Organisation of the Hb 1 genes of the Antarctic skate Bathyraja eatonii: New insights into the...
10
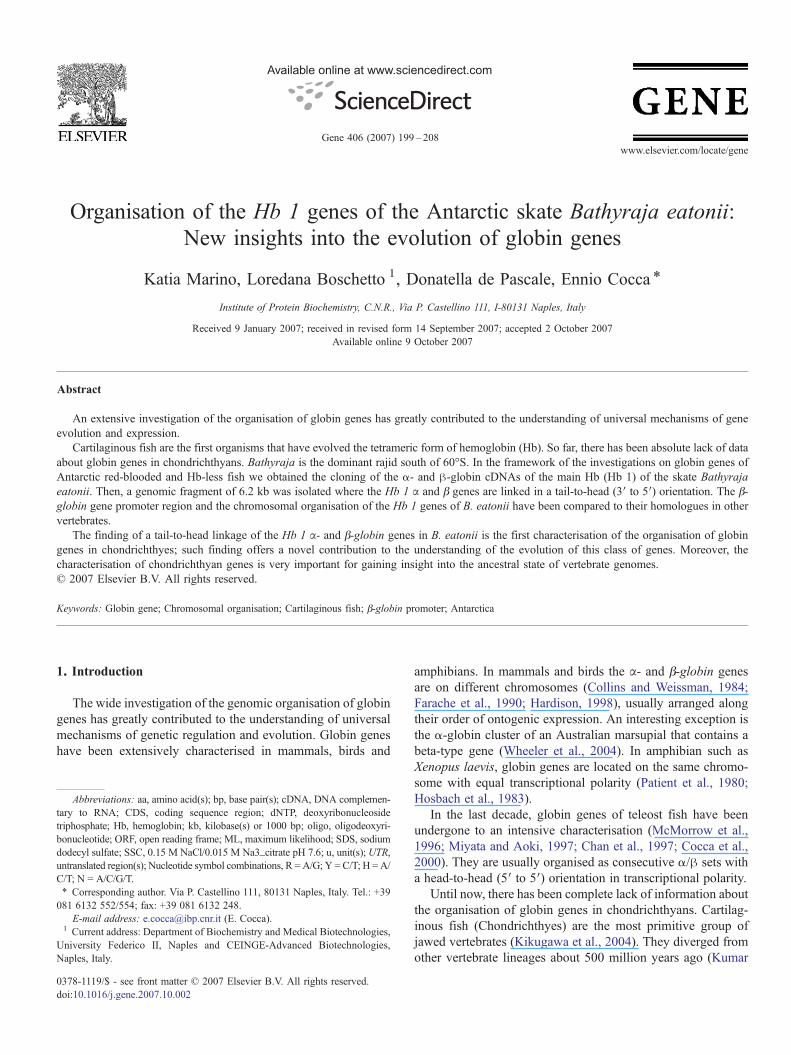
Organisation of the Hb 1 genes of the Antarctic skate Bathyraja eatonii: New insights into the evolution of globin genes Katia Marino, Loredana Boschetto 1 , Donatella de Pascale, Ennio Cocca ⁎ Institute of Protein Biochemistry, C.N.R., Via P. Castellino 111, I-80131 Naples, Italy Received 9 January 2007; received in revised form 14 September 2007; accepted 2 October 2007 Available online 9 October 2007 Abstract An extensive investigation of the organisation of globin genes has greatly contributed to the understanding of universal mechanisms of gene evolution and expression. Cartilaginous fish are the first organisms that have evolved the tetrameric form of hemoglobin (Hb). So far, there has been absolute lack of data about globin genes in chondrichthyans. Bathyraja is the dominant rajid south of 60°S. In the framework of the investigations on globin genes of Antarctic red-blooded and Hb-less fish we obtained the cloning of the α- and β-globin cDNAs of the main Hb (Hb 1) of the skate Bathyraja eatonii. Then, a genomic fragment of 6.2 kb was isolated where the Hb 1 α and β genes are linked in a tail-to-head (3′ to 5′) orientation. The β- globin gene promoter region and the chromosomal organisation of the Hb 1 genes of B. eatonii have been compared to their homologues in other vertebrates. The finding of a tail-to-head linkage of the Hb 1 α- and β-globin genes in B. eatonii is the first characterisation of the organisation of globin genes in chondrichthyes; such finding offers a novel contribution to the understanding of the evolution of this class of genes. Moreover, the characterisation of chondrichthyan genes is very important for gaining insight into the ancestral state of vertebrate genomes. © 2007 Elsevier B.V. All rights reserved. Keywords: Globin gene; Chromosomal organisation; Cartilaginous fish; β-globin promoter; Antarctica 1. Introduction The wide investigation of the genomic organisation of globin genes has greatly contributed to the understanding of universal mechanisms of genetic regulation and evolution. Globin genes have been extensively characterised in mammals, birds and amphibians. In mammals and birds the α- and β-globin genes are on different chromosomes (Collins and Weissman, 1984; Farache et al., 1990; Hardison, 1998), usually arranged along their order of ontogenic expression. An interesting exception is the α-globin cluster of an Australian marsupial that contains a beta-type gene (Wheeler et al., 2004). In amphibian such as Xenopus laevis, globin genes are located on the same chromo- some with equal transcriptional polarity (Patient et al., 1980; Hosbach et al., 1983). In the last decade, globin genes of teleost fish have been undergone to an intensive characterisation (McMorrow et al., 1996; Miyata and Aoki, 1997; Chan et al., 1997; Cocca et al., 2000). They are usually organised as consecutive α/β sets with a head-to-head (5′ to 5′) orientation in transcriptional polarity. Until now, there has been complete lack of information about the organisation of globin genes in chondrichthyans. Cartilag- inous fish (Chondrichthyes) are the most primitive group of jawed vertebrates (Kikugawa et al., 2004). They diverged from other vertebrate lineages about 500 million years ago (Kumar Available online at www.sciencedirect.com Gene 406 (2007) 199 – 208 www.elsevier.com/locate/gene Abbreviations: aa, amino acid(s); bp, base pair(s); cDNA, DNA complemen- tary to RNA; CDS, coding sequence region; dNTP, deoxyribonucleoside triphosphate; Hb, hemoglobin; kb, kilobase(s) or 1000 bp; oligo, oligodeoxyri- bonucleotide; ORF, open reading frame; ML, maximum likelihood; SDS, sodium dodecyl sulfate; SSC, 0.15 M NaCl/0.015 M Na3_citrate pH 7.6; u, unit(s); UTR, untranslated region(s); Nucleotide symbol combinations, R = A/G; Y = C/T; H = A/ C/T; N = A/C/G/T. ⁎ Corresponding author. Via P. Castellino 111, 80131 Naples, Italy. Tel.: +39 081 6132 552/554; fax: +39 081 6132 248. E-mail address: [email protected] (E. Cocca). 1 Current address: Department of Biochemistry and Medical Biotechnologies, University Federico II, Naples and CEINGE-Advanced Biotechnologies, Naples, Italy. 0378-1119/$ - see front matter © 2007 Elsevier B.V. All rights reserved. doi:10.1016/j.gene.2007.10.002
-
Upload
independent -
Category
Documents
-
view
0 -
download
0
Transcript of Organisation of the Hb 1 genes of the Antarctic skate Bathyraja eatonii: New insights into the...
Available online at www.sciencedirect.com
199–208www.elsevier.com/locate/gene
Gene 406 (2007)
Organisation of the Hb 1 genes of the Antarctic skate Bathyraja eatonii:New insights into the evolution of globin genes
Katia Marino, Loredana Boschetto 1, Donatella de Pascale, Ennio Cocca ⁎
Institute of Protein Biochemistry, C.N.R., Via P. Castellino 111, I-80131 Naples, Italy
Received 9 January 2007; received in revised form 14 September 2007; accepted 2 October 2007Available online 9 October 2007
Abstract
An extensive investigation of the organisation of globin genes has greatly contributed to the understanding of universal mechanisms of geneevolution and expression.
Cartilaginous fish are the first organisms that have evolved the tetrameric form of hemoglobin (Hb). So far, there has been absolute lack of dataabout globin genes in chondrichthyans. Bathyraja is the dominant rajid south of 60°S. In the framework of the investigations on globin genes ofAntarctic red-blooded and Hb-less fish we obtained the cloning of the α- and β-globin cDNAs of the main Hb (Hb 1) of the skate Bathyrajaeatonii. Then, a genomic fragment of 6.2 kb was isolated where the Hb 1 α and β genes are linked in a tail-to-head (3′ to 5′) orientation. The β-globin gene promoter region and the chromosomal organisation of the Hb 1 genes of B. eatonii have been compared to their homologues in othervertebrates.
The finding of a tail-to-head linkage of the Hb 1 α- and β-globin genes in B. eatonii is the first characterisation of the organisation of globingenes in chondrichthyes; such finding offers a novel contribution to the understanding of the evolution of this class of genes. Moreover, thecharacterisation of chondrichthyan genes is very important for gaining insight into the ancestral state of vertebrate genomes.© 2007 Elsevier B.V. All rights reserved.
Keywords: Globin gene; Chromosomal organisation; Cartilaginous fish; β-globin promoter; Antarctica
1. Introduction
The wide investigation of the genomic organisation of globingenes has greatly contributed to the understanding of universalmechanisms of genetic regulation and evolution. Globin geneshave been extensively characterised in mammals, birds and
Abbreviations: aa, amino acid(s); bp, base pair(s); cDNA, DNA complemen-tary to RNA; CDS, coding sequence region; dNTP, deoxyribonucleosidetriphosphate; Hb, hemoglobin; kb, kilobase(s) or 1000 bp; oligo, oligodeoxyri-bonucleotide; ORF, open reading frame; ML, maximum likelihood; SDS, sodiumdodecyl sulfate; SSC, 0.15 M NaCl/0.015 M Na3_citrate pH 7.6; u, unit(s); UTR,untranslated region(s); Nucleotide symbol combinations, R = A/G; Y = C/T; H = A/C/T; N = A/C/G/T.⁎ Corresponding author. Via P. Castellino 111, 80131 Naples, Italy. Tel.: +39
081 6132 552/554; fax: +39 081 6132 248.E-mail address: [email protected] (E. Cocca).
1 Current address: Department of Biochemistry and Medical Biotechnologies,University Federico II, Naples and CEINGE-Advanced Biotechnologies,Naples, Italy.
0378-1119/$ - see front matter © 2007 Elsevier B.V. All rights reserved.doi:10.1016/j.gene.2007.10.002
amphibians. In mammals and birds the α- and β-globin genesare on different chromosomes (Collins and Weissman, 1984;Farache et al., 1990; Hardison, 1998), usually arranged alongtheir order of ontogenic expression. An interesting exception isthe α-globin cluster of an Australian marsupial that contains abeta-type gene (Wheeler et al., 2004). In amphibian such asXenopus laevis, globin genes are located on the same chromo-some with equal transcriptional polarity (Patient et al., 1980;Hosbach et al., 1983).
In the last decade, globin genes of teleost fish have beenundergone to an intensive characterisation (McMorrow et al.,1996; Miyata and Aoki, 1997; Chan et al., 1997; Cocca et al.,2000). They are usually organised as consecutive α/β sets witha head-to-head (5′ to 5′) orientation in transcriptional polarity.
Until now, there has been complete lack of information aboutthe organisation of globin genes in chondrichthyans. Cartilag-inous fish (Chondrichthyes) are the most primitive group ofjawed vertebrates (Kikugawa et al., 2004). They diverged fromother vertebrate lineages about 500 million years ago (Kumar
200 K. Marino et al. / Gene 406 (2007) 199–208
and Hedges, 1998) and represent the ancestor of tetrapods andray-finned fish. Cartilaginous fish comprise two groups, theelasmobranches (sharks, rays and skates) and the holocepha-lians (chimeras). They are the first organisms that have evolvedthe tetrameric form of Hb: the duplication and differentiation ofthe ancestral globin gene into the α and β genes, including theformation of the subunit interfaces, and the mechanism of thequaternary structure change, took place within a comparativelyshort period between the branching points of hagfish andlampreys from cartilaginous fish. A few investigations havebeen made on Hbs from chondrichthyans (Nash et al., 1976;Aschauer et al., 1985; Chong et al., 1999; Naoi et al., 2001;Verde et al., 2005), but nothing is known about the cognategenes, with the exception of the α-globin cDNA sequence of theskate Dasyatis akajei.
The characterisation of globin genes in cartilaginous fish willprovide significant information on the evolution of this family ofgenes. Moreover, the gene investigation of cartilaginous fish isessential for gaining insights into the ancestral state of vertebrategenomes.
The organism selected for this study is the cartilaginous fishBathyraja eatonii (Eaton's skate). This animal lives in theSouthern Ocean, being common on the Kerguelen Plateau,around South Orkney and South Shetland islands, and aroundthe Antarctic Peninsula. The blood of B. eatonii contains amajor Hb (Hb 1) and a minor one (Hb 2), which approximateamount ratio is 80:20 (Verde et al., 2005).
We have cloned the B. eatonii Hb 1 α- and β-globin cDNAs,and then we have isolated a genomic fragment containing thecomplete α/β intergenic region. This work describes the firstcharacterisation of the organisation of globin genes inchondrichthyes.
2. Materials and methods
2.1. Materials
B. eatonii specimens were collected by bottom trawling nearLow and Brabant Islands in the Palmer Archipelago (63°25′S,62°15′W), during the 2001 austral winter and the 2003 australautumn. Skates were transported to Palmer Station, Antarctica,where they were held in running seawater at −1 to +1 °C untiltissue sampling. The animals were killed by truncation of spinalcord. Spleens and gonads were dissected from adult specimens,and frozen immediately in liquid nitrogen. Blood was drawnfrom the heart by heparinised syringes. Erythrocytes werecollected by centrifugation at 3000 g for 5 min, washed in 1.7%NaCl, and then frozen in liquid nitrogen. Tissues and cells werestored at −80 °C until use.
2.2. Cloning of α- and β-globin cDNAs from B. eatonii
Total RNA was isolated from B. eatonii spleen using TRI-Reagent™ (Sigma Aldrich), as described by Chomczynski andSacchi (1987). First-strand cDNA synthesis was performed byheating 1 μg of total RNA to 70 °C for 5 min. The denaturedRNA was mixed with 10 nmol of dNTPs, 20 u of RNAsin,
50 pmol of oligo (dT)-adaptor primer [5′-CGGAGATCTC-CAATGTGATGGGAAATTC(T)17-3′] and 1 μl of ImProm-II™ reverse transcriptase (Promega), and incubated for 1 h at42 °C. The reaction was stopped by heating at 70 °C for 15 min.The reverse transcription mixture was amplified by PCR usingas direct primers the following oligos, deducted from the N-terminal regions (see Fig. 1): N-ter_α (5′-CARGARATHCAY-CAYGT-3′) to amplify the α-globin cDNA, and N-ter_β (5′-ACNGAYAARGARGC-3′) to amplify the β-globin cDNA; theadaptor primer (5′-CGGAGATCTCCAATGTGATGG-GAAATTC-3′) was used as the reverse primer. Amplificationswere performed using a reaction mixture containing single-stranded cDNA, 2.5 u of Taq polymerase (EuroClone), 5 pmoleach of the above primers and 0.20 mM dNTPs buffered with160 mM (NH4)2SO4, 670 mM Tris·HCl (pH 8.8), 0.1% Tween-20, containing 1.5 mM MgCl2. The PCR program consisted of30 cycles of 1 min at 94 °C, 1 min at temperature between 42and 48 °C and 1 min at 72 °C, and ending with a single cycle of10 min at 72 °C. The amplified cDNAs were purified andligated in the pDrive vector (Quiagen) with T4 DNA ligase.Escherichia coli cells (strain DH5α) were transformed withthe ligation mixtures. Standard molecular biological techniques(Sambrook et al., 1989) were used in the isolation, restriction, andsequence analysis of plasmid DNA. The cloned cDNA fragmentswere sequenced on both strands by automated sequencing. Thecloning of the 5′ regions of the globin cDNAs was obtained by5′ RACE using the Marathon™ cDNA Amplification Kit (BDBiosciences) and the two following internal primers (see Fig. 1):α5′RACE (5′-GCAGGTCGTCCAGGTGTTCAGCCGC-3′) andβ5′RACE (5′-GACCTTGGACACCACTGTCGCCGGC-3′).
2.3. Sequence analysis
The cDNA sequences were edited and analysed using the“Discovery Studio Gene v1.5” program (Accelrys, 2003).
The program ClustalX 1.81 (a revision of the ClustalWprogram, described in Thompson et al., 1994) was used toperform multiple sequence alignments of protein sequences,which were subsequently manually improved.
The PROT TEST web-site (http://darwin.nmsu.edu/~molb470/fall2005/projects/richar/prottest.htm) was used tofind the best fitting model of protein evolution based onsequence alignments. Maximum likelihood (ML) analyses wereperformed with PhyML 2.4.4 (Guindon and Gascuel, 2003)using two different amino acid substitution models, the Whelanand Goldman (WAG) model for α-globins, and the Dayhoffmodel for β-globins. Statistical support for the different internalbranches was assessed by bootstrap resampling (1000 bootstrapreplicates).
Finally, bootstrap consensus trees were constructed with theprogram MEGA 3.1 (Kumar et al., 2004).
Additional programs were used to analyse the sequence ofthe promoter regions: “Markov Chain Promoter FinderMcPromoter MM:II” (http://genes.mit.edu/McPromoter, Ohleret al., 1999); “NSITE Version 2.2004” (Softberry Inc.), “TSSG”and “TSSW” — Recognition of human PolII promoter regionand start of transcription (1999–2005, www.softberry.com);
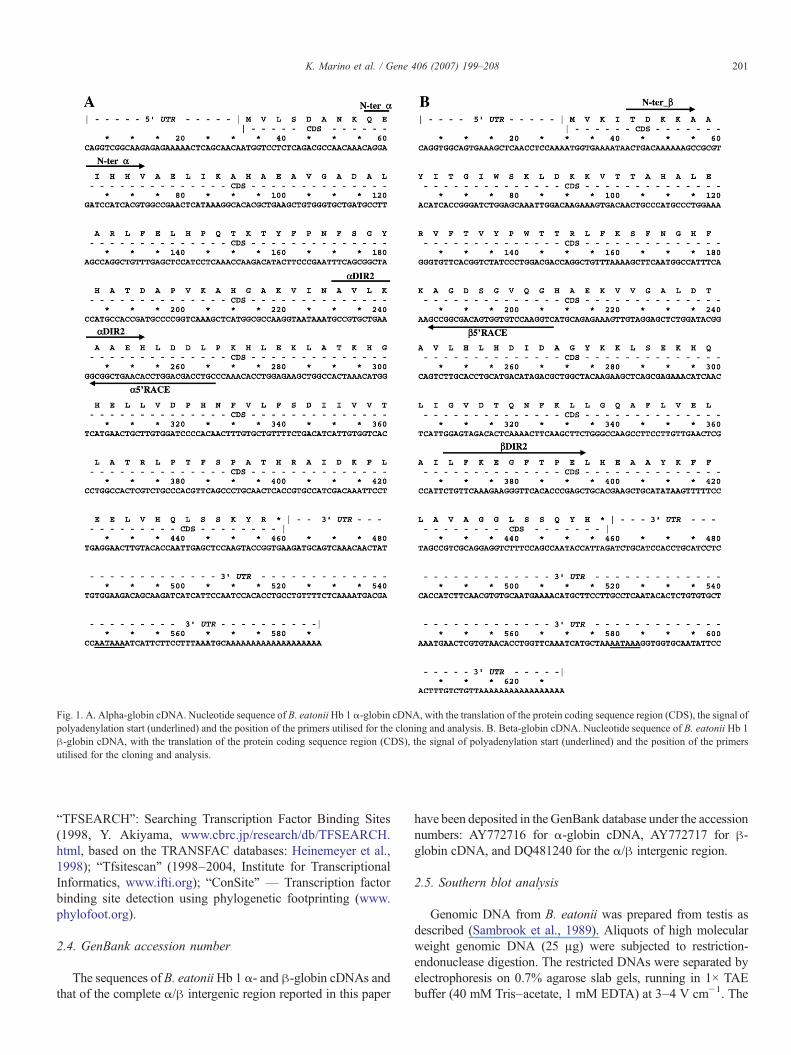
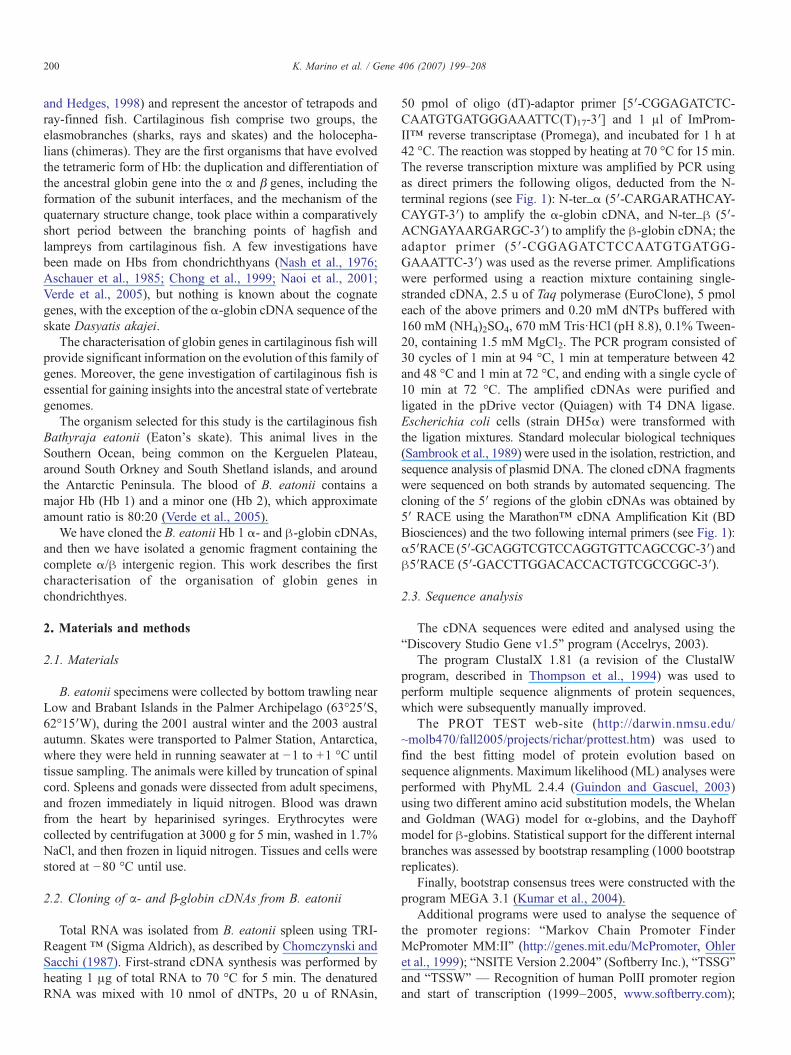
Fig. 1. A. Alpha-globin cDNA. Nucleotide sequence of B. eatoniiHb 1 α-globin cDNA, with the translation of the protein coding sequence region (CDS), the signal ofpolyadenylation start (underlined) and the position of the primers utilised for the cloning and analysis. B. Beta-globin cDNA. Nucleotide sequence of B. eatonii Hb 1β-globin cDNA, with the translation of the protein coding sequence region (CDS), the signal of polyadenylation start (underlined) and the position of the primersutilised for the cloning and analysis.
201K. Marino et al. / Gene 406 (2007) 199–208
“TFSEARCH”: Searching Transcription Factor Binding Sites(1998, Y. Akiyama, www.cbrc.jp/research/db/TFSEARCH.html, based on the TRANSFAC databases: Heinemeyer et al.,1998); “Tfsitescan” (1998–2004, Institute for TranscriptionalInformatics, www.ifti.org); “ConSite” — Transcription factorbinding site detection using phylogenetic footprinting (www.phylofoot.org).
2.4. GenBank accession number
The sequences of B. eatoniiHb 1 α- and β-globin cDNAs andthat of the complete α/β intergenic region reported in this paper
have been deposited in the GenBank database under the accessionnumbers: AY772716 for α-globin cDNA, AY772717 for β-globin cDNA, and DQ481240 for the α/β intergenic region.
2.5. Southern blot analysis
Genomic DNA from B. eatonii was prepared from testis asdescribed (Sambrook et al., 1989). Aliquots of high molecularweight genomic DNA (25 μg) were subjected to restriction-endonuclease digestion. The restricted DNAs were separated byelectrophoresis on 0.7% agarose slab gels, running in 1× TAEbuffer (40 mM Tris–acetate, 1 mM EDTA) at 3–4 V cm−1. The
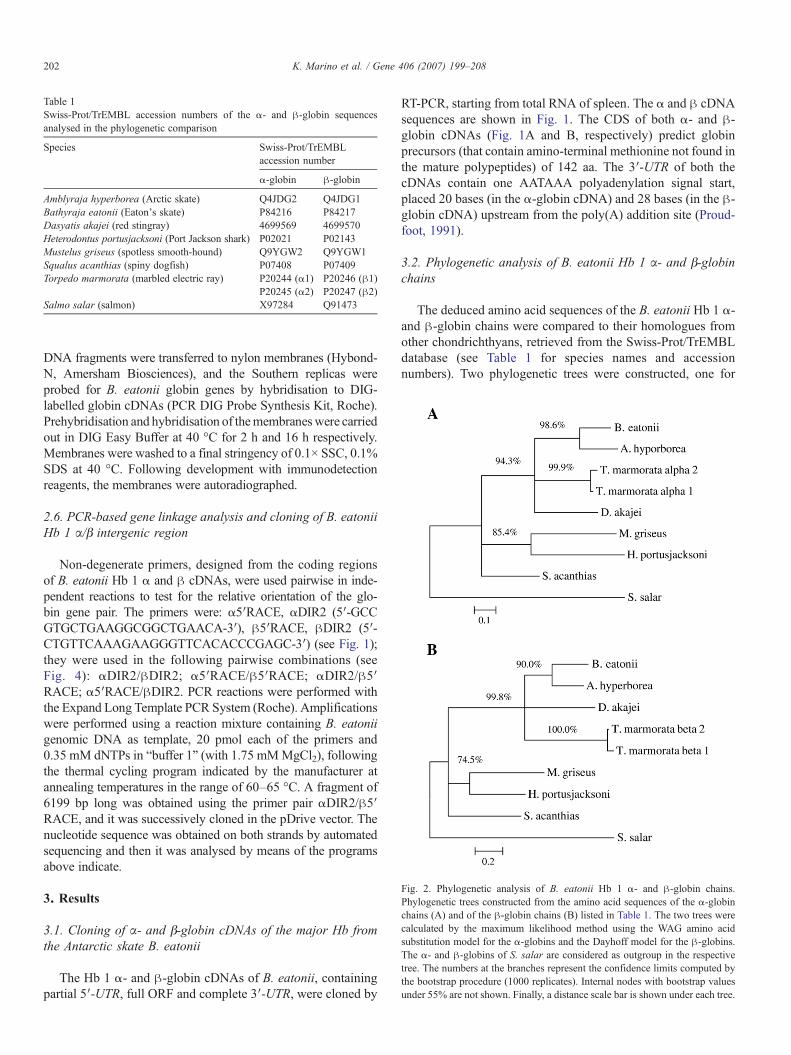
Table 1Swiss-Prot/TrEMBL accession numbers of the α- and β-globin sequencesanalysed in the phylogenetic comparison
Species Swiss-Prot/TrEMBLaccession number
α-globin β-globin
Amblyraja hyperborea (Arctic skate) Q4JDG2 Q4JDG1Bathyraja eatonii (Eaton's skate) P84216 P84217Dasyatis akajei (red stingray) 4699569 4699570Heterodontus portusjacksoni (Port Jackson shark) P02021 P02143Mustelus griseus (spotless smooth-hound) Q9YGW2 Q9YGW1Squalus acanthias (spiny dogfish) P07408 P07409Torpedo marmorata (marbled electric ray) P20244 (α1) P20246 (β1)
P20245 (α2) P20247 (β2)Salmo salar (salmon) X97284 Q91473
Fig. 2. Phylogenetic analysis of B. eatonii Hb 1 α- and β-globin chains.Phylogenetic trees constructed from the amino acid sequences of the α-globinchains (A) and of the β-globin chains (B) listed in Table 1. The two trees werecalculated by the maximum likelihood method using the WAG amino acidsubstitution model for the α-globins and the Dayhoff model for the β-globins.The α- and β-globins of S. salar are considered as outgroup in the respectivetree. The numbers at the branches represent the confidence limits computed bythe bootstrap procedure (1000 replicates). Internal nodes with bootstrap valuesunder 55% are not shown. Finally, a distance scale bar is shown under each tree.
202 K. Marino et al. / Gene 406 (2007) 199–208
DNA fragments were transferred to nylon membranes (Hybond-N, Amersham Biosciences), and the Southern replicas wereprobed for B. eatonii globin genes by hybridisation to DIG-labelled globin cDNAs (PCR DIG Probe Synthesis Kit, Roche).Prehybridisation and hybridisation of themembraneswere carriedout in DIG Easy Buffer at 40 °C for 2 h and 16 h respectively.Membranes were washed to a final stringency of 0.1× SSC, 0.1%SDS at 40 °C. Following development with immunodetectionreagents, the membranes were autoradiographed.
2.6. PCR-based gene linkage analysis and cloning of B. eatoniiHb 1 α/β intergenic region
Non-degenerate primers, designed from the coding regionsof B. eatonii Hb 1 α and β cDNAs, were used pairwise in inde-pendent reactions to test for the relative orientation of the glo-bin gene pair. The primers were: α5′RACE, αDIR2 (5′-GCCGTGCTGAAGGCGGCTGAACA-3′), β5′RACE, βDIR2 (5′-CTGTTCAAAGAAGGGTTCACACCCGAGC-3′) (see Fig. 1);they were used in the following pairwise combinations (seeFig. 4): αDIR2/βDIR2; α5′RACE/β5′RACE; αDIR2/β5′RACE; α5′RACE/βDIR2. PCR reactions were performed withthe Expand Long Template PCR System (Roche). Amplificationswere performed using a reaction mixture containing B. eatoniigenomic DNA as template, 20 pmol each of the primers and0.35 mM dNTPs in “buffer 1” (with 1.75 mMMgCl2), followingthe thermal cycling program indicated by the manufacturer atannealing temperatures in the range of 60–65 °C. A fragment of6199 bp long was obtained using the primer pair αDIR2/β5′RACE, and it was successively cloned in the pDrive vector. Thenucleotide sequence was obtained on both strands by automatedsequencing and then it was analysed by means of the programsabove indicate.
3. Results
3.1. Cloning of α- and β-globin cDNAs of the major Hb fromthe Antarctic skate B. eatonii
The Hb 1 α- and β-globin cDNAs of B. eatonii, containingpartial 5′-UTR, full ORF and complete 3′-UTR, were cloned by
RT-PCR, starting from total RNA of spleen. The α and β cDNAsequences are shown in Fig. 1. The CDS of both α- and β-globin cDNAs (Fig. 1A and B, respectively) predict globinprecursors (that contain amino-terminal methionine not found inthe mature polypeptides) of 142 aa. The 3′-UTR of both thecDNAs contain one AATAAA polyadenylation signal start,placed 20 bases (in the α-globin cDNA) and 28 bases (in the β-globin cDNA) upstream from the poly(A) addition site (Proud-foot, 1991).
3.2. Phylogenetic analysis of B. eatonii Hb 1 α- and β-globinchains
The deduced amino acid sequences of the B. eatonii Hb 1 α-and β-globin chains were compared to their homologues fromother chondrichthyans, retrieved from the Swiss-Prot/TrEMBLdatabase (see Table 1 for species names and accessionnumbers). Two phylogenetic trees were constructed, one for
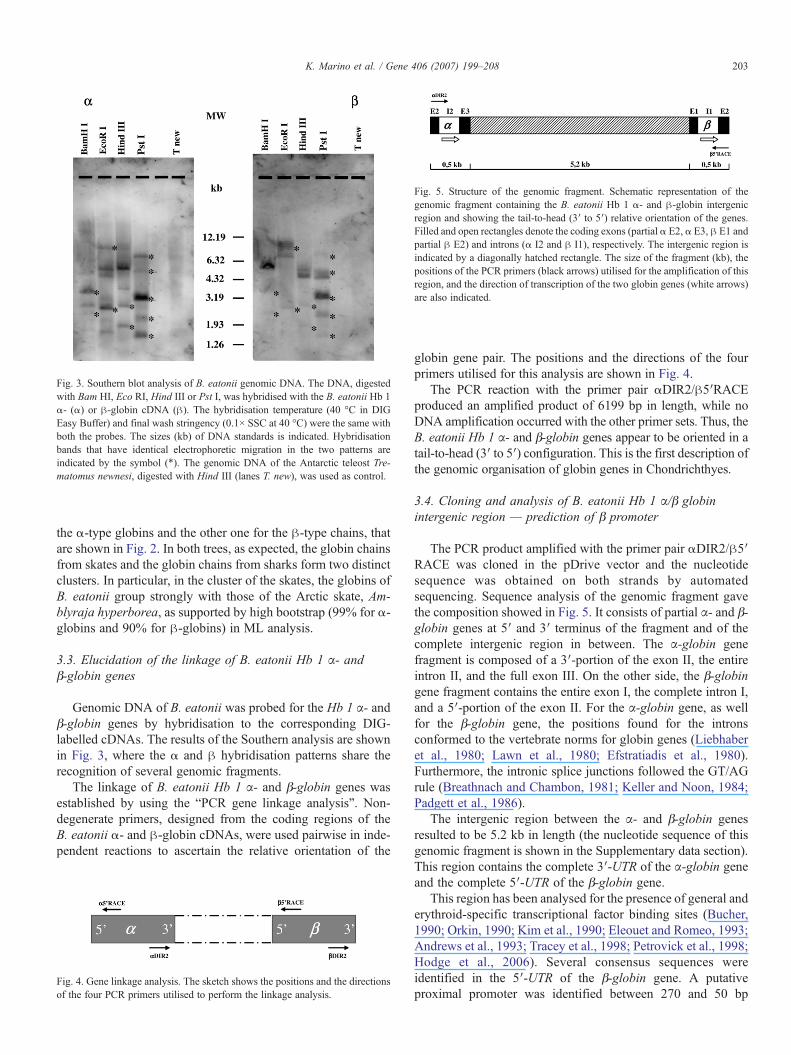
Fig. 3. Southern blot analysis of B. eatonii genomic DNA. The DNA, digestedwith Bam HI, Eco RI, Hind III or Pst I, was hybridised with the B. eatonii Hb 1α- (α) or β-globin cDNA (β). The hybridisation temperature (40 °C in DIGEasy Buffer) and final wash stringency (0.1× SSC at 40 °C) were the same withboth the probes. The sizes (kb) of DNA standards is indicated. Hybridisationbands that have identical electrophoretic migration in the two patterns areindicated by the symbol (⁎). The genomic DNA of the Antarctic teleost Tre-matomus newnesi, digested with Hind III (lanes T. new), was used as control.
Fig. 5. Structure of the genomic fragment. Schematic representation of thegenomic fragment containing the B. eatonii Hb 1 α- and β-globin intergenicregion and showing the tail-to-head (3′ to 5′) relative orientation of the genes.Filled and open rectangles denote the coding exons (partial α E2, α E3, β E1 andpartial β E2) and introns (α I2 and β I1), respectively. The intergenic region isindicated by a diagonally hatched rectangle. The size of the fragment (kb), thepositions of the PCR primers (black arrows) utilised for the amplification of thisregion, and the direction of transcription of the two globin genes (white arrows)are also indicated.
203K. Marino et al. / Gene 406 (2007) 199–208
the α-type globins and the other one for the β-type chains, thatare shown in Fig. 2. In both trees, as expected, the globin chainsfrom skates and the globin chains from sharks form two distinctclusters. In particular, in the cluster of the skates, the globins ofB. eatonii group strongly with those of the Arctic skate, Am-blyraja hyperborea, as supported by high bootstrap (99% for α-globins and 90% for β-globins) in ML analysis.
3.3. Elucidation of the linkage of B. eatonii Hb 1 α- andβ-globin genes
Genomic DNA of B. eatonii was probed for the Hb 1 α- andβ-globin genes by hybridisation to the corresponding DIG-labelled cDNAs. The results of the Southern analysis are shownin Fig. 3, where the α and β hybridisation patterns share therecognition of several genomic fragments.
The linkage of B. eatonii Hb 1 α- and β-globin genes wasestablished by using the “PCR gene linkage analysis”. Non-degenerate primers, designed from the coding regions of theB. eatonii α- and β-globin cDNAs, were used pairwise in inde-pendent reactions to ascertain the relative orientation of the
Fig. 4. Gene linkage analysis. The sketch shows the positions and the directionsof the four PCR primers utilised to perform the linkage analysis.
globin gene pair. The positions and the directions of the fourprimers utilised for this analysis are shown in Fig. 4.
The PCR reaction with the primer pair αDIR2/β5′RACEproduced an amplified product of 6199 bp in length, while noDNA amplification occurred with the other primer sets. Thus, theB. eatonii Hb 1 α- and β-globin genes appear to be oriented in atail-to-head (3′ to 5′) configuration. This is the first description ofthe genomic organisation of globin genes in Chondrichthyes.
3.4. Cloning and analysis of B. eatonii Hb 1 α/β globinintergenic region — prediction of β promoter
The PCR product amplified with the primer pair αDIR2/β5′RACE was cloned in the pDrive vector and the nucleotidesequence was obtained on both strands by automatedsequencing. Sequence analysis of the genomic fragment gavethe composition showed in Fig. 5. It consists of partial α- and β-globin genes at 5′ and 3′ terminus of the fragment and of thecomplete intergenic region in between. The α-globin genefragment is composed of a 3′-portion of the exon II, the entireintron II, and the full exon III. On the other side, the β-globingene fragment contains the entire exon I, the complete intron I,and a 5′-portion of the exon II. For the α-globin gene, as wellfor the β-globin gene, the positions found for the intronsconformed to the vertebrate norms for globin genes (Liebhaberet al., 1980; Lawn et al., 1980; Efstratiadis et al., 1980).Furthermore, the intronic splice junctions followed the GT/AGrule (Breathnach and Chambon, 1981; Keller and Noon, 1984;Padgett et al., 1986).
The intergenic region between the α- and β-globin genesresulted to be 5.2 kb in length (the nucleotide sequence of thisgenomic fragment is shown in the Supplementary data section).This region contains the complete 3′-UTR of the α-globin geneand the complete 5′-UTR of the β-globin gene.
This region has been analysed for the presence of general anderythroid-specific transcriptional factor binding sites (Bucher,1990; Orkin, 1990; Kim et al., 1990; Eleouet and Romeo, 1993;Andrews et al., 1993; Tracey et al., 1998; Petrovick et al., 1998;Hodge et al., 2006). Several consensus sequences wereidentified in the 5′-UTR of the β-globin gene. A putativeproximal promoter was identified between 270 and 50 bp
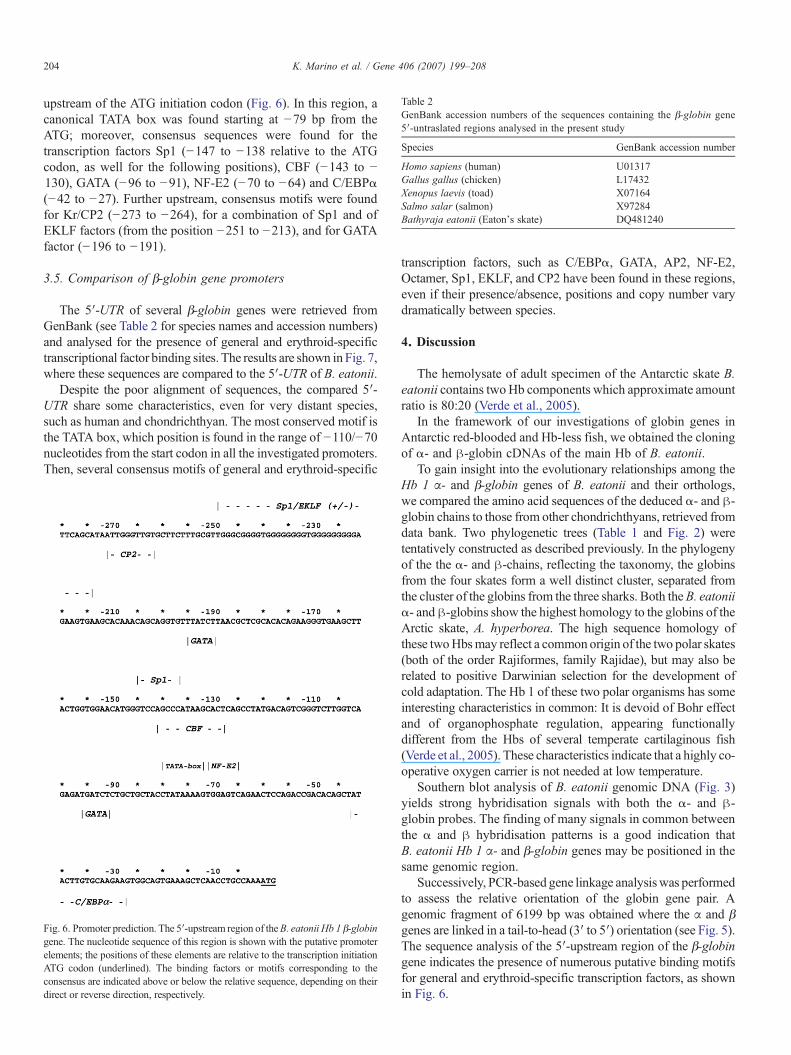
Table 2GenBank accession numbers of the sequences containing the β-globin gene5′-untraslated regions analysed in the present study
Species GenBank accession number
Homo sapiens (human) U01317Gallus gallus (chicken) L17432Xenopus laevis (toad) X07164Salmo salar (salmon) X97284Bathyraja eatonii (Eaton's skate) DQ481240
204 K. Marino et al. / Gene 406 (2007) 199–208
upstream of the ATG initiation codon (Fig. 6). In this region, acanonical TATA box was found starting at −79 bp from theATG; moreover, consensus sequences were found for thetranscription factors Sp1 (−147 to −138 relative to the ATGcodon, as well for the following positions), CBF (−143 to −130), GATA (−96 to −91), NF-E2 (−70 to −64) and C/EBPα(−42 to −27). Further upstream, consensus motifs were foundfor Kr/CP2 (−273 to −264), for a combination of Sp1 and ofEKLF factors (from the position −251 to −213), and for GATAfactor (−196 to −191).
3.5. Comparison of β-globin gene promoters
The 5′-UTR of several β-globin genes were retrieved fromGenBank (see Table 2 for species names and accession numbers)and analysed for the presence of general and erythroid-specifictranscriptional factor binding sites. The results are shown in Fig. 7,where these sequences are compared to the 5′-UTR of B. eatonii.
Despite the poor alignment of sequences, the compared 5′-UTR share some characteristics, even for very distant species,such as human and chondrichthyan. The most conserved motif isthe TATA box, which position is found in the range of −110/−70nucleotides from the start codon in all the investigated promoters.Then, several consensus motifs of general and erythroid-specific
Fig. 6. Promoter prediction. The 5′-upstream region of theB. eatonii Hb 1 β-globingene. The nucleotide sequence of this region is shown with the putative promoterelements; the positions of these elements are relative to the transcription initiationATG codon (underlined). The binding factors or motifs corresponding to theconsensus are indicated above or below the relative sequence, depending on theirdirect or reverse direction, respectively.
transcription factors, such as C/EBPα, GATA, AP2, NF-E2,Octamer, Sp1, EKLF, and CP2 have been found in these regions,even if their presence/absence, positions and copy number varydramatically between species.
4. Discussion
The hemolysate of adult specimen of the Antarctic skate B.eatonii contains twoHb components which approximate amountratio is 80:20 (Verde et al., 2005).
In the framework of our investigations of globin genes inAntarctic red-blooded and Hb-less fish, we obtained the cloningof α- and β-globin cDNAs of the main Hb of B. eatonii.
To gain insight into the evolutionary relationships among theHb 1 α- and β-globin genes of B. eatonii and their orthologs,we compared the amino acid sequences of the deduced α- and β-globin chains to those from other chondrichthyans, retrieved fromdata bank. Two phylogenetic trees (Table 1 and Fig. 2) weretentatively constructed as described previously. In the phylogenyof the the α- and β-chains, reflecting the taxonomy, the globinsfrom the four skates form a well distinct cluster, separated fromthe cluster of the globins from the three sharks. Both theB. eatoniiα- and β-globins show the highest homology to the globins of theArctic skate, A. hyperborea. The high sequence homology ofthese twoHbsmay reflect a commonorigin of the two polar skates(both of the order Rajiformes, family Rajidae), but may also berelated to positive Darwinian selection for the development ofcold adaptation. The Hb 1 of these two polar organisms has someinteresting characteristics in common: It is devoid of Bohr effectand of organophosphate regulation, appearing functionallydifferent from the Hbs of several temperate cartilaginous fish(Verde et al., 2005). These characteristics indicate that a highly co-operative oxygen carrier is not needed at low temperature.
Southern blot analysis of B. eatonii genomic DNA (Fig. 3)yields strong hybridisation signals with both the α- and β-globin probes. The finding of many signals in common betweenthe α and β hybridisation patterns is a good indication thatB. eatonii Hb 1 α- and β-globin genes may be positioned in thesame genomic region.
Successively, PCR-based gene linkage analysiswas performedto assess the relative orientation of the globin gene pair. Agenomic fragment of 6199 bp was obtained where the α and βgenes are linked in a tail-to-head (3′ to 5′) orientation (see Fig. 5).The sequence analysis of the 5′-upstream region of the β-globingene indicates the presence of numerous putative binding motifsfor general and erythroid-specific transcription factors, as shownin Fig. 6.
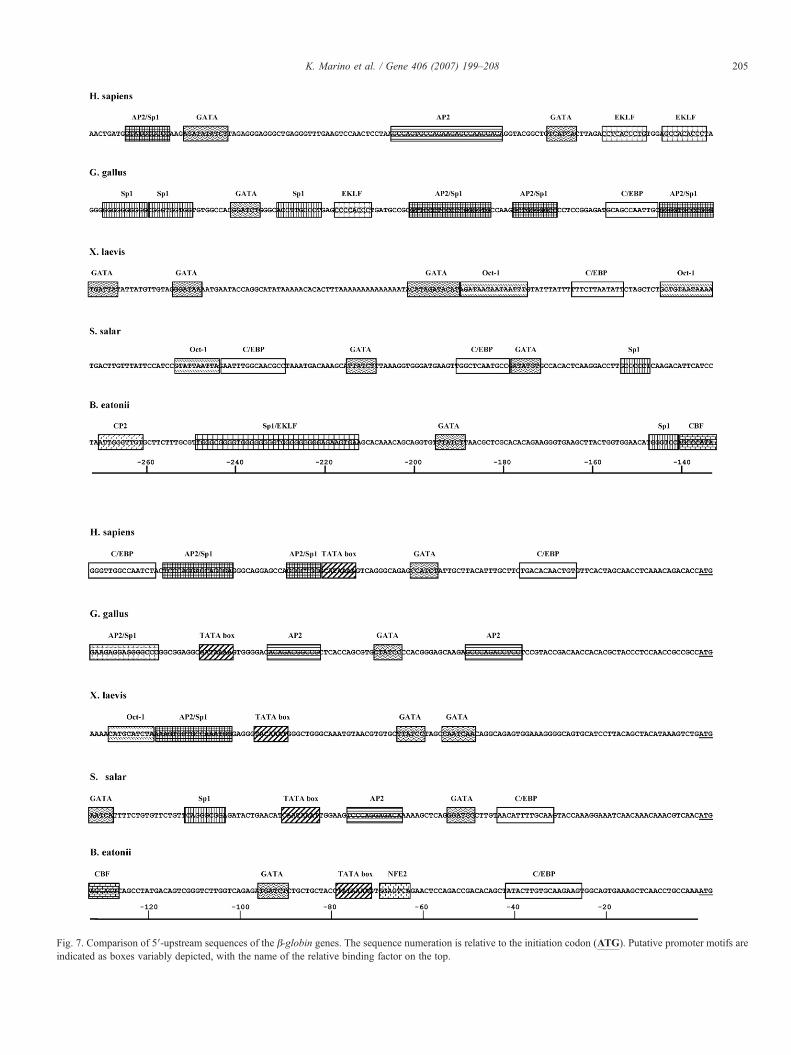
Fig. 7. Comparison of 5′-upstream sequences of the β-globin genes. The sequence numeration is relative to the initiation codon (ATG). Putative promoter motifs areindicated as boxes variably depicted, with the name of the relative binding factor on the top.
205K. Marino et al. / Gene 406 (2007) 199–208

206 K. Marino et al. / Gene 406 (2007) 199–208
The 5′-upstream region of B. eatonii Hb 1 β-globin gene wascompared to that of β-globin genes of vertebrates belonging todifferent classes (see Fig. 7): Homo sapiens (mammal), Gallusgallus (bird),X. laevis (amphibian), and Salmo salar (teleost fish).
Promoter sequences were found to differ with respect topresence/absence, copy number, and relative location of consen-sus motifs. The high sequence complexity of β-globin genepromoter is a reflection of its complex regulation and of theevolutionary pressure (Chuzhanova et al., 2002).
However, despite the poor alignment of sequences, they sharesome characteristics, even for very distant species, such as humanand chondrichthyan. The most conserved motif is the TATA box,which position is found in the range of −110/−70 nucleotidesfrom the start codon in all the investigated promoters. Asexpected, the B. eatonii β-globin promoter is more similar, in itsoverall structure, to the orthologous sequence derived from ateleostean fish.
The finding of a tail-to-head linkage for the Hb 1 α- and β-globin genes of the Antarctic skate B. eatonii is the firstdescription of the genomic organisation of globin genes inChondrichthyes; such finding offers a significant contribution tothe understanding of general evolution of this class of genes.Moreover, the characterisation of chondrichthyan genes is very
Fig. 8. Evolution of globin gene clusters in vertebrates. The chromosomal organisatiothe globin gene clusters from other vertebrates. The clusters are positioned along theindicate their transcriptional direction. Dashed lines for B. eatonii and S. salar indicB. eatonii and X. laevis highlights the similarity between the relative orientations foopen rectangles denote pseudogenes.
important for gaining insight into the ancestral state of verte-brate genomes.
The internal organisation of the α- and β-globin genes(typically consisting of three exons and two introns) is quitewell conserved in all vertebrates. However, important differencesare to be found between vertebrate groups at level of chromo-somal organisation of these genes. In Fig. 8 the chromosomalarrangements of the globin loci of several vertebrates (that arethose already considered for the promoter analysis) that belong todifferent groups are compared.
Globins of higher vertebrates are believed to have originatedfrom a common ancestral gene. When gnathostome fish evolvedfrom the more primitive agnathan, tetrameric hemoglobins withalpha and beta subunits replaced monomeric globins. Lampreys,the most primitive fish lineages, express larval and adulthemoglobins as single globin chains (Lanfranchi et al., 1994).
During the evolution of fish, the ancestral globin gene wasduplicated and the subsequent divergence of the gene pair gaverise to the modern α- and β-globin genes. The tandem dup-lication event that led to the evolution of the vertebrate α- andβ-globin genes would initially have left the two genes adjacent.In teleost fish, that display a high level of genomic plasticity(Volff, 2005; Froschauer et al., 2006), the two genes have been
n of the B. eatonii Hb 1 α- and β-globin genes is compared to the arrangements ofpath of key evolutionary steps of this class of genes. The arrows under the genesate that their clusters are not completely characterised. A thick dashed line forund for their adult α- and β-globin genes. In the H. sapiens globin gene cluster,
207K. Marino et al. / Gene 406 (2007) 199–208
undergone to a chromosomal rearrangement of inversion, toform a tightly linked, divergent transcription unit (McMorrowet al., 1996; Miyata and Aoki, 1997; Chan et al., 1997; Coccaet al., 2000). In these organisms, α- and β-globin genes areoriented 5′ to 5′ relative to each other, separated by anintergenic region that presumably functions as dual promoter,regulating the simultaneous expression of the α- and β-globinchains. In amphibians, α- and β-globin genes are organised onthe same chromosome as two distinct, but consecutive clusters(Hosbach et al., 1983). As vertebrates evolved, a majormutational event (or events) eliminated the tight linkage of α-and β-globin genes found in fish and amphibians. This im-portant genomic rearrangement, consisting of a translocationor a process of chromosome duplication (Wheeler et al., 2004),probably occurred in the common ancestor of amniotes.
As a result of this, in mammals and birds α- and β-globingenes form two separated clusters, placed on different chromo-somes, where the genes are usually arranged along their order ofontogenic expression (Maniatis et al., 1980; Dodgson et al.,1979; Engel and Dodgson, 1980).
Except for the group of teleost fish and amphibians, verylittle is known about globin genes in the lower vertebrates.Among reptiles, α- and β-globin sequences from a turtle havebeen described (Shishikura, 2002), but there is complete lackof data about the arrangement of globin genes. A fewinvestigations have been made on Hbs from sharks and skates(Nash et al., 1976; Aschauer et al., 1985; Chong et al., 1999;Naoi et al., 2001), but this work represents the firstcontribution about the organisation of globin genes in thekey group of chondrichthyans. The relative orientation of theglobin genes pair of B. eatonii, that result to be linked at 3′ to5′ of each other with equal transcriptional polarity, corre-sponds to the organisation found for the adult αA- and β A-globin genes of Xenopus.
The similarity between the arrangement of adult globingenes in Xenopus and Bathyraja allows us to speculate byconsidering the particular arrangement found in teleostean as a“discontinuity” along the evolutionary course of this class ofgenes.
Interestingly, the ongoing characterisation of the genomeof the cartilaginous fish Callorhinchus milii (Venkatesh etal., 2005) shows that a significant number of random samplessequences are more similar to human than to homologousray-finned fish sequences. This suggests that a substantialnumber of genes may be evolving faster in ray-finned fishthan in other vertebrate lineages, and that the genome of theformer seems to be quite divergent from those of the othervertebrates.
Acknowledgements
This study is in the framework of the Italian National Prog-ramme for Antarctic Research. We gratefully acknowledge thelogistic support provided to our field research team at PalmerStation and on board the R/V LM Gould by the personnel ofRaytheon Polar Services and by the captains and crews of the R/V LM Gould.
Appendix A. Supplementary data
Supplementary data associated with this article can be found,in the online version, at doi:10.1016/j.gene.2007.10.002.
References
Andrews, N.C., Erdjument-Bromage, H., Davidson, M.B., Tempst, P., Orkin, S.H.,1993. Erythroid transcription factor NF-E2 is a haematopoietic-specific basic-leucine zipper protein. Nature 362, 722–728.
Aschauer, H., Weber, R.E., Braunitzer, G., 1985. The primary structure of thehemoglobin of the dogfish shark (Squalus acanthias). Antagonistic effectsof ATP and urea on oxygen affinity of an elasmobranch hemoglobin. Biol.Chem. Hoppe-Seyler 366, 589–599.
Breathnach, R., Chambon, P., 1981. Organization and expression of eukaryoticsplit genes coding for proteins. Ann. Rev. Biochem. 50, 349–383.
Bucher, P., 1990. Weight matrix descriptions of four eukaryotic RNApolymerase II promoter elements derived from 502 unrelated promotersequences. J. Mol. Biol. 212, 563–578.
Chan, F.Y., et al., 1997. Characterisation of adult α- and β-globin genes in thezebrafish. Blood 89, 688–700.
Chomczynski, P., Sacchi, N., 1987. Single step method of RNA isolation by acidguanidinium thiocyanate–phenol–chloroform extraction. Anal. Biochem.162, 156–159.
Chong, K.T., Miyazaki, G., Morimoto, H., Oda, Y., Park, S.Y., 1999. Structuresof the deoxy and CO forms of haemoglobin from Dasyatis akajei, acartilaginous fish. Acta Crystallogr., D Biol. Crystallogr. 55, 1291–1300.
Chuzhanova, N.A., Krawczak, M., Thomas, N., Nemytikova, L.A., Gusev, V.D.,Cooper, D.N., 2002. The evolution of the vertebrate β-globin gene promoter.Evolution 56, 224–232.
Cocca, E., Detrich III, H.W., Parker, S.K., di Prisco, G., 2000. A cluster of fourglobin genes from the Antarctic fish Notothenia coriiceps. J. Fish Biol. 57,33–50.
Collins, F.S., Weissman, S.M., 1984. The molecular genetics of humanhemoglobin. Prog. Nucleic Acid Res. Mol. Biol. 31, 315–462.
Dodgson, J.B., Strommer, J., Engel, J.D., 1979. Isolation of the chicken β-globin gene and a linked embryonic b-like globin gene from a chicken DNArecombinant library. Cell 17, 879–887.
Efstratiadis, A., et al., 1980. The structure and evolution of the human β-globingene family. Cell 21, 653–668.
Eleouet, J.F., Romeo, P.H., 1993. CACCC-binding or simian-virus-40-protein-1-binding proteins cooperate with human GATA-1 to direct erythroid-specific transcription and to mediate 5′ hypersensitive site 2 sensitivity of aTATA-less promoter. Eur. J. Biochem. 212, 763–770.
Engel, J.D., Dodgson, J.B., 1980. Analysis of the closely linked adult chicken α-globin genes in recombinant DNAs. Proc. Natl. Acad. Sci. U. S. A. 77,2596–2600.
Farache, G., Razin, S.V., Rzeszowska-Wolny, J., Moreau, J., Targa, F.R.,Scherrer, K., 1990. Mapping of structural and transcription-related matrixattachment sites in the alpha-globin gene domain of avian erythroblasts anderythrocytes. Mol. Cell. Biol. 10, 5349–5358.
Froschauer, A., Braasch, I., Volff, J.N., 2006. Fish genomes, comparativegenomics and vertebrate evolution. Curr. Genomics 7, 43–57.
Guindon, S., Gascuel, O., 2003. A simple, fast, and accurate algorithm toestimate large phylogenies by maximum likelihood. Syst. Biol. 52, 696–704.
Hardison, R., 1998. Hemoglobins from bacteria to man: evolution of differentpatterns of gene expression. J. Exp. Biol. 201, 1099–1117.
Heinemeyer, T., et al., 1998. Databases on transcriptional regulation:TRANSFAC, TRRD, and COMPEL. Nucleic Acids Res. 26, 364–370.
Hodge, D., et al., 2006. A global role for EKLF in definitive and primitiveerythropoiesis. Blood 107, 3359–3370.
Hosbach, H.A., Wyler, T., Weber, R., 1983. The Xenopus laevis globin genefamily: chromosomal arrangement and gene structure. Cell 32, 45–53.
Keller, E.B., Noon, W.A., 1984. Intron splicing: a conserved internal signal inintrons of animal pre-mRNAs. Proc. Natl. Acad. Sci. U. S. A. 81, 7417–7420.
Kikugawa, K., et al., 2004. Basal jawed vertebrate phylogeny inferred frommultiple nuclear DNA-coded genes. BMC Biol. 2, 1–11.
208 K. Marino et al. / Gene 406 (2007) 199–208
Kim, C.G., Swendeman, S.L., Barnhart, K.M., Sheffery, M., 1990. Promoterelements and erythroid cell nuclear factors that regulate alpha-globin genetranscription in vitro. Mol. Cell. Biol. 10, 5958–5966.
Kumar, S., Hedges, S.B., 1998. A molecular timescale for vertebrate evolution.Nature 392, 917–920.
Kumar, S., Tamura, K., Nei, M., 2004. MEGA3: integrated software formolecular evolutionary genetics analysis and sequence alignment. Brief.Bioinform. 5, 150–163.
Lanfranchi, G., Pallavicini, A., Laveder, P., Valle, G., 1994. Ancestralhemoglobin switching in lampreys. Dev. Biol. 164, 402–408.
Lawn, R.M., Efstratiadis, A., O'Connell, C., Maniatis, T., 1980. The nucleotidesequence of the human beta-globin gene. Cell 21, 647–651.
Liebhaber, S.A., Gootsens, M.J., Kan, Y.W., 1980. Cloning and completenucleotide sequence of human 5′-alpha-globin gene. Proc. Natl. Acad. Sci.U. S. A. 77, 7054–7058.
Maniatis, T., Fritsch, E.F., Lauer, J., Lawn, R.M., 1980. The molecular geneticsof human hemoglobins. Annu. Rev. Genet. 14, 145–178.
McMorrow, T., Wagner, A., Deryckere, F., Gannon, F., 1996. Structuralorganization and sequence analysis of the globin locus in Atlantic salmon.DNA Cell Biol. 15, 407–414.
Miyata, M., Aoki, T., 1997. Head-to-head linkage of carp alpha and beta-globingenes. Biochim. Biophys. Acta 1354, 127–133.
Naoi, Y., et al., 2001. The functional similarity and structural diversity of humanand cartilaginous fish hemoglobins. J. Mol. Biol. 307, 259–270.
Nash, A.R., Fisher, W.K., Thompson, E.O., 1976. Haemoglobins of the shark,Heterodontus portusjacksoni II. Amino acid sequence of the alpha-chain.Aust. J. Biol. Sci. 29, 73–97.
Ohler, U., Harbeck, S., Niemann, H., Noeth, E., Reese, M.G., 1999. InterpolatedMarkov chains for eukaryotic promoter recognition. Bioinformatics 15,362–369.
Orkin, S.H., 1990. Globin gene regulation and switching: circa 1990. Cell 63,665–672.
Padgett, R.A., Grabowski, P.J., Konarska, M.M., Seiler, S., Sharp, P.A., 1986.Splicing of messenger RNA precursors. Ann. Rev. Biochem. 55, 1119–1150.
Patient, R.K., Elkington, J.A., Kay, R.M., Williams, J.G., 1980. Internalorganization of the major adult alpha- and beta-globin genes of X. laevis.Cell 21, 565–573.
Petrovick,M.S., Hiebert, S.W., Friedman, A.D., Hetherington, C.J., Tenen, D.G.,Zhang, D.E., 1998.Multiple functional domains of AML1: PU.1 andC/EBPasynergize with different regions of AML1. Mol. Cell. Biol. 18, 3915–3925.
Proudfoot, N., 1991. Poly(A) signals. Cell 64, 671–674.Sambrook, J., Fritsch, E.F., Maniatis, T., 1989. Molecular Cloning: a Laboratory
Manual, 2nd Edn. Cold Spring Harbor Laboratory Press, Plainview, NewYork.Shishikura, F., 2002. The primary structure of haemoglobin D from the Aldabra
giant tortoise, Geochelone gigantea. Zool. Sci. 19, 197–206.Thompson, J.D., Higgins, D.G., Gibson, T.J., 1994. CLUSTAL W: improving
the sensitivity of progressive multiple sequence alignment through sequenceweighting, position-specific gap penalties and weight matrix choice. NucleicAcids Res. 22, 4673–4680.
Tracey Jr, W.D., Pepling, M.E., Horb, M.E., Thomsen, G.H., Gergen, J.P., 1998.A Xenopus homologue of aml-1 reveals unexpected patterning mecha-nisms leading to the formation of embryonic blood. Development 125,1371–1380.
Venkatesh, B., Tay, A., Dandona, N., Patil, J.G., Brenner, S., 2005. A compactcartilaginous fish model genome. Curr. Biol. 15, R82–R83.
Verde, C., et al., 2005. Structure, function and molecular adaptations ofhaemoglobins of the polar cartilaginous fish Bathyraja eatonii and Rajahyperborea. Biochem. J. 389, 297–306.
Volff, J.N., 2005. Genome evolution and biodiversity in teleost fish. Heredity94, 280–294.
Wheeler, D., Hope, R.M., Cooper, S.J.B., Gooley, A.A., Holland, R.A.B., 2004.Linkage of the b-like w-globin gene to a-like globin genes in an Australianmarsupial supports the chromosome duplication model for separation ofglobin gene clusters. J. Mol. Evol. 58, 642–652.