
Hockey India Coaching Education Pathway Level '1' Certified ...
Upload
khangminh22Category
view
2download
0
ORIGINAL ARTICLE
Ice hockey skate starts: a comparison of high and low calibreskaters
Philippe J. Renaud1• Shawn M. K. Robbins2
• Philippe C. Dixon1,3•
Jaymee R. Shell1 • Rene A. Turcotte1• David J. Pearsall1
Published online: 11 February 2017
� International Sports Engineering Association 2017
Abstract The forward skating start is a fundamental skill
for ice hockey players, yet extremely challenging given the
low traction of the ice surface. The technique for maximum
skating acceleration of the body is not well understood.
The aim of this study was to evaluate kinematic ice hockey
skating start movement technique in relation to a skater’s
skill level. A 10-camera motion capture system placed on
the ice surface recorded ‘‘hybrid-V’’ skate start movement
patterns of high and low calibre male ice hockey players
(n = 7, 8, respectively). Participants’ lower body kine-
matics and estimated body centre of mass (CoM) move-
ment during the first four steps were calculated. Both skate
groups had similar lower body strength profiles, yet high
calibre skaters achieved greater velocity; skating technique
differences most likely explained the performance differ-
ences between the groups. Unlike over ground sprint start
technique, skating starts showed greater concurrent hip
abduction, external rotation and extension, presumably for
ideal blade-to-ice push-off orientation for propulsion. Ini-
tial analysis revealed similar hip, knee and ankle joint gross
movement patterns across skaters, however, further scru-
tiny of the data revealed that high calibre skaters achieved
greater vertical CoM acceleration during each step that in
turn allowed greater horizontal traction, forward propul-
sion, lower double-support times and, accordingly, faster
starts with higher stride rates.
Keywords Ice hockey � Ice skating � Biomechanics � 3D
kinematics � Motion capture � Hip � Knee � Ankle
1 Introduction
Ice hockey is one of the fastest team sports, with players
reaching peak speeds in excess of 40 km/h [1, 2]. Such
speeds can be sustained due to low ice resistance to for-
ward glide; low surface friction works against the athlete
during the skate start, as minimal blade grip can hamper
forward propulsion. In a game situation, forward skating
acceleration is crucial to a player’s overall success. For
example, the players with faster starts are more likely to
win puck possession, outmaneuver their opponents, and
achieve tactical separation from defensive players. Con-
sequently, power skating, and in particular skating starts, is
emphasized in skill development [3], which involves many
repetitions, with skating performance improvement asses-
sed by lower skating drill times. Experienced coaches often
stress ‘‘correct’’ body movement technique, yet there is
limited information as to what exactly proper technique is
and how it leads to better skate start acceleration.
Studies have used different measurement techniques
including single and multi-camera (film, video) recording
[4–6], direct joint measures using electrogoniometers
[7, 8], and three-dimensional motion tracking on ice [9],
using treadmills [10] and synthetic ice surfaces [11, 12].
Using these approaches, some key movement traits of skate
starts have been identified. For instance, de Koning et al.
[13], using three film cameras of speed skaters’ starts,
& Philippe J. Renaud
1 Department of Kinesiology and Physical Education, McGill
Research Centre for Physical Activity and Health, McGill
University, Montreal, QC, Canada
2 Centre for Interdisciplinary Research in Rehabilitation,
Constance Lethbridge Rehabilitation Centre and the School
of Physical and Occupational Therapy, McGill University,
Montreal, QC, Canada
3 Department of Engineering Science, University of Oxford,
Oxford, UK
Sports Eng (2017) 20:255–266
DOI 10.1007/s12283-017-0227-0
found that male elite skaters displayed ‘‘running-like’’
initial push-offs in order to generate propulsion, then
transitioned to a ‘‘glide’’ technique during steady-state
skating. Chang et al. [14] and Buckeridge et al. [7], using
goniometers placed about the knee and hip, were able to
examine differences in joint kinematics corresponding to
speed and player calibre, respectively. However, these
studies were often limited by one or more factors: low
measurement resolution and accuracy [5, 6], small mea-
surement field of view with respect to task [4], non-ice
testing [12, 14] and/or focused description of lower body
movements without relation to global body progression
[7, 14].
Further study is warranted to better understand how the
hip, knee, and ankle joints move in the ice hockey skate
start technique. Therefore, the purpose of this study was to
conduct a comprehensive kinematic analysis of low and
high calibre skaters during ice hockey starts using three-
dimensional motion capture cameras on the ice surface.
This quantitative data may identify key movement patterns
for maximal skate start accelerations that coaches and
trainers can use as teaching cues for athlete development.
2 Methods
2.1 Participants and protocol
Seven high calibre (HC; age 24.7 ± 3.1 years, height
184.2 ± 6.4 cm, mass 87.1 ± 6.0 kg, playing experience
19.7 ± 3.9 years, mean ± SD) and eight low calibre (LC;
age 23.9 ± 3.1 years, height 179.4 ± 3.4 cm, mass
81.3 ± 8.4 kg, playing experience 9 ± 6 years,
mean ± SD) male skaters participated in this study.
Assumed to be technically superior, HC skaters played at
the junior level or higher; LC skaters played at lower than
junior level. Groups were similar in age, height and weight
(p[ 0.05, via independent t test). HC skaters had signifi-
cantly more playing experience than LC skaters
(p = 0.001, via independent t test). Participants also had
equivalent leg strength as estimated by the mean average of
three dry-land double-support long jump trials (HC;
219.1 ± 17.0 cm, LC; 208.5 ± 18.8 cm, mean ± SD)
(p = 0.28, via independent t test). Participants who had
major lower limb injuries within the last year were exclu-
ded from this study. Prior to testing, all participants read
and signed the ethics consent form. A research ethics
certificate was granted by the McGill University Research
Ethics Board II. All participants wore Bauer MX3 skates
with standard boots and were sharpened to a 3/8 in. hollow
with a 9.5 radius (both standard) by the same technician
prior to data collection. They were told to lace their skates
as they would in a game; this was decided in order to keep
the participants as comfortable as possible in the new
skates. They were allotted a 5 min warm-up period on the
ice surface away from the calibrated capture area. Partici-
pants performed three repetitions of a maximum effort
forward skating start by listening to the following
instructions: ‘‘When I yell ‘GO!’ I want you to skate for-
ward as fast as you can’’. They were told to keep their
skates parallel prior to the ‘‘GO!’’ call, as they started their
movement, they were free to choose how to position their
skates to allow them to accelerate as quickly as possible.
Participants were specifically told not to perform a cross-
over start.
2.2 Motion capture
A 10-camera Vicon MX3 ? (eight cameras) and T-Series
T40S (two cameras) motion capture system (Vicon Motion
Systems Ltd., Oxford, UK) was setup on the arena ice
surface. The system was calibrated prior to each testing
session and captured data at a rate of 240 Hz. The
approximate calibrated capture area consisted of a volume
of 3 m wide 9 6.5 m long 9 1.5 m high to track the first
four skating steps of the start (Fig. 1). Participants wore
tight fitting compression clothing in addition to test skates,
hockey gloves, helmet, and a hockey stick to carry while
skating in order to replicate game situation skating.
2.3 Marker placement
Each participant had 24 passive retro-reflective markers
placed on their lower limbs according to the ViconTM Plug-
in-Gait lower body setup (Vicon Motion Systems Ltd.,
Oxford, UK, [15]) (Fig. 2). Additional markers were
placed on the skates and knees of each participant to allow
for accurate ankle joint centre calculations. After partici-
pant calibration, the medial knee and medial ankle markers
were removed for the dynamic skating trials. The mid-point
between the left and right posterior superior iliac spine
markers was computed and used to estimate the whole
body Centre of Mass (CoM) [16, 17] position (mid-PSI
marker on Fig. 2).
2.4 Data analysis
All data from the ten infrared cameras were collected
through the Vicon MX Ultranet and Vicon Giganet con-
nection hubs and ViconTM Nexus (Ver 1.8.5, Vicon Motion
Systems Ltd., Oxford, UK) software. This same software
was used to label and extract the kinematics of the lower
body including hip (flexion/extension; abduction/adduc-
tion; and internal/external rotations), and knee (flexion/
extension) angles. The local hip and knee rotation angles
were adjusted using the thigh-offset technique as described
256 P. J. Renaud et al.

Fig. 1 Diagram of the on-ice
experimental setup. Camera
positions were standardized for
all participants. Fixed points on
the rink (stars) were used as
reference for camera positions.
Large shaded rectangle shows
camera capture area. Black dot
shows the location of the origin
of the global coordinate system
Fig. 2 Modified lower body plug-in-gait (Vicon Motion Systems Ltd., UK) calibration marker placement on participant
Ice hockey skate starts: a comparison of high and low calibre skaters 257
by Baker et al. [18]. Vicon IQ (Ver 2.5, Vicon Motion
Systems Ltd., Oxford, UK) was used to gap fill all of the
marker data, while Visual3D (Ver 5.01.23, C-Motion Inc.,
Germantown, Maryland, United States) was used to esti-
mate CoM velocity, acceleration and position. Visual3D
was also used to calculate the ankle kinematics (plan-
tar/dorsi flexion) angles with the modified marker place-
ment on the skates (see Fig. 2). The lower body angles
definitions were derived from YXZ Cardan angles with the
following ordered rotations: flexion, abduction, and rota-
tion. A fourth order low pass Butterworth [19] filter with a
cutoff frequency of 6 Hz was used to filter the data. Data
were partitioned from the first to the fourth step of the
skating start for all participants.
A representative trial selection method [20] was per-
formed on the three skating start trials for each participant;
whereby the root mean squared error between each curve
and the mean curve for all dependent variables was cal-
culated. From this calculation, the trial out of the three
which had the overall average minimum root mean squared
error was chosen as the representative trial. This technique
was chosen in order for a true captured trial to be used for
data analysis.
2.5 Event and phase definitions
For each four steps (S1–S4) of each trial, ice contact events
(ON) and end of ice contact events (OFF) were identified
through Visual3D by the velocity of the toe marker in the
direction of forward progression [21] and the jerk of the
heel marker in the vertical direction [22], respectively.
Subsequently, these ON and OFF events were used to
define the eight kinematic variables: (1) task completion
time, (2) step length and (3) width, (4) double-support time,
(5) angle during ice contact and CoM (6) position, (7)
velocity and (8) acceleration.
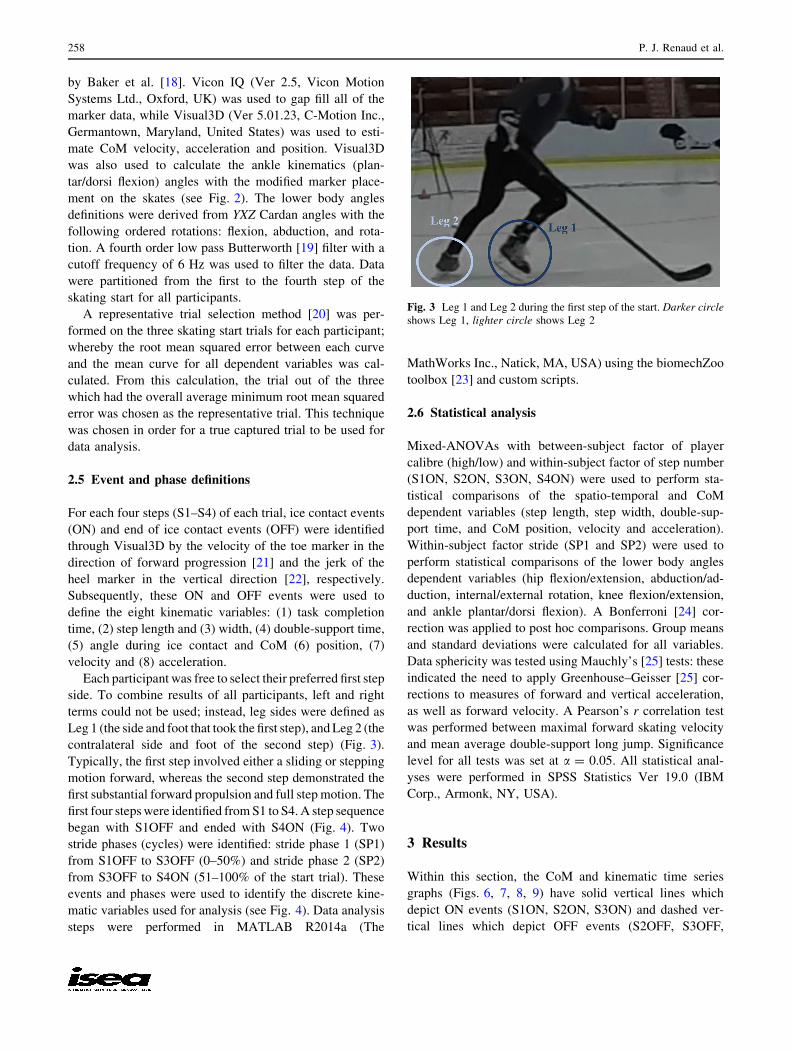
Each participant was free to select their preferred first step
side. To combine results of all participants, left and right
terms could not be used; instead, leg sides were defined as
Leg 1 (the side and foot that took the first step), and Leg 2 (the
contralateral side and foot of the second step) (Fig. 3).
Typically, the first step involved either a sliding or stepping
motion forward, whereas the second step demonstrated the
first substantial forward propulsion and full step motion. The
first four steps were identified from S1 to S4. A step sequence
began with S1OFF and ended with S4ON (Fig. 4). Two
stride phases (cycles) were identified: stride phase 1 (SP1)
from S1OFF to S3OFF (0–50%) and stride phase 2 (SP2)
from S3OFF to S4ON (51–100% of the start trial). These
events and phases were used to identify the discrete kine-
matic variables used for analysis (see Fig. 4). Data analysis
steps were performed in MATLAB R2014a (The
MathWorks Inc., Natick, MA, USA) using the biomechZoo
toolbox [23] and custom scripts.
2.6 Statistical analysis
Mixed-ANOVAs with between-subject factor of player
calibre (high/low) and within-subject factor of step number
(S1ON, S2ON, S3ON, S4ON) were used to perform sta-
tistical comparisons of the spatio-temporal and CoM
dependent variables (step length, step width, double-sup-
port time, and CoM position, velocity and acceleration).
Within-subject factor stride (SP1 and SP2) were used to
perform statistical comparisons of the lower body angles
dependent variables (hip flexion/extension, abduction/ad-
duction, internal/external rotation, knee flexion/extension,
and ankle plantar/dorsi flexion). A Bonferroni [24] cor-
rection was applied to post hoc comparisons. Group means
and standard deviations were calculated for all variables.
Data sphericity was tested using Mauchly’s [25] tests: these
indicated the need to apply Greenhouse–Geisser [25] cor-
rections to measures of forward and vertical acceleration,
as well as forward velocity. A Pearson’s r correlation test
was performed between maximal forward skating velocity
and mean average double-support long jump. Significance
level for all tests was set at a = 0.05. All statistical anal-
yses were performed in SPSS Statistics Ver 19.0 (IBM
Corp., Armonk, NY, USA).
3 Results
Within this section, the CoM and kinematic time series
graphs (Figs. 6, 7, 8, 9) have solid vertical lines which
depict ON events (S1ON, S2ON, S3ON) and dashed ver-
tical lines which depict OFF events (S2OFF, S3OFF,
Fig. 3 Leg 1 and Leg 2 during the first step of the start. Darker circle
shows Leg 1, lighter circle shows Leg 2
258 P. J. Renaud et al.

S4OFF). Darker vertical lines depict Leg 1 events, and
lighter vertical lines depict Leg 2 events.
3.1 Start acceleration performance
HC (1.03 ± 0.08 s) skaters performed the skate start in
significantly shorter time than LC (1.20 ± 0.18 s) skaters
(p = 0.037). Leg strength (as estimated from long jump
distances) did not significantly correlate with forward
skating velocity at the four skating start steps ON events
(p[ 0.05). Step length and step width measures were
similar between groups. However, a main effect of step
was found for step length, wherein both groups demon-
strated significant increases in step length with each con-
secutive step (Fig. 5). HC skaters showed higher stride
rates than LC skaters (1.95 vs 1.7 strides/s, respectively,
p = 0.043). A main effect of calibre was found for double-
support time; these double-support times were very short
for each group (less than 0.01 s, Table 1), indicative of a
running gait pattern. Indeed, HC skaters’ double-support
times were negligible to non-existent for the 2nd to 3rd
step.
Fig. 4 Sequence of plug-in-gait
step events (left to right). These
events have been used to define
the variables within the results
section. Darker circles depict
Leg 1 events, lighter circles
depict Leg 2 events. Solid
circles are ON events, dashed
circles are OFF events. Darker
and lighter solid horizontal bars
show when Leg 1 and Leg 2
were in contact with the ice
surface
Fig. 5 Mean step lengths for each respective step by skating calibre
groups (±SD bars). SStep lengths increased for each consecutive step
Ice hockey skate starts: a comparison of high and low calibre skaters 259

3.2 Estimation of body CoM movement
Side-to-side CoM excursion was substantial (i.e.
±0.7–0.9 m from midline) from step to step; however, no
differences were found between calibre groups over the
skate start duration. Mean CoM vertical position over the
four start steps’ ice contacts for HC skaters was signifi-
cantly higher than compared to LC skaters (Fig. 6;
Table 2).
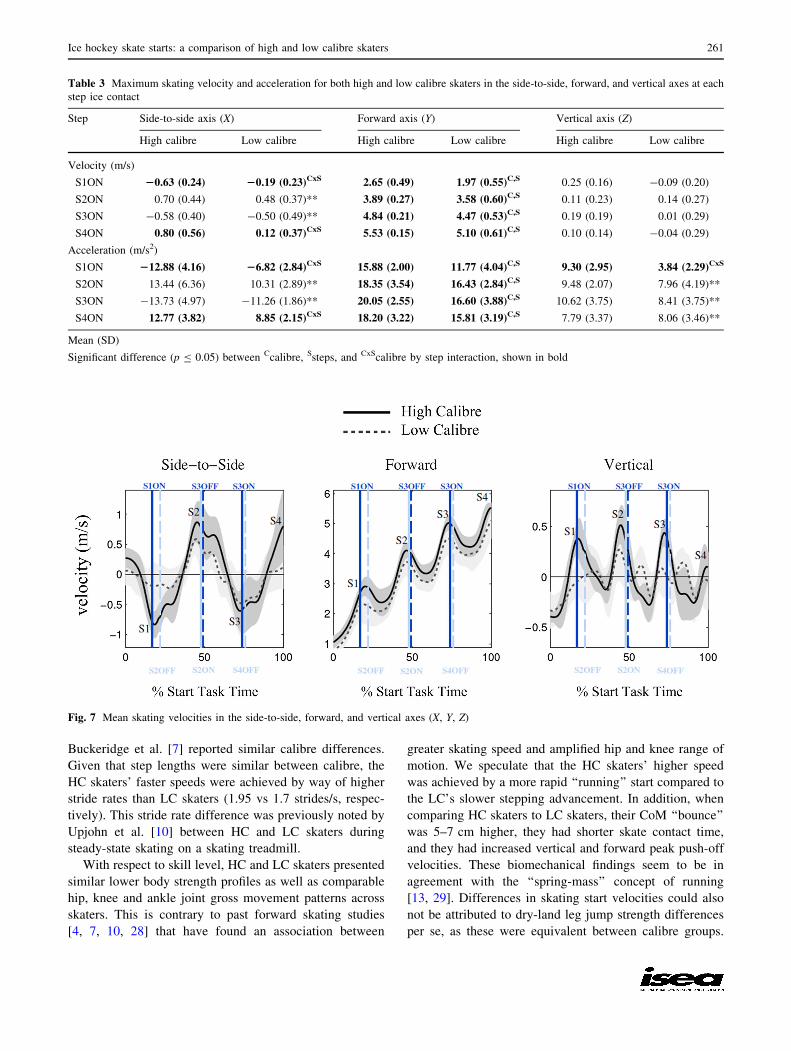
Skating start CoM velocity and acceleration measures
are presented in the side-to-side (X), forward (Y) and ver-
tical (Z) directions in Table 3 as well as Figs. 7 and 8. In
general, skaters increased their forward velocity from 2 m/
s at step 1–5 m/s at step 4, with peak step forward accel-
erations of 11–20 m/s2. HC skaters achieved larger mean
forward velocities and accelerations than LC skaters over
the four start steps (p B 0.048). In the vertical direction,
over the first three steps, HC skaters generated peak
accelerations of 9.3–10.6 m/s2 compared to LC skaters’
3.8–8.4 m/s2: this corresponded to the greater elevation of
HC’ CoM movement path and transient flight phase
between steps 2 and 3. In terms of side-to-side motion, both
calibre groups showed substantial peak reversal accelera-
tions ranging from 6.8 to 13.7 m/s2: considerably higher
than seen in walking or running gait [26].
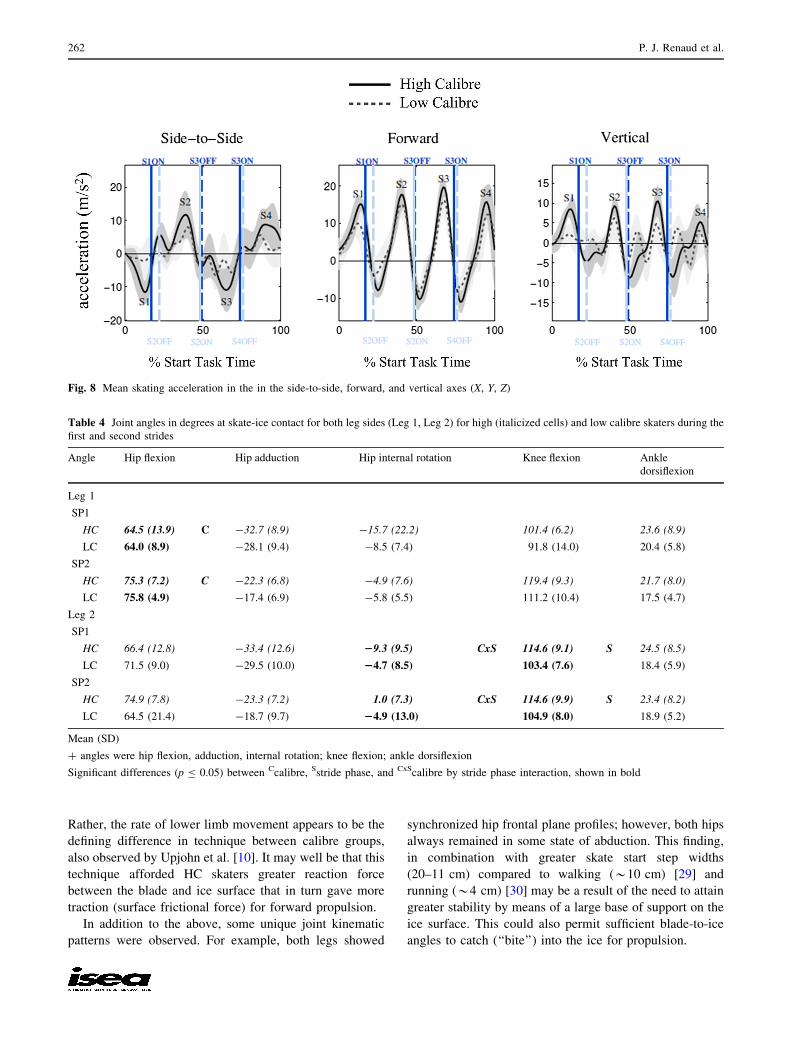
3.3 Lower limb joint angles
In general, no significant main effect of calibre or calibre x
step interaction was observed for the first and second step
leg joint angles during ice contact (Table 4). However,
interaction effects in stride phases between HC and LC
were detected in hip internal/external rotation for Leg 2
(p = 0.029); as well as a main stride phase effects in hip
flexion/extension for Leg 1 (p = 0.002), and a main calibre
effect of knee flexion/extension for Leg 2 (p = 0.026)
(Fig. 9).
4 Discussion
This study examined the kinematic movement technique of
ice hockey skating starts in relation to skater calibre level.
Detailed 3D kinematic measures of skaters’ lower body
kinematics and estimated CoM progression during the first
four steps were obtained in situ on the ice surface. Dif-
ferent from over ground sprint start kinematic technique
[27], these skating starts showed greater concurrent hip
abduction, external rotation and extension, presumably for
ideal blade-to-ice push-off orientation for propulsion. This
finding agrees with Stull et al. [12] three-dimensional
analysis of skate starts performed on a synthetic ice sur-
face. HC skaters covered 6.25 m in shorter time (1.03 vs
1.20 s) and faster speed by the 4th step (5.53 vs 5.10 m/s)
than LC skaters. In practical terms, HC skaters completed
the task one step (literally) ahead of the LC skaters, a major
tactical advantage in the game of ice hockey. The fact that
HC skaters had higher accelerations in the side-to-side and
vertical directions during their first step, as well as higher
velocities in the side-to-side direction for the first step,
seems to give them the ability for larger initial propulsion.
Table 1 Skating double-support time in seconds for both high and
low calibre skaters for 1st to 3rd steps
Step High calibre Low calibre
S1ON 0.036 (0.042) 0.098 (0.063)C
S2ON -0.015 (0.029) 0.040 (0.046)C
S3ON 0.003 (0.029) 0.038 (0.028)C
Mean (SD)
A negative value denotes a flight phase (i.e. no double support)C Significant difference between calibre groups (p B 0.05)
Fig. 6 Mean vertical (Z) CoM position during skate start strides
Table 2 Vertical (Z) CoM position in cm for both high and low
calibre skaters at each step ice contact
Step High calibre Low calibre
S1ON -2.0 (3.3) -4.8 (2.7)C
S2ON 3.3 (2.7) -4.3 (4.3)C
S3ON 3.2 (2.8) -3.9 (2.8)C
S4ON 1.1 (2.7) -4.8 (3.2)C
Mean (SD). Zero vertical reference height taken from participant’s
initial start positionC significant difference between calibre groups (p B 0.05)
260 P. J. Renaud et al.
Buckeridge et al. [7] reported similar calibre differences.
Given that step lengths were similar between calibre, the
HC skaters’ faster speeds were achieved by way of higher
stride rates than LC skaters (1.95 vs 1.7 strides/s, respec-
tively). This stride rate difference was previously noted by
Upjohn et al. [10] between HC and LC skaters during
steady-state skating on a skating treadmill.
With respect to skill level, HC and LC skaters presented
similar lower body strength profiles as well as comparable
hip, knee and ankle joint gross movement patterns across
skaters. This is contrary to past forward skating studies
[4, 7, 10, 28] that have found an association between
greater skating speed and amplified hip and knee range of
motion. We speculate that the HC skaters’ higher speed
was achieved by a more rapid ‘‘running’’ start compared to
the LC’s slower stepping advancement. In addition, when
comparing HC skaters to LC skaters, their CoM ‘‘bounce’’
was 5–7 cm higher, they had shorter skate contact time,
and they had increased vertical and forward peak push-off
velocities. These biomechanical findings seem to be in
agreement with the ‘‘spring-mass’’ concept of running
[13, 29]. Differences in skating start velocities could also
not be attributed to dry-land leg jump strength differences
per se, as these were equivalent between calibre groups.
Table 3 Maximum skating velocity and acceleration for both high and low calibre skaters in the side-to-side, forward, and vertical axes at each
step ice contact
Step Side-to-side axis (X) Forward axis (Y) Vertical axis (Z)
High calibre Low calibre High calibre Low calibre High calibre Low calibre
Velocity (m/s)
S1ON 20.63 (0.24) 20.19 (0.23)CxS 2.65 (0.49) 1.97 (0.55)C,S 0.25 (0.16) -0.09 (0.20)
S2ON 0.70 (0.44) 0.48 (0.37)** 3.89 (0.27) 3.58 (0.60)C,S 0.11 (0.23) 0.14 (0.27)
S3ON -0.58 (0.40) -0.50 (0.49)** 4.84 (0.21) 4.47 (0.53)C,S 0.19 (0.19) 0.01 (0.29)
S4ON 0.80 (0.56) 0.12 (0.37)CxS 5.53 (0.15) 5.10 (0.61)C,S 0.10 (0.14) -0.04 (0.29)
Acceleration (m/s2)
S1ON 212.88 (4.16) 26.82 (2.84)CxS 15.88 (2.00) 11.77 (4.04)C,S 9.30 (2.95) 3.84 (2.29)CxS
S2ON 13.44 (6.36) 10.31 (2.89)** 18.35 (3.54) 16.43 (2.84)C,S 9.48 (2.07) 7.96 (4.19)**
S3ON -13.73 (4.97) -11.26 (1.86)** 20.05 (2.55) 16.60 (3.88)C,S 10.62 (3.75) 8.41 (3.75)**
S4ON 12.77 (3.82) 8.85 (2.15)CxS 18.20 (3.22) 15.81 (3.19)C,S 7.79 (3.37) 8.06 (3.46)**
Mean (SD)
Significant difference (p B 0.05) between Ccalibre, Ssteps, and CxScalibre by step interaction, shown in bold
Fig. 7 Mean skating velocities in the side-to-side, forward, and vertical axes (X, Y, Z)
Ice hockey skate starts: a comparison of high and low calibre skaters 261
Rather, the rate of lower limb movement appears to be the
defining difference in technique between calibre groups,
also observed by Upjohn et al. [10]. It may well be that this
technique afforded HC skaters greater reaction force
between the blade and ice surface that in turn gave more
traction (surface frictional force) for forward propulsion.
In addition to the above, some unique joint kinematic
patterns were observed. For example, both legs showed
synchronized hip frontal plane profiles; however, both hips
always remained in some state of abduction. This finding,
in combination with greater skate start step widths
(20–11 cm) compared to walking (*10 cm) [29] and
running (*4 cm) [30] may be a result of the need to attain
greater stability by means of a large base of support on the
ice surface. This could also permit sufficient blade-to-ice
angles to catch (‘‘bite’’) into the ice for propulsion.
Fig. 8 Mean skating acceleration in the in the side-to-side, forward, and vertical axes (X, Y, Z)
Table 4 Joint angles in degrees at skate-ice contact for both leg sides (Leg 1, Leg 2) for high (italicized cells) and low calibre skaters during the
first and second strides
Angle Hip flexion Hip adduction Hip internal rotation Knee flexion Ankle
dorsiflexion
Leg 1
SP1
HC 64.5 (13.9) C -32.7 (8.9) -15.7 (22.2) 101.4 (6.2) 23.6 (8.9)
LC 64.0 (8.9) -28.1 (9.4) -8.5 (7.4) 91.8 (14.0) 20.4 (5.8)
SP2
HC 75.3 (7.2) C -22.3 (6.8) -4.9 (7.6) 119.4 (9.3) 21.7 (8.0)
LC 75.8 (4.9) -17.4 (6.9) -5.8 (5.5) 111.2 (10.4) 17.5 (4.7)
Leg 2
SP1
HC 66.4 (12.8) -33.4 (12.6) 29.3 (9.5) CxS 114.6 (9.1) S 24.5 (8.5)
LC 71.5 (9.0) -29.5 (10.0) 24.7 (8.5) 103.4 (7.6) 18.4 (5.9)
SP2
HC 74.9 (7.8) -23.3 (7.2) 1.0 (7.3) CxS 114.6 (9.9) S 23.4 (8.2)
LC 64.5 (21.4) -18.7 (9.7) 24.9 (13.0) 104.9 (8.0) 18.9 (5.2)
Mean (SD)
? angles were hip flexion, adduction, internal rotation; knee flexion; ankle dorsiflexion
Significant differences (p B 0.05) between Ccalibre, Sstride phase, and CxScalibre by stride phase interaction, shown in bold
262 P. J. Renaud et al.

Fig. 9 Mean lower limb joint angles during the skating start at skate-ice contact. The solid black vertical bars at the bottom of each angle-time
graph indicate the skate-ice contact support duration
Ice hockey skate starts: a comparison of high and low calibre skaters 263
Similarly, greater hip external rotation values were
found throughout the first four steps during the skate start.
The range of internal (?) and external (-) hip rotation was
from 0 to -35�. These values are substantially higher than
what was found by in steady-state skating on a skating
treadmill by Upjohn et al. [10]. The findings of the current
study show that the hips were both substantially abducted
and externally rotated during the start phase. This is
counter to Buckeridge et al. [7] postulation that the tran-
sition from the acceleration phase to steady skate skating
was defined solely by the change from hip extension to hip
abduction. Conversely, the present study found that con-
current hip abduction, external rotation and extension
seems to be essential in skating acceleration.
Furthermore, ankle plantar/dorsi flexion profiles were
observed to be distinct from running; all skaters demon-
strated substantial dorsiflexion (20�–30�) during each of
the skating step ice contact phases. This greater pre-dor-
siflex position of the ankle may in turn contribute to a
greater ‘‘plantar coil reflex’’ action, which in turn may
yield greater and faster vertical CoM flight. This could also
allow each consecutive step to be larger than the last, as
observed in this study. These ankle findings are similar to
those found using electrogoniometers by Pearsall et al. [31]
and Buckeridge et al. [7].
As stated above, in general, the lower limb kinematics
were similar between the groups. However, closer inspec-
tion showed some asymmetries between the leg side
kinematics, as well as a few calibre differences. These
differences are not easily explained, however they may be
attributed to the respective roles of the first and second
steps in initiating forward motion: the first step (defining
Leg 1 side) achieves a forward stable base of support, while
the opposite leg (Leg 2 side) contributes the first large
push-off effort followed by the second step. For example,
the starting leg side (Leg 1) increased hip flexion from 1st
to 2nd stride (64�–75�) but not for the opposite side (Leg
2). Also, differences between calibre and leg side were
seen; for examples, for Leg 2 side, (1) a decreased hip
internal rotation from 1st to 2nd stride (-9� to 1�) for HC
was measured but not LC (-4� to -5�), and (2) HC
increased knee flexion (115�) during the second stride,
whereas LC did not. This asymmetry persisted to a lesser
extent into the subsequent 3rd and 4th steps, and presum-
able symmetry in latter skating strides would be achieved.
Given the major challenge in maximizing traction, HC may
well have learned to maximize concurrent hip external
rotation and knee flexion on second step side (Leg 2) to
generate faster skating velocities.
In terms of practical coaching implications, this study’s
results suggest that kinematic tracking of the estimated
body’s CoM may be a key variable for performance out-
comes. Thus, in addition to maximal outward placement and
rotation of their step legs, coaches may want to emphasize to
athletes to achieve high stride rates to propel the skater’s
body both forward and upward during the skate start.
Future studies should include analysis of full-body
kinematics and larger sample sizes are warranted to con-
firm the asymmetrical differences found in hip and knee
kinematics. Though muscle strength (as estimated from
long jump trials) was not related to skating start velocity
future studies should focus on muscle power. This could be
achieved by adding more off-ice measurements to the
testing protocol. Vertical and lateral jump tests, as well as
other explosive plyometric tests could perhaps reveal the
difference in muscle power between high and low calibre
skaters. A more detailed examination of the skate start’s
ankle motion is also warranted. Furthermore, studies
combining skate force sensors [32] and 3D whole body
kinematic data would allow for an inverse dynamic anal-
ysis which would provide a better understanding of the
respective ankle, knee and hip joint power contributions
during the skating start. Additionally, further study on ice
hockey skating speed transition is needed to observe the
changing movement patterns from acceleration to steady-
state skating. Finally, future on-ice analysis should include
a broader range of participants spanning developmental age
as well as examining differences attributable to gender.
This study in itself is a substantial achievement in terms
of measuring ice hockey skating performance, as it
demonstrated the feasibility of using sophisticated motion
tracking technology within an ice arena’s cold, humid
environment. Though labor intensive in terms of the
repeated camera setup/take down between ice testing ses-
sions, the precision as well as the internal and external
validity of the results from these measures is far more
comprehensive to that of prior ice hockey skating studies.
Installation of permanent infrastructure to mount cameras,
cabling and computer links as shown by Bruening and
Richards [33] who have already demonstrated this for
figure skating jump analysis would make future direct on-
ice kinematic analysis of skating skills more time efficient.
This would have definite and far reaching practical impli-
cations for athlete skate training. Future studies are con-
ceivable with inclusion of more cameras to create a longer
skating corridor to analyze the ice hockey skating start
through to steady-state transition, as well as other tasks
such as backwards skating, turning, shooting, and
stickhandling.
5 Conclusion
This study successfully demonstrated the use of a 3D
motion capture camera system in an arena on the ice sur-
face to record detailed lower body kinematics of ice hockey
264 P. J. Renaud et al.

skating. Overall, HC skaters completed the task faster and
with larger overall forward velocity than LC skaters.
Though the gross movement patterns of the lower limbs
were very similar between groups, HC skaters displayed
higher stride rates than LC. In turn, the HC skaters
achieved a higher vertical CoM velocity and shorter dou-
ble-support times during the ‘‘running’’ start steps that may
have contributed to their greater forward acceleration. The
differences noted cannot be attributed to leg strength dis-
crepancies, as both groups had similar leg strength profiles.
The difference between HC and LC skaters is more likely
attributable to faster joint movement to elicit greater
muscle power and possibly greater traction to the ice. In
contrast to over ground sprint start kinematic technique,
greater concurrent hip abduction, external rotation and
extension seems to be essential for skate-to-ice push-off
orientation needed for propulsion.
Acknowledgements This work was financially supported by the
Natural Sciences and Engineering Research Council of Canada
(NSERC) under [Grant Number CRDPJ 453725-13]; as well as Bauer
Hockey Corp. The authors would like to thank Adrien Gerbe and
Spencer Paveck for their help during the data collection process.
Compliance with ethical standards
Conflict of interest The authors declare that they have no conflict of
interest.
References
1. Hamel J (2011) What is the maximum speed ice hockey players
reach? https://www.quora.com/What-is-the-maximum-speed-ice-
hockey-players-reach. Accessed 3 Mar 2016
2. NHL (2015) NHL Skills Competition All-Time Results,
1990–2012. http://www.nhl.com/ice/page.htm?id=67157. Acces-
sed 3 Mar 2016
3. Marino G (1995) Biomechanics of power skating: past research,
future trends. In: Proceedings of the XIII international sympo-
sium for biomechanics in sport, International Society for
Biomechanics in Sport. Lakehead University, Thunder Bay, ON,
pp 246–252
4. Lafontaine D (2007) Three-dimensional kinematics of the knee
and ankle joints for three consecutive push-offs during ice hockey
skating starts. Sports Biomech 6(3):391–406. doi:10.1080/
14763140701491427
5. McPherson MN, Wrigley A, Montelpare WJ, Pearsall D, Ashare A
(2004) The biomechanical characteristics of development-age
hockey players: determining the effects of body size on the assess-
ment of skating technique. In: Safety in ice hockey, pp 272–287
6. Shackel B (2008) A biomechanical comparison of starting technique
in speed skating and hockey. M.Sc. thesis, University of Manitoba
7. Buckeridge E, LeVangie MC, Stetter B, Nigg SR, Nigg BM
(2015) An on-ice measurement approach to analyse the biome-
chanics of ice hockey skating. PLoS One 10(5):e0127324. doi:10.
1371/journal.pone.0127324
8. Dewan C, Pearsall D, Turcotte R (2004) Ankle kinematics during
forward hockey skating: acceleration to constant velocity. In:
International Society for the Biomechanics of Sport, pp 387–390
9. Zuiker T (2014) The effects of different speed skating push-off
techniques on the mechanical power, power distribution and
energy expenditure. Dissertation, Delft University of Technology
10. Upjohn T, Turcotte R, Pearsall DJ, Loh J (2008) Three-dimen-
sional kinematics of the lower limbs during forward ice hockey
skating. Sports Biomech 7(2):206–221. doi:10.1080/1476314070
1841621
11. Stidwill TJ, Pearsall D, Turcotte R (2010) Comparison of skating
kinetics and kinematics on ice and on a synthetic surface. Sports
Biomech 9(1):57–64
12. Stull JD, Philippon MJ, LaPrade RF (2011) ‘‘At-risk’’ positioning
and hip biomechanics of the Peewee ice hockey sprint start. Am J
Sports Med 39(Suppl):29S–35S. doi:10.1177/0363546511414012
13. de Koning J, Thomas R, Berger M, de Groot G, van Ingen
Schenau G (1995) The start in speed skating: from running to
gliding. Med Sci Sports Exerc 27(12):1703–1708
14. Chang R, Turcotte R, Pearsall D (2009) Hip adductor muscle
function in forward skating. Sports Biomech 8(3):212–222.
doi:10.1080/14763140903229534
15. Oxford Metrics Ltd (1999) Plug-in Gait. Oxford Metrics Ltd,
Oxford
16. Ernst M, Gotze M, Muller R, Blickhan R (2014) Vertical adap-
tation of the center of mass in human running on uneven ground.
Hum Mov Sci 38:293–304. doi:10.1016/j.humov.2014.05.012
17. Myklebust H, Gloersen O, Hallen J (2015) Validity of ski skating
center of mass displacement measured by a single inertial mea-
surement unit. J Appl Biomech. doi:10.1123/jab.2015-0081
18. Baker R, Finney L, Orr J (1999) A new approach to determine the
hip rotation profile from clinical gait analysis data. Hum Mov Sci
18(5):655–667. doi:10.1016/S0167-9457(99)00027-5
19. Robertson DGE, Dowling JJ (2003) Design and responses of
Butterworth and critically damped digital filters. J Electromyogr
Kinesiol 13(6):569–573. doi:10.1016/S1050-6411(03)00080-4
20. Dixon PC, Tisseyre M, Damavandi M, Pearsall DJ (2011) Inter-
segment foot kinematics during cross-slope running. Gait Posture
33(4):640–644. doi:10.1016/j.gaitpost.2011.02.010
21. Zeni JA Jr, Richards JG, Higginson JS (2008) Two simple
methods for determining gait events during treadmill and over-
ground walking using kinematic data. Gait Posture
27(4):710–714. doi:10.1016/j.gaitpost.2007.07.007
22. Hreljac A, Marshall RN (2000) Algorithms to determine event
timing during normal walking using kinematic data. J Biomech
33(6):783–786
23. Dixon PC, Loh JJ, Michaud-Paquette Y, Pearsall DJ (2016)
biomechZoo: an open-source toolbox for the processing, analysis,
and visualization of biomechanical movement data. Comput
Methods Progr Biomed. doi:10.1016/j.cmpb.2016.11.007
24. Armstrong RA (2014) When to use the Bonferroni correction.
Ophthalmic Physiol Opt 34(5):502–508. doi:10.1111/opo.12131
25. Grieve AP (1984) Tests of sphericity of normal distributions and
the analysis of repeated measures designs. Psychometrika
49(2):257–267. doi:10.1007/bf02294176
26. Saibene F, Minetti AE (2003) Biomechanical and physiological
aspects of legged locomotion in humans. Eur J Appl Physiol
88(4–5):297–316
27. Nagahara R, Matsubayashi T, Matsuo A, Zushi K (2014) Kine-
matics of transition during human accelerated sprinting. Biol
Open 3(8):689–699. doi:10.1242/bio.20148284
28. Marino G (1983) Selected mechanical factors associated with
acceleration in ice skating. Res Q Exerc Sport 54(3):234–238
29. Owings TM, Grabiner MD (2004) Step width variability, but not
step length variability or step time variability, discriminates gait
of healthy young and older adults during treadmill locomotion.
J Biomech 37(6):935–938. doi:10.1016/j.jbiomech.2003.11.012
30. Arellano CJ, Kram R (2011) The effects of step width and arm
swing on energetic cost and lateral balance during running.
Ice hockey skate starts: a comparison of high and low calibre skaters 265

J Biomech 44(7):1291–1295. doi:10.1016/j.jbiomech.2011.01.
002
31. Pearsall D, Turcotte R, Lefebvre R, Bateni H, Nicolaou M,
Montgomery D, Chang R (2001) Kinematics of the foot and ankle
in forward ice hockey skating. In: ISBS-conference Proceedings
archive, vol 1
32. Stidwill T, Turcotte R, Dixon P, Pearsall D (2009) Force trans-
ducer system for measurement of ice hockey skating force. Sports
Eng 12(2):63–68. doi:10.1007/s12283-009-0033-4
33. Bruening DA, Richards JG (2006) The effects of articulated
figure skates on jump landing forces. J Appl Biomech 22(4):285
266 P. J. Renaud et al.
Copyright © 2022 FDOKUMEN