Organic matter composition and dynamics in a northern hardwood forest ecosystem 15 years after...
12
Organic matter composition and dynamics in a northern hardwood forest ecosystem 15 years after clear-cutting David A.N. Ussiri * , Chris E. Johnson Department of Civil and Environmental Engineering, Syracuse University, 151 Link Hall, Syracuse, NY 13244, USA Received 8 August 2006; received in revised form 15 December 2006; accepted 15 December 2006 Abstract Soil organic matter (SOM) plays an important role in governing soil properties and nutrient cycling in forest ecosystems. Clear-cutting alters the SOM cycle by changing decomposition rates and organic matter (OM) inputs to the forest ecosystem. We studied the 15-year clear-cutting response on the properties and composition of SOM at the Hubbard Brook Experimental Forest (HBEF) in New Hampshire. Solid-state 13 C nuclear magnetic resonance (NMR) spectroscopy was used to study the structural chemistry of SOM in whole soils and extracted humic substances. Overall, alkyl C and O-alkyl C were the dominant C fractions in soils and humic substances. Alkyl C accounted for 38–49% of the total NMR signal intensity in soils and 33–56% in humic substances. O-alkyl C accounted for 32–45% of the signal intensity in soils and 20–31% in humic substances. Following clear-cutting, the contribution of O-alkyl C increased in whole soils and humic acids of the Oa horizon, while alkyl C decreased in whole soils and humic acids of Oa and Bh horizons. Thus, the ratio of alkyl C to O-alkyl C, an index of the degree of decomposition of SOM, decreased in whole soils and humic acids after clear-cutting, indicating that the SOM in post-harvest soils is less decomposed relative to pre- harvest soils. On average, humic substances accounted for 47% of SOM. The concentration of humic acid decreased by up to 25% in Oa, E and Bh horizons after clear-cutting, while the concentration of fulvic acid decreased by more than 40% in the Oa and E horizons. Together, these results indicate that clear-cutting resulted in the loss of humic substances from the forest floor and upper mineral horizons, which was replaced by less decomposed OM in the post-clear-cut soils under the regrowing forest. # 2007 Elsevier B.V. All rights reserved. Keywords: 13 C CPMAS NMR; Forest soils; Spodosol; Humic substances; Forest clear-cutting; Hubbard Brook Experimental Forest 1. Introduction Soil organic matter (SOM) is a heterogeneous mixture of organic compounds of plant, animal and microbial origin in various stages of decomposition (Rice and MacCarthy, 1991; Stevenson, 1994). Soil organic matter forms a large and dynamic reservoir of C, which is a major part of the global C cycle. Global estimates of the C content of SOM ranges from 1100 to 3000 Pg (Schlesinger, 1997). As the major pool of terrestrial C resides in soil (Schlesinger, 1997; Jobba ´gy and Jackson, 2000), understanding the mechanisms and factors that govern SOM release and retention is central to terrestrial ecosystem research. Clear-cutting alters C cycling through removal of above- ground tree biomass for wood products. This induces changes in the forest ecosystem that extend to a wide range of biogeochemica1 processes (Likens et al., 1970; Boyle et al., 1973; Bormann et al., 1974; Mann et al., 1988). For example, the input of litter to the forest floor decreases for several years following clear-cutting (Hughes and Fahey, 1994). The removal of the forest canopy also causes decreased interception of atmospheric moisture, reduced transpiration, and increased soil temperatures due to increased solar radiation input to the soil surface. These conditions will likely stimulate microbial activity and therefore increase the rate of OM decomposition (Bormann et al., 1974; Clayton and Kennedy, 1985; Hen- dricksen et al., 1989; Mattson and Swank, 1989; Moore, 1989; Dahlgren and Driscoll, 1994; Johnson et al., 1995). Changes in decomposition rates and patterns after clear-cutting are likely to influence the amount, structure, and chemistry of OM in forest ecosystems. Experimental Watershed 5 (W5) at the Hubbard Brook Experimental Forest (HBEF) in New Hampshire was clear-cut www.elsevier.com/locate/foreco Forest Ecology and Management 240 (2007) 131–142 * Corresponding author. Current address: School of Environment and Natural Resources, The Ohio State University, 2021 Coffey Road, Columbus, OH 43210, USA. Fax: +1 614 292 7432. E-mail address: [email protected] (D.A.N. Ussiri). 0378-1127/$ – see front matter # 2007 Elsevier B.V. All rights reserved. doi:10.1016/j.foreco.2006.12.017
Transcript of Organic matter composition and dynamics in a northern hardwood forest ecosystem 15 years after...
www.elsevier.com/locate/foreco
Forest Ecology and Management 240 (2007) 131–142
Organic matter composition and dynamics in a northern hardwood forest
ecosystem 15 years after clear-cutting
David A.N. Ussiri *, Chris E. Johnson
Department of Civil and Environmental Engineering, Syracuse University, 151 Link Hall, Syracuse, NY 13244, USA
Received 8 August 2006; received in revised form 15 December 2006; accepted 15 December 2006
Abstract
Soil organic matter (SOM) plays an important role in governing soil properties and nutrient cycling in forest ecosystems. Clear-cutting alters the
SOM cycle by changing decomposition rates and organic matter (OM) inputs to the forest ecosystem. We studied the 15-year clear-cutting response
on the properties and composition of SOM at the Hubbard Brook Experimental Forest (HBEF) in New Hampshire. Solid-state 13C nuclear
magnetic resonance (NMR) spectroscopy was used to study the structural chemistry of SOM in whole soils and extracted humic substances.
Overall, alkyl C and O-alkyl C were the dominant C fractions in soils and humic substances. Alkyl C accounted for 38–49% of the total NMR signal
intensity in soils and 33–56% in humic substances. O-alkyl C accounted for 32–45% of the signal intensity in soils and 20–31% in humic
substances. Following clear-cutting, the contribution of O-alkyl C increased in whole soils and humic acids of the Oa horizon, while alkyl C
decreased in whole soils and humic acids of Oa and Bh horizons. Thus, the ratio of alkyl C to O-alkyl C, an index of the degree of decomposition of
SOM, decreased in whole soils and humic acids after clear-cutting, indicating that the SOM in post-harvest soils is less decomposed relative to pre-
harvest soils. On average, humic substances accounted for 47% of SOM. The concentration of humic acid decreased by up to 25% in Oa, E and Bh
horizons after clear-cutting, while the concentration of fulvic acid decreased by more than 40% in the Oa and E horizons. Together, these results
indicate that clear-cutting resulted in the loss of humic substances from the forest floor and upper mineral horizons, which was replaced by less
decomposed OM in the post-clear-cut soils under the regrowing forest.
# 2007 Elsevier B.V. All rights reserved.
Keywords: 13C CPMAS NMR; Forest soils; Spodosol; Humic substances; Forest clear-cutting; Hubbard Brook Experimental Forest
1. Introduction
Soil organic matter (SOM) is a heterogeneous mixture of
organic compounds of plant, animal and microbial origin in
various stages of decomposition (Rice and MacCarthy, 1991;
Stevenson, 1994). Soil organic matter forms a large and
dynamic reservoir of C, which is a major part of the global C
cycle. Global estimates of the C content of SOM ranges from
1100 to 3000 Pg (Schlesinger, 1997). As the major pool of
terrestrial C resides in soil (Schlesinger, 1997; Jobbagy and
Jackson, 2000), understanding the mechanisms and factors that
govern SOM release and retention is central to terrestrial
ecosystem research.
* Corresponding author. Current address: School of Environment and Natural
Resources, The Ohio State University, 2021 Coffey Road, Columbus, OH
43210, USA. Fax: +1 614 292 7432.
E-mail address: [email protected] (D.A.N. Ussiri).
0378-1127/$ – see front matter # 2007 Elsevier B.V. All rights reserved.
doi:10.1016/j.foreco.2006.12.017
Clear-cutting alters C cycling through removal of above-
ground tree biomass for wood products. This induces changes
in the forest ecosystem that extend to a wide range of
biogeochemica1 processes (Likens et al., 1970; Boyle et al.,
1973; Bormann et al., 1974; Mann et al., 1988). For example,
the input of litter to the forest floor decreases for several years
following clear-cutting (Hughes and Fahey, 1994). The removal
of the forest canopy also causes decreased interception of
atmospheric moisture, reduced transpiration, and increased soil
temperatures due to increased solar radiation input to the soil
surface. These conditions will likely stimulate microbial
activity and therefore increase the rate of OM decomposition
(Bormann et al., 1974; Clayton and Kennedy, 1985; Hen-
dricksen et al., 1989; Mattson and Swank, 1989; Moore, 1989;
Dahlgren and Driscoll, 1994; Johnson et al., 1995). Changes in
decomposition rates and patterns after clear-cutting are likely to
influence the amount, structure, and chemistry of OM in forest
ecosystems.
Experimental Watershed 5 (W5) at the Hubbard Brook
Experimental Forest (HBEF) in New Hampshire was clear-cut

D.A.N. Ussiri, C.E. Johnson / Forest Ecology and Management 240 (2007) 131–142132
harvested in the winter of 1983–1984 for a long-term
investigation aimed at the determination of the patterns of
nutrient reorganization after clear-cutting. Previous research
showed that changes in forest floor and mineral soil C were not
statistically detectable for the first 3 years after clear-cutting
(Huntington and Ryan, 1990). After 8 years, pools of C in the
forest floor had declined by 27% ( p = 0.05), however, there were
no detectable changes in pools of C in the mineral soil (Johnson
et al., 1995). Increased OM concentrations were observed in E,
Bh, and Bs1 horizons between post-harvest years 3 and 8, but
remained unchanged in Bs2 horizon which comprises the bulk of
the solum (Johnson et al., 1995, 1997). In the mineral soils C:N
and C:OM ratios declined after clear-cutting, suggesting that
SOM was enriched in N relative to C, and C was preferentially
lost from mineral soils in the first 8 years after clear cutting
(Johnson, 1995). Dissolved organic carbon (DOC) concentra-
tions in zero-tension lysimeter solutions from Oa, Bh, and Bs
horizons and stream water increased in the first 9 years after
clear-cutting relative to uncut watershed 6 nearby (Johnson et al.,
1995; Dahlgren and Driscoll, 1994; Dai et al., 2001). Overall,
these findings suggested that changes in the chemistry of SOM
and dissolved organic matter in soil solution and stream water
following clear-cutting are the result of changes in both the
quality and quantity of SOM.
Recent advances in solid-state 13C nuclear magnetic
resonance (NMR) spectroscopy have made possible its routine
application to studies of soil organic matter (Baldock et al., 1992;
Baldock and Preston, 1995; Preston, 1996, 2001; Kogel-
Knabner, 1992, 1997, 2000). This technique affords the
opportunity to examine the distribution of soil C among classes
of structures, such as alkyl C, O-alkyl C, aromatic C, and
carbonyl C. Furthermore, solid-state 13C NMR spectroscopy
enables direct study of SOM in whole soil samples without
extraction. We used 13C NMR spectroscopy and chemical
methods to examine the chemistry and structure of SOM from
watershed 5 at the Hubbard Brook Experimental Forest. The
objective of this study was to assess the effects of clear-cutting on
the chemistry of SOM. To do this, we examined both soils and
humic substances of pre-harvest (1983) and post-harvest (1986,
1991, and 1998) watershed 5 at HBEF. The results from 1983
(pre-clear-cutting) have been published previously in greater
detail (Ussiri and Johnson, 2003), but they are included in this
paper as reference point since this manuscript builds on the
earlier work due to the time series nature of the study. In this
paper we examine the following research questions: (i) What are
the effects of clear-cutting on the chemical structure and
composition of SOM? (ii) Did clear-cutting change the
concentration and/or composition of various SOM fractions?
(iii) Did clear-cutting result in preferential loss of any SOM
fractions?
2. Materials and methods
2.1. Site description and soil sampling
The HBEF lies in the southern White Mountains of New
Hampshire (458560N and 718450W). Detailed description of
climate, geology and hydrology at the HBEF may be found
elsewhere (Federer et al., 1990; Likens and Bormann, 1995).
Vegetation in the study area is mostly northern hardwood,
dominated by American beech (Fagus grandifolia), sugar
maple (Acer saccharum), and yellow birch (Betula allegha-
niensis). Pockets of the spruce-fir forest type, consisting of red
spruce (Picea rubens), balsam fir (Abies balsamea) and white
birch (Betula papyrifera) are found at the highest elevations,
and on exposed slopes (Whittaker et al., 1974).
Soils at the HBEF are predominantly well-drained, coarse-
loamy, mixed-frigid Typic Haplorthods with a 3–15 cm organic
layer at the surface (Likens and Bormann, 1995). These soils
are acidic (pH < 4.5) with low base saturation and cation
exchange capacity (Johnson et al., 1991b). Average soil depth
to C horizon (or bedrock) is about 60 cm (Johnson et al.,
1991a). This experiment was conducted in W5, a 23-ha
watershed, which was clear cut in a whole-tree harvest in the
winter of 1983–1984. All trees with diameter at breast height
�5 cm were cut with chain saws and feller-bunchers, except in
a buffer strip along the watershed boundary. Whole trees were
removed from most of W5 in the spring and summer of 1984
with rubber tired skidders. More details of the clear-cutting
operation may be found in Ryan et al. (1992).
A stratified random sampling strategy was used in the study
to ensure coverage of the watershed. Sixty sampling locations
were chosen, 10 locations in each of 6 elevation bands of W5.
At each location, four sampling sites were chosen. Soils were
sampled from W5 prior to clear-cutting (1983) and in post-
harvest years 3, 8 and 15 (1986, 1991 and 1998). Sixty pits were
excavated in each sampling year at one site on each location.
Soil samples were collected by depth and by genetic horizons.
A more detailed description of the sampling plan and
methodology can be found elsewhere (Huntington et al.,
1988; Johnson et al., 1991a,b, 1997). Samples were air-dried to
a constant weight, sieved through a 5 mm (O horizons) or 2 mm
(mineral horizons) screen, and archived in glass jars. A subset
of the genetic horizon samples was used in this study. We used
samples collected from six pits in each sampling year, selected
to represent the range of elevation found in W5. Each of the
selected pits exhibited the full suite of horizons typically found
in HBEF Spodosols (i.e., Oi + Oe, Oa, E, Bh, Bs1, and Bs2).
Selected properties of the soil samples used in this study are
presented in Table 1.
2.2. Extraction, fractionation and purification of humic
substances
Humic substances were extracted from soil samples of the
Oa, E, Bh, Bs1 and Bs2 horizons. The procedures used for
extraction, fractionation, and purification of humic substances
in this study are summarized in Ussiri and Johnson (2003),
which includes a flow-chart. Briefly, humic substances were
extracted with 0.5 M NaOH at soil mass (g) to solution volume
(ml) ratios of 1:10 and 1:20 for mineral horizon soils and
organic horizons, respectively, under an N2 atmosphere
(Stevenson, 1994). The extracted humic substances were
fractionated into humic acid and fulvic acid by acidifying the
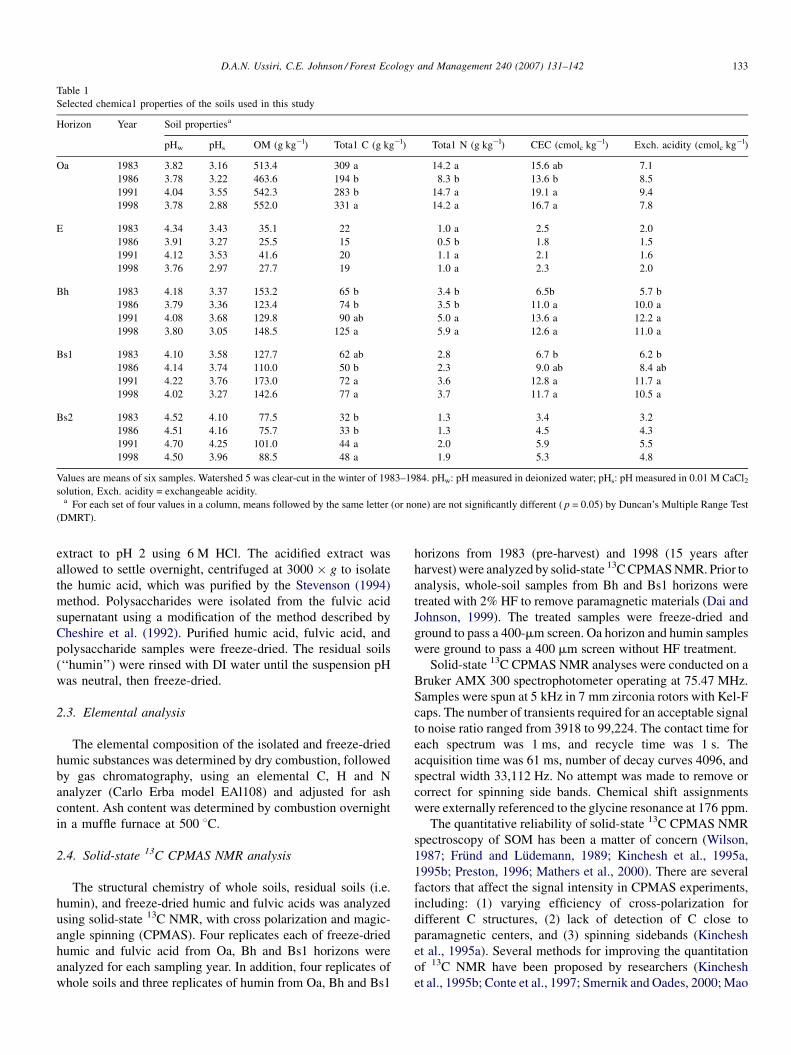
Table 1
Selected chemica1 properties of the soils used in this study
Horizon Year Soil propertiesa
pHw pHs OM (g kg�l) Tota1 C (g kg�l) Tota1 N (g kg�l) CEC (cmolc kg�l) Exch. acidity (cmolc kg�l)
Oa 1983 3.82 3.16 513.4 309 a 14.2 a 15.6 ab 7.1
1986 3.78 3.22 463.6 194 b 8.3 b 13.6 b 8.5
1991 4.04 3.55 542.3 283 b 14.7 a 19.1 a 9.4
1998 3.78 2.88 552.0 331 a 14.2 a 16.7 a 7.8
E 1983 4.34 3.43 35.1 22 1.0 a 2.5 2.0
1986 3.91 3.27 25.5 15 0.5 b 1.8 1.5
1991 4.12 3.53 41.6 20 1.1 a 2.1 1.6
1998 3.76 2.97 27.7 19 1.0 a 2.3 2.0
Bh 1983 4.18 3.37 153.2 65 b 3.4 b 6.5b 5.7 b
1986 3.79 3.36 123.4 74 b 3.5 b 11.0 a 10.0 a
1991 4.08 3.68 129.8 90 ab 5.0 a 13.6 a 12.2 a
1998 3.80 3.05 148.5 125 a 5.9 a 12.6 a 11.0 a
Bs1 1983 4.10 3.58 127.7 62 ab 2.8 6.7 b 6.2 b
1986 4.14 3.74 110.0 50 b 2.3 9.0 ab 8.4 ab
1991 4.22 3.76 173.0 72 a 3.6 12.8 a 11.7 a
1998 4.02 3.27 142.6 77 a 3.7 11.7 a 10.5 a
Bs2 1983 4.52 4.10 77.5 32 b 1.3 3.4 3.2
1986 4.51 4.16 75.7 33 b 1.3 4.5 4.3
1991 4.70 4.25 101.0 44 a 2.0 5.9 5.5
1998 4.50 3.96 88.5 48 a 1.9 5.3 4.8
Values are means of six samples. Watershed 5 was clear-cut in the winter of 1983–1984. pHw: pH measured in deionized water; pHs: pH measured in 0.01 M CaCl2solution, Exch. acidity = exchangeable acidity.
a For each set of four values in a column, means followed by the same letter (or none) are not significantly different ( p = 0.05) by Duncan’s Multiple Range Test
(DMRT).
D.A.N. Ussiri, C.E. Johnson / Forest Ecology and Management 240 (2007) 131–142 133
extract to pH 2 using 6 M HCl. The acidified extract was
allowed to settle overnight, centrifuged at 3000 � g to isolate
the humic acid, which was purified by the Stevenson (1994)
method. Polysaccharides were isolated from the fulvic acid
supernatant using a modification of the method described by
Cheshire et al. (1992). Purified humic acid, fulvic acid, and
polysaccharide samples were freeze-dried. The residual soils
(‘‘humin’’) were rinsed with DI water until the suspension pH
was neutral, then freeze-dried.
2.3. Elemental analysis
The elemental composition of the isolated and freeze-dried
humic substances was determined by dry combustion, followed
by gas chromatography, using an elemental C, H and N
analyzer (Carlo Erba model EAl108) and adjusted for ash
content. Ash content was determined by combustion overnight
in a muffle furnace at 500 8C.
2.4. Solid-state 13C CPMAS NMR analysis
The structural chemistry of whole soils, residual soils (i.e.
humin), and freeze-dried humic and fulvic acids was analyzed
using solid-state 13C NMR, with cross polarization and magic-
angle spinning (CPMAS). Four replicates each of freeze-dried
humic and fulvic acid from Oa, Bh and Bs1 horizons were
analyzed for each sampling year. In addition, four replicates of
whole soils and three replicates of humin from Oa, Bh and Bs1
horizons from 1983 (pre-harvest) and 1998 (15 years after
harvest) were analyzed by solid-state 13C CPMAS NMR. Prior to
analysis, whole-soil samples from Bh and Bs1 horizons were
treated with 2% HF to remove paramagnetic materials (Dai and
Johnson, 1999). The treated samples were freeze-dried and
ground to pass a 400-mm screen. Oa horizon and humin samples
were ground to pass a 400 mm screen without HF treatment.
Solid-state 13C CPMAS NMR analyses were conducted on a
Bruker AMX 300 spectrophotometer operating at 75.47 MHz.
Samples were spun at 5 kHz in 7 mm zirconia rotors with Kel-F
caps. The number of transients required for an acceptable signal
to noise ratio ranged from 3918 to 99,224. The contact time for
each spectrum was 1 ms, and recycle time was 1 s. The
acquisition time was 61 ms, number of decay curves 4096, and
spectral width 33,112 Hz. No attempt was made to remove or
correct for spinning side bands. Chemical shift assignments
were externally referenced to the glycine resonance at 176 ppm.
The quantitative reliability of solid-state 13C CPMAS NMR
spectroscopy of SOM has been a matter of concern (Wilson,
1987; Frund and Ludemann, 1989; Kinchesh et al., 1995a,
1995b; Preston, 1996; Mathers et al., 2000). There are several
factors that affect the signal intensity in CPMAS experiments,
including: (1) varying efficiency of cross-polarization for
different C structures, (2) lack of detection of C close to
paramagnetic centers, and (3) spinning sidebands (Kinchesh
et al., 1995a). Several methods for improving the quantitation
of 13C NMR have been proposed by researchers (Kinchesh
et al., 1995b; Conte et al., 1997; Smernik and Oades, 2000; Mao
D.A.N. Ussiri, C.E. Johnson / Forest Ecology and Management 240 (2007) 131–142134
et al., 2000; Smernik, 2005). However, these methods require
extended time of analysis and/or additional analyses, therefore
limiting the number of samples that can be analyzed. Studies of
soils and humic substances have indicated that the fraction of C
in the aromatic and carbonyl regions of 13C CPMAS NMR
spectra may be underestimated, causing overestimation of alkyl
and O-alkyl C fractions (Kinchesh et al., 1995a; Mao et al.,
2000). Consequently, the integrated 13C CPMAS NMR spectra
may not reflect the true distribution of C in an individual
sample. Kinchesh et al. (1995a), however, suggested that the
results of 13C CPMAS NMR could be used for comparison of
samples of similar origin. Our goal was to analyze as many
samples as possible to detect changes in the composition of
specific horizons and SOM fractions with time; therefore we
limited our analyses to 13C CPMAS NMR.
3. Statistical methods
The Student’s two-sample t-test was used to test the
significant differences between pre- and post-harvest samples.
After testing for the equality of the variances, the appropriate
formulation of the t-test was applied. Mean comparison was
conducted using Duncan’s Multiple Range Test (DMRT) when
means were different by t-test ( p � 0.05).
4. Results
4.1. Soils
Chemical properties of the soils used in this study are given in
Table 1. Since we used only a subset of the samples collected, the
values in Table 1 may be somewhat different than the overall
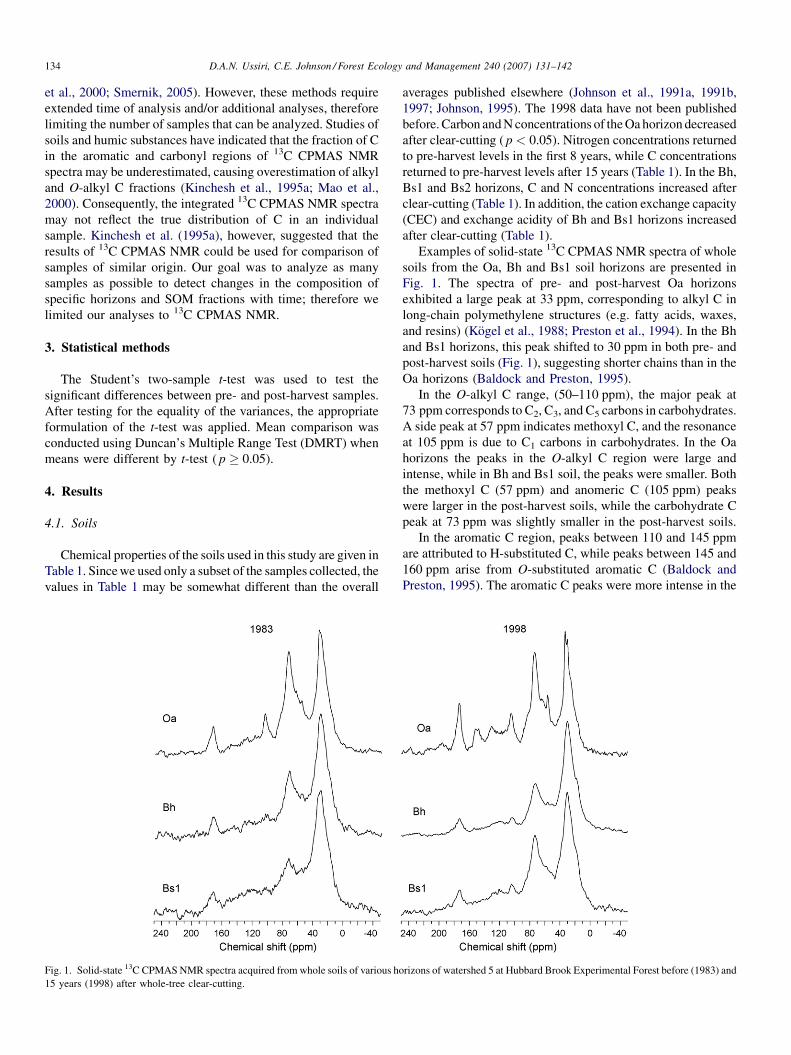
Fig. 1. Solid-state 13C CPMAS NMR spectra acquired from whole soils of various ho
15 years (1998) after whole-tree clear-cutting.
averages published elsewhere (Johnson et al., 1991a, 1991b,
1997; Johnson, 1995). The 1998 data have not been published
before. Carbon and N concentrations of the Oa horizon decreased
after clear-cutting ( p < 0.05). Nitrogen concentrations returned
to pre-harvest levels in the first 8 years, while C concentrations
returned to pre-harvest levels after 15 years (Table 1). In the Bh,
Bs1 and Bs2 horizons, C and N concentrations increased after
clear-cutting (Table 1). In addition, the cation exchange capacity
(CEC) and exchange acidity of Bh and Bs1 horizons increased
after clear-cutting (Table 1).
Examples of solid-state 13C CPMAS NMR spectra of whole
soils from the Oa, Bh and Bs1 soil horizons are presented in
Fig. 1. The spectra of pre- and post-harvest Oa horizons
exhibited a large peak at 33 ppm, corresponding to alkyl C in
long-chain polymethylene structures (e.g. fatty acids, waxes,
and resins) (Kogel et al., 1988; Preston et al., 1994). In the Bh
and Bs1 horizons, this peak shifted to 30 ppm in both pre- and
post-harvest soils (Fig. 1), suggesting shorter chains than in the
Oa horizons (Baldock and Preston, 1995).
In the O-alkyl C range, (50–110 ppm), the major peak at
73 ppm corresponds to C2, C3, and C5 carbons in carbohydrates.
A side peak at 57 ppm indicates methoxyl C, and the resonance
at 105 ppm is due to C1 carbons in carbohydrates. In the Oa
horizons the peaks in the O-alkyl C region were large and
intense, while in Bh and Bs1 soil, the peaks were smaller. Both
the methoxyl C (57 ppm) and anomeric C (105 ppm) peaks
were larger in the post-harvest soils, while the carbohydrate C
peak at 73 ppm was slightly smaller in the post-harvest soils.
In the aromatic C region, peaks between 110 and 145 ppm
are attributed to H-substituted C, while peaks between 145 and
160 ppm arise from O-substituted aromatic C (Baldock and
Preston, 1995). The aromatic C peaks were more intense in the
rizons of watershed 5 at Hubbard Brook Experimental Forest before (1983) and

Fig. 2. Carbon distribution in whole soils of watershed 5 at Hubbard Brook
Experimental Forest based on 13C CPMAS NMR analysis before (1983) and 15
years (1998) after whole-tree clear-cutting. Error bars represent standard errors
of the means.
D.A.N. Ussiri, C.E. Johnson / Forest Ecology and Management 240 (2007) 131–142 135
post-harvest Oa horizon soils (Fig. 1). In the carbonyl C region
(160–220 ppm), there was only one peak at 173 ppm. This peak
originates primarily from carboxyl C, but amides and esters can
also contribute (Baldock and Preston, 1995). The carboxylic C
peaks were larger and more intense in the post-harvest Oa
horizons (Fig. 1).
Integration of the major regions of 13C resonance indicated
that the major C components in whole-SOM were alkyl C (38–
49%) and O-alkyl C (32–45% of total C). Together, alkyl C and
O-alkyl C typically accounted for about 80% of C in Hubbard
Brook SOM (Fig. 2). The contributions of aromatic and
carbonyl C were much smaller (10–15% and 5–10% of total C,
respectively, Fig. 2). These ranges are consistent with ranges for
forest soils reported by Mahieu et al. (1999). The proportion of
alkyl C was greater in mineral soils than in Oa horizons,
increasing from 39% in the Oa horizon to 45% in the Bs1
horizon of the pre-harvest profile, and from 38% to 44% in the
post-harvest profile. The aromatic C fraction also increased
with increasing soil depth from 11% to 15% in the pre-harvest
profile, and from 10% to 14% in the post-harvest profile. In
contrast, the O-alkyl C fraction decreased from 45% of total C
in the Oa horizon to 32% of total C in the pre-harvest Bs1
horizon, and from 41 to 31% in the post-harvest soils. The
proportion of carbonyl C did not show any significant changes
with increased soil depth (Fig. 2).
Oa horizons did not show detectable changes in alkyl C and
aromatic C concentration 15 years after clear-cutting, but mean
O-alkyl C decreased from an average of 45% of total C in 1983
to 40% of total C in 1998 ( p = 0.1). Carbonyl C increased by
nearly two-fold from 5% of total C in 1983 to 9% of total C 15
years later ( p = 0.01, Fig. 2). In the Bh horizon, the alkyl C
decreased significantly ( p = 0.05) from 49% of total C in 1983
to 43% of total C in 1998. In addition, carbonyl C nearly
doubled in the Bh horizon 15 years after-clear-cutting (Fig. 2).
In the Bs1 horizon, changes in the alkyl C, O-alkyl C, aromatic
C and carbonyl C fractions were not statistically significant.
4.2. Isolated humic substances
4.2.1. Concentration of humic substances extracted
Extractable humic substances ranged from 307 to 624 g kg�1
of SOM in HBEF soils (Table 2). Both humic and fulvic acid
concentrations decreased significantly after clear-cutting in the
Oa horizon ( p < 0.05, Table 2). Humic acid decreased by nearly
24% in the first 3 years and did not return to the pre-harvest
concentrations by year 15. Fulvic acid decreased by nearly 47%
and did not return to pre-harvest concentrations during first 15
years (Table 2). In the E horizon, the fulvic acid concentration
decreased by 51% in the first 8 years after harvest ( p < 0.05).
Similar decreases in humic acid were also observed. In the Bh
horizon, humic acid concentrations decreased significantly by
about 25% in the first 3 years and remained lower than pre-
harvest concentrations after 15 years.
4.2.2. NMR analysis of humic and fulvic acid
Examples of solid-state 13C CPMAS NMR spectra of
isolated humic and fulvic acid fractions are presented in Figs. 3
and 4, respectively. Spectra of humic and fulvic acids from Oa,
Bh, and Bs1 horizons exhibited distinct peaks in the alkyl C (0–
50 ppm), O-alkyl C (50–110 ppm), aromatic C (110–160 ppm),
carboxyl C (160–185 ppm) and ketone (185–220 ppm) regions.
In the alkyl C region humic acid extracted from the Oa horizon
had a broad alkyl C peak centered around 33 ppm (Fig. 3) while
in the fulvic acid this peak centered around 29 ppm (Fig. 4). In
Bh and Bs1 horizons, the alkyl peak in humic acid shifted
downward to around 29 ppm (Fig. 3), while in fulvic acid this
peak shifted upwards to 38 ppm (Fig. 4). The decrease in
chemical shift of the alkyl C peak towards 25 ppm in humic
acid indicates a reduction in long-chain polymethylene
structures and/or an increase in short-chain polymers (Baldock
and Preston, 1995). This pattern indicates that the alkyl C of
humic acids extracted from mineral soils had shorter chains
than those from the Oa horizon, possibly due to the breakdown
of long-chain structures over time in the mineral horizons.
Methoxyl C and carbohydrate C peaks at 57 and 73 ppm,
respectively, dominated the O-alkyl C region of humic and
fulvic acid spectra. These peaks were large and intense in
humic acid extracted from the Oa horizons, and decreased in
intensity in the mineral horizons (Bh and Bs1). In fulvic acid,
however, the methoxyl peak at 57 ppm was much less
prominent than in corresponding humic acid samples, and
only minor variations were observed with soil depth.
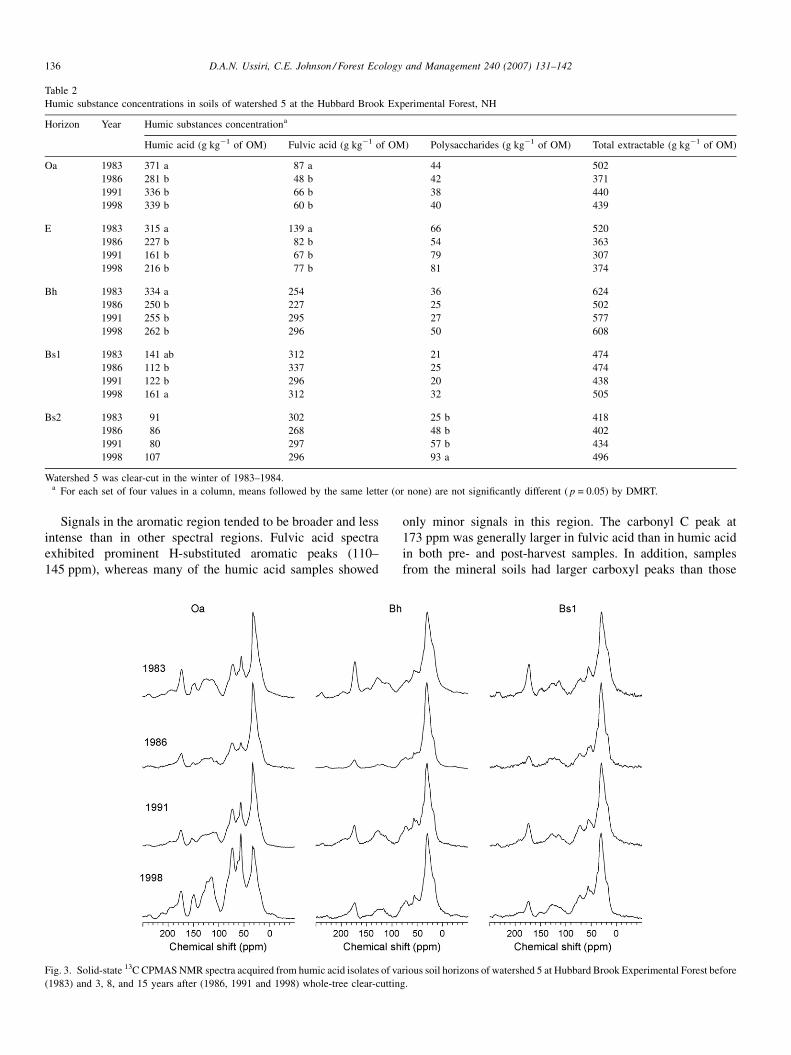
Table 2
Humic substance concentrations in soils of watershed 5 at the Hubbard Brook Experimental Forest, NH
Horizon Year Humic substances concentrationa
Humic acid (g kg�1 of OM) Fulvic acid (g kg�1 of OM) Polysaccharides (g kg�1 of OM) Total extractable (g kg�1 of OM)
Oa 1983 371 a 87 a 44 502
1986 281 b 48 b 42 371
1991 336 b 66 b 38 440
1998 339 b 60 b 40 439
E 1983 315 a 139 a 66 520
1986 227 b 82 b 54 363
1991 161 b 67 b 79 307
1998 216 b 77 b 81 374
Bh 1983 334 a 254 36 624
1986 250 b 227 25 502
1991 255 b 295 27 577
1998 262 b 296 50 608
Bs1 1983 141 ab 312 21 474
1986 112 b 337 25 474
1991 122 b 296 20 438
1998 161 a 312 32 505
Bs2 1983 91 302 25 b 418
1986 86 268 48 b 402
1991 80 297 57 b 434
1998 107 296 93 a 496
Watershed 5 was clear-cut in the winter of 1983–1984.a For each set of four values in a column, means followed by the same letter (or none) are not significantly different ( p = 0.05) by DMRT.
D.A.N. Ussiri, C.E. Johnson / Forest Ecology and Management 240 (2007) 131–142136
Signals in the aromatic region tended to be broader and less
intense than in other spectral regions. Fulvic acid spectra
exhibited prominent H-substituted aromatic peaks (110–
145 ppm), whereas many of the humic acid samples showed
Fig. 3. Solid-state 13C CPMAS NMR spectra acquired from humic acid isolates of va
(1983) and 3, 8, and 15 years after (1986, 1991 and 1998) whole-tree clear-cuttin
only minor signals in this region. The carbonyl C peak at
173 ppm was generally larger in fulvic acid than in humic acid
in both pre- and post-harvest samples. In addition, samples
from the mineral soils had larger carboxyl peaks than those
rious soil horizons of watershed 5 at Hubbard Brook Experimental Forest before
g.
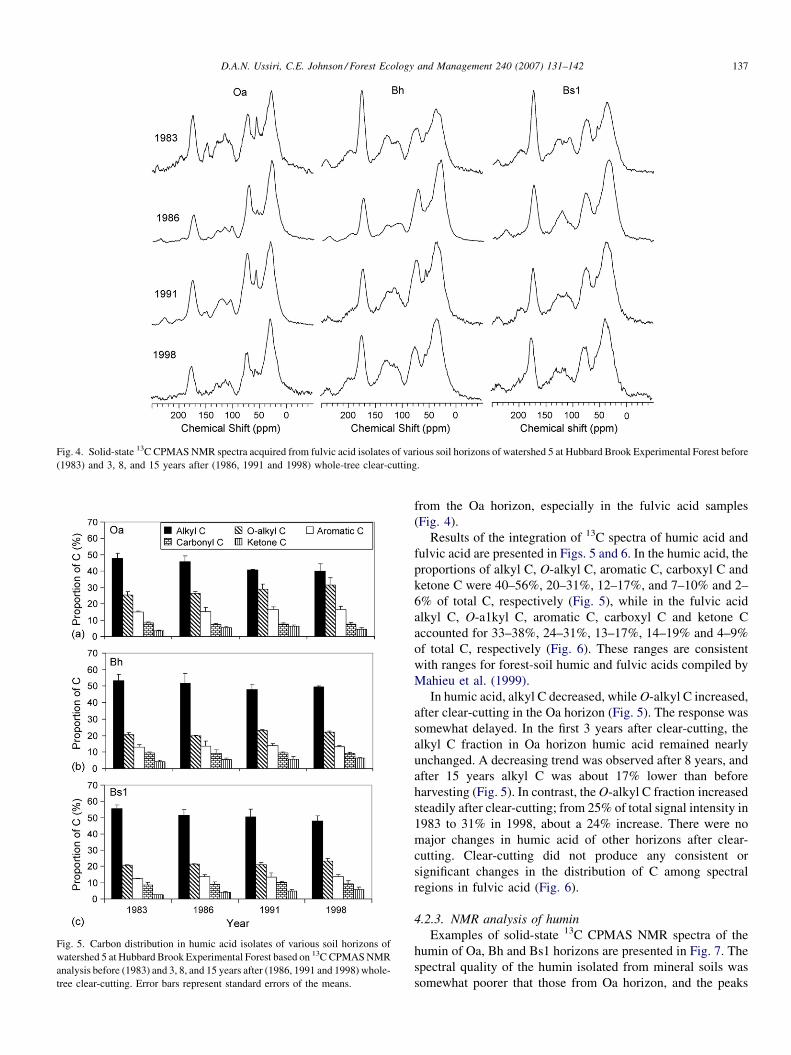
Fig. 5. Carbon distribution in humic acid isolates of various soil horizons of
watershed 5 at Hubbard Brook Experimental Forest based on 13C CPMAS NMR
analysis before (1983) and 3, 8, and 15 years after (1986, 1991 and 1998) whole-
tree clear-cutting. Error bars represent standard errors of the means.
Fig. 4. Solid-state 13C CPMAS NMR spectra acquired from fulvic acid isolates of various soil horizons of watershed 5 at Hubbard Brook Experimental Forest before
(1983) and 3, 8, and 15 years after (1986, 1991 and 1998) whole-tree clear-cutting.
D.A.N. Ussiri, C.E. Johnson / Forest Ecology and Management 240 (2007) 131–142 137
from the Oa horizon, especially in the fulvic acid samples
(Fig. 4).
Results of the integration of 13C spectra of humic acid and
fulvic acid are presented in Figs. 5 and 6. In the humic acid, the
proportions of alkyl C, O-alkyl C, aromatic C, carboxyl C and
ketone C were 40–56%, 20–31%, 12–17%, and 7–10% and 2–
6% of total C, respectively (Fig. 5), while in the fulvic acid
alkyl C, O-a1kyl C, aromatic C, carboxyl C and ketone C
accounted for 33–38%, 24–31%, 13–17%, 14–19% and 4–9%
of total C, respectively (Fig. 6). These ranges are consistent
with ranges for forest-soil humic and fulvic acids compiled by
Mahieu et al. (1999).
In humic acid, alkyl C decreased, while O-alkyl C increased,
after clear-cutting in the Oa horizon (Fig. 5). The response was
somewhat delayed. In the first 3 years after clear-cutting, the
alkyl C fraction in Oa horizon humic acid remained nearly
unchanged. A decreasing trend was observed after 8 years, and
after 15 years alkyl C was about 17% lower than before
harvesting (Fig. 5). In contrast, the O-alkyl C fraction increased
steadily after clear-cutting; from 25% of total signal intensity in
1983 to 31% in 1998, about a 24% increase. There were no
major changes in humic acid of other horizons after clear-
cutting. Clear-cutting did not produce any consistent or
significant changes in the distribution of C among spectral
regions in fulvic acid (Fig. 6).
4.2.3. NMR analysis of humin
Examples of solid-state 13C CPMAS NMR spectra of the
humin of Oa, Bh and Bs1 horizons are presented in Fig. 7. The
spectral quality of the humin isolated from mineral soils was
somewhat poorer that those from Oa horizon, and the peaks
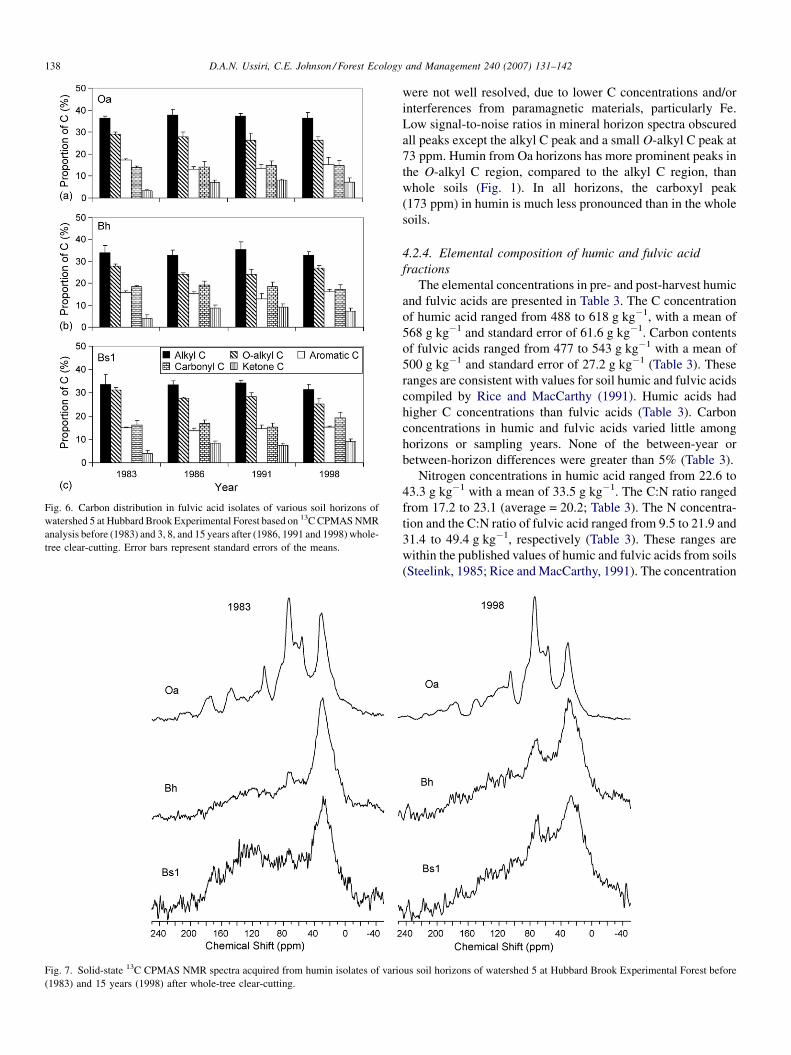
Fig. 6. Carbon distribution in fulvic acid isolates of various soil horizons of
watershed 5 at Hubbard Brook Experimental Forest based on 13C CPMAS NMR
analysis before (1983) and 3, 8, and 15 years after (1986, 1991 and 1998) whole-
tree clear-cutting. Error bars represent standard errors of the means.
Fig. 7. Solid-state 13C CPMAS NMR spectra acquired from humin isolates of vario
(1983) and 15 years (1998) after whole-tree clear-cutting.
D.A.N. Ussiri, C.E. Johnson / Forest Ecology and Management 240 (2007) 131–142138
were not well resolved, due to lower C concentrations and/or
interferences from paramagnetic materials, particularly Fe.
Low signal-to-noise ratios in mineral horizon spectra obscured
all peaks except the alkyl C peak and a small O-alkyl C peak at
73 ppm. Humin from Oa horizons has more prominent peaks in
the O-alkyl C region, compared to the alkyl C region, than
whole soils (Fig. 1). In all horizons, the carboxyl peak
(173 ppm) in humin is much less pronounced than in the whole
soils.
4.2.4. Elemental composition of humic and fulvic acid
fractions
The elemental concentrations in pre- and post-harvest humic
and fulvic acids are presented in Table 3. The C concentration
of humic acid ranged from 488 to 618 g kg�1, with a mean of
568 g kg�1 and standard error of 61.6 g kg�1. Carbon contents
of fulvic acids ranged from 477 to 543 g kg�1 with a mean of
500 g kg�1 and standard error of 27.2 g kg�1 (Table 3). These
ranges are consistent with values for soil humic and fulvic acids
compiled by Rice and MacCarthy (1991). Humic acids had
higher C concentrations than fulvic acids (Table 3). Carbon
concentrations in humic and fulvic acids varied little among
horizons or sampling years. None of the between-year or
between-horizon differences were greater than 5% (Table 3).
Nitrogen concentrations in humic acid ranged from 22.6 to
43.3 g kg�1 with a mean of 33.5 g kg�1. The C:N ratio ranged
from 17.2 to 23.1 (average = 20.2; Table 3). The N concentra-
tion and the C:N ratio of fulvic acid ranged from 9.5 to 21.9 and
31.4 to 49.4 g kg�1, respectively (Table 3). These ranges are
within the published values of humic and fulvic acids from soils
(Steelink, 1985; Rice and MacCarthy, 1991). The concentration
us soil horizons of watershed 5 at Hubbard Brook Experimental Forest before

Table 3
Elemental content and atomic ratios of purified, ash-free humic and fulvic acids isolated from soils of watershed 5 at the Hubbard Brook Experimental Forest, NH
Elements (g kg�1) Sampling year
1983 1998 1991 1986
Oa Bh Bs1 Oa Bh Bs1 O Bh Bs1 Oa Bh Bs1
Humic acid
C 579 577 574 567 571 565 567 562 564 560 563 565
N 29.9 36.9 35.8 34.0 36.9 35.9 33.6 38.3 38.2 32.9 35.0 35.2
H 47.0 51.5 49.2 53.8 52.5 50.0 50.2 55.8 56.0 51.6 53.1 52.4
H:C 0.97 1.06 1.02 1.13 1.10 1.06 1.05 1.08 1.18 1.10 1.12 1.10
C:N 23.0 18.9 19.0 19.6 18.1 18.6 19.8 17.2 17.5 20.0 19.0 18.7
Fulvic acid
C 503 512 513 481 491 492 487 491 489 479 493 489
N 16.1 14.4 12.6 16.0 18.4 12.4 14.9 18.5 13.8 15.7 14.9 11.6
H 44.0 35.7 34.6 39.1 37.3 32.9 42.4 35.6 34.7 41.1 36.7 32.1
H:C 1.03 0.83 0.80 0.97 0.91 0.79 1.04 0.86 0.84 1.02 0.90 0.78
C:N 38.0 41.9 48.3 35.2 31.6 48.3 38.2 31.0 43.0 35.7 38.0 49.4
Watershed 5 was clear-cut in the winter of 1983–1984.
D.A.N. Ussiri, C.E. Johnson / Forest Ecology and Management 240 (2007) 131–142 139
of N increased ( p < 0.05) in Oa horizon humic acid after clear-
cutting, but there were no significant changes in Bh and Bs1
humic acids. The C:N ratio of humic acid decreased after clear-
cutting (Table 3). Humic acid contained more N and had lower
C:N ratio than fulvic acid. The N concentration of fulvic acid
increased in the Bh horizon after clear-cutting (Table 3). This
was accompanied by a decrease in C:N ratio, indicating N
enrichment in Bh horizon fulvic acids after-clear-cutting.
The H concentration ranged from 19 to 69 g kg�1 in humic
acid, and 29–49 g kg�1 in fulvic acid. The H:C atomic ratio –
an indicator of aliphaticity – ranged from 0.37 to 1.36 for humic
acid and 0.71–1.17 for fulvic acid (Table 3). Generally, humic
acid contained more H and had higher H:C ratios than fulvic
acid (Table 3). Fulvic acids extracted from Oa horizons had
greater H concentrations and higher H:C ratios than mineral
soil fulvic acids in all sampling years, suggesting that fulvic
acid of the Oa horizon is generally more aliphatic than in
mineral horizons. Clear-cutting did not significantly affect H
concentrations in either humic or fulvic acid.
5. Discussion
Covington (1981) hypothesized that decreased litter inputs
and accelerated decomposition following clear-cutting of
northern hardwoods would result in decreases of up to 50%
in forest floor SOM content in the first 15 years after harvest,
followed by a slow increase back to pre-cut levels. His
observations were based on samples from a chronosequence of
stands, ranging in age from 3 to 70 years, in the White
Mountains of New Hampshire. Concerns over the large
magnitude of the reported C loss from clear-cutting disturbance
and its implication regarding nutrient cycling in forest
motivated a large number of studies (Federer, 1984; Snyder
and Harter, 1985; Mattson and Swank, 1989; Brais et al., 1995;
Yanai et al., 2000). Many of these studies failed to support
Covington’s hypothesis. Thus, there are no consistent results of
the effects of harvesting on carbon dynamics and long-term site
productivity (Yanai et al., 2003). A meta-analysis of the effects
of forest management on soil C showed that forest harvesting
had little or no effects on soil C and N (Johnson and Curtis,
2001).
Research at the HBEF has indicated that changes in both the
quantity and quality of the OM occur after clear-cutting. For
example, direct measurements using soil pit sampling revealed
a 27% decline in forest floor C pool 8 years after clear-cutting,
while isolated forest floor blocks incubated in W5 lost 20–30%
of mass in the first 7 years after clear-cutting (Johnson et al.,
1995). Even though new litter inputs were excluded from the
forest floor blocks, their rate of mass loss was still slower than
that predicted by Covington (1981). These declines were the
result of decreases in both C concentration and the mass of
forest floor. The decline in C pools and concentrations were
attributed to increased decomposition and physical disturbance
during logging, which caused mixing of the upper mineral
horizons into the forest floor (Ryan et al., 1992). While
disturbance-related mixing undoubtedly played a role in the
redistribution of soil C after harvesting, our results indicate that
decomposition processes resulted in changes in OM quality.
Clear-cutting may alter both quantity and quality of OM by
reducing litter input and increasing decomposition rates. Clear-
cutting at the HBEF caused significant 3- and 8-year declines in
N and C concentrations in the Oa horizon, respectively (Table 1,
Johnson et al., 1995). In the Bh, Bs1 and Bs2 horizons,
however, C and N concentrations increased between years 8 and
15 (Table 1). In addition, the humic acid concentration
decreased by 24, 28 and 25% in the Oa, E, and Bh horizons,
respectively, in the first 3 years after clear-cutting, and
remained significantly lower than the pre-harvest concentra-
tions 15 years after clear-cutting (Table 2). Fulvic acid
concentrations decreased by 47 and 41% in the Oa and E
horizons, respectively, in the first 3 years and remained
significantly lower than pre-harvest concentrations 15 years
after clear-cutting (Table 2). This could be the result of the
export of soluble humic substances from the forest floor and the
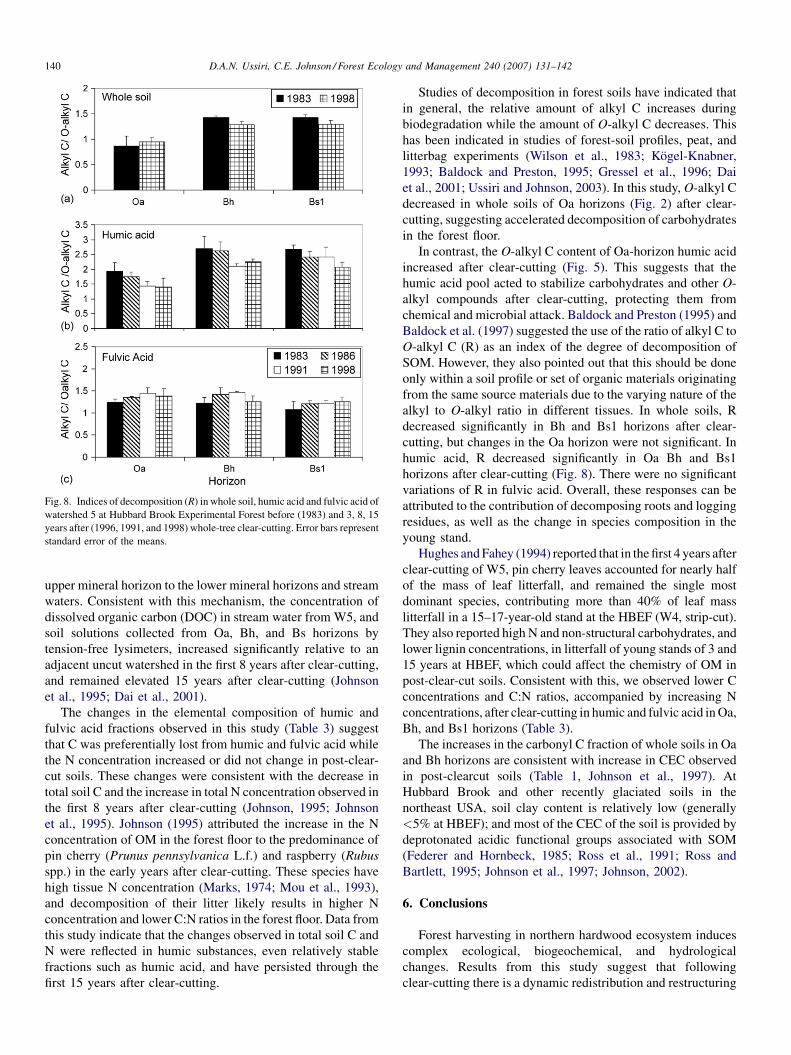
Fig. 8. Indices of decomposition (R) in whole soil, humic acid and fulvic acid of
watershed 5 at Hubbard Brook Experimental Forest before (1983) and 3, 8, 15
years after (1996, 1991, and 1998) whole-tree clear-cutting. Error bars represent
standard error of the means.
D.A.N. Ussiri, C.E. Johnson / Forest Ecology and Management 240 (2007) 131–142140
upper mineral horizon to the lower mineral horizons and stream
waters. Consistent with this mechanism, the concentration of
dissolved organic carbon (DOC) in stream water from W5, and
soil solutions collected from Oa, Bh, and Bs horizons by
tension-free lysimeters, increased significantly relative to an
adjacent uncut watershed in the first 8 years after clear-cutting,
and remained elevated 15 years after clear-cutting (Johnson
et al., 1995; Dai et al., 2001).
The changes in the elemental composition of humic and
fulvic acid fractions observed in this study (Table 3) suggest
that C was preferentially lost from humic and fulvic acid while
the N concentration increased or did not change in post-clear-
cut soils. These changes were consistent with the decrease in
total soil C and the increase in total N concentration observed in
the first 8 years after clear-cutting (Johnson, 1995; Johnson
et al., 1995). Johnson (1995) attributed the increase in the N
concentration of OM in the forest floor to the predominance of
pin cherry (Prunus pennsylvanica L.f.) and raspberry (Rubus
spp.) in the early years after clear-cutting. These species have
high tissue N concentration (Marks, 1974; Mou et al., 1993),
and decomposition of their litter likely results in higher N
concentration and lower C:N ratios in the forest floor. Data from
this study indicate that the changes observed in total soil C and
N were reflected in humic substances, even relatively stable
fractions such as humic acid, and have persisted through the
first 15 years after clear-cutting.
Studies of decomposition in forest soils have indicated that
in general, the relative amount of alkyl C increases during
biodegradation while the amount of O-alkyl C decreases. This
has been indicated in studies of forest-soil profiles, peat, and
litterbag experiments (Wilson et al., 1983; Kogel-Knabner,
1993; Baldock and Preston, 1995; Gressel et al., 1996; Dai
et al., 2001; Ussiri and Johnson, 2003). In this study, O-alkyl C
decreased in whole soils of Oa horizons (Fig. 2) after clear-
cutting, suggesting accelerated decomposition of carbohydrates
in the forest floor.
In contrast, the O-alkyl C content of Oa-horizon humic acid
increased after clear-cutting (Fig. 5). This suggests that the
humic acid pool acted to stabilize carbohydrates and other O-
alkyl compounds after clear-cutting, protecting them from
chemical and microbial attack. Baldock and Preston (1995) and
Baldock et al. (1997) suggested the use of the ratio of alkyl C to
O-alkyl C (R) as an index of the degree of decomposition of
SOM. However, they also pointed out that this should be done
only within a soil profile or set of organic materials originating
from the same source materials due to the varying nature of the
alkyl to O-alkyl ratio in different tissues. In whole soils, R
decreased significantly in Bh and Bs1 horizons after clear-
cutting, but changes in the Oa horizon were not significant. In
humic acid, R decreased significantly in Oa Bh and Bs1
horizons after clear-cutting (Fig. 8). There were no significant
variations of R in fulvic acid. Overall, these responses can be
attributed to the contribution of decomposing roots and logging
residues, as well as the change in species composition in the
young stand.
Hughes and Fahey (1994) reported that in the first 4 years after
clear-cutting of W5, pin cherry leaves accounted for nearly half
of the mass of leaf litterfall, and remained the single most
dominant species, contributing more than 40% of leaf mass
litterfall in a 15–17-year-old stand at the HBEF (W4, strip-cut).
They also reported high N and non-structural carbohydrates, and
lower lignin concentrations, in litterfall of young stands of 3 and
15 years at HBEF, which could affect the chemistry of OM in
post-clear-cut soils. Consistent with this, we observed lower C
concentrations and C:N ratios, accompanied by increasing N
concentrations, after clear-cutting in humic and fulvic acid in Oa,
Bh, and Bs1 horizons (Table 3).
The increases in the carbonyl C fraction of whole soils in Oa
and Bh horizons are consistent with increase in CEC observed
in post-clearcut soils (Table 1, Johnson et al., 1997). At
Hubbard Brook and other recently glaciated soils in the
northeast USA, soil clay content is relatively low (generally
<5% at HBEF); and most of the CEC of the soil is provided by
deprotonated acidic functional groups associated with SOM
(Federer and Hornbeck, 1985; Ross et al., 1991; Ross and
Bartlett, 1995; Johnson et al., 1997; Johnson, 2002).
6. Conclusions
Forest harvesting in northern hardwood ecosystem induces
complex ecological, biogeochemical, and hydrological
changes. Results from this study suggest that following
clear-cutting there is a dynamic redistribution and restructuring
D.A.N. Ussiri, C.E. Johnson / Forest Ecology and Management 240 (2007) 131–142 141
of SOM pools and fractions in these soils. In addition,
accelerated decomposition in the forest floor resulted in the
preferential decomposition of O-alkyl C compounds and the
loss of humic substances from the soil, probably through
increased leaching as DOC and increased respiration losses.
Changes in the composition of the humic acid fraction after
harvesting indicate that humic acid plays an important role in
the response of soils to clear-cutting disturbance. The
magnitude of changes in the structure and composition of
SOM after clear-cutting were relatively small. The absence of
large changes may be attributed to large C pool sizes and longer
turnover times of SOM. More labile fractions such as humic
and fulvic acids, and more dynamic pools of OM such as soil
solution and stream water DOC may be more sensitive
indicators of disturbance effects in the short and medium terms.
Acknowledgements
This work was supported by grants from USDA-National
Research Initiative Competitive Grants Program and National
Science Foundation-Long Term Ecological Research (NSF-
LTER) Program. We thank David Kiemle of the State
University of New York, College of Environmental Science
and Forestry for help with NMR acquisitions. This is a
contribution to the Hubbard Brook Ecosystem Study. Hubbard
Brook Experimental Forest is operated and maintained by
USDA Forest Service, Northeastern Forest Experiment Station,
US Department of Agriculture, Radnor, Pennsylvania, USA.
References
Baldock, J.A., Oades, J.M., Nelson, P.N., Skene, T.M., Golchin, A., Clarke, P.,
1997. Assessing the extent of decomposition of natural organic materials
using solid state 13C NMR spectroscopy. Aust. J. Soil Res. 35, 1061–1083.
Baldock, J.A., Oades, J.M., Waters, A.G., Peng, X., Vassallo, A.M., Wilson,
M.A., 1992. Aspects of chemical structure of soil organic materials as
revealed by solid-state 13C NMR spectroscopy. Biogeochemistry 16, 1–42.
Baldock, J.A., Preston, C.M., 1995. Chemistry of carbon decomposition
processes in forests as revealed by solid-state carbon-13 nuclear magnetic
resonance. In: McFee, W.W., Kelly, J.M. (Eds.), Carbon Forms and Func-
tions in Forest Soils. SSSA, Madison, WI, pp. 89–117.
Bormann, F.H., Likens, G.E., Siccama, T.G., Pierce, R.S., Eaton, J.S., 1974. The
export of nutrients and recovery of stable conditions following deforestation
at Hubbard Brook. Ecol. Monogr. 44, 255–277.
Boyle, J.R., Philips, J.J., Ek, A.R., 1973. Whole-tree harvesting: nutrients
budget evaluations. J. For. 71, 760–762.
Brais, S.C., Camire, C., Pare, D., 1995. Impacts of whole-tree harvesting and
winter windrowing on soil-pH and base status of clayey sites of north-
western Quebec. Can. J. For. Res. 25, 997–1007.
Cheshire, M.V., Russell, J.D., Fraser, A.R., Bracewell, J.M., Robertson, G.W.,
Benzing-Purdie, L.M., Ratcliffe, C.I., Ripmeester, J.A., Goodman, B.A.,
1992. Nature of soil carbohydrate and its association with soil humic
substances. J. Soil Sci. 43, 359–373.
Clayton, J.L., Kennedy, D.A., 1985. Nutrient losses from timber harvest in
Idaho Batholith. Soil Sci. Soc. Am. J. 49, 1041–1049.
Conte, P., Piccolo, A., van Lagen, B., Buurman, P., de Jager, P.A., 1997.
Quantitative aspects of solid-state 13C-NMR spectra of humic substances
from soils of volcanic systems. Geoderma 80, 327–338.
Covington, W.W., 1981. Changes in forest floor organic matter and nutrient
content following clear-cutting in northern hardwood. Ecology 65, 41–48.
Dahlgren, R.A., Driscoll, C.T., 1994. The effects of whole tree clear cutting on
soil processes at Hubbard Brook Experimental Forest, New Hampshire,
USA. Plant Soil 158, 239–262.
Dai, K.H., Johnson, C.E., 1999. Applicability of solid-state 13C CP/MAS NMR
analysis to Spodosols: chemical removal of magnetic materials. Geoderma
93, 289–310.
Dai, K.H., Johnson, C.E., Driscoll, C.T., 2001. Organic matter chemistry and
dynamics in clear-cut and unmanaged hardwood forest ecosystems. Bio-
geochemistry 54, 51–83.
Federer, C.A., 1984. Organic matter and nitrogen content of the forest floor in
even-aged northern hardwoods. Can. J. For. Res. 14, 763–767.
Federer, C.A., Flynn, L.D., Martin, C.W., Hornbeck, J.W., Pierce, R.S., 1990.
Thirty years of hydrometeorologic data at the Hubbard Brook Experimental
Forest, New Hampshire. 17 USDA Forest Services General Technical
Report, NE-141, Washington, DC.
Federer, C.A., Hornbeck, J.W., 1985. The buffer capacity of forest soils in New
England. Water Air Soil Poll. 26, 163–173.
Frund, R., Ludemann, H.D., 1989. The quantitative analysis of solution and
CPMAS-13-C NMR spectra of humic material. Sci. Tot. Environ. 81/82,
157–168.
Gressel, N., McColl, J.G., Preston, C.M., Newman, R.H., Powers, R.F., 1996.
Linkages between phosphorus transformations and carbon decomposition in
a forest soil. Biogeochemistry 33, 97–123.
Hendricksen, O.Q., Chatarpaul, L., Burgess, D., 1989. Nutrient cycling follow-
ing whole tree and conventional harvesting of northern mixed forest. Can. J.
For. Res. 19, 725–735.
Hughes, J.W., Fahey, T.J., 1994. Litterfall dynamics and ecosystem recovery
during forest development. For. Ecol. Manage. 63, 181–198.
Huntington, T.G., Ryan, D.F., 1990. Whole-tree-harvesting effects on soil
nitrogen and carbon. For. Ecol. Manage. 31, 193–204.
Huntington, T.G., Ryan, D.F., Hamburg, S.P., 1988. Estimating soil nitrogen and
carbon pools in a northern hardwood forest ecosystem. Soil Sci. Soc. Am. J.
52, 1162–1167.
Jobbagy, E.G., Jackson, R.B., 2000. The vertical distribution of soil organic
carbon and its relation to climate and vegetation. Ecol. Appl. 10,
423–436.
Johnson, C.E., 1995. Soil nitrogen status 8 years after whole-tree clear-cutting.
Can. J. For. Res. 25, 1346–1355.
Johnson, C.E., 2002. Cation exchange properties of acid soils of the north-
eastern USA. Eur. J. Soil Sci. 53, 271–282.
Johnson, C.E., Driscoll, C.T., Fahey, T.J., Siccama, T.G., Hughes, J.W., 1995.
Carbon dynamics following clear cutting of a northern hardwood forest. In:
Kelly, J.M., McFee, W.W. (Eds.), Carbon Forms and Functions in Forest
Soils. SSSA, Madison, WI, pp. 463–488.
Johnson, C.E., Johnson, A.H., Huntington, T.G., Siccama, T.G., 1991a. Whole-
tree clear-cutting effects on soil horizons and organic matter pools. Soil Sci.
Soc. Am. J. 55, 497–502.
Johnson, C.E., Johnson, A.H., Siccama, T.G., 1991b. Whole-tree clear-cutting
effects on exchangeable cations and soil acidity. Soil Sci. Soc. Am. J. 55,
505–507.
Johnson, C.E., Romanowicz, R.B., Siccama, T.G., 1997. Conservation of
exchangeable cations after clear-cutting of a northern hardwood forest.
Can. J. For. Res. 27, 859–868.
Johnson, D.W., Curtis, P.S., 2001. Effects of forest management on soil C and N
storage: a meta analysis. For. Ecol. Manage. 140, 227–238.
Kinchesh, P., Powlson, D.S., Randall, E.W., 1995a. 13C NMR studies of organic
matter in whole soils. I. Quantitation possibilities. Eur. J. Soil Sci. 46, 125–
138.
Kinchesh, P., Powlson, D.S., Randall, E.W., 1995b. 13C NMR studies of organic
matter in whole soils. II. A case study of some Rothamsted soils. Eur. J. Soil
Sci. 46, 139–146.
Kogel-Knabner, 2000. Analytical approaches for characterizing soil organic
matter. Org. Geochem. 31, 609–625.
Kogel-Knabner, I., 1992. Forest Soil Organic Matter. Structure and Formation.
Bayreuther Bodenkundliche Berichte. University of Bayreuth, Germany.
Kogel-Knabner, I., 1993. Biodegradation and humification processes in forest
soils. In: Bollag, J.M., Stotsky, G. (Eds.), Soil Biochemistry. Marcel Dekker,
New York, pp. 101–135.

D.A.N. Ussiri, C.E. Johnson / Forest Ecology and Management 240 (2007) 131–142142
Kogel-Knabner, I., 1997. 13C and 15N NMR spectroscopy as a tool in soil
organic matter studies. Geoderma 80, 243–270.
Kogel, I., Hempfling, R., Zech, W., Hatcher, P.G., Schulten, H.-R., 1988.
Chemical composition of the organic matter in forest soils. 1. Forest litter.
Soil Sci. 146, 124–136.
Likens, G.E., Bormann, F.H., 1995. Biogeochemistry of a Forested Ecosystem.
Springer-Verlag, New York.
Likens, G.E., Bormann, F.H., Johnson, N.M., Fisher, D.W., Pierce, R.S., 1970.
Effects of forest cutting and herbicide treatment on nutrient budgets in the
Hubbard Brook-watershed-ecosystem. Ecol. Monogr. 40, 23–47.
Mahieu, N., Powlson, D.S., Randall, E.W., 1999. Statistical analysis of pub-
lished carbon-13 CPMAS NMR spectra of soil organic matter. Soil Sci. Soc.
Am. J. 63, 307–319.
Mann, L.K., Johnson, D.W., West, D.C., Cole, D.W., Hornbeck, J.W., Martin,
C.W., Riekirk, H., Smith, C.T., Swank, W.T., Tritton, L.M., van Lear, D.H.,
1988. Effects of whole-tree and stem-only clear cutting on post harvest
hydrologic losses nutrient capital and regrowth. For. Sci. 34, 412–428.
Mao, J.-D., Hu, W.-G., Schmidt-Rohr, K., Davies, G., Ghabbour, E.A., Xing, B.,
2000. Quantitative characterization of humic substances by solid-state
carbon-13 nuclear magnetic resonance. Soil Sci. Soc. Am. J. 64, 873–884.
Marks, P.L., 1974. The role of pin cherry (Prunus pensylvanica L.) in main-
tenance of stability in northern hardwood ecosystems. Ecol. Monogr. 44,
73–88.
Mathers, N.J., Mao, X.A., Xu, Z.H., Saffigna, P.G., Berners-Price, S.J., Perera,
M.C.S., 2000. Recent advances in application of 13C and 15N NMR
spectroscopy. Aust. J. Soil Res. 38, 769–787.
Mattson, K.G., Swank, W.T., 1989. Soil and detrital carbon dynamics following
forest cutting in the southern Appalachians. Biol. Fert. Soils 7, 247–253.
Moore, T.R., 1989. Dynamics of dissolved organic carbon in forested and
disturbed catchments, Westland, New Zealand. Water Resour. Res. 25,
1321–1330.
Mou, P., Fahey, T., Hughes, J.W., 1993. Effects of soil disturbance on vegetation
recovery and nutrient accumulation following whole tree harvest of a
northern hardwood ecosystem Hubbard Brook Experimental Forest. J.
Appl. Ecol. 30, 661–675.
Preston, C.M., 1996. Applications of NMR to soil organic matter analysis:
history and prospects. Soil Sci. 161, 144–166.
Preston, C.M., 2001. Carbon-13 solid-state NMR of soil organic matter-using
the technique effectively. Can. J. Soil Sci. 81, 255–270.
Preston, C.M., Hempfling, R., Schulten, H.-R., Schnitzer, M., Trofymow, J.A.,
Axelson, D.E., 1994. Characterization of organic matter in a forest soil of
coastal British Columbia by 13C NMR and pyrolysis field ionization mass
spectrometry. Plant Soil 158, 69–82.
Rice, J.A., MacCarthy, P., 1991. Statistical evaluation of the elemental com-
position of humic substances. Org. Geochem. 17, 635–648.
Ross, D.S., Bartlett, R.J., 1995. Apparent pH independence of charge in forest
organic surface soil horizons. Water Air Soil Poll. 85, 1113–1118.
Ross, D.S., Bartlett, R.J., Magdoff, F.R., 1991. Exchangeable cations and pH-
independent distribution of cation exchange capacities in Spodosols of
forested watershed. In: Wright, R.J. (Ed.), Plant–Soil Interaction at low Ph.
Kluwer, Dordrecht, pp. 81–92.
Ryan, D.F., Huntington, T.G., Martin, C.W., 1992. Redistribution of soil
nitrogen, carbon and organic matter by mechanical disturbance during
whole-tree harvesting in northern hardwoods. For. Ecol. Manage. 49,
87–99.
Schlesinger, W.H., 1997. Biogeochemistry: An Analysis of Global Change.
Academic Press, San Diego.
Smernik, R.J., 2005. Solid-state 13C NMR spectroscopic studies of soil organic
matter at two magnetic field strengths. Geoderma 125, 249–271.
Smernik, R.J., Oades, J.M., 2000. The use of spin counting for determining
quantitation in solid state 13C NMR spectra of natural organic matter. 1.
Model systems and the effects of paramagnetic impurities. Geoderma 96,
101–129.
Snyder, K.E., Harter, R.D., 1985. Changes in solum chemistry following clear-
cutting of northern hardwood stands. Soil Sci. Soc. Am. J. 49, 223–228.
Steelink, C., 1985. Implications of elemental characteristics of humic sub-
stances. In: Aiken, G.R., Mcknight, D.M., Wershaw, R.L., MacCarthy, P.
(Eds.), Humic Substances in Soil, Sediment and Water: Geochemistry,
Isolation and Characterization. John Wiley & Sons, New York, pp. 457–
476.
Stevenson, F.J., 1994. Humus Chemistry: Genesis, Composition, Reactions.
John Wiley & Sons, New York.
Ussiri, D.A.N., Johnson, C.E., 2003. Characteristics of organic matter in a
northern hardwood forest soil by 13C NMR spectroscopy and chemical
methods. Geoderma 111, 123–149.
Whittaker, R.H., Bormann, F.H., Likens, G.E., Siccama, T.G., 1974. The
Hubbard Brook ecosystem study: forest biomass and production. Ecol.
Monogr. 44, 233–254.
Wilson, M.A., 1987. NMR Techniques and Application in Geochemistry and
Soil Chemistry. Pergamon Press, Oxford.
Wilson, M.A., Heng, S., Goh, K.H., Pugmire, R.J., Grant, D.M., 1983. Studies
of litter and acid-insoluble soil organic matter fractions using 13C-cross-
polarization nuclear magnetic resonance spectroscopy with magic angle
spinning. J. Soil Sci. 34, 83–97.
Yanai, R.D., Arthur, M.A., Siccama, T.G., Federer, C.A., 2000. Challenges of
measuring forest floor organic matter dynamics: repeated measures from
chronosequence. For. Ecol. Manage. 138, 273–283.
Yanai, R.D., Currie, W.S., Goodale, C.L., 2003. Soil carbon dynamics after
forest harvest: an ecosystem paradigm reconsidered. Ecosystems 6,
197–212.