Organic Matter and Water Stability of Field Aggregates Affected by Tillage in South Dakota
10
SSSAJ: Volume 73: Number 1 • January–February 2009 197 Soil Sci. Soc. Am. J. 73:197-206 doi:10.2136/sssaj2007.0184 Received 18 May 2007. *Corresponding author ([email protected]). © Soil Science Society of America 677 S. Segoe Rd. Madison WI 53711 USA All rights reserved. No part of this periodical may be reproduced or transmitted in any form or by any means, electronic or mechanical, including photocopying, recording, or any information storage and retrieval system, without permission in writing from the publisher. Permission for printing and for reprinting the material contained herein has been obtained by the publisher. T he quantity and quality of SOM provides an important link between management and soil function. It is generally ac- cepted that conversion to crop production practices has caused a decline in SOM compared with the original grassland lev- els throughout the Great Plains (Campbell and Souster, 1982; Monreal and Janzen, 1993; Allmaras et al., 2000). Tillage has caused soil C losses from 28 to 77% depending on geographic location (climate) and soil type (Paustian et al., 1997). Changes in agricultural management from CT to NT and enhancement of rotation complexity have increased the accumulation of SOC (West and Post, 2002). Conservation of SOM is essential to sustaining crop productivity (Doran et al., 1998) and maintaining the soil resource because SOM is strongly linked to soil fertility and desirable soil tilth (Carter, 2002). Boyle et al. (1989), in a re- view of the influence of SOM on soil aggregation and water infiltration, concluded that SOM had a disproportionate effect Joseph L. Pikul Jr.* USDA-ARS North Central Agricultural Research Lab. 2923 Medary Ave. Brookings, SD 57006 Gabriela Chilom James Rice Dep. of Chemistry and Biochemistry South Dakota State Univ. Brookings, SD 57007 Anna Eynard Thomas E. Schumacher Dep. of Plant Science South Dakota State Univ. Brookings, SD 57007 Kristine Nichols USDA-ARS Northern Great Plains Research Lab. 1701 10th Ave. SW Mandan, ND 58554 Jane M. F. Johnson USDA-ARS North Central Soil Conservation Research Lab. 803 Iowa Ave. Morris, MN 56267 Sara Wright (retired) USDA-ARS Sustainable Agricultural Systems Lab. Building 001 10300 Baltimore Ave. Beltsville, MD 20705 TheCan Caesar USDA-ARS Northern Plains Agricultural Research Lab. 1500 North Central Ave. Sidney, MT 59270 Michael Ellsbury (retired) USDA-ARS North Central Agricultural Research Lab. 2923 Medary Ave. Brookings, SD 57006 SOIL & WATER MANAGEMENT & CONSERVATION Organic Matter and Water Stability of Field Aggregates Affected by Tillage in South Dakota Tillage has been associated with soil organic matter (SOM) decline. A case study of two adjacent farms was conducted in eastern South Dakota. One farm used no-till (NT) and the other used chisel tillage (CT). We hypothesized that soil under NT, compared with tillage, would have both greater quantity and greater quality of SOM and that this improved SOM condition would result in increased water stable aggregation (WSA). A rotary sieve was used to sort dry field aggregates into six size groups: <0.4, 0.4 to 0.8, 0.8 to 2.0, 2.0 to 6.0, 6.0 to 19.0, and >19 mm. Water stable aggregation, soil organic C (SOC), N, glomalin, and basidiomycete fungi were measured. Fine particulate soil organic matter (fPOM, 0.5– 0.053 mm) and coarse particulate organic matter (2.0–0.5 mm) were isolated by sieving. Quantitative solid-state 13 C nuclear magnetic resonance was used to determine C type in humic acid, humin, and whole soil. The fPOM/SOM ratio was greatest in <0.4-mm aggregates and 24% greater in NT than CT. Soil organic C was greatest in 0.8- to 2.0-mm aggregates and 11% greater in NT than CT. Average WSA was 63% greater under NT than under CT. Aggregate wettability was less under NT than CT. Slower water uptake under NT might be attributed to a greater abundance of wax-type C under NT than under CT. We conclude that NT, compared with CT, resulted in better SOM quality during the course of 10 yr. Improved SOM quality was related to improved WSA. Abbreviations: AM, arbuscular mycorrhizal; cPOM, coarse particulate organic matter; CT, chisel tillage; DPMAS, direct-polarization magic-angle spinning; EC, electrical conductivity; fPOM, fine particulate organic matter; HA, humic acid; IRTG, immunoreactive total glomalin; NMR, nuclear magnetic resonance; NT, no-till; POM, particulate organic matter; SOC, soil organic carbon; SOM, soil organic matter; TPOM, total particulate organic matter; WSA, water stable aggregation. Mention of trade names or commercial products in this manuscript is solely for the purpose of providing specific information, and does not imply recommendation or endorsement by USDA.
Transcript of Organic Matter and Water Stability of Field Aggregates Affected by Tillage in South Dakota
SSSAJ: Volume 73: Number 1 • January–February 2009 197
Soil Sci. Soc. Am. J. 73:197-206doi:10.2136/sssaj2007.0184Received 18 May 2007.*Corresponding author ([email protected]).© Soil Science Society of America677 S. Segoe Rd. Madison WI 53711 USAAll rights reserved. No part of this periodical may be reproduced or transmitted in any form or by any means, electronic or mechanical, including photocopying, recording, or any information storage and retrieval system, without permission in writing from the publisher. Permission for printing and for reprinting the material contained herein has been obtained by the publisher.
The quantity and quality of SOM provides an important link between management and soil function. It is generally ac-
cepted that conversion to crop production practices has caused a decline in SOM compared with the original grassland lev-els throughout the Great Plains (Campbell and Souster, 1982; Monreal and Janzen, 1993; Allmaras et al., 2000). Tillage has caused soil C losses from 28 to 77% depending on geographic location (climate) and soil type (Paustian et al., 1997). Changes in agricultural management from CT to NT and enhancement of rotation complexity have increased the accumulation of SOC (West and Post, 2002).
Conservation of SOM is essential to sustaining crop productivity (Doran et al., 1998) and maintaining the soil resource because SOM is strongly linked to soil fertility and desirable soil tilth (Carter, 2002). Boyle et al. (1989), in a re-view of the infl uence of SOM on soil aggregation and water infi ltration, concluded that SOM had a disproportionate effect
Joseph L. Pikul Jr.*USDA-ARSNorth Central Agricultural Research Lab.2923 Medary Ave.Brookings, SD 57006
Gabriela ChilomJames RiceDep. of Chemistry and BiochemistrySouth Dakota State Univ.Brookings, SD 57007
Anna EynardThomas E. SchumacherDep. of Plant ScienceSouth Dakota State Univ.Brookings, SD 57007
Kristine Nichols USDA-ARSNorthern Great Plains Research Lab.1701 10th Ave. SWMandan, ND 58554
Jane M. F. Johnson USDA-ARSNorth Central Soil Conservation Research Lab.803 Iowa Ave.Morris, MN 56267
Sara Wright (retired)USDA-ARSSustainable Agricultural Systems Lab.Building 00110300 Baltimore Ave.Beltsville, MD 20705
TheCan CaesarUSDA-ARSNorthern Plains Agricultural Research Lab.1500 North Central Ave.Sidney, MT 59270
Michael Ellsbury (retired)USDA-ARSNorth Central Agricultural Research Lab.2923 Medary Ave.Brookings, SD 57006
SOIL &
WA
TER M
AN
AG
EMEN
T & C
ON
SERV
ATIO
N
Organic Matter and Water Stability of Field Aggregates Affected by Tillage in South Dakota
Tillage has been associated with soil organic matter (SOM) decline. A case study of two adjacent farms was conducted in eastern South Dakota. One farm used no-till (NT) and the other used chisel tillage (CT). We hypothesized that soil under NT, compared with tillage, would have both greater quantity and greater quality of SOM and that this improved SOM condition would result in increased water stable aggregation (WSA). A rotary sieve was used to sort dry fi eld aggregates into six size groups: <0.4, 0.4 to 0.8, 0.8 to 2.0, 2.0 to 6.0, 6.0 to 19.0, and >19 mm. Water stable aggregation, soil organic C (SOC), N, glomalin, and basidiomycete fungi were measured. Fine particulate soil organic matter (fPOM, 0.5–0.053 mm) and coarse particulate organic matter (2.0–0.5 mm) were isolated by sieving. Quantitative solid-state 13C nuclear magnetic resonance was used to determine C type in humic acid, humin, and whole soil. The fPOM/SOM ratio was greatest in <0.4-mm aggregates and 24% greater in NT than CT. Soil organic C was greatest in 0.8- to 2.0-mm aggregates and 11% greater in NT than CT. Average WSA was 63% greater under NT than under CT. Aggregate wettability was less under NT than CT. Slower water uptake under NT might be attributed to a greater abundance of wax-type C under NT than under CT. We conclude that NT, compared with CT, resulted in better SOM quality during the course of 10 yr. Improved SOM quality was related to improved WSA.
Abbreviations: AM, arbuscular mycorrhizal; cPOM, coarse particulate organic matter; CT, chisel tillage; DPMAS, direct-polarization magic-angle spinning; EC, electrical conductivity; fPOM, fi ne particulate organic matter; HA, humic acid; IRTG, immunoreactive total glomalin; NMR, nuclear magnetic resonance; NT, no-till; POM, particulate organic matter; SOC, soil organic carbon; SOM, soil organic matter; TPOM, total particulate organic matter; WSA, water stable aggregation.
Mention of trade names or commercial products in this manuscript is solely for the purpose of providing specifi c information, and does not imply recommendation or endorsement by USDA.
198 SSSAJ: Volume 73: Number 1 • January–February 2009
on soil physical behavior. Water stability of soil aggregates has been shown to be dependent on the quantity and quality of or-ganic materials (Tisdall and Oades, 1982). Bruce et al. (1992) determined that increased phytomass input to a loamy sand increased aggregate stability and water infi ltration. On long-term tillage, residue management, and N-fertility plots, Pikul and Zuzel (1994) found that an increase in SOM increased the porosity of surface crusts in a silt loam soil.
The effect of management on soil aggregation is not al-ways clearly defi ned, nor is the time necessary to effect change readily understood. Degens (1997) provided a review of the function of labile organic bonding and binding agents related to soil aggregation. Degens (1997) suggested that conclusions on soil stabilization resulting from controlled incubation stud-ies contribute little to understanding biological processes under fi eld conditions.
Fungi play an important role in the formation and stabi-lization of soil aggregates through the adhesive effects of meta-bolic products and entanglement of soil particles. Exudates from basidiomycete fungi are important in soil aggregation, but short lived as binding agents (Caesar-TonThat and Cochran, 2000). Arbuscular mycorrhizal (AM) fungi produce an exudate called glomalin, which is a stable, Fe-containing glycoprotein (Wright and Upadhyaya, 1996) thought to be important in soil aggregation (Wright et al., 1999). Recently, Gadkar and Rillig (2006), cloned the gene for glomalin production from AM fungal hyphae and provided the fi rst evidence for the identity of the glomalin protein in the AM fungi Glomus. In a recent re-view, Treseder and Turner (2007) concluded that soil glomalin stocks were positively correlated with net primary productivity but not with AM fungi abundance. Glomalin concentrations in soil were often greater, however, in the presence of AM host plants that maintained relatively high AM fungi colonization rates.
New microaggregates are thought to form around decom-posing pieces of root-derived particulate organic matter (POM) inside macroaggregates (Gale et al., 2000a). Particulate organic matter is physically defi ned as the organic material isolated in the fraction 0.053 to 2.00 mm. It is an intermediate between fresh plant litter and humifi ed SOM, and has been shown to be more sensitive to changes in management than total SOM (Cambardella et al., 2001). In undisturbed soils, POM is derived primarily from roots (Gale et al., 2000a,b). Six et al. (2000) proposed an aggregate “life cycle,” suggesting that fi ne intraaggregate POM is formed as it becomes encrusted with clay particles and microbial products within macroaggregates. As macroaggregates degrade, stable microaggregates become the nuclei for the formation of new macroaggregates. Nichols and Wright (2006) showed that POM contained signifi cant amounts of glomalin.
Humifi cation of SOM under different agricultural systems results in unique chemical constituents of humic materials that may improve soil aggregate stability. Ding et al. (2002) showed that the composition of humic acid (HA) under conventional tillage was less aliphatic (alkyl C) and more aromatic than HA developed under conservation tillage. Investigations of SOM decomposition using quantitative solid-state 13C nuclear mag-netic resonance (NMR) have shown that aliphatic structures are more recalcitrant and increase in abundance relative to other fractions as decomposition proceeds (Ussiri and Johnson,
2003). The increase in the proportion of aliphatic materials may be the result of utilization of easily decomposed carbo-hydrates (O-alkyl C) by microorganisms. Ussiri and Johnson (2003) suggested using the ratio of alkyl C to O-alkyl C (R) as an index to the degree of decomposition. Gregorich et al. (2001) found that the composition of crop residue returned to the soil had little effect on the chemical composition of SOM as determined by 13C NMR. Stearman et al. (1989) found that on a Loring silt loam (a fi ne-silty, mixed, active, thermic Oxyaquic Fragiudalf), HA under no-till (treatments having greater amounts of C) had greater aliphatic to aromatic ratios and suggested that this characteristic might be due to earlier stages of decomposition.
Water stable soil aggregation has been related to differenc-es in aggregate wettability, and soil wettability is related to the chemical constituents of the SOM. Chenu et al. (2000) found that SOM associated with clay minerals increased hydropho-bicity, resulting in resistance of aggregates to slaking. Shepherd et al. (2001) concluded that greater aggregate stability of soil under pasture was due to the presence of a protective water-repellent lattice of long-chain polymethylene compounds around soil aggregates. Cultivation of prairie soils of central South Dakota has resulted in a decline in wettability compared with never-tilled grassland (Eynard et al., 2004a).
There is a scarcity of studies dealing with the properties of naturally formed fi eld aggregates, their distribution, and their breakdown. Frequently, work on soil aggregate stability starts with aggregates well under 2 mm in size, and many investiga-tors use wet-sieving techniques (Kemper and Rosenau, 1986) as a means to isolate small aggregate units (Franzluebbers et al., 2000; Shaver et al., 2002; Mikha and Rice, 2004; Olchin et al., 2008). Thus, only aggregates that are stable in water are examined further, which leads to the question of whether mea-sured aggregate properties are largely an artifact of the chosen method of separation. The method of fractionation has been shown to infl uence physical, chemical, and biological prop-erties of different sized soil aggregates (Ashman et al., 2003; Sainju, 2006). We believe that it is important to test natural fi eld aggregates because they serve is an indicator of the ca-pability of surface soil to resist breakdown and sealing (Ben-Hur and Lado, 2008). We hypothesized that soil under no-till, compared with tillage, would have both greater quantity and better quality of SOM and that this improved SOM condi-tion would result in increased WSA. Our objectives were to measure the WSA of naturally formed soil aggregates from two tillage systems and elucidate the relationships between selected properties of the SOM and WSA.
MATERIALS AND METHODSField Site and Soil Sampling
A case study was conducted from 8 Nov. 2001 to 23 June 2004 on adjacent farms in eastern South Dakota (Fig. 1). This period of time cov-ered both the corn (Zea mays L.) and soybean [Glycine max (L.) Merr.] crops, but for brevity only data from the 2002 soybean year are reported here. One farm chiseled and disked fi elds each fall (CT), and the other farm used NT. On the NT farm, primary tillage was last used in 1992. Under CT, corn and soybean were also row cultivated each year. Primary tillage under CT was approximately 160 mm deep. Farms were located about 24 km southeast of Brookings, SD (44°14.5′ N, 96°41.2′ W). The crop rotation
SSSAJ: Volume 73: Number 1 • January –February 2009 199
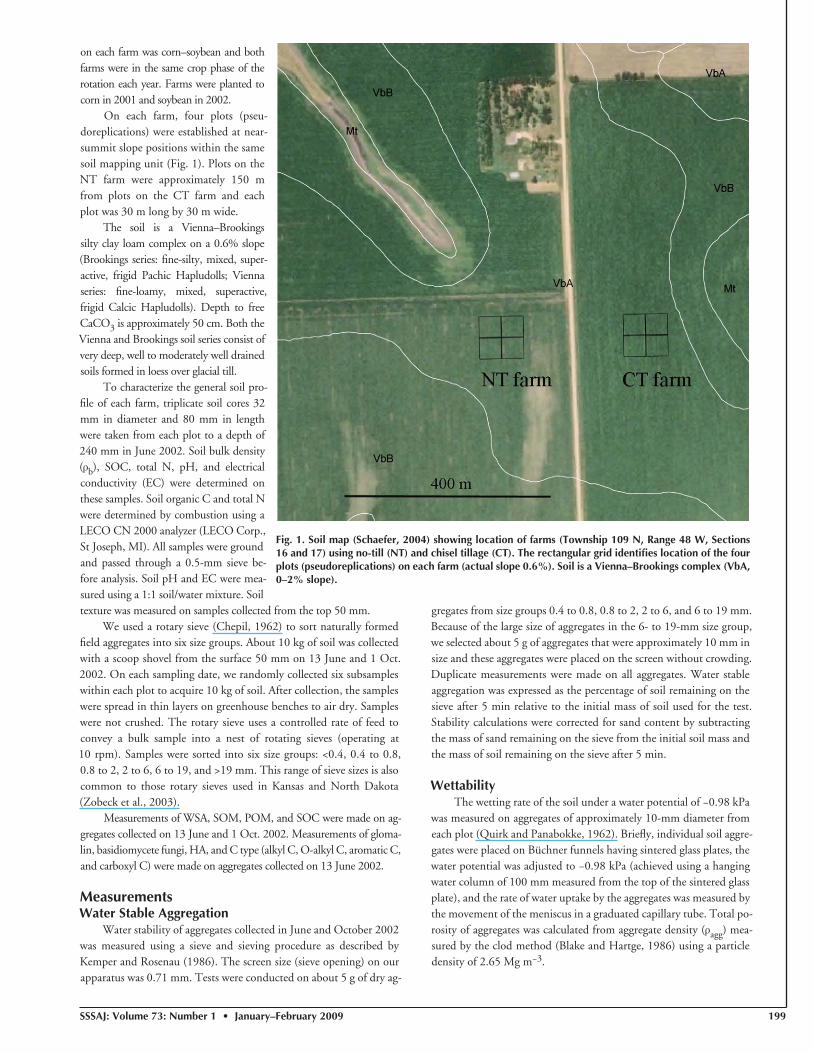
on each farm was corn–soybean and both farms were in the same crop phase of the rotation each year. Farms were planted to corn in 2001 and soybean in 2002.
On each farm, four plots (pseu-doreplications) were established at near-summit slope positions within the same soil mapping unit (Fig. 1). Plots on the NT farm were approximately 150 m from plots on the CT farm and each plot was 30 m long by 30 m wide.
The soil is a Vienna–Brookings silty clay loam complex on a 0.6% slope (Brookings series: fi ne-silty, mixed, super-active, frigid Pachic Hapludolls; Vienna series: fi ne-loamy, mixed, superactive, frigid Calcic Hapludolls). Depth to free CaCO3 is approximately 50 cm. Both the Vienna and Brookings soil series consist of very deep, well to moderately well drained soils formed in loess over glacial till.
To characterize the general soil pro-fi le of each farm, triplicate soil cores 32 mm in diameter and 80 mm in length were taken from each plot to a depth of 240 mm in June 2002. Soil bulk density (ρb), SOC, total N, pH, and electrical conductivity (EC) were determined on these samples. Soil organic C and total N were determined by combustion using a LECO CN 2000 analyzer (LECO Corp., St Joseph, MI). All samples were ground and passed through a 0.5-mm sieve be-fore analysis. Soil pH and EC were mea-sured using a 1:1 soil/water mixture. Soil texture was measured on samples collected from the top 50 mm.
We used a rotary sieve (Chepil, 1962) to sort naturally formed fi eld aggregates into six size groups. About 10 kg of soil was collected with a scoop shovel from the surface 50 mm on 13 June and 1 Oct. 2002. On each sampling date, we randomly collected six subsamples within each plot to acquire 10 kg of soil. After collection, the samples were spread in thin layers on greenhouse benches to air dry. Samples were not crushed. The rotary sieve uses a controlled rate of feed to convey a bulk sample into a nest of rotating sieves (operating at 10 rpm). Samples were sorted into six size groups: <0.4, 0.4 to 0.8, 0.8 to 2, 2 to 6, 6 to 19, and >19 mm. This range of sieve sizes is also common to those rotary sieves used in Kansas and North Dakota (Zobeck et al., 2003).
Measurements of WSA, SOM, POM, and SOC were made on ag-gregates collected on 13 June and 1 Oct. 2002. Measurements of gloma-lin, basidiomycete fungi, HA, and C type (alkyl C, O-alkyl C, aromatic C, and carboxyl C) were made on aggregates collected on 13 June 2002.
MeasurementsWater Stable Aggregation
Water stability of aggregates collected in June and October 2002 was measured using a sieve and sieving procedure as described by Kemper and Rosenau (1986). The screen size (sieve opening) on our apparatus was 0.71 mm. Tests were conducted on about 5 g of dry ag-
gregates from size groups 0.4 to 0.8, 0.8 to 2, 2 to 6, and 6 to 19 mm. Because of the large size of aggregates in the 6- to 19-mm size group, we selected about 5 g of aggregates that were approximately 10 mm in size and these aggregates were placed on the screen without crowding. Duplicate measurements were made on all aggregates. Water stable aggregation was expressed as the percentage of soil remaining on the sieve after 5 min relative to the initial mass of soil used for the test. Stability calculations were corrected for sand content by subtracting the mass of sand remaining on the sieve from the initial soil mass and the mass of soil remaining on the sieve after 5 min.
WettabilityThe wetting rate of the soil under a water potential of −0.98 kPa
was measured on aggregates of approximately 10-mm diameter from each plot (Quirk and Panabokke, 1962). Briefl y, individual soil aggre-gates were placed on Büchner funnels having sintered glass plates, the water potential was adjusted to −0.98 kPa (achieved using a hanging water column of 100 mm measured from the top of the sintered glass plate), and the rate of water uptake by the aggregates was measured by the movement of the meniscus in a graduated capillary tube. Total po-rosity of aggregates was calculated from aggregate density (ρagg) mea-sured by the clod method (Blake and Hartge, 1986) using a particle density of 2.65 Mg m−3.
Fig. 1. Soil map (Schaefer, 2004) showing location of farms (Township 109 N, Range 48 W, Sections 16 and 17) using no-till (NT) and chisel tillage (CT). The rectangular grid identifi es location of the four plots (pseudoreplications) on each farm (actual slope 0.6%). Soil is a Vienna–Brookings complex (VbA, 0–2% slope).
200 SSSAJ: Volume 73: Number 1 • January–February 2009
Particulate Soil Organic MatterParticulate organic matter was measured by dispersing and siev-
ing, using the weight loss-on-ignition (LOI) method of Cambardella et al. (2001) and further described by Gajda et al. (2001). We used an ignition temperature of 450°C for 4 h and 30- and 10-g samples for POM and SOM, respectively, as recommended by Cambardella et al. (2001) and also used by other investigators (Gajda et al., 2001; Mikha et al., 2006). Particulate organic matter remaining on the 0.5-mm sieve was termed coarse POM (cPOM) and had a size range of 0.5 to 2.0 mm; POM retained on the 0.053-mm sieve was called fi ne POM (fPOM) and had a size range of 0.053 to 0.5 mm. The mass of POM was determined by LOI.
Soil organic matter was measured using LOI (Cambardella et al., 2001; Gajda et al., 2001). Fine POM and cPOM were expressed relative to SOM (fPOM/SOM and cPOM/SOM ratios) for each aggregate group.
Soil CarbonSoil C for aggregate groups <0.4, 0.4 to 0.8, 0.8 to 2, 2 to 6,
6 to 19, and >19 mm was measured by combustion using a LECO CN 2000 analyzer. All samples were ground and passed through a 0.5-mm sieve before analysis. Before grinding, visible pieces of crop residue were removed. For noncalcareous soils (Nelson and Sommers, 1982), soil C can be considered to be SOC. Generally, the pH values for calcareous soils are within a range of 7.5 to 8.5 (Loeppert and Suarez, 1996). The pH of our soil profi le samples (Table 1) indicated that pretreatment to remove carbonates (Nelson and Sommers, 1982) before dry combustion was not necessary. Soil C will therefore be referred to as SOC.
BasidiomycetesThe quantity of basidiomycetes in aggregate size groups 0.8 to 2,
2 to 6, and 6 to 19 mm was determined using an enzyme-linked im-munosorbent assay (ELISA) protocol as described in Caesar-TonThat et al. (2001). Absorbance (Abs450) was read at a dual wavelength of 450/655 nm using a BioRad 550 microplate reader controlled by a computer using the Plate Reader Manage program (BioRad, Hercules, CA). All incubation steps on aggregate material were performed at room temperature. All samples were processed in triplicate. Two in-dependent tests were made on each aggregate sample. Measurements were made on whole aggregates before wet sieving and on the soil retained on the sieve following the wet sieve test.
GlomalinGlomalin was extracted from the soil of each aggregate group us-
ing the extraction procedure of Wright et al. (1999) except that 1 g of sample was extracted by using 8 mL of extraction solution. Extraction was performed using 50 mmol L−1 sodium citrate, pH 8.0. This ex-traction protocol may coextract other soil proteins, and the extract has been renamed glomalin-related soil protein (Rillig, 2004), however, we will refer to glomalin-related soil protein as glomalin. All extrac-tions were performed at 121°C for 1 h, and the extraction cycles were repeated seven times. The supernatant from each extraction cycle was combined and assayed for glomalin concentration using an ELISA protocol and the antiglomalin monoclonal antibody as described by Wright and Upadhyaya (1998). This fraction will be called immunore-active total glomalin (IRTG).
Glomalin was also extracted from fi ve fractions of SOM in the 2- to 6-mm aggregate size group. Fractions were: (i) visible plant resi-due picked from the soil before wet sieving; (ii) fPOM from water
stable aggregates; (iii) cPOM from water stable aggregates; (iv) fPOM from aggregates that slaked during wet sieving; and (v) cPOM from aggregates that slaked during wet sieving. Two glomalin fractions (cit-rate-extractable and recalcitrant glomalin [Nichols and Wright, 2005, 2006; Wright et al., 2006]) were extracted from 0.4- to 4-g samples of the fi ve SOM fractions.
Citrate-extractable glomalin was extracted with 50 mmol L−1 so-dium citrate at pH 8.0. The recalcitrant glomalin fraction was extract-ed with 100 mmol L−1 sodium pyrophosphate at pH 9.0 (Wright et al., 2006). Repeated extractions (until the solution was straw colored) were performed at 121°C for 1 h. The supernatant from each extrac-tion cycle was combined and assayed for glomalin concentration. Each extractant (citrate or pyrophosphate) was analyzed separately. Glomalin concentrations in SOM materials were measured using a Bradford total protein assay (Wright and Upadhyaya, 1996).
Humic AcidSoil was fractionated into humin and HA following Stevenson
(1994). Thirty grams of soil from aggregate size groups <0.4, 0.4 to 0.8, 0.8 to 2, 2 to 6, and 6 to 19 mm (collected on 13 June 2002) were extracted for HA. Humic acid was separated from the humin and the inorganic fraction using repeated extractions with 0.5 mol L−1 NaOH under N2. Humin and HA fractions were dried, ground, and analyzed for total C, N, and organic C type.
Solid-State Carbon-13 Nuclear Magnetic ResonanceOrganic C type in the HA, humin, and soil was determined
by quantitative 13C NMR. Samples of HA and humin consisted of bulked samples (replications and aggregate size groups <0.4, 0.4 to 0.8, 0.8 to 2, 2 to 6, and 6 to 19 mm). Soil was a bulked sample consisting of 10-mm aggregates from four replications. All samples were ground and passed through a 0.5-mm sieve. The quantitative 13C NMR technique, described by Mao et al. (2000), utilizes direct-polarization magic-angle spinning (DPMAS) at high rotation speeds (13 kHz) combined with a T1
C correction obtained from cross-polar-ization total sideband suppression (CP/T1–TOSS) experiment. The recycle delays used for DPMAS were determined for each sample. The number of scans recorded ranged between 5000 and 35,000. All samples, except HA fractions, were treated with dilute solutions of HF to remove Fe before NMR analysis (Keeler and Maciel, 2003). Samples were packed in a 4-mm-diameter zirconia rotor with a Kel-F cap. Spectra were acquired at 75 MHz on a Bruker ASX300 spectrom-eter. The 13C NMR spectra were integrated according to the follow-ing chemical shift regions: 0 to 50 ppm, alkyl C (aliphatic C); 50 to 108 ppm, O-alkyl C (carbohydrate C); 108 to 162 ppm, aromatic C; and 162 to 212 ppm, carboxyl C. The distribution among these four major C types was calculated by integration using software supplied with the spectrometer operating system.
StatisticsStatistical comparisons of measured soil properties were made
using one-way and two-way analysis of variance (Minitab Release 14, Minitab Inc., State College, PA). Fixed effects were tillage (CT and NT). Time of sampling (13 June and 1 Oct. 2002) and replications were treated as random effects in the combined analysis. Treatment ef-fects (one-way ANOVA) were considered signifi cant for P ≤ 0.05. The effect of time and tillage (two-way ANOVA) and the time × tillage interaction were evaluated using a general linear model.
SSSAJ: Volume 73: Number 1 • January –February 2009 201
Stepwise regression was used to identify signifi cant predictors of WSA for aggregates of size groups 0.8 to 2.0 and 2.0 to 6.0 mm. Measurements on these size groups included fPOM, cPOM, total particulate organic matter (TPOM), C and N of HA, SOC, N, basidiomycete fungi, IRTG, and SOM. We had too few measurements of the distri-bution of organic C types with 13C DPMAS NMR for regres-sion modeling.
RESULTS AND DISCUSSIONSite Characteristics
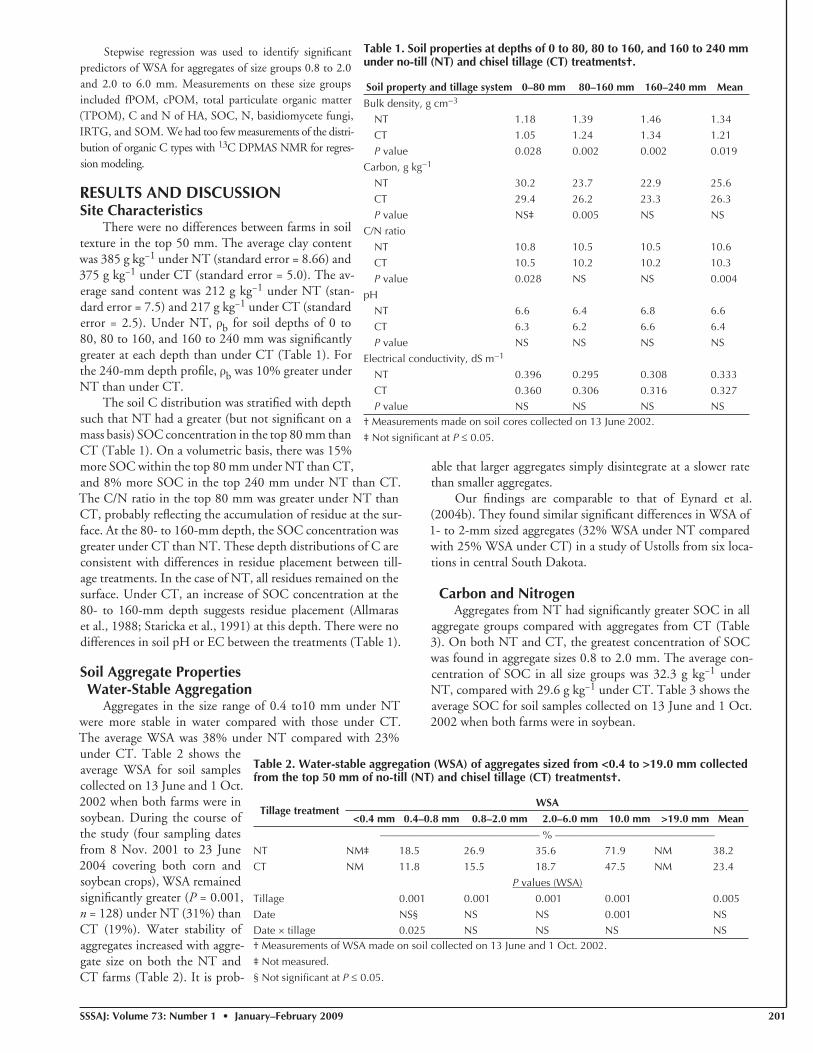
There were no differences between farms in soil texture in the top 50 mm. The average clay content was 385 g kg−1 under NT (standard error = 8.66) and 375 g kg−1 under CT (standard error = 5.0). The av-erage sand content was 212 g kg−1 under NT (stan-dard error = 7.5) and 217 g kg−1 under CT (standard error = 2.5). Under NT, ρb for soil depths of 0 to 80, 80 to 160, and 160 to 240 mm was signifi cantly greater at each depth than under CT (Table 1). For the 240-mm depth profi le, ρb was 10% greater under NT than under CT.
The soil C distribution was stratifi ed with depth such that NT had a greater (but not signifi cant on a mass basis) SOC concentration in the top 80 mm than CT (Table 1). On a volumetric basis, there was 15% more SOC within the top 80 mm under NT than CT, and 8% more SOC in the top 240 mm under NT than CT. The C/N ratio in the top 80 mm was greater under NT than CT, probably refl ecting the accumulation of residue at the sur-face. At the 80- to 160-mm depth, the SOC concentration was greater under CT than NT. These depth distributions of C are consistent with differences in residue placement between till-age treatments. In the case of NT, all residues remained on the surface. Under CT, an increase of SOC concentration at the 80- to 160-mm depth suggests residue placement (Allmaras et al., 1988; Staricka et al., 1991) at this depth. There were no differences in soil pH or EC between the treatments (Table 1).
Soil Aggregate PropertiesWater-Stable Aggregation
Aggregates in the size range of 0.4 to10 mm under NT were more stable in water compared with those under CT. The average WSA was 38% under NT compared with 23% under CT. Table 2 shows the average WSA for soil samples collected on 13 June and 1 Oct. 2002 when both farms were in soybean. During the course of the study (four sampling dates from 8 Nov. 2001 to 23 June 2004 covering both corn and soybean crops), WSA remained signifi cantly greater (P = 0.001, n = 128) under NT (31%) than CT (19%). Water stability of aggregates increased with aggre-gate size on both the NT and CT farms (Table 2). It is prob-
able that larger aggregates simply disintegrate at a slower rate than smaller aggregates.
Our fi ndings are comparable to that of Eynard et al. (2004b). They found similar signifi cant differences in WSA of 1- to 2-mm sized aggregates (32% WSA under NT compared with 25% WSA under CT) in a study of Ustolls from six loca-tions in central South Dakota.
Carbon and NitrogenAggregates from NT had signifi cantly greater SOC in all
aggregate groups compared with aggregates from CT (Table 3). On both NT and CT, the greatest concentration of SOC was found in aggregate sizes 0.8 to 2.0 mm. The average con-centration of SOC in all size groups was 32.3 g kg−1 under NT, compared with 29.6 g kg−1 under CT. Table 3 shows the average SOC for soil samples collected on 13 June and 1 Oct. 2002 when both farms were in soybean.
Table 1. Soil properties at depths of 0 to 80, 80 to 160, and 160 to 240 mm under no-till (NT) and chisel tillage (CT) treatments†.
Soil property and tillage system 0–80 mm 80–160 mm 160–240 mm Mean
Bulk density, g cm−3
NT 1.18 1.39 1.46 1.34
CT 1.05 1.24 1.34 1.21
P value 0.028 0.002 0.002 0.019
Carbon, g kg−1
NT 30.2 23.7 22.9 25.6
CT 29.4 26.2 23.3 26.3
P value NS‡ 0.005 NS NS
C/N ratio
NT 10.8 10.5 10.5 10.6
CT 10.5 10.2 10.2 10.3
P value 0.028 NS NS 0.004
pH
NT 6.6 6.4 6.8 6.6
CT 6.3 6.2 6.6 6.4
P value NS NS NS NS
Electrical conductivity, dS m−1
NT 0.396 0.295 0.308 0.333
CT 0.360 0.306 0.316 0.327 P value NS NS NS NS† Measurements made on soil cores collected on 13 June 2002.
‡ Not signifi cant at P ≤ 0.05.
Table 2. Water-stable aggregation (WSA) of aggregates sized from <0.4 to >19.0 mm collected from the top 50 mm of no-till (NT) and chisel tillage (CT) treatments†.
Tillage treatmentWSA
<0.4 mm 0.4–0.8 mm 0.8–2.0 mm 2.0–6.0 mm 10.0 mm >19.0 mm Mean
——————————————— % ———————————————NT NM‡ 18.5 26.9 35.6 71.9 NM 38.2
CT NM 11.8 15.5 18.7 47.5 NM 23.4
P values (WSA)
Tillage 0.001 0.001 0.001 0.001 0.005
Date NS§ NS NS 0.001 NSDate × tillage 0.025 NS NS NS NS† Measurements of WSA made on soil collected on 13 June and 1 Oct. 2002.
‡ Not measured.
§ Not signifi cant at P ≤ 0.05.
202 SSSAJ: Volume 73: Number 1 • January–February 2009
The C/N ratio was signifi cantly greater under NT than CT for all aggregate groups (Table 3). The average C/N ratio of ag-gregates was 10.7 under NT and 10.2 under CT. Under NT, the greatest C/N ratio was found in aggregate sizes 0.8 to 2.0 mm, whereas under CT, the greatest C/N ratio was found in aggregate sizes 2.0 to 6.0 mm (Table 3). There were no differences in the C/N ratios of aggregates due to time of sampling (13 June or 1 Oct. 2002) except within aggregate sizes 0.4 to 0.8 mm.
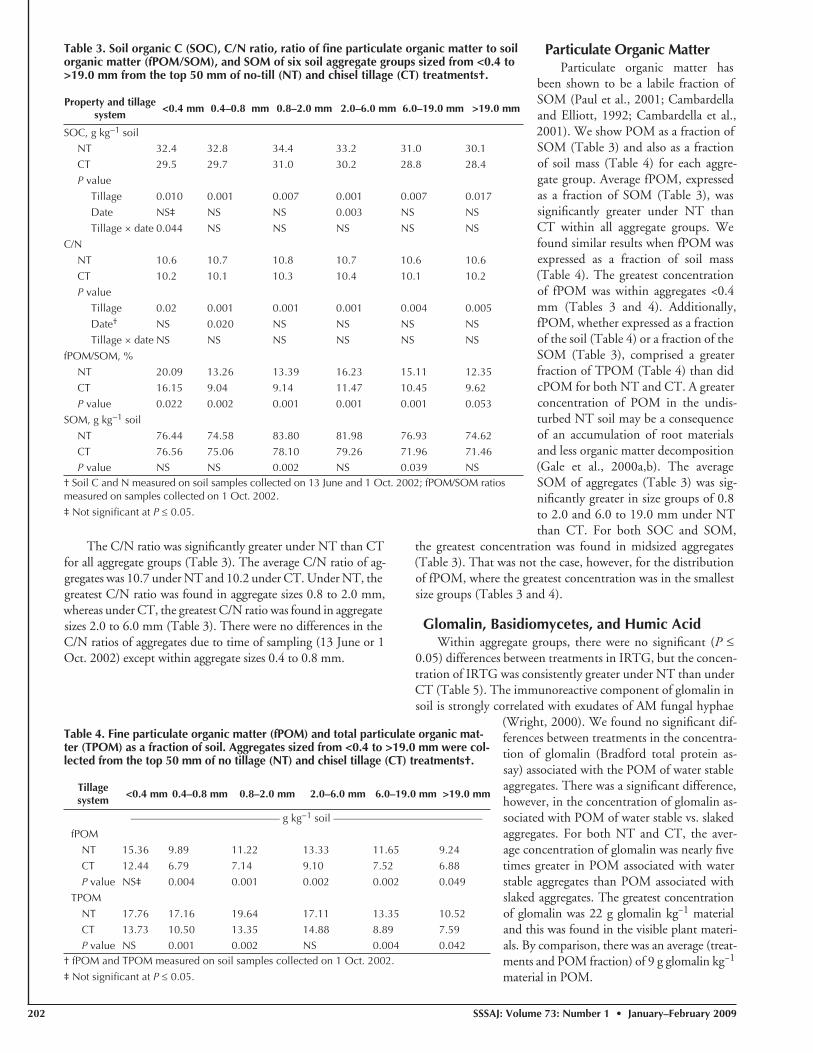
Particulate Organic MatterParticulate organic matter has
been shown to be a labile fraction of SOM (Paul et al., 2001; Cambardella and Elliott, 1992; Cambardella et al., 2001). We show POM as a fraction of SOM (Table 3) and also as a fraction of soil mass (Table 4) for each aggre-gate group. Average fPOM, expressed as a fraction of SOM (Table 3), was signifi cantly greater under NT than CT within all aggregate groups. We found similar results when fPOM was expressed as a fraction of soil mass (Table 4). The greatest concentration of fPOM was within aggregates <0.4 mm (Tables 3 and 4). Additionally, fPOM, whether expressed as a fraction of the soil (Table 4) or a fraction of the SOM (Table 3), comprised a greater fraction of TPOM (Table 4) than did cPOM for both NT and CT. A greater concentration of POM in the undis-turbed NT soil may be a consequence of an accumulation of root materials and less organic matter decomposition (Gale et al., 2000a,b). The average SOM of aggregates (Table 3) was sig-nifi cantly greater in size groups of 0.8 to 2.0 and 6.0 to 19.0 mm under NT than CT. For both SOC and SOM,
the greatest concentration was found in midsized aggregates (Table 3). That was not the case, however, for the distribution of fPOM, where the greatest concentration was in the smallest size groups (Tables 3 and 4).
Glomalin, Basidiomycetes, and Humic AcidWithin aggregate groups, there were no signifi cant (P ≤
0.05) differences between treatments in IRTG, but the concen-tration of IRTG was consistently greater under NT than under CT (Table 5). The immunoreactive component of glomalin in soil is strongly correlated with exudates of AM fungal hyphae
(Wright, 2000). We found no signifi cant dif-ferences between treatments in the concentra-tion of glomalin (Bradford total protein as-say) associated with the POM of water stable aggregates. There was a signifi cant difference, however, in the concentration of glomalin as-sociated with POM of water stable vs. slaked aggregates. For both NT and CT, the aver-age concentration of glomalin was nearly fi ve times greater in POM associated with water stable aggregates than POM associated with slaked aggregates. The greatest concentration of glomalin was 22 g glomalin kg−1 material and this was found in the visible plant materi-als. By comparison, there was an average (treat-ments and POM fraction) of 9 g glomalin kg−1 material in POM.
Table 3. Soil organic C (SOC), C/N ratio, ratio of fi ne particulate organic matter to soil organic matter (fPOM/SOM), and SOM of six soil aggregate groups sized from <0.4 to >19.0 mm from the top 50 mm of no-till (NT) and chisel tillage (CT) treatments†.
Property and tillage system
<0.4 mm 0.4–0.8 mm 0.8–2.0 mm 2.0–6.0 mm 6.0–19.0 mm >19.0 mm
SOC, g kg−1 soil NT 32.4 32.8 34.4 33.2 31.0 30.1
CT 29.5 29.7 31.0 30.2 28.8 28.4
P value
Tillage 0.010 0.001 0.007 0.001 0.007 0.017
Date NS‡ NS NS 0.003 NS NS
Tillage × date 0.044 NS NS NS NS NS
C/N
NT 10.6 10.7 10.8 10.7 10.6 10.6
CT 10.2 10.1 10.3 10.4 10.1 10.2
P value
Tillage 0.02 0.001 0.001 0.001 0.004 0.005
Date† NS 0.020 NS NS NS NS
Tillage × date NS NS NS NS NS NS
fPOM/SOM, %
NT 20.09 13.26 13.39 16.23 15.11 12.35
CT 16.15 9.04 9.14 11.47 10.45 9.62
P value 0.022 0.002 0.001 0.001 0.001 0.053
SOM, g kg−1 soil
NT 76.44 74.58 83.80 81.98 76.93 74.62
CT 76.56 75.06 78.10 79.26 71.96 71.46 P value NS NS 0.002 NS 0.039 NS† Soil C and N measured on soil samples collected on 13 June and 1 Oct. 2002; fPOM/SOM ratios measured on samples collected on 1 Oct. 2002.
‡ Not signifi cant at P ≤ 0.05.
Table 4. Fine particulate organic matter (fPOM) and total particulate organic mat-ter (TPOM) as a fraction of soil. Aggregates sized from <0.4 to >19.0 mm were col-lected from the top 50 mm of no tillage (NT) and chisel tillage (CT) treatments†.
Tillage system
<0.4 mm 0.4–0.8 mm 0.8–2.0 mm 2.0–6.0 mm 6.0–19.0 mm >19.0 mm
—————————————— g kg−1 soil ——————————————fPOM
NT 15.36 9.89 11.22 13.33 11.65 9.24
CT 12.44 6.79 7.14 9.10 7.52 6.88
P value NS‡ 0.004 0.001 0.002 0.002 0.049
TPOM
NT 17.76 17.16 19.64 17.11 13.35 10.52
CT 13.73 10.50 13.35 14.88 8.89 7.59 P value NS 0.001 0.002 NS 0.004 0.042
† fPOM and TPOM measured on soil samples collected on 1 Oct. 2002.
‡ Not signifi cant at P ≤ 0.05.
SSSAJ: Volume 73: Number 1 • January –February 2009 203
The average number of basidi-omycetes in the soil remaining on the screens following wet sieving was signifi cantly greater (40%) under NT than CT (Table 5) for the 0.8- to 2.0-mm aggregates. For both NT and CT, the 0.8- to 2.0-mm aggregates had the greatest absorbance value (number of basidiomycetes). These fungi play an important role in the formation and stabilization of soil aggregates (Caesar-TonThat and Cochran, 2000) through the adhesive effects of microbial meta-bolic products and entanglement of soil particles by fi lamentous fungi.
There were small differences in the C/N ratios of HA between NT and CT (Table 5). Generally, aggregates <0.4 mm had the greatest C/N ratios. We think that the difference in C/N ra-tios among aggregate groups provides evidence that “less humifi ed” materi-als (having greater C/N ratios) were present within the smaller aggregates. Stevenson (1994) suggested a relation between or-ganic matter decomposition and the C/N ratio of HA such that soil mixing and aeration would encourage decomposition, resulting in a narrowing of the C/N ratio of HA. Chefetz et al. (2002) found that HA of aggregates, containing freshly depos-ited organic matter, showed greater C/N ratios. The aggregate size evaluated by Chefetz et al. (2002) roughly corresponds to our <0.4-mm aggregates.
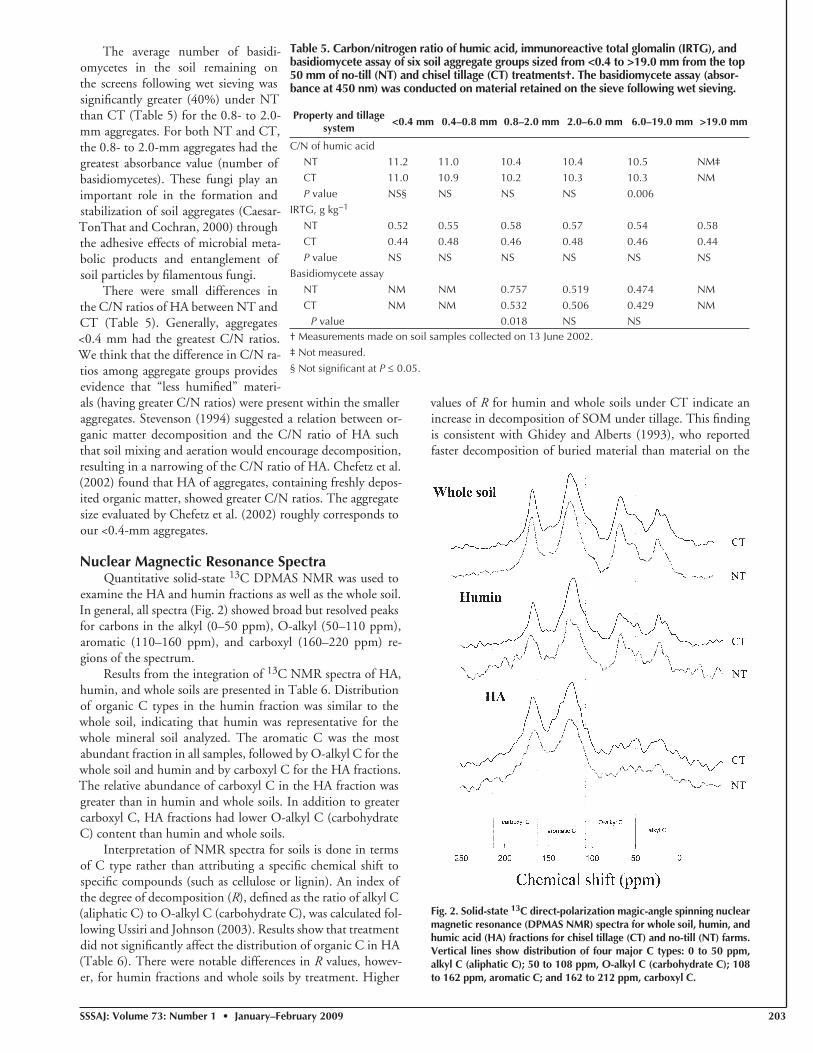
Nuclear Magnectic Resonance SpectraQuantitative solid-state 13C DPMAS NMR was used to
examine the HA and humin fractions as well as the whole soil. In general, all spectra (Fig. 2) showed broad but resolved peaks for carbons in the alkyl (0–50 ppm), O-alkyl (50–110 ppm), aromatic (110–160 ppm), and carboxyl (160–220 ppm) re-gions of the spectrum.
Results from the integration of 13C NMR spectra of HA, humin, and whole soils are presented in Table 6. Distribution of organic C types in the humin fraction was similar to the whole soil, indicating that humin was representative for the whole mineral soil analyzed. The aromatic C was the most abundant fraction in all samples, followed by O-alkyl C for the whole soil and humin and by carboxyl C for the HA fractions. The relative abundance of carboxyl C in the HA fraction was greater than in humin and whole soils. In addition to greater carboxyl C, HA fractions had lower O-alkyl C (carbohydrate C) content than humin and whole soils.
Interpretation of NMR spectra for soils is done in terms of C type rather than attributing a specifi c chemical shift to specifi c compounds (such as cellulose or lignin). An index of the degree of decomposition (R), defi ned as the ratio of alkyl C (aliphatic C) to O-alkyl C (carbohydrate C), was calculated fol-lowing Ussiri and Johnson (2003). Results show that treatment did not signifi cantly affect the distribution of organic C in HA (Table 6). There were notable differences in R values, howev-er, for humin fractions and whole soils by treatment. Higher
values of R for humin and whole soils under CT indicate an increase in decomposition of SOM under tillage. This fi nding is consistent with Ghidey and Alberts (1993), who reported faster decomposition of buried material than material on the
Table 5. Carbon/nitrogen ratio of humic acid, immunoreactive total glomalin (IRTG), and basidiomycete assay of six soil aggregate groups sized from <0.4 to >19.0 mm from the top 50 mm of no-till (NT) and chisel tillage (CT) treatments†. The basidiomycete assay (absor-bance at 450 nm) was conducted on material retained on the sieve following wet sieving.
Property and tillage system
<0.4 mm 0.4–0.8 mm 0.8–2.0 mm 2.0–6.0 mm 6.0–19.0 mm >19.0 mm
C/N of humic acid NT 11.2 11.0 10.4 10.4 10.5 NM‡
CT 11.0 10.9 10.2 10.3 10.3 NM
P value NS§ NS NS NS 0.006
IRTG, g kg−1
NT 0.52 0.55 0.58 0.57 0.54 0.58
CT 0.44 0.48 0.46 0.48 0.46 0.44
P value NS NS NS NS NS NS
Basidiomycete assay
NT NM NM 0.757 0.519 0.474 NM
CT NM NM 0.532 0.506 0.429 NM
P value 0.018 NS NS† Measurements made on soil samples collected on 13 June 2002.
‡ Not measured.
§ Not signifi cant at P ≤ 0.05.
Fig. 2. Solid-state 13C direct-polarization magic-angle spinning nuclear magnetic resonance (DPMAS NMR) spectra for whole soil, humin, and humic acid (HA) fractions for chisel tillage (CT) and no-till (NT) farms. Vertical lines show distribution of four major C types: 0 to 50 ppm, alkyl C (aliphatic C); 50 to 108 ppm, O-alkyl C (carbohydrate C); 108 to 162 ppm, aromatic C; and 162 to 212 ppm, carboxyl C.
204 SSSAJ: Volume 73: Number 1 • January–February 2009
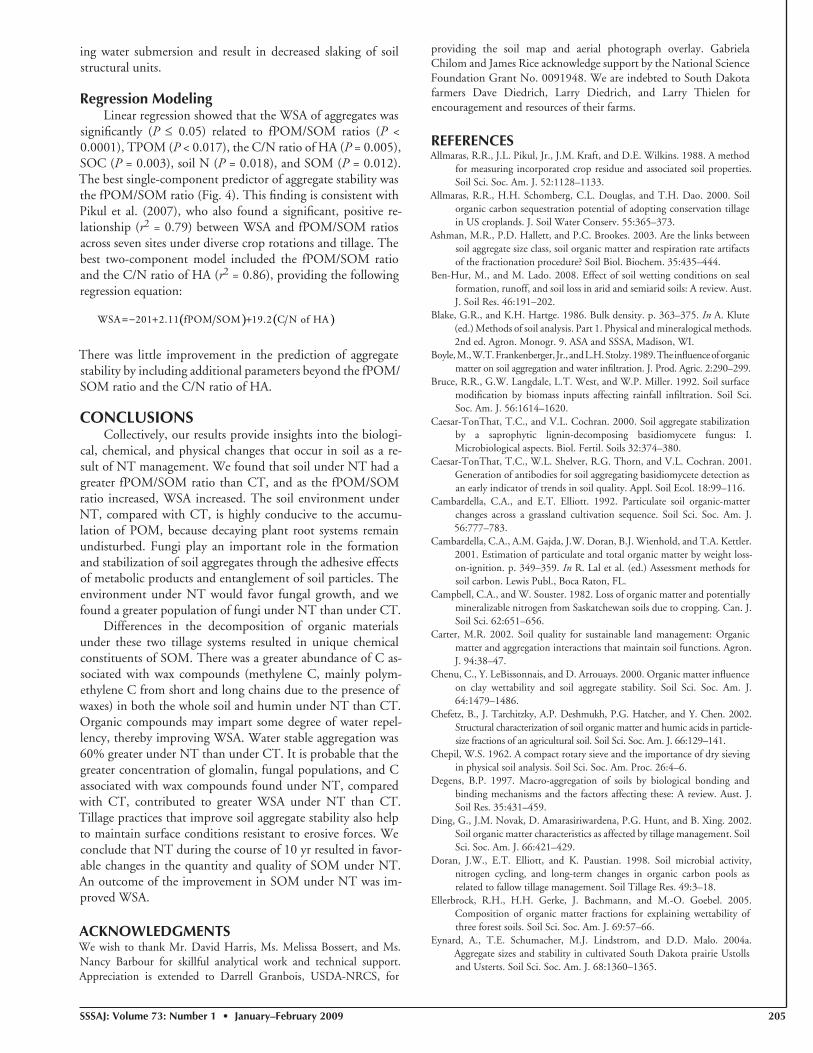
Fig. 4. Relationship of water stable aggregation (WSA) to the fi ne particulate organic matter/soil organic matter (fPOM/SOM) ratio. Soil aggregates tested were from size groups 0.4 to 0.8, 0.8 to 2.0, and 2.0 to 6.0 mm and 10-mm aggregates from size group 6.0 to 19.0 mm of no-till (NT) and chisel tillage (CT) farms. The linear regression does not include tests on the 10-mm aggregates.
surface. Sleutel et al. (2007) compared two adjacent farm fi elds under reduced tillage and CT and found evidence, using pyrol-ysis–fi eld ionization mass spectroscopy, of a less decomposed character of SOM under reduced tillage.
Types of water-repellent substances in soil organic matter include aliphatic components and waxes, represented in the quantitative C13 NMR spectra by the chemical shift region between 0 and 50 ppm. The region between 0 and 20 ppm of the C13 NMR spectra is attributed to methyl C, mainly from branched alkyl carbons. The region between 20 and 33 ppm of the same spectra is attributed to methylene C, mainly polym-ethylene C from short and long chains due to the presence of waxes. These two regions were integrated and the polymethyl-ene C (20–33 ppm) to methyl C (0– 20 ppm) ratio was calcu-lated. Under NT, the ratio was 2 compared with 1.5 under CT for the whole soil. The difference was more pronounced for the humin samples, where the ratio was 3 under NT compared with 1.5 under CT. No difference occurred for HA.
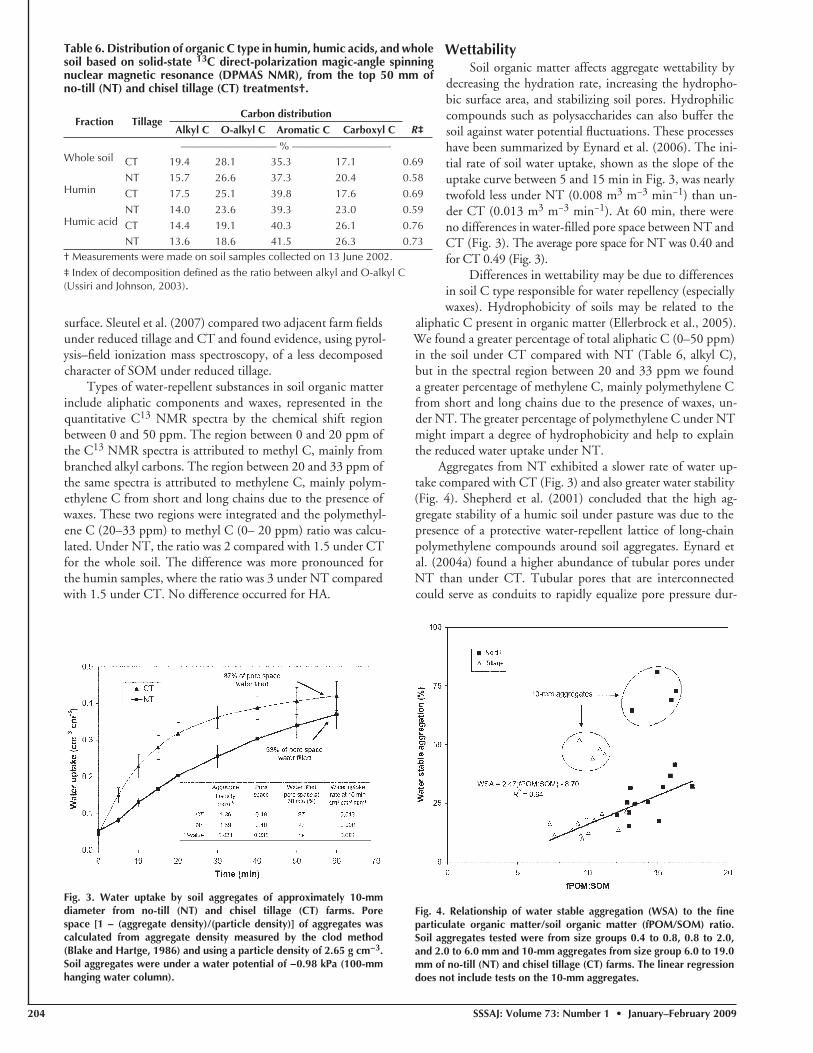
WettabilitySoil organic matter affects aggregate wettability by
decreasing the hydration rate, increasing the hydropho-bic surface area, and stabilizing soil pores. Hydrophilic compounds such as polysaccharides can also buffer the soil against water potential fl uctuations. These processes have been summarized by Eynard et al. (2006). The ini-tial rate of soil water uptake, shown as the slope of the uptake curve between 5 and 15 min in Fig. 3, was nearly twofold less under NT (0.008 m3 m−3 min−1) than un-der CT (0.013 m3 m−3 min−1). At 60 min, there were no differences in water-fi lled pore space between NT and CT (Fig. 3). The average pore space for NT was 0.40 and for CT 0.49 (Fig. 3).
Differences in wettability may be due to differences in soil C type responsible for water repellency (especially waxes). Hydrophobicity of soils may be related to the
aliphatic C present in organic matter (Ellerbrock et al., 2005). We found a greater percentage of total aliphatic C (0–50 ppm) in the soil under CT compared with NT (Table 6, alkyl C), but in the spectral region between 20 and 33 ppm we found a greater percentage of methylene C, mainly polymethylene C from short and long chains due to the presence of waxes, un-der NT. The greater percentage of polymethylene C under NT might impart a degree of hydrophobicity and help to explain the reduced water uptake under NT.
Aggregates from NT exhibited a slower rate of water up-take compared with CT (Fig. 3) and also greater water stability (Fig. 4). Shepherd et al. (2001) concluded that the high ag-gregate stability of a humic soil under pasture was due to the presence of a protective water-repellent lattice of long-chain polymethylene compounds around soil aggregates. Eynard et al. (2004a) found a higher abundance of tubular pores under NT than under CT. Tubular pores that are interconnected could serve as conduits to rapidly equalize pore pressure dur-
Table 6. Distribution of organic C type in humin, humic acids, and whole soil based on solid-state 13C direct-polarization magic-angle spinning nuclear magnetic resonance (DPMAS NMR), from the top 50 mm of no-till (NT) and chisel tillage (CT) treatments†.
Fraction TillageCarbon distribution
Alkyl C O-alkyl C Aromatic C Carboxyl C R‡
————————— % —————————-Whole soil CT 19.4 28.1 35.3 17.1 0.69
NT 15.7 26.6 37.3 20.4 0.58Humin CT 17.5 25.1 39.8 17.6 0.69
NT 14.0 23.6 39.3 23.0 0.59Humic acid CT 14.4 19.1 40.3 26.1 0.76
NT 13.6 18.6 41.5 26.3 0.73† Measurements were made on soil samples collected on 13 June 2002.
‡ Index of decomposition defi ned as the ratio between alkyl and O-alkyl C (Ussiri and Johnson, 2003).
Fig. 3. Water uptake by soil aggregates of approximately 10-mm diameter from no-till (NT) and chisel tillage (CT) farms. Pore space [1 − (aggregate density)/(particle density)] of aggregates was calculated from aggregate density measured by the clod method (Blake and Hartge, 1986) and using a particle density of 2.65 g cm−3. Soil aggregates were under a water potential of −0.98 kPa (100-mm hanging water column).
SSSAJ: Volume 73: Number 1 • January –February 2009 205
ing water submersion and result in decreased slaking of soil structural units.
Regression ModelingLinear regression showed that the WSA of aggregates was
signifi cantly (P ≤ 0.05) related to fPOM/SOM ratios (P < 0.0001), TPOM (P < 0.017), the C/N ratio of HA (P = 0.005), SOC (P = 0.003), soil N (P = 0.018), and SOM (P = 0.012). The best single-component predictor of aggregate stability was the fPOM/SOM ratio (Fig. 4). This fi nding is consistent with Pikul et al. (2007), who also found a signifi cant, positive re-lationship (r2 = 0.79) between WSA and fPOM/SOM ratios across seven sites under diverse crop rotations and tillage. The best two-component model included the fPOM/SOM ratio and the C/N ratio of HA (r2 = 0.86), providing the following regression equation:
( ) ( )WSA 201 2.11 fPOM SOM 19.2 C N of HA=− + +
There was little improvement in the prediction of aggregate stability by including additional parameters beyond the fPOM/SOM ratio and the C/N ratio of HA.
CONCLUSIONSCollectively, our results provide insights into the biologi-
cal, chemical, and physical changes that occur in soil as a re-sult of NT management. We found that soil under NT had a greater fPOM/SOM ratio than CT, and as the fPOM/SOM ratio increased, WSA increased. The soil environment under NT, compared with CT, is highly conducive to the accumu-lation of POM, because decaying plant root systems remain undisturbed. Fungi play an important role in the formation and stabilization of soil aggregates through the adhesive effects of metabolic products and entanglement of soil particles. The environment under NT would favor fungal growth, and we found a greater population of fungi under NT than under CT.
Differences in the decomposition of organic materials under these two tillage systems resulted in unique chemical constituents of SOM. There was a greater abundance of C as-sociated with wax compounds (methylene C, mainly polym-ethylene C from short and long chains due to the presence of waxes) in both the whole soil and humin under NT than CT. Organic compounds may impart some degree of water repel-lency, thereby improving WSA. Water stable aggregation was 60% greater under NT than under CT. It is probable that the greater concentration of glomalin, fungal populations, and C associated with wax compounds found under NT, compared with CT, contributed to greater WSA under NT than CT. Tillage practices that improve soil aggregate stability also help to maintain surface conditions resistant to erosive forces. We conclude that NT during the course of 10 yr resulted in favor-able changes in the quantity and quality of SOM under NT. An outcome of the improvement in SOM under NT was im-proved WSA.
ACKNOWLEDGMENTSWe wish to thank Mr. David Harris, Ms. Melissa Bossert, and Ms. Nancy Barbour for skillful analytical work and technical support. Appreciation is extended to Darrell Granbois, USDA-NRCS, for
providing the soil map and aerial photograph overlay. Gabriela Chilom and James Rice acknowledge support by the National Science Foundation Grant No. 0091948. We are indebted to South Dakota farmers Dave Diedrich, Larry Diedrich, and Larry Thielen for encouragement and resources of their farms.
REFERENCESAllmaras, R.R., J.L. Pikul, Jr., J.M. Kraft, and D.E. Wilkins. 1988. A method
for measuring incorporated crop residue and associated soil properties. Soil Sci. Soc. Am. J. 52:1128–1133.
Allmaras, R.R., H.H. Schomberg, C.L. Douglas, and T.H. Dao. 2000. Soil organic carbon sequestration potential of adopting conservation tillage in US croplands. J. Soil Water Conserv. 55:365–373.
Ashman, M.R., P.D. Hallett, and P.C. Brookes. 2003. Are the links between soil aggregate size class, soil organic matter and respiration rate artifacts of the fractionation procedure? Soil Biol. Biochem. 35:435–444.
Ben-Hur, M., and M. Lado. 2008. Effect of soil wetting conditions on seal formation, runoff, and soil loss in arid and semiarid soils: A review. Aust. J. Soil Res. 46:191–202.
Blake, G.R., and K.H. Hartge. 1986. Bulk density. p. 363–375. In A. Klute (ed.) Methods of soil analysis. Part 1. Physical and mineralogical methods. 2nd ed. Agron. Monogr. 9. ASA and SSSA, Madison, WI.
Boyle, M., W.T. Frankenberger, Jr., and L.H. Stolzy. 1989. The infl uence of organic matter on soil aggregation and water infi ltration. J. Prod. Agric. 2:290–299.
Bruce, R.R., G.W. Langdale, L.T. West, and W.P. Miller. 1992. Soil surface modifi cation by biomass inputs affecting rainfall infi ltration. Soil Sci. Soc. Am. J. 56:1614–1620.
Caesar-TonThat, T.C., and V.L. Cochran. 2000. Soil aggregate stabilization by a saprophytic lignin-decomposing basidiomycete fungus: I. Microbiological aspects. Biol. Fertil. Soils 32:374–380.
Caesar-TonThat, T.C., W.L. Shelver, R.G. Thorn, and V.L. Cochran. 2001. Generation of antibodies for soil aggregating basidiomycete detection as an early indicator of trends in soil quality. Appl. Soil Ecol. 18:99–116.
Cambardella, C.A., and E.T. Elliott. 1992. Particulate soil organic-matter changes across a grassland cultivation sequence. Soil Sci. Soc. Am. J. 56:777–783.
Cambardella, C.A., A.M. Gajda, J.W. Doran, B.J. Wienhold, and T.A. Kettler. 2001. Estimation of particulate and total organic matter by weight loss-on-ignition. p. 349–359. In R. Lal et al. (ed.) Assessment methods for soil carbon. Lewis Publ., Boca Raton, FL.
Campbell, C.A., and W. Souster. 1982. Loss of organic matter and potentially mineralizable nitrogen from Saskatchewan soils due to cropping. Can. J. Soil Sci. 62:651–656.
Carter, M.R. 2002. Soil quality for sustainable land management: Organic matter and aggregation interactions that maintain soil functions. Agron. J. 94:38–47.
Chenu, C., Y. LeBissonnais, and D. Arrouays. 2000. Organic matter infl uence on clay wettability and soil aggregate stability. Soil Sci. Soc. Am. J. 64:1479–1486.
Chefetz, B., J. Tarchitzky, A.P. Deshmukh, P.G. Hatcher, and Y. Chen. 2002. Structural characterization of soil organic matter and humic acids in particle-size fractions of an agricultural soil. Soil Sci. Soc. Am. J. 66:129–141.
Chepil, W.S. 1962. A compact rotary sieve and the importance of dry sieving in physical soil analysis. Soil Sci. Soc. Am. Proc. 26:4–6.
Degens, B.P. 1997. Macro-aggregation of soils by biological bonding and binding mechanisms and the factors affecting these: A review. Aust. J. Soil Res. 35:431–459.
Ding, G., J.M. Novak, D. Amarasiriwardena, P.G. Hunt, and B. Xing. 2002. Soil organic matter characteristics as affected by tillage management. Soil Sci. Soc. Am. J. 66:421–429.
Doran, J.W., E.T. Elliott, and K. Paustian. 1998. Soil microbial activity, nitrogen cycling, and long-term changes in organic carbon pools as related to fallow tillage management. Soil Tillage Res. 49:3–18.
Ellerbrock, R.H., H.H. Gerke, J. Bachmann, and M.-O. Goebel. 2005. Composition of organic matter fractions for explaining wettability of three forest soils. Soil Sci. Soc. Am. J. 69:57–66.
Eynard, A., T.E. Schumacher, M.J. Lindstrom, and D.D. Malo. 2004a. Aggregate sizes and stability in cultivated South Dakota prairie Ustolls and Usterts. Soil Sci. Soc. Am. J. 68:1360–1365.
206 SSSAJ: Volume 73: Number 1 • January–February 2009
Eynard, A., T.E. Schumacher, M.J. Lindstrom, D.D. Malo, and R.A. Kohl. 2004b. Wettability of soil aggregates from cultivated and uncultivated Ustolls and Usterts. Aust. J. Soil Res. 42:163–170.
Eynard, A., T.E. Schumacher, M.J. Lindstrom, D.D. Malo, and R.A. Kohl. 2006. Effects of aggregate structure and organic C on wettability of Ustolls. Soil Tillage Res. 88:205–216.
Franzluebbers, A.J., S.F. Wright, and J.A. Stuedemann. 2000. Soil aggregation and glomalin under pastures in the southern Piedmont USA. Soil Sci. Soc. Am. J. 64:1018–1026.
Gadkar, V., and M.C. Rillig. 2006. The arbuscular mycorrhizal fungal protein glomalin is a putative homolog of heat shock protein 60. FEMS Microbiol. Lett. 263:93–101.
Gale, W.J., C.A. Cambardella, and T.B. Bailey. 2000a. Root-derived carbon and the formation and stabilization of aggregates. Soil Sci. Soc. Am. J. 64:201–207.
Gale, W.J., C.A. Cambardella, and T.B. Bailey. 2000b. Surface residue- and root-derived carbon in stable and unstable aggregates. Soil Sci. Soc. Am. J. 64:196–201.
Gajda, J.W., J.W. Doran, T.A. Kettler, B.J. Wienhold, J.L. Pikul, Jr., and C.A. Cambardella. 2001. Soil quality evaluations of alternative and conventional management systems. p. 381–400. In R. Lal et al. (ed.) Assessment methods for soil carbon. Lewis Publ., Boca Raton, FL.
Ghidey, F., and E.E. Alberts. 1993. Residue type and placement effects on decomposition: Field study and model evaluation. Trans. ASAE 36:1611–1617.
Gregorich, E.A., C.F. Drury, and J.A. Baldock. 2001. Changes in soil carbon under long-term maize in monoculture and legume-based rotation. Can. J. Soil Sci. 81:21–31.
Keeler, C., and G.E. Maciel. 2003. Quantitation in the solid-state 13C-NMR analysis of soil and organic soil fractions. Anal. Chem. 75:2421–2432.
Kemper, W.D., and R.C. Rosenau. 1986. Aggregate stability and size distribution. p. 425–444. In A. Klute (ed.) Methods of soil analysis. Part 1. Physical and mineralogical methods. 2nd ed. Agron. Monogr. 9. ASA and SSSA, Madison, WI.
Loeppert, R.H., and D.L. Suarez. 1996. Carbonate and gypsum. p. 437–474. In D.L. Sparks (ed.) Methods of soil analysis. Part 3. Chemical methods. SSSA Book Ser. 5. SSSA, Madison, WI.
Mao, J.-D., W.-G. Hu, K. Schmidt-Rohr, G. Davies, E.A. Ghabbour, and B. Xing. 2000. Quantitative characterization of humic substances by solid-state carbon-13 nuclear magnetic resonance. Soil Sci. Soc. Am. J. 64:873–884.
Mikha, M.M., and C.W. Rice. 2004. Tillage and manure effects on soil and aggregate-associated carbon and nitrogen. Soil Sci. Soc. Am. J. 68:809–816.
Mikha, M.M., M.F. Vigil, M.A. Liebig, R.A. Bowman, B. McConkey, E.J. Deibert, and J.L. Pikul, Jr. 2006. Cropping system infl uences on soil chemical properties and soil quality in the Great Plains. Renewable Agric. Food Syst. 21:26–35.
Monreal, C.M., and H.H. Janzen. 1993. Soil organic-carbon dynamics after 80 years of cropping a Dark Brown Chernozem. Can. J. Soil Sci. 73:133–136.
Nelson, D.W., and L.E. Sommers. 1982. Total carbon, organic carbon, and organic matter. p. 539–579. In A.L. Page et al. (ed.) Methods of soil analysis. Part 2. Chemical and microbiological properties. 2nd ed. Agron. Monogr. 9. ASA and SSSA, Madison, WI.
Nichols, K.A., and S.F. Wright. 2005. Comparison of glomalin and humic acid in eight native U.S. soils. Soil Sci. 170:985–997.
Nichols, K.A., and S.F. Wright. 2006. Carbon and nitrogen in operationally-defi ned soil organic matter pools. Biol. Fertil. Soils 43:215–220.
Olchin, G.P., S. Ogle, S.D. Frey, T.R. Filley, K. Paustian, and J. Six. 2008. Residue carbon stabilization in soil aggregates of no-till and tillage management of dryland cropping systems. Soil Sci. Soc. Am. J. 72:507–513.
Paul, E.A., S.J. Morris, and S. Böhm. 2001. The determination of soil C pool sizes and turnover rates: Biophysical fractionation and tracers. p. 193- 206. In R. Lal et al. (ed.) Assessment methods for soil carbon. Lewis Publ., Boca Raton, FL.
Paustian, K., H.P. Collins, and E.A. Paul. 1997. Management controls on
soil carbon. p. 15–49. In E.A. Paul et al. (ed.) Soil organic matter in temperate agroecosystems: Long-term experiments in North America. CRC Press, Boca Raton, FL.
Pikul, J.L., Jr., S. Osborne, M. Ellsbury, and W. Riedell. 2007. Particulate organic matter and water stable aggregation of soil under contrasting management. Soil Sci. Soc. Am. J. 71:766–776.
Pikul, J.L., Jr., and J.F. Zuzel. 1994. Soil crusting and water infi ltration affected by long-term tillage and residue management. Soil Sci. Soc. Am. J. 58:1524–1530.
Quirk, J.P., and C.R. Panabokke. 1962. Incipient failure of soil aggregates. J. Soil Sci. 13:60–70.
Rillig, M.C. 2004. Arbuscular mycorrhizae, glomalin, and soil aggregation. Can. J. Soil Sci. 84:355–363.
Sainju, U.M. 2006. Carbon and nitrogen pools in soil aggregates separated by dry and wet sieving methods. Soil Sci. 171:937–949.
Schaefer, W.T. 2004. Soil survey of Brookings County, South Dakota. U.S. Gov. Print. Offi ce, Washington, DC.
Shaver, T.M., G.A. Peterson, L.R. Ahuja, D.G. Westfall, L.A. Sherrod, and G. Dunn. 2002. Surface soil physical properties after twelve years of dryland no-till management. Soil Sci. Soc. Am. J. 66:1296–1303.
Shepherd, T.G., S. Saggar, R.H. Newman, C.W. Ross, and J.L. Dando. 2001. Tillage-induced changes to soil structure and organic carbon fractions in New Zealand soils. Aust. J. Soil Res. 39:465–489.
Six, J., E.T. Elliot, and K. Paustian. 2000. Soil macroaggregate turnover and microaggregate formation: A mechanism for C sequestration under no-tillage management. Soil Biol. Biochem. 32:2099–2103.
Sleutel, S., M.A. Kader, P. Leinweber, K. D’Haene, and S. De Neve. 2007. Tillage management alters surface soil organic matter composition: A pyrolysis mass spectroscopy study. Soil Sci. Soc. Am. J. 71:1620–1628.
Staricka, J.A., R.R. Allmaras, and W.W. Nelson. 1991. Spatial variation of crop residue incorporated by tillage. Soil Sci. Soc. Am. J. 55:1668–1674.
Stearman, G.K., R.J. Lewis, L.J. Tortorelli, and D.D. Tyler. 1989. Characterization of humic acid from no-tilled and tilled soils using carbon-13 nuclear magnetic resonance. Soil Sci. Soc. Am. J. 53:744–749.
Stevenson, F.J. 1994. Humic chemistry: Genesis, composition, reactions. 2nd ed. John Wiley & Sons, New York.
Tisdall, J.M., and J.M. Oades. 1982. Organic matter and water stable aggregates. J. Soil Sci. 33:141–163.
Treseder, K.K., and K.M. Turner. 2007. Glomalin in ecosystems. Soil Sci. Soc. Am. J. 71:1257–1266.
Ussiri, D.A.N., and C.E. Johnson. 2003. Characterization of organic matter in a northern hardwood forest soil by 13C NMR spectroscopy and chemical methods. Geoderma 111:123–149.
West, T.O., and W.M. Post. 2002. Soil organic carbon sequestration rates by tillage and crop rotation: A global analysis. Soil Sci. Soc. Am. J. 66:1930–1946.
Wright, S.F. 2000. A fl uorescent antibody assay for hyphae and glomalin from arbuscular mycorrhizal fungi. Plant Soil 226:171–177.
Wright, S.F., J.L. Starr, and I.C. Paltineau. 1999. Changes in aggregate stability and concentration of glomalin during tillage management transition. Soil Sci. Soc. Am. J. 63:1825–1829.
Wright, S.F., and A. Upadhyaya. 1996. Extraction of an abundant and unusual protein from soil and comparison with hyphal protein of arbuscular mycorrhizal fungi. Soil Sci. 161:575–586.
Wright, S.F., and A. Upadhyaya. 1998. A survey of soils for aggregate stability and glomalin, a glycoprotein produced by hyphae of arbuscular mycorrhizal fungi. Plant Soil 198:97–107.
Wright, S.F., K.A. Nichols, and W.F. Schmidt. 2006. Comparison of effi cacy of three extractants to solubilize glomalin on hyphae and in soil. Chemosphere 64:1219–1224.
Zobeck, T.M., T.W. Popham, E.L. Skidmore, J.A. Lamb, S.D. Merrill, M.J. Lindstrom, D.L. Mokma, and R.E. Yoder. 2003. Aggregate-mean diameter and wind-erodible soil predictions using dry aggregate-size distributions. Soil Sci. Soc. Am. J. 67:425–436.