Field Philosophy: From Dualism to Complexity Through the Borderland

Gwchimrca n Cwmtiimwo Ada Vol. 53. pp. 685-697 Copyright Q 1989 Rrpmon Flm p!c Printed in USA
00167037/89/$3.00 + .@I
Organic carbon oxidation and benthic nitrogen and silica dynamics in San Clemente Basin, a continental borderland site
MICHAELBENDER
Graduate School of Oceanography, Univemity of Rhode Island, Kingston, RI 0288 I, U.S.A.
RICHARD JAHNKE* and RAY WEISS
Scripps Institution of Oceanography, University of California, San Diego, La Jolla, CA 92093, U.S.A.
and
WILLIAM MARTIN++, DAVID T. HEGGIE*++, JOSEPH ORCHARDS and TODD SOWERS
Grsduatc School of Oceanography, University of Rhode Island, Kingston, RI 0288 I, U.S.A.
(Received February 26, 1988; accepted in revisedfonn November 22, 1988)
Aktnct-Organic carbon oxidation rates in San Clemente Besin wm &term&d by benthic chamber experiments using the Bottom Lander, along with studies of pore water chemi&y. Non-steady-state diagenetic models are developed for interp&ng concentration-time data from the benthic chamber experiments. 4, NOi, and a- 81~ all important oxidsnts for orgsnic carbon at our study site. Regenerated fixed nitrogen WBS consumed by NO; reduction. Ikerr is a tlux of NO j into the sediments, and the benthic flux of NHt is undetectable. The total rate at which fixed nitrogen is removal from the oceans at this she is about twice the flux of PON to the sea floor. Si@ fluxes calculated from interfacial pore water gradients are in satisfactory agreement with those determined using the Lander. Most sika dissolution must therefore occur within the sediment.% although interstitial profiles show that little dkolution occurs below I cm depth.
INTRODUCIION
A UNIFIED VIEW of early diageneais in pelagic sediments has developed over the last decade. Sedimentary organic carbon is oxidized Jequentially by 02, NO;, MnOz, Fe203 and SO$-. The order reflects the free energy of C, oxidation, and is manifested by a characteristic pattern of depth vari- ability in pore water concentrations of 02, NO;, Mn2+, Fti+, a-, TA (total alkalinity), TCOZ (total a), and other spe- cies (FROEUCH et al., 1979; EMERSON er al., 1980, and otbers). Concentrations of these variables covary in ways &Ming the stoichiometry of the G degradation dons (SHOL KOVITZ, 1973; EMERSON et al., 1980; MURRAY et al., 1980; GRUNDMANIS and MURRAY, 1982; BENDER ef al., 1985). In Orrich environments, relative rates at which C, is oxidized by the tierent oxidants vary depending on the C, flux to the sea floor, the secondary oxidants becoming more impor- tant as the C,,,, rain rate increases (BENDER and HEGGIE, 1984).
While many principle3 describing the early diagenesis of C, appear to be well undentood, major issues remain. In this paper, we focus on two of these. Fii we investigate relative rates at which C, is oxidized by the difknt oxidants at a sea floor site with low bottom water [OJ (56 pmol/kg) and high organic carbon rain rate. Such areas are common on the continental shelf and slope, and are globally important
Present addresses.
l Skidway Institute of Oceanography, P.O. Box 13687, Savannah, GA 31416, U.S.A. l * Woods Hole Oceanographic Institution, Woods Hole, MA
02543, U.S.A. - Bumu of Mineral Resources, Geology, and Geophysics, GPO
Box 378, Canberra, ACT 2601, Australia.
sites of C, burial, nutrient burial, denitrilkation, and tracer inputs to the ocean (e.g., HENRICHS and REEBURGH, 1987). Thus, understanding their diagenetic patterns is clearly im- portant. Second, we address two questions about the nature of benthic nitrogen dynamics. One concerns the fate of re generatad Na in pore waters and whether it diffuses out to bottom water or is oxidized within the sediment column. The second concerns the mass balance of N at our study site, which appears fairly typical of sedimentary areas believed to be important fixed nitrogen sinks (CHRISTENSEN et al., 1987).
We also focus on benthic Si@ dynamica, comparing SiO2 fluxes measured with benthic chambers and calculated with pore water chemistry, and discuss the implications for where in the sediment column Si02 is regenerated.
Our work was carried out in San Clemente Basin, a semi- enclosed basin in the central California Borderlands (Fig. 1). We measured both benthic fluxes and gradients in pore water chemistry, in order to determine fluxes across the interface as well as reaction rati as a function of depth within the sediments. The results extend our knowledge of pelagic benthic car&m, nitrogen, and SQ dynamics.
EXPERIMENTAL
Benthicjlux meawements using the Bottom Lander
bHhiC tbxe3 wm mCaSUrcd using the Bottom k&er (WEISS ef al.. 1977; JAHNKE and CHRISTAINSEN, 1989). This instrument em- places three box cores in the sediment. Lids seal the chambers, and nineteen or twenty samples are drawn from each chamber at indi- vidual, pre-programmed time intervals during a deployment. In the December 1983 and January 1985 deployments, sampks wen drawn into leucite or titanium cylinders; those drawn into the leucite cyl- inders were acidified lo pH 2 in situ during sampling. In these two deploymenU the Lander sampling system was run in a dosaJ-system, decreasing volume mode (WEISS a al.. 1977). and the water in the chamber was continuously circulated through a “transfer pump” of
685

686 M. Bender et al.
FIG. I. Map showing the location of San Clemente Basin,
about 2 liters volume. Upon retrieval, water was taken from the dis- crete time series sample cylinders and also from the water in the transfer pump when the Lander was brought on board the ship. The latter ramp&a contain water identical to that in the chamber overlying the sediments at the time circulation was stopped and the experiment terminated (shortly before the Lander was retrieved).
During the 1986 deployments, the Lander plumbing was operated in an open system, constant volume configuration (JAHNKE and CHRISTAINSEN, 1989). Samples were drawn into glass or plastic sy- ringes. The volume removed from the chamber (50 ml for each of 19 samphs) was replaced by allowing bottom water to flow through 3.2 mm I.D. tygon tubing into the chamber. This results in a small but significant dilution which was accounted for in calculating fluxes. All results have been recalculated to the vahrea which would have been obaened if tJtem had been no dilution during sampling. Samples taken in glass sytingea were found to be contaminated with respect to Sia and NH;. Therefore, data for these species are reported for plastic syringe samples and chamber waters only. [a] was measured in samplea drawn directJy into 50 ml glass syringes in situ, as well as in sampka Born 10 ml open-ended glam ampoules in line with the plastic sy&gea (The ampouka were deployed 8Jkd with deionized water.Astbe~~8lkd,5vdumesofseawatermndrawnthrough each ampouk. Because the sample is gently drawn into the bottom oftheampoule,Md~~sawatcrisdenserthaadeionizedwatcl, thl.5hing efIkie&ea are >99%.)
~tsonLoMkiJamplesarrnportcdhenforthespscies01, Na (actually NO; + NOy), NHf , FOi’, and Sia. Vital stptistia for Lander deployments are given in Table 1.
Coring
Cores were taken either by subcoring the box cores of the Bottom Lander, or with the Qu&opod. The latter is a wireline instrument which lands on the sea Boor, then takes - I m long piston cores by mechanica& driving core liner into the sediment. Lander cores and Ql&mpod cores am -ted ‘.t” and “Q1 reapecuvely.
Pore water sampling
Pore waters were sampled using three methods. Fimt, they were sampkd by conventionaJ sectioning and centifurring techniques. In an NrRlkd glove bag, sediment was extruded into centrifirge tube-s. The tubes were closed removed from the glove bae, and centrifuged; supernatant watem were fihemd through 0.4 p Nuckpore filters. Ex- truding and centrifuging were done in a cold van at in situ temper- atures. Centrifugad samplea were analyzed for Siq , NO;, NH;, and Mn+r, as well as trace metaht (not reported here).
Second, pore waters were collected by whole core squeezing (BENDER et ul., 1987). In this method, as used in our lab, a piston having tbe same diameter as core liner (2%‘) is fitted with a hole through the center and a 10 p polyester screen filter on the bottom. As it is pushed a8ainst the sediment-water interface, pore waters are
extruded sequentially according to depth below the interface. They pa5sthroughatiherandarecdkctedinviaBforanrlysis.Wecolkc& pore waten in 3 ml ahquots, coneaponding to a depth interval in the sediments of about I mm. Them experimenb thus give interf&ai pore water gradients with a very high teaolution. Tracer experiments have shown that monotonic pore water gradients, as observed here forNO~andSi02,cuefPithfullynproduadbythismdhod(BENMR et al., 1987). Whole core squeezer samples were analyzed for NO; and SiOr only. Whole con squeezing was also done at in situ tem- peratures.
In situ pore water samples were collected using an instrument based on the design of Ross Barnes, as brietly *bed by BENDER
etol.(1985).Itwasusedwithatapardcirrularstai~~sampliag probe designed and built by Steven Ememon (University of Wash- ington). In situ samples were analyzed for [SiOr] and [NIc+].
Analytical methods
Dissolved Or in Bottom Lander samples was measured by the standard Winkler technique (C+ruurr and CARpENIFR, 1966X scaled down to a IO ml sample volume. Replicate titrations were performed oneach.sample;thetitmtionerror,meaauedbytbedi&renabetwam replicates, averagal fo.746. The overall error, including titration and handling errors, was determined Born the stand& deviation of bot- tom water [Q] measurements to be 22.3%.
NO; concentrations were measured using an autoanaiyla pre- cision is kO.4 pmoljkg at the bottom water concentration. NH: con- centrations wem measured by the method of !&LORZANO (1969).
Tabk 1. Quadqd (Q) ti Iketom La&r(L) dcploymcnr lccationr.
Depbvmnt - I.adtude~ LalgirudeOK) Wua depth Cm)
Q2 l-85 320 354 1180 11.6 1882
QW 4.85 32” 35.1’ 1 lso 9.8 1920
441 4.85 320 33.6 1180 10.7 1900
Q19 l-86 320 35.0 II80 12.7’ 1800
Q7 4-86 320 35.7 1180 10.4 1920
L1.l l-85 320 35.1’ llB“9.9 1925
L1.3 l-85 32” 35.1’ 11809.9 1925
L5.1 1-86 320 35.3 1180 10.6 1919
L5.3 l-86 320 35.3 118” 10.6 1919
L17.1 1.86 320 35.3 1180 10.7 I905
LI.l 4-86 320 34.5 11809.9 1911
L15.3 4-86 320 35.0 11809.8 1920

8102 (pmollka)
120 100 200 240 280 220 0 A
ap et ~
-2 . ii
-4
Organic C, N, Siq in the San Cicmentc Basin
-s .
-a . q
-10.
Ntl3 ~mollkg)
0 s 10 1s 20 2s 0
* .
-2 0 0
-4 o
I--
0
-S
-0
0
-10
RG. 2. Pon water p&la of Si&. NO;, NHf and Mn’+ in sample collected by shiplxmrd ccntrifugation.
The precision and the detection limit were both 0.5 rmol/kg. SiG was anal@ by a slightly modiW vetsion of the method of PARSONS etal.(1984).Rsdaionwas*lrmdlk&LaadaJPmpkswcrcanalyzbd in @icate for a standard error of kO.7 rmol/ke. POE water Mn2+ anaIysa were done by atomic absorption spectrophotometry using ekctrothermal atomization. Precision is *5X
PRESENTATION AND DSCIJSSION OF THE DATA
Pore water profiles
Pore water data are plotted in Figs. 2 (centrifuge data), 3 (whole corn squeezer data), and 4 (in situ data). The Lxldbgc and whole core squeezer data show consistent trends with depth. For in situ phles, most data points define systematic trends with depth, but many samples have Sit& and NH*+ concentrations less than interpolated values. This result re- kts leakage of bottom water down the sides of the sampling probe and consequent mixing of pore water and bottom water during sampling. Samples am assumed to be diluted if both
Wh (mm)
902 (wmollkg)
687
NH3 (Ilmollkg)
O0 40 SO 120
q CUI+np -10 o"= ElfXliP
01 0 0.0 q OSHP
-20 2, .
i
0. 0
-30 0 00
0 0.
-40
FE. 4. Pore water Siq and Ns proties determined by in situ sampling using the harpoon sampler. Samples judged to have been contaminated by bottom water are enclosed in parentheau.
[NO;] and [Sia] are anomolously low. Points mgarded as anomolous are marked and are not considered in the sub sequent discussion. In addition, samples taken from 0 to 5 cm may be somewhat diluted. These samples am also ignored in the discussion below.
The diagenetic profiles are as expected for a near-shore re- gion of low bottom water [Or] and high C, rain. Unpublished O2 microelectrode profiles of RElMEPs (pers. commun.) show [02] approaching zero at a depth of 2 to 5 mm. [NO;] be&ins decreasing close to the sediment-water interface. Concave upward curvature in the [NO;]depth protiles (Fig. 3) indi- cates that there is a narrow zone of net NO, production in the upper 2 to 5 mm of the sediment column, and that de- nitrification occurs below that depth until [NO;] approaches zero at 3 to 4 cm. [Mn’+] begins increasing at a depth of about 5 mm (Fii 2). indicating the onset of MnOr reduction at, or slightly below, this depth. [NH:] begins increasing at about 5 cm depth (Fig. 4). reflecting onset of a- reduction (NHt may be produced by Mn02 and FerO, reduction, but not in sufficient quantities to account for the observed con- centrations). (NHt] rises to about 100 Ccmol/lcg at 35 cm depth; the concentration gradient decmases with depth The pore water profiles observed at San Clemente Basin are similar to those obtained elsewhere (e.g., FROELICH a al., 1979). but the sequence is condensed because of the low bottom water [OJ and high C,, rain rate prevailing at this site.
Pore water Siq concentrations increase from the bottom water value of 149 pmol/kg, reaching a value of 235 f 10 rmol/kg at 2 to 3 cm below the interface. Below this depth,
140’ . ' ' 0 10
oepth OGO
30
FE. 3. Whole core squeaer profiles of NO, and SiO, in San Ckmcntc Basin. For Si@. the protile drawn is the model fit to a profile obtained by avcmging all the data for each depth interval. For NOi, model fits to three of the plotted pro6Ies am abown: one with a relatively aknv d&t&cation rate (430: cmvc I), one with a very npid nitrikation rate (42: curve II). and one with a moderately rapid nitritication rate (Q19: curve III).

688 M. Bender n al
[SiOr] rises at a much slower rate of about 5 pmol/kg/cm. In situ sampies indicate that the asymptotic [SiO,] is 290- 360 rmol/kg. The three in situ profiles have different asymp totic values. This variation probably reflects spatial variability, but systematic dilution in profiles with lower asymptotes cannot be ruled out. The highest concentrations in the cen- trifuged samples also differ from profile to profile, as do the highest values in the whole core squeezer profiles. Again, these features probably reflect areal variability. However, the highest concentrations in the shipboard-squeezed samples (about 280 cmol/kg) are considerably less than in the in situ samples. This result undoubtedly reflects the fact that in situ profiles were taken deeper in the sediment column, where SiOl concentrations arc higher, but we cannot rule out the possibility that a pressure-dependent sampling artifact con- tributes to the difference.
In some oceanic areas of high biological productivity, pore water NHf and SiO, profiles have local minima due to the pumping activity of benthic organisms (SMITH ef al., 1987). This feature is absent in our data. A centrifuge profile shows elevated NH: concentrations in the 0 to 2 cm interval. This feature probably reflects NH: production during core re- trieval (ALLER ef al.. 1987), rather than the in sifu condition.
Fluxes and pore water concentration gradients of Mn” and NH:
Pore water concentration gradients and fluxes of Mn2’ and NH: allow us to estimate C,, oxidation rates by MnOr and
0 30 60 90
0 30 60 90
0 20 40 60 80 0 20 40 60 60
60
6
i?TTzB_
q Ampoule samples
q Syrinp samples
40 0
L15 348a q Syringe (excluded)
20 0 20 40 60 60
Time (hours)
FIG. 5. [O&time plots from Bottom Lander deployments in San Clemente Basin. Arrows show the bottom water conantmtion. Model fits to January 1986 data are shown with solid lines. For April 1986. the solid lines are the model fits assuming contamination adds a constant amount of O2 to each sample; dashed lines are model tits after excluding all points with [Oz] > [OJBw. Fitting procedures are described in the text.
0 20 40 60 60 0 20 40 60 60
0 30 60 90 0 30 60 90
0 20 40 60 60 0 20 40 60 80
Time (hours)
RG. 6. [NOi]-time plots from Bottom Lander deployments in San Clemente Basin. Arrows show the bottom water concentration. Square symbols show transfer pump cOtKxntmtions at the end of the exper- iment. Model fits, shown by solid lines, were obtained using the pro cedure described in the text.
SC$, respectively. The Mn2+ concentration gradient was es- timated from the data in the 0.75 to 2.5 cm interval of core LlElTM to be 36 - lo-’ pmol cm-“. The NHf concentra- tion gradient was estimated from data for 42 HP ( I 1- 13 cm interval), QS HP (5-13 cm interval), and Q9 HP (5-9 cm interval) as 9, 5, and 5 * lo-’ rmol cm-*, respectively (average = 6).
Apparent sediment diffusion coefficients (0,) were calcu- lated from the formula
D.3 = 0.95 * D(4OC) * I#?.
D corresponds to the di&sivity in pure H20, and 4 = po- rosity. The factor 0.95 allows for the higher viscosity of sea- water relative to deionized water, and the deionized water diffusivity at 4°C is calculated by interpolation from the data in LI and GREGORY (1974). We adopt a value of 4 = 0.85 for sediment in the Mn2’ reduction zone, and 4 = 0.80 for sediment in the (deeper) part of the core where NH: is pro- duced. The products of sediment diffusivities and pore water concentration gradients correspond to upward fluxes of 2.4 and 5.8 ctmol cmm2 yr-’ for Mn’+ and NH:, respectively. These data will subsequently be used for the calculation of C,, oxidation rates by Mn02 and So’-.
Bottom Lander data
We have obtained concentration-time data from a total of five Bottom Lander deployments in January 1985. January 1986, and April 1986. 02-time data from seven flux chamber experiments are reported in Fig. 5; NO; and SiO, data from eight experiments are reported in Figs. 6 and 7. NH: con-
Organic C, N, SK& in the San Clemente Basin 689
,43----sz 143 . L5.3.lgb ’ -
0 20 40 60 80 0 20 40 60 60
140- 14O- 0 30 60 90 0 30 60 90
140- 140- 0 20 40 60 80 0 20 40 60 60
'601
160X 140-
0 20 40 60 60
Time (hours)
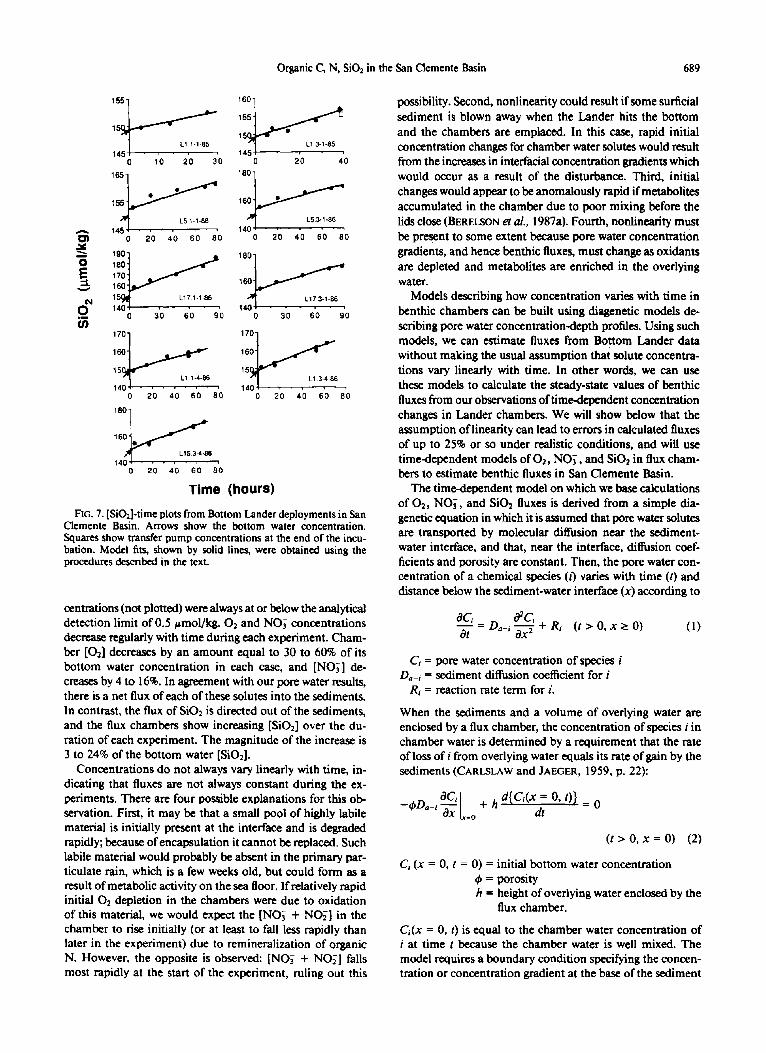
FIG. 7. [SiOJ-time plots from Bottom Lander deployments in San Clemente Basin. Arrows show the bottom water concentration. Squares show transfer pump concentrations at the end of the incu- bation. Model fits, shown by solid lines, were obtained using the procedures described in the text.
centrations (not plotted) were always at or below the analytical detection limit of0.5 rmol/kg. 02 and NO; concentrations decrcak regularly with time during each experiment. Cham- ber [O,] decreases by an amount equal to 30 to 60% of its bottom water concentration in each case, and [NO;] de- creases by 4 to 16%. In agreement with our pore water results, there is a net flux of each of these solutes into the sediments. In contrast, the flux of SiO2 is directed out of the sediments, and the flux chambers show increasing [Si02] over the du- ration of each experiment. The magnitude of the increase is 3 to 24% of the bottom water [SiOt].
Concentrations do not always vary linearly with time, in- dicating that fluxes are not always constant during the ex- periments. There are four possible explanations for this ob- servation. First, it may be that a small pool of highly labile material is initially present at the interface and is degraded rapidly; because of encapsulation it cannot be replaced. Such labile material would probably be absent in the primary par- ticulate rain, which is a few weeks old, but could form as a result of metabolic activity on the sea floor. If relatively rapid initial O2 depletion in the chambers were due to oxidation of this material, we would expect the [NO; + NO;] in the chamber to rise initially (or at least to fall less rapidly than later in the experiment) due to remineralization of organic N. However, the opposite is observed: [NO; + NO;] falls most rapidly at the start of the experiment, ruling out this
possibility. Second, nonlinearity could result if some surlkial sediment is blown away when the Lander hits the bottom and the chambers are emplaced. In this case, rapid initial concentration changes for chamber water solutes would result from the increases in interfacial concentration gradients which would occur as a result of the disturbance. Third, initial changes would appear to be anomalously rapid if metabolites accumulated in the chamber due to poor mixing before the lids close (BEREISON ez al., 1987a). Fourth, nonlinearity must be present to some extent because pore water concentration gradients, and hence benthic fluxes, must change as oxidants are depleted and metabolites are enriched in the overlying water.
Models describing how concentration varies with time in benthic chambers can be built using diagenetic models de- scribing pore water concentration-depth profiles. Using such models, we can estimate fluxes from Bottom Lander data without making the usual assumption that solute concentra- tions vary linearly with time. In other words, we can use these models to calculate the steady-state values of benthic fluxes from our observations of time-dependent concentration changes in Lander chambers. We will show below that the assumption of linearity can lead to errors in calculated fluxes of up to 25% or so under realistic conditions, and will use time-dependent models of 02, NO;, and SiOl in flux cham- bers to estimate benthic fluxes in San Clemente Basin.
The time-dependent model on which we base calculations of 02, NO;, and Si02 fluxes is derived from a simple dia- genetic equation in which it is assumed that pore water solutes are transported by molecular diffusion near the sediment- water interface, and that, near the interface, diffusion cocf- ficients and porosity are constant. Then, the pore water con- centration of a chemical species (I) varies with time (t) and distance below the sediment-water interface (x) according to
3 = at
D _. dci - + Ri a ’ ax2 (t > 0, X GZ 0) (1)
Ci = pore water concentration of species i Da-i = sediment diffusion coefficient for i
R, = reaction rate term for i.
When the sediments and a volume of overlying water are enclosed by a flux chamber, the concentration of species i in chamber water is determined by a requirement that the rate of loss of i from overlying water equals its rate of gain by the sediments (CARLSLAW and JAEGER, 1959, p. 22):
Xi -4Da-i z
+ h d{Ci(X = OY 1)) = 0
x-0 dt
(t > 0, x = 0) (2)
C, (x = 0, t = 0) = initial bottom water concentration f#~ = porosity h = height of overlying water enclosed by the
flux chamber.
Ci(X = 0, t) is equal to the chamber water concentration of i at time f because the chamber water is well mixed. The model requires a boundary condition specifying the concen- tration or concentration gradient at the base of the sediment

690 M. Bender et al
layer considered, and an initial condition, namely that the pore water profile of species i at z = 0 (when the flux chamber is emplaced) is its steady state profile. These two conditions are de&m&ted by the pore water chemistry of the solute, i. We next explain our choice of boundary and initial conditions for 02, NO;, and SiO, .
Oxygen
As noted earlier, pore water O2 concentrations approach zero within a few millimeters of the sediment-water interface in San Clemente Basin (REIMERS, pezs. commun.). Under these conditions, the appropriate boundary condition at depth in the diagenetic model for 02 is that [Oz] + 0 as x + m (m being the depth at which O2 + 0 in steady state) (EMERSON
et al., 1985). We assume that O2 is consumed at a constant rate from x = 0 to x = m (zero order kinetics). We adopt this assumption for two reasons. First, as a result of biotur- bation. gradients of organic C and ATP in the top 5 mm of the sediment column are small (JAHNKE et al., 1986; CRAVEN
et al., 1988). Second, we have no specific information on the reactivity of organic matter in the top 5 mm of these sedi- ments. Following DEVOL (1975), we aSSume that the C,, oxidation rate by O1 is independent of [02], throughout most of the 02 concentration range in the pore waters. Then, the steady-state Q profIle is derived from the solution to equation (I)with~,/~f-O,R,=-Roz,andCXx=O)equaltothe bottom water O2 concentration (JAHNKE et al.. 1982). This
pore water 02 model yields the initial condition necesmiy to generate chamber water [O&time curves using Eqns. (1) and (2) af?er tixing the sediment di!&sion coefficient for 4, the bent& Or flux, and the height of overlying water enclosed by the chamber. Because the chamber 02 concentmtion de- cteases during flux chamber experiments, the depth at which [a] approaches zero decma.~ over time. We reproduce this effect in our model by setting Ro2 (x, II+ 1) to zero when C& (x, t,) approaches zero. That is to say, the O2 consumption rate is set at zero at and below the depths where the O2 con- centration is zero. We have optimixed the fit of model [O,]- time curves to Lander data by adjusting the flux during suc- cessive model runs until the sum of the absolute deviations from the experimental [O&time curve is approximately minimixed.
We have solved Eqns. ( 1) and (2) for 02, NOi, and SiO2, with the appropriate boundary and initial conditions, using the Crank-Nicolson numerical approximation procedure (CRANK, 1975). Solutions converged adequately with At = 360 seconds and Ax = 0.0 1 cm for all three solutes. Cham- ber water concentrations and pore water profiles, as calculated from finite difference representations of the terms in Pqn. (2), satisfied the mass balance condition expressed in that equation to better than 2.5% for all time points tested in all model runs. The benthic flux calculated from chamber water vs. time curves generated by the model always agreed to within *0.5% with that calculated from the steady state pore water model. In addition, numerical results for a simple version of the model, in which the initial pore water concentration of tbesoluteiszeroandnorertctiqnoccursinporewaters,agreed with the analytical solution for that case (BENDER et al., 1987).
The fits to Oz-time data (Fig. 5) show that the model re- produces the general trends apparent in these results. How-
ever, the data themselves show considerable scatter, appar- ently due to contamination. Random contamination is apparent to some degree in all the data. Systematic con- tamination is apparent in samples taken by glass syringe (open symbols in Fig. 5) in January 1986: the first samples in these deployments, taken by syringe a few minutes a&r the cham- ber lid was closed, are generally contaminated by 02 present in the sampling lines when the Lander was deployed. Because of this systematic error in the data, fluxes were calculated after excluding points with O2 exceeding its bottom water concentration. This exclusion is admittedly arbitrary, because points lower than bottom water may have also been contam- inated. Concentrations of NOi and SiO*, which were mea- sured in samples collected in a different way from the 02 samples, are corrected for the very small effects of dilution.
A different problem appears to have affected the April 1986 02 data. At that time, ah samples were collected in ampoules which had been filled with distilled water when the Lander was deployed. The sucking action of syringes placed behind the ampoules in the sampling lines drew chamber water through the ampoules; the final aliquots were collected after the ampoules had been flushed with four volumes of chamber water. In these samples, we again observe the expected de- crease in [O,] with time, which results from respiratory O2 consumption. However, there is considerable noise in the data, resulting from a number of possible artifacts such as the presence of bubbles in the sampling train. Because of the uncertainty concerning the source of the contamination in April 1986, we report a range of fluxes for these data. The higher flux estimate for each experiment was obtained by assuming that ah samples were systematically contaminated by the same amount of 02. The lower flux estimate was made after excluding any samples with [Or] in excess of bottom water [O,].
O2 fluxes into San Clemente Basin sediments are reported in Table 2. Fluxes were estimated in two ways: using linear fits to the [O&time data, with the r = 0 point forced through the known bottom water concentration; and using fits based on the non-steady state model of the time course of chamber 02 concentration. The model predicts a decrease in the slope of [O&time curves as a flux chamber experiment proceeds. Therefore, model-calculated fluxes, which are derived from the slope at t = 0, are larger than “linear-fit” fluxes. On av- erage, they are larger by 23%. The average O2 flux into the sediments, based on data from four Lander experiments in January 1986 and three in April 1986, is 37 + 7 rmol/cm2/ yr (based on model-calculated fluxes). There is no clear dif- ference between fluxes measured during different cruises; in- stead, the variability is probably due to a combination of experimental error and spatial differences in sediment O2 demand.
The discrepancy between model-calculated and linear-fit fluxes can be important when precise flux estimates are re- quired, as in the evaluation of temporal and local areal vari- ability in fluxes. We have examined how the error in fluxes calculated from linear fits to concentration-time data is in- fluenced by two important experimental variables, the mag- nitude of the benthic flux and the height of overlying water enclosed by the flux chamber. In Fig. 8, the error (“AF/F”, the percent deviation of the linear-fit tlux from the “true”

Organic C, N, Sit& in the San Clcmente Basin 691
L 1.1
L 1.3
L 15.3
(a) (W
28 40
20 36
21 34
Januy 1986
46
32
44
35
3927
April 1986’
(a) @)
32 47
20 44
24 44
39
24
32
27 -
31*7
(8) (b)
28 41
17 37
20 34
oxygen flux) is plotted versus the per cent change in chamber [O,] during the course of a 90-hour experiment. As would be predicted, the error increases as the Or concentration change increases, becoming very large as the final concen- tration approaches zero. The surprising result is that a large concentration change is not required to produce significant nonlinearity: when the height of overlying water enclosed by the chamber is small, significant errors in fluxes calculated
0’ 1 I 1 1
0 25 50 75 100
% AC/C( bw)
FIG. 8. Error in flux estimates when the flux is calculated from a linear fit to the flux chamber concentration vs. time data: examples using O2 as a model solute. The horizontal axis is the percent change in chamber water concentration during the experiment; the vertical axis is the percent deviation of the “linear fit” flux from the true Or flux. The range of fluxes considered is 5 to 50 rmol/cm’/yr, the range of overlying water heights is 5.7 to 14. I cm (the range encountered in San Ciemente Basin deployments). Bottom water [Or] at the start of model runs is 56 rmoljlcg (the San Clemente Basin value). Tie lines connect results from model runs using the same flux (its value is written next to the line) and different overlying water heights.
FIG. 9. Error in flux estimates when the tlux is calculated from a linear fit to chamber water concentration vs. time data: examples using experimental conditions encountered during Bottom Lander deployments in San Clemente &sin. Axes are the Same as in Fii 8.
from linear fits occur at concentration changes as low as 20%. The effects observed in the hypothetical cases examined in Fig. 8 carry over to other solutes (SiOz, N05) under the ex- perimental conditions encountered in San Clemeute Basin depIoyments (Fig 9).
Nitrate
We must build a pore water NO; model explaining the major features of SCB protiles in order to apply the flux chamber model to SCB Bottom Lander data Pore water Na- profiles show that a layer of net nitrate production (with d’C/dx’ < 0) overlies a layer of net nitrate consumption (with d2C/dx2 > 0). If the depth of the boundary between the layers is xN, then, using the notation of Eqn. (l),
RNOJ = kN (x < xN)
R NO3 = -kDcNos (x > XN] (3)
kN = nitrification rate constant; nitrification is assumed to be zero order with respect to CNo3
kD = lint order denitrification rate constant.
Boundary conditions specify continuity of flux and concen- tration at depth xN, and that CM, + 0 as x + 00. Using these conditions, the steady state NO; profile is obtained by solving equation (1) with X’,/& = 0, R, as specified by Eqn. (3), and C, (x = 0) set at the bottom water concentration. This particular model and its solution have been discussed in detail by JAHNKE et al. (1982). We have fit this model to pore water NO; protiles using a nonlinear least squares tech- nique (BEVINGTON, 1969) with kN, kD, and XN as fitting pa-
rameters. The sediment diffiion coefficient for NOS was calculated, as described above, to be 7 - 10m6 cm’/sec. The range of best-fit model protiles is shown in Fig 3; best-fit model parameters are listed in Table 3. The calculated ni- trification rate in the upper zone varies considerably from profile to profile, probably because of the difficulty inherent in measuring and modelling rapidly changing gradients near the sediment-water interface. The range of nitrification rates explaining our pore water profiles is 2 to 7 fimol/cm’/yr, with

692 M. Bender ef al.
an average of 4 + 2. The denitrification rate is better con- strained by the data, its average being 7 f 2 rmol/cm2/yr.
The pore water NO; model with &C/at not equal to zero (transient state model) was used to calculate fluxes from Bot- tom Lander concentration-time data using numerical solu- tions to Eqns. (1) and (2), the appropriate boundary condi- tions at x = X~ and x - 00, and the nitrate profile at t = 0 given by the steady state model. &03 (bottom water) was set at the measured value of 4 1.8 rmol/kg. Three additional pa- rameters (k,, k,, and XN) had to be specified. Fixing the benthic flux for a given model run determined one of them, given values for the other two. We fixed xN and kD at the average values obtained from fits to pore water data, allowing kN to be determined by the flux chosen. This procedure is admittedly somewhat arbitrary, but gives benthic flux values which am insensitive to input values of& and kD. The reason for this insensitivity is that the chamber [NO;]-time data fix the best-fit flux vahtes; the calculated kN &dues conform to the best-fit flux and the selected xN and kD values. In other words, whatever values of xN and kD are adopted, the best fit value of kN will give essentially the same [NO;]depth curve. Another potential problem is that, contrary to our assumption, XN migrates during the incutxltion. We caktdated that the change in xN was about 0.03 mm or k?ss, and would not affect our calculated fluxes. Best-tit fluxes were obtained by varying the flux to optimize the fit of model (NO&time curves to the data (the approach was the same as that de- scribed previously for 02). Model fits are shown in Fig. 6; no systematic discrepancies between model curves and experi- mental data are apparent.
The average tlux derived from these data using the time- dependent model of benthic chamber experiments is 5 + 2 rmol/cm2/yr, directed into the sediments; this average ex- ceeds the average linear-fit flux by about 17% (Table 4). As was the case for 02, there is no clear time variability in the benthic NO; flux (January and April values are not distin- guishable). We also report NO; tluxes calculated from our high-resolution pore water profiles. As noted earlier, we can- not calculate theNO; flux from pore water data very precisely because the presence ofa thin net nitrification layer (2-5 mm thick) results in rapid changes in pore water NO; gradients immediately below the sediment-water interface. Within the limits of our precision, the nitrate fluxes calculated from pore water data (3 + 2 rmol/cm’/yr into the sediments) agree with the Lander data (5 f 2 amol/cm2/yr).
Silicate
The time-dependent model describing Lander Si02 data was applied in the same way as the 02 and NOi models. The steady state profile, used as the initial condition for model runs. was obtained by solving Eqn. (1) with XI’,/& = 0, Cs,oZ approaching the asymptotic SiO2 concentration (C,) as .Y+ 3c, and
&a02 = ks(Ceq - Cs,ozJ (4)
(k, is the Si02 dissolution rate constant). This steady state model faithfully reproduces the pore water profiles deter- mined using the whole core squeezer (Fig. 3). Using Dp_s,02 = 4. 10eh cm2/sec (based on the discussion in SCHINK et al., 1975). we obtained ks = 8 +- 5 - 10m6 rmol/cm’/sec and Cc9 = 235 + 10 rcmol/L from fits to our pore water data (Table 5). We adopted this average value of C, for calculating benthic Si02 fluxes from the Lander chamber [Si02]-time data, using the time dependent model (Eqns. I and 2). (As
noted earlier, this value of C, is not really a true asymptotic value: the concentration increases slowly below 3 to 4 cm depth.) Next, when a trial value for the flux was chosen prior
to each model run, ks was calculated from the model expres- sion for the steady-state SiOz flux (Eqn. 4). Model [Si02]- time curves were obtained from numerical solutions to Eqns. (I), (2), and (4) with the appropriate boundary conditions and with the initial Si02 distribution calculated from the steady state model.
Model curves conformed well to the shape of experimental curves in January 1985 and April 1986 (Fig. 7). However,
I (1s
4.HS
I X6
.I X6
I kS
I Rh
4-M’
0.11
2 0
42
4.7
36
04
59
2.1
36
5.7
39
5.7
4.1

Organic C, N, SiOl in the San Clemente Basin 693
@ 6.6 x 10⁻⁶ 232
Qs 2.6 x lo-6 253
430 13 x 10-6 226
Q4l 15 x 10-6 232
Q l9 4.1 x 10⁻⁶ 229
47 6.2 x 10⁻⁶ 238
Ave.: 8.0 + 4.9 x 10⁻⁶ 235+ 10
[SiOr]-time data from January 1986 show curvature at early time points greatly in excess of that predicted by the model. A possible explanation of this curvature is that mixing be- tween samples occurred, causing early samples to mix with later samples and vice-versa. This possibility was eliminated prior to April 1986 by the insertion of check valves into the sampling lines, and the excess [SiO+time curvature is not apparent in the April 1986 data.
If this mixing affected SiO, concentrations, it should also have affected [NO:] measured in the same samples. Thus, A[SiOr], ([SiOr] at time t minus [SiOr] in bottom water) should be linearly related to A[NO&, and the line should pass through the origin. The two are linearly related, however, when the line is extrapolated to zero A[NO;], A[SiO*] remains significantly greater than zero. We conclude that mixing between samples may explain some of the curvature in [SiOz]-time plots, but another (unknown) artifact caused a rapid increase in [SiOz] early in the deployment during the January 1986 experiments. Because of the uncertainty in the appropriate [SiOr] at t = 0 in January 1986, model fits to the data were calculated adopting the value for [SiOZ] (t = 0) obtained by a linear fit to the [SiOz]-time curves, rather than to the bottom water value. The average SiOr flux out of the sediments calculated from January 1986 deployments in this way is 20 + 6 ~mol/cm*/yr, which is in good agreement with the overall average value.
The average Si02 flux obtained From model fits to Lander data is 18 + 5 Ccmol/cm*/yr (directed out of the sediments), a value 20% greater than that calculated from linear fits to the same data (Table 6). For comparison, the range of fluxes determined from pore water data is 18 to 27 crmol/cm*/yr. The lower estimate was obtained from straight line fits to the first three [SiOz] values below the sediment-water interface; the higher estimate was calculated from model parameters explaining the pore water Si02 profiles.
NITROGEN DIAGENESIS
In this section, we first discuss the various diagenetic pro- cesses involving nitrogen which are occurring in San Clemente Basin, then estimate fluxes associated with each process. We then compare benthic nitrogen fluxes in San Clemente with
fluxes estimated for two other Borderland Basins by BER- ELSON et al. (1987b).
Figure 10a presents a schematic diagram of benthic nitro- gen cycling in the San Clemente Basin. There is a net flux of NOi from bottom water into the sediments. This downward flux of NO; is augmented by nitrification of NH: produced by oxidation of organic matter in the Or reduction zone of the sediment column. NO; originating both from the ben- thic flux and from nitrification diffises down into the NOS reduction zone, where it oxidizes both sedimentary organic matter and NH: diffusing up from below (see the following discussion). Fe*’ may also be oxidized in this way, but fluxes would be negligible. The NH: thus oxidized by NO; is pro- duced by organic matter oxidation in the SOi- reduction zone.
Release to bottom water of NHt produced by oxidation of sedimentary organic matter in the O2 reduction zone is omitted from the paradigm because it is probably unimpor- tant, as judged using Lander data. Consider the extreme as- sumptions that organic matter being oxidized has the Redfield C/N (= 106/16), that N is quantitatively transformed to NH: during organic matter oxidation, and that there is no nitrification occurring either in the sediments or in the chamber water. In this case, [NH:] in the chambers would linearly covary with [4], and A[NHZ]/A(02] would equal - 16/ 106. NH: concentrations were measured in all benthic flux samples and were below the detection limit of 0.5 pmol/ kg. The upper limit of the chamber NH: concentration is up to a factor of six less than the value which would be found if all regenerated N,, were returned to bottom water as NH:. BERELSON et al. ( 198713) reached a similar conclusion.
Table 6. A comparison of Si% fluxes aoss the sediment-water interface in the San Clemcnte Basin using data &tamed by whole wm squeezing and from bell-jar cxpaiments using the Bottom Lander. “Model” fluxes fmm WCS data are based on model pamwms derived frcm least squares tits to the data %!I&’ fluxes are calcula
2 fmm linear fits to conceuaion vs. time data. All fluxes are given in units of
pmol!c ryr.
SiO2 flux from WCS data SiO2 flux from Lander data
Core No. or landerchamber MaMfit Linearfit hJcdelf4 Linear fit
l-85
4-85
l-86
4-86
l-85
l-86
4-86
Qz
L1.l -12 -11
L1.3 -13 -12
15.1 -17 -15
L5.3 -14 -12
L17.1 -29 -23
L17.3 -18 -21
LI.1 -19 -17
L1.3 -18 -17
L15.3 -20 -16
-25 -18 -19 -11
-33 -19
-38 -19
-21 -18
-26 -18
- - ~ - Average: -27i7 -18k4 -18k5 -15+5

694 M. Bender et al.
Nitrogen balance
83PoN 4 7 NO% 9.0 N2
6 + I 02 raductlon
ton. 23PC+J+O2+ 23NO3.
.
8OPW 7 N03- 90N2
+ +
N03- reduction 11 PON+65N03- + 76N2
*ona OBNH3+0.5MO3~ + 1.4N2
t
4.9 FON 0.9 NH3
Carbon balance
b
70.4 POC (erg) 45.4 dlss. CO2
+
02 red. zon. 31 0 erg c + 02 * 31.0 co2
4
39 4 POC (erg)
N03- rod. x.0”. 7.3 erg C + N03- + 7.3 CO2 + N2
t
32 1 POC (or@
12orpC+Mn02 * 1.2co2+Mn*+
HIlO2 rod. zon. 4
30.9 Pot (cq)
+ I 5.9 erg c + SO4 --* 5.9 co2 + s-.
SO4-- rod. lo”. I
Burlrl 25 PO’.? (ofg)
Oxygen balance
rpamc (C + N) .36.0 02 d36.0 CO2 + N03-
Mrl++ l 12 02 -eMnO I 2 4 tArI+*
FIG. 10. Mass balances of nitrogen, organic C, and 4 in San Clcmente Basin sediments. Units are pmol/cm’/yr except for the flux of N2, which is expressed in units of pgm atoms/cm’/yr to allow for direct comparison with fixed nitrogen tluxes.
We conclude from this result that NH: produced by organic matter remineralization is excreted within the sediment col- umn as a result of otganic N remineralixation, but is rapidly oxidized to NO; by 02. We dismiss an alternative explana- tion-rapid nitrification within the overlying water in the benthic chamber-because one must invoke sedimentary ni- tri6cation in order to account for the sedimentary denitrifi- cation rate calculated from the pore water N% gradients.
A nitrogen pathway of unknown importance is transport of DON actuas the sediment-water inter&e. As noted earlier, very high DON concentrations have been observed in pore waterq raising the possibility that otganic nitrogen is recycled to bottom water rather than being completely reminemlixed in the sediments (HENRICHS and FARRINGTON, 1979; HEN-
RICHS, 1980; HEGGIE et al.. 1985). We have attempted to measure the DON flux across the interface, but wen unable to do so for several reasons. Fii our results for pore water determinations were highly sensitive to the sample collection method. Second, even if we had good pore water data, we would be unable to calculate tluxes, because the value of the diffusion coefficient is unknown due to uncertainties in the size of the DOC molecules (ELDERFIELD, 1981). Third, our unpublished DON concentration increases measured in Lander chambers are equivocal. On the one hand, resuspen- sion may cause the increase to be anomalously large. On the other hand, our procedure, utihxing the persulfMe oxidation method of GRA~~HOW et al. (1983) and NYDAHL (1978), may underestimate [DON) (YoSHlMl ef al., 1985). As a mault

wnic C, N, Si@ in the San Clemcntc Basin 695
of all these problems, we report no DON data and, for the sake of discussion, assume that DON Buxes am small relative to those of NHt and NO;. This important problem clearly must be addms& by future work.
The schematic outlined in Fii 1Oa suggests that NO; ox- idizes NH: which diffuses upwards after being produced by organic matter oxidation in the a- reduction zone. The evidence for this reaction is that [NHt] starts rising at a depth in the sediment below whem NO; goes to zero (Fii. 2-4). This result is not pecuhar to San Clemente Basin pore waters but is in fact common (BENDER et al., 1977; EMERSON et al.,
1980; REIMERS and SMITH, 1986). Furthermore, the tlux of NOi down to the horizon where NHt disappears is always sufficient to oxidize the M4+ d&sing up. The only other plausible mechanism for removing the NH*+ is oxidation by Oz. However, in San Clemente Basin and other sites we be lieve that the downward flux of 02 is negligible at the depth where NH: disappears.
A tentative mass balance for N is presented in Fa 1Oa. Burial is estimated from the sediment accumulation rate of 15 mg/cm’/yr (S~HWALBACH and G~RSLINE, 1985), the C,, concentration of 2.0% by weight (R. JAHNKE, unpublished data), and an assumed C/N of 106/16. We made our mass balance assuming that transport of DON is negligible, that dissolved inorganic N produced by organic matter remin- eralixation is quantitatively oxidized to NO;, and that con- centrations and fluxes of inorganic N species are negligible except for NH:, NO;, and NI .
For 02 oxidation, we can calculate the C:N ratio in the organic matter being oxidixed from pore water and bent& flux data. To explain this calculation it is 8rst necesmry to digmss and constrain the @ balance (Fs 1Oc). The average bent&. tlux is 37.2 pmol/cm’/yr (for the sake ofconsistency, we carry along one figure after the decimal). Of this, 1.2 is consumed in oxidizing Mn’+, and 36 in oxidizing C,. The nitri8cation ram (2.3 rcmol/cm’/yr) is calculated from the difference between the NO, reduction rate of 7.0, calculated from pore water data, and the benthic flux of NO; into the sediments (4.7) measured with the Lander. These values cor- respond to a C/N of 106/7.8 assuming C:H:O of 1:2: 1. (This C/N ratio is determmed from the small differena in two huge numbers, and has a large uncertainty.)
Reaction stoichiometries invoked for organic carbon ox- idation by NO,, MtQ, and ?& are as assumed by FROE
LICH et al. (1979) (C:N = 106/16 and oxidation of NW to N2 during NO; reduction). Calculated fluxes for oxidation by NO;, MnG , and a- are rather insensitive to the choia of c/N ratio.
The NHt production rate in the a- reduction zone, and its flux into the NO; reduction zone, are calculated from the NHt flux estimated earlier. We assume that an appropriate amount (0.5 ~mol/cm’/yr) of the NO; diffusing into the NO; reduction zone is consumed in quantitatively oxidizing NHt to N2, according to the reaction
5NH: + 3NO; + 20H- + 4N2 + 11 H20.
The remainder (6.5) is used to oxidize organic matter to CQ and N2 according to the stoichiometric relationship outlined above.
The main processes responsible for organic nitrogen deg- radation are organic matter oxidation by Or, NO;, and a-. Production by Mn@ ted&on is minor and is ne glected, and production by Fe20a is likely to be negligible also (BENDER and HECGIE, 1984). According to our mass balance, no more than half of the nitrogen in organic matter being oxidized by ol may be exported to bottom water as DON. The remainder is ultimately converted to N2, as is all dissolved nitrogen produced by NO;, so’,-, and MnOr re duction. The benthic flux of NO; into the sediments is at least twice as great as the DON flux out. Therefore diagenesis involves a net tlux of fued nitrogen into the sediment column at San Clemente Basin. This flux in, together with consump tion of fixed inorganic nitrogen within the sediment column, is balanced by export of N2 to bottom water. Finally, the NW burial rate is about 4 amol cm-’ yr-‘, or roughly half the rain to the sea floor. If we repeat the calculations assuming a C/N ratio of 106/7.8 for buried organic matter, we calculate that the rain rate is 6.3, the burial rate is 2.0, and 3 1% of the rain is buried.
From these results, it is clear that, in San Clemente Basin sediments, the total removal rate of tixed inorganic nitrogen from the oceans by burial plus denitrification must be gmater than the rain rate to the sea floor. The removal rate of tixed N by denitri6cation is 9 m atoms/cm’/yr. The total removal is then 13 pm01 cm-’ yr-‘, or roughly 1.5 times the PON rain of 8.3. BERELMN et al. (1987b) also found that fixed N removal at the sea floor exceeded the PON rain in San Pedro and San Nicholas Basins. We have used their data to calculate the rate of organic N burial (taken as C,,,, burial X l/7, using their adopted stoichiometry), and the PON min rate (taken as the N_ burial rate plus the rate of NH*+ production and denitri8cation: Table 7, RS in their paper). For San Pedro Basin, we calculate a PON rain rate of 25 Ccmol/cm’/yr and a fixed N removal rate (- PON rain rate + NO; reduction rate) of 54. For San Nicholas Basin, we calculate a PON rain of 18 and a 8xed N removal rate of 33. For these two basins, the fixed N removal rate is on average two times the PON rain, a value even higher than that found for San Clemente.
In many regions of the continental shelf and slope, patterns oforganicnitrogendiagenesismustbesimilartothatobserved here. For example, JAHNKE ef al. (pm. commun.) have ob served even more intense tixed N consumption in Santa Monica Basin. Our results thus emphasixe the point that de- nitrification in deep marginal environments may play a very large role in the global mass balance of tixed nitrogen.
ORGANIC CARBON OXIDATION RATES BY THE DIFFERENT ELECTRON ACCEPTORS
Using results from the preceeding section, we have cal- culated rates at which organic carbon is oxidized by the var- ious electron acceptors. Assumed stoichiometries are as out- lined earlier. The oxidation rate by O2 is computed using the rate of Or consumption by C,,, oxidation (36: Fw lob), and the C/N ratio of 106/7.8 computed earlier in the discussion of the nitrogen balance. The corresponding rate of C, oxi- dationby02is31.
The downward flux of NOi is 7 rmol/cm’/yr. 0.5 rmol/ cm2/yr is consumed in oxidizing NHt. The remaining

696 M. Bender et al.
NO; flux of 6.5 Ctmol/cm2/yr is consumed by oxidizing C,, at the rate of 7.3 ctmol/cm’/yr.
The rate of organic carbon oxidation by Mn4 can be computed from the upward flux of Mn2+ (2.4 ~mollcm’lyr). According to this flux and the stoichiometry, Mn02 oxidizes C,, at the rate of 1.2 rmo1/cm2/yr.
The upward flux of NH: is 0.9 rmol/cm’/yr. Assuming all this NH: is generated by Sa- oxidation of organic matter with a C/N = 106/16, the rate of organic carbon oxidation by Sd- is 5.9 ~mollcm’lyr.
Neglecting FeZOj reduction, which was not measured and is probably minor (BENDER and HEGGIE, 1984), the total
rate of C, oxidation is 45 Ctmol/cm’/yr. 68% of the recycled C,, is oxidized by Or, with NO; and Sa- oxidizing nearly all of the rest. At the pelagic and hemipelagic MANOP sites, for comparison, degradation rates ranged from 2 to 14 pmoll cm’/yr and O2 oxidized more than 90% of the organic matter reaching the sea floor. Our results for San Clemente Basin extend the trend observed earlier: as the organic matter rain to the sea floor rises, the secondary oxidants (those other than 02) are responsible for remineralizing an increasing fraction of the organic carbon.
The burial rate of C,, can be estimated from the sediment accumulation rate in San Clemente Basin (15 mg/cm’/yr: SCHWALBACH and GORSLINE, 1985) and the sedimentary C, concentration of 2% (JAHNKE, unpublished data) to be 25
rmol/cm’/yr. Given this number and the total C,, remin- eralization rate (45 ~mol/cm’/yr), we calculate that 64% of the POC raining to the sea floor is remineralized and 36% is buried. This value of the “burial efficiency” is high; the values in San Pedro and San Nicholas Basins are even higher (63% and 5746, respectively: BEREISON er al., 1987b). The higher
burial efficiencies for San Pedro and San Nicholas Basins can be attributed to a combination of higher sedimentation rates, higher POC ram to the sea floor, and lower bottom water 02 concentrations.
BENTHIC SILICA RECYCLING
The average benthic flux of SiO, measured with the Lander is 20 rmo1/cm2/yr. The average flux determined from the interfacial pore water gradients is 18 to 27, depending on how it is calculated. Benthic fluxes measured with chambers include dissolution at the sediment-water interface, while fluxes calculated from pore water gradients include only dis- solution below 2 to 3 mm depth in the sediments. The sim- ilarity of the two sets of numbers indicates that most biogenic SiOr dissolves integrally within the sediments, with little dis- solution at the interface.
The benthic SiO, flw measured by BERELSON d al. (1987b) for both San Pedro and San Nicholas Basins was 26 rmol/ cm2/yr. They found that 10% of the biogenic SiO2 survived to be buried. Assuming the same is true for San Clemente, we calculate biogenic Si02 rain rates as 22 for San Clemente and 28 for San Pedro and San Nicholas. The ratio of the biogenic SiO2 rain to the POC rain rate is then 0.3 1 for San Clemente, 0.16 for San Pedro, and 0.23 for San Nicholas. It is unlikely that the similarity in ratios (to within 235%) is fortuitous. We believe it indicates that biogenic detritus of a similar composition is reaching the sea floor throughout the California Borderland.
Acknowledgements-We are indebted to many people who helped with varied aspects of this work. Along with R.W. and R.J., A. Krause, T. Lillie, 0. Kirsten, F. Mansir, and M. Christainsen designed, built, maintained, and deployed the Bottom Lander. The Mastem and crews of R/V New Horizon and R/V Melville provided sea@ng support. S. Emenon, D. McCorkle, D. Archer, C. Reimens, and T. Shaw par- ticipated both in the field work and in many discussions about the interpretation of the data. D. Cullen and D. Kahn provided analytical assistance. Three reviewen, B. Boudreau, D. Hammond, and D. McCorkle, made extensive comments which helped us improve the manuscript. This research was supported by the National science Foundation.
Editorial handling: E. R. Sholkovitz
REFERENCES
ALLER R. C., HALL PER 0. J. and RUDE P. D. (1987) Solute distri- butions and flux estimates in bioturbated sediments of the Panama Basin (abstr.). Eos 68, 1749.
BENDER M. L. and HECCIE D. T. (1984) Fate of organic carbon reaching the sea floor: A status report. Geochim. Cosmochim. Acfa 48,977-986.
BENDER M. L., FANNING K. A., FROELICH P. N., HEATH G. R. and MAYNARD V. (1977) Interstitial nittate protiles and oxidation of sedimentary organic matter in the Eastern Equatorial Atlantic. Science 19% 605-609.
BENDER M. L., HUDSON H., GRAHAM D. W., BARNES R. 0.. LEINEN M. and KAHN D. (1985) Disgcnesis and convection m&ted in pore water chemistry on the western tlank of the East Pacific Rise, 20 degrees south. Earth Planet. Sci. LetI. 76.71-83.
BENDER M., MARTIN W., HEXS J., SAYLES F., BALL L. and LAMBERT C. ( 1987) A whole core squeaer for inte&cial porn water sampIin& Limnol. Oceanog. 32, 12 14- 1225.
BEREL.SON W. M., BUCHHOLTZ M. R., HAMMOND D. E. and SANTS CHI P. H. (1987a) Radon guxes measured with the MANOP got- tom Lander. Deep-Sea Res. 34, 1209-1228.
BEREL.SON W. M., HAMMOND D. E. and JOHNSON K. S. (1987b) Benthic fluxes and the cycling of bio8enic silica and carbon in two southern California botde&nd basins Geochim. Cosmachim. Acta 51, 1345- 1363.
BEVINGTON P. R. (1969) Daa Reduction and Error Analysis/or rhe Physical Sciences. McGraw-Hill, New York.
CARLSLAW H. S. and JAEGER 1. C. (1959) Conduction of Hear in Solids (2nd edn.). Oxford University Press, Oxford, 5 IOp.
CARRI-I-~ D. E. and CARPENTER J. H. (1966) Comparison and eval- uation of currently employed modifications of the Wmkler method for determining dissolved oxygen in seawater, a NASCO report. J. Mar. Res. 24.286-3 18.
CHRISTENSEN J. P., MURRAY J. W., DEVOL A. H. and COD~SPOTI L. (1987) Denitritication in continental shelf sediments has major impact on the oceanic nitmtpm bu&t. Global Biogecxhem. Cuzles 1,97-l 16.
CRANK J. (1975) The Mathematics ofDlQ7iiion. Oxford Univ. Press, Oxford.
CRAVEN D. B., JAHNKE R. and CARLUCCI A. F. (1988) Fine scale vertical distribution of microbial biomass and activity in California Borderland sediments. DeepSea Res. 33, 379-390.
DEVOL A. H. ( 1975) Biolo&al oxidation in oxic and anoxic marine environments, rates and process. Ph.D. thesis Univ. Washington, 208~.
ELDERFIELD H. (198 I) Metal-organic associations in interstitial waters of Nanagansett Bay sediments. Amer. J. Sci. 281, 1184-I 1%.
EMERSON S., JAHNKE R., BENDER M., FROELICH P.. KUNKHAMMER G., BOWSER C. and SETL~CK G. (1980) Early diageneais in sedi- ments from the Eastern Equatorial Pacific. I. Pore water, nutrient, and carbonate results. Earth Planet. Sci. Left. 49, 57-80.
EMERSON S., FISCHER K.. REIMERS C. and HEXXIE D. (1985) Organic carbon dynamics and preservation in deep-sea sediments. Deep- Sea Res. 32, l-2 1.
FROELICH P. N., KLINKHAMMER G. P., BENDER M. L., LUEDTKE N. A., HEATH G. R., CULLEN D., DAUPHIN P., HARTMANN B. and MAYNARD V. (1979) Early oxidation of organic matter in

Organic C, N, SiO, in the San Clemente Basin 697
pelagic sediments of the Eastern Equatorial Atlantic: Suboxic dia- genesis. Geochim. Cosmochim. Acta 43, 1075-1090.
GRASSHOFF K., EHRHARDT M. and KREMLING K. (1983) Methods ofSeawater Analysis. Verlag Chemie Gmblt.
GRUNDMANIS V. and MURRAY J. W. (1982) Aerobic respiration in pelagic marine sediments. Geochim. Cosmochim. Acta 46, 1 lOl- 1120.
HEGGIE D. T., HUDSON A. and RSCHER K. (1985) Dissolved organic matter in pore waters of deepsea sediments (abstr.). Eos 66,132s.
HENRICHS S. M. (1980) Biogeochemistry of dissolved free amino acids in marine sediments. Ph.D. dissertation, Massachusetts In- stitute of Technology-Woods Hole Oceanographic Institution.
HENRICHS S. M. and FARRINGTON J. W. (1979) Amino acids in interstitial waters of marine sediments. Nature 279, 3 19-322.
HENRICHS S. M. and REEBURGH W. S. (1987) Anaerobic mineral- ization of marine sediment organic matter: Rates and the role of anaerobic processes in the oceanic carbon economy. Geomicro- biology .I. 5, 191-237.
JAHNKE R. and CHRISTAINSEN M. (1989) A free vehicle benthic chamber instrument for sea floor studies. Deep-Sea Res. (in press).
JAHNKE J. R., EMERSON S. R. and MURRAY J. (1982) A model of oxygen reduction, denitrification and organic matter remineral- ization in marine sediments. Limnol. Oceanogr. 27,610-623.
JAHNKE R. A., EMERSON S. R., COCHRAN J. K. and HIRSCHBERG D. (1986) Fine scale distributions of porosity and particulate excess *“‘Pb, organic carbon and CaCq in surface sediments of the deep equatorial Pacific. Earth Planet. Sci. Lett. 77,59-69.
LI Y.-H. and GREGORY S. (1974) Diffusion of ions in sea water and in deepsea sediments. Geochim. Cosmochim. Acta 38,703-7 14.
MURRAY J., EMERSON S. and JAHNKE R. ( 1980) Carbonate saturation and the effect of pressure on the alkalinity in interstitial waters
from the Guatemala Basin. Geochim. Cosmochim. Acta 44,963- 972.
NYDAHL F. (1978) On the peroxodisulfate oxidation of total nitrogen in waters to nitrate. Wat. Res. 12, 1123- 1130.
PARSONS T. R., MAITA Y. and LALLI C. M. (1984) A Manual of Chemical and Biological Methods for Seawater Analysis. Perga- mon, New York.
REIMERS C. E. and SMITH K. L. JR. (1986) Reconciling measured and predicted fluxes of oxygen across the deepsea sediment-water interface. Limnol. Oceanogr. 31,3053 18.
SCHINK D. R., GUINAS~O N. L. JR. and FANNING K. A. (1975) Pro cesses affecting the concentration of silica at the sediment-water interface of the Atlantic Ocean. J. Geonhys. Res. 80.30 13-303 1.
SCHWALBACH J. R. and GORSLINE D. S. (1985) Holocene sediment budgets for the basins of the California Continental Borderland. J. Sediment Petrol. 55, 829-842.
SHOLKOVITZ E. (1973) Interstitial water chemistry of Santa Barbara Basin sediments. Geochim. Cosmochim. Acta 37.2043-2073.
SMITH K. L. JR., CARLUCCI A. F., JAHNKE R. and CRAVEN D. B. (1987) Organic carbon mineralization in the Santa Catalina Basin: Benthic boundary layer metabolism. DeepSea Res. 34, 185-2 11.
S~LORZANO L. ( 1969) Determination of ammonia in natural waters by the phenol hypochlorite method. Limnol. Oceanogr. 14,799- 801.
YOSHIMI S., SUGIMURA Y. and ITOH T. (1985) A catalytic oxidation method for the determination of total nitrogen dissolved in see water. Mar. Chem. 16, 83-97.
WEIRS R. F., KNTEN 0. H. and ACKERMANN R. (1977) Free vehicle instrumentation for the in situ measurement of processes con- trolling the formation of deepsea ferromangenese nodules. In Oceans ‘77 Conference Record, Marine Technology Society, 2,44D, 1-4.
Copyright © 2022 FDOKUMEN