Oral Radiology - e-Book version to be sold via e-commerce site
656
-
Upload
khangminh22 -
Category
Documents
-
view
1 -
download
0
Transcript of Oral Radiology - e-Book version to be sold via e-commerce site


Oral RadiologyP R I N C I P L E S
a n d I N T E R P R E T A T I O N

To access your Student Resources, visit:
http://evolve.elsevier.com/White/oralradiology/
Evolve ® Student Resources for White/Pharoah: Oral Radiology: Principles and Interpretation, 6th Edition, offer the following features:
• Web Resources
• Suggested Reading Lists
http://evolve.elsevier.com/White/oralradiology/

Oral RadiologyP R I N C I P L E S
a n d I N T E R P R E T A T I O N
Sixth Edition
STUART C. WHITE, DDS, PhDDistinguished Professor
Section of Oral and Maxillofacial RadiologySchool of Dentistry
University of California, Los AngelesLos Angeles, California
MICHAEL J. PHAROAH, DDS, MSc, FRCD(C)Professor, Department of Radiology
Faculty of DentistryUniversity of Toronto
Toronto, OntarioCanada

11830 Westline Industrial DriveSt. Louis, Missouri 63146
ORAL RADIOLOGY: PRINCIPLES AND INTERPRETATION ISBN: 978-0-323-04983-2Copyright © 2009, 2004, 2000, 1994, 1987, 1982 by Mosby, Inc., an affi liate of Elsevier Inc.
All rights reserved. No part of this publication may be reproduced or transmitted in any form or by any means, electronic or mechanical, including photocopying, recording, or any information storage and retrieval system, without permission in writing from the publisher. Permissions may be sought directly from Elsevier’s Rights Department: phone: (+1) 215 239 3804 (US) or (+44) 1865 843830 (UK); fax: (+44) 1865 853333; e-mail: [email protected]. You may also complete your request on-line via the Elsevier website at http://www.elsevier.com/permissions.
Notice
Neither the Publisher nor the Authors assume any responsibility for any loss or injury and/or damage to persons or property arising out of or related to any use of the material contained in this book. It is the responsibility of the treating practitioner, relying on independent expertise and knowledge of the patient, to determine the best treatment and method of application for the patient. The Publisher
Library of Congress Cataloging-in-Publication Data
Oral radiology : principles and interpretation / [edited by] Stuart C. White, Michael J. Pharoah.—6th ed. p. ; cm. Includes bibliographical references and index. ISBN 978-0-323-04983-2 (pbk. : alk. paper) 1. Teeth—Radiography. 2. Jaws—Radiography. 3. Mouth—Radiography. I. White, Stuart C. II. Pharoah, M. J. [DNLM: 1. Radiography, Dental. WN 230 O63 2009] RK309.O7 2009 617.6′07572—dc22 2008016461
Vice President and Publisher: Linda DuncanSenior Editor: John DolanManaging Editor: Jaime PendillPublishing Services Manager: Patricia TannianProject Manager: Claire KramerDesign Direction: Kimberly Denando
Printed in ChinaLast digit is the print number: 9 8 7 6 5 4 3 2 1
Working together to grow libraries in developing countries
www.elsevier.com | www.bookaid.org | www.sabre.org

TO OUR FAMILIES
Liza
Heather, Kelly, Ingrid, Xander, and Zeke
Linda
Jayson, Edward, and Lian

This page intentionally left blank
Byron W. Benson , DDS, MS Professor and Vice ChairDepartment of Diagnostic SciencesTexas A & M Health Science CenterBaylor College of DentistryDallas, Texas Sharon L. Brooks , DDS, MS ProfessorDepartment of Periodontics and Oral MedicineUniversity of Michigan School of DentistryAnn Arbor, Michigan Laurie C. Carter , DDS, PhD Professor and DirectorOral and Maxillofacial RadiologyDirector of Advanced Dental EducationVirginia Commonwealth University School of DentistryRichmond, Virginia Allan G. Farman , BDS, PhD (odont), DSc (odont) Professor, Division of Radiology and Imaging ScienceDepartment of Surgical and Hospital DentistryClinical Professor, Department of Diagnostic Radiology School of
MedicineAdjunct Professor, Department of Anatomical Sciences and
NeurobiologyUniversity of LouisvilleLouisville, Kentucky Mel L. Kantor , DDS, MPH, PhD ProfessorDivision of Oral and Maxillofacial RadiologyDepartment of Diagnostic SciencesUMDNJ New Jersey Dental SchoolNewark, New Jersey Ernest W.N. Lam , DMD, PhD, FRCD(C) Associate ProfessorOral and Maxillofacial RadiologyUniversity of TorontoToronto, Ontario, Canada Linda Lee , DDS, MSc, Dipl ABOP, FRCD(C) Dental OncologyPrincess Margaret HospitalUniversity Health NetworkUniversity of TorontoToronto, Ontario, Canada John B. Ludlow , DDS, MS, FDS, RCSEd Professor of Oral and Maxillofacial RadiologyUniversity of North Carolina at Chapel HillSchool of DentistryChapel Hill, North Carolina
CONTRIBUTORS
Alan G. Lurie , DDS, PhD Professor and ChairOral and Maxillofacial RadiologyUniversity of Connecticut School of DentistryFarmington, Connecticut Andr é Mol , DDS, MS, PhD Assistant ProfessorDepartment of Diagnostic Sciences and General DentistryUniversity of North Carolina at Chapel HillSchool of DentistryChapel Hill, North Carolina Carol Anne Murdoch-Kinch , DDS, PhD Associate ProfessorDepartment of Oral and Maxillofacial Surgery/Hospital DentistryUniversity of MichiganAnn Arbor, Michigan Susanne Perschbacher , DDS, MSc, FRCD(C) Assistant ProfessorOral and Maxillofacial RadiologyUniversity of TorontoToronto, Ontario, Canada C. Grace Petrikowski , DDS, MSc, FRCD(C) Associate ProfessorFaculty of Dentistry, University of TorontoToronto, Ontario, Canada Axel Ruprecht , DDS, MScD, FRCD(C) Gilbert E. Lilly Professor of Diagnostic SciencesProfessor and Director of Oral and Maxillofacial RadiologyProfessor of RadiologyProfessor of Anatomy and Cell BiologyThe University of IowaIowa City, Iowa William C. Scarfe , BDS, MS, FRACDS ProfessorRadiology and Imaging SciencesUniversity of LouisvilleSchool of DentistryLouisville, Kentucky Vivek Shetty , DDS, Dr Med Dent Professor Section of Oral and Maxillofacial SurgeryUCLASchool of DentistryLos Angeles, California
vii
viii CONTRIBUTORS
Sotirios Tetradis , DDS, PhD ProfessorSection of Oral and Maxillofacial RadiologyUCLA School of DentistryLos Angeles, California Ann Wenzel , PhD, Dr Odont Professor and HeadDepartment of Oral RadiologySchool of DentistryUniversity of AarhusAarhus, Denmark
Robert E. Wood , DDS, PhD, FRCD(C), DABFO Head, Department of Dental OncologyPrincess Margaret HospitalAssociate Professor, University of TorontoToronto, Ontario, Canada

PREFACE
Each new edition of this textbook provides the opportunity to include recent progress in our rapidly changing fi eld of diagnostic imaging. Every chapter has been revised in light of new knowledge, technology, and techniques. It is the continuing goal of our textbook to present the underlying science of diagnostic imaging, including the core prin-ciples of image production and interpretation for the dental student.
For the fi rst time, we are able to offer supplemental resources to both instructors and students. We will have a companion Evolve website ( http://evolve.elsevier.com/White/oralradiology ) for the sixth edition. For instructors, a test bank and image collection will save time in preparing for lectures and examinations. For students, it provides added practice with case studies and links to more resources.
We are sincerely appreciative of the contributions of all authors for sharing their expertise with the reader and acknowledge the superb contributions of previous contributors, Kathryn Atchison and Neil Frederiksen.
This edition welcomes three new authors. Dr. William C. Scarfe and Dr. Allan G. Farman, colleagues at the University of Louisville, prepared an excellent new chapter on cone-beam imaging. This imaging modality is rapidly evolving and making substantive superb con tributions to diagnostic challenges involving placement of dental implants, detection and interpretation of dental and osseous disease,
and cephalometric analysis. Their chapter describes the underlying principles and clinical applications of this technology. Dr. Susanne Perschbacher at the University of Toronto rewrote the chapter on periodontal diseases, a critical subject in oral health that dentists manage daily.
The chapters on radiographic manifestations of disease in the orofacial region have been updated with an effort to keep a balance between the amount of detailed information and the depth of knowl-edge required for the dental student. The additions include the latest information on etiology and diagnosis and more examples of advanced imaging, including cone-beam computed tomography images. New concepts on the classifi cation of oral and maxillofacial diseases pub-lished by the World Health Organization have been introduced. Also, the clinical and radiologic aspects of new entities have been included, such as bisphosphonate-related osteonecrosis in the chapter on infl ammatory lesions of the jaws. The chapter on orofacial implants has been expanded and updated to include the application of new imaging modalities and new software programs to keep students and instructors abreast of this rapidly changing fi eld.
ix
Stuart C. White Michael J. Pharoah

This page intentionally left blank

ACKNOWLEDGMENTS
We have drawn on the special talents of many of our colleagues as authors of chapters, some for the fi rst time and others for return visits. We thank all for sharing their knowledge and skills. We are also most grateful for the generous support from the staff at Elsevier for their energy and creativity in the presentation of the content of this book.
Finally, we particularly thank our students whose sharp eyes and minds constantly discover new ways for us to improve each edition.
xi
Stuart C. White Michael J. Pharoah

This page intentionally left blank

CONTENTS
Part I Physics of Ionizing Radiation, 1 1 Radiation Physics, 2
Part II Biologic Effects of Radiation, 17 2 Radiobiology, 18
Part III Radiation Safety and Protection, 31 3 Radiation Safety and Protection, 32
Part IV Imaging Principles and Techniques, 45
4 Projection Geometry, 46 5 X-Ray Film, Intensifying Screens, and Grids, 53 6 Processing X-Ray Film, 65 7 Digital Imaging, 78 John B. Ludlow and André Mol 8 Radiographic Quality Assurance and Infection
Control, 100 9 Intraoral Radiographic Examinations, 109 10 Normal Radiographic Anatomy, 152 11 Panoramic Imaging, 175 Alan G. Lurie 12 Extraoral Radiographic Examinations, 191 Sotirios Tetradis and Mel L. Kantor 13 Advanced Imaging, 207 In collaboration with Neil L. Frederiksen 14 Cone-Beam Computed Tomography, 225 William C. Scarfe and Allan G. Farman 15 Guidelines for Prescribing Dental
Radiographs, 244 Sharon L. Brooks
Part V Radiographic Interpretation, 255 16 Principles of Radiographic Interpretation, 256 17 Dental Caries, 270 Ann Wenzel
18 Periodontal Diseases, 282 Susanne Perschbacher 19 Dental Anomalies, 295 Ernest W.N. Lam 20 Infl ammatory Lesions of the Jaws, 325 Linda Lee 21 Cysts and Cystlike Lesions of the Jaws, 343 22 Benign Tumors of the Jaws, 366 23 Malignant Diseases of the Jaws, 405 Robert E. Wood 24 Diseases of Bone Manifested in the Jaws, 428 25 Systemic Diseases Manifested in the Jaws, 454 26 Diagnostic Imaging of the Temporomandibular
Joint, 473 C. Grace Petrikowski 27 Paranasal Sinuses, 506 Axel Ruprecht and Ernest W.N. Lam 28 Soft Tissue Calcifi cation and Ossifi cation, 526 Laurie C. Carter 29 Trauma to Teeth and Facial Structures, 541 Ernest W.N. Lam 30 Developmental Disturbances of the Face and
Jaws, 562 Carol Anne Murdoch-Kinch 31 Salivary Gland Radiology, 578 Byron W. Benson 32 Dental Implants, 597 Byron W. Benson and Vivek Shetty
Index, 613
xiii

This page intentionally left blank
PART
ONE
Physics of Ionizing Radiation

C H A P T E R 1
Radiation Physics
Composition of Matter
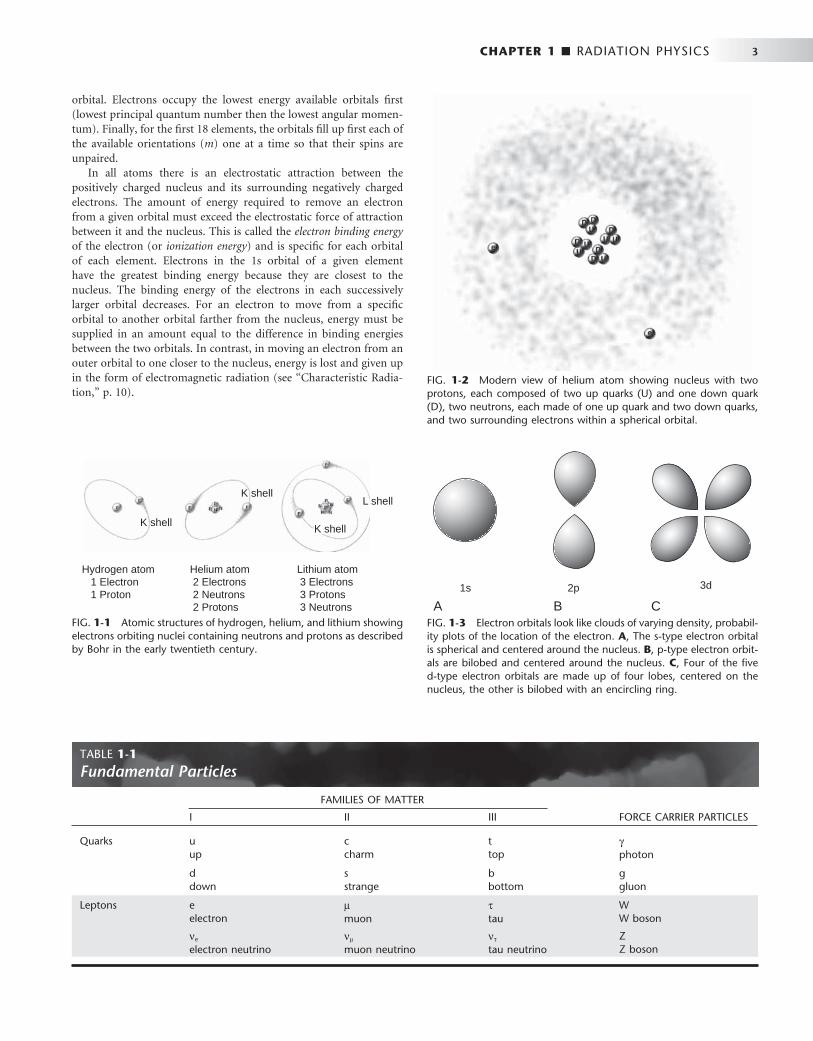
Matter is anything that has mass and occupies space. Matter occurs in three states: solid, liquid, and gas. Atoms, the fundamental units of matter, cannot be subdivided by chemical methods although they may be composed of many smaller (subatomic) particles. Bohr viewed the atom as a miniature solar system with a nucleus at the center and revolving electrons ( Fig. 1-1 ). Although this classical view of the atom has the virtue of being easily understood, it has been replaced in recent decades by the Standard Model, which describes fundamental parti-cles, and the Quantum Mechanical Model, which describes the arrangement of electrons in an atom.
According to the Standard Model, there are 12 types of fundamen-tal matter particles plus their corresponding antiparticles ( Table 1-1 ). These particles are considered to be fundamental because current experiments show that they have no inner structure and cannot be divided. These fundamental particles consist of six types of quarks and six types of leptons and their antiparticles (particles having an opposite charge but otherwise identical to quarks and leptons). Quarks only exist in association with other quarks, never as solitary particles. Neutrons and protons are made of quarks. Unlike quarks, leptons exist only as solitary particles. The stable leptons are electrons and neutrinos. All visible matter in the universe (that is, all stable matter) is made of up quarks, down quarks, and electrons. Antimatter particles are rare and highly unstable because when they interact with matter, they mutually annihilate into pure energy. The universe is made of 24% matter and 76% dark energy. Only 5% of the matter is in the form of atoms and neutrinos. The nature of the rest of the matter, and of dark energy, is unknown.
In addition to matter particles, the Standard Model describes force carrier particles — particles that mediate interactions between matter particles. They are the means by which matter (quarks and leptons) interacts without touching, such as through magnetism, light, and electrostatic attraction and repulsion. Photons mediate the electro-magnetic force, W and Z bosons mediate the weak nuclear force (associated with beta decay), and gluons mediate the strong nuclear force that binds nuclei together. Gravity is speculated to be mediated by gravitons, a fourth type of force particle (but not part of the Stan-dard Model).
ATOMIC STRUCTURE
Nucleus In all atoms except hydrogen, the nucleus consists of positively charged protons and neutral neutrons. A hydrogen nucleus contains a single proton. Protons and neutrons in turn are made of quarks ( Fig. 1-2 ).
Protons (with a charge of 1) consist of two up quarks (charge 23 each)
and one down quark (charge − 13 ). Neutrons are made of one up quark and two down quarks and thus are neutral. Although the posi-tively charged protons repel each other, the nucleus does not fl y apart because it is held together by the strong nuclear force, the rapid exchange of gluons. The strong nuclear force overwhelms the repul-sive electromagnetic effect at the incredibly short distances inside an atomic nucleus.
The number of protons in the nucleus determines the identity of an element. This is its atomic number ( Z ), the nuclear charge. Each of the more than 100 elements has a specifi c atomic number, a corresponding number of orbital electrons in the ground state, and unique chemical and physical properties. Nearly the entire mass of the atom consists of the protons and neutrons in the nucleus. The total number of protons and neutrons in the nucleus of an atom is its atomic mass ( A ).
Electron Orbitals The Quantum Mechanical Model describes contemporary under-standing of the arrangement of electrons in an atom. Beginning with the work of Schr ö dinger, physicists saw electrons as being small par-ticles that exhibit particle-like properties (e.g., they have mass) and wavelike properties (e.g., they generate interference patterns). The previous concept of electrons circling around nuclei in two-dimensional orbits has been replaced by the concept of electrons existing in three-dimensional volumes called orbitals . Orbitals repre-sent the probability locations of the electron in space at any instant in time, the regions in which the electron is most likely to exist. Each kind of orbital is characterized by a set of quantum numbers n, l , and m . The principal quantum number ( n ) describes the size of the orbital, the average distance of the electron from the nucleus. The angular momentum quantum number ( l ) describes the shape of the orbital ( l can never be greater than n − 1). The letters s, p, d, f, g, and h are used to describe orbital shapes and correspond with angular momen-tum values of 0, 1, 2, 3, 4, and 5, respectively. The s-type orbital is spherical ( Fig. 1-3 ). The s-type orbitals are the fi rst to be fi lled in every element. Next are the p-type orbitals, which are bilobed and centered on the nucleus. Boron is the fi rst element to contain an electron in a p orbital. Next are the d-type orbitals, which consist of four lobes arranged around the nucleus or they are bilobed with a ring. Scan-dium is the fi rst element to contain an electron in a d orbital. The magnetic quantum number ( m ) describes the orientation of an orbital in space. In an atom with many electrons the electron clouds of one orbital are superimposed with those of other orbitals. No known atom has more than seven orbitals. Only two electrons may occupy an
2
One atom says to a friend, “ I think I lost an electron. ” The friends replies, “ Are you sure? ” “ Yes, ” says the fi rst atom, “ I ’ m positive. ”
CHAPTER 1 ■ RADIATION PHYSICS 3
orbital. Electrons occupy the lowest energy available orbitals fi rst (lowest principal quantum number then the lowest angular momen-tum). Finally, for the fi rst 18 elements, the orbitals fi ll up fi rst each of the available orientations ( m ) one at a time so that their spins are unpaired.
In all atoms there is an electrostatic attraction between the positively charged nucleus and its surrounding negatively charged electrons. The amount of energy required to remove an electron from a given orbital must exceed the electrostatic force of attraction between it and the nucleus. This is called the electron binding energy of the electron (or ionization energy ) and is specifi c for each orbital of each element. Electrons in the 1s orbital of a given element have the greatest binding energy because they are closest to the nucleus. The binding energy of the electrons in each successively larger orbital decreases. For an electron to move from a specifi c orbital to another orbital farther from the nucleus, energy must be supplied in an amount equal to the difference in binding energies between the two orbitals. In contrast, in moving an electron from an outer orbital to one closer to the nucleus, energy is lost and given up in the form of electromagnetic radiation (see “ Characteristic Radia-tion, ” p. 10).
TABLE 1-1 Fundamental Particles
FAMILIES OF MATTER
FORCE CARRIER PARTICLES I II III
Quarks u up
c charm
t top
γ photon
d down
s strange
b bottom
g gluon
Leptons e electron
μ muon
τ tau
W W boson
ν e electron neutrino
ν μ muon neutrino
ν τ tau neutrino
Z Z boson
FIG. 1-1 Atomic structures of hydrogen, helium, and lithium showing electrons orbiting nuclei containing neutrons and protons as described by Bohr in the early twentieth century.
Hydrogen atom 1 Electron 1 Proton
Helium atom 2 Electrons 2 Neutrons 2 Protons
Lithium atom 3 Electrons 3 Protons 3 Neutrons
K shell
K shellL shell
K shell
FIG. 1-2 Modern view of helium atom showing nucleus with two protons, each composed of two up quarks (U) and one down quark (D), two neutrons, each made of one up quark and two down quarks, and two surrounding electrons within a spherical orbital.
FIG. 1-3 Electron orbitals look like clouds of varying density, probabil-ity plots of the location of the electron. A , The s-type electron orbital is spherical and centered around the nucleus. B , p-type electron orbit-als are bilobed and centered around the nucleus. C , Four of the fi ve d-type electron orbitals are made up of four lobes, centered on the nucleus, the other is bilobed with an encircling ring.
1s 2p 3d
A B C
4 PART I ■ PHYSICS OF IONIZING RADIATION
IONIZATION
When the number of electrons in an atom is equal to the number of protons in its nucleus, the atom is electrically neutral. If such an atom loses an electron, the nucleus becomes a positive ion and the free electron a negative ion. This process of forming an ion pair is termed ionization. To ionize an atom requires suffi cient energy to overcome the electrostatic force binding the electrons to the nucleus. The binding energy of an electron is related to the atomic number of the atom and the orbital type. Large atomic number elements (high Z ) have more protons in their nucleus and thus bind electrons in any give orbital more tightly than do smaller- Z elements. Within a given atom, electrons in the inner orbitals are more tightly bound than the more distant outer orbitals. Tightly bound electrons require the energy of x rays or high-energy particles to remove them, whereas loosely bound electrons can be displaced by ultraviolet radiation. However, nonionizing radiations , such as visible light, infrared, and microwave radiation, and radio waves do not have suffi cient energy to remove bound electrons from their orbitals.
Nature of Radiation
Radiation is the transmission of energy through space and matter. It may occur in two forms: particulate and electromagnetic.
RADIOACTIVITY
Small atoms have roughly equal numbers of protons and neutrons, whereas larger atoms tend to have more neutrons than protons. This makes them unstable and they may break up, releasing α or β particles or γ rays. This process is called radioactivity. When a radioactive atom releases an α or β particle, the atom is transmuted into another element. α Particles are helium nuclei consisting of two protons and two neutrons. They result from the radioactive decay of many large atomic number elements. Because of their double positive charge and heavy mass, α particles densely ionize matter through which they pass. Accordingly, they quickly give up their energy and penetrate only a few micrometers of body tissue. (An ordinary sheet of paper absorbs them.) After stopping, α particles acquire two electrons and become neutral helium atoms.
When a neutron in a radioactive nucleus decays, it produces a proton, a β particle, and a neutrino. β Particles are otherwise identical to electrons. High-speed β particles are not densely ionizing; thus, they are able to penetrate matter to a greater depth than α particles
can, up to a maximum of 1.5 cm in tissue. This deeper penetration occurs because β particles are smaller and lighter and carry a single negative charge; therefore they have a much lower probability of inter-acting with matter than do α particles. β Particles are used in radiation therapy for treatment of some skin cancers.
The capacity of particulate radiation to ionize atoms depends on its mass, velocity, and charge. The rate of loss of energy from a particle as it moves along its track through matter (tissue) is its linear energy transfer (LET). A particle loses kinetic energy each time it ionizes adjacent matter. The greater its physical size and charge and the lower its velocity, the greater is its LET. For example, α particles, with their high charge and low velocity, are densely ionizing, lose their kinetic energy rapidly, and thus have a high LET. β Particles are much less densely ionizing because of their lighter mass and lower charge; thus they have a lower LET. High LET radiations concentrate their ioniza-tion along a short path, whereas low LET radiations produce ion pairs much more sparsely over a longer path length.
The third type of radioactivity is γ decay. γ Rays are photons, a form of electromagnetic radiation (see later). They result as part of a decay chain where a massive nucleus produced by fi ssion converts from an excited state to a lower-level ground state.
ELECTROMAGNETIC RADIATION
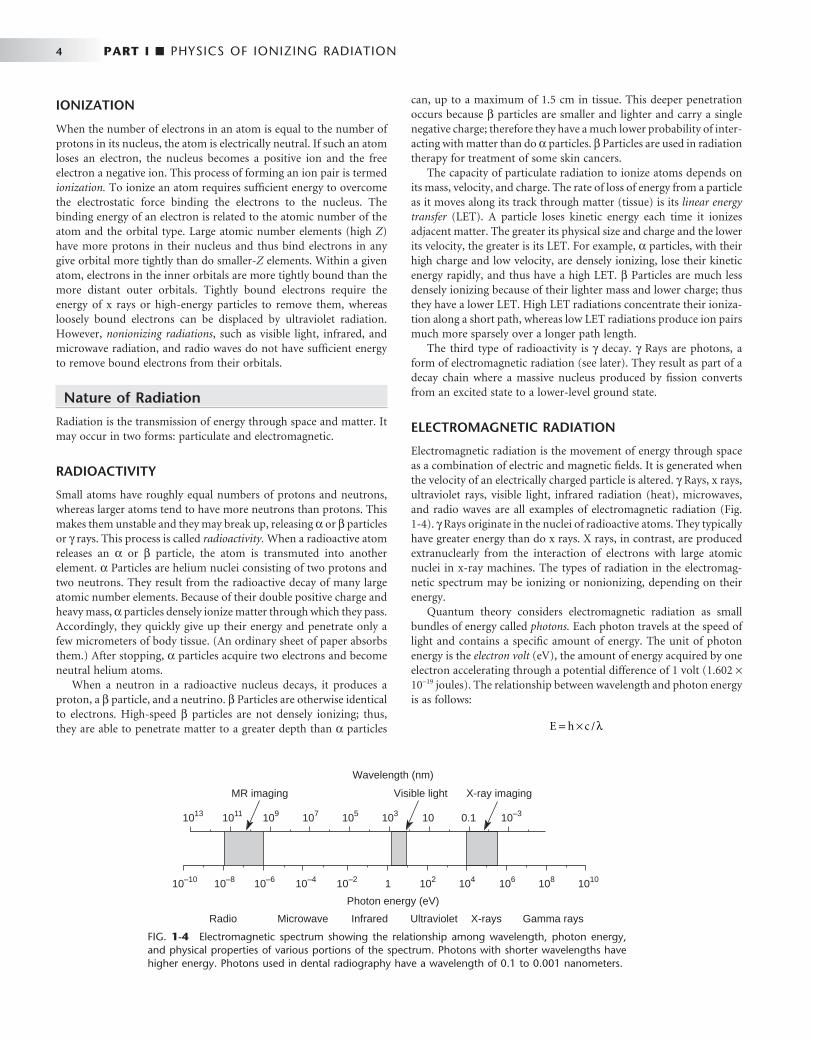
Electromagnetic radiation is the movement of energy through space as a combination of electric and magnetic fi elds. It is generated when the velocity of an electrically charged particle is altered. γ Rays, x rays, ultraviolet rays, visible light, infrared radiation (heat), microwaves, and radio waves are all examples of electromagnetic radiation ( Fig. 1-4 ). γ Rays originate in the nuclei of radioactive atoms. They typically have greater energy than do x rays. X rays, in contrast, are produced extranuclearly from the interaction of electrons with large atomic nuclei in x-ray machines. The types of radiation in the electromag-netic spectrum may be ionizing or nonionizing, depending on their energy.
Quantum theory considers electromagnetic radiation as small bundles of energy called photons. Each photon travels at the speed of light and contains a specifi c amount of energy. The unit of photon energy is the electron volt (eV), the amount of energy acquired by one electron accelerating through a potential difference of 1 volt (1.602 × 10 − 19 joules). The relationship between wavelength and photon energy is as follows:
E h c= × /λ
FIG. 1-4 Electromagnetic spectrum showing the relationship among wavelength, photon energy, and physical properties of various portions of the spectrum. Photons with shorter wavelengths have higher energy. Photons used in dental radiography have a wavelength of 0.1 to 0.001 nanometers.
10–10
1013 1011 109 107 105 103 10 0.1 10–3
10–8 10–6 10–4 10–2 1 102 104 106 108 1010
Wavelength (nm)
Radio Microwave Infrared Ultraviolet X-rays Gamma rays
Visible lightMR imaging X-ray imaging
Photon energy (eV)

CHAPTER 1 ■ RADIATION PHYSICS 5
where E is energy in kiloelectron volts (keV), h is Planck ’ s constant (6.626 × 10 − 34 joule-seconds or 4.3 × 10 − 18 keV), c is the velocity of light, and λ is wavelength in nanometers. This expression may be simplifi ed to the following:
E = 1 24. /λ
Some properties of electromagnetic radiation are best expressed by quantum theory, whereas others are most successfully described by wave theory. The quantum theory of radiation has been successful in correlating experimental data on the interaction of radiation with atoms, the photoelectric effect, and the production of x rays. The wave theory of electromagnetic radiation maintains that radiation is propa-gated in the form of waves, not unlike the waves resulting from a dis-turbance in water. Such waves consist of electric and magnetic fi elds oriented in planes at right angles to one another that oscillate perpen-dicular to the direction of motion ( Fig. 1-5 ). All electromagnetic waves travel at the velocity of light (c = 3.0 × 10 8 m/sec) in a vacuum. Waves of all kinds exhibit the properties of wavelength ( λ ) and fre-quency ( ν ) and are related as follows:
λ ν× = = ×c m sec3 108 /
where λ is in meters and ν is in cycles per second (hertz). Wave theory is more useful for considering radiation in bulk when millions of quanta are being examined, as in experiments dealing with refraction, refl ection, diffraction, interference, and polarization.
High-energy photons such as x rays and γ rays are typically char-acterized by their energy (electron volts), medium-energy photons (e.g., visible light and ultraviolet waves) by their wavelength (nano-meters), and low-energy photons (e.g., AM and FM radio waves) by their frequency (KHz and MHz).
X-Ray Machine
The primary components of an x-ray machine are the x-ray tube and its power supply. The x-ray tube is positioned within the tube head, along with some components of the power supply ( Fig. 1-6 ). Often
the tube is recessed within the tube head to improve the quality of the radiographic image (see Chapter 4 ). The tube head is supported by an arm that is usually mounted on a wall. A control panel allows the operator to adjust the time of exposure and often the energy and exposure rate of the x-ray beam.
X-RAY TUBE
An x-ray tube is composed of a cathode and an anode situated within an evacuated glass envelope or tube ( Fig. 1-7 ). Electrons stream from a fi lament in the cathode to a target in the anode, where they produce x rays. For the x-ray tube to function, a power supply is necessary to (1) heat the cathode fi lament to generate electrons and (2) establish a high-voltage potential between the anode and cathode to accelerate the electrons toward the anode.
Cathode The cathode (see Fig. 1-7 ) in an x-ray tube consists of a fi lament and a focusing cup. The fi lament is the source of electrons within the x-ray
FIG. 1-5 The electric and magnetic fi elds associated with a photon.
Direction of photonpropagation
Ele
ctric
fiel
d
Magnetic field
FIG. 1-6 Tube head (including the recessed x-ray tube), components of the power supply, and the oil that conducts heat away from the x-ray tube. Path of useful x-ray beam from anode through fi lter and collimator to end of aiming cylinder shown in blue.
X-ray tube
Yoke
Oil
Collimator
Aimingcylinder
Aluminum filter
Power supply

6 PART I ■ PHYSICS OF IONIZING RADIATION
tube. It is a coil of tungsten wire about 2 mm in diameter and 1 cm or less in length. It is mounted on two stiff wires that support it and carry the electric current. These two mounting wires lead through the glass envelope and connect to both the high- and low-voltage electri-cal sources. The fi lament is heated to incandescence by the fl ow of current from the low-voltage source and emits electrons at a rate proportional to the temperature of the fi lament.
The fi lament lies in a focusing cup ( Fig. 1-8, A ; see also Fig. 1-7 ), a negatively charged concave refl ector made of molybdenum. The para-bolic shape of the focusing cup electrostatically focuses the electrons emitted by the fi lament into a narrow beam directed at a small rect-angular area on the anode called the focal spot ( Fig. 1-8, B ; see also Fig. 1-7 ). The electrons move in this direction because they are both repelled by the negatively charged cathode and attracted to the posi-tively charged anode. The x-ray tube is evacuated to prevent collision of the fast-moving electrons with gas molecules, which would signifi -cantly reduce their speed. The vacuum also prevents oxidation, “ burnout, ” of the fi lament.
Anode The anode consists of a tungsten target embedded in a copper stem (see Fig. 1-7 ). The purpose of the target in an x-ray tube is to convert
the kinetic energy of the colliding electrons into x-ray photons. The target is made of tungsten, an element that has several characteristics of an ideal target material. It has a high atomic number (74), a high melting point, high thermal conductivity, and low vapor pressure at the working temperatures of an x-ray tube. The conversion of the kinetic energy of the electrons into x-ray photons is an ineffi cient process with more than 99% of the electron kinetic energy converted to heat. A target made of a high atomic number material is most effi -cient in producing x rays. Because heat is generated at the anode, the requirement for a target with a high melting point is clear. Tungsten also has high thermal conductivity, thus readily dissipating its heat into the copper stem. Finally, the low vapor pressure of tungsten at high temperatures helps maintain the vacuum in the tube at high operating temperatures. The tungsten target is typically embedded in a large block of copper. Copper, also a good thermal conductor, removes heat from the tungsten, thus reducing the risk of the target melting. Addi-tionally, insulating oil between the glass envelope and the housing of the tube head carries heat away from the copper stem. This type of anode is a stationary anode because it has no moving parts.
The focal spot is the area on the target to which the focusing cup directs the electrons and from which x rays are produced. The sharp-ness of a radiographic image increases as the size of the focal spot decreases (see Chapter 4 ). The heat generated per unit target area, however, becomes greater as the focal spot decreases in size. To take advantage of a small focal spot while distributing the electrons over a larger area of the target, the target is placed at an angle to the electron beam ( Fig. 1-9 ). The apparent size of the focal spot seen from a posi-tion perpendicular to the electron beam (the effective focal spot ) is smaller than the actual focal spot size. Typically, the target is inclined about 20 degrees to the central ray of the x-ray beam. This causes the effective focal spot to be approximately 1 × 1 mm, as opposed to the actual focal spot, which is about 1 × 3 mm. This results in a small apparent source of x rays and thus an increase in the sharpness of the image (see Fig. 4-2 ), with a larger actual focal spot size to improve heat dissipation.
Another method of dissipating the heat from a small focal spot is to use a rotating anode. In this case the tungsten target is in the form of a beveled disk that rotates when the tube is in operation ( Fig. 1-10 ). As a result, the electrons strike successive areas of the target, widening the focal spot by an amount corresponding to the circumference of the beveled disk, thus distributing the heat over this extended area. FIG. 1-7 X-ray tube with the major components labeled.
Filament andelectron cloud
Focal spot ontungsten target Glass envelope
VacuumCopper stem
Electrons
Cathode (–)
Tubewindow Useful
x-raybeam
Anode (+)Electronicfocusing
cup
FIG. 1-8 A, Focusing cup (arrow) containing a fi lament in the cathode of the tube from a dental x-ray machine. B, Focal spot area (arrows) on the target of the tube.
A B

CHAPTER 1 ■ RADIATION PHYSICS 7
The focal spot of a stationary tube is now a focal track in rotating anode machines. Narrow focal tracks in rotating anode tubes can be used with tube currents of 100 to 500 milliamperes (mA), 10 to 50 times that possible with stationary targets. The target and rotor (armature) of the motor lie within the x-ray tube, and the stator coils (which drive the rotor at about 3000 revolutions per minute) lie outside the tube. Such rotating anodes are not used in intraoral dental x-ray machines but may be used in tomographic or cephalometric units and are always used in medical computed tomography x-ray machines, which require high radiation output.
POWER SUPPLY
The primary functions of the power supply of an x-ray machine are to (1) provide a low-voltage current to heat the x-ray tube fi lament and (2) generate a high potential difference between the anode and cathode. The x-ray tube and two transformers lie within an electrically grounded metal housing called the head of the x-ray machine. An electrical insulating material, usually oil, surrounds the tube and transformers.
Tube Current The tube current is the fl ow of electrons through the tube; that is, from the cathode fi lament, across the tube to the anode, and then back to the fi lament. The fi lament transformer ( Fig. 1-11 ) reduces the voltage of the incoming alternating current (AC) to about 10 volts in the fi la-ment circuit. This voltage is regulated by the fi lament current control (mA selector), which adjusts the resistance and thus the current fl ow through the fi lament. This in turn regulates the fi lament temperature and thus the number of electrons emitted. The mA setting on the fi la-ment current control actually refers to the tube current, typically about 10 mA, which is measured by the milliammeter. This is not the same as the current in the fi lament circuit.
Notice also that the tube current is dependent on the tube voltage; as the voltage increases between the anode and cathode, so does the current fl ow. The hot fi lament releases electrons, creating a negative space charge around the fi lament. When the fi lament wire is positive, the released electrons stay near the fi lament. The increasingly negative space charge impedes the further release of electrons. When the anode
becomes positive, it attracts electrons from the fi lament, the space charge is reduced, and increasing numbers of electrons are released from the fi lament, thereby increasing the tube current. The higher the voltage, the greater this effect.
Tube Voltage A high voltage is required between the anode and cathode to give electrons suffi cient energy to generate x rays. The actual voltage used on an x-ray machine is adjusted with the autotransformer (see Fig. 1-11 ). By using the kilovolt peak (kVp) selector, the operator adjusts the autotransformer and converts the primary voltage from the input source into the desired secondary voltage. The selected secondary voltage is applied to the primary winding of the high-voltage trans-former, which boosts the peak voltage of the incoming line current (110 V) up to 60,000 to 100,000 V (60 to 100 kV). This boosts the peak energy of the electrons passing through the tube to as high as 60 to 100 keV and provides them suffi cient energy to generate x rays. The kVp dial thus selects the peak operating voltage between the anode and cathode.
FIG. 1-9 The angle of the target to the central ray of the x-ray beam has a strong infl uence on the apparent size of the focal spot. The pro-jected effective focal spot is much smaller than the actual focal spot size.
Focusing cupand filamentTarget
Cathode (–)Anode (+)
Centralray20°
1 mm
1 mm
1 mm
3 mm
Actual focalspot size
e-
Effective focalspot size
FIG. 1-10 X-ray tube with a rotating anode, which allows heat at the focal spot to spread out over a large surface area.
Glass tube
Anode
Focusing cup
Filament
Electron stream
X-ray beam
Focal spot
Rotor
Stator(sectioned)
FIG. 1-11 Schematic of dental x-ray machine circuitry and x-ray tube with the major components labeled.
kVp selector
ACpowersupply
kVp mA
Timer
High-voltagetransformer
Autotransformer mA selector
X-raytube
Filamenttransformer
8 PART I ■ PHYSICS OF IONIZING RADIATION
Because the polarity of the line current alternates (60 cycles per second), the polarity of the x-ray tube alternates at the same frequency ( Fig. 1-12, A ). When the polarity of the voltage applied across the tube causes the target anode to be positive and the fi lament to be negative, the electrons around the fi lament accelerate toward the positive target and current fl ows through the tube ( Fig. 1-12, B ). Because the line voltage varies continuously, so does the voltage potential between the anode and cathode.
The operating voltage of an x-ray machine is stated as the kVp. As the tube voltage is increased, the speed of the electrons moving toward the anode increases. When the electrons strike the focal spot of the target, some of their energy converts to x-ray photons. X rays are produced at the target with greatest effi ciency when the voltage applied across the tube is high. Therefore the intensity of x-ray pulses tends to be sharply peaked at the center of each cycle ( Fig. 1-12, C ). During the following half (or negative half) of each cycle, the fi lament becomes positive and the target negative (see Fig. 1-12, B ). At these times the electrons do not fl ow across the gap between the two ele-ments of the tube. This half of the cycle is called inverse voltage or reverse bias (see Fig. 1-12, B ). No x rays are generated during this half of the voltage cycle (see Fig. 1-12, C ). Therefore when an x-ray tube
is powered with 60-cycle AC, 60 pulses of x rays are generated each second, each having a duration of 1
120 second. This type of power supply circuitry, in which the alternating high voltage is applied directly across the x-ray tube, limits x-ray production to half the AC cycle and is called self-rectifi ed or half-wave rectifi ed. Almost all con-ventional dental x-ray machines are self-rectifi ed.
Some dental x-ray manufacturers produce machines that replace the conventional 60-cycle AC, half-wave rectifi ed power supply with a full-wave rectifi ed, high-frequency power supply. This results in an essentially constant potential between the anode and cathode. The result is that the mean energy of the x-ray beam produced by these x-ray machines is higher than that from a conventional half-wave rectifi ed machine operated at the same voltage. For a given voltage setting and radiographic density, the images resulting from these constant-potential machines have a longer contrast scale and the patient receives a lower dose compared with conventional x-ray machines.
TIMER
A timer is built into the high-voltage circuit to control the duration of the x-ray exposure (see Fig. 1-11 ). The electronic timer controls
FIG. 1-12 A, A 60-cycle AC line voltage at autotransformer. B, Voltage at the anode varies up to the kVp setting (70 in this case). C, The intensity of radiation produced at the anode increases as the anode voltage increases. (Modifi ed from Johns HE, Cunningham JR: The physics of radiology, ed 3, Springfi eld, Ill, 1969, Charles C Thomas.)

CHAPTER 1 ■ RADIATION PHYSICS 9
the length of time that high voltage is applied to the tube and there-fore the time during which tube current fl ows and x rays are pro-duced. Before the high voltage is applied across the tube, however, the fi lament must be brought to operating temperature to ensure an adequate rate of electron emission. Subjecting the fi lament to continuous heating at normal operating current shortens its life. To minimize fi lament damage, the timing circuit fi rst sends a current through the fi lament for about half a second to bring it to the proper operating temperature and then applies power to the high-voltage circuit. In some circuit designs, a continuous low-level current passing through the fi lament maintains it at a safe low temperature, thereby further shortening the delay to preheat the fi lament. For these reasons an x-ray machine may be left on continuously during working hours.
Some x-ray machine timers are calibrated in fractions of a second, whereas others are expressed as number of impulses in an exposure (e.g., 3, 6, 9, 15). The number of impulses divided by 60 (the frequency of the power source) gives the exposure time in seconds. Thus a setting of 30 impulses means that there will be 30 impulses of radiation equivalent to a half-second exposure.
TUBE RATING AND DUTY CYCLE
X-ray tubes produce heat at the target while in operation. The heat buildup at the anode is measured in heat units (HU), where HU = kVp × mA × seconds. The heat storage capacity for anodes of dental diagnostic tubes is approximately 20 kHU. Heat is removed from the target by conduction to the copper anode and then to the surrounding oil and tube housing and by convection to the atmosphere.
Each x-ray machine comes with a tube rating chart that describe the longest exposure time the tube can be energized for a range of voltages (kVp) and tube current (mA) values without risk of damage to the target from overheating. These tube ratings generally do not impose any restrictions on tube use for intraoral radiography. If a dental x-ray unit is used for extraoral exposures, however, it is wise to mount the tube-rating chart by the machine for easy reference. Duty cycle relates to the frequency with which successive exposures can be made. The interval between successive exposures must be long enough for heat dissipation. This characteristic is a function of the size of the anode and the method used to cool it.
Production of X Rays
Most high-speed electrons traveling from the fi lament to the target interact with target electrons and release their energy as heat. Occa-sionally, however, electrons convert their kinetic energy into x-ray photons by the formation of bremsstrahlung and characteristic radiation .
BREMSSTRAHLUNG RADIATION
The sudden stopping or slowing of high-speed electrons by tungsten nuclei in the target produces bremsstrahlung photons, the primary source of radiation from an x-ray tube. ( Bremsstrahlung means “ braking radiation ” in German.) Occasionally electrons from the fi la-ment directly hit the nucleus of a target atom. When this happens, all the kinetic energy of the electron is transformed into a single x-ray photon ( Fig. 1-13, A ). The energy of the resultant photon (in keV) is thus numerically equal to the energy of the electron, that is, the voltage applied across the x-ray tube at that instant.
More frequently, high-speed electrons have near or wide misses with atomic nuclei (see Fig. 1-13, B ). In these interactions, the electron is attracted toward the positively charged nuclei, its path is altered towards the nucleus, and it loses some of its velocity. This deceleration causes the electron to lose kinetic energy that is given off in the form of many new photons. The closer the high-speed electron approaches the nuclei, the greater is the electrostatic attraction between the nucleus and the electron, braking effect, and energy of the resulting bremsstrahlung photons.
Bremsstrahlung interactions generate x-ray photons with a con-tinuous spectrum of energy. The energy of an x-ray beam is usually described by identifying the peak operating voltage (in kVp). A dental x-ray machine operating at a peak voltage of 70 kVp, for example, applies a fl uctuating voltage of up to 70 kVp across the tube. This tube therefore produces a continuous spectrum of x-ray photons with energies ranging to a maximum of 70 keV ( Fig. 1-14 ). The reasons for this continuous spectrum are as follows:
1. The continuously varying voltage difference between the target and fi lament, which is characteristic of half-wave rectifi cation, causes the electrons striking the target to have varying levels of kinetic energy.
2. The bombarding electrons pass at varying distances around tungsten nuclei and are thus defl ected to varying extents. As a
Bremsstrahlung photonof maximal energy
Bremsstrahlung photonof lower energy
Near-Miss Interaction
Altered pathof deflecteddeceleratedelectron
Direct-Hit Interaction
Incident high-energy electron
Incident high-energy electron
B
A
FIG. 1-13 Bremsstrahlung radiation is produced by the direct hit of an electron on a nucleus in the target (A) or more frequently, by the passage of an electron near a nucleus, which results in electrons being defl ected and decelerated (B) .

10 PART I ■ PHYSICS OF IONIZING RADIATION
result, they give up varying amounts of energy in the form of bremsstrahlung photons.
3. Many electrons participate in many bremsstrahlung interactions in the target before losing all their kinetic energy. As a conse-quence, an electron carries differing amounts of energy at the time of each interaction with a tungsten nucleus that results in the generation of an x-ray photon.
CHARACTERISTIC RADIATION
Characteristic radiation contributes only a small fraction of the photons in an x-ray beam. It occurs when an incident electron ejects an inner electron from the tungsten target. When this happens, an electron from an outer orbital is quickly attracted to the void in the defi cient inner orbital ( Fig. 1-15 ). When the outer-orbital electron replaces the displaced electron, a photon is emitted with an energy equivalent to the difference in the two orbital binding energies. The energies of characteristic photons are discrete because they represent the difference of the energy levels of electron orbital levels and hence are characteristic of the target atoms.
Factors Controlling the X-Ray Beam
An x-ray beam may be modifi ed by altering the beam exposure dura-tion (timer), exposure rate (mA), energy (kVp and fi ltration), shape (collimation), and intensity (target-patient distance).
EXPOSURE TIME
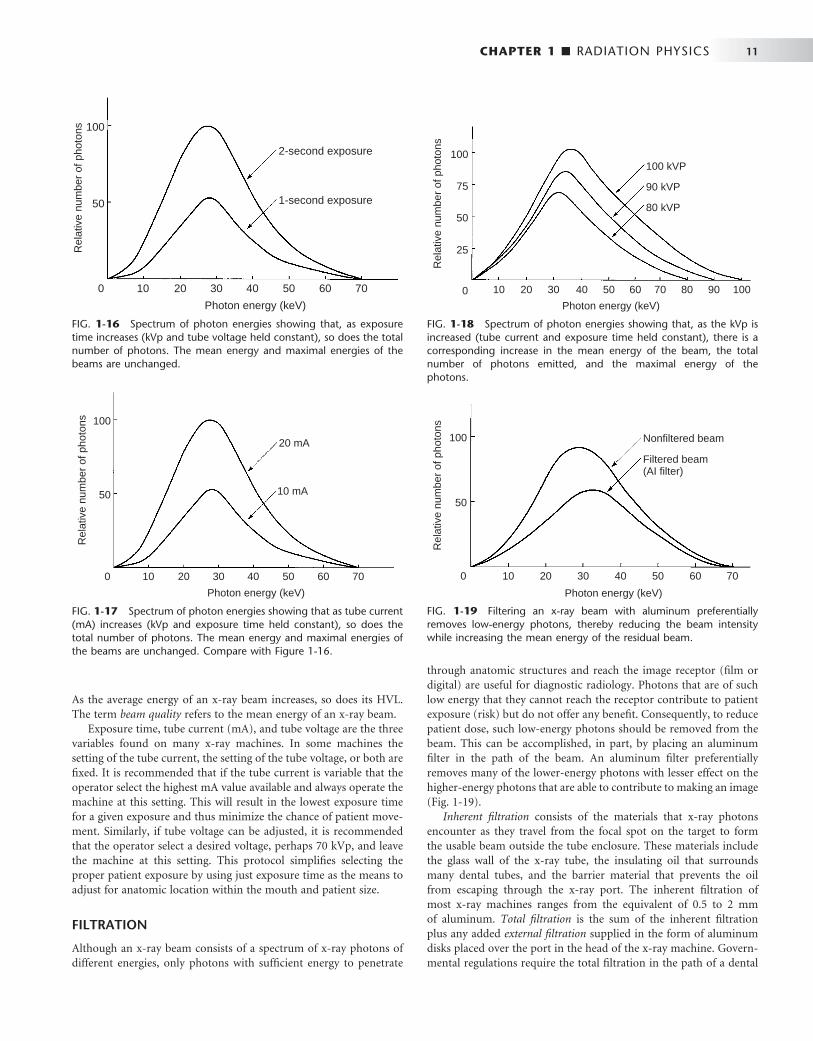
Changing the time controls the duration of the exposure and thus the number of photons generated ( Fig. 1-16 ). When the exposure time is doubled, the number of photons generated at all energies in the x-ray emission spectrum is doubled, but the range of photon energies is unchanged.
TUBE CURRENT (mA)
The quantity of radiation produced by an x-ray tube (i.e., the number of photons that reach the patient and fi lm) is directly proportional to the tube current (mA) and the time the tube is operated ( Fig. 1-17 ). As the mA setting is increased, more power is applied to the fi lament, which heats up and releases more electrons that collide with the target to produce radiation. The quantity of radiation produced is expressed as the product of time and tube current. The quantity of radiation remains constant regardless of variations in mA and time as long as the product remains constant. For instance, a machine operating at 10 mA for 1 second (10 mA) produces the same quantity of radiation when operated at 20 mA for 0.5 second (10 mA). In practice some dental x-ray machines fall slightly short of this ideal constancy. The term beam quantity or beam intensity refers to the number of photons an x-ray beam.
TUBE VOLTAGE (kVp)
Increasing the kVp increases the potential difference between the cathode and the anode, thus increasing the energy of each electron when it strikes the target. This results in an increased effi ciency of conversion of electron energy into x-ray photons and thus an increase in (1) the number of photons generated, (2) their mean energy, and (3) their maximal energy ( Fig. 1-18 ).
The ability of x-ray photons to penetrate matter depends on their energy. High-energy x-ray photons have a greater probability of pen-etrating matter, whereas lower-energy photons have a greater proba-bility of being absorbed. Therefore the higher the kVp and mean energy of the x-ray beam, the greater the penetrability of the beam through matter. A useful way to characterize the penetrating quality of an x-ray beam (its energy) is by its half-value layer (HVL). The HVL is the thickness of an absorber, such as aluminum, required to reduce by one half the number of x-ray photons passing through it.
FIG. 1-14 Spectrum of photons emitted from an x-ray beam gener-ated at 70 kVp. The vast preponderance of radiation is bremsstrahlung, with a minor addition of characteristic radiation.
2010 30 5040 60 70
Rel
ativ
e nu
mbe
r of
pho
tons
Bremsstrahlung radiation
Characteristicradiation
Photon energy (keV)
FIG. 1-15 Characteristic radiation. A, An incident electron ejects an electron from in an inner orbital creating a photoelectron and a vacancy. B, An electron from an outer orbital fi lls this vacancy. C, A photon is emitted with energy equal to the difference in energy levels between the two orbitals. D, Electrons from various orbitals may be involved, giving rise to other photons. The energies of the photons thus created are characteristic of the target atom.
Incident high-energy electron
Recoil electronVacancy
Characteristicradiation(photon)
Higher–energy-levelelectron
BA DC
CHAPTER 1 ■ RADIATION PHYSICS 11
As the average energy of an x-ray beam increases, so does its HVL. The term beam quality refers to the mean energy of an x-ray beam.
Exposure time, tube current (mA), and tube voltage are the three variables found on many x-ray machines. In some machines the setting of the tube current, the setting of the tube voltage, or both are fi xed. It is recommended that if the tube current is variable that the operator select the highest mA value available and always operate the machine at this setting. This will result in the lowest exposure time for a given exposure and thus minimize the chance of patient move-ment. Similarly, if tube voltage can be adjusted, it is recommended that the operator select a desired voltage, perhaps 70 kVp, and leave the machine at this setting. This protocol simplifi es selecting the proper patient exposure by using just exposure time as the means to adjust for anatomic location within the mouth and patient size.
FILTRATION
Although an x-ray beam consists of a spectrum of x-ray photons of different energies, only photons with suffi cient energy to penetrate
through anatomic structures and reach the image receptor (fi lm or digital) are useful for diagnostic radiology. Photons that are of such low energy that they cannot reach the receptor contribute to patient exposure (risk) but do not offer any benefi t. Consequently, to reduce patient dose, such low-energy photons should be removed from the beam. This can be accomplished, in part, by placing an aluminum fi lter in the path of the beam. An aluminum fi lter preferentially removes many of the lower-energy photons with lesser effect on the higher-energy photons that are able to contribute to making an image ( Fig. 1-19 ).
Inherent fi ltration consists of the materials that x-ray photons encounter as they travel from the focal spot on the target to form the usable beam outside the tube enclosure. These materials include the glass wall of the x-ray tube, the insulating oil that surrounds many dental tubes, and the barrier material that prevents the oil from escaping through the x-ray port. The inherent fi ltration of most x-ray machines ranges from the equivalent of 0.5 to 2 mm of aluminum. Total fi ltration is the sum of the inherent fi ltration plus any added external fi ltration supplied in the form of aluminum disks placed over the port in the head of the x-ray machine. Govern-mental regulations require the total fi ltration in the path of a dental
FIG. 1-16 Spectrum of photon energies showing that, as exposure time increases (kVp and tube voltage held constant), so does the total number of photons. The mean energy and maximal energies of the beams are unchanged.
2010 30 5040 60 70
2-second exposure
Photon energy (keV)
1-second exposure
0
50
100
Rel
ativ
e nu
mbe
r of
pho
tons
FIG. 1-17 Spectrum of photon energies showing that as tube current (mA) increases (kVp and exposure time held constant), so does the total number of photons. The mean energy and maximal energies of the beams are unchanged. Compare with Figure 1-16 .
20 mA
10 mA
2010 30 5040 60 70
Photon energy (keV)
0
50
100
Rel
ativ
e nu
mbe
r of
pho
tons
FIG. 1-18 Spectrum of photon energies showing that, as the kVp is increased (tube current and exposure time held constant), there is a corresponding increase in the mean energy of the beam, the total number of photons emitted, and the maximal energy of the photons.
2010 30 5040 60 70
Rel
ativ
e nu
mbe
r of
pho
tons
100 kVP
Photon energy (keV)0
50
100
90 kVP
80 kVP
80 90
25
100
75
FIG. 1-19 Filtering an x-ray beam with aluminum preferentially removes low-energy photons, thereby reducing the beam intensity while increasing the mean energy of the residual beam.
2010 30 5040 60 70
Rel
ativ
e nu
mbe
r of
pho
tons
Nonfiltered beam
Photon energy (keV)
0
50
100
Filtered beam(AI filter)
12 PART I ■ PHYSICS OF IONIZING RADIATION
x-ray beam to be equal to the equivalent of 1.5 mm of aluminum up to 70 kVp and 2.5 mm of aluminum for all higher voltages (see Chapter 3 ).
COLLIMATION
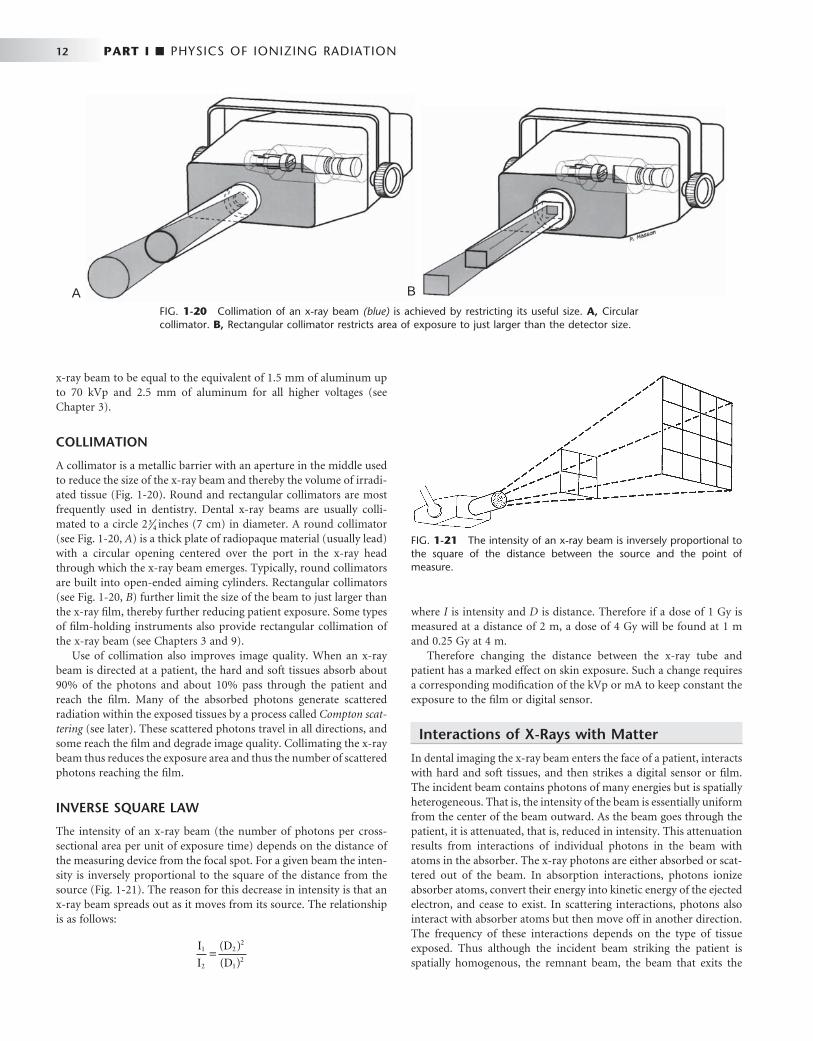
A collimator is a metallic barrier with an aperture in the middle used to reduce the size of the x-ray beam and thereby the volume of irradi-ated tissue ( Fig. 1-20 ). Round and rectangular collimators are most frequently used in dentistry. Dental x-ray beams are usually colli-mated to a circle 2 3
4 inches (7 cm) in diameter. A round collimator (see Fig. 1-20, A ) is a thick plate of radiopaque material (usually lead) with a circular opening centered over the port in the x-ray head through which the x-ray beam emerges. Typically, round collimators are built into open-ended aiming cylinders. Rectangular collimators (see Fig. 1-20, B ) further limit the size of the beam to just larger than the x-ray fi lm, thereby further reducing patient exposure. Some types of fi lm-holding instruments also provide rectangular collimation of the x-ray beam (see Chapters 3 and 9).
Use of collimation also improves image quality. When an x-ray beam is directed at a patient, the hard and soft tissues absorb about 90% of the photons and about 10% pass through the patient and reach the fi lm. Many of the absorbed photons generate scattered radiation within the exposed tissues by a process called Compton scat-tering (see later). These scattered photons travel in all directions, and some reach the fi lm and degrade image quality. Collimating the x-ray beam thus reduces the exposure area and thus the number of scattered photons reaching the fi lm.
INVERSE SQUARE LAW
The intensity of an x-ray beam (the number of photons per cross-sectional area per unit of exposure time) depends on the distance of the measuring device from the focal spot. For a given beam the inten-sity is inversely proportional to the square of the distance from the source ( Fig. 1-21 ). The reason for this decrease in intensity is that an x-ray beam spreads out as it moves from its source. The relationship is as follows:
I
I
D
D1
2
22
12
=( )
( )
where I is intensity and D is distance. Therefore if a dose of 1 Gy is measured at a distance of 2 m, a dose of 4 Gy will be found at 1 m and 0.25 Gy at 4 m.
Therefore changing the distance between the x-ray tube and patient has a marked effect on skin exposure. Such a change requires a corresponding modifi cation of the kVp or mA to keep constant the exposure to the fi lm or digital sensor.
Interactions of X-Rays with Matter
In dental imaging the x-ray beam enters the face of a patient, interacts with hard and soft tissues, and then strikes a digital sensor or fi lm. The incident beam contains photons of many energies but is spatially heterogeneous. That is, the intensity of the beam is essentially uniform from the center of the beam outward. As the beam goes through the patient, it is attenuated, that is, reduced in intensity. This attenuation results from interactions of individual photons in the beam with atoms in the absorber. The x-ray photons are either absorbed or scat-tered out of the beam. In absorption interactions, photons ionize absorber atoms, convert their energy into kinetic energy of the ejected electron, and cease to exist. In scattering interactions, photons also interact with absorber atoms but then move off in another direction. The frequency of these interactions depends on the type of tissue exposed. Thus although the incident beam striking the patient is spatially homogenous, the remnant beam, the beam that exits the
FIG. 1-20 Collimation of an x-ray beam (blue) is achieved by restricting its useful size. A, Circular collimator. B, Rectangular collimator restricts area of exposure to just larger than the detector size.
A B
FIG. 1-21 The intensity of an x-ray beam is inversely proportional to the square of the distance between the source and the point of measure.

CHAPTER 1 ■ RADIATION PHYSICS 13
patient, is spatially heterogeneous. It is this differential exposure of the fi lm that allows a radiograph to reveal the morphologic features of enamel, dentin, bone, and soft tissues through which it has passed.
In a dental x-ray beam there are three means of beam attenuation: (1) coherent scattering, (2) photoelectric absorption, and (3) Compton scattering. In addition, about 9% of the primary photons pass through the patient without interaction ( Fig. 1-22 and Table 1-2 ).
COHERENT SCATTERING
Coherent scattering (also known as classical, elastic , or Thompson scat-tering ) may occur when a low-energy incident photon (less than 10 keV) passes near an outer electron of an atom. The incident photon interacts with the electron by causing it to become momentarily excited at the same frequency as the incoming photon ( Fig. 1-23 ). The incident photon ceases to exist. The excited electron then returns to the ground state and generates another x-ray photon with the same frequency (energy) as in the incident beam. Usually the secondary photon is emitted at an angle to the path of the incident photon. The net effect is that the direction of the incident x-ray photon is altered. Coherent scattering accounts for only about 7% of the total number
No interaction
Coherent scattering
Photoelectric absorption
Compton scattering
FIG. 1-22 Photons in an x-ray beam interact with the object primarily by Compton scattering, in which case the scattered photon may strike the fi lm and degrade the radiographic image by causing fi lm fog, or photoelectric absorption, in which case they cease to exist. Relatively few photons undergo coherent scattering within the object or pass through the object without interacting and expose the fi lm.
FIG. 1-23 Coherent scattering resulting from the interaction of a low-energy incident photon with an outer electron, causing the outer electron to vibrate momentarily. After this, a scattered photon of the same energy is emitted at a different angle from the path of the inci-dent photon.
Scattered photon
Incident photon
TABLE 1-2 Fate of 1,000,000 Incident Photons in Bitewing Projection
INTERACTION FATE OF INCIDENT PHOTON PRIMARY PHOTONS SCATTERED PHOTONS * TOTAL †
Coherent scattering Scatters from outer electron 74,453 78,117 152,570
Photoelectric absorption Ejects inner electron and ceases to exist; releases characteristic photon
268,104 261,041 529,145
Compton scattering Ejects outer electron, both scatter 565,939 549,360 1,115,300
No interaction Passes through patient 91,504 379,350 470,855
Total 1,000,000 1,267,868 2,267,869
* Scattered photons result from primary, Compton, and coherent interactions. † Note that the sum of the total number of photoelectric interactions and photons that exit the patient equals the total number of incident photons.
of interactions in a dental exposure (see Table 1-1 ). Coherent scatter-ing contributes little to fi lm fog because the number of scattered photons is small and their energy is too low for many of them to reach the fi lm or sensor.
PHOTOELECTRIC ABSORPTION
Photoelectric absorption is critical in diagnostic imaging. This process occurs when an incident photon interacts with an electron in an inner orbital of an atom of the absorbing medium. The photon ejects the electron from its orbital and it becomes a recoil electron (photoelec-tron) ( Fig. 1-24 ). At this point the incident photon ceases to exist. The kinetic energy imparted to the recoil electron is equal to the energy of the incident photon minus the binding energy of the electron. In the case of atoms with low atomic numbers (e.g., those in most bio-logic molecules), the binding energy is small and the recoil electron acquires most of the energy of the incident photon. Most photoelec-tric interactions occur in the 1s orbital because the density of the
From Gibbs SJ: Personal communication, 1986.
14 PART I ■ PHYSICS OF IONIZING RADIATION
electron cloud is greatest in this region and thus there is a higher probability of interaction. About 23% of interactions in a dental x-ray beam exposure involve photoelectric absorption.
An atom that has participated in a photoelectric interaction is ionized as a result of the loss of an electron. This electron defi ciency (usually in the 1s orbital) is instantly fi lled, usually by a 2s or 2p orbital electron, with the release of characteristic radiation (see Fig. 1-15 ). Whatever the orbital of the replacement electron, the characteristic photons generated are of such low energy that they are absorbed within the patient and do not fog the fi lm. Recoil electrons ejected during photoelectric absorption travel only short distances in the absorber before they give up their energy through secondary ionizations.
The clinical signifi cance of photoelectric absorption depends on the fact that the frequency of photoelectric interaction varies directly with the third power of the atomic number of the absorber. For example, because the effective atomic number of compact bone (Z = 13.8) is greater than that of soft tissue (Z = 7.4), the probability that a photon will be absorbed by a photoelectric interaction in bone is approxi-mately 6.5 times (13.8 3 /7.4 3 = 6.5) greater than in an equal thickness of soft tissue. This difference is readily seen on dental radiographs as a difference in optical density of the image. It is this difference in the absorption that makes the production of a radiographic image possible.
COMPTON SCATTERING
Compton scattering occurs when a photon interacts with an outer orbital electron ( Fig. 1-25 ). About 49% of interactions in a dental x-ray beam exposure involve Compton scattering. In this interaction the incident photon collides with an outer electron, which receives kinetic energy and recoils from the point of impact. The path of the incident photon is defl ected by this interaction and is scattered in a new direction from the site of the collision. The energy of the scattered photon equals the energy of the incident photon minus the sum of the kinetic energy gained by the recoil electron and its binding energy. As with photoelectric absorption, Compton scattering results in the loss of an electron and ionization of the absorbing atom. Scattered photons continue on their new paths, causing further ionizations. The recoil electrons also give up their energy by ionizing other atoms.
The probability of a Compton interaction is directly proportional to the electron density of the absorber. The number of electrons in bone (5.55 × 10 23 /cc) is greater than in soft tissue (3.34 × 10 23 /cc); therefore the probability of Compton scattering is correspondingly greater in bone than in tissue. As a result, Compton interactions con-tribute to the formation of an image.
Scattered photons travel in all directions. The higher the energy of the incident photon, however, the greater the probability that the angle of scatter of the secondary photon will be small and its direction will be forward. These scattered photons darken and degrade the image while carrying no useful information.
BEAM ATTENUATION
As an x-ray beam travels through matter, its intensity is reduced pri-marily through photoelectric absorption and Compton scattering. The absorption of the beam depends primarily on the thickness and density of the absorber and the energy of the beam. The reduction of beam intensity is predictable because it depends on physical charac-teristics of the beam and the absorber. A monochromatic beam of photons, a beam in which all the photons have the same energy, pro-vides a useful example. When only the primary (not scattered) photons are considered, a constant fraction of the beam is attenuated as the beam moves through each unit thickness of an absorber. Therefore 1.5 cm of water may reduce a beam intensity by 50%, the next 1.5 cm by another 50% (to 25% of the original intensity), and so on. This is an exponential pattern of absorption ( Fig. 1-26 ). The HVL described earlier in this chapter is a measure of beam energy describing the amount of an absorber that reduces the beam intensity by half; in the preceding example, the HVL is 1.5 cm of water.
Unlike the previous example, however, there is a wide range of photon energies in an x-ray beam. Low-energy photons are much more likely than high-energy photons to be absorbed. As a consequence, the superfi cial layers of an absorber tend to remove the low-energy photons and transmit the higher-energy photons. Therefore as an x-ray beam passes through matter, the intensity of the beam decreases, but the mean energy of the residual beam increases by preferential removal of low energy photons. In contrast to the absorption of a monochromatic beam, an x-ray beam is absorbed less and less by each succeeding unit
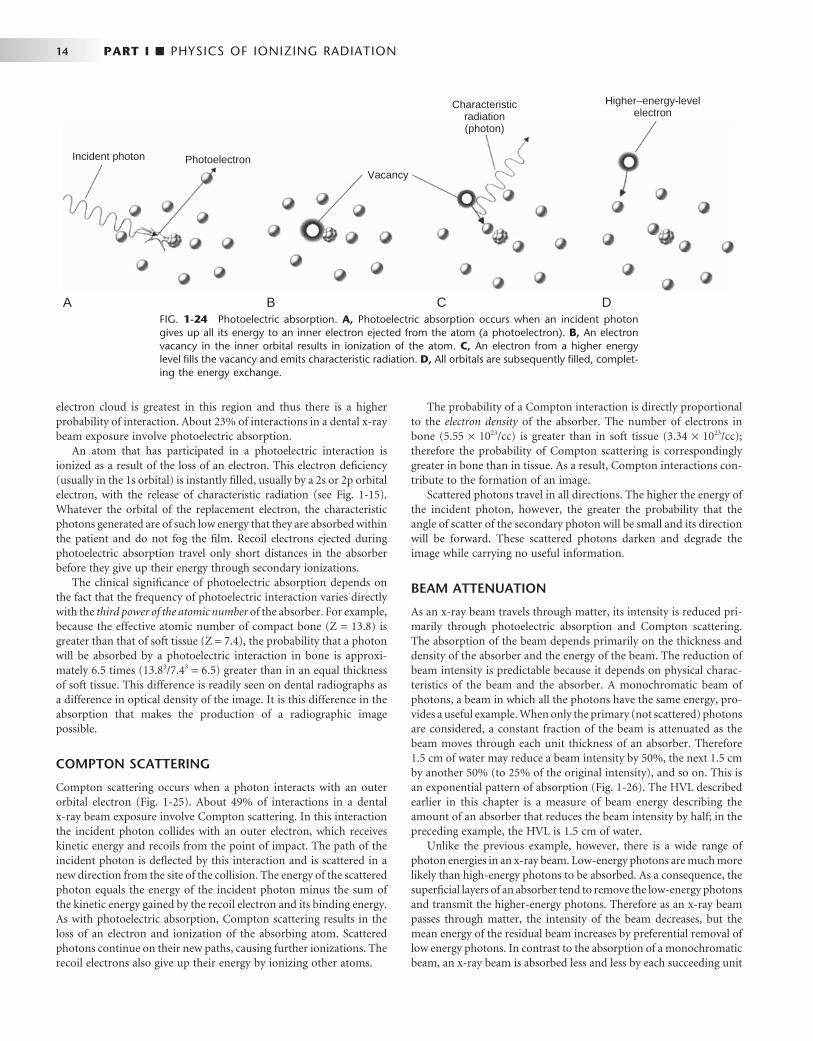
FIG. 1-24 Photoelectric absorption. A, Photoelectric absorption occurs when an incident photon gives up all its energy to an inner electron ejected from the atom (a photoelectron). B, An electron vacancy in the inner orbital results in ionization of the atom. C, An electron from a higher energy level fi lls the vacancy and emits characteristic radiation. D, All orbitals are subsequently fi lled, complet-ing the energy exchange.
PhotoelectronVacancy
Characteristicradiation(photon)
Higher–energy-levelelectron
Incident photon
A B C D
CHAPTER 1 ■ RADIATION PHYSICS 15
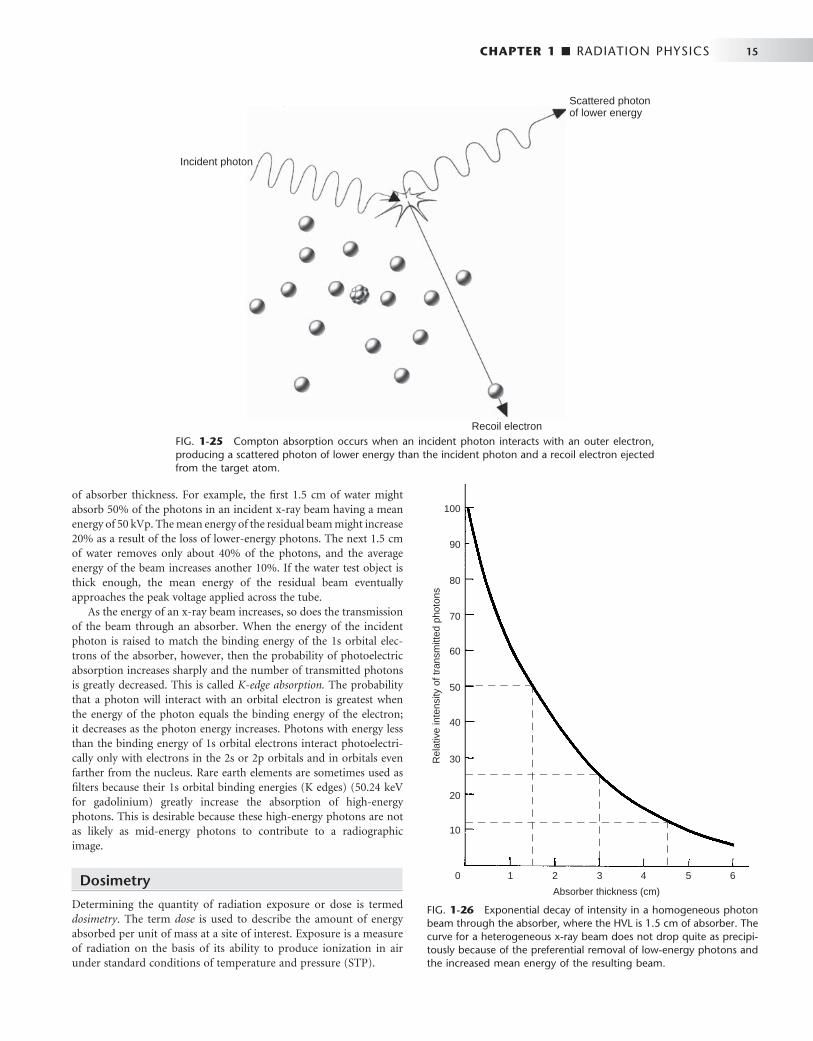
FIG. 1-25 Compton absorption occurs when an incident photon interacts with an outer electron, producing a scattered photon of lower energy than the incident photon and a recoil electron ejected from the target atom.
Recoil electron
Incident photon
Scattered photonof lower energy
FIG. 1-26 Exponential decay of intensity in a homogeneous photon beam through the absorber, where the HVL is 1.5 cm of absorber. The curve for a heterogeneous x-ray beam does not drop quite as precipi-tously because of the preferential removal of low-energy photons and the increased mean energy of the resulting beam.
21 3 54 6
Rel
ativ
e in
tens
ity o
f tra
nsm
itted
pho
tons
Absorber thickness (cm)
0
20
100
10
30
90
80
70
60
50
40
of absorber thickness. For example, the fi rst 1.5 cm of water might absorb 50% of the photons in an incident x-ray beam having a mean energy of 50 kVp. The mean energy of the residual beam might increase 20% as a result of the loss of lower-energy photons. The next 1.5 cm of water removes only about 40% of the photons, and the average energy of the beam increases another 10%. If the water test object is thick enough, the mean energy of the residual beam eventually approaches the peak voltage applied across the tube.
As the energy of an x-ray beam increases, so does the transmission of the beam through an absorber. When the energy of the incident photon is raised to match the binding energy of the 1s orbital elec-trons of the absorber, however, then the probability of photoelectric absorption increases sharply and the number of transmitted photons is greatly decreased. This is called K-edge absorption. The probability that a photon will interact with an orbital electron is greatest when the energy of the photon equals the binding energy of the electron; it decreases as the photon energy increases. Photons with energy less than the binding energy of 1s orbital electrons interact photoelectri-cally only with electrons in the 2s or 2p orbitals and in orbitals even farther from the nucleus. Rare earth elements are sometimes used as fi lters because their 1s orbital binding energies (K edges) (50.24 keV for gadolinium) greatly increase the absorption of high-energy photons. This is desirable because these high-energy photons are not as likely as mid-energy photons to contribute to a radiographic image.
Dosimetry
Determining the quantity of radiation exposure or dose is termed dosimetry . The term dose is used to describe the amount of energy absorbed per unit of mass at a site of interest. Exposure is a measure of radiation on the basis of its ability to produce ionization in air under standard conditions of temperature and pressure (STP).
16 PART I ■ PHYSICS OF IONIZING RADIATION
UNITS OF MEASUREMENT
Table 1-3 presents some of the more frequently used units for measur-ing quantities of radiation. In recent years a move has occurred to use a modernized version of the metric system called the SI system (Sys-t è me International d ’ Unit é s). * This book uses SI units. The SI system uses base units including the kilogram (kg) (mass), the meter (length), the second (time), the ampere (electric current), and the mole (amount of substance). SI-derived units, including newton (force) and joule (energy), evolve from these base units. The following units are SI-derived units with special names.
Exposure Exposure is a measure of radiation quantity, the capacity of radiation to ionize air. The SI unit of exposure is air kerma, an acronym for kinetic energy released in matter. Kerma measures the kinetic energy transferred from photons to electrons and is expressed in units of dose (gray [ Gy ] ), where 1 Gy equals 1 joule/kg. Kerma is the sum of the initial kinetic energies of all the charged particles liberated by uncharged ionizing radiation (neutrons and photons) in a sample of matter, divided by the mass of the sample. It has replaced the roentgen (R), the traditional unit of radiation exposure measured in air.
Absorbed Dose Absorbed dose is a measure of the energy absorbed by any type of ionizing radiation per unit of mass of any type of matter. The SI unit is the Gy, where 1 Gy equals 1 joule/kg. The traditional unit of absorbed dose is the rad (radiation absorbed dose) , where 1 rad is equivalent to 100 ergs per gram (g) of absorber. One gray equals 100 rads.
Equivalent Dose The equivalent dose (H T ) is used to compare the biologic effects of different types of radiation on a tissue or organ. Particulate radiations have a high LET and are more damaging to tissue than is low-LET radiation such as x rays. This relative biologic effectiveness of different types of radiation is called the radiation-weighting factor (W R ). For instance, deposition of 1 Gy of high-energy protons causes fi ve times as much damage as 1 Gy of x-ray photons. The W R of photons, the reference, is 1. The W R of 5 keV neutrons and high-energy protons is 5 and the W R of α particles is 20. To account for this difference, the H T is computed as the product of the absorbed dose (D T ) averaged over a tissue or organ and the W R :
H W DT R T= ×
The unit of equivalent dose is the sievert (Sv). For diagnostic x-ray
examinations 1 Sv equals 1 Gy. The traditional unit of equivalent dose is the rem (roentgen equivalent man). One sievert equals 100 rem.
Effective Dose The effective dose (E) is used to estimate the risk in humans. For exposures to a part of the body, for instance, the jaws, the effective dose measures the equivalent whole-body dose. This allows the risk from exposure to one region of the body to be compared with the risk from exposure to another region. In addition to considering the relative biologic effectiveness of different types of radiation, it also considers the radiosensitivity of different tissues for cancer forma-tion or heritable effect. The comparative radiosensitivities of differ-ent tissues are measured by the W T . The tissue-weighting factors include red bone marrow, breast, colon, lung, and stomach, all 0.12; gonads 0.08; bladder, esophagus, liver, and thyroid, all 0.04; bone surface, brain, salivary glands, and skin, all 0.01; and other specifi ed tissues totaling 0.12. Thus E is the sum of the products of the equivalent dose to each organ or tissue (H T ) and the tissue-weighting factor (W T ):
E W HT T= ×Σ
The unit of effective dose is the Sv.
Radioactivity The measurement of radioactivity (A) describes the decay rate of a sample of radioactive material. The SI unit is the becquerel (Bq); 1 Bq equals 1 disintegration/second. The traditional unit is the curie (Ci), which corresponds to the activity of 1 g of radium (3.7 × 10 10 disintegrations/second). Accordingly, 1 mCi equals 37 megaBq and 1 Bq equals 2.7 × 10 − 11 Ci.
BIBLIOGRAPHY 1 Bushberg JT : The essential physics of medical imaging , ed 2 , Baltimore , 2001 ,
Lippincott Williams & Wilkins . 2 Bushong SC : Radiologic science for technologists: physics, biology, and
protection , ed 7 , St Louis , 2001 , Mosby . 3 Greene B : The elegant universe , ed 1 , New York , 1999 , Vintage . 4 International Commission on Radiological Protection : Radiation protection:
radiological protection and safety in medicine , ICRP Publication No. 73, 1996 , Elsevier Science .
5 Sacks O : Uncle Tungsten: memories of a chemical boyhood , New York , 2002 , Vintage .
6 Wolbarst AB : Physics of radiology , ed 2 , Madison, Wis , 2005 , Medical Physics .
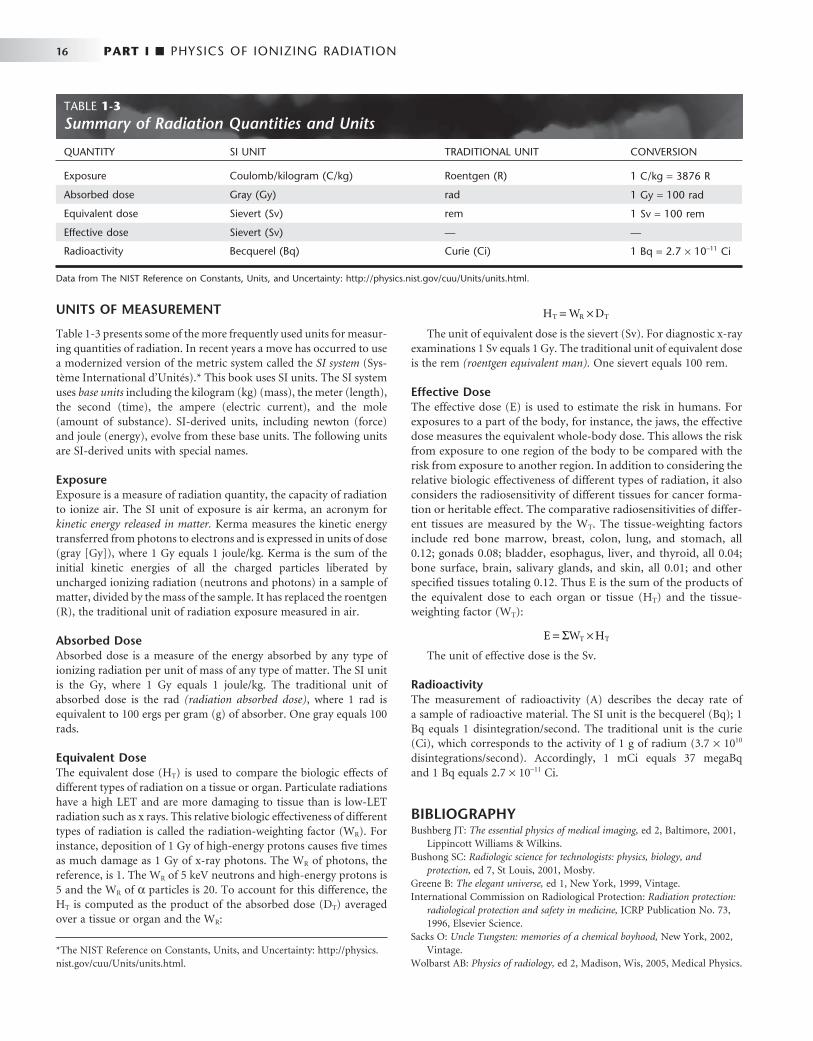
TABLE 1-3 Summary of Radiation Quantities and Units
QUANTITY SI UNIT TRADITIONAL UNIT CONVERSION
Exposure Coulomb/kilogram (C/kg) Roentgen (R) 1 C/kg = 3876 R
Absorbed dose Gray (Gy) rad 1 Gy = 100 rad
Equivalent dose Sievert (Sv) rem 1 Sv = 100 rem
Effective dose Sievert (Sv) — —
Radioactivity Becquerel (Bq) Curie (Ci) 1 Bq = 2.7 × 10 − 11 Ci
Data from The NIST Reference on Constants, Units, and Uncertainty: http://physics.nist.gov/cuu/Units/units.html.
* The NIST Reference on Constants, Units, and Uncertainty: http://physics.nist.gov/cuu/Units/units.html.
PART
TWO
Biologic Effects of Radiation

C H A P T E R 2
Radiobiology
Radiobiology is the study of the effects of ionizing radiation on living systems. This discipline requires studying many levels of organization within biologic systems spanning broad ranges
in size and temporal scale. The initial interaction between ionizing radiation and matter occurs at the level of the electron within the fi rst 10 − 13 second after exposure. These changes result in modifi cation of biologic molecules within the ensuing seconds to hours. In turn, the molecular changes may lead to alterations in cells and organisms that persist for hours, decades, and possibly even generations. These changes may result in injury or death.
Radiation Chemistry
Radiation acts on living systems through direct and indirect effects. When the energy of a photon or secondary electron ionizes biologic macromolecules, the effect is termed direct. Alternatively, a photon may be absorbed by water in an organism, ionizing some of its water molecules. The resulting ions form free radicals (radiolysis of water) that in turn interact with and produce changes in biologic molecules. Because intermediate changes involving water molecules are required to alter the biologic molecules, this series of events is termed indirect.
DIRECT EFFECT
In direct effects, biologic molecules (RH, where R is the molecule and H is a hydrogen atom) absorb energy from ionizing radiation and form unstable free radicals (atoms or molecules having an unpaired electron in the valence shell). Generation of free radicals occurs in less than 10 − 10 second after interaction with a photon. Free radicals are extremely reactive and have very short lives, quickly reforming into stable confi gurations by dissociation (breaking apart) or cross-linking (joining of two molecules). Free radicals play a dominant role in producing molecular changes in biologic molecules.
Free radical production:
RH x-radiation R H e+ → + ++ −i
Free radical fates: Dissociation:
R X Yi i→ +
Cross-linking:
R S RSi i+ →
Because the altered biologic molecules differ structurally and func-tionally from the original molecules, the consequence is a biologic change in the irradiated organism. Approximately one third of the bio-
logic effects of x-ray exposure result from direct effects. However, direct effects are the most common outcome for particulate radiation such as neutrons and α particles.
RADIOLYSIS OF WATER
Because water is the predominant molecule in biologic systems (about 70% by weight), it frequently participates in the interactions between x-ray photons and biologic molecules. A complex series of chemical changes occurs in water after exposure to ionizing radiation. Collec-tively these reactions result in the radiolysis of water.
photon H O H OH+ → +2
i i
Although the radiolysis of water is complex, on balance water is
largely converted to hydrogen and hydroxyl free radicals. When dis-solved oxygen is present in irradiated water, hydroperoxyl free radicals may also be formed:
H O HOi i+ →2 2
Hydroperoxyl free radicals contribute to the formation of hydro-gen peroxide in tissues:
HO H H O2 2 2
i i+ →
HO HO O H O2 2 2 2 2
i i+ → +
Both peroxyl radicals and hydrogen peroxide are oxidizing agents and are the primary toxins produced in the tissues by ionizing radiation.
INDIRECT EFFECTS
Indirect effects are those in which hydrogen and hydroxyl free radicals, produced by the action of radiation on water, interact with organic molecules. The interaction of hydrogen and hydroxyl free radicals with organic molecules results in the formation of organic free radi-cals. About two thirds of radiation-induced biologic damage results from indirect effects. Such reactions may involve the removal of hydrogen:
RH OH R H O
RH H R H
+ → ++ → +
i i
i i
2
2
The OH • free radical is more important in causing such damage. Organic free radicals are unstable and transform into stable, altered
molecules as described in the earlier section in this chapter on direct effects (p. 18). These altered molecules have different chemical and biologic properties from the original molecules.
18
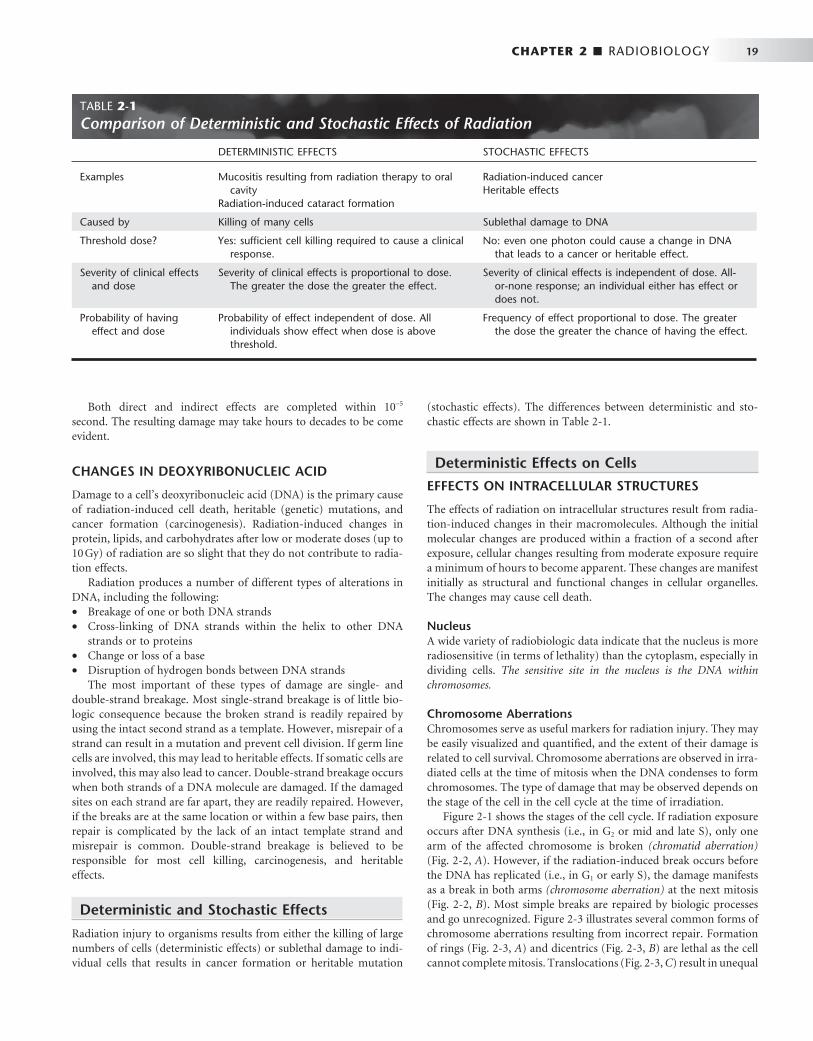
CHAPTER 2 ■ RADIOBIOLOGY 19
Both direct and indirect effects are completed within 10 − 5 second. The resulting damage may take hours to decades to be come evident.
CHANGES IN DEOXYRIBONUCLEIC ACID
Damage to a cell ’ s deoxyribonucleic acid (DNA) is the primary cause of radiation-induced cell death, heritable (genetic) mutations, and cancer formation (carcinogenesis). Radiation-induced changes in protein, lipids, and carbohydrates after low or moderate doses (up to 10 Gy) of radiation are so slight that they do not contribute to radia-tion effects.
Radiation produces a number of different types of alterations in DNA, including the following: • Breakage of one or both DNA strands • Cross-linking of DNA strands within the helix to other DNA
strands or to proteins • Change or loss of a base • Disruption of hydrogen bonds between DNA strands
The most important of these types of damage are single- and double-strand breakage. Most single-strand breakage is of little bio-logic consequence because the broken strand is readily repaired by using the intact second strand as a template. However, misrepair of a strand can result in a mutation and prevent cell division. If germ line cells are involved, this may lead to heritable effects. If somatic cells are involved, this may also lead to cancer. Double-strand breakage occurs when both strands of a DNA molecule are damaged. If the damaged sites on each strand are far apart, they are readily repaired. However, if the breaks are at the same location or within a few base pairs, then repair is complicated by the lack of an intact template strand and misrepair is common. Double-strand breakage is believed to be responsible for most cell killing, carcinogenesis, and heritable effects.
Deterministic and Stochastic Effects
Radiation injury to organisms results from either the killing of large numbers of cells (deterministic effects) or sublethal damage to indi-vidual cells that results in cancer formation or heritable mutation
(stochastic effects). The differences between deterministic and sto-chastic effects are shown in Table 2-1 .
Deterministic Effects on Cells
EFFECTS ON INTRACELLULAR STRUCTURES
The effects of radiation on intracellular structures result from radia-tion-induced changes in their macromolecules. Although the initial molecular changes are produced within a fraction of a second after exposure, cellular changes resulting from moderate exposure require a minimum of hours to become apparent. These changes are manifest initially as structural and functional changes in cellular organelles. The changes may cause cell death.
Nucleus A wide variety of radiobiologic data indicate that the nucleus is more radiosensitive (in terms of lethality) than the cytoplasm, especially in dividing cells. The sensitive site in the nucleus is the DNA within chromosomes.
Chromosome Aberrations Chromosomes serve as useful markers for radiation injury. They may be easily visualized and quantifi ed, and the extent of their damage is related to cell survival. Chromosome aberrations are observed in irra-diated cells at the time of mitosis when the DNA condenses to form chromosomes. The type of damage that may be observed depends on the stage of the cell in the cell cycle at the time of irradiation.
Figure 2-1 shows the stages of the cell cycle. If radiation exposure occurs after DNA synthesis (i.e., in G 2 or mid and late S), only one arm of the affected chromosome is broken (chromatid aberration) ( Fig. 2-2, A ). However, if the radiation-induced break occurs before the DNA has replicated (i.e., in G 1 or early S), the damage manifests as a break in both arms (chromosome aberration) at the next mitosis ( Fig. 2-2, B ). Most simple breaks are repaired by biologic processes and go unrecognized. Figure 2-3 illustrates several common forms of chromosome aberrations resulting from incorrect repair. Formation of rings ( Fig. 2-3, A ) and dicentrics ( Fig. 2-3, B ) are lethal as the cell cannot complete mitosis. Translocations ( Fig. 2-3, C ) result in unequal
TABLE 2-1 Comparison of Deterministic and Stochastic Effects of Radiation
DETERMINISTIC EFFECTS STOCHASTIC EFFECTS
Examples Mucositis resulting from radiation therapy to oral cavity
Radiation-induced cataract formation
Radiation-induced cancer Heritable effects
Caused by Killing of many cells Sublethal damage to DNA
Threshold dose? Yes: suffi cient cell killing required to cause a clinical response.
No: even one photon could cause a change in DNA that leads to a cancer or heritable effect.
Severity of clinical effects and dose
Severity of clinical effects is proportional to dose. The greater the dose the greater the effect.
Severity of clinical effects is independent of dose. All-or-none response; an individual either has effect or does not.
Probability of having effect and dose
Probability of effect independent of dose. All individuals show effect when dose is above threshold.
Frequency of effect proportional to dose. The greater the dose the greater the chance of having the effect.
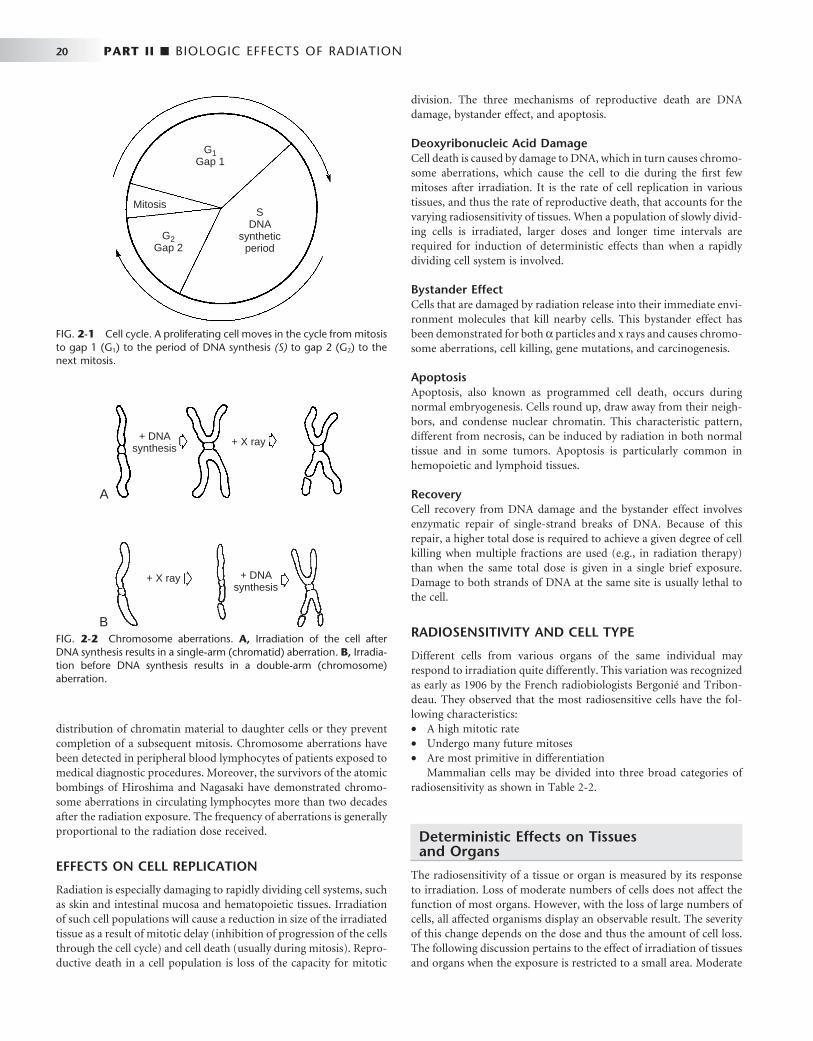
20 PART II ■ BIOLOGIC EFFECTS OF RADIATION
distribution of chromatin material to daughter cells or they prevent completion of a subsequent mitosis. Chromosome aberrations have been detected in peripheral blood lymphocytes of patients exposed to medical diagnostic procedures. Moreover, the survivors of the atomic bombings of Hiroshima and Nagasaki have demonstrated chromo-some aberrations in circulating lymphocytes more than two decades after the radiation exposure. The frequency of aberrations is generally proportional to the radiation dose received.
EFFECTS ON CELL REPLICATION
Radiation is especially damaging to rapidly dividing cell systems, such as skin and intestinal mucosa and hematopoietic tissues. Irradiation of such cell populations will cause a reduction in size of the irradiated tissue as a result of mitotic delay (inhibition of progression of the cells through the cell cycle) and cell death (usually during mitosis). Repro-ductive death in a cell population is loss of the capacity for mitotic
division. The three mechanisms of reproductive death are DNA damage, bystander effect, and apoptosis.
Deoxyribonucleic Acid Damage Cell death is caused by damage to DNA, which in turn causes chromo-some aberrations, which cause the cell to die during the fi rst few mitoses after irradiation. It is the rate of cell replication in various tissues, and thus the rate of reproductive death, that accounts for the varying radiosensitivity of tissues. When a population of slowly divid-ing cells is irradiated, larger doses and longer time intervals are required for induction of deterministic effects than when a rapidly dividing cell system is involved.
Bystander Effect Cells that are damaged by radiation release into their immediate envi-ronment molecules that kill nearby cells. This bystander effect has been demonstrated for both α particles and x rays and causes chromo-some aberrations, cell killing, gene mutations, and carcinogenesis.
Apoptosis Apoptosis, also known as programmed cell death, occurs during normal embryogenesis. Cells round up, draw away from their neigh-bors, and condense nuclear chromatin. This characteristic pattern, different from necrosis, can be induced by radiation in both normal tissue and in some tumors. Apoptosis is particularly common in hemopoietic and lymphoid tissues.
Recovery Cell recovery from DNA damage and the bystander effect involves enzymatic repair of single-strand breaks of DNA. Because of this repair, a higher total dose is required to achieve a given degree of cell killing when multiple fractions are used (e.g., in radiation therapy) than when the same total dose is given in a single brief exposure. Damage to both strands of DNA at the same site is usually lethal to the cell.
RADIOSENSITIVITY AND CELL TYPE
Different cells from various organs of the same individual may respond to irradiation quite differently. This variation was recognized as early as 1906 by the French radiobiologists Bergoni é and Tribon-deau. They observed that the most radiosensitive cells have the fol-lowing characteristics: • A high mitotic rate • Undergo many future mitoses • Are most primitive in differentiation
Mammalian cells may be divided into three broad categories of radiosensitivity as shown in Table 2-2 .
Deterministic Effects on Tissues and Organs
The radiosensitivity of a tissue or organ is measured by its response to irradiation. Loss of moderate numbers of cells does not affect the function of most organs. However, with the loss of large numbers of cells, all affected organisms display an observable result. The severity of this change depends on the dose and thus the amount of cell loss. The following discussion pertains to the effect of irradiation of tissues and organs when the exposure is restricted to a small area. Moderate
FIG. 2-1 Cell cycle. A proliferating cell moves in the cycle from mitosis to gap 1 (G 1 ) to the period of DNA synthesis (S) to gap 2 (G 2 ) to the next mitosis.
G2Gap 2
G1Gap 1
MitosisS
DNAsynthetic
period
FIG. 2-2 Chromosome aberrations. A, Irradiation of the cell after DNA synthesis results in a single-arm (chromatid) aberration. B, Irradia-tion before DNA synthesis results in a double-arm (chromosome) aberration.
+ DNAsynthesis
+ X ray
A
+ DNAsynthesis
+ X ray
B
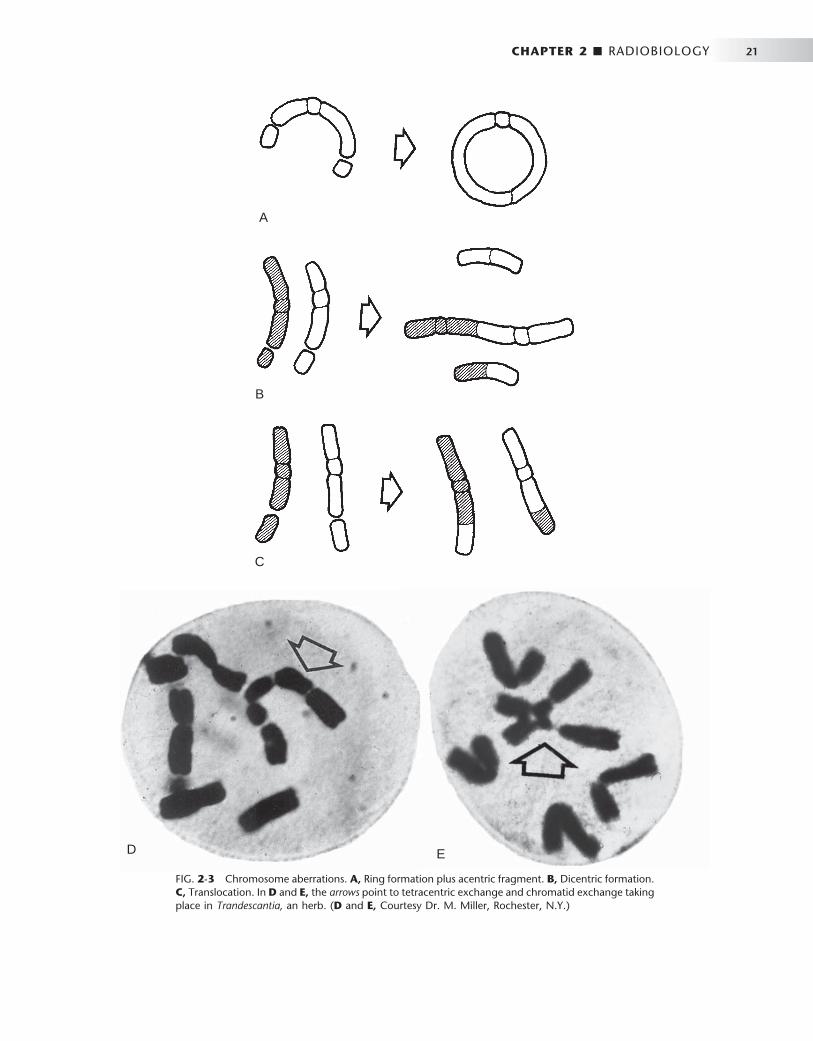
CHAPTER 2 ■ RADIOBIOLOGY 21
FIG. 2-3 Chromosome aberrations. A, Ring formation plus acentric fragment. B, Dicentric formation. C, Translocation. In D and E, the arrows point to tetracentric exchange and chromatid exchange taking place in Trandescantia, an herb. ( D and E, Courtesy Dr. M. Miller, Rochester, N.Y.)
A
B
C
ED
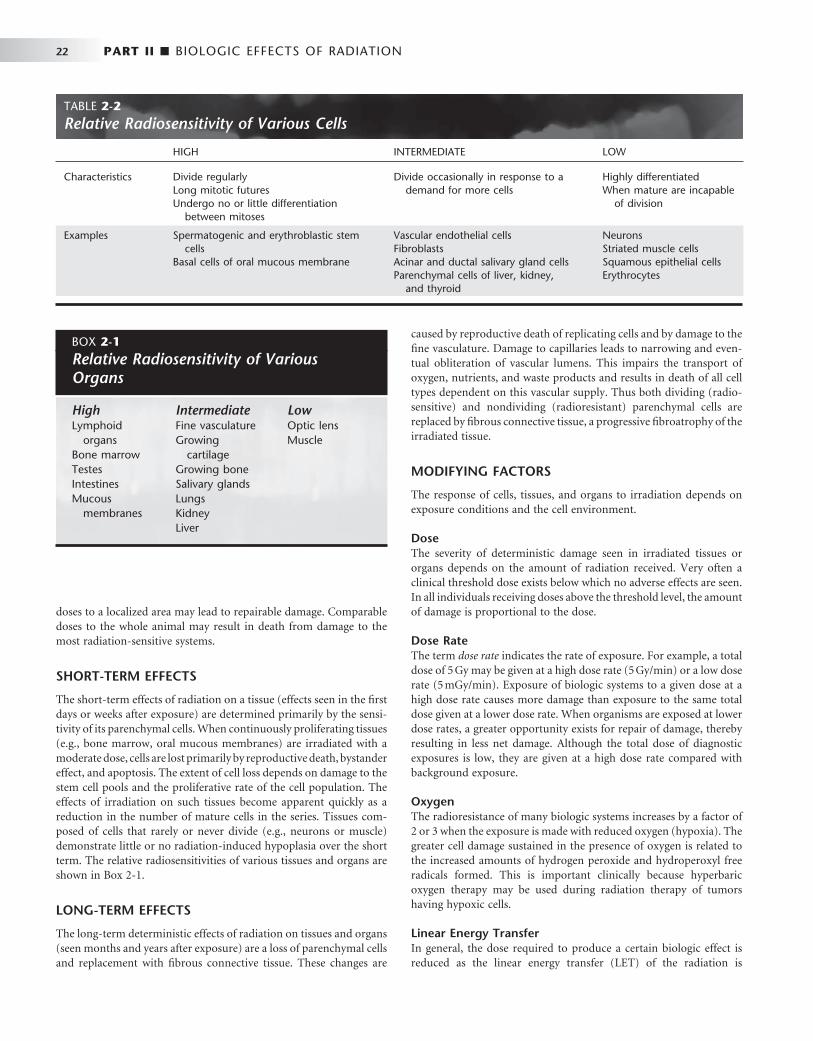
22 PART II ■ BIOLOGIC EFFECTS OF RADIATION
doses to a localized area may lead to repairable damage. Comparable doses to the whole animal may result in death from damage to the most radiation-sensitive systems.
SHORT-TERM EFFECTS
The short-term effects of radiation on a tissue (effects seen in the fi rst days or weeks after exposure) are determined primarily by the sensi-tivity of its parenchymal cells. When continuously proliferating tissues (e.g., bone marrow, oral mucous membranes) are irradiated with a moderate dose, cells are lost primarily by reproductive death, bystander effect, and apoptosis. The extent of cell loss depends on damage to the stem cell pools and the proliferative rate of the cell population. The effects of irradiation on such tissues become apparent quickly as a reduction in the number of mature cells in the series. Tissues com-posed of cells that rarely or never divide (e.g., neurons or muscle) demonstrate little or no radiation-induced hypoplasia over the short term. The relative radiosensitivities of various tissues and organs are shown in Box 2-1 .
LONG-TERM EFFECTS
The long-term deterministic effects of radiation on tissues and organs (seen months and years after exposure) are a loss of parenchymal cells and replacement with fi brous connective tissue. These changes are
caused by reproductive death of replicating cells and by damage to the fi ne vasculature. Damage to capillaries leads to narrowing and even-tual obliteration of vascular lumens. This impairs the transport of oxygen, nutrients, and waste products and results in death of all cell types dependent on this vascular supply. Thus both dividing (radio-sensitive) and nondividing (radioresistant) parenchymal cells are replaced by fi brous connective tissue, a progressive fi broatrophy of the irradiated tissue.
MODIFYING FACTORS
The response of cells, tissues, and organs to irradiation depends on exposure conditions and the cell environment.
Dose The severity of deterministic damage seen in irradiated tissues or organs depends on the amount of radiation received. Very often a clinical threshold dose exists below which no adverse effects are seen. In all individuals receiving doses above the threshold level, the amount of damage is proportional to the dose.
Dose Rate The term dose rate indicates the rate of exposure. For example, a total dose of 5 Gy may be given at a high dose rate (5 Gy/min) or a low dose rate (5 mGy/min). Exposure of biologic systems to a given dose at a high dose rate causes more damage than exposure to the same total dose given at a lower dose rate. When organisms are exposed at lower dose rates, a greater opportunity exists for repair of damage, thereby resulting in less net damage. Although the total dose of diagnostic exposures is low, they are given at a high dose rate compared with background exposure.
Oxygen The radioresistance of many biologic systems increases by a factor of 2 or 3 when the exposure is made with reduced oxygen (hypoxia). The greater cell damage sustained in the presence of oxygen is related to the increased amounts of hydrogen peroxide and hydroperoxyl free radicals formed. This is important clinically because hyperbaric oxygen therapy may be used during radiation therapy of tumors having hypoxic cells.
Linear Energy Transfer In general, the dose required to produce a certain biologic effect is reduced as the linear energy transfer (LET) of the radiation is
TABLE 2-2 Relative Radiosensitivity of Various Cells
HIGH INTERMEDIATE LOW
Characteristics Divide regularly Long mitotic futures Undergo no or little differentiation
between mitoses
Divide occasionally in response to a demand for more cells
Highly differentiated When mature are incapable
of division
Examples Spermatogenic and erythroblastic stem cells
Basal cells of oral mucous membrane
Vascular endothelial cells Fibroblasts Acinar and ductal salivary gland cells Parenchymal cells of liver, kidney,
and thyroid
Neurons Striated muscle cells Squamous epithelial cells Erythrocytes
BOX 2-1
Relative Radiosensitivity of Various Organs
High Lymphoid
organs Bone marrow Testes Intestines Mucous
membranes
Intermediate Fine vasculature Growing
cartilage Growing bone Salivary glands Lungs Kidney Liver
Low Optic lens Muscle
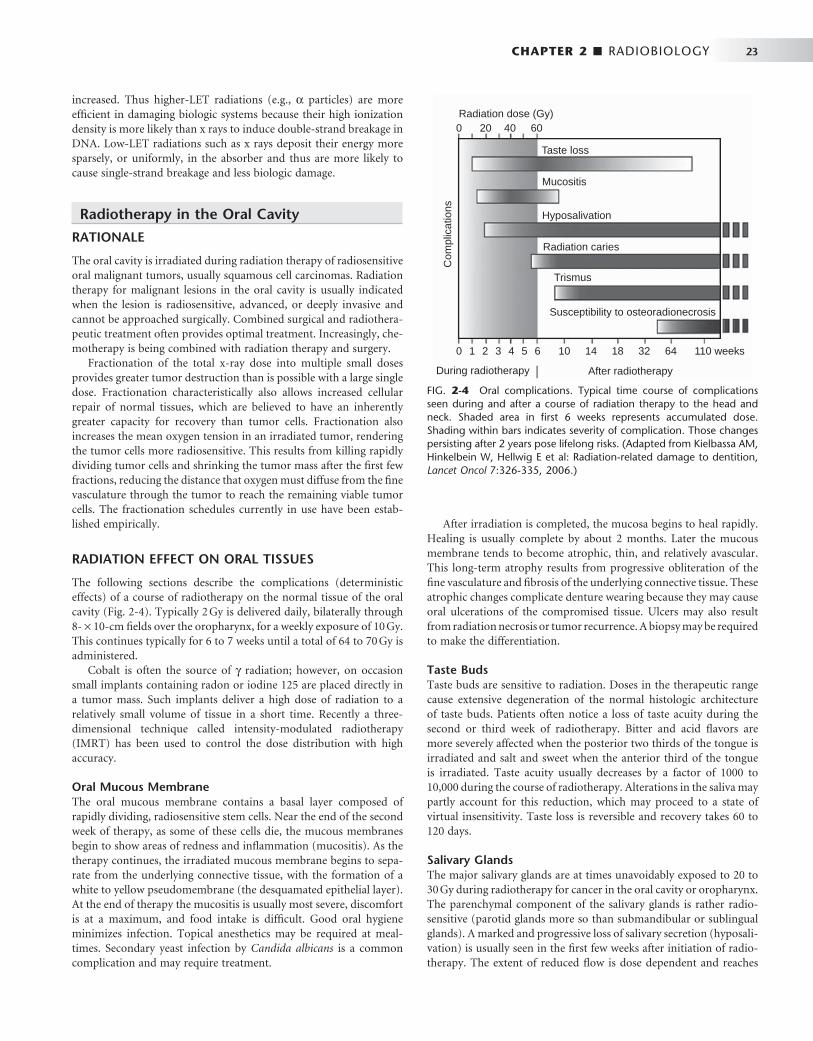
CHAPTER 2 ■ RADIOBIOLOGY 23
increased. Thus higher-LET radiations (e.g., α particles) are more effi cient in damaging biologic systems because their high ionization density is more likely than x rays to induce double-strand breakage in DNA. Low-LET radiations such as x rays deposit their energy more sparsely, or uniformly, in the absorber and thus are more likely to cause single-strand breakage and less biologic damage.
Radiotherapy in the Oral Cavity
RATIONALE
The oral cavity is irradiated during radiation therapy of radiosensitive oral malignant tumors, usually squamous cell carcinomas. Radiation therapy for malignant lesions in the oral cavity is usually indicated when the lesion is radiosensitive, advanced, or deeply invasive and cannot be approached surgically. Combined surgical and radiothera-peutic treatment often provides optimal treatment. Increasingly, che-motherapy is being combined with radiation therapy and surgery.
Fractionation of the total x-ray dose into multiple small doses provides greater tumor destruction than is possible with a large single dose. Fractionation characteristically also allows increased cellular repair of normal tissues, which are believed to have an inherently greater capacity for recovery than tumor cells. Fractionation also increases the mean oxygen tension in an irradiated tumor, rendering the tumor cells more radiosensitive. This results from killing rapidly dividing tumor cells and shrinking the tumor mass after the fi rst few fractions, reducing the distance that oxygen must diffuse from the fi ne vasculature through the tumor to reach the remaining viable tumor cells. The fractionation schedules currently in use have been estab-lished empirically.
RADIATION EFFECT ON ORAL TISSUES
The following sections describe the complications (deterministic effects) of a course of radiotherapy on the normal tissue of the oral cavity ( Fig. 2-4 ). Typically 2 Gy is delivered daily, bilaterally through 8- × 10-cm fi elds over the oropharynx, for a weekly exposure of 10 Gy. This continues typically for 6 to 7 weeks until a total of 64 to 70 Gy is administered.
Cobalt is often the source of γ radiation; however, on occasion small implants containing radon or iodine 125 are placed directly in a tumor mass. Such implants deliver a high dose of radiation to a relatively small volume of tissue in a short time. Recently a three-dimensional technique called intensity-modulated radiotherapy (IMRT) has been used to control the dose distribution with high accuracy.
Oral Mucous Membrane The oral mucous membrane contains a basal layer composed of rapidly dividing, radiosensitive stem cells. Near the end of the second week of therapy, as some of these cells die, the mucous membranes begin to show areas of redness and infl ammation (mucositis). As the therapy continues, the irradiated mucous membrane begins to sepa-rate from the underlying connective tissue, with the formation of a white to yellow pseudomembrane (the desquamated epithelial layer). At the end of therapy the mucositis is usually most severe, discomfort is at a maximum, and food intake is diffi cult. Good oral hygiene minimizes infection. Topical anesthetics may be required at meal-times. Secondary yeast infection by Candida albicans is a common complication and may require treatment.
After irradiation is completed, the mucosa begins to heal rapidly. Healing is usually complete by about 2 months. Later the mucous membrane tends to become atrophic, thin, and relatively avascular. This long-term atrophy results from progressive obliteration of the fi ne vasculature and fi brosis of the underlying connective tissue. These atrophic changes complicate denture wearing because they may cause oral ulcerations of the compromised tissue. Ulcers may also result from radiation necrosis or tumor recurrence. A biopsy may be required to make the differentiation.
Taste Buds Taste buds are sensitive to radiation. Doses in the therapeutic range cause extensive degeneration of the normal histologic architecture of taste buds. Patients often notice a loss of taste acuity during the second or third week of radiotherapy. Bitter and acid fl avors are more severely affected when the posterior two thirds of the tongue is irradiated and salt and sweet when the anterior third of the tongue is irradiated. Taste acuity usually decreases by a factor of 1000 to 10,000 during the course of radiotherapy. Alterations in the saliva may partly account for this reduction, which may proceed to a state of virtual insensitivity. Taste loss is reversible and recovery takes 60 to 120 days.
Salivary Glands The major salivary glands are at times unavoidably exposed to 20 to 30 Gy during radiotherapy for cancer in the oral cavity or oropharynx. The parenchymal component of the salivary glands is rather radio-sensitive (parotid glands more so than submandibular or sublingual glands). A marked and progressive loss of salivary secretion (hyposali-vation) is usually seen in the fi rst few weeks after initiation of radio-therapy. The extent of reduced fl ow is dose dependent and reaches
FIG. 2-4 Oral complications. Typical time course of complications seen during and after a course of radiation therapy to the head and neck. Shaded area in fi rst 6 weeks represents accumulated dose. Shading within bars indicates severity of complication. Those changes persisting after 2 years pose lifelong risks. (Adapted from Kielbassa AM, Hinkelbein W, Hellwig E et al: Radiation-related damage to dentition, Lancet Oncol 7:326-335, 2006.)
During radiotherapy After radiotherapy
Taste loss
Mucositis
Hyposalivation
Radiation caries
Trismus
Susceptibility to osteoradionecrosis
0 20 40 60
0 1 2 3 4 5 6 10 14 18 32 64 110 weeks
Radiation dose (Gy)
Com
plic
atio
ns

24 PART II ■ BIOLOGIC EFFECTS OF RADIATION
essentially zero at 60 Gy. The mouth becomes dry (xerostomia) and tender, and swallowing is diffi cult and painful. Patients with irradiation of both parotid glands are more likely to complain of dry mouth and diffi culty with chewing and swallowing than are those with unilateral irradiation. Various saliva substitutes are available to help restore function. Use of IMRT has helped to spare the contralateral salivary glands and thus minimize the loss of salivary function.
The reduced volume of saliva in patients receiving radiation therapy that includes the major salivary glands is altered from normal. Because serous cells are more radiosensitive than mucous cells, the residual saliva is more viscous than usual. Further, the small volume of viscous saliva that is secreted usually has a pH value 1 unit below normal (i.e., an average of 5.5 in irradiated patients compared with 6.5 in unexposed individuals). This pH is low enough to initi-ate decalcifi cation of normal enamel. In addition, the buffering capacity of saliva falls as much as 44% during radiation therapy. If some portions of the major salivary glands are spared, dryness of the mouth usually subsides in 6 to 12 months because of compensa-tory hypertrophy of residual salivary gland tissue. Reduced salivary fl ow that persists beyond a year is unlikely to show signifi cant recovery.
Histologically, an acute infl ammatory response may occur soon after the initiation of therapy, particularly involving the serous acini. In the months after irradiation the infl ammatory response becomes more chronic, and the glands demonstrate progressive fi brosis, adipo-sis, loss of fi ne vasculature, and concomitant parenchymal degenera-tion ( Fig. 2-5 ), thus accounting for the xerostomia.
Teeth Children receiving radiation therapy to the jaws may show defects in the permanent dentition such as retarded root development, dwarfed teeth, or failure to form one or more teeth ( Fig. 2-6 ). If exposure precedes calcifi cation, irradiation may destroy the tooth bud. Irradia-tion after calcifi cation has begun may inhibit cellular differentiation, causing malformations and arresting general growth. Such exposure may retard or abort root formation, but the eruptive mechanism of teeth is relatively radiation resistant. Irradiated teeth with altered root formation still erupt. In general, the severity of the damage is dose dependent.
Adult teeth are resistant to the direct effects of radiation exposure. Pulpal tissue demonstrates long-term fi broatrophy after irradiation. Radiation has no discernible effect on the crystalline structure of enamel, dentin, or cementum, and radiation does not increase their solubility.
Radiation Caries Radiation caries is a rampant form of dental decay that may occur in individuals who receive a course of radiotherapy that includes expo-sure of the salivary glands. After radiotherapy that includes the major salivary glands, the microfl ora undergo a pronounced change, render-ing them acidogenic in the saliva and plaque. Patients receiving radia-tion therapy to oral structures have increases in Streptococcus mutans, Lactobacillus, and Candida . Caries results from changes in the salivary glands and saliva, including reduced fl ow, decreased pH, reduced buff-ering capacity, increased viscosity, and altered fl ora. The residual saliva in individuals with xerostomia also has a low concentration of Ca+2
FIG. 2-5 Radiation effects on human submandibular salivary glands. A, Normal gland. B, A gland 6 months after exposure to radiotherapy. Note the loss of acini and presence of chronic infl ammatory cells. C, A gland 1 year after exposure to radiotherapy. Note the loss of acini and extensive fi brosis.
A B
C
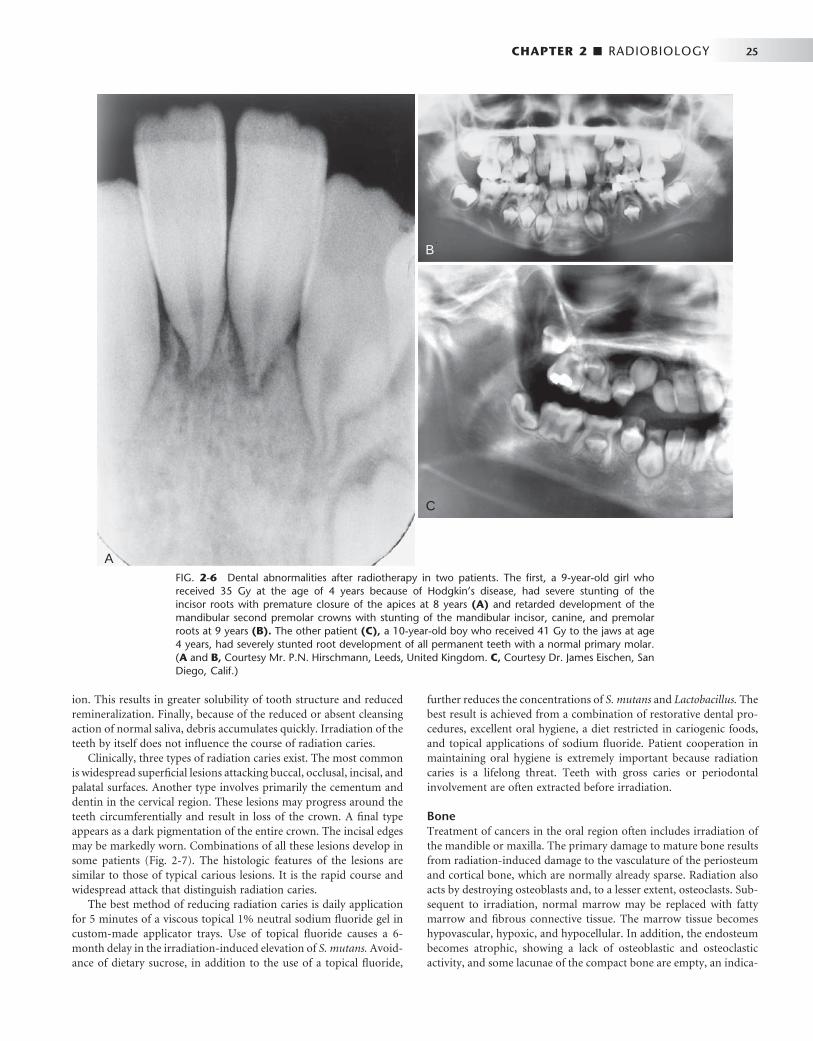
CHAPTER 2 ■ RADIOBIOLOGY 25
ion. This results in greater solubility of tooth structure and reduced remineralization. Finally, because of the reduced or absent cleansing action of normal saliva, debris accumulates quickly. Irradiation of the teeth by itself does not infl uence the course of radiation caries.
Clinically, three types of radiation caries exist. The most common is widespread superfi cial lesions attacking buccal, occlusal, incisal, and palatal surfaces. Another type involves primarily the cementum and dentin in the cervical region. These lesions may progress around the teeth circumferentially and result in loss of the crown. A fi nal type appears as a dark pigmentation of the entire crown. The incisal edges may be markedly worn. Combinations of all these lesions develop in some patients ( Fig. 2-7 ). The histologic features of the lesions are similar to those of typical carious lesions. It is the rapid course and widespread attack that distinguish radiation caries.
The best method of reducing radiation caries is daily application for 5 minutes of a viscous topical 1% neutral sodium fl uoride gel in custom-made applicator trays. Use of topical fl uoride causes a 6-month delay in the irradiation-induced elevation of S. mutans. Avoid-ance of dietary sucrose, in addition to the use of a topical fl uoride,
further reduces the concentrations of S. mutans and Lactobacillus. The best result is achieved from a combination of restorative dental pro-cedures, excellent oral hygiene, a diet restricted in cariogenic foods, and topical applications of sodium fl uoride. Patient cooperation in maintaining oral hygiene is extremely important because radiation caries is a lifelong threat. Teeth with gross caries or periodontal involvement are often extracted before irradiation.
Bone Treatment of cancers in the oral region often includes irradiation of the mandible or maxilla. The primary damage to mature bone results from radiation-induced damage to the vasculature of the periosteum and cortical bone, which are normally already sparse. Radiation also acts by destroying osteoblasts and, to a lesser extent, osteoclasts. Sub-sequent to irradiation, normal marrow may be replaced with fatty marrow and fi brous connective tissue. The marrow tissue becomes hypovascular, hypoxic, and hypocellular. In addition, the endosteum becomes atrophic, showing a lack of osteoblastic and osteoclastic activity, and some lacunae of the compact bone are empty, an indica-
FIG. 2-6 Dental abnormalities after radiotherapy in two patients. The fi rst, a 9-year-old girl who received 35 Gy at the age of 4 years because of Hodgkin ’ s disease, had severe stunting of the incisor roots with premature closure of the apices at 8 years (A) and retarded development of the mandibular second premolar crowns with stunting of the mandibular incisor, canine, and premolar roots at 9 years (B). The other patient (C), a 10-year-old boy who received 41 Gy to the jaws at age 4 years, had severely stunted root development of all permanent teeth with a normal primary molar. ( A and B, Courtesy Mr. P.N. Hirschmann, Leeds, United Kingdom. C, Courtesy Dr. James Eischen, San Diego, Calif.)
A
B
C
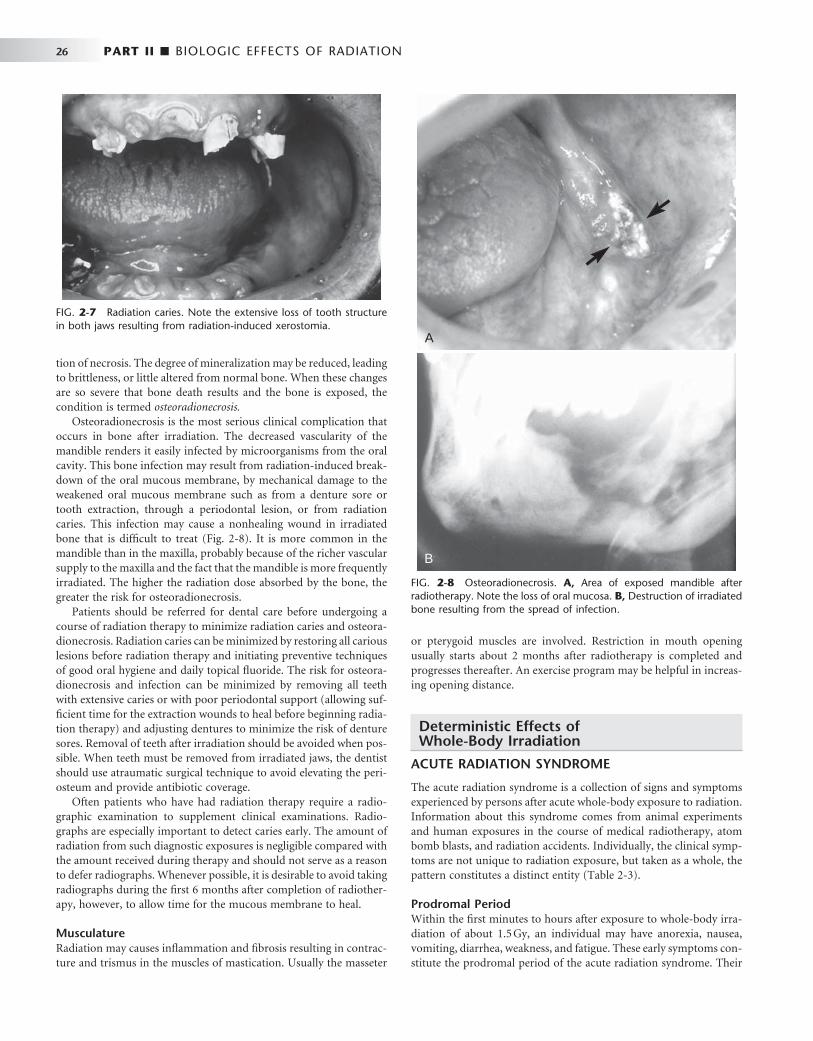
26 PART II ■ BIOLOGIC EFFECTS OF RADIATION
FIG. 2-7 Radiation caries. Note the extensive loss of tooth structure in both jaws resulting from radiation-induced xerostomia.
tion of necrosis. The degree of mineralization may be reduced, leading to brittleness, or little altered from normal bone. When these changes are so severe that bone death results and the bone is exposed, the condition is termed osteoradionecrosis.
Osteoradionecrosis is the most serious clinical complication that occurs in bone after irradiation. The decreased vascularity of the mandible renders it easily infected by microorganisms from the oral cavity. This bone infection may result from radiation-induced break-down of the oral mucous membrane, by mechanical damage to the weakened oral mucous membrane such as from a denture sore or tooth extraction, through a periodontal lesion, or from radiation caries. This infection may cause a nonhealing wound in irradiated bone that is diffi cult to treat ( Fig. 2-8 ). It is more common in the mandible than in the maxilla, probably because of the richer vascular supply to the maxilla and the fact that the mandible is more frequently irradiated. The higher the radiation dose absorbed by the bone, the greater the risk for osteoradionecrosis.
Patients should be referred for dental care before undergoing a course of radiation therapy to minimize radiation caries and osteora-dionecrosis. Radiation caries can be minimized by restoring all carious lesions before radiation therapy and initiating preventive techniques of good oral hygiene and daily topical fl uoride. The risk for osteora-dionecrosis and infection can be minimized by removing all teeth with extensive caries or with poor periodontal support (allowing suf-fi cient time for the extraction wounds to heal before beginning radia-tion therapy) and adjusting dentures to minimize the risk of denture sores. Removal of teeth after irradiation should be avoided when pos-sible. When teeth must be removed from irradiated jaws, the dentist should use atraumatic surgical technique to avoid elevating the peri-osteum and provide antibiotic coverage.
Often patients who have had radiation therapy require a radio-graphic examination to supplement clinical examinations. Radio-graphs are especially important to detect caries early. The amount of radiation from such diagnostic exposures is negligible compared with the amount received during therapy and should not serve as a reason to defer radiographs. Whenever possible, it is desirable to avoid taking radiographs during the fi rst 6 months after completion of radiother-apy, however, to allow time for the mucous membrane to heal.
Musculature Radiation may causes infl ammation and fi brosis resulting in contrac-ture and trismus in the muscles of mastication. Usually the masseter
or pterygoid muscles are involved. Restriction in mouth opening usually starts about 2 months after radiotherapy is completed and progresses thereafter. An exercise program may be helpful in increas-ing opening distance.
Deterministic Effects of Whole-Body Irradiation
ACUTE RADIATION SYNDROME
The acute radiation syndrome is a collection of signs and symptoms experienced by persons after acute whole-body exposure to radiation. Information about this syndrome comes from animal experiments and human exposures in the course of medical radiotherapy, atom bomb blasts, and radiation accidents. Individually, the clinical symp-toms are not unique to radiation exposure, but taken as a whole, the pattern constitutes a distinct entity ( Table 2-3 ).
Prodromal Period Within the fi rst minutes to hours after exposure to whole-body irra-diation of about 1.5 Gy, an individual may have anorexia, nausea, vomiting, diarrhea, weakness, and fatigue. These early symptoms con-stitute the prodromal period of the acute radiation syndrome. Their
FIG. 2-8 Osteoradionecrosis. A, Area of exposed mandible after radiotherapy. Note the loss of oral mucosa. B, Destruction of irradiated bone resulting from the spread of infection.
A
B

CHAPTER 2 ■ RADIOBIOLOGY 27
cause is not clear but probably involves the autonomic nervous system. The severity and time of onset may be of signifi cant prognostic value because they are dose related: the higher the dose, the more rapid the onset and the greater the severity of symptoms.
Latent Period After the prodromal reaction comes a latent period of apparent well-being during which no signs or symptoms of radiation sickness occur. The extent of the latent period is also dose related. It extends from hours or days after supralethal exposures (greater than approximately 5 Gy) to a few weeks after exposures of about 2 Gy.
Hematopoietic Syndrome Whole-body exposures of 2 to 7 Gy cause injury to the hematopoietic stem cells of the bone marrow and spleen. The high mitotic activity of these cells makes bone marrow a highly radiosensitive tissue. Doses in this range cause a rapid fall in the numbers of circulating granulo-cytes, platelets, and fi nally erythrocytes ( Fig. 2-9 ). Although mature circulating granulocytes, platelets, and erythrocytes are radioresistant because they are nonreplicating cells, their paucity in the peripheral blood after irradiation refl ects the radiosensitivity of their precursors. The rate of fall in the circulating levels of a cell depends on the life span of that cell in the peripheral blood. Granulocytes, with short lives
in circulation, fall off in a few days, whereas red blood cells, with long lives in circulation, fall off slowly.
The clinical signs of the hematopoietic syndrome include infection (from lymphopenia and granulocytopenia), hemorrhage (from loss of platelets), and anemia (from erythrocyte depletion). The probabil-ity of death is low after exposures at the low end of this range but much higher at the high end. When death results from the hemato-poietic syndrome, it usually occurs 10 to 30 days after irradiation.
Gastrointestinal Syndrome The gastrointestinal syndrome is caused by whole-body exposures in the range of 7 to 15 Gy, which causes extensive damage to the gastro-intestinal system in addition to the hematopoietic damage described previously. Exposure in this dose range causes considerable injury to the rapidly proliferating basal epithelial cells of the intestinal villi and leads to rapid loss of the epithelial layer of the intestinal mucosa. Because of the denuded mucosal surface, there is loss of plasma and electrolytes, loss of effi cient intestinal absorption, and ulceration of the mucosal lining with hemorrhaging into the intestines. These changes are responsible for the diarrhea, dehydration, and loss of weight. Endogenous intestinal bacteria readily invade the denuded surface, producing septicemia.
At about the time that developing damage to the gastrointestinal system reaches a maximum, the effect of bone marrow depression is beginning to be manifested. The result is a marked lowering of the body ’ s defense against bacterial infection and a decrease in effective-ness of the clotting mechanism. The combined effects of damage to these hematopoietic and gastrointestinal stem cell systems cause death within 2 weeks from fl uid and electrolyte loss, infection, and possibly nutritional impairment. Thirty of the fi refi ghters at the accident site at Chernobyl, Ukraine, died in the fi rst few months of the hemato-poietic or gastrointestinal syndrome.
Cardiovascular and Central Nervous System Syndrome Exposures in excess of 50 Gy usually cause death in 1 to 2 days. The few humans who have been exposed at this level showed collapse of the circulatory system with a precipitous fall in blood pressure in the hours preceding death. Autopsy revealed necrosis of cardiac muscle.
TABLE 2-3 Acute Radiation Syndrome
DOSE (Gy) MANIFESTATION
1 to 2 Prodromal symptoms
2 to 4 Mild hematopoietic symptoms
4 to 7 Severe hematopoietic symptoms
7 to 15 Gastrointestinal symptoms
50 Cardiovascular and central nervous system symptoms
FIG. 2-9 Radiation effects on blood cells. When whole-body exposure inhibits the replacement of circulating cells by stem cell proliferation, the duration of the cir-culating cells’ survival is largely determined by their life span.
Time after radiation exposure (days)
20
Granulocytes
0 5 10 15 20 25
Per
cent
of c
ontr
ol c
ells
Platelets
Erythrocytes
Lymphocytes40
60
80
100

28 PART II ■ BIOLOGIC EFFECTS OF RADIATION
Victims also may show intermittent stupor, incoordination, disorien-tation, and convulsions suggestive of extensive damage to the nervous system. Although the precise mechanism is not fully understood, these latter symptoms most likely result from radiation-induced damage to the neurons and fi ne vasculature of the brain.
Management of Acute Radiation Syndrome The presenting clinical problems govern the management of different forms of acute radiation syndrome. Antibiotics are indicated when the granulocyte count falls. Fluid and electrolyte replacement is used as necessary. Whole blood transfusions are used to treat anemia, and platelets may be administered to arrest thrombocytopenia. Bone marrow grafts are indicated between identical twins because there is no risk for graft-versus-host disease.
RADIATION EFFECTS ON EMBRYOS AND FETUSES
The effects of radiation on human embryos and fetuses have been studied in animals and in women exposed to diagnostic or therapeutic radiation during pregnancy and those exposed to radiation from the atomic bombs dropped at Hiroshima and Nagasaki. Embryos and fetuses are considerably more radiosensitive than adults because most embryonic cells are relatively undifferentiated and rapidly mitotic.
Exposures in the range of 2 to 3 Gy during the fi rst few days after conception are thought to cause undetectable death of the embryo. The cells in the embryo are dividing rapidly and are highly sensitive to radiation. Lethality is common and many of these embryos fail to implant in the uterine wall. The fi rst 15 weeks includes the period of organogenesis when the major organ systems form. The most common abnormalities among the Japanese children exposed early in gestation were reduced growth that persists through life and reduced head cir-cumference (microcephaly), often associated with mental retardation. Other abnormalities included small birth size, cataracts, genital and skeletal malformations, and microphthalmia. The period of maximal sensitivity of the brain is 8 to 15 weeks after conception. The fre-quency of severe mental retardation after exposure to 1 Gy during this period is about 43%. These effects are deterministic in nature and are believed to have a threshold of about 0.1 to 0.2 Gy. This threshold dose is 400 to 800 times higher than the exposure from a dental examina-tion (0.25 mGy from a full-mouth examination when a leaded apron is used).
LATE EFFECTS
A number of late deterministic effects have been found in the survi-vors of the atomic bombing of Hiroshima and Nagasaki.
Growth and Development Children exposed in the bombings showed impairment of growth and development. They have reduced height, weight, and skeletal develop-ment. The younger the individual was at the time of exposure, the more pronounced the effects.
Cataracts The threshold for induction of cataracts (opacities in the lens of the eye) ranges from about 0.6 Gy when the dose is received in a single exposure to more than 5 Gy when the dose is received in multiple exposures over a period of weeks. These doses are much larger than those from dental radiography. Most affected individuals are unaware of their presence.
Life Span Shortening The survivors of the atomic bombings show a clear decrease in median life expectancy with increasing radiation dose. The reduction ranges from 2 months up to 2.6 years by dose group, with an overall mean of 4 months. Survivors demonstrate increased frequency of heart disease, stroke, and diseases of the digestive, respiratory, and hemato-poietic systems.
Stochastic Effects
Stochastic effects result from sublethal changes in the DNA of indi-vidual cells. The most important consequence of such damage is car-cinogenesis. Heritable effects, although much less likely, can also occur.
CARCINOGENESIS
Radiation causes cancer by modifying DNA. The most likely mecha-nism is radiation-induced gene mutation. Most investigators think that radiation acts as an initiator, that is, it induces a change in the cell so that it no longer undergoes terminal differentiation. Evidence also exists that radiation acts as a promoter, stimulating cells to mul-tiply. Finally, it may also convert premalignant cells into malignant ones, for instance, conversion of proto-oncogenes to oncogenes. Gene mutations may also involve a loss of function in the case of tumor-suppressor genes. Data on radiation-induced cancers come primarily from populations of people who have been exposed to high levels of radiation; however, in principle, even low doses of radiation may initi-ate cancer formation in a single cell.
Estimation of the number of cancers induced by radiation is dif-fi cult. Radiation-induced cancers are not distinguishable from cancers produced by other causes. This means that the number of cancers can be estimated only as the number of excess cases found in exposed groups compared with the number in unexposed groups of people. The group of individuals most intensively studied for estimating the cancer risk from radiation is the Japanese atomic bomb survivors. The cases of more than 120,000 individuals have been followed since 1950, of whom 91,000 were exposed. The incidences of deaths from leuke-mias and solid cancers are shown in Tables 2-4 and 2-5 . The risk for most solid cancers increases linearly with dose.
Most individuals in these studies received exposures far in excess of the diagnostic range. Thus the probability that a cancer will result from a small dose can be estimated only by extrapolation from the rates observed after exposure to larger doses (see Chapter 3 ). Box 2-2
TABLE 2-4 Cancer Mortality Rate in 86,611 Atomic Bomb Survivors Having 47,685 Deaths from All Causes (1950-2000)
LEUKEMIAS SOLID CANCERS
Deaths 296 10,127
Radiation induced 93 479
Data adapted from Preston DL, Pierce DA, Shimizu Y et al: Effect of recent changes in atomic bomb survivor dosimetry on cancer mortality risk estimates, Radiat Res 162:377-389, 2004.

CHAPTER 2 ■ RADIOBIOLOGY 29
shows the radiosensitivity of various tissues in terms of susceptibility to radiation-induced cancer. The following discussion of radiation carcinogenesis pertains primarily to those organs exposed in the course of dental radiography.
Leukemia The incidence of leukemia (other than chronic lymphocytic leukemia) rises after exposure of the bone marrow to radiation. Atomic bomb survivors and patients irradiated for ankylosing spondylitis show a wave of leukemias beginning soon after exposure and peaking at around 7 years. For individuals exposed under age 30 years, the risk for development of leukemia ceases after about 30 years. For individu-als exposed as adults, the risk persists throughout life. Leukemias appear sooner than solid cancers because of the higher rate of cell division and differentiation of hematopoietic stem cells compared with the other tissues. Persons younger than 20 years are more at risk than adults are.
Evidence also exists for a slightly increased risk for childhood cancer, both leukemia and solid tumors, after diagnostic irradiation in utero. The level of the risk is uncertain but thought to increase the absolute risk by about 0.06% per 0.1 Gy.
Thyroid Cancer The incidence of thyroid carcinomas (arising from the follicular epi-thelium) increases in humans after exposure. Only about 10% or less of individuals with such cancers die from their disease. The best-studied groups are Israeli children irradiated to the scalp for ring-
TABLE 2-5 Comparison of Radiation-Induced Leukemias and Solid Tumors
FEATURE LEUKEMIAS SOLID TUMORS
Onset 2-3 years after exposure 10 or more years after exposure
Peak incidence 5-7 years after exposure, rarely occur more than 15 years after exposure
Elevated risk remains for the rest of the exposed individual ’ s life
Demographics The risk from exposure during childhood is about twice as great as the risk during adulthood. All forms except chronic lymphocytic leukemia.
The risk from exposure during childhood is about twice as great as the risk during adulthood. The number of cancers induced by radiation is most likely a multiple of their spontaneous frequency (see Box 2-2 ).
worm; children in Rochester, New York, irradiated to the thymus gland; and survivors of the atomic bombs in Japan. Susceptibility to radiation-induced thyroid cancer is greater early in childhood than at any time later in life, and children are more susceptible than adults. Females are two to three times more susceptible than males to radio-genic and spontaneous thyroid cancers. The fallout from the accident at the Chernobyl nuclear power plant, primarily iodine 131, is thought to have caused about 4000 cases of thyroid cancer in children and 15 fatalities.
Esophageal Cancer Data pertaining to esophageal cancer are relatively sparse. Excess cancers are found in the Japanese atomic bomb survivors and in patients treated with x radiation for ankylosing spondylitis.
Brain and Nervous System Cancers Patients exposed to diagnostic x-ray examinations in utero and to therapeutic doses in childhood or as adults (average midbrain dose of about 1 Gy) show excess numbers of malignant and benign brain tumors. Additionally, a case-control study has shown an associa-tion between intracranial meningiomas and previous medical or dental radiography. The strongest association was with a history of exposure to full-mouth dental radiographs when younger than 20 years. Because of their age, it is likely that these patients received substantially more exposure than is the case today with contemporary imaging techniques.
Salivary Gland Cancer The incidence of salivary gland tumors is increased in patients treated with irradiation for diseases of the head and neck, in Japanese atomic bomb survivors, and in persons exposed to diagnostic x radiation. An association between tumors of the salivary glands and dental radiog-raphy has been shown, the risk being highest in persons receiving full-mouth examinations before the age of 20 years. Only individuals who received an estimated cumulative parotid dose of 0.5 Gy or more showed a signifi cant correlation between dental radiography and sali-vary gland tumors.
Cancer of Other Organs Other organs such as the skin, paranasal sinuses, and bone marrow (with respect to multiple myeloma) also show excess neoplasia after exposure. However, the mortality and morbidity rates expected after head and neck exposure are much lower than for the organs described previously.
BOX 2-2
Susceptibility of Different Organs to Radiation-Induced Cancer
High Colon Stomach Lung Bone marrow
(leukemia) Female breast
Intermediate Bladder Liver Thyroid
Low Bone surface Brain Salivary glands Skin
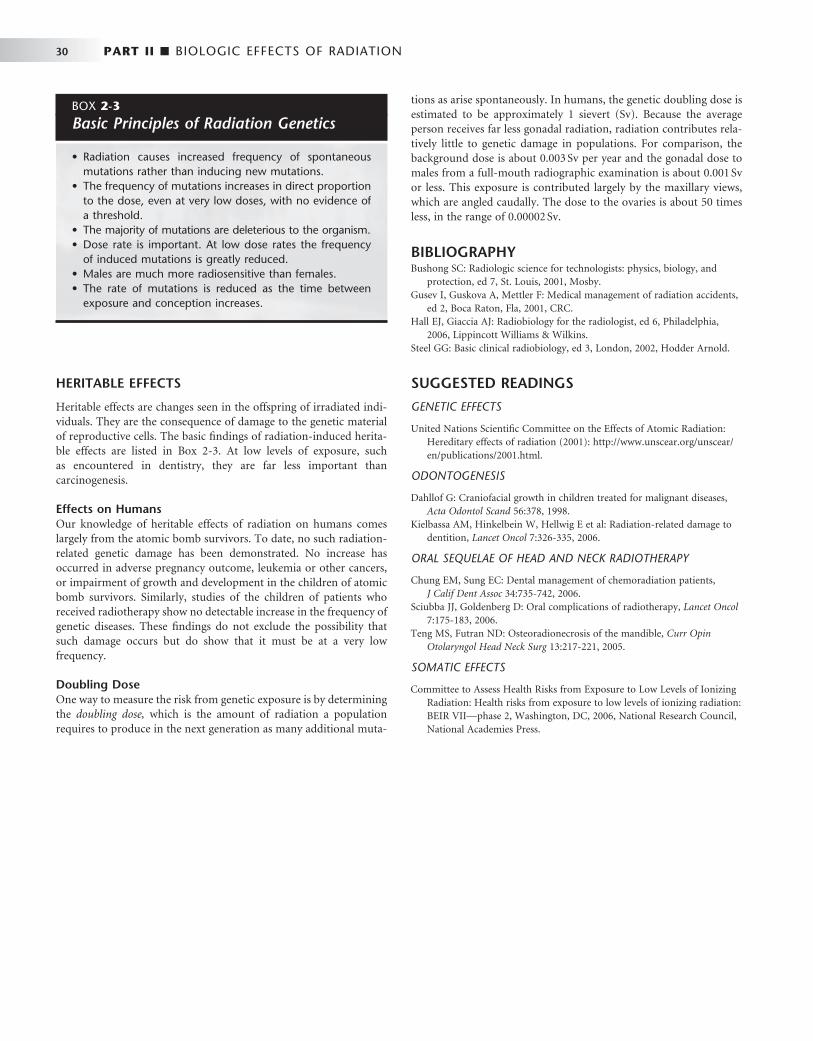
30 PART II ■ BIOLOGIC EFFECTS OF RADIATION
HERITABLE EFFECTS
Heritable effects are changes seen in the offspring of irradiated indi-viduals. They are the consequence of damage to the genetic material of reproductive cells. The basic fi ndings of radiation-induced herita-ble effects are listed in Box 2-3 . At low levels of exposure, such as encountered in dentistry, they are far less important than carcinogenesis.
Effects on Humans Our knowledge of heritable effects of radiation on humans comes largely from the atomic bomb survivors. To date, no such radiation-related genetic damage has been demonstrated. No increase has occurred in adverse pregnancy outcome, leukemia or other cancers, or impairment of growth and development in the children of atomic bomb survivors. Similarly, studies of the children of patients who received radiotherapy show no detectable increase in the frequency of genetic diseases. These fi ndings do not exclude the possibility that such damage occurs but do show that it must be at a very low frequency.
Doubling Dose One way to measure the risk from genetic exposure is by determining the doubling dose, which is the amount of radiation a population requires to produce in the next generation as many additional muta-
tions as arise spontaneously. In humans, the genetic doubling dose is estimated to be approximately 1 sievert (Sv). Because the average person receives far less gonadal radiation, radiation contributes rela-tively little to genetic damage in populations. For comparison, the background dose is about 0.003 Sv per year and the gonadal dose to males from a full-mouth radiographic examination is about 0.001 Sv or less. This exposure is contributed largely by the maxillary views, which are angled caudally. The dose to the ovaries is about 50 times less, in the range of 0.00002 Sv.
BIBLIOGRAPHY 1 Bushong SC : Radiologic science for technologists: physics, biology, and
protection , ed 7 , St. Louis , 2001 , Mosby . 2 Gusev I , Guskova A , Mettler F : Medical management of radiation accidents ,
ed 2 , Boca Raton, Fla , 2001 , CRC . 3 Hall EJ , Giaccia AJ : Radiobiology for the radiologist , ed 6 , Philadelphia ,
2006 , Lippincott Williams & Wilkins . 4 Steel GG : Basic clinical radiobiology , ed 3 , London , 2002 , Hodder Arnold .
SUGGESTED READINGS
GENETIC EFFECTS
5 United Nations Scientifi c Committee on the Effects of Atomic Radiation : Hereditary effects of radiation ( 2001 ): http://www.unscear.org/unscear/en/publications/2001.html .
ODONTOGENESIS
6 Dahllof G : Craniofacial growth in children treated for malignant diseases , Acta Odontol Scand 56 : 378 , 1998 .
7 Kielbassa AM , Hinkelbein W , Hellwig E et al : Radiation-related damage to dentition , Lancet Oncol 7 : 326 - 335 , 2006 .
ORAL SEQUELAE OF HEAD AND NECK RADIOTHERAPY
8 Chung EM , Sung EC : Dental management of chemoradiation patients , J Calif Dent Assoc 34 : 735 - 742 , 2006 .
9 Sciubba JJ , Goldenberg D : Oral complications of radiotherapy , Lancet Oncol 7 : 175 - 183 , 2006 .
10 Teng MS , Futran ND : Osteoradionecrosis of the mandible , Curr Opin Otolaryngol Head Neck Surg 13 : 217 - 221 , 2005 .
SOMATIC EFFECTS
11 Committee to Assess Health Risks from Exposure to Low Levels of Ionizing Radiation : Health risks from exposure to low levels of ionizing radiation: BEIR VII — phase 2 , Washington, DC , 2006 , National Research Council, National Academies Press .
BOX 2-3
Basic Principles of Radiation Genetics
• Radiation causes increased frequency of spontaneous mutations rather than inducing new mutations.
• The frequency of mutations increases in direct proportion to the dose, even at very low doses, with no evidence of a threshold.
• The majority of mutations are deleterious to the organism. • Dose rate is important. At low dose rates the frequency
of induced mutations is greatly reduced. • Males are much more radiosensitive than females. • The rate of mutations is reduced as the time between
exposure and conception increases.

PART
THREE
Radiation Safety and Protection

C H A P T E R 3
Radiation Safety and Protection
Dentists must be prepared to intelligently discuss with patients the benefi ts and possible hazards involved with the use of x rays and to describe the steps taken to reduce the hazard.
This chapter considers sources of exposure, estimates of risks from dental radiography, and means to minimize exposure from dental examinations.
Sources of Radiation Exposure
The general population is exposed to radiation from natural and man-made sources ( Table 3-1 ). Understanding these exposure sources pro-vides a useful framework for considering dental exposure.
NATURAL RADIATION
All life on earth has evolved in a continuous exposure to natural radia-tion ( Fig. 3-1 and Table 3-1 ). Background radiation from cosmic and terrestrial sources yields an average annual effective dose of about 2.4 millisieverts (mSv) worldwide and 3.0 mSv in the United States because of higher radon levels.
Cosmic Sources Cosmic radiation includes energetic subatomic particles, photons from the sun and supernova, and to a lesser extent, the particles and photons (secondary cosmic radiation) generated by the interactions of primary cosmic radiation with atoms and molecules of the earth ’ s atmosphere. Exposure from cosmic radiation is primarily a function of altitude, almost doubling with each 2000-meter (m) increase in elevation, because less atmosphere is present to attenuate the radia-tion. At sea level the exposure from cosmic radiation is about 0.24 mSv per year; at an elevation of 1600 m (approximately 1 mile, the eleva-tion of Denver, Colorado), it is about 0.50 mSv per year. The global average is 0.4 mSv per year, about 16% of natural exposure.
Cosmic radiation also includes exposure resulting from airline travel. As more people travel frequently above the protection of the earth ’ s atmosphere, cosmic radiation becomes a more signifi cant con-tributor to exposure. An airline fl ight of 5 hours in the middle lati-tudes at an altitude of 12 km may result in a dose equivalent of about 25 μ Sv.
Terrestrial Sources Exposure from terrestrial sources comes from external sources such as soil and from internal sources, including radon and other radionu-clides that are inhaled or ingested.
External Radiation. Exposure from terrestrial sources comes from radioactive nuclides in the soil, primarily potassium 40 and the radioactive decay products of uranium 238 and thorium 232. Most of the γ radiation from these sources comes from the top 20 cm of soil. Indoor exposure from radionuclides is very close to that occurring
outdoors because the shielding provided by structural materials bal-ances the exposure from radioactive nuclides contained within these shielding materials. The average terrestrial exposure rate is about 0.5 mSv per year, or approximately 20% of the average annual back-ground exposure.
Radon. Radon, a decay product in the uranium series, is esti-mated to be responsible for approximately 52% of the radiation exposure of the world ’ s population. As such, it is the largest single contributor to natural radiation (1.2 mSv). Radon is a gas (radon 222) that enters homes and buildings and by itself does little harm. However, radon decays to form solid products that emit α particles (porion 218, porion 214, lead 214, and bismuth 214). These decay products become attached to dust particles that can be inhaled and deposited on the bronchial epithelium in the respiratory tract. Expo-sure to this quantity of radiation may cause as many as 10,000 to 20,000 lung cancer deaths per year in the United States, mostly in smokers.
Other Internal. Other sources of internal terrestrial exposure are radionuclides that are taken up from the external environment by ingestion. The greatest internal exposure comes from the ingestion of uranium and thorium and their decay products, primarily potassium 40 but also rubidium 87, carbon 14, tritium, and others. The total exposure from ingestion and inhalation other than radon is estimated at 0.3 mSv per year, about 12% of natural-origin exposure.
MAN-MADE RADIATION
Humans have contributed many additional sources of radiation to the environment ( Fig. 3-2 ). These may be categorized into three major groups: medical diagnosis and treatment, consumer and industrial products and sources, and other minor sources. Recent estimates suggest that medical exposure in the developed countries has grown rapidly in recent decades, particularly computed tomography (CT) of the chest and abdomen and increased use of cardiac nuclear medicine studies. It is estimated that the average doses from medical exposures are comparable to natural background exposure.
Medical Diagnosis and Treatment Well over one billion medical x-ray examinations are performed annually worldwide. This source of exposure contributes the large majority of exposures from man-made sources. Although sources in this group include radiation therapy and nuclear medicine, diagnostic medical exposure is the largest contributor, contributing most of this source. Dental x-ray examinations are responsible for less than 1% of the average annual exposures from man-made sources.
Consumer and Industrial Products Consumer and industrial products contain some of the most interest-ing and unsuspected sources. This group includes the domestic water
32
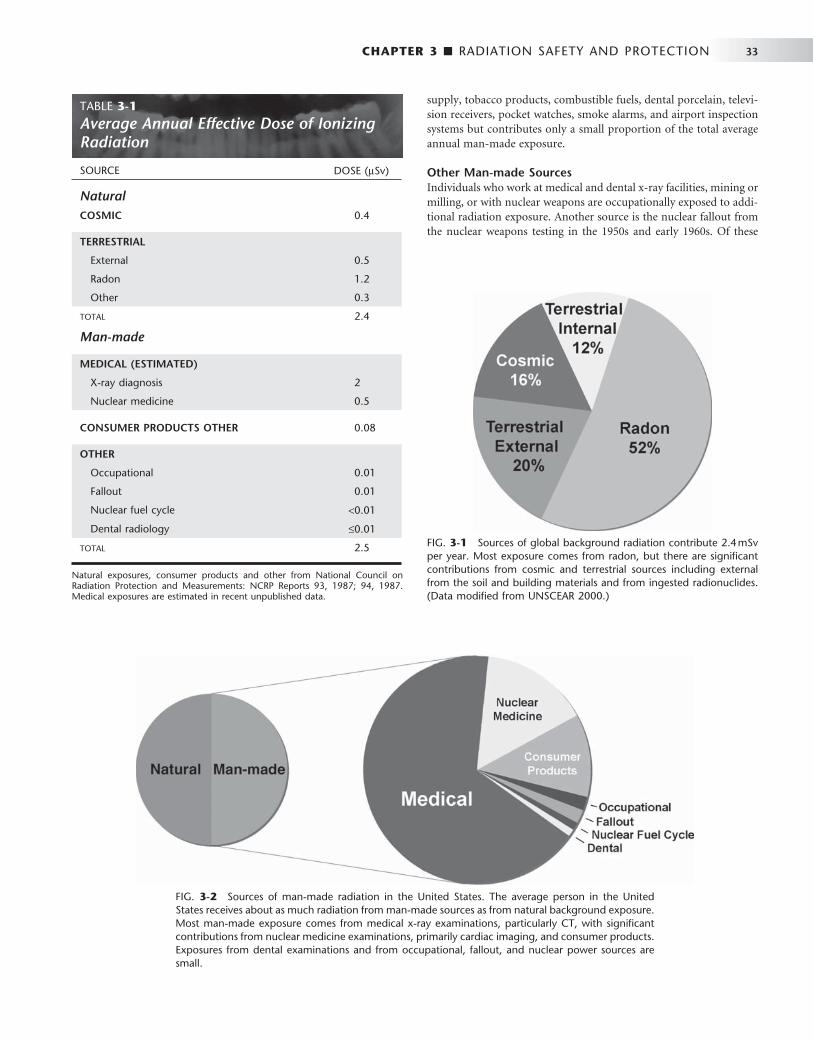
CHAPTER 3 ■ RADIATION SAFETY AND PROTECTION 33
TABLE 3-1 Average Annual Effective Dose of Ionizing Radiation
SOURCE DOSE ( μ Sv)
Natural COSMIC 0.4
TERRESTRIAL
External 0.5
Radon 1.2
Other 0.3
TOTAL 2.4
Man-made
MEDICAL (ESTIMATED)
X-ray diagnosis 2
Nuclear medicine 0.5
CONSUMER PRODUCTS OTHER 0.08
OTHER
Occupational 0.01
Fallout 0.01
Nuclear fuel cycle < 0.01
Dental radiology ≤ 0.01
TOTAL 2.5
Natural exposures, consumer products and other from National Council on Radiation Protection and Measurements: NCRP Reports 93, 1987; 94, 1987. Medical exposures are estimated in recent unpublished data.
FIG. 3-1 Sources of global background radiation contribute 2.4 mSv per year. Most exposure comes from radon, but there are signifi cant contributions from cosmic and terrestrial sources including external from the soil and building materials and from ingested radionuclides. (Data modifi ed from UNSCEAR 2000.)
FIG. 3-2 Sources of man-made radiation in the United States. The average person in the United States receives about as much radiation from man-made sources as from natural background exposure. Most man-made exposure comes from medical x-ray examinations, particularly CT, with signifi cant contributions from nuclear medicine examinations, primarily cardiac imaging, and consumer products. Exposures from dental examinations and from occupational, fallout, and nuclear power sources are small.
supply, tobacco products, combustible fuels, dental porcelain, televi-sion receivers, pocket watches, smoke alarms, and airport inspection systems but contributes only a small proportion of the total average annual man-made exposure.
Other Man-made Sources Individuals who work at medical and dental x-ray facilities, mining or milling, or with nuclear weapons are occupationally exposed to addi-tional radiation exposure. Another source is the nuclear fallout from the nuclear weapons testing in the 1950s and early 1960s. Of these

34 PART III ■ RADIATION SAFETY AND PROTECTION
sources, strontium 90 and iodine 131 are the most important. Because of its chemical similarity to calcium, strontium 90, a β emitter, is readily assimilated in the bones and teeth of children and young adults. Iodine 131, a γ emitter, accumulates in the thyroid gland. Fallout is no longer considered a signifi cant source of exposure to the public because of the cessation of atmospheric testing of nuclear weapons.
Nuclear power (which contributes only about 0.01 mSv to the average annual exposure) is another man-made source of particular concern to the public. However, nuclear power and support facilities, in normal operation, add only about 10% of that contributed by the release of naturally occurring radionuclides from the combustion of coal, natural gas, and oil. In spite of this low contribution to the average annual exposure made by nuclear power, accidents have occurred. Between 1945 and 1987, 284 nuclear reactor accidents, excluding Chernobyl, were reported in several countries, resulting in the exposure of more than 1300 people, with 33 fatalities. The public was not directly affected in the majority of these accidents. The nuclear accident at Chernobyl in the Ukraine in 1986 made clear that the use of nuclear power facilities carries the real potential of causing considerable harm if not properly controlled. In that event, 29 persons in the immediate vicinity of the plant died of acute radiation injury in the fi rst months after exposure. The long-term risk to the general population includes thyroid tumors that have resulted in 15 known fatalities.
Dose and Risk in Radiography
This section considers governmental dose limits on individuals who are occupationally exposed and members of the general population, amounts of radiation received by patients in dental and medical radio-graphy, and the estimated risks from these exposures.
DOSE LIMITS
Recognition of the harmful effects of radiation and the risks involved with its use led the National Council on Radiation Protection and Measurements (NCRP) and the International Commission on Radio-logical Protection (ICRP) to establish guidelines for limitations on the amount of radiation received by both occupationally exposed individu-als and the public. Since their establishment in the 1930s, these dose limits have been revised downward several times. These revisions refl ect the increased knowledge concerning the harmful effects of radiation and the increased ability to use radiation more effi ciently. The current occupational exposure limits have been established to ensure that no individuals will have deterministic effects and that the probability for stochastic effects is as low as reasonably and economically feasible ( Table 3-2 ). Note that there are no limits on the exposure a patient can receive from diagnostic or therapeutic exposures.
Dose limits from man-made sources for members of the general public, not occupationally exposed, have been established at 10% of that of occupationally exposed individuals. The negligible individual dose, established by the NCRP, is considered to be the dose below which any effort to reduce the radiation exposure may not be cost-effective. In spite of the NCRP ’ s endorsement of the nonthreshold hypothesis for purposes of radiation safety, it is thought that the impact on society of radiation exposure of this magnitude is negligible.
Dentists and their staff are occupationally exposed workers and are allowed to receive up to 50 mSv of whole-body radiation exposure per year ( Table 3-2 ). Although this is considered to present only a minimal risk, every effort should be made to keep the dose to all individuals as low as practical. As a profession we do rather well. The average dose for individuals occupationally exposed in the operation
TABLE 3-2 Recommended Annual Limits for Human Exposure to Ionizing Radiation
RECOMMENDATION NCRP ICRP
Occupational Dose Limits
Relative to stochastic effects 50 mSv annual effective dose limit and 10 mSv age (yr) cumulative effective dose limit
50 mSv annual effective dose limit and 100 mSv in 5-yr cumulative effective dose limit
Relative to deterministic effects 150 mSv annual equivalent dose limit to lens of eye and 500 mSv annual equivalent dose limit to skin and extremities
150 mSv equivalent dose limit to lens of eye and 500 mSv annual equivalent dose limit to skin and extremities
Nonoccupational (Public) Dose Limits
Relative to stochastic effects 5 mSv annual effective dose limit for infrequent exposure and 1 mSv annual effective dose limit for continuous exposure
1 mSv annual effective dose limit and, if higher, not to exceed annual average of 1 mSv over 5 yr
Relative to deterministic effects 50 mSv annual equivalent dose limit to lens of eye, skin, and extremities
15 mSv annual equivalent dose limit to lens of eye and 50 mSv annual equivalent dose limit to lens of eye, skin, and extremities
Embryo-fetus 0.5 mSv equivalent dose limit per month after pregnancy is known
2 mSv equivalent dose limit after the pregnancy has been declared
Negligible individual dose * 0.01 mSv annual effective dose None established
* That dose below which any effort to reduce the radiation exposure cannot be justifi ed.
From National Council on Radiation Protection and Measurements: NCRP Report 116, 1993, and International Commission on Radiological Protection: Radiation pro-tection, ICRP Publication 60, 1990.
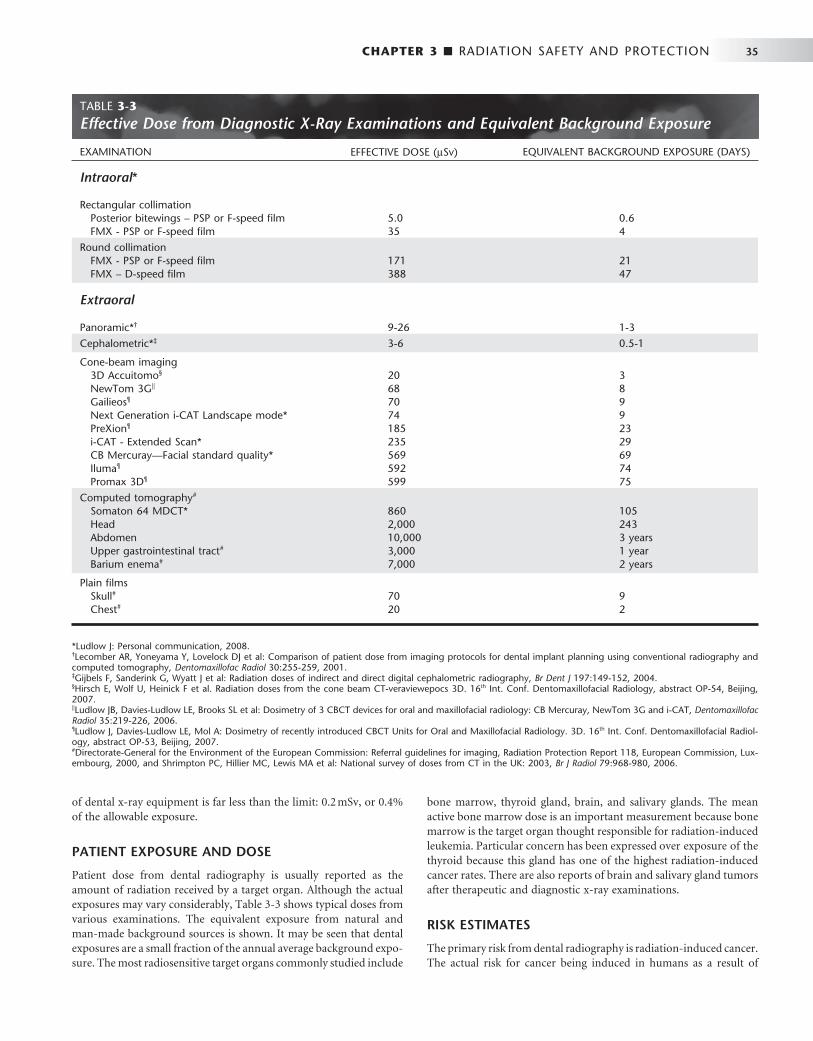
CHAPTER 3 ■ RADIATION SAFETY AND PROTECTION 35
of dental x-ray equipment is far less than the limit: 0.2 mSv, or 0.4% of the allowable exposure.
PATIENT EXPOSURE AND DOSE
Patient dose from dental radiography is usually reported as the amount of radiation received by a target organ. Although the actual exposures may vary considerably, Table 3-3 shows typical doses from various examinations. The equivalent exposure from natural and man-made background sources is shown. It may be seen that dental exposures are a small fraction of the annual average background expo-sure. The most radiosensitive target organs commonly studied include
bone marrow, thyroid gland, brain, and salivary glands. The mean active bone marrow dose is an important measurement because bone marrow is the target organ thought responsible for radiation-induced leukemia. Particular concern has been expressed over exposure of the thyroid because this gland has one of the high est radiation-induced cancer rates. There are also reports of brain and salivary gland tumors after therapeutic and diagnostic x-ray examinations.
RISK ESTIMATES
The primary risk from dental radiography is radiation-induced cancer. The actual risk for cancer being induced in humans as a result of
TABLE 3-3 Effective Dose from Diagnostic X-Ray Examinations and Equivalent Background Exposure
EXAMINATION EFFECTIVE DOSE ( μ Sv) EQUIVALENT BACKGROUND EXPOSURE (DAYS)
Intraoral *
Rectangular collimation Posterior bitewings – PSP or F-speed fi lm 5.0 0.6 FMX - PSP or F-speed fi lm 35 4
Round collimation FMX - PSP or F-speed fi lm 171 21 FMX – D-speed fi lm 388 47
Extraoral
Panoramic * † 9-26 1-3
Cephalometric * ‡ 3-6 0.5-1
Cone-beam imaging 3D Accuitomo § 20 3 NewTom 3G | | 68 8 Gailieos ¶ 70 9 Next Generation i-CAT Landscape mode * 74 9 PreXion ¶ 185 23 i-CAT - Extended Scan * 235 29 CB Mercuray — Facial standard quality * 569 69 Iluma ¶ 592 74 Promax 3D ¶ 599 75
Computed tomography # Somaton 64 MDCT * 860 105 Head 2,000 243 Abdomen 10,000 3 years Upper gastrointestinal tract # 3,000 1 year Barium enema # 7,000 2 years
Plain fi lms Skull # 70 9 Chest # 20 2
* Ludlow J: Personal communication, 2008. † Lecomber AR, Yoneyama Y, Lovelock DJ et al: Comparison of patient dose from imaging protocols for dental implant planning using conventional radiography and computed tomography, Dentomaxillofac Radiol 30:255-259, 2001. ‡ Gijbels F, Sanderink G, Wyatt J et al: Radiation doses of indirect and direct digital cephalometric radiography, Br Dent J 197:149-152, 2004. § Hirsch E, Wolf U, Heinick F et al. Radiation doses from the cone beam CT-veraviewepocs 3D. 16 th Int. Conf. Dentomaxillofacial Radiology, abstract OP-54, Beijing, 2007. | | Ludlow JB, Davies-Ludlow LE, Brooks SL et al: Dosimetry of 3 CBCT devices for oral and maxillofacial radiology: CB Mercuray, NewTom 3G and i-CAT, Dentomaxillofac Radiol 35:219-226, 2006. ¶ Ludlow J, Davies-Ludlow LE, Mol A: Dosimetry of recently introduced CBCT Units for Oral and Maxillofacial Radiology. 3D. 16 th Int. Conf. Dentomaxillofacial Radiol-ogy, abstract OP-53, Beijing, 2007. # Directorate-General for the Environment of the European Commission: Referral guidelines for imaging, Radiation Protection Report 118, European Commission, Lux-embourg, 2000, and Shrimpton PC, Hillier MC, Lewis MA et al: National survey of doses from CT in the UK: 2003, Br J Radiol 79:968-980, 2006.
36 PART III ■ RADIATION SAFETY AND PROTECTION
exposure to low doses of radiation is diffi cult to estimate for a number of reasons:
• The data for the cancer risk from radiation exposure involve exposures many times larger than those involved with dental radiology. Estimating cancer risk in dentistry thus requires extrapolating from high doses down to the low-dose range. A linear extrapolation is considered to be most appropriate, but the accuracy of this assumption is not known.
• Cancer is a common disease, accounting for about 20% of all deaths. It is estimated that in the United States in 2007 more than 1,400,000 new cases of cancer were diagnosed and that more than 560,000 people will die from this disease. The very low incidence that may result from dental exposure is impossi-ble to detect by direct measurement.
• Radiation-induced cancers are clinically and histologically indistinguishable from cancers induced by other causes.
• The time between radiation exposure and the development of cancer may be years to decades, during which time individuals may be subjected to many other carcinogens.
In spite of these diffi culties, the ICRP has developed an estimate that includes the probability for the induction of both fatal and non-fatal cancer and hereditary effects in an exposed population. On the basis of this estimate, 33 μ Sv for a full-mouth x ray delivered to 1,000,000 people would result in about two additional cancer deaths over the lifetime of the exposed individuals. This would be in addition to the 200,000 that would occur spontaneously. Such a calculation assumes a linear dose-response relationship and no threshold dose below which no risk exists. These assumptions may be in error and, if so, they most likely overestimate the actual risk.
This degree of risk from exposure to ionizing radiation may be expressed in multiple ways. It is helpful to compare the risk from dental exposures with that of equivalent natural exposures. Equivalent natural exposure is calculated as the product of the effective dose resulting from a specifi c radiographic examination and the average daily effective dose (8 μ Sv) delivered by natural sources. The dentist may point out to the patient that with optimal intraoral radiographic technique (E- or F-speed fi lm or digital imaging, along with rectan-gular collimation) the days of equivalent exposure are only about 4 days for a full-mouth examination. For another example, the depen-dence of physical location within the United States on exposure to natural radiation may be used. The effective dose resulting from cosmic radiation in Denver is 0.24 mSv (240 μ Sv), higher than the average of the United States because of its high elevation and reduced atmospheric protection. This means that a person living in an average location in the United States who had one complete mouth survey and one panoramic image made by optimized tech-niques every year (total effective dose for these examinations = 42 μ Sv, see Table 3-3 ) would incur less than one fi fth the risk for a person living in Denver who was not exposed to dental radiography. Put another way, if a person living in an average location in the United States had 14 complete mouth surveys (238 μ Sv) made by optimized techniques every year, he or she would incur only the same risk as a person living in Denver who was not exposed to dental radiography. There is no known risk from living in Denver pertaining to cosmic radiation.
Everyone is subject to risks in everyday life. Newspapers and news magazines occasionally publish articles dealing with the level of such risks. In consideration of the potential risk associated with dental radiography, it might be good to keep in mind that the average person ’ s risk for death as a result of an accident while a patient in hospital is about 230 per million; choking to death, 13 per million; and dying in
a boating accident, 4.6 per million. The risk from each of these events is greater than the risk from intraoral radiographic procedures.
In addition, people needlessly expose themselves to x radiation. There is a current trend for having full-body CT scans in hopes of detecting early signs of cancer, coronary artery disease, and other abnormalities. What most people do not realize is that a combined CT scan of the chest and abdomen delivers an E dose equal to almost 1000 chest radiographs. Furthermore, this increased exposure is often incurred for what is considered to be an unnecessary test: there is insuffi cient scientifi c evidence to justify CT screening for patients with no symptoms or family history suggesting disease.
Although the risk involved with dental radiography is certainly small in comparison with many other risks that are a common part of everyday life such as smoking or consumption of fatty foods, no basis exists to assume that it is zero. Although diagnostic radiation appears to be a weak carcinogen, the risk is increased because of the large number of people exposed. Practitioners must ensure that their patients avoid even the smallest unnecessary dose of radiation.
Reducing Dental Exposure
There are three guiding principles in radiation protection; the fi rst is the principle of justifi cation . In making dental radiographs this principle obligates the dentist to do more good than harm. In radiology this means the dentist should identify those situations where the benefi t to a patient from the diagnostic exposure exceeds the low risk of harm. In practice this principle infl uences what patients we select for radiographic examinations and what examina-tions we choose. These matters are considered in Chapter 15 , Guide-lines for Prescribing Dental Radiographs.
The second guiding rule is the principle of optimization . This prin-ciple holds that dentists should use every means to reduce unneces-sary exposure to their patient and themselves. This philosophy of radiation protection is often referred to as the principle of ALARA ( A s L ow A s R easonably A chievable). ALARA holds that exposures to ion-izing radiation should be kept as low as reasonably achievable, eco-nomic and social factors being taken into account. The means to accomplish this end are considered later in this chapter.
The third principle is that of dose limitation . Dose limits are used for occupational and public exposures to ensure that no individuals are exposed to unacceptably high doses. There are no dose limits for individuals exposed for diagnostic or therapeutic purposes.
The dentist in each facility is responsible for the design and conduct of the radiation protection program. In this section, methods of exposure and dose reduction are described that can be used in dental radiography. Each subsection begins with a recommendation of the American Dental Association (ADA) Council on Scientifi c Affairs. This is followed by a discussion of ways in which these recom-mendations can be satisfi ed.
PATIENT SELECTION CRITERIA
Dentists should not prescribe routine dental radiographs at preset intervals for all patients. Instead, they should prescribe radiographs after an evaluation of the patient ’ s needs that includes a health history review, a clinical dental history assessment, a clinical examination, and an evaluation of susceptibility to dental diseases. (ADA, 2006)
Radiographic selection criteria are clinical or historical fi ndings that identify patients for whom a high probability exists that a radio-graphic examination will provide information affecting their treat-ment or prognosis. These criteria satisfy the principle of justifi cation and are considered in Chapter 15 .

CHAPTER 3 ■ RADIATION SAFETY AND PROTECTION 37
CONDUCTING THE EXAMINATION
When the decision has been made that a radiographic examination is justifi ed (patient selection), the way in which the examination is conducted, the principle of optimization, greatly infl uences patient exposure to x radiation. The conduct of the examination may be divided into choice of equipment, choice of technique, operation of equipment, and processing and interpreting the radiographic image.
Film and Digital Imaging
Film of a speed slower than E-speed should not be used for dental radiographs. (ADA, 2006)
Currently, intraoral dental x-ray fi lm is available in three speed groups: D, E, and F ( Chapter 5 ). Clinically, fi lm of speed group E is almost twice as fast (sensitive) as fi lm of group D and about 50 times as fast as regular dental x-ray fi lm ( Fig. 3-3 ). The current F-speed fi lms require about 75% the exposure of E-speed fi lm and only about 40% that of D-speed. Faster fi lms are desirable from the standpoint of exposure reduction. Multiple studies have found that F-speed fi lm has the same useful density range, latitude, contrast, and image quality as D- and E-speed fi lms and can be used in routine intraoral radio-graphic examinations without sacrifi ce of diagnostic information. Current digital sensors offer equal or greater dose savings than F-speed fi lm and comparable diagnostic utility.
Intensifying Screens and Film or Digital Imaging
Rare-earth intensifying screens are recommended . . . combined with high-speed fi lm of 400 or greater. (ADA, 2006)
Contemporary intensifying screens used in extraoral radiography use the rare earth elements gadolinium and lanthanum (see Chapter 5 ). These rare earth phosphors emit green light on interaction with x rays. Compared with the older calcium tungstate screens, rare earth screens decrease patient exposure by as much as 55% in panoramic and cephalo metric radiography.
Unlike digital intraoral imaging, there is no signifi cant dose reduc-tion to be gained by replacing extraoral screen-fi lm systems with digital imaging. Image resolution with digital systems is comparable to that obtained with rare earth screens matched with appropriate fi lm.
Source-to-Skin Distance
Use of long source-to-skin distances of 40 cm, rather than short dis-tances of 20 cm, decreases exposure by 10 to 25 percent. Distances between 20 cm and 40 cm are appropriate, but the longer distances are optimal. (ADA, 2006)
Two standard focal source-to-skin distances have evolved over the years for use in intraoral radiography, one 20 cm (8 inches) and the other 41 cm (16 inches). Use of the distance results in a 32% reduction in exposed tissue volume because the x-ray beam is less divergent ( Fig. 3-4 ). One study reported a 30% decrease in the effective dose resulting from the use of a 30-cm distance instead of a 20-cm distance for a simulated 19-image complete mouth survey. Another study of patient exposures from intraoral radiographic examinations comparing a 40-cm distance with a 20-cm distance found a 38% to 45% decrease in thyroid exposure.
The use of a longer source-to-object distance also results in a smaller apparent focal spot size and thereby theoretically increases the
resolution of the radiograph (see Chapter 4 ). The clinical signifi cance of the effect of focal spot size on image resolution, however, has been questioned.
Rectangular Collimation
Since a rectangular collimator decreases the radiation dose by up to fi vefold as compared with a circular one, radiographic equipment should provide rectangular collimation for exposure of periapical and bitewing radiographs. (ADA, 2006)
The federal government requires that the x-ray beam used in intraoral radiography be collimated so that the fi eld of radiation at the patient ’ s skin surface is “ contained in a circle having a diameter of no more than 7 cm ( 23
4 inches) ” when the x-ray tube is operated above 50
kilovolts peak (kVp). In view of the dimensions of No. 2 intraoral fi lm (3.2 × 4.1 cm) or digital sensor, a fi eld size of this magnitude is almost three times that necessary to expose the image. Consequently, limiting the size of the x-ray beam even more than required by law may sig-nifi cantly reduce patient exposure. This results in not only decreased patient exposure but also increased image quality ( Fig. 3-4 ). Addition-ally, the amount of radiation scatter generated is proportional to the area exposed. If scatter radiation is decreased, image fog is decreased and image quality is increased.
There are several means to limit of the size of the x-ray beam. First, a rectangular position-indicating device (PID) may be attached to the radiographic tube housing ( Fig. 3-5 ). Use of a rectangular PID having
FIG. 3-3 Relationship between surface exposures delivered to a patient by exposure of groups D, E, and F (in light gray) intraoral fi lms and diagnostic density at various kilovoltages. Note substantial overlap between E- and F-speed fi lms. (Modifi ed from HHS Publication [ Food and Drug Administration ] 85-8245, 1985.)
50 60
50
70 80 90 10055 65 75 85 95
100
150
200
250
300
350
400
450
500
550
600
mR
or
10–5
Gy
Kilovoltage
Acceptable X-Ray Exposure RangesSpeed Groups D, E, and F Film
D
E
F
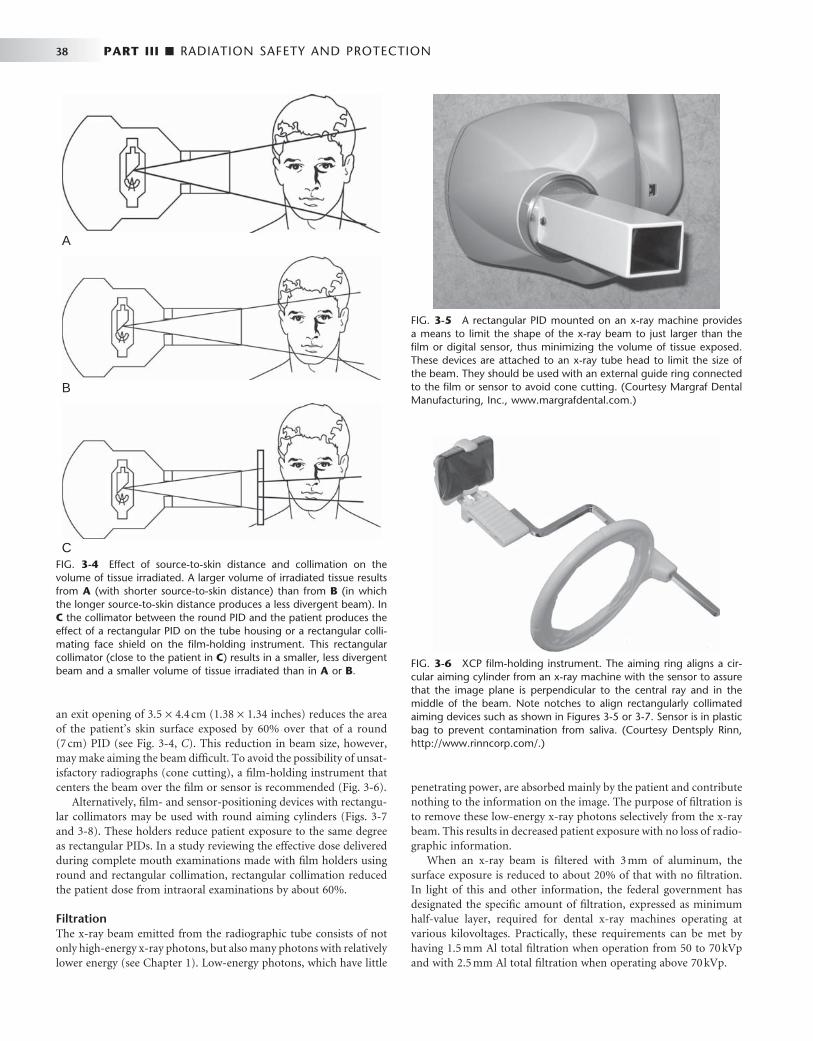
38 PART III ■ RADIATION SAFETY AND PROTECTION
an exit opening of 3.5 × 4.4 cm (1.38 × 1.34 inches) reduces the area of the patient ’ s skin surface exposed by 60% over that of a round (7 cm) PID (see Fig. 3-4, C ). This reduction in beam size, however, may make aiming the beam diffi cult. To avoid the possibility of unsat-isfactory radiographs (cone cutting), a fi lm-holding instrument that centers the beam over the fi lm or sensor is recommended ( Fig. 3-6 ).
Alternatively, fi lm- and sensor-positioning devices with rectangu-lar collimators may be used with round aiming cylinders ( Figs. 3-7 and 3-8 ). These holders reduce patient exposure to the same degree as rectangular PIDs. In a study reviewing the effective dose delivered during complete mouth examinations made with fi lm holders using round and rectangular collimation, rectangular collimation reduced the patient dose from intraoral examinations by about 60%.
Filtration The x-ray beam emitted from the radiographic tube consists of not only high-energy x-ray photons, but also many photons with relatively lower energy (see Chapter 1 ). Low-energy photons, which have little
penetrating power, are absorbed mainly by the patient and contribute nothing to the information on the image. The purpose of fi ltration is to remove these low-energy x-ray photons selectively from the x-ray beam. This results in decreased patient exposure with no loss of radio-graphic information.
When an x-ray beam is fi ltered with 3 mm of aluminum, the surface exposure is reduced to about 20% of that with no fi ltration. In light of this and other information, the federal government has designated the specifi c amount of fi ltration, expressed as minimum half-value layer, required for dental x-ray machines operating at various kilovoltages. Practically, these requirements can be met by having 1.5 mm Al total fi ltration when operation from 50 to 70 kVp and with 2.5 mm Al total fi ltration when operating above 70 kVp.
FIG. 3-4 Effect of source-to-skin distance and collimation on the volume of tissue irradiated. A larger volume of irradiated tissue results from A (with shorter source-to-skin distance) than from B (in which the longer source-to-skin distance produces a less divergent beam). In C the collimator between the round PID and the patient produces the effect of a rectangular PID on the tube housing or a rectangular colli-mating face shield on the fi lm-holding instrument. This rectangular collimator (close to the patient in C ) results in a smaller, less divergent beam and a smaller volume of tissue irradiated than in A or B .
A
C
B
FIG. 3-5 A rectangular PID mounted on an x-ray machine provides a means to limit the shape of the x-ray beam to just larger than the fi lm or digital sensor, thus minimizing the volume of tissue exposed. These devices are attached to an x-ray tube head to limit the size of the beam. They should be used with an external guide ring connected to the fi lm or sensor to avoid cone cutting. (Courtesy Margraf Dental Manufacturing, Inc., www.margrafdental.com .)
FIG. 3-6 XCP fi lm-holding instrument. The aiming ring aligns a cir-cular aiming cylinder from an x-ray machine with the sensor to assure that the image plane is perpendicular to the central ray and in the middle of the beam. Note notches to align rectangularly collimated aiming devices such as shown in Figures 3-5 or 3-7 . Sensor is in plastic bag to prevent contamination from saliva. (Courtesy Dentsply Rinn, http://www.rinncorp.com/ .)
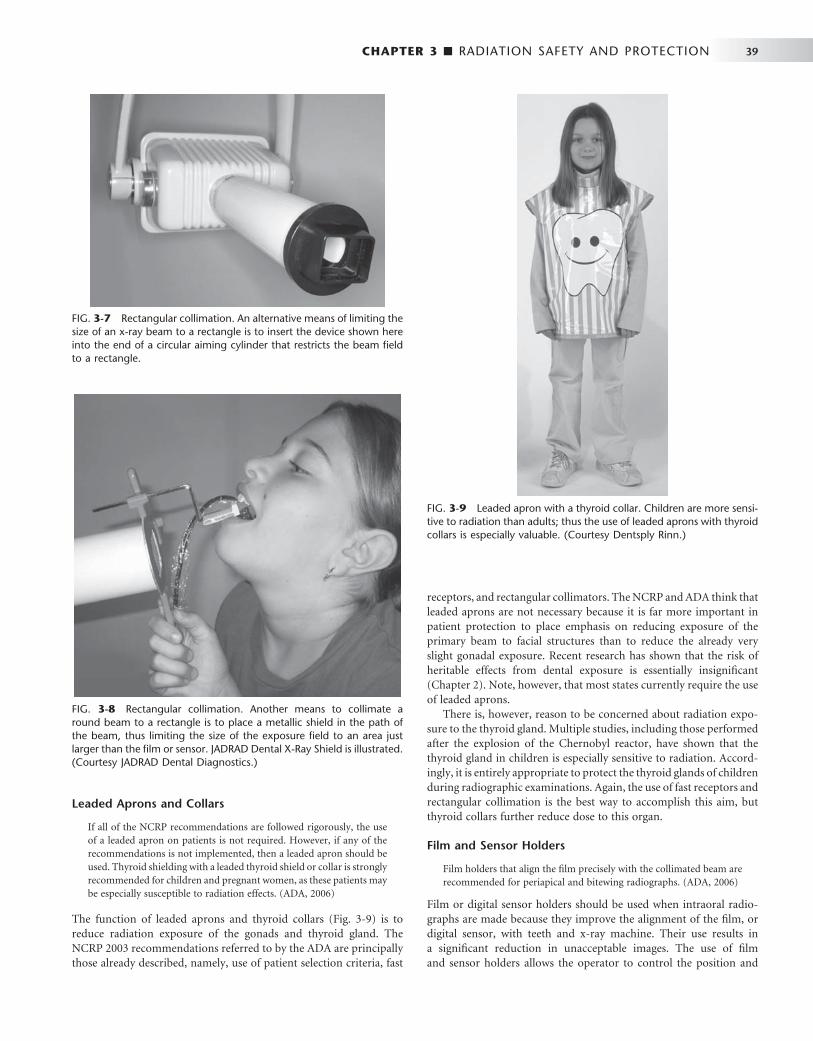
CHAPTER 3 ■ RADIATION SAFETY AND PROTECTION 39
FIG. 3-7 Rectangular collimation. An alternative means of limiting the size of an x-ray beam to a rectangle is to insert the device shown here into the end of a circular aiming cylinder that restricts the beam fi eld to a rectangle.
FIG. 3-8 Rectangular collimation. Another means to collimate a round beam to a rectangle is to place a metallic shield in the path of the beam, thus limiting the size of the exposure fi eld to an area just larger than the fi lm or sensor. JADRAD Dental X-Ray Shield is illustrated. (Courtesy JADRAD Dental Diagnostics.)
Leaded Aprons and Collars
If all of the NCRP recommendations are followed rigorously, the use of a leaded apron on patients is not required. However, if any of the recommendations is not implemented, then a leaded apron should be used. Thyroid shielding with a leaded thyroid shield or collar is strongly recommended for children and pregnant women, as these patients may be especially susceptible to radiation effects. (ADA, 2006)
The function of leaded aprons and thyroid collars ( Fig. 3-9 ) is to reduce radiation exposure of the gonads and thyroid gland. The NCRP 2003 recommendations referred to by the ADA are principally those already described, namely, use of patient selection criteria, fast
receptors, and rectangular collimators. The NCRP and ADA think that leaded aprons are not necessary because it is far more important in patient protection to place emphasis on reducing exposure of the primary beam to facial structures than to reduce the already very slight gonadal exposure. Recent research has shown that the risk of heritable effects from dental exposure is essentially insignifi cant ( Chapter 2 ). Note, however, that most states currently require the use of leaded aprons.
There is, however, reason to be concerned about radiation expo-sure to the thyroid gland. Multiple studies, including those performed after the explosion of the Chernobyl reactor, have shown that the thyroid gland in children is especially sensitive to radiation. Accord-ingly, it is entirely appropriate to protect the thyroid glands of children during radiographic examinations. Again, the use of fast receptors and rectangular collimation is the best way to accomplish this aim, but thyroid collars further reduce dose to this organ.
Film and Sensor Holders
Film holders that align the fi lm precisely with the collimated beam are recommended for periapical and bitewing radiographs. (ADA, 2006)
Film or digital sensor holders should be used when intraoral radio-graphs are made because they improve the alignment of the fi lm, or digital sensor, with teeth and x-ray machine. Their use results in a signifi cant reduction in unacceptable images. The use of fi lm and sensor holders allows the operator to control the position and
FIG. 3-9 Leaded apron with a thyroid collar. Children are more sensi-tive to radiation than adults; thus the use of leaded aprons with thyroid collars is especially valuable. (Courtesy Dentsply Rinn.)

40 PART III ■ RADIATION SAFETY AND PROTECTION
alignment of the fi lm or sensor with respect to the teeth and jaws. This is especially important when the paralleling technique ( Chapter 4 ) and digital imaging ( Chapter 7 ) are used. In these cases it is often desirable to position the receptor away from the teeth so as to get the best image and reduce patient discomfort. This requires the use of a fi lm or sensor holder. Most such devices have an external guide that shows the opera-tor where to align the aiming cylinder (PID). As a result, the x-ray beam is properly directed toward the receptors. This greatly reduces the chance of the beam partially missing the image receptor (a “ cone-cut ” ) and also reduces image distortion ( Chapter 4 ).
The decision as to which technique is used should be based on the diagnostic quality of the resultant radiographs, the effi ciency of using radiation, and the convenience of the technique. The more effi cient the technique, the fewer radiograph retakes will be required, along with less patient exposure. A study of comparative effi ciencies of the bisection and parallel techniques found that the number of nondiag-nostic radiographs was reduced by more than half when intraoral complete mouth examinations were made with the paralleling technique.
Kilovoltage
The operating potential of dental X-ray machines must range between 50 and 100 kilovolt peak but should range between 60 and 80 kVp. (ADA, 2006)
As the kVp is lowered, the mean energy of the beam decreases. This results in (1) an image with greater contrast (assuming that exposure time is increased), (2) a beam with more low-energy photons that carry the potential for risk but are not useful in making an image, and (3) reduced beam intensity requiring increased exposure time, thus increasing the risk of the patient moving and blurring the image. Although image diagnosis may be improved slightly with increased image contrast (low kVp) images, the patient dose is somewhat reduced with higher kVp exposures. The best balance is to use 60 to 80 kVp.
The availability of constant-potential (fully rectifi ed), high-frequency or direct current (DC) dental x-ray units has made possible the production of radiographs with lower kilovoltage and at reduced levels of radiation. The surface exposure required to produce a comparable radiographic density using a constant-potential unit is approximately 25% less than that of a conventional self-rectifi ed unit operating at the same kilovoltage. Currently several manufacturers produce DC units.
Milliampere-Seconds
The operator should set the amperage and time settings for exposure of dental radiographs of optimal quality. (ADA, 2006)
Of the three technical conditions (tube voltage, fi ltration, and expo-sure time), exposure time is the most crucial factor in infl uencing diagnostic quality. In terms of exposure, optimal image quality means that the radiograph is of diagnostic density, neither overexposed (too dark) nor underexposed (too light). Both overexposed and underex-posed radiographs result in repeat exposures, thereby leading to need-less additional patient exposure. Image density is controlled by the quantity of x rays produced, which in turn is best controlled by the combination of milliamperage and exposure time, termed milliampere-seconds (mAs) ( Chapter 1 ). Typically, a radiograph of correct density will demonstrate very faint soft tissue outlines. Dentin will have an optical density of about 1.0. If your x-ray machine has a
variable milliampere control, it should be set at the highest choice. Proper exposure times should be determined empirically by using optimal fi lm processing conditions ( Chapter 6 ) or manufacturer ’ s recommendations for digital sensors. A chart showing optimal expo-sure times for each region of the arch in children and adults should be mounted by each x-ray machine. Because fi lm-processing condi-tions are standardized, the only decision the dentist or the assistant needs to make is to select the proper exposure time.
Film Processing
Radiographs should not be overexposed and then underdeveloped, because this practice results in greater exposure to the patient and dental health care worker and can produce images of poor diagnostic quality. Dental radiographs should not be processed by sight, and manufacturers ’ instructions regarding time, temperature and chemis-try should be followed. (ADA, 2006)
A major cause of unnecessary patient exposure is the deliberate over-exposure of fi lms compensated by underdevelopment of the fi lm. This procedure results in both needless exposure of the patient and in fi lms that are of inferior diagnostic quality (because of incomplete develop-ment). On the other hand, a properly exposed radiograph is of no value if all its diagnostic information is lost as a result of poor process-ing procedures. One dental insurance carrier reported that some 6% of the dental radiographs it received were not readable because of improper processing. Another study of 500 panoramic radiographs found that the average fi lm contained at least one processing error. Time-temperature processing, in an adequately equipped and main-tained darkroom, is the best way to ensure optimal fi lm quality (see Chapter 6 ). To help ensure optimal image quality, the dental assistant should follow the fi lm manufacturer ’ s recommendation for process-ing solutions, not the solution manufacturer ’ s directions.
The use of machines to process dental x-ray fi lm has become widespread. More than 90% of dentists surveyed have reported using dental fi lm processors. Automatic fi lm processors should be used in a darkroom. Although some units have daylight loaders, allowing fi lm to be placed in the machine in room light, such loaders are diffi cult to keep clean and free of contamination. Film processors, however, can actually increase patient exposure if not correctly maintained. Approximately 30% of all fi lms retaken because of incorrect fi lm density were directly related to processor variability. The introduction of a comprehensive maintenance program was found to reduce this retake rate signifi cantly, resulting in a substantial savings in both patient exposure and operating costs.
Interpreting the Images
The dentist should view radiographs under appropriate conditions for analysis and diagnosis. (ADA, 2006)
Radiographs are best viewed in a semidarkened room with light trans-mitted through the fi lms; all extraneous light should be eliminated. In addition, radiographs should be studied with the aid of a magnify-ing glass to detect even the smallest change in image density. A vari-able-intensity light source should also be available. Similarly, digital images are best interpreted on a computer screen in a darkened environment.
The diagnostic accuracy of radiographic caries diagnosis is only about 70% or less. This fact should stimulate individuals to place a greater emphasis on careful radiographic interpretation. Failure to diagnose problems is an increasing source of liability claims.
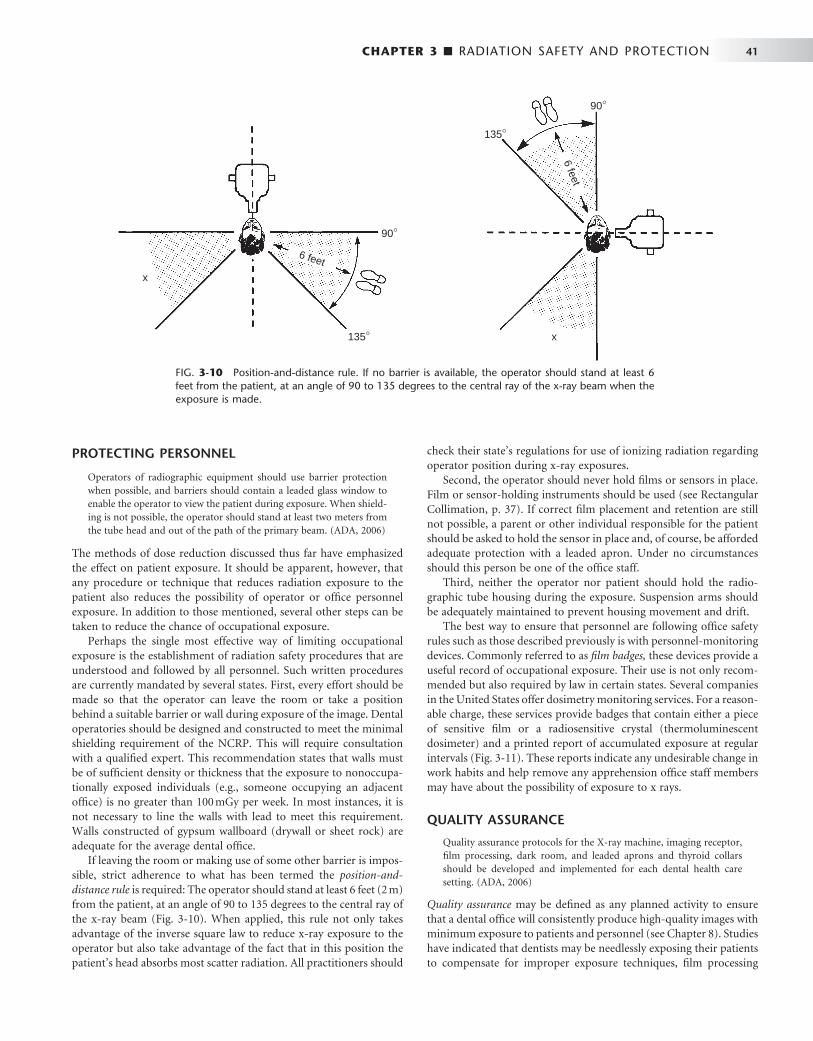
CHAPTER 3 ■ RADIATION SAFETY AND PROTECTION 41
PROTECTING PERSONNEL
Operators of radiographic equipment should use barrier protection when possible, and barriers should contain a leaded glass window to enable the operator to view the patient during exposure. When shield-ing is not possible, the operator should stand at least two meters from the tube head and out of the path of the primary beam. (ADA, 2006)
The methods of dose reduction discussed thus far have emphasized the effect on patient exposure. It should be apparent, however, that any procedure or technique that reduces radiation exposure to the patient also reduces the possibility of operator or offi ce personnel exposure. In addition to those mentioned, several other steps can be taken to reduce the chance of occupational exposure.
Perhaps the single most effective way of limiting occupational exposure is the establishment of radiation safety procedures that are understood and followed by all personnel. Such written procedures are currently mandated by several states. First, every effort should be made so that the operator can leave the room or take a position behind a suitable barrier or wall during exposure of the image. Dental operatories should be designed and constructed to meet the minimal shielding requirement of the NCRP. This will require consultation with a qualifi ed expert. This recommendation states that walls must be of suffi cient density or thickness that the exposure to nonoccupa-tionally exposed individuals (e.g., someone occupying an adjacent offi ce) is no greater than 100 mGy per week. In most instances, it is not necessary to line the walls with lead to meet this requirement. Walls constructed of gypsum wallboard (drywall or sheet rock) are adequate for the average dental offi ce.
If leaving the room or making use of some other barrier is impos-sible, strict adherence to what has been termed the position-and-distance rule is required: The operator should stand at least 6 feet (2 m) from the patient, at an angle of 90 to 135 degrees to the central ray of the x-ray beam ( Fig. 3-10 ). When applied, this rule not only takes advantage of the inverse square law to reduce x-ray exposure to the operator but also take advantage of the fact that in this position the patient ’ s head absorbs most scatter radiation. All practitioners should
check their state ’ s regulations for use of ionizing radiation regarding operator position during x-ray exposures.
Second, the operator should never hold fi lms or sensors in place. Film or sensor-holding instruments should be used (see Rectangular Collimation, p. 37). If correct fi lm placement and retention are still not possible, a parent or other individual responsible for the patient should be asked to hold the sensor in place and, of course, be afforded adequate protection with a leaded apron. Under no circumstances should this person be one of the offi ce staff.
Third, neither the operator nor patient should hold the radio-graphic tube housing during the exposure. Suspension arms should be adequately maintained to prevent housing movement and drift.
The best way to ensure that personnel are following offi ce safety rules such as those described previously is with personnel-monitoring devices. Commonly referred to as fi lm badges, these devices provide a useful record of occupational exposure. Their use is not only recom-mended but also required by law in certain states. Several companies in the United States offer dosimetry monitoring services. For a reason-able charge, these services provide badges that contain either a piece of sensitive fi lm or a radiosensitive crystal (thermoluminescent dosimeter) and a printed report of accumulated exposure at regular intervals ( Fig. 3-11 ). These reports indicate any undesirable change in work habits and help remove any apprehension offi ce staff members may have about the possibility of exposure to x rays.
QUALITY ASSURANCE
Quality assurance protocols for the X-ray machine, imaging receptor, fi lm processing, dark room, and leaded aprons and thyroid collars should be developed and implemented for each dental health care setting. (ADA, 2006)
Quality assurance may be defi ned as any planned activity to ensure that a dental offi ce will consistently produce high-quality images with minimum exposure to patients and personnel (see Chapter 8 ). Studies have indicated that dentists may be needlessly exposing their patients to compensate for improper exposure techniques, fi lm processing
FIG. 3-10 Position-and-distance rule. If no barrier is available, the operator should stand at least 6 feet from the patient, at an angle of 90 to 135 degrees to the central ray of the x-ray beam when the exposure is made.
x
6 feet
135°
90°
x
6 feet
135°
90°
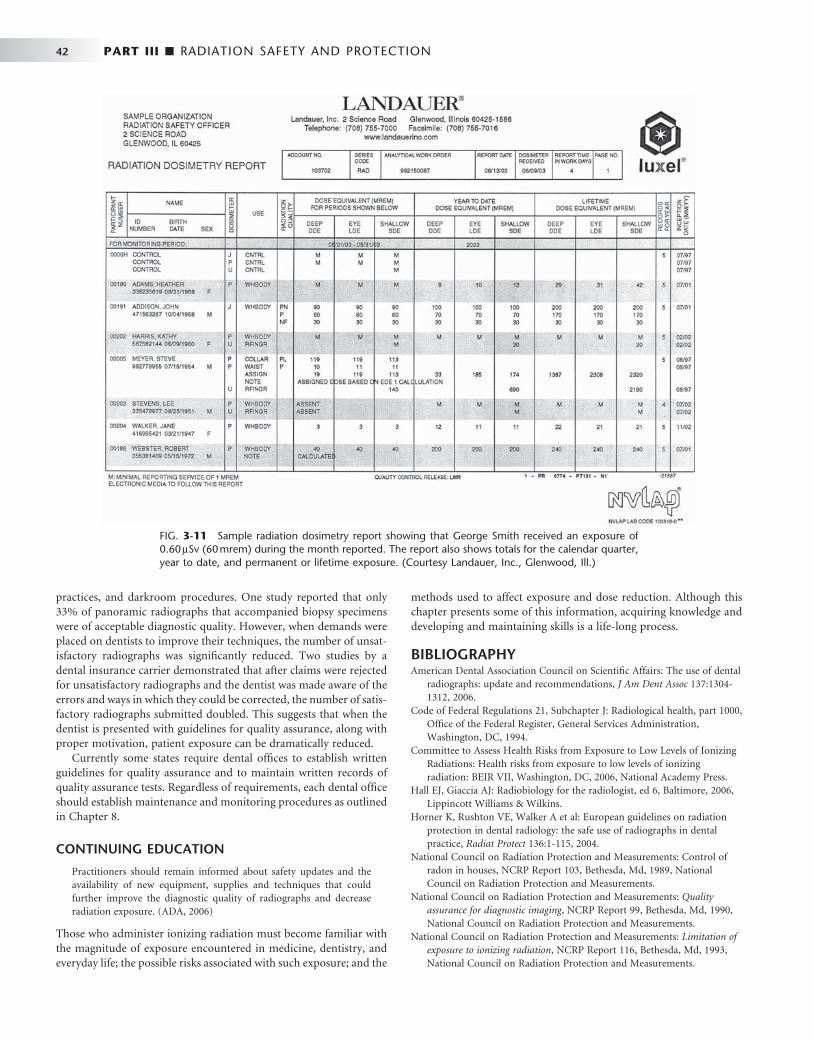
42 PART III ■ RADIATION SAFETY AND PROTECTION
practices, and darkroom procedures. One study reported that only 33% of panoramic radiographs that accompanied biopsy specimens were of acceptable diagnostic quality. However, when demands were placed on dentists to improve their techniques, the number of unsat-isfactory radiographs was signifi cantly reduced. Two studies by a dental insurance carrier demonstrated that after claims were rejected for unsatisfactory radiographs and the dentist was made aware of the errors and ways in which they could be corrected, the number of satis-factory radiographs submitted doubled. This suggests that when the dentist is presented with guidelines for quality assurance, along with proper motivation, patient exposure can be dramatically reduced.
Currently some states require dental offi ces to establish written guidelines for quality assurance and to maintain written records of quality assurance tests. Regardless of requirements, each dental offi ce should establish maintenance and monitoring procedures as outlined in Chapter 8 .
CONTINUING EDUCATION
Practitioners should remain informed about safety updates and the availability of new equipment, supplies and techniques that could further improve the diagnostic quality of radiographs and decrease radiation exposure. (ADA, 2006)
Those who administer ionizing radiation must become familiar with the magnitude of exposure encountered in medicine, dentistry, and everyday life; the possible risks associated with such exposure; and the
methods used to affect exposure and dose reduction. Although this chapter presents some of this information, acquiring knowledge and developing and maintaining skills is a life-long process.
BIBLIOGRAPHY 1 American Dental Association Council on Scientifi c Affairs : The use of dental
radiographs: update and recommendations , J Am Dent Assoc 137 : 1304 - 1312 , 2006 .
2 Code of Federal Regulations 21, Subchapter J: Radiological health, part 1000, Offi ce of the Federal Register, General Services Administration, Washington, DC, 1994.
3 Committee to Assess Health Risks from Exposure to Low Levels of Ionizing Radiations : Health risks from exposure to low levels of ionizing radiation: BEIR VII , Washington, DC , 2006 , National Academy Press .
4 Hall EJ , Giaccia AJ : Radiobiology for the radiologist , ed 6 , Baltimore , 2006 , Lippincott Williams & Wilkins .
5 Horner K , Rushton VE , Walker A et al : European guidelines on radiation protection in dental radiology: the safe use of radiographs in dental practice , Radiat Protect 136 : 1 - 115 , 2004 .
6 National Council on Radiation Protection and Measurements : Control of radon in houses , NCRP Report 103, Bethesda, Md , 1989 , National Council on Radiation Protection and Measurements .
7 National Council on Radiation Protection and Measurements : Quality assurance for diagnostic imaging , NCRP Report 99, Bethesda, Md , 1990 , National Council on Radiation Protection and Measurements .
8 National Council on Radiation Protection and Measurements : Limitation of exposure to ionizing radiation , NCRP Report 116, Bethesda, Md , 1993 , National Council on Radiation Protection and Measurements .
FIG. 3-11 Sample radiation dosimetry report showing that George Smith received an exposure of 0.60 μ Sv (60 mrem) during the month reported. The report also shows totals for the calendar quarter, year to date, and permanent or lifetime exposure. (Courtesy Landauer, Inc., Glenwood, Ill.)

CHAPTER 3 ■ RADIATION SAFETY AND PROTECTION 43
9 National Council on Radiation Protection and Measurements : Dental x-ray protection , NCRP Report 145, Bethesda, Md , 2003 , National Council on Radiation Protection and Measurements .
10 Nationwide Evaluation of X-Ray Trends (NEXT), tabulation and graphical summary of the 1999 dental radiography survey , CRCPD Publication E-03-6, Bethesda, Md , 2003 , Center for Devices and Radiological Health, U.S. Food and Drug Administration .
11 Preston RJ : Radiation biology: concepts for radiation protection , Health Phys 88 : 545 - 556 , 2005 .
12 Sources and effects of ionizing radiation , volume 1 : sources, New York , 2000 , UNSCEAR, UN Publication .
13 Wall BF , Kendall GM , Edwards AA et al : What are the risks from medical X-rays and other low dose radiation? Br J Radiol 79 : 285 - 294 , 2006 .

This page intentionally left blank
PART
FOUR
Imaging Principles and Techniques
C H A P T E R 4
Projection Geometry
Aconventional radiograph is a two-dimensional projection image of a three-dimensional object. In such an image the entire volume of tissue between the x-ray source and the fi lm
or digital receptor is projected onto a two-dimensional image. To obtain the maximal value from a radiograph, a clinician must have a clear understanding of normal anatomy and then mentally recon-struct a three-dimensional image of the anatomic structures of interest from one or more of these two-dimensional views. Using high-quality radiographs greatly facilitates this task. The principles of projection geometry describe the effect of focal spot size and position (relative to the object and the fi lm) on image clarity, magnifi cation, and distortion. Clinicians use these principles to maximize image clarity, minimize distortion, and localize objects in the image fi eld. Later chapters will consider different forms of tomographic imaging techniques that produce slices through tissue rather than projection images.
Image Sharpness and Resolution
Several geometric considerations contribute to image clarity, particu-larly image sharpness and resolution. Sharpness measures how well a boundary between two areas of differing radiodensity is revealed. Image spatial resolution measures how well a radiograph is able to reveal small objects that are close together. Although sharpness and resolution are two distinct features, they are interdependent, being infl uenced by the same geometric variables. For clinical diagnosis it is desirable to optimize conditions that will result in images with high sharpness and resolution.
When x rays are produced at the target in an x-ray tube, they originate from all points within the area of the focal spot. Because these rays originate from different points and travel in straight lines, their projections of a feature of an object do not occur at exactly the same location on a fi lm. As a result, the image of the edge of an object is slightly blurred rather than sharp and distinct. Figure 4-1 shows the path of photons that originate at the margins of the focal spot and provide an image of the edges of an object. The resulting blurred zone of unsharpness on an image causes a loss in image clarity by reducing sharpness and resolution. The larger the focal spot area, the greater the loss of clarity.
Three methods exist for minimizing this loss of image clarity and improving the quality of radiographs: 1. Use as small an effective focal spot as practical. Dental x-ray machines
should have a nominal focal spot size of 1.0 mm or less. Some tubes used in extraoral radiography have effective focal spots measuring 0.3 mm, which greatly adds to image clarity. X-ray tube manufac-turers use as small an effective focal spot size as is consistent with the requirements for heat dissipation. As described in Chapter 1 ,
the size of the effective focal spot is a function of the angle of the target with respect to the long axis of the electron beam. A large angle distributes the electron beam over a larger surface and decreases the heat generated per unit of target area, thus prolong-ing tube life. However, this results in a larger effective focal spot and loss of image clarity ( Fig. 4-2 ). A small angle has a greater wearing effect on the target but results in a smaller effective focal spot, decreased unsharpness, and increased image sharpness and resolution. This angle of the face of the target to the central x-ray beam is usually between 10 and 20 degrees.
2. Increase the distance between the focal spot and the object by using a long, open-ended cylinder. Figure 4-3 shows how increasing the focal spot-to-object distance reduces image blurring by reducing the divergence of the x-ray beam. The longer focal spot-to-object distance minimizes blurring by using photons whose paths are almost parallel. The benefi ts of using a long focal spot-to-object distance support the use of long, open-ended cylinders as aiming devices on dental x-ray machines.
3. Minimize the distance between the object and the fi lm. Figure 4-4 shows that, as the object-to-fi lm distance is reduced, the unsharp-ness decreases, resulting in enhanced image clarity. This is the result of minimizing the divergence of the x-ray photons.
Image Size Distortion
Image size distortion (magnifi cation) is the increase in size of the image on the radiograph compared with the actual size of the object. The divergent paths of photons in an x-ray beam cause enlargement of the image on a radiograph. Image size distortion results from the relative distances of the focal spot-to-fi lm and object-to-fi lm (see Figs. 4-3 and 4-4 ). Accordingly, increasing the focal spot-to-fi lm distance and decreasing the object-to-fi lm distance minimizes image magnifi -cation. The use of a long, open-ended cylinder as an aiming device on an x-ray machine thus reduces the magnifi cation of images on a periapical view. Furthermore, as previously mentioned, this technique also improves image clarity by increasing the distance between the focal spot and the object.
Image Shape Distortion
Image shape distortion is the result of unequal magnifi cation of dif-ferent parts of the same object. This situation arises when not all the parts of an object are at the same focal spot-to-object distance. The physical shape of the object may often prevent its optimal orientation, resulting in some shape distortion. Such a phenomenon is seen by the differences in appearance of the image on a radiograph compared with the true shape. To minimize shape distortion, the practitioner
46
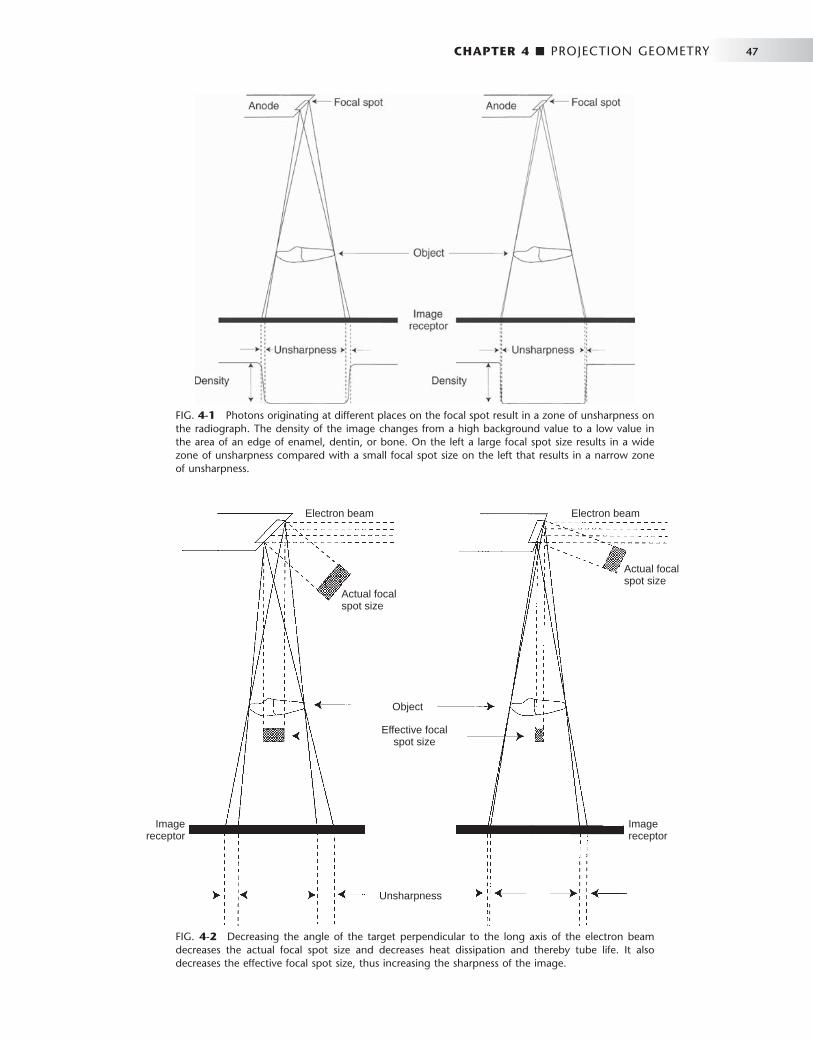
CHAPTER 4 ■ PROJECTION GEOMETRY 47
FIG. 4-1 Photons originating at different places on the focal spot result in a zone of unsharpness on the radiograph. The density of the image changes from a high background value to a low value in the area of an edge of enamel, dentin, or bone. On the left a large focal spot size results in a wide zone of unsharpness compared with a small focal spot size on the left that results in a narrow zone of unsharpness.
FIG. 4-2 Decreasing the angle of the target perpendicular to the long axis of the electron beam decreases the actual focal spot size and decreases heat dissipation and thereby tube life. It also decreases the effective focal spot size, thus increasing the sharpness of the image.
Unsharpness
Object
Effective focalspot size
Actual focalspot size
Actual focalspot size
Electron beamElectron beam
Imagereceptor
Imagereceptor
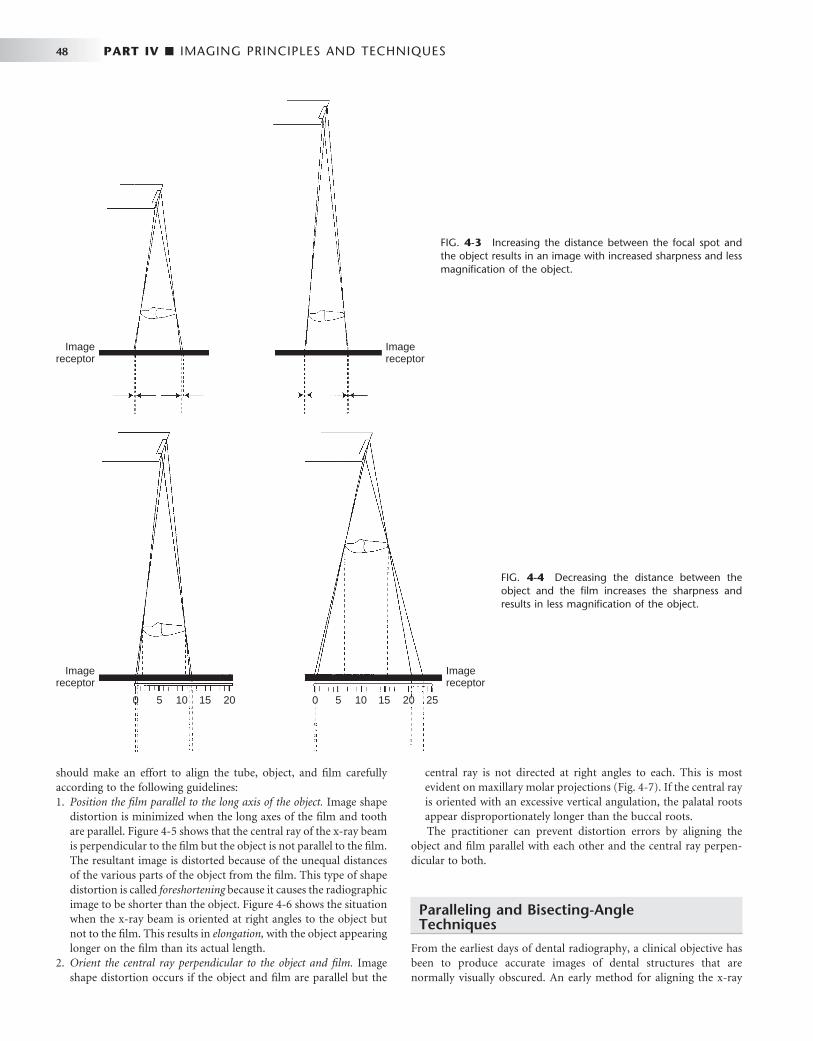
48 PART IV ■ IMAGING PRINCIPLES AND TECHNIQUES
FIG. 4-3 Increasing the distance between the focal spot and the object results in an image with increased sharpness and less magnifi cation of the object.
Imagereceptor
Imagereceptor
FIG. 4-4 Decreasing the distance between the object and the fi lm increases the sharpness and results in less magnifi cation of the object.
0 5 10 15 20 0 5 10 15 20 25
Imagereceptor
Imagereceptor
should make an effort to align the tube, object, and fi lm carefully according to the following guidelines: 1. Position the fi lm parallel to the long axis of the object. Image shape
distortion is minimized when the long axes of the fi lm and tooth are parallel. Figure 4-5 shows that the central ray of the x-ray beam is perpendicular to the fi lm but the object is not parallel to the fi lm. The resultant image is distorted because of the unequal distances of the various parts of the object from the fi lm. This type of shape distortion is called foreshortening because it causes the radiographic image to be shorter than the object. Figure 4-6 shows the situation when the x-ray beam is oriented at right angles to the object but not to the fi lm. This results in elongation, with the object appearing longer on the fi lm than its actual length.
2. Orient the central ray perpendicular to the object and fi lm. Image shape distortion occurs if the object and fi lm are parallel but the
central ray is not directed at right angles to each. This is most evident on maxillary molar projections ( Fig. 4-7 ). If the central ray is oriented with an excessive vertical angulation, the palatal roots appear disproportionately longer than the buccal roots. The practitioner can prevent distortion errors by aligning the
object and fi lm parallel with each other and the central ray perpen-dicular to both.
Paralleling and Bisecting-Angle Techniques
From the earliest days of dental radiography, a clinical objective has been to produce accurate images of dental structures that are normally visually obscured. An early method for aligning the x-ray

CHAPTER 4 ■ PROJECTION GEOMETRY 49
FIG. 4-5 Foreshortening of a radiographic image results when the central ray is perpendicular to the fi lm but the object is not parallel with the fi lm.
0 5 10
05
10
Imagereceptor
FIG. 4-6 Elongation of a radiographic image results when the central ray is perpendicular to the object but not to the fi lm.
0
5
10
0 5 10
15
20
25
beam and fi lm with the teeth and jaws was the bisecting-angle tech-nique ( Fig. 4-8 ). In this method the fi lm is placed as close to the teeth as possible without deforming it. However, when the fi lm is in this position, it is not parallel to the long axes of the teeth. This arrange-ment inherently causes distortion. Nevertheless, by directing the central ray perpendicular to an imaginary plane that bisects the angle between the teeth and the fi lm, the practitioner can make the length of the tooth ’ s image on the fi lm correspond to the actual length of the tooth. This angle between a tooth and the fi lm is especially apparent
FIG. 4-7 The central ray should be perpendicular to the long axes of both the tooth and the fi lm. If the direction of the x-ray beam is not at right angles to the long axis of the tooth, then the appearance of the tooth is distorted, as seen by apparent elongation of the length of the palatal roots. Additionally, distortion of the relationship of the height of the alveolar crest relative to the cementoenamel junction occurs. In this case the buccal alveolar crest appears to lie superior to the palatal cementoenamel junction.
FIG. 4-8 In the bisecting-angle technique the central ray is directed at a right angle to the imaginary plane that bisects the angle formed by the fi lm and the central axis of the object. This method results in an image that is the same length as the object.
Central axis of toothImaginary bisector
when teeth are radiographed in the maxilla or anterior mandible. Although the projected length of a tooth is correct, the image is still distorted because the fi lm and object are not parallel and the x-ray beam is not directed at right angles to them. This distortion tends to increase along the image toward the apex.
When the central ray is not perpendicular to the bisector plane, the length of the image of a projected tooth changes. If the central ray is directed at an angle that is more positive than perpendicular to the bisector, the image of the tooth is foreshortened. Likewise, if it is inclined with more negative angulation to the bisector, the image is elongated. In recent years, the bisecting-angle technique has been used less frequently for general periapical radiography as use of the paral-leling technique has increased.
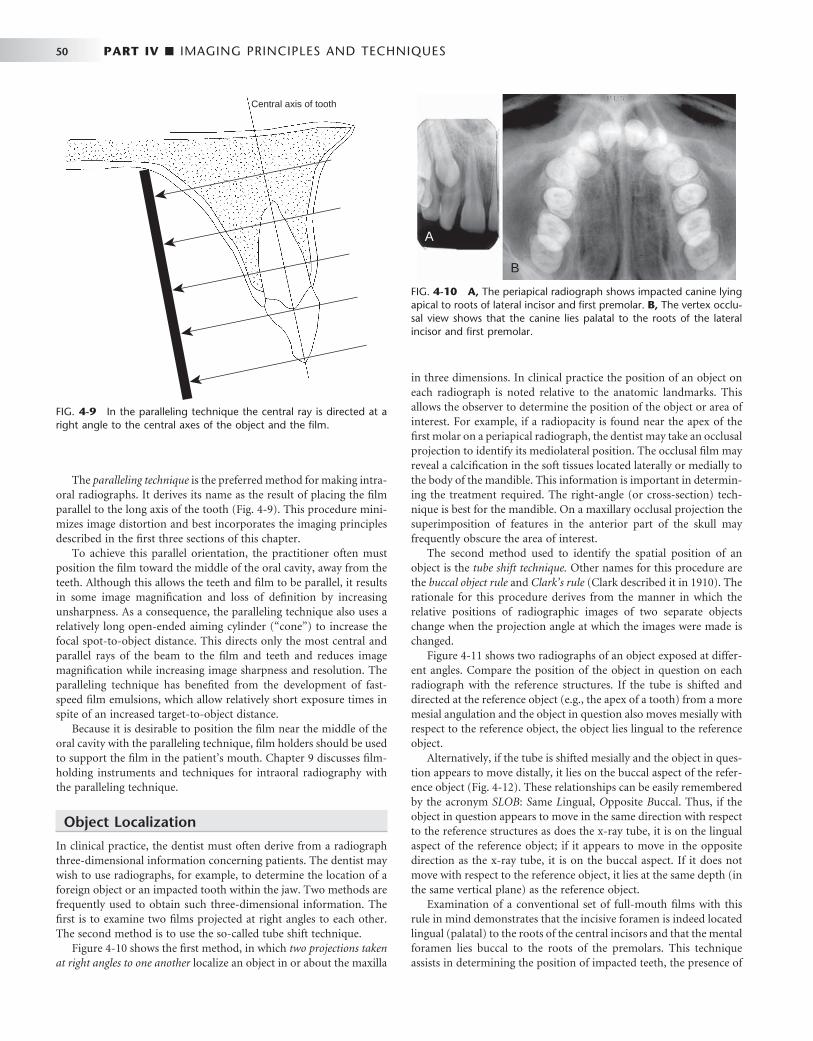
50 PART IV ■ IMAGING PRINCIPLES AND TECHNIQUES
The paralleling technique is the preferred method for making intra-oral radiographs. It derives its name as the result of placing the fi lm parallel to the long axis of the tooth ( Fig. 4-9 ). This procedure mini-mizes image distortion and best incorporates the imaging principles described in the fi rst three sections of this chapter.
To achieve this parallel orientation, the practitioner often must position the fi lm toward the middle of the oral cavity, away from the teeth. Although this allows the teeth and fi lm to be parallel, it results in some image magnifi cation and loss of defi nition by increasing unsharpness. As a consequence, the paralleling technique also uses a relatively long open-ended aiming cylinder ( “ cone ” ) to increase the focal spot-to-object distance. This directs only the most central and parallel rays of the beam to the fi lm and teeth and reduces image magnifi cation while increasing image sharpness and resolution. The paralleling technique has benefi ted from the development of fast-speed fi lm emulsions, which allow relatively short exposure times in spite of an increased target-to-object distance.
Because it is desirable to position the fi lm near the middle of the oral cavity with the paralleling technique, fi lm holders should be used to support the fi lm in the patient ’ s mouth. Chapter 9 discusses fi lm-holding instruments and techniques for intraoral radiography with the paralleling technique.
Object Localization
In clinical practice, the dentist must often derive from a radiograph three-dimensional information concerning patients. The dentist may wish to use radiographs, for example, to determine the location of a foreign object or an impacted tooth within the jaw. Two methods are frequently used to obtain such three-dimensional information. The fi rst is to examine two fi lms projected at right angles to each other. The second method is to use the so-called tube shift technique.
Figure 4-10 shows the fi rst method, in which two projections taken at right angles to one another localize an object in or about the maxilla
in three dimensions. In clinical practice the position of an object on each radiograph is noted relative to the anatomic landmarks. This allows the observer to determine the position of the object or area of interest. For example, if a radiopacity is found near the apex of the fi rst molar on a periapical radiograph, the dentist may take an occlusal projection to identify its mediolateral position. The occlusal fi lm may reveal a calcifi cation in the soft tissues located laterally or medially to the body of the mandible. This information is important in determin-ing the treatment required. The right-angle (or cross-section) tech-nique is best for the mandible. On a maxillary occlusal projection the superimposition of features in the anterior part of the skull may frequently obscure the area of interest.
The second method used to identify the spatial position of an object is the tube shift technique. Other names for this procedure are the buccal object rule and Clark ’ s rule (Clark described it in 1910). The rationale for this procedure derives from the manner in which the relative positions of radiographic images of two separate objects change when the projection angle at which the images were made is changed.
Figure 4-11 shows two radiographs of an object exposed at differ-ent angles. Compare the position of the object in question on each radiograph with the reference structures. If the tube is shifted and directed at the reference object (e.g., the apex of a tooth) from a more mesial angulation and the object in question also moves mesially with respect to the reference object, the object lies lingual to the reference object.
Alternatively, if the tube is shifted mesially and the object in ques-tion appears to move distally, it lies on the buccal aspect of the refer-ence object ( Fig. 4-12 ). These relationships can be easily remembered by the acronym SLOB : S ame L ingual, O pposite B uccal. Thus, if the object in question appears to move in the same direction with respect to the reference structures as does the x-ray tube, it is on the lingual aspect of the reference object; if it appears to move in the opposite direction as the x-ray tube, it is on the buccal aspect. If it does not move with respect to the reference object, it lies at the same depth (in the same vertical plane) as the reference object.
Examination of a conventional set of full-mouth fi lms with this rule in mind demonstrates that the incisive foramen is indeed located lingual (palatal) to the roots of the central incisors and that the mental foramen lies buccal to the roots of the premolars. This technique assists in determining the position of impacted teeth, the presence of
FIG. 4-9 In the paralleling technique the central ray is directed at a right angle to the central axes of the object and the fi lm.
Central axis of tooth
FIG. 4-10 A, The periapical radiograph shows impacted canine lying apical to roots of lateral incisor and fi rst premolar. B, The vertex occlu-sal view shows that the canine lies palatal to the roots of the lateral incisor and fi rst premolar.
A
B
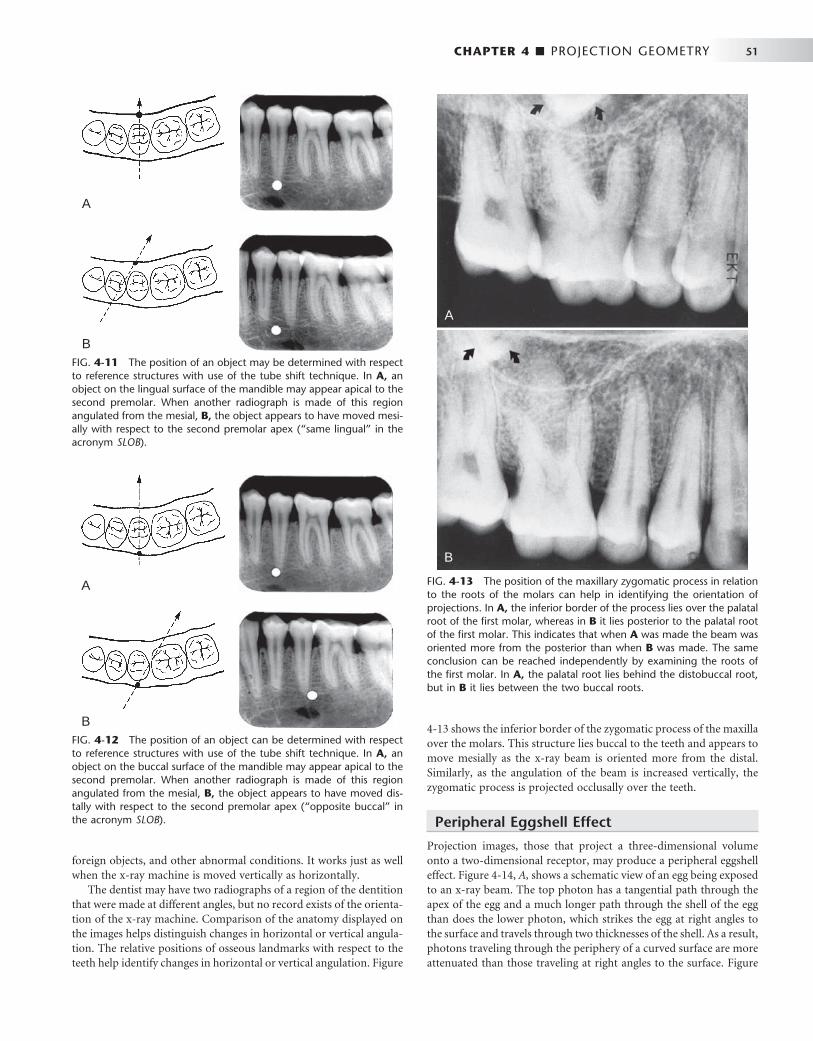
CHAPTER 4 ■ PROJECTION GEOMETRY 51
4-13 shows the inferior border of the zygomatic process of the maxilla over the molars. This structure lies buccal to the teeth and appears to move mesially as the x-ray beam is oriented more from the distal. Similarly, as the angulation of the beam is increased vertically, the zygomatic process is projected occlusally over the teeth.
Peripheral Eggshell Effect
Projection images, those that project a three-dimensional volume onto a two-dimensional receptor, may produce a peripheral eggshell effect. Figure 4-14, A , shows a schematic view of an egg being exposed to an x-ray beam. The top photon has a tangential path through the apex of the egg and a much longer path through the shell of the egg than does the lower photon, which strikes the egg at right angles to the surface and travels through two thicknesses of the shell. As a result, photons traveling through the periphery of a curved surface are more attenuated than those traveling at right angles to the surface. Figure
FIG. 4-11 The position of an object may be determined with respect to reference structures with use of the tube shift technique. In A, an object on the lingual surface of the mandible may appear apical to the second premolar. When another radiograph is made of this region angulated from the mesial, B, the object appears to have moved mesi-ally with respect to the second premolar apex ( “ same lingual ” in the acronym SLOB ).
A
B
FIG. 4-12 The position of an object can be determined with respect to reference structures with use of the tube shift technique. In A, an object on the buccal surface of the mandible may appear apical to the second premolar. When another radiograph is made of this region angulated from the mesial, B, the object appears to have moved dis-tally with respect to the second premolar apex ( “ opposite buccal ” in the acronym SLOB ).
A
B
foreign objects, and other abnormal conditions. It works just as well when the x-ray machine is moved vertically as horizontally.
The dentist may have two radiographs of a region of the dentition that were made at different angles, but no record exists of the orienta-tion of the x-ray machine. Comparison of the anatomy displayed on the images helps distinguish changes in horizontal or vertical angula-tion. The relative positions of osseous landmarks with respect to the teeth help identify changes in horizontal or vertical angulation. Figure
FIG. 4-13 The position of the maxillary zygomatic process in relation to the roots of the molars can help in identifying the orientation of projections. In A, the inferior border of the process lies over the palatal root of the fi rst molar, whereas in B it lies posterior to the palatal root of the fi rst molar. This indicates that when A was made the beam was oriented more from the posterior than when B was made. The same conclusion can be reached independently by examining the roots of the fi rst molar. In A, the palatal root lies behind the distobuccal root, but in B it lies between the two buccal roots.
A
B

52 PART IV ■ IMAGING PRINCIPLES AND TECHNIQUES
FIG. 4-14 Peripheral eggshell effect. A is a radiograph of a hard-boiled egg. Note how the peripheral rim, the eggshell, is opaque even though the eggshell is uniform in thickness. B shows a schematic view of this egg being exposed to an x-ray beam. The top photon has a tangential path through the apex of the egg and a longer path through the shell of the egg than the lower photon. As a result, photons traveling through the periphery of a curved surface are more attenuated than those traveling at right angles to the surface. C shows an expansile lesion on the buccal surface of the mandible on an occlusal view. Note how the periphery of the expanded cortex is more opaque than the region inside the expanded border as a result of the peripheral eggshell effect.
A B
C
4-14, B , shows an expansile lesion on the buccal surface of the man-dible on an occlusal view. Note how the periphery of the expanded cortex is more opaque than the region inside the expanded border. The cortical bone in not thicker on the cortex than over the rest of the lesion, but rather the x-ray beam is more attenuated in this region because of the longer path length of photons through the bony cortex on the periphery. This peripheral eggshell effect accounts for why the lamina dura, the border of the maxillary sinuses and nasal fossa, and numerous other structures are well demonstrated on projection images. Note that soft tissue masses, such as the nose and tongue, do not show a peripheral eggshell effect because they are uniform rather then being composed of a dense layer surrounding a more lucent interior.
BIBLIOGRAPHY
BUCCAL OBJECT RULE
1 Chenail B , Aurelio JA , Gerstein H : A model for teaching the Buccal Object Moves Most Rule , J Endod 9 : 452 - 453 , 1983 .
2 Clark CA : A method of ascertaining the relative position of unerupted teeth by means of fi lm radiographs , Proc R Soc Med Odontol Sect 3 : 87 - 90 , 1910 .
3 Goerig AC , Neaverth EJ : A simplifi ed look at the buccal object rule in endodontics , J Endod 13 : 570 - 572 , 1987 .
4 Jacobs SG : Radiographic localization of unerupted maxillary anterior teeth using the vertical tube shift technique: the history and application of the method with some case reports , Am J Orthod Dentofac Orthop 116 : 415 - 423 , 1999 .
5 Jacobs SG : Radiographic localization of unerupted teeth: further fi ndings about the vertical tube shift method and other localization techniques , Am J Orthod Dentofac Orthop 118 : 439 - 447 , 2000 .
6 Khabbaz MG , Serefoglou MH : The application of the buccal object rule for the determination of calcifi ed root canals , Int Endod J 29 : 284 - 287 , 1996 .
7 Ludlow JB : The Buccal Object Rule , Dentomaxillofac Radiol 28 : 258 , 1999 . 8 Reader A : A teaching model for the buccal object rule , J Dent Educ 48 : 469 -
472 , 1984 .
PARALLELING TECHNIQUE
9 Forsberg J : A comparison of the paralleling and bisecting-angle radiographic techniques in endodontics , Int Endod J 20 : 177 - 182 , 1987 .
10 Forsberg J , Halse A : Radiographic simulation of a periapical lesion comparing the paralleling and the bisecting-angle techniques , Int Endod J 27 : 133 - 138 , 1994 .
11 Schulze RK , d ’ Hoedt B : A method to calculate angular disparities between object and receptor in “ paralleling technique, ” Dentomaxillofac Radiol 31 : 32 - 38 , 2002 .
C H A P T E R 5
X-Ray Film, Intensifying Screens, and Grids
A beam of x-ray photons that passes through the dental arches is reduced in intensity (attenuated) by absorption and scat-tering of photons out of the primary beam. The pattern of
the photons that exits the subject, the remnant beam, conveys infor-mation about the structure and composition of the absorber. For this information to be useful diagnostically, the remnant beam must be recorded on an image receptor. The image receptor most often used in dental radiography is x-ray fi lm. This chapter describes x-ray fi lm and its properties and the use of intensifying screens and grids to modify radiographic images. Digital radiographic systems, which also may be used to make radiographs, are described in Chapter 7 .
X-Ray Film
COMPOSITION
X-ray fi lm has two principal components: emulsion and base. The emulsion, which is sensitive to x rays and visible light, records the radiographic image. The base is a plastic supporting material onto which the emulsion is coated ( Fig. 5-1 ).
Emulsion The two principal components of emulsion are silver halide grains, which are sensitive to x radiation and visible light, and a vehicle matrix in which the crystals are suspended. The silver halide grains are com-posed primarily of crystals of silver bromide. The composition of a dental fi lm emulsion is shown in Table 5-1 . Iodide is added to Ultra-Speed fi lm because its large diameter (compared with bromine) dis-rupts the regularity of the silver bromide crystal structure, thereby increasing its sensitivity to x radiation. Iodide is not used in InSight fi lm. The photosensitivity of the silver halide crystals also depends on the presence of trace amounts of a sulfur-containing compound. In addition, trace amounts of gold are sometimes added to silver halide crystals to improve their sensitivity.
The silver halide grains in InSight fi lm are fl at, tabular crystals with a mean diameter of about 1.8 μ m ( Fig. 5-2 ). Ultra-Speed fi lm is com-posed of globular-shaped crystals about 1 μ m in diameter. The tabular grains of the InSight fi lm are oriented parallel with the fi lm surface to offer a large cross-sectional area to the x-ray beam ( Fig. 5-3 ). As a result, InSight fi lm requires only about half the exposure of Ultra-Speed fi lm.
In the manufacture of fi lm, the silver halide grains are suspended in a surrounding vehicle that is applied to both sides of the supporting base. The vehicle, composed of gelatinous and nongelatinous materi-als, keeps the silver halide grains evenly dispersed. To ensure good
adhesion of the emulsion to the fi lm base, a thin layer of adhesive material is added to the base before the emulsion is applied. During fi lm processing, the vehicle absorbs the processing solutions, allowing the chemicals to reach and react with the silver halide grains. An additional layer of vehicle is added to the fi lm emulsion as an overcoat; this barrier helps protect the fi lm from damage by scratching, con-tamination, or pressure from rollers when an automatic processor is used.
Film emulsions are sensitive to both x-ray photons and visible light. Film intended to be exposed by x rays is called direct exposure fi lm. All intraoral dental fi lm is direct exposure fi lm. Screen fi lm , which is sensitive to visible light, is used with intensifying screens that emit visible light. Screen fi lm and intensifying screens are used for extraoral projections such as panoramic and skull radiographs. Intensifying screens are described later in this chapter.
Base The function of the fi lm base is to support the emulsion. The base must have the proper degree of fl exibility to allow easy handling of the fi lm. The base for dental x-ray fi lm is 0.18 mm thick and is made of polyester polyethylene terephthalate. The fi lm base is uniformly translucent and casts no pattern on the resultant radiograph. Some think that a base with a slight blue tint improves viewing of diagnostic detail. The fi lm base must also withstand exposure to processing solu-tions without becoming distorted.
INTRAORAL X-RAY FILM
A number of manufacturers around the world make intraoral dental x-ray fi lm. In each case the fi lm is made as a double-emulsion fi lm, that is, coated with an emulsion on each side of the base. With a double layer of emulsion, less radiation can be used to produce an image. Direct exposure fi lm is used for intraoral examinations because it provides higher-resolution images than screen-fi lm combinations. Some diagnostic tasks, such as detection of incipient caries or early periapical disease, require this higher resolution.
One corner of each dental fi lm has a small, raised dot that is used for fi lm orientation ( Fig. 5-4 ). The manufacturer orients the fi lm in the packet so that the convex side of the dot is toward the front of the packet and faces the x-ray tube. The side of the fi lm with the depres-sion is thus oriented toward the patient ’ s tongue. After the fi lm has been exposed and processed, the dot is used to identify the image as showing the patient ’ s right or left side. When the fi lms are mounted with the images of the teeth in the anatomic position, each fi lm is fi rst oriented with the convex side of the dot toward the viewer. Then, on
53
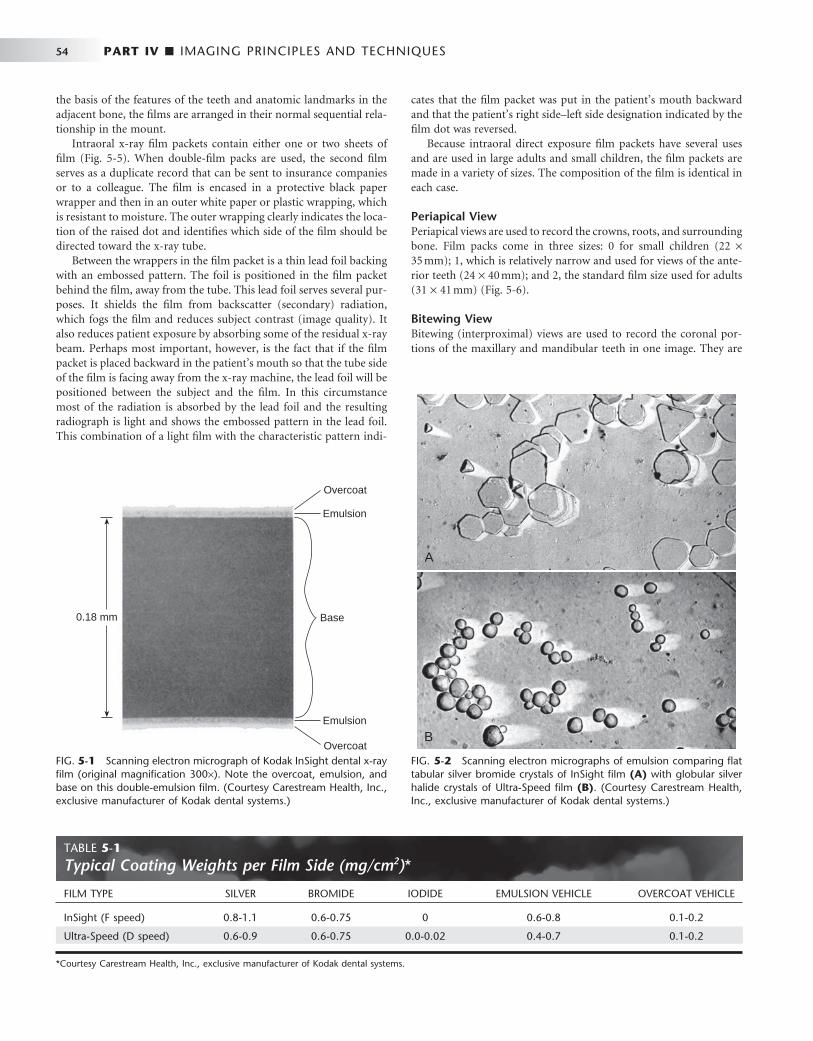
54 PART IV ■ IMAGING PRINCIPLES AND TECHNIQUES
the basis of the features of the teeth and anatomic landmarks in the adjacent bone, the fi lms are arranged in their normal sequential rela-tionship in the mount.
Intraoral x-ray fi lm packets contain either one or two sheets of fi lm ( Fig. 5-5 ). When double-fi lm packs are used, the second fi lm serves as a duplicate record that can be sent to insurance companies or to a colleague. The fi lm is encased in a protective black paper wrapper and then in an outer white paper or plastic wrapping, which is resistant to moisture. The outer wrapping clearly indicates the loca-tion of the raised dot and identifi es which side of the fi lm should be directed toward the x-ray tube.
Between the wrappers in the fi lm packet is a thin lead foil backing with an embossed pattern. The foil is positioned in the fi lm packet behind the fi lm, away from the tube. This lead foil serves several pur-poses. It shields the fi lm from backscatter (secondary) radiation, which fogs the fi lm and reduces subject contrast (image quality). It also reduces patient exposure by absorbing some of the residual x-ray beam. Perhaps most important, however, is the fact that if the fi lm packet is placed backward in the patient ’ s mouth so that the tube side of the fi lm is facing away from the x-ray machine, the lead foil will be positioned between the subject and the fi lm. In this circumstance most of the radiation is absorbed by the lead foil and the resulting radiograph is light and shows the embossed pattern in the lead foil. This combination of a light fi lm with the characteristic pattern indi-
FIG. 5-1 Scanning electron micrograph of Kodak InSight dental x-ray fi lm (original magnifi cation 300 × ). Note the overcoat, emulsion, and base on this double-emulsion fi lm. (Courtesy Carestream Health, Inc., exclusive manufacturer of Kodak dental systems.)
0.18 mm Base
Overcoat
Emulsion
Emulsion
Overcoat FIG. 5-2 Scanning electron micrographs of emulsion comparing fl at tabular silver bromide crystals of InSight fi lm (A) with globular silver halide crystals of Ultra-Speed fi lm (B) . (Courtesy Carestream Health, Inc., exclusive manufacturer of Kodak dental systems.)
A
B
cates that the fi lm packet was put in the patient ’ s mouth backward and that the patient ’ s right side – left side designation indicated by the fi lm dot was reversed.
Because intraoral direct exposure fi lm packets have several uses and are used in large adults and small children, the fi lm packets are made in a variety of sizes. The composition of the fi lm is identical in each case.
Periapical View Periapical views are used to record the crowns, roots, and surrounding bone. Film packs come in three sizes: 0 for small children (22 × 35 mm); 1, which is relatively narrow and used for views of the ante-rior teeth (24 × 40 mm); and 2, the standard fi lm size used for adults (31 × 41 mm) ( Fig. 5-6 ).
Bitewing View Bitewing (interproximal) views are used to record the coronal por-tions of the maxillary and mandibular teeth in one image. They are
TABLE 5-1 Typical Coating Weights per Film Side (mg/cm 2 ) *
FILM TYPE SILVER BROMIDE IODIDE EMULSION VEHICLE OVERCOAT VEHICLE
InSight (F speed) 0.8-1.1 0.6-0.75 0 0.6-0.8 0.1-0.2
Ultra-Speed (D speed) 0.6-0.9 0.6-0.75 0.0-0.02 0.4-0.7 0.1-0.2
* Courtesy Carestream Health, Inc., exclusive manufacturer of Kodak dental systems.
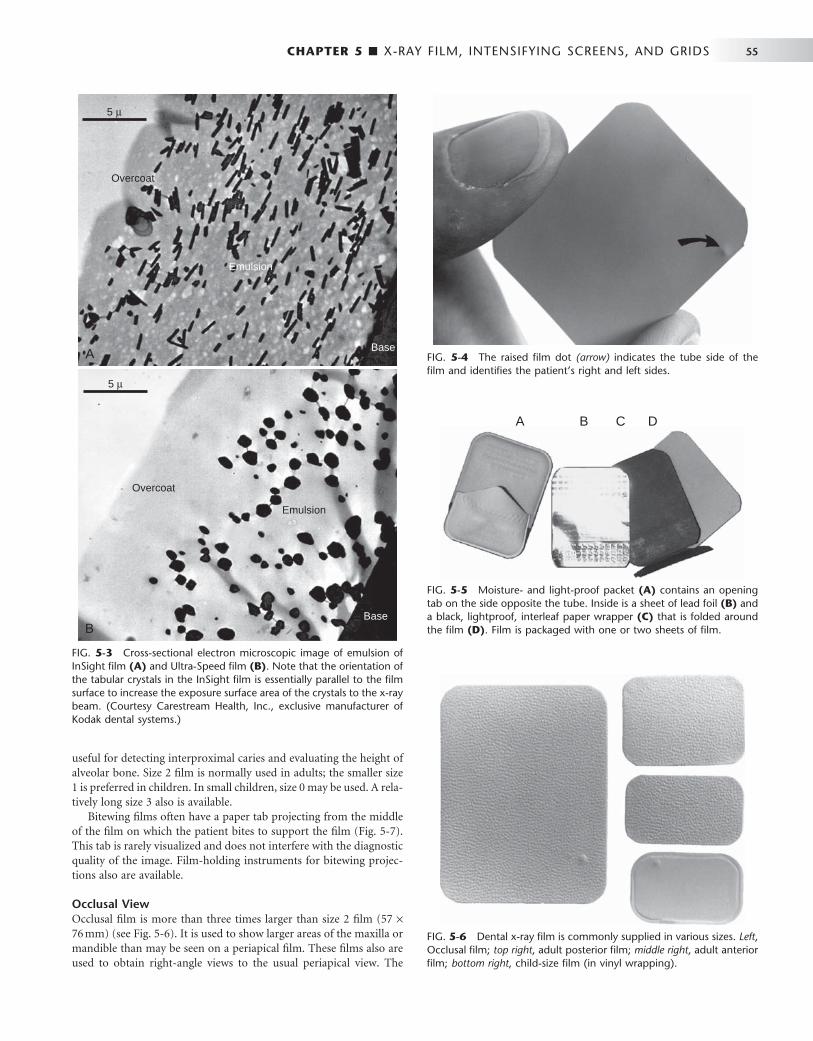
CHAPTER 5 ■ X-RAY FILM, INTENSIFYING SCREENS, AND GRIDS 55
useful for detecting interproximal caries and evaluating the height of alveolar bone. Size 2 fi lm is normally used in adults; the smaller size 1 is preferred in children. In small children, size 0 may be used. A rela-tively long size 3 also is available.
Bitewing fi lms often have a paper tab projecting from the middle of the fi lm on which the patient bites to support the fi lm ( Fig. 5-7 ). This tab is rarely visualized and does not interfere with the diagnostic quality of the image. Film-holding instruments for bitewing projec-tions also are available.
Occlusal View Occlusal fi lm is more than three times larger than size 2 fi lm (57 × 76 mm) (see Fig. 5-6 ). It is used to show larger areas of the maxilla or mandible than may be seen on a periapical fi lm. These fi lms also are used to obtain right-angle views to the usual periapical view. The
FIG. 5-3 Cross-sectional electron microscopic image of emulsion of InSight fi lm (A) and Ultra-Speed fi lm (B) . Note that the orientation of the tabular crystals in the InSight fi lm is essentially parallel to the fi lm surface to increase the exposure surface area of the crystals to the x-ray beam. (Courtesy Carestream Health, Inc., exclusive manufacturer of Kodak dental systems.)
Overcoat
Emulsion
Base
5 μ
Overcoat
Emulsion
Base
5 μ
A
B
FIG. 5-4 The raised fi lm dot (arrow) indicates the tube side of the fi lm and identifi es the patient ’ s right and left sides.
FIG. 5-5 Moisture- and light-proof packet (A) contains an opening tab on the side opposite the tube. Inside is a sheet of lead foil (B) and a black, lightproof, interleaf paper wrapper (C) that is folded around the fi lm (D) . Film is packaged with one or two sheets of fi lm.
A B C D
FIG. 5-6 Dental x-ray fi lm is commonly supplied in various sizes. Left , Occlusal fi lm; top right , adult posterior fi lm; middle right , adult anterior fi lm; bottom right , child-size fi lm (in vinyl wrapping).

56 PART IV ■ IMAGING PRINCIPLES AND TECHNIQUES
name derives from the fact that the fi lm usually is held in position by having the patient bite lightly on it to support it between the occlusal surfaces of the teeth (see Chapter 9 ).
SCREEN FILM
The extraoral projections used most frequently in dentistry are the panoramic, cephalometric, and other skull views. For these projec-tions and for virtually all other extraoral radiography, screen fi lm is used with intensifying screens (described later in this chapter) to reduce patient exposure. Screen fi lm is different from dental intraoral fi lm. It is designed to be sensitive to visible light because it is placed between two intensifying screens when an exposure is made. The intensifying screens absorb x rays and emit visible light, which exposes the screen fi lm. Silver halide crystals are inherently sensitive to ultra-violet (UV) and blue light (300 to 500 nm) and thus are sensitive to screens that emit UV and blue light. When fi lm is used with screens that emit green light, the silver halide crystals are coated with sensitiz-ing dyes to increase absorption. Because the properties of intensifying screens vary, the dentist should use the appropriate screen-fi lm com-bination recommended by the screen and fi lm manufacturer so that the emission characteristics of the screen match the absorption char-acteristics of the fi lm.
Several general types of screen fi lm are suitable for extraoral radi-ography. Several manufacturers supply high-contrast, medium-speed fi lm suitable for skull radiography. Other fi lms are available that are faster (i.e., they require less radiation exposure), but these provide less image detail. Such fi lms should be considered for panoramic radiog-raphy when fi ne image detail is not available because of movement of the x-ray tube head during the exposure.
Another type of fi lm provides less contrast and a wider latitude. This type reveals a wide range of densities and is most suitable for cephalometric radiography, when both bony and soft tissue details are desired.
Contemporary screen fi lms use tabular-shaped (fl at) grains of silver halide ( Fig. 5-8 ) to capture the image. The tabular grains are oriented with their relatively large, fl at surfaces facing the radiation
source, providing a larger cross-section (target) and resulting in increased speed without loss of sharpness. In addition, green-sensitizing dyes are added to the surface of the tabular grains, increas-ing their light-absorbing capability. Some manufacturers add an absorbing dye in the fi lm emulsion to reduce crossover of light from one screen to the fi lm emulsion on the opposite side. This increases the sharpness of the image.
Intensifying Screens
Early in the history of radiography, scientists discovered that various inorganic salts or phosphors fl uoresce (emit visible light) when exposed to an x-ray beam. The intensity of this fl uorescence is pro-portional to the x-ray energy absorbed. These phosphors have been incorporated into intensifying screens for use with screen fi lm. The sum of the effects of the x rays and the visible light emitted by the screen phosphors exposes the fi lm in an intensifying cassette.
FUNCTION
The presence of intensifying screens creates an image receptor system that is 10 to 60 times more sensitive to x rays than the fi lm alone. Consequently, use of intensifying screens means a substantial reduc-tion in the dose of x radiation to which the patient is exposed. Inten-sifying screens are used with fi lms for virtually all extraoral radiography, including panoramic, cephalometric, and skull projections. In general, the resolving power of screens is related to their speed: the slower the speed of a screen, the greater its resolving power and vice versa. Inten-sifying screens are not used intraorally with periapical or occlusal fi lms because their use would reduce the resolution of the resulting image below that necessary for diagnosis of much dental disease.
FIG. 5-7 Paper loop placed around a size 2 adult fi lm to support the fi lm when the patient bites on the tab for a bitewing projection. This projection reveals the tooth crowns and alveolar crests.
FIG. 5-8 T grains of silver halide in an emulsion of T-Mat fi lm (A) are larger and fl atter than the smaller, thicker crystals in an emulsion of conventional fi lm (B) . Note that the fl at surfaces of the T grains are oriented parallel with the fi lm surface, facing the radiation source. (Courtesy Carestream Health, Inc., exclusive manufacturer of Kodak dental systems.)
A B
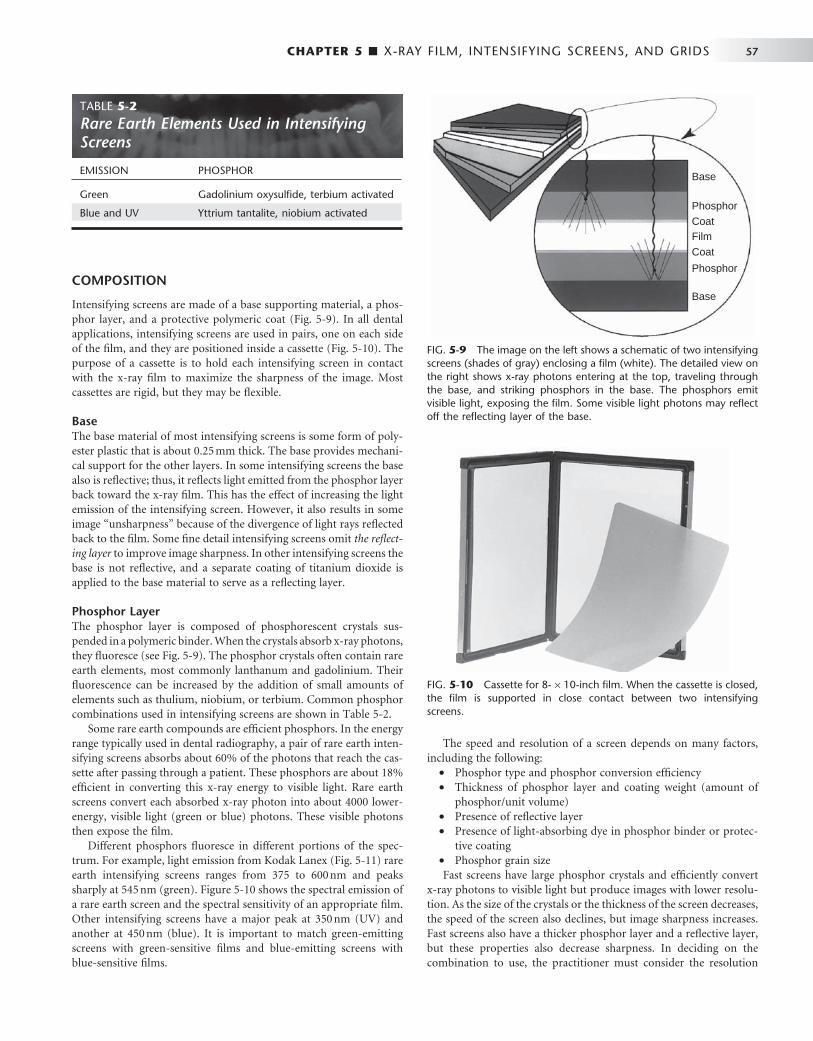
CHAPTER 5 ■ X-RAY FILM, INTENSIFYING SCREENS, AND GRIDS 57
COMPOSITION
Intensifying screens are made of a base supporting material, a phos-phor layer, and a protective polymeric coat ( Fig. 5-9 ). In all dental applications, intensifying screens are used in pairs, one on each side of the fi lm, and they are positioned inside a cassette ( Fig. 5-10 ). The purpose of a cassette is to hold each intensifying screen in contact with the x-ray fi lm to maximize the sharpness of the image. Most cassettes are rigid, but they may be fl exible.
Base The base material of most intensifying screens is some form of poly-ester plastic that is about 0.25 mm thick. The base provides mechani-cal support for the other layers. In some intensifying screens the base also is refl ective; thus, it refl ects light emitted from the phosphor layer back toward the x-ray fi lm. This has the effect of increasing the light emission of the intensifying screen. However, it also results in some image “ unsharpness ” because of the divergence of light rays refl ected back to the fi lm. Some fi ne detail intensifying screens omit the refl ect-ing layer to improve image sharpness. In other intensifying screens the base is not refl ective, and a separate coating of titanium dioxide is applied to the base material to serve as a refl ecting layer.
Phosphor Layer The phosphor layer is composed of phosphorescent crystals sus-pended in a polymeric binder. When the crystals absorb x-ray photons, they fl uoresce (see Fig. 5-9 ). The phosphor crystals often contain rare earth elements, most commonly lanthanum and gadolinium. Their fl uorescence can be increased by the addition of small amounts of elements such as thulium, niobium, or terbium. Common phosphor combinations used in intensifying screens are shown in Table 5-2 .
Some rare earth compounds are effi cient phosphors. In the energy range typically used in dental radiography, a pair of rare earth inten-sifying screens absorbs about 60% of the photons that reach the cas-sette after passing through a patient. These phosphors are about 18% effi cient in converting this x-ray energy to visible light. Rare earth screens convert each absorbed x-ray photon into about 4000 lower-energy, visible light (green or blue) photons. These visible photons then expose the fi lm.
Different phosphors fl uoresce in different portions of the spec-trum. For example, light emission from Kodak Lanex ( Fig. 5-11 ) rare earth intensifying screens ranges from 375 to 600 nm and peaks sharply at 545 nm (green). Figure 5-10 shows the spectral emission of a rare earth screen and the spectral sensitivity of an appropriate fi lm. Other intensifying screens have a major peak at 350 nm (UV) and another at 450 nm (blue). It is important to match green-emitting screens with green-sensitive fi lms and blue-emitting screens with blue-sensitive fi lms.
The speed and resolution of a screen depends on many factors, including the following:
• Phosphor type and phosphor conversion effi ciency • Thickness of phosphor layer and coating weight (amount of
phosphor/unit volume) • Presence of refl ective layer • Presence of light-absorbing dye in phosphor binder or protec-
tive coating • Phosphor grain size Fast screens have large phosphor crystals and effi ciently convert
x-ray photons to visible light but produce images with lower resolu-tion. As the size of the crystals or the thickness of the screen decreases, the speed of the screen also declines, but image sharpness increases. Fast screens also have a thicker phosphor layer and a refl ective layer, but these properties also decrease sharpness. In deciding on the combination to use, the practitioner must consider the resolution
FIG. 5-9 The image on the left shows a schematic of two intensifying screens (shades of gray) enclosing a fi lm (white). The detailed view on the right shows x-ray photons entering at the top, traveling through the base, and striking phosphors in the base. The phosphors emit visible light, exposing the fi lm. Some visible light photons may refl ect off the refl ecting layer of the base.
Base
CoatFilm
Coat
Phosphor
Base
Phosphor
FIG. 5-10 Cassette for 8- × 10-inch fi lm. When the cassette is closed, the fi lm is supported in close contact between two intensifying screens.
TABLE 5-2 Rare Earth Elements Used in Intensifying Screens
EMISSION PHOSPHOR
Green Gadolinium oxysulfi de, terbium activated
Blue and UV Yttrium tantalite, niobium activated

58 PART IV ■ IMAGING PRINCIPLES AND TECHNIQUES
requirements of the task for which the image will be used. Most dental extraoral diagnostic tasks can be accomplished with screen-fi lm com-binations that have a speed of 400 or faster.
Protective Coat A protective polymer coat (up to 15 μ m thick) is placed over the phosphor layer to protect the phosphor and to provide a surface that can be cleaned. The intensifying screens should be kept clean because any debris, spots, or scratches may cause light spots on the resultant radiograph.
Image Characteristics
Processing an exposed x-ray fi lm causes it to become dark in the exposed area. The degree and pattern of fi lm darkening depend on numerous factors, including the energy and intensity of the x-ray beam, composition of the subject imaged, fi lm emulsion used, and characteristics of fi lm processing. This section describes the major imaging characteristics of x-ray fi lm.
RADIOGRAPHIC DENSITY
When a fi lm is exposed by an x-ray beam (or by light, in the case of screen-fi lm combinations) and then processed, the silver halide crys-tals in the emulsion that were struck by the photons are converted to grains of metallic silver. These silver grains block the transmission of light from a viewbox and give the fi lm its dark appearance. The overall degree of darkening of an exposed fi lm is referred to as radiographic density . This density can be measured as the optical density of an area of an x-ray fi lm where:
Optical density Log
I
Io
t
= 10
where I o is the intensity of incident light (e.g., from a viewbox) and I t is the intensity of the light transmitted through the fi lm. Thus the
measurement of fi lm density also is a measure of the opacity of the fi lm. With an optical density of 0, 100% of the light is transmitted; with a density of 1, 10% of the light is transmitted; with a density of 2, 1% of the light is transmitted, and so on.
A plot of the relationship between fi lm optical density and expo-sure is called a characteristic curve ( Fig. 5-12 ). It usually is shown as the relationship between the optical density of the fi lm and the loga-rithm of the corresponding exposure. As exposure of the fi lm increases, its optical density increases. A fi lm is of greatest diagnostic value when the structures of interest are imaged on the relatively straight portion of the graph, between 0.6 and 3.0 optical density units. The charac-teristic curves of fi lms reveal much information about fi lm contrast, speed, and latitude.
An unexposed fi lm, when processed, shows some density. This is caused by the inherent density of the base and added tint and the development of unexposed silver halide crystals. This minimal density is called gross fog , or base plus fog. The optical density of gross fog typically is 0.2 to 0.3.
Radiographic density is infl uenced by exposure and the thickness and density of the subject.
Exposure The overall fi lm density depends on the number of photons absorbed by the fi lm emulsion. Increasing the milliamperage (mA), peak kilo-voltage (kVp), or exposure time increases the number of photons reaching the fi lm and thus increases the density of the radiograph. Reducing the distance between the focal spot and fi lm also increases fi lm density.
Subject Thickness The thicker the subject, the more the beam is attenuated and the lighter the resultant image ( Fig. 5-13 ). If exposure factors intended for adults are used on children or edentulous patients, the resultant fi lms are dark because a smaller amount of absorbing tissue is in the path of the x-ray beam. The dentist should vary exposure (either kVp
FIG. 5-11 Relative sensitivity of Kodak T-Mat fi lm (continuous line) and emission lines of a Kodak Lanex and Ektavision screens (gadolinium oxysulfi de, terbium activated). Intensifying screens emit light as a series of relatively narrow line emissions. The maximal emission of the screen at 545 nm corresponds well to a high-sensitivity region of the fi lm. (Data courtesy Carestream Health, Inc., exclusive manufacturer of Kodak dental systems.)
350
100
Rel
ativ
e in
tens
ity
Wavelength (nm)
80
60
40
20
0400 450 500
Emission lines of screens
Absorption spectrum of film
550 600 650
FIG. 5-12 Characteristic curve of direct exposure fi lm. The contrast (slope of the curve) is greater in the high-density region than in the low-density region.
0.0
0.0
0.5 1.0 1.5 2.0 2.5 3.0 3.5
0.5
1.0
1.5
2.0
2.5
3.0
3.5
Log relative exposure
Opt
ical
den
sity

CHAPTER 5 ■ X-RAY FILM, INTENSIFYING SCREENS, AND GRIDS 59
FIG. 5-13 A, Aluminum step wedge. B, Graph of the optical density of a radiograph made by exposing the step wedge. Note that as the thickness of the aluminum decreases, more photons are available to expose the fi lm and the image becomes progressively darker.
16-step aluminum wedge
3.23.02.82.62.42.22.01.81.61.41.21.00.80.60.40.20.0
Rad
iogr
aph
of s
tep
wed
ge
Opt
ical
den
sity
B
A
or time) according to the patient ’ s size to produce radiographs of optimal density.
Subject Density Variations in the density of the subject exert a profound infl uence on the image. The greater the density of a structure within the subject, the greater the attenuation of the x-ray beam directed through that subject or area. In the oral cavity the relative densities of various natural structures, in order of decreasing density, are enamel, dentin and cementum, bone, muscle, fat, and air. Metallic objects (e.g., res-torations) are far denser than enamel and hence better absorbers. Because an x-ray beam is differentially attenuated by these absorbers, the resultant beam carries information that is recorded on the radio-graphic fi lm as light and dark areas. Dense objects (which are strong absorbers) cause the radiographic image to be light and are said to be radiopaque. Objects with low densities are weak absorbers. They allow most photons to pass through, and they cast a dark area on the fi lm that corresponds to the radiolucent object.
RADIOGRAPHIC CONTRAST
Radiographic contrast is a general term that describes the range of densities on a radiograph. It is defi ned as the difference in densities between light and dark regions on a radiograph. Thus an image that shows both light areas and dark areas has high contrast . This also is referred to as a short gray scale of contrast because few shades of gray are present between the black and white images on the fi lm. A radio-graphic image composed only of light gray and dark gray zones has low contrast , also referred to as having a long gray scale of contrast ( Fig. 5-14 ). The radiographic contrast of an image is the result of the inter-play of subject contrast, fi lm contrast, and scattered radiation.
Subject Contrast Subject contrast is the range of characteristics of the subject that infl u-ences radiographic contrast. It is infl uenced largely by the subject ’ s thickness, density, and atomic number. The subject contrast of a patient ’ s head and neck exposed in a lateral cephalometric view is high. The dense regions of the bone and teeth absorb most of the
FIG. 5-14 Radiograph of a dried mandible revealing low contrast (A) and high contrast (B) . A B
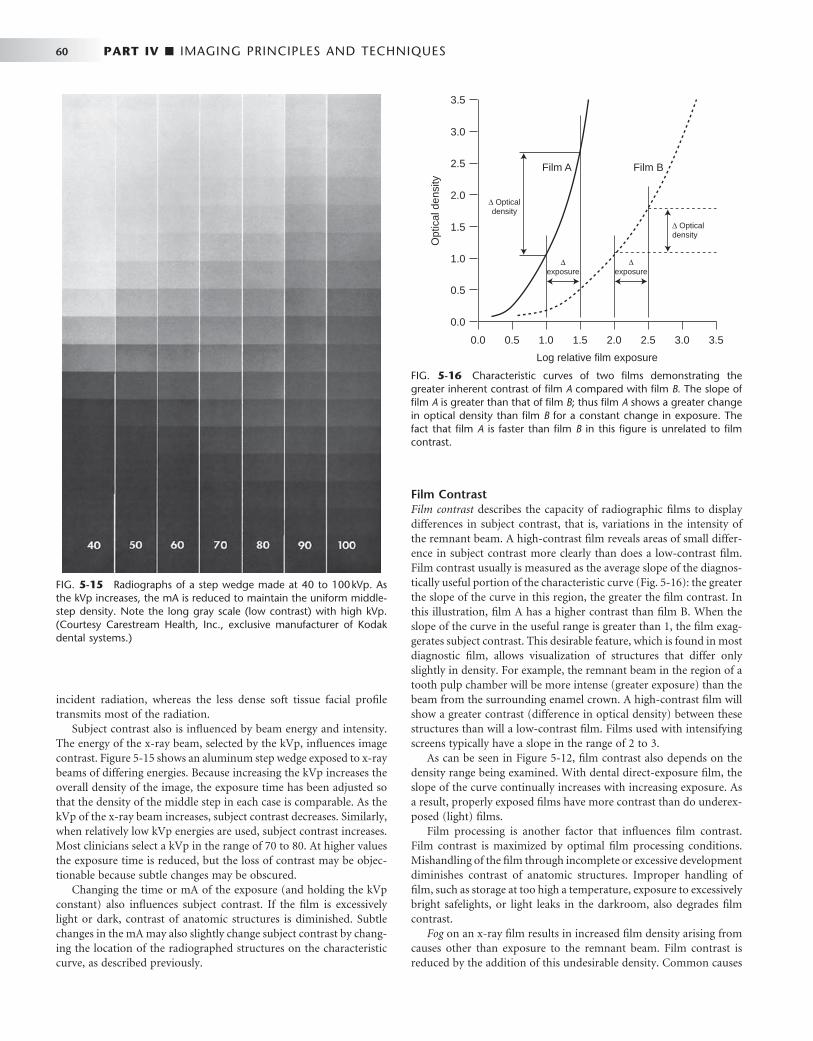
60 PART IV ■ IMAGING PRINCIPLES AND TECHNIQUES
incident radiation, whereas the less dense soft tissue facial profi le transmits most of the radiation.
Subject contrast also is infl uenced by beam energy and intensity. The energy of the x-ray beam, selected by the kVp, infl uences image contrast. Figure 5-15 shows an aluminum step wedge exposed to x-ray beams of differing energies. Because increasing the kVp increases the overall density of the image, the exposure time has been adjusted so that the density of the middle step in each case is comparable. As the kVp of the x-ray beam increases, subject contrast decreases. Similarly, when relatively low kVp energies are used, subject contrast increases. Most clinicians select a kVp in the range of 70 to 80. At higher values the exposure time is reduced, but the loss of contrast may be objec-tionable because subtle changes may be obscured.
Changing the time or mA of the exposure (and holding the kVp constant) also infl uences subject contrast. If the fi lm is excessively light or dark, contrast of anatomic structures is diminished. Subtle changes in the mA may also slightly change subject contrast by chang-ing the location of the radiographed structures on the characteristic curve, as described previously.
Film Contrast Film contrast describes the capacity of radiographic fi lms to display differences in subject contrast, that is, variations in the intensity of the remnant beam. A high-contrast fi lm reveals areas of small differ-ence in subject contrast more clearly than does a low-contrast fi lm. Film contrast usually is measured as the average slope of the diagnos-tically useful portion of the characteristic curve ( Fig. 5-16 ): the greater the slope of the curve in this region, the greater the fi lm contrast. In this illustration, fi lm A has a higher contrast than fi lm B. When the slope of the curve in the useful range is greater than 1, the fi lm exag-gerates subject contrast. This desirable feature, which is found in most diagnostic fi lm, allows visualization of structures that differ only slightly in density. For example, the remnant beam in the region of a tooth pulp chamber will be more intense (greater exposure) than the beam from the surrounding enamel crown. A high-contrast fi lm will show a greater contrast (difference in optical density) between these structures than will a low-contrast fi lm. Films used with intensifying screens typically have a slope in the range of 2 to 3.
As can be seen in Figure 5-12 , fi lm contrast also depends on the density range being examined. With dental direct-exposure fi lm, the slope of the curve continually increases with increasing exposure. As a result, properly exposed fi lms have more contrast than do underex-posed (light) fi lms.
Film processing is another factor that infl uences fi lm contrast. Film contrast is maximized by optimal fi lm processing conditions. Mishandling of the fi lm through incomplete or excessive development diminishes contrast of anatomic structures. Improper handling of fi lm, such as storage at too high a temperature, exposure to excessively bright safelights, or light leaks in the darkroom, also degrades fi lm contrast.
Fog on an x-ray fi lm results in increased fi lm density arising from causes other than exposure to the remnant beam. Film contrast is reduced by the addition of this undesirable density. Common causes
FIG. 5-15 Radiographs of a step wedge made at 40 to 100 kVp. As the kVp increases, the mA is reduced to maintain the uniform middle-step density. Note the long gray scale (low contrast) with high kVp. (Courtesy Carestream Health, Inc., exclusive manufacturer of Kodak dental systems.)
FIG. 5-16 Characteristic curves of two fi lms demonstrating the greater inherent contrast of fi lm A compared with fi lm B. The slope of fi lm A is greater than that of fi lm B ; thus fi lm A shows a greater change in optical density than fi lm B for a constant change in exposure. The fact that fi lm A is faster than fi lm B in this fi gure is unrelated to fi lm contrast.
Log relative film exposure
0.0
0.0
Opt
ical
den
sity
0.5 1.0 1.5 2.0 2.5 3.53.0
0.5
1.0
1.5
2.0
2.5 Film A Film B
Δ Opticaldensity
Δ Opticaldensity
Δexposure
3.0
3.5
Δexposure

CHAPTER 5 ■ X-RAY FILM, INTENSIFYING SCREENS, AND GRIDS 61
of fi lm fog are improper safelighting, storage of fi lm at too high a temperature, and development of fi lm at an excessive temperature or for a prolonged period. Film fog can be reduced by proper fi lm pro-cessing and storage.
Scattered Radiation Scattered radiation results from photons that have interacted with the subject by Compton or coherent interactions. These interactions cause the emission of photons that travel in directions other than that of the primary beam. The consequent scattered radiation causes fogging of a radiograph, an overall darkening of the image that results in loss of radiographic contrast. In most dental applications the best means of reducing scattered radiation are to (1) use a relatively low kVp, (2) collimate the beam to the size of the fi lm to prevent scatter from an area outside the region of the image, and (3) use grids in extraoral radiography.
RADIOGRAPHIC SPEED
Radiographic speed refers to the amount of radiation required to produce an image of a standard density. Film speed frequently is expressed as the reciprocal of the exposure (in Roentgens) required to produce an optical density of 1 above gross fog. A fast fi lm requires a relatively low exposure to produce a density of 1, whereas a slower fi lm requires a longer exposure for the processed fi lm to have the same density. Film speed is controlled largely by the size of the silver halide grains and their silver content.
The speed of dental intraoral x-ray fi lm is indicated by a letter designating a particular group ( Table 5-3 ). The fastest dental fi lm currently available has a speed rating of F. Only fi lms with a D or faster speed rating are appropriate for intraoral radiography. Currently the types of fi lm used most often in the United States are Kodak Ultra-Speed (group D) and Kodak InSight (group E or F, depending on processing conditions). InSight fi lm is preferred because it requires only about half the exposure of Ultra-Speed fi lm and offers compa-rable contrast and resolution. F-speed fi lm is faster than the D-speed fi lm because tabular crystal grains are used in the emulsion of F-speed fi lm. The characteristic curves in Figure 5-17 show that InSight fi lm (curve on the left) is faster than Ultra-Speed fi lm (curve on the right) because less exposure is required to produce the same level of density although the two fi lms have similar contrast.
Although fi lm speed can be increased slightly by processing the fi lm at a higher temperature, this is achieved at the expense of increased
fi lm fog and graininess. Processing in depleted solutions can lower the effective speed. It is always preferable to use fresh processing solutions and follow the recommended processing time and temperature.
FILM LATITUDE
Film latitude is a measure of the range of exposures that can be recorded as distinguishable densities on a fi lm. A fi lm optimized to display a wide latitude can record a subject with a wide range of subject contrast. A fi lm with a characteristic curve that has a long straight-line portion and a shallow slope has a wide latitude ( Fig. 5-18 ). As a consequence, wide variations in the amount of radiation
TABLE 5-3 Intraoral Film Speed Classifi cation
FILM SPEED GROUP SPEED RANGE (RECIPROCAL ROENTGENS * )
C 6-12
D 12-24
E 24-48
F 48-96
* Reciprocal Roentgens are the reciprocal of the exposure in Roentgens required to obtain a fi lm with an optical density of 1.0 above base plus fog after processing.
FIG. 5-17 Characteristic curves for InSight and Ultra-Speed fi lm. InSight fi lm is faster and has essentially the same contrast as Ultra-Speed fi lm. (Courtesy Carestream Health, Inc., exclusive manufacturer of Kodak dental systems.)
Log relative film exposure
InSight
Ultra-Speed
0.0
0.0
Opt
ical
den
sity
0.5 1.0 1.5 2.0 2.5 3.53.0
0.5
1.0
1.5
2.0
2.5
3.0
3.5
FIG. 5-18 Characteristic curves for two fi lms demonstrating greater inherent latitude of fi lm B compared with fi lm A . The slope of fi lm B is less steep than that of fi lm A ; therefore fi lm B records a greater range of exposures within the useful density range than does fi lm A .
Log relative film exposure
0.0
0.0
Opt
ical
den
sity
0.5 1.0 1.5 2.0 2.5 3.53.0
0.5
1.0
1.5
2.0
2.5
3.0
3.5
Film A Film B
Latitude A
Latitude B
Usefuldensityrange
From National Council on Radiation Protection and Measurements, Report No. 145, Appendix E, 2004.

62 PART IV ■ IMAGING PRINCIPLES AND TECHNIQUES
exiting the subject can be recorded. Films with a wide latitude have lower contrast (i.e., a long gray scale) than do fi lms with a narrow latitude. Wide-latitude fi lms are useful when both the osseous struc-tures of the skull and the soft tissues of the facial region must be recorded.
To some extent the operator can modify the latitude of an image. A high kVp produces images with a wide latitude and low contrast. Reduced exposure produces a somewhat lighter image and shows a slightly wider range of anatomic structures with lower contrast. Wide-latitude fi lm is recommended for imaging structures with a wide range of subject densities.
RADIOGRAPHIC NOISE
Radiographic noise is the appearance of uneven density of a uniformly exposed radiographic fi lm. It is seen on a small area of fi lm as localized variations in density. The primary causes of noise are radiographic mottle and radiographic artifact. Radiographic mottle is uneven density resulting from the physical structure of the fi lm or intensifying screens. Radiographic artifacts are defects caused by errors in fi lm handling, such as fi ngerprints or bends in the fi lm, or errors in fi lm processing, such as splashing developer or fi xer on a fi lm or marks or scratches from rough handling.
On intraoral dental fi lm, mottle may be seen as fi lm graininess , which is caused by the visibility of silver grains in the fi lm emulsion, especially when magnifi cation is used to examine an image. Film graininess is most evident when high-temperature processing is used.
Radiographic mottle is also evident when the fi lm is used with fast intensifying screens. Two important causes of the phenomenon are quantum mottle and screen structure mottle . Quantum mottle is caused by a fl uctuation in the number of photons per unit of the beam cross-sectional area absorbed by the intensifying screen. Quantum mottle is most evident when fast fi lm-screen combinations are used. Under these conditions the relative nonuniformity of the beam is highest. The longer exposures required by slower fi lm-screen combi-nations tend to average out the beam pattern and thereby reduce quantum mottle. Screen structure mottle is graininess caused by screen phosphors. It is most evident when fast screens with large crystals are used.
RADIOGRAPHIC BLURRING
Sharpness is the ability of a radiograph to defi ne an edge precisely (e.g., the dentin-enamel junction, a thin trabecular plate). Resolution , or resolving power, is the ability of a radiograph to record separate struc-tures that are close together. It usually is measured by radiographing an object made up of a series of thin lead strips with alternating radiolucent spaces of the same thickness. The groups of lines and spaces are arranged in the test target in order of increasing numbers of lines and spaces per millimeter ( Fig. 5-19 ). The resolving power is measured as the highest number of line pairs (a line pair being the image of an absorber and the adjacent lucent space) per millimeter that can be distinguished on the resultant radiograph when examined with low-power magnifi cation. Typically, panoramic fi lm-screen com-binations can resolve about fi ve line pairs per millimeter; periapical fi lm, which has better resolving power, can delineate clearly more than 20 line pairs per millimeter.
Radiographic blur is caused by image receptor (fi lm and screen) blurring, motion blurring, and geometric blurring.
FIG. 5-19 Radiograph of a resolving power target consisting of groups of radiopaque lines and radiolucent spaces. Numbers at each group indicate the line pairs per millimeter represented by the group.
Image Receptor Blurring With intraoral dental x-ray fi lm, the size and number of the silver grains in the fi lm emulsion determines image sharpness: the fi ner the grain size, the fi ner the sharpness. In general, slow-speed fi lms have fi ne grains and faster fi lms have larger grains.
Use of intensifying screens in extraoral radiography has an adverse effect on image sharpness. Some degree of sharpness is lost because visible light and UV radiation emitted by the screen spread out beyond the point of origin and expose a fi lm area larger than the phosphor crystal (see Fig. 5-9 ). The spreading light causes a blurring of fi ne detail on the radiograph. Intensifying screens with large crystals are relatively fast, but image sharpness is diminished. Furthermore, fast intensifying screens have a relatively thick phosphor layer, which con-tributes to dispersion of light and loss of image sharpness. Diffusion of light from a screen can be minimized and image sharpness maxi-mized by ensuring as close a contact as possible between the intensify-ing screen and the fi lm.
The presence of an image on each side of a double-emulsion fi lm also causes a loss of image sharpness through parallax ( Fig. 5-20 ). Parallax results from the apparent change in position or size of a subject when it is viewed from different perspectives. Because dental fi lm has a double coating of emulsion and the x-ray beam is diver-gent, the images recorded on each emulsion vary slightly in size. In intraoral images, the effect of parallax on image sharpness is unim-portant but is most apparent when wet fi lms are viewed. Under these conditions the emulsion is swollen with water and the loss of image sharpness caused by parallax is more evident. When intensifying screens are used, parallax distortion contributes to image unsharp-ness because light from one screen may cross the fi lm base and reach the emulsion on the opposite side. This problem can be solved by
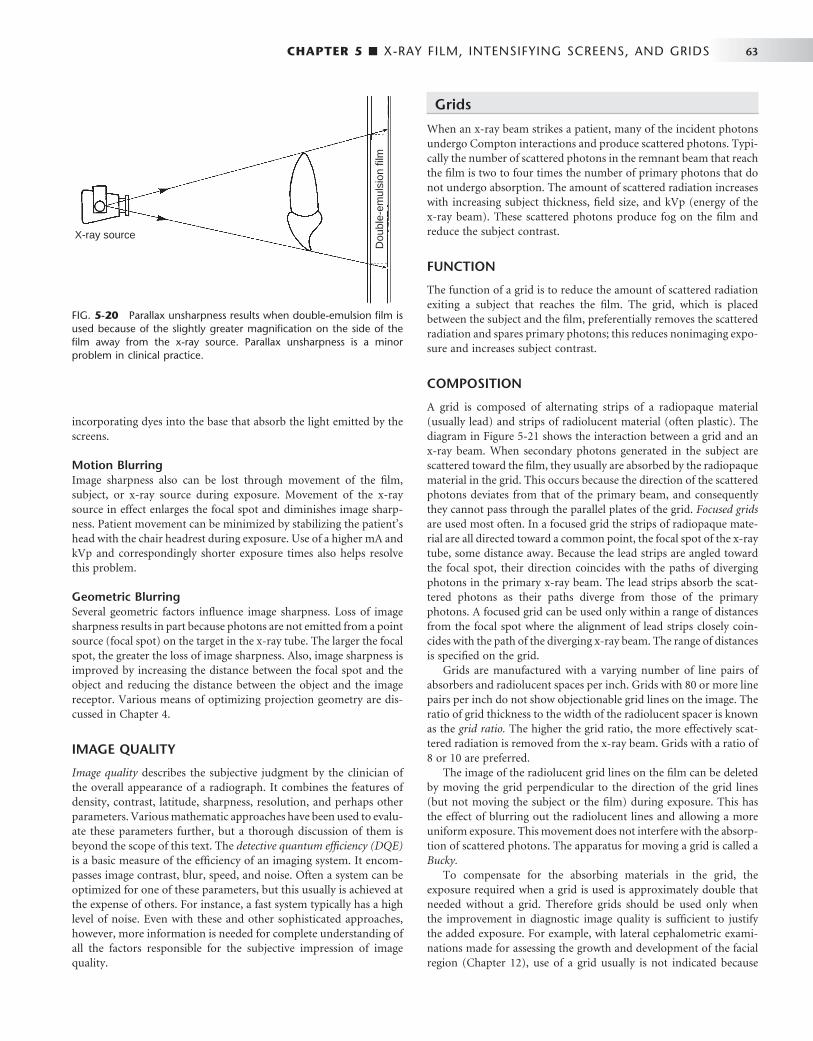
CHAPTER 5 ■ X-RAY FILM, INTENSIFYING SCREENS, AND GRIDS 63
incorporating dyes into the base that absorb the light emitted by the screens.
Motion Blurring Image sharpness also can be lost through movement of the fi lm, subject, or x-ray source during exposure. Movement of the x-ray source in effect enlarges the focal spot and diminishes image sharp-ness. Patient movement can be minimized by stabilizing the patient ’ s head with the chair headrest during exposure. Use of a higher mA and kVp and correspondingly shorter exposure times also helps resolve this problem.
Geometric Blurring Several geometric factors infl uence image sharpness. Loss of image sharpness results in part because photons are not emitted from a point source (focal spot) on the target in the x-ray tube. The larger the focal spot, the greater the loss of image sharpness. Also, image sharpness is improved by increasing the distance between the focal spot and the object and reducing the distance between the object and the image receptor. Various means of optimizing projection geometry are dis-cussed in Chapter 4 .
IMAGE QUALITY
Image quality describes the subjective judgment by the clinician of the overall appearance of a radiograph. It combines the features of density, contrast, latitude, sharpness, resolution, and perhaps other parameters. Various mathematic approaches have been used to evalu-ate these parameters further, but a thorough discussion of them is beyond the scope of this text. The detective quantum effi ciency (DQE) is a basic measure of the effi ciency of an imaging system. It encom-passes image contrast, blur, speed, and noise. Often a system can be optimized for one of these parameters, but this usually is achieved at the expense of others. For instance, a fast system typically has a high level of noise. Even with these and other sophisticated approaches, however, more information is needed for complete understanding of all the factors responsible for the subjective impression of image quality.
Grids
When an x-ray beam strikes a patient, many of the incident photons undergo Compton interactions and produce scattered photons. Typi-cally the number of scattered photons in the remnant beam that reach the fi lm is two to four times the number of primary photons that do not undergo absorption. The amount of scattered radiation increases with increasing subject thickness, fi eld size, and kVp (energy of the x-ray beam). These scattered photons produce fog on the fi lm and reduce the subject contrast.
FUNCTION
The function of a grid is to reduce the amount of scattered radiation exiting a subject that reaches the fi lm. The grid, which is placed between the subject and the fi lm, preferentially removes the scattered radiation and spares primary photons; this reduces nonimaging expo-sure and increases subject contrast.
COMPOSITION
A grid is composed of alternating strips of a radiopaque material (usually lead) and strips of radiolucent material (often plastic). The diagram in Figure 5-21 shows the interaction between a grid and an x-ray beam. When secondary photons generated in the subject are scattered toward the fi lm, they usually are absorbed by the radiopaque material in the grid. This occurs because the direction of the scattered photons deviates from that of the primary beam, and consequently they cannot pass through the parallel plates of the grid. Focused grids are used most often. In a focused grid the strips of radiopaque mate-rial are all directed toward a common point, the focal spot of the x-ray tube, some distance away. Because the lead strips are angled toward the focal spot, their direction coincides with the paths of diverging photons in the primary x-ray beam. The lead strips absorb the scat-tered photons as their paths diverge from those of the primary photons. A focused grid can be used only within a range of distances from the focal spot where the alignment of lead strips closely coin-cides with the path of the diverging x-ray beam. The range of distances is specifi ed on the grid.
Grids are manufactured with a varying number of line pairs of absorbers and radiolucent spaces per inch. Grids with 80 or more line pairs per inch do not show objectionable grid lines on the image. The ratio of grid thickness to the width of the radiolucent spacer is known as the grid ratio. The higher the grid ratio, the more effectively scat-tered radiation is removed from the x-ray beam. Grids with a ratio of 8 or 10 are preferred.
The image of the radiolucent grid lines on the fi lm can be deleted by moving the grid perpendicular to the direction of the grid lines (but not moving the subject or the fi lm) during exposure. This has the effect of blurring out the radiolucent lines and allowing a more uniform exposure. This movement does not interfere with the absorp-tion of scattered photons. The apparatus for moving a grid is called a Bucky.
To compensate for the absorbing materials in the grid, the exposure required when a grid is used is approximately double that needed without a grid. Therefore grids should be used only when the improvement in diagnostic image quality is suffi cient to justify the added exposure. For example, with lateral cephalometric exami-nations made for assessing the growth and development of the facial region ( Chapter 12 ), use of a grid usually is not indicated because
FIG. 5-20 Parallax unsharpness results when double-emulsion fi lm is used because of the slightly greater magnifi cation on the side of the fi lm away from the x-ray source. Parallax unsharpness is a minor problem in clinical practice.
X-ray source
Dou
ble-
emul
sion
film
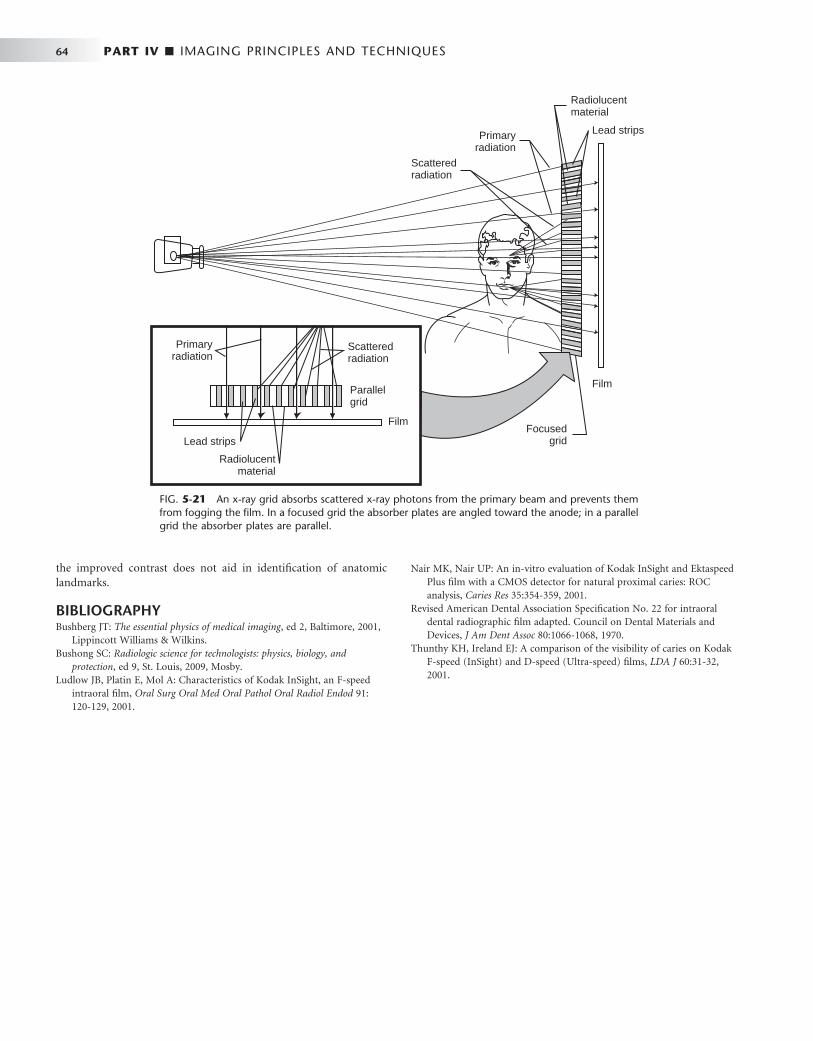
64 PART IV ■ IMAGING PRINCIPLES AND TECHNIQUES
the improved contrast does not aid in identifi cation of anatomic landmarks.
BIBLIOGRAPHY 1 Bushberg JT : The essential physics of medical imaging , ed 2 , Baltimore , 2001 ,
Lippincott Williams & Wilkins . 2 Bushong SC : Radiologic science for technologists: physics, biology, and
protection , ed 9 , St. Louis , 2009 , Mosby . 3 Ludlow JB , Platin E , Mol A : Characteristics of Kodak InSight, an F-speed
intraoral fi lm , Oral Surg Oral Med Oral Pathol Oral Radiol Endod 91 : 120 - 129 , 2001 .
4 Nair MK , Nair UP : An in-vitro evaluation of Kodak InSight and Ektaspeed Plus fi lm with a CMOS detector for natural proximal caries: ROC analysis , Caries Res 35 : 354 - 359 , 2001 .
5 Revised American Dental Association Specifi cation No. 22 for intraoral dental radiographic fi lm adapted. Council on Dental Materials and Devices , J Am Dent Assoc 80 : 1066 - 1068 , 1970 .
6 Thunthy KH , Ireland EJ : A comparison of the visibility of caries on Kodak F-speed (InSight) and D-speed (Ultra-speed) fi lms , LDA J 60 : 31 - 32 , 2001 .
FIG. 5-21 An x-ray grid absorbs scattered x-ray photons from the primary beam and prevents them from fogging the fi lm. In a focused grid the absorber plates are angled toward the anode; in a parallel grid the absorber plates are parallel.
Primaryradiation
Primaryradiation
Scatteredradiation
Scatteredradiation
Focusedgrid
Parallelgrid
Film
Film
Lead strips
Lead strips
Radiolucentmaterial
Radiolucentmaterial
C H A P T E R 6
Processing X-Ray Film
The recording medium (image receptor) most frequently used in dental radiography is radiographic fi lm. Making excellent fi lm radiographs will improve patient diagnoses and overall
care. Making excellent radiographs requires using the proper fi lm exposure times and optimizing fi lm processing. This chapter describes these processes starting with the formation of the latent image, fol-lowed by conversion of the latent image into a visible image (fi lm processing), and closing with how to establish the proper exposure time.
Formation of the Latent Image
When a beam of photons exits an object and exposes an x-ray fi lm, it chemically changes the photosensitive silver halide crystals in the fi lm emulsion. These chemically altered silver bromide crystals constitute the latent (invisible) image on the fi lm. Before exposure, fi lm emulsion consists of photosensitive crystals containing primarily silver bromide suspended in a vehicle and layered on a thin sheet of transparent plastic base. Some crystals also contain small amounts of silver iodide. These silver halide crystals also contain a few free silver ions (intersti-tial silver ions) in the spaces between the crystalline lattice atoms ( Fig. 6-1, A ). The crystals are chemically sensitized by the addition of trace amounts of sulfur compounds, which bind to the surface of the crys-tals. The sulfur compounds play a crucial role in image formation. Along with physical irregularities in the crystal produced by iodide ions, sulfur compounds create sensitivity sites , the sites in the crystals that are sensitive to radiation. Each crystal has many sensitivity sites, which begin the process of image formation by trapping the electrons generated when the emulsion is irradiated. Exposure to radiation chemically alters the photosensitive silver halide crystals to produce the latent image. Processing the exposed fi lm in developer and fi xer converts the latent image into the visible radiographic image.
When the silver halide crystals are irradiated, x-ray photons inter-act primarily with the bromide ions by Compton and photoelectric interactions ( Fig. 6-1, B ). These interactions result in the removal of an electron from the bromide ions. By the loss of an electron, a bromide ion is converted into a neutral bromine atom. The free elec-trons move through the crystal until they reach a sensitivity site, where they become trapped and impart a negative charge to the site. The negatively charged sensitivity site then attracts positively charged free interstitial silver ions ( Fig. 6-1, C ). When a silver ion reaches the nega-tively charged sensitivity site, it is reduced and forms a neutral atom of metallic silver ( Fig. 6-1, D ). The sites containing these neutral silver atoms are now called latent image sites . This process occurs numerous times within a crystal. The overall distribution of latent image sites in a fi lm after exposure constitutes the latent image.
Film processing converts the latent image into one that can be visualized ( Fig. 6-2 ). The neutral silver atoms at each latent image site
( Fig. 6-2, B ) render the crystals sensitive to development and image formation. The larger the aggregate of neutral silver atoms, the more sensitive the crystal is to the effects of the developer. Most latent image sites that are capable of being developed in an optimally exposed fi lm have at least four or fi ve silver atoms. Developer converts silver bromide crystals with neutral silver atoms deposited at the latent image sites into black, solid silver metallic grains ( Fig. 6-2, C ). These solid silver grains block light from a viewbox. Fixer removes unex-posed, undeveloped silver bromide crystals (those without latent image sites), leaving the fi lm clear in unexposed areas ( Fig. 6-2, D ). Thus the radiographic image is composed of the light (radiopaque) areas, where few photons reached the fi lm, and dark (radiolucent) areas of the fi lm that were struck by many photons.
Processing Solutions
Film processing involves the following procedures: 1. Immerse exposed fi lm in developer. 2. Rinse fi lm in water bath. 3. Immerse fi lm in fi xer. 4. Wash fi lm in water bath. 5. Dry fi lm and mount for viewing. This chapter fi rst describes the function of developer and fi xer.
Procedures for each of these steps are described later.
DEVELOPING SOLUTION
The developer reduces all silver ions in the exposed crystals of silver halide (those with a latent image) to metallic silver grains (see Fig. 6-2 ). To produce a diagnostic image, this reduction process must be restricted to crystals containing latent image sites. To accomplish this, the reducing agents used as developers are catalyzed by the neutral silver atoms at the latent image sites (see Fig. 6-2, B ). The silver atoms act as a bridge by which electrons from the reducing agents reach silver ions in the crystal and convert them to solid grains of metallic silver. Individual crystals are developed completely or not at all during the recommended developing times (see Fig. 6-2, C ). Variations in density on the processed radiographs are the result of different ratios of developed (exposed) and undeveloped (unexposed) crystals. Areas with many exposed crystals are denser because of their higher con-centration of black metallic silver grains after development. If the developer remains too long in contact with silver bromide halide crystals that do not contain a latent image, it slowly reduces these crystals also, thereby overdeveloping the image.
When an exposed fi lm is developed, the developer initially has no visible effect ( Fig. 6-3 ). After this initial phase, the density increases, very rapidly at fi rst and then more slowly. Eventually all the exposed crystals develop (become reduced to black metallic silver), and the
65
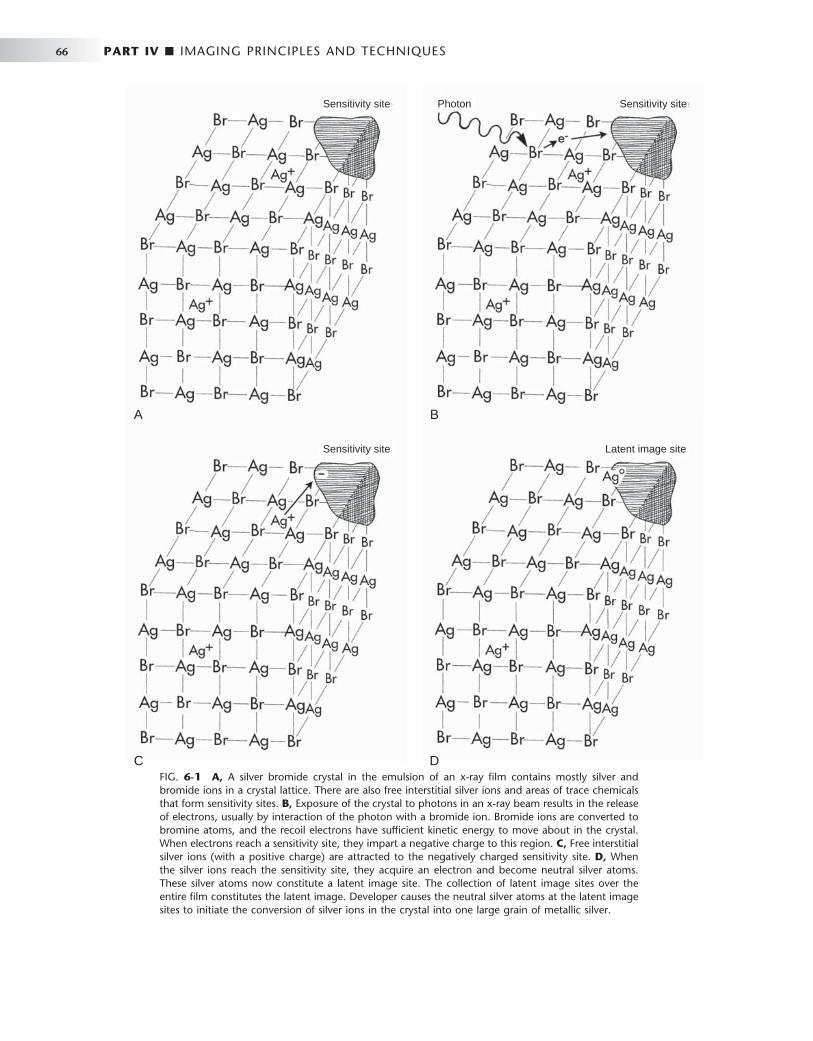
66 PART IV ■ IMAGING PRINCIPLES AND TECHNIQUES
FIG. 6-1 A, A silver bromide crystal in the emulsion of an x-ray fi lm contains mostly silver and bromide ions in a crystal lattice. There are also free interstitial silver ions and areas of trace chemicals that form sensitivity sites. B, Exposure of the crystal to photons in an x-ray beam results in the release of electrons, usually by interaction of the photon with a bromide ion. Bromide ions are converted to bromine atoms, and the recoil electrons have suffi cient kinetic energy to move about in the crystal. When electrons reach a sensitivity site, they impart a negative charge to this region. C, Free interstitial silver ions (with a positive charge) are attracted to the negatively charged sensitivity site. D, When the silver ions reach the sensitivity site, they acquire an electron and become neutral silver atoms. These silver atoms now constitute a latent image site. The collection of latent image sites over the entire fi lm constitutes the latent image. Developer causes the neutral silver atoms at the latent image sites to initiate the conversion of silver ions in the crystal into one large grain of metallic silver.
C D
A B
Photon Sensitivity siteSensitivity site
Sensitivity site Latent image site
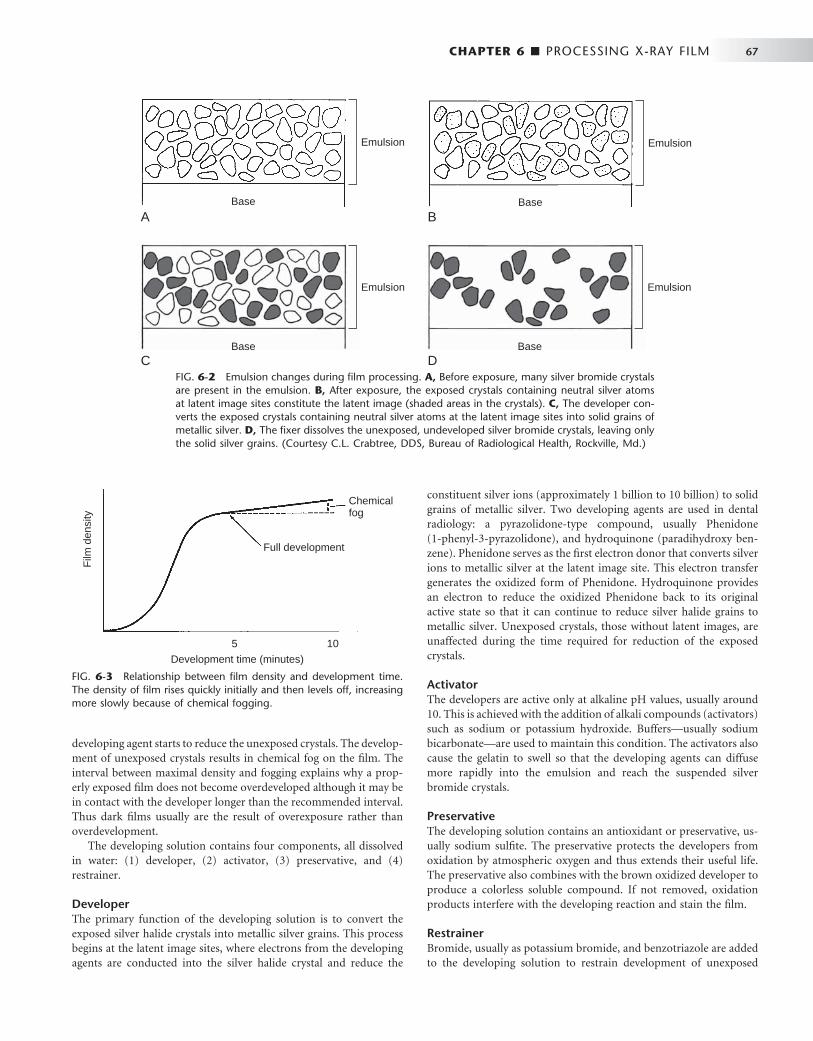
CHAPTER 6 ■ PROCESSING X-RAY FILM 67
developing agent starts to reduce the unexposed crystals. The develop-ment of unexposed crystals results in chemical fog on the fi lm. The interval between maximal density and fogging explains why a prop-erly exposed fi lm does not become overdeveloped although it may be in contact with the developer longer than the recommended interval. Thus dark fi lms usually are the result of overexposure rather than overdevelopment.
The developing solution contains four components, all dissolved in water: (1) developer, (2) activator, (3) preservative, and (4) restrainer.
Developer The primary function of the developing solution is to convert the exposed silver halide crystals into metallic silver grains. This process begins at the latent image sites, where electrons from the developing agents are conducted into the silver halide crystal and reduce the
constituent silver ions (approximately 1 billion to 10 billion) to solid grains of metallic silver. Two developing agents are used in dental radiology: a pyrazolidone-type compound, usually Phenidone (1-phenyl-3-pyrazolidone), and hydroquinone (paradihydroxy ben-zene). Phenidone serves as the fi rst electron donor that converts silver ions to metallic silver at the latent image site. This electron transfer generates the oxidized form of Phenidone. Hydroquinone provides an electron to reduce the oxidized Phenidone back to its original active state so that it can continue to reduce silver halide grains to metallic silver. Unexposed crystals, those without latent images, are unaffected during the time required for reduction of the exposed crystals.
Activator The developers are active only at alkaline pH values, usually around 10. This is achieved with the addition of alkali compounds (activators) such as sodium or potassium hydroxide. Buffers — usually sodium bicarbonate — are used to maintain this condition. The activators also cause the gelatin to swell so that the developing agents can diffuse more rapidly into the emulsion and reach the suspended silver bromide crystals.
Preservative The developing solution contains an antioxidant or preservative, us -ually sodium sulfi te. The preservative protects the developers from oxidation by atmospheric oxygen and thus extends their useful life. The preservative also combines with the brown oxidized developer to produce a colorless soluble compound. If not removed, oxidation products interfere with the developing reaction and stain the fi lm.
Restrainer Bromide, usually as potassium bromide, and benzotriazole are added to the developing solution to restrain development of unexposed
FIG. 6-2 Emulsion changes during fi lm processing. A, Before exposure, many silver bromide crystals are present in the emulsion. B, After exposure, the exposed crystals containing neutral silver atoms at latent image sites constitute the latent image (shaded areas in the crystals). C, The developer con-verts the exposed crystals containing neutral silver atoms at the latent image sites into solid grains of metallic silver. D, The fi xer dissolves the unexposed, undeveloped silver bromide crystals, leaving only the solid silver grains. (Courtesy C.L. Crabtree, DDS, Bureau of Radiological Health, Rockville, Md.)
Emulsion
Base
Emulsion
Base
Emulsion
Base
Emulsion
Base
A B
C D
FIG. 6-3 Relationship between fi lm density and development time. The density of fi lm rises quickly initially and then levels off, increasing more slowly because of chemical fogging.
Film
den
sity
Development time (minutes)
Full development
Chemicalfog
5 10

68 PART IV ■ IMAGING PRINCIPLES AND TECHNIQUES
silver halide crystals. Although bromide and benzotriazole depress the reduction of both exposed and unexposed crystals, they are much more effective in depressing the reduction of unexposed crystals. Con-sequently, the restrainers act as antifog agents and increase contrast.
DEVELOPER REPLENISHER
In the normal course of fi lm processing, Phenidone and hydroqui-none are consumed, and bromide ions and other byproducts are released into solution. Developer also becomes inactivated by expo-sure to oxygen. These actions produce a “ seasoned ” solution, and the fi lm speed and contrast stabilize. The developing solution of both manual and automatic developers should be replenished with fresh solution each morning to prolong the life of the seasoned developer. The recommended amount to be added daily is 8 ounces of fresh developer (replenisher) per gallon of developing solution. This assumes the development of an average of 30 periapical or 5 pan-oramic fi lms per day. Some of the used solution may need to be removed to make room for the replenisher.
RINSING
After development the fi lm emulsion swells and becomes saturated with developer. At this point the fi lms are rinsed in water for 30 seconds with continuous, gentle agitation before they are placed in the fi xer. Rinsing dilutes the developer, slowing the development process. It also removes the alkali activator, preventing neutralization of the acid fi xer. This rinsing process is typical for manual processing but is not used with automatic processing.
FIXING SOLUTION
The primary function of fi xing solution is to dissolve and remove the undeveloped silver halide crystals from the emulsion (see Fig. 6-2, D ). The presence of unexposed crystals causes fi lm to be opaque. If these crystals are not removed, the image on the resultant radiograph is dark and nondiagnostic. Figure 6-4 is a photomicrograph of fi lm emulsion showing the solid silver grains after fi xer has removed the
unexposed silver bromide crystals. (Compare it with Fig. 45-2, A , which shows the unprocessed emulsion.) A second function of fi xing solution is to harden and shrink the fi lm emulsion. As with developer, fi xer should be replenished daily at the rate of 8 ounces per gallon.
Fixing solution also contains four components, all dissolved in water: (1) clearing agent, (2) acidifi er, (3) preservative, and (4) hardener.
Clearing Agent After development the fi lm emulsion must be cleared by dissolving and removing the unexposed silver halide. An aqueous solution of ammonium thiosulfate ( “ hypo ” ) dissolves the silver halide grains. It forms stable, water-soluble complexes with silver ions, which then diffuse from the emulsion. The clearing agent does not have a rapid effect on the metallic silver grains in the fi lm emulsion, but excessive fi xation results in a gradual loss of fi lm density because the grains of silver slowly dissolve in the acetic acid of the fi xing solution.
Acidifi er The fi xing solution contains an acetic acid buffer system (pH 4 to 4.5) to keep the fi xer pH constant. The acidic pH is required to promote good diffusion of thiosulfate into the emulsion and of silver thiosul-fate complex out of the emulsion. The acid-fi xing solution also inac-tivates any carryover developing agents in the fi lm emulsion, blocking continued development of any unexposed crystals while the fi lm is in the fi xing tank.
Preservative Ammonium sulfi te is the preservative in the fi xing solution, as it is in the developer. It prevents oxidation of the thiosulfate clearing agent, which is unstable in the acid environment of the fi xing solution. It also binds with any colored oxidized developer carried over into the fi xing solution and effectively removes it from the solution, which prevents oxidized developer from staining the fi lm.
Hardener The hardening agent most often used is aluminum sulfate. Aluminum complexes with the gelatin during fi xing and prevents damage to the gelatin during subsequent handling. The hardeners also reduce swell-ing of the emulsion during the fi nal wash. This lessens mechanical damage to the emulsion and limits water absorption, thus shortening drying time.
WASHING
After fi xing, the processed fi lm is washed in a suffi cient fl ow of water for an adequate time to ensure removal of all thiosulfate ions and silver thiosulfate complexes. Washing effi ciency declines rapidly when the water temperature falls below 60 ° F. Any silver compound or thiosulfate that remains because of improper washing discolors and causes stains, which are most apparent in the radiopaque (light) areas. This discoloration results from the thiosulfate reacting with silver to form brown silver sulfi de, which can obscure diagnostic information.
Darkroom Equipment
The darkroom should be convenient to the x-ray machines and dental operatories and should be at least 4 × 5 feet (1.2 × 1.5 m) ( Fig. 6-5 ). It must be well operated to ensure excellent radiographs.
FIG. 6-4 Scanning electron micrograph of a processed emulsion of Kodak Ultra-Speed dental x-ray fi lm (5000 × ). Note the white-appearing solid silver grains above the base. (Courtesy Carestream Health, Inc., exclusive manufacturer of Kodak dental systems.)
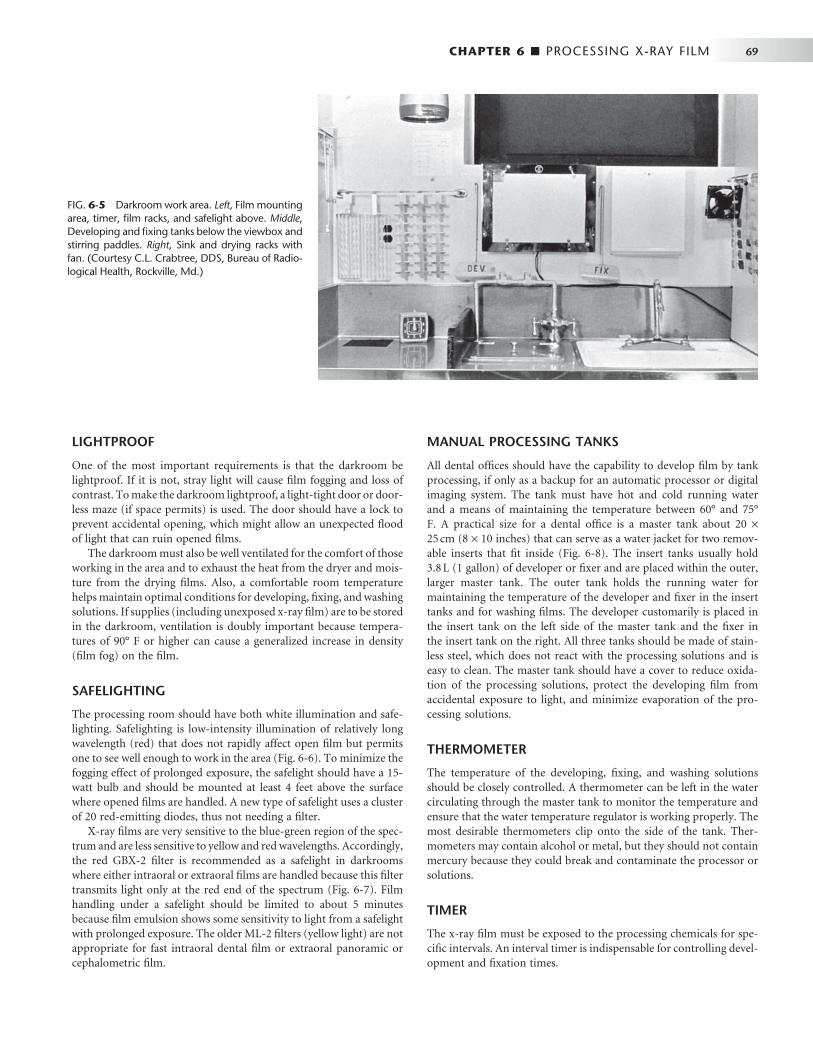
CHAPTER 6 ■ PROCESSING X-RAY FILM 69
LIGHTPROOF
One of the most important requirements is that the darkroom be lightproof. If it is not, stray light will cause fi lm fogging and loss of contrast. To make the darkroom lightproof, a light-tight door or door-less maze (if space permits) is used. The door should have a lock to prevent accidental opening, which might allow an unexpected fl ood of light that can ruin opened fi lms.
The darkroom must also be well ventilated for the comfort of those working in the area and to exhaust the heat from the dryer and mois-ture from the drying fi lms. Also, a comfortable room temperature helps maintain optimal conditions for developing, fi xing, and washing solutions. If supplies (including unexposed x-ray fi lm) are to be stored in the darkroom, ventilation is doubly important because tempera-tures of 90 ° F or higher can cause a generalized increase in density (fi lm fog) on the fi lm.
SAFELIGHTING
The processing room should have both white illumination and safe-lighting. Safelighting is low-intensity illumination of relatively long wavelength (red) that does not rapidly affect open fi lm but permits one to see well enough to work in the area ( Fig. 6-6 ). To minimize the fogging effect of prolonged exposure, the safelight should have a 15-watt bulb and should be mounted at least 4 feet above the surface where opened fi lms are handled. A new type of safelight uses a cluster of 20 red-emitting diodes, thus not needing a fi lter.
X-ray fi lms are very sensitive to the blue-green region of the spec-trum and are less sensitive to yellow and red wavelengths. Accordingly, the red GBX-2 fi lter is recommended as a safelight in darkrooms where either intraoral or extraoral fi lms are handled because this fi lter transmits light only at the red end of the spectrum ( Fig. 6-7 ). Film handling under a safelight should be limited to about 5 minutes because fi lm emulsion shows some sensitivity to light from a safelight with prolonged exposure. The older ML-2 fi lters (yellow light) are not appropriate for fast intraoral dental fi lm or extraoral panoramic or cephalometric fi lm.
MANUAL PROCESSING TANKS
All dental offi ces should have the capability to develop fi lm by tank processing, if only as a backup for an automatic processor or digital imaging system. The tank must have hot and cold running water and a means of maintaining the temperature between 60 ° and 75 ° F. A practical size for a dental offi ce is a master tank about 20 × 25 cm (8 × 10 inches) that can serve as a water jacket for two remov-able inserts that fi t inside ( Fig. 6-8 ). The insert tanks usually hold 3.8 L (1 gallon) of developer or fi xer and are placed within the outer, larger master tank. The outer tank holds the running water for maintaining the temperature of the developer and fi xer in the insert tanks and for washing fi lms. The developer customarily is placed in the insert tank on the left side of the master tank and the fi xer in the insert tank on the right. All three tanks should be made of stain-less steel, which does not react with the processing solutions and is easy to clean. The master tank should have a cover to reduce oxida-tion of the processing solutions, protect the developing fi lm from accidental exposure to light, and minimize evaporation of the pro-cessing solutions.
THERMOMETER
The temperature of the developing, fi xing, and washing solutions should be closely controlled. A thermometer can be left in the water circulating through the master tank to monitor the temperature and ensure that the water temperature regulator is working properly. The most desirable thermometers clip onto the side of the tank. Ther-mometers may contain alcohol or metal, but they should not contain mercury because they could break and contaminate the processor or solutions.
TIMER
The x-ray fi lm must be exposed to the processing chemicals for spe-cifi c intervals. An interval timer is indispensable for controlling devel-opment and fi xation times.
FIG. 6-5 Darkroom work area. Left , Film mounting area, timer, fi lm racks, and safelight above. Middle , Developing and fi xing tanks below the viewbox and stirring paddles. Right , Sink and drying racks with fan. (Courtesy C.L. Crabtree, DDS, Bureau of Radio-logical Health, Rockville, Md.)
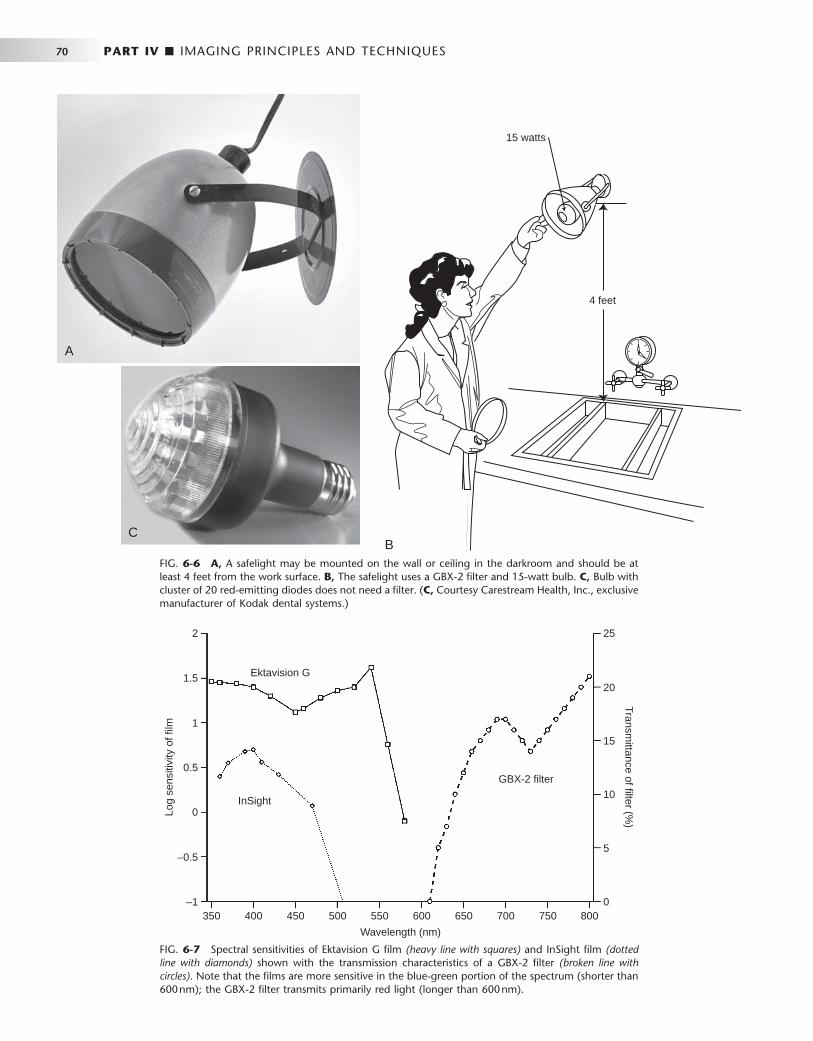
70 PART IV ■ IMAGING PRINCIPLES AND TECHNIQUES
FIG. 6-6 A, A safelight may be mounted on the wall or ceiling in the darkroom and should be at least 4 feet from the work surface. B, The safelight uses a GBX-2 fi lter and 15-watt bulb. C, Bulb with cluster of 20 red-emitting diodes does not need a fi lter. ( C, Courtesy Carestream Health, Inc., exclusive manufacturer of Kodak dental systems.)
15 watts
4 feet
B
A
C
FIG. 6-7 Spectral sensitivities of Ektavision G fi lm (heavy line with squares) and InSight fi lm (dotted line with diamonds) shown with the transmission characteristics of a GBX-2 fi lter (broken line with circles) . Note that the fi lms are more sensitive in the blue-green portion of the spectrum (shorter than 600 nm); the GBX-2 fi lter transmits primarily red light (longer than 600 nm).
350 400 450 500 550 600
Wavelength (nm)
Log
sens
itivi
ty o
f film
Transmittance of filter (%
)
650 700 750 8000
5
10
15
20
25
–1
–0.5
0
0.5
Ektavision G
InSight
GBX-2 filter
1
1.5
2

CHAPTER 6 ■ PROCESSING X-RAY FILM 71
FIG. 6-8 Processing tank. The developing and fi xing tanks are inserted into a bath of running water with an overfl ow drain.
Unit cover
Insert tankfor fixing
chemicals
Insert tank fordevelopingchemicals
Water bath/rinsing tank
Overflow pipe
DRYING RACKS
Two or three drying racks can be mounted on a convenient wall for fi lm hangers. Drip trays are placed underneath the racks to catch water that may run off the wet fi lms. An electric fan can be used to circulate the air and speed the drying of fi lms, but it should not be pointed directly at the fi lms. Also, cabinet dryers are available that circulate warm air around the fi lm and accelerate drying. Excessive heat must be avoided because it may damage the emulsion. If dryers are installed in the darkroom, they should be ventilated outside the darkroom to preclude high humidity and heat, which are detrimental to any unex-posed fi lm stored in the room.
Manual Processing Procedures
Manual processing of fi lm requires the following eight steps: 1. Replenish solutions. The fi rst step in manual tank processing is
to replenish the developer and fi xer. Add fresh developer (replen-isher) and fi xer (8 ounces per gallon) to maintain the proper strength of each solution. Check the solution levels to ensure that the developer and fi xer cover the fi lms on the top clips of the fi lm hangers.
2. Stir solutions. Next, stir the developer and fi xing solution to mix the chemicals and equalize the temperature throughout the tanks. To prevent cross-contamination, use a separate paddle for each solution. It is best to label one paddle for the developer and the other for the fi xer. Because proper developing time varies with the temperature of the solution, check the temperature of the developer after stirring.
3. Mount fi lms on hangers. Using only safelight illumination in the darkroom, remove the exposed fi lm from its lightproof packet or cassette. Hold the fi lms only by their edges to avoid damage to the fi lm surface. Clip the bare fi lm onto a fi lm hanger, one fi lm to a clip ( Fig. 6-9 ). To avoid any possible confusion later, label the fi lm racks with the patient ’ s name and the exposure date.
4. Set timer. Check the temperature of the developer and set the interval timer to the time indicated by the manufacturer for the solution temperature. For intraoral fi lm processing in conven-tional solutions, use the following development times:
FIG. 6-9 Films are mounted securely on fi lm clips. Film is always held by its edges to avoid fi ngerprints on the image. (Courtesy C.L. Crab-tree, DDS, Bureau of Radiological Health, Rockville, Md.)
TEMPERATURE DEVELOPMENT TIME
68 ° F 5 minutes
70 ° F 412 minutes
72 ° F 4 minutes
76 ° F 3 minutes
80 ° F 212 minutes
Processing fi lms at either higher or lower temperatures and for longer or shorter times than recommended by the manufac-turer reduces the contrast of the processed fi lm. Also, processing too long or at temperatures higher than those recommended can result in fi lm fog, which may diminish fi lm contrast and diag-nostic information.
5. Develop. Start the timer mechanism and immerse the hanger and fi lms immediately in the developer. Agitate the hanger mildly for 5 seconds to sweep air bubbles off the fi lm. Leave the fi lms in the developer for the predetermined time without further

72 PART IV ■ IMAGING PRINCIPLES AND TECHNIQUES
agitation. When removing the fi lms, drain the excess developer into the wash bath.
6. Rinse. After development, remove the fi lm hanger from the developer and place in the running water bath for 30 seconds. Agitate the fi lms continuously in the rinse water to remove excess developer, thus slowing development and minimizing contamination of the fi xer.
7. Fix. Place the hanger and fi lm in the fi xer solution for 2 to 4 minutes and agitate for 5 of every 30 seconds. This eliminates bubbles and brings fresh fi xer into contact with the emulsion. Excess fi xation (several hours) removes some of the metallic silver grains, diminishing the density of the fi lm. When the fi lms are removed, drain the excess fi xer into the wash bath.
8. Wash and dry. After fi xation of the fi lms is complete, place the hanger in running water for at least 10 minutes to remove resid-ual processing solutions. After the fi lms have been washed, remove surface moisture by gently shaking excess water from the fi lms and hanger. Dry the fi lms in circulating, moderately warm air. If the fi lms dry rapidly with small drops of water clinging to their surface, the areas under the drops dry more slowly than the surrounding areas. This uneven drying causes distortion of the gelatin, leaving a drying artifact in some cases. The result is spots that frequently are visible and detract from the usefulness of the fi nished radiograph. After drying, the fi lms are ready to mount.
Rapid-Processing Chemicals
In recent years a number of manufacturers have produced rapid-processing solutions. These solutions typically develop fi lms in 15 seconds and fi x them in 15 seconds at room temperature. They have the same general formulation as conventional processing solutions but often contain a higher concentration of hydroquinone. They also have a more alkaline pH than conventional solutions, which causes the emulsion to swell more, thus providing greater access to developer. These solutions are especially advantageous in endodontics and in emergency situations, when short processing time is essential. Although the resultant images may be satisfactory, they often do not achieve the same degree of contrast as fi lms processed conventionally, and they may discolor over time if not fully washed. After viewing, rapidly processed fi lms are placed in conventional fi xing solution for 4 minutes and washed for 10 minutes. This improves the contrast and helps keep them stable in storage. Conventional solutions are pre-ferred for most routine use.
Changing Solutions
All processing solutions deteriorate as a result of continued use and exposure to air. Although regular replenishment of the developer and fi xer prolongs their useful life, the buildup of reaction products even-tually causes these solutions to cease functioning properly. Exhaustion of the developer results from oxidation of the developing agents, depletion of the hydroquinone, and buildup of bromide. Use of exhausted developer results in fi lms that show reduced density and contrast. When the fi xer becomes exhausted, silver thiosulfate com-plexes form and halide ions build up. The increased concentration of silver thiosulfate complexes slows the rate of diffusion of these com-plexes from the emulsion. The halide ions slow the rate of clearing of unexposed silver halide crystals. These changes result in fi lms with incomplete clearing that turn brown with age. With regular replenish-
ment, solutions may last 3 or 4 weeks before they must be changed. When the developer and fi xer are replaced, the solutions must be prepared according to the directions on the containers.
A simple procedure can help determine when solutions should be changed. A double fi lm packet instead of a single fi lm packet is exposed on one projection for the fi rst patient radiographed after new solutions have been prepared. One fi lm is placed in the patient ’ s chart, and the other is mounted on a corner of a viewbox in the darkroom. As successive fi lms are processed, they are compared with this refer-ence fi lm. Loss of image contrast and density become evident as the solutions deteriorate, indicating when the time has come to change them. The fi xer is changed when the developer is changed.
Automatic Film Processing
Equipment that automates all processing steps is available ( Fig. 6-10 ). Although automatic processing has a number of advantages, the most important is the time saved. Depending on the equipment and the temperature of operation, an automatic processor requires only 4 to 6 minutes to develop, fi x, wash, and dry a fi lm. Many dental automatic processors have a light-shielded (daylight loading) compartment in which the operator can unwrap fi lms and feed them into the machine without working in a darkroom. This is desirable because the indi-vidual doing the developing does not have to work in the dark. However, special care must be taken to maintain infection control when using these daylight-loading compartments (see Chapter 8 ).
When extraoral fi lms are processed, the light-shielded compart-ment is removed to provide room for feeding the larger fi lm into the processor. Another attractive feature of the automatic system is that the density and contrast of the radiographs tend to be consistent. However, because of the higher temperature of the developer and the artifacts caused by rollers, the quality of fi lms processed automatically often is not as high as that of those carefully developed manually. With automatically processed fi lms, more grain usually is evident in the fi nal image.
Whether automatic processing equipment is appropriate for a spe-cifi c practice depends on the dentist and the nature and volume of the practice. The equipment is expensive and must be cleaned fre-quently. Also, the automated equipment may break down, and con-ventional darkroom equipment may still be needed as a backup system.
MECHANISM
Automatic processors have an in-line arrangement. Typically, this consists of a transport mechanism that picks up the unwrapped fi lm and passes it through the developing, fi xing, washing, and drying sections ( Fig. 6-11 ). The transport system most often used is a series of rollers driven by a constant-speed motor that operates through gears, belts, or chains. The rollers often consist of independent assemblies of multiple rollers in a rack, with one rack for each step in the operation. Although these assemblies are designed and posi-tioned so that the fi lm crosses over from one roller to the next, the operator may remove them independently for soaking, cleaning, and repairing.
The primary function of the rollers is to move the fi lm through the developing solutions, but they also serve at least three other pur-poses. First, their motion helps keep the solutions agitated, which contributes to the uniformity of processing. Second, in the developer, fi xer, and water tanks the rollers press on the fi lm emulsion, forcing

CHAPTER 6 ■ PROCESSING X-RAY FILM 73
some solution out of the emulsion. The emulsions rapidly fi ll again with solution, thus promoting solution exchange. Finally, the top rollers at the crossover point between the developer and fi xer tanks remove developing solution, minimizing carryover of developer into the fi xer tank. This feature helps maintain the uniformity of process-ing chemicals.
The chemical compositions of the developer and fi xer are modifi ed to operate at higher temperatures than those used for manual process-ing and to meet the more rapid development, fi xing, washing, and drying requirements of automatic processing. The fi xer has an addi-
tional hardener that helps the emulsion withstand the rigors of the transport system.
OPERATION
Successful operation of an automatic processor requires standardized procedures and regular maintenance. The processor and surrounding area should always be kept clean so that no chemicals contaminate hands or fi lms. Each morning the solution level and temperature should be checked before fi lms are processed. Hands should be dry
FIG. 6-10 Automatic fi lm processors. A, Dent-X 810 AR fi lm processor. B, A/T 2000XR. ( A , Courtesy AFP Imaging/Dent-X, Elmsford, N.Y.; B, courtesy Air Techniques, Inc., Hicksville, N.Y.)
A B
Filmentry
Developingsolution
Fixingsolution
Waterwash
Filmexit
Dryingelements
Filmentrance Developer Fixer Wash
DryerFilm exit
A
B C
FIG. 6-11 A, Automatic fi lm processors typically consist of a roller assembly that transports the fi lm through developing, fi xing, washing, and drying stations. B, Assembly of fi lm transport mechanism. C, Complete internal transport system. ( B and C, Courtesy AFP Imaging/Dent-X, Elmsford, N.Y.)

74 PART IV ■ IMAGING PRINCIPLES AND TECHNIQUES
when handling fi lm, and fi lms should be touched only by their edges. The better processors have automatic replenishment systems. Once a week a maintenance routine should be followed, including cleaning the rollers and other working parts. It is also often useful to run a large fi lm through the processor to clean the rollers.
REPLENISHMENT
It is important to maintain the constituents of the developer and fi xer carefully to preserve the optimal sensitometric and physical properties of the fi lm emulsion within the narrow limits imposed by the speed
and temperature of automatic processing. As the activity of the devel-oping and fi xing solutions lessens, its effect on the fi lm diminishes. To compensate for this loss of activity, some automatic processors include an automatic replenishment system that adds fresh developer to the developer tank and fresh fi xer to the fi xer tank. As with manual pro-cessing, 8 ounces of fresh developer and fi xer should be added per gallon of solution per day. This assumes an average workload of 30 intraoral or 5 extraoral fi lms per day. Insuffi cient replenishment of the developer results in a loss of image contrast. Exhaustion of the fi xing solution causes poor clearing of the fi lm, insuffi cient hardening of the emulsion, and unreliable transport from the fi xer assembly through the drying operation.
BOX 6-1
Common Problems in Film Exposure and Development
Light Radiographs ( Fig. 6-12 ) PROCESSING ERRORS Underdevelopment (temperature too low; time too short;
thermometer inaccurate) Depleted developer solution Diluted or contaminated developer Excessive fi xation
UNDEREXPOSURE Insuffi cient milliamperage Insuffi cient peak kilovoltage Insuffi cient time Film-source distance too great Film packet reversed in mouth ( Fig. 6-13 )
Dark Radiographs ( Fig. 6-14 ) PROCESSING ERRORS Overdevelopment (temperature too high; time too long) Developer concentration too high Inadequate fi xation Accidental exposure to light Improper safelighting
OVEREXPOSURE Excessive milliamperage Excessive peak kilovoltage Excessive time Film-source distance too short
Insuffi cient Contrast ( Fig. 6-15 ) Underdevelopment Underexposure Excessive peak kilovoltage Excessive fi lm fog
Film Fog ( Fig. 6-16 ) Improper safelighting (improper fi lter; excessive bulb wattage;
inadequate distance between safelight and work surface; prolonged exposure to safelight)
Light leaks (cracked safelight fi lter; light from doors, vents, or other sources)
Overdevelopment Contaminated solutions Deteriorated fi lm (stored at high temperature; stored at high
humidity; exposed to radiation; outdated)
Dark Spots or Lines ( Fig. 6-17 ) Fingerprint contamination Black wrapping paper sticking to fi lm surface Film in contact with tank or another fi lm during fi xation Film contaminated with developer before processing Excessive bending of fi lm Static discharge to fi lm before processing Excessive roller pressure during automatic processing Dirty rollers in automatic processing
Light Spots ( Fig. 6-18 ) Film contaminated with fi xer before processing Film in contact with tank or another fi lm during development Excessive bending of fi lm
Yellow or Brown Stains Depleted developer Depleted fi xer Insuffi cient washing Contaminated solutions
Blurring ( Fig. 6-19 ) Movement of patient Movement of x-ray tube head Double exposure
Partial Images ( Fig. 6-20 ) Top of fi lm not immersed in developing solution Misalignment of x-ray tube head ( “ cone cut ” )
Emulsion Peel Abrasion of image during processing Excessive time in wash water
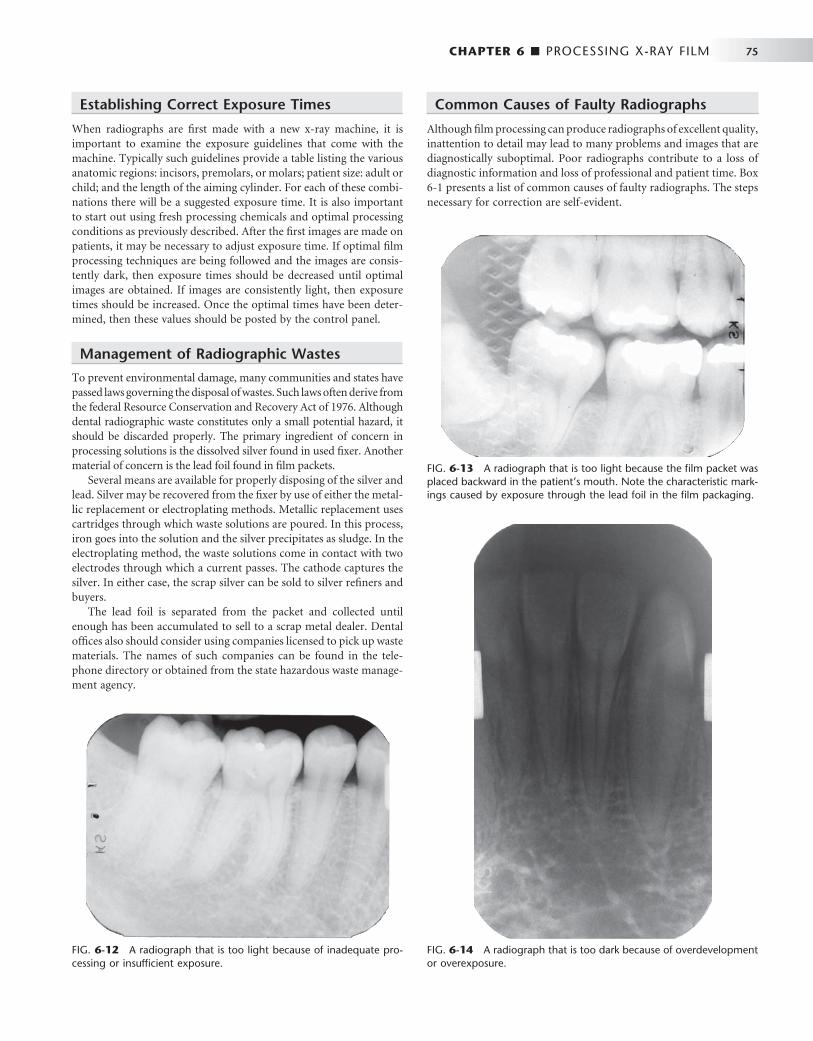
CHAPTER 6 ■ PROCESSING X-RAY FILM 75
FIG. 6-12 A radiograph that is too light because of inadequate pro-cessing or insuffi cient exposure.
FIG. 6-13 A radiograph that is too light because the fi lm packet was placed backward in the patient ’ s mouth. Note the characteristic mark-ings caused by exposure through the lead foil in the fi lm packaging.
Establishing Correct Exposure Times
When radiographs are fi rst made with a new x-ray machine, it is important to examine the exposure guidelines that come with the machine. Typically such guidelines provide a table listing the various anatomic regions: incisors, premolars, or molars; patient size: adult or child; and the length of the aiming cylinder. For each of these combi-nations there will be a suggested exposure time. It is also important to start out using fresh processing chemicals and optimal processing conditions as previously described. After the fi rst images are made on patients, it may be necessary to adjust exposure time. If optimal fi lm processing techniques are being followed and the images are consis-tently dark, then exposure times should be decreased until optimal images are obtained. If images are consistently light, then exposure times should be increased. Once the optimal times have been deter-mined, then these values should be posted by the control panel.
Management of Radiographic Wastes
To prevent environmental damage, many communities and states have passed laws governing the disposal of wastes. Such laws often derive from the federal Resource Conservation and Recovery Act of 1976. Although dental radiographic waste constitutes only a small potential hazard, it should be discarded properly. The primary ingredient of concern in processing solutions is the dissolved silver found in used fi xer. Another material of concern is the lead foil found in fi lm packets.
Several means are available for properly disposing of the silver and lead. Silver may be recovered from the fi xer by use of either the metal-lic replacement or electroplating methods. Metallic replacement uses cartridges through which waste solutions are poured. In this process, iron goes into the solution and the silver precipitates as sludge. In the electroplating method, the waste solutions come in contact with two electrodes through which a current passes. The cathode captures the silver. In either case, the scrap silver can be sold to silver refi ners and buyers.
The lead foil is separated from the packet and collected until enough has been accumulated to sell to a scrap metal dealer. Dental offi ces also should consider using companies licensed to pick up waste materials. The names of such companies can be found in the tele-phone directory or obtained from the state hazardous waste manage-ment agency.
Common Causes of Faulty Radiographs
Although fi lm processing can produce radiographs of excellent quality, inattention to detail may lead to many problems and images that are diagnostically suboptimal. Poor radiographs contribute to a loss of diagnostic information and loss of professional and patient time. Box 6-1 presents a list of common causes of faulty radiographs. The steps necessary for correction are self-evident.
FIG. 6-14 A radiograph that is too dark because of overdevelopment or overexposure.

76 PART IV ■ IMAGING PRINCIPLES AND TECHNIQUES
FIG. 6-17 Dark spot on an x-ray fi lm caused by fi lm contact with the tank wall during fi xation.
FIG. 6-18 Light spots on an x-ray fi lm caused by fi lm contact with drops of fi xer before processing.
FIG. 6-19 Blurred radiograph caused by movement of the patient during exposure.
FIG. 6-20 Partial image caused by poor alignment of the tube head with the fi lm rectangular collimator.
FIG. 6-15 A radiograph with insuffi cient contrast, showing gray enamel and gray pulp chambers.
FIG. 6-16 Fogged radiograph marked by lack of image detail.
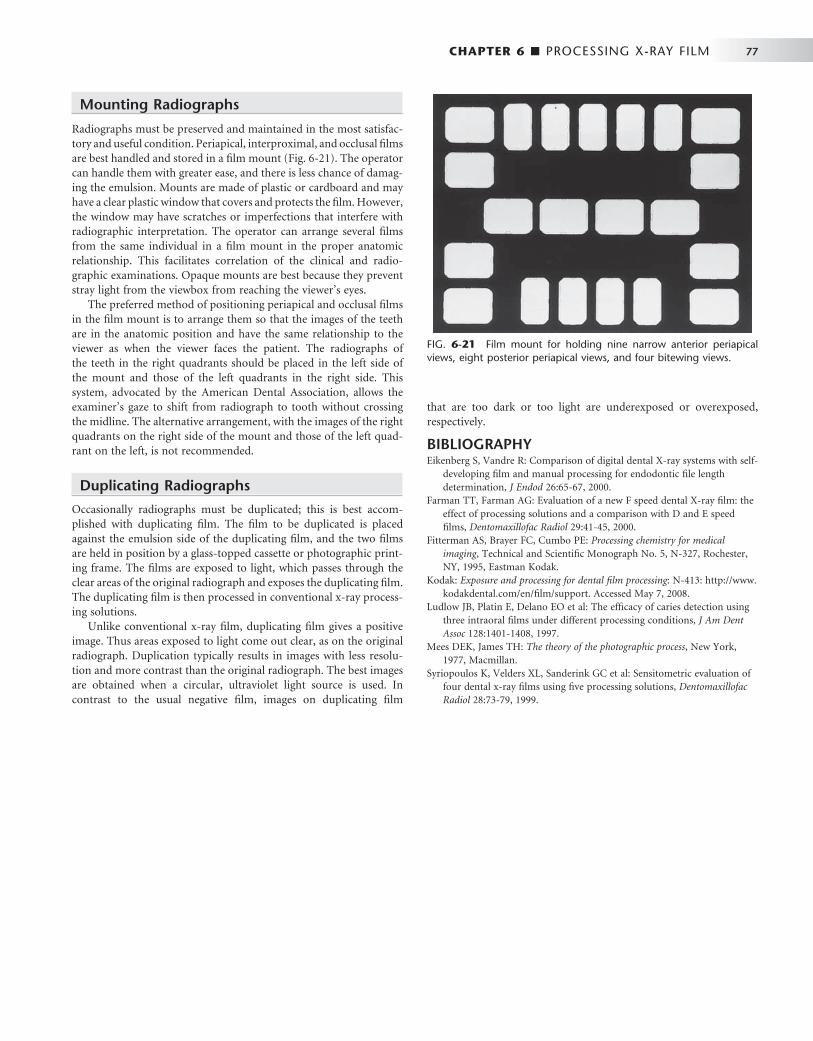
CHAPTER 6 ■ PROCESSING X-RAY FILM 77
FIG. 6-21 Film mount for holding nine narrow anterior periapical views, eight posterior periapical views, and four bitewing views.
that are too dark or too light are underexposed or overexposed, respectively.
BIBLIOGRAPHY 1 Eikenberg S , Vandre R : Comparison of digital dental X-ray systems with self-
developing fi lm and manual processing for endodontic fi le length determination , J Endod 26 : 65 - 67 , 2000 .
2 Farman TT , Farman AG : Evaluation of a new F speed dental X-ray fi lm: the effect of processing solutions and a comparison with D and E speed fi lms , Dentomaxillofac Radiol 29 : 41 - 45 , 2000 .
3 Fitterman AS , Brayer FC , Cumbo PE : Processing chemistry for medical imaging , Technical and Scientifi c Monograph No. 5, N-327, Rochester, NY , 1995 , Eastman Kodak .
4 Kodak : Exposure and processing for dental fi lm processing : N-413: http://www.kodakdental.com/en/fi lm/support . Accessed May 7, 2008.
5 Ludlow JB , Platin E , Delano EO et al : The effi cacy of caries detection using three intraoral fi lms under different processing conditions , J Am Dent Assoc 128 : 1401 - 1408 , 1997 .
6 Mees DEK , James TH : The theory of the photographic process , New York , 1977 , Macmillan .
7 Syriopoulos K , Velders XL , Sanderink GC et al : Sensitometric evaluation of four dental x-ray fi lms using fi ve processing solutions , Dentomaxillofac Radiol 28 : 73 - 79 , 1999 .
Mounting Radiographs
Radiographs must be preserved and maintained in the most satisfac-tory and useful condition. Periapical, interproximal, and occlusal fi lms are best handled and stored in a fi lm mount ( Fig. 6-21 ). The operator can handle them with greater ease, and there is less chance of damag-ing the emulsion. Mounts are made of plastic or cardboard and may have a clear plastic window that covers and protects the fi lm. However, the window may have scratches or imperfections that interfere with radiographic interpretation. The operator can arrange several fi lms from the same individual in a fi lm mount in the proper anatomic relationship. This facilitates correlation of the clinical and radio-graphic examinations. Opaque mounts are best because they prevent stray light from the viewbox from reaching the viewer ’ s eyes.
The preferred method of positioning periapical and occlusal fi lms in the fi lm mount is to arrange them so that the images of the teeth are in the anatomic position and have the same relationship to the viewer as when the viewer faces the patient. The radiographs of the teeth in the right quadrants should be placed in the left side of the mount and those of the left quadrants in the right side. This system, advocated by the American Dental Association, allows the examiner ’ s gaze to shift from radiograph to tooth without crossing the midline. The alternative arrangement, with the images of the right quadrants on the right side of the mount and those of the left quad-rant on the left, is not recommended.
Duplicating Radiographs
Occasionally radiographs must be duplicated; this is best accom-plished with duplicating fi lm. The fi lm to be duplicated is placed against the emulsion side of the duplicating fi lm, and the two fi lms are held in position by a glass-topped cassette or photographic print-ing frame. The fi lms are exposed to light, which passes through the clear areas of the original radiograph and exposes the duplicating fi lm. The duplicating fi lm is then processed in conventional x-ray process-ing solutions.
Unlike conventional x-ray fi lm, duplicating fi lm gives a positive image. Thus areas exposed to light come out clear, as on the original radiograph. Duplication typically results in images with less resolu-tion and more contrast than the original radiograph. The best images are obtained when a circular, ultraviolet light source is used. In contrast to the usual negative fi lm, images on duplicating fi lm

C H A P T E R 7
Digital Imaging
John B. Ludlow • Andr é Mol
The advent of digital imaging has revolutionized radiology. This revolution is the result of both technologic innovation in image acquisition processes and the development of networked
computing systems for image retrieval and transmission. Dentistry is seeing a steady increase in the use of these technologies, improvement of software interfaces, and introduction of new products. A number of forces are driving the shift from fi lm to digital systems. The detri-mental effects of inadequate fi lm processing on diagnostic quality and the diffi culty of maintaining high-quality chemical processing are well documented. Digital imaging eliminates chemical processing. Haz-ardous wastes in the form of processing chemicals and lead foil are eliminated with digital systems. Images can be electronically trans-ferred to other health care providers without any alteration of the original image quality. In addition, digital intraoral receptors require less radiation than fi lm, thus lowering patient exposure.
However, digital systems also have a number of disadvantages in comparison with fi lm. The initial expense of setting up a digital imaging system is relatively high. Certain components such as the electronic x-ray receptor used in some intraoral systems are suscepti-ble to rough handling and are costly to replace. Because digital systems use new or immature technologies, there is a risk — perhaps even a likelihood — of systems becoming obsolete or manufacturers going out of business. The excellent image quality and comparatively low cost of a properly exposed and processed fi lm keeps fi lm-based radi-ography competitive with digital alternatives.
The trends, however, are certain: computers play a role in the majority of dental practices, and that role is expanding as a variety of functions from appointment scheduling, procedure billing, and patient charting are integrated into seamless practice management software solutions. It is no longer a matter of if but rather when the majority of dental practices will use digital imaging. Already during this time of transition, fi lm-based practices are confronted with digital images from practices that have implemented digital radiography. This chapter describes the characteristics of digital images, image receptors, display options, and storage devices, followed by a discus-sion of digital image processing.
Analog Versus Digital
The term digital in digital imaging refers to the numeric format of the image content and its discreteness. Conventional fi lm images can be considered an analog medium in which differences in the size and distribution of black metallic silver result in a continuous density spectrum. Digital images are numeric and discrete in two ways: (1) in terms of the spatial distribution of the picture elements (pixels) and
(2) in terms of the different shades of gray of each of the pixels. A digital image consists of a large collection of individual pixels orga-nized in a matrix of rows and columns ( Fig. 7-1 ). Each pixel has a row and column coordinate that uniquely identifi es its location in the matrix. The formation of a digital image requires several steps, begin-ning with analog processes. At each pixel of an electronic detector, the absorption of x rays generates a small voltage. More x rays generate a higher voltage and vice versa. At each pixel, the voltage can fl uctuate between a minimum and maximum value and is therefore an analog signal ( Fig. 7-2, A ).
Production of a digital image requires a process called analog-to-digital conversion (ADC). ADC consists of two steps: sampling and quantization. Sampling means that a small range of voltage values are grouped together as a single value ( Fig. 7-2, B ). Narrow sampling better mimics the original signal but leads to larger memory require-ments for the resulting digital image ( Fig. 7-2, C ). Once sampled, the signal is quantized, which means that every sampled signal is assigned a value. These values are stored in the computer and represent the image. For the clinician to see the image, the computer organizes the pixels in their proper locations and displays a shade of gray that cor-responds to the number that was assigned during the quantization step.
To understand the strengths and weaknesses of digital radiography, the clinician establishes which elements of the radiographic imaging chain stay the same and which ones change. The imaging chain can be conceptualized as a series of interconnecting links beginning with the generation of x rays. Exposure factors, patient factors, and the projec-tion geometry determine how the x-ray beam will be attenuated. A portion of the unattenuated x-ray beam is captured by the image receptor to form a latent image. This latent image is then processed and converted into a real image, which is viewed and interpreted by the clinician. The use of digital detectors changes the way we acquire, store, retrieve, and display images. However, besides an adjustment of the exposure time, digital detectors do not fundamentally change the way in which x rays are selectively attenuated by the tissues of the patient. The physics of the interaction of x rays with matter and the effects of the projection geometry on the appearance of the radio-graphic image are unaltered and remain critically important for understanding image content and for optimizing image quality.
Digital Image Receptors
Digital image receptors encompass a number of different technologies and come in many different sizes and shapes. Unfortunately, a number of different and sometimes confusing names are in use to identify
78

CHAPTER 7 ■ DIGITAL IMAGING 79
these receptors in medicine and dentistry. Currently, the most useful distinction is that between two main technologies: (1) solid-state technology and (2) photostimulable phosphor technology. Although solid-state detectors can be further subdivided, these detectors have in common certain physical properties and the ability to generate a digital image in the computer without any other external device. In medicine, the use of solid-state detectors is referred to as digital radi-ography. In dentistry, intraoral solid-state detectors are often called sensors. The other main technology, photostimulable phosphor (PSP), consists of a phosphor coated on top of a plate in which a latent image is formed after x-ray exposure. The latent image is converted to a digital image by a scanning device through stimulation by laser light. Some refer to this technology as storage phosphor on the basis of the notion that the image information is temporarily stored within the phosphor. Others use the term image plates to differentiate them from fi lm and solid-state detectors. The use of PSP plates in medical radiol-ogy is referred to as computed radiography.
SOLID-STATE DETECTORS
Solid-state detectors collect the charge generated by x rays in a solid semiconducting material. The key clinical feature of these detectors is the rapid availability of the image after exposure. The matrix and its associated readout and amplifying electronics of intraoral detectors are enclosed within a plastic housing to protect them from the oral environment. These elements of the detector consume part of the real estate of the sensor so that the active area of the sensor is smaller than its total surface area. Sensor bulk, although reduced by continued miniaturization of the electronic components, is a potential drawback of intraoral solid-state detectors. In addition, most detectors incorpo-rate an electronic cable to transfer data to the computer. One manu-facturer has produced a system that replaces the cable connection with
a radiofrequency transmitter. This frees the detector from a direct tether to the computer, but it necessitates some additional electronic components, thus increasing the overall bulk of the sensor.
A number of manufacturers produce detectors with varying active sensor areas roughly corresponding to the different sizes of intraoral fi lm. Detectors without fl aws are relatively expensive to produce, and the expense of the detector increases with increasing matrix size (total number of pixels). Pixel size varies from 20 to 70 micrometers ( μ m). Three types of solid-state sensors are in common use.
Charge-Coupled Device The charge-coupled device (CCD), introduced to dentistry in 1987, was the fi rst digital image receptor to be adapted for intraoral imaging. The CCD uses a thin wafer of silicon as the basis for image recording. The silicon crystals are formed in a picture element (pixel) matrix ( Fig. 7-3 ). When exposed to radiation, the covalent bonds between silicon atoms are broken, producing electron-hole pairs ( Fig. 7-4 ). The number of electron-hole pairs that are formed is proportional to the amount of exposure that an area receives. The electrons are then attracted toward the most positive potential in the device, where they create “ charge packets. ” Each packet corresponds to one pixel. The charge pattern formed from the individual pixels in the matrix repre-sents the latent image ( Fig. 7-5 ). The image is read by transferring each row of pixel charges from one pixel to the next in a “ bucket brigade ” fashion. As a charge reaches the end of its row, it is trans-ferred to a readout amplifi er and transmitted as a voltage to the analog-to-digital converter located within or connected to the com-puter. Voltages from each pixel are sampled and assigned a numeric value representing a gray level (ADC). Because CCD detectors are more sensitive to light than to x rays, most manufacturers use a layer of scintillating material coated directly on the CCD surface or coupled
FIG. 7-1 The digital image is made up of a large number of discrete picture ele-ments (pixels). Their size is so small that the image appears smooth at normal magnifi cation. The location of each pixel is uniquely identifi ed by a row and column coordinate within the image matrix. The value assigned to a pixel represents the intensity (gray level) of the image at that location.
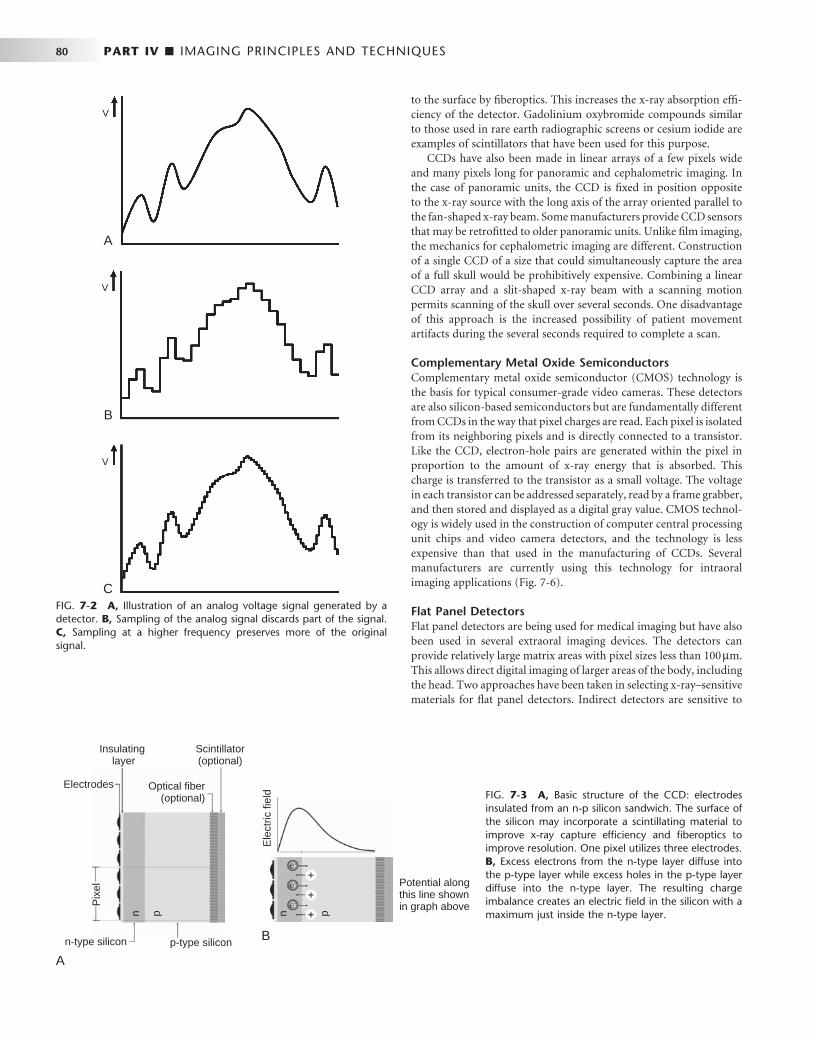
80 PART IV ■ IMAGING PRINCIPLES AND TECHNIQUES
to the surface by fi beroptics. This increases the x-ray absorption effi -ciency of the detector. Gadolinium oxybromide compounds similar to those used in rare earth radiographic screens or cesium iodide are examples of scintillators that have been used for this purpose.
CCDs have also been made in linear arrays of a few pixels wide and many pixels long for panoramic and cephalometric imaging. In the case of panoramic units, the CCD is fi xed in position opposite to the x-ray source with the long axis of the array oriented parallel to the fan-shaped x-ray beam. Some manufacturers provide CCD sensors that may be retrofi tted to older panoramic units. Unlike fi lm imaging, the mechanics for cephalometric imaging are different. Construction of a single CCD of a size that could simultaneously capture the area of a full skull would be prohibitively expensive. Combining a linear CCD array and a slit-shaped x-ray beam with a scanning motion permits scanning of the skull over several seconds. One disadvantage of this approach is the increased possibility of patient movement artifacts during the several seconds required to complete a scan.
Complementary Metal Oxide Semiconductors Complementary metal oxide semiconductor (CMOS) technology is the basis for typical consumer-grade video cameras. These detectors are also silicon-based semiconductors but are fundamentally different from CCDs in the way that pixel charges are read. Each pixel is isolated from its neighboring pixels and is directly connected to a transistor. Like the CCD, electron-hole pairs are generated within the pixel in proportion to the amount of x-ray energy that is absorbed. This charge is transferred to the transistor as a small voltage. The voltage in each transistor can be addressed separately, read by a frame grabber, and then stored and displayed as a digital gray value. CMOS technol-ogy is widely used in the construction of computer central processing unit chips and video camera detectors, and the technology is less expensive than that used in the manufacturing of CCDs. Several manufacturers are currently using this technology for intraoral imaging applications ( Fig. 7-6 ).
Flat Panel Detectors Flat panel detectors are being used for medical imaging but have also been used in several extraoral imaging devices. The detectors can provide relatively large matrix areas with pixel sizes less than 100 μ m. This allows direct digital imaging of larger areas of the body, including the head. Two approaches have been taken in selecting x-ray – sensitive materials for fl at panel detectors. Indirect detectors are sensitive to
FIG. 7-2 A, Illustration of an analog voltage signal generated by a detector. B, Sampling of the analog signal discards part of the signal. C, Sampling at a higher frequency preserves more of the original signal.
A
B
C
V
V
V
FIG. 7-3 A, Basic structure of the CCD: electrodes insulated from an n-p silicon sandwich. The surface of the silicon may incorporate a scintillating material to improve x-ray capture effi ciency and fi beroptics to improve resolution. One pixel utilizes three electrodes. B, Excess electrons from the n-type layer diffuse into the p-type layer while excess holes in the p-type layer diffuse into the n-type layer. The resulting charge imbalance creates an electric fi eld in the silicon with a maximum just inside the n-type layer.
n-type silicon
Electrodes
Insulating layer
Scintillator(optional)
Optical fiber(optional)
p-type silicon
n p
Pix
el
A
B
Ele
ctric
fiel
d
n p
Potential alongthis line shownin graph above

CHAPTER 7 ■ DIGITAL IMAGING 81
visible light, and an intensifying screen (gadolinium oxysulfi de or cesium iodide) is used to convert x-ray energy into light. The perfor-mance of these devices is determined by the thickness of the intensify-ing screen. Thicker screens are more effi cient but allow greater diffusion of light photons, leading to image unsharpness. Direct detectors use a photoconductor material (selenium) with properties similar to silicon and a higher atomic number, which permits more effi cient absorption of x rays. Under the infl uence of an applied elec-trical fi eld, the electrons that are freed during x-ray exposure of the selenium are conducted in a direct line to an underlying thin fi lm transistor (TFT) detector element. Direct detectors using selenium (Z = 34) provide higher resolution but lower effi ciency in comparison with indirect detectors using intensifying screens with gadolinium (Z = 64) or cesium (Z = 55). The electrical energy generated is propor-tional to the x-ray exposure and is stored at each pixel in a capacitor. The energy is released and read out by applying appropriate row and
column voltages to a particular pixel ’ s transistor. Currently, fl at panel detectors are expensive and likely to be limited to specialized imaging tasks such as cone beam imaging.
PHOTOSTIMULABLE PHOSPHOR
PSP plates absorb and store energy from x rays and then release this energy as light (phosphorescence) when stimulated by another light of an appropriate wavelength. To the extent that the stimulating light and phosphorescent light wavelengths differ, the two may be distin-guished and the phosphorescence can be quantifi ed as a measure of the amount of x-ray energy that the material has absorbed.
The PSP material used for radiographic imaging is “ europium-doped ” barium fl uorohalide. Barium in combination with iodine, chlorine, or bromine forms a crystal lattice. The addition of europium (Eu + 2 ) creates imperfections in this lattice. When exposed to a suffi -ciently energetic source of radiation, valence electrons in europium can absorb energy and move into the conduction band. These elec-trons migrate to nearby halogen vacancies (F-centers) in the fl uoro-halide lattice and may become trapped there in a metastable state. While in this state, the number of trapped electrons is proportional to x-ray exposure and represents a latent image. When stimulated by red light of around 600 nm, the barium fl uorohalide releases trapped electrons to the conduction band. When an electron returns to the Eu + 3 ion, energy is released in the green spectrum between 300 and 500 nm ( Fig. 7-7 ). Fiberoptics conduct light from the PSP plate to a photomultiplier tube. The photomultiplier tube converts light into electrical energy. A red fi lter at the photomultiplier tube selectively removes the stimulating laser light, and the remaining green light is detected and converted to a varying voltage. The variations in voltage output from the photomultiplier tube correspond to variations in stimulated light intensity from the latent image. The voltage signal is quantifi ed by an analog-to-digital converter and stored and displayed as a digital image. In practice, the barium fl uorohalide material is
FIG. 7-4 X-ray or light photons impart energy to electrons in the valence band, releasing them into the conduction band. This generates an “ electron-hole ” charge pair.
Photoelectric Absorption in Silicon
Conduction band
Valence band
Electron
Hole
+
–
FIG. 7-5 A, Before exposure, the central electrode of each pixel is turned on, thus creating an area of maximum potential or potential well. B, X-ray photons are absorbed in the scintillating material and are converted to light photons. Light photons are absorbed in the silicon through photoelectric absorption. C , Electrons released from the valence band collect selectively near the n-p layer interface in the area of maximum potential to form a charge packet. During CCD readout, the electrical potential of the pixel electrodes are sequentially modulated to shift the charge packet from pixel to pixel.
A B C
Ele
ctric
fiel
d
Area ofmaximum potential
Scintillator(Gd2O2S)
Charge packet
Pixelboundary
Lightphoton X-ray
photon

82 PART IV ■ IMAGING PRINCIPLES AND TECHNIQUES
combined with a polymer and spread in a thin layer on a base material to create a PSP. For intraoral radiography, a polyester base similar to radiographic fi lm is used.
When they are manufactured in standard intraoral sizes, these plates provide handling characteristics similar to intraoral fi lm. PSP plates are also made in sizes commonly used for panoramic and cephalometric imaging. Some PSP processors accommodate a full
range of intraoral and extraoral plate sizes. Other processors are limited to intraoral or extraoral formats.
Before exposure, PSP plates must be erased to eliminate “ ghost images ” from prior exposures (note that this is a different type of ghost image than that associated with panoramic radiography). This is accomplished by fl ooding the plate with a bright light. Placing plates on a dental viewbox with the phosphor side of the plates facing the
FIG. 7-6 A, Kodak No. 2 fi lm. B, Soredex Optime No. 2 PSP plate sitting on barrier envelope to demonstrate packaged size. C, Gendex No. 2 CCD sensor. D, Schick No. 2 CMOS wireless sensor.
A B C D
FIG. 7-7 PSP image formation. A, The PSP plate has been fl ooded with white light to return all electrons to the valence band. B, Exposure to x rays imparts energy to europium valence electrons, moving them into the conduction band. Some electrons become trapped at “ F centers. ” C, A red scanning laser imparts energy to electrons at the F centers, promoting them to the conduction band from which many return to the valence band. With the electron ’ s return to the valence band, energy is released in the form of light photons in the green spectrum. This light is detected by a photomulti-plier tube or diode with a red fi lter to screen out the scanning laser light.
Plateexposed
X-rayphoton
Conduction band
F center F center F center
Scanninglaser
Photomultipliertube
e–
e–
Valence band
Plateprepared
Plateprocessed
Eu+2 Eu+2
BA C
Eu+3 Eu+2 Eu+3

CHAPTER 7 ■ DIGITAL IMAGING 83
light for 1 or 2 minutes can accomplish this. More intense light sources can be used for shorter periods of time. Some PSP systems integrate automatic plate-erasing lights. Erased plates are placed in light-tight containers before exposure. In the case of intraoral plates, sealable polyvinyl envelopes that are impervious to oral fl uids and light are used for packaging. For large-format plates, conventional cassettes (without intensifying screens) are used. After exposure, plates should be processed as soon as possible because trapped electrons spontane-ously release over time. The rate of loss of electrons is greatest shortly after exposure. The rate varies depending on the composition of the storage phosphor and the environmental temperature. Some phos-phors lose 23% of their trapped electrons after 30 minutes and 30% after an hour. Because loss of trapped electrons is fairly uniform across the plate surface, early loss of charge does not typically result in clini-cally meaningful image deterioration. However, underexposed images may suffer noticeable image degradation. Adequately exposed images may be stored for 12 to 24 hours and retain acceptable image quality. A more important source of latent image fading is exposure to ambient light during plate preparation for processing. A semidark environ-ment is recommended for plate handling. The more intense the back-ground light and the longer the exposure of the plate to this light, the greater is the loss of trapped electrons and the more degraded the resultant image. Red safelights found in most darkrooms are not safe for exposed PSP plates, which are most sensitive to the red light spectrum.
Stationary Plate Scans A number of approaches have been adopted for “ reading ” the latent images on PSP plates. An approach used by Soredex in its Digora system and Air Techniques in its ScanX system uses a rapidly rotating multifaceted mirror that refl ects a beam of red laser light. As the mirror revolves, the laser light sweeps across the plate. The plate is advanced and the adjacent line of phosphor is scanned. The direction of the laser scanning the plate is termed the fast scan direction. The direction of plate advancement is termed the slow scan direction.
Both companies have also introduced image erasing into the scanner. This improves work fl ow and reduces potential plate damage from manual erasing. Furthermore, the mechanism used for plate intake in the Soredex Optime scanner requires a metal disk on the back of the plate. This disk also serves as a marker to indicate when a plate was exposed backward.
Rotating Plate Scans An alternate approach to plate reading used by Gendex in the DenOptix system and by Kodak in the CR 7400 system involves a rapidly rotating drum that holds the plate. The rotation of the drum past a fi xed laser provides a rapid scan. Incremental movement of the laser in the slow scan direction allows image data to be acquired line by line.
Digital Detector Characteristics
CONTRAST RESOLUTION
Contrast resolution is the ability to distinguish different densities in the radiographic image. This is a function of the interaction of the following:
• Attenuation characteristics of the tissues imaged • Capacity of the image receptor to distinguish differences in
numbers of x-ray photons coming from different areas of the subject
• Ability of the computer display to portray differences in density
• Ability of the observer to recognize those differences Current digital detectors capture data at 8, 10, 12, or 16 bits. The
bit depth is a power of 2 ( Fig. 7-8 ). This means that the detector can theoretically capture 256 (2 8 ) to 65,536 (2 16 ) different densities. In practice the actual number of meaningful densities that can be cap-tured is limited by inaccuracies in image acquisition, that is, noise. Regardless of the number of density differences that a detector can capture, conventional computer monitors are capable of displaying a gray scale of only 8 bits. Because operating systems such as Windows reserve a number of gray levels for the display of system information, the actual number of gray levels that can be displayed on a monitor is 242. A more important limiting factor is the human visual system, which is capable of distinguishing only about 60 gray levels at any time under ideal viewing conditions. Considering the typical viewing environment in the dental operatory, the actual number of gray levels that can be distinguished falls to less than 30. Human visual limita-tions are also present for fi lm viewing; however, the luminance (brightness) of a typical radiograph view box is much greater than that of a typical computer display. Therefore the ambient lighting of the room in which the image is viewed will theoretically have a lower impact on fi lm than on digital displays.
SPATIAL RESOLUTION
Spatial resolution is the capacity for distinguishing fi ne detail in an image. Resolution is often measured and reported in units of line-pairs per millimeter. Test objects consisting of sets of very fi ne radi-opaque lines separated from each other by spaces equal to the width of a line are constructed with a variety of line widths ( Fig. 7-9 ). A line and its associated space are called a line pair (lp). At least two pixels are required to resolve a line pair, one for the dark line and one for the light space. Typical observers are able to distinguish about 6 lp/mm without benefi t of magnifi cation. Intraoral fi lm is capable of providing more than 20 lp/mm of resolution. Unless a fi lm image is magnifi ed, the observer is unable to appreciate the extent of the detail in the image.
With solid-state digital imaging systems the theoretic resolution limit is determined by pixel size: the smaller the size of the pixel, the higher the resolution. With 20- μ m pixels, a theoretical resolution of
FIG. 7-8 Contrast resolution. Examples of gray-scale ramps represent-ing distinct gray levels from black to white. Bit depth controls the number of possible gray levels in the image. The actual number of distinct gray levels that are displayed is dependent on the output device and image processing. The perceived number of gray levels is infl uenced by viewing conditions and the visual acuity of the observer. A, 6 bits/pixel — 64 gray levels. B, 5 bits/pixel — 32 gray levels. C, 4 bits/pixel — 16 gray levels. D, 3 bits/pixel — 8 gray levels.
A
D
B
C
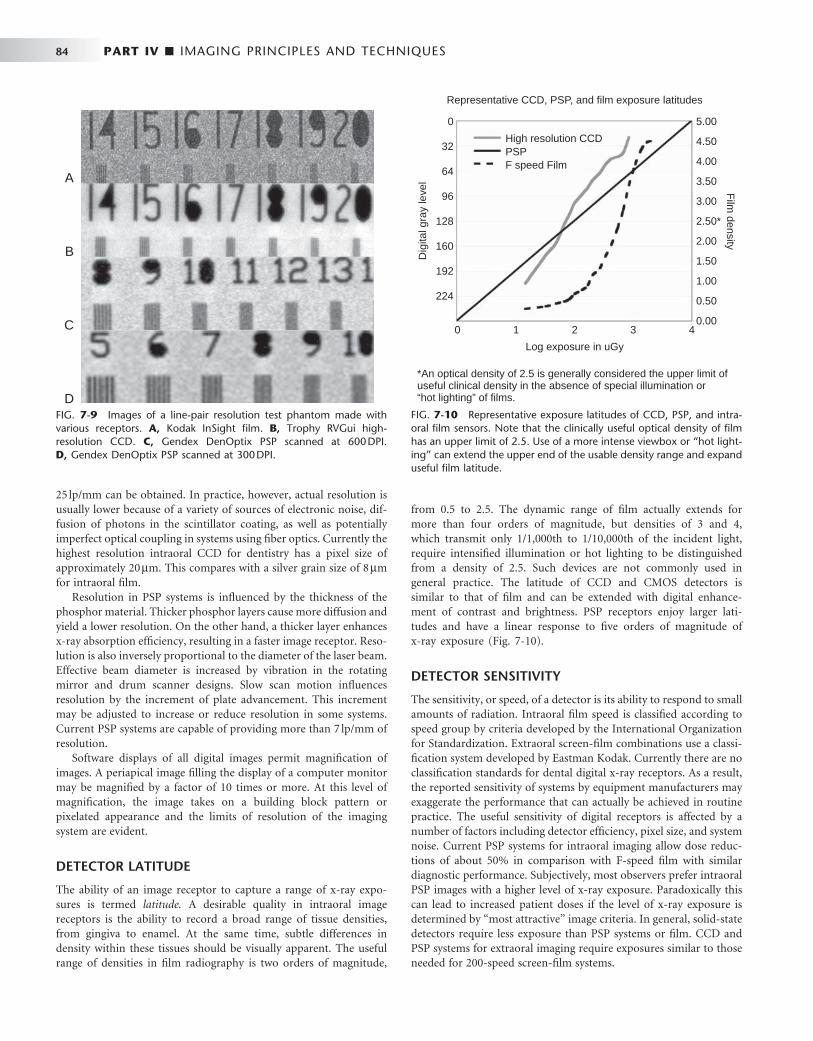
84 PART IV ■ IMAGING PRINCIPLES AND TECHNIQUES
25 lp/mm can be obtained. In practice, however, actual resolution is usually lower because of a variety of sources of electronic noise, dif-fusion of photons in the scintillator coating, as well as potentially imperfect optical coupling in systems using fi ber optics. Currently the highest resolution intraoral CCD for dentistry has a pixel size of approximately 20 μ m. This compares with a silver grain size of 8 μ m for intraoral fi lm.
Resolution in PSP systems is infl uenced by the thickness of the phosphor material. Thicker phosphor layers cause more diffusion and yield a lower resolution. On the other hand, a thicker layer enhances x-ray absorption effi ciency, resulting in a faster image receptor. Reso-lution is also inversely proportional to the diameter of the laser beam. Effective beam diameter is increased by vibration in the rotating mirror and drum scanner designs. Slow scan motion infl uences resolution by the increment of plate advancement. This increment may be adjusted to increase or reduce resolution in some systems. Current PSP systems are capable of providing more than 7 lp/mm of resolution.
Software displays of all digital images permit magnifi cation of images. A periapical image fi lling the display of a computer monitor may be magnifi ed by a factor of 10 times or more. At this level of magnifi cation, the image takes on a building block pattern or pixelated appearance and the limits of resolution of the imaging system are evident.
DETECTOR LATITUDE
The ability of an image receptor to capture a range of x-ray expo-sures is termed latitude. A desirable quality in intraoral image receptors is the ability to record a broad range of tissue densities, from gingiva to enamel. At the same time, subtle differences in density within these tissues should be visually apparent. The useful range of densities in fi lm radiography is two orders of magnitude,
from 0.5 to 2.5. The dynamic range of fi lm actually extends for more than four orders of magnitude, but densities of 3 and 4, which transmit only 1/1,000th to 1/10,000th of the incident light, require intensifi ed illumination or hot lighting to be distinguished from a density of 2.5. Such devices are not commonly used in general practice. The latitude of CCD and CMOS detectors is similar to that of fi lm and can be extended with digital enhance-ment of contrast and brightness. PSP receptors enjoy larger lati-tudes and have a linear response to fi ve orders of magnitude of x-ray exposure ( Fig. 7-10 ).
DETECTOR SENSITIVITY
The sensitivity, or speed, of a detector is its ability to respond to small amounts of radiation. Intraoral fi lm speed is classifi ed according to speed group by criteria developed by the International Organization for Standardization. Extraoral screen-fi lm combinations use a classi-fi cation system developed by Eastman Kodak. Currently there are no classifi cation standards for dental digital x-ray receptors. As a result, the reported sensitivity of systems by equipment manufacturers may exaggerate the performance that can actually be achieved in routine practice. The useful sensitivity of digital receptors is affected by a number of factors including detector effi ciency, pixel size, and system noise. Current PSP systems for intraoral imaging allow dose reduc-tions of about 50% in comparison with F-speed fi lm with similar diagnostic performance. Subjectively, most observers prefer intraoral PSP images with a higher level of x-ray exposure. Paradoxically this can lead to increased patient doses if the level of x-ray exposure is determined by “ most attractive ” image criteria. In general, solid-state detectors require less exposure than PSP systems or fi lm. CCD and PSP systems for extraoral imaging require exposures similar to those needed for 200-speed screen-fi lm systems.
FIG. 7-9 Images of a line-pair resolution test phantom made with various receptors. A, Kodak InSight fi lm. B, Trophy RVGui high-resolution CCD. C, Gendex DenOptix PSP scanned at 600 DPI. D, Gendex DenOptix PSP scanned at 300 DPI.
A
B
C
D FIG. 7-10 Representative exposure latitudes of CCD, PSP, and intra-oral fi lm sensors. Note that the clinically useful optical density of fi lm has an upper limit of 2.5. Use of a more intense viewbox or “ hot light-ing ” can extend the upper end of the usable density range and expand useful fi lm latitude.
0
0 5.00
4.50
4.00
3.50
3.00
Film
density
2.50*
2.00
1.50
1.00
0.50
0.00
32
64
96
128
Dig
ital g
ray
leve
l
160
High resolution CCDPSPF speed Film
192
224
1 2
Log exposure in uGy
Representative CCD, PSP, and film exposure latitudes
*An optical density of 2.5 is generally considered the upper limit ofuseful clinical density in the absence of special illumination or“hot lighting” of films.
3 4
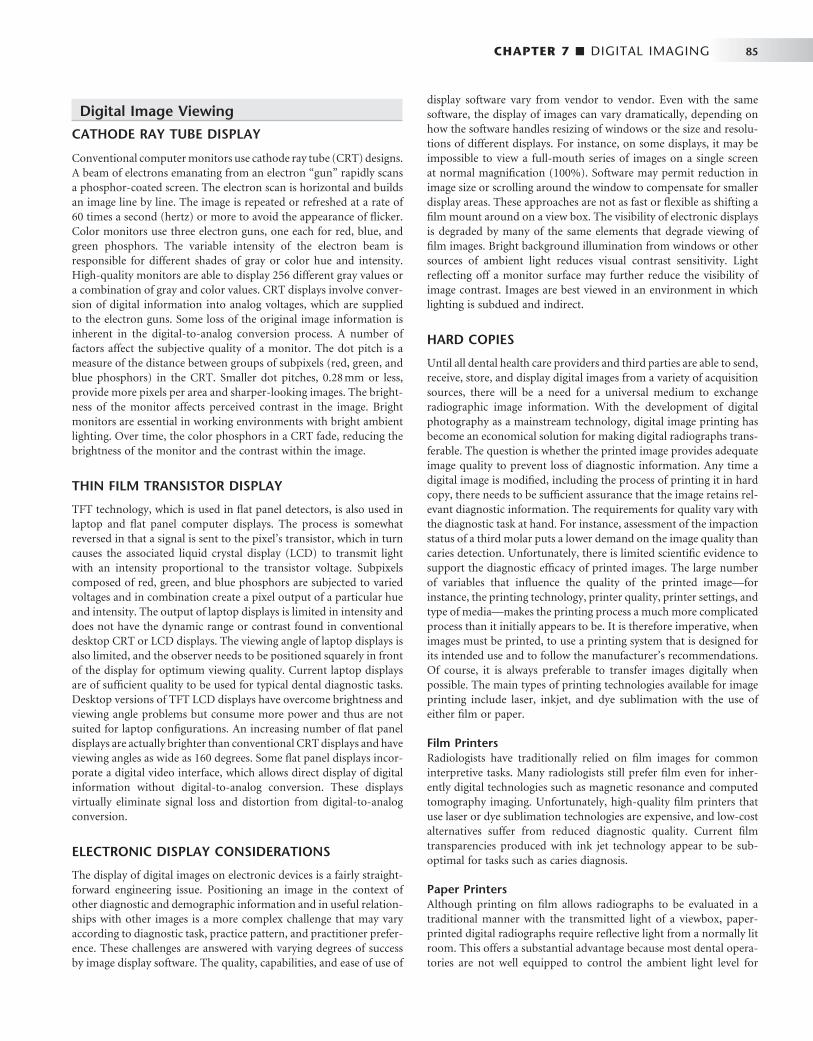
CHAPTER 7 ■ DIGITAL IMAGING 85
Digital Image Viewing
CATHODE RAY TUBE DISPLAY
Conventional computer monitors use cathode ray tube (CRT) designs. A beam of electrons emanating from an electron “ gun ” rapidly scans a phosphor-coated screen. The electron scan is horizontal and builds an image line by line. The image is repeated or refreshed at a rate of 60 times a second (hertz) or more to avoid the appearance of fl icker. Color monitors use three electron guns, one each for red, blue, and green phosphors. The variable intensity of the electron beam is responsible for different shades of gray or color hue and intensity. High-quality monitors are able to display 256 different gray values or a combination of gray and color values. CRT displays involve conver-sion of digital information into analog voltages, which are supplied to the electron guns. Some loss of the original image information is inherent in the digital-to-analog conversion process. A number of factors affect the subjective quality of a monitor. The dot pitch is a measure of the distance between groups of subpixels (red, green, and blue phosphors) in the CRT. Smaller dot pitches, 0.28 mm or less, provide more pixels per area and sharper-looking images. The bright-ness of the monitor affects perceived contrast in the image. Bright monitors are essential in working environments with bright ambient lighting. Over time, the color phosphors in a CRT fade, reducing the brightness of the monitor and the contrast within the image.
THIN FILM TRANSISTOR DISPLAY
TFT technology, which is used in fl at panel detectors, is also used in laptop and fl at panel computer displays. The process is somewhat reversed in that a signal is sent to the pixel ’ s transistor, which in turn causes the associated liquid crystal display (LCD) to transmit light with an intensity proportional to the transistor voltage. Subpixels composed of red, green, and blue phosphors are subjected to varied voltages and in combination create a pixel output of a particular hue and intensity. The output of laptop displays is limited in intensity and does not have the dynamic range or contrast found in conventional desktop CRT or LCD displays. The viewing angle of laptop displays is also limited, and the observer needs to be positioned squarely in front of the display for optimum viewing quality. Current laptop displays are of suffi cient quality to be used for typical dental diagnostic tasks. Desktop versions of TFT LCD displays have overcome brightness and viewing angle problems but consume more power and thus are not suited for laptop confi gurations. An increasing number of fl at panel displays are actually brighter than conventional CRT displays and have viewing angles as wide as 160 degrees. Some fl at panel displays incor-porate a digital video interface, which allows direct display of digital information without digital-to-analog conversion. These displays virtually eliminate signal loss and distortion from digital-to-analog conversion.
ELECTRONIC DISPLAY CONSIDERATIONS
The display of digital images on electronic devices is a fairly straight-forward engineering issue. Positioning an image in the context of other diagnostic and demographic information and in useful relation-ships with other images is a more complex challenge that may vary according to diagnostic task, practice pattern, and practitioner prefer-ence. These challenges are answered with varying degrees of success by image display software. The quality, capabilities, and ease of use of
display software vary from vendor to vendor. Even with the same software, the display of images can vary dramatically, depending on how the software handles resizing of windows or the size and resolu-tions of different displays. For instance, on some displays, it may be impossible to view a full-mouth series of images on a single screen at normal magnifi cation (100%). Software may permit reduction in image size or scrolling around the window to compensate for smaller display areas. These approaches are not as fast or fl exible as shifting a fi lm mount around on a view box. The visibility of electronic displays is degraded by many of the same elements that degrade viewing of fi lm images. Bright background illumination from windows or other sources of ambient light reduces visual contrast sensitivity. Light refl ecting off a monitor surface may further reduce the visibility of image contrast. Images are best viewed in an environment in which lighting is subdued and indirect.
HARD COPIES
Until all dental health care providers and third parties are able to send, receive, store, and display digital images from a variety of acquisition sources, there will be a need for a universal medium to exchange radiographic image information. With the development of digital photography as a mainstream technology, digital image printing has become an economical solution for making digital radiographs trans-ferable. The question is whether the printed image provides adequate image quality to prevent loss of diagnostic information. Any time a digital image is modifi ed, including the process of printing it in hard copy, there needs to be suffi cient assurance that the image retains rel-evant diagnostic information. The requirements for quality vary with the diagnostic task at hand. For instance, assessment of the impaction status of a third molar puts a lower demand on the image quality than caries detection. Unfortunately, there is limited scientifi c evidence to support the diagnostic effi cacy of printed images. The large number of variables that infl uence the quality of the printed image — for instance, the printing technology, printer quality, printer settings, and type of media — makes the printing process a much more complicated process than it initially appears to be. It is therefore imperative, when images must be printed, to use a printing system that is designed for its intended use and to follow the manufacturer ’ s recommendations. Of course, it is always preferable to transfer images digitally when possible. The main types of printing technologies available for image printing include laser, inkjet, and dye sublimation with the use of either fi lm or paper.
Film Printers Radiologists have traditionally relied on fi lm images for common interpretive tasks. Many radiologists still prefer fi lm even for inher-ently digital technologies such as magnetic resonance and computed tomography imaging. Unfortunately, high-quality fi lm printers that use laser or dye sublimation technologies are expensive, and low-cost alternatives suffer from reduced diagnostic quality. Current fi lm transparencies produced with ink jet technology appear to be sub-optimal for tasks such as caries diagnosis.
Paper Printers Although printing on fi lm allows radiographs to be evaluated in a traditional manner with the transmitted light of a viewbox, paper-printed digital radiographs require refl ective light from a normally lit room. This offers a substantial advantage because most dental opera-tories are not well equipped to control the ambient light level for
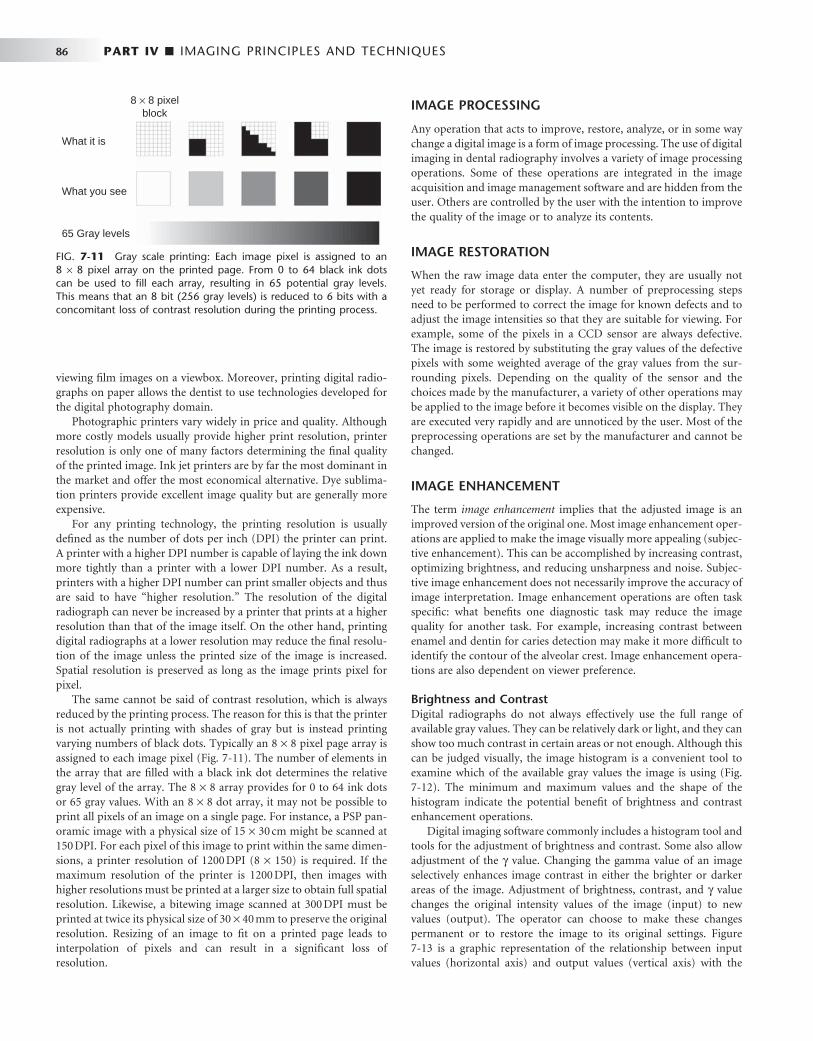
86 PART IV ■ IMAGING PRINCIPLES AND TECHNIQUES
viewing fi lm images on a viewbox. Moreover, printing digital radio-graphs on paper allows the dentist to use technologies developed for the digital photography domain.
Photographic printers vary widely in price and quality. Although more costly models usually provide higher print resolution, printer resolution is only one of many factors determining the fi nal quality of the printed image. Ink jet printers are by far the most dominant in the market and offer the most economical alternative. Dye sublima-tion printers provide excellent image quality but are generally more expensive.
For any printing technology, the printing resolution is usually defi ned as the number of dots per inch (DPI) the printer can print. A printer with a higher DPI number is capable of laying the ink down more tightly than a printer with a lower DPI number. As a result, printers with a higher DPI number can print smaller objects and thus are said to have “ higher resolution. ” The resolution of the digital radiograph can never be increased by a printer that prints at a higher resolution than that of the image itself. On the other hand, printing digital radiographs at a lower resolution may reduce the fi nal resolu-tion of the image unless the printed size of the image is increased. Spatial resolution is preserved as long as the image prints pixel for pixel.
The same cannot be said of contrast resolution, which is always reduced by the printing process. The reason for this is that the printer is not actually printing with shades of gray but is instead printing varying numbers of black dots. Typically an 8 × 8 pixel page array is assigned to each image pixel ( Fig. 7-11 ). The number of elements in the array that are fi lled with a black ink dot determines the relative gray level of the array. The 8 × 8 array provides for 0 to 64 ink dots or 65 gray values. With an 8 × 8 dot array, it may not be possible to print all pixels of an image on a single page. For instance, a PSP pan-oramic image with a physical size of 15 × 30 cm might be scanned at 150 DPI. For each pixel of this image to print within the same dimen-sions, a printer resolution of 1200 DPI (8 × 150) is required. If the maximum resolution of the printer is 1200 DPI, then images with higher resolutions must be printed at a larger size to obtain full spatial resolution. Likewise, a bitewing image scanned at 300 DPI must be printed at twice its physical size of 30 × 40 mm to preserve the original resolution. Resizing of an image to fi t on a printed page leads to interpolation of pixels and can result in a signifi cant loss of resolution.
IMAGE PROCESSING
Any operation that acts to improve, restore, analyze, or in some way change a digital image is a form of image processing. The use of digital imaging in dental radiography involves a variety of image processing operations. Some of these operations are integrated in the image acquisition and image management software and are hidden from the user. Others are controlled by the user with the intention to improve the quality of the image or to analyze its contents.
IMAGE RESTORATION
When the raw image data enter the computer, they are usually not yet ready for storage or display. A number of preprocessing steps need to be performed to correct the image for known defects and to adjust the image intensities so that they are suitable for viewing. For example, some of the pixels in a CCD sensor are always defective. The image is restored by substituting the gray values of the defective pixels with some weighted average of the gray values from the sur-rounding pixels. Depending on the quality of the sensor and the choices made by the manufacturer, a variety of other operations may be applied to the image before it becomes visible on the display. They are executed very rapidly and are unnoticed by the user. Most of the preprocessing operations are set by the manufacturer and cannot be changed.
IMAGE ENHANCEMENT
The term image enhancement implies that the adjusted image is an improved version of the original one. Most image enhancement oper-ations are applied to make the image visually more appealing (subjec-tive enhancement). This can be accomplished by increasing contrast, optimizing brightness, and reducing unsharpness and noise. Subjec-tive image enhancement does not necessarily improve the accuracy of image interpretation. Image enhancement operations are often task specifi c: what benefi ts one diagnostic task may reduce the image quality for another task. For example, increasing contrast between enamel and dentin for caries detection may make it more diffi cult to identify the contour of the alveolar crest. Image enhancement opera-tions are also dependent on viewer preference.
Brightness and Contrast Digital radiographs do not always effectively use the full range of available gray values. They can be relatively dark or light, and they can show too much contrast in certain areas or not enough. Although this can be judged visually, the image histogram is a convenient tool to examine which of the available gray values the image is using ( Fig. 7-12 ). The minimum and maximum values and the shape of the histogram indicate the potential benefi t of brightness and contrast enhancement operations.
Digital imaging software commonly includes a histogram tool and tools for the adjustment of brightness and contrast. Some also allow adjustment of the γ value. Changing the gamma value of an image selectively enhances image contrast in either the brighter or darker areas of the image. Adjustment of brightness, contrast, and γ value changes the original intensity values of the image (input) to new values (output). The operator can choose to make these changes permanent or to restore the image to its original settings. Figure 7-13 is a graphic representation of the relationship between input values (horizontal axis) and output values (vertical axis) with the
FIG. 7-11 Gray scale printing: Each image pixel is assigned to an 8 × 8 pixel array on the printed page. From 0 to 64 black ink dots can be used to fi ll each array, resulting in 65 potential gray levels. This means that an 8 bit (256 gray levels) is reduced to 6 bits with a concomitant loss of contrast resolution during the printing process.
8 × 8 pixelblock
What it is
What you see
65 Gray levels
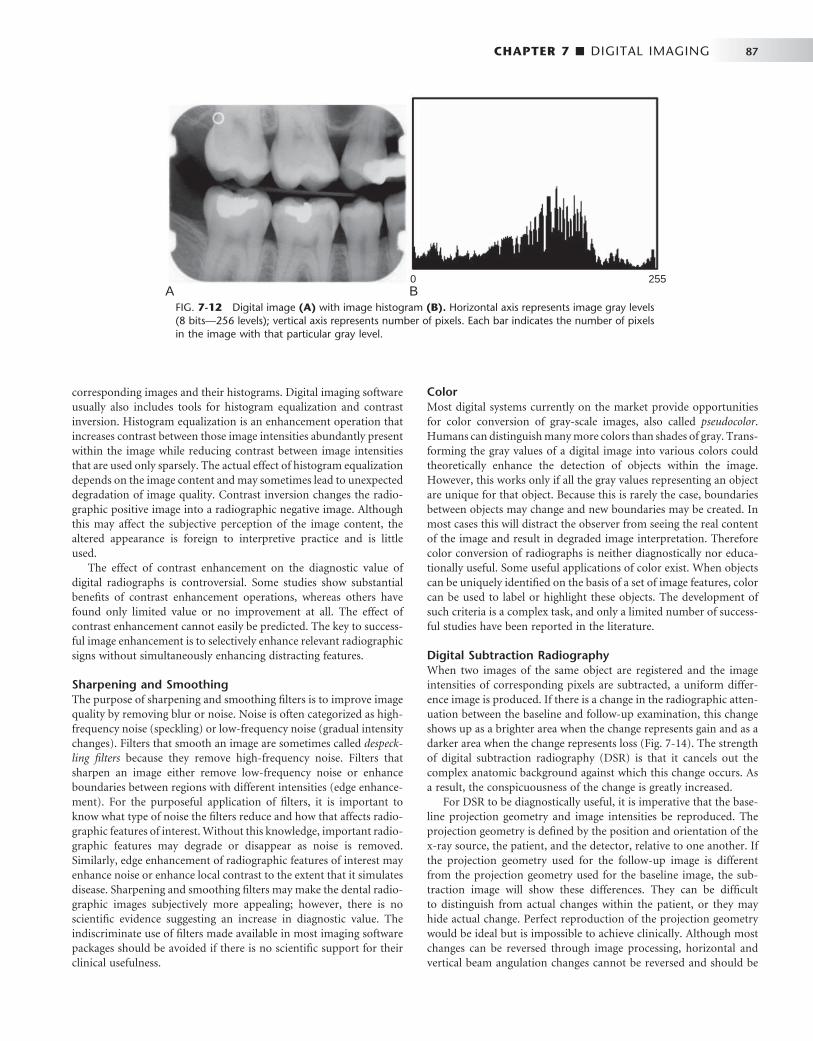
CHAPTER 7 ■ DIGITAL IMAGING 87
corresponding images and their histograms. Digital imaging software usually also includes tools for histogram equalization and contrast inversion. Histogram equalization is an enhancement operation that increases contrast between those image intensities abundantly present within the image while reducing contrast between image intensities that are used only sparsely. The actual effect of histogram equalization depends on the image content and may sometimes lead to unexpected degradation of image quality. Contrast inversion changes the radio-graphic positive image into a radiographic negative image. Although this may affect the subjective perception of the image content, the altered appearance is foreign to interpretive practice and is little used.
The effect of contrast enhancement on the diagnostic value of digital radiographs is controversial. Some studies show substantial benefi ts of contrast enhancement operations, whereas others have found only limited value or no improvement at all. The effect of contrast enhancement cannot easily be predicted. The key to success-ful image enhancement is to selectively enhance relevant radiographic signs without simultaneously enhancing distracting features.
Sharpening and Smoothing The purpose of sharpening and smoothing fi lters is to improve image quality by removing blur or noise. Noise is often categorized as high-frequency noise (speckling) or low-frequency noise (gradual intensity changes). Filters that smooth an image are sometimes called despeck-ling fi lters because they remove high-frequency noise. Filters that sharpen an image either remove low-frequency noise or enhance boundaries between regions with different intensities (edge enhance-ment). For the purposeful application of fi lters, it is important to know what type of noise the fi lters reduce and how that affects radio-graphic features of interest. Without this knowledge, important radio-graphic features may degrade or disappear as noise is removed. Similarly, edge enhancement of radiographic features of interest may enhance noise or enhance local contrast to the extent that it simulates disease. Sharpening and smoothing fi lters may make the dental radio-graphic images subjectively more appealing; however, there is no scientifi c evidence suggesting an increase in diagnostic value. The indiscriminate use of fi lters made available in most imaging software packages should be avoided if there is no scientifi c support for their clinical usefulness.
FIG. 7-12 Digital image (A) with image histogram (B). Horizontal axis represents image gray levels (8 bits — 256 levels); vertical axis represents number of pixels. Each bar indicates the number of pixels in the image with that particular gray level.
A B0 255
Color Most digital systems currently on the market provide opportunities for color conversion of gray-scale images, also called pseudocolor . Humans can distinguish many more colors than shades of gray. Trans-forming the gray values of a digital image into various colors could theoretically enhance the detection of objects within the image. However, this works only if all the gray values representing an object are unique for that object. Because this is rarely the case, boundaries between objects may change and new boundaries may be created. In most cases this will distract the observer from seeing the real content of the image and result in degraded image interpretation. Therefore color conversion of radiographs is neither diagnostically nor educa-tionally useful. Some useful applications of color exist. When objects can be uniquely identifi ed on the basis of a set of image features, color can be used to label or highlight these objects. The development of such criteria is a complex task, and only a limited number of success-ful studies have been reported in the literature.
Digital Subtraction Radiography When two images of the same object are registered and the image intensities of corresponding pixels are subtracted, a uniform differ-ence image is produced. If there is a change in the radiographic atten-uation between the baseline and follow-up examination, this change shows up as a brighter area when the change represents gain and as a darker area when the change represents loss ( Fig. 7-14 ). The strength of digital subtraction radiography (DSR) is that it cancels out the complex anatomic background against which this change occurs. As a result, the conspicuousness of the change is greatly increased.
For DSR to be diagnostically useful, it is imperative that the base-line projection geometry and image intensities be reproduced. The projection geometry is defi ned by the position and orientation of the x-ray source, the patient, and the detector, relative to one another. If the projection geometry used for the follow-up image is different from the projection geometry used for the baseline image, the sub-traction image will show these differences. They can be diffi cult to distinguish from actual changes within the patient, or they may hide actual change. Perfect reproduction of the projection geometry would be ideal but is impossible to achieve clinically. Although most changes can be reversed through image processing, horizontal and vertical beam angulation changes cannot be reversed and should be
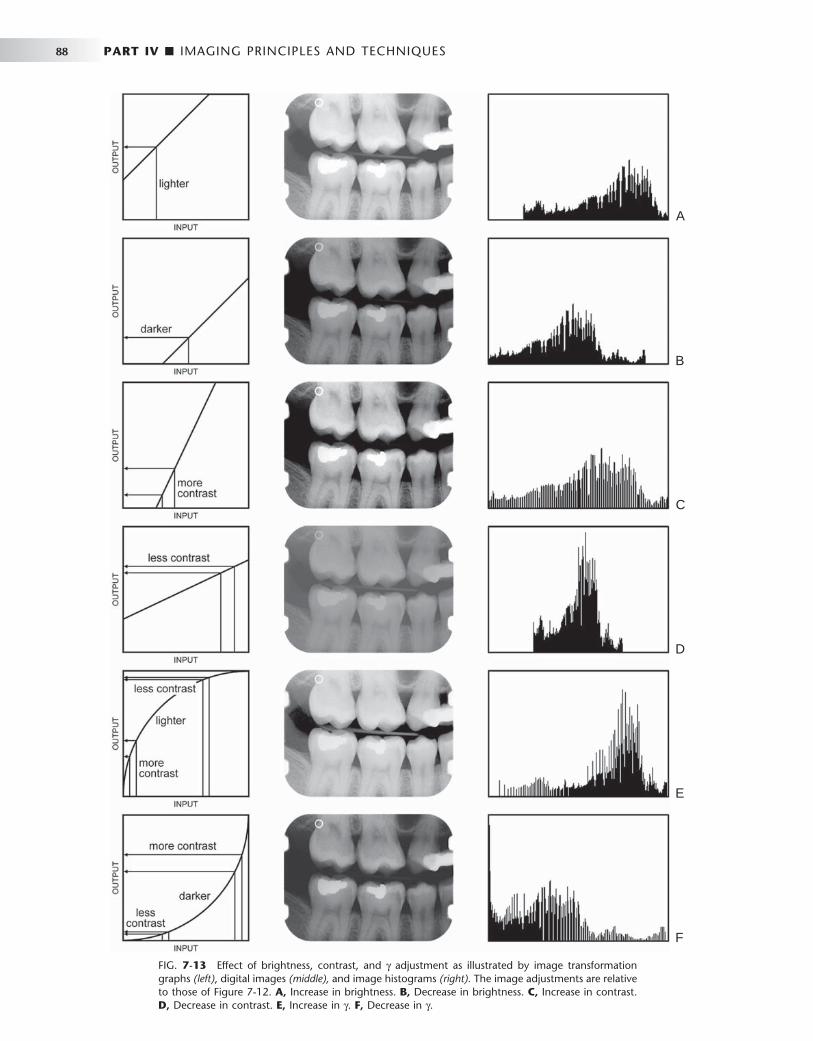
88 PART IV ■ IMAGING PRINCIPLES AND TECHNIQUES
FIG. 7-13 Effect of brightness, contrast, and γ adjustment as illustrated by image transformation graphs (left) , digital images (middle), and image histograms (right). The image adjustments are relative to those of Figure 7-12 . A, Increase in brightness. B, Decrease in brightness. C, Increase in contrast. D, Decrease in contrast. E, Increase in γ . F, Decrease in γ .
A
B
C
D
E
F

CHAPTER 7 ■ DIGITAL IMAGING 89
reproduced as accurately as possible. The actual tolerance of changes in the projection geometry depends on how much actual change needs to be detected. Although exact reproduction of the projection geometry is not strictly necessary, some form of mechanical standard-ization will reduce the reliance on image processing and will generally produce better results.
Subtraction images are well suited for acquiring quantitative infor-mation, such as linear, area, and density measurements. Methods used to make such measurements range from visual interpretation and manual measurement to computer-aided image analysis. Regardless of the analytic technique used, detecting and quantifying actual changes within a patient requires that factors affecting such measures be controlled.
IMAGE ANALYSIS
Image analysis operations are designed to extract diagnostically rele-vant information from the image. This information can range from simple linear measurements to fully automated diagnosis. The use of image analysis tools brings with it the responsibility to understand their limitations. The accuracy and precision of a measurement are limited by the extent to which the image is a truthful and reproducible representation of the patient and by the operator ’ s ability to make an exact measurement.
Measurement Digital imaging software provides a number of tools for image analy-sis. Digital rulers, densitometers, and a variety of other tools are readily available. These tools are usually digital equivalents of existing tools used in endodontics, orthodontics, periodontology, implantol-ogy, and other areas of dentistry ( Fig. 7-15 ). Digital imaging has also added new tools that were not available with fi lm-based radiography. The size and image intensity of any area within a digital radiograph can be measured. Tools are also being developed for measuring the complexity of the trabecular bone pattern. Such measurements can be useful as screening tools for osteoporosis assessment and for detect-ing other diseases.
Diagnosis One of the most challenging areas of research is the development of tools and procedures that automate the detection, classifi cation, and quantifi cation of radiographic signs of disease. The rationale for the use of such methods is to achieve early and accurate disease detection
by using reproducible and objective criteria. The development of automated image analysis operations is very complex and requires a thorough understanding of anatomy, pathology, and radiographic image formation. The three basic steps of image analysis are segmen-tation, feature extraction, and object classifi cation. Of these, segmen-tation is the most critical step. The goal of segmentation is to simplify the image and reduce it to its basic components. This involves sub-dividing the image, thus separating objects from the background. Objects of interest are defi ned by the diagnostic task, for example, a tooth, a carious lesion, a bone level, or an implant. When image seg-mentation results in the detection of an object, a variety of features can be measured that assist in determining what the object represents. Such features may include measures of size and shape, relative loca-tion, average density, homogeneity, and texture. A unique set of values for a certain combination of features can lead to classifi cation of the object. Automated cephalometric landmark identifi cation is an example of this technology. Other dental examples include caries detection, classifi cation of periodontal disease, and detection and
FIG. 7-14 Application of digital subtraction radiography for detection and quantifi cation of peri-odontal bone healing. A, Baseline image. B, Standardized 1-year follow-up image. C, Subtraction image showing increase in bone (arrow).
A B C
FIG. 7-15 Example of a measurement tool to determine the length of the crown and mesiobuccal root of the fi rst molar. The measurement has been calibrated for a magnifi cation factor of 1.05. The digital measurement tool is more versatile than the analog ruler; however, for both types of measurement tools, the apparent length remains depen-dent on the projection geometry.

90 PART IV ■ IMAGING PRINCIPLES AND TECHNIQUES
BOX 7-1
Digital Image Backup Considerations
• Type of backup media • Time and method of backup • Backup interval • Storage location of backup media • Recovery time • Recovery reliability • Future compatibility of backup technology
quantifi cation of periapical bone lesions. The success of many of these applications is highly dependent on specifi c imaging parameters. Very few provide reliable results when used clinically. This underscores the complexity of the radiographic image interpretation process.
Image Storage
The use of digital imaging in dentistry requires an image archiving and management system that is very different from that used for conventional radiography. Storage of diagnostic images on magnetic or optical media raises a number of new issues that must be consid-ered. The fi le size of dental digital radiographs varies considerably, ranging from approximately 200 kilobytes for intraoral images to as much as 6 megabytes for extraoral images. Storage and retrieval of these images in an average-sized dental practice is not a trivial issue. Fortunately, the development of new storage media and the continuing decrease in the price of a unit of storage has alleviated the capacity issue in dental radiography. The hard drive capacities of modern computers already exceed the storage needs of most dental practices.
The simplicity with which digital images can be modifi ed through image processing poses a potential risk with respect to ensuring the integrity of the diagnostic information. Once in a digital format, criti-cal image data can be deleted or modifi ed. It is important that the software prevents the user from permanently deleting or modifying original image data, whether intentional or unintentional. Not all software programs provide such a safeguard. As the use of digital imaging in dentistry continues to expand, the implementation of standards for preserving original image data becomes urgent. It is also imperative that images and other important patient-related informa-tion are regularly stored on secondary external media. The use of computers for storing critical patient information mandates the design and use of a backup protocol. Box 7-1 shows some issues that need to be considered when a backup protocol is designed. Backup media suitable for external storage of digital radiographs include external hard drives, digital tapes, CDs, and DVDs. Downloading of data by telephone or dedicated data lines to off-site commercial storage sites is available through a number of vendors and provides essentially unlimited storage and backup. All these technologies are low in cost and have demonstrated reasonable reliability.
The purpose of image compression is to reduce the size of digital image fi les for archiving or transmission. In particular, storing extra-oral images in a busy clinic may pose a challenge to storage capacity
and speed of image access. The purpose of fi le compression is to signifi cantly reduce the fi le size while preserving critical image information.
Compression methods are generally classifi ed as lossless or lossy. Lossless methods do not discard any image data, and an exact copy of the image is reproduced after decompression. Most compression tech-niques take advantage of redundancies in the image, which can be expressed in simpler terms. The maximum compression rate for loss-less compression is usually less than 3 : 1. Lossy compression methods achieve higher levels of compression by discarding image data. Empiric evidence suggests that this does not necessarily affect the diagnostic quality of an image. Compression rates of 12 : 1 and 14 : 1 were shown to have no appreciable effect on caries diagnosis. For determining endodontic fi le length, a rate of 25 : 1 was diagnostically equivalent to the uncompressed image. A compression rate of 28 : 1 was acceptable for the subjective evaluation of image quality and the detection of artifi cial lesions in panoramic radiographs.
Version 3.0 of the DICOM (Digital Imaging and Communications in Medicine) standard adopted JPEG (Joint Photographic Experts Group) as the compression method, which provides a range of com-pression levels. Other types of image compression methods, such as wavelet compression, are being investigated for their use in medical imaging. Although the use of low and medium levels of lossy com-pression appear to have little effect on the diagnostic value of dental images, the application of lossy compression should be used with caution and only after its effect for specifi c diagnostic tasks has been evaluated. With the continuing increase in the capacity of storage media and the widespread use of high-speed data communication lines, lossy compression of dental radiographs is rapidly becoming obsolete. At the same time, new digital image receptors are generating images with more and more pixels and more bits per pixel, thus increasing storage needs. Image compression negates to some extent the gain from such high-end detectors. Whether we need high resolu-tion detectors and whether we can use image compression should be dictated by diagnostic criteria. Current evidence suggests that detector quality and moderate image compression have a limited impact on diagnostic outcomes.
Systems Compatibility
The development of digital imaging systems for dental radiography has largely been driven by industry. Manufacturers have adopted and developed technologies according to individual needs and philoso-phies. As a result, image formats among systems from different vendors are not standardized, and image archival, retrieval, and display systems are often incompatible. Despite the proprietary nature of imaging software, it is possible to transfer images from one vendor ’ s system to the other. Most systems provide image export and import tools using a variety of generic image formats, such as JPEG and TIFF (tagged image fi le format). However, the process of transferring images through export-import procedures is cumbersome. It requires a number of steps, and the operator needs to ensure that the right images are imported into the proper patient folder. It can also not be assumed that the display and calibration of imported and native images will be the same.
Clearly, exporting and importing is not the method of choice when digital imaging is going to be used on a large scale. It has long been recognized that the adoption of a standard for transferring images and associated information between digital imaging devices in medicine

CHAPTER 7 ■ DIGITAL IMAGING 91
and dentistry is necessary. The American College of Radiology and the National Electrical Manufacturers Association formed a joint committee to develop a standard for digital imaging systems. A large number of professional organizations have contributed to this complex development process, which has resulted in the current standard, known as the Digital Imaging and Communications in Medicine (DICOM) standard. Various dental organizations, includ-ing the American Dental Association, are playing an active role in defi ning aspects of the standard related to dentistry. The DICOM standard is not a static set of rules dictating to manufacturers how to build imaging devices. Rather it is an evolving document address-ing the interoperability of medical and dental imaging and informa-tion systems. Manufacturers of digital imaging systems for dental radiography are responding to the call to adopt the DICOM standard. Not all systems are currently conforming to the DICOM standard, and those that do may not conform to every aspect of the standard. The successful adoption of digital imaging in dentistry requires interoperability of all devices. It is likely that manufacturers do not want to be left behind and that the market will weed out those that are noncompliant. Dentists using different vendors with DICOM-compliant imaging devices will be able to exchange images seamlessly.
Clinical Considerations
Some fundamental differences from fi lm in the clinical handling of digital receptors should be noted ( Table 7-1 ). Because digital receptors are intended to be reusable, they must be handled with greater care than their fi lm counterparts. Indeed, in certain situations fi lm may be intentionally damaged through bending to accommodate patient anatomy. This is never the case with digital receptors. Examples of common image artifacts found on images made with solid-state or PSP systems are shown in Box 7-2 . PSP plates are susceptible to bending and scratching during handling that induce permanent arti-facts in the receptor. These artifacts obscure information of potential diagnostic importance and may necessitate disposal of the receptor and repeat imaging of the patient. Because of the inability of digital detectors to be bent to accommodate patient anatomy, new imaging strategies must be used for some patients. It may not be possible to consistently capture the distal surface of the canine on premolar views. An additional projection may be required to adequately visual-ize this surface.
A signifi cant potential problem with most PSP systems is the inability to distinguish images from plates that have been exposed backward. Unlike fi lm packets, which incorporate a lead foil with
TABLE 7-1 Clinical Comparison of Intraoral Imaging Alternatives
IMAGING STEP FILM CCD/CMOS PSP
Receptor preparation
None (1) Place protective plastic sleeve over receptor
(2) Receptor must be connected to computer and patient identifying information entered for acquisition/archiving software
(1) “ Erase ” plates (2) Package plates in protective plastic
envelope
Receptor placement
(1) Numerous generic fi lm holding devices are available
(1) Specialized receptor holder specifi c for manufacturer ’ s receptor may limit options
(1) Many receptor holders used for fi lm may be adapted for PSP plates
(2) Film may be bent to accommodate anatomy
(2) Receptor infl exibility and bulk limit placement options
(2) Bending of receptor may irreversibly damage it
(3) Receptor cable must be carefully routed out of patient mouth
(4) Patient discomfort more likely than with fi lm or PSP
Exposure Simple exposure Computer must be activated before exposure
Simple exposure
Processing (1) Dark, light-safe environment in form of darkroom or daylight loader required
Image acquisition and display is almost immediate
(1) Dimly light environment desirable to prevent loss of image information
(2) Processor chemistry must be prepared or replenished
(3) Chemical temperature must be warmed, or processing time must be adjusted to accommodate temperature
(2) Processor must be programmed with patient and detector information so that images are identifi ed, preprocessed, and stored properly
(3) Protective wrapper must be removed from plates
(4) Films must be removed from wrapper; lead foil must be separated for recycling
(4) Plates must be loaded on drum systems
Continued
Text continued on p. 98.
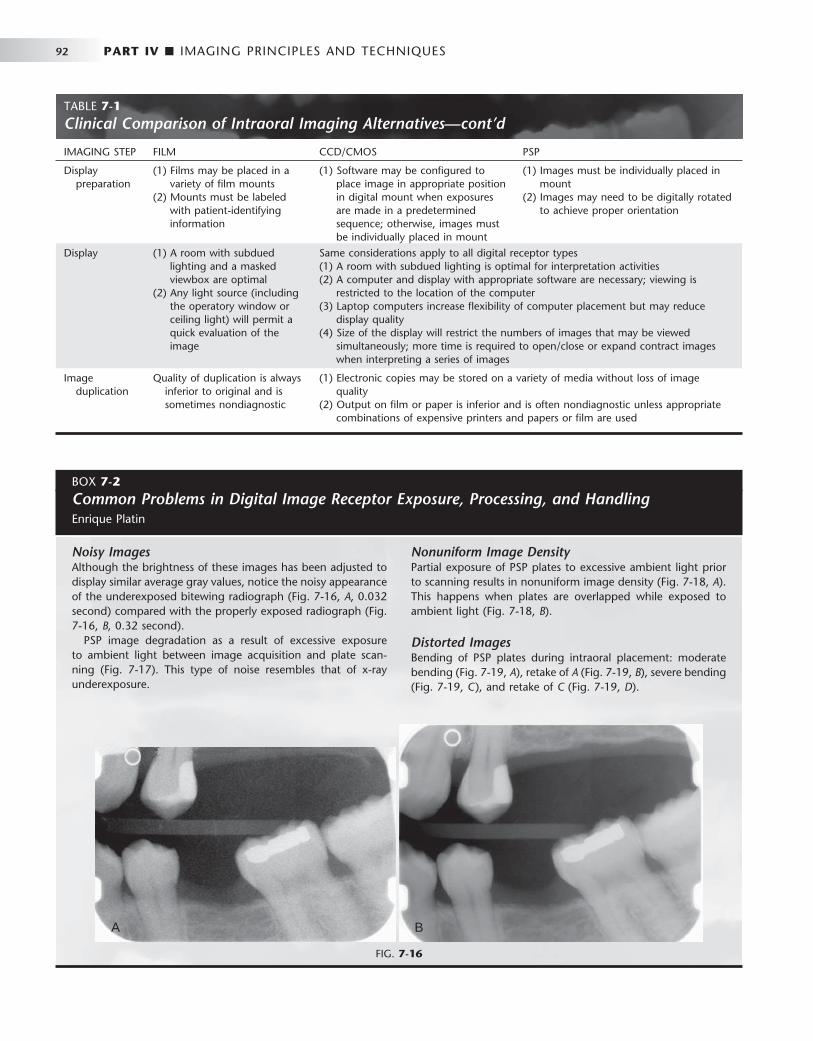
92 PART IV ■ IMAGING PRINCIPLES AND TECHNIQUES
BOX 7-2
Common Problems in Digital Image Receptor Exposure, Processing, and Handling Enrique Platin
Noisy Images Although the brightness of these images has been adjusted to display similar average gray values, notice the noisy appearance of the underexposed bitewing radiograph ( Fig. 7-16, A , 0.032 second) compared with the properly exposed radiograph ( Fig. 7-16, B, 0.32 second).
PSP image degradation as a result of excessive exposure to ambient light between image acquisition and plate scan-ning ( Fig. 7-17 ). This type of noise resembles that of x-ray underexposure.
Nonuniform Image Density Partial exposure of PSP plates to excessive ambient light prior to scanning results in nonuniform image density ( Fig. 7-18, A ). This happens when plates are overlapped while exposed to ambient light ( Fig. 7-18, B ).
Distorted Images Bending of PSP plates during intraoral placement: moderate bending ( Fig. 7-19, A ), retake of A ( Fig. 7-19, B ), severe bending ( Fig. 7-19, C ), and retake of C ( Fig. 7-19, D ).
FIG. 7-16
A B
IMAGING STEP FILM CCD/CMOS PSP
Display preparation
(1) Films may be placed in a variety of fi lm mounts
(2) Mounts must be labeled with patient-identifying information
(1) Software may be confi gured to place image in appropriate position in digital mount when exposures are made in a predetermined sequence; otherwise, images must be individually placed in mount
(1) Images must be individually placed in mount
(2) Images may need to be digitally rotated to achieve proper orientation
Display (1) A room with subdued lighting and a masked viewbox are optimal
(2) Any light source (including the operatory window or ceiling light) will permit a quick evaluation of the image
Same considerations apply to all digital receptor types (1) A room with subdued lighting is optimal for interpretation activities (2) A computer and display with appropriate software are necessary; viewing is
restricted to the location of the computer (3) Laptop computers increase fl exibility of computer placement but may reduce
display quality (4) Size of the display will restrict the numbers of images that may be viewed
simultaneously; more time is required to open/close or expand contract images when interpreting a series of images
Image duplication
Quality of duplication is always inferior to original and is sometimes nondiagnostic
(1) Electronic copies may be stored on a variety of media without loss of image quality
(2) Output on fi lm or paper is inferior and is often nondiagnostic unless appropriate combinations of expensive printers and papers or fi lm are used
TABLE 7-1 Clinical Comparison of Intraoral Imaging Alternatives—cont’d

CHAPTER 7 ■ DIGITAL IMAGING 93
FIG. 7-17
FIG. 7-18
A
B
Double Images PSP double image on incisor periapical radiograph resulting from incomplete erasure of previous image of posterior peri-apical region ( Fig. 7-20, A ) and retake ( Fig. 7-20, B ).
More examples of double images resulting from incomplete erasure of PSP receptors: posterior periapical radiograph with double image ( Fig. 7-21, A ), retake of A ( Fig. 7-21, B ), anterior periapical radiograph with double image ( Fig. 7-21, C ), and retake of C ( Fig. 7-21, D ).
Damaged Image Receptors Scratched phosphor surface mimicking root canal fi lling ( Fig. 7-22, A ) and retake ( Fig. 7-22, B ).
Image artifacts resulting from excessive bending of the PSP plate ( Fig. 7-23, A ) and excessive bending has resulted in per-manent damage to the phosphor plate ( Fig. 7-23, B ).
PSP circular artifact as a result of plate damage ( Fig. 7-24, A ) and localized swelling of the protective coating from disinfec-tant solution on work surface ( Fig. 7-24, B ).
PSP image artifact resulting from plate surface contamination ( Fig. 7-25, A ). This artifact was caused by a glove powder smudge that prevented proper scanning of the affected area of the PSP plate ( Fig. 7-25, B ). Contaminants combined with skin oils may permanently damage the phosphor plate surface.
Malfunctioning CCD sensor resulting from rough handling (dropped sensor). The sensor produces geometric image arti-facts ( Fig. 7-26, A and B ).
Improper Use of Image Processing Improper use of image processing tools, such as fi lters, may result in false-positive fi ndings. An edge enhancement fi lter was applied to the panoramic image, which produced radiolucen-cies at restoration edges simulating recurrent caries ( Fig. 7-27, A ). These radiolucencies are not present in a follow-up intraoral image ( Fig. 7-27, B ).
BOX 7-2
Common Problems in Digital Image Receptor Exposure, Processing, and Handling—cont’d
Continued

94 PART IV ■ IMAGING PRINCIPLES AND TECHNIQUES
A B
FIG. 7-20
FIG. 7-19
A B
C D
BOX 7-2
Common Problems in Digital Image Receptor Exposure, Processing, and Handling—cont’d
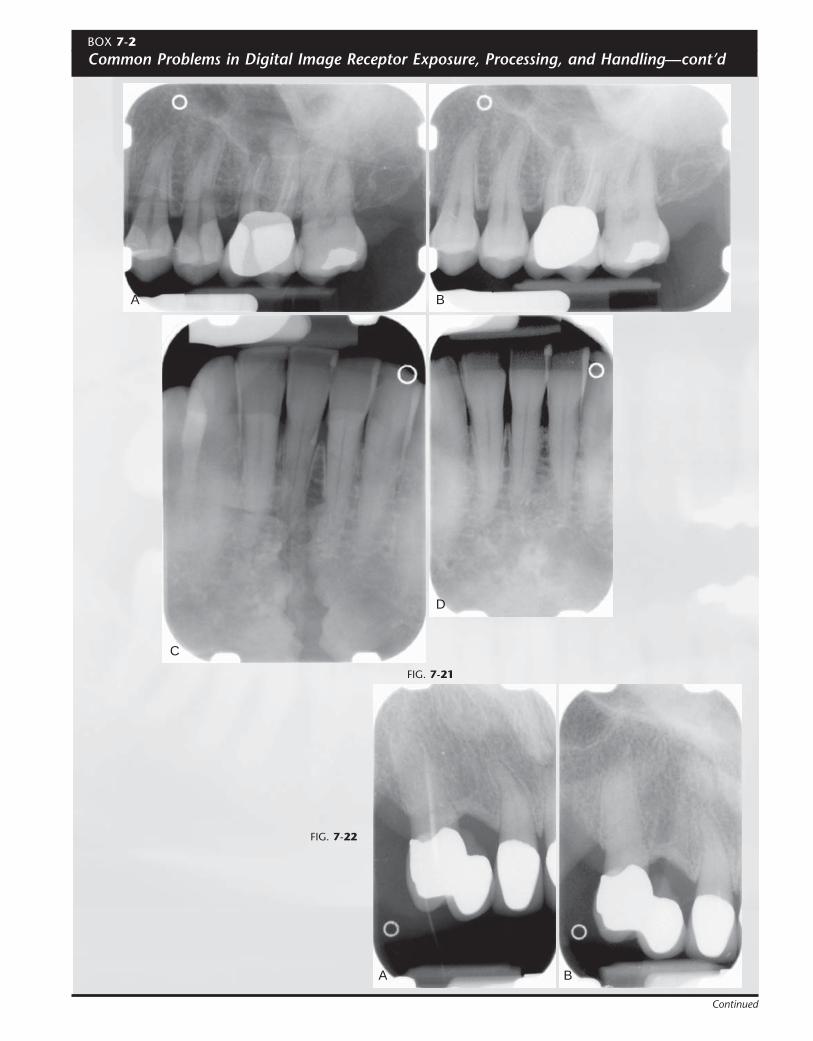
FIG. 7-21
A
C
B
D
FIG. 7-22
A B
BOX 7-2
Common Problems in Digital Image Receptor Exposure, Processing, and Handling—cont’d
Continued
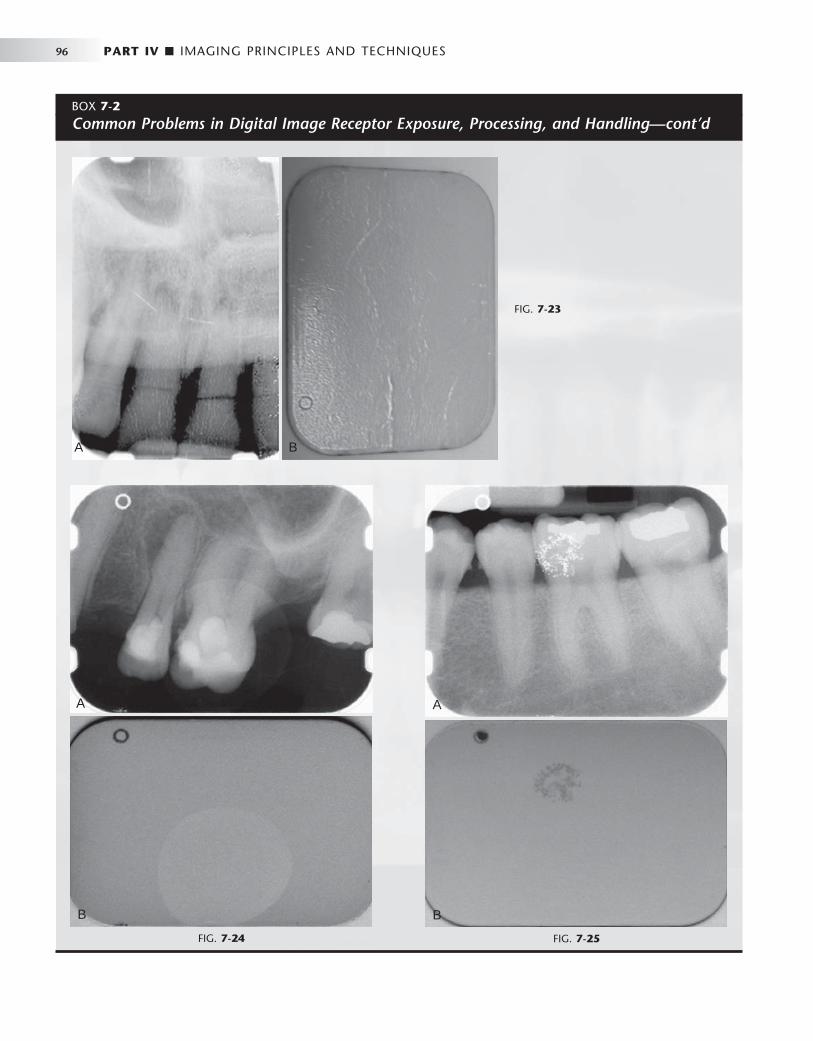
96 PART IV ■ IMAGING PRINCIPLES AND TECHNIQUES
FIG. 7-23
A B
FIG. 7-24
A
B
FIG. 7-25
A
B
BOX 7-2
Common Problems in Digital Image Receptor Exposure, Processing, and Handling—cont’d
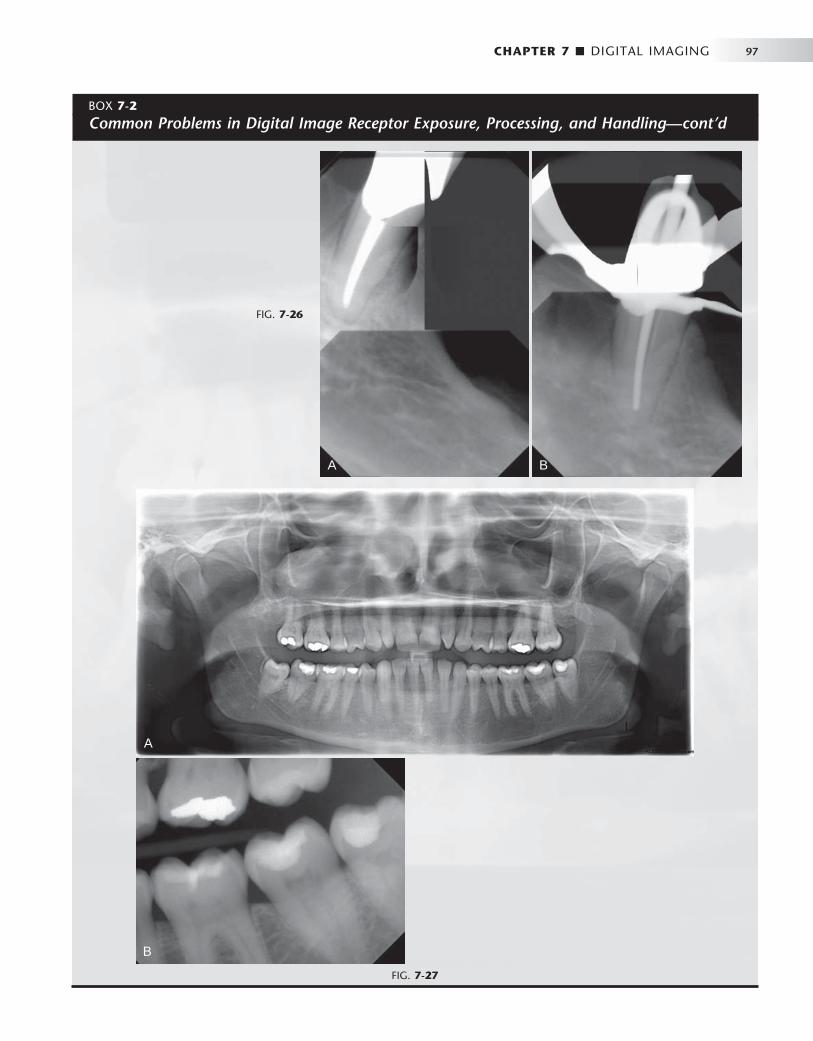
CHAPTER 7 ■ DIGITAL IMAGING 97
FIG. 7-26
A B
FIG. 7-27
A
B
BOX 7-2
Common Problems in Digital Image Receptor Exposure, Processing, and Handling—cont’d
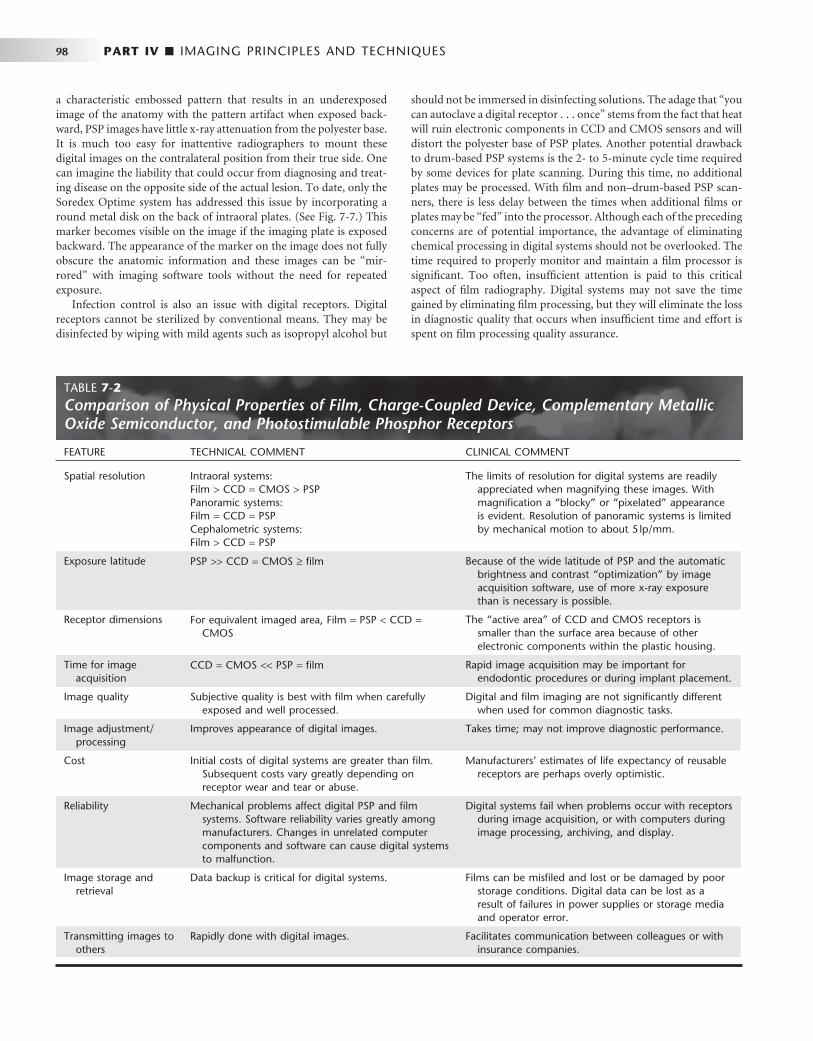
98 PART IV ■ IMAGING PRINCIPLES AND TECHNIQUES
TABLE 7-2 Comparison of Physical Properties of Film, Charge-Coupled Device, Complementary Metallic Oxide Semiconductor, and Photostimulable Phosphor Receptors
FEATURE TECHNICAL COMMENT CLINICAL COMMENT
Spatial resolution Intraoral systems: Film > CCD = CMOS > PSP Panoramic systems: Film = CCD = PSP Cephalometric systems: Film > CCD = PSP
The limits of resolution for digital systems are readily appreciated when magnifying these images. With magnifi cation a “ blocky ” or “ pixelated ” appearance is evident. Resolution of panoramic systems is limited by mechanical motion to about 5 lp/mm.
Exposure latitude PSP > > CCD = CMOS ≥ fi lm Because of the wide latitude of PSP and the automatic brightness and contrast “ optimization ” by image acquisition software, use of more x-ray exposure than is necessary is possible.
Receptor dimensions For equivalent imaged area, Film = PSP < CCD = CMOS
The “ active area ” of CCD and CMOS receptors is smaller than the surface area because of other electronic components within the plastic housing.
Time for image acquisition
CCD = CMOS < < PSP = fi lm Rapid image acquisition may be important for endodontic procedures or during implant placement.
Image quality Subjective quality is best with fi lm when carefully exposed and well processed.
Digital and fi lm imaging are not signifi cantly different when used for common diagnostic tasks.
Image adjustment/ processing
Improves appearance of digital images. Takes time; may not improve diagnostic performance.
Cost Initial costs of digital systems are greater than fi lm. Subsequent costs vary greatly depending on receptor wear and tear or abuse.
Manufacturers ’ estimates of life expectancy of reusable receptors are perhaps overly optimistic.
Reliability Mechanical problems affect digital PSP and fi lm systems. Software reliability varies greatly among manufacturers. Changes in unrelated computer components and software can cause digital systems to malfunction.
Digital systems fail when problems occur with receptors during image acquisition, or with computers during image processing, archiving, and display.
Image storage and retrieval
Data backup is critical for digital systems. Films can be misfi led and lost or be damaged by poor storage conditions. Digital data can be lost as a result of failures in power supplies or storage media and operator error.
Transmitting images to others
Rapidly done with digital images. Facilitates communication between colleagues or with insurance companies.
a characteristic embossed pattern that results in an underexposed image of the anatomy with the pattern artifact when exposed back-ward, PSP images have little x-ray attenuation from the polyester base. It is much too easy for inattentive radiographers to mount these digital images on the contralateral position from their true side. One can imagine the liability that could occur from diagnosing and treat-ing disease on the opposite side of the actual lesion. To date, only the Soredex Optime system has addressed this issue by incorporating a round metal disk on the back of intraoral plates. (See Fig. 7-7 .) This marker becomes visible on the image if the imaging plate is exposed backward. The appearance of the marker on the image does not fully obscure the anatomic information and these images can be “ mir-rored ” with imaging software tools without the need for repeated exposure.
Infection control is also an issue with digital receptors. Digital receptors cannot be sterilized by conventional means. They may be disinfected by wiping with mild agents such as isopropyl alcohol but
should not be immersed in disinfecting solutions. The adage that “ you can autoclave a digital receptor . . . once ” stems from the fact that heat will ruin electronic components in CCD and CMOS sensors and will distort the polyester base of PSP plates. Another potential drawback to drum-based PSP systems is the 2- to 5-minute cycle time required by some devices for plate scanning. During this time, no additional plates may be processed. With fi lm and non – drum-based PSP scan-ners, there is less delay between the times when additional fi lms or plates may be “ fed ” into the processor. Although each of the preceding concerns are of potential importance, the advantage of eliminating chemical processing in digital systems should not be overlooked. The time required to properly monitor and maintain a fi lm processor is signifi cant. Too often, insuffi cient attention is paid to this critical aspect of fi lm radiography. Digital systems may not save the time gained by eliminating fi lm processing, but they will eliminate the loss in diagnostic quality that occurs when insuffi cient time and effort is spent on fi lm processing quality assurance.

CHAPTER 7 ■ DIGITAL IMAGING 99
Conclusion
Dental practitioners commonly ask, “ Which is better, fi lm or digital imaging? ” There is no simple answer to this question ( Tables 7-1 and 7-2 ). Reported technical properties of resolution, contrast, and lati-tude are confounded by a lack of standardization in the assessment of these characteristics. From a diagnostic standpoint most studies suggest that digital performance is not clinically different from fi lm for typical diagnostic tasks such as caries diagnosis. The “ look and feel ” of digital displays is distinctly different from fi lm viewing, and some practitioners may fi nd this difference disconcerting. A basic understanding of computers and a mastery of common computing skills is essential for viewing digital images. Beyond this, learning the peculiarities and vagaries of a particular acquisition and display soft-ware will take time and may not be intuitive. Multiple mouse clicks through multiple menus may be required to view a full-mouth series of images. This may modestly increase the time required to complete the interpretative process.
In selecting an imaging system, other issues should be consid-ered. Digital images avoid environmental pollutants encountered with fi lm processing, but what about the environmental impact associated with the disposal of broken or obsolete electronic equip-ment? The initial fi nancial outlay for digital imaging hardware makes these systems more expensive than fi lm. Manufacturers are quick to point out that the costs of fi lm or digital systems should be amortized over the life of the equipment and consumables; however, the life expectancy of newer digital systems is highly spec-ulative. Mishandling of digital system components can catastrophi-cally shorten any projected life expectancy. And what price should we place on the ability to instantly transmit images and to integrate them into a fully electronic record? There are no universal answers to these questions. They must be asked and answered according to the needs and objectives of individual dental practices. As practice patterns and technology change with time, the answers will also change. Although the details of the image in our crystal ball have yet to resolve, the trends of increasing adoption of digital imaging
and continuing technologic innovation makes the future of digital imaging in dentistry certain.
BIBLIOGRAPHY DIGITAL DETECTORS AND DISPLAYS
1 Abreu M Jr , Mol A , Ludlow JB : Performance of RVGui sensor and Kodak Ektaspeed Plus fi lm for proximal caries detection , Oral Surg Oral Med Oral Pathol Oral Radiol Endod 91 : 381 - 385 , 2001 .
4 Couture RA , Hildebolt C : Quantitative dental radiography with a new photostimulable phosphor system , Oral Surg Oral Med Oral Pathol Oral Radiol Endod 89 : 498 - 508 , 2000 .
6 Hildebolt CF , Couture RA , Whiting BR : Dental photostimulable phosphor radiography , Dent Clin North Am 44 : 273 - 297 , 2000 .
8 Sanderink GC , Miles DA : Intraoral detectors: CCD, CMOS, TFT, and other devices , Dent Clin North Am 44 : 249 - 255 , v, 2000 .
9 Van der Stelt PF : Principles of digital imaging , Dent Clin North Am 44 : 237 - 248 , v, 2000 .
IMAGE PROCESSING
11 Analoui M : Radiographic image enhancement, I: spatial domain techniques , Dentomaxillofac Radiol 30 : 1 - 9 , 2001 .
12 Analoui M : Radiographic digital image enhancement, II: transform domain techniques , Dentomaxillofac Radiol 30 : 65 - 77 , 2001 .
13 Baxes GA : Digital image processing: principles and applications , New York , 1994 , John Wiley .
14 Gonzalez R , Wood R : Digital image processing , ed 3 , 2007 , Upper Saddle River, NJ , Prentice Hall .
15 Gr ö ndahl H-G , Gr ö ndahl K , Webber R : A digital subtraction technique for dental radiography , Oral Surg Oral Med Oral Pathol 55 : 96 - 102 , 1983 .
16 Lehmann T , Gr ö ndahl H-G , Benn D : Computer-based registration for digital subtraction in dental radiology , Dentomaxillofac Radiol 29 : 323 - 346 , 2000 .
17 Mol A : Image processing tools for dental applications , Dent Clin North Am 44 : 299 - 318 , 2000 .
18 Russ JC : The image process handbook , ed 4 , Boca Raton, Fla , 2002 , CRC Press .
19 Ruttimann U , Webber R , Schmidt E : A robust digital method for fi lm contrast correction in subtraction radiography , J Periodont Res 21 : 486 - 495 , 1986 .
C H A P T E R 8
Radiographic Quality Assurance and Infection Control
A quality assurance program in radiology is a series of proce-dures designed to ensure optimal and consistent operation of each component in the imaging chain. When all com-
ponents are functioning properly, the result is consistently high-quality radiographs made with low exposure to patients and offi ce personnel.
The goal of an infection control program in radiology is a series of procedures designed to avoid cross-contamination among patients and between patients and operators.
Radiographic Quality Assurance
Because radiographs are indispensable for patient diagnosis, the dentist must ensure that optimal exposure and fi lm processing condi-tions are maintained. To reach this goal, a quality assurance program includes evaluation of the performance of x-ray machines, manual and automatic processing procedures, image receptors, and viewing conditions. Optimization of these components results in the most diagnostic images and the lowest exposure for patients. It is best if one individual is given the responsibility for implementing the quality assurance program and to take corrective action when indicated. Most of these steps are quickly accomplished yet can have a signifi cant infl uence on radiographic quality ( Box 8-1 ).
DAILY TASKS
Several tasks should be performed daily to ensure excellent radio-graphs.
Compare Radiographs with Reference Film One of the most common causes of poor radiographs is poor fi lm processing in the darkroom, in particular the use of depleted solu-tions. A simple and effective means for constant monitoring of the quality of images produced in an offi ce is to check daily fi lms against a reference fi lm. Soon after fi lm-processing solutions are replaced, mount a patient fi lm that has been properly exposed and processed with exact time-temperature technique on a corner of the viewbox. This image, with optimal density and contrast, serves as a reference for the radiographs made in the following days and weeks ( Fig. 8-1 ). All subsequent images should be compared with this refer-ence fi lm.
Comparison of daily images with the reference fi lm may reveal problems before they interfere with the diagnostic quality of the images. When a problem is identifi ed, it is important to determine the probable source and to take corrective action. For instance, if the processing solutions have become depleted, the resultant radiographs
are light and have reduced contrast. Both developer and fi xer should be changed when degradation of the image quality is evident. Light images may also result from cold solutions or insuffi cient developing time. Dark images may be caused by excessive developing time, devel-oper that is too warm, or light leaks.
There are two methods that are more accurate than a reference fi lm but require additional equipment and more time to perform. These are sensitometry/densitometry and the use of a step wedge.
Make Step-Wedge Test of Processing System The most accurate and rigorous method of testing fi lm-processing solutions is to use a sensitometer and densitometer. A sensitometer exposes fi lm to a calibrated light pattern. After processing, a densi-tometer is used to measure the optical density of each step in the test pattern of the fi lm exposed by the sensitometer. A change in the density readings from day to day indicates a problem in the darkroom.
For most dental offi ces a variation of this method using a step-wedge test provides accurate monitoring of day-to-day processing conditions. This information is used to measure the speed of the imaging system and image contrast. Both are sensitive measures of the processing environment. A step wedge is readily made with the lead foil from fi lm packets. Stack fi ve sheets together and staple at one end ( Fig. 8-2 ). Cut off four fi fths of the top layer, three fi fths of the second layer, two fi fths of the third layer, and one fi fth of the fourth layer to create a fi ve-step wedge. Lay the wedge on top of a fi lm packet and expose with the usual setting for an adult bitewing view. The resultant image should show fi ve steps from dark to light. Save the fi rst fi lm after changing to fresh processing solution for comparison with images made on subsequent days. Monitor the processing solutions at the beginning of each day with a step-wedge image to ensure that the processing system is operational for patient care.
Enter Findings in Retake Log Another simple and effective means of reducing the number of faulty radiographs is to keep a retake log. Record all errors for images that must be re-exposed.
Replenish Processing Solutions At the beginning of each work day, check the levels of the processing solutions and replenish if necessary. Replenish the developer with fresh developing solution and the fi xer with fresh fi xing solution.
Check Temperature of Processing Solutions At the beginning of each work day, check the temperature of the processing solutions. The solutions must reach the optimal
100

CHAPTER 8 ■ RADIOGRAPHIC QUALITY ASSURANCE AND INFECTION CONTROL 101
temper ature before use — 68 ° F (20 ° C) for manual processing and 82 ° F (28 ° C) for heated automatic processors. The instructions accompanying the fi lm and processor verify the optimal temperature. Unheated automatic processors should be located away from win-dows or heaters that may cause their temperature to vary during the day. Proper temperature regulation is required for accurate time-temperature processing.
WEEKLY TASKS
Replace Processing Solutions The replacement frequency of processing solutions depends primarily on the rate of use of the solutions but also on the size of tanks, whether a cover is used, and the temperature of the solutions. In most offi ces the solutions should be changed weekly or every other week. The results of the step-wedge test will help determine the proper frequency.
Clean Processing Equipment Regular cleaning of the processing equipment is necessary for optimal operation. Clean the solution tanks of manual and automatic process-ing equipment when the solutions are changed. Clean the rollers of automatic fi lm processors weekly according to the manufacturer ’ s instructions. After cleaning, rinse the tanks and rollers twice as long as the manufacturer recommends to prevent the cleaner from interfer-ing with the action of the fi lm-processing solutions.
BOX 8-1
Schedule of Radiographic Quality Assurance Procedures
Daily • Check processing by comparing radiographs with refer-
ence fi lm or with step wedge • Enter causes of retakes in a log • Replenish processing solutions • Check temperature of processing solutions
Weekly • Replace processing solutions • Clean processing equipment • Clean viewboxes • Review retake log
Monthly • Check darkroom safelighting • Clean intensifying screens • Rotate fi lm stock • Check exposure charts • Inspect leaded aprons and thyroid collars
Yearly • Calibrate x-ray machine
FIG. 8-1 Radiographs should be checked daily against a reference fi lm made with fresh solutions. As processing solutions become exhausted, the daily images become increasingly light and lose con-trast. When these changes are clear, both the developer and the fi xer should be changed. (Courtesy C.L. Crabtree, DDS, Bureau of Radiologi-cal Health, Rockville, Md.)
FIG. 8-2 A, Step wedge made of strips of lead foil from fi lm packets. This step wedge is positioned over a fi lm, and an exposure is made. B, Processed radiograph showing each step. Such an image should be made daily after replenishing processing solutions and compared with an image made with fresh solutions. When the step wedge has become one full step lighter, it is time to change both the developer and the fi xer.
A B
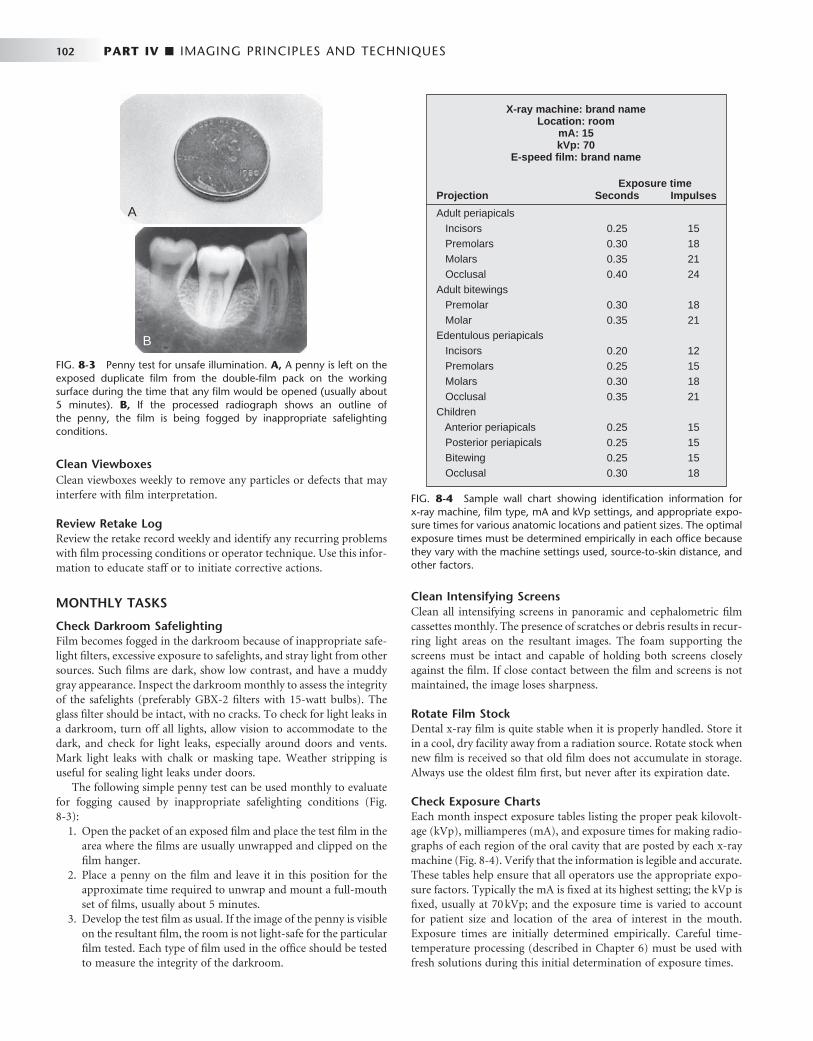
102 PART IV ■ IMAGING PRINCIPLES AND TECHNIQUES
Clean Viewboxes Clean viewboxes weekly to remove any particles or defects that may interfere with fi lm interpretation.
Review Retake Log Review the retake record weekly and identify any recurring problems with fi lm processing conditions or operator technique. Use this infor-mation to educate staff or to initiate corrective actions.
MONTHLY TASKS
Check Darkroom Safelighting Film becomes fogged in the darkroom because of inappropriate safe-light fi lters, excessive exposure to safelights, and stray light from other sources. Such fi lms are dark, show low contrast, and have a muddy gray appearance. Inspect the darkroom monthly to assess the integrity of the safelights (preferably GBX-2 fi lters with 15-watt bulbs). The glass fi lter should be intact, with no cracks. To check for light leaks in a darkroom, turn off all lights, allow vision to accommodate to the dark, and check for light leaks, especially around doors and vents. Mark light leaks with chalk or masking tape. Weather stripping is useful for sealing light leaks under doors.
The following simple penny test can be used monthly to evaluate for fogging caused by inappropriate safelighting conditions ( Fig. 8-3 ):
1. Open the packet of an exposed fi lm and place the test fi lm in the area where the fi lms are usually unwrapped and clipped on the fi lm hanger.
2. Place a penny on the fi lm and leave it in this position for the approximate time required to unwrap and mount a full-mouth set of fi lms, usually about 5 minutes.
3. Develop the test fi lm as usual. If the image of the penny is visible on the resultant fi lm, the room is not light-safe for the particular fi lm tested. Each type of fi lm used in the offi ce should be tested to measure the integrity of the darkroom.
Clean Intensifying Screens Clean all intensifying screens in panoramic and cephalometric fi lm cassettes monthly. The presence of scratches or debris results in recur-ring light areas on the resultant images. The foam supporting the screens must be intact and capable of holding both screens closely against the fi lm. If close contact between the fi lm and screens is not maintained, the image loses sharpness.
Rotate Film Stock Dental x-ray fi lm is quite stable when it is properly handled. Store it in a cool, dry facility away from a radiation source. Rotate stock when new fi lm is received so that old fi lm does not accumulate in storage. Always use the oldest fi lm fi rst, but never after its expiration date.
Check Exposure Charts Each month inspect exposure tables listing the proper peak kilovolt-age (kVp), milliamperes (mA), and exposure times for making radio-graphs of each region of the oral cavity that are posted by each x-ray machine ( Fig. 8-4 ). Verify that the information is legible and accurate. These tables help ensure that all operators use the appropriate expo-sure factors. Typically the mA is fi xed at its highest setting; the kVp is fi xed, usually at 70 kVp; and the exposure time is varied to account for patient size and location of the area of interest in the mouth. Exposure times are initially determined empirically. Careful time-temperature processing (described in Chapter 6 ) must be used with fresh solutions during this initial determination of exposure times.
FIG. 8-3 Penny test for unsafe illumination. A, A penny is left on the exposed duplicate fi lm from the double-fi lm pack on the working surface during the time that any fi lm would be opened (usually about 5 minutes). B, If the processed radiograph shows an outline of the penny, the fi lm is being fogged by inappropriate safelighting conditions.
A
B
FIG. 8-4 Sample wall chart showing identifi cation information for x-ray machine, fi lm type, mA and kVp settings, and appropriate expo-sure times for various anatomic locations and patient sizes. The optimal exposure times must be determined empirically in each offi ce because they vary with the machine settings used, source-to-skin distance, and other factors.
0.250.300.350.40
0.300.35
0.200.250.300.35
0.250.250.250.30
15182124
1821
12151821
15151518
Adult periapicals Incisors Premolars Molars OcclusalAdult bitewings Premolar MolarEdentulous periapicals Incisors Premolars Molars OcclusalChildren Anterior periapicals Posterior periapicals Bitewing Occlusal
X-ray machine: brand nameLocation: room
mA: 15kVp: 70
E-speed film: brand name
Exposure timeSeconds ImpulsesProjection
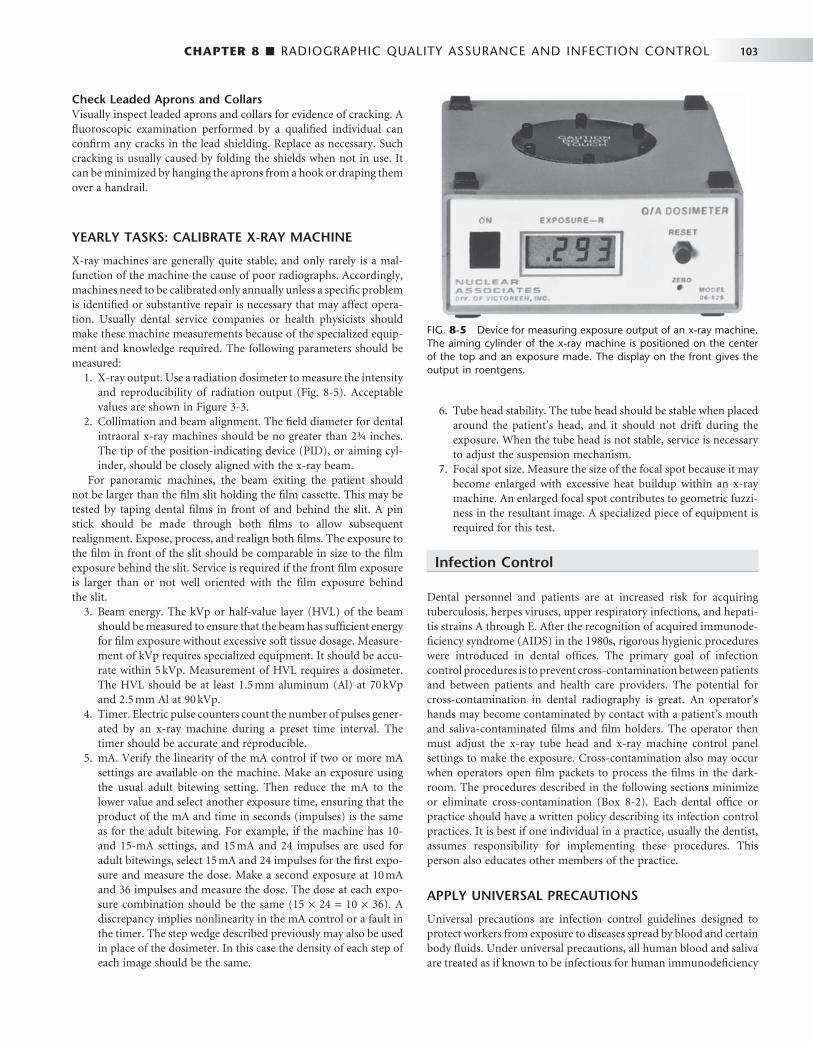
CHAPTER 8 ■ RADIOGRAPHIC QUALITY ASSURANCE AND INFECTION CONTROL 103
Check Leaded Aprons and Collars Visually inspect leaded aprons and collars for evidence of cracking. A fl uoroscopic examination performed by a qualifi ed individual can confi rm any cracks in the lead shielding. Replace as necessary. Such cracking is usually caused by folding the shields when not in use. It can be minimized by hanging the aprons from a hook or draping them over a handrail.
YEARLY TASKS: CALIBRATE X-RAY MACHINE
X-ray machines are generally quite stable, and only rarely is a mal-function of the machine the cause of poor radiographs. Accordingly, machines need to be calibrated only annually unless a specifi c problem is identifi ed or substantive repair is necessary that may affect opera-tion. Usually dental service companies or health physicists should make these machine measurements because of the specialized equip-ment and knowledge required. The following parameters should be measured:
1. X-ray output. Use a radiation dosimeter to measure the intensity and reproducibility of radiation output ( Fig. 8-5 ). Acceptable values are shown in Figure 3-3 .
2. Collimation and beam alignment. The fi eld diameter for dental intraoral x-ray machines should be no greater than 2¾ inches. The tip of the position-indicating device (PID), or aiming cyl-inder, should be closely aligned with the x-ray beam.
For panoramic machines, the beam exiting the patient should not be larger than the fi lm slit holding the fi lm cassette. This may be tested by taping dental fi lms in front of and behind the slit. A pin stick should be made through both fi lms to allow subsequent realignment. Expose, process, and realign both fi lms. The exposure to the fi lm in front of the slit should be comparable in size to the fi lm exposure behind the slit. Service is required if the front fi lm exposure is larger than or not well oriented with the fi lm exposure behind the slit.
3. Beam energy. The kVp or half-value layer (HVL) of the beam should be measured to ensure that the beam has suffi cient energy for fi lm exposure without excessive soft tissue dosage. Measure-ment of kVp requires specialized equipment. It should be accu-rate within 5 kVp. Measurement of HVL requires a dosimeter. The HVL should be at least 1.5 mm aluminum (Al) at 70 kVp and 2.5 mm Al at 90 kVp.
4. Timer. Electric pulse counters count the number of pulses gener-ated by an x-ray machine during a preset time interval. The timer should be accurate and reproducible.
5. mA. Verify the linearity of the mA control if two or more mA settings are available on the machine. Make an exposure using the usual adult bitewing setting. Then reduce the mA to the lower value and select another exposure time, ensuring that the product of the mA and time in seconds (impulses) is the same as for the adult bitewing. For example, if the machine has 10- and 15-mA settings, and 15 mA and 24 impulses are used for adult bitewings, select 15 mA and 24 impulses for the fi rst expo-sure and measure the dose. Make a second exposure at 10 mA and 36 impulses and measure the dose. The dose at each expo-sure combination should be the same (15 × 24 = 10 × 36). A discrepancy implies nonlinearity in the mA control or a fault in the timer. The step wedge described previously may also be used in place of the dosimeter. In this case the density of each step of each image should be the same.
6. Tube head stability. The tube head should be stable when placed around the patient ’ s head, and it should not drift during the exposure. When the tube head is not stable, service is necessary to adjust the suspension mechanism.
7. Focal spot size. Measure the size of the focal spot because it may become enlarged with excessive heat buildup within an x-ray machine. An enlarged focal spot contributes to geometric fuzzi-ness in the resultant image. A specialized piece of equipment is required for this test.
Infection Control
Dental personnel and patients are at increased risk for acquiring tuberculosis, herpes viruses, upper respiratory infections, and hepati-tis strains A through E. After the recognition of acquired immunode-fi ciency syndrome (AIDS) in the 1980s, rigorous hygienic procedures were introduced in dental offi ces. The primary goal of infection control procedures is to prevent cross-contamination between patients and between patients and health care providers. The potential for cross-contamination in dental radiography is great. An operator ’ s hands may become contaminated by contact with a patient ’ s mouth and saliva-contaminated fi lms and fi lm holders. The operator then must adjust the x-ray tube head and x-ray machine control panel settings to make the exposure. Cross-contamination also may occur when operators open fi lm packets to process the fi lms in the dark-room. The procedures described in the following sections minimize or eliminate cross-contamination ( Box 8-2 ). Each dental offi ce or practice should have a written policy describing its infection control practices. It is best if one individual in a practice, usually the dentist, assumes responsibility for implementing these procedures. This person also educates other members of the practice.
APPLY UNIVERSAL PRECAUTIONS
Universal precautions are infection control guidelines designed to protect workers from exposure to diseases spread by blood and certain body fl uids. Under universal precautions, all human blood and saliva are treated as if known to be infectious for human immunodefi ciency
FIG. 8-5 Device for measuring exposure output of an x-ray machine. The aiming cylinder of the x-ray machine is positioned on the center of the top and an exposure made. The display on the front gives the output in roentgens.

104 PART IV ■ IMAGING PRINCIPLES AND TECHNIQUES
virus (HIV) and hepatitis B virus. Accordingly, the means used to protect against cross-contamination are used universally, that is, for all individuals. The American Dental Association and the Centers for Disease Control and Prevention stress the use of universal precautions because many patients are unaware that they are carriers of infectious disease or choose not to reveal this information.
Wear Gloves During All Radiographic Procedures The practitioner should always wear gloves when making radiographs or handling contaminated fi lm packets or associated materials such as cotton rolls and fi lm-holding instruments or when removing barrier protections from surfaces and radiographic equipment. After the patient is seated, the practitioner should wash his or her hands and put on disposable gloves in sight of the patient if the operatory arrangement permits. Dental assistants should wear eyewear or a mask or faceshield if exposure to bodily fl uids is anticipated.
Charts should be kept away from sources of contamination and not handled during the radiographic examination. Chair adjustments should be made in advance, or adjustments should be made on control surfaces that are covered, such as the headrest control.
Disinfect and Cover X-Ray Machine, Working Surfaces, Chair, and Apron The goal of preventing cross-contamination is addressed in part by disinfecting all surfaces and by using barriers to isolate equipment
from direct contact. Although barriers greatly aid infection control, they do not replace the need for effective surface cleaning and disin-fection. Experience has demonstrated that, during the daily activity of treatment, failure of mechanical barriers is common. It is advanta-geous and reassuring to the operator to know that whenever this happens, the surfaces that may become accidentally exposed are clean and disinfected. Any surface that may be contaminated should be surface disinfected. This includes the x-ray machine control panel, tube head, and beam alignment device, dental chair and headrest, surfaces on which fi lm is placed, leaded apron and thyroid collar, and the doorknob of the operatory. Operators should avoid touching walls and other surfaces with contaminated gloves. Good surface dis-infectants include iodophors, chlorines, and synthetic phenolic compounds. Although the American Dental Association does not recommend specifi c chemical disinfectants and sterilants, it does suggest that when dentists use a chemical agent for disinfection or sterilization, the agent should be an Environmental Protection Agency (EPA) registered hospital disinfectant of low to intermediate activity. The agent should also be tuberculocidal — an effective killer of tuberculosis — and capable of preventing other infectious diseases, including hepatitis B and HIV.
Barriers should cover working surfaces that were previously cleaned and disinfected. Barriers protect the underlying surface from becoming contaminated. An effective barrier for the countertops and x-ray control console is plastic wrap, which may be conveniently stored in a butcher ’ s paper dispenser mounted on a wall ( Fig. 8-6 ). When covering the x-ray control console, the operator should be sure to include the exposure switch and the exposure time control if they are integral parts of the unit ( Fig. 8-7 ). An x-ray exposure switch that is independent of the console should be covered with a sandwich bag or food storage bag or wrapped with plastic wrap.
The dental chair headrest, headrest adjustments, and chair back may be easily covered with a plastic bag ( Fig. 8-8 ). The x-ray tube head, PID, and yoke should be covered while they are still wet with disinfectant with a barrier to stop any dripping ( Fig. 8-9 ). The bag
BOX 8-2
Key Steps in Radiographic Infection Control
Apply universal precautions • Wear gloves during all radiographic procedures • Disinfect and cover x-ray machine, working surfaces,
chair, and apron • Sterilize nondisposable instruments • Use barrier-protected fi lm (sensor) or disposable con-
tainer • Prevent contamination of processing equipment
FIG. 8-6 Plastic wrap from a dispenser is used to cover countertops and the x-ray machine console.
FIG. 8-7 Plastic wrap covers parts of console that are touched during the radiographic examination.

CHAPTER 8 ■ RADIOGRAPHIC QUALITY ASSURANCE AND INFECTION CONTROL 105
should be secured by tying a knot in the open end or by placing a heavy rubber band over the x-ray tube head just proximal to the swivel. Also, the leaded apron should be cleaned, disinfected, and covered between patients because it is frequently contaminated with saliva as the result of handling (readjusting its position) during a radiographic procedure. The apron should be suspended on a heavy coat hanger to permit turning front to back. It should be sprayed with a detergent-containing disinfectant and then wiped and covered with the same type of plastic garment bag used for the x-ray head and chair back ( Fig. 8-10 ). The operatory is now prepared for radiography.
Panoramic and cephalometric equipment should receive the same maintenance for decontamination and disinfection as other equip-ment. Panoramic bite blocks, chin rest, and patient handgrips should be cleaned with detergent-iodine disinfectant and covered with a plastic bag. Disposable bite blocks may be used. The head-positioning guides, control panel, and exposure switch should be carefully wiped with a paper towel that is well moistened with disinfectant. The radiographer should wear disposable gloves while positioning and exposing the patient. The gloves should be removed before the cassette is removed from the machine for processing because the cassette and fi lm remain extraoral and should not be handled with contaminated disposable gloves. Cephalostat ear posts, ear post brackets, and forehead support or nasion pointer should be cleaned and disinfected with iodine-detergent disinfectant. These may then also be covered in plastic.
After patient exposures are completed, the barriers should be removed, contaminated working surfaces (including those in the darkroom) and the apron sprayed with disinfectant and wiped as described previously. Then the barriers should be replaced in prepara-tion for the next patient.
Sterilize Nondisposable Instruments It is best to use fi lm-holding instruments that are heat sterilizable. After sterilization, the instruments should be kept in bags for storage and subsequent transport to the radiography area. When the instru-ments are taken to the radiography area, it is good technique to remove them from the bag immediately before use. After use, instru-
FIG. 8-8 A new plastic bag is placed over the chair and headrest for each patient.
FIG. 8-9 A plastic bag is slipped over the x-ray tube head with a large rubber band just proximal to the swivel or tie ends, as shown here. The plastic is pulled tight over the PID and secured with a light rubber band slipped over the PID and placed next to the head.
FIG. 8-10 Hanging apron is sprayed with disinfectant and then dried and covered with a garment bag.
ments should be replaced in the bag to reinforce cleanliness in the area. The same sterilization bag should be used to transport the con-taminated instruments back to the cleaning and sterilizing room.
Use Barrier-Protected Film (Sensor) or Disposable Container Film should be obtained in advance from a central source. To prevent contamination of bulk supplies of fi lm, they should be dispensed in procedure quantities. The required number of fi lms for a full-mouth or interproximal series should be prepackaged in coin envelopes or paper cups in the central preparation room. These envelopes of fi lms should be dispensed with the fi lm-holding instruments. For unantici-pated occasions in which an unusual number of fi lms are required, a small container of fi lms can be on hand in the central preparation and sterilizing room. No one wearing contaminated gloves should retrieve

106 PART IV ■ IMAGING PRINCIPLES AND TECHNIQUES
opened, allowing the fi lm to drop out. The barrier envelopes can be conveniently opened in a lighted area, the fi lm dropped onto a clean work area or into a clean paper or plastic cup, and the fi lm transferred to the daylight loader or darkroom for processing.
If barrier-protected fi lm is not used, the exposed fi lm should be placed in a disposable container for later transport to the darkroom for processing. Paper fi lm packets are exposed to saliva and possibly blood during exposure in the patient ’ s mouth. To prevent saliva from seeping into a paper fi lm packet, a paper towel should be placed beside the container for exposed fi lms. The practitioner should use this towel to wipe each fi lm as it is removed from the patient ’ s mouth and before it is placed with the other exposed fi lms. This problem may also be avoided by using fi lm packaged in vinyl.
Sensors for digital imaging are not able to be sterilized; thus it is important to use a barrier to protect them from contamination when placed in the patient ’ s mouth ( Fig. 8-12 ). Typically the manufacturers of these sensors recommend the use of plastic barrier sheaths. The supplemental use of latex fi nger cots provides signifi cant added pro-tection and is recommended for routine use when using digital sensors. Because such barriers may fail, the sensors should be cleaned and disinfected with an EPA-registered intermediate-level hospital disinfectant after every patient. The manufacturer of such equipment should be consulted for proper disinfectant.
Prevent Contamination of Processing Equipment After all exposures are made, the operator should remove his or her gloves and take the container of contaminated fi lms to the darkroom. The goal in the darkroom is to break the infection chain so that only clean fi lms are placed into processing solutions. Two towels should be placed on the darkroom working surface. The container of contami-nated fi lms should be placed on one of these towels. After the exposed fi lm is removed from its packet, it should be placed on the second towel. The fi lm packaging is discarded on the fi rst towel with the container.
Removing fi lm from a packet without touching (contaminating) it is a relatively simple procedure. Figure 8-13 illustrates the method
FIG. 8-11 Dental fi lm with a plastic barrier to protect fi lm from contact with saliva. A, Note notch on side of plastic envelope for opening. B, During opening, the plastic is removed and the clean fi lm allowed to drop into a container.
A B
FIG. 8-12 Film-holding instrument with barrier wrapping protecting sensor and cord from saliva.
a fi lm from this supply. Films should be dispensed only by staff members with clean hands or wearing clean gloves.
Film packets may be packaged in a plastic envelope ( Fig. 8-11 ), which protects the fi lm from contact with saliva and blood during exposure. Barrier-protected fi lm fi ts in most fi lm-holding instru-ments. An attractive feature of the protective envelopes is the ease with which they may be opened and the fi lm extracted. For best results, the packet should be immersed in a disinfectant after the fi lms have been exposed in the patient ’ s mouth. Then the packet should be dried and

CHAPTER 8 ■ RADIOGRAPHIC QUALITY ASSURANCE AND INFECTION CONTROL 107
FIG. 8-13 Method for removing fi lms from packet without touching them with contaminated gloves. A, Packet tab is opened and lead foil and black interleaf paper are slid from wrapping. B, Foil is rotated away from black paper and discarded. C, Paper wrapping is opened. D, Film falls into a clean cup.
A B
C D
for opening a contaminated fi lm packet while wearing contami-nated gloves without touching the fi lm. The practitioner dons a clean pair of gloves, picks up the fi lm packet by the color-coded end, and pulls the tab upward and away from the packet to reveal the black paper tab wrapped over the end of the fi lm. Now, holding the fi lm over the second towel, he or she carefully grasps the black paper tab that wraps the fi lm and pulls the fi lm from the packet. When the fi lm is pulled from the packet, it will fall from the paper wrapping onto the clean towel. The paper wrapper may need to be shaken lightly to cause the fi lm to fall free. The packaging materials should be placed on the fi rst paper towel. After all fi lms are opened, the practitioner gathers the contaminated packaging and container and discards them along with the contaminated gloves. The clean fi lms are processed in the usual manner. It is not necessary to wear gloves when handling processed fi lms, fi lm mounts, or patient charts.
An alternate procedure when exposing fi lms in vinyl packaging is to place the exposed fi lm, still in the protective plastic envelope, in an approved disinfecting solution when it is removed from the mouth
and after wiping it with a paper towel. It should remain in the disin-fectant after the exposure of the last fi lm for the recommended time. Immersion for 30 seconds in a 5.25% solution of sodium hypochlorite is effective.
Automatic fi lm processors with daylight loaders offer a special problem because of the risk for contaminating the sleeves with con-taminated gloves or fi lm packets. One approach is to clean the fi lms by immersion in a disinfectant, with or without a plastic envelope, as previously described. With this method the operator cleans the fi lms, puts on clean gloves, and then takes only cleaned fi lm packets into the daylight loader. An alternate approach is to open the top of the loader, place a clean barrier on the bottom, and insert the cup of exposed fi lm packets and a clean cup. The operator then closes the top, puts on clean gloves, pushes his or her hands through the sleeve, and opens the fi lm packets, allowing the fi lm to drop into the clean cup. After all fi lm packets have been opened, the contaminated gloves are removed, the fi lms are loaded into the developer, and hands are removed. Then the top of the loader may be removed and the contaminated materials removed.
108 PART IV ■ IMAGING PRINCIPLES AND TECHNIQUES
BIBLIOGRAPHY QUALITY ASSURANCE
1 American Dental Association Council on Scientifi c Affairs : The use of dental radiographs: update and recommendations , J Am Dent Assoc 137 : 1304 - 1312 , 2006 .
2 Goren AD , Lundeen RC , Deahl ST II et al : Updated quality assurance self-assessment exercise in intraoral and panoramic radiography, American Academy of Oral and Maxillofacial Radiology, Radiology Practice Committee , Oral Surg Oral Med Oral Pathol Oral Radiol Endod 89 : 369 - 374 , 2000 .
3 Kodak Dental Radiography Series : Quality assurance in dental radiography , N-416, Rochester, NY , 1995 , Eastman Kodak .
4 Michel R , Zimmerman TL : Basic radiation protection considerations in dental practice , Health Phys 77 : S81 - S83 , 1999 .
5 National Radiological Protection Board : Guidance notes for dental practitioners on the safe use of x-ray equipment ( 2001 ): www.nrpb.org.uk .
INFECTION CONTROL
6 American Academy of Oral and Maxillofacial Radiology infection control guidelines for dental radiographic procedures , Oral Surg Oral Med Oral Pathol 73 : 248 - 249 , 1992 .
7 American Dental Association Council on Scientifi c Affairs and American Dental Association Council on Dental Practice : Infection control recommendations for the dental offi ce and the dental laboratory , J Am Dent Assoc 127 : 672 - 680 , 1996 .
8 Hubar JS , Gardiner DM : Infection control procedures used in conjunction with computed dental radiography , Int J Comput Dent 3 : 259 - 267 , 2000 .
9 Kohn WG , Collins AS , Cleveland JL et al ; Centers for Disease Control and Prevention: Guidelines for infection control in dental health-care settings — 2003 , MMWR Morb Mortal Wkly Rep 52 ( RR-17 ): 1 - 61 , 2003 .
10 Miller CH , Palenik CJ : Infection control and management of hazardous materials for the dental team , ed 4 , St. Louis , Mosby (in press) .
11 U.S. Department of Labor , Occupational Safety and Health Administration: Occupational exposure to bloodborne pathogens, needlestick and other sharp injuries, fi nal rule , Fed Reg 66 : 5317 - 5325 , 2001 .

C H A P T E R 9
Intraoral Radiographic Examinations
Intraoral radiographic examinations are the backbone of imaging for the general dentist. Intraoral radiographs can be divided into three categories: periapical projections, bitewing projections, and
occlusal projections. Periapical radiographs should show all of a tooth, including the surrounding bone. Bitewing radiographs show only the crowns of teeth and the adjacent alveolar crests. Occlusal radiographs show an area of teeth and bone larger than periapical radiographs.
A full-mouth set of radiographs consists of periapical and bite-wing projections ( Fig. 9-1 ). These projections, when well exposed and properly processed, can provide considerable diagnostic infor-mation to complement the clinical examination. As with any clinical procedure, the operator must clearly understand the goals of dental radiography and the criteria for evaluating the quality of performance.
Radiographs should be made only when a clear diagnostic need exists for the information the radiograph may provide. Accordingly, the frequency of such examinations varies with the individual circum-stances of each patient (see Chapter 15 ).
Criteria of Quality
Every radiographic examination should produce radiographs of optimal diagnostic quality, incorporating the following features: • Radiographs should record the complete areas of interest on the
image. In the case of intraoral periapical radiographs, the full length of the roots and at least 2 mm of periapical bone must be visible. If evidence of a pathologic condition is present, the area of the entire lesion plus some surrounding normal bone should show on one radiograph. If this is not possible to achieve on a periapical radiograph, an occlusal projection may be required as well as an extraoral projection. Bitewing examinations should demonstrate each posterior proximal surface at least once.
• Radiographs should have the least possible amount of distortion. Most distortion is caused by improper angulation of the x-ray beam rather than by the curvature of the structures being exam-ined or inappropriate positioning of the receptor. Close attention to proper positioning of the receptor and x-ray tube results in diagnostically useful images.
• Radiographs should have optimal density and contrast to facilitate interpretation. Although milliamperage (mA), peak kilovoltage (kVp), and exposure time are crucial parameters infl uencing density and contrast, faulty processing can adversely affect the quality of a properly exposed radiograph. When evaluating radiographs and considering whether to retake a
view, the practitioner should consider the initial reason for making the image. When a full-mouth set is indicated, it is not necessary to retake a view that fails to open a contact or show a periapical region if the missing information is available on another view. If a single view
or only a few views are needed, they should be repeated only if they fail to reveal the desired information.
Periapical Radiography
Two intraoral projection techniques are commonly used for periapical radiography: the paralleling technique and the bisecting-angle tech-nique. Most clinicians prefer the paralleling technique because it pro-vides a less distorted view of the dentition. The paralleling technique is the most appropriate technique for digital imaging. The following discussion describes the principles and uses of the paralleling tech-nique to obtain a full-mouth set of radiographs. When anatomic confi guration (e.g., palate and fl oor of the mouth) precludes strict adherence to the paralleling concept, slight modifi cations may have to be made. If the anatomic constraints are extreme, some of the principles of the bisecting-angle technique may be used to accomplish the required receptor placement and determine the vertical angula-tion of the tube. The bisecting-angle technique is described later in the chapter.
The term image receptor refers to any medium that can capture an image including fi lm, charge-coupled device (CCD) or complemen-tary metal oxide semiconductors (CMOS) sensors, or storage phos-phor plates. The principles for making radiographs are the same for each of these receptor types; thus this chapter uses the general term receptor to refer any of the image receptors.
GENERAL STEPS FOR MAKING AN EXPOSURE
• Prepare unit for exposure . Place barriers for universal infection control and have receptors and receptor-holding instruments ready at chairside (see Chapter 9 ).
• Greet and seat the patient . Position the patient upright in the chair with the back and head well supported and briefl y describe the procedures that are to be performed. Position the dental chair low for maxillary projections and elevated for mandibular projections. Ask the patient to remove eyeglasses and all removable appliances. Drape the patient with a lead apron regardless of whether a single image or a full series is to be made. Do not comment on any discomfort the patient may feel during the procedure. If it seems necessary to apologize for any discomfort, do it after the examination.
• Adjust the x-ray unit setting . Set the x-ray machine for the proper kVp, mA, and exposure time. Generally only the exposure time is adjusted for the various anatomic locations.
• Wash hands thoroughly . Wash your hands with soap and water, preferably in front of the patient or at least in an area where the patient can observe or be aware of the washing. Put on disposable gloves.
109
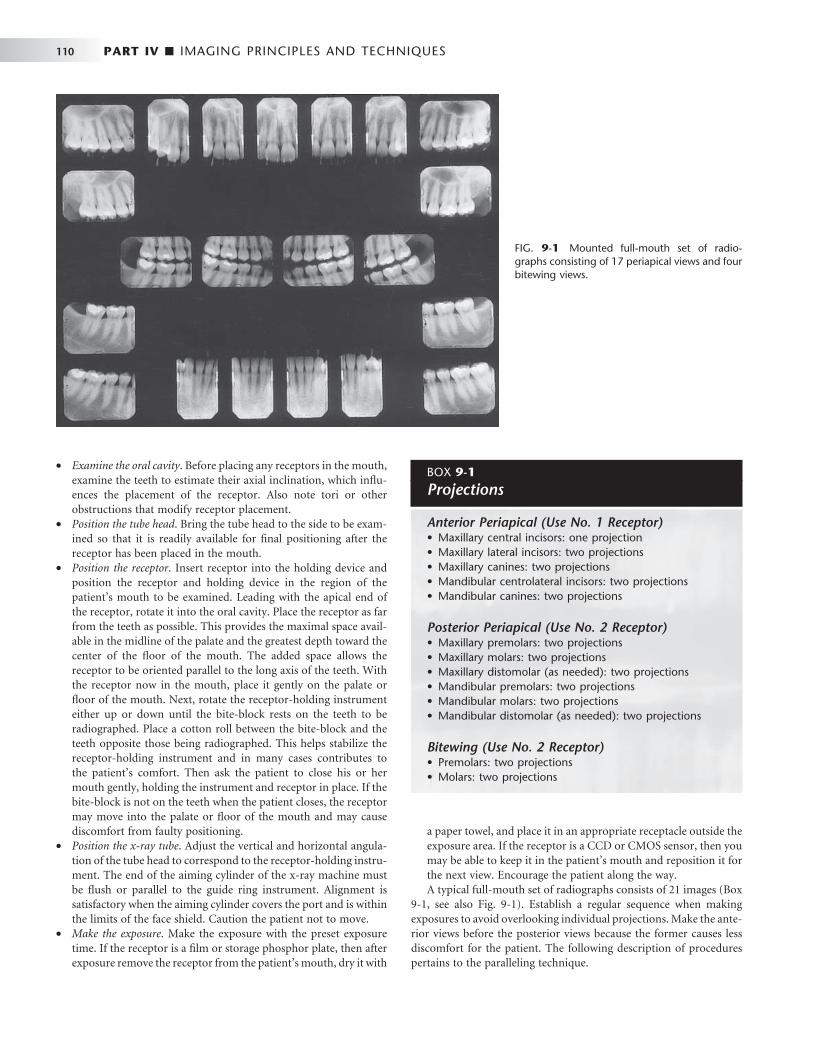
110 PART IV ■ IMAGING PRINCIPLES AND TECHNIQUES
• Examine the oral cavity . Before placing any receptors in the mouth, examine the teeth to estimate their axial inclination, which infl u-ences the placement of the receptor. Also note tori or other obstructions that modify receptor placement.
• Position the tube head . Bring the tube head to the side to be exam-ined so that it is readily available for fi nal positioning after the receptor has been placed in the mouth.
• Position the receptor . Insert receptor into the holding device and position the receptor and holding device in the region of the patient ’ s mouth to be examined. Leading with the apical end of the receptor, rotate it into the oral cavity. Place the receptor as far from the teeth as possible. This provides the maximal space avail-able in the midline of the palate and the greatest depth toward the center of the fl oor of the mouth. The added space allows the receptor to be oriented parallel to the long axis of the teeth. With the receptor now in the mouth, place it gently on the palate or fl oor of the mouth. Next, rotate the receptor-holding instrument either up or down until the bite-block rests on the teeth to be radiographed. Place a cotton roll between the bite-block and the teeth opposite those being radiographed. This helps stabilize the receptor-holding instrument and in many cases contributes to the patient ’ s comfort. Then ask the patient to close his or her mouth gently, holding the instrument and receptor in place. If the bite-block is not on the teeth when the patient closes, the receptor may move into the palate or fl oor of the mouth and may cause discomfort from faulty positioning.
• Position the x-ray tube . Adjust the vertical and horizontal angula-tion of the tube head to correspond to the receptor-holding instru-ment. The end of the aiming cylinder of the x-ray machine must be fl ush or parallel to the guide ring instrument. Alignment is satisfactory when the aiming cylinder covers the port and is within the limits of the face shield. Caution the patient not to move.
• Make the exposure . Make the exposure with the preset exposure time. If the receptor is a fi lm or storage phosphor plate, then after exposure remove the receptor from the patient ’ s mouth, dry it with
a paper towel, and place it in an appropriate receptacle outside the exposure area. If the receptor is a CCD or CMOS sensor, then you may be able to keep it in the patient ’ s mouth and reposition it for the next view. Encourage the patient along the way. A typical full-mouth set of radiographs consists of 21 images ( Box
9-1 , see also Fig. 9-1 ). Establish a regular sequence when making exposures to avoid overlooking individual projections. Make the ante-rior views before the posterior views because the former causes less discomfort for the patient. The following description of procedures pertains to the paralleling technique.
FIG. 9-1 Mounted full-mouth set of radio-graphs consisting of 17 periapical views and four bitewing views.
BOX 9-1
Projections
Anterior Periapical (Use No. 1 Receptor) • Maxillary central incisors: one projection • Maxillary lateral incisors: two projections • Maxillary canines: two projections • Mandibular centrolateral incisors: two projections • Mandibular canines: two projections
Posterior Periapical (Use No. 2 Receptor) • Maxillary premolars: two projections • Maxillary molars: two projections • Maxillary distomolar (as needed): two projections • Mandibular premolars: two projections • Mandibular molars: two projections • Mandibular distomolar (as needed): two projections
Bitewing (Use No. 2 Receptor) • Premolars: two projections • Molars: two projections

CHAPTER 9 ■ INTRAORAL RADIOGRAPHIC EXAMINATIONS 111
PARALLELING TECHNIQUE
The central concept of the paralleling technique (also called the right-angle or long-cone technique ) is that the x-ray receptor is sup-ported parallel to the long axis of the teeth and the central ray of the x-ray beam is directed at right angles to the teeth and receptor ( Fig. 9-2 ). This orientation of the receptor, teeth, and central ray minimizes geometric distortion and presents the teeth and supporting bone in their true anatomic relationships. To reduce geometric distor-tion, the x-ray source should be located relatively distant from the teeth. The use of a long source-to-object distance reduces the apparent size of the focal spot, thus increasing image sharpness, and provides images with minimal magnifi cation. The paralleling method works equally well for fi lm, CCD or CMOS sensors, or storage phosphor plates.
Receptor-Holding Instruments Use instruments to allow precise positions of the receptor in the patient ’ s mouth. Many of these receptor holders are specifi c for various brands of digital sensors, storage phosphor plates, or fi lm. It is also important to use a receptor-holding instrument that has an external guiding ring. This guiding ring is used to align the x-ray aiming cylinder and ensures that the receptor is centered in the beam behind the teeth of interest and that the receptor and teeth are perpendicular to the x-ray beam ( Fig. 9-3 ). These should be used with rectangular collimators to reduce patient exposure ( Chapter 3 ).
Receptor Placement For the best images, the receptor should be positioned parallel to the teeth and deep in the patient ’ s mouth. This is particularly important when rigid sensors are used because they may be larger than fi lm. For maxillary projections, the superior border of the receptor generally rests at the height of the palatal vault in the midline. Similarly, for mandibular projections, the receptor should be used to displace the tongue posteriorly or toward the midline to allow the inferior border of the receptor to rest on the fl oor of the mouth away from the mucosa on the lingual surface of the mandible. Especially for digital sensors, patient acceptance and comfort are best when the receptor is placed in the center of the mouth.
Angulation of the Tube Head The orientation of the x-ray machine ’ s aiming cylinder in the vertical and horizontal planes should be adjusted to align with the aiming ring. The horizontal direction of the beam primarily infl uences the degree of overlapping of the images of the crowns at the interproximal spaces ( Fig. 9-4 ).
BISECTING-ANGLE TECHNIQUE
The bisecting-angle technique was used often in the fi rst half of the 1900s but has been largely replaced by the paralleling technique. This method may be useful when the operator is unable to apply the paral-leling technique because of large rigid sensors or the anatomy of the patient. The bisecting-angle technique is based on a simple geometric theorem, Cieszynski ’ s rule of isometry, which states that two triangles are equal when they share one complete side and have two equal angles. Dental radiography applies the theorem as follows. The
Central axis of teeth
Receptor
Central ray
Collimatedbeam
FIG. 9-3 Receptor-holding instruments. A, XCP instrument for ante-rior views with wired sensor. B, XCP instrument for posterior views with wireless sensor. ( A and B, Courtesy Dentsply Rinn, Elgin, Ill.)
A
B
FIG. 9-2 Paralleling technique illustrates the parallelism between the long axis of the tooth and the receptor. The central ray is directed perpendicular to each.

112 PART IV ■ IMAGING PRINCIPLES AND TECHNIQUES
receptor is positioned as close as possible to the lingual surface of the teeth, resting in the palate or in the fl oor of the mouth ( Fig. 9-5 ). The plane of the receptor and the long axis of the teeth form an angle with its apex at the point where the receptor is in contact with the teeth along an imaginary line that bisects this angle and directs the central
ray of the beam at right angles to this bisector. This forms two trian-gles with two equal angles and a common side (the imaginary bisec-tor). Consequently, when these conditions are satisfi ed, the images cast on the receptor theoretically are the same length as the projected object. To reproduce the length of each root of a multirooted tooth accurately, the central beam must be angled differently for each root. Another limitation of this technique is that the alveolar ridge often projects more coronally than its true position, thus distorting the apparent height of the alveolar bone around the teeth.
Receptor-Holding Instruments Several methods can be used to support receptors intraorally for bisecting-angle projections. The preferred method is to use a receptor-holding bisecting-angle instrument that provides an external device for localizing the x-ray beam. The bisecting-angle instrument uses a fi xed average bisecting angle. It is not desirable to have the patient support the receptor from the lingual surface with his or her forefi nger. Patients often use excessive force and bend the receptor, causing distortion of the image. Also, the receptor might slip without the operator ’ s expertise, resulting in an improper image fi eld. Finally, without an external guide to the position of the receptor, the x-ray beam may miss part of the receptor, resulting in a partial image (cone cut) .
Positioning of the Patient For radiographs of the maxillary arch, the patient ’ s head should be positioned upright with the sagittal plane vertical and the occlusal plane horizontal. When the mandibular teeth are to be radiographed, the head is tilted back slightly to compensate for the changed occlusal plane when the mouth is opened.
Receptor Placement The projections described for the paralleling technique may also be used for the bisecting-angle technique. The receptor is positioned behind the area of interest, with the apical end against the mucosa on the lingual or palatal surface. The occlusal or incisal edge is oriented against the teeth with an edge of the receptor extending just beyond the teeth. If necessary for the patient ’ s comfort, the anterior corner of a fi lm can be softened by bending it before it is placed against the mucosa. Care must be taken not to bend the fi lm excessively because this may result in considerable image distortion and pressure defects in the emulsion that are apparent on the processed receptor. Such bending is not possible with CCD or CMOS sensors or storage phos-phor plates.
FIG. 9-4 Horizontal overlapping of crowns is the result of misdirection of the central ray.
FIG. 9-5 Bisecting-angle technique shows the central ray directed at a right angle to the plane that bisects the angle between the long axis of the tooth and the receptor.
Collimatedbeam
Central ray
Receptor
Imaginarybisector
Central axis of tooth
Text continued on p. 135.
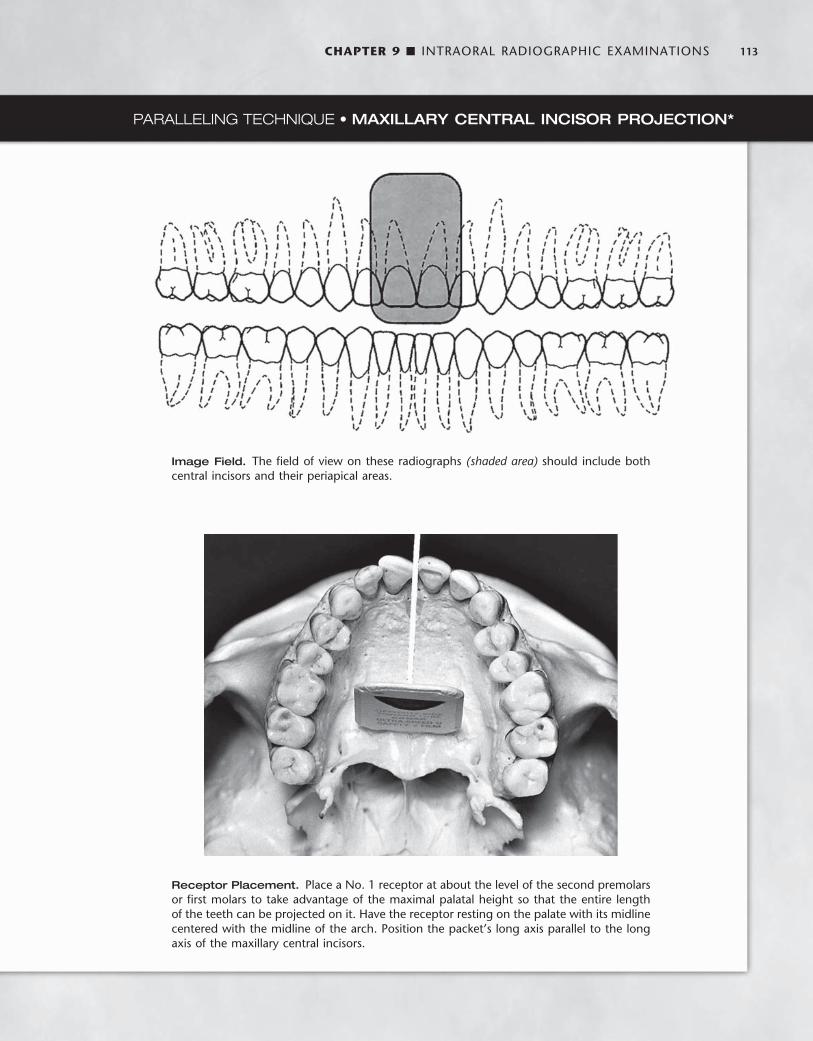
CHAPTER 9 ■ INTRAORAL RADIOGRAPHIC EXAMINATIONS 113
PARALLELING TECHNIQUE • MAXILLARY CENTRAL INCISOR PROJECTION *
Image Field. The fi eld of view on these radiographs (shaded area) should include both central incisors and their periapical areas.
Receptor Placement. Place a No. 1 receptor at about the level of the second premolars or fi rst molars to take advantage of the maximal palatal height so that the entire length of the teeth can be projected on it. Have the receptor resting on the palate with its midline centered with the midline of the arch. Position the packet ’ s long axis parallel to the long axis of the maxillary central incisors.
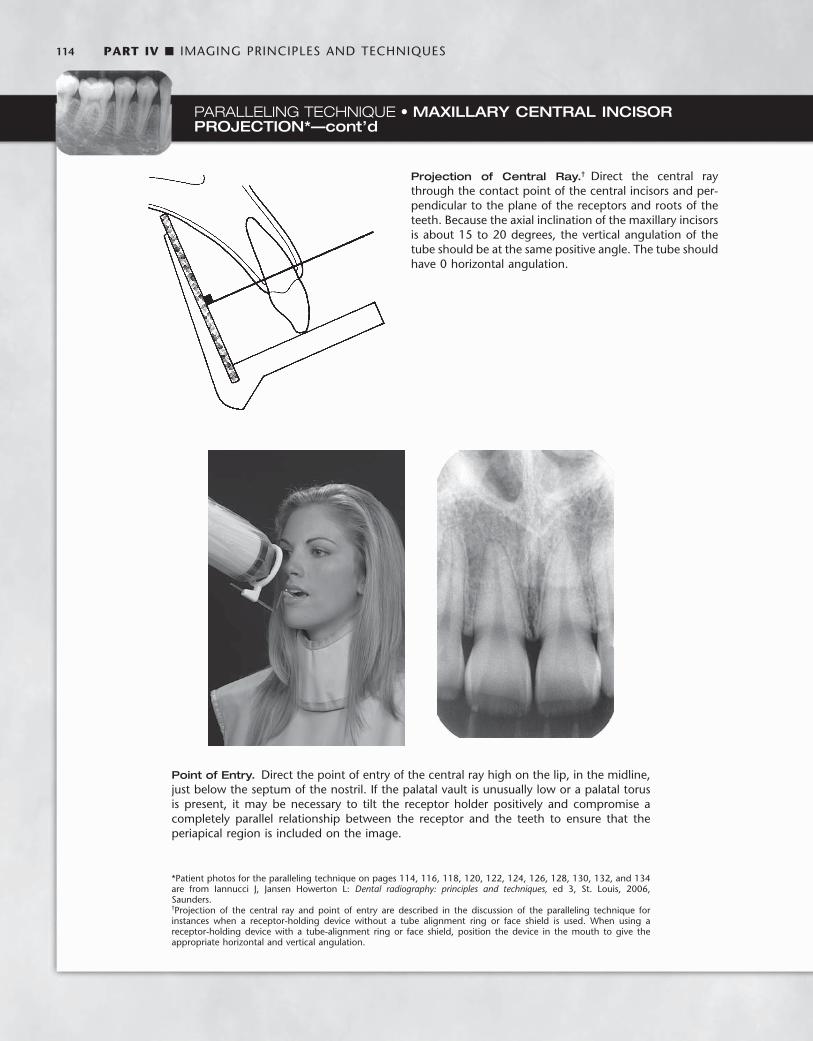
114 PART IV ■ IMAGING PRINCIPLES AND TECHNIQUES
Projection of Central Ray. † Direct the central ray through the contact point of the central incisors and per-pendicular to the plane of the receptors and roots of the teeth. Because the axial inclination of the maxillary incisors is about 15 to 20 degrees, the vertical angulation of the tube should be at the same positive angle. The tube should have 0 horizontal angulation.
* Patient photos for the paralleling technique on pages 114, 116, 118, 120, 122, 124, 126, 128, 130, 132, and 134 are from Iannucci J, Jansen Howerton L: Dental radiography: principles and techniques, ed 3, St. Louis, 2006, Saunders.
Point of Entry. Direct the point of entry of the central ray high on the lip, in the midline, just below the septum of the nostril. If the palatal vault is unusually low or a palatal torus is present, it may be necessary to tilt the receptor holder positively and compromise a completely parallel relationship between the receptor and the teeth to ensure that the periapical region is included on the image.
PARALLELING TECHNIQUE • MAXILLARY CENTRAL INCISOR PROJECTION*—cont’d
† Projection of the central ray and point of entry are described in the discussion of the paralleling technique for instances when a receptor-holding device without a tube alignment ring or face shield is used. When using a receptor-holding device with a tube-alignment ring or face shield, position the device in the mouth to give the appropriate horizontal and vertical angulation.

CHAPTER 9 ■ INTRAORAL RADIOGRAPHIC EXAMINATIONS 115
PARALLELING TECHNIQUE • MAXILLARY LATERAL PROJECTION
Image Field. This projection should show the lateral incisor and its periapical fi eld cen-tered on the radiograph. Include the mesial interproximal area with the distal aspect of the central incisor on the radiograph so that no overlap is evident.
Receptor Placement. Place a No. 1 receptor deep in the oral cavity parallel with the long axis and the mesio-distal plane of the maxillary lateral incisor.

116 PART IV ■ IMAGING PRINCIPLES AND TECHNIQUES
Point of Entry. Orient the central ray to enter high on the lip about 1 cm from the midline.
PARALLELING TECHNIQUE • MAXILLARY LATERAL PROJECTION—cont’d
Projection of Central Ray. Direct the central ray through the middle of the lateral incisor, with no overlap-ping of the margins of the crowns at the interproximal space on its mesial aspect. Do not attempt to visualize the distal contact with the canine.

CHAPTER 9 ■ INTRAORAL RADIOGRAPHIC EXAMINATIONS 117
PARALLELING TECHNIQUE • MAXILLARY CANINE PROJECTION
Image Field. This projection should demonstrate the entire canine, with its periapical area, in the midline of the radiograph. Open the mesial contact area. Ignore the distal contact because it will be visualized on other projections.
Receptor Placement. Place a No. 1 receptor against the palate, well away from the palatal surface of the teeth. Orient the receptor packet with its anterior edge at about the middle of the lateral incisor and its long axis parallel with the long axis of the canine.

118 PART IV ■ IMAGING PRINCIPLES AND TECHNIQUES
Point of Entry. Direct the central ray through the canine eminence. The point of entry will be at about the intersection of the distal and inferior borders of the ala of the nose.
PARALLELING TECHNIQUE • MAXILLARY CANINE PROJECTION—cont’d
Projection of Central Ray. Position the holding instru-ment so that it directs the beam through the mesial contact of the canine. Do not attempt to open the distal contact.

CHAPTER 9 ■ INTRAORAL RADIOGRAPHIC EXAMINATIONS 119
PARALLELING TECHNIQUE • MAXILLARY PREMOLAR PROJECTION
Image Field. The radiograph of this region should include the images of the distal half of the canine and the premolars, with room for at least the fi rst molar.
Receptor Placement. Place a No. 2 receptor in the mouth with the long dimension parallel with the occlusal plane and in the midline and near the palatal midline. The packet should extend far enough forward to cover the distal half of the canine. It will also include the premolars and the fi rst molar and maybe the mesial portion of the second molar. The plane of the receptor should be nearly vertical to correspond with the long axis of the premolar teeth. Position the receptor-holding device so that the long axis of the receptor is parallel with the mean buccal plane of the premolars. This establishes the proper hori-zontal angulation.
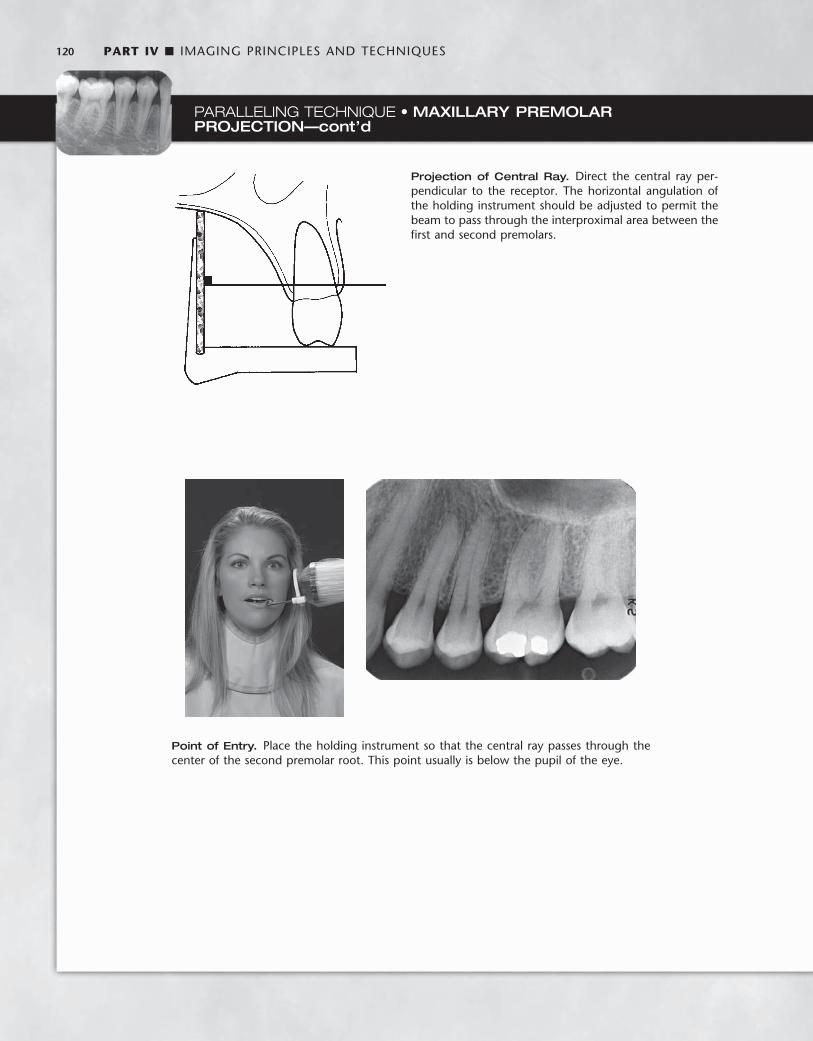
120 PART IV ■ IMAGING PRINCIPLES AND TECHNIQUES
Point of Entry. Place the holding instrument so that the central ray passes through the center of the second premolar root. This point usually is below the pupil of the eye.
PARALLELING TECHNIQUE • MAXILLARY PREMOLAR PROJECTION—cont’d
Projection of Central Ray. Direct the central ray per-pendicular to the receptor. The horizontal angulation of the holding instrument should be adjusted to permit the beam to pass through the interproximal area between the fi rst and second premolars.

CHAPTER 9 ■ INTRAORAL RADIOGRAPHIC EXAMINATIONS 121
PARALLELING TECHNIQUE • MAXILLARY MOLAR PROJECTION
Image Field. The radiograph of this region should show the images of the distal half of the second premolar, the three maxillary permanent molars, and some of the tuberosity. Include the same area on the receptor even if some or all molars are missing. If the third molar is impacted in an area other than the region of the tuberosity, a distal oblique or extraoral projection (e.g., panoramic or oblique lateral jaw view) may be required.
Receptor Placement. When placing the No. 2 receptor for this projection, position the wide dimension of the receptor nearly horizontal to minimize brushing the palate and dorsum of the tongue. When the receptor is in the region to be examined, rotate it into position with a fi rm and defi nite motion. This maneuver is important in avoid-ing the gag refl ex, and resolute action by the operator enhances the patient ’ s confi dence. Place the receptor far enough posterior to cover the fi rst, second, and third molar areas and some of the tuberosity. The anterior border should just cover the distal aspect of the second premolar. To cover the molars from crown to apices, place the receptor at the midline of the palate. In this position room should be available to orient the receptor parallel with the molar teeth. The mesial or distal rotation of the receptor-holding device should ensure that the long axis of the receptor is parallel with the mean buccal plane of the molars (to establish the proper horizontal angulation). A shallow palate may require slight tipping of the holding instrument to avoid bending the receptor.
NOTE: In some cases the size of the mouth (length of the arch) does not allow positioning of the receptor (holding device) as far posterior as recommended for the molar projection. However, by placing the receptor-holding device so that half the tube alignment ring or face shield is behind the outer canthus of the eye, the molars and part of the tuberosity usually can be included in the image of the molar projection.

122 PART IV ■ IMAGING PRINCIPLES AND TECHNIQUES
Projection of Central Ray. Direct the central ray per-pendicular to the receptor. Adjust the horizontal angula-tion of the receptor-holding instrument to direct the beam at right angles to the buccal surfaces of the molar teeth.
Point of Entry. The point of entry of the central ray should be on the cheek below the outer canthus of the eye and the zygoma at the position of the maxillary second molar.
PARALLELING TECHNIQUE • MAXILLARY MOLAR PROJECTION—cont’d
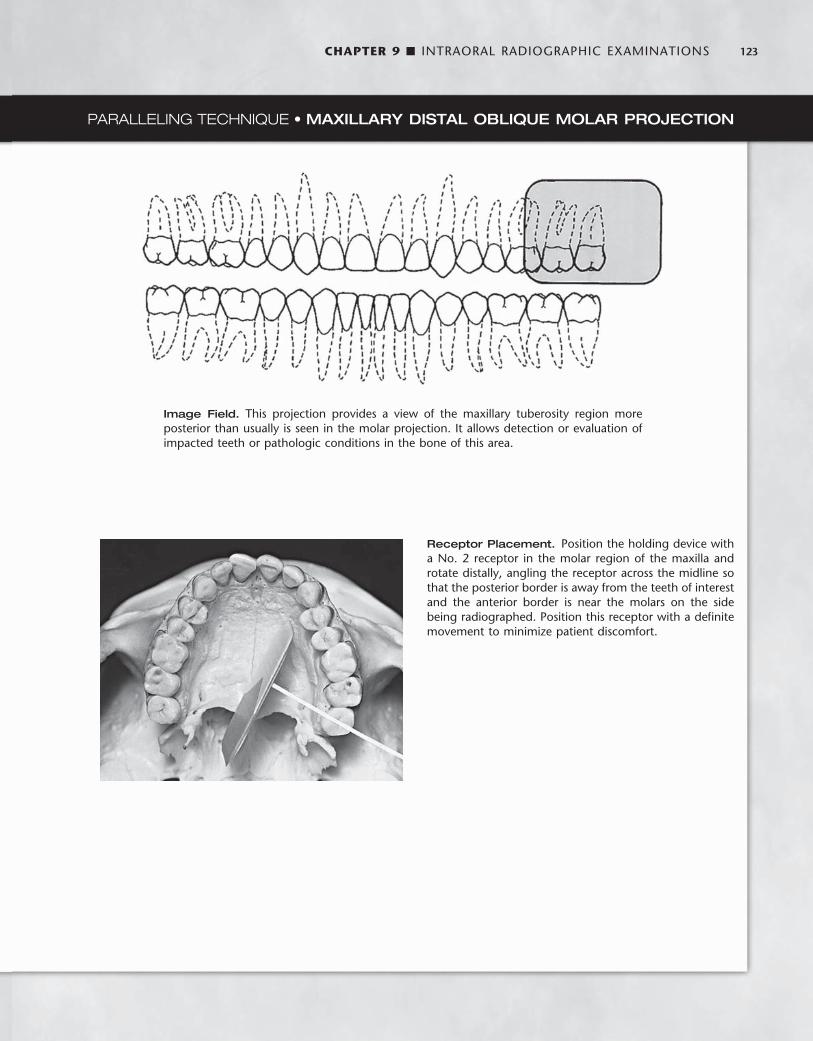
CHAPTER 9 ■ INTRAORAL RADIOGRAPHIC EXAMINATIONS 123
PARALLELING TECHNIQUE • MAXILLARY DISTAL OBLIQUE MOLAR PROJECTION
Image Field. This projection provides a view of the maxillary tuberosity region more posterior than usually is seen in the molar projection. It allows detection or evaluation of impacted teeth or pathologic conditions in the bone of this area.
Receptor Placement. Position the holding device with a No. 2 receptor in the molar region of the maxilla and rotate distally, angling the receptor across the midline so that the posterior border is away from the teeth of interest and the anterior border is near the molars on the side being radiographed. Position this receptor with a defi nite movement to minimize patient discomfort.

124 PART IV ■ IMAGING PRINCIPLES AND TECHNIQUES
Point of Entry. The central ray enters the maxillary third molar region just below the middle of the zygomatic arch, distal to the lateral canthus of the eye.
PARALLELING TECHNIQUE • MAXILLARY DISTAL OBLIQUE MOLAR PROJECTION—cont’d
NOTE: Occasionally a hypersensitive patient gags when a receptor is placed for the usual maxillary molar projection. However, if a modifi ed distal oblique projection is used, moving the posterior border of the receptor more medially frequently is less irritating to the patient, and the image is obtained with comfort. The patient ’ s reaction of relief indicates when a suffi cient rotation has been achieved. Although this maneuver may result in some overlap-ping of the molar contact areas, these surfaces will be apparent on the bitewing projection. Slight overlapping of contact areas is preferable to no radiograph of the region.
Projection of Central Ray. Direct the central ray from the posterior aspect through the third molar region and perpendicular to the angled receptor, projecting the more posterior objects anteriorly onto the receptor.
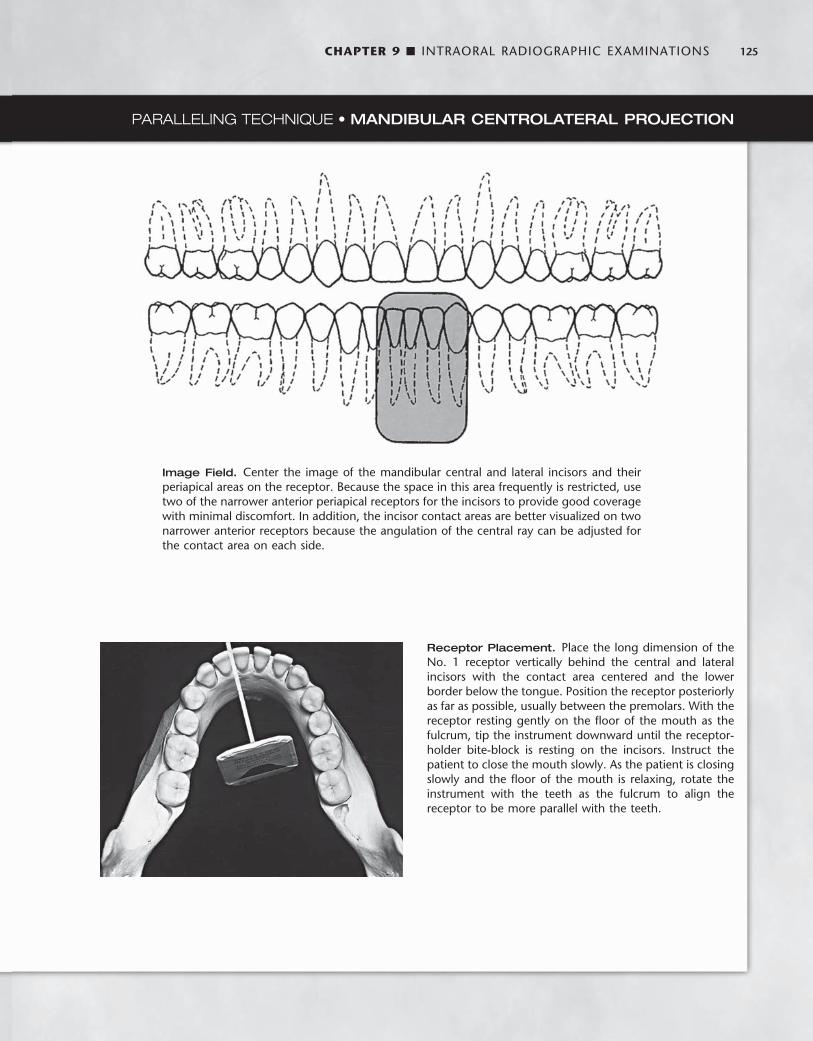
CHAPTER 9 ■ INTRAORAL RADIOGRAPHIC EXAMINATIONS 125
PARALLELING TECHNIQUE • MANDIBULAR CENTROLATERAL PROJECTION
Image Field. Center the image of the mandibular central and lateral incisors and their periapical areas on the receptor. Because the space in this area frequently is restricted, use two of the narrower anterior periapical receptors for the incisors to provide good coverage with minimal discomfort. In addition, the incisor contact areas are better visualized on two narrower anterior receptors because the angulation of the central ray can be adjusted for the contact area on each side.
Receptor Placement. Place the long dimension of the No. 1 receptor vertically behind the central and lateral incisors with the contact area centered and the lower border below the tongue. Position the receptor posteriorly as far as possible, usually between the premolars. With the receptor resting gently on the fl oor of the mouth as the fulcrum, tip the instrument downward until the receptor-holder bite-block is resting on the incisors. Instruct the patient to close the mouth slowly. As the patient is closing slowly and the fl oor of the mouth is relaxing, rotate the instrument with the teeth as the fulcrum to align the receptor to be more parallel with the teeth.

126 PART IV ■ IMAGING PRINCIPLES AND TECHNIQUES
Point of Entry. The central ray enters below the lower lip and about 1 cm lateral to the midline.
PARALLELING TECHNIQUE • MANDIBULAR CENTROLATERAL PROJECTION—cont’d
Projection of Central Ray. Orient the central ray through the interproximal space between the central and lateral incisors.
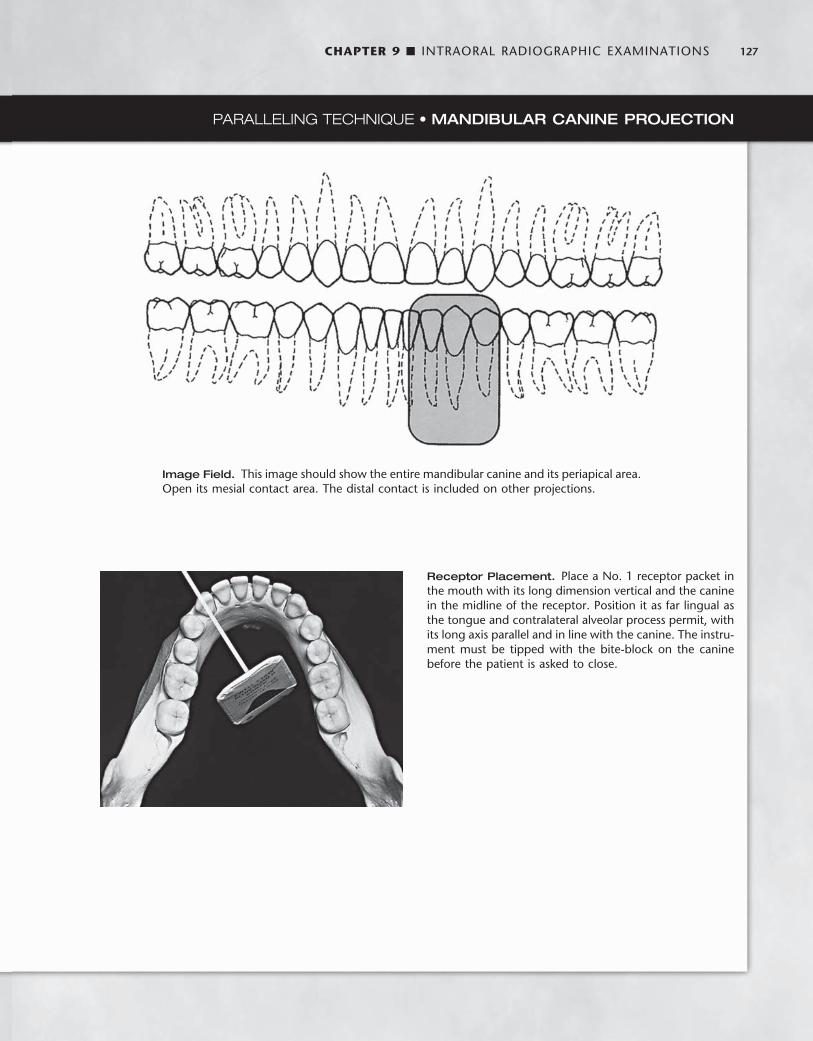
CHAPTER 9 ■ INTRAORAL RADIOGRAPHIC EXAMINATIONS 127
PARALLELING TECHNIQUE • MANDIBULAR CANINE PROJECTION
Image Field. This image should show the entire mandibular canine and its periapical area. Open its mesial contact area. The distal contact is included on other projections.
Receptor Placement. Place a No. 1 receptor packet in the mouth with its long dimension vertical and the canine in the midline of the receptor. Position it as far lingual as the tongue and contralateral alveolar process permit, with its long axis parallel and in line with the canine. The instru-ment must be tipped with the bite-block on the canine before the patient is asked to close.

128 PART IV ■ IMAGING PRINCIPLES AND TECHNIQUES
Point of Entry. The point of entry is nearly perpendicular to the ala of the nose, over the position of the canine, and about 3 cm above the inferior border of the mandible.
PARALLELING TECHNIQUE • MANDIBULAR CANINE PROJECTION—cont’d
Projection of Central Ray. Direct the central ray through the mesial contact of the canine without regard to the distal contact.

CHAPTER 9 ■ INTRAORAL RADIOGRAPHIC EXAMINATIONS 129
PARALLELING TECHNIQUE • MANDIBULAR PREMOLAR PROJECTION
Image Field. The radiograph of this area should show the distal half of the canine, the two premolars, and the fi rst molar.
Receptor Placement. Bring the No. 2 receptor into the mouth with its plane nearly horizontal. Rotate the lead edge to the fl oor of the mouth between the tongue and the teeth with the anterior border near the midline of the canine. Place the receptor away from the teeth to position it in the deeper portion of the mouth. Placing the receptor toward the midline also provides more room for the ante-rior border of the receptor in the curvature of the jaw as it sweeps anteriorly. Prevent the anterior border from con-tacting the very sensitive attached gingiva on the lingual surface of the mandible.
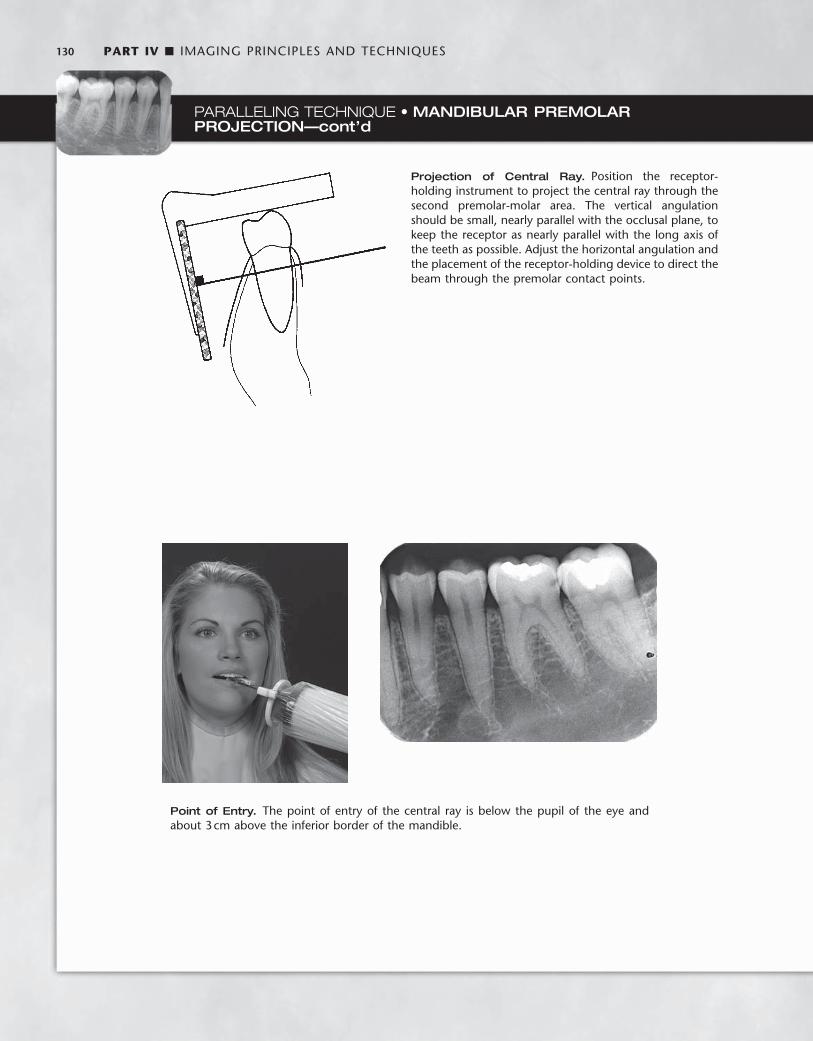
130 PART IV ■ IMAGING PRINCIPLES AND TECHNIQUES
Point of Entry. The point of entry of the central ray is below the pupil of the eye and about 3 cm above the inferior border of the mandible.
PARALLELING TECHNIQUE • MANDIBULAR PREMOLAR PROJECTION—cont’d
Projection of Central Ray. Position the receptor-holding instrument to project the central ray through the second premolar-molar area. The vertical angulation should be small, nearly parallel with the occlusal plane, to keep the receptor as nearly parallel with the long axis of the teeth as possible. Adjust the horizontal angulation and the placement of the receptor-holding device to direct the beam through the premolar contact points.

CHAPTER 9 ■ INTRAORAL RADIOGRAPHIC EXAMINATIONS 131
PARALLELING TECHNIQUE • MANDIBULAR MOLAR PROJECTION
Image Field. The radiograph of this region should include the distal half of the second premolar and the three mandibular permanent molars. In the case of an impacted third molar or a pathologic condition distal to the third molar, a distal oblique molar projection or even additional extraoral projections (panoramic or lateral ramus) may be required to demonstrate the area adequately. If the molar area is edentulous, place the receptor far enough posterior to include the retromolar area in the examination.
Receptor Placement. Place the No. 2 receptor in the mouth with its plane nearly horizontal. Rotate the inferior edge downward beneath the lateral border of the tongue, displacing it medially. The anterior edge of the receptor should be at about the middle of the second premolar. In most cases the tongue forces the receptor near the alveolar process and molars, aligning it parallel with the long axis of the teeth and the line of occlusion.
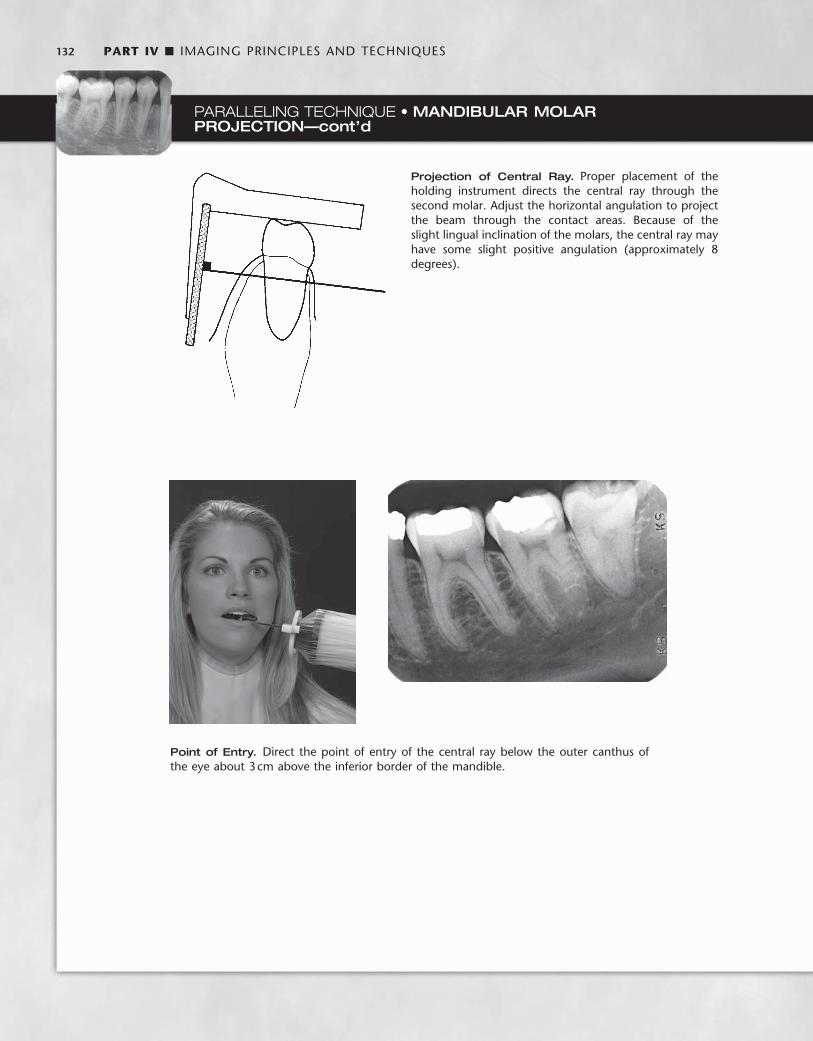
132 PART IV ■ IMAGING PRINCIPLES AND TECHNIQUES
PARALLELING TECHNIQUE • MANDIBULAR MOLAR PROJECTION—cont’d
Point of Entry. Direct the point of entry of the central ray below the outer canthus of the eye about 3 cm above the inferior border of the mandible.
Projection of Central Ray. Proper placement of the holding instrument directs the central ray through the second molar. Adjust the horizontal angulation to project the beam through the contact areas. Because of the slight lingual inclination of the molars, the central ray may have some slight positive angulation (approximately 8 degrees).
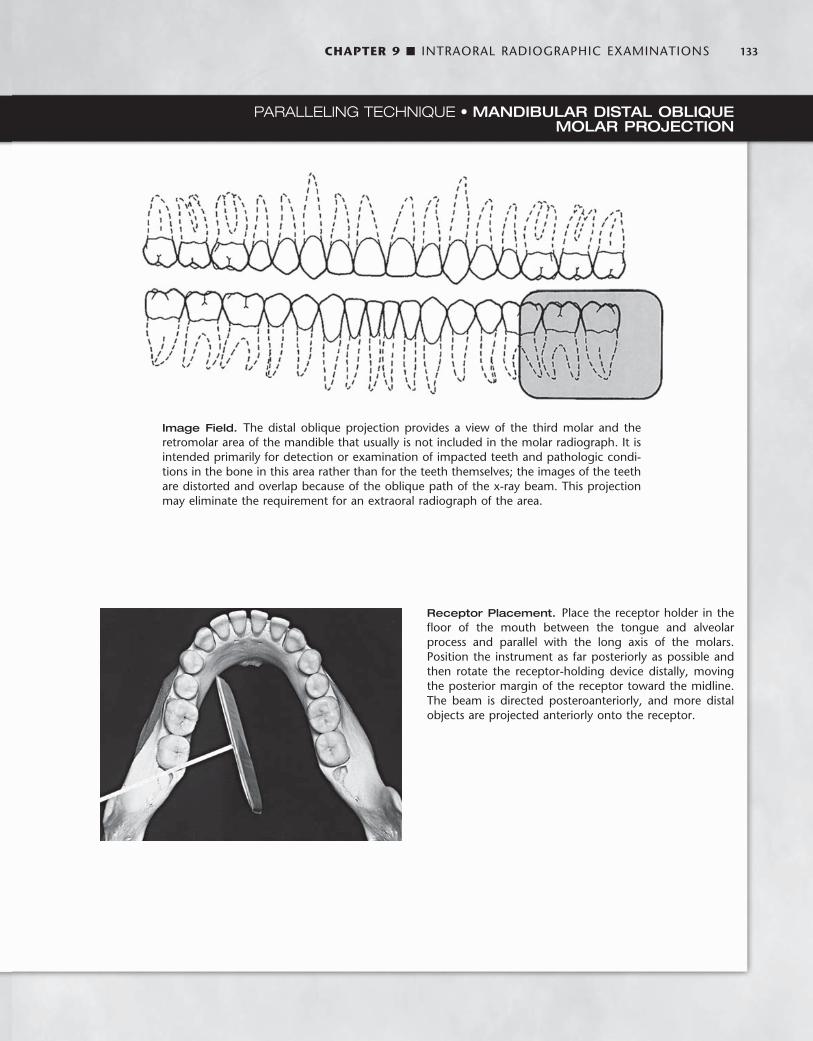
CHAPTER 9 ■ INTRAORAL RADIOGRAPHIC EXAMINATIONS 133
PARALLELING TECHNIQUE • MANDIBULAR DISTAL OBLIQUE MOLAR PROJECTION
Image Field. The distal oblique projection provides a view of the third molar and the retromolar area of the mandible that usually is not included in the molar radiograph. It is intended primarily for detection or examination of impacted teeth and pathologic condi-tions in the bone in this area rather than for the teeth themselves; the images of the teeth are distorted and overlap because of the oblique path of the x-ray beam. This projection may eliminate the requirement for an extraoral radiograph of the area.
Receptor Placement. Place the receptor holder in the fl oor of the mouth between the tongue and alveolar process and parallel with the long axis of the molars. Position the instrument as far posteriorly as possible and then rotate the receptor-holding device distally, moving the posterior margin of the receptor toward the midline. The beam is directed posteroanteriorly, and more distal objects are projected anteriorly onto the receptor.
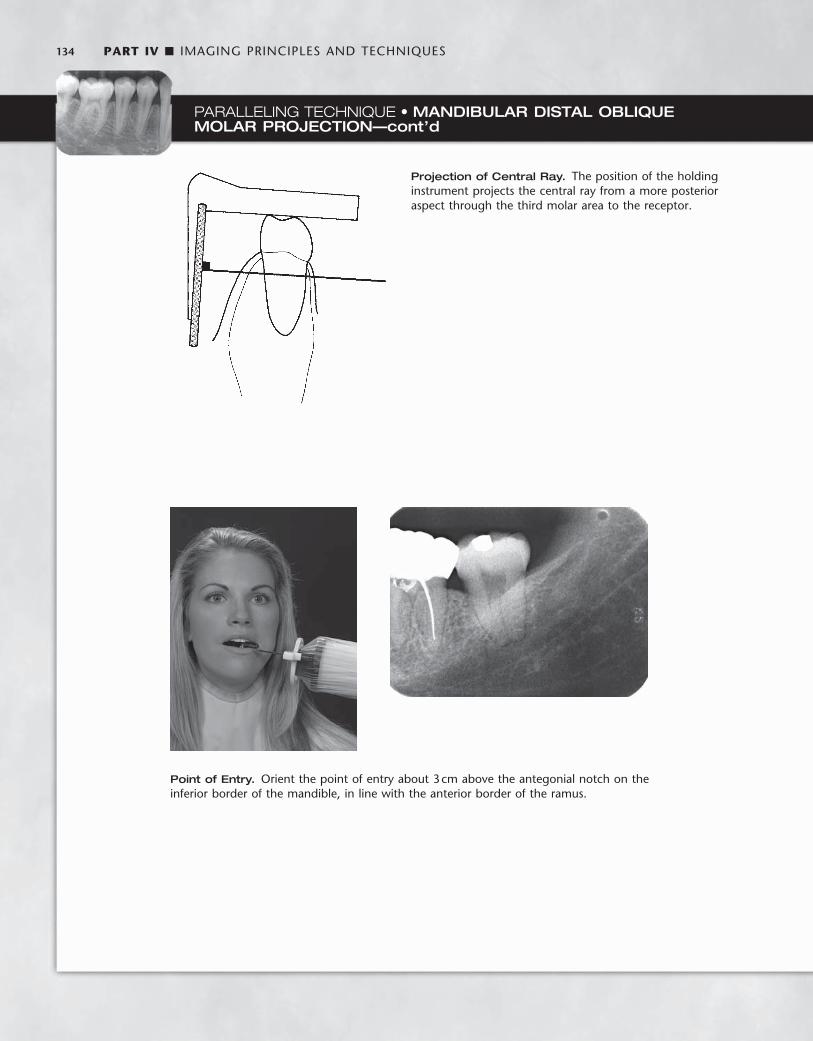
134 PART IV ■ IMAGING PRINCIPLES AND TECHNIQUES
PARALLELING TECHNIQUE • MANDIBULAR DISTAL OBLIQUE MOLAR PROJECTION—cont’d
Point of Entry. Orient the point of entry about 3 cm above the antegonial notch on the inferior border of the mandible, in line with the anterior border of the ramus.
Projection of Central Ray. The position of the holding instrument projects the central ray from a more posterior aspect through the third molar area to the receptor.
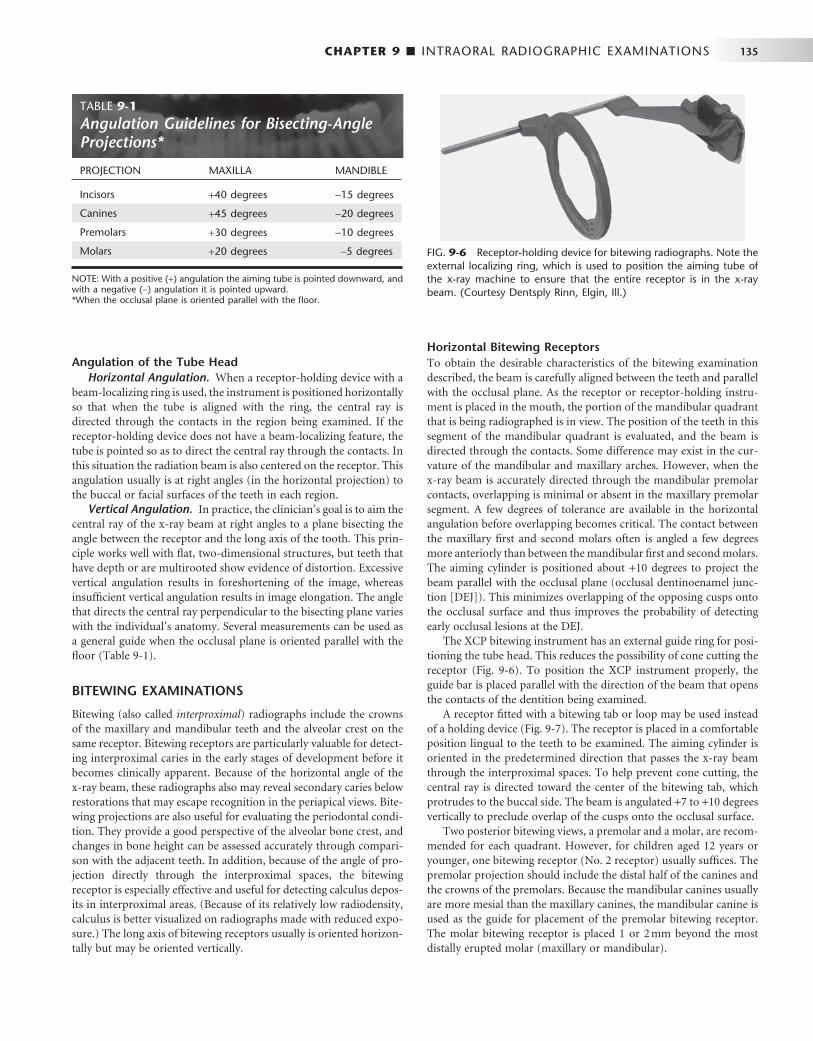
CHAPTER 9 ■ INTRAORAL RADIOGRAPHIC EXAMINATIONS 135
Angulation of the Tube Head Horizontal Angulation. When a receptor-holding device with a
beam-localizing ring is used, the instrument is positioned horizontally so that when the tube is aligned with the ring, the central ray is directed through the contacts in the region being examined. If the receptor-holding device does not have a beam-localizing feature, the tube is pointed so as to direct the central ray through the contacts. In this situation the radiation beam is also centered on the receptor. This angulation usually is at right angles (in the horizontal projection) to the buccal or facial surfaces of the teeth in each region.
Vertical Angulation. In practice, the clinician ’ s goal is to aim the central ray of the x-ray beam at right angles to a plane bisecting the angle between the receptor and the long axis of the tooth. This prin-ciple works well with fl at, two-dimensional structures, but teeth that have depth or are multirooted show evidence of distortion. Excessive vertical angulation results in foreshortening of the image, whereas insuffi cient vertical angulation results in image elongation. The angle that directs the central ray perpendicular to the bisecting plane varies with the individual ’ s anatomy. Several measurements can be used as a general guide when the occlusal plane is oriented parallel with the fl oor ( Table 9-1 ).
BITEWING EXAMINATIONS
Bitewing (also called interproximal ) radiographs include the crowns of the maxillary and mandibular teeth and the alveolar crest on the same receptor. Bitewing receptors are particularly valuable for detect-ing interproximal caries in the early stages of development before it becomes clinically apparent. Because of the horizontal angle of the x-ray beam, these radiographs also may reveal secondary caries below restorations that may escape recognition in the periapical views. Bite-wing projections are also useful for evaluating the periodontal condi-tion. They provide a good perspective of the alveolar bone crest, and changes in bone height can be assessed accurately through compari-son with the adjacent teeth. In addition, because of the angle of pro-jection directly through the interproximal spaces, the bitewing receptor is especially effective and useful for detecting calculus depos-its in interproximal areas. (Because of its relatively low radiodensity, calculus is better visualized on radiographs made with reduced expo-sure.) The long axis of bitewing receptors usually is oriented horizon-tally but may be oriented vertically.
Horizontal Bitewing Receptors To obtain the desirable characteristics of the bitewing examination described, the beam is carefully aligned between the teeth and parallel with the occlusal plane. As the receptor or receptor-holding instru-ment is placed in the mouth, the portion of the mandibular quadrant that is being radiographed is in view. The position of the teeth in this segment of the mandibular quadrant is evaluated, and the beam is directed through the contacts. Some difference may exist in the cur-vature of the mandibular and maxillary arches. However, when the x-ray beam is accurately directed through the mandibular premolar contacts, overlapping is minimal or absent in the maxillary premolar segment. A few degrees of tolerance are available in the horizontal angulation before overlapping becomes critical. The contact between the maxillary fi rst and second molars often is angled a few degrees more anteriorly than between the mandibular fi rst and second molars. The aiming cylinder is positioned about + 10 degrees to project the beam parallel with the occlusal plane (occlusal dentinoenamel junc-tion [ DEJ ] ). This minimizes overlapping of the opposing cusps onto the occlusal surface and thus improves the probability of detecting early occlusal lesions at the DEJ.
The XCP bitewing instrument has an external guide ring for posi-tioning the tube head. This reduces the possibility of cone cutting the receptor ( Fig. 9-6 ). To position the XCP instrument properly, the guide bar is placed parallel with the direction of the beam that opens the contacts of the dentition being examined.
A receptor fi tted with a bitewing tab or loop may be used instead of a holding device ( Fig. 9-7 ). The receptor is placed in a comfortable position lingual to the teeth to be examined. The aiming cylinder is oriented in the predetermined direction that passes the x-ray beam through the interproximal spaces. To help prevent cone cutting, the central ray is directed toward the center of the bitewing tab, which protrudes to the buccal side. The beam is angulated + 7 to + 10 degrees vertically to preclude overlap of the cusps onto the occlusal surface.
Two posterior bitewing views, a premolar and a molar, are recom-mended for each quadrant. However, for children aged 12 years or younger, one bitewing receptor (No. 2 receptor) usually suffi ces. The premolar projection should include the distal half of the canines and the crowns of the premolars. Because the mandibular canines usually are more mesial than the maxillary canines, the mandibular canine is used as the guide for placement of the premolar bitewing receptor. The molar bitewing receptor is placed 1 or 2 mm beyond the most distally erupted molar (maxillary or mandibular).
TABLE 9-1 Angulation Guidelines for Bisecting-Angle Projections *
PROJECTION MAXILLA MANDIBLE
Incisors + 40 degrees − 15 degrees
Canines + 45 degrees − 20 degrees
Premolars + 30 degrees − 10 degrees
Molars + 20 degrees − 5 degrees
NOTE: With a positive ( + ) angulation the aiming tube is pointed downward, and with a negative ( − ) angulation it is pointed upward. * When the occlusal plane is oriented parallel with the fl oor.
FIG. 9-6 Receptor-holding device for bitewing radiographs. Note the external localizing ring, which is used to position the aiming tube of the x-ray machine to ensure that the entire receptor is in the x-ray beam. (Courtesy Dentsply Rinn, Elgin, Ill.)

136 PART IV ■ IMAGING PRINCIPLES AND TECHNIQUES
FIG. 9-7 Bitewing loop, showing the tab that the patient bites on to support the receptor (fi lm) during exposure.
FIG. 9-8 A set of vertical bitewings. Orienting the length of the receptor vertically increases the likeli-hood that, even in patients with extensive alveolar bone loss, the residual alveolar crests in the maxilla and the mandible will be recorded on the radiograph.
Vertical Bitewing Receptors Vertical bitewing receptors usually are used when the patient has moderate to extensive alveolar bone loss. Orienting the length of the receptor vertically increases the likelihood that the residual alveolar crests in the maxilla and the mandible will be recorded on the radio-graph ( Fig. 9-8 ). The principles for positioning the receptor and ori-enting the x-ray beam are otherwise the same as for horizontal bitewing projections. Text continued on p. 147.
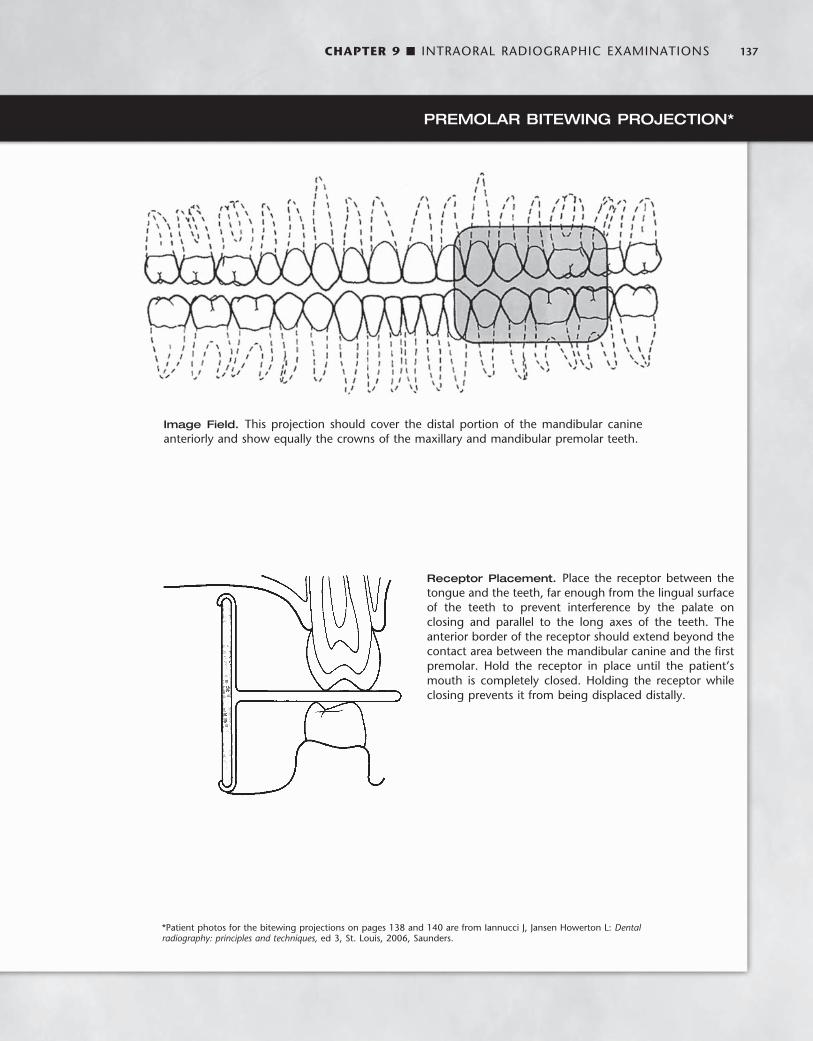
CHAPTER 9 ■ INTRAORAL RADIOGRAPHIC EXAMINATIONS 137
PREMOLAR BITEWING PROJECTION *
Image Field. This projection should cover the distal portion of the mandibular canine anteriorly and show equally the crowns of the maxillary and mandibular premolar teeth.
Receptor Placement. Place the receptor between the tongue and the teeth, far enough from the lingual surface of the teeth to prevent interference by the palate on closing and parallel to the long axes of the teeth. The anterior border of the receptor should extend beyond the contact area between the mandibular canine and the fi rst premolar. Hold the receptor in place until the patient ’ s mouth is completely closed. Holding the receptor while closing prevents it from being displaced distally.
* Patient photos for the bitewing projections on pages 138 and 140 are from Iannucci J, Jansen Howerton L: Dental radiography: principles and techniques, ed 3, St. Louis, 2006, Saunders.

138 PART IV ■ IMAGING PRINCIPLES AND TECHNIQUES
Point of Entry. Identify the point of entry by retracting the cheek and determining that the central ray will enter the line of occlusion at the point of contact between the second premolar and the fi rst molar.
PREMOLAR BITEWING PROJECTION—cont’d
Projection of Central Ray. Adjust the horizontal angu-lation of the cone to project the central ray to the center of the receptor through the premolar contact areas. To compensate for the slight inclination of the receptor against the palatal mucosa, the vertical angulation should be about + 5 degrees. (In the drawing, the mandibular teeth are in dashed lines.)

CHAPTER 9 ■ INTRAORAL RADIOGRAPHIC EXAMINATIONS 139
MOLAR BITEWING PROJECTION
Image Field. This projection should show the distal surface of the most posterior erupted molar and equally the crowns of the maxillary and mandibular molars. Because the maxil-lary and mandibular molar contact areas may not be open from the same horizontal angulation, they may not be visible on one receptor. In this case it may be desirable to open the maxillary molar contacts because the mandibular molar contacts usually are open on the periapical receptors.
Receptor Placement. Place the receptor between the tongue and teeth, as far lingual as practical to avoid con-tacting the sensitive attached gingiva. The distal margin of the receptor should extend 1 to 2 mm beyond the most posterior erupted molar. When using the XCP, adjust the horizontal angulation by placing the guide bar parallel with the direction of the central ray to open the contact area between the fi rst and second molars.
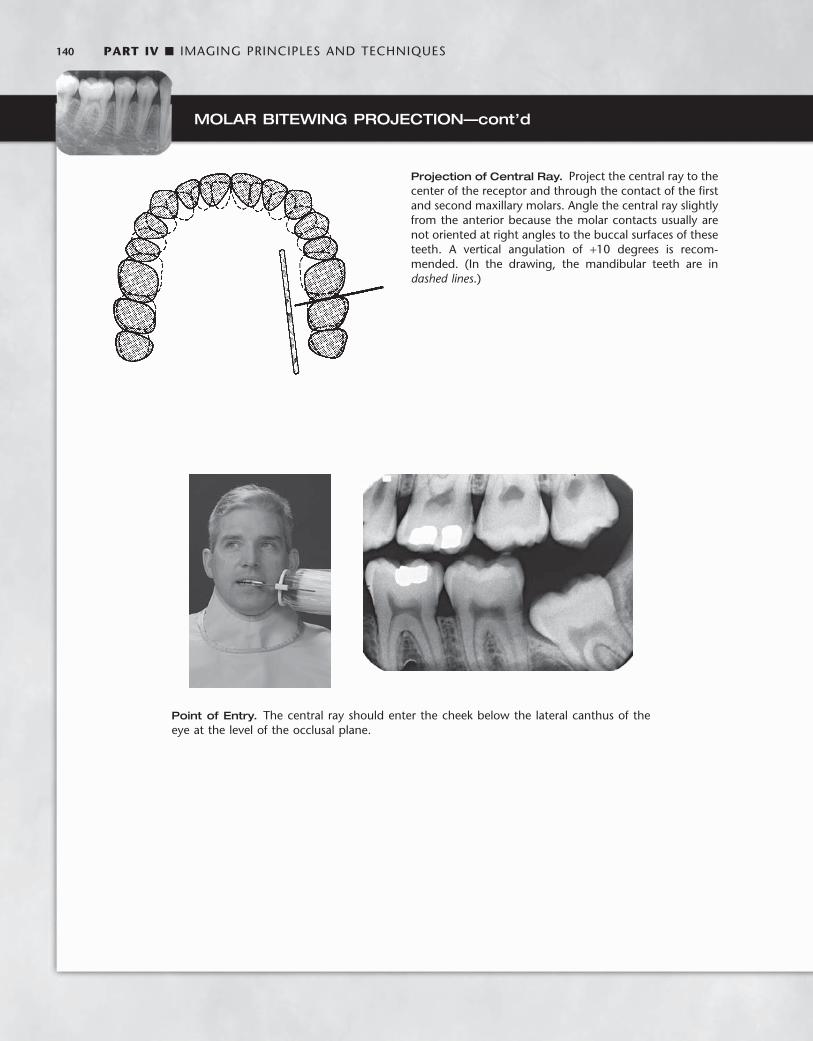
140 PART IV ■ IMAGING PRINCIPLES AND TECHNIQUES
MOLAR BITEWING PROJECTION—cont’d
Point of Entry. The central ray should enter the cheek below the lateral canthus of the eye at the level of the occlusal plane.
Projection of Central Ray. Project the central ray to the center of the receptor and through the contact of the fi rst and second maxillary molars. Angle the central ray slightly from the anterior because the molar contacts usually are not oriented at right angles to the buccal surfaces of these teeth. A vertical angulation of + 10 degrees is recom-mended. (In the drawing, the mandibular teeth are in dashed lines .)
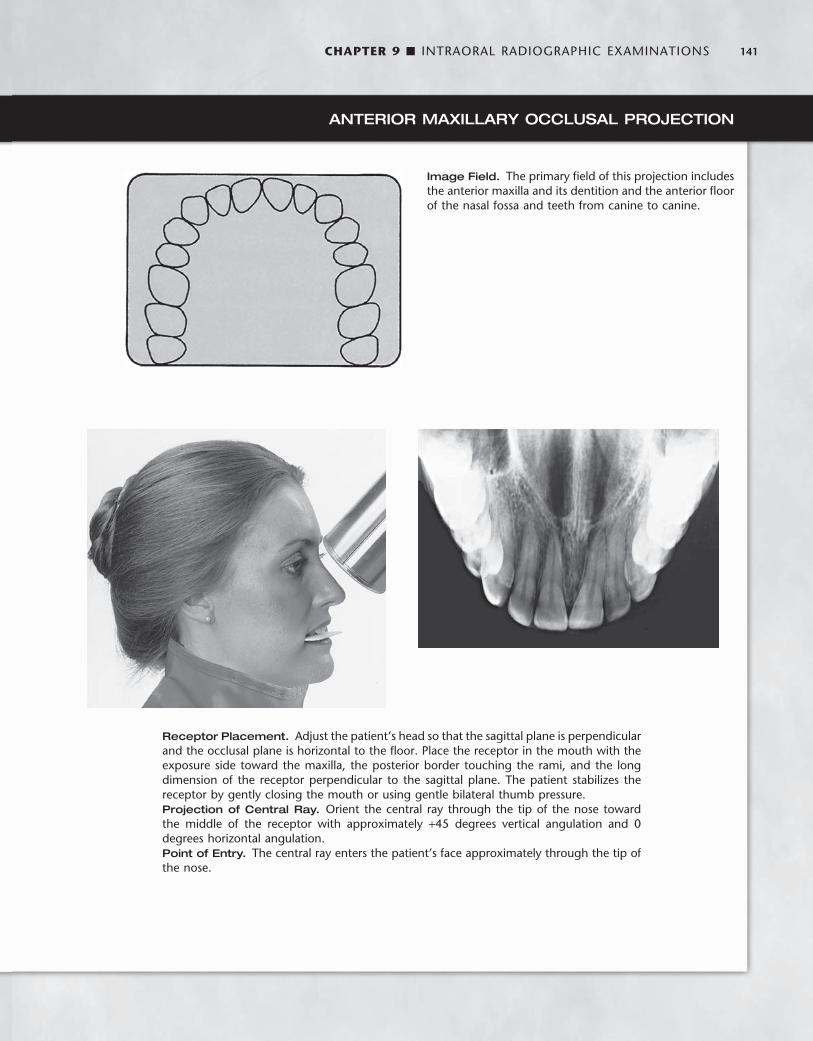
CHAPTER 9 ■ INTRAORAL RADIOGRAPHIC EXAMINATIONS 141
ANTERIOR MAXILLARY OCCLUSAL PROJECTION
Image Field. The primary fi eld of this projection includes the anterior maxilla and its dentition and the anterior fl oor of the nasal fossa and teeth from canine to canine.
Receptor Placement. Adjust the patient ’ s head so that the sagittal plane is perpendicular and the occlusal plane is horizontal to the fl oor. Place the receptor in the mouth with the exposure side toward the maxilla, the posterior border touching the rami, and the long dimension of the receptor perpendicular to the sagittal plane. The patient stabilizes the receptor by gently closing the mouth or using gentle bilateral thumb pressure. Projection of Central Ray. Orient the central ray through the tip of the nose toward the middle of the receptor with approximately + 45 degrees vertical angulation and 0 degrees horizontal angulation. Point of Entry. The central ray enters the patient ’ s face approximately through the tip of the nose.

142 PART IV ■ IMAGING PRINCIPLES AND TECHNIQUES
CROSS-SECTIONAL MAXILLARY OCCLUSAL PROJECTION *
Image Field. This projection shows the palate, zygomatic processes of the maxilla, anteroinferior aspects of each antrum, nasolacrimal canals, teeth from second molar to second molar, and nasal septum.
Receptor Placement. Seat the patient upright with the sagittal plane perpendicular to the fl oor and the occlusal plane horizontal. Place the receptor, with its long dimension perpendicular to the sagittal plane, crosswise in the mouth. Gently push the receptor in backward until it contacts the anterior border of the mandibular rami. The patient stabilizes the receptor by gently closing the mouth. Projection of Central Ray. Direct the central ray at a vertical angulation of + 65 degrees and a horizontal angulation of 0 degrees, to the bridge of the nose just below the nasion, toward the middle of the receptor. Point of Entry. Generally, the central ray enters the patient ’ s face through the bridge of the nose.
* Patient photo for this occlusal projection is from Iannucci J, Jansen Howerton L: Dental radiography: principles and techniques, ed 3, St. Louis, 2006, Saunders.
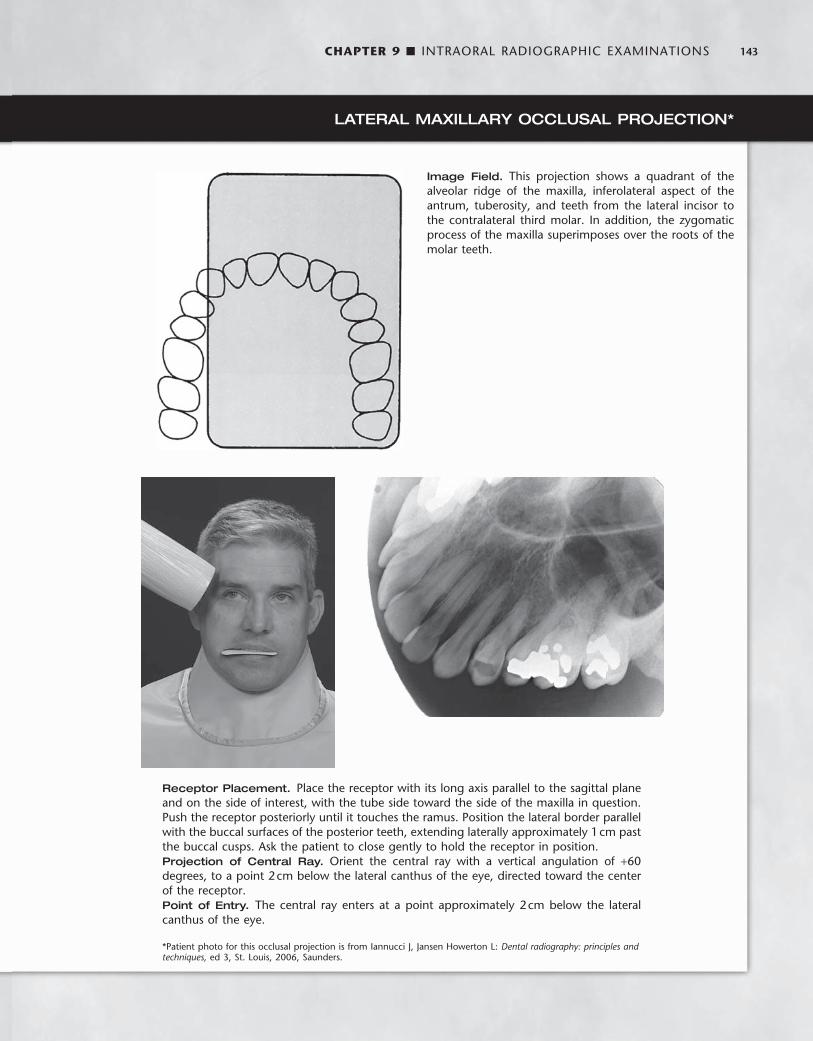
CHAPTER 9 ■ INTRAORAL RADIOGRAPHIC EXAMINATIONS 143
LATERAL MAXILLARY OCCLUSAL PROJECTION *
Image Field. This projection shows a quadrant of the alveolar ridge of the maxilla, inferolateral aspect of the antrum, tuberosity, and teeth from the lateral incisor to the contralateral third molar. In addition, the zygomatic process of the maxilla superimposes over the roots of the molar teeth.
Receptor Placement. Place the receptor with its long axis parallel to the sagittal plane and on the side of interest, with the tube side toward the side of the maxilla in question. Push the receptor posteriorly until it touches the ramus. Position the lateral border parallel with the buccal surfaces of the posterior teeth, extending laterally approximately 1 cm past the buccal cusps. Ask the patient to close gently to hold the receptor in position. Projection of Central Ray. Orient the central ray with a vertical angulation of + 60 degrees, to a point 2 cm below the lateral canthus of the eye, directed toward the center of the receptor. Point of Entry. The central ray enters at a point approximately 2 cm below the lateral canthus of the eye. * Patient photo for this occlusal projection is from Iannucci J, Jansen Howerton L: Dental radiography: principles and techniques, ed 3, St. Louis, 2006, Saunders.
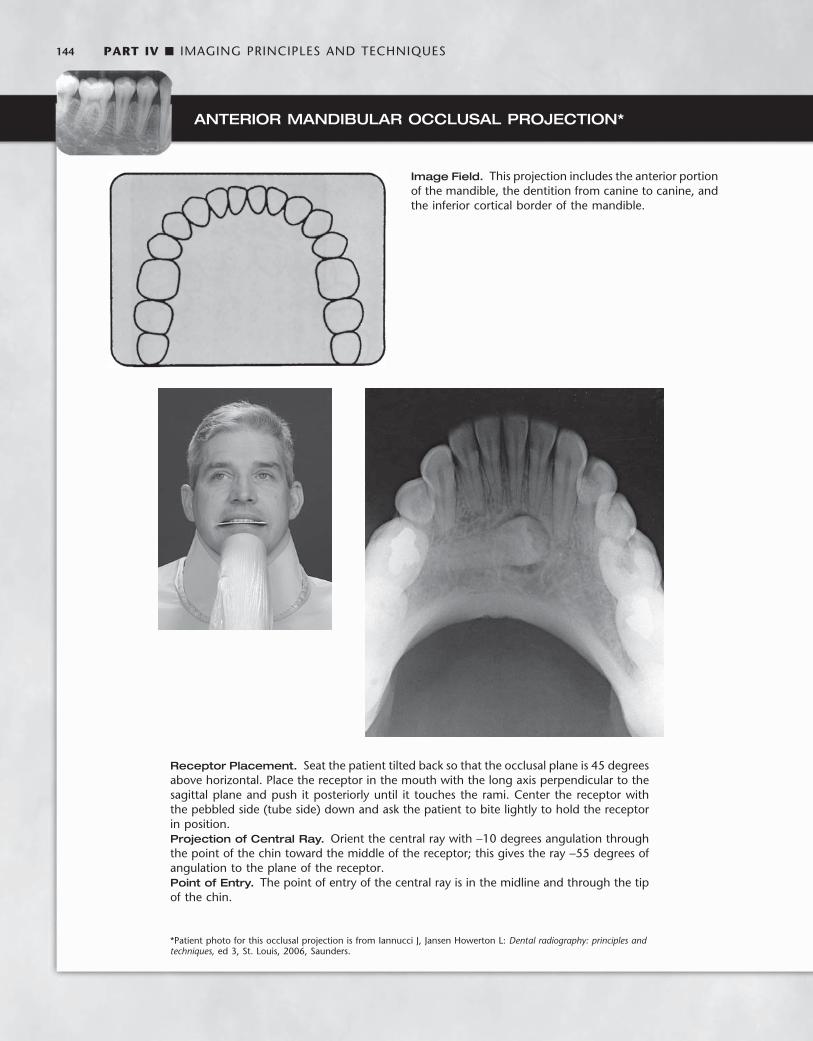
144 PART IV ■ IMAGING PRINCIPLES AND TECHNIQUES
ANTERIOR MANDIBULAR OCCLUSAL PROJECTION *
Image Field. This projection includes the anterior portion of the mandible, the dentition from canine to canine, and the inferior cortical border of the mandible.
Receptor Placement. Seat the patient tilted back so that the occlusal plane is 45 degrees above horizontal. Place the receptor in the mouth with the long axis perpendicular to the sagittal plane and push it posteriorly until it touches the rami. Center the receptor with the pebbled side (tube side) down and ask the patient to bite lightly to hold the receptor in position. Projection of Central Ray. Orient the central ray with − 10 degrees angulation through the point of the chin toward the middle of the receptor; this gives the ray − 55 degrees of angulation to the plane of the receptor. Point of Entry. The point of entry of the central ray is in the midline and through the tip of the chin.
* Patient photo for this occlusal projection is from Iannucci J, Jansen Howerton L: Dental radiography: principles and techniques, ed 3, St. Louis, 2006, Saunders.
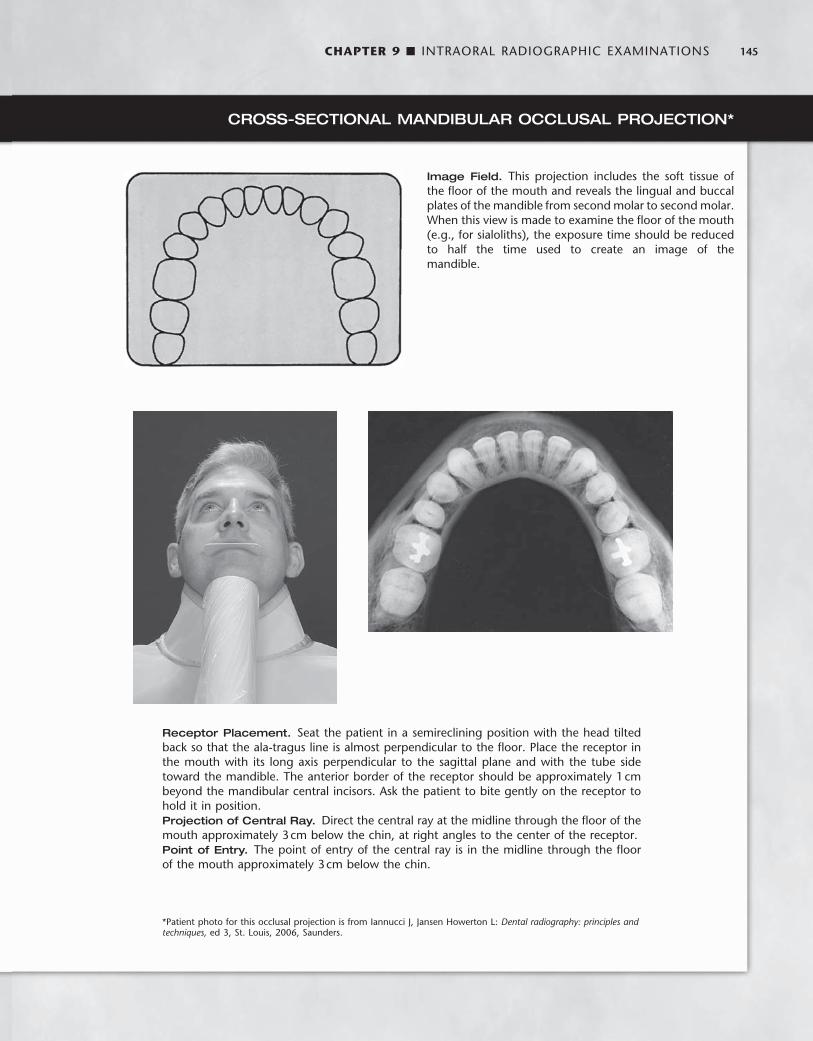
CHAPTER 9 ■ INTRAORAL RADIOGRAPHIC EXAMINATIONS 145
CROSS-SECTIONAL MANDIBULAR OCCLUSAL PROJECTION *
Image Field. This projection includes the soft tissue of the fl oor of the mouth and reveals the lingual and buccal plates of the mandible from second molar to second molar. When this view is made to examine the fl oor of the mouth (e.g., for sialoliths), the exposure time should be reduced to half the time used to create an image of the mandible.
Receptor Placement. Seat the patient in a semireclining position with the head tilted back so that the ala-tragus line is almost perpendicular to the fl oor. Place the receptor in the mouth with its long axis perpendicular to the sagittal plane and with the tube side toward the mandible. The anterior border of the receptor should be approximately 1 cm beyond the mandibular central incisors. Ask the patient to bite gently on the receptor to hold it in position. Projection of Central Ray. Direct the central ray at the midline through the fl oor of the mouth approximately 3 cm below the chin, at right angles to the center of the receptor. Point of Entry. The point of entry of the central ray is in the midline through the fl oor of the mouth approximately 3 cm below the chin.
* Patient photo for this occlusal projection is from Iannucci J, Jansen Howerton L: Dental radiography: principles and techniques, ed 3, St. Louis, 2006, Saunders.
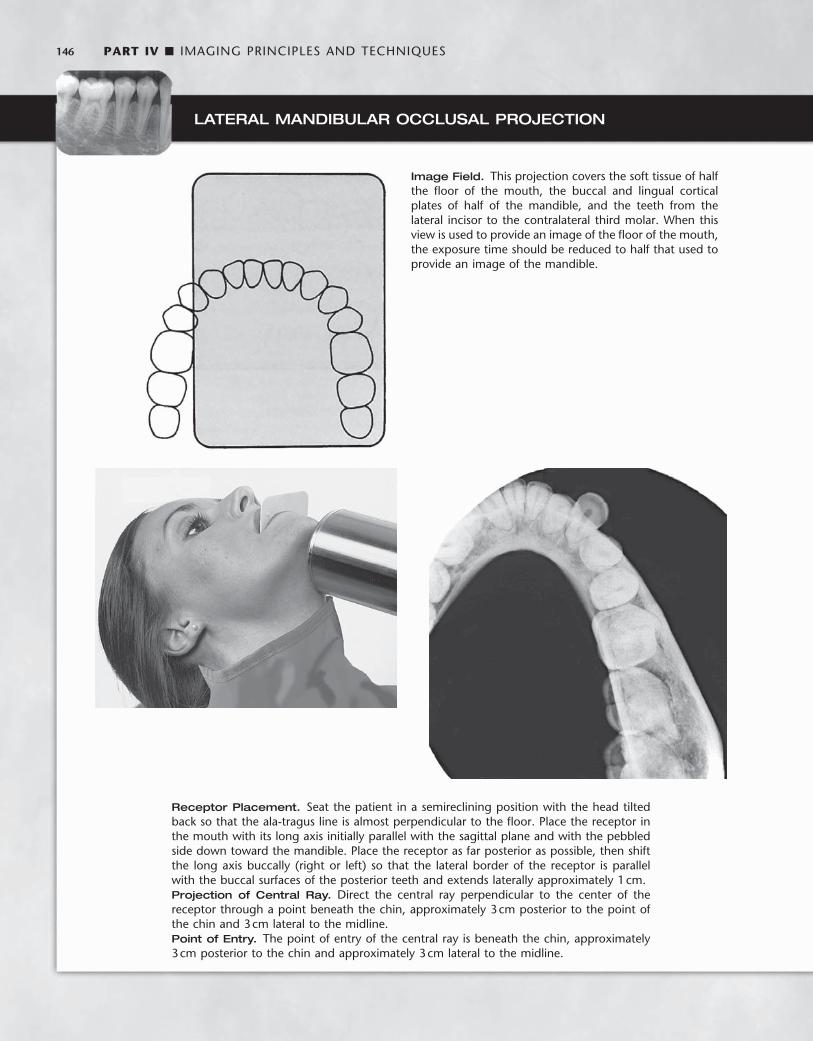
146 PART IV ■ IMAGING PRINCIPLES AND TECHNIQUES
LATERAL MANDIBULAR OCCLUSAL PROJECTION
Image Field. This projection covers the soft tissue of half the fl oor of the mouth, the buccal and lingual cortical plates of half of the mandible, and the teeth from the lateral incisor to the contralateral third molar. When this view is used to provide an image of the fl oor of the mouth, the exposure time should be reduced to half that used to provide an image of the mandible.
Receptor Placement. Seat the patient in a semireclining position with the head tilted back so that the ala-tragus line is almost perpendicular to the fl oor. Place the receptor in the mouth with its long axis initially parallel with the sagittal plane and with the pebbled side down toward the mandible. Place the receptor as far posterior as possible, then shift the long axis buccally (right or left) so that the lateral border of the receptor is parallel with the buccal surfaces of the posterior teeth and extends laterally approximately 1 cm. Projection of Central Ray. Direct the central ray perpendicular to the center of the receptor through a point beneath the chin, approximately 3 cm posterior to the point of the chin and 3 cm lateral to the midline. Point of Entry. The point of entry of the central ray is beneath the chin, approximately 3 cm posterior to the chin and approximately 3 cm lateral to the midline.
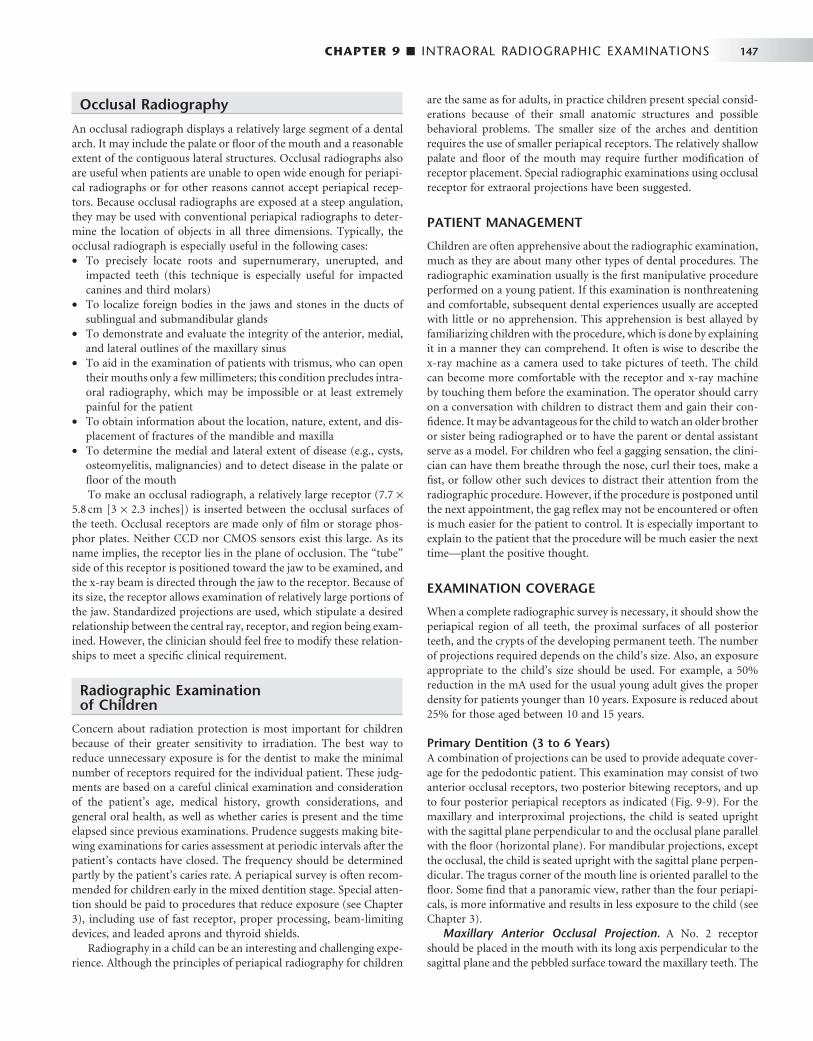
CHAPTER 9 ■ INTRAORAL RADIOGRAPHIC EXAMINATIONS 147
Occlusal Radiography
An occlusal radiograph displays a relatively large segment of a dental arch. It may include the palate or fl oor of the mouth and a reasonable extent of the contiguous lateral structures. Occlusal radiographs also are useful when patients are unable to open wide enough for periapi-cal radiographs or for other reasons cannot accept periapical recep-tors. Because occlusal radiographs are exposed at a steep angulation, they may be used with conventional periapical radiographs to deter-mine the location of objects in all three dimensions. Typically, the occlusal radiograph is especially useful in the following cases: • To precisely locate roots and supernumerary, unerupted, and
impacted teeth (this technique is especially useful for impacted canines and third molars)
• To localize foreign bodies in the jaws and stones in the ducts of sublingual and submandibular glands
• To demonstrate and evaluate the integrity of the anterior, medial, and lateral outlines of the maxillary sinus
• To aid in the examination of patients with trismus, who can open their mouths only a few millimeters; this condition precludes intra-oral radiography, which may be impossible or at least extremely painful for the patient
• To obtain information about the location, nature, extent, and dis-placement of fractures of the mandible and maxilla
• To determine the medial and lateral extent of disease (e.g., cysts, osteomyelitis, malignancies) and to detect disease in the palate or fl oor of the mouth To make an occlusal radiograph, a relatively large receptor (7.7 ×
5.8 cm [ 3 × 2.3 inches ] ) is inserted between the occlusal surfaces of the teeth. Occlusal receptors are made only of fi lm or storage phos-phor plates. Neither CCD nor CMOS sensors exist this large. As its name implies, the receptor lies in the plane of occlusion. The “ tube ” side of this receptor is positioned toward the jaw to be examined, and the x-ray beam is directed through the jaw to the receptor. Because of its size, the receptor allows examination of relatively large portions of the jaw. Standardized projections are used, which stipulate a desired relationship between the central ray, receptor, and region being exam-ined. However, the clinician should feel free to modify these relation-ships to meet a specifi c clinical requirement.
Radiographic Examination of Children
Concern about radiation protection is most important for children because of their greater sensitivity to irradiation. The best way to reduce unnecessary exposure is for the dentist to make the minimal number of receptors required for the individual patient. These judg-ments are based on a careful clinical examination and consideration of the patient ’ s age, medical history, growth considerations, and general oral health, as well as whether caries is present and the time elapsed since previous examinations. Prudence suggests making bite-wing examinations for caries assessment at periodic intervals after the patient ’ s contacts have closed. The frequency should be determined partly by the patient ’ s caries rate. A periapical survey is often recom-mended for children early in the mixed dentition stage. Special atten-tion should be paid to procedures that reduce exposure (see Chapter 3 ), including use of fast receptor, proper processing, beam-limiting devices, and leaded aprons and thyroid shields.
Radiography in a child can be an interesting and challenging expe-rience. Although the principles of periapical radiography for children
are the same as for adults, in practice children present special consid-erations because of their small anatomic structures and possible behavioral problems. The smaller size of the arches and dentition requires the use of smaller periapical receptors. The relatively shallow palate and fl oor of the mouth may require further modifi cation of receptor placement. Special radiographic examinations using occlusal receptor for extraoral projections have been suggested.
PATIENT MANAGEMENT
Children are often apprehensive about the radiographic examination, much as they are about many other types of dental procedures. The radiographic examination usually is the fi rst manipulative procedure performed on a young patient. If this examination is nonthreatening and comfortable, subsequent dental experiences usually are accepted with little or no apprehension. This apprehension is best allayed by familiarizing children with the procedure, which is done by explaining it in a manner they can comprehend. It often is wise to describe the x-ray machine as a camera used to take pictures of teeth. The child can become more comfortable with the receptor and x-ray machine by touching them before the examination. The operator should carry on a conversation with children to distract them and gain their con-fi dence. It may be advantageous for the child to watch an older brother or sister being radiographed or to have the parent or dental assistant serve as a model. For children who feel a gagging sensation, the clini-cian can have them breathe through the nose, curl their toes, make a fi st, or follow other such devices to distract their attention from the radiographic procedure. However, if the procedure is postponed until the next appointment, the gag refl ex may not be encountered or often is much easier for the patient to control. It is especially important to explain to the patient that the procedure will be much easier the next time — plant the positive thought.
EXAMINATION COVERAGE
When a complete radiographic survey is necessary, it should show the periapical region of all teeth, the proximal surfaces of all posterior teeth, and the crypts of the developing permanent teeth. The number of projections required depends on the child ’ s size. Also, an exposure appropriate to the child ’ s size should be used. For example, a 50% reduction in the mA used for the usual young adult gives the proper density for patients younger than 10 years. Exposure is reduced about 25% for those aged between 10 and 15 years.
Primary Dentition (3 to 6 Years) A combination of projections can be used to provide adequate cover-age for the pedodontic patient. This examination may consist of two anterior occlusal receptors, two posterior bitewing receptors, and up to four posterior periapical receptors as indicated ( Fig. 9-9 ). For the maxillary and interproximal projections, the child is seated upright with the sagittal plane perpendicular to and the occlusal plane parallel with the fl oor (horizontal plane). For mandibular projections, except the occlusal, the child is seated upright with the sagittal plane perpen-dicular. The tragus corner of the mouth line is oriented parallel to the fl oor. Some fi nd that a panoramic view, rather than the four periapi-cals, is more informative and results in less exposure to the child (see Chapter 3 ).
Maxillary Anterior Occlusal Projection. A No. 2 receptor should be placed in the mouth with its long axis perpendicular to the sagittal plane and the pebbled surface toward the maxillary teeth. The
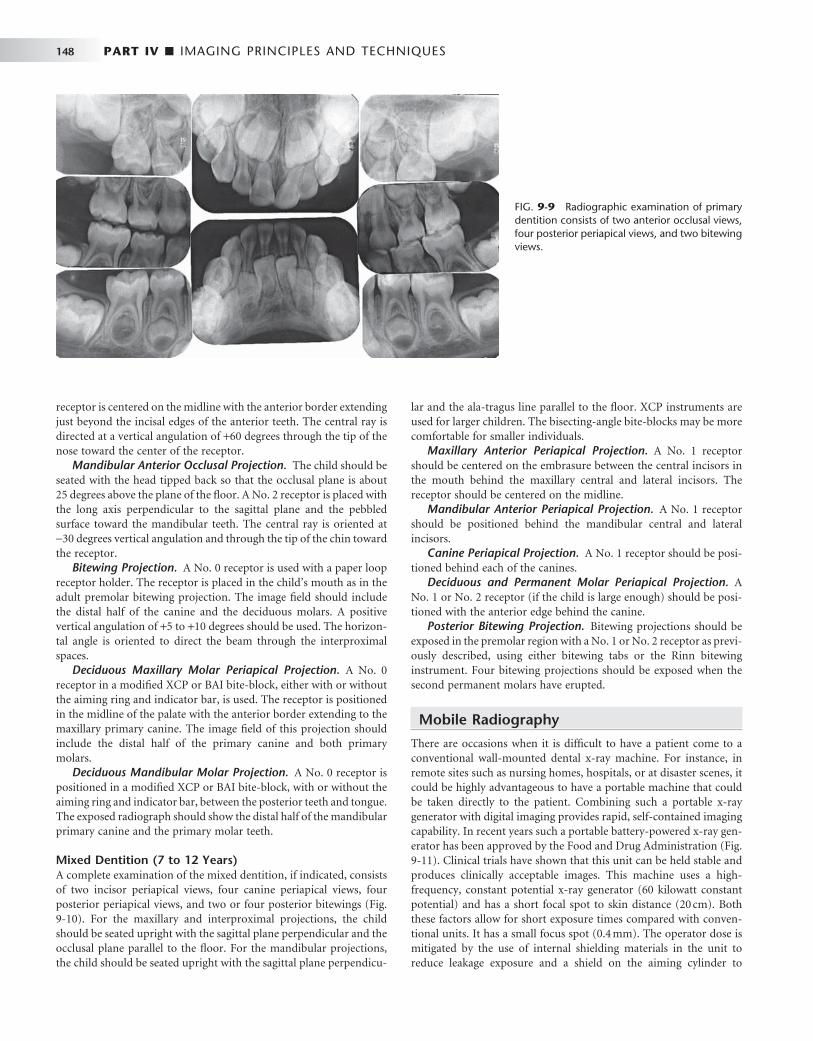
148 PART IV ■ IMAGING PRINCIPLES AND TECHNIQUES
receptor is centered on the midline with the anterior border extending just beyond the incisal edges of the anterior teeth. The central ray is directed at a vertical angulation of + 60 degrees through the tip of the nose toward the center of the receptor.
Mandibular Anterior Occlusal Projection. The child should be seated with the head tipped back so that the occlusal plane is about 25 degrees above the plane of the fl oor. A No. 2 receptor is placed with the long axis perpendicular to the sagittal plane and the pebbled surface toward the mandibular teeth. The central ray is oriented at − 30 degrees vertical angulation and through the tip of the chin toward the receptor.
Bitewing Projection. A No. 0 receptor is used with a paper loop receptor holder. The receptor is placed in the child ’ s mouth as in the adult premolar bitewing projection. The image fi eld should include the distal half of the canine and the deciduous molars. A positive vertical angulation of + 5 to + 10 degrees should be used. The horizon-tal angle is oriented to direct the beam through the interproximal spaces.
Deciduous Maxillary Molar Periapical Projection. A No. 0 receptor in a modifi ed XCP or BAI bite-block, either with or without the aiming ring and indicator bar, is used. The receptor is positioned in the midline of the palate with the anterior border extending to the maxillary primary canine. The image fi eld of this projection should include the distal half of the primary canine and both primary molars.
Deciduous Mandibular Molar Projection. A No. 0 receptor is positioned in a modifi ed XCP or BAI bite-block, with or without the aiming ring and indicator bar, between the posterior teeth and tongue. The exposed radiograph should show the distal half of the mandibular primary canine and the primary molar teeth.
Mixed Dentition (7 to 12 Years) A complete examination of the mixed dentition, if indicated, consists of two incisor periapical views, four canine periapical views, four posterior periapical views, and two or four posterior bitewings ( Fig. 9-10 ). For the maxillary and interproximal projections, the child should be seated upright with the sagittal plane perpendicular and the occlusal plane parallel to the fl oor. For the mandibular projections, the child should be seated upright with the sagittal plane perpendicu-
lar and the ala-tragus line parallel to the fl oor. XCP instruments are used for larger children. The bisecting-angle bite-blocks may be more comfortable for smaller individuals.
Maxillary Anterior Periapical Projection. A No. 1 receptor should be centered on the embrasure between the central incisors in the mouth behind the maxillary central and lateral incisors. The receptor should be centered on the midline.
Mandibular Anterior Periapical Projection. A No. 1 receptor should be positioned behind the mandibular central and lateral incisors.
Canine Periapical Projection. A No. 1 receptor should be posi-tioned behind each of the canines.
Deciduous and Permanent Molar Periapical Projection. A No. 1 or No. 2 receptor (if the child is large enough) should be posi-tioned with the anterior edge behind the canine.
Posterior Bitewing Projection. Bitewing projections should be exposed in the premolar region with a No. 1 or No. 2 receptor as previ-ously described, using either bitewing tabs or the Rinn bitewing instrument. Four bitewing projections should be exposed when the second permanent molars have erupted.
Mobile Radiography
There are occasions when it is diffi cult to have a patient come to a conventional wall-mounted dental x-ray machine. For instance, in remote sites such as nursing homes, hospitals, or at disaster scenes, it could be highly advantageous to have a portable machine that could be taken directly to the patient. Combining such a portable x-ray generator with digital imaging provides rapid, self-contained imaging capability. In recent years such a portable battery-powered x-ray gen-erator has been approved by the Food and Drug Administration ( Fig. 9-11 ). Clinical trials have shown that this unit can be held stable and produces clinically acceptable images. This machine uses a high-frequency, constant potential x-ray generator (60 kilowatt constant potential) and has a short focal spot to skin distance (20 cm). Both these factors allow for short exposure times compared with conven-tional units. It has a small focus spot (0.4 mm). The operator dose is mitigated by the use of internal shielding materials in the unit to reduce leakage exposure and a shield on the aiming cylinder to
FIG. 9-9 Radiographic examination of primary dentition consists of two anterior occlusal views, four posterior periapical views, and two bitewing views.

CHAPTER 9 ■ INTRAORAL RADIOGRAPHIC EXAMINATIONS 149
minimize backscatter from the patient. These units are approved for use in many but not all states in the United States.
Special Considerations
The radiographic procedures that have been described in this chapter are for the “ well ” patient. These procedures may need to be modifi ed for patients who have unusual diffi culties. Specifi c modifi cations depend on the patient ’ s physical and emotional characteristics. As with any dental procedure, however, the dental assistant begins the examination by showing appreciation of the patient ’ s condition and sympathy for any problems that might occur for either of them. If the assistant is kind but fi rm, the patient ’ s confi dence increases, which helps the patient relax and cooperate. Following are a few conditions and circumstances that may be encountered, with some recommenda-
tions and suggestions that may help the clinician achieve an adequate radiographic examination.
INFECTION
Infection in the orofacial structures may result in edema and lead to trismus of some of the muscles of mastication. As a result, intraoral radiography may be painful to the patient and diffi cult for both the patient and radiologist. Under such circumstances extraoral or occlu-sal techniques may offer the only possibility of an examination. The choice of a specifi c extraoral projection depends on the condition and the areas to be examined. Although the resulting radiograph may not be ideal in many respects, it usually provides more useful information than the diagnostician would have without it. In the case of edema in an area to be examined, exposure time should be increased to com-pensate for the tissue swelling.
TRAUMA
A patient who has undergone trauma may have a dental or facial fracture. Dental fractures are best appreciated by using periapical or occlusal radiographs. Special care must be taken when making these views because of the condition of the patient. Skeletal fractures are usually best seen with panoramic or other extraoral views or a com-puted tomography examination. In some cases patients with fractures of the facial skeleton may be bedridden because of involvement of other injuries. Consequently, an extraoral radiographic examination with the patient in the supine position is necessary. However, the cir-cumstances need not compromise the techniques, and satisfactory intraoral radiographs can be produced if the proper relative positions of the tube, patient, and receptor are observed.
PATIENTS WITH MENTAL DISABILITIES
Patients with mental disabilities may cause some diffi culty for the radiologist who is attempting an examination. The diffi culty usually is the result of the patient ’ s lack of coordination or inability to com-prehend what is expected. However, when the radiographic examina-tion is performed speedily, unpredictable moves by the patient can be minimized. In some cases sedation may be required.
FIG. 9-10 Radiographic examination of mixed dentition consists of two incisor views, four canine views, four posterior views, and two bite-wing views.
FIG. 9-11 Handheld x-ray machine useful for patients in remote situ-ations. Operator dose is reduced by internal shielding and shield on aiming cylinder to reduce backscatter. (Courtesy Aribex, Inc.)
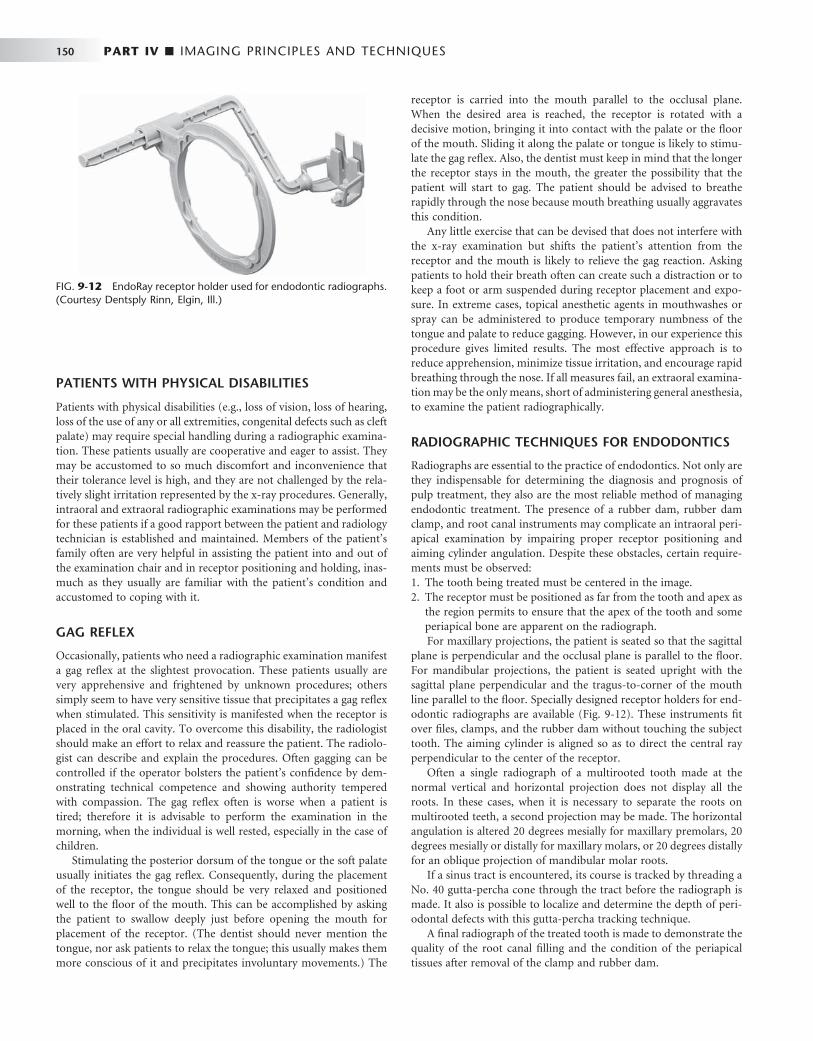
150 PART IV ■ IMAGING PRINCIPLES AND TECHNIQUES
PATIENTS WITH PHYSICAL DISABILITIES
Patients with physical disabilities (e.g., loss of vision, loss of hearing, loss of the use of any or all extremities, congenital defects such as cleft palate) may require special handling during a radiographic examina-tion. These patients usually are cooperative and eager to assist. They may be accustomed to so much discomfort and inconvenience that their tolerance level is high, and they are not challenged by the rela-tively slight irritation represented by the x-ray procedures. Generally, intraoral and extraoral radiographic examinations may be performed for these patients if a good rapport between the patient and radiology technician is established and maintained. Members of the patient ’ s family often are very helpful in assisting the patient into and out of the examination chair and in receptor positioning and holding, inas-much as they usually are familiar with the patient ’ s condition and accustomed to coping with it.
GAG REFLEX
Occasionally, patients who need a radiographic examination manifest a gag refl ex at the slightest provocation. These patients usually are very apprehensive and frightened by unknown procedures; others simply seem to have very sensitive tissue that precipitates a gag refl ex when stimulated. This sensitivity is manifested when the receptor is placed in the oral cavity. To overcome this disability, the radiologist should make an effort to relax and reassure the patient. The radiolo-gist can describe and explain the procedures. Often gagging can be controlled if the operator bolsters the patient ’ s confi dence by dem-onstrating technical competence and showing authority tempered with compassion. The gag refl ex often is worse when a patient is tired; therefore it is advisable to perform the examination in the morning, when the individual is well rested, especially in the case of children.
Stimulating the posterior dorsum of the tongue or the soft palate usually initiates the gag refl ex. Consequently, during the placement of the receptor, the tongue should be very relaxed and positioned well to the fl oor of the mouth. This can be accomplished by asking the patient to swallow deeply just before opening the mouth for placement of the receptor. (The dentist should never mention the tongue, nor ask patients to relax the tongue; this usually makes them more conscious of it and precipitates involuntary movements.) The
receptor is carried into the mouth parallel to the occlusal plane. When the desired area is reached, the receptor is rotated with a decisive motion, bringing it into contact with the palate or the fl oor of the mouth. Sliding it along the palate or tongue is likely to stimu-late the gag refl ex. Also, the dentist must keep in mind that the longer the receptor stays in the mouth, the greater the possibility that the patient will start to gag. The patient should be advised to breathe rapidly through the nose because mouth breathing usually aggravates this condition.
Any little exercise that can be devised that does not interfere with the x-ray examination but shifts the patient ’ s attention from the receptor and the mouth is likely to relieve the gag reaction. Asking patients to hold their breath often can create such a distraction or to keep a foot or arm suspended during receptor placement and expo-sure. In extreme cases, topical anesthetic agents in mouthwashes or spray can be administered to produce temporary numbness of the tongue and palate to reduce gagging. However, in our experience this procedure gives limited results. The most effective approach is to reduce apprehension, minimize tissue irritation, and encourage rapid breathing through the nose. If all measures fail, an extraoral examina-tion may be the only means, short of administering general anesthesia, to examine the patient radiographically.
RADIOGRAPHIC TECHNIQUES FOR ENDODONTICS
Radiographs are essential to the practice of endodontics. Not only are they indispensable for determining the diagnosis and prognosis of pulp treatment, they also are the most reliable method of managing endodontic treatment. The presence of a rubber dam, rubber dam clamp, and root canal instruments may complicate an intraoral peri-apical examination by impairing proper receptor positioning and aiming cylinder angulation. Despite these obstacles, certain require-ments must be observed: 1. The tooth being treated must be centered in the image. 2. The receptor must be positioned as far from the tooth and apex as
the region permits to ensure that the apex of the tooth and some periapical bone are apparent on the radiograph. For maxillary projections, the patient is seated so that the sagittal
plane is perpendicular and the occlusal plane is parallel to the fl oor. For mandibular projections, the patient is seated upright with the sagittal plane perpendicular and the tragus-to-corner of the mouth line parallel to the fl oor. Specially designed receptor holders for end-odontic radiographs are available ( Fig. 9-12 ). These instruments fi t over fi les, clamps, and the rubber dam without touching the subject tooth. The aiming cylinder is aligned so as to direct the central ray perpendicular to the center of the receptor.
Often a single radiograph of a multirooted tooth made at the normal vertical and horizontal projection does not display all the roots. In these cases, when it is necessary to separate the roots on multirooted teeth, a second projection may be made. The horizontal angulation is altered 20 degrees mesially for maxillary premolars, 20 degrees mesially or distally for maxillary molars, or 20 degrees distally for an oblique projection of mandibular molar roots.
If a sinus tract is encountered, its course is tracked by threading a No. 40 gutta-percha cone through the tract before the radiograph is made. It also is possible to localize and determine the depth of peri-odontal defects with this gutta-percha tracking technique.
A fi nal radiograph of the treated tooth is made to demonstrate the quality of the root canal fi lling and the condition of the periapical tissues after removal of the clamp and rubber dam.
FIG. 9-12 EndoRay receptor holder used for endodontic radiographs. (Courtesy Dentsply Rinn, Elgin, Ill.)

CHAPTER 9 ■ INTRAORAL RADIOGRAPHIC EXAMINATIONS 151
PREGNANCY
Although a fetus is sensitive to ionizing radiation, the amount of exposure received by an embryo or fetus during dental radiography is extremely low. No incidences have been reported of damage to a fetus from dental radiography. Regardless, prudence suggests that such radiographic examinations be kept to a minimum consistent with the mother ’ s dental needs. As with any patient, radiographic examination is limited during pregnancy to cases with a specifi c diag-nostic indication. With the low patient dose afforded by use of optimal radiation safety techniques (see Chapter 3 ), an intraoral or extraoral examination can be performed whenever a reasonable diagnostic requirement exists.
EDENTULOUS PATIENTS
Radiographic examination of edentulous patients is important, whether the area of interest is one tooth or an entire arch. These areas may contain roots, residual infection, impacted teeth, cysts, or other pathologic entities that may adversely affect the usefulness of pros-thetic appliances or the patient ’ s health. After a determination has been made that these entities are not present, repeated examinations to detect them are not warranted in the absence of signs or symptoms.
If available, a panoramic examination of the edentulous jaws is most convenient. If abnormalities of the alveolar ridges are identifi ed, the higher resolution of periapical receptor is used to make intraoral projections to supplement the panoramic examination.
In a completely or partly edentulous patient, a receptor-holding device is used for intraoral radiography of the alveolar ridges. Place-ment of the receptor-holding instrument may be complicated by its tipping into the voids normally occupied by the crowns of the missing teeth. To manage this diffi culty, cotton rolls are placed between the ridge and the receptor holder, supporting the holder in a horizontal position. An orthodontic elastic band to hold cotton rolls to the bite-block on the receptor holder often is useful when several such projec-tions must be exposed. With elastics, it is simple to maneuver the
cotton rolls into the areas that require support. The patient may steady the receptor-holding instrument with a hand or an opposing denture.
If panoramic equipment is not available, an examination consist-ing of 14 intraoral views provides an excellent survey. The exposure required for an edentulous ridge is approximately 25% less than that for a dentulous ridge. This examination consists of seven projections in each jaw (adult No. 2 receptor) as follows:
Central incisors (midline): one projection Lateral canine: two projections Premolar: two projections Molar: two projections
BIBLIOGRAPHY 1 Adriaens PA , De Boever J , Vande Velde F : Comparison of intra-oral long-
cone paralleling radiographic surveys and orthopantomographs with special reference to the bone height , J Oral Rehabil 9 : 355 - 365 , 1982 .
2 Biggerstaff RH , Phillips JR : A quantitative comparison of paralleling long-cone and bisection-of-angle periapical radiography , Oral Surg Oral Med Oral Pathol 62 : 673 - 677 , 1976 .
3 Dubrez B , Jacot-Descombes S , Cimasoni G : Reliability of a paralleling instrument for dental radiographs , Oral Surg Oral Med Oral Pathol Oral Radiol Endod 80 : 358 - 364 , 1995 .
4 Forsberg J , Halse A : Radiographic simulation of a periapical lesion comparing the paralleling and the bisecting-angle techniques , Int Endod J 27 : 133 - 138 , 1994 .
Iannucci J , Jansen Howerton L : Dental radiography: principles and techniques , ed 3 , St. Louis , Saunders , 2006 .
5 Scandrett FR , Tebo HG , Miller JT et al : Radiographic examination of the edentulous patient, 1: review of the literature and preliminary report comparing three methods , Oral Surg Oral Med Oral Pathol 35 : 266 - 274 , 1973 .
6 Schulze RK , d ’ Hoedt B : A method to calculate angular disparities between object and receptor in “paralleling technique,” Dentomaxillofac Radiol 31 : 32 - 38 , 2002 .
7 Weclew TV : Comparing the paralleling extension cone technique and the bisecting angle technique , J Acad Gen Dent 22 : 18 - 20 , 1974 .

C H A P T E R 1 0
Normal Radiographic Anatomy
The radiographic recognition of disease requires a sound knowl-edge of the radiographic appearance of normal structures. Intelligent diagnosis mandates an appreciation of the wide
range of variation in the appearance of normal anatomic structures. Similarly, most patients demonstrate many of the normal radio-graphic landmarks, but it is a rare patient who shows them all. Accord-ingly, the absence of one or even several such landmarks in any individual should not necessarily be considered abnormal.
Teeth
Teeth are composed primarily of dentin, with an enamel cap over the coronal portion and a thin layer of cementum over the root surface ( Fig. 10-1 ). The enamel cap characteristically appears more radi-opaque than the other tissues because it is the most dense, naturally occurring substance in the body. Because it is 90% mineral, it causes the greatest attenuation of x-ray photons. Its radiographic appearance is uniformly opaque and without evidence of the fi ne structure. Only the occlusal surface refl ects the complex gross anatomy. The dentin is about 75% mineralized, and because of its lower mineral content, its radiographic appearance is roughly comparable to that of bone. Dentin is smooth and homogeneous on radiographs because of its uniform morphologic features. The junction between enamel and dentin appears as a distinct interface that separates these two struc-tures. The thin layer of cementum on the root surface has a mineral content (50%) comparable to that of dentin. Cementum is not usually apparent radiographically because the contrast between it and dentin is so low and the cementum layer is so thin.
Diffuse radiolucent areas with ill-defi ned borders may be apparent radiographically on the mesial or distal aspects of teeth in the cervical regions between the edge of the enamel cap and the crest of the alveo-lar ridge ( Fig. 10-2 ). This phenomenon, called cervical burnout , is caused by the normal confi guration of the affected teeth, which results in decreased x-ray absorption in the areas in question. Close inspec-tion will reveal intact edges of the proximal surfaces. Furthermore, the perception of these radiolucent areas results from the contrast with the adjacent, relatively opaque enamel and alveolar bone. Such radio-lucencies should be anticipated in almost all teeth and should not be confused with root surface caries, which frequently have a similar appearance.
The pulp of normal teeth is composed of soft tissue and conse-quently appears radiolucent. The chambers and root canals contain-ing the pulp extend from the interior of the crown to the apices of the roots. Although the shape of most pulp chambers is fairly uniform within tooth groups, great variations exist among individuals in the
size of the pulp chambers and the extent of pulp horns. The practi-tioner must anticipate such variations in the proportions and distri-bution of the pulp and verify them radiographically when planning restorative procedures.
In normal, fully formed teeth the root canal may be apparent, extending from the pulp chamber to the apex of the root. An apical foramen is usually recognizable ( Fig. 10-3 ). In other normal teeth the canal may appear constricted in the region of the apex and not dis-cernible in the last millimeter or so of its length ( Fig. 10-4 ). In this case the canal may occasionally exit on the side of the tooth, just short of the radiographic apex. Lateral canals may occur as branches of an otherwise normal root canal. They may extend to the apex and end in a normal, discernible foramen or may exit the side of the root. In either case, two or more terminal foramina might cause endodontic treatment to fail if they are not identifi ed.
At the end of a developing tooth root the pulp canal diverges and the walls of the root rapidly taper to a knife edge ( Fig. 10-5 ). In the recess formed by the root walls and extending a short distance beyond is a small, rounded, radiolucent area in the trabecular bone, sur-rounded by a thin layer of hyperostotic bone. This is the dental papilla bounded by its bony crypt. The papilla forms the dentin and the pri-mordium of the pulp. When the tooth reaches maturity, the pulpal walls in the apical region begin to constrict and fi nally come into close apposition. Awareness of this sequence and its radiographic pattern is often useful in evaluating the stage of maturation of the developing tooth; it also helps avoid misidentifying the apical radiolucency as a periapical lesion.
In a mature tooth, the shape of the pulp chamber and canal may change. With aging occurs a gradual deposition of secondary dentin. This process begins apically, proceeds coronally, and may lead to pulp obliteration. Trauma to the tooth (e.g., from caries, a blow, restora-tions, attrition, or erosion) also may stimulate dentin production, leading to a reduction in size of the pulp chamber and canals. Such cases usually include evidence of the source of the pathologic stimulus. In the case of a blow to the teeth, however, only the patient ’ s recollec-tion may suggest the true reason for the reduced pulp chamber size.
Supporting Structures
LAMINA DURA
A radiograph of sound teeth in a normal dental arch demonstrates that the tooth sockets are bounded by a thin radiopaque layer of dense bone ( Fig. 10-6 ). Its name, lamina dura ( “ hard layer ” ), is derived from its radiographic appearance. This layer is continuous with the shadow of
152

CHAPTER 10 ■ NORMAL RADIOGRAPHIC ANATOMY 153
FIG. 10-1 Teeth are composed of pulp ( arrow on the second molar), enamel ( arrow on the fi rst molar), dentin ( arrow on the second premo-lar), and cementum (usually not visible radiographically).
FIG. 10-2 Cervical burnout caused by overexposure of the lateral portion of teeth between the enamel and alveolar crest (arrows).
FIG. 10-3 Root canals open at the apices of adult incisors (arrows).
FIG. 10-4 Although the root canal is not radiographically visible in the apical 2 mm of a tooth, anatomically it is present (arrow).
FIG. 10-5 A developing root shown by a divergent apex around the dental papilla (arrow), which is enclosed by an opaque bony crypt.
the cortical bone at the alveolar crest. It is only slightly thicker and no more highly mineralized than the trabeculae of cancellous bone in the area. Its radiographic appearance is caused by the fact that the x-ray beam passes tangentially through many times the thickness of the thin bony wall, which results in its observed attenuation (the egg-shell effect). Developmentally the lamina dura is an extension of the lining of the bony crypt that surrounds each tooth during development.
The appearance of the lamina dura on radiographs may vary. When the x-ray beam is directed through a relatively long expanse of the structure, the lamina dura appears radiopaque and well defi ned. When the beam is directed more obliquely, however, the lamina dura appears more diffuse and may not be discernible. In fact, even if the supporting bone in a healthy arch is intact, identifi cation of a lamina dura completely surrounding every root on each fi lm is frequently diffi cult, although it usually is evident to some extent about the roots on each fi lm ( Fig. 10-7 ). In addition, small variations and disruptions in the continuity of the lamina dura may result from superimposi-tions of cancellous bone and small nutrient canals passing from the marrow spaces to the periodontal ligament.
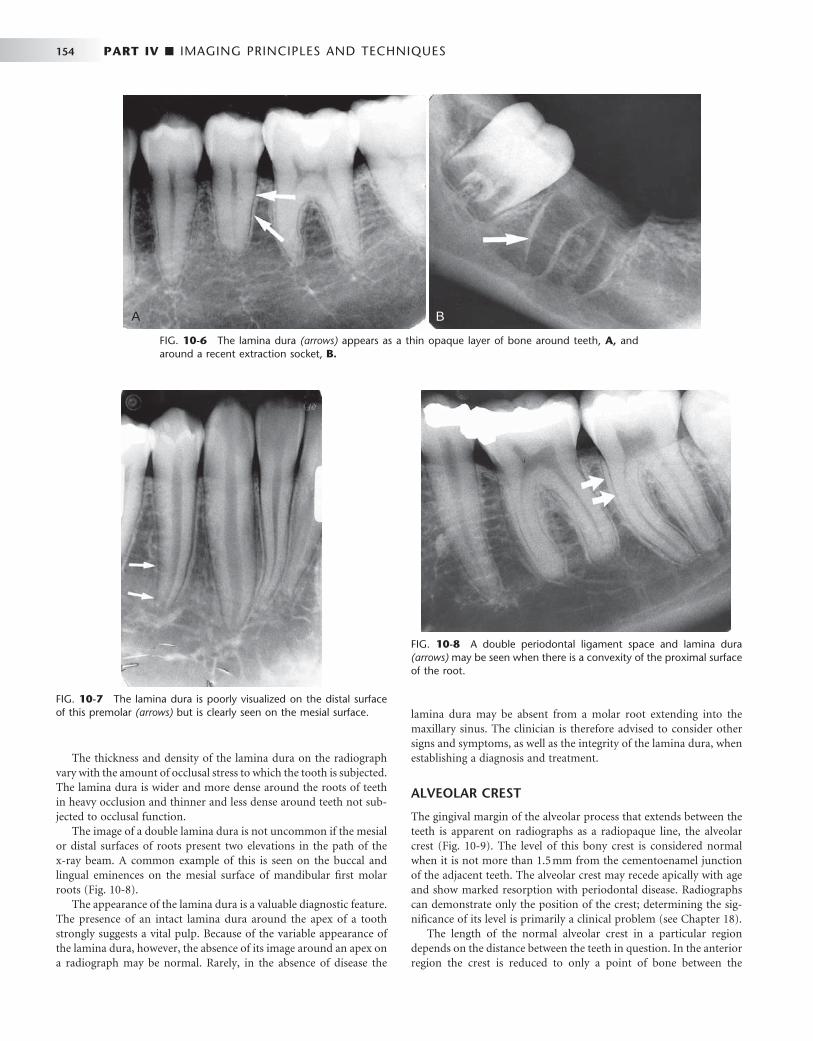
154 PART IV ■ IMAGING PRINCIPLES AND TECHNIQUES
The thickness and density of the lamina dura on the radiograph vary with the amount of occlusal stress to which the tooth is subjected. The lamina dura is wider and more dense around the roots of teeth in heavy occlusion and thinner and less dense around teeth not sub-jected to occlusal function.
The image of a double lamina dura is not uncommon if the mesial or distal surfaces of roots present two elevations in the path of the x-ray beam. A common example of this is seen on the buccal and lingual eminences on the mesial surface of mandibular fi rst molar roots ( Fig. 10-8 ).
The appearance of the lamina dura is a valuable diagnostic feature. The presence of an intact lamina dura around the apex of a tooth strongly suggests a vital pulp. Because of the variable appearance of the lamina dura, however, the absence of its image around an apex on a radiograph may be normal. Rarely, in the absence of disease the
lamina dura may be absent from a molar root extending into the maxillary sinus. The clinician is therefore advised to consider other signs and symptoms, as well as the integrity of the lamina dura, when establishing a diagnosis and treatment.
ALVEOLAR CREST
The gingival margin of the alveolar process that extends between the teeth is apparent on radiographs as a radiopaque line, the alveolar crest ( Fig. 10-9 ). The level of this bony crest is considered normal when it is not more than 1.5 mm from the cementoenamel junction of the adjacent teeth. The alveolar crest may recede apically with age and show marked resorption with periodontal disease. Radiographs can demonstrate only the position of the crest; determining the sig-nifi cance of its level is primarily a clinical problem (see Chapter 18 ).
The length of the normal alveolar crest in a particular region depends on the distance between the teeth in question. In the anterior region the crest is reduced to only a point of bone between the
FIG. 10-6 The lamina dura (arrows) appears as a thin opaque layer of bone around teeth, A, and around a recent extraction socket, B.
A B
FIG. 10-7 The lamina dura is poorly visualized on the distal surface of this premolar (arrows) but is clearly seen on the mesial surface.
FIG. 10-8 A double periodontal ligament space and lamina dura (arrows) may be seen when there is a convexity of the proximal surface of the root.

CHAPTER 10 ■ NORMAL RADIOGRAPHIC ANATOMY 155
close-set incisors. Posteriorly it is fl at, aligned parallel with and slightly below a line connecting the cementoenamel junctions of the adjacent teeth. The crest of the bone is continuous with the lamina dura and forms a sharp angle with it. Rounding of these sharp junctions is indicative of periodontal disease.
The image of the crest varies from a dense layer of cortical bone to a smooth surface without cortical bone. In the latter case the tra-beculae at the surface are of normal size and density. In the posterior regions this range of radiodensity of the crest is presumed to be normal if the bone is at a proper level in relation to the teeth. The absence of an image of cortex between the incisors, however, is con-sidered by many to be an indication of incipient disease, even if the level of the bone is not abnormal.
PERIODONTAL LIGAMENT SPACE
Because the periodontal ligament (PDL) is composed primarily of collagen, it appears as a radiolucent space between the tooth root and the lamina dura. This space begins at the alveolar crest, extends around the portions of the tooth roots within the alveolus, and returns to the alveolar crest on the opposite side of the tooth ( Fig. 10-10 ).
The PDL varies in width from patient to patient, from tooth to tooth in the individual, and even from location to location around one tooth ( Fig. 10-11 ). Usually it is thinner in the middle of the root and slightly wider near the alveolar crest and root apex, suggesting that the fulcrum of physiologic movement is in the region where the PDL is thinnest. The thickness of the ligament relates to the degree of function because the PDL is thinnest around the roots of embedded teeth and those that have lost their antagonists. The reverse is not necessarily true, however, because an appreciably wider space is not regularly observed in persons with especially heavy occlusion or bruxism.
The shape of the tooth creates the appearance of a double PDL space. When the x-ray beam is directed so that two convexities of a root surface appear on a fi lm, the double PDL space is seen (see Fig. 10-8 ).
CANCELLOUS BONE
The cancellous bone (also called trabecular bone or spongiosa ) lies between the cortical plates in both jaws. It is composed of thin radi-
opaque plates and rods (trabeculae) surrounding many small radio-lucent pockets of marrow. The radiographic pattern of the trabeculae comes from two anatomic sources. First is the cancellous bone itself. The second is the endosteal surface of the outer cortical bone where the cancellous bone fuses with the cortical bone. At this surface tra-becular plates are relatively thick and make a signifi cant contribution to the radiographic image. The trabecular pattern shows considerable intrapatient and interpatient variability, which is normal and not a manifestation of disease. To evaluate the trabecular pattern in a spe-cifi c area, the practitioner should examine the trabecular distribution, size, and density and compare them throughout both jaws, and espe-cially to the corresponding region on the opposite side. This fre-quently demonstrates that a particularly suspect region is characteristic for the individual.
FIG. 10-9 The alveolar crests (arrows) are seen as cortical borders of the alveolar bone.
FIG. 10-10 The periodontal ligament space (arrows) is seen as a narrow radiolucency between the tooth root and lamina dura.
FIG. 10-11 The periodontal ligament space appears wide on the mesial surface of this canine (arrows) and thin on the distal surface.
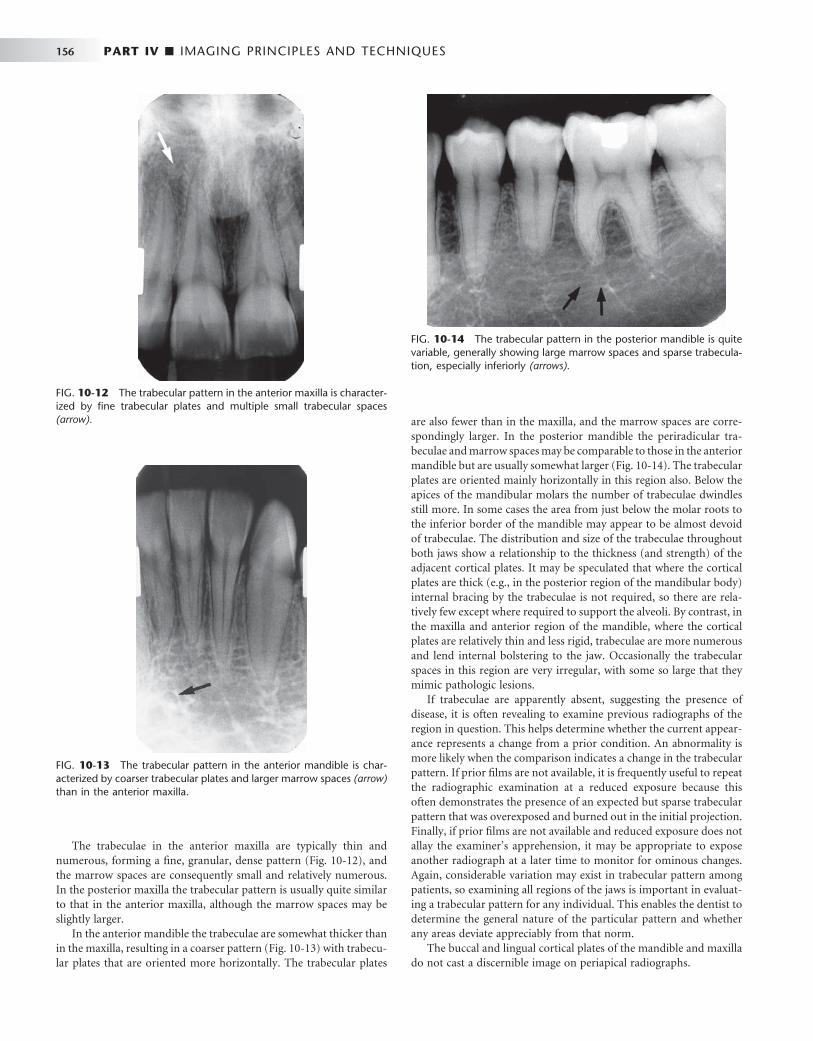
156 PART IV ■ IMAGING PRINCIPLES AND TECHNIQUES
The trabeculae in the anterior maxilla are typically thin and numerous, forming a fi ne, granular, dense pattern ( Fig. 10-12 ), and the marrow spaces are consequently small and relatively numerous. In the posterior maxilla the trabecular pattern is usually quite similar to that in the anterior maxilla, although the marrow spaces may be slightly larger.
In the anterior mandible the trabeculae are somewhat thicker than in the maxilla, resulting in a coarser pattern ( Fig. 10-13 ) with trabecu-lar plates that are oriented more horizontally. The trabecular plates
are also fewer than in the maxilla, and the marrow spaces are corre-spondingly larger. In the posterior mandible the periradicular tra-beculae and marrow spaces may be comparable to those in the anterior mandible but are usually somewhat larger ( Fig. 10-14 ). The trabecular plates are oriented mainly horizontally in this region also. Below the apices of the mandibular molars the number of trabeculae dwindles still more. In some cases the area from just below the molar roots to the inferior border of the mandible may appear to be almost devoid of trabeculae. The distribution and size of the trabeculae throughout both jaws show a relationship to the thickness (and strength) of the adjacent cortical plates. It may be speculated that where the cortical plates are thick (e.g., in the posterior region of the mandibular body) internal bracing by the trabeculae is not required, so there are rela-tively few except where required to support the alveoli. By contrast, in the maxilla and anterior region of the mandible, where the cortical plates are relatively thin and less rigid, trabeculae are more numerous and lend internal bolstering to the jaw. Occasionally the trabecular spaces in this region are very irregular, with some so large that they mimic pathologic lesions.
If trabeculae are apparently absent, suggesting the presence of disease, it is often revealing to examine previous radiographs of the region in question. This helps determine whether the current appear-ance represents a change from a prior condition. An abnormality is more likely when the comparison indicates a change in the trabecular pattern. If prior fi lms are not available, it is frequently useful to repeat the radiographic examination at a reduced exposure because this often demonstrates the presence of an expected but sparse trabecular pattern that was overexposed and burned out in the initial projection. Finally, if prior fi lms are not available and reduced exposure does not allay the examiner ’ s apprehension, it may be appropriate to expose another radiograph at a later time to monitor for ominous changes. Again, considerable variation may exist in trabecular pattern among patients, so examining all regions of the jaws is important in evaluat-ing a trabecular pattern for any individual. This enables the dentist to determine the general nature of the particular pattern and whether any areas deviate appreciably from that norm.
The buccal and lingual cortical plates of the mandible and maxilla do not cast a discernible image on periapical radiographs.
FIG. 10-12 The trabecular pattern in the anterior maxilla is character-ized by fi ne trabecular plates and multiple small trabecular spaces (arrow).
FIG. 10-13 The trabecular pattern in the anterior mandible is char-acterized by coarser trabecular plates and larger marrow spaces (arrow) than in the anterior maxilla.
FIG. 10-14 The trabecular pattern in the posterior mandible is quite variable, generally showing large marrow spaces and sparse trabecula-tion, especially inferiorly (arrows).
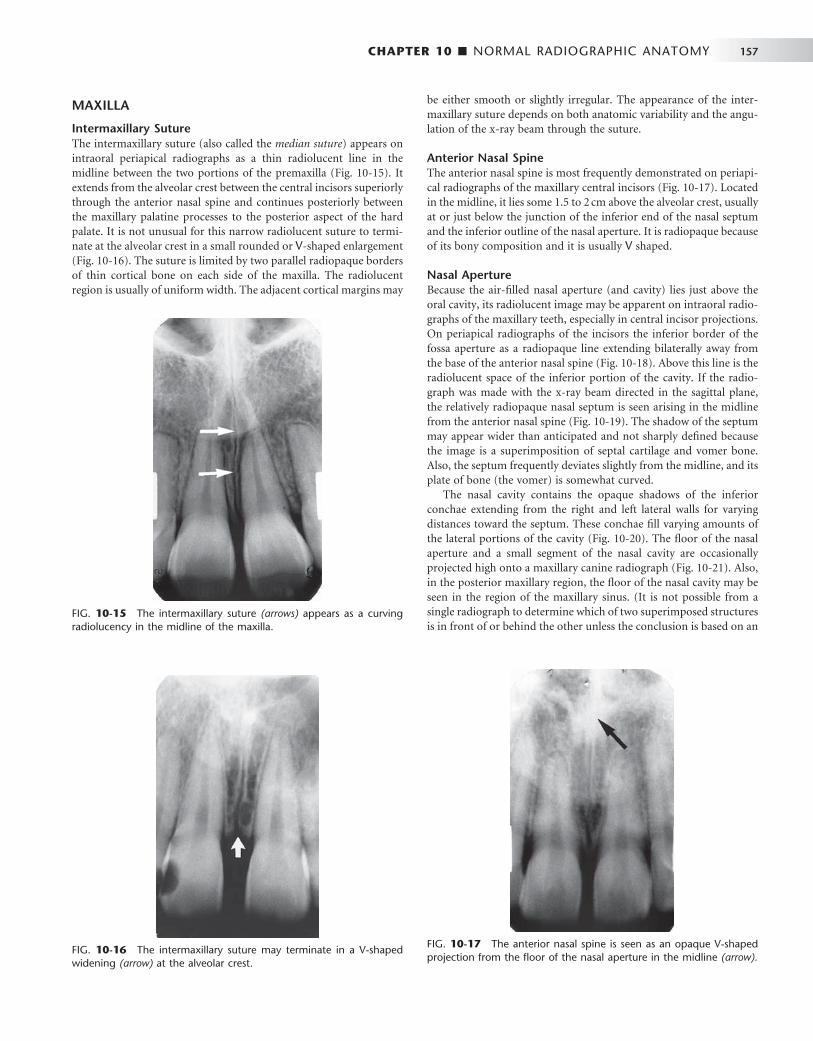
CHAPTER 10 ■ NORMAL RADIOGRAPHIC ANATOMY 157
MAXILLA
Intermaxillary Suture The intermaxillary suture (also called the median suture ) appears on intraoral periapical radiographs as a thin radiolucent line in the midline between the two portions of the premaxilla ( Fig. 10-15 ). It extends from the alveolar crest between the central incisors superiorly through the anterior nasal spine and continues posteriorly between the maxillary palatine processes to the posterior aspect of the hard palate. It is not unusual for this narrow radiolucent suture to termi-nate at the alveolar crest in a small rounded or V -shaped enlargement ( Fig. 10-16 ). The suture is limited by two parallel radiopaque borders of thin cortical bone on each side of the maxilla. The radiolucent region is usually of uniform width. The adjacent cortical margins may
be either smooth or slightly irregular. The appearance of the inter-maxillary suture depends on both anatomic variability and the angu-lation of the x-ray beam through the suture.
Anterior Nasal Spine The anterior nasal spine is most frequently demonstrated on periapi-cal radiographs of the maxillary central incisors ( Fig. 10-17 ). Located in the midline, it lies some 1.5 to 2 cm above the alveolar crest, usually at or just below the junction of the inferior end of the nasal septum and the inferior outline of the nasal aperture. It is radiopaque because of its bony composition and it is usually V shaped.
Nasal Aperture Because the air-fi lled nasal aperture (and cavity) lies just above the oral cavity, its radiolucent image may be apparent on intraoral radio-graphs of the maxillary teeth, especially in central incisor projections. On periapical radiographs of the incisors the inferior border of the fossa aperture as a radiopaque line extending bilaterally away from the base of the anterior nasal spine ( Fig. 10-18 ). Above this line is the radiolucent space of the inferior portion of the cavity. If the radio-graph was made with the x-ray beam directed in the sagittal plane, the relatively radiopaque nasal septum is seen arising in the midline from the anterior nasal spine ( Fig. 10-19 ). The shadow of the septum may appear wider than anticipated and not sharply defi ned because the image is a superimposition of septal cartilage and vomer bone. Also, the septum frequently deviates slightly from the midline, and its plate of bone (the vomer) is somewhat curved.
The nasal cavity contains the opaque shadows of the inferior conchae extending from the right and left lateral walls for varying distances toward the septum. These conchae fi ll varying amounts of the lateral portions of the cavity ( Fig. 10-20 ). The fl oor of the nasal aperture and a small segment of the nasal cavity are occasionally projected high onto a maxillary canine radiograph ( Fig. 10-21 ). Also, in the posterior maxillary region, the fl oor of the nasal cavity may be seen in the region of the maxillary sinus. (It is not possible from a single radiograph to determine which of two superimposed structures is in front of or behind the other unless the conclusion is based on an
FIG. 10-15 The intermaxillary suture (arrows) appears as a curving radiolucency in the midline of the maxilla.
FIG. 10-16 The intermaxillary suture may terminate in a V-shaped widening (arrow) at the alveolar crest.
FIG. 10-17 The anterior nasal spine is seen as an opaque V-shaped projection from the fl oor of the nasal aperture in the midline (arrow).
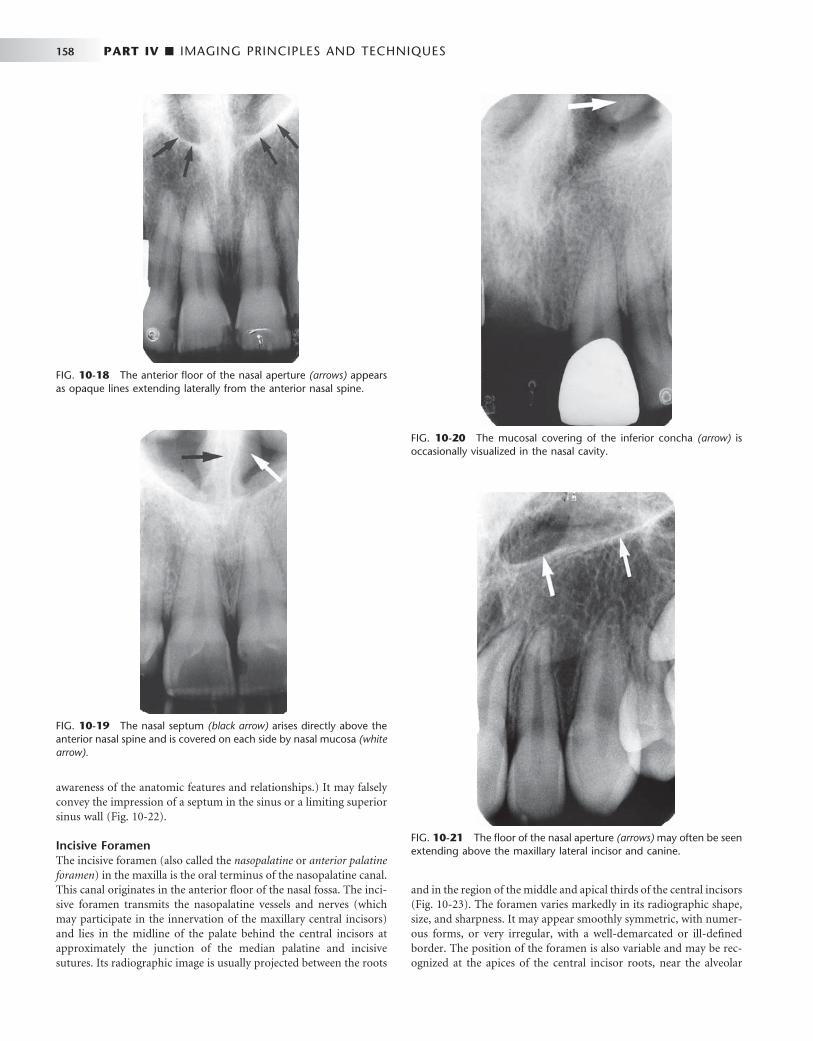
158 PART IV ■ IMAGING PRINCIPLES AND TECHNIQUES
FIG. 10-18 The anterior fl oor of the nasal aperture (arrows) appears as opaque lines extending laterally from the anterior nasal spine.
FIG. 10-19 The nasal septum (black arrow) arises directly above the anterior nasal spine and is covered on each side by nasal mucosa (white arrow).
FIG. 10-20 The mucosal covering of the inferior concha (arrow) is occasionally visualized in the nasal cavity.
FIG. 10-21 The fl oor of the nasal aperture (arrows) may often be seen extending above the maxillary lateral incisor and canine.
awareness of the anatomic features and relationships.) It may falsely convey the impression of a septum in the sinus or a limiting superior sinus wall ( Fig. 10-22 ).
Incisive Foramen The incisive foramen (also called the nasopalatine or anterior palatine foramen ) in the maxilla is the oral terminus of the nasopalatine canal. This canal originates in the anterior fl oor of the nasal fossa. The inci-sive foramen transmits the nasopalatine vessels and nerves (which may participate in the innervation of the maxillary central incisors) and lies in the midline of the palate behind the central incisors at approximately the junction of the median palatine and incisive sutures. Its radiographic image is usually projected between the roots
and in the region of the middle and apical thirds of the central incisors ( Fig. 10-23 ). The foramen varies markedly in its radiographic shape, size, and sharpness. It may appear smoothly symmetric, with numer-ous forms, or very irregular, with a well-demarcated or ill-defi ned border. The position of the foramen is also variable and may be rec-ognized at the apices of the central incisor roots, near the alveolar

CHAPTER 10 ■ NORMAL RADIOGRAPHIC ANATOMY 159
FIG. 10-22 The fl oor of the nasal aperture (arrows) extends posteri-orly, superimposed with the maxillary sinus.
FIG. 10-23 A, The incisive foramen appears as an ovoid radiolucency (arrows) between the roots of the central inci-sors. B, Note its borders, which are diffuse but within normal limits.
A B
crest, anywhere in between, or extending over the entire distance. The great variability of its radiographic image is primarily the result of (1) the differing angles at which the x-ray beam is directed for the maxillary central incisors and (2) some variability in its anatomic size.
Familiarity with the incisive foramen is important because it is a potential site of cyst formation. An incisive canal cyst is radiographi-cally discernible because it frequently causes a readily perceived enlargement of the foramen and canal. The presence of a cyst is pre-sumed if the width of the foramen exceeds 1 cm or if enlargement can be demonstrated on successive radiographs. Also, if the radiolucency of the normal foramen is projected over the apex of one central incisor, it may suggest a pathologic periapical condition. The absence of disease is indicated by a lack of clinical symptoms and an intact lamina dura around the central incisor in question.
The lateral walls of the nasopalatine canal are not usually seen on periapical views but on occasion can be visualized on a projection of the central incisors as a pair of radiopaque lines running vertically from the superior foramina of the nasopalatine canal to the incisive foramen ( Fig. 10-24, A ). Cone-beam images of this region, however, regularly demonstrate the borders of the nasopalatine canal ( Figs. 10-24, B and C ). Visualization of these structures is important when placing an implant in this region is considered.
Superior Foramina of the Nasopalatine Canal The nasopalatine canal originates at two foramina in the fl oor of the nasal cavity. The openings are on each side of the nasal septum, close to the anteroinferior border of the nasal cavity, and each canal passes downward somewhat anteriorly and medially to unite with the canal from the other side in a common opening, the incisive (nasopalatine) foramen. The superior foramina of the canal occasionally appear in projections of the maxillary incisors, especially when an exaggerated vertical angle is used ( Fig. 10-25 ). They are usually round or oval, although they make take a variety of outlines, depending on the angle of projection.
Lateral Fossa The lateral fossa (also called incisive fossa ) is a gentle depression in the maxilla near the apex of the lateral incisor ( Fig. 10-26 ). On periapical projections of this region it may appear diffusely radiolucent. The image will not be misinterpreted as a pathologic condition, however, if the radiograph is examined for an intact lamina dura around the root of the lateral incisor. This fi nding, coupled with absence of clini-cal symptoms, suggests normalcy of the bone.
Nose The soft tissue of the tip of the nose is frequently seen in projections of the maxillary central and lateral incisors, superimposed over the roots of these teeth. The image of the nose has a uniform, slightly opaque appear-ance with a sharp border ( Fig. 10-27 ). Occasionally the radiolucent nares can be identifi ed, especially when a steep vertical angle is used.

160 PART IV ■ IMAGING PRINCIPLES AND TECHNIQUES
A
C
B
FIG. 10-24 Nasopalatine Canal. A, The lateral walls of the nasopalatine canal (arrows) extend from the incisive foramen to the fl oor of the nasal fossa. B, Cone-beam image in the sagittal plane demonstrates superior foramina in the fl oor of the nasal fossa, the anterior and posterior borders of the canal, and the incisive foramen opening onto the hard palate. C, Cone-beam image in the axial plane at the level of the incisive foramen demon-strates anterior and lateral borders of the incisive canal lying palatal to the incisor roots seen in cross section. ( B and C made with 3DX Accuitomo, J. Morita.)
FIG. 10-25 The superior foramina of the nasopalatine canal (arrows ) appear just lateral to the nasal septum and posterior to the anterior nasal spine.
FIG. 10-26 The lateral fossa is a diffuse radiolucency (arrows) in the region of the apex of the lateral incisor. It is formed by a depression in the maxilla at this location.

CHAPTER 10 ■ NORMAL RADIOGRAPHIC ANATOMY 161
Nasolacrimal Canal The nasal and maxillary bones form the nasolacrimal canal. It runs from the medial aspect of the anteroinferior border of the orbit infe-riorly to drain under the inferior concha into the nasal cavity. Occa-sionally it can be visualized on periapical radiographs in the region above the apex of the canine, especially when steep vertical angulation is used ( Fig. 10-28 ). The nasolacrimal canals are routinely seen on maxillary occlusal projections (see Chapter 9 ) in the region of the molars ( Fig. 10-29 ).
Maxillary Sinus The maxillary sinus, like the other paranasal sinuses, is an air-containing cavity lined with mucous membrane. It develops by the invagination of mucous membrane from the nasal cavity. The largest of the paranasal sinuses, it normally occupies virtually the entire body of the maxilla. Its function is unknown.
The sinus may be considered as a three-sided pyramid, with its base the medial wall adjacent to the nasal cavity and its apex extending laterally into the zygomatic process of the maxilla. Its three sides are (1) the superior wall forming the fl oor of the orbit, (2) the anterior wall extending above the premolars, and (3) the posterior wall bulging above the molar teeth and maxillary tuberosity. The sinus communi-cates with the nasal cavity by the ostium, some 3 to 6 mm in diameter positioned and under the posterior aspect of the middle concha of the ethmoid bone.
The borders of the maxillary sinus appear on periapical radio-graphs as a thin, delicate, tenuous radiopaque line (actually a thin layer of cortical bone) ( Fig. 10-30 ). In the absence of disease it appears continuous, but on close examination it can be seen to have small interruptions in its smoothness or density. These discontinuities are probably illusions caused by superimposition of small marrow spaces. In adults the sinuses are usually seen to extend from the distal aspect of the canine to the posterior wall of the maxilla above the tuberosity.
The maxillary sinuses show considerable variation in size. They enlarge during childhood, achieving mature size by the age of 15 to 18 years. They may change during adult life in response to environ-
FIG. 10-27 The soft tissue outline of the nose (arrows) is superim-posed on the anterior maxilla.
FIG. 10-28 The nasolacrimal canal (arrow) is occasionally seen near the apex of the canine when steep vertical angulation is used. Note the mesiodens (supernumerary tooth) superior to the central incisor.
FIG. 10-29 The nasolacrimal canals are commonly seen as ovoid radiolucencies (arrows) on maxillary occlusal projections.
mental factors. The right and left sinuses usually appear similar in shape and size, although marked asymmetry is occasionally present. The fl oors of the maxillary sinus and nasal cavity are seen on dental radiographs at approximately the same level around the age of puberty. In older individuals the sinus may extend farther into the alveolar process, and in the posterior region of the maxilla its fl oor may appear considerably below the level of the fl oor of the nasal cavity. Anteriorly each sinus is restricted by the canine fossa and is usually seen to sweep superiorly, crossing the level of the fl oor of the nasal cavity in the premolar or canine region. Consequently, on periapical radiographs of the canine, the fl oors of the sinus and nasal cavity are often super-imposed and may be seen crossing one another, forming an inverted Y in the area ( Fig. 10-31 ).

162 PART IV ■ IMAGING PRINCIPLES AND TECHNIQUES
The outline of the nasal fossa is usually heavier and more diffuse than that of the thin, delicate cortical bone denoting the sinus. The degree of extension of the maxillary sinus into the alveolar process is extremely variable. In some projections the fl oor of the sinus will be well above the apices of the posterior teeth; in others it may extend well beyond the apices toward the alveolar ridge. In response to a loss of function (associated with the loss of posterior teeth) the sinus may expand farther into the alveolar bone, occasionally extending to the alveolar ridge ( Fig. 10-32 ).
The roots of the molars usually lie in close apposition to the maxil-lary sinus. Root apices may project anatomically into the fl oor of the sinus, causing small elevations or prominences. The thin layer of bone covering the root is seen as a fusion of the lamina dura and the fl oor of the sinus. Rarely, defects may be present in the bony covering of the root apices in the sinus fl oor, and a periapical radiograph will fail to show lamina dura covering the apex.
When the rounded sinus fl oor dips between the buccal and palatal molar roots and is medial to the premolar roots, the projection of the apices is superior to the fl oor. This appearance conveys the impression that the roots project into the sinus cavity, which is an illusion. As the positive vertical angle of the projection is increased, the roots medial to the sinus appear to project farther into the sinus cavity. In contrast, the roots that are lateral to the sinus appear to move either out of the sinus or farther away from it as the angle is increased.
The intimate relationship between sinus and teeth leads to the possibility that clinical symptoms originating in the sinus may be perceived in the teeth and vice versa. This proximity of sinus and teeth is in part a consequence of the gradual developmental expansion of the maxillary sinus, which thins the sinus walls and opens the canals that traverse the anterolateral and posterolateral walls and carry the superior alveolar nerves. The nerves are then in intimate contact with the membrane lining the sinus. As a result, an acute infl ammation of the sinus is frequently accompanied by pain in the maxillary teeth innervated by that portion of the nerve proximal to the insult. Subjec-tive symptoms in the area of the maxillary posterior teeth may require careful analysis to differentiate tooth pain from sinus pain.
Frequently, thin radiolucent lines of uniform width are found within the image of the maxillary sinus ( Fig. 10-33 ). These are the shadows of neurovascular canals or grooves in the lateral sinus walls that accommodate the posterior superior alveolar vessels, their branches, and the accompanying superior alveolar nerves. Although
FIG. 10-30 The inferior border of the maxillary sinus (arrows) appears as a thin radiopaque line near the apices of the maxillary premolars and molars.
FIG. 10-31 The anterior border of the maxillary sinus (white arrows) crosses the fl oor of the nasal fossa (black arrow) .
FIG. 10-32 The fl oor of the maxillary sinus (arrows) extends toward the crest of the alveolar ridge in response to missing teeth.
A B

CHAPTER 10 ■ NORMAL RADIOGRAPHIC ANATOMY 163
A B
C
they may be found coursing in any direction (including vertically), they are usually seen running a curved posteroanterior course that is convex toward the alveolar process. On occasion they may be found to branch and rarely also to extend outside the image of the sinus and continue as an interradicular channel. Because such vascular mark-ings are not seen in the walls of cysts, they may serve to distinguish a healthy sinus from a cyst.
Often one or several radiopaque lines traverse the image of the maxillary sinus ( Fig. 10-34 ). These opaque lines are called septa . They are thin folds of cortical bone that projecting a few millimeters away from the fl oor and wall of the antrum or they may extend across the sinus. They are usually oriented vertically vary in number, thickness, and length. They appear on many periapical intraoral radiographs and frequently on cone-beam images. Although septa appear to sepa-rate the sinuses into distinct compartments, this is seldom the case. Rather, the septa typically extend only a few millimeters into the central volume of the sinus. Septa deserve attention because they sometimes mimic periapical disease, and the chambers they create in
FIG. 10-33 Neurovascular canals (arrows) in the lateral wall of the maxillary sinus.
FIG. 10-34 Maxillary Sinus Septa. A, Septum (arrow) in the maxillary sinus formed by a low ridge of bone on the sinus wall. (See also Fig. 10-32, B ). B, Septa in region of missing fi rst molar. Note also thickening of sinus mucous membrane. C, Cross section of B at level of septum showing extension of septa from buccal to palatal wall of sinus. ( B and C made with 3DX Accuitomo, J. Morita.)

164 PART IV ■ IMAGING PRINCIPLES AND TECHNIQUES
the alveolar recess may complicate the search for a root fragment dis-placed into the sinus.
The fl oor of the maxillary sinus occasionally shows small radi-opaque projections, which are nodules of bone ( Fig. 10-35 ). These must be differentiated from root tips, which they resemble in shape. In contrast to a root fragment, which is quite homogeneous in appear-ance, the bony nodules often show trabeculation; and although they may be quite well defi ned, at certain points on their surface they blend with the trabecular pattern of adjacent bone. A root fragment may also be recognized by the presence of a root canal. It is not uncommon to see the fl oor of the nasal fossa in periapical views of the posterior teeth superimposed on the maxillary sinus (see Fig. 10-22 ). The fl oor of the nasal fossa is usually oriented more or less horizontally, depend-ing on fi lm placement, and is superimposed high on maxillary views. The image, a solid opaque line, frequently appears somewhat thicker than the adjacent sinus walls and septa.
Zygomatic Process and Zygomatic Bone The zygomatic process of the maxilla is an extension of the lateral maxillary surface that arises in the region of the apices of the fi rst and second molars and serves as the articulation for the zygomatic bone.
On periapical radiographs the zygomatic process appears as a U -shaped radiopaque line with its open end directed superiorly. The enclosed rounded end is projected in the apical region of the fi rst and second molars ( Fig. 10-36 ). The size, width, and defi nition of the zygomatic process are quite variable, and its image may be large, depending on the angle at which the beam was projected. The maxil-lary antrum may expand laterally into the zygomatic process of the maxilla (and even into the zygomatic bone after the maxillozygomatic suture has fused), thereby resulting in a relatively increased radiolu-cent region within the U-shaped image of the process.
When the sinus is recessed deep within the process (and perhaps into the zygomatic bone), the image of the air space within the process is dark, and typically, the walls of the process are rather thin and well defi ned (in contrast to the very dark radiolucent air space). When the sinus exhibits relatively little penetration of the maxillary process (usually in younger individuals or those who have maintained their posterior teeth and vigorous masticatory function), the image of the walls of the zygomatic process tends to be somewhat thicker, and the appearance of the sinus in this region is somewhat smaller and more opaque.
The inferior portion of the zygomatic bone may be seen extending posteriorly from the inferior border of the zygomatic process of the maxilla (thereby completing the zygomatic arch between the zygo-matic processes of the maxillary and temporal bones). It can be identi-fi ed as a uniform gray or white radiopacity over the apices of the molars ( Fig. 10-37 ). The prominence of the molar apices superim-posed on the shadow of the zygomatic bone, and the amount of detail supplied by the radiograph, depends in part on the degree of aeration (pneumatization) of the zygomatic bone that has occurred, on the bony structure, and on the orientation of the x-ray beam.
Nasolabial Fold An oblique line demarcating a region that appears to be covered by a veil of slight radiopacity frequently traverses periapical radiographs of the premolar region ( Fig. 10-38 ). The line of contrast is sharp, and the area of increased radiopacity is posterior to the line. The line is the nasolabial fold, and the opaque veil is the thick cheek tissue super-imposed on the teeth and the alveolar process. The image of the fold becomes more evident with age as the repeated creasing of the skin along the line (where the elevator of the lip, zygomatic head, and orbicularis all insert into the skin) and the degeneration of the elastic
FIG. 10-35 This bony nodule (arrow) is a normal variant of the fl oor of the maxillary sinus.
FIG. 10-36 The zygomatic process of the maxilla (arrows) protrudes laterally from the maxillary wall. Its size may be quite variable: small with thick borders (A) or large with thin borders (B).
A B
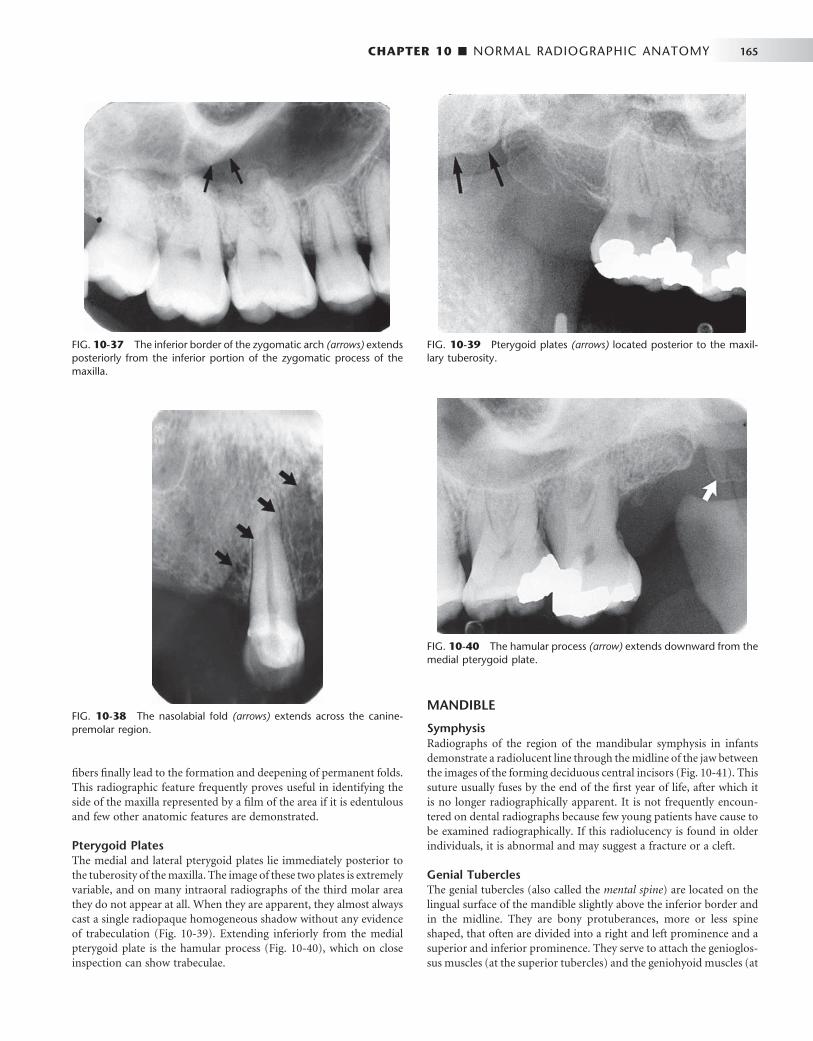
CHAPTER 10 ■ NORMAL RADIOGRAPHIC ANATOMY 165
fi bers fi nally lead to the formation and deepening of permanent folds. This radiographic feature frequently proves useful in identifying the side of the maxilla represented by a fi lm of the area if it is edentulous and few other anatomic features are demonstrated.
Pterygoid Plates The medial and lateral pterygoid plates lie immediately posterior to the tuberosity of the maxilla. The image of these two plates is extremely variable, and on many intraoral radiographs of the third molar area they do not appear at all. When they are apparent, they almost always cast a single radiopaque homogeneous shadow without any evidence of trabeculation ( Fig. 10-39 ). Extending inferiorly from the medial pterygoid plate is the hamular process ( Fig. 10-40 ), which on close inspection can show trabeculae.
MANDIBLE
Symphysis Radiographs of the region of the mandibular symphysis in infants demonstrate a radiolucent line through the midline of the jaw between the images of the forming deciduous central incisors ( Fig. 10-41 ). This suture usually fuses by the end of the fi rst year of life, after which it is no longer radiographically apparent. It is not frequently encoun-tered on dental radiographs because few young patients have cause to be examined radiographically. If this radiolucency is found in older individuals, it is abnormal and may suggest a fracture or a cleft.
Genial Tubercles The genial tubercles (also called the mental spine ) are located on the lingual surface of the mandible slightly above the inferior border and in the midline. They are bony protuberances, more or less spine shaped, that often are divided into a right and left prominence and a superior and inferior prominence. They serve to attach the genioglos-sus muscles (at the superior tubercles) and the geniohyoid muscles (at
FIG. 10-37 The inferior border of the zygomatic arch (arrows) extends posteriorly from the inferior portion of the zygomatic process of the maxilla.
FIG. 10-38 The nasolabial fold (arrows) extends across the canine-premolar region.
FIG. 10-39 Pterygoid plates (arrows) located posterior to the maxil-lary tuberosity.
FIG. 10-40 The hamular process (arrow) extends downward from the medial pterygoid plate.
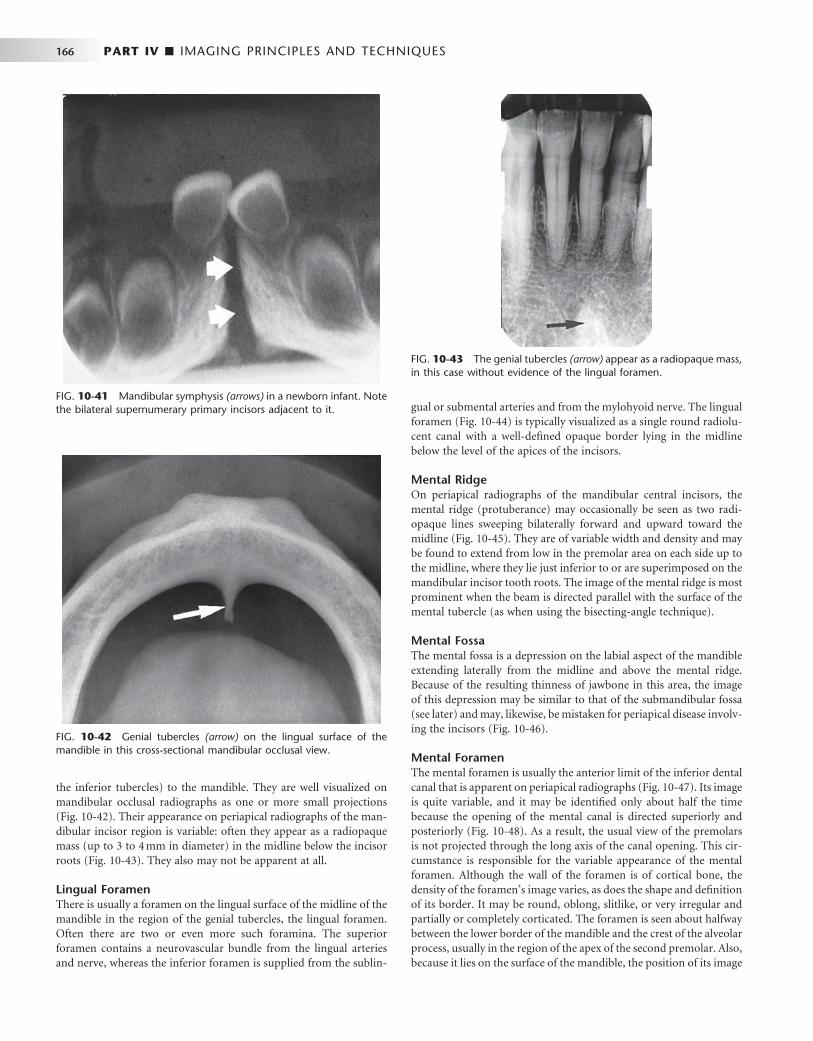
166 PART IV ■ IMAGING PRINCIPLES AND TECHNIQUES
the inferior tubercles) to the mandible. They are well visualized on mandibular occlusal radiographs as one or more small projections ( Fig. 10-42 ). Their appearance on periapical radiographs of the man-dibular incisor region is variable: often they appear as a radiopaque mass (up to 3 to 4 mm in diameter) in the midline below the incisor roots ( Fig. 10-43 ). They also may not be apparent at all.
Lingual Foramen There is usually a foramen on the lingual surface of the midline of the mandible in the region of the genial tubercles, the lingual foramen. Often there are two or even more such foramina. The superior foramen contains a neurovascular bundle from the lingual arteries and nerve, whereas the inferior foramen is supplied from the sublin-
gual or submental arteries and from the mylohyoid nerve. The lingual foramen ( Fig. 10-44 ) is typically visualized as a single round radiolu-cent canal with a well-defi ned opaque border lying in the midline below the level of the apices of the incisors.
Mental Ridge On periapical radiographs of the mandibular central incisors, the mental ridge (protuberance) may occasionally be seen as two radi-opaque lines sweeping bilaterally forward and upward toward the midline ( Fig. 10-45 ). They are of variable width and density and may be found to extend from low in the premolar area on each side up to the midline, where they lie just inferior to or are superimposed on the mandibular incisor tooth roots. The image of the mental ridge is most prominent when the beam is directed parallel with the surface of the mental tubercle (as when using the bisecting-angle technique).
Mental Fossa The mental fossa is a depression on the labial aspect of the mandible extending laterally from the midline and above the mental ridge. Because of the resulting thinness of jawbone in this area, the image of this depression may be similar to that of the submandibular fossa (see later) and may, likewise, be mistaken for periapical disease involv-ing the incisors ( Fig. 10-46 ).
Mental Foramen The mental foramen is usually the anterior limit of the inferior dental canal that is apparent on periapical radiographs ( Fig. 10-47 ). Its image is quite variable, and it may be identifi ed only about half the time because the opening of the mental canal is directed superiorly and posteriorly ( Fig. 10-48 ). As a result, the usual view of the premolars is not projected through the long axis of the canal opening. This cir-cumstance is responsible for the variable appearance of the mental foramen. Although the wall of the foramen is of cortical bone, the density of the foramen ’ s image varies, as does the shape and defi nition of its border. It may be round, oblong, slitlike, or very irregular and partially or completely corticated. The foramen is seen about halfway between the lower border of the mandible and the crest of the alveolar process, usually in the region of the apex of the second premolar. Also, because it lies on the surface of the mandible, the position of its image
FIG. 10-41 Mandibular symphysis (arrows) in a newborn infant. Note the bilateral supernumerary primary incisors adjacent to it.
FIG. 10-42 Genial tubercles (arrow) on the lingual surface of the mandible in this cross-sectional mandibular occlusal view.
FIG. 10-43 The genial tubercles (arrow) appear as a radiopaque mass, in this case without evidence of the lingual foramen.
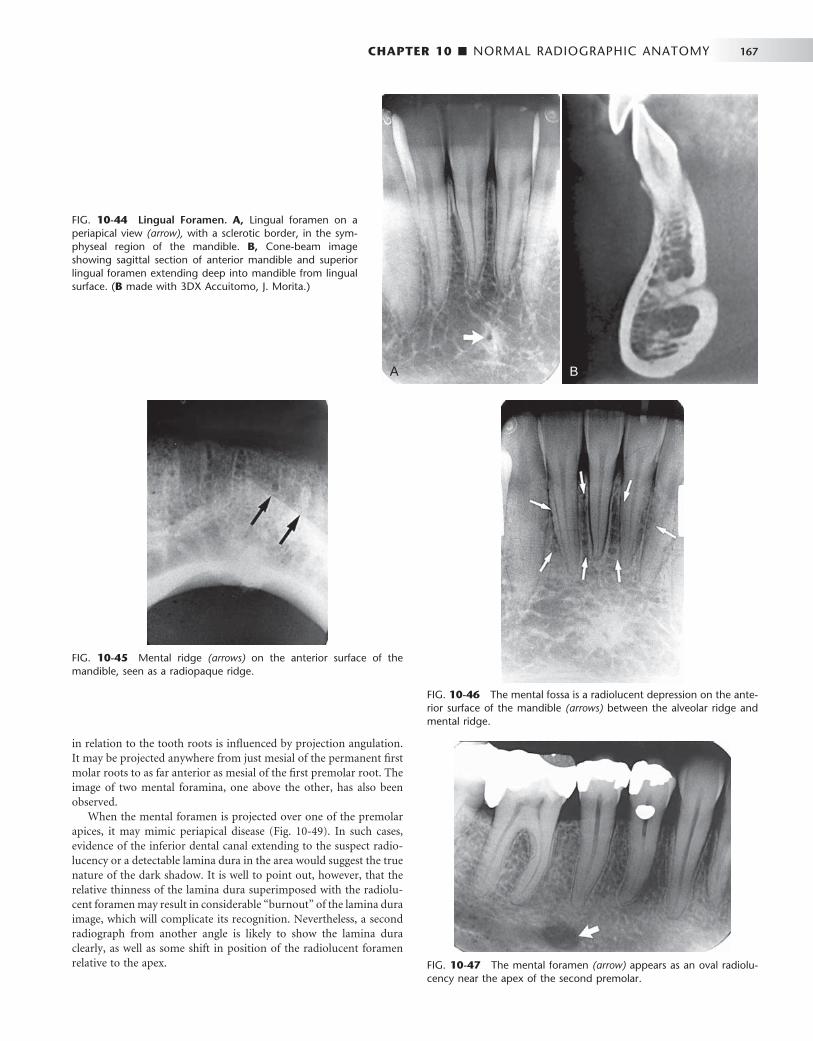
CHAPTER 10 ■ NORMAL RADIOGRAPHIC ANATOMY 167
FIG. 10-44 Lingual Foramen. A, Lingual foramen on a periapical view (arrow), with a sclerotic border, in the sym-physeal region of the mandible. B, Cone-beam image showing sagittal section of anterior mandible and superior lingual foramen extending deep into mandible from lingual surface. ( B made with 3DX Accuitomo, J. Morita.)
A B
in relation to the tooth roots is infl uenced by projection angulation. It may be projected anywhere from just mesial of the permanent fi rst molar roots to as far anterior as mesial of the fi rst premolar root. The image of two mental foramina, one above the other, has also been observed.
When the mental foramen is projected over one of the premolar apices, it may mimic periapical disease ( Fig. 10-49 ). In such cases, evidence of the inferior dental canal extending to the suspect radio-lucency or a detectable lamina dura in the area would suggest the true nature of the dark shadow. It is well to point out, however, that the relative thinness of the lamina dura superimposed with the radiolu-cent foramen may result in considerable “ burnout ” of the lamina dura image, which will complicate its recognition. Nevertheless, a second radiograph from another angle is likely to show the lamina dura clearly, as well as some shift in position of the radiolucent foramen relative to the apex.
FIG. 10-45 Mental ridge (arrows) on the anterior surface of the mandible, seen as a radiopaque ridge.
FIG. 10-46 The mental fossa is a radiolucent depression on the ante-rior surface of the mandible (arrows) between the alveolar ridge and mental ridge.
FIG. 10-47 The mental foramen (arrow) appears as an oval radiolu-cency near the apex of the second premolar.
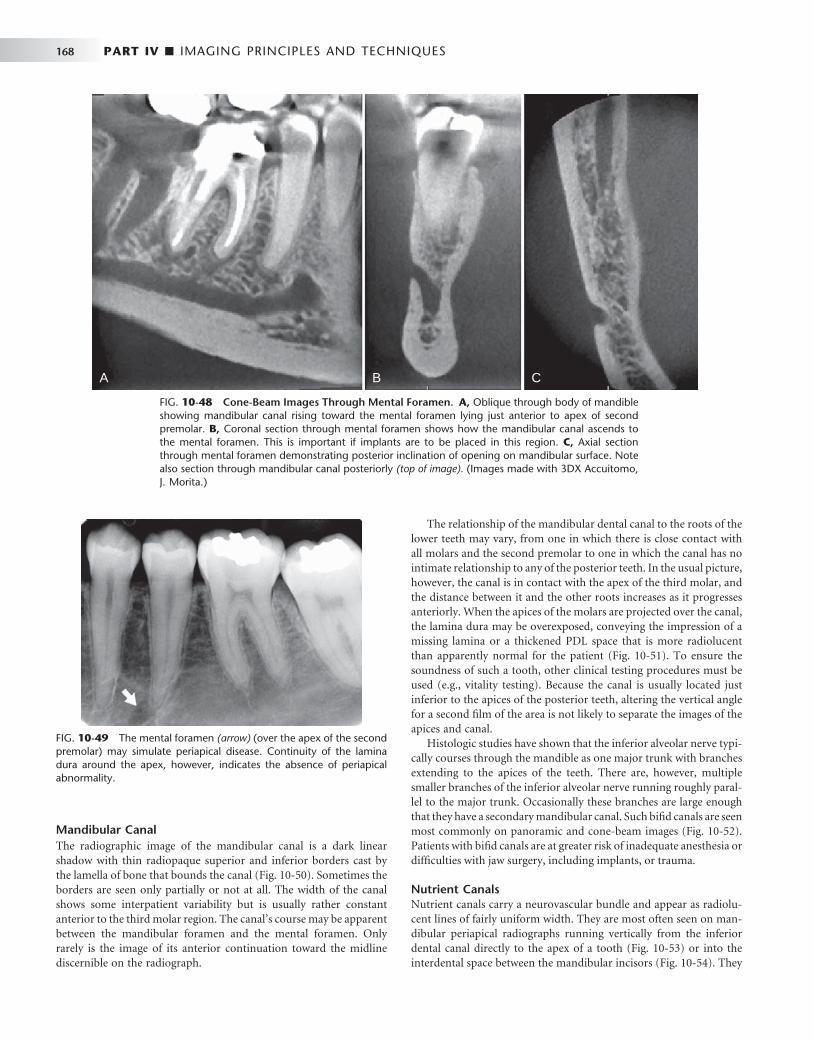
168 PART IV ■ IMAGING PRINCIPLES AND TECHNIQUES
The relationship of the mandibular dental canal to the roots of the lower teeth may vary, from one in which there is close contact with all molars and the second premolar to one in which the canal has no intimate relationship to any of the posterior teeth. In the usual picture, however, the canal is in contact with the apex of the third molar, and the distance between it and the other roots increases as it progresses anteriorly. When the apices of the molars are projected over the canal, the lamina dura may be overexposed, conveying the impression of a missing lamina or a thickened PDL space that is more radiolucent than apparently normal for the patient ( Fig. 10-51 ). To ensure the soundness of such a tooth, other clinical testing procedures must be used (e.g., vitality testing). Because the canal is usually located just inferior to the apices of the posterior teeth, altering the vertical angle for a second fi lm of the area is not likely to separate the images of the apices and canal.
Histologic studies have shown that the inferior alveolar nerve typi-cally courses through the mandible as one major trunk with branches extending to the apices of the teeth. There are, however, multiple smaller branches of the inferior alveolar nerve running roughly paral-lel to the major trunk. Occasionally these branches are large enough that they have a secondary mandibular canal. Such bifi d canals are seen most commonly on panoramic and cone-beam images ( Fig. 10-52 ). Patients with bifi d canals are at greater risk of inadequate anesthesia or diffi culties with jaw surgery, including implants, or trauma.
Nutrient Canals Nutrient canals carry a neurovascular bundle and appear as radiolu-cent lines of fairly uniform width. They are most often seen on man-dibular periapical radiographs running vertically from the inferior dental canal directly to the apex of a tooth ( Fig. 10-53 ) or into the interdental space between the mandibular incisors ( Fig. 10-54 ). They
FIG. 10-48 Cone-Beam Images Through Mental Foramen. A, Oblique through body of mandible showing mandibular canal rising toward the mental foramen lying just anterior to apex of second premolar. B, Coronal section through mental foramen shows how the mandibular canal ascends to the mental foramen. This is important if implants are to be placed in this region. C, Axial section through mental foramen demonstrating posterior inclination of opening on mandibular surface. Note also section through mandibular canal posteriorly (top of image). (Images made with 3DX Accuitomo, J. Morita.)
A B C
FIG. 10-49 The mental foramen (arrow) (over the apex of the second premolar) may simulate periapical disease. Continuity of the lamina dura around the apex, however, indicates the absence of periapical abnormality.
Mandibular Canal The radiographic image of the mandibular canal is a dark linear shadow with thin radiopaque superior and inferior borders cast by the lamella of bone that bounds the canal ( Fig. 10-50 ). Sometimes the borders are seen only partially or not at all. The width of the canal shows some interpatient variability but is usually rather constant anterior to the third molar region. The canal ’ s course may be apparent between the mandibular foramen and the mental foramen. Only rarely is the image of its anterior continuation toward the midline discernible on the radiograph.
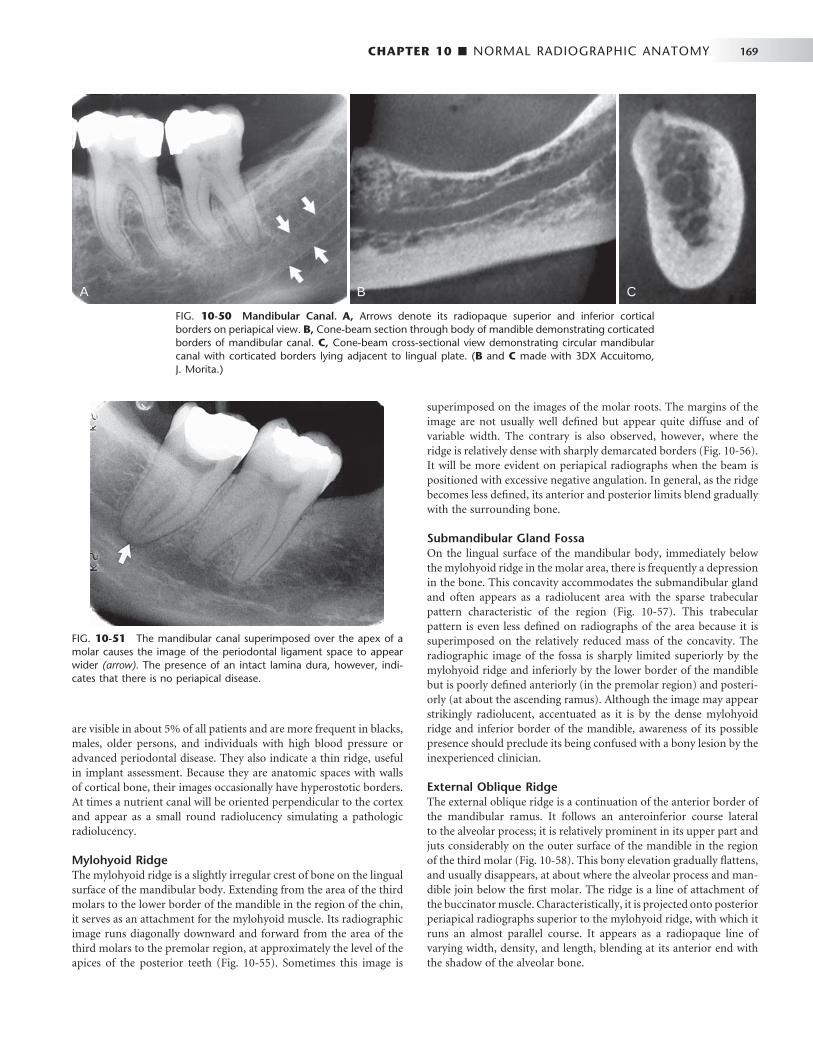
CHAPTER 10 ■ NORMAL RADIOGRAPHIC ANATOMY 169
FIG. 10-50 Mandibular Canal. A, Arrows denote its radiopaque superior and inferior cortical borders on periapical view. B, Cone-beam section through body of mandible demonstrating corticated borders of mandibular canal. C, Cone-beam cross-sectional view demonstrating circular mandibular canal with corticated borders lying adjacent to lingual plate. ( B and C made with 3DX Accuitomo, J. Morita.)
A B C
are visible in about 5% of all patients and are more frequent in blacks, males, older persons, and individuals with high blood pressure or advanced periodontal disease. They also indicate a thin ridge, useful in implant assessment. Because they are anatomic spaces with walls of cortical bone, their images occasionally have hyperostotic borders. At times a nutrient canal will be oriented perpendicular to the cortex and appear as a small round radiolucency simulating a pathologic radiolucency.
Mylohyoid Ridge The mylohyoid ridge is a slightly irregular crest of bone on the lingual surface of the mandibular body. Extending from the area of the third molars to the lower border of the mandible in the region of the chin, it serves as an attachment for the mylohyoid muscle. Its radiographic image runs diagonally downward and forward from the area of the third molars to the premolar region, at approximately the level of the apices of the posterior teeth ( Fig. 10-55 ). Sometimes this image is
superimposed on the images of the molar roots. The margins of the image are not usually well defi ned but appear quite diffuse and of variable width. The contrary is also observed, however, where the ridge is relatively dense with sharply demarcated borders ( Fig. 10-56 ). It will be more evident on periapical radiographs when the beam is positioned with excessive negative angulation. In general, as the ridge becomes less defi ned, its anterior and posterior limits blend gradually with the surrounding bone.
Submandibular Gland Fossa On the lingual surface of the mandibular body, immediately below the mylohyoid ridge in the molar area, there is frequently a depression in the bone. This concavity accommodates the submandibular gland and often appears as a radiolucent area with the sparse trabecular pattern characteristic of the region ( Fig. 10-57 ). This trabecular pattern is even less defi ned on radiographs of the area because it is superimposed on the relatively reduced mass of the concavity. The radiographic image of the fossa is sharply limited superiorly by the mylohyoid ridge and inferiorly by the lower border of the mandible but is poorly defi ned anteriorly (in the premolar region) and posteri-orly (at about the ascending ramus). Although the image may appear strikingly radiolucent, accentuated as it is by the dense mylohyoid ridge and inferior border of the mandible, awareness of its possible presence should preclude its being confused with a bony lesion by the inexperienced clinician.
External Oblique Ridge The external oblique ridge is a continuation of the anterior border of the mandibular ramus. It follows an anteroinferior course lateral to the alveolar process; it is relatively prominent in its upper part and juts considerably on the outer surface of the mandible in the region of the third molar ( Fig. 10-58 ). This bony elevation gradually fl attens, and usually disappears, at about where the alveolar process and man-dible join below the fi rst molar. The ridge is a line of attachment of the buccinator muscle. Characteristically, it is projected onto posterior periapical radiographs superior to the mylohyoid ridge, with which it runs an almost parallel course. It appears as a radiopaque line of varying width, density, and length, blending at its anterior end with the shadow of the alveolar bone.
FIG. 10-51 The mandibular canal superimposed over the apex of a molar causes the image of the periodontal ligament space to appear wider (arrow). The presence of an intact lamina dura, however, indi-cates that there is no periapical disease.
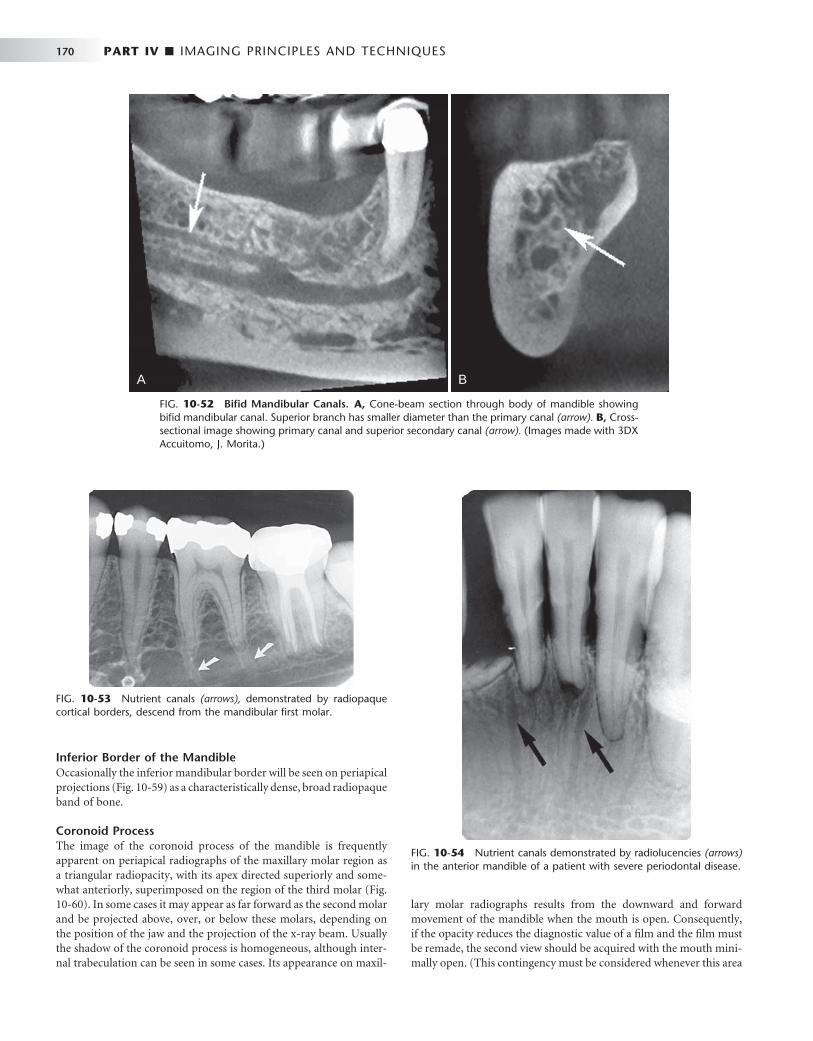
170 PART IV ■ IMAGING PRINCIPLES AND TECHNIQUES
FIG. 10-52 Bifi d Mandibular Canals. A, Cone-beam section through body of mandible showing bifi d mandibular canal. Superior branch has smaller diameter than the primary canal (arrow). B, Cross-sectional image showing primary canal and superior secondary canal (arrow). (Images made with 3DX Accuitomo, J. Morita.)
FIG. 10-53 Nutrient canals (arrows), demonstrated by radiopaque cortical borders, descend from the mandibular fi rst molar.
FIG. 10-54 Nutrient canals demonstrated by radiolucencies (arrows) in the anterior mandible of a patient with severe periodontal disease.
BA
Inferior Border of the Mandible Occasionally the inferior mandibular border will be seen on periapical projections ( Fig. 10-59 ) as a characteristically dense, broad radiopaque band of bone.
Coronoid Process The image of the coronoid process of the mandible is frequently apparent on periapical radiographs of the maxillary molar region as a triangular radiopacity, with its apex directed superiorly and some-what anteriorly, superimposed on the region of the third molar ( Fig. 10-60 ). In some cases it may appear as far forward as the second molar and be projected above, over, or below these molars, depending on the position of the jaw and the projection of the x-ray beam. Usually the shadow of the coronoid process is homogeneous, although inter-nal trabeculation can be seen in some cases. Its appearance on maxil-
lary molar radiographs results from the downward and forward movement of the mandible when the mouth is open. Consequently, if the opacity reduces the diagnostic value of a fi lm and the fi lm must be remade, the second view should be acquired with the mouth mini-mally open. (This contingency must be considered whenever this area
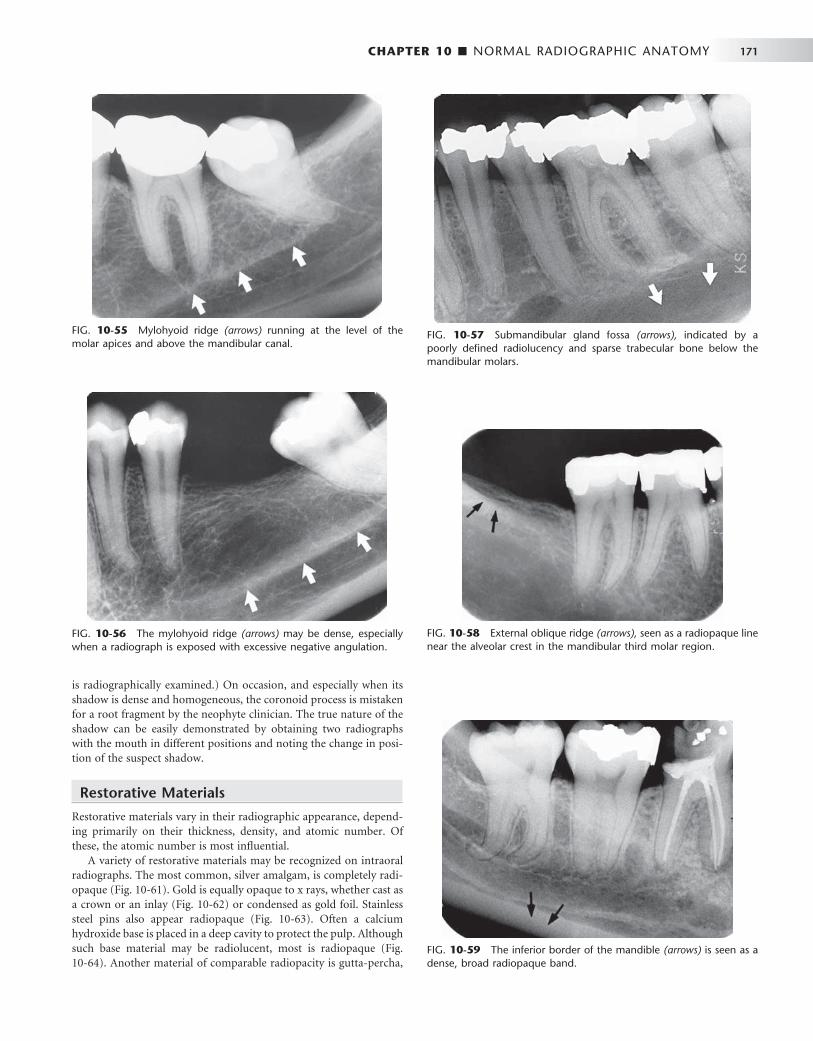
CHAPTER 10 ■ NORMAL RADIOGRAPHIC ANATOMY 171
FIG. 10-55 Mylohyoid ridge (arrows) running at the level of the molar apices and above the mandibular canal.
FIG. 10-56 The mylohyoid ridge (arrows) may be dense, especially when a radiograph is exposed with excessive negative angulation.
FIG. 10-57 Submandibular gland fossa (arrows), indicated by a poorly defi ned radiolucency and sparse trabecular bone below the mandibular molars.
FIG. 10-58 External oblique ridge (arrows), seen as a radiopaque line near the alveolar crest in the mandibular third molar region.
FIG. 10-59 The inferior border of the mandible (arrows) is seen as a dense, broad radiopaque band.
is radiographically examined.) On occasion, and especially when its shadow is dense and homogeneous, the coronoid process is mistaken for a root fragment by the neophyte clinician. The true nature of the shadow can be easily demonstrated by obtaining two radiographs with the mouth in different positions and noting the change in posi-tion of the suspect shadow.
Restorative Materials
Restorative materials vary in their radiographic appearance, depend-ing primarily on their thickness, density, and atomic number. Of these, the atomic number is most infl uential.
A variety of restorative materials may be recognized on intraoral radiographs. The most common, silver amalgam, is completely radi-opaque ( Fig. 10-61 ). Gold is equally opaque to x rays, whether cast as a crown or an inlay ( Fig. 10-62 ) or condensed as gold foil. Stainless steel pins also appear radiopaque ( Fig. 10-63 ). Often a calcium hydroxide base is placed in a deep cavity to protect the pulp. Although such base material may be radiolucent, most is radiopaque ( Fig. 10-64 ). Another material of comparable radiopacity is gutta-percha,
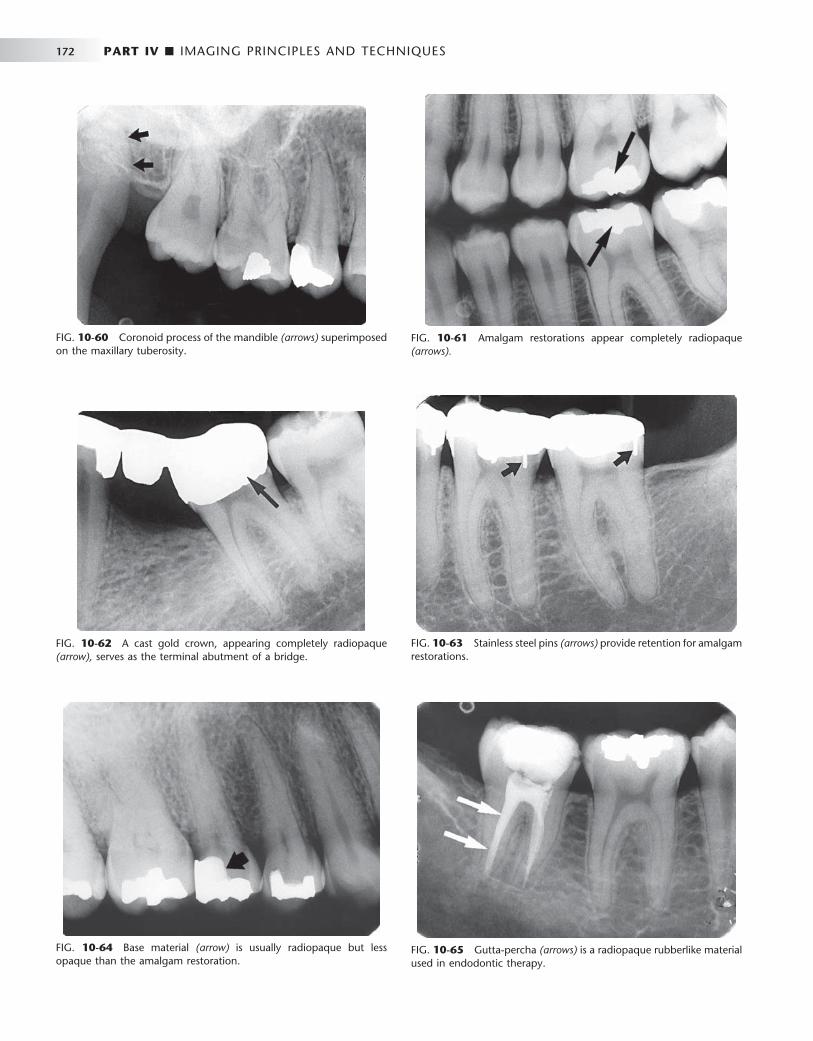
172 PART IV ■ IMAGING PRINCIPLES AND TECHNIQUES
FIG. 10-60 Coronoid process of the mandible (arrows) superimposed on the maxillary tuberosity.
FIG. 10-61 Amalgam restorations appear completely radiopaque (arrows).
FIG. 10-62 A cast gold crown, appearing completely radiopaque (arrow), serves as the terminal abutment of a bridge.
FIG. 10-63 Stainless steel pins (arrows) provide retention for amalgam restorations.
FIG. 10-64 Base material (arrow) is usually radiopaque but less opaque than the amalgam restoration.
FIG. 10-65 Gutta-percha (arrows) is a radiopaque rubberlike material used in endodontic therapy.
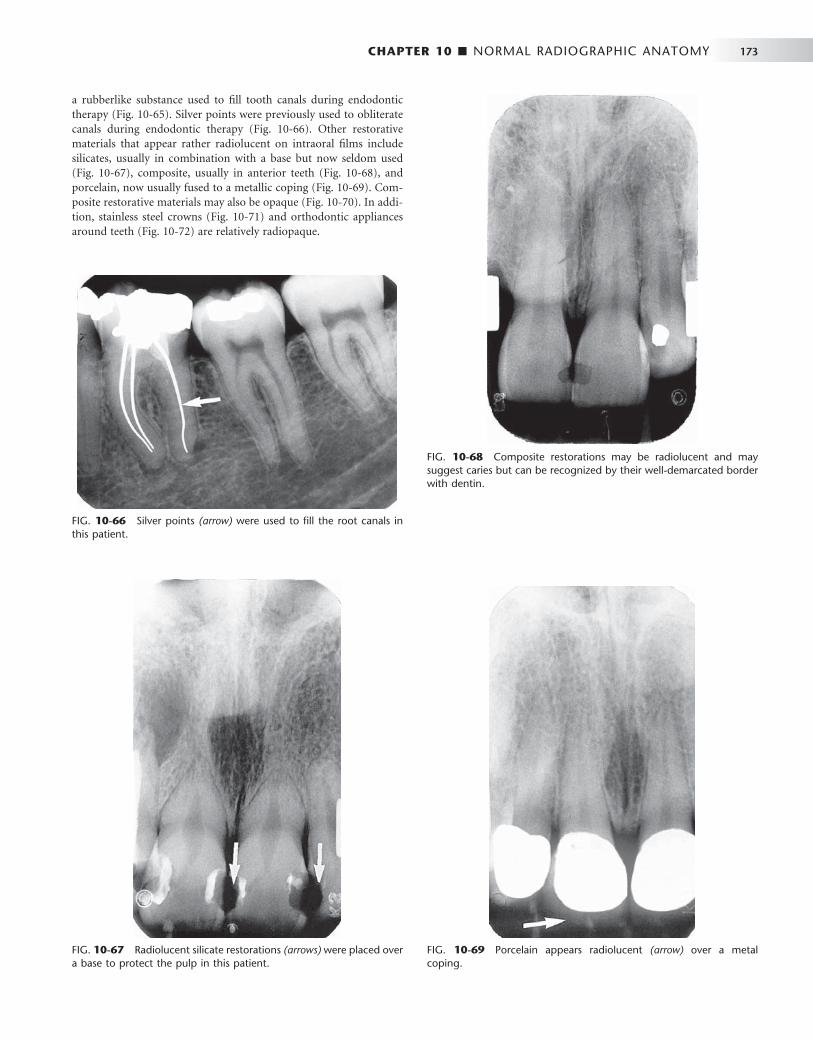
CHAPTER 10 ■ NORMAL RADIOGRAPHIC ANATOMY 173
FIG. 10-66 Silver points (arrow) were used to fi ll the root canals in this patient.
FIG. 10-67 Radiolucent silicate restorations (arrows) were placed over a base to protect the pulp in this patient.
FIG. 10-68 Composite restorations may be radiolucent and may suggest caries but can be recognized by their well-demarcated border with dentin.
FIG. 10-69 Porcelain appears radiolucent (arrow) over a metal coping.
a rubberlike substance used to fi ll tooth canals during endodontic therapy ( Fig. 10-65 ). Silver points were previously used to obliterate canals during endodontic therapy ( Fig. 10-66 ). Other restorative materials that appear rather radiolucent on intraoral fi lms include silicates, usually in combination with a base but now seldom used ( Fig. 10-67 ), composite, usually in anterior teeth ( Fig. 10-68 ), and porcelain, now usually fused to a metallic coping ( Fig. 10-69 ). Com-posite restorative materials may also be opaque ( Fig. 10-70 ). In addi-tion, stainless steel crowns ( Fig. 10-71 ) and orthodontic appliances around teeth ( Fig. 10-72 ) are relatively radiopaque.
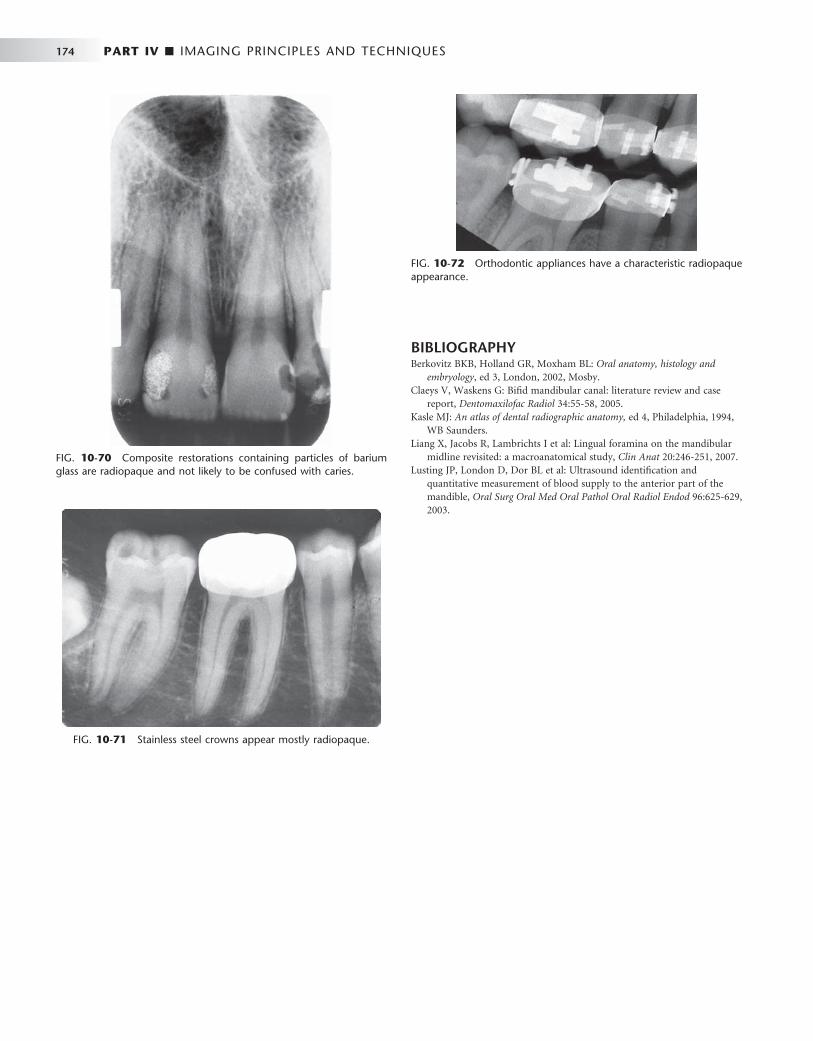
174 PART IV ■ IMAGING PRINCIPLES AND TECHNIQUES
FIG. 10-70 Composite restorations containing particles of barium glass are radiopaque and not likely to be confused with caries.
FIG. 10-71 Stainless steel crowns appear mostly radiopaque.
FIG. 10-72 Orthodontic appliances have a characteristic radiopaque appearance.
BIBLIOGRAPHY 1 Berkovitz BKB , Holland GR , Moxham BL : Oral anatomy, histology and
embryology , ed 3 , London , 2002 , Mosby . 2 Claeys V , Waskens G : Bifi d mandibular canal: literature review and case
report , Dentomaxilofac Radiol 34 : 55 - 58 , 2005 . 3 Kasle MJ : An atlas of dental radiographic anatomy , ed 4 , Philadelphia , 1994 ,
WB Saunders . 4 Liang X , Jacobs R , Lambrichts I et al : Lingual foramina on the mandibular
midline revisited: a macroanatomical study , Clin Anat 20 : 246 - 251 , 2007 . 5 Lusting JP , London D , Dor BL et al : Ultrasound identifi cation and
quantitative measurement of blood supply to the anterior part of the mandible , Oral Surg Oral Med Oral Pathol Oral Radiol Endod 96 : 625 - 629 , 2003 .

C H A P T E R 1 1
Panoramic Imaging
Alan G. Lurie
Panoramic imaging (also called pantomography ) is a technique for producing a single tomographic image of the facial struc-tures that includes both the maxillary and mandibular dental
arches and their supporting structures ( Fig. 11-1 ). This is a curvilinear variant of conventional tomography and is also based on the principle of the reciprocal movement of an x-ray source and an image receptor around a central point or plane, called the image layer, in which the object of interest is located. Objects in front of or behind this image layer are not clearly captured because of their movement relative to the centers of rotation of the receptor and x-ray source.
The principal advantages of panoramic images include the following:
• Broad coverage of the facial bones and teeth • Low patient radiation dose • Convenience of the examination for the patient • Use in patients unable to open their mouths • Short time required to make a panoramic image, usually in the
range of 3 to 4 minutes (This includes the time necessary for positioning the patient and the actual exposure cycle.)
• Patients readily understand panoramic fi lms; thus they are also a useful visual aid in patient education and case presentation.
Panoramic images are most useful clinically for diagnostic prob-lems requiring broad coverage of the jaws. Common examples include evaluation of trauma, location of third molars, extensive dental or osseous disease, known or suspected large lesions, tooth development (especially in the mixed dentition), retained teeth or root tips (in edentulous patients), temporomandibular joint (TMJ) pain, and developmental anomalies. These tasks do not require the high resolu-tion and sharp detail available on intraoral images. Panoramic imaging is often used as the initial evaluation image that can provide the required insight or assist in determining the need for other projec-tions. Panoramic images are also useful for patients who do not toler-ate intraoral procedures well. However, when a full-mouth series of radiographs is available for a patient receiving general dental care, typically little or no additional useful information is gained from a simultaneous panoramic examination.
The main disadvantage of panoramic radiology is that the image does not display the fi ne anatomic detail available on intraoral peri-apical radiographs. Thus it is not as useful as periapical radiography for detecting small carious lesions, fi ne structure of the marginal periodontium, or periapical disease. The proximal surfaces of premo-lars also typically overlap. Accordingly, the availability of a panoramic radiograph for an adult patient often does not preclude the need for
intraoral fi lms for the diagnoses of most commonly encountered dental diseases. Other problems associated with panoramic radiogra-phy include unequal magnifi cation and geometric distortion across the image. Occasionally the presence of overlapping structures, such as the cervical spine, can hide odontogenic lesions, particularly in the incisor regions. Further, clinically important objects may be situated outside the plane of focus (image layer) and may appear distorted or not present at all.
Principles of Panoramic Image Formation
Paatero and, working independently, Numata were the fi rst to describe the principles of panoramic radiography. The following illustrations explain the operation of a panoramic machine. Two adjacent disks are rotating at the same speed in opposite directions as an x-ray beam passes through their centers of rotation ( Fig. 11-2 ). Lead collimators in the shape of a slit, located at the x-ray source and at the image receptor, limit the central ray to a narrow vertical beam. Radiopaque objects A, B, C, and D stand upright on disk 1 and rotate past the slit. Their images are recorded on the receptor, which also moves past the slit at the same time. The objects are displayed sharply on the receptor because they are moving past the slit at the same rate and in the same direction as the receptor. This causes their moving shadows to appear stationary in relation to the moving receptor. Other objects between the letters and the center of rotation of disk 1 rotate with a slower velocity and are blurred on the receptor. Any objects between the x-ray source and the center of rotation of disk 1 move in the opposite direc-tion of the receptor, and their shadows are also blurred on the receptor.
Figure 11-3 shows that the same relationship of moving fi lm to image is achieved if disk 1 is held stationary and the x-ray source is rotated so that the central ray constantly passes through the center of rotation of disk 1 and, simultaneously, both disk 2 and the lead colli-mator (Pb) rotate around the center of disk 1. Note that, although disk 2 moves, the receptor on this disk also rotates past the slit. In this situ-ation, as before, the objects A through D move through the x-ray beam in the same direction and at the same rate as the receptor. To obtain optimal image defi nition, it is crucial that the speed of the receptor passing the collimator slit (Pb) be maintained equal to the speed at which the x-ray beam sweeps through the objects of interest.
In the case where the receptor is a charge-coupled device (CCD) array, the image is electronically transmitted to the controlling
175

176 PART IV ■ IMAGING PRINCIPLES AND TECHNIQUES
computer as the x-ray beam hits it, and this transmission is continu-ous as the x-ray source and receptor are traveling around the patient. The resulting geometric projection characteristics are the same as if fi lm or a photostimulable phosphor plate (PSP) had been used. This holds true for geometric distortions such as magnifi cation and elon-gation, the presence of ghost images, superimposition of the cervical spine over midline structures, overlap of teeth, and left-right size variations from lack of proper positioning of the patient ’ s sagittal plane in the instrument.
Figure 11-4 shows that a patient may replace disk 1 and that objects A through D represent teeth and surrounding bone. In prac-tice, the center of rotation is located off to the side, away from the objects being imaged. During the exposure cycle, the machine auto-matically shifts to one or more additional rotation centers. The rate of movement of the receptor behind the slit is regulated to be the same as that of the central ray sweeping through the dental structures on the side of the patient nearest the receptor. Structures on the opposite
side of the patient (near the x-ray tube) are distorted and appear out of focus because the x-ray beam sweeps through them in the direction opposite that in which the image receptor is moving. In addition, structures near the x-ray source are so magnifi ed (and their borders so blurred) that they are not seen as discrete images on the resultant image. These structures appear only as diffuse phantom or ghost images. Because of both these circumstances, only structures near the receptor are usefully captured on the resultant image. Structures located more centrally in the body relative to the jaws, such as the hyoid bone and epiglottis, appear on the right, left, and sometimes central areas of the fi nal image.
Most panoramic machines now use a continuously moving center of rotation rather than multiple fi xed locations. Figure 11-5 shows a
FIG. 11-1 Maxilla, mandible, and dentition in an adult patient (panoramic view).
FIG. 11-2 Movement of the fi lm and objects ( A, B, C, and D ) about two fi xed centers of rotation. Pb , Lead collimator.
X-raysource
Disk 1Disk 2
Film
DC
BA
Pb
FIG. 11-3 Movement of the fi lm and x-ray source about one fi xed center of rotation. Pb , Lead collimator.
X-raysource
Disk 1Disk 2
Film
DC
BA
Pb

CHAPTER 11 ■ PANORAMIC IMAGING 177
continually moving center of rotation. This feature optimizes the shape of the image layer to reveal the teeth and supporting bone. This center of rotation is initially near the lingual surface of the right body of the mandible when the left TMJ is imaged. The rotation center moves forward along an arc that ends just lingual to the symphysis of the mandible when the midline is imaged. The arc is reversed as the opposite side of the face is imaged. In some contemporary panoramic machines, the shape of the image layer can be adjusted to better conform to the shape of the patients ’ mandibulofacial anatomy or to better show specifi c anatomic areas such as the TMJ or the maxillary sinuses. This is accomplished through varying the shape of the moving center of rotation, and allows better representation of children, unusu-ally confi gured patients, and specifi c anatomic sites of interest.
IMAGE LAYER
The image layer is a three-dimensional curved zone, or “ focal trough, ” where the structures lying within this layer are reasonably well defi ned on fi nal panoramic image. The structures seen on a panoramic image are primarily those located within the image layer. Objects outside the image layer are blurred, magnifi ed, or reduced in size and are some-times distorted to the extent of not being recognizable. The shape of the image layer varies with the brand of equipment used. Figure 11-6 shows the general shape of the image layer used in panoramic machines. The factors that affect its size are variables that infl uence image defi ni-tion: arc path, velocity of the receptor and x-ray tube head, alignment of the x-ray beam, and collimator width. The location of the image layer can change with extensive machine use, so recalibration may be necessary if consistently suboptimal images are produced.
As the position of an object is moved within the image layer, the size and shape of the resultant image change. Figure 11-7, A through F , illustrates the infl uence of patient positioning on image size and shape. Figure 11-7, A and B , shows a mandible supporting a brass ring properly aligned in the middle of the image layer. Note the even
FIG. 11-4 Movement of the fi lm and x-ray source about a shifting center of rotation. Pb , Lead collimator.
X-raysource
Disk 2
Film
Pb
FIG. 11-5 Movement of the x-ray source and beam. The dark line shows a continuously moving center of rotation. As the source moves behind the patient ’ s neck and the anterior teeth are imaged, the center of rotation moves forward along the arc (dark line) toward the sagittal plane. The x-ray source continues to move around the patient to image the opposite side.
X-raysource
FIG. 11-6 Focal trough. The closer to the center of the trough (dark zone) an anatomic structure is positioned, the more clearly it is imaged on the resulting radiograph.
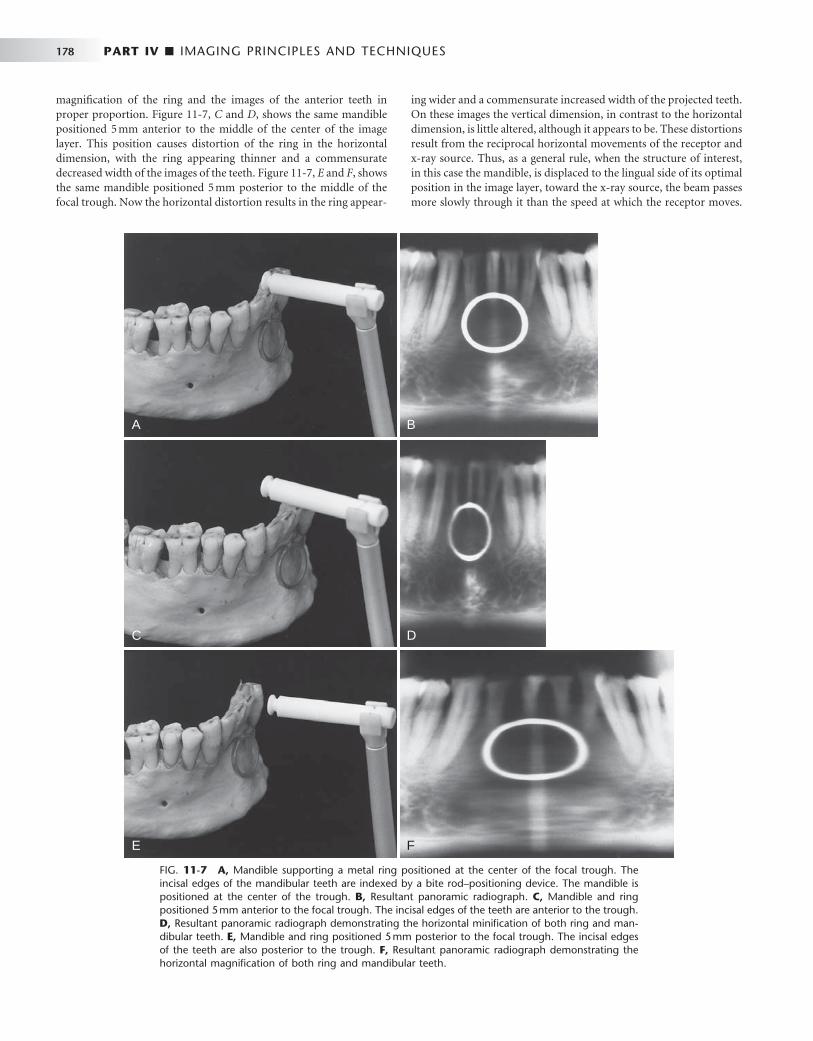
178 PART IV ■ IMAGING PRINCIPLES AND TECHNIQUES
FIG. 11-7 A, Mandible supporting a metal ring positioned at the center of the focal trough. The incisal edges of the mandibular teeth are indexed by a bite rod – positioning device. The mandible is positioned at the center of the trough. B, Resultant panoramic radiograph. C, Mandible and ring positioned 5 mm anterior to the focal trough. The incisal edges of the teeth are anterior to the trough. D, Resultant panoramic radiograph demonstrating the horizontal minifi cation of both ring and man-dibular teeth. E, Mandible and ring positioned 5 mm posterior to the focal trough. The incisal edges of the teeth are also posterior to the trough. F, Resultant panoramic radiograph demonstrating the horizontal magnifi cation of both ring and mandibular teeth.
A B
C D
E F
magnifi cation of the ring and the images of the anterior teeth in proper proportion. Figure 11-7, C and D , shows the same mandible positioned 5 mm anterior to the middle of the center of the image layer. This position causes distortion of the ring in the horizontal dimension, with the ring appearing thinner and a commensurate decreased width of the images of the teeth. Figure 11-7, E and F , shows the same mandible positioned 5 mm posterior to the middle of the focal trough. Now the horizontal distortion results in the ring appear-
ing wider and a commensurate increased width of the projected teeth. On these images the vertical dimension, in contrast to the horizontal dimension, is little altered, although it appears to be. These distortions result from the reciprocal horizontal movements of the receptor and x-ray source. Thus, as a general rule, when the structure of interest, in this case the mandible, is displaced to the lingual side of its optimal position in the image layer, toward the x-ray source, the beam passes more slowly through it than the speed at which the receptor moves.

CHAPTER 11 ■ PANORAMIC IMAGING 179
Consequently, the images of the structures in this region are elongated horizontally on the image and they appear wider. Alternatively, when the mandible is displaced toward the buccal aspect of the image layer, the beam passes at a rate faster than normal through the structures. In the example shown, because the receptor is moving at the proper rate, the representations of the anterior teeth are compressed horizon-tally on the image, and they appear thinner. Special attention must be paid to these considerations in following the progress of a bony lesion, especially in the anterior region. As a result of improper patient posi-tioning the lesion may appear greater (enlarging) (see Figure 11-7, F ) or reduced (healing) (see Figure 11-7, D ) on successive images. Thus the importance of careful alignment and positioning of the patient ’ s dental arches within the area of the image layer is apparent.
The same principle applies to the patient ’ s sagittal plane being rotated in the image layer. The posterior structures on the side to which the patient ’ s head is rotated will be magnifi ed in the horizontal dimension because the posterior structures will be moved away from the image receptor, whereas posterior structures on the opposite side will be moved closer to the image receptor and will be reduced in horizontal dimension. The resulting image will have horizontally large molar teeth and mandibular ramus, and severe premolar overlap, on one side and horizontally smaller molar teeth and mandibular ramus on the other side. This must not be confused with a congenital or developmental facial asymmetry (This positioning artifact is demon-strated in Figure 11-8 ).
PANORAMIC MACHINES
A number of companies manufacture high-quality fi lm-based and digital panoramic machines. The Othoralix 8500 (KaVo Dental Corp.,
Gendex Dental Systems, Lake Zurich, Ill. [ Fig. 11-9 ] ), the Proline XC (Planmeca Oy, Helsinki, Finland [ Fig. 11-10 ] ), and the Orthophos XG-Plus (Sirona Dental Systems GmbH, Bensheim, Germany [ Fig. 11-11 ] ) are all highly versatile. In addition to producing standard panoramic images of the jaws, they have the capability of adjusting to patients of various sizes and making frontal and lateral images of TMJs. These machines also are capable of producing tomographic views through the sinuses and cross-sectional views of the maxilla and mandible. These views are acquired by having special tube head and fi lm movements programmed into the machine. Each machine also has the capability for adding on a cephalometric attachment to allow exposure of standardized skull views. Some machines further have the capability of automated exposure control. This is accomplished by measuring the amount of radiation passing through the patient ’ s mandible during the initial part of the exposure and adjusting the imaging factors (peak kilovoltage [ kVp ] , milliamperage [ mA ] , and speed of imaging movements) to obtain a correctly exposed image. Finally, all of these machines are available in CCD-digital confi gurations.
There are now computer-controlled multimodality machines in which the direction and speed of movement of the tube head and fi lm are highly variable, in some cases including multidirectional tomog-raphy. This allows the machines to be programmed to make tomo-graphic views through many areas of the head. For instance, they can be programmed to image frontal or lateral views of the TMJs, coronal or sagittal sections through the maxillary sinuses, and cross-sectional cuts through a predetermined portion of the maxilla or mandible. These machines have much greater versatility than the conventional panoramic machines, and they are more expensive. Most of the special examinations made on these machines use circular or hypocycloidal
FIG. 11-8 Panoramic image showing positioning error-rotation of the sagittal plane. The patient ’ s head was rotated to the left, moving the right side closer to the receptor and the left side further from the receptor. Note the relative magnifi cation of the left-sided molar teeth, mandibular ramus, and condyle and the severe overlap of the posterior teeth. It is important to recognize this fairly common distortion and not to mistake it for a skeletal asymmetry.
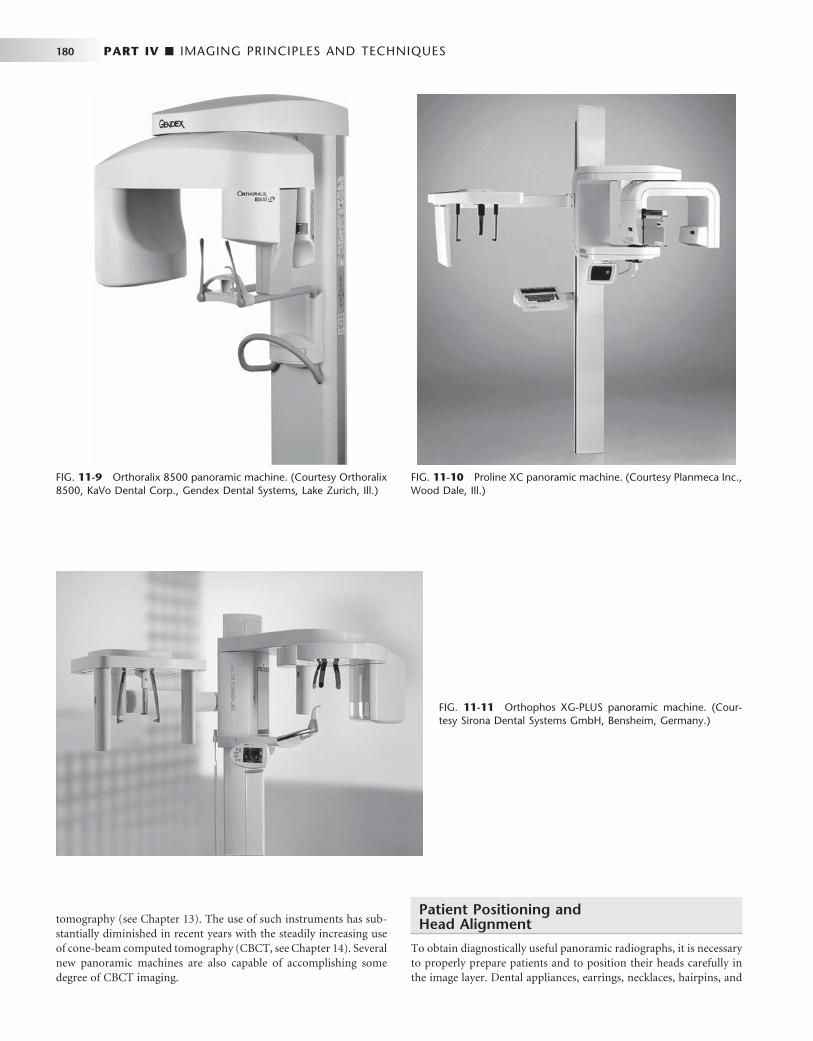
180 PART IV ■ IMAGING PRINCIPLES AND TECHNIQUES
FIG. 11-9 Orthoralix 8500 panoramic machine. (Courtesy Orthoralix 8500, KaVo Dental Corp., Gendex Dental Systems, Lake Zurich, Ill.)
FIG. 11-11 Orthophos XG-PLUS panoramic machine. (Cour-tesy Sirona Dental Systems GmbH, Bensheim, Germany.)
tomography (see Chapter 13 ). The use of such instruments has sub-stantially diminished in recent years with the steadily increasing use of cone-beam computed tomography (CBCT, see Chapter 14 ). Several new panoramic machines are also capable of accomplishing some degree of CBCT imaging.
Patient Positioning and Head Alignment
To obtain diagnostically useful panoramic radiographs, it is necessary to properly prepare patients and to position their heads carefully in the image layer. Dental appliances, earrings, necklaces, hairpins, and
FIG. 11-10 Proline XC panoramic machine. (Courtesy Planmeca Inc., Wood Dale, Ill.)

CHAPTER 11 ■ PANORAMIC IMAGING 181
any other metallic objects in the head and neck region should be removed. It may also be wise to demonstrate the machine to the patient by cycling it while explaining the need to remain still during the procedure. This is particularly true for children, who may be anxious. Children should be instructed to look forward and to not follow the tube head with their eyes.
The anteroposterior position radiograph of the patient is achieved typically by having patients place the incisal edges of their maxillary and mandibular incisors into a notched positioning device (the bite-block). Patients should not shift the mandible to either side when making this protrusive movement. The midsagittal plane must be centered within the image layer of the particular x-ray unit.
Placement of the patient either too far anterior or posterior results in signifi cant dimensional aberrations in the images. Too far posterior results in magnifi ed mesiodistal dimensions through the anterior sex-tants and resulting “ fat ” teeth (see Figure 11-7, F ). Too far anterior results in reduced mesiodistal dimensions through the anterior sex-tants and resulting “ thin ” teeth (see Figure 11-7, D ). Failure to position the midsagittal plane in the rotational midline of the machine results in a radiograph showing right and left sides that are unequally magni-fi ed in the horizontal dimension (see Fig. 11-8 ). Poor midline posi-
tioning is a common error, causing horizontal distortion in the posterior regions, excessive tooth overlap in the premolar regions and, on occasion, nondiagnostic, clinically unacceptable images. A simple method for evaluating the degree of horizontal distortion of the image is to compare the apparent width of the mandibular fi rst molars bilaterally. The smaller side is too close to the receptor and the larger side is too close to the x-ray source.
The patient ’ s chin and occlusal plane must be properly positioned to avoid distortion. The occlusal plane is aligned so that it is lower anteriorly, angled 20 to 30 degrees below the horizontal. A general guide for chin positioning is to place the patient so that a line from the tragus of the ear to the outer canthus of the eye is parallel with the fl oor. If the chin is tipped too high, the occlusal plane on the radiograph appears fl at or inverted, and the image of the mandible is distorted ( Fig. 11-12, A ). In addition, a radiopaque shadow of the hard palate is superimposed on the roots of the maxillary teeth. If the chin is tipped too low, the teeth become severely overlapped, the symphy-seal region of the mandible may be cut off the fi lm, and both man-dibular condyles may be projected off the superior edge of the fi lm ( Fig. 11-12, B ). Patients are positioned with their backs and spines as erect as possible and their necks extended. Having patients place their
FIG. 11-12 Panoramic radiographs demonstrating poor patient head alignment. A, The chin and occlusal plane are rotated upward, resulting in overlapping images of the teeth and an opaque shadow (the hard palate) obscuring the roots of the maxillary teeth. B, The chin and occlusal plane are rotated downward, cutting off the symphyseal region on the radiograph and distorting the anterior teeth.
A
B

182 PART IV ■ IMAGING PRINCIPLES AND TECHNIQUES
feet on a foot support and using a cushion for back support may facilitate proper back positioning in seated units. These devices help straighten the spine, minimizing the artifact produced by a shadow of the spine.
Proper neck extension is best accomplished by using a gentle upward force on the mastoid eminences when positioning the head in a manner similar to applying cervical traction. Allowing patients to slump their heads and necks forward causes a large opaque artifact in the midline created by the superimposition of an increased mass of cervical spine. This shadow obscures the entire symphyseal region of the mandible and may require that the radiograph be retaken ( Fig. 11-13 ). Finally, after patients are positioned in the machine, they should be instructed to swallow and hold the tongue on the roof of the mouth. This raises the dorsum of the tongue to the hard palate, eliminating the air space and providing optimal visualization of the apices of the maxillary teeth.
Image Receptors
Intensifying screens (see Chapter 5 ) are routinely used in panoramic radiography because they signifi cantly reduce the amount of radiation required for properly exposing a radiograph. Fast fi lms combined with high-speed (rare earth) screens are indicated for most examina-tions. In most cases, the manufacturer provides panoramic machines with intensifying screens. The type of screen (manufacturer and model) is printed in black letters on each screen and clearly projected onto the radiograph. With rare earth screens and fast fi lms, the patient ’ s skin exposure from panoramic radiography is approximately equivalent to four bitewing views made with F-speed fi lm.
Most manufacturers have developed direct digital acquisition pan-oramic machines. The receptor on such a machine is either an array of CCDs or a fi lm-sized PSP plate rather than fi lm. The CCD array transmits an electronic signal to the controlling computer, which displays the image on the viewscreen as it is being acquired. The soft-ware of the unit makes internal adjustments to the acquired data to
render an interpretable image on the screen. The PSP plate is pro-cessed in the same manner as an intraoral PSP, and a similar image characteristic adjustment is automatically performed by the software package. Both these digital modalities allow the user to perform post-processing modifi cations on the image, including linear contrast and density adjustments, black/white reversal, area of interest magnifi ca-tion, edge enhancement, and color rendering. Most units acquire and store their electronic data in DICOM format ( D igital I maging and CO mmunication in M edicine); this allows for rapid telecommunica-tion of images worldwide to all DICOM compliant workstations. DICOM is the international standard language for the electronic com-munication of digital images, be they radiographs, photographs, his-topathologic slides, or any other type of “ picture image. ” The American Dental Association recommended that all digital x-ray units manu-factured after 2004 be DICOM compliant. These units are becoming more widely used as dentistry increases its use of direct digital imaging and electronic patient records.
All panoramic images should have some mechanism for automati-cally marking the patient ’ s left or right sides on the image. Also, the patient ’ s name, age, and the date the image was acquired should be indicated, with markers, photographic imprinting, or glued labels. The dentist ’ s name must be on the image. No signifi cant anatomic struc-tures should be obscured by any of these labels or markings. Also, no parts of the image are trimmed to make the fi lm fi t the patient ’ s chart.
Panoramic Film Darkroom Techniques
Special darkroom procedures are needed when panoramic fi lm is being processed. These fi lms are far more light sensitive than intraoral fi lms, especially after they have been exposed. A reduction in dark-room lighting from that used for conventional intraoral fi lm is neces-sary. A Kodak GBX-2 fi lter can be installed with a 15-watt bulb at least 4 feet from the working surface. An ML-2 fi lter should not be used because it fogs panoramic fi lm. Panoramic fi lm should be developed either manually or in automatic fi lm processors according to the
FIG. 11-13 Panoramic radiograph of an improperly positioned patient. Note the large radiopaque region in the middle. This artifact ( “ spine-shadow ghost ” ) could have been eliminated by having the patient sit straight and align or stretch the neck.
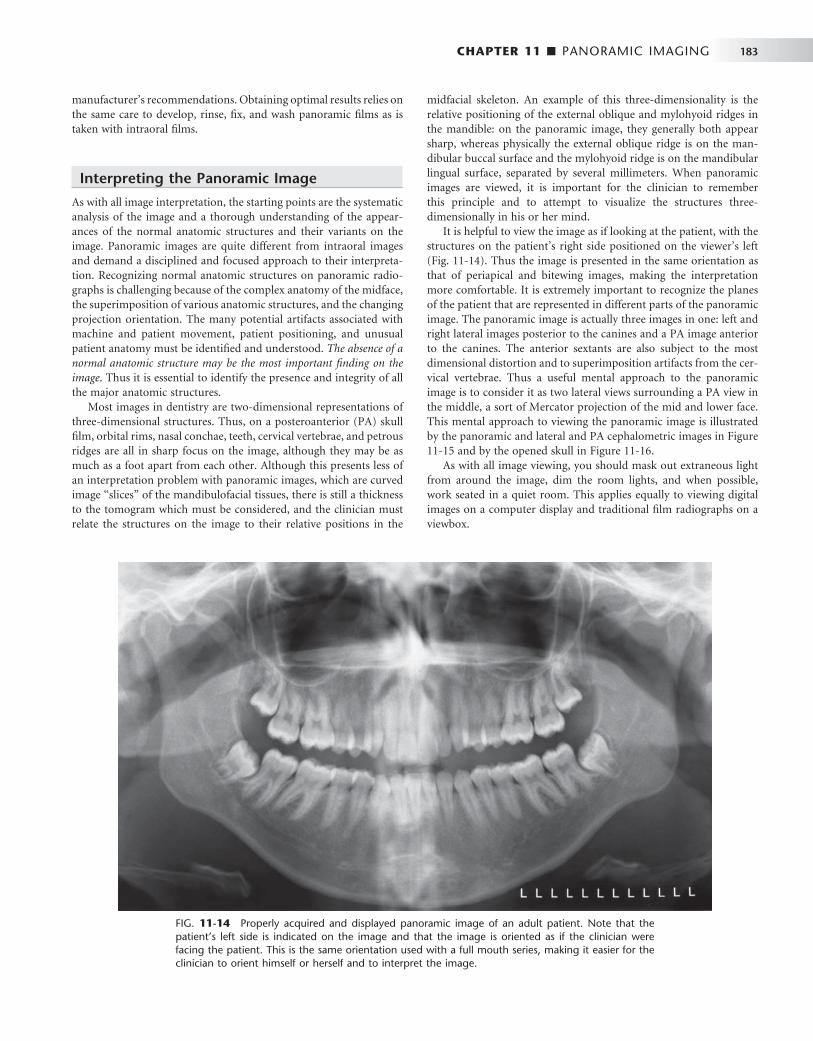
CHAPTER 11 ■ PANORAMIC IMAGING 183
manufacturer ’ s recommendations. Obtaining optimal results relies on the same care to develop, rinse, fi x, and wash panoramic fi lms as is taken with intraoral fi lms.
Interpreting the Panoramic Image
As with all image interpretation, the starting points are the systematic analysis of the image and a thorough understanding of the appear-ances of the normal anatomic structures and their variants on the image. Panoramic images are quite different from intraoral images and demand a disciplined and focused approach to their interpreta-tion. Recognizing normal anatomic structures on panoramic radio-graphs is challenging because of the complex anatomy of the midface, the superimposition of various anatomic structures, and the changing projection orientation. The many potential artifacts associated with machine and patient movement, patient positioning, and unusual patient anatomy must be identifi ed and understood. The absence of a normal anatomic structure may be the most important fi nding on the image . Thus it is essential to identify the presence and integrity of all the major anatomic structures.
Most images in dentistry are two-dimensional representations of three-dimensional structures. Thus, on a posteroanterior (PA) skull fi lm, orbital rims, nasal conchae, teeth, cervical vertebrae, and petrous ridges are all in sharp focus on the image, although they may be as much as a foot apart from each other. Although this presents less of an interpretation problem with panoramic images, which are curved image “ slices ” of the mandibulofacial tissues, there is still a thickness to the tomogram which must be considered, and the clinician must relate the structures on the image to their relative positions in the
FIG. 11-14 Properly acquired and displayed panoramic image of an adult patient. Note that the patient ’ s left side is indicated on the image and that the image is oriented as if the clinician were facing the patient. This is the same orientation used with a full mouth series, making it easier for the clinician to orient himself or herself and to interpret the image.
midfacial skeleton. An example of this three-dimensionality is the relative positioning of the external oblique and mylohyoid ridges in the mandible: on the panoramic image, they generally both appear sharp, whereas physically the external oblique ridge is on the man-dibular buccal surface and the mylohyoid ridge is on the mandibular lingual surface, separated by several millimeters. When panoramic images are viewed, it is important for the clinician to remember this principle and to attempt to visualize the structures three-dimensionally in his or her mind.
It is helpful to view the image as if looking at the patient, with the structures on the patient ’ s right side positioned on the viewer ’ s left ( Fig. 11-14 ). Thus the image is presented in the same orientation as that of periapical and bitewing images, making the interpretation more comfortable. It is extremely important to recognize the planes of the patient that are represented in different parts of the panoramic image. The panoramic image is actually three images in one: left and right lateral images posterior to the canines and a PA image anterior to the canines. The anterior sextants are also subject to the most dimensional distortion and to superimposition artifacts from the cer-vical vertebrae. Thus a useful mental approach to the panoramic image is to consider it as two lateral views surrounding a PA view in the middle, a sort of Mercator projection of the mid and lower face. This mental approach to viewing the panoramic image is illustrated by the panoramic and lateral and PA cephalometric images in Figure 11-15 and by the opened skull in Figure 11-16 .
As with all image viewing, you should mask out extraneous light from around the image, dim the room lights, and when possible, work seated in a quiet room. This applies equally to viewing digital images on a computer display and traditional fi lm radiographs on a viewbox.
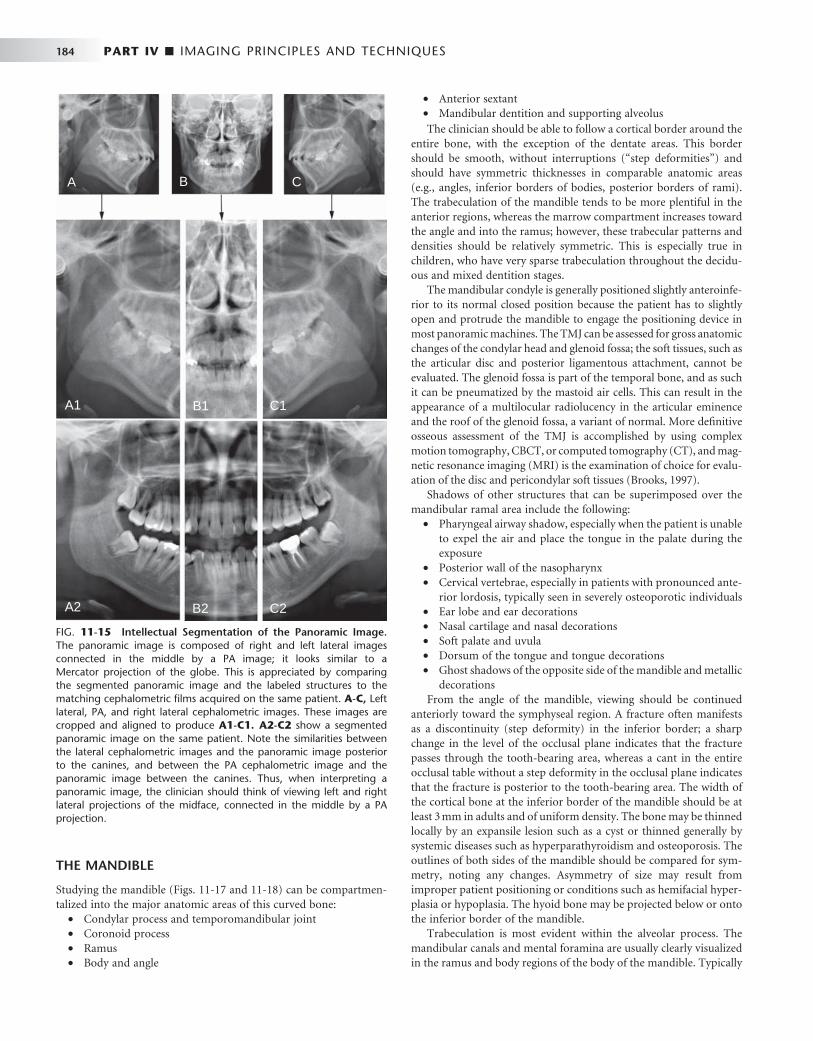
184 PART IV ■ IMAGING PRINCIPLES AND TECHNIQUES
• Anterior sextant • Mandibular dentition and supporting alveolus The clinician should be able to follow a cortical border around the
entire bone, with the exception of the dentate areas. This border should be smooth, without interruptions ( “ step deformities ” ) and should have symmetric thicknesses in comparable anatomic areas (e.g., angles, inferior borders of bodies, posterior borders of rami). The trabeculation of the mandible tends to be more plentiful in the anterior regions, whereas the marrow compartment increases toward the angle and into the ramus; however, these trabecular patterns and densities should be relatively symmetric. This is especially true in children, who have very sparse trabeculation throughout the decidu-ous and mixed dentition stages.
The mandibular condyle is generally positioned slightly anteroinfe-rior to its normal closed position because the patient has to slightly open and protrude the mandible to engage the positioning device in most panoramic machines. The TMJ can be assessed for gross anatomic changes of the condylar head and glenoid fossa; the soft tissues, such as the articular disc and posterior ligamentous attachment, cannot be evaluated. The glenoid fossa is part of the temporal bone, and as such it can be pneumatized by the mastoid air cells. This can result in the appearance of a multilocular radiolucency in the articular eminence and the roof of the glenoid fossa, a variant of normal. More defi nitive osseous assessment of the TMJ is accomplished by using complex motion tomography, CBCT, or computed tomography (CT), and mag-netic resonance imaging (MRI) is the examination of choice for evalu-ation of the disc and pericondylar soft tissues (Brooks, 1997).
Shadows of other structures that can be superimposed over the mandibular ramal area include the following:
• Pharyngeal airway shadow, especially when the patient is unable to expel the air and place the tongue in the palate during the exposure
• Posterior wall of the nasopharynx • Cervical vertebrae, especially in patients with pronounced ante-
rior lordosis, typically seen in severely osteoporotic individuals • Ear lobe and ear decorations • Nasal cartilage and nasal decorations • Soft palate and uvula • Dorsum of the tongue and tongue decorations • Ghost shadows of the opposite side of the mandible and metallic
decorations From the angle of the mandible, viewing should be continued
anteriorly toward the symphyseal region. A fracture often manifests as a discontinuity (step deformity) in the inferior border; a sharp change in the level of the occlusal plane indicates that the fracture passes through the tooth-bearing area, whereas a cant in the entire occlusal table without a step deformity in the occlusal plane indicates that the fracture is posterior to the tooth-bearing area. The width of the cortical bone at the inferior border of the mandible should be at least 3 mm in adults and of uniform density. The bone may be thinned locally by an expansile lesion such as a cyst or thinned generally by systemic diseases such as hyperparathyroidism and osteoporosis. The outlines of both sides of the mandible should be compared for sym-metry, noting any changes. Asymmetry of size may result from improper patient positioning or conditions such as hemifacial hyper-plasia or hypoplasia. The hyoid bone may be projected below or onto the inferior border of the mandible.
Trabeculation is most evident within the alveolar process. The mandibular canals and mental foramina are usually clearly visualized in the ramus and body regions of the body of the mandible. Typically
FIG. 11-15 Intellectual Segmentation of the Panoramic Image. The panoramic image is composed of right and left lateral images connected in the middle by a PA image; it looks similar to a Mercator projection of the globe. This is appreciated by comparing the segmented panoramic image and the labeled structures to the matching cephalometric fi lms acquired on the same patient. A-C, Left lateral, PA, and right lateral cephalometric images. These images are cropped and aligned to produce A1-C1. A2-C2 show a segmented panoramic image on the same patient. Note the similarities between the lateral cephalometric images and the panoramic image posterior to the canines, and between the PA cephalometric image and the panoramic image between the canines. Thus, when interpreting a panoramic image, the clinician should think of viewing left and right lateral projections of the midface, connected in the middle by a PA projection.
A
A1
A2
B
B1
B2 C2
C1
C
THE MANDIBLE
Studying the mandible ( Figs. 11-17 and 11-18 ) can be compartmen-talized into the major anatomic areas of this curved bone:
• Condylar process and temporomandibular joint • Coronoid process • Ramus • Body and angle
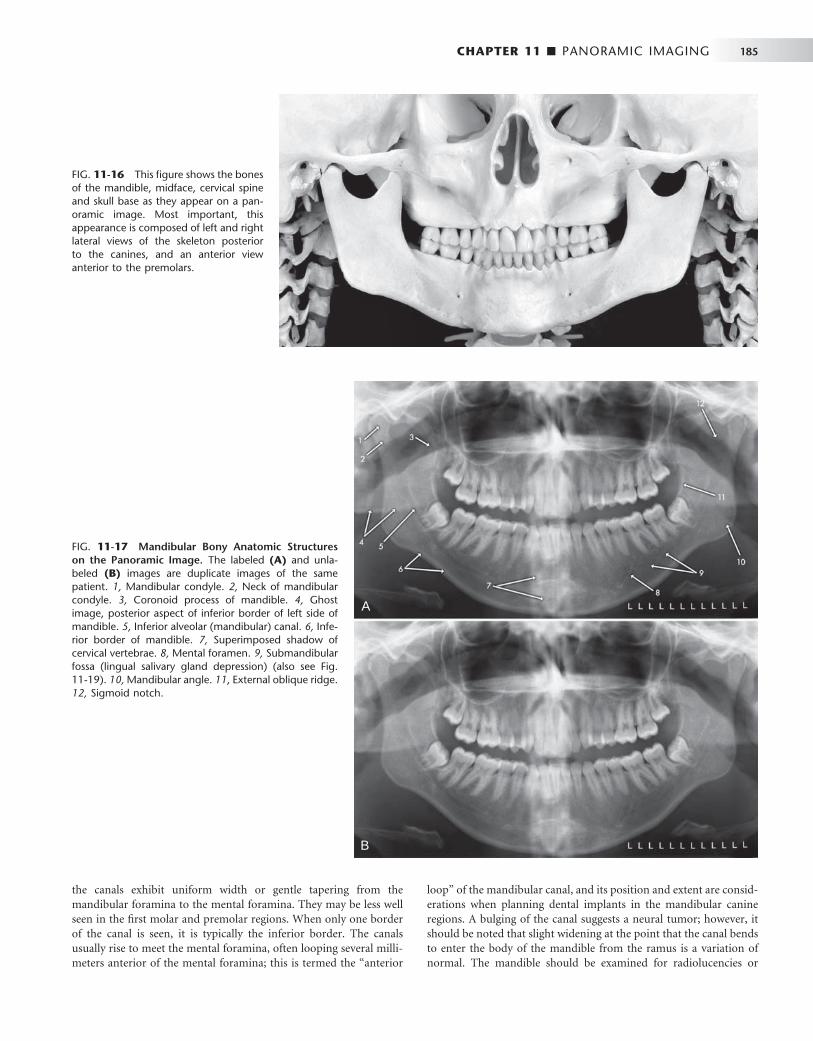
CHAPTER 11 ■ PANORAMIC IMAGING 185
FIG. 11-16 This fi gure shows the bones of the mandible, midface, cervical spine and skull base as they appear on a pan-oramic image. Most important, this appearance is composed of left and right lateral views of the skeleton posterior to the canines, and an anterior view anterior to the premolars.
FIG. 11-17 Mandibular Bony Anatomic Structures on the Panoramic Image. The labeled (A) and unla-beled (B) images are duplicate images of the same patient. 1, Mandibular condyle. 2, Neck of mandibular condyle. 3, Coronoid process of mandible. 4, Ghost image, posterior aspect of inferior border of left side of mandible. 5, Inferior alveolar (mandibular) canal. 6, Infe-rior border of mandible. 7, Superimposed shadow of cervical vertebrae. 8, Mental foramen. 9, Submandibular fossa (lingual salivary gland depression) (also see Fig. 11-19 ). 10, Mandibular angle. 11 , External oblique ridge. 12, Sigmoid notch.
A
B
the canals exhibit uniform width or gentle tapering from the mandibular foramina to the mental foramina. They may be less well seen in the fi rst molar and premolar regions. When only one border of the canal is seen, it is typically the inferior border. The canals usually rise to meet the mental foramina, often looping several milli-meters anterior of the mental foramina; this is termed the “ anterior
loop ” of the mandibular canal, and its position and extent are consid-erations when planning dental implants in the mandibular canine regions. A bulging of the canal suggests a neural tumor; however, it should be noted that slight widening at the point that the canal bends to enter the body of the mandible from the ramus is a variation of normal. The mandible should be examined for radiolucencies or

186 PART IV ■ IMAGING PRINCIPLES AND TECHNIQUES
opacities. The midline is more opaque because of the mental protu-berance, increased trabecular numbers, and attenuation of the beam as it passes through the cervical spine. Many modern panoramic machines automatically increase the exposure factors as they pass across the cervical spine region in an attempt to minimize this opacity; nevertheless, some opacity is generally seen in the anterior regions of the image. There are often depressions on the lingual surfaces of the mandible, which are occupied by the submandibular and sublingual glands: these depressions are termed the lingual salivary gland depres-sions, or fossae, and are often more radiolucent. This anatomic feature is shown on a panoramic image, a periapical image, a coronal CT image, and a dry skull in Figure 11-19 .
MIDFACIAL REGION
The midface is a complex mixture of bones, air cavities and soft tissues, all of which appear on panoramic images ( Figs. 11-20 and 11-21 ). Individual bones that may appear the panoramic image of the midface include temporal, zygoma, mandible, frontal, maxilla, sphe-noid, ethmoid, vomer, nasal, turbinate, and palate; thus, it is some-what of a misnomer to refer to the midfacial region on the panoramic image as “ the maxilla. ” Maintaining the discipline and focus of a sys-temic examination of all aspects of the midfacial images is diffi cult and critical in the overall examination of the panoramic image.
As with the mandible, the maxilla can be compartmentalized into major sites for examination:
• Cortical boundary of the maxilla, including the posterior border and the alveolar ridge
FIG. 11-18 Spinal, Neck, and Soft Tissue Anatomic Structures on the Panoramic Image. The labeled (A) and unlabeled (B) images are duplicate images of the same patient. 1, Schm ö rl ’ s Node (variant of normal anatomy of the vertebral body). 2, Cervical vertebra. 3, Ear lobe. 4, Soft palate and uvula. 5, Hard palate (the lower line is the junction of the hard palate and the lateral wall of the nasal cavity on the tube side, and the upper line is the junction of the hard palate and lateral wall of the nasal cavity on the recep-tor side). 6, Orbital rim. 7, Floor of nasopharynx (upper surface of soft palate). 8, Posterior surface of tongue. 9, Posterior pharyngeal wall. 10, Hyoid bone.
A
B
• Pterygomaxillary fi ssure • Maxillary sinuses • Zygomatic complex, including inferior and lateral orbital rims,
zygomatic process of maxilla, and anterior portion of zygomatic arch
• Nasal cavity and conchae • Temporomandibular joint (already viewed in the mandible, but
revisiting important structures is always a good idea in image interpretation)
• Maxillary dentition and supporting alveolus
Examining the cortical outline of the maxilla is a good way to center the examination of the midface. The posterior border of the maxilla extends from the superior portion of the pterygomaxillary fi ssure down to the tuberosity region and around to the other side. The posterior border of the pterygomaxillary fi ssure is the pterygoid spine of the sphenoid bone (the anterior border of the pterygoid plates). Occasionally, the sphenoid sinus may extend into this struc-ture. The pterygomaxillary fi ssure itself has an inverted teardrop appearance; it is very important to identify this area on both sides of the image because maxillary sinus mucoceles and carcinomas will characteristically destroy the posterior maxillary border, which is then manifested as loss of the anterior border of the pterygomaxillary fi ssure. Also, LeFort fractures of the maxilla by defi nition involve the pterygoid plate(s), and this will often be initially diagnosed by disturbances of the integrity of the pterygomaxillary fi ssure on the panoramic image. In fact, this may be the only evidence for such a fracture on the panoramic image. To clarify the three-dimensional anatomy of the pterygomaxillary fi ssure, Figure 11-22 shows this

CHAPTER 11 ■ PANORAMIC IMAGING 187
FIG. 11-19 The submandibular fossa (lingual sali-vary gland depression), a concavity often found on the posterior lingual surface of the mandible. This triangularly shaped area is bounded anatomically by the mylohyoid ridge, the inferior border of the man-dibular body, and the posterior border of the man-dibular ramus. Asterisk indicates the area of the submandibular fossa on the various images. A, Pan-oramic image. B, Photograph of the lingual side of a dried mandible. C, Coronal CT scan through the molar region of the mandible. D, Mandibular molar periapical image.
FIG. 11-20 Maxillary, or Mid-Facial, Bony Ana-tomic Structures on the Panoramic Image. The labeled (A) and unlabeled (B) images are duplicates of the same patient. 1, Articular tubercle, temporal bone. 2, Zygoma. 3, Zygomatic process of maxilla. 4, Pterygomaxillary fi ssure. 5, Floor of orbit. 6, Anterior aspect if inferior concha. 7, Nasal septum. 8, Anterior nasal spine. 9, Floor of maxillary sinus. 10, Maxillary left third molar (developing). 11, Ear lobe. 12, Cervical vertebral body.
A
B
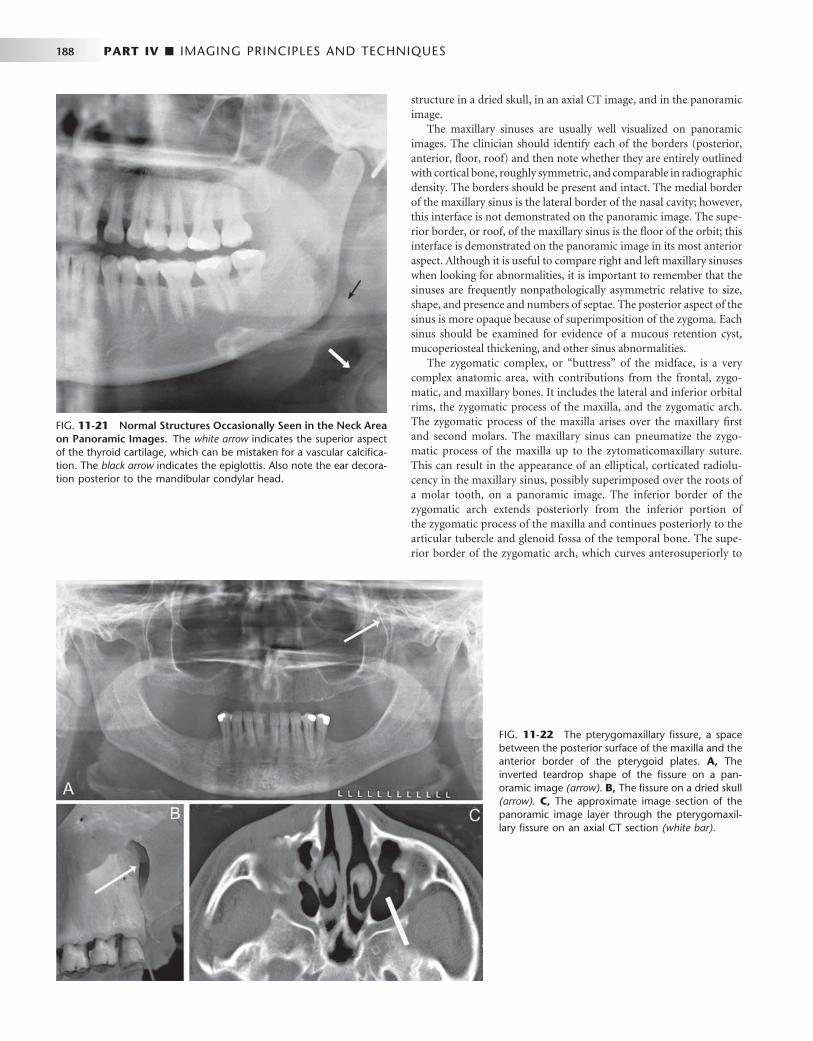
188 PART IV ■ IMAGING PRINCIPLES AND TECHNIQUES
FIG. 11-21 Normal Structures Occasionally Seen in the Neck Area on Panoramic Images. The white arrow indicates the superior aspect of the thyroid cartilage, which can be mistaken for a vascular calcifi ca-tion. The black arrow indicates the epiglottis. Also note the ear decora-tion posterior to the mandibular condylar head.
structure in a dried skull, in an axial CT image, and in the panoramic image.
The maxillary sinuses are usually well visualized on panoramic images. The clinician should identify each of the borders (posterior, anterior, fl oor, roof) and then note whether they are entirely outlined with cortical bone, roughly symmetric, and comparable in radiographic density. The borders should be present and intact. The medial border of the maxillary sinus is the lateral border of the nasal cavity; however, this interface is not demonstrated on the panoramic image. The supe-rior border, or roof, of the maxillary sinus is the fl oor of the orbit; this interface is demonstrated on the panoramic image in its most anterior aspect. Although it is useful to compare right and left maxillary sinuses when looking for abnormalities, it is important to remember that the sinuses are frequently nonpathologically asymmetric relative to size, shape, and presence and numbers of septae. The posterior aspect of the sinus is more opaque because of superimposition of the zygoma. Each sinus should be examined for evidence of a mucous retention cyst, mucoperiosteal thickening, and other sinus abnormalities.
The zygomatic complex, or “ buttress ” of the midface, is a very complex anatomic area, with contributions from the frontal, zygo-matic, and maxillary bones. It includes the lateral and inferior orbital rims, the zygomatic process of the maxilla, and the zygomatic arch. The zygomatic process of the maxilla arises over the maxillary fi rst and second molars. The maxillary sinus can pneumatize the zygo-matic process of the maxilla up to the zytomaticomaxillary suture. This can result in the appearance of an elliptical, corticated radiolu-cency in the maxillary sinus, possibly superimposed over the roots of a molar tooth, on a panoramic image. The inferior border of the zygomatic arch extends posteriorly from the inferior portion of the zygomatic process of the maxilla and continues posteriorly to the articular tubercle and glenoid fossa of the temporal bone. The supe-rior border of the zygomatic arch, which curves anterosuperiorly to
FIG. 11-22 The pterygomaxillary fi ssure, a space between the posterior surface of the maxilla and the anterior border of the pterygoid plates. A, The inverted teardrop shape of the fi ssure on a pan-oramic image (arrow). B, The fi ssure on a dried skull (arrow). C, The approximate image section of the panoramic image layer through the pterygomaxil-lary fi ssure on an axial CT section (white bar) .

CHAPTER 11 ■ PANORAMIC IMAGING 189
form the lateral aspect of the lateral orbital rim, should also be noted. The zygomaticotemporal suture lies in the middle of the zygomatic arch and may simulate a fracture if visualized on the image. Addition-ally, the mastoid air cells will occasionally pneumatize the temporal bone all the way to the zygomaticotemporal suture, giving the glenoid fossa of the TMJ the appearance of having a multilocular, or “ soap-bubbly, ” radiolucency that is, in fact, a variant of normal.
The nasal fossa may show the nasal septum and inferior concha, including both the bone and its mucosal covering. The conchae, com-posed of an internal bone, the turbinate, and covering cartilage and mucosa, are seen in a coronal manner in the anterior portion of the image and in a sagittal manner in the posterior portions of the pan-oramic image. They can appear as very large, homogeneous, soft-tissue densities superimposed over the maxillary sinuses and occasionally the anterior nasopharynx.
SOFT TISSUES
A number of opaque soft tissue structures may be identifi ed on pan-oramic radiographs (see Figs. 11-20 and 11-21 ), including the tongue arching across the fi lm under the hard palate, roughly from the region of the right angle of the mandible to the left angle), lip markings (in the middle of the fi lm), the soft palate extending posteriorly from the hard palate (see Fig. 11-18 , No. 7) over each ramus, the posterior wall of the oral and nasal pharynx, the nasal septum, ear lobes, nose, and nasolabial folds. Radiolucent airway shadows superimpose on normal anatomic structures and may be demonstrated by the borders of adjacent soft tissues. They include the nasal fossa, nasopharynx, oral cavity, and oro-pharynx. The epiglottis and thyroid cartilage are often seen in panoramic images. Occasionally the air space between the dorsum of the tongue and the soft palate simulates a fracture through the angle of the mandible.
SUPERIMPOSITIONS AND GHOST IMAGES
Many radiopaque objects out of the image layer superimpose on the images of normal anatomic structures. This results when the x-ray beam projects through a dense object (e.g., an earring, the spinal column, the mandibular ramus, or the hard palate) that is in the path of the x-ray beam but out of the portion of the focal trough being imaged. The object typically appears blurred and pro jects either over the midline structures, as with the cervical vertebrae, or onto the opposite side of the radiograph with reversed confi guration and more cranially positioned than the real structure (see Fig. 11-18 ). These contralateral images are termed “ ghost images, ” and they may obscure normal anatomy or be mistaken for pathologic conditions.
DENTITION
Finally, the teeth and supporting alveolar bone should be evaluated. Excessively wide or narrow anterior teeth suggest malposition of the patient in the image layer. Similarly, teeth that are wider on one side than the other suggest that the patient ’ s sagittal plane was rotated. Although gross caries and periapical and periodontal disease may be evident, subtle disease requires intraoral images for diagnosis. The proximal surfaces of the premolar teeth often overlap, which further interferes with caries interpretation.
One of the strengths of the panoramic image is the demonstration of the complete dentition. Although there is a rare situation where positioning of the patient and of an ectopic tooth place the tooth out of the image layer, all the teeth are generally seen on the image. Thus the interpretation must always include identifi cation of all erupted and developing teeth ( Fig. 11-23 ). The teeth should be examined for gross abnormalities of number, position, and anatomy. Existing
FIG. 11-23 Panoramic image showing late mixed dentition of an 11-year-old patient. The panoramic image can be useful in identifying the presence or absence, as well as developmental status, of the permanent dentition. In this patient, the mandibular second premolars are congenitally absent, and the mandibular deciduous second molars are not undergoing root resorption, indicating that they will be retained. The permanent canines, second molars, and fi rst and second premolars are in various stages of mineralization, with most of them beginning to erupt.
190 PART IV ■ IMAGING PRINCIPLES AND TECHNIQUES
dentistry, including endodontic obturations, crowns, and other fi xed restorations, should be noted.
It is particularly important to closely examine impacted third molars. Their orientation, the numbers and confi gurations of the roots, the relationships of the tooth components to critical anatomic structures such as the mandibular canal, the fl oor and posterior wall of the maxillary sinus, the maxillary tuberosity, and adjacent teeth, and the presence of abnormalities in the pericoronal or periradicular bone must be carefully studied. Suspected abnormalities of the denti-tion seen on panoramic images will generally require intraoral imaging for a more defi nitive demonstration of the area.
BIBLIOGRAPHY 1 Brooks SL , Brand JW , Gibbs SJ et al : Imaging of the temporomandibular
joint: a position paper of the American Academy of Oral and Maxillofacial Radiology , Oral Surg Oral Med Oral Pathol Oral Radiol Endod 83 : 609 - 618 , 1997 .
2 Chomenko AG : Atlas for maxillofacial pantomographic interpretation , Chicago , 1985 , Quintessence .
Farman AG , editor: Panoramic radiology: seminars on maxillofacial imaging and interpretation , 2007 , Berlin , Springer .
3 Langland OE , Langlais RP , McDavid WD et al : Panoramic radiology , ed 2 , Philadelphia , 1989 , Lea & Febiger .
Moore WE, editor: Successful panoramic radiography: KODAK Dental Radiography Series (2001): www.kodakdental.com/documentation/fi lm/N-406SuccPanRad.pdf. Accessed February 20, 2008.
5 Numata H : Consideration of the parabolic radiography of the dental arch , J Shimazu Stud 10 : 13 , 1933 .
6 Paatero YV : The use of a mobile source of light in radiography , Acta Radiol 29 : 221 , 1948 .
7 Paatero YV : A new tomographic method for radiographing curved outer surfaces , Acta Radiol 32 : 177 , 1949 .

C H A P T E R 1 2
Extraoral Radiographic Examinations
Sotirios Tetradis • Mel L. Kantor
In extraoral radiographic examinations both the x-ray source and image receptor (fi lm or electronic sensor) are placed outside the patient ’ s mouth. This chapter describes the most common extra-
oral radiographic examinations in which the source and sensor remain static. These include the lateral cephalometric projection of the sagittal or median plane; the submentovertex projection of the transverse or horizontal plane; the Waters, posteroanterior cephalometric , and reverse-Towne projections of the coronal or frontal plane; and the oblique lateral projections of the mandibular body and ramus. Panoramic radiography is described in Chapter 11 , and other more complex imaging modalities are described in Chapters 13 and 14 .
Technique
The fi rst step in obtaining a radiograph is the selection of the appro-priate projection for the pertinent diagnostic task. However, for peda-gogic reasons, this chapter begins with the technical facets of obtaining the extraoral views to make the reader familiar with the various projections.
Extraoral radiographs are produced with conventional dental x-ray machines, certain models of panoramic machines, or higher-capacity medical x-ray units. Cephalometric and skull views require at least a 20 × 25 cm (8 × 10 inch) image receptor, whereas oblique lateral projections of the mandible can be obtained with a 13 × 18 cm (5 × 7 inch) image receptor. It is critical to correctly and clearly label the right and left sides of the image. This usually is done by placing a metal marker (an R or an L ) on the outside of the cassette in a corner in which the marker does not obstruct diagnostic information.
The proper exposure parameters depend on the patient ’ s size, anatomy, and head orientation; image receptor speed; x-ray source-to-receptor distance; and whether grids are used. In cases of known or suspected disease, medium- or high-speed rare-earth screen-fi lm combinations provide optimal balance between diagnostic informa-tion and patient exposure. For orthodontic purposes, high-speed combinations reduce patient exposure without compromising the identifi cation of anatomic landmarks necessary for cephalometric analysis. Although radiographic grids reduce scattered radiation and improve contrast and resolution, they result in higher patient expo-sure. Cephalometry does not require the use of grids. However, grids could improve the radiographic appearance of fi ne structures, such as trabecular architecture, and aid in the diagnosis of disease.
Proper positioning of the x-ray source, patient, and image receptor requires patience, attention to detail, and experience. The main ana-tomic landmark used in patient positioning during extraoral radiog-
raphy is the canthomeatal line, which joins the central point of the external auditory canal to the outer canthus of the eye. The cantho-meatal line forms approximately a 10-degree angle with the Frankfort plane, the line that connects the superior border of the external audi-tory canal with the infraorbital rim. The image receptor and patient placement, central beam direction, and resultant image for the lateral, submentovertex, Waters, posteroanterior, reverse-Towne, and man-dibular oblique lateral projections are summarized in Table 12-1 and are described in detail in the following sections.
LATERAL SKULL PROJECTION (LATERAL CEPHALOMETRIC PROJECTION)
Of the extraoral radiographs described in this chapter, the lateral cephalometric projection is by far the most commonly used in den-tistry. All cephalometric radiographs, including the lateral view, are made with a cephalostat that helps maintain a constant relationship among the skull, the fi lm, and the x-ray beam. Skeletal, dental, and soft tissue anatomic landmarks delineate lines, planes, angles, and distances that are used to generate measurements and to classify patient craniofacial morphologic features. At the beginning of treat-ment, these measurements are often compared with an established standard; during treatment, the measurements are usually compared with those from previous cephalometric radiographs of the same patient to monitor growth and development as well as treatment.
Image Receptor and Patient Placement The image receptor is positioned parallel to the patient ’ s midsagittal plane. The site of interest is placed toward the image receptor to minimize distortion. In cephalometric radiography, the patient is placed with the left side toward the image receptor (U.S. standards), and a wedge fi lter at the tube head is positioned over the anterior aspect of the beam to absorb some of the radiation and to allow visualization of soft tissues of the face.
Position of the Central X-Ray Beam The central beam is perpendicular to the midsagittal plane of the patient and the plane of the image receptor and is centered over the external auditory meatus.
Resultant Image ( Fig. 12-1 ) Exact superimposition of right and left sides is impossible because structures on the side near the image receptor are magnifi ed less than the same structures on the side far from the image receptor. Bilateral
191
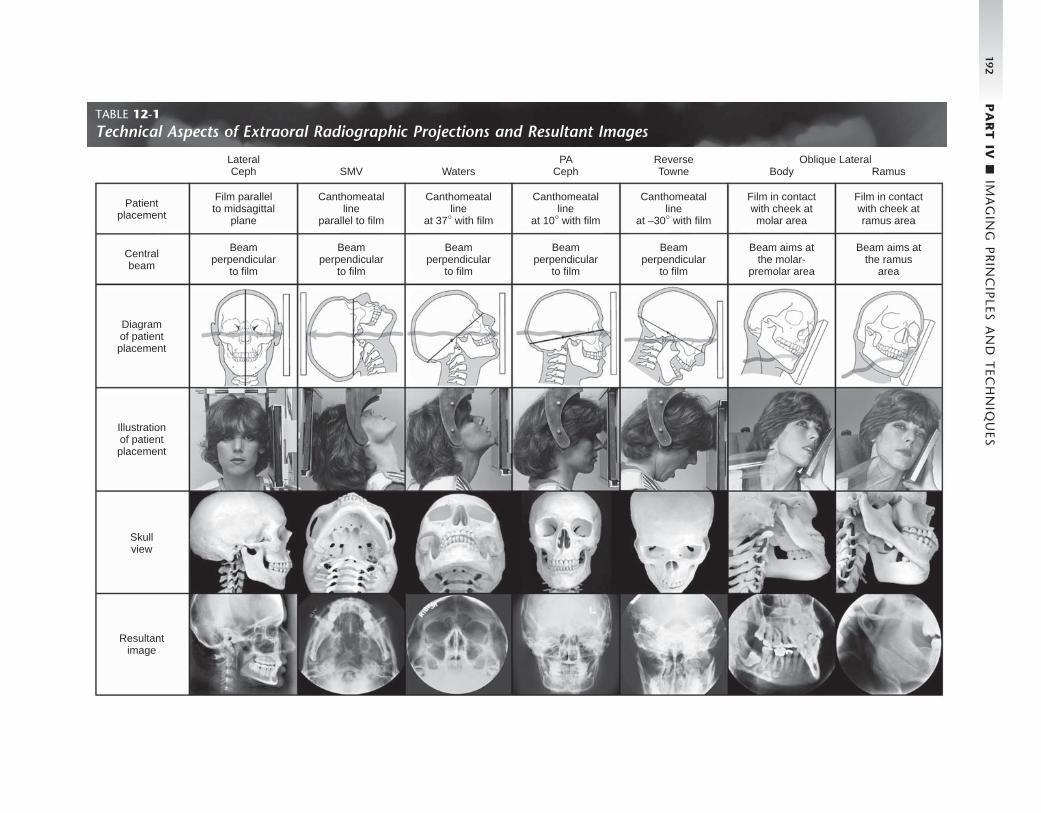
192 P
AR
T IV
■ IM
AG
ING
PR
INC
IPLES A
ND
TEC
HN
IQU
ES
TABLE 12-1 Technical Aspects of Extraoral Radiographic Projections and Resultant Images
Patientplacement
LateralCeph SMV Waters
PACeph
ReverseTowne Body Ramus
Film parallelto midsagittal
plane
Beamperpendicular
to film
Canthomeatalline
parallel to film
Beamperpendicular
to film
Beamperpendicular
to film
Canthomeatalline
at 37° with film
Beamperpendicular
to film
Canthomeatalline
at 10° with film
Beamperpendicular
to film
Canthomeatalline
at –30° with film
Beam aims atthe molar-
premolar area
Film in contactwith cheek atmolar area
Beam aims atthe ramus
area
Film in contactwith cheek atramus area
Oblique Lateral
Centralbeam
Illustrationof patientplacement
Skullview
Resultantimage
Diagramof patientplacement

CHAPTER 12 ■ EXTRAORAL RADIOGRAPHIC EXAMINATIONS 193
structures close to the midsagittal plane demonstrate less discrepancy in size compared with bilateral structures farther away from the midsagittal plane. Structures close to the midsagittal plane (e.g., the clinoid processes and inferior turbinates) should be nearly superimposed.
There are many cephalometric analyses that are based on a variety of anatomic landmarks. Steiner and Ricketts analyses are two commonly used analyses that use the skeletal, dental, and soft tissue landmarks included in Box 12-1 . Precise identifi cation of the various landmarks on the lateral cephalometric radiograph is necessary to generate accurate cephalometric measurements. The landmarks in Box 12-1 are shown in Figure 12-2, A , on a side view of a skull and in Figure 12-2, B , on a 5-mm wide midline section of an orthodontic patient imaged by cone-beam computed tomogra-phy. Finally, Figure 12-2, C , depicts the projected landmark position on the lateral cephalogram of an orthodontic patient. Although taken for a specifi c purpose, a lateral cephalometric radiograph is still a lateral skull fi lm and should be interpreted as such. It is not suffi cient to limit the interpretation to the cephalometric analysis.
SUBMENTOVERTEX (BASE) PROJECTION
Image Receptor and Patient Placement The image receptor is positioned parallel to patient ’ s transverse plane and perpendicular to the midsagittal and coronal planes. To achieve this, the patient ’ s neck is extended as far backward as possible, with the canthomeatal line forming a 10-degree angle with the image receptor.
Position of the Central X-Ray Beam The central beam is perpendicular to the image receptor, directed from below the mandible toward the vertex of the skull (hence the name submentovertex, or SMV ), and centered about 2 cm anterior to a line connecting the right and left condyles.
Resultant Image ( Fig. 12-3 ) The midsagittal plane (represented by an imaginary line extending from the interproximal space of the maxillary central incisors through the nasal septum, to the middle of the anterior arch of the atlas, and to the dens) should divide the skull image in two symmetric halves.
FIG. 12-1 Anatomic landmarks identifi ed in the lateral cephalometric projection.
Base ofmiddle cranial
fossa
Externalauditorymeatus
Mastoidair cells
Mastoidprocess
Occipitalcondyle
Posteriorarch of
atlas
Anteriorarch of
atlas
Dens axis
Posteriorpharyngeal wall
Earlobe
Salpingopharyngealfold
Superiorborder of
inferiorturbinate
Point B
Tooth bud
Hardpalate
Point A
Anteriornasal spine
Zygomaticprocess ofmaxilla
Floor oforbit
Inferiorrim of orbit
Frontalprocess ofzygoma
Lower eyelid
Lens of eye
Nasal bone
Nasion
Ethmoidair cells
Roof oforbit
Posteriormaxillary
sinusPlanum
sphenoidaleSphenoid
sinus
Anteriorclinoid
processesSella
turcica
Posteriorclinoid
processesPterygomaxillary
fissurePterygoid
spineClivusPterygoid
plates
Softpalate
Inferior borderof zygomatic arch
Dorsum oftongue
Hyoid bone
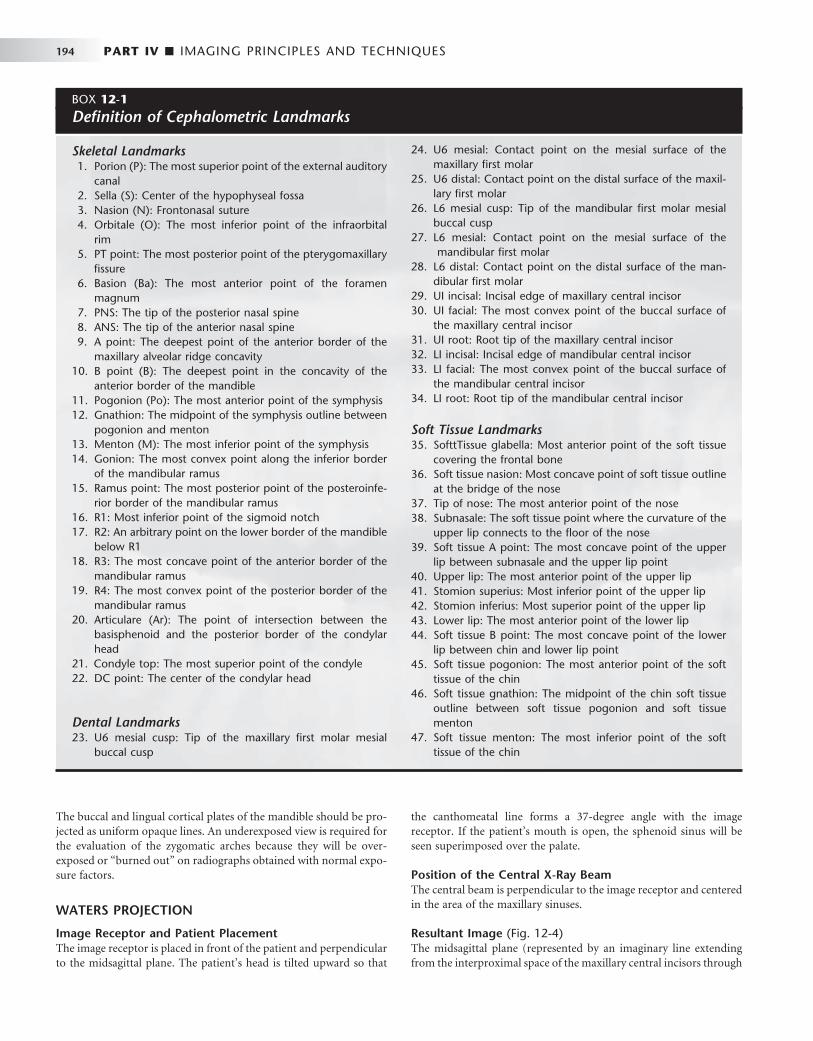
194 PART IV ■ IMAGING PRINCIPLES AND TECHNIQUES
BOX 12-1
Defi nition of Cephalometric Landmarks
Skeletal Landmarks 1. Porion (P): The most superior point of the external auditory
canal 2. Sella (S): Center of the hypophyseal fossa 3. Nasion (N): Frontonasal suture 4. Orbitale (O): The most inferior point of the infraorbital
rim 5. PT point: The most posterior point of the pterygomaxillary
fi ssure 6. Basion (Ba): The most anterior point of the foramen
magnum 7. PNS: The tip of the posterior nasal spine 8. ANS: The tip of the anterior nasal spine 9. A point: The deepest point of the anterior border of the
maxillary alveolar ridge concavity 10. B point (B): The deepest point in the concavity of the
anterior border of the mandible 11. Pogonion (Po): The most anterior point of the symphysis 12. Gnathion: The midpoint of the symphysis outline between
pogonion and menton 13. Menton (M): The most inferior point of the symphysis 14. Gonion: The most convex point along the inferior border
of the mandibular ramus 15. Ramus point: The most posterior point of the posteroinfe-
rior border of the mandibular ramus 16. R1: Most inferior point of the sigmoid notch 17. R2: An arbitrary point on the lower border of the mandible
below R1 18. R3: The most concave point of the anterior border of the
mandibular ramus 19. R4: The most convex point of the posterior border of the
mandibular ramus 20. Articulare (Ar): The point of intersection between the
basisphenoid and the posterior border of the condylar head
21. Condyle top: The most superior point of the condyle 22. DC point: The center of the condylar head
Dental Landmarks 23. U6 mesial cusp: Tip of the maxillary fi rst molar mesial
buccal cusp
24. U6 mesial: Contact point on the mesial surface of the maxillary fi rst molar
25. U6 distal: Contact point on the distal surface of the maxil-lary fi rst molar
26. L6 mesial cusp: Tip of the mandibular fi rst molar mesial buccal cusp
27. L6 mesial: Contact point on the mesial surface of the mandibular fi rst molar
28. L6 distal: Contact point on the distal surface of the man-dibular fi rst molar
29. UI incisal: Incisal edge of maxillary central incisor 30. UI facial: The most convex point of the buccal surface of
the maxillary central incisor 31. UI root: Root tip of the maxillary central incisor 32. LI incisal: Incisal edge of mandibular central incisor 33. LI facial: The most convex point of the buccal surface of
the mandibular central incisor 34. LI root: Root tip of the mandibular central incisor
Soft Tissue Landmarks 35. SofttTissue glabella: Most anterior point of the soft tissue
covering the frontal bone 36. Soft tissue nasion: Most concave point of soft tissue outline
at the bridge of the nose 37. Tip of nose: The most anterior point of the nose 38. Subnasale: The soft tissue point where the curvature of the
upper lip connects to the fl oor of the nose 39. Soft tissue A point: The most concave point of the upper
lip between subnasale and the upper lip point 40. Upper lip: The most anterior point of the upper lip 41. Stomion superius: Most inferior point of the upper lip 42. Stomion inferius: Most superior point of the upper lip 43. Lower lip: The most anterior point of the lower lip 44. Soft tissue B point: The most concave point of the lower
lip between chin and lower lip point 45. Soft tissue pogonion: The most anterior point of the soft
tissue of the chin 46. Soft tissue gnathion: The midpoint of the chin soft tissue
outline between soft tissue pogonion and soft tissue menton
47. Soft tissue menton: The most inferior point of the soft tissue of the chin
The buccal and lingual cortical plates of the mandible should be pro-jected as uniform opaque lines. An underexposed view is required for the evaluation of the zygomatic arches because they will be over-exposed or “ burned out ” on radiographs obtained with normal expo-sure factors.
WATERS PROJECTION
Image Receptor and Patient Placement The image receptor is placed in front of the patient and perpendicular to the midsagittal plane. The patient ’ s head is tilted upward so that
the canthomeatal line forms a 37-degree angle with the image receptor. If the patient ’ s mouth is open, the sphenoid sinus will be seen superimposed over the palate.
Position of the Central X-Ray Beam The central beam is perpendicular to the image receptor and centered in the area of the maxillary sinuses.
Resultant Image ( Fig. 12-4 ) The midsagittal plane (represented by an imaginary line extending from the interproximal space of the maxillary central incisors through

CHAPTER 12 ■ EXTRAORAL RADIOGRAPHIC EXAMINATIONS 195
FIG. 12-2 A, Anatomic cephalometric landmarks shown on a side view of the skull. B, Midline ana-tomic cephalometric landmarks depicted on a 5-mm-wide CBCT (cone-beam computed tomography) scan section of an orthodontic patient. C, Cephalometric landmarks used in Steiner and Ricketts cephalometric analyses.
A
B C

196 PART IV ■ IMAGING PRINCIPLES AND TECHNIQUES
Posterior wall ofmaxillary sinus
Coronoidprocess ofmandible
Anteriorwall ofmiddle
cranial fossa
Ramus ofmandible
Foramenovale
Foramenspinosum
Clivus
Mandibularangle
Externalauditorymeatus
Ossicles
Occipitalcondyle
Lateral wallof orbit
Nasal septum
Inferior orbitalfissure
Sphenoidsinuses
Lateral plateof pterygoidprocess
Medial plateof pterygoidprocess
Condyle ofmandible
Hyoid bone
Posteriorpharyngeal wall
Anteriorarch of atlas
DensA
B
FIG. 12-3 A, Anatomic landmarks identifi ed in the submentovertex projection. B, An underexposed submentovertex view reveals the zygomatic arches.
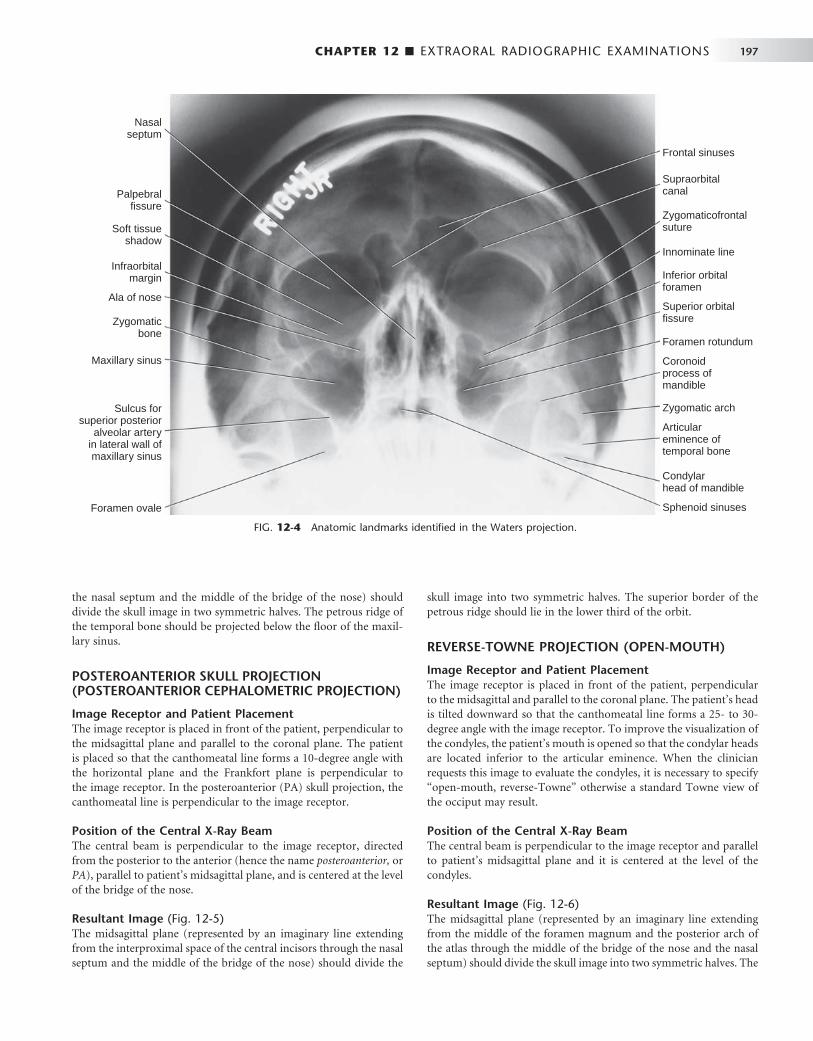
CHAPTER 12 ■ EXTRAORAL RADIOGRAPHIC EXAMINATIONS 197
FIG. 12-4 Anatomic landmarks identifi ed in the Waters projection.
Palpebralfissure
Nasalseptum
Soft tissueshadow
Infraorbitalmargin
Ala of nose
Zygomaticbone
Maxillary sinus
Sulcus forsuperior posterior
alveolar arteryin lateral wall ofmaxillary sinus
Foramen ovale
Frontal sinuses
Supraorbitalcanal
Zygomaticofrontalsuture
Innominate line
Inferior orbitalforamen
Superior orbitalfissure
Foramen rotundum
Coronoidprocess ofmandible
Zygomatic arch
Articulareminence oftemporal bone
Condylarhead of mandible
Sphenoid sinuses
the nasal septum and the middle of the bridge of the nose) should divide the skull image in two symmetric halves. The petrous ridge of the temporal bone should be projected below the fl oor of the maxil-lary sinus.
POSTEROANTERIOR SKULL PROJECTION (POSTEROANTERIOR CEPHALOMETRIC PROJECTION)
Image Receptor and Patient Placement The image receptor is placed in front of the patient, perpendicular to the midsagittal plane and parallel to the coronal plane. The patient is placed so that the canthomeatal line forms a 10-degree angle with the horizontal plane and the Frankfort plane is perpendicular to the image receptor. In the posteroanterior (PA) skull projection, the canthomeatal line is perpendicular to the image receptor.
Position of the Central X-Ray Beam The central beam is perpendicular to the image receptor, directed from the posterior to the anterior (hence the name posteroanterior, or PA ), parallel to patient ’ s midsagittal plane, and is centered at the level of the bridge of the nose.
Resultant Image ( Fig. 12-5 ) The midsagittal plane (represented by an imaginary line extending from the interproximal space of the central incisors through the nasal septum and the middle of the bridge of the nose) should divide the
skull image into two symmetric halves. The superior border of the petrous ridge should lie in the lower third of the orbit.
REVERSE-TOWNE PROJECTION (OPEN-MOUTH)
Image Receptor and Patient Placement The image receptor is placed in front of the patient, perpendicular to the midsagittal and parallel to the coronal plane. The patient ’ s head is tilted downward so that the canthomeatal line forms a 25- to 30-degree angle with the image receptor. To improve the visualization of the condyles, the patient ’ s mouth is opened so that the condylar heads are located inferior to the articular eminence. When the clinician requests this image to evaluate the condyles, it is necessary to specify “ open-mouth, reverse-Towne ” otherwise a standard Towne view of the occiput may result.
Position of the Central X-Ray Beam The central beam is perpendicular to the image receptor and parallel to patient ’ s midsagittal plane and it is centered at the level of the condyles.
Resultant Image ( Fig. 12-6 ) The midsagittal plane (represented by an imaginary line extending from the middle of the foramen magnum and the posterior arch of the atlas through the middle of the bridge of the nose and the nasal septum) should divide the skull image into two symmetric halves. The
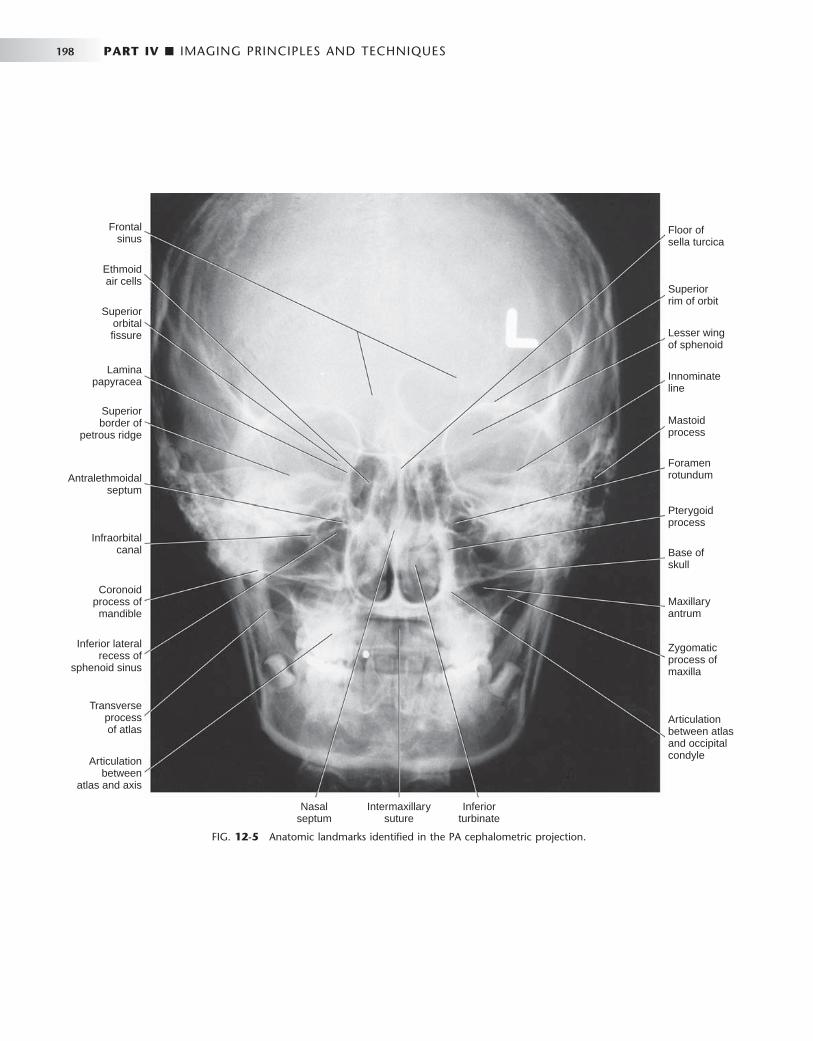
198 PART IV ■ IMAGING PRINCIPLES AND TECHNIQUES
FIG. 12-5 Anatomic landmarks identifi ed in the PA cephalometric projection.
Floor ofsella turcica
Superiorrim of orbit
Lesser wingof sphenoid
Innominateline
Mastoidprocess
Foramenrotundum
Pterygoidprocess
Base ofskull
Maxillaryantrum
Zygomaticprocess ofmaxilla
Articulationbetween atlasand occipitalcondyle
Nasalseptum
Intermaxillarysuture
Inferiorturbinate
Frontalsinus
Ethmoidair cells
Superiororbitalfissure
Laminapapyracea
Superiorborder of
petrous ridge
Antralethmoidalseptum
Infraorbitalcanal
Coronoidprocess ofmandible
Inferior lateralrecess of
sphenoid sinus
Transverseprocessof atlas
Articulationbetween
atlas and axis
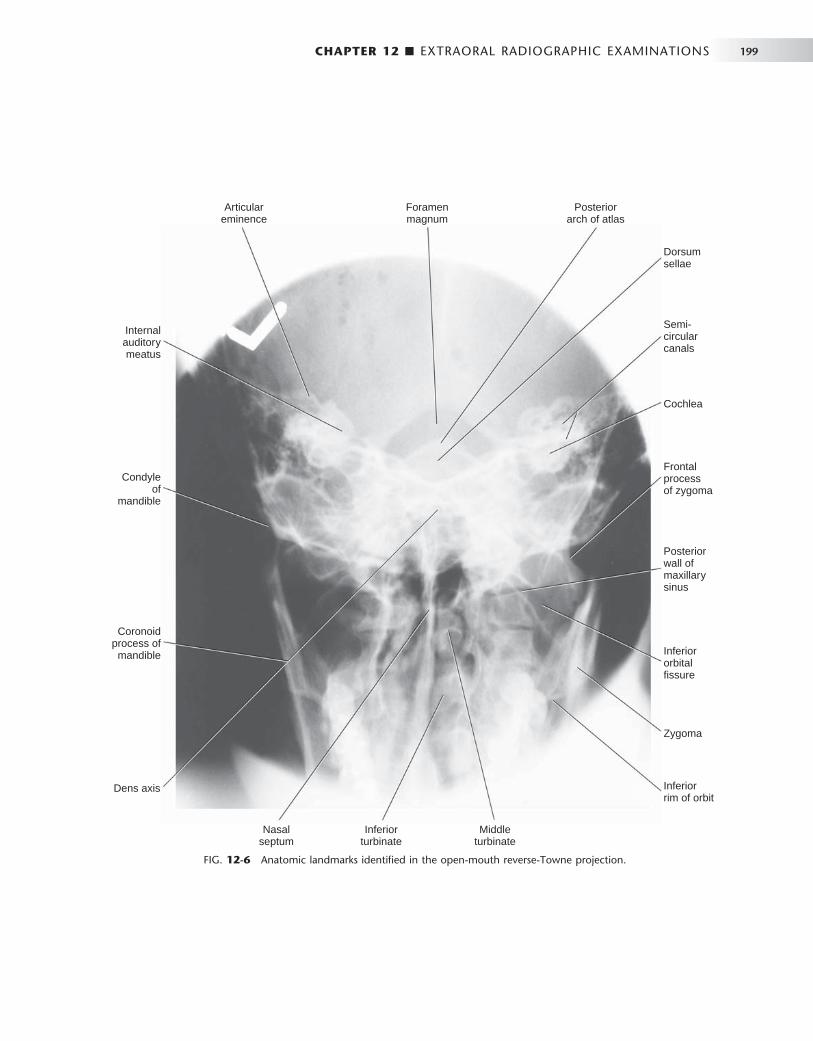
CHAPTER 12 ■ EXTRAORAL RADIOGRAPHIC EXAMINATIONS 199
FIG. 12-6 Anatomic landmarks identifi ed in the open-mouth reverse-Towne projection.
Nasalseptum
Inferiorrim of orbit
Articulareminence
Internalauditorymeatus
Condyleof
mandible
Coronoidprocess ofmandible
Dens axis
Inferiorturbinate
Middleturbinate
Zygoma
Inferiororbitalfissure
Posteriorwall ofmaxillarysinus
Frontalprocessof zygoma
Cochlea
Semi-circularcanals
Dorsumsellae
Foramenmagnum
Posteriorarch of atlas

200 PART IV ■ IMAGING PRINCIPLES AND TECHNIQUES
FIG. 12-7 Anatomic landmarks identifi ed in the oblique lateral projection of the mandibular body.
Inferior borderof mandible
Area ofosteosclerosis
Hyoid bone
Inferior border of orbit
Posterior wall of sinus
Posterior wall of zygomaticprocess of maxilla
Inferior border of zygomatic arch
Dorsum of tongue
Hard palate
Tube side, inferiorborder of mandible
petrous ridge of the temporal bone should be superimposed at the inferior part of the occipital bone, and the condylar heads should be projected inferior to the articular eminence.
MANDIBULAR OBLIQUE LATERAL PROJECTIONS
Mandibular Body Protection
Image Receptor and Patient Placement
The image receptor is placed against the patient ’ s cheek on the side of interest and centered in the molar-premolar area. The lower border of the cassette is parallel and at least 2 cm below the inferior border of the mandible. The head is tilted toward the side being examined, and the mandible is protruded.
Position of the Central X-Ray Beam The central beam is directed toward the molar-premolar region from a point 2 cm below the angle of the opposite side of the mandible.
Resultant Image ( Fig. 12-7 ) A clear image of the teeth, the alveolar ridge, and the body of the mandible should be obtained. If signifi cant distortion is present, the head was tilted excessively. If the contralateral side of the mandible is superimposed over the area of interest, the head was not tilted suffi ciently.
Mandibular Ramus Projection
Image Receptor and Patient Placement The image receptor is placed over the ramus and far enough posteri-orly to include the condyle. The lower border of the cassette is parallel
and at least 2 cm below the inferior border of the mandible. The head is tilted toward the side being examined so that the condyle of the area of interest and the contralateral angle of the mandible form a hori-zontal line. The mandible is protruded.
Position of the Central X-Ray Beam The central beam is directed toward the center of the imaged ramus, from 2 cm below the inferior border of the opposite side of the man-dible at the area of the fi rst molar.
Resultant Image ( Fig. 12-8 ) A clear image of the third molar – retromolar area, angle of the man-dible, ramus, and condyle head should be obtained. If signifi cant distortion is present, the head was tilted excessively. If the contralateral side of the mandible is superimposed over the area of interest, the head was not tilted suffi ciently.
Evaluating the Image
Extraoral images should fi rst be evaluated for overall quality. Proper exposure and processing will result in an image with good contrast and density. Proper patient positioning prevents unwanted superim-positions and distortions and facilitates identifi cation of anatomic landmarks. Interpreting poor-quality images can lead to diagnostic errors and subsequent treatment errors.
The fi rst step in the interpretation of radiographic images is the identifi cation of anatomy. A thorough knowledge of normal radio-graphic anatomy and the appearance of normal variants is critical for the identifi cation of pathology. Abnormalities cause disruptions of normal anatomy. Detecting the altered anatomy precedes classifying the type of change and developing a differential diagnosis. What is not detected cannot be interpreted. Figures 12-1 through 12-8 present
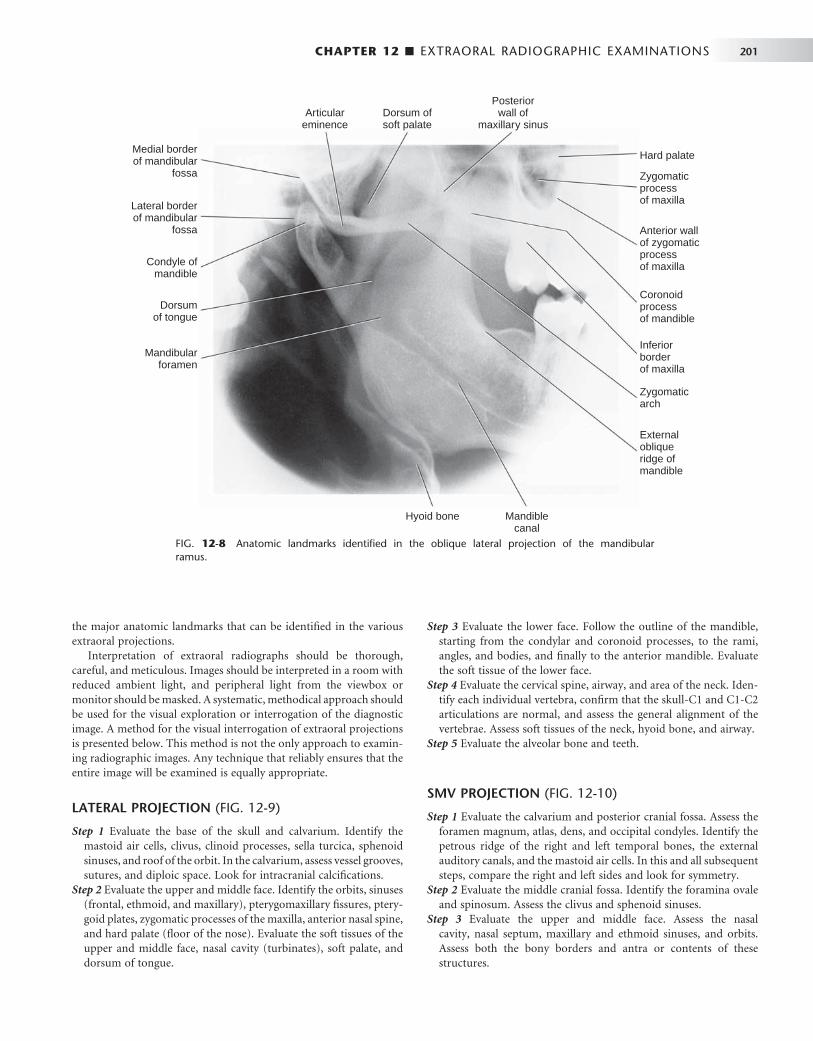
CHAPTER 12 ■ EXTRAORAL RADIOGRAPHIC EXAMINATIONS 201
FIG. 12-8 Anatomic landmarks identifi ed in the oblique lateral projection of the mandibular ramus.
Hyoid bone Mandiblecanal
Externalobliqueridge ofmandible
Zygomaticarch
Inferiorborderof maxilla
Coronoidprocessof mandible
Anterior wallof zygomaticprocessof maxilla
Zygomaticprocessof maxilla
Hard palate
Posteriorwall of
maxillary sinusDorsum ofsoft palate
Articulareminence
Medial borderof mandibular
fossa
Lateral borderof mandibular
fossa
Condyle ofmandible
Dorsumof tongue
Mandibularforamen
the major anatomic landmarks that can be identifi ed in the various extraoral projections.
Interpretation of extraoral radiographs should be thorough, careful, and meticulous. Images should be interpreted in a room with reduced ambient light, and peripheral light from the viewbox or monitor should be masked. A systematic, methodical approach should be used for the visual exploration or interrogation of the diagnostic image. A method for the visual interrogation of extraoral projections is presented below. This method is not the only approach to examin-ing radiographic images. Any technique that reliably ensures that the entire image will be examined is equally appropriate.
LATERAL PROJECTION ( FIG. 12-9 )
Step 1 Evaluate the base of the skull and calvarium. Identify the mastoid air cells, clivus, clinoid processes, sella turcica, sphenoid sinuses, and roof of the orbit. In the calvarium, assess vessel grooves, sutures, and diploic space. Look for intracranial calcifi cations.
Step 2 Evaluate the upper and middle face. Identify the orbits, sinuses (frontal, ethmoid, and maxillary), pterygomaxillary fi ssures, ptery-goid plates, zygomatic processes of the maxilla, anterior nasal spine, and hard palate (fl oor of the nose). Evaluate the soft tissues of the upper and middle face, nasal cavity (turbinates), soft palate, and dorsum of tongue.
Step 3 Evaluate the lower face. Follow the outline of the mandible, starting from the condylar and coronoid processes, to the rami, angles, and bodies, and fi nally to the anterior mandible. Evaluate the soft tissue of the lower face.
Step 4 Evaluate the cervical spine, airway, and area of the neck. Iden-tify each individual vertebra, confi rm that the skull-C1 and C1-C2 articulations are normal, and assess the general alignment of the vertebrae. Assess soft tissues of the neck, hyoid bone, and airway.
Step 5 Evaluate the alveolar bone and teeth.
SMV PROJECTION ( FIG. 12-10 )
Step 1 Evaluate the calvarium and posterior cranial fossa. Assess the foramen magnum, atlas, dens, and occipital condyles. Identify the petrous ridge of the right and left temporal bones, the external auditory canals, and the mastoid air cells. In this and all subsequent steps, compare the right and left sides and look for symmetry.
Step 2 Evaluate the middle cranial fossa. Identify the foramina ovale and spinosum. Assess the clivus and sphenoid sinuses.
Step 3 Evaluate the upper and middle face. Assess the nasal cavity, nasal septum, maxillary and ethmoid sinuses, and orbits. Assess both the bony borders and antra or contents of these structures.

FIG. 12-9 Interrogating the lateral cephalometric projection. The radiograph in the upper left dem-onstrates the whole image. Subsequent radiographs correspond to the steps of interrogation.
543
21
FIG. 12-10 Interrogating the submentovertex projection. The radiograph in the upper left demon-strates the whole image. Subsequent radiographs correspond to the steps of interrogation.
43
21
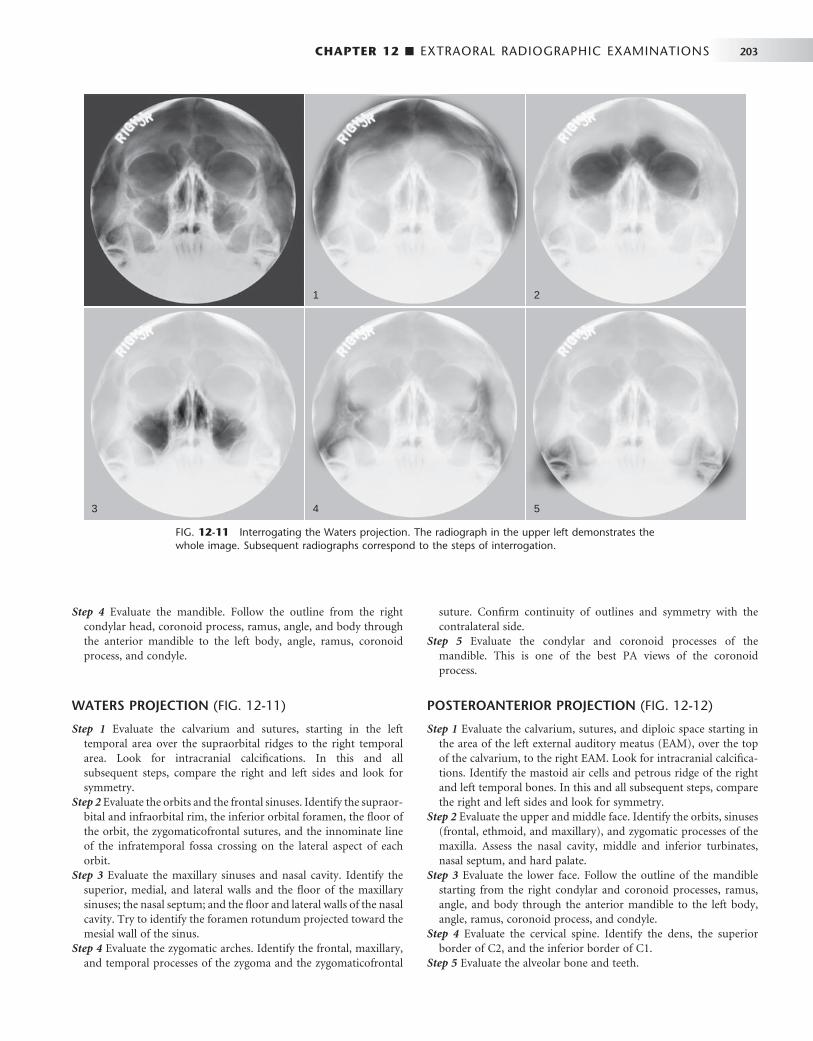
CHAPTER 12 ■ EXTRAORAL RADIOGRAPHIC EXAMINATIONS 203
FIG. 12-11 Interrogating the Waters projection. The radiograph in the upper left demonstrates the whole image. Subsequent radiographs correspond to the steps of interrogation.
5
2
4
1
3
Step 4 Evaluate the mandible. Follow the outline from the right condylar head, coronoid process, ramus, angle, and body through the anterior mandible to the left body, angle, ramus, coronoid process, and condyle.
WATERS PROJECTION ( FIG. 12-11 )
Step 1 Evaluate the calvarium and sutures, starting in the left temporal area over the supraorbital ridges to the right temporal area. Look for intracranial calcifi cations. In this and all subsequent steps, compare the right and left sides and look for symmetry.
Step 2 Evaluate the orbits and the frontal sinuses. Identify the supraor-bital and infraorbital rim, the inferior orbital foramen, the fl oor of the orbit, the zygomaticofrontal sutures, and the innominate line of the infratemporal fossa crossing on the lateral aspect of each orbit.
Step 3 Evaluate the maxillary sinuses and nasal cavity. Identify the superior, medial, and lateral walls and the fl oor of the maxillary sinuses; the nasal septum; and the fl oor and lateral walls of the nasal cavity. Try to identify the foramen rotundum projected toward the mesial wall of the sinus.
Step 4 Evaluate the zygomatic arches. Identify the frontal, maxillary, and temporal processes of the zygoma and the zygomaticofrontal
suture. Confi rm continuity of outlines and symmetry with the contralateral side.
Step 5 Evaluate the condylar and coronoid processes of the mandible. This is one of the best PA views of the coronoid process.
POSTEROANTERIOR PROJECTION ( FIG. 12-12 )
Step 1 Evaluate the calvarium, sutures, and diploic space starting in the area of the left external auditory meatus (EAM), over the top of the calvarium, to the right EAM. Look for intracranial calcifi ca-tions. Identify the mastoid air cells and petrous ridge of the right and left temporal bones. In this and all subsequent steps, compare the right and left sides and look for symmetry.
Step 2 Evaluate the upper and middle face. Identify the orbits, sinuses (frontal, ethmoid, and maxillary), and zygomatic processes of the maxilla. Assess the nasal cavity, middle and inferior turbinates, nasal septum, and hard palate.
Step 3 Evaluate the lower face. Follow the outline of the mandible starting from the right condylar and coronoid processes, ramus, angle, and body through the anterior mandible to the left body, angle, ramus, coronoid process, and condyle.
Step 4 Evaluate the cervical spine. Identify the dens, the superior border of C2, and the inferior border of C1.
Step 5 Evaluate the alveolar bone and teeth.
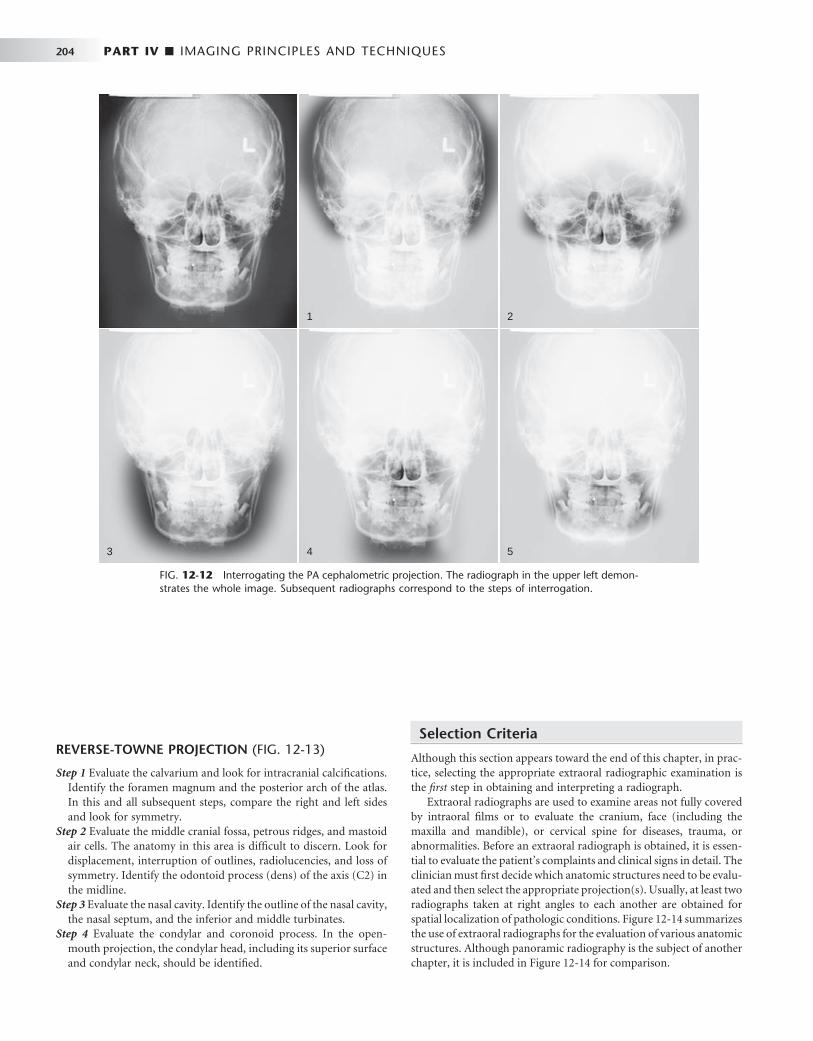
204 PART IV ■ IMAGING PRINCIPLES AND TECHNIQUES
FIG. 12-12 Interrogating the PA cephalometric projection. The radiograph in the upper left demon-strates the whole image. Subsequent radiographs correspond to the steps of interrogation.
1 2
43 5
REVERSE-TOWNE PROJECTION ( FIG. 12-13 )
Step 1 Evaluate the calvarium and look for intracranial calcifi cations. Identify the foramen magnum and the posterior arch of the atlas. In this and all subsequent steps, compare the right and left sides and look for symmetry.
Step 2 Evaluate the middle cranial fossa, petrous ridges, and mastoid air cells. The anatomy in this area is diffi cult to discern. Look for displacement, interruption of outlines, radiolucencies, and loss of symmetry. Identify the odontoid process (dens) of the axis (C2) in the midline.
Step 3 Evaluate the nasal cavity. Identify the outline of the nasal cavity, the nasal septum, and the inferior and middle turbinates.
Step 4 Evaluate the condylar and coronoid process. In the open-mouth projection, the condylar head, including its superior surface and condylar neck, should be identifi ed.
Selection Criteria
Although this section appears toward the end of this chapter, in prac-tice, selecting the appropriate extraoral radiographic examination is the fi rst step in obtaining and interpreting a radiograph.
Extraoral radiographs are used to examine areas not fully covered by intraoral fi lms or to evaluate the cranium, face (including the maxilla and mandible), or cervical spine for diseases, trauma, or abnormalities. Before an extraoral radiograph is obtained, it is essen-tial to evaluate the patient ’ s complaints and clinical signs in detail. The clinician must fi rst decide which anatomic structures need to be evalu-ated and then select the appropriate projection(s). Usually, at least two radiographs taken at right angles to each another are obtained for spatial localization of pathologic conditions. Figure 12-14 summarizes the use of extraoral radiographs for the evaluation of various anatomic structures. Although panoramic radiography is the subject of another chapter, it is included in Figure 12-14 for comparison.

FIG. 12-13 Interrogating the reverse-Towne projection. The radiograph in the upper left demon-strates the whole image. Subsequent radiographs correspond to the steps of interrogation.
3 4
1 2
FIG. 12-14 Relative usefulness of extraoral radiographic projections to display various anatomic structures.
Anterior mandible
Mandibular body
Ramus
Coronoid process
Condylar neck
AR
EA
OF
INT
ER
ES
T
Condylar head
Anterior maxilla
Posterior maxilla
Orbit
Zygoma
Zygomatic arch
Nasal bones
Nasal cavity
Maxillary sinus
Frontal sinus
Ethmoid sinus
Sphenoid sinus
LateralCeph SMV Waters
PACeph
ReverseTowne
ObliqueBody
LateralRamus Panoramic
Low usefulness
Medium usefulness
High usefulness
No symbol: Not recommened

206 PART IV ■ IMAGING PRINCIPLES AND TECHNIQUES
BIBLIOGRAPHY 1 Ballinger PW , Frank ED : Merrill ’ s atlas of radiographic positions and radiologic
procedures , vol 2 , ed 10 , pp 353 - 399 , St. Louis , 2003 , Mosby . 2 Kantor ML , Norton LA : Normal radiographic anatomy and common
anomalies seen in cephalometric fi lms , Am J Orthod Dentofac Orthop 91 : 414 - 426 , 1987 .
3 Keats TE , Anderson MW : Atlas of normal roentgen variants that may simulate disease , ed 7 , pp 3 - 275 , St. Louis , 2001 , Mosby .
4 Miyashita K : Contemporary cephalometric radiography , pp 245 - 266 , Tokyo , 1996 , Quintessence .
5 Shapiro R : Radiology of the normal skull , Chicago , 1981 , Year Book Medical . 6 Swischuk LE : Imaging of the cervical spine in children , New York , 2002 ,
Springer-Verlag .
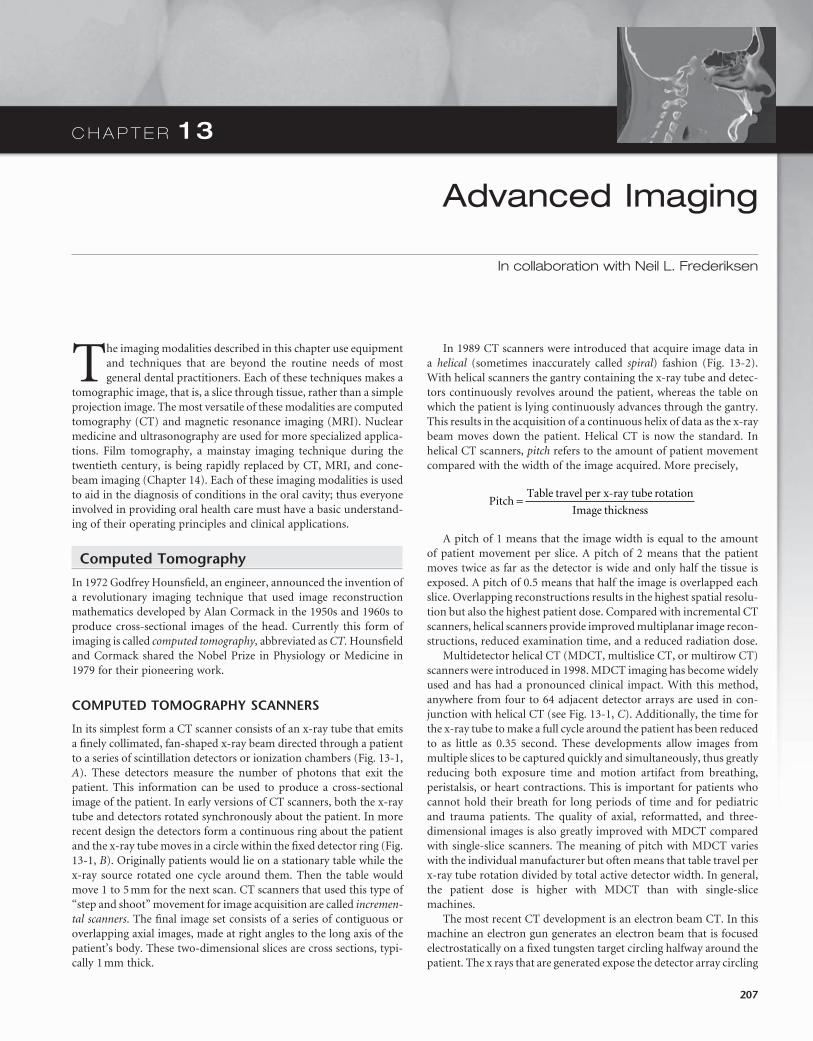
C H A P T E R 1 3
Advanced Imaging
In collaboration with Neil L. Frederiksen
The imaging modalities described in this chapter use equipment and techniques that are beyond the routine needs of most general dental practitioners. Each of these techniques makes a
tomographic image, that is, a slice through tissue, rather than a simple projection image. The most versatile of these modalities are computed tomography (CT) and magnetic resonance imaging (MRI). Nuclear medicine and ultrasonography are used for more specialized applica-tions. Film tomography, a mainstay imaging technique during the twentieth century, is being rapidly replaced by CT, MRI, and cone-beam imaging ( Chapter 14 ). Each of these imaging modalities is used to aid in the diagnosis of conditions in the oral cavity; thus everyone involved in providing oral health care must have a basic understand-ing of their operating principles and clinical applications.
Computed Tomography
In 1972 Godfrey Hounsfi eld, an engineer, announced the invention of a revolutionary imaging technique that used image reconstruction mathematics developed by Alan Cormack in the 1950s and 1960s to produce cross-sectional images of the head. Currently this form of imaging is called computed tomography, abbreviated as CT. Hounsfi eld and Cormack shared the Nobel Prize in Physiology or Medicine in 1979 for their pioneering work.
COMPUTED TOMOGRAPHY SCANNERS
In its simplest form a CT scanner consists of an x-ray tube that emits a fi nely collimated, fan-shaped x-ray beam directed through a patient to a series of scintillation detectors or ionization chambers ( Fig. 13-1, A ). These detectors measure the number of photons that exit the patient. This information can be used to produce a cross-sectional image of the patient. In early versions of CT scanners, both the x-ray tube and detectors rotated synchronously about the patient. In more recent design the detectors form a continuous ring about the patient and the x-ray tube moves in a circle within the fi xed detector ring ( Fig. 13-1, B ). Originally patients would lie on a stationary table while the x-ray source rotated one cycle around them. Then the table would move 1 to 5 mm for the next scan. CT scanners that used this type of “ step and shoot ” movement for image acquisition are called incremen-tal scanners . The fi nal image set consists of a series of contiguous or overlapping axial images, made at right angles to the long axis of the patient ’ s body. These two-dimensional slices are cross sections, typi-cally 1 mm thick.
In 1989 CT scanners were introduced that acquire image data in a helical (sometimes inaccurately called spiral ) fashion ( Fig. 13-2 ). With helical scanners the gantry containing the x-ray tube and detec-tors continuously revolves around the patient, whereas the table on which the patient is lying continuously advances through the gantry. This results in the acquisition of a continuous helix of data as the x-ray beam moves down the patient. Helical CT is now the standard. In helical CT scanners, pitch refers to the amount of patient movement compared with the width of the image acquired. More precisely,
PitchTable travel per x-ray tube rotation
Image thickness=
A pitch of 1 means that the image width is equal to the amount of patient movement per slice. A pitch of 2 means that the patient moves twice as far as the detector is wide and only half the tissue is exposed. A pitch of 0.5 means that half the image is overlapped each slice. Overlapping reconstructions results in the highest spatial resolu-tion but also the highest patient dose. Compared with incremental CT scanners, helical scanners provide improved multiplanar image recon-structions, reduced examination time, and a reduced radiation dose.
Multidetector helical CT (MDCT, multislice CT, or multirow CT) scanners were introduced in 1998. MDCT imaging has become widely used and has had a pronounced clinical impact. With this method, anywhere from four to 64 adjacent detector arrays are used in con-junction with helical CT (see Fig. 13-1, C ). Additionally, the time for the x-ray tube to make a full cycle around the patient has been reduced to as little as 0.35 second. These developments allow images from multiple slices to be captured quickly and simultaneously, thus greatly reducing both exposure time and motion artifact from breathing, peristalsis, or heart contractions. This is important for patients who cannot hold their breath for long periods of time and for pediatric and trauma patients. The quality of axial, reformatted, and three-dimensional images is also greatly improved with MDCT compared with single-slice scanners. The meaning of pitch with MDCT varies with the individual manufacturer but often means that table travel per x-ray tube rotation divided by total active detector width. In general, the patient dose is higher with MDCT than with single-slice machines.
The most recent CT development is an electron beam CT. In this machine an electron gun generates an electron beam that is focused electrostatically on a fi xed tungsten target circling halfway around the patient. The x rays that are generated expose the detector array circling
207

208 PART IV ■ IMAGING PRINCIPLES AND TECHNIQUES
the other half of the patient. Because there are no moving parts, an image may be acquired in less that 100 microseconds. This technique is primarily used for cardiac imaging to “ stop ” heart motion.
X-RAY TUBES
CT scanners use x-ray tubes with rotating anodes (see Fig. 1-10 ). These tubes have a high heat capacity, up to 8 million heat units ] ; (compare with dental tubes of 20 kilo heat units). They operate at 120 to 140 kilovolts peak (kVp) and 200 to 800 milliamperes. Focal spot sizes range from 0.5 to 2.0 mm. The high x-ray output minimizes exposure time and improves image quality by increasing the signal-to-noise ratio. The high kVp also provides a wide dynamic range by reducing bone absorption compared with soft tissue and extends tube life by reducing tube loading. The tubes operate continuously by using three-phase or high-frequency generators. The x-ray beam is colli-mated both before and after the patient. Prepatient collimation adjusts patient exposure. Postpatient collimation controls slice thickness. Slice thickness is typically between 1 and 3 mm. Thinner slices result in higher spatial resolution and contrast, less partial volume effect (see later), and higher patient dose.
DETECTORS
The x-ray beam exiting the patient is captured by an array of detectors. These detectors are usually gas fi lled or solid state. Gas-fi lled ion chamber detectors are usually made of high-pressure xenon. The ion chamber sends a signal proportional to the number of photons cap-tured. Gas-fi lled ion chambers respond quickly but only capture about 50% of the photons in the beam. Solid-state detectors are used more commonly. These are usually made of cadmium tungstate, are opti-cally coupled to a photodiode, and are as small as 0.625 mm across. These detectors are about 80% effi cient. The signal from either type of detector is amplifi ed, digitized, and sent to a computer for analysis.
IMAGE RECONSTRUCTION
The photons recorded by the detectors represent a composite of the absorption characteristics of all elements of the patient in the path of
FIG. 13-1 Mechanical Geometry of CT Scanners. A, In CT scanners the x-ray source emits a fan beam. In early CT scanners both the x-ray source and the detector array revolved around the patient. B, In current scanners the x-ray tube revolves around the patient and the remnant beam is detected by a fi xed circular array. C, In contemporary CT multidetector scanners the detector array has 4 to 64 rows of detectors.
C
B
A FIG. 13-2 Helical CT. In helical scanners the patient is moves con-tinuously through the gantry and the x-ray source moves continuously around the patient in a circle. The net effect is to describe a helical beam, and image, path through the patient.
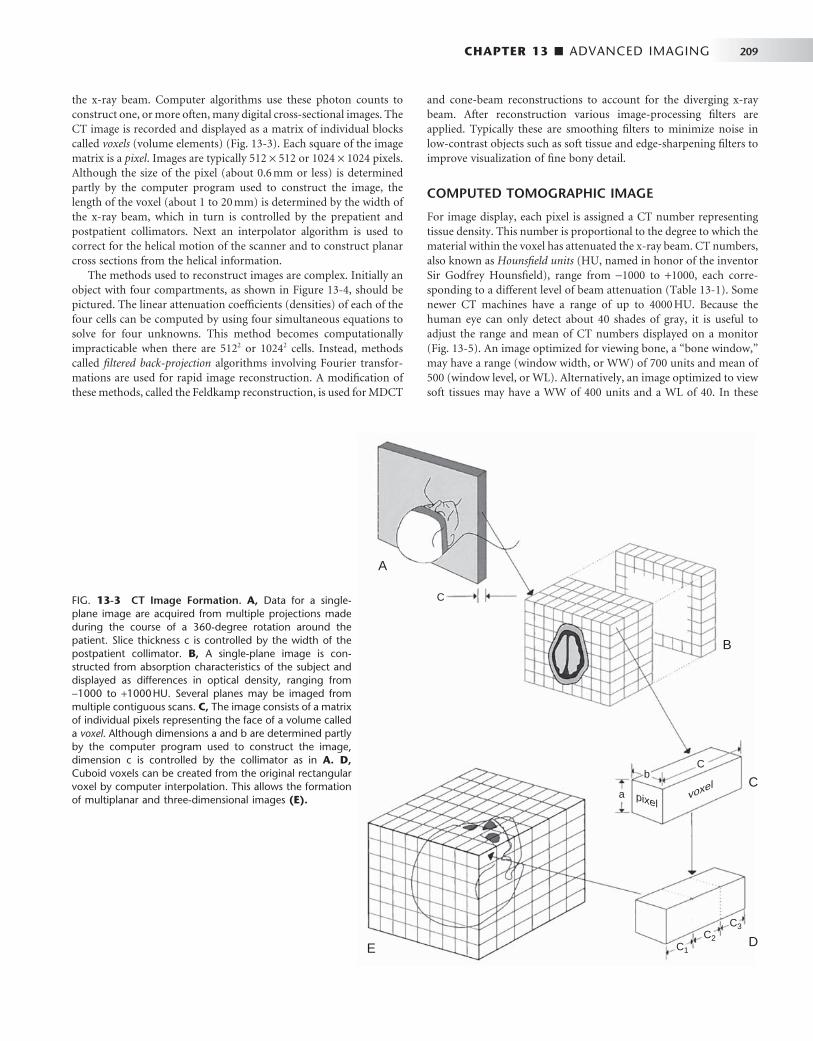
CHAPTER 13 ■ ADVANCED IMAGING 209
the x-ray beam. Computer algorithms use these photon counts to construct one, or more often, many digital cross-sectional images. The CT image is recorded and displayed as a matrix of individual blocks called voxels (volume elements) ( Fig. 13-3 ). Each square of the image matrix is a pixel . Images are typically 512 × 512 or 1024 × 1024 pixels. Although the size of the pixel (about 0.6 mm or less) is determined partly by the computer program used to construct the image, the length of the voxel (about 1 to 20 mm) is determined by the width of the x-ray beam, which in turn is controlled by the prepatient and postpatient collimators. Next an interpolator algorithm is used to correct for the helical motion of the scanner and to construct planar cross sections from the helical information.
The methods used to reconstruct images are complex. Initially an object with four compartments, as shown in Figure 13-4 , should be pictured. The linear attenuation coeffi cients (densities) of each of the four cells can be computed by using four simultaneous equations to solve for four unknowns. This method becomes computationally impracticable when there are 512 2 or 1024 2 cells. Instead, methods called fi ltered back-projection algorithms involving Fourier transfor-mations are used for rapid image reconstruction. A modifi cation of these methods, called the Feldkamp reconstruction, is used for MDCT
and cone-beam reconstructions to account for the diverging x-ray beam. After reconstruction various image-processing fi lters are applied. Typically these are smoothing fi lters to minimize noise in low-contrast objects such as soft tissue and edge-sharpening fi lters to improve visualization of fi ne bony detail.
COMPUTED TOMOGRAPHIC IMAGE
For image display, each pixel is assigned a CT number representing tissue density. This number is proportional to the degree to which the material within the voxel has attenuated the x-ray beam. CT numbers, also known as Hounsfi eld units (HU, named in honor of the inventor Sir Godfrey Hounsfi eld), range from − 1000 to + 1000, each corre-sponding to a different level of beam attenuation ( Table 13-1 ). Some newer CT machines have a range of up to 4000 HU. Because the human eye can only detect about 40 shades of gray, it is useful to adjust the range and mean of CT numbers displayed on a monitor ( Fig. 13-5 ). An image optimized for viewing bone, a “ bone window, ” may have a range (window width, or WW) of 700 units and mean of 500 (window level, or WL). Alternatively, an image optimized to view soft tissues may have a WW of 400 units and a WL of 40. In these
FIG. 13-3 CT Image Formation. A, Data for a single-plane image are acquired from multiple projections made during the course of a 360-degree rotation around the patient. Slice thickness c is controlled by the width of the postpatient collimator. B, A single-plane image is con-structed from absorption characteristics of the subject and displayed as differences in optical density, ranging from − 1000 to + 1000 HU. Several planes may be imaged from multiple contiguous scans. C, The image consists of a matrix of individual pixels representing the face of a volume called a voxel . Although dimensions a and b are determined partly by the computer program used to construct the image, dimension c is controlled by the collimator as in A. D, Cuboid voxels can be created from the original rectangular voxel by computer interpolation. This allows the formation of multiplanar and three-dimensional images (E).
A
B
C
DE
C
Cb
pixelvoxel
a
C1
C2
C3
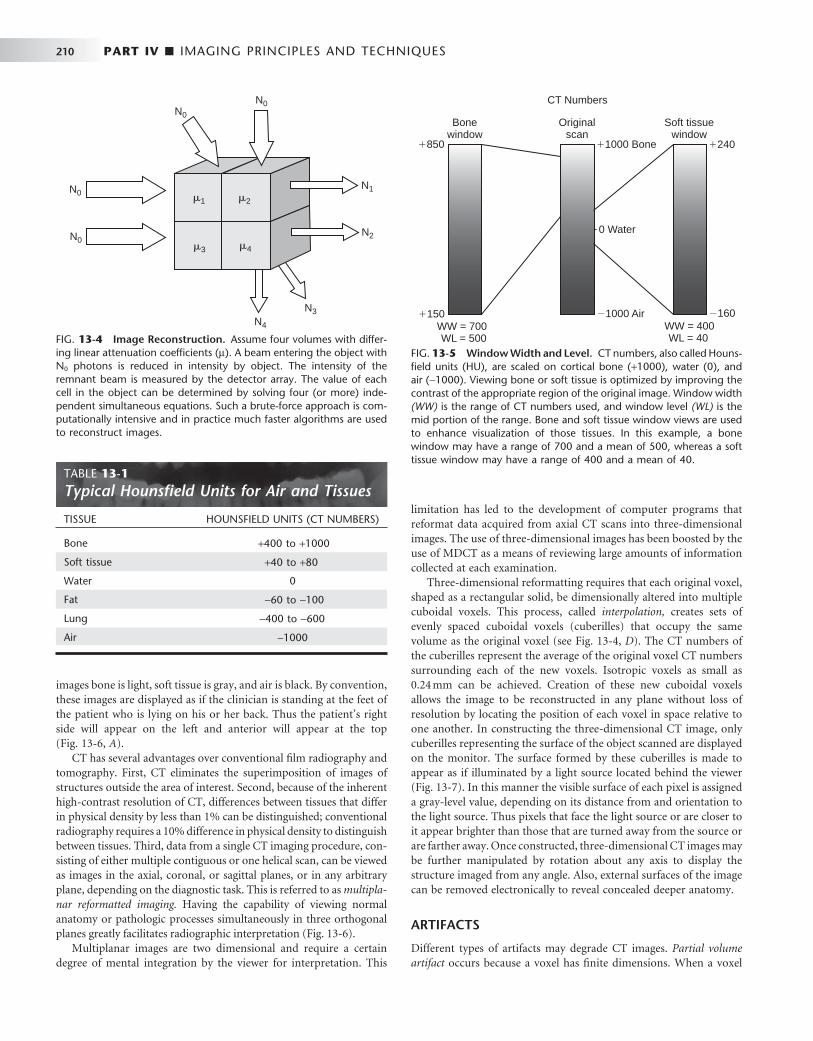
210 PART IV ■ IMAGING PRINCIPLES AND TECHNIQUES
images bone is light, soft tissue is gray, and air is black. By convention, these images are displayed as if the clinician is standing at the feet of the patient who is lying on his or her back. Thus the patient ’ s right side will appear on the left and anterior will appear at the top ( Fig. 13-6, A ).
CT has several advantages over conventional fi lm radiography and tomography. First, CT eliminates the superimposition of images of structures outside the area of interest. Second, because of the inherent high-contrast resolution of CT, differences between tissues that differ in physical density by less than 1% can be distinguished; conventional radiography requires a 10% difference in physical density to distinguish between tissues. Third, data from a single CT imaging procedure, con-sisting of either multiple contiguous or one helical scan, can be viewed as images in the axial, coronal, or sagittal planes, or in any arbitrary plane, depending on the diagnostic task. This is referred to as multipla-nar reformatted imaging. Having the capability of viewing normal anatomy or pathologic processes simultaneously in three orthogonal planes greatly facilitates radiographic interpretation ( Fig. 13-6 ).
Multiplanar images are two dimensional and require a certain degree of mental integration by the viewer for interpretation. This
limitation has led to the development of computer programs that reformat data acquired from axial CT scans into three-dimensional images. The use of three-dimensional images has been boosted by the use of MDCT as a means of reviewing large amounts of information collected at each examination.
Three-dimensional reformatting requires that each original voxel, shaped as a rectangular solid, be dimensionally altered into multiple cuboidal voxels. This process, called interpolation, creates sets of evenly spaced cuboidal voxels (cuberilles) that occupy the same volume as the original voxel (see Fig. 13-4, D ). The CT numbers of the cuberilles represent the average of the original voxel CT numbers surrounding each of the new voxels. Isotropic voxels as small as 0.24 mm can be achieved. Creation of these new cuboidal voxels allows the image to be reconstructed in any plane without loss of resolution by locating the position of each voxel in space relative to one another. In constructing the three-dimensional CT image, only cuberilles representing the surface of the object scanned are displayed on the monitor. The surface formed by these cuberilles is made to appear as if illuminated by a light source located behind the viewer ( Fig. 13-7 ). In this manner the visible surface of each pixel is assigned a gray-level value, depending on its distance from and orientation to the light source. Thus pixels that face the light source or are closer to it appear brighter than those that are turned away from the source or are farther away. Once constructed, three-dimensional CT images may be further manipulated by rotation about any axis to display the structure imaged from any angle. Also, external surfaces of the image can be removed electronically to reveal concealed deeper anatomy.
ARTIFACTS
Different types of artifacts may degrade CT images. Partial volume artifact occurs because a voxel has fi nite dimensions. When a voxel
FIG. 13-4 Image Reconstruction. Assume four volumes with differ-ing linear attenuation coeffi cients ( μ ). A beam entering the object with N 0 photons is reduced in intensity by object. The intensity of the remnant beam is measured by the detector array. The value of each cell in the object can be determined by solving four (or more) inde-pendent simultaneous equations. Such a brute-force approach is com-putationally intensive and in practice much faster algorithms are used to reconstruct images.
�1 �2
�3 �4
N0
N0
N0
N0
N4
N3
N2
N1
TABLE 13-1 Typical Hounsfi eld Units for Air and Tissues
TISSUE HOUNSFIELD UNITS (CT NUMBERS)
Bone + 400 to + 1000
Soft tissue + 40 to + 80
Water 0
Fat − 60 to − 100
Lung − 400 to − 600
Air − 1000
FIG. 13-5 Window Width and Level. CT numbers, also called Houns-fi eld units (HU), are scaled on cortical bone ( + 1000), water (0), and air ( − 1000). Viewing bone or soft tissue is optimized by improving the contrast of the appropriate region of the original image. Window width (WW) is the range of CT numbers used, and window level (WL) is the mid portion of the range. Bone and soft tissue window views are used to enhance visualization of those tissues. In this example, a bone window may have a range of 700 and a mean of 500, whereas a soft tissue window may have a range of 400 and a mean of 40.
Bonewindow
Originalscan
Soft tissuewindow
WW = 700WL = 500
WW = 400WL = 40
�850
�150
�1000 Bone
�1000 Air
0 Water-
CT Numbers
�240
�160
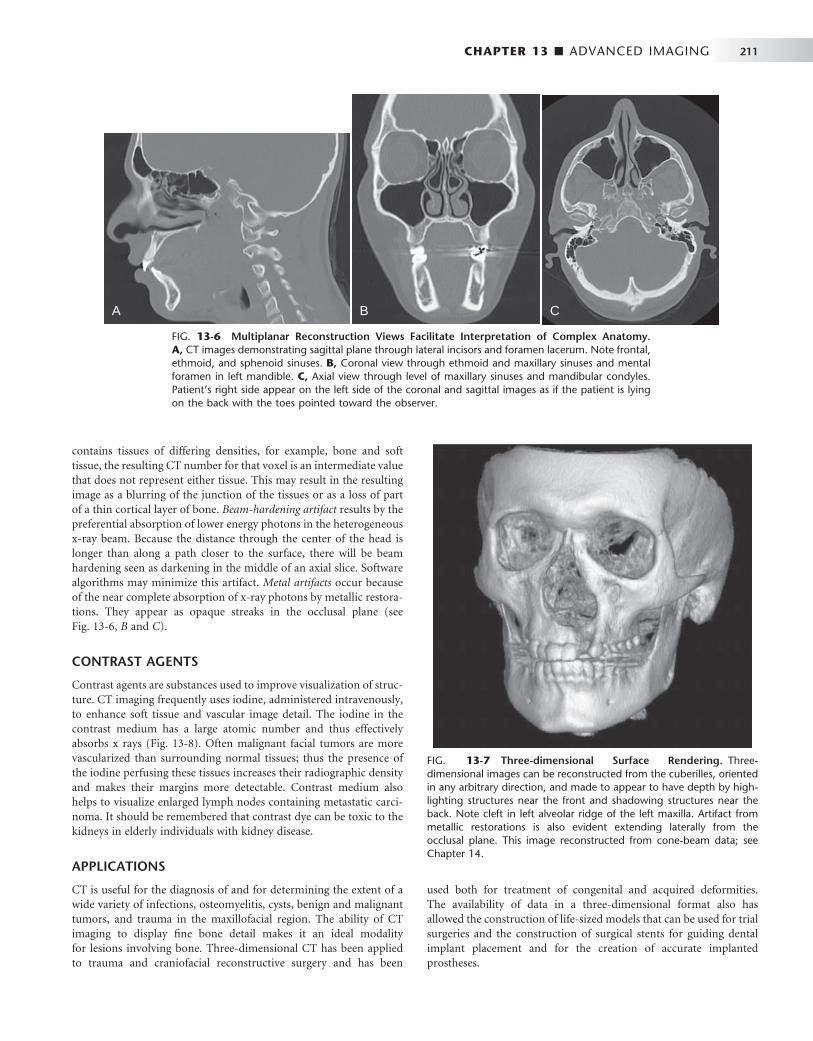
CHAPTER 13 ■ ADVANCED IMAGING 211
used both for treatment of congenital and acquired deformities. The availability of data in a three-dimensional format also has allowed the construction of life-sized models that can be used for trial surgeries and the construction of surgical stents for guiding dental implant placement and for the creation of accurate implanted prostheses.
FIG. 13-6 Multiplanar Reconstruction Views Facilitate Interpretation of Complex Anatomy. A, CT images demonstrating sagittal plane through lateral incisors and foramen lacerum. Note frontal, ethmoid, and sphenoid sinuses. B, Coronal view through ethmoid and maxillary sinuses and mental foramen in left mandible. C, Axial view through level of maxillary sinuses and mandibular condyles. Patient ’ s right side appear on the left side of the coronal and sagittal images as if the patient is lying on the back with the toes pointed toward the observer.
CBA
FIG. 13-7 Three-dimensional Surface Rendering. Three-dimensional images can be reconstructed from the cuberilles, oriented in any arbitrary direction, and made to appear to have depth by high-lighting structures near the front and shadowing structures near the back. Note cleft in left alveolar ridge of the left maxilla. Artifact from metallic restorations is also evident extending laterally from the occlusal plane. This image reconstructed from cone-beam data; see Chapter 14 .
contains tissues of differing densities, for example, bone and soft tissue, the resulting CT number for that voxel is an intermediate value that does not represent either tissue. This may result in the resulting image as a blurring of the junction of the tissues or as a loss of part of a thin cortical layer of bone. Beam-hardening artifact results by the preferential absorption of lower energy photons in the heterogeneous x-ray beam. Because the distance through the center of the head is longer than along a path closer to the surface, there will be beam hardening seen as darkening in the middle of an axial slice. Software algorithms may minimize this artifact. Metal artifacts occur because of the near complete absorption of x-ray photons by metallic restora-tions. They appear as opaque streaks in the occlusal plane (see Fig. 13-6, B and C ).
CONTRAST AGENTS
Contrast agents are substances used to improve visualization of struc-ture. CT imaging frequently uses iodine, administered intravenously, to enhance soft tissue and vascular image detail. The iodine in the contrast medium has a large atomic number and thus effectively absorbs x rays ( Fig. 13-8 ). Often malignant facial tumors are more vascularized than surrounding normal tissues; thus the presence of the iodine perfusing these tissues increases their radiographic density and makes their margins more detectable. Contrast medium also helps to visualize enlarged lymph nodes containing metastatic carci-noma. It should be remembered that contrast dye can be toxic to the kidneys in elderly individuals with kidney disease.
APPLICATIONS
CT is useful for the diagnosis of and for determining the extent of a wide variety of infections, osteomyelitis, cysts, benign and malignant tumors, and trauma in the maxillofacial region. The ability of CT imaging to display fi ne bone detail makes it an ideal modality for lesions involving bone. Three-dimensional CT has been applied to trauma and craniofacial reconstructive surgery and has been
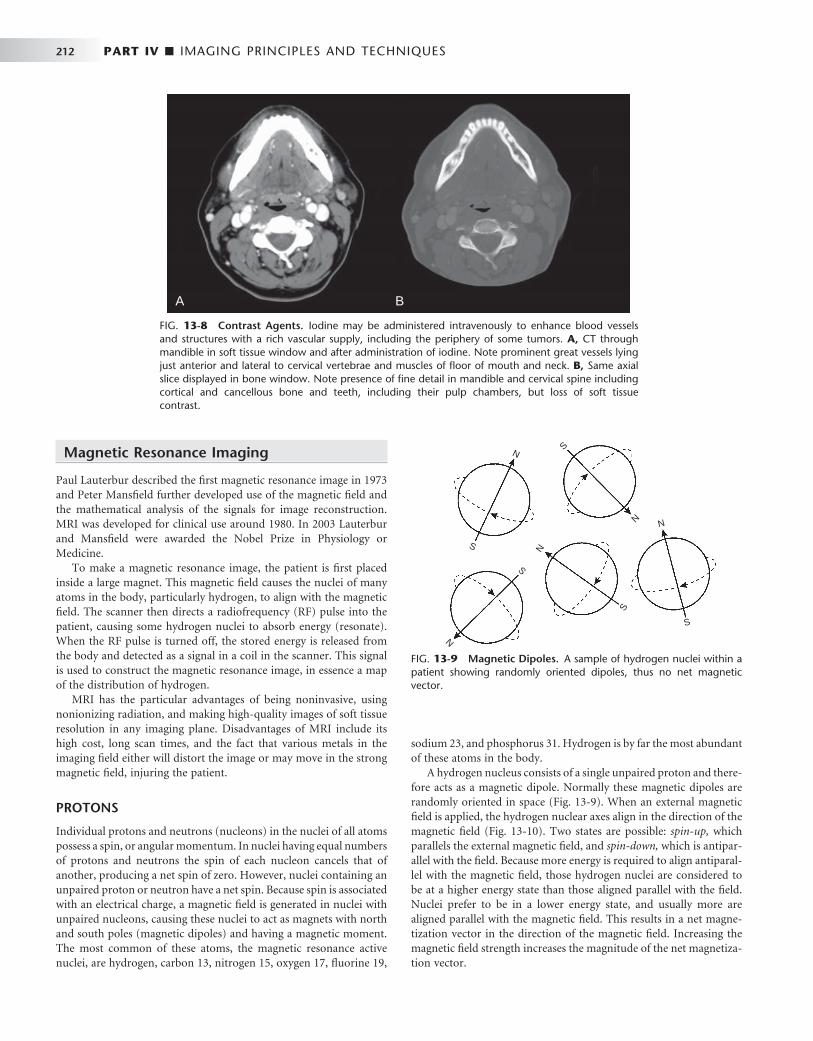
212 PART IV ■ IMAGING PRINCIPLES AND TECHNIQUES
Magnetic Resonance Imaging
Paul Lauterbur described the fi rst magnetic resonance image in 1973 and Peter Mansfi eld further developed use of the magnetic fi eld and the mathematical analysis of the signals for image reconstruction. MRI was developed for clinical use around 1980. In 2003 Lauterbur and Mansfi eld were awarded the Nobel Prize in Physiology or Medicine.
To make a magnetic resonance image, the patient is fi rst placed inside a large magnet. This magnetic fi eld causes the nuclei of many atoms in the body, particularly hydrogen, to align with the magnetic fi eld. The scanner then directs a radiofrequency (RF) pulse into the patient, causing some hydrogen nuclei to absorb energy (resonate). When the RF pulse is turned off, the stored energy is released from the body and detected as a signal in a coil in the scanner. This signal is used to construct the magnetic resonance image, in essence a map of the distribution of hydrogen.
MRI has the particular advantages of being noninvasive, using nonionizing radiation, and making high-quality images of soft tissue resolution in any imaging plane. Disadvantages of MRI include its high cost, long scan times, and the fact that various metals in the imaging fi eld either will distort the image or may move in the strong magnetic fi eld, injuring the patient.
PROTONS
Individual protons and neutrons (nucleons) in the nuclei of all atoms possess a spin, or angular momentum. In nuclei having equal numbers of protons and neutrons the spin of each nucleon cancels that of another, producing a net spin of zero. However, nuclei containing an unpaired proton or neutron have a net spin. Because spin is associated with an electrical charge, a magnetic fi eld is generated in nuclei with unpaired nucleons, causing these nuclei to act as magnets with north and south poles (magnetic dipoles) and having a magnetic moment. The most common of these atoms, the magnetic resonance active nuclei, are hydrogen, carbon 13, nitrogen 15, oxygen 17, fl uorine 19,
sodium 23, and phosphorus 31. Hydrogen is by far the most abundant of these atoms in the body.
A hydrogen nucleus consists of a single unpaired proton and there-fore acts as a magnetic dipole. Normally these magnetic dipoles are randomly oriented in space ( Fig. 13-9 ). When an external magnetic fi eld is applied, the hydrogen nuclear axes align in the direction of the magnetic fi eld ( Fig. 13-10 ). Two states are possible: spin-up, which parallels the external magnetic fi eld, and spin-down, which is antipar-allel with the fi eld. Because more energy is required to align antiparal-lel with the magnetic fi eld, those hydrogen nuclei are considered to be at a higher energy state than those aligned parallel with the fi eld. Nuclei prefer to be in a lower energy state, and usually more are aligned parallel with the magnetic fi eld. This results in a net magne-tization vector in the direction of the magnetic fi eld. Increasing the magnetic fi eld strength increases the magnitude of the net magnetiza-tion vector.
FIG. 13-8 Contrast Agents. Iodine may be administered intravenously to enhance blood vessels and structures with a rich vascular supply, including the periphery of some tumors. A, CT through mandible in soft tissue window and after administration of iodine. Note prominent great vessels lying just anterior and lateral to cervical vertebrae and muscles of fl oor of mouth and neck. B, Same axial slice displayed in bone window. Note presence of fi ne detail in mandible and cervical spine including cortical and cancellous bone and teeth, including their pulp chambers, but loss of soft tissue contrast.
A B
FIG. 13-9 Magnetic Dipoles. A sample of hydrogen nuclei within a patient showing randomly oriented dipoles, thus no net magnetic vector.
N
S
S
N
N
S
S
N
N
S
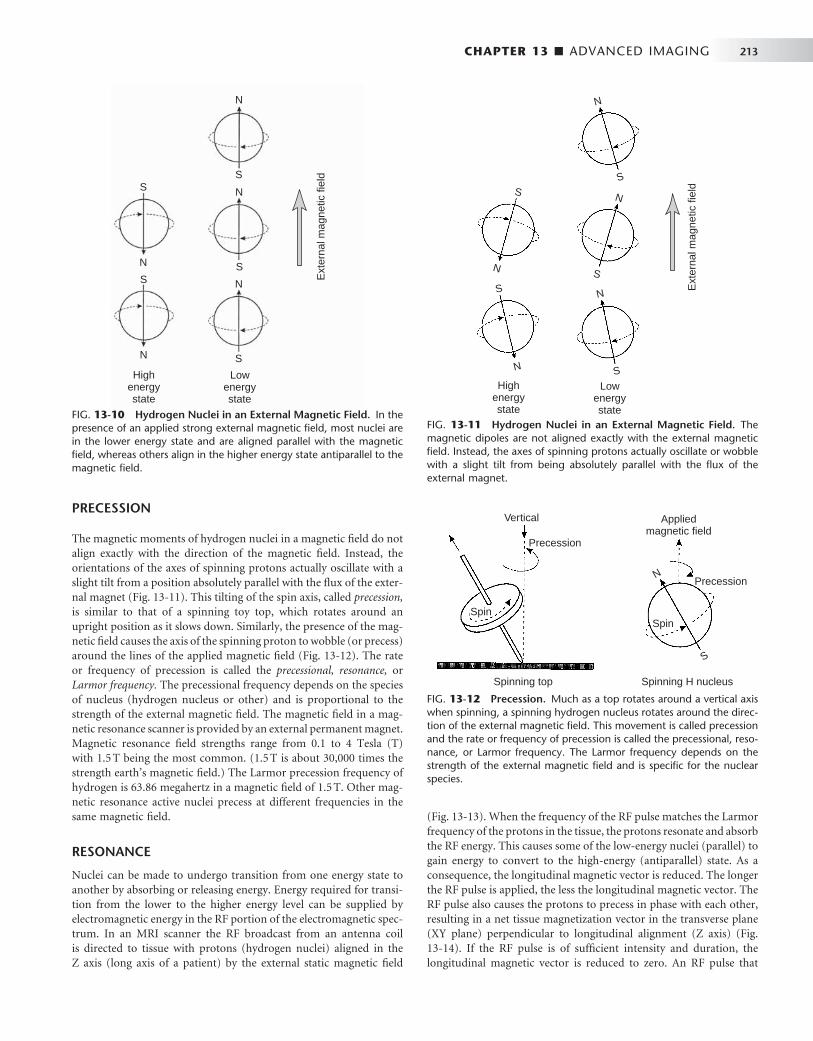
CHAPTER 13 ■ ADVANCED IMAGING 213
PRECESSION
The magnetic moments of hydrogen nuclei in a magnetic fi eld do not align exactly with the direction of the magnetic fi eld. Instead, the orientations of the axes of spinning protons actually oscillate with a slight tilt from a position absolutely parallel with the fl ux of the exter-nal magnet ( Fig. 13-11 ). This tilting of the spin axis, called precession, is similar to that of a spinning toy top, which rotates around an upright position as it slows down. Similarly, the presence of the mag-netic fi eld causes the axis of the spinning proton to wobble (or precess) around the lines of the applied magnetic fi eld ( Fig. 13-12 ). The rate or frequency of precession is called the precessional, resonance, or Larmor frequency. The precessional frequency depends on the species of nucleus (hydrogen nucleus or other) and is proportional to the strength of the external magnetic fi eld. The magnetic fi eld in a mag-netic resonance scanner is provided by an external permanent magnet. Magnetic resonance fi eld strengths range from 0.1 to 4 Tesla (T) with 1.5 T being the most common. (1.5 T is about 30,000 times the strength earth ’ s magnetic fi eld.) The Larmor precession frequency of hydrogen is 63.86 megahertz in a magnetic fi eld of 1.5 T. Other mag-netic resonance active nuclei precess at different frequencies in the same magnetic fi eld.
RESONANCE
Nuclei can be made to undergo transition from one energy state to another by absorbing or releasing energy. Energy required for transi-tion from the lower to the higher energy level can be supplied by electromagnetic energy in the RF portion of the electromagnetic spec-trum. In an MRI scanner the RF broadcast from an antenna coil is directed to tissue with protons (hydrogen nuclei) aligned in the Z axis (long axis of a patient) by the external static magnetic fi eld
N
N
N
N
N
S
S
S
S
S
Ext
erna
l mag
netic
fiel
d
Highenergystate
Lowenergystate
FIG. 13-10 Hydrogen Nuclei in an External Magnetic Field. In the presence of an applied strong external magnetic fi eld, most nuclei are in the lower energy state and are aligned parallel with the magnetic fi eld, whereas others align in the higher energy state antiparallel to the magnetic fi eld.
N
N
N
N
N
S
S
S
S
S
Ext
erna
l mag
netic
fiel
d
Highenergystate
Lowenergystate
FIG. 13-11 Hydrogen Nuclei in an External Magnetic Field. The magnetic dipoles are not aligned exactly with the external magnetic fi eld. Instead, the axes of spinning protons actually oscillate or wobble with a slight tilt from being absolutely parallel with the fl ux of the external magnet.
FIG. 13-12 Precession. Much as a top rotates around a vertical axis when spinning, a spinning hydrogen nucleus rotates around the direc-tion of the external magnetic fi eld. This movement is called precession and the rate or frequency of precession is called the precessional, reso-nance, or Larmor frequency. The Larmor frequency depends on the strength of the external magnetic fi eld and is specifi c for the nuclear species.
Vertical
Precession
Spin
Spinning top Spinning H nucleus
Appliedmagnetic field
Precession
Spin
N
S
( Fig. 13-13 ). When the frequency of the RF pulse matches the Larmor frequency of the protons in the tissue, the protons resonate and absorb the RF energy. This causes some of the low-energy nuclei (parallel) to gain energy to convert to the high-energy (antiparallel) state. As a consequence, the longitudinal magnetic vector is reduced. The longer the RF pulse is applied, the less the longitudinal magnetic vector. The RF pulse also causes the protons to precess in phase with each other, resulting in a net tissue magnetization vector in the transverse plane (XY plane) perpendicular to longitudinal alignment (Z axis) ( Fig. 13-14 ). If the RF pulse is of suffi cient intensity and duration, the longitudinal magnetic vector is reduced to zero. An RF pulse that

214 PART IV ■ IMAGING PRINCIPLES AND TECHNIQUES
FIG. 13-13 Longitudinal Magnetic Vector. When hydrogen nuclei are in an external magnetic fi eld, two energy states result: spin-up, which is parallel to the direction of the fi eld, and spin-down, which is antiparallel to the direction of the fi eld. A, The combined effect of these two energy states is a weak net magnetic moment, or magnetization vector parallel with the applied magnetic fi eld. B, When the frequency of the RF pulse matches the Larmor frequency of the protons absorb the RF energy causing some low-energy nuclei to convert to the high-energy state, thereby reducing the net longitudinal magnetic vector, vertical black arrow in Z axis.
Z axis Z axis
X axis
Y axis Y axis
X axis
XY plane XY plane
Longitudinalmagnetizationvector
Longitudinalmagnetizationvector
A B
FIG. 13-14 Transverse Magnetic Vector. A, The RF pulse also causes the protons to precess in phase with each other, resulting in a net tissue magnetization vector in the transverse plane (XY plane). B, Increasing the intensity and duration RF of the pulse increases the transverse magnetization vector because the nuclei are more nearly in phase, horizontal black arrow in X axis.
Z axis Z axis
X axis
Y axis Y axis
X axis
XY plane XY plane
Transversemagnetizationvector
Transversemagnetizationvector
A B

CHAPTER 13 ■ ADVANCED IMAGING 215
accomplished this is called a 90-degree RF pulse or having a fl ip angle of 90 degrees. At this time the net magnetic vector in the transverse plane is maximized because the magnetic moments of all nuclei are in phase.
MAGNETIC RESONANCE SIGNAL
The precession of the net magnetic vector, that is, the precession of the magnetic moments of the hydrogen nuclei in phase in the trans-verse plane, induces a current fl ow in a receiver coil ( Fig. 13-15 ), the MR signal. The frequency of this alternating current signal matches the frequency of the RF pulse and the Larmor precessional frequency of hydrogen nuclei. The magnitude of this signal is proportional to the overall concentration of hydrogen nuclei (proton density) in the tissue. This strength of the signal also depends on the degree to which hydrogen is bound within a molecule. Tightly bound hydrogen atoms, such as those present in bone, do not align themselves with the exter-nal magnetic fi eld and produce only a weak signal. Loosely bound or mobile hydrogen atoms such as those in soft tissues and liquids react to the RF pulse and thus produce a detectable signal at the end of the RF pulse. The concentration of loosely bound hydrogen nuclei avail-able to create the signal is referred to as the proton density or spin density of the tissue in question. The higher the concentration of these nuclei of loosely bound hydrogen atoms, the stronger the net trans-verse magnetization, the more intense the recovered signal, and the brighter the corresponding part of the magnetic resonance image.
When the RF pulse is turned off, the nuclei begin to return to their original lower-energy spin state, a condition called relaxation . As they give up the energy absorbed by the RF pulse, some of the high-energy
nuclei return to the low-energy state and the net longitudinal mag-netic vector returns to its original state. Additionally, and indepen-dently, the individual magnetic moments of the protons begin to interact with each other and dephase. This results in reduction of the magnetization in the transverse plane, a condition called decay . As a result of the loss of transverse magnetization and the dephasing of the hydrogen nuclei, there is a loss of intensity of the magnetic resonance signal. The reduced voltage induced in the receiving coil is called the free induction decay (FID) signal. In sum, the FID of the MR signal results from the loss of the transverse net magnetization vector. This results from return of the net magnetization vector to the longitudinal plane and dephasing of the hydrogen nuclei.
T1 AND T2 RELAXATION
Relaxation at the end of the RF pulse results in recovery of the longi-tudinal magnetization. This is accomplished by a transfer of energy from individual hydrogen nuclei (spin) to the surrounding molecules (lattice). This is an exponential process and the time required for 63% of the net magnetization to return to equilibrium (the time constant) by this transfer of energy is called the T1 relaxation time or spin-lattice relaxation time. The T1 relaxation time varies with different tissues and refl ects the ability of their nuclei to transfer their excess energy to surrounding molecules ( Table 13-2 ).
Additionally, and the end of the RF pulse, the magnetic moments of adjacent hydrogen nuclei begin to interfere with one another, causing the nuclei to dephase with a resultant loss of transverse magnetization. The time constant that describes the exponential rate of loss of trans-verse magnetization is called the T2 relaxation time or the spin-spin relaxation time. As the transverse magnetization rapidly decays to zero, so does the amplitude and duration of the detected radio signal. T2 relaxation occurs more rapidly than T1 relaxation. Note that both T1 and T2 times are features of the tissues being examined.
RADIOFREQUENCY PULSES SEQUENCES (AND IMAGE CONTRAST)
The components of the RF pulse sequence are set by the operator and determine the appearance of the resultant image. The most basic features of a pulse sequence are the repetition time (TR) and echo time (TE). The TR time is the duration between repeat RF pulses ( Fig. 13-16 ). The time between pulse repetitions determines the amount of T1 relaxation that has occurred at the time the signal is
FIG. 13-15 Receiver Coil. The precession of the net transverse mag-netic vector in the XY plane induces a current fl ow in a receiver coil, the magnetic resonance signal. The frequency of this induced alternat-ing current signal matches the frequency of the RF pulse and the Larmor precessional frequency of hydrogen nuclei.
TABLE 13-2 T1 and T2 Relaxation Times in a Main Field of 1.5 Tesla
TISSUE TYPE T1 TIME (MS) T2 TIME (MS)
Fat 240-250 60-80
Bone marrow 550 50
White matter of cerebrum 780 90
Gray matter of cerebrum 920 100
Muscle 860-900 50
CSF (similar to water) 2200-2400 500-1400
CSF, Cerebrospinal fl uid.
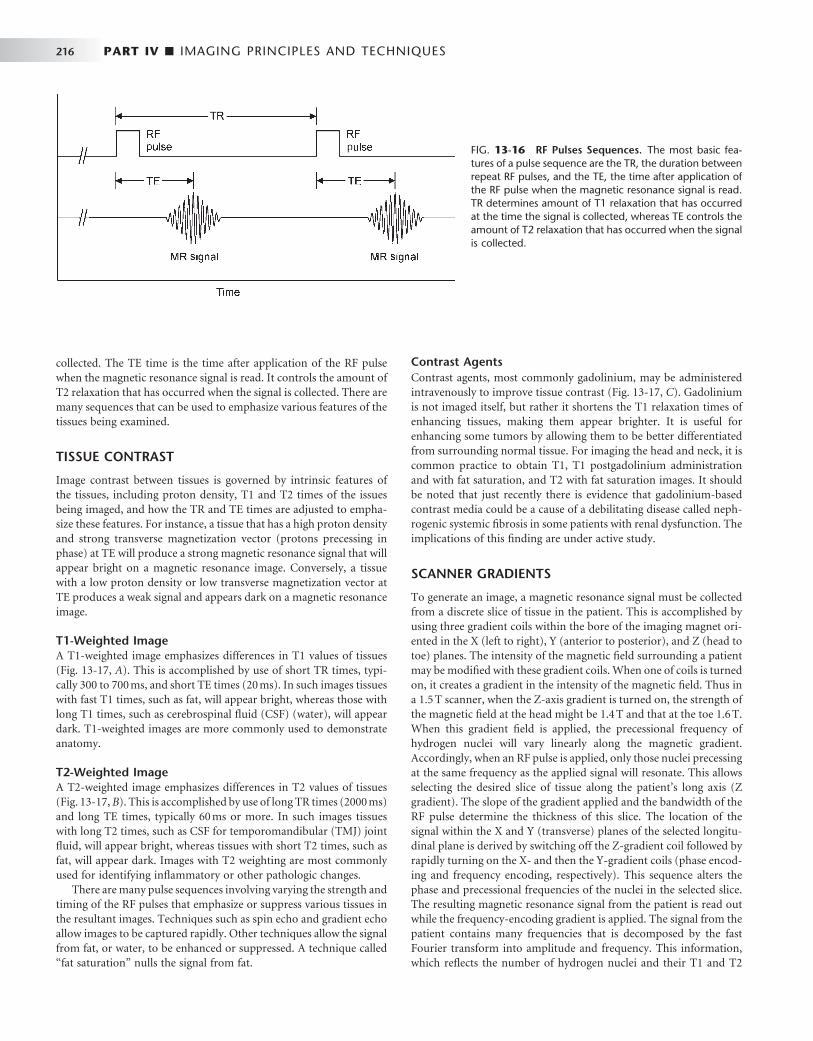
216 PART IV ■ IMAGING PRINCIPLES AND TECHNIQUES
collected. The TE time is the time after application of the RF pulse when the magnetic resonance signal is read. It controls the amount of T2 relaxation that has occurred when the signal is collected. There are many sequences that can be used to emphasize various features of the tissues being examined.
TISSUE CONTRAST
Image contrast between tissues is governed by intrinsic features of the tissues, including proton density, T1 and T2 times of the issues being imaged, and how the TR and TE times are adjusted to empha-size these features. For instance, a tissue that has a high proton density and strong transverse magnetization vector (protons precessing in phase) at TE will produce a strong magnetic resonance signal that will appear bright on a magnetic resonance image. Conversely, a tissue with a low proton density or low transverse magnetization vector at TE produces a weak signal and appears dark on a magnetic resonance image.
T1-Weighted Image A T1-weighted image emphasizes differences in T1 values of tissues ( Fig. 13-17, A ). This is accomplished by use of short TR times, typi-cally 300 to 700 ms, and short TE times (20 ms). In such images tissues with fast T1 times, such as fat, will appear bright, whereas those with long T1 times, such as cerebrospinal fl uid (CSF) (water), will appear dark. T1-weighted images are more commonly used to demonstrate anatomy.
T2-Weighted Image A T2-weighted image emphasizes differences in T2 values of tissues ( Fig. 13-17, B ). This is accomplished by use of long TR times (2000 ms) and long TE times, typically 60 ms or more. In such images tissues with long T2 times, such as CSF for temporomandibular (TMJ) joint fl uid, will appear bright, whereas tissues with short T2 times, such as fat, will appear dark. Images with T2 weighting are most commonly used for identifying infl ammatory or other pathologic changes.
There are many pulse sequences involving varying the strength and timing of the RF pulses that emphasize or suppress various tissues in the resultant images. Techniques such as spin echo and gradient echo allow images to be captured rapidly. Other techniques allow the signal from fat, or water, to be enhanced or suppressed. A technique called “ fat saturation ” nulls the signal from fat.
Contrast Agents Contrast agents, most commonly gadolinium, may be administered intravenously to improve tissue contrast ( Fig. 13-17, C ). Gadolinium is not imaged itself, but rather it shortens the T1 relaxation times of enhancing tissues, making them appear brighter. It is useful for enhancing some tumors by allowing them to be better differentiated from surrounding normal tissue. For imaging the head and neck, it is common practice to obtain T1, T1 postgadolinium administration and with fat saturation, and T2 with fat saturation images. It should be noted that just recently there is evidence that gadolinium-based contrast media could be a cause of a debilitating disease called neph-rogenic systemic fi brosis in some patients with renal dysfunction. The implications of this fi nding are under active study.
SCANNER GRADIENTS
To generate an image, a magnetic resonance signal must be collected from a discrete slice of tissue in the patient. This is accomplished by using three gradient coils within the bore of the imaging magnet ori-ented in the X (left to right), Y (anterior to posterior), and Z (head to toe) planes. The intensity of the magnetic fi eld surrounding a patient may be modifi ed with these gradient coils. When one of coils is turned on, it creates a gradient in the intensity of the magnetic fi eld. Thus in a 1.5 T scanner, when the Z-axis gradient is turned on, the strength of the magnetic fi eld at the head might be 1.4 T and that at the toe 1.6 T. When this gradient fi eld is applied, the precessional frequency of hydrogen nuclei will vary linearly along the magnetic gradient. Accordingly, when an RF pulse is applied, only those nuclei precessing at the same frequency as the applied signal will resonate. This allows selecting the desired slice of tissue along the patient ’ s long axis (Z gradient). The slope of the gradient applied and the bandwidth of the RF pulse determine the thickness of this slice. The location of the signal within the X and Y (transverse) planes of the selected longitu-dinal plane is derived by switching off the Z-gradient coil followed by rapidly turning on the X- and then the Y-gradient coils (phase encod-ing and frequency encoding, respectively). This sequence alters the phase and precessional frequencies of the nuclei in the selected slice. The resulting magnetic resonance signal from the patient is read out while the frequency-encoding gradient is applied. The signal from the patient contains many frequencies that is decomposed by the fast Fourier transform into amplitude and frequency. This information, which refl ects the number of hydrogen nuclei and their T1 and T2
FIG. 13-16 RF Pulses Sequences. The most basic fea-tures of a pulse sequence are the TR, the duration between repeat RF pulses, and the TE, the time after application of the RF pulse when the magnetic resonance signal is read. TR determines amount of T1 relaxation that has occurred at the time the signal is collected, whereas TE controls the amount of T2 relaxation that has occurred when the signal is collected.

CHAPTER 13 ■ ADVANCED IMAGING 217
FIG. 13-17 MRI Images. MRI examination performed to evaluate neck mass in a patient with known diagnosis of multiple myeloma. A, Axial T1 precontrast (no fat saturation) image through mandible. Note abnormally dark marrow in posterior right mandible ( arrow, compare with left side) and mass in right carotid space (other arrow) . B, Axial T1 postcontrast image with fat saturation. Note abnormal enhance-ment of both marrow in right mandible and of the mass in the right carotid space. C, Axial T2 with fat saturation demonstrating abnormally bright signal in both marrow in right mandible and of the mass in the right carotid space. (Courtesy Dr. Thomas Underhill, Radiology Associates, Richmond, Va.)
A B
C
properties at each X and Y location in the selected longitudinal plane, is reconstructed into magnetic resonance images.
MAGNETIC RESONANCE IMAGES
MRI has several advantages over other diagnostic imaging procedures. First, it offers the best contrast resolution of soft tissues. Although x-ray attenuation coeffi cients of soft tissues may vary by no more than
1%, T1 and T2 relaxation times may vary by up to 40%. Second, no ionizing radiation is involved with MRI. Third, because the region of the body imaged in MRI is controlled with the gradient coils, direct multiplanar imaging is possible without reorienting the patient. Dis-advantages of MRI include relatively long imaging times and the potential hazard imposed by the presence of ferromagnetic metals in the vicinity of the imaging magnet. This latter disadvantage excludes from MRI any patient with implanted metallic foreign objects or

218 PART IV ■ IMAGING PRINCIPLES AND TECHNIQUES
medical devices that consist of or contain ferromagnetic metals (e.g., cardiac pacemakers, some cerebral aneurysm clips or ferrous foreign bodies in the eye). The strong magnetic fi elds may move these objects and harm patients. Metals used in dentistry for restorations or ortho-dontics will not move but may distort the image in their vicinity. Titanium implants cause only minor image degradation. Finally, some patients have claustrophobia when positioned in an MRI machine.
APPLICATIONS
Because of its excellent soft tissue contrast resolution, MRI is useful in evaluating soft tissue conditions, for instance, the position and integrity of the disk in the TMJ ( Fig. 13-18 ); for soft tissue disease especially neoplasia involving the soft tissues, such as tongue, cheek, salivary glands, and neck; determining malignant involvement of lymph nodes; and determining perineural invasion by malignant neo-plasia. Similar to CT imaging, a contrast agent such as gadolinium can be added to enhance the image resolution of neoplasia ( Fig 13-19 ). Also, it is customary to remove the high signal of surrounding fat tissue (fat suppression) to enhance the appearance of the neoplasm. A typical protocol would include T1, T1 postgadolinium (with fat suppression), and T2 (with fat suppression) images.
Nuclear Medicine
Film radiography, CT, MRI, and diagnostic ultrasonography are mor-phologic imaging techniques in that each requires a macroscopic ana-tomic change for information to be recorded by an image receptor. However, in some human diseases abnormal biochemical processes occur without anatomic change. Radionuclide imaging (a form of functional imaging) provides a means of assessing such physiologic change. Nuclear medicine examinations are commonly used for assign function of the brain, thyroids, heart, lungs, and gastrointestinal system as well as for diagnosis and follow-up of metastatic disease, bone tumors, and infection ( Fig. 13-20 ).
Radionuclide imaging uses radioactive atoms or molecules that emit gamma rays. These atoms behave in an organism in a manner comparable to their stable counterparts because they are chemically indistinguishable. Radionuclides allow measurement of tissue func-tion in vivo and provide an early marker of disease through measure-ment of biochemical change. After the radionuclides are administered, they distribute in the body according to their chemical properties. The γ -scintillation camera detects gamma rays and forms planar images showing the locations of the radionuclides in the body. Single photon emission computed tomography (SPECT) and positron emission tomography (PET) imaging are advanced nuclear medicine tech-niques that form tomographic views. Recently molecular imaging of individual gene expression is being accomplished in the laboratory.
RADIONUCLIDES
The ideal radionuclide has a short half-life, emits γ rays but no charged particles, and is capable of binding to a variety of pharmaceuticals. Although many γ -emitting isotopes are used in radionuclide imaging, including iodine ( 131 I), gallium ( 67 Ga), and selenium ( 74 Se), the most commonly used is technetium 99m ( 99m Tc). Technetium 99m has a half-life of 6 hours and emits primarily 140 kiloelectron volt (keV) photons. As technetium pertechnetate, 99m Tc mimics iodine distribu-tion when injected intravenously and is concentrated by the salivary and thyroid glands and gastric mucosa. When it is attached to various
carrier molecules, it can be used to examine virtually every organ of the body.
To image bone, 99m Tc is typically bound to methylene diphospho-nate (MDP) and a dose of 20 to 30 mCi (740 to 1110 mega-Becquerels [ MBq ] ) is injected intravenously. Immediately after injection the tracer distributes intravascularly. Images made during this fl ow phase, the fi rst 60 to 90 seconds, are called radionuclide angiography. In the second, or blood pool phase, the tracer quickly moves into the extra-cellular space. The third, or bone scintigraphy phase, is made 2 to 3 hours after injection. The MDP deposition in the skeleton depends both on osteoclastic activity and blood fl ow ( Fig. 13-20 ). Images made 2 to 3 hours after injection show most of the tracer activity in the skeleton, kidneys, and bladder. Most metastatic tumors in bone induce formation of new bone and thus may be detected on such an examination.
Radionuclide-labeled tracers are used in quantities well below amounts that are lethal to cells. However, although radionuclide imaging is considered noninvasive, the radiation dose the patient receives as a result of intravenous injection of radionuclide-labeled tracers should be considered. Injection of 740 MBq of 99m Tc pertech-netate delivers a whole-body radiation dose of 2 milliGrays (mGy). This quantity is less than the average annual effective dose resulting from natural radiation (see Chapter 3 ).
g -SCINTILLATION CAMERA
γ -Scintillation cameras (also called Anger cameras ) are the most common means of forming an image ( Fig. 13-21 ). These cameras capture photons and convert them to light and then to a voltage signal. This signal is reconstructed to a planar image that shows the distribu-tion of the radionuclide in the patient. The fi rst part of the gamma camera is a collimator. It absorbs γ rays that do not travel parallel to the plates, thus improving image resolution. The γ rays that pass through the collimator then strike a scintillation crystal. This crystal, often made of sodium iodide with trace amounts of thallium, fl uoresces when it absorbs γ rays. These fl ashes of light are detected by an array of photo-multiplier tubes coupled to the crystal with light pipes. The photomul-tiplier tubes capture the fl ash and amplify the signal. The size of the signal is proportional to the energy of the absorbed photon. The signals from the photomultiplier tubes go through an analog to digital con-verter and then to a pulse height analyzer. This device detects the inten-sity of the signal, and thus the energy of the incident absorbed photons, and only uses those from the radionuclide when forming the fi nal image. Many of the γ rays released from the radionuclide in the patient undergo Compton absorption at some distant site and result in a new scattered photon. If these scattered, lower-energy photons pass through the collimator of the gamma camera, they may degrade image resolu-tion. However, these scattered photons are detected by the pulse height analyzer and are rejected so that they do not contribute to the image. Gamma cameras have a spatial resolution of up 3 to 5 mm. Use of a scintillation crystal for acquisition of data for image formation has led to the labeling of this technique as scintigraphy.
SINGLE PHOTON EMISSION COMPUTED TOMOGRAPHY
SPECT is a method of acquiring tomographic slices through a patient. Most gamma cameras have SPECT capability. In this technique either a single or multiple gamma camera is rotated 360 degrees about the patient. Image acquisition takes about 30 to 45 minutes. The acquired
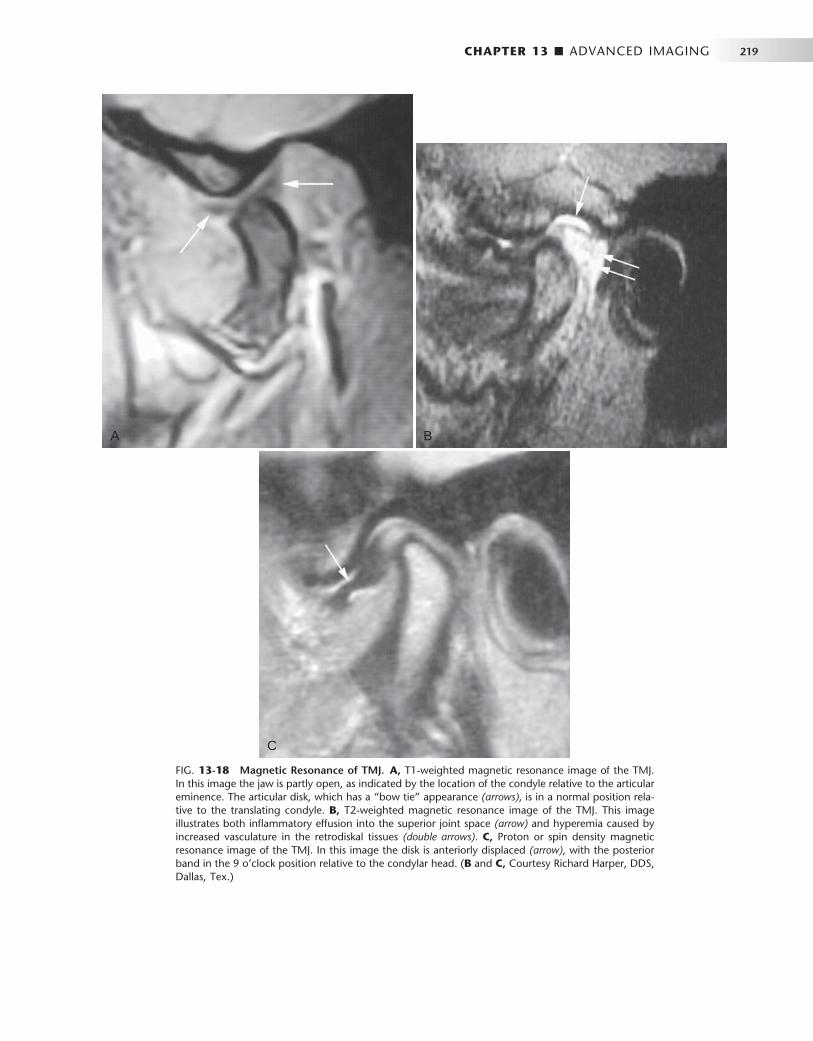
CHAPTER 13 ■ ADVANCED IMAGING 219
FIG. 13-18 Magnetic Resonance of TMJ. A, T1-weighted magnetic resonance image of the TMJ. In this image the jaw is partly open, as indicated by the location of the condyle relative to the articular eminence. The articular disk, which has a “ bow tie ” appearance (arrows) , is in a normal position rela-tive to the translating condyle. B, T2-weighted magnetic resonance image of the TMJ. This image illustrates both infl ammatory effusion into the superior joint space (arrow) and hyperemia caused by increased vasculature in the retrodiskal tissues (double arrows) . C, Proton or spin density magnetic resonance image of the TMJ. In this image the disk is anteriorly displaced (arrow) , with the posterior band in the 9 o ’ clock position relative to the condylar head. ( B and C, Courtesy Richard Harper, DDS, Dallas, Tex.)
A B
C
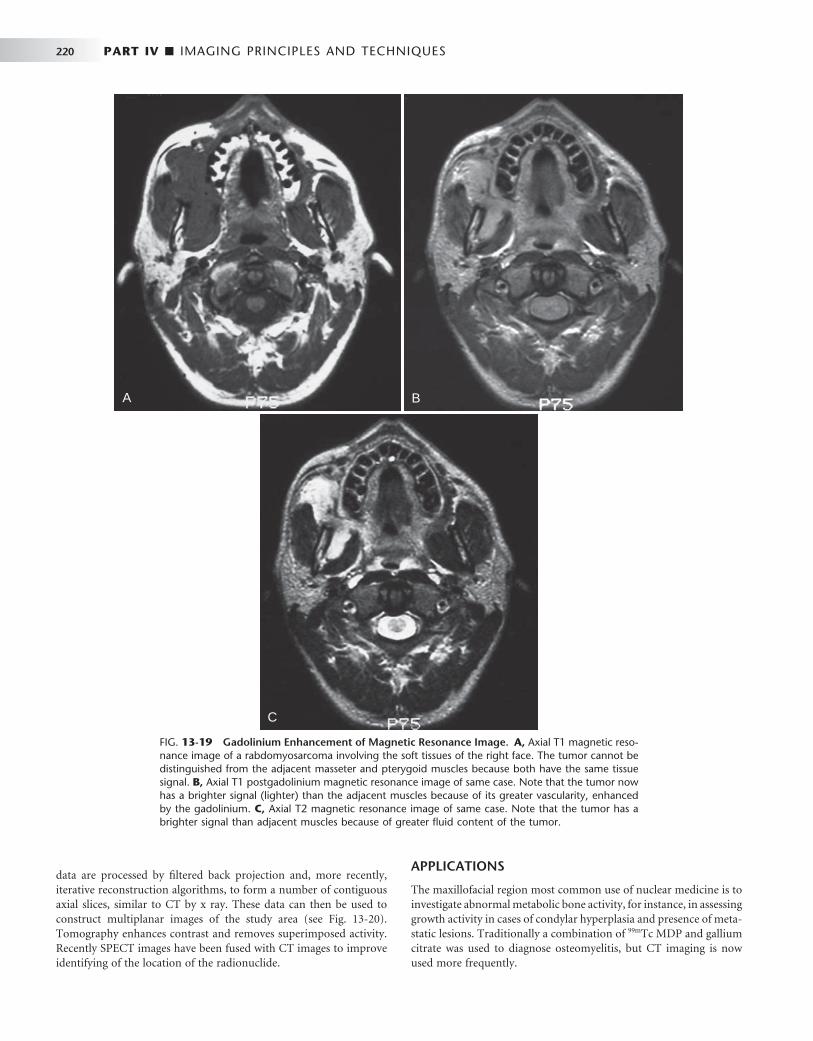
220 PART IV ■ IMAGING PRINCIPLES AND TECHNIQUES
FIG. 13-19 Gadolinium Enhancement of Magnetic Resonance Image. A, Axial T1 magnetic reso-nance image of a rabdomyosarcoma involving the soft tissues of the right face. The tumor cannot be distinguished from the adjacent masseter and pterygoid muscles because both have the same tissue signal. B, Axial T1 postgadolinium magnetic resonance image of same case. Note that the tumor now has a brighter signal (lighter) than the adjacent muscles because of its greater vascularity, enhanced by the gadolinium. C, Axial T2 magnetic resonance image of same case. Note that the tumor has a brighter signal than adjacent muscles because of greater fl uid content of the tumor.
A B
C
data are processed by fi ltered back projection and, more recently, iterative reconstruction algorithms, to form a number of contiguous axial slices, similar to CT by x ray. These data can then be used to construct multiplanar images of the study area (see Fig. 13-20 ). Tomography enhances contrast and removes superimposed activity. Recently SPECT images have been fused with CT images to improve identifying of the location of the radionuclide.
APPLICATIONS
The maxillofacial region most common use of nuclear medicine is to investigate abnormal metabolic bone activity, for instance, in assessing growth activity in cases of condylar hyperplasia and presence of meta-static lesions. Traditionally a combination of 99m Tc MDP and gallium citrate was used to diagnose osteomyelitis, but CT imaging is now used more frequently.

CHAPTER 13 ■ ADVANCED IMAGING 221
POSITRON EMISSION TOMOGRAPHY
PET is a more advanced imaging modality in nuclear medicine. PET, which is reported to have a sensitivity nearly 100 times that of a gamma camera, relies on positron-emitting radionuclides generated in a cyclotron. The utility of PET is based not only on its sensitivity but also on the fact that the most commonly used radionuclides ( 11 C, 13 N, 15 O, 18 F) are isotopes of elements that occur naturally in organic molecules. Although fl uorine does not technically fi t into this cate-gory, it is a chemical substitute for hydrogen. These radionuclides are used as is, or more commonly, incorporated into a radiopharmaceuti-cal such as glucose or amino acids by use of a medical cyclotron. After the radiopharmaceutical is injected into the patient, the isotope dis-tributes within the body ’ s tissue according to the carrier molecule and emits a positron. This positron then interacts with a free electron and mutual annihilation occurs, resulting in the production of two 551-keV photons emitted at 180 degrees to each other. The PET scanner consists of a ring of many detectors in a circle around the patient ( Fig. 13-22 ). The detector crystals are often made of bismuth germinate.
Electronically coupled opposing detectors simultaneously identify the pair of γ photons using coincidence detection circuits that measure events within 10 to 20 nanoseconds. The annihilation event is thus known to have occurred along the line joining the two detectors. Raw PET scan data consist of a number of these coincidence lines, which are reorganized into projections that identify where isotope is concen-trated within the patient. The spatial resolution of a PET scanner is about 5 mm. PET is useful in skeletal imaging for assessing primary bone tumors, locating metastases in bone, and detecting osteomyelitis. For instance, 18 F-fl uoro-2-deoxyglucose ( 18 F-FDG) is a radiopharma-ceutical commonly used for studying glucose use in the brain and heart and to look for cancer metastases ( Fig. 13-23 ). PET images are often fused with CT scans to facilitate anatomic localization of radio-nuclide. The PET/CT combination has been shown to be quite helpful in staging and treatment planning of squamous cell carcinoma in the head and neck.
Ultrasonography
Sonography is a technique based on sound waves that acquires images in real time and without the use of ionizing radiation. The phenom-enon perceived as sound is the result of periodic changes in the pres-sure of air against the eardrum. The periodicity of these changes lies anywhere between 1500 and 20,000 Hz. By defi nition, ultrasound has a periodicity greater than 20 kHz, greater than the audible range. Diagnostic ultrasonography (sonography), the clinical application of ultrasound, uses vibratory frequencies in the range of 1 to 20 MHz.
Scanners used for sonography generate electrical impulses that are converted into ultra-high-frequency sound waves by a transducer, a device that can convert one form of energy into another — in this case, electrical energy into sonic energy. The most important component of the transducer is a thin piezoelectric crystal or material made up of a great number of dipoles arranged in a geometric pattern. A dipole may be thought of as a distorted molecule that appears to have a
FIG. 13-20 Radionuclide Image. The increased uptake of 99m Tc-MDP in the region of the right TMJ. The top row images were captured with a γ -scintillation camera. The lower two tomographic images were captured with SPECT.
Anterior L Posterior R Rlat Llat
Nal scintillatorCollimator
Lucite light pipePhotomultiplier tubes
Analog todigital
Pulse heightanalyzer
Digital toanalog
FIG. 13-22 PET Scanner. A PET scanner consists of a ring of detec-tors that measure pairs of 511 keV γ rays traveling in opposite directions from positron annihilation. Each pair is recorded simultaneously; thus the location of the radionuclide can be determined as the intersection of the pairs of detectors recording simultaneous events. The location of the common source of the radionuclide is thus readily determined as the intersection of the fl ight paths of the γ rays.
FIG. 13-21 Gamma Scintillation Camera. The principal compo-nents of a gamma scintillation camera are a collimator to limit γ rays to those perpendicular to the surface of the camera, a scintillator to absorb the γ rays and emit a fl ash of visible light, photomultiplier tubes to count the fl ashes of light and measure their energy, a pulse height analyzer to select only those fl ashes from the administered radionu-clide, and a monitor to display the resultant image. The most superior γ ray will pass through the collimator and contribute to the image and the collimator will block the second γ ray. The photon resulting from Compton scattering in the leg will be rejected by the pulse height analyzer and not contribute to the image. Image of patient is anterior view of patient after intravenous injection of 99m Tc-MDP.
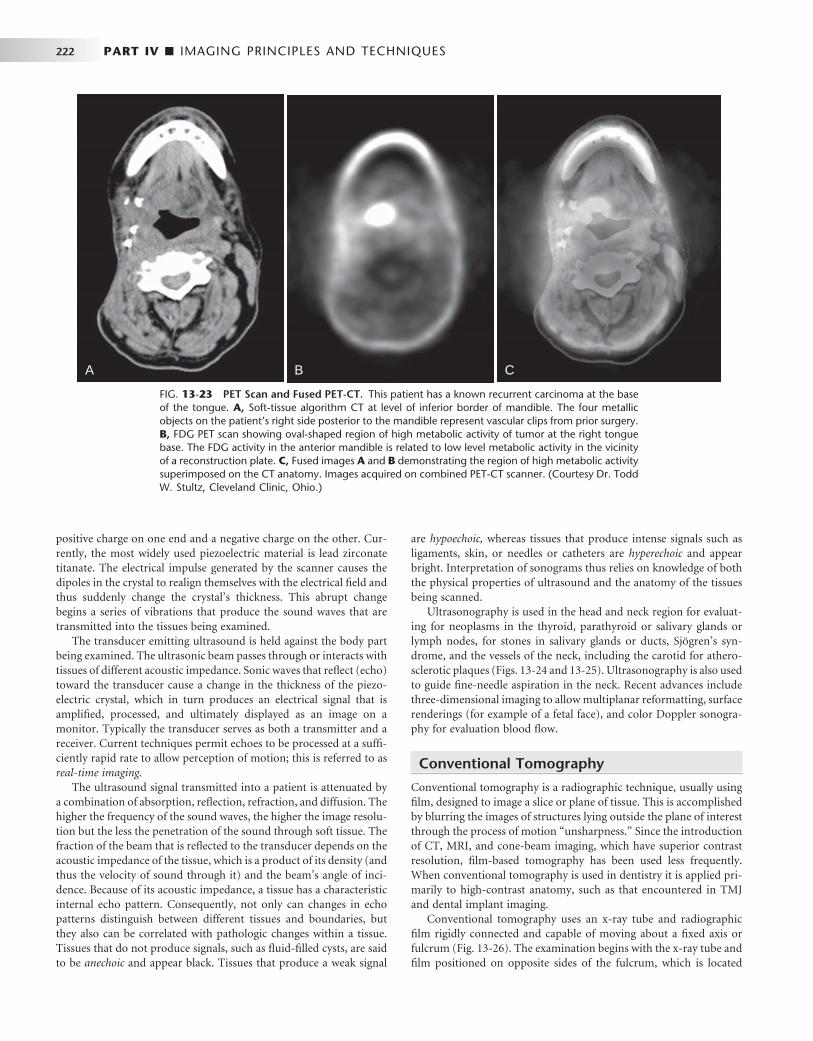
222 PART IV ■ IMAGING PRINCIPLES AND TECHNIQUES
positive charge on one end and a negative charge on the other. Cur-rently, the most widely used piezoelectric material is lead zirconate titanate. The electrical impulse generated by the scanner causes the dipoles in the crystal to realign themselves with the electrical fi eld and thus suddenly change the crystal ’ s thickness. This abrupt change begins a series of vibrations that produce the sound waves that are transmitted into the tissues being examined.
The transducer emitting ultrasound is held against the body part being examined. The ultrasonic beam passes through or interacts with tissues of different acoustic impedance. Sonic waves that refl ect (echo) toward the transducer cause a change in the thickness of the piezo-electric crystal, which in turn produces an electrical signal that is amplifi ed, processed, and ultimately displayed as an image on a monitor. Typically the transducer serves as both a transmitter and a receiver. Current techniques permit echoes to be processed at a suffi -ciently rapid rate to allow perception of motion; this is referred to as real-time imaging.
The ultrasound signal transmitted into a patient is attenuated by a combination of absorption, refl ection, refraction, and diffusion. The higher the frequency of the sound waves, the higher the image resolu-tion but the less the penetration of the sound through soft tissue. The fraction of the beam that is refl ected to the transducer depends on the acoustic impedance of the tissue, which is a product of its density (and thus the velocity of sound through it) and the beam ’ s angle of inci-dence. Because of its acoustic impedance, a tissue has a characteristic internal echo pattern. Consequently, not only can changes in echo patterns distinguish between different tissues and boundaries, but they also can be correlated with pathologic changes within a tissue. Tissues that do not produce signals, such as fl uid-fi lled cysts, are said to be anechoic and appear black. Tissues that produce a weak signal
are hypoechoic, whereas tissues that produce intense signals such as ligaments, skin, or needles or catheters are hyperechoic and appear bright. Interpretation of sonograms thus relies on knowledge of both the physical properties of ultrasound and the anatomy of the tissues being scanned.
Ultrasonography is used in the head and neck region for evaluat-ing for neoplasms in the thyroid, parathyroid or salivary glands or lymph nodes, for stones in salivary glands or ducts, Sj ö gren ’ s syn-drome, and the vessels of the neck, including the carotid for athero-sclerotic plaques ( Figs. 13-24 and 13-25 ). Ultrasonography is also used to guide fi ne-needle aspiration in the neck. Recent advances include three-dimensional imaging to allow multiplanar reformatting, surface renderings (for example of a fetal face), and color Doppler sonogra-phy for evaluation blood fl ow.
Conventional Tomography
Conventional tomography is a radiographic technique, usually using fi lm, designed to image a slice or plane of tissue. This is accomplished by blurring the images of structures lying outside the plane of interest through the process of motion “ unsharpness. ” Since the introduction of CT, MRI, and cone-beam imaging, which have superior contrast resolution, fi lm-based tomography has been used less frequently. When conventional tomography is used in dentistry it is applied pri-marily to high-contrast anatomy, such as that encountered in TMJ and dental implant imaging.
Conventional tomography uses an x-ray tube and radiographic fi lm rigidly connected and capable of moving about a fi xed axis or fulcrum ( Fig. 13-26 ). The examination begins with the x-ray tube and fi lm positioned on opposite sides of the fulcrum, which is located
FIG. 13-23 PET Scan and Fused PET-CT. This patient has a known recurrent carcinoma at the base of the tongue. A, Soft-tissue algorithm CT at level of inferior border of mandible. The four metallic objects on the patient ’ s right side posterior to the mandible represent vascular clips from prior surgery. B, FDG PET scan showing oval-shaped region of high metabolic activity of tumor at the right tongue base. The FDG activity in the anterior mandible is related to low level metabolic activity in the vicinity of a reconstruction plate. C, Fused images A and B demonstrating the region of high metabolic activity superimposed on the CT anatomy. Images acquired on combined PET-CT scanner. (Courtesy Dr. Todd W. Stultz, Cleveland Clinic, Ohio.)
A B C
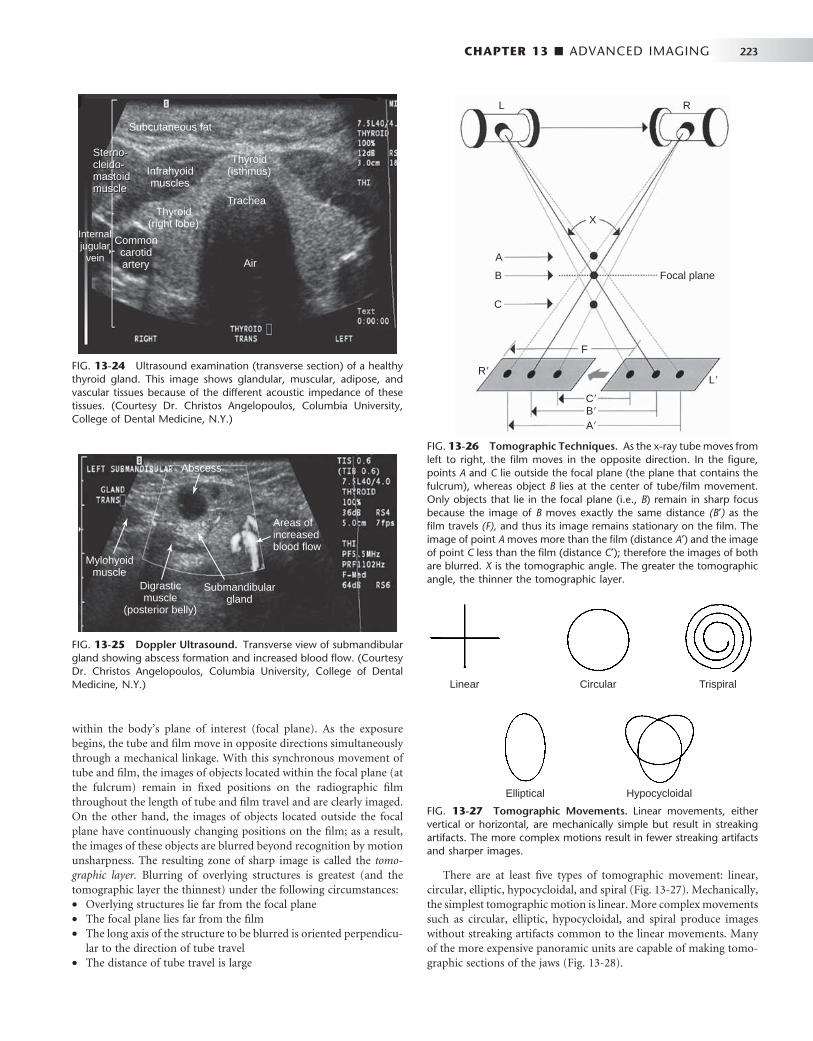
CHAPTER 13 ■ ADVANCED IMAGING 223
FIG. 13-24 Ultrasound examination (transverse section) of a healthy thyroid gland. This image shows glandular, muscular, adipose, and vascular tissues because of the different acoustic impedance of these tissues. (Courtesy Dr. Christos Angelopoulos, Columbia University, College of Dental Medicine, N.Y.)
Sterno-cleido-mastoidmuscle
Subcutaneous fat
Sterno-cleido-mastoidmuscle
Infrahyoidmuscles
Thyroid(right lobe)
Thyroid(isthmus)
Air
Commoncarotidartery
Internaljugular
vein
Trachea
FIG. 13-25 Doppler Ultrasound. Transverse view of submandibular gland showing abscess formation and increased blood fl ow. (Courtesy Dr. Christos Angelopoulos, Columbia University, College of Dental Medicine, N.Y.)
Abscess
Areas ofincreasedblood flow
Submandibulargland
Digrasticmuscle
(posterior belly)
Mylohyoidmuscle
FIG. 13-26 Tomographic Techniques. As the x-ray tube moves from left to right, the fi lm moves in the opposite direction. In the fi gure, points A and C lie outside the focal plane (the plane that contains the fulcrum), whereas object B lies at the center of tube/fi lm movement. Only objects that lie in the focal plane (i.e., B ) remain in sharp focus because the image of B moves exactly the same distance (B ′ ) as the fi lm travels (F), and thus its image remains stationary on the fi lm. The image of point A moves more than the fi lm (distance A ′ ) and the image of point C less than the fi lm (distance C ′ ); therefore the images of both are blurred. X is the tomographic angle. The greater the tomographic angle, the thinner the tomographic layer.
L R
X
A
Focal plane
F
L�R�
C�B�
A�
B
C
FIG. 13-27 Tomographic Movements. Linear movements, either vertical or horizontal, are mechanically simple but result in streaking artifacts. The more complex motions result in fewer streaking artifacts and sharper images.
Linear Circular Trispiral
Elliptical Hypocycloidal
There are at least fi ve types of tomographic movement: linear, circular, elliptic, hypocycloidal, and spiral ( Fig. 13-27 ). Mechanically, the simplest tomographic motion is linear. More complex movements such as circular, elliptic, hypocycloidal, and spiral produce images without streaking artifacts common to the linear movements. Many of the more expensive panoramic units are capable of making tomo-graphic sections of the jaws ( Fig. 13-28 ).
within the body ’ s plane of interest (focal plane). As the exposure begins, the tube and fi lm move in opposite directions simultaneously through a mechanical linkage. With this synchronous movement of tube and fi lm, the images of objects located within the focal plane (at the fulcrum) remain in fi xed positions on the radiographic fi lm throughout the length of tube and fi lm travel and are clearly imaged. On the other hand, the images of objects located outside the focal plane have continuously changing positions on the fi lm; as a result, the images of these objects are blurred beyond recognition by motion unsharpness. The resulting zone of sharp image is called the tomo-graphic layer. Blurring of overlying structures is greatest (and the tomographic layer the thinnest) under the following circumstances: • Overlying structures lie far from the focal plane • The focal plane lies far from the fi lm • The long axis of the structure to be blurred is oriented perpendicu-
lar to the direction of tube travel • The distance of tube travel is large

224 PART IV ■ IMAGING PRINCIPLES AND TECHNIQUES
BIBLIOGRAPHY
COMPUTED TOMOGRAPHY
1 Bononmo L , Foley D , Imhof H et al : Multidetector computed tomography technology: advances in imaging techniques , ed 1 , London , 2003 , Royal Society of Medicine Press .
2 Bushberg JT , Seibert JA , Leidholdt EM Jr et al : The essential physics of medical imaging , ed 2 , Baltimore , 2002 , Williams & Wilkins .
3 Bushong , SC : Computed tomography , ed 1 , New York , 2000 , McGraw-Hill . 4 Fishman EK , Jeffrey RB Jr : Multidetector CT: principles, techniques, and
clinical applications , ed 1 , Philadelphia , 2004 , Lippincott Williams & Wilkins .
5 Kalender W : Computed tomography: fundamentals, systems technology, image quality, applications , ed 2 , Erlangen , 2005 , Publicis Corporate Publishing .
6 Knollmann F , Coakley FV : Multislice CT: principles and protocols , ed 1 , Philadelphia , 2006 , Elsevier .
7 Marchal G , Vogl TJ , Heiken JP et al : Multidetector-row computed tomography , ed 1 , Milan , 2005 , Springer .
8 Silverman PM : Multislice computed tomography: a practical approach to clinical protocols , ed 1 , Philadelphia , 2002 , Lippincott Williams & Wilkins .
MAGNETIC RESONANCE IMAGING
9 Bushberg JT , Seibert JA , Leidholdt EM Jr et al : The essential physics of medical imaging , ed 2 , Baltimore , 2002 , Williams & Wilkins .
10 Westbrook C , Roth CK , Talbot J : MRI in practice , ed 3 , Oxford , 2005 , Blackwell Publishing .
NUCLEAR MEDICINE
11 Mettler FA , Guiberteau MJ : Essentials of nuclear medicine , ed 5 , Philadelphia , 2006 , WB Saunders .
12 Schiepers C : Diagnostic nuclear medicine , ed 2 , Berlin , 2006 , Springer . 13 Sharp PF , Gemmell HG , Murray AD : Practical nuclear medicine , ed 3 ,
London , 2005 , Springer-Verlag . 14 Wilson MA : Nuclear medicine , ed 1 , Philadelphia , 1998 , Lippincott-Raven .
ULTRASOUND
15 Brant WE : Ultrasound , ed 1 , Philadelphia , 2001 , Lippincott Williams & Wilkins .
16 Emshoff R , Bertram S , Strobl H : Ultrasonographic cross-sectional characteristics of muscles of the head and neck , Oral Surg Oral Med Oral Pathol Oral Radiol Endod 87 : 93 - 106 , 1999 .
17 Goldman LW , Fowlkes JB , editors: Categorical course in diagnostic radiology physics: CT and US cross-sectional imaging , Oak Brook, Ill , 2000 , RSNA Publications .
18 Middleton WD , Kurtz AB , Hertzberg BA : Ultrasound: the requisites , ed 2 , St. Louis , 2004 , Mosby .
19 Shimizu M , Okamura K , Yoshiura K et al : Sonographic diagnostic criteria for screening Sj ö gren ’ s syndrome , Oral Surg Oral Med Oral Path Oral Radiol Endod 102 : 85 - 93 , 2006 .
FIG. 13-28 Linear Tomographic Images Made by Panoramic Units. A, Mandibular tomogram in the region of the mental foramen. B, Maxillary tomograms in the premolar region acquired with an Instrumentarium Orthopantomograph 100 panoramic unit. Note the dome-shaped opacity in the fl oor of the maxillary sinus consistent with a mucous retention phenomenon. ( B, Courtesy Brad Potter, DDS, Augusta, Ga.)
A B
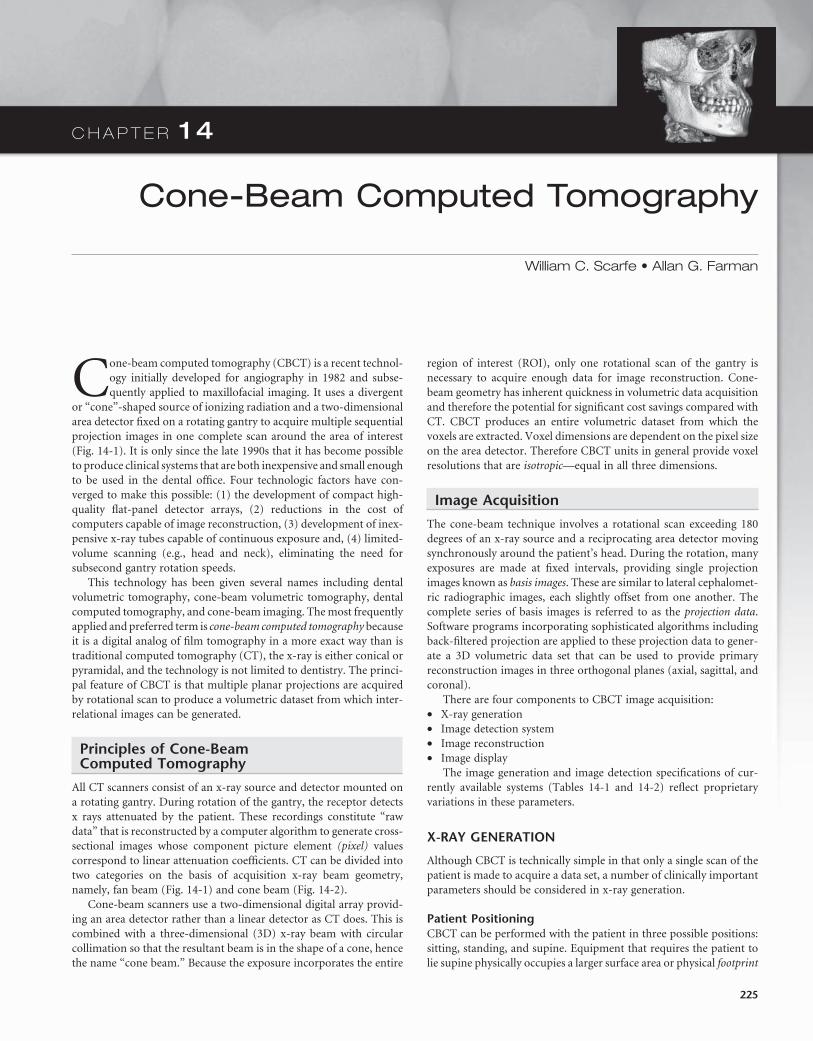
C H A P T E R 1 4
Cone-Beam Computed Tomography
William C. Scarfe • Allan G. Farman
Cone-beam computed tomography (CBCT) is a recent technol-ogy initially developed for angiography in 1982 and subse-quently applied to maxillofacial imaging. It uses a divergent
or “ cone ” -shaped source of ionizing radiation and a two-dimensional area detector fi xed on a rotating gantry to acquire multiple sequential projection images in one complete scan around the area of interest ( Fig. 14-1 ). It is only since the late 1990s that it has become possible to produce clinical systems that are both inexpensive and small enough to be used in the dental offi ce. Four technologic factors have con-verged to make this possible: (1) the development of compact high-quality fl at-panel detector arrays, (2) reductions in the cost of computers capable of image reconstruction, (3) development of inex-pensive x-ray tubes capable of continuous exposure and, (4) limited-volume scanning (e.g., head and neck), eliminating the need for subsecond gantry rotation speeds.
This technology has been given several names including dental volumetric tomography, cone-beam volumetric tomography, dental computed tomography, and cone-beam imaging. The most frequently applied and preferred term is cone-beam computed tomography because it is a digital analog of fi lm tomography in a more exact way than is traditional computed tomography (CT), the x-ray is either conical or pyramidal, and the technology is not limited to dentistry. The princi-pal feature of CBCT is that multiple planar projections are acquired by rotational scan to produce a volumetric dataset from which inter-relational images can be generated.
Principles of Cone-Beam Computed Tomography
All CT scanners consist of an x-ray source and detector mounted on a rotating gantry. During rotation of the gantry, the receptor detects x rays attenuated by the patient. These recordings constitute “ raw data ” that is reconstructed by a computer algorithm to generate cross-sectional images whose component picture element (pixel) values correspond to linear attenuation coeffi cients. CT can be divided into two categories on the basis of acquisition x-ray beam geometry, namely, fan beam ( Fig. 14-1 ) and cone beam ( Fig. 14-2 ).
Cone-beam scanners use a two-dimensional digital array provid-ing an area detector rather than a linear detector as CT does. This is combined with a three-dimensional (3D) x-ray beam with circular collimation so that the resultant beam is in the shape of a cone, hence the name “ cone beam. ” Because the exposure incorporates the entire
region of interest (ROI), only one rotational scan of the gantry is necessary to acquire enough data for image reconstruction. Cone-beam geometry has inherent quickness in volumetric data acquisition and therefore the potential for signifi cant cost savings compared with CT. CBCT produces an entire volumetric dataset from which the voxels are extracted. Voxel dimensions are dependent on the pixel size on the area detector. Therefore CBCT units in general provide voxel resolutions that are isotropic — equal in all three dimensions.
Image Acquisition
The cone-beam technique involves a rotational scan exceeding 180 degrees of an x-ray source and a reciprocating area detector moving synchronously around the patient ’ s head. During the rotation, many exposures are made at fi xed intervals, providing single projection images known as basis images . These are similar to lateral cephalomet-ric radiographic images, each slightly offset from one another. The complete series of basis images is referred to as the projection data . Software programs incorporating sophisticated algorithms including back-fi ltered projection are applied to these projection data to gener-ate a 3D volumetric data set that can be used to provide primary reconstruction images in three orthogonal planes (axial, sagittal, and coronal).
There are four components to CBCT image acquisition: • X-ray generation • Image detection system • Image reconstruction • Image display
The image generation and image detection specifi cations of cur-rently available systems ( Tables 14-1 and 14-2 ) refl ect proprietary variations in these parameters.
X-RAY GENERATION
Although CBCT is technically simple in that only a single scan of the patient is made to acquire a data set, a number of clinically important parameters should be considered in x-ray generation.
Patient Positioning CBCT can be performed with the patient in three possible positions: sitting, standing, and supine. Equipment that requires the patient to lie supine physically occupies a larger surface area or physical footprint
225
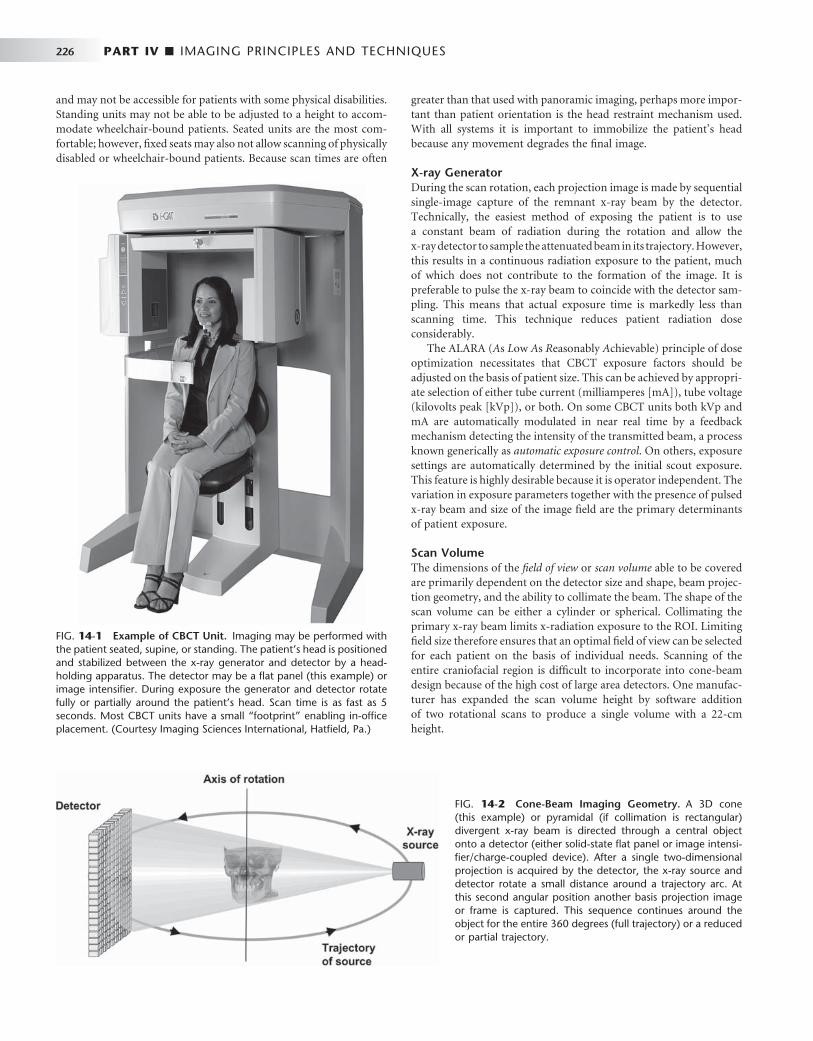
226 PART IV ■ IMAGING PRINCIPLES AND TECHNIQUES
greater than that used with panoramic imaging, perhaps more impor-tant than patient orientation is the head restraint mechanism used. With all systems it is important to immobilize the patient ’ s head because any movement degrades the fi nal image.
X-ray Generator During the scan rotation, each projection image is made by sequential single-image capture of the remnant x-ray beam by the detector. Technically, the easiest method of exposing the patient is to use a constant beam of radiation during the rotation and allow the x-ray detector to sample the attenuated beam in its trajectory. However, this results in a continuous radiation exposure to the patient, much of which does not contribute to the formation of the image. It is preferable to pulse the x-ray beam to coincide with the detector sam-pling. This means that actual exposure time is markedly less than scanning time. This technique reduces patient radiation dose considerably.
The ALARA ( A s L ow A s R easonably A chievable) principle of dose optimization necessitates that CBCT exposure factors should be adjusted on the basis of patient size. This can be achieved by appropri-ate selection of either tube current (milliamperes [ mA ] ), tube voltage (kilovolts peak [ kVp ] ), or both. On some CBCT units both kVp and mA are automatically modulated in near real time by a feedback mechanism detecting the intensity of the transmitted beam, a process known generically as automatic exposure control . On others, exposure settings are automatically determined by the initial scout exposure. This feature is highly desirable because it is operator independent. The variation in exposure parameters together with the presence of pulsed x-ray beam and size of the image fi eld are the primary determinants of patient exposure.
Scan Volume The dimensions of the fi eld of view or scan volume able to be covered are primarily dependent on the detector size and shape, beam projec-tion geometry, and the ability to collimate the beam. The shape of the scan volume can be either a cylinder or spherical. Collimating the primary x-ray beam limits x-radiation exposure to the ROI. Limiting fi eld size therefore ensures that an optimal fi eld of view can be selected for each patient on the basis of individual needs. Scanning of the entire craniofacial region is diffi cult to incorporate into cone-beam design because of the high cost of large area detectors. One manufac-turer has expanded the scan volume height by software addition of two rotational scans to produce a single volume with a 22-cm height.
FIG. 14-1 Example of CBCT Unit. Imaging may be performed with the patient seated, supine, or standing. The patient ’ s head is positioned and stabilized between the x-ray generator and detector by a head-holding apparatus. The detector may be a fl at panel (this example) or image intensifi er. During exposure the generator and detector rotate fully or partially around the patient ’ s head. Scan time is as fast as 5 seconds. Most CBCT units have a small “ footprint ” enabling in-offi ce placement. (Courtesy Imaging Sciences International, Hatfi eld, Pa.)
FIG. 14-2 Cone-Beam Imaging Geometry. A 3D cone (this example) or pyramidal (if collimation is rectangular) divergent x-ray beam is directed through a central object onto a detector (either solid-state fl at panel or image intensi-fi er/charge-coupled device). After a single two-dimensional projection is acquired by the detector, the x-ray source and detector rotate a small distance around a trajectory arc. At this second angular position another basis projection image or frame is captured. This sequence continues around the object for the entire 360 degrees (full trajectory) or a reduced or partial trajectory.
and may not be accessible for patients with some physical disabilities. Standing units may not be able to be adjusted to a height to accom-modate wheelchair-bound patients. Seated units are the most com-fortable; however, fi xed seats may also not allow scanning of physically disabled or wheelchair-bound patients. Because scan times are often

CHAPTER 14 ■ CONE-BEAM COMPUTED TOMOGRAPHY 227
Scan Factors The speed with which individual images are acquired is called the frame rate and is measured in frames, projected images, per second. The maximum frame rate of the detector and rotational speed deter-mines the number of projections that may be acquired. The number of projection images comprising a single scan may be fi xed or variable. With a higher frame rate, more information is available to reconstruct the image; therefore, primary reconstruction time is increased. However, higher frame rates increase the signal-to-noise ratio, pro-ducing images with less noise. In the maxillofacial region, another advantage of a higher frame rate is that it reduces metallic artifact. Note that higher frame rates are usually accomplished with a longer scan time and hence higher patient dose.
Most CBCT imaging systems use a complete circular trajectory or a scan arc of 360 degrees to acquire projection data. This physical requirement is usually necessary to produce adequate projection data for 3D reconstruction. However, it is theoretically possible to reduce the completeness of the scanning trajectory to less than a full circle and still reconstruct a volumetric data set. This approach potentially reduces the scan time and is mechanically easier to perform.
It is desirable to reduce CBCT scan times to as short as possible to reduce motion artifact resulting from subject movement. This can be substantial and may be a limiting factor in voxel resolution. Decreased scanning times may be achieved by increasing the detector frame rate, reducing the number of projections, or reducing the scan arc. The latter two possibilities produce data with higher noise, whereas the fi rst is optimal.
IMAGE DETECTION
Current CBCT units can be divided into two groups on the basis of detector type: image intensifi er tube/charge-coupled device combina-tion or fl at-panel imager. The former confi guration comprises an x-ray image intensifi er tube coupled to a charge-coupled device with a fi ber optic coupling. Flat-panel imaging consists of detection of x rays with an “ indirect ” detector that is based on a large area solid-state sensor panel coupled to an x-ray scintillator layer (see Chapter 7 ). The most common fl at-panel confi guration consists of a cesium iodide scintillator applied to a thin fi lm transistor made of amorphous silicon.
Voxel Size The principal determinants of nominal voxel size in CBCT are the x-ray tube focal spot size, x-ray geometric confi guration, and the matrix and pixel size of the solid state detector. Both the focal spot size and the geometric confi guration of the x-ray source determine the degree of geometric unsharpness, a limiting factor in spatial resolution. However, the cost of x-ray tubes, and therefore of the CBCT unit, increases substantially with smaller focal spot size. Reduc-ing the object-to-detector distance and increasing source-to-object distance also minimizes geometric unsharpness. In maxillofacial CBCT the detector position is limited because it must be located far enough from the patient ’ s head so that it freely rotates and clears the patient ’ s shoulders. Limitations also exist in extending the source-to-object distance because this increases the size of the CBCT unit. However, reducing source-to-object distance produces a magni-fi ed projected image on the detector, increasing potential spatial resolution.
Grayscale The ability of CBCT to display differences in attenuation is related to the ability of the detector to detect subtle contrast differences. This parameter is called the bit depth of the system and determines the number of shades of gray available to display the attenuation. At the time of writing, all available CBCT units used detectors capable of recording grayscale differences of 12 bits or higher. If a 12-bit detector (2 12 ) is used to defi ne the scale, 4096 shades are available to display contrast. Although higher bit-depth images in CBCT are possible, this added information comes at the expense of increased computational time and substantially larger fi le sizes.
RECONSTRUCTION
Once the basis projection frames have been acquired, it is necessary to process these data to create the volumetric data set. This process is called primary reconstruction . Although a single cone-beam rotation may take less than 30 seconds, it produces 100 to more than 600 individual projection frames, each with more than a million pixels with 12 to 16 bits of data assigned to each pixel. The reconstruction of these data is computationally complex. To facilitate data handling, data are usually acquired by one computer (acquisition computer) and transferred by an Ethernet connection to a processing computer (workstation). In contrast to conventional CT, cone-beam data recon-struction is performed by personal computer – based rather than workstation platforms.
Reconstruction times vary depending on the acquisition parame-ters (voxel size, size of the image fi eld, and number of projections), hardware (processing speed, data throughput from acquisition to
TABLE 14-1 Representative Cone-Beam Computed Tomography Imaging Systems
PRODUCT DISTRIBUTOR
3D Accuitomo/Veraviewpocs 3D J. Morita Mfg. Corp.
CB MercuRay Hitachi Medical Systems
Galileos Sirona Dental Systems
GXCB-500 Gendex Dental Systems
ILUMA Ultra Cone Beam CT/Kodak 9000 3D
Kodak Dental Systems
NewTom 3G (patient supine) NewTom VG (patient upright)
AFP Imaging Corp.
Next Generation iCAT Imaging Sciences International
Picasso Series – Trio/Pro/Master Ashtel Dental/Vatech / E.Woo Technology
PreXion 3D PreXion, Inc.
Promax 3D Planmeca Oy
PSR9000N Asahi Roentgen Corp./Belmont Corporation
Scanora 3D Soredex, Inc.
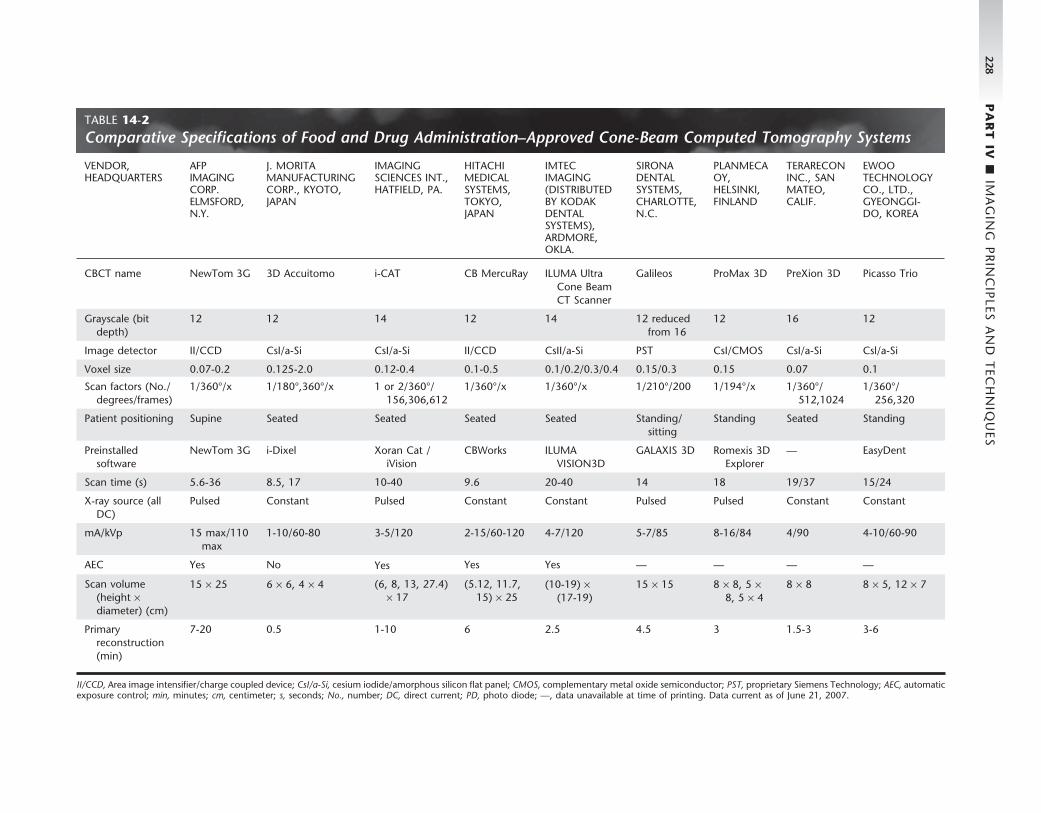
228 P
AR
T IV
■ IM
AG
ING
PR
INC
IPLES A
ND
TEC
HN
IQU
ES
TABLE 14-2 Comparative Specifi cations of Food and Drug Administration – Approved Cone-Beam Computed Tomography Systems
VENDOR, HEADQUARTERS
AFP IMAGING CORP. ELMSFORD, N.Y.
J. MORITA MANUFACTURING CORP., KYOTO, JAPAN
IMAGING SCIENCES INT., HATFIELD, PA.
HITACHI MEDICAL SYSTEMS, TOKYO, JAPAN
IMTEC IMAGING (DISTRIBUTED BY KODAK DENTAL SYSTEMS), ARDMORE, OKLA.
SIRONA DENTAL SYSTEMS, CHARLOTTE, N.C.
PLANMECA OY, HELSINKI, FINLAND
TERARECON INC., SAN MATEO, CALIF.
EWOO TECHNOLOGY CO., LTD., GYEONGGI-DO, KOREA
CBCT name NewTom 3G 3D Accuitomo i-CAT CB MercuRay ILUMA Ultra Cone Beam CT Scanner
Galileos ProMax 3D PreXion 3D Picasso Trio
Grayscale (bit depth)
12 12 14 12 14 12 reduced from 16
12 16 12
Image detector II/CCD CsI/a-Si CsI/a-Si II/CCD CsII/a-Si PST CsI/CMOS CsI/a-Si Csl/a-Si
Voxel size 0.07-0.2 0.125-2.0 0.12-0.4 0.1-0.5 0.1/0.2/0.3/0.4 0.15/0.3 0.15 0.07 0.1
Scan factors (No./degrees/frames)
1/360 ° /x 1/180 ° ,360 ° /x 1 or 2/360 ° /156,306,612
1/360 ° /x 1/360 ° /x 1/210 ° /200 1/194 ° /x 1/360 ° /512,1024
1/360 ° /256,320
Patient positioning Supine Seated Seated Seated Seated Standing/sitting
Standing Seated Standing
Preinstalled software
NewTom 3G i-Dixel Xoran Cat / iVision
CBWorks ILUMA VISION3D
GALAXIS 3D Romexis 3D Explorer
— EasyDent
Scan time (s) 5.6-36 8.5, 17 10-40 9.6 20-40 14 18 19/37 15/24
X-ray source (all DC)
Pulsed Constant Pulsed Constant Constant Pulsed Pulsed Constant Constant
mA/kVp 15 max/110 max
1-10/60-80 3-5/120 2-15/60-120 4-7/120 5-7/85 8-16/84 4/90 4-10/60-90
AEC Yes No Yes Yes Yes — — — —
Scan volume (height × diameter) (cm)
15 × 25 6 × 6, 4 × 4 (6, 8, 13, 27.4) × 17
(5.12, 11.7, 15) × 25
(10-19) × (17-19)
15 × 15 8 × 8, 5 × 8, 5 × 4
8 × 8 8 × 5, 12 × 7
Primary reconstruction (min)
7-20 0.5 1-10 6 2.5 4.5 3 1.5-3 3-6
II/CCD, Area image intensifi er/charge coupled device; CsI/a-Si, cesium iodide/amorphous silicon fl at panel; CMOS, complementary metal oxide semiconductor; PST, proprietary Siemens Technology; AEC, automatic exposure control; min, minutes; cm, centimeter; s, seconds; No., number; DC, direct current; PD, photo diode; — , data unavailable at time of printing. Data current as of June 21, 2007.
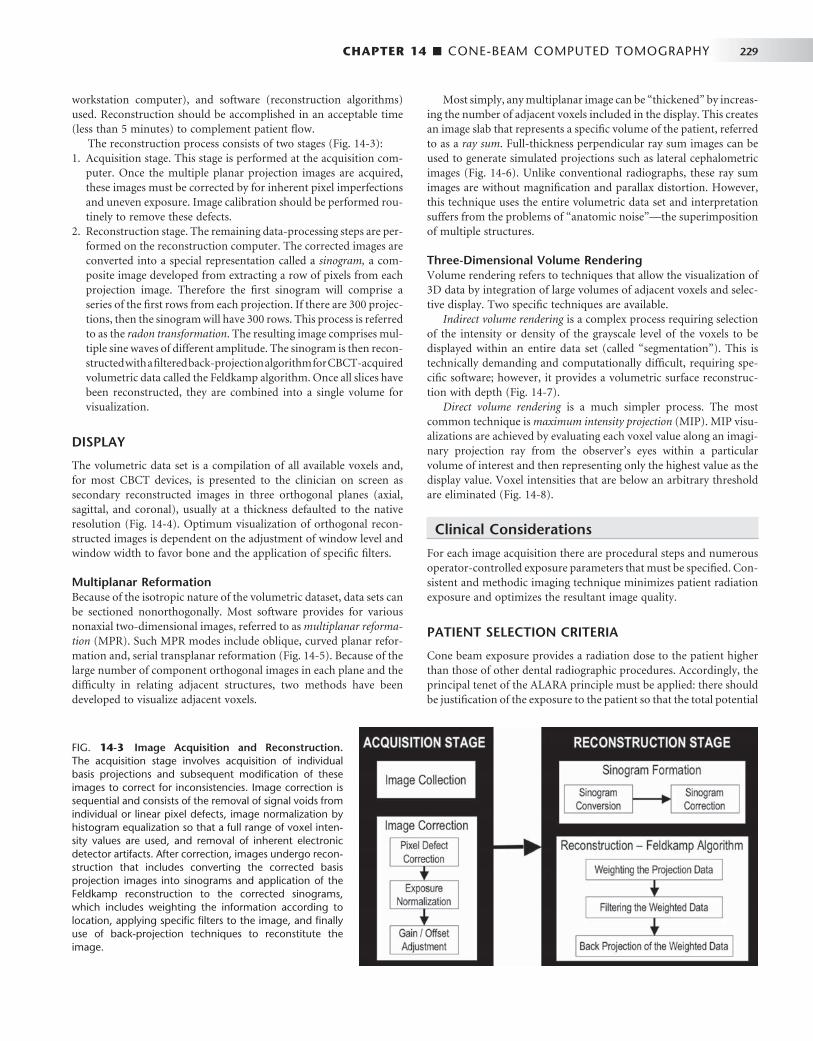
CHAPTER 14 ■ CONE-BEAM COMPUTED TOMOGRAPHY 229
workstation computer), and software (reconstruction algorithms) used. Reconstruction should be accomplished in an acceptable time (less than 5 minutes) to complement patient fl ow.
The reconstruction process consists of two stages ( Fig. 14-3 ): 1. Acquisition stage. This stage is performed at the acquisition com-
puter. Once the multiple planar projection images are acquired, these images must be corrected by for inherent pixel imperfections and uneven exposure. Image calibration should be performed rou-tinely to remove these defects.
2. Reconstruction stage. The remaining data-processing steps are per-formed on the reconstruction computer. The corrected images are converted into a special representation called a sinogram, a com-posite image developed from extracting a row of pixels from each projection image. Therefore the fi rst sinogram will comprise a series of the fi rst rows from each projection. If there are 300 projec-tions, then the sinogram will have 300 rows. This process is referred to as the radon transformation . The resulting image comprises mul-tiple sine waves of different amplitude. The sinogram is then recon-structed with a fi ltered back-projection algorithm for CBCT-acquired volumetric data called the Feldkamp algorithm. Once all slices have been reconstructed, they are combined into a single volume for visualization.
DISPLAY
The volumetric data set is a compilation of all available voxels and, for most CBCT devices, is presented to the clinician on screen as secondary reconstructed images in three orthogonal planes (axial, sagittal, and coronal), usually at a thickness defaulted to the native resolution ( Fig. 14-4 ). Optimum visualization of orthogonal recon-structed images is dependent on the adjustment of window level and window width to favor bone and the application of specifi c fi lters.
Multiplanar Reformation Because of the isotropic nature of the volumetric dataset, data sets can be sectioned nonorthogonally. Most software provides for various nonaxial two-dimensional images, referred to as multiplanar reforma-tion (MPR). Such MPR modes include oblique, curved planar refor-mation and, serial transplanar reformation ( Fig. 14-5 ). Because of the large number of component orthogonal images in each plane and the diffi culty in relating adjacent structures, two methods have been developed to visualize adjacent voxels.
Most simply, any multiplanar image can be “ thickened ” by increas-ing the number of adjacent voxels included in the display. This creates an image slab that represents a specifi c volume of the patient, referred to as a ray sum . Full-thickness perpendicular ray sum images can be used to generate simulated projections such as lateral cephalometric images ( Fig. 14-6 ). Unlike conventional radiographs, these ray sum images are without magnifi cation and parallax distortion. However, this technique uses the entire volumetric data set and interpretation suffers from the problems of “ anatomic noise ” — the superimposition of multiple structures.
Three-Dimensional Volume Rendering Volume rendering refers to techniques that allow the visualization of 3D data by integration of large volumes of adjacent voxels and selec-tive display. Two specifi c techniques are available.
Indirect volume rendering is a complex process requiring selection of the intensity or density of the grayscale level of the voxels to be displayed within an entire data set (called “ segmentation ” ). This is technically demanding and computationally diffi cult, requiring spe-cifi c software; however, it provides a volumetric surface reconstruc-tion with depth ( Fig. 14-7 ).
Direct volume rendering is a much simpler process. The most common technique is maximum intensity projection (MIP). MIP visu-alizations are achieved by evaluating each voxel value along an imagi-nary projection ray from the observer ’ s eyes within a particular volume of interest and then representing only the highest value as the display value. Voxel intensities that are below an arbitrary threshold are eliminated ( Fig. 14-8 ).
Clinical Considerations
For each image acquisition there are procedural steps and numerous operator-controlled exposure parameters that must be specifi ed. Con-sistent and methodic imaging technique minimizes patient radiation exposure and optimizes the resultant image quality.
PATIENT SELECTION CRITERIA
Cone beam exposure provides a radiation dose to the patient higher than those of other dental radiographic procedures. Accordingly, the principal tenet of the ALARA principle must be applied: there should be justifi cation of the exposure to the patient so that the total potential
FIG. 14-3 Image Acquisition and Reconstruction. The acquisition stage involves acquisition of individual basis projections and subsequent modifi cation of these images to correct for inconsistencies. Image correction is sequential and consists of the removal of signal voids from individual or linear pixel defects, image normalization by histogram equalization so that a full range of voxel inten-sity values are used, and removal of inherent electronic detector artifacts. After correction, images undergo recon-struction that includes converting the corrected basis projection images into sinograms and application of the Feldkamp reconstruction to the corrected sinograms, which includes weighting the information according to location, applying specifi c fi lters to the image, and fi nally use of back-projection techniques to reconstitute the image.
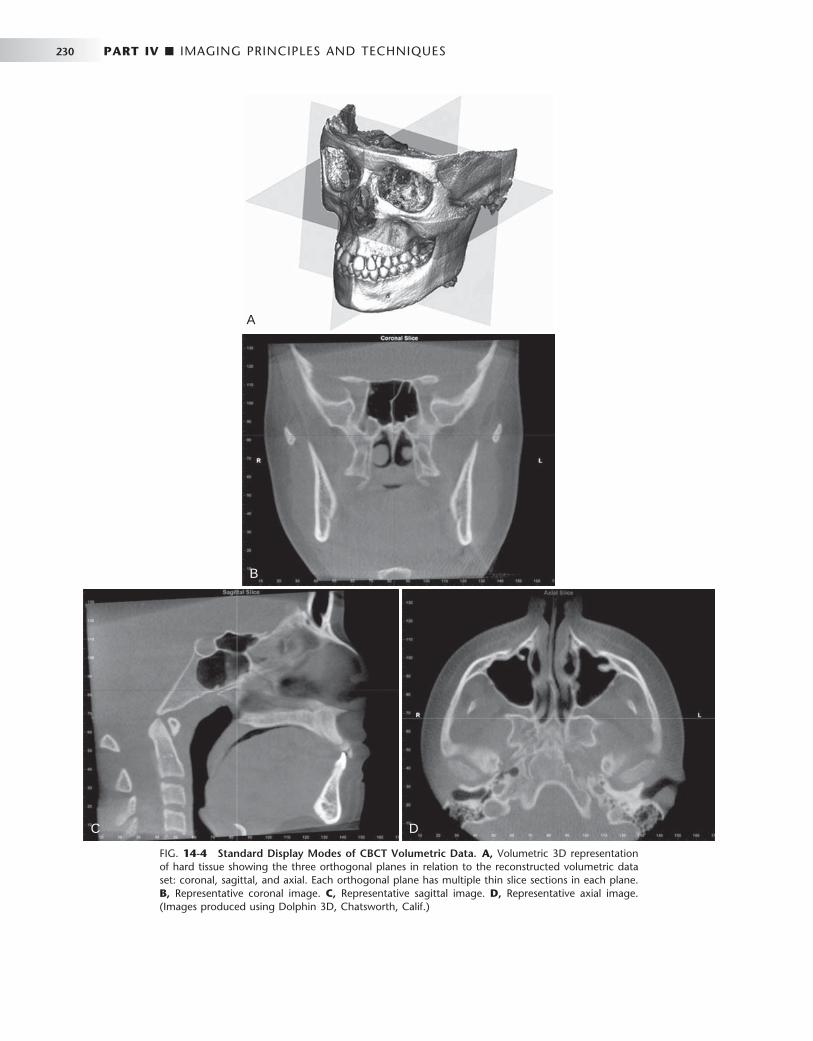
230 PART IV ■ IMAGING PRINCIPLES AND TECHNIQUES
A
B
C D
FIG. 14-4 Standard Display Modes of CBCT Volumetric Data. A, Volumetric 3D representation of hard tissue showing the three orthogonal planes in relation to the reconstructed volumetric data set: coronal, sagittal, and axial. Each orthogonal plane has multiple thin slice sections in each plane. B, Representative coronal image. C, Representative sagittal image. D, Representative axial image. (Images produced using Dolphin 3D, Chatsworth, Calif.)

CHAPTER 14 ■ CONE-BEAM COMPUTED TOMOGRAPHY 231
FIG. 14-5 Multiplanar Reformation. A thick axial image simulating an occlusal image (A) with an MPR oblique curved line (white solid) and resultant “ panoramic ” (B) and serial cross-sectional 1-mm-thick images (C) of a potential implant site in the lower left mandible. The axial and panoramic images are used as reference images to show the location of the cross-sectional images. The cross-sectional images demonstrate the amount of undercut and location of the inferior alveolar canal.
A
B
C
FIG. 14-6 Ray Sum Images. An axial projection (A) is used as the reference image. A section slice is identifi ed that, in this case, corresponds to the mid sagittal plane and the thickness of this increased to include both left and right sides of the volumetric data set. As the thickness of the “ slab ” increases, adjacent voxels representing elements such as air, bone, and soft tissues are added. The resultant image generated (B) from a full-thickness ray sum provides a simulated lateral cephalometric image.
A B
Fat
Bone
Muscle
Bone
Air
Addition of voxel gray values

232 PART IV ■ IMAGING PRINCIPLES AND TECHNIQUES
FIG. 14-7 3D Volumetric Surface Rendering. Manual segmentation is often accomplished by an adjustable scale determining the upper and lower limit and range of intensity values to include in the segmentation. The visual result of changes in this scale is displayed in “ real time ” so that the effects of incremental changes can be visualized. The segmentation may be optimized to reveal the objects of interest including (A) bone as a solid surface or shaded surface display, (B) bone and the dentition under the bone as a transparency using volumetric imaging, or (C) bone, the dentition, and the soft tissue surface using volumetric imaging. (Segmentation performed with Dolphin 3D, Chatsworth, Calif.)
A B C
FIG. 14-8 Maximum Intensity Projection. This method produces a “ pseudo ” 3D image by evaluat-ing each voxel value along an imaginary projection ray from the observer ’ s eyes within the data set and then representing only the highest value as the display value. In this example, an axial projection (A) is used as the reference image. A projection ray is identifi ed throughout the entire volumetric data set along which individual voxels are identifi ed, each with varying grayscale intensity correspond-ing to various tissue densities such as fat, muscle, air, and bone. The MIP algorithm selects only those values along the projection ray that have the highest values (usually corresponding to bone) and rep-resents this as only one pixel on the resultant image (B).
A B
CHAPTER 14 ■ CONE-BEAM COMPUTED TOMOGRAPHY 233
diagnostic benefi ts are greater than the individual detriment radiation exposure might cause. Currently CBCT is most commonly used in the assessment of pathologic conditions and structural maxillofacial deformity, the preoperative assessment of orthodontics, and in the assessment of available bone for implant placement. It is advisable that the indication for the CBCT examination be documented by entry in the patient ’ s chart or on the written request or prescriptive order for the CBCT examination.
PATIENT PREPARATION
Patients should be escorted into the scanner unit and before head stabilization provided with appropriate personal radiation barrier protection. Although the mandatory use of these devices is regulated by regional (state) or federal legislation, it is recommended that at least a leaded torso apron be applied correctly (above the collar) to the patient. This is particularly advisable for pregnant patients and for children. It is highly recommended that a lead thyroid collar also be used, provided that this will not interfere with the scan, to reduce thyroid exposure.
Each CBCT unit has a unique method of head stabilization, varying from chin cups to posterior or lateral head supports to head restraints. Patient motion can be minimized by application of one or more methods simultaneously. Image quality is severely degraded by head movement, so it is important to obtain patient compliance.
Alignment of the area of interest with the x-ray beam is critical in imaging the appropriate fi eld, thereby reducing patient radiation exposure and optimizing image quality by reducing scattered radia-tion. Often facial topographic reference planes (e.g., the mid sagittal plane, Frankfort horizontal) or internal references (e.g., occlusal plane, palatal plane) are adjusted to coincide or be aligned with exter-nal laser lights to position the patient correctly.
Immediately before the scan, the patient should be asked to remove all metallic objects form the head and neck areas. This includes eyeglasses, jewelry (including earrings and piercings), and metallic partial dentures. It is not necessary to remove plastic completely removable prostheses. Unless specifi cally indicated otherwise (e.g., closed temporomandibular [ TMJ ] views or orthodontic views), it is desirable that the dentition be separated but held together fi rmly during the scan. This can be performed with a tongue depressor or cotton rolls. Separation of the teeth is particularly useful in single arch scans where scatter from metallic restorations in the opposing arch can be reduced. The patient should be directed to remain as still as possible before exposure, to breathe slowly through the nose, and to close the eyes. This latter suggestion reduces the possibility of the patient moving as a result of following the detector as it passes in front of the face.
IMAGING PROTOCOL
An imaging protocol is a set of technical exposure parameters for CBCT dependent on the specifi ed purpose of the examination. An imaging protocol is developed to produce images of optimal quality with the least amount of radiation exposure to the patient. For specifi c cone beam units, manufacturer-provided imaging protocols are usually available. Most commonly they involve modifi cations in imaging fi eld, number of basis projections, and voxel resolution. Operators should be aware of the effects of all parameters on image quality and patient dose when choosing imaging protocols.
Voxel Size The voxel size with which projection images are acquired varies from manufacturer to manufacturer principally on the basis of the matrix size of the detector and projection geometry. In addition, CBCT units may offer a selection of voxel sizes. For these choices the image detector collects information over a series of pixels in the horizontal and verti-cal directions and averages the data. This collation or pixel binning results in a substantial reduction in data processing, reducing second-ary reconstruction times. Therefore voxel size should be specifi ed as either acquisition or reconstruction. Generally, decreasing voxel size increases spatial resolution, but because of the pixel fi ll factor of a par-ticular fl at panel, a higher radiation dose may be required.
Scan Time and Number of Projections Adjusting the frame rate to increase the number of basis image projec-tions provides reconstructed images with fewer artifacts and better image quality ( Fig. 14-9 ). However, increasing the number of projec-tions increases patient radiation exposure proportionately.
Scanning Trajectory Reconstructed images from incomplete, limited, or truncated scan-ning trajectories may suffer from strong limited-angle artifacts because of missing information. Images created with incomplete scanning arcs suffer from greater peripheral unidirectional streaking artifacts and more pronounced mid plane cupping and photon starvation artifacts. Missing data can be somewhat compensated for with a number of approaches, including use of statistical knowledge of the patient ’ s anatomy and use of a number of algorithm projection completion techniques.
Field of View Collimation of the CBCT primary x-ray beam enables limitation of the x radiation to the area of interest. This functionality provides dose savings by limiting the irradiation fi eld to fi t the fi eld of view (FOV), with a reduced exposure dose to the patient and improved image quality because of reduced scattered radiation (see Fig. 14-9 ).
IMAGE OPTIMIZATION
Most programs offer the user means to adjust brightness, contrast, and edge sharpening. To optimize image presentation and facilitate diagnosis, it is necessary to adjust contrast (window) and brightness (level) parameters to favor bony structures. Great variability exists in cone beam imaging between CBCT units and within the same unit depending on the number of scans performed. Although CBCT pro-prietary software may provide for window/level presets, it is advisable that this be adjusted for each scan. After these parameters are set, further enhancements can be performed by the application of sharp-ening, fi ltering, and edge algorithms. The use of these functions must be weighed against the visual effects of increased noise in the image ( Fig. 14-10 ).
REPORTS
Cone-beam imaging comprises not only the technical component of patient exposure but a responsibility for interpreting the resultant volumetric data set. Documentation of an imaging examination is an important part of a patient ’ s medical record. The mechanics of image reporting include the development of a series of images formatted to display the condition/region appropriately (image report) and a

234 PART IV ■ IMAGING PRINCIPLES AND TECHNIQUES
FIG. 14-9 Pictorial Plot of the Effect of Number of Basis Projection Images and Size of FOV on Image Quality. Increasing number of projections in one 360-degree scan (x-axis) provides more data and reduces image noise; however, it increases patient dose proportionately. Reducing the number of projections creates undersampling and produces streaks. Minimizing the FOV reduces patient exposure and resultant scatter radiation and decreases image noise.
FIG. 14-10 Effect of Image Enhancement on CBCT Images. The visual effect of three sequential adjustments on corrected MPR cross-sectional images. A, Default image after interpolation algorithm — smoothens edges of cortical bone but adds blur to high-contrast structures. B, Adjustment of window level and width to bone preset (W/L: 3000/500). C, Addition of mild sharpen algorithm. (Images captured with i-CAT, ISI, Hatfi eld, Pa, created with XoranCat software, Xoran Technologies, Inc., Ann Arbor, Mich.)
A B C
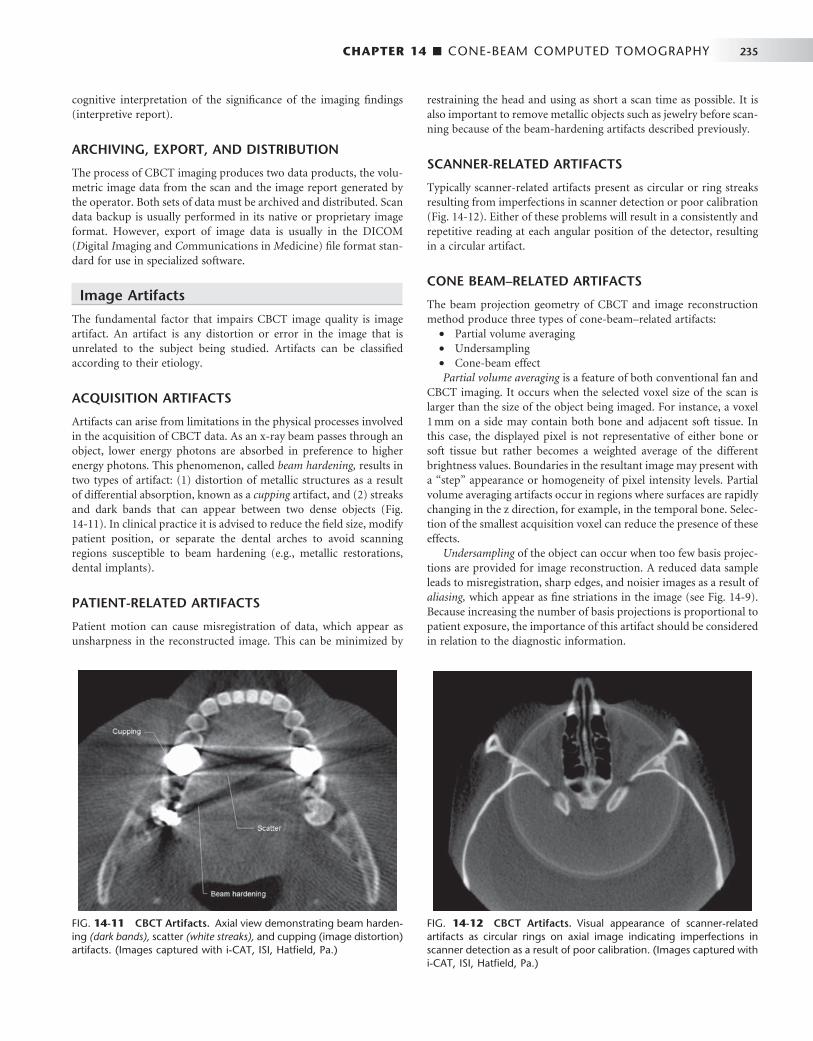
CHAPTER 14 ■ CONE-BEAM COMPUTED TOMOGRAPHY 235
cognitive interpretation of the signifi cance of the imaging fi ndings (interpretive report).
ARCHIVING, EXPORT, AND DISTRIBUTION
The process of CBCT imaging produces two data products, the volu-metric image data from the scan and the image report generated by the operator. Both sets of data must be archived and distributed. Scan data backup is usually performed in its native or proprietary image format. However, export of image data is usually in the DICOM ( D igital I maging and Co mmunications in M edicine) fi le format stan-dard for use in specialized software.
Image Artifacts
The fundamental factor that impairs CBCT image quality is image artifact. An artifact is any distortion or error in the image that is unrelated to the subject being studied. Artifacts can be classifi ed according to their etiology.
ACQUISITION ARTIFACTS
Artifacts can arise from limitations in the physical processes involved in the acquisition of CBCT data. As an x-ray beam passes through an object, lower energy photons are absorbed in preference to higher energy photons. This phenomenon, called beam hardening, results in two types of artifact: (1) distortion of metallic structures as a result of differential absorption, known as a cupping artifact, and (2) streaks and dark bands that can appear between two dense objects ( Fig. 14-11 ). In clinical practice it is advised to reduce the fi eld size, modify patient position, or separate the dental arches to avoid scanning regions susceptible to beam hardening (e.g., metallic restorations, dental implants).
PATIENT-RELATED ARTIFACTS
Patient motion can cause misregistration of data, which appear as unsharpness in the reconstructed image. This can be minimized by
restraining the head and using as short a scan time as possible. It is also important to remove metallic objects such as jewelry before scan-ning because of the beam-hardening artifacts described previously.
SCANNER-RELATED ARTIFACTS
Typically scanner-related artifacts present as circular or ring streaks resulting from imperfections in scanner detection or poor calibration ( Fig. 14-12 ). Either of these problems will result in a consistently and repetitive reading at each angular position of the detector, resulting in a circular artifact.
CONE BEAM – RELATED ARTIFACTS
The beam projection geometry of CBCT and image reconstruction method produce three types of cone-beam – related artifacts:
• Partial volume averaging • Undersampling • Cone-beam effect Partial volume averaging is a feature of both conventional fan and
CBCT imaging. It occurs when the selected voxel size of the scan is larger than the size of the object being imaged. For instance, a voxel 1 mm on a side may contain both bone and adjacent soft tissue. In this case, the displayed pixel is not representative of either bone or soft tissue but rather becomes a weighted average of the different brightness values. Boundaries in the resultant image may present with a “ step ” appearance or homogeneity of pixel intensity levels. Partial volume averaging artifacts occur in regions where surfaces are rapidly changing in the z direction, for example, in the temporal bone. Selec-tion of the smallest acquisition voxel can reduce the presence of these effects.
Undersampling of the object can occur when too few basis projec-tions are provided for image reconstruction. A reduced data sample leads to misregistration, sharp edges, and noisier images as a result of aliasing, which appear as fi ne striations in the image (see Fig. 14-9 ). Because increasing the number of basis projections is proportional to patient exposure, the importance of this artifact should be considered in relation to the diagnostic information.
FIG. 14-11 CBCT Artifacts. Axial view demonstrating beam harden-ing (dark bands), scatter (white streaks), and cupping (image distortion) artifacts. (Images captured with i-CAT, ISI, Hatfi eld, Pa.)
FIG. 14-12 CBCT Artifacts. Visual appearance of scanner-related artifacts as circular rings on axial image indicating imperfections in scanner detection as a result of poor calibration. (Images captured with i-CAT, ISI, Hatfi eld, Pa.)
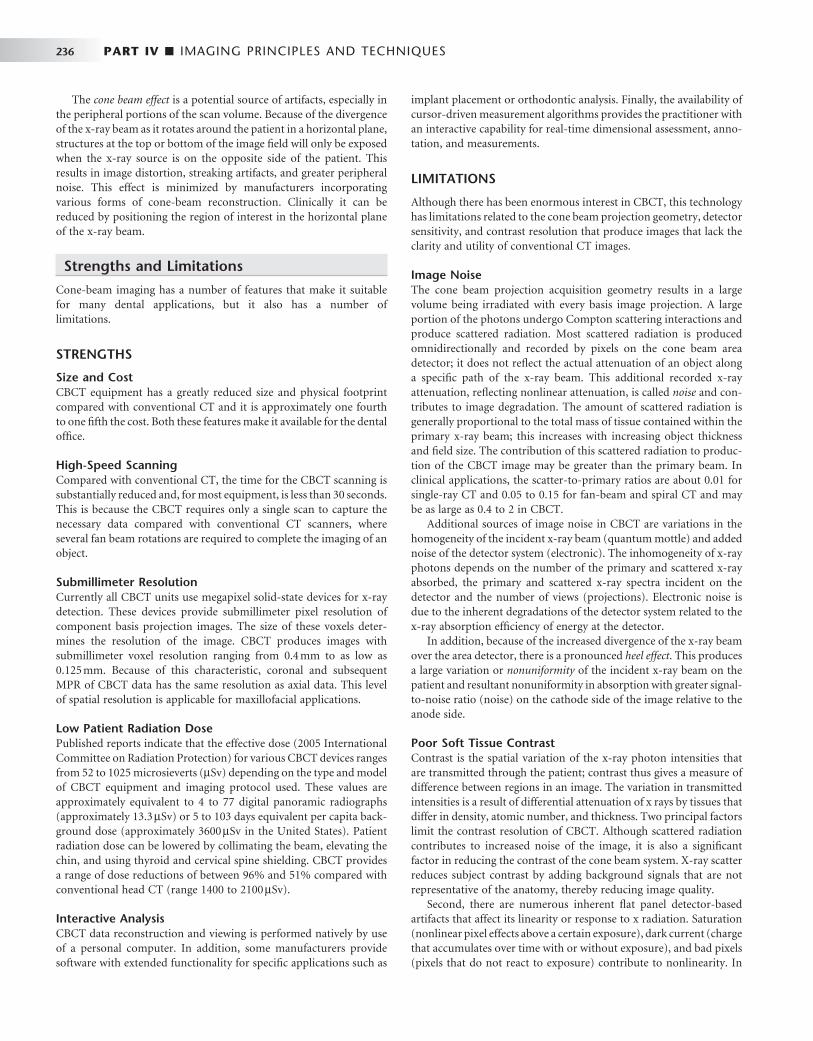
236 PART IV ■ IMAGING PRINCIPLES AND TECHNIQUES
The cone beam effect is a potential source of artifacts, especially in the peripheral portions of the scan volume. Because of the divergence of the x-ray beam as it rotates around the patient in a horizontal plane, structures at the top or bottom of the image fi eld will only be exposed when the x-ray source is on the opposite side of the patient. This results in image distortion, streaking artifacts, and greater peripheral noise. This effect is minimized by manufacturers incorporating various forms of cone-beam reconstruction. Clinically it can be reduced by positioning the region of interest in the horizontal plane of the x-ray beam.
Strengths and Limitations
Cone-beam imaging has a number of features that make it suitable for many dental applications, but it also has a number of limitations.
STRENGTHS
Size and Cost CBCT equipment has a greatly reduced size and physical footprint compared with conventional CT and it is approximately one fourth to one fi fth the cost. Both these features make it available for the dental offi ce.
High-Speed Scanning Compared with conventional CT, the time for the CBCT scanning is substantially reduced and, for most equipment, is less than 30 seconds. This is because the CBCT requires only a single scan to capture the necessary data compared with conventional CT scanners, where several fan beam rotations are required to complete the imaging of an object.
Submillimeter Resolution Currently all CBCT units use megapixel solid-state devices for x-ray detection. These devices provide submillimeter pixel resolution of component basis projection images. The size of these voxels deter-mines the resolution of the image. CBCT produces images with submillimeter voxel resolution ranging from 0.4 mm to as low as 0.125 mm. Because of this characteristic, coronal and subsequent MPR of CBCT data has the same resolution as axial data. This level of spatial resolution is applicable for maxillofacial applications.
Low Patient Radiation Dose Published reports indicate that the effective dose (2005 International Committee on Radiation Protection) for various CBCT devices ranges from 52 to 1025 microsieverts ( μ Sv) depending on the type and model of CBCT equipment and imaging protocol used. These values are approximately equivalent to 4 to 77 digital panoramic radiographs (approximately 13.3 μ Sv) or 5 to 103 days equivalent per capita back-ground dose (approximately 3600 μ Sv in the United States). Patient radiation dose can be lowered by collimating the beam, elevating the chin, and using thyroid and cervical spine shielding. CBCT provides a range of dose reductions of between 96% and 51% compared with conventional head CT (range 1400 to 2100 μ Sv).
Interactive Analysis CBCT data reconstruction and viewing is performed natively by use of a personal computer. In addition, some manufacturers provide software with extended functionality for specifi c applications such as
implant placement or orthodontic analysis. Finally, the availability of cursor-driven measurement algorithms provides the practitioner with an interactive capability for real-time dimensional assessment, anno-tation, and measurements.
LIMITATIONS
Although there has been enormous interest in CBCT, this technology has limitations related to the cone beam projection geometry, detector sensitivity, and contrast resolution that produce images that lack the clarity and utility of conventional CT images.
Image Noise The cone beam projection acquisition geometry results in a large volume being irradiated with every basis image projection. A large portion of the photons undergo Compton scattering interactions and produce scattered radiation. Most scattered radiation is produced omnidirectionally and recorded by pixels on the cone beam area detector; it does not refl ect the actual attenuation of an object along a specifi c path of the x-ray beam. This additional recorded x-ray attenuation, refl ecting nonlinear attenuation, is called noise and con-tributes to image degradation. The amount of scattered radiation is generally proportional to the total mass of tissue contained within the primary x-ray beam; this increases with increasing object thickness and fi eld size. The contribution of this scattered radiation to produc-tion of the CBCT image may be greater than the primary beam. In clinical applications, the scatter-to-primary ratios are about 0.01 for single-ray CT and 0.05 to 0.15 for fan-beam and spiral CT and may be as large as 0.4 to 2 in CBCT.
Additional sources of image noise in CBCT are variations in the homogeneity of the incident x-ray beam (quantum mottle) and added noise of the detector system (electronic). The inhomogeneity of x-ray photons depends on the number of the primary and scattered x-ray absorbed, the primary and scattered x-ray spectra incident on the detector and the number of views (projections). Electronic noise is due to the inherent degradations of the detector system related to the x-ray absorption effi ciency of energy at the detector.
In addition, because of the increased divergence of the x-ray beam over the area detector, there is a pronounced heel effect . This produces a large variation or nonuniformity of the incident x-ray beam on the patient and resultant nonuniformity in absorption with greater signal-to-noise ratio (noise) on the cathode side of the image relative to the anode side.
Poor Soft Tissue Contrast Contrast is the spatial variation of the x-ray photon intensities that are transmitted through the patient; contrast thus gives a measure of difference between regions in an image. The variation in transmitted intensities is a result of differential attenuation of x rays by tissues that differ in density, atomic number, and thickness. Two principal factors limit the contrast resolution of CBCT. Although scattered radiation contributes to increased noise of the image, it is also a signifi cant factor in reducing the contrast of the cone beam system. X-ray scatter reduces subject contrast by adding background signals that are not representative of the anatomy, thereby reducing image quality.
Second, there are numerous inherent fl at panel detector-based artifacts that affect its linearity or response to x radiation. Saturation (nonlinear pixel effects above a certain exposure), dark current (charge that accumulates over time with or without exposure), and bad pixels (pixels that do not react to exposure) contribute to nonlinearity. In

CHAPTER 14 ■ CONE-BEAM COMPUTED TOMOGRAPHY 237
addition, the sensitivity of different regions of the panel to radiation (pixel-to-pixel gain variation) may not be uniform over the entire region.
Specifi c Applications in Dentistry
CBCT technology has had a substantial impact on maxillofacial imaging. It has been applied to diagnosis in all areas of dentistry and is now expanding into treatment applications. CBCT should not be considered a replacement for panoramic or conventional projection radiographic applications but rather as a complementary modality for specifi c applications.
IMPLANT SITE ASSESSMENT
Perhaps the greatest impact of CBCT has been on the planning of dental implant placements. CBCT provides cross-sectional images of the alveolar bone height, width, and angulation and accurately depicts vital structures such as the inferior alveolar dental nerve canal in the mandible or the sinus in the maxilla. The most useful series of images for implant site assessment include the axial, reformatted panoramic, and serial transplanar images at the specifi c location ( Fig. 14-13 ). In many instances a diagnostic stent is made with radiographic markers and inserted at the time of the scan ( Fig. 14-14 ). This provides a precise reference of the location of the proposed implants or teeth.
FIG. 14-13 CBCT for Implant Site Assessment. A curved planar MPR is accomplished by aligning the long axis of the imaging plane with the dental arch (A), providing a region panorama-like thin-slice image (B). In addition, serial thin-slice transplanar images are often generated (C), useful in the assessment of specifi c morphologic features such as the location of the inferior alveolar canal (shown with a white dot ) for implant site assessment and for allowing measurement of the available alveolar bone height and width. (Images captured and created with Newtom 3G, AFP Imaging Corp., Elmsford, N.Y.)
A B
C
DICOM data can be imported into third-party software applications that provide many useful tools that can be used to assess and plan both the surgical and prosthetic components of implant therapy. In addition, the data set may then be used to construct a surgical implant guidance stent to facilitate the precise placement of implants.
ORTHODONTICS AND THREE-DIMENSIONAL CEPHALOMETRY
CBCT imaging is being used in the diagnosis, assessment, and analysis of maxillofacial orthodontic and orthopedic anomalies. CBCT pro-vides display of the position of impacted and supernumerary teeth and their relationships to adjacent roots or other anatomic structures. This facilitates surgical exposure and planning of subsequent move-ment. Also, information regarding palatal morphologic features and dimensions, tooth inclination and torque, root resorption, and avail-able alveolar bone width for buccolingual movement of teeth can be obtained. CBCT also provides adequate visualization of the TMJ, the pharyngeal airway space, and soft tissue relationships.
Perhaps the greatest potential use of CBCT in orthodontics is that it is capable of providing both conventional two- and three-dimensional cephalometric images in one acquisition. CBCT data sets can be manipulated by the ray sum technique to generate simulated panoramic, lateral, submentovertex, and posteroanterior

238 PART IV ■ IMAGING PRINCIPLES AND TECHNIQUES
FIG. 14-14 Use of a Diagnostic Stent. Stents provide fi ducial radiographic landmarks that can be used to correlate proposed clinical location and angulation of implants with the available alveolar bone. The panoramic projection (A) provides an overview of location, whereas serial cross-sectional images (B) indicate alveolar bone height. In this example, the four transplanar images of the maxillary right canine region indicate that the proposed placement is too far buccal and too perpendicular to engage the available bone. (Images captured with i-CAT, ISI, Hatfi eld, Pa, created with XoranCat soft-ware, Xoran Technologies, Inc., Ann Arbor, Mich.)
A
B
cephalometric images ( Fig. 14-15 ). Alternatively, it is possible to extract the topographic features of the skull and air/soft tissue inter-faces in high detail by using a variety of orthodontic-centered prod-ucts. There are numerous potential benefi ts to 3D cephalometry including accuracy of linear measurements, visual demonstration of dentoskeletal relationships and facial esthetics, and the potential for assessment of growth and development ( Fig. 14-16 ).
LOCALIZATION OF THE INFERIOR ALVEOLAR CANAL
The relationship of the inferior alveolar canal to the roots of man-dibular third molar teeth is of importance when attempting to mini-mize the likelihood of nerve damage that may lead to permanent loss of sensation to one side to the lower lip. Thus accurate assessment of the position of the canal in relation to the impacted third molar may reduce injuries to this nerve. Traditional panoramic imaging may be adequate when the third molar is clear of the canal, but in the case of radiographic superimposition it is advisable to use a 3D imaging approach. This can be achieved at comparatively low radiation dose with CBCT combined either with the proprietary software accompa-nying the imaging device or with a third-party diagnostic software ( Fig. 14-17 ).
TEMPOROMANDIBULAR JOINT
CBCT provides multiplanar and potentially 3D images of the condyle and surrounding structures to facilitate analysis and diagnosis of bone morphologic features, joint space and dynamic function, critical keys to providing appropriate treatment outcomes in patients with TMJ signs and symptoms. Imaging can depict the features of degenerative joint disease ( Fig. 14-18 ), developmental anomalies of the condyle, ankylosis,
and rheumatoid arthritic disease. Appropriate imaging protocols should include reformatted panoramic and axial reference images, cor-rected parasagittal and paracoronal transerial slices, and for those cases in which asymmetry or surgery is contemplated, 3D reconstructions.
CONDITIONS OF THE MAXILLOFACIAL COMPLEX
CBCT can assist in the assessment of many conditions of the jaws, most notably dental conditions such as impacted canines and super-numerary teeth, fractured or split teeth, periapical lesions, and peri-odontal disease ( Fig. 14-19 ). Benign calcifi cations (e.g., tonsilloliths, lymph nodes, salivary gland stones) can also be identifi ed by location and differentiated from potentially signifi cant calcifi cations of the arteries such as carotid artery calcifi cations or veins (e.g., phleboliths). Although CBCT does not provide suitable soft tissue contrast to dis-tinguish the contents of paranasal opacifi cations, the morphologic characteristics and extent of these lesions are particularly well seen (e.g., mucous extravasation cyst).
Most important, the location, size, shape, extent, and full involve-ment of jaw conditions can be visualized with a combination of two- and three-dimensional images. CBCT has been found to be particularly useful for trauma ( Fig. 14-20 ) and for visualizing the extent and degree of involvement of osteomyelitis.
RAPID PROTOTYPING
Rapid prototyping (RP) is broad term used to describe a group of related processes and techniques that are used to fabricate physical scale models directly from 3D computer-assisted design data. The purpose of RP in maxillofacial imaging is to create a life-size, dimen-sionally accurate model of an anatomic structure. These models are

FIG. 14-15 Two-dimensional Projec-tions Generated with Cone Beam Data Set. This patient had an asymmetry of one side of the face. Ray sum refo rmation of the CBCT data was performed to provide multiple conventional images such as the lateral cephalometric (A), frontal cephalometric or posteroanterior (B), and panoramic (C) projections. (Images generated with Dolphin 3D, Chatsworth, Calif.)
A B
C
FIG. 14-16 Fusion. 3D anatomic views demonstrating imaging possibilities with fusion of CBCT data and photographic image sets. (Images created with 3DMD, Atlanta, Ga. courtesy Dr. Chester Wang).
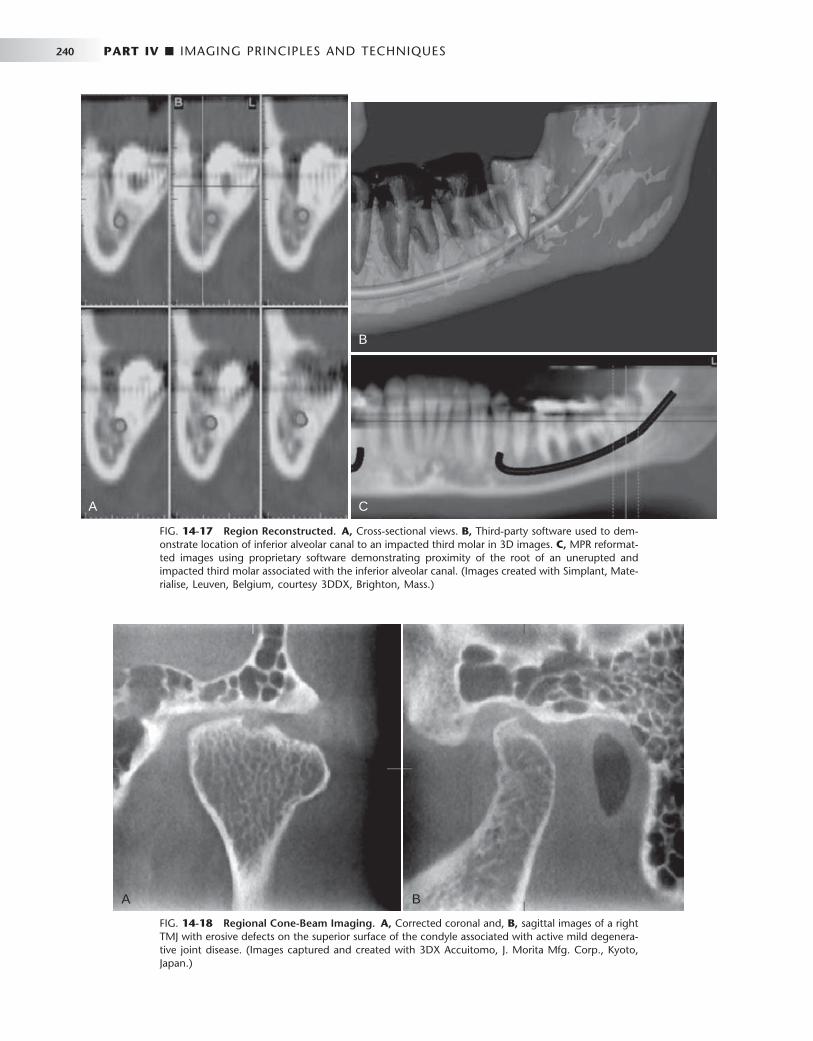
240 PART IV ■ IMAGING PRINCIPLES AND TECHNIQUES
FIG. 14-17 Region Reconstructed. A, Cross-sectional views. B, Third-party software used to dem-onstrate location of inferior alveolar canal to an impacted third molar in 3D images. C, MPR reformat-ted images using proprietary software demonstrating proximity of the root of an unerupted and impacted third molar associated with the inferior alveolar canal. (Images created with Simplant, Mate-rialise, Leuven, Belgium, courtesy 3DDX, Brighton, Mass.)
A
B
C
FIG. 14-18 Regional Cone-Beam Imaging. A, Corrected coronal and, B, sagittal images of a right TMJ with erosive defects on the superior surface of the condyle associated with active mild degenera-tive joint disease. (Images captured and created with 3DX Accuitomo, J. Morita Mfg. Corp., Kyoto, Japan.)
A B
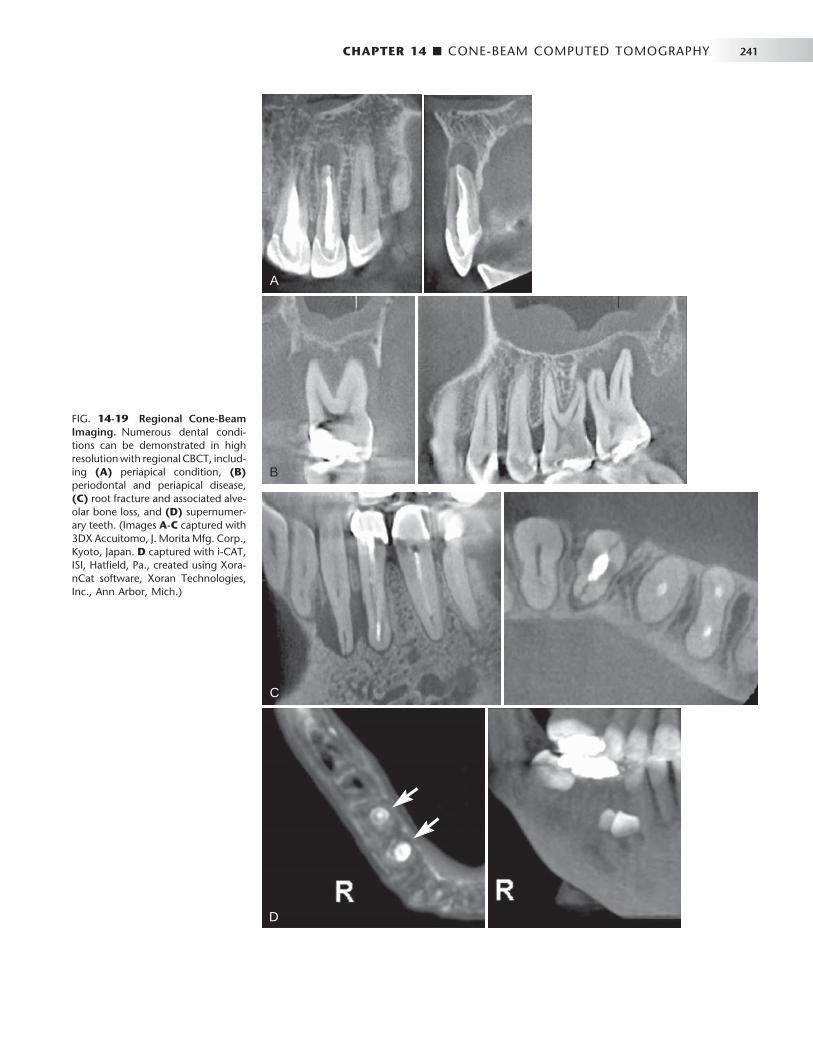
CHAPTER 14 ■ CONE-BEAM COMPUTED TOMOGRAPHY 241
FIG. 14-19 Regional Cone-Beam Imaging. Numerous dental condi-tions can be demonstrated in high resolution with regional CBCT, includ-ing (A) periapical condition, (B) periodontal and periapical disease, (C) root fracture and associated alve-olar bone loss, and (D) supernumer-ary teeth. (Images A-C captured with 3DX Accuitomo, J. Morita Mfg. Corp., Kyoto, Japan. D captured with i-CAT, ISI, Hatfi eld, Pa., created using Xora-nCat software, Xoran Technologies, Inc., Ann Arbor, Mich.)
C
D
A
B
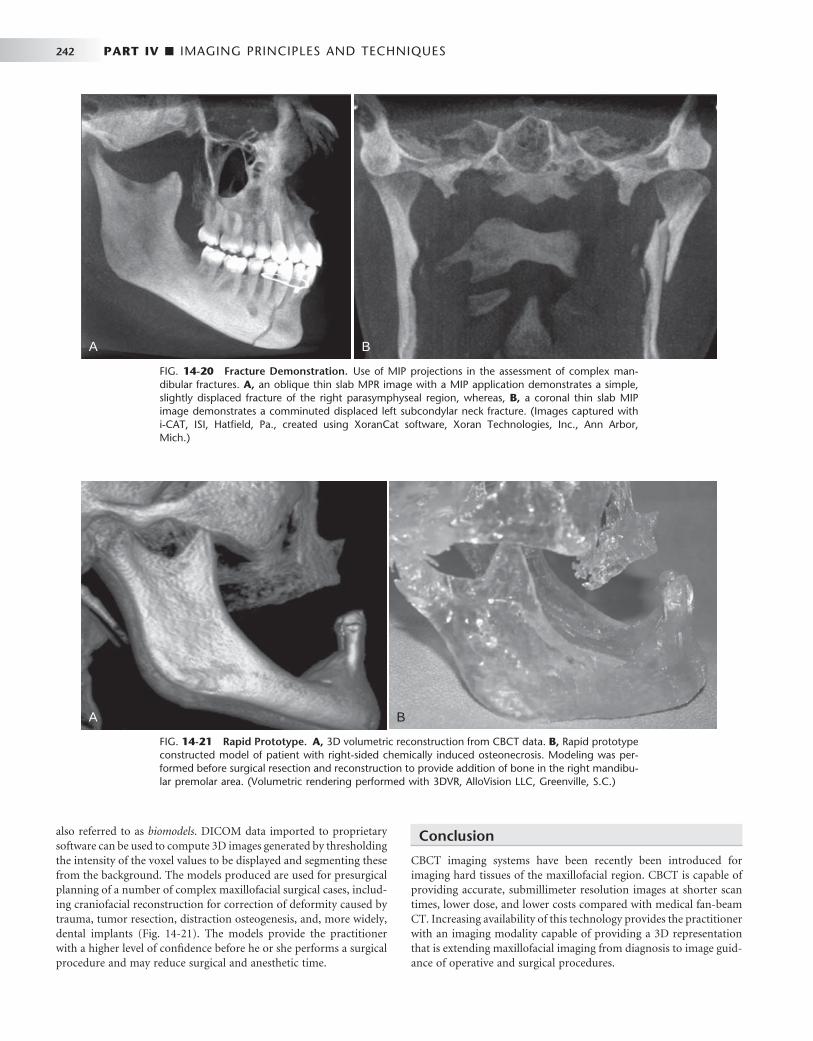
242 PART IV ■ IMAGING PRINCIPLES AND TECHNIQUES
FIG. 14-20 Fracture Demonstration. Use of MIP projections in the assessment of complex man-dibular fractures. A, an oblique thin slab MPR image with a MIP application demonstrates a simple, slightly displaced fracture of the right parasymphyseal region, whereas, B, a coronal thin slab MIP image demonstrates a comminuted displaced left subcondylar neck fracture. (Images captured with i-CAT, ISI, Hatfi eld, Pa., created using XoranCat software, Xoran Technologies, Inc., Ann Arbor, Mich.)
A B
also referred to as biomodels . DICOM data imported to proprietary software can be used to compute 3D images generated by thresholding the intensity of the voxel values to be displayed and segmenting these from the background. The models produced are used for presurgical planning of a number of complex maxillofacial surgical cases, includ-ing craniofacial reconstruction for correction of deformity caused by trauma, tumor resection, distraction osteogenesis, and, more widely, dental implants ( Fig. 14-21 ). The models provide the practitioner with a higher level of confi dence before he or she performs a surgical procedure and may reduce surgical and anesthetic time.
Conclusion
CBCT imaging systems have been recently been introduced for imaging hard tissues of the maxillofacial region. CBCT is capable of providing accurate, submillimeter resolution images at shorter scan times, lower dose, and lower costs compared with medical fan-beam CT. Increasing availability of this technology provides the practitioner with an imaging modality capable of providing a 3D representation that is extending maxillofacial imaging from diagnosis to image guid-ance of operative and surgical procedures.
FIG. 14-21 Rapid Prototype. A, 3D volumetric reconstruction from CBCT data. B, Rapid prototype constructed model of patient with right-sided chemically induced osteonecrosis. Modeling was per-formed before surgical resection and reconstruction to provide addition of bone in the right mandibu-lar premolar area. (Volumetric rendering performed with 3DVR, AlloVision LLC, Greenville, S.C.)
A B

CHAPTER 14 ■ CONE-BEAM COMPUTED TOMOGRAPHY 243
BIBLIOGRAPHY
RADIATION DOSE
1 Dula K , Mini R , van der Stelt PF et al : Hypothetical mortality risk associated with spiral computed tomography of the maxilla and mandible , Eur J Oral Sci 104 : 503 - 510 , 1996 .
2 Ludlow JB , Davies-Ludlow LE , Brooks SL : Dosimetry of two extraoral direct digital imaging devices: NewTom cone beam CT and Orthophos Plus DS panoramic unit , Dentomaxillofac Radiol 32 : 229 - 234 , 2003 .
3 Ludlow JB , Davies-Ludlow LE , Brooks SL et al : Dosimetry of 3 CBCT devices for oral and maxillofacial radiology: CB Mercuray, NewTom 3G and i-CAT , Dentomaxillofac Radiol 35 : 219 - 226 , 2006 [ erratum in Dentomaxillofac Radiol 35:392, 2006 ] .
4 Mah JK , Danforth RA , Bumann A et al : Radiation absorbed in maxillofacial imaging with a new dental computed tomography device , Oral Surg Oral Med Oral Pathol Oral Radiol Endod 96 : 508 - 513 , 2003 .
5 Nakajima A , Sameshima GT , Arai Y et al : Two- and three-dimensional orthodontic imaging using limited cone beam-computed tomography , Angle Orthod 75 : 895 - 903 , 2005 .
6 Schulze D , Heiland M , Thurmann H et al : Radiation exposure during midfacial imaging using 4- and 16-slice computed tomography, cone beam computed tomography systems and conventional radiography , Dentomaxillofac Radiol 33 : 83 - 86 , 2004 .
IMAGE RECONSTRUCTION
7 Endo M , Tsunoo T , Nakamori N et al : Effect of scattered radiation on image noise in cone beam CT , Med Phys 28 : 469 - 474 , 2001 .
8 Feldkamp LA , Davis LC , Kress JW : Practical cone-beam algorithm , J Opt Soc Am 1 : 612 - 619 , 1984 .
9 Siewerdsen JH , Jaffray DA : Cone-beam computed tomography with a fl at-panel imager: magnitude and effects of x-ray scatter , Med Phys 28 : 220 - 231 , 2001 .
CLINICAL APPLICATIONS
10 Cotton TP , Geisler TM , Holden DT et al : Endodontic applications of cone-beam volumetric tomography , J Endod 33 : 1121 - 1132 , 2007 .
11 D ’ Urso PS , Barker TM , Earwaker WJ et al : Stereolithography biomodelling in cranio-maxillofacial surgery: a prospective trial , J Craniomaxillofac Surg 27 : 30 - 37 , 1999 .
12 Holberg C , Steinhauser S , Geis P et al : Cone-beam computed tomography in orthodontics: benefi ts and limitations , J Orofacac Orthop 66 : 434 - 444 , 2005 .
13 Scarfe WC , Farman AG , Sukovic P : Clinical applications of cone-beam computed tomography in dental practice , J Can Dent Assoc 72 : 75 - 80 , 2006 .
14 Swennen GR , Schutyser F : Three-dimensional cephalometry: spiral multi-slice vs cone-beam computed tomography , Am J Orthod Dentofacial Orthop 130 : 410 - 416 , 2006 .
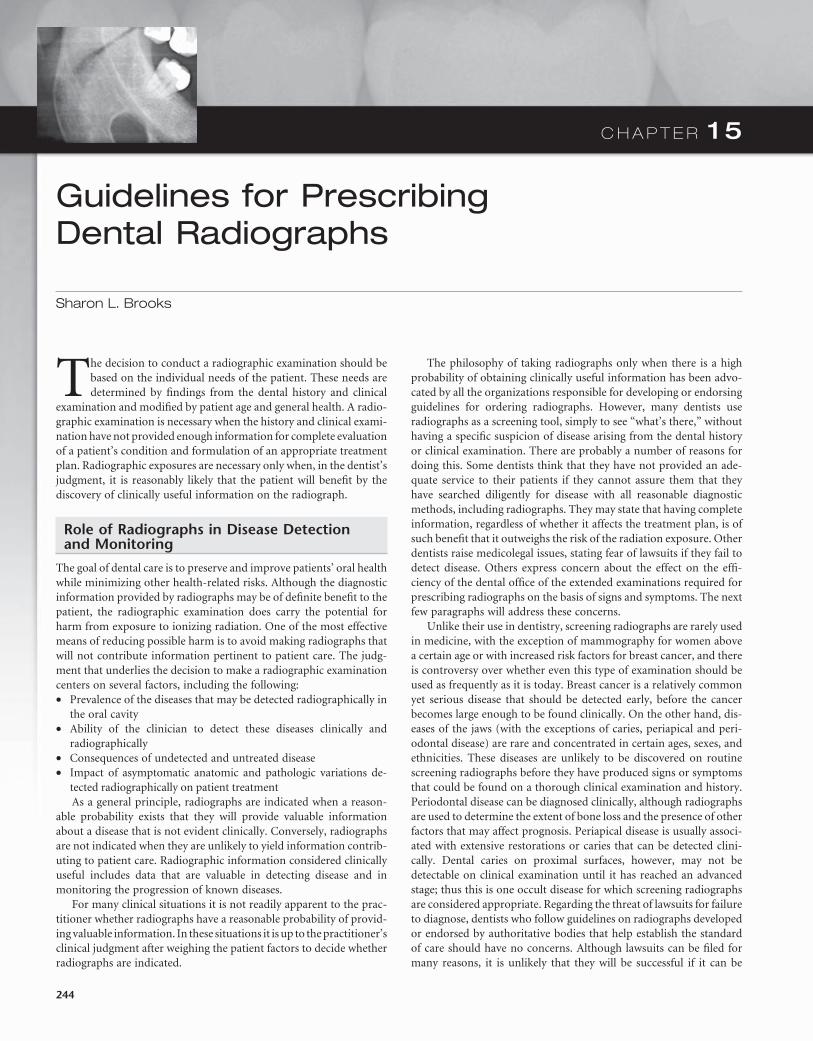
C H A P T E R 1 5
Guidelines for Prescribing Dental Radiographs
Sharon L. Brooks
The decision to conduct a radiographic examination should be based on the individual needs of the patient. These needs are determined by fi ndings from the dental history and clinical
examination and modifi ed by patient age and general health. A radio-graphic examination is necessary when the history and clinical exami-nation have not provided enough information for complete evaluation of a patient ’ s condition and formulation of an appropriate treatment plan. Radiographic exposures are necessary only when, in the dentist ’ s judgment, it is reasonably likely that the patient will benefi t by the discovery of clinically useful information on the radiograph.
Role of Radiographs in Disease Detection and Monitoring
The goal of dental care is to preserve and improve patients ’ oral health while minimizing other health-related risks. Although the diagnostic information provided by radiographs may be of defi nite benefi t to the patient, the radiographic examination does carry the potential for harm from exposure to ionizing radiation. One of the most effective means of reducing possible harm is to avoid making radiographs that will not contribute information pertinent to patient care. The judg-ment that underlies the decision to make a radiographic examination centers on several factors, including the following: • Prevalence of the diseases that may be detected radiographically in
the oral cavity • Ability of the clinician to detect these diseases clinically and
radiographically • Consequences of undetected and untreated disease • Impact of asymptomatic anatomic and pathologic variations de-
tected radiographically on patient treatment As a general principle, radiographs are indicated when a reason-
able probability exists that they will provide valuable information about a disease that is not evident clinically. Conversely, radiographs are not indicated when they are unlikely to yield information contrib-uting to patient care. Radiographic information considered clinically useful includes data that are valuable in detecting disease and in monitoring the progression of known diseases.
For many clinical situations it is not readily apparent to the prac-titioner whether radiographs have a reasonable probability of provid-ing valuable information. In these situations it is up to the practitioner ’ s clinical judgment after weighing the patient factors to decide whether radiographs are indicated.
The philosophy of taking radiographs only when there is a high probability of obtaining clinically useful information has been advo-cated by all the organizations responsible for developing or endorsing guidelines for ordering radiographs. However, many dentists use radiographs as a screening tool, simply to see “ what ’ s there, ” without having a specifi c suspicion of disease arising from the dental history or clinical examination. There are probably a number of reasons for doing this. Some dentists think that they have not provided an ade-quate service to their patients if they cannot assure them that they have searched diligently for disease with all reasonable diagnostic methods, including radiographs. They may state that having complete information, regardless of whether it affects the treatment plan, is of such benefi t that it outweighs the risk of the radiation exposure. Other dentists raise medicolegal issues, stating fear of lawsuits if they fail to detect disease. Others express concern about the effect on the effi -ciency of the dental offi ce of the extended examinations required for prescribing radiographs on the basis of signs and symptoms. The next few paragraphs will address these concerns.
Unlike their use in dentistry, screening radiographs are rarely used in medicine, with the exception of mammography for women above a certain age or with increased risk factors for breast cancer, and there is controversy over whether even this type of examination should be used as frequently as it is today. Breast cancer is a relatively common yet serious disease that should be detected early, before the cancer becomes large enough to be found clinically. On the other hand, dis-eases of the jaws (with the exceptions of caries, periapical and peri-odontal disease) are rare and concentrated in certain ages, sexes, and ethnicities. These diseases are unlikely to be discovered on routine screening radiographs before they have produced signs or symptoms that could be found on a thorough clinical examination and history. Periodontal disease can be diagnosed clinically, although radiographs are used to determine the extent of bone loss and the presence of other factors that may affect prognosis. Periapical disease is usually associ-ated with extensive restorations or caries that can be detected clini-cally. Dental caries on proximal surfaces, however, may not be detectable on clinical examination until it has reached an advanced stage; thus this is one occult disease for which screening radiographs are considered appropriate. Regarding the threat of lawsuits for failure to diagnose, dentists who follow guidelines on radiographs developed or endorsed by authoritative bodies that help establish the standard of care should have no concerns. Although lawsuits can be fi led for many reasons, it is unlikely that they will be successful if it can be
244
CHAPTER 15 ■ GUIDELINES FOR PRESCRIBING DENTAL RADIOGRAPHS 245
shown that the practitioner did a thorough clinical examination and history and carefully considered the guidelines when determining whether to order radiographs.
Some dentists set up their practices so that new patients are auto-matically seen fi rst by the dental hygienist, who takes a predetermined set of radiographs at the fi rst appointment, before the dentist sees the patient. Although this may make effi cient use of the dentist ’ s time, it is contrary to the recommendations of the American Dental Associa-tion (ADA) that the selection of radiographs should be based on the fi ndings of the clinical examination. Performing a thorough examina-tion before radiographs are ordered should not be an insurmountable obstacle for an effi cient dental practice.
Regarding the issue of cost versus benefi t of radiographs, for any individual patient there is little risk of harm from a set of radiographs, even if no important diagnostic information is revealed. However, there is a large societal cost, both in terms of health care dollars and radiation risk, if millions of dental patients receive unproductive radiographic examinations, as would happen if routine screening were widespread.
Our philosophy is that radiographs should be based on the need for diagnostic information for patients on a case-by-case basis. For that reason, the next section will discuss some of the clinical situations that may call for a radiographic examination.
CARIES
Dental caries is the most common dental disease, affecting people of all ages. Although the caries prevalence rates of developed countries have been decreasing since the 1970s, probably partially as a result of the widespread use of fl uoride, increasing numbers of older adults are maintaining their teeth throughout their lifetimes, leaving them at risk for developing both coronal and root caries. Although occlusal, buccal, and lingual carious lesions are reasonably easy to detect clini-cally, interproximal caries and caries associated with existing restora-tions are much more diffi cult to detect with only a clinical examination (see Chapter 17 ). Studies have repeatedly demonstrated that clinicians using radiographs detect caries not evident clinically, both in enamel and in dentin. Although a radiographic examination is very important for diagnosis of dental caries, the optimal frequency for such an exam-ination should be based on mitigating features such as the patient ’ s age, medical condition, diet, oral hygiene practices, oral health status, and the nature of the caries process itself.
Carious lesions demonstrate one of three behaviors: progression, arrest, or regression. Only about 50% of lesions progress beyond the initial, just-detectable defect, and in most instances the lesions dem-onstrate a slow rate of progression through enamel (months to years). Mechanisms are also in use to enhance remineralization of early enamel lesions. However, the rate of caries progression is signifi cantly faster in deciduous than in permanent enamel, and patients vary widely in their rates of formation of caries and in their rates of caries progression.
Because the presence of caries cannot be determined with confi -dence by clinical examination alone, it is necessary to expose patients periodically through bitewing radiography to monitor dental caries. The length of the exposure intervals varies considerably because of different patient circumstances. For most patients in good physical health with adequate oral hygiene, an infrequent radiographic exami-nation is needed to monitor dental caries. However, if the patient history and clinical examination suggest that the individual has a
relatively high caries experience, shorter intervals allow careful moni-toring of disease.
PERIODONTAL DISEASES
Some form of periodontal disease affects most people at some point during their lives, gingivitis more often in younger individuals and periodontitis more commonly in older adults. Periodontal diseases are responsible for a substantial portion of all teeth lost. A consensus exists among practitioners that radiographic examinations play an important role in the evaluation of patients with periodontal disease after the disease is initially detected on clinical examination (see Chapter 18 ). In addition to providing a picture of the extent of alveo-lar bone support for the dentition, radiographic examinations help demonstrate local factors that complicate the disease, including the presence of gingival irritants such as calculus and faulty restorations. Occasionally the length and morphologic features of roots, visible on periapical radiographs, are crucial factors in the prognosis of the disease. These observations suggest that, when clinical evidence exists of periodontal disease other than nonspecifi c gingivitis, it is appropri-ate to make radiographs, generally a combination of periapicals and bitewings, to help establish the severity of the disease. Follow-up radiographs after therapy is complete will help the clinician monitor the progression of disease and determine whether the destruction of alveolar bone has been halted.
DENTAL ANOMALIES
Abnormal formation of teeth may be manifested as deviations in number, size, and composition. These abnormalities in dental devel-opment occur more frequently, and are more likely to have a serious impact, in the permanent dentition than in the primary dentition. The most frequently encountered anomalies are the presence of supernu-merary teeth, usually mesiodens, or developmentally absent teeth, usually second premolars (see Chapter 19 ).
Few anomalies exist for which orthodontic treatment or surgical correction or modifi cation must start at an early age. When the dentist suspects an abnormality requiring treatment, radiographs to confi rm and localize it are not required until the time when the treatment is most appropriate. For example, a panoramic examination of a 5-year-old child to determine the presence or absence of permanent teeth may be ill timed. Although the examination provides evidence that one or more second premolars or lateral incisors are developmentally missing, this information usually does not infl uence the current treat-ment plan. When examination for dental anomalies is appropriate, both the radiation dose and the anticipated diagnostic benefi t should be considered. Projections that best demonstrate the required diag-nostic information should be selected. A panoramic radiograph of the lower face is usually best for observing the presence or absence of teeth in all quadrants, although a periapical fi lm or an occlusal fi lm is suf-fi cient for an examination limited to one area.
GROWTH AND DEVELOPMENT AND DENTAL MALOCCLUSION
Children and adolescents are often examined to assess the growth and development of the teeth and jaws. This assessment considers the relationship of one jaw to the other and to the soft tissues. An exami-nation of occlusion, growth, and development requires an individual-ized radiographic examination that may include periapicals or a
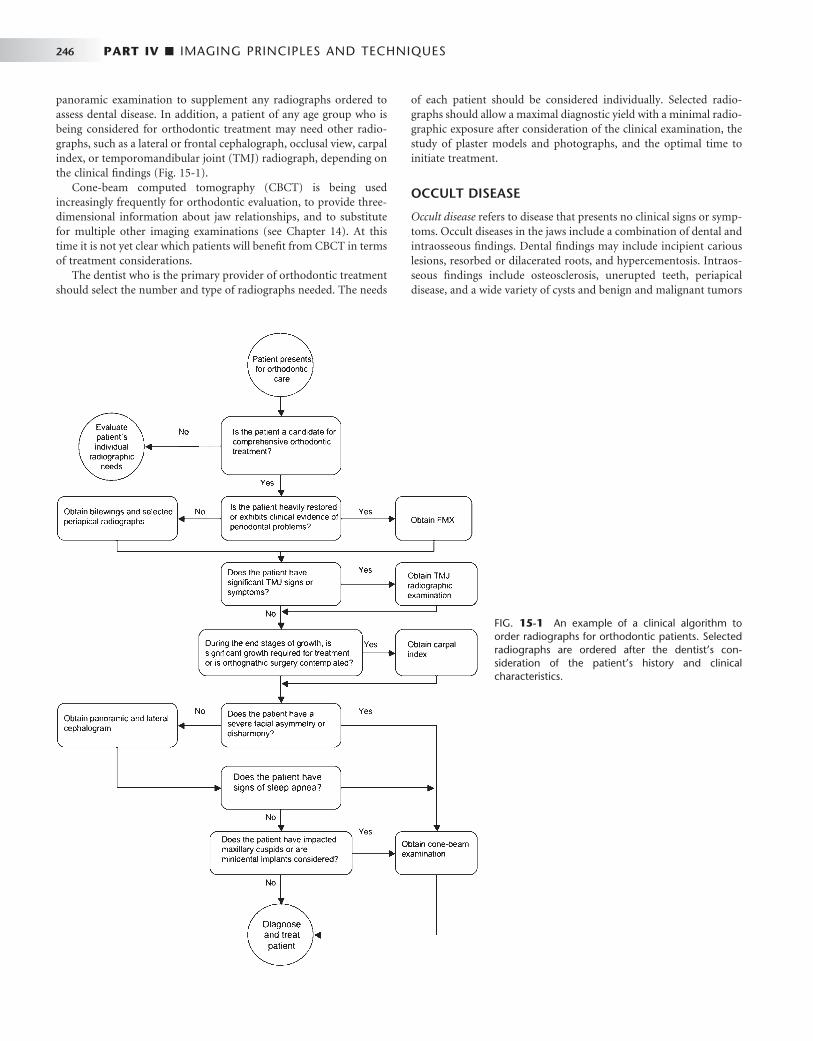
246 PART IV ■ IMAGING PRINCIPLES AND TECHNIQUES
panoramic examination to supplement any radiographs ordered to assess dental disease. In addition, a patient of any age group who is being considered for orthodontic treatment may need other radio-graphs, such as a lateral or frontal cephalograph, occlusal view, carpal index, or temporomandibular joint (TMJ) radiograph, depending on the clinical fi ndings ( Fig. 15-1 ).
Cone-beam computed tomography (CBCT) is being used increasingly frequently for orthodontic evaluation, to provide three-dimensional information about jaw relationships, and to substitute for multiple other imaging examinations (see Chapter 14 ). At this time it is not yet clear which patients will benefi t from CBCT in terms of treatment considerations.
The dentist who is the primary provider of orthodontic treatment should select the number and type of radiographs needed. The needs
of each patient should be considered individually. Selected radio-graphs should allow a maximal diagnostic yield with a minimal radio-graphic exposure after consideration of the clinical examination, the study of plaster models and photographs, and the optimal time to initiate treatment.
OCCULT DISEASE
Occult disease refers to disease that presents no clinical signs or symp-toms. Occult diseases in the jaws include a combination of dental and intraosseous fi ndings. Dental fi ndings may include incipient carious lesions, resorbed or dilacerated roots, and hypercementosis. Intraos-seous fi ndings include osteosclerosis, unerupted teeth, periapical disease, and a wide variety of cysts and benign and malignant tumors
FIG. 15-1 An example of a clinical algorithm to order radiographs for orthodontic patients. Selected radiographs are ordered after the dentist ’ s con-sideration of the patient ’ s history and clinical characteristics.

CHAPTER 15 ■ GUIDELINES FOR PRESCRIBING DENTAL RADIOGRAPHS 247
(see Chapters 20 through 25 ). Small carious lesions, resorption of root structure, and bony lesions may go unnoticed until signs and symp-toms develop.
Although the consequences of some occult diseases may be quite serious, most serious diseases are rare. Often a historical or clinical sign or symptom of intraosseous disease suggests its presence. For instance, an unusual contour of bone or an absent third molar, not explained by a history of extraction, suggests the possibility of an impaction with the potential for an associated dentigerous cyst. Although patient history and clinical signs and symptoms do not always accurately predict the fi nding of dental and intraosseous fi ndings, the majority of these true occult diseases are not clinically relevant or they are so rare that, except for caries as described previously, the dentist need not obtain a radiographic examination of the jaws solely to screen for them in dentate individuals in the absence of unusual clinical signs or symptoms. Caries is an exception because of its much higher prevalence than other occult diseases.
There is a considerable difference of opinion on whether asymp-tomatic edentulous patients seen for routine denture construction should have screening radiographs taken to look for occult disease. Several studies have demonstrated a relatively large number of lesions on radiographs of edentulous patients, including retained root tips and areas of sclerotic bone, but almost all these fi ndings required no treatment and did not affect the outcome of care. For that reason, some recommend no radiographs of edentulous patients if the clinical examination is negative for signs and symptoms of disease. Others still think that screening radiographs of these patients are of value. As the standard of care for completely or partially edentulous patients moves toward dental implants rather than removable prosthetics, imaging to assess the quantity and quality of bone available for implants is gaining in importance.
There has been increasing interest in the last few years in using panoramic radiographs to screen patients for the presence of calcifi ed atheromas in the bifurcation of the carotid artery, a fi nding that may indicate an increased risk for the development of a cerebrovascular accident (stroke). However, the value of this fi nding has been ques-tioned recently because a noncalcifi ed vulnerable plaque, which is not visible on panoramic radiographs, may put the patient at more risk for stroke than a more stable calcifi ed plaque. Nevertheless, the general consensus at this time is that panoramic radiographs made for dental purposes should be evaluated for this calcifi cation, particularly in patients older than 55 years, but that these radiographs should not be made simply to screen for atheromas without other dental indications. (See Chapter 28 for more details.)
JAW DISEASE
Imaging of known jaw lesions, such as fi bro-osseous diseases or neo-plastic diseases, before biopsy and defi nitive treatment is also impor-tant for appropriate management of the patient. For small lesions of the jaws, periapical or panoramic radiographs may be enough as long as the lesion can be seen in its entirety. If clinical evidence of swelling exists, some type of radiograph at 90 degrees to the original plane should be made to determine whether there is expansion of the jaw or perforation of the buccal or lingual cortical bone. If lesions are too large to fi t on standard dental fi lms, extend into the maxillary sinus or other portions of the head outside the jaws, or are suspected of malignancy, additional imaging such as computed tomography (CT) or CBCT is appropriate before biopsy (see Chapters 13 and 14 ). This
type of imaging can defi ne the extent of the lesion, suggest an opera-tive approach, and provide information about the nature of the lesion. The person performing the biopsy or managing the patient should order the advanced images to decrease confusion and increase coor-dination of care.
TEMPOROMANDIBULAR JOINT
Many types of diseases affect the TMJ, including congenital and devel-opmental malformations of the mandible and cranial bones; acquired disorders such as disk displacement, neoplasms, fractures, and dislo-cations; infl ammatory diseases that produce capsulitis or synovitis; and arthritides of various types, including rheumatoid arthritis and osteoarthritis. The goal of TMJ imaging, similar to that for imaging other body parts, should be to obtain new information that will infl u-ence patient care. Radiologic examination may not be needed for all patients with signs and symptoms referable to the TMJ region, par-ticularly if no treatment is contemplated (see Chapter 26 ). The deci-sion of whether and how to image the joints should depend on the results of the history and clinical fi ndings, the clinical diagnosis, and results of prior examinations, as well as the tentative treatment plan and expected outcome.
The cost of the examination and the radiation dose should also infl uence the decision if more than one type of examination can provide the desired information. For example, information about the status of the osseous tissues can be obtained from panoramic radio-graphs, plain fi lms, conventional tomography, CT, CBCT, and mag-netic resonance imaging (MRI). The subtlety of the expected fi ndings and the amount of detail required should be considered when select-ing the examination to perform. If soft tissue information such as disk position is necessary for patient care, MRI or arthrography is appropriate.
IMPLANTS
An increasingly common method of replacing missing teeth is with osseointegrated implants, metal screws that are inserted into the man-dible or maxilla. Prosthetic appliances are then affi xed to the screws after a period of healing. Preoperative planning is crucial to ensure success of the implants. The dentist must evaluate the adequacy of the height and thickness of bone for the desired implant; the quality of the bone, including the relative proportion of medullary and cortical bone; the location of anatomic structures such as the mandibular canal or maxillary sinus; and the presence of structural abnormalities such as undercuts that may affect placement or angulation of the implant (see Chapter 32 ).
Standard periapical and panoramic radiographs can supply infor-mation regarding the vertical dimensions of the bone in the proposed implant site. However, some type of cross-sectional imaging (conven-tional tomography, CT, or CBCT) is recommended before implant placement for visualization of important anatomic landmarks, deter-mination of size and path of insertion of implant, and evaluation of the adequacy of the bone for anchorage of the implant. There is also increasing use of implant planning software and preparation of surgi-cal drilling guides, which require the three-dimensional data from CT or CBCT. Postoperative evaluation of implants may be needed at later times to judge healing, assess complete seating of fi xtures, and ensure continued health of the surrounding bone.
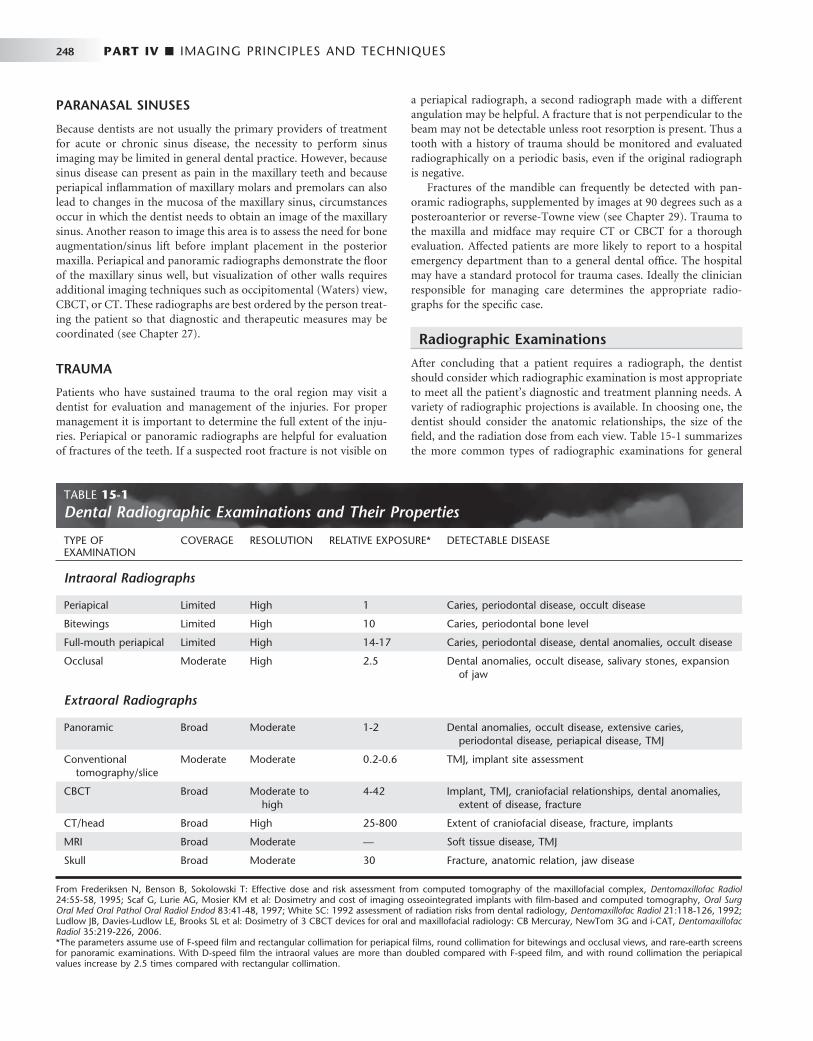
248 PART IV ■ IMAGING PRINCIPLES AND TECHNIQUES
PARANASAL SINUSES
Because dentists are not usually the primary providers of treatment for acute or chronic sinus disease, the necessity to perform sinus imaging may be limited in general dental practice. However, because sinus disease can present as pain in the maxillary teeth and because periapical infl ammation of maxillary molars and premolars can also lead to changes in the mucosa of the maxillary sinus, circumstances occur in which the dentist needs to obtain an image of the maxillary sinus. Another reason to image this area is to assess the need for bone augmentation/sinus lift before implant placement in the posterior maxilla. Periapical and panoramic radiographs demonstrate the fl oor of the maxillary sinus well, but visualization of other walls requires additional imaging techniques such as occipitomental (Waters) view, CBCT, or CT. These radiographs are best ordered by the person treat-ing the patient so that diagnostic and therapeutic measures may be coordinated (see Chapter 27 ).
TRAUMA
Patients who have sustained trauma to the oral region may visit a dentist for evaluation and management of the injuries. For proper management it is important to determine the full extent of the inju-ries. Periapical or panoramic radiographs are helpful for evaluation of fractures of the teeth. If a suspected root fracture is not visible on
a periapical radiograph, a second radiograph made with a different angulation may be helpful. A fracture that is not perpendicular to the beam may not be detectable unless root resorption is present. Thus a tooth with a history of trauma should be monitored and evaluated radiographically on a periodic basis, even if the original radiograph is negative.
Fractures of the mandible can frequently be detected with pan-oramic radiographs, supplemented by images at 90 degrees such as a posteroanterior or reverse-Towne view (see Chapter 29 ). Trauma to the maxilla and midface may require CT or CBCT for a thorough evaluation. Affected patients are more likely to report to a hospital emergency department than to a general dental offi ce. The hospital may have a standard protocol for trauma cases. Ideally the clinician responsible for managing care determines the appropriate radio-graphs for the specifi c case.
Radiographic Examinations
After concluding that a patient requires a radiograph, the dentist should consider which radiographic examination is most appropriate to meet all the patient ’ s diagnostic and treatment planning needs. A variety of radiographic projections is available. In choosing one, the dentist should consider the anatomic relationships, the size of the fi eld, and the radiation dose from each view. Table 15-1 summarizes the more common types of radiographic examinations for general
TABLE 15-1 Dental Radiographic Examinations and Their Properties
TYPE OF EXAMINATION
COVERAGE RESOLUTION RELATIVE EXPOSURE * DETECTABLE DISEASE
Intraoral Radiographs
Periapical Limited High 1 Caries, periodontal disease, occult disease
Bitewings Limited High 10 Caries, periodontal bone level
Full-mouth periapical Limited High 14-17 Caries, periodontal disease, dental anomalies, occult disease
Occlusal Moderate High 2.5 Dental anomalies, occult disease, salivary stones, expansion of jaw
Extraoral Radiographs
Panoramic Broad Moderate 1-2 Dental anomalies, occult disease, extensive caries, periodontal disease, periapical disease, TMJ
Conventional tomography/slice
Moderate Moderate 0.2-0.6 TMJ, implant site assessment
CBCT Broad Moderate to high
4-42 Implant, TMJ, craniofacial relationships, dental anomalies, extent of disease, fracture
CT/head Broad High 25-800 Extent of craniofacial disease, fracture, implants
MRI Broad Moderate — Soft tissue disease, TMJ
Skull Broad Moderate 30 Fracture, anatomic relation, jaw disease
* The parameters assume use of F-speed fi lm and rectangular collimation for periapical fi lms, round collimation for bitewings and occlusal views, and rare-earth screens for panoramic examinations. With D-speed fi lm the intraoral values are more than doubled compared with F-speed fi lm, and with round collimation the periapical values increase by 2.5 times compared with rectangular collimation.
From Frederiksen N, Benson B, Sokolowski T: Effective dose and risk assessment from computed tomography of the maxillofacial complex, Dentomaxillofac Radiol 24:55-58, 1995; Scaf G, Lurie AG, Mosier KM et al: Dosimetry and cost of imaging osseointegrated implants with fi lm-based and computed tomography, Oral Surg Oral Med Oral Pathol Oral Radiol Endod 83:41-48, 1997; White SC: 1992 assessment of radiation risks from dental radiology, Dentomaxillofac Radiol 21:118-126, 1992; Ludlow JB, Davies-Ludlow LE, Brooks SL et al: Dosimetry of 3 CBCT devices for oral and maxillofacial radiology: CB Mercuray, NewTom 3G and i-CAT, Dentomaxillofac Radiol 35:219-226, 2006.
CHAPTER 15 ■ GUIDELINES FOR PRESCRIBING DENTAL RADIOGRAPHS 249
dental patients and factors to consider in choosing the most appropri-ate one. For example, a panoramic radiograph provides broad area coverage with moderate resolution. Intraoral fi lms give more detailed information but a signifi cantly higher radiation dose per unit area exposed. The clinician must use clinical judgment to weigh these factors. Examples of all these radiographs can be found in previous chapters.
INTRAORAL RADIOGRAPHS
Intraoral radiographs are examinations made by placing the x-ray fi lm within the patient ’ s mouth during the exposure. These exposures offer the dentist a high-detail view of the teeth and bone in the area exposed. Such views are most appropriate for revealing caries and periodontal and periapical disease in a localized region. A complete-mouth or full-mouth examination (FMX) consists of periapical views of all the tooth-bearing regions as well as interproximal views (see Chapter 9 ).
Periapical Radiographs Periapical views show all of a tooth and the surrounding bone and are very useful for revealing caries and periodontal and periapical disease. These views may be made of a specifi c tooth or region or as part of an FMX.
Interproximal Radiographs Interproximal views (bitewings) show the coronal aspects of both the maxillary and mandibular dentition in a region, as well as the sur-rounding crestal bone. These views are most useful for revealing proximal caries and evaluating the height of the alveolar bony crest. They can be made in either the anterior or posterior region of the mouth.
Occlusal Radiographs Occlusal views are intraoral radiographs in which the fi lm is posi-tioned in the occlusal plane. They are often used in lieu of periapical views in children because the small size of the patient ’ s mouth limits fi lm placement. In adults, occlusal radiographs may supplement peri-apical views, providing visualization of a greater area of teeth and bone. They are useful for demonstrating impacted or abnormally placed maxillary anterior teeth or visualizing the region of a palatal cleft. Occlusal views may also demonstrate buccal or lingual expan-sion of bone or presence of a sialolith in the submandibular duct.
EXTRAORAL RADIOGRAPHS
Extraoral radiographs are examinations made of the orofacial region by use of fi lms located outside the mouth. The relationships among patient position, fi lm location, and beam direction vary depending on the specifi c radiographic information desired. The standard technique for making several extraoral radiographs is discussed in Chapter 12 . Only the panoramic radiograph is described here because it has common use as a radiographic examination for general dental patients.
Panoramic Radiographs Panoramic radiographs provide a broad view of the jaws, teeth, maxil-lary sinuses, nasal fossa, and TMJs (see Chapter 11 ). They show which teeth are present, their relative state of development, the presence or absence of dental abnormalities, and many traumatic and pathologic
lesions in bone. Panoramic radiographs are the technique of choice for initial examinations of edentulous patients. Because this system is an extraoral technique and uses intensifying screens, the resolution of the images is less than with the intraoral nonscreen fi lms (see Chapter 5 ). Panoramic radiographs are also susceptible to artifacts from improper patient positioning that negatively affect the image. Consequently this system is generally considered inadequate for independent diagnosis of caries, root abnormalities, and periapical changes.
In the majority of dental patients, oral disease involving the teeth or jaw bones lies within the area imaged by periapical radiographs. Therefore when a full-mouth set of radiographs is available, a pan-oramic examination is usually redundant because it does not add information that alters the treatment plan. However, situations may exist in which a panoramic radiograph may be preferred over a peri-apical examination, such as for assessing growth and development in a child or adolescent. Panoramic views are most useful when the required fi eld of view is large but the need for high resolution is of less importance. Although the selection of a radiographic examina-tion should be based on the extent of the expected information it is likely to provide, the relatively low dose of radiation from the panoramic examination should also be a qualifying factor.
Advanced Imaging Procedures A variety of advanced imaging procedures such as CT, CBCT, MRI, ultrasonography, and nuclear medicine scans may be required in spe-cifi c diagnostic situations. These techniques are discussed in Chapter 13 , although in general the dentist refers the patient to a hospital or other imaging center for these procedures rather than performing them in the dental offi ce.
Guidelines for Ordering Radiographs
The ADA has issued guidelines recommending which radiographs to make and how often to repeat them: • Make radiographs only after a clinical examination. • Order only those radiographs that directly benefi t the patient in
terms of diagnosis or treatment plan. • Use the least amount of radiation exposure necessary to generate
an acceptable view of the imaged area.
PREVIOUS RADIOGRAPHS
Most patients have been seen previously by a dentist and have already had radiographs made. These radiographs are helpful regardless of when they were exposed. If they are relatively recent, they may be adequate to the diagnostic problem at hand. Even if they were made so long ago that they are not likely to refl ect the current status of the patient, they may still prove useful. These previous radiographs may demonstrate whether a condition has worsened, has remained unchanged, or has shown healing, such as in the progression of caries or periodontal disease.
ADMINISTRATIVE RADIOGRAPHS
Administrative radiographs are those made for reasons other than diagnosis, including those made for an insurance company or for an examining board. We think that it is appropriate to expose patients only when it benefi ts their health care. Most administrative radiographs do not serve such an objective. Unfortunately, this

250 PART IV ■ IMAGING PRINCIPLES AND TECHNIQUES
recommendation is often not adhered to in practice, and dentists are left to sort out the most appropriate criteria to use in their practices.
Use of Guidelines to Order Dental Radiographs
At any time, patients generally have a combination of diseases that the clinician must consider. Therefore guidelines specify not only which examinations to order but also which specifi c patient factors infl uence the number and type of x-ray fi lms to order.
A panel of individuals was convened in the mid 1980s at the request of a branch of the Food and Drug Administration (FDA) to develop a set of guidelines for the making of dental radiographs. The panel addressed the topic of appropriate radiographs for an adequate evaluation of a new or recall asymptomatic patient seeking general dental care. The guidelines were updated in 2004 to refl ect changes in technology and to address situations not considered in the fi rst docu-ment ( Table 15-2 ). However, there was no change in philosophy between the original and current guidelines.
The guidelines describe circumstances (patient age, medical and dental history, and physical signs) that suggest the need for radio-graphs. These circumstances are called selection criteria. The guide-lines also suggest the types of radiographic examinations most likely to benefi t the patient in terms of yielding diagnostic information. They recommend that radiographs not be made unless some expecta-tion exists that they will provide evidence of diseases that will affect the treatment plan. The ADA was an equal partner with the FDA in the revision of the guidelines and recommends their use.
These guidelines also form the basis of the recommendations in this chapter. However, the practitioner, who is the only one who knows the patient ’ s dental history and susceptibility to oral disease, must make the ultimate decision on whether to order radiographs, using the guidelines as a resource, not as a standard of care or a regulation.
Central to the guidelines is the idea that dentists should expose patients to radiation only when they reasonably expect that the result-ing radiograph will benefi t patient care. Accordingly, two situations mandate a radiograph: some clinical evidence of an abnormality that requires further evaluation for a complete assessment or a high prob-ability of disease that warrants a screening examination.
Selection criteria for radiographs are those signs or symptoms found in the patient history or clinical examination that suggest that a radiographic examination will yield clinically useful information. A key concept in the use of selection criteria is recognition of the need to consider each patient individually. Prescription of radiographs should be decided on an individual basis according to the patient ’ s demonstrated need.
The guidelines include a description of clinical situations in which radiographs are likely to contribute to the diagnosis, treatment, or prognosis. Two examples highlight the differences between ordering radiographs for dental diseases with clinical signs and symptoms and dental diseases with no clinical indicators but high prevalences. In the fi rst case, a patient has a hard swelling in the premolar region of the mandible with expansion of the buccal and lingual cortical plates. The clinical sign of swelling alerts the dentist to the need for a radiograph to determine the nature of the abnormality causing the swelling.
An example of the second situation is the patient who comes seeking general dental care after having not seen a dentist for many years. Even without clinical evidence of caries, bitewings are indicated
because of the prevalence of dental caries in the population. Because this patient has not had interproximal radiographs for many years, it is reasonable to assume that the patient may benefi t from the radio-graph by the detection of interproximal caries. Although no clinical signs exist that predict the presence of early caries, the dentist relies on clinical knowledge of the prevalence of caries to decide that this radiograph has a reasonable probability of fi nding disease.
Without some specifi c indication, it is inappropriate to expose the patient “ just to see if there is something there. ” The major exception to this rule is the use of interproximal fi lms for caries when no clinical signs exist of early lesions. The probability of fi nding occult disease in a patient with all permanent teeth erupted and no clinical or his-torical evidence of abnormality or risk factors is so low that making a periapical or panoramic radiographic survey just to look for such disease is not indicated.
PATIENT EXAMINATION
The ordering of radiographs requires a reasonable expectation that they will provide information that will contribute to solving the diag-nostic problem at hand. Accordingly, the fi rst step is a careful exami-nation of the patient, including transillumination of the anterior teeth to evaluate for interproximal decay. The clinical examination provides indications as to the nature and extent of the radiographic examina-tion appropriate to the situation.
A team of dentists tested the ability of the ADA guidelines to reduce the number of intraoral radiographs while still offering ade-quate diagnostic information. This testing of the use of selection cri-teria demonstrated that a small but signifi cant number of radiographic fi ndings was not 100% covered in the anterior region if only posterior interproximal and selected periapical radiographs were used. The testing suggested that anterior interproximal radiographs or anterior periapicals are also indicated to detect interproximal caries and peri-odontal disease in the anterior region, specifi cally for patients with high levels of dental disease. A panoramic radiograph could be made in place of the periapical radiographs to supplement the posterior bitewings if the totality of the disease expected indicates a broad area of coverage and fi ne detail is not required.
In the ADA/FDA guidelines patients are classifi ed by stage of dental development, by whether they are being evaluated for the fi rst time (without previous documentation) or being reevaluated during a recall visit, and by an estimate of their risk for having dental caries or periodontal disease. A footnote to Table 15-2 also outlines some other clinical fi ndings that indicate when radiographs are likely to contribute to a complete description of the asymptomatic patient.
Applying these guidelines to the specifi c circumstances with each patient requires clinical judgment and an amalgamation of knowl-edge, experience, and concern. Clinical judgment is also required to recognize situations that are not described by the guidelines but in which patients will need radiographs nonetheless.
Initial Visit The guidelines recommend that a child with primary dentition who is cooperative and has closed posterior contacts have only interproxi-mal radiographs to examine for caries. Additional periapical/occlusal views are recommended only in the case of clinically evident diseases or specifi c historic or clinical indications such as those listed at the footnote of Table 15-2 . If the molar contacts are not closed, inter-proximal radiographs are not necessary because the proximal surfaces may be examined directly.

CHAPTER 15 ■ GUIDELINES FOR PRESCRIBING DENTAL RADIOGRAPHS 251
For radiographic examination of a new patient in the transitional dentition, after eruption of the fi rst permanent tooth the guidelines recommend interproximal radiographs to assess for dental caries and a panoramic radiograph or selected periapical/occlusal views to evalu-ate growth and development, this being a time when management of dental anomalies might begin.
The guidelines group adolescents and dentate adults together to identify the kind and extent of appropriate radiographic examination. The guidelines recommend that these patients receive an individual-ized examination consisting of interproximal views and panoramic or periapical views selected on the basis of specifi c historical or clinical indications. The presence of generalized dental disease often indicates the need for a full-mouth examination. Alternatively, the presence of only a few localized abnormalities or diseases suggests that a more limited examination consisting of interproximal and selected periapi-cal views may suffi ce. In circumstances with no evidence of current or past dental disease, only interproximal views may be necessary for caries examination.
For the edentulous patient presenting for prosthetic treatment, an individualized examination that is based on clinical signs and symp-toms should be performed. This may include a panoramic radiograph or selected periapical/occlusal views, with some type of cross-sectional examination if dental implants are being considered.
Recall Visit Patients who are returning after initial care require careful examina-tion before determining the need for radiographs. As at the initial examination, selected periapical views should be obtained if any of the historical or clinical signs or symptoms listed in the footnote to Table 15-2 are present and need further evaluation.
The guidelines recommend interproximal radiographs for recall patients to detect interproximal caries. The optimal frequency for these views depends on the age of the patient and the probability of fi nding this disease. If the patient has clinically demonstrable caries or the presence of high-risk factors for caries (poor diet, poor oral hygiene, and those listed in the footnote to Table 15-2 ), then bitewings are exposed at fairly frequent intervals (6 to 12 months for children and adolescents and 6 to 18 months for adults) until no carious lesions are clinically evident. The recommended intervals are longer for indi-viduals not at high risk for caries: 12 to 24 months for the child, 18 to 36 months for the adolescent, and 24 to 36 months for the adult. Note that individuals can change risk category, going from high to low risk or the reverse.
Clinical judgment about need for and type of radiographic exami-nation should be used for other circumstances, such as evaluating the status of periodontal disease, monitoring growth and development, and endodontic or restorative considerations. The interproximal examination may be supplemented by a panoramic, selected periapi-cal/occlusal, or an advanced imaging examination, depending on the patient ’ s specifi c needs.
A radiographic examination may be required in a number of other situations, such as for patients contemplating orthodontic or implant treatment or patients with intraosseous lesions. The goal should be to obtain the necessary diagnostic information with the minimal radia-tion dose and fi nancial cost, which can be substantial for advanced imaging procedures such as MRI. The dentist should determine spe-cifi cally what type of information is needed and the most appropriate technique for obtaining it. An example of a clinical algorithm for ordering radiographs before orthodontic treatment is shown in Figure 15-1 , using guidelines endorsed by the American Academy of
Orthodontics. Because guidelines for ordering radiographs for other situations are not as well developed, the dentist must rely on clinical judgment.
SPECIAL CONSIDERATIONS
Pregnancy Occasionally it is desirable to obtain radiographs of a woman who is pregnant. The x-ray beam is largely confi ned to the head and neck region in dental x-ray examinations; thus, fetal exposure is only about 1 microgray ( μ Gy) for a full-mouth examination. This exposure is quite small compared with that received normally from natural back-ground sources. However, concerns have been raised about a possible relationship between maternal radiation dose to the thyroid gland from dental radiographs and low birth-weight babies, prompting the ADA to recommend the use of protective thyroid collars and aprons during dental radiography, especially of children, women of child-bearing age, and pregnant women. Because the use of radiographs in all patients is predicated on there being a diagnostic need for them, the guidelines apply to patients who are pregnant as well as those who are not.
Radiation Therapy Patients with a malignancy in the oral cavity or perioral region often receive radiation therapy for their disease. Some oral tissues receive 50 Gy or more. Although such patients are often apprehensive about receiving additional exposure, dental exposure is insignifi cant com-pared with what they have already received. The average skin dose from a dental radiograph is approximately 3 milligrays (mGy), less if faster fi lm or digital imaging is used. Furthermore, patients who have received radiation therapy may have radiation-induced xerostomia and thus are at a high risk for development of radiation caries, which may produce serious consequences if extractions are needed in the future. Accordingly, patients who have had radiation therapy to the oral cavity should be carefully followed up because they are at special risk for dental disease.
EXAMPLES OF USE OF THE GUIDELINES
Consider the ways in which the guidelines can be applied to different clinical situations:
• The fi rst visit of a 5-year-old boy to a dental offi ce. A careful clinical examination reveals that the patient is cooperative and that the posterior teeth are in contact. Posterior bitewings are recommended to detect caries. If all of this patient ’ s teeth are present, no evidence exists of decay, a reasonably good diet is being observed, and the parent(s) seem(s) well motivated to promote good oral hygiene, no further radiographic examina-tion is required at this time. Radiographs for the detection of development abnormalities are not in order at this age because a complete appraisal cannot be made at age 5 years. Even if it could be made, it is too early to initiate treatment for such abnormalities.
• A 25-year-old woman receiving a 6-month checkup after her last treatment for a fractured incisor. No caries is evident on interproximal radiographs made 6 months ago; currently no clinical signs suggest caries, nor does the patient have high-risk factors for caries. No evidence exists of periodontal disease or other remarkable signs or symptoms in general or associated with the recently fractured tooth. As long as the fractured incisor

252 PART IV ■ IMAGING PRINCIPLES AND TECHNIQUES
TABLE 15-2 U.S. Food and Drug Administration Guidelines for Prescribing Dental Radiographs * The recommendations in this table are subject to clinical judgment and may not apply to every patient. They are to be used by dentists only after
reviewing the patient ’ s health history and completing a clinical examination. Because every precaution should be taken to minimize radiation exposure, protective thyroid collars and aprons should be used whenever possible. This practice is strongly recommended for children, women of childbearing age and pregnant women.
TYPE OF ENCOUNTER PATIENT AGE AND DENTAL DEVELOPMENTAL STAGE
CHILD WITH PRIMARY DENTITION (PRIOR TO ERUPTION OF FIRST PERMANENT TOOTH)
CHILD WITH TRANSITIONAL DENTITION (AFTER ERUPTION OF FIRST PERMANENT TOOTH)
New patient † being evaluated for dental diseases and dental development
Individualized radiographic examination consisting of selected periapical/occlusal views and/or posterior bitewings if proximal surfaces cannot be visualized or probed; patients without evidence of disease and with open proximal contacts may not require a radiographic examination at this time
Individualized radiographic examination consisting of posterior bitewings with panoramic examination or posterior bitewings and selected periapical images
Recall patient † with clinical caries or at increased risk for caries ‡
Posterior bitewing examination at six- to 12-month intervals if proximal surfaces cannot be examined visually or with a probe
Recall patient * with no clinical caries and not at increased risk of developing caries ‡
Posterior bitewing examination at 12- to 24-month intervals if proximal surfaces cannot be examined visually or with a probe
Recall patient † with periodontal disease
Clinical judgment as to the need for and type of radiographic images for the evaluation of periodontal disease; imaging may consist of, but is not limited to, selected bitewing and/or periapical images of areas in which periodontal disease (other than nonspecifi c gingivitis) can be demonstrated clinically
Patient for monitoring of growth and development
Clinical judgment as to need for and type of radiographic images for evaluation and/or monitoring of dentofacial growth and development
Patient with other circumstances including, but not limited to, proposed or existing implants, pathology, restorative/endodontic needs, treated periodontal disease and caries remineralization
Clinical judgment as to need for and type of radiographic images for evaluation and/or monitoring of these conditions
* Reprinted from U.S. Department of Health and Human Services, Public Health Service, Food and Drug Administration; and American Dental Association, Council on Dental Benefi t Programs, Council on Scientifi c Affairs. † Clinical situations for which radiographs may be indicated, but are not limited to, include the following: Positive historical fi ndings: Previous periodontal or endo-dontic treatment, history of pain or trauma, familial history of dental anomalies, postoperative evaluation of healing, remineralization monitoring, presence of implants or evaluation for implant placement. Positive clinical signs/symptoms: clinical evidence of periodontal disease, large or deep restorations, deep carious lesions, mal-posed or clinically impacted teeth, swelling, evidence of dental/facial trauma, mobility of teeth, sinus tract ( “ fi stula ” ), clinically suspected sinus pathology, growth abnormalities, oral involvement in known or suspected systemic disease, positive neurologic fi ndings in the head and neck, evidence of foreign objects, pain and/or dysfunction of the temporomandibular joint, facial asymmetry, abutment teeth for fi xed or removable partial prosthesis, unexplained bleeding, unexplained sensitivity of teeth, unusual eruption, spacing or migration of teeth, unusual tooth morphology, calcifi cation or color, missing teeth with unknown reason, clinical erosion.
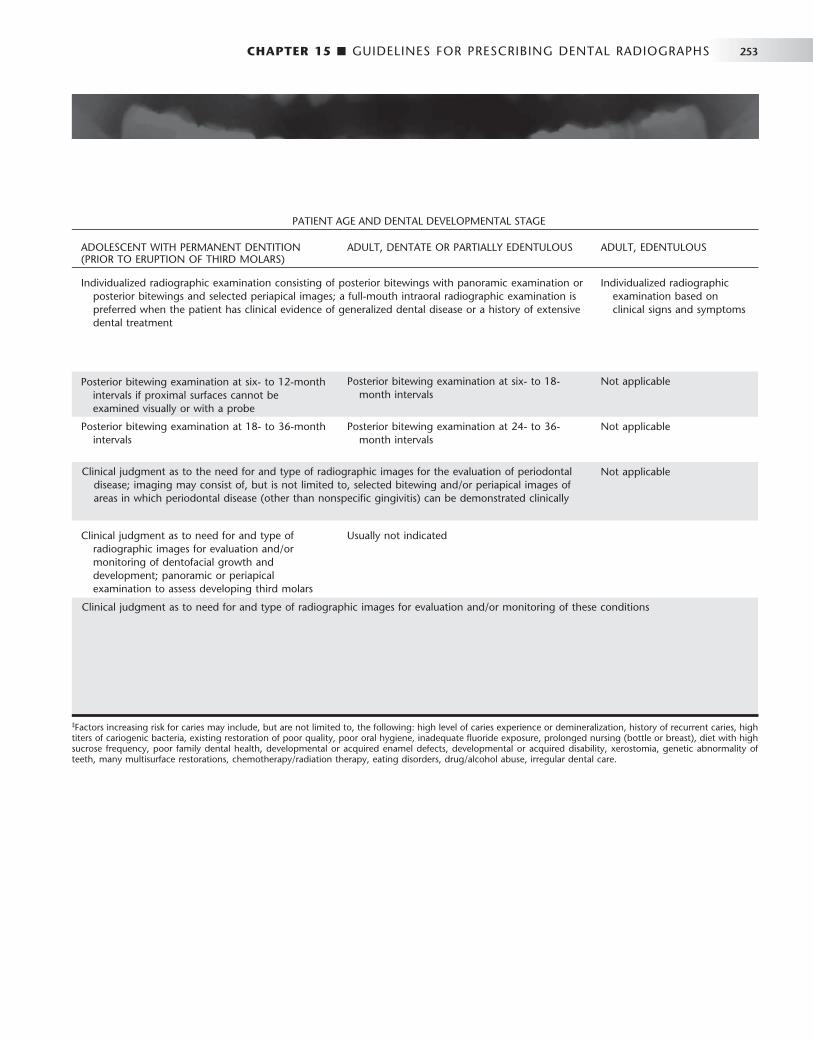
CHAPTER 15 ■ GUIDELINES FOR PRESCRIBING DENTAL RADIOGRAPHS 253
ADOLESCENT WITH PERMANENT DENTITION (PRIOR TO ERUPTION OF THIRD MOLARS)
ADULT, DENTATE OR PARTIALLY EDENTULOUS ADULT, EDENTULOUS
Individualized radiographic examination consisting of posterior bitewings with panoramic examination or posterior bitewings and selected periapical images; a full-mouth intraoral radiographic examination is preferred when the patient has clinical evidence of generalized dental disease or a history of extensive dental treatment
Individualized radiographic examination based on clinical signs and symptoms
Posterior bitewing examination at six- to 18-month intervals
Not applicable
Posterior bitewing examination at 18- to 36-month intervals
Posterior bitewing examination at 24- to 36-month intervals
Not applicable
Not applicable
Clinical judgment as to need for and type of radiographic images for evaluation and/or monitoring of dentofacial growth and development; panoramic or periapical examination to assess developing third molars
Usually not indicated
Posterior bitewing examination at six- to 12-month intervals if proximal surfaces cannot be examined visually or with a probe
Clinical judgment as to the need for and type of radiographic images for the evaluation of periodontal disease; imaging may consist of, but is not limited to, selected bitewing and/or periapical images of areas in which periodontal disease (other than nonspecifi c gingivitis) can be demonstrated clinically
PATIENT AGE AND DENTAL DEVELOPMENTAL STAGE
Clinical judgment as to need for and type of radiographic images for evaluation and/or monitoring of these conditions
‡ Factors increasing risk for caries may include, but are not limited to, the following: high level of caries experience or demineralization, history of recurrent caries, high titers of cariogenic bacteria, existing restoration of poor quality, poor oral hygiene, inadequate fl uoride exposure, prolonged nursing (bottle or breast), diet with high sucrose frequency, poor family dental health, developmental or acquired enamel defects, developmental or acquired disability, xerostomia, genetic abnormality of teeth, many multisurface restorations, chemotherapy/radiation therapy, eating disorders, drug/alcohol abuse, irregular dental care.

254 PART IV ■ IMAGING PRINCIPLES AND TECHNIQUES
shows normal vitality testing, no radiographs are recommended for this patient. If the incisor is nonvital, a periapical view of this tooth should be exposed.
• A 45-year-old man returning to the dentist ’ s offi ce after 1 year. At his last visit you placed two mesial, occlusal, distal amalgam restorations on premolars and performed root canal therapy on number 30. The patient has a 5-mm pocket in the buccal furcation of number 3 but no other evidence of periodontal disease. The guidelines recommend that this patient receive interproximal radiographs to see whether he still has active caries and periapical views of numbers 3 and 30 to evaluate the extent of the periodontal disease and periapical disease, respectively.
• A 65-year-old woman coming to the offi ce for the fi rst time. No previous radiographs are available. A history exists of root canal therapy in two teeth, although the patient is not aware which teeth were treated. Clinical examination reveals multiple carious teeth, multiple missing teeth, and pockets of more than 3 mm involving most of the remaining teeth. The guidelines recom-mend a full-mouth examination, including interproximal radio-graphs, for this patient because of the high probability of fi nding caries, periodontal disease, and periapical disease.
BIBLIOGRAPHY
GUIDELINES FOR ORDERING RADIOGRAPHS
1 Å kerblom A , Rohlin M , Hasselgren G : Individualised restricted intraoral radiography versus full-mouth radiography in the detection of periradicular lesions , Swed Dent J 12 : 151 - 159 , 1988 .
2 American Dental Association Council on Scientifi c Affairs : The use of dental radiographs: update and recommendations , J Am Dent Assoc 137 : 1304 - 1312 , 2006 .
3 Atchison KA , Luke LS , White SC : An algorithm for ordering pretreatment orthodontic radiographs , Am J Orthod Dentofac Orthop 102 : 29 - 44 , 1992 .
4 Atchison KA , White SC , Flack VF et al : Assessing the FDA guidelines for ordering dental radiographs , J Am Dent Assoc 126 : 1372 - 1383 , 1995 .
5 Bohay RN , Stephens RG , Kogon SL : A study of the impact of screening or selective radiography on the treatment and post delivery outcome for edentulous patients , Oral Surg Oral Med Oral Pathol Oral Radiol Endod 86 : 353 - 359 , 1998 .
6 Brooks SL : A study of selection criteria for intraoral dental radiography , Oral Surg Oral Med Oral Pathol 62 : 234 - 239 , 1986 .
7 Brooks SL , Brand JW , Gibbs SJ et al : Imaging of the temporomandibular joint: a position paper of the American Academy of Oral and Maxillofacial Radiology , Oral Surg Oral Med Oral Pathol Oral Radiol Endod 83 : 609 - 618 , 1997 .
8 Bruks A , Enberg K , Nordqvist I et al : Radiographic examinations as an aid to orthodontic diagnosis and treatment planning , Swed Dent J 23 : 77 - 85 , 1999 .
European Commission : Radiation protection 136, European guidelines on radiation protection in dental radiology: the safe use of radiographs in dental practice , 2004 : http://ec.europa.eu/energy/nuclear/radioprotection/publication/doc/136_en.pdf . Accessed May 11, 2008.
10 Hollender L : Decision making in radiographic imaging , J Dent Educ 56 : 834 - 843 , 1992 .
11 Keur JJ : Radiographic screening of edentulous patients: sense or nonsense? A risk-benefi t analysis , Oral Surg Oral Med Oral Pathol 62 : 463 - 467 , 1986 .
12 Luke LS , Lee P , Atchison KA et al : Orthodontic residents ’ indications for use of the lateral TMJ tomogram and the posteroanterior cephalogram , J Dent Educ 61 : 29 - 36 , 1997 .
13 Molander B : Panoramic radiography in dental diagnostics , Swed Dent J 119 ( Suppl ): 1 - 26 , 1996 .
14 Pitts NB , Kidd EA : Some of the factors to be considered in the prescription and timing of bitewing radiography in the diagnosis and management of dental caries , J Dent 20 : 74 - 84 , 1992 .
15 Rushton VE , Horner K , Worthington HV : Routine panoramic radiography of new adult patients in general dental practice: relevance of diagnostic yield to treatment and identifi cation of radiographic selection criteria , Oral Surg Oral Med Oral Pathol Oral Radiol Endod 93 : 488 - 495 , 2002 .
16 Stephens RG , Kogon SL : New U.S. guidelines for prescribing dental radiographs: a critical review , J Can Dent Assoc 56 : 1019 - 1024 , 1990 .
17 Tyndall DA , Brooks SL : Selection criteria for dental implant site imaging: a position paper of the American Academy of Oral and Maxillofacial Radiology , Oral Surg Oral Med Oral Pathol Oral Radiol 89 : 630 - 637 , 2000 .
18 U.S. Department of Health and Human Services, Public Health Service, Food and Drug Administration, and American Dental Association, Council on Dental Benefi t Programs, Council on Scientifi c Affairs : The selection of patients for dental radiographic examinations , revised ed ( 2004 ): www.ada.org/prof/resources/topics/radiography.asp . Accessed August 22, 2007.
19 White SC , Heslop EW , Hollender LG et al : Parameters of radiologic care: an offi cial report of the American Academy of Oral and Maxillofacial Radiology , Oral Surg Oral Med Oral Pathol Oral Radiol Endod 91 : 498 - 511 , 2001 .
DISEASE DETECTION
20 Atchison KA , White SC , Flack VF et al : Effi cacy of the FDA selection criteria for radiographic assessment of the periodontium , J Dent Res 74 : 1424 - 1432 , 1995 .
21 Backer Dirks O : Posteruptive changes in dental enamel , J Dent Res 45 ( Suppl ): 503 - 511 , 1966 .
22 Friedlander AH , Freymiller EG : Detection of radiation-accelerated atherosclerosis of the carotid artery by panoramic radiography: a new opportunity for dentists , J Am Dent Assoc 134 : 1361 - 1365 , 2003 .
23 Hall WB : Decision making in periodontology , ed 3 , St. Louis , 1998 , Mosby . 24 Madden RP , Hodges JS , Salmen CW et al : Utility of panoramic radiographs
in detecting cervical calcifi ed carotid atheroma , Oral Surg Oral Med Oral Pathol Oral Radiol Endod 103 : 543 - 548 , 2007 .
25 Moles DR , Downer MC : Optimum bitewing examination recall intervals assessed by computer simulation , Commun Dent Health 17 : 14 - 19 , 2000 .
26 Reddy MS , Geurs NC , Jeffcoat RL et al : Periodontal disease progression , J Periodontol 71 : 1583 - 1590 , 2000 .
27 Shwartz M , Gr ö ndahl H-G , Pliskin JS et al : A longitudinal analysis from bitewing radiographs of the rate of progression of approximal carious lesions through human dental enamel , Arch Oral Biol 29 : 529 - 536 , 1984 .
28 White SC , Atchison KA , Hewlett ER et al : Clinical and historical predictors of dental caries on radiographs , Dentomaxillofac Radiol 24 : 121 - 127 , 1995 .
29 White SC , Atchison KA , Hewlett ER et al : Effi cacy of FDA guidelines for ordering radiographs for caries detection , Oral Surg Oral Med Oral Pathol 77 : 531 - 540 , 1994 .
RADIATION DOSAGE AND EFFECTS
30 Frederiksen N , Benson B , Sokolowski T : Effective dose and risk assessment from computed tomography of the maxillofacial complex , Dentomaxillofac Radiol 24 : 55 - 58 , 1995 .
31 Hujoel PP , Bollen AM , Noonan CJ et al : Antepartum dental radiography and infant low birth weight , JAMA 291 : 1987 - 1993 , 2004 .
32 Ludlow JB , Davies-Ludlow LE , Brooks SL et al : Dosimetry of 3 CBCT devices for oral and maxillofacial radiology: CB Mercuray, NewTom 3G and i-CAT , Dentomaxillofac Radiol 35 : 219 - 226 , 2006
33 Scaf G , Lurie AG , Mosier KM et al : Dosimetry and cost of imaging osseointegrated implants with fi lm-based and computed tomography , Oral Surg Oral Med Oral Pathol Oral Radiol Endod 83 : 41 - 48 , 1997 .
34 White SC : 1992 assessment of radiation risks from dental radiology , Dentomaxillofac Radiol 21 : 118 - 126 , 1992 .

PART
FIVE
Radiographic Interpretation
C H A P T E R 1 6
Principles of Radiographic Interpretation
The objective of this chapter is to provide a step-by-step analytic process that can be applied to the interpretation of diagnostic images. However, reading this chapter, by itself, will not
instantly bestow the ability to interpret radiographic fi lms correctly; rather, it will equip the reader with a systematic method of image analysis. Profi ciency comes only with practice.
Clinical Examination
Radiographs are prescribed when the dentist thinks that they are likely to offer useful diagnostic information that will infl uence the treat-ment plan. Often some clinical sign or symptom or fi nding from the patient ’ s history indicates the need for a radiologic examination. This clinical information should be used fi rst to select the type of radio-graphs and later to aid in their interpretation.
ACQUIRING APPROPRIATE DIAGNOSTIC IMAGES
An insuffi cient number or inadequate quality of radiographs limits the information available from diagnostic imaging. Because the general practitioner often is responsible both for prescribing and interpreting radiographs, inadequate fi lms should be recognized and supplemental images obtained before proceeding with the analysis.
Quality of the Diagnostic Image Before the analysis is started, the quality of the images is examined. Is the image distorted? For instance, if the image is elongated, greater error occurs in measuring the length of a root canal. Because of the inherent frequency of image distortion in panoramic fi lms, this factor must always be taken into consideration. For example, a region of image magnifi cation involving the mandibular condyle may be diag-nosed erroneously as condylar hyperplasia. For this reason, a thor-ough knowledge of all possible image distortions is a prerequisite for analysis of panoramic images.
The practitioner also should check to see whether the density or contrast of the image has been degraded by exposure or developing errors. It may be impossible, for example, to diagnose osteoporosis in an overexposed image, or detail may be obscured in an underexposed fi lm. If the images are of poor quality, it might be prudent to obtain better quality images before proceeding to the analysis.
Number and Type of Available Images Initially the clinical examination indicates the number and types of fi lms required (see Chapter 14 ). The interpretation of these fi lms in turn may suggest the need for additional imaging. Caution should be
exercised in attempting to make an interpretation on the basis of a single fi lm, especially if the only fi lm is a panoramic view. Also, a bitewing or periapical projection often can be supplemented by another view produced by altering the horizontal or vertical angula-tion of the x-ray beam. For example, detection of recurrent caries around a heavily restored dentition may benefi t from an additional view taken by altering the angle of the x-ray beam. One of the benefi ts of a full-mouth series of intraoral fi lms is that it provides a second view of most areas at a slightly different angle.
Conventional dental radiography produces images in only two dimensions, usually in the mesiodistal direction. In some cases a view at right angles to the plane of the original fi lm is benefi cial. For instance, if a condylar neck fracture is suspected, a lateral view of the condylar region (e.g., a panoramic view) should be supple-mented with an anteroposterior view. In a similar fashion, occlusal projections of the jaws can provide a supplementary right-angle view for the periapical fi lm. Use of a vertex occlusal view follows this principle in establishing the location of impacted maxillary cuspids. In some cases an investigation requires other images in addition to intraoral radiography or panoramic images. Techniques such as tomography, sialography, nuclear imaging, cone-beam computed tomography, conventional computed tomography, and magnetic res-onance imaging may be required (see Chapter 15 ). These techniques are available through consultation with an oral and maxillofacial radiologist.
Diagnostic imaging should be completed before a biopsy proce-dure or treatment is provided. Diagnostic imaging can aid in the selection of the most appropriate site for a biopsy procedure to obtain the most representative tissue sample. Also, the biopsy procedure may alter the tissue by inducing infl ammatory changes, which in turn alter the imaging characteristics of the tissue. This compromises the diag-nostic information that can be obtained, such as determining the extent of a disease.
Viewing Conditions Ideally, viewing conditions should include the following characteristics:
• Ambient light in the viewing room should be reduced. • Intraoral radiographs should be mounted in a fi lm holder. • Light from the viewbox should be of equal intensity across the
viewing surface. • The size of the viewbox should accommodate the size of the
fi lm. If the viewing area is larger than the fi lm, an opaque mask should be used to eliminate all light from around the periphery of the fi lm. This mask can be fabricated from a sheet of opaque material cut to fi t the entire viewbox, leaving an opening for one fi lm.
256
CHAPTER 16 ■ PRINCIPLES OF RADIOGRAPHIC INTERPRETATION 257
• An intense light source is essential for evaluating dark regions of the fi lm.
• A magnifying glass allows detailed examination of small regions of the fi lm.
When images in a digital format are viewed, both room lighting and quality of the monitor are important.
Image Analysis
When the quality and number of fi lms are satisfactory, analysis of the image begins.
SYSTEMATIC RADIOGRAPHIC EXAMINATION
The fi rst step in image analysis is to use a systematic approach to identify all the normal anatomy present in an image or set of images. A profound knowledge of the variation of normal appearance is required to be able to recognize an abnormal appearance. Because no textbook can display all possible variations, the best learning method is to identify normal anatomy in every fi lm analyzed. In this way the observer can build up a large mental database of the spectrum of normal anatomic appearances. An additional benefi t of this proce-dure is that it forces the observer to examine the entire fi lm. Practi-tioners should avoid limiting their attention to one particular region of the fi lm; rather, all aspects of each image should be examined sys-tematically. More than one abnormality may be present. For instance, a bitewing radiograph made to detect caries and alveolar bone loss also may reveal just the edge of an unsuspected intraosseous lesion that will be seen only if the dentist examines the radiograph thoroughly.
INTRAORAL IMAGES
For almost all dental patients, treatment planning includes some com-bination of periapical and bitewing images. This chapter presents a systematic method for analyzing these images. This method may be used to analyze a single image or a full-mouth set. It is most important for the practitioner to develop a particular method and to use it regu-larly. A thorough examination is best accomplished when a specifi c sequence of analysis is used to enhance the scrutiny of all parts of images.
To follow the method presented here, the practitioner should examine the periapical images before the bitewing images, starting in the right maxilla and working across to the left and then dropping down and continuing in the left mandible to the right, concentrating on one anatomic structure at a time. First, the bone is examined. All anatomic landmarks appropriate for the region are identifi ed. In the posterior maxilla, for example, the maxillary sinus, tuberosity, and zygomatic process of the maxilla should be examined. In what way does their appearance change as the angle of each projection is altered? Also, the character of the trabecular bone should be examined. Are the density and size of the trabeculae normal for the region? The same areas should be compared on adjacent images and with the corre-sponding area on images of the other side.
Next, a second visual circuit should be made through all the images, examining the bone of the alveolar process. In particular, the height of the alveolar crest relative to the teeth and the cortication should be examined. Loss of height of the alveolar bone (more than 1.5 mm from the adjacent cementoenamel junctions) may indicate active or past periodontal disease. All regions of the alveolar process
should be examined to gain an overall appreciation for the extent and severity of alveolar bone loss. Any areas of erosion of the alveolar crest and the thickness of the overlying mucosa should be noted. Carcino-mas arising from the epithelial covering may cause erosive lesions with ill-defi ned borders in the alveolar bone. The trabecular pattern of the alveolar process should be examined. The lamina dura may be exam-ined later together with the periodontal membrane space and tooth roots.
Finally, a third visual circuit should be made, examining the denti-tion and associated structures. Each tooth should be studied in sequence, using all images available. The way the tooth ’ s appearance and root structure change with different orientations of the x-ray beam should be noted. The teeth should be counted, looking for missing or supernumerary teeth. The crowns should be examined for normal development of the enamel and for caries. Particular attention should be paid to the interproximal regions at or below the contact points. Restorations should be checked carefully for signs of recurrent caries. Often lesions found on one view cannot be detected on another because of superimposition of the restoration. The pulp chamber should be examined for size and contents. The roots should be exam-ined for shape and form to detect developmental or acquired abnor-malities such as external resorption. The width of the periodontal ligament space around the roots of the tooth should be inspected. The width should be fairly uniform, with very subtle widening toward the cervical region of the tooth. In particular, the lamina dura around each tooth should be examined. Is it intact? The most common abnor-malities found in the bone are radiolucent or radiopaque lesions at the apices of teeth.
EXTRAORAL RADIOGRAPHY
The extraoral radiographs most commonly used in dentistry are pan-oramic images, cephalometric views, and examinations of the tem-poromandibular joint. Specifi c methods for examining these images are covered in the chapters pertaining to these types of images. The same general principles of thorough, systematic coverage described earlier should be used. For viewing each of these types of images, it is important to develop a defi nite sequence that considers all the hard and soft tissues in the fi eld. The practitioner should always focus on one component at a time and examine it thoroughly. Only with such a pattern can the likelihood of detecting all abnormalities be maximized.
When an intraosseous lesion is identifi ed, the following fi ve steps should be used to analyze the lesion as fully as possible.
Analysis of the Intraosseous Lesions
Two basic approaches can be used to analyze images of a lesion. One is the picture matching, or “ Aunt Minnie, ” method. This involves trying to match the radiographic image with a mental picture or with an image in a favorite textbook. Although all radiologists probably use this technique to a certain extent, it has signifi cant limitations. For instance, the observer ’ s experience and memory limit the mental image of a particular disorder. Similarly, the appearance of different abnormalities in a textbook is limited by the author ’ s knowledge and experience and, of course, by the number of images printed. Also, fi gures in a textbook usually represent the most ideal examples of the abnormality. For example, the term periapical cemental dysplasia often evokes a mental image of a radiolucent or mixed radiolucent-radiopaque lesion at the apex of a mandibular incisor because this
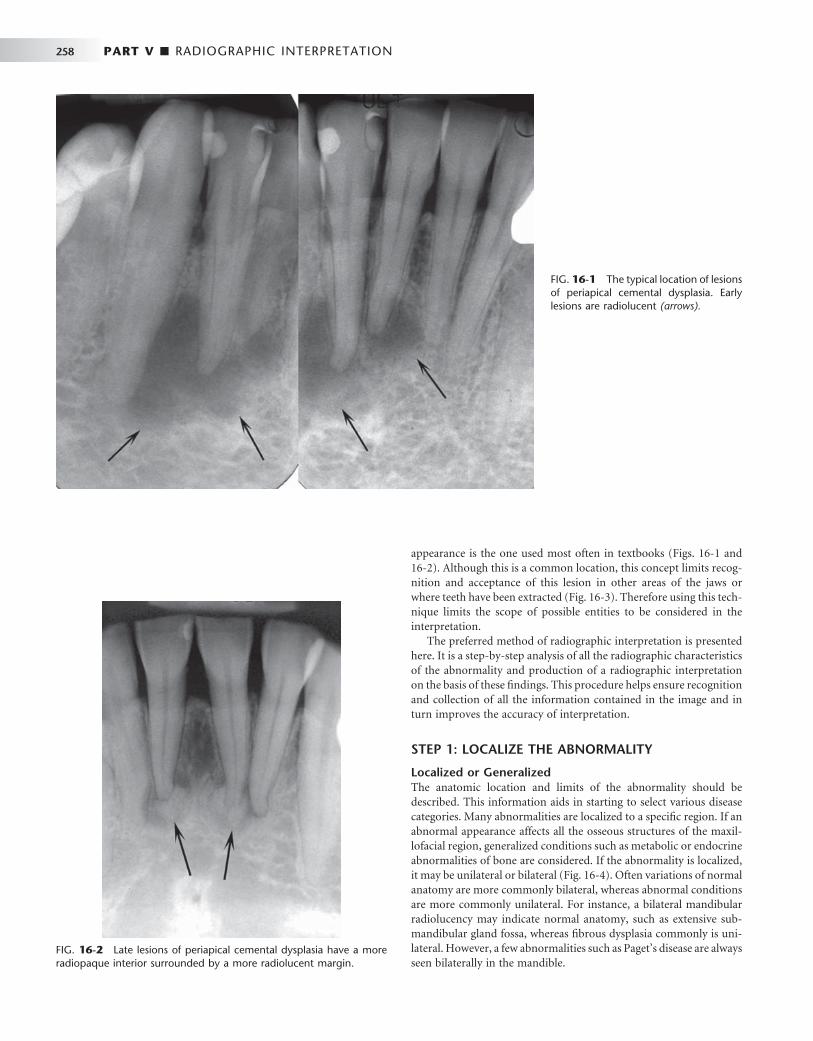
258 PART V ■ RADIOGRAPHIC INTERPRETATION
appearance is the one used most often in textbooks ( Figs. 16-1 and 16-2 ). Although this is a common location, this concept limits recog-nition and acceptance of this lesion in other areas of the jaws or where teeth have been extracted ( Fig. 16-3 ). Therefore using this tech-nique limits the scope of possible entities to be considered in the interpretation.
The preferred method of radiographic interpretation is presented here. It is a step-by-step analysis of all the radiographic characteristics of the abnormality and production of a radiographic interpretation on the basis of these fi ndings. This procedure helps ensure recognition and collection of all the information contained in the image and in turn improves the accuracy of interpretation.
STEP 1: LOCALIZE THE ABNORMALITY
Localized or Generalized The anatomic location and limits of the abnormality should be described. This information aids in starting to select various disease categories. Many abnormalities are localized to a specifi c region. If an abnormal appearance affects all the osseous structures of the maxil-lofacial region, generalized conditions such as metabolic or endocrine abnormalities of bone are considered. If the abnormality is localized, it may be unilateral or bilateral ( Fig. 16-4 ). Often variations of normal anatomy are more commonly bilateral, whereas abnormal conditions are more commonly unilateral. For instance, a bilateral mandibular radiolucency may indicate normal anatomy, such as extensive sub-mandibular gland fossa, whereas fi brous dysplasia commonly is uni-lateral. However, a few abnormalities such as Paget ’ s disease are always seen bilaterally in the mandible.
FIG. 16-1 The typical location of lesions of periapical cemental dysplasia. Early lesions are radiolucent (arrows).
FIG. 16-2 Late lesions of periapical cemental dysplasia have a more radiopaque interior surrounded by a more radiolucent margin.

CHAPTER 16 ■ PRINCIPLES OF RADIOGRAPHIC INTERPRETATION 259
• The probability of cartilaginous lesions and osteochondromas occurring is greater in the condylar region.
• If the epicenter is within the maxillary antrum, the lesion is not of odontogenic tissue, as opposed to a lesion that has grown into the antrum from the alveolar process of the maxilla ( Fig. 16-9 ).
Particular lesions tend to be found in specifi c locations: • The epicenters of central giant cell granulomas commonly are
located anterior to the fi rst molars in the mandible and anterior to the cuspid in the maxilla in young patients.
• Osteomyelitis occurs in the mandible and rarely in the maxilla.
• Periapical cemental dysplasia occurs in the periapical region of teeth (see Figs. 16-1 and 16-2 ).
Single or Multifocal Establishing whether an abnormality is multifocal aids in interpreta-tion because the list of possible multifocal abnormalities is short. Some examples are periapical cemental dysplasia, odontogenic keratocysts, metastatic lesions, multiple myeloma ( Fig. 16-10 ), and leukemic infi ltrates.
Occasionally exceptions to all these points occur. However, in the majority of cases these criteria will serve as a guide to an accurate interpretation.
Size Finally, consider the size of the lesion. There are very few size restric-tions for a particular lesion, but the size may aid in the differential diagnosis. For instance, a dentigerous cyst is often larger than a hyper-plastic follicle.
STEP 2: ASSESS THE PERIPHERY AND SHAPE
Study the periphery of the lesion. Is the periphery well defi ned or ill defi ned? If an imaginary pencil can be used to draw confi dently the limits of the lesion, the margin is well defi ned ( Fig. 16-11 ). Do not become concerned if some small regions are ill defi ned; these may be due to the shape or direction of the x-ray beam at that particular location. A well-defi ned lesion is one in which most of the periphery is well defi ned. In contrast, it is diffi cult to draw an exact delineation
FIG. 16-3 A periapical fi lm revealing a lesion of cemental dysplasia left behind after extraction of the associated tooth.
FIG. 16-4 This lesion, cherubism, is bilateral, manifesting in both the left and right mandibular rami. Note that the mandibular molars have been displaced anteriorly on both sides.
Position in the Jaws Is the abnormality in soft tissue or is it contained within the jaws? When the lesion is in bone, the point of origin, or epicenter, can be estimated on the basis of the assumption that the abnormality grew equally in every direction (this becomes less accurate with very large lesions). The point of origin may indicate the tissue types that compose the abnormality. However, determining the exact location may be diffi cult in some circumstances if the nature of the abnormality is not well defi ned. The following are a few examples:
• If the epicenter is coronal to a tooth, the lesion probably is composed of odontogenic epithelium ( Fig. 16-5 ).
• If it is above the inferior alveolar nerve canal (IAC), the likeli-hood is greater that it is composed of odontogenic tissue ( Fig. 16-6 ).
• If the epicenter is below the IAC, it is unlikely to be odontogenic in origin ( Fig. 16-7 ).
• If it originates within the IAC, the tissue of origin probably is neural or vascular in nature ( Fig. 16-8 ).

260 PART V ■ RADIOGRAPHIC INTERPRETATION
FIG. 16-5 A , A cropped panoramic image of a lesion where the epicenter is coronal to the unerupted mandibular fi rst molar. B , An occlusal projection providing a right-angled view of the same lesion.
A B
FIG. 16-6 A panoramic image revealing a cystic ameloblastoma within the body of the left mandible. Note that the inferior alveolar nerve canal has been displaced inferiorly to the inferior cortex (arrows), indicating that the lesion started superior to the canal.
around most of an ill-defi ned periphery ( Fig. 16-12 ). These two types of peripheries or borders can be further broken down under two subcategories: well-defi ned borders and ill-defi ned borders.
Well-Defi ned Borders A punched-out border is one that has a sharp boundary in which no bone reaction is apparent immediately adjacent to the abnormality. This is analogous to punching a hole in a radiograph with a paper punch. The border of the resulting hole is well defi ned, and the surrounding bone has a normal appearance up to the edge of the hole. This type of border sometimes is seen in multiple myeloma (see Fig. 16-10 ).
A corticated margin is a thin, fairly uniform radiopaque line of reactive bone at the periphery of a lesion. This is commonly seen with cysts (see Fig. 16-5 ).
A sclerotic margin is a wide, radiopaque border of reactive bone that usually is not uniform in width. This may be seen with periapical cemental dysplasia and may indicate a very slow rate of growth or the potential for the lesion to stimulate the production of surrounding bone (see Figs. 16-2 and 16-3 ).
A radiopaque lesion may have a soft tissue capsule, which is indi-cated by the presence of a radiolucent line at the periphery. This may be seen in conjunction with a corticated periphery, as is observed with odontomas and cementoblastomas ( Figs. 16-13 and 16-14 ).

CHAPTER 16 ■ PRINCIPLES OF RADIOGRAPHIC INTERPRETATION 261
FIG. 16-7 A cropped panoramic image displaying a lesion (develop-mental salivary gland defect) below the inferior alveolar canal and thus unlikely to be of odontogenic origin.
FIG. 16-8 A lateral oblique view of the mandible revealing a lesion within the inferior alveolar canal. The smooth fusiform expansion of the canal indicates a neural lesion.
FIG. 16-9 The lack of a peripheral cortex on this retention pseudocyst indicates that it originated in the sinus and not in the alveolar process. It therefore is unlikely to be of odontogenic origin.
FIG. 16-10 A cropped panoramic fi lm revealing several small punched-out lesions of multiple myeloma (a few indicated by arrows ) involving the body and ramus of the mandible.
Ill-Defi ned Borders
A blending border is ill defi ned because of the gradual transition between normal-appearing bone trabeculae and the abnormal-appearing trabeculae of the lesion. The focus of this observation is on the trabeculae and not on the radiolucent marrow spaces. Some con-ditions with this type of margin are sclerosing osteitis ( Fig. 16-15 ) and fi brous dysplasia.
An invasive border usually is associated with rapid growth and can be seen with malignant lesions. Usually an area of radiolucency with fewer or no trabeculae representing bone destruction can be seen just behind the margin ( Fig. 16-16 ). In contrast to the blending border,
the focus of this observation is on the enlarging radiolucency at the expense of bone trabeculae. These borders have also been described as permeative because the lesion grows around existing trabeculae, producing radiolucent, fi ngerlike, or bay-type extensions at the periphery. This may result in enlargement of the marrow spaces at the periphery ( Fig. 16-17 ).
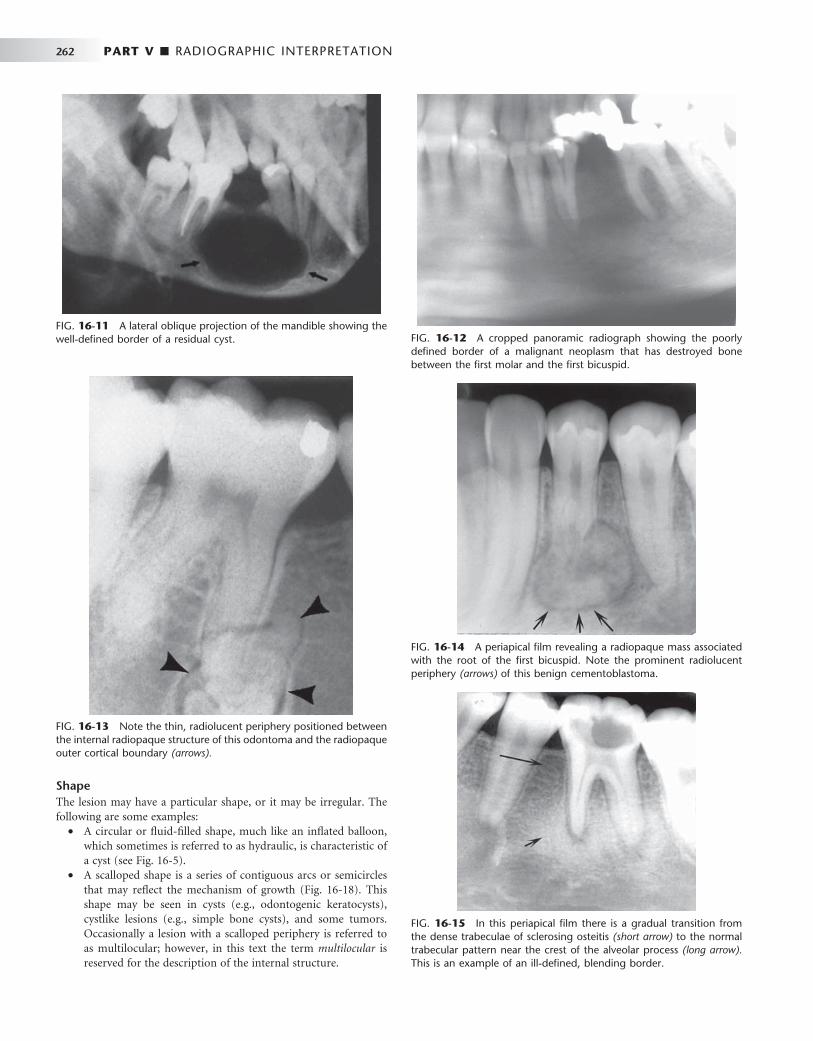
262 PART V ■ RADIOGRAPHIC INTERPRETATION
FIG. 16-11 A lateral oblique projection of the mandible showing the well-defi ned border of a residual cyst. FIG. 16-12 A cropped panoramic radiograph showing the poorly
defi ned border of a malignant neoplasm that has destroyed bone between the fi rst molar and the fi rst bicuspid.
FIG. 16-13 Note the thin, radiolucent periphery positioned between the internal radiopaque structure of this odontoma and the radiopaque outer cortical boundary (arrows).
FIG. 16-14 A periapical fi lm revealing a radiopaque mass associated with the root of the fi rst bicuspid. Note the prominent radiolucent periphery (arrows) of this benign cementoblastoma.
FIG. 16-15 In this periapical fi lm there is a gradual transition from the dense trabeculae of sclerosing osteitis (short arrow) to the normal trabecular pattern near the crest of the alveolar process (long arrow). This is an example of an ill-defi ned, blending border.
Shape The lesion may have a particular shape, or it may be irregular. The following are some examples:
• A circular or fl uid-fi lled shape, much like an infl ated balloon, which sometimes is referred to as hydraulic, is characteristic of a cyst (see Fig. 16-5 ).
• A scalloped shape is a series of contiguous arcs or semicircles that may refl ect the mechanism of growth ( Fig. 16-18 ). This shape may be seen in cysts (e.g., odontogenic keratocysts), cystlike lesions (e.g., simple bone cysts), and some tumors. Occasionally a lesion with a scalloped periphery is referred to as multilocular; however, in this text the term multilocular is reserved for the description of the internal structure.

CHAPTER 16 ■ PRINCIPLES OF RADIOGRAPHIC INTERPRETATION 263
FIG. 16-16 Periapical (A) and occlusal (B) fi lms revealing a squamous cell carcinoma in the anterior maxilla. Note the invasive margin that extends beyond the lateral incisor (arrow) and the radiolucent region with no apparent trabeculae representing bone destruction behind this margin.
A B
FIG. 16-17 Lateral occlusal view of a lesion revealing an ill-defi ned periphery with enlargement of the small marrow spaces at the margin (arrow). This is characteristic of a malignant neoplasm, in this case a lymphoma.
STEP 3: ANALYZE THE INTERNAL STRUCTURE
The internal appearance of a lesion can be classifi ed into one of three basic categories: totally radiolucent, totally radiopaque, or mixed radiolucent and radiopaque (mixed density).
A radiolucent interior is common in cysts (see Fig. 16-5, A ), and a totally radiopaque interior is observed in osteomas. The mixed density internal structure is seen as the presence of calcifi ed structures against a radiolucent (black) backdrop. A challenging aspect of this
FIG. 16-18 A cropped panoramic fi lm of an odontogenic keratocyst displaying a scalloped border, especially around the apex of the associ-ated teeth (arrows).
analysis may be the decision concerning whether a calcifi ed structure is in the internal aspect of the lesion or resides on either side. This is diffi cult to determine by using images that are two-dimensional rep-resentations of three-dimensional structures. The calcifi ed structures should be examined and an attempt made to identify the structure by its shape, size, and pattern. For example, bone can be identifi ed by the presence of trabeculae. Also, the degree of radiopacity may help; for instance, enamel is more radiopaque than bone. The following is a
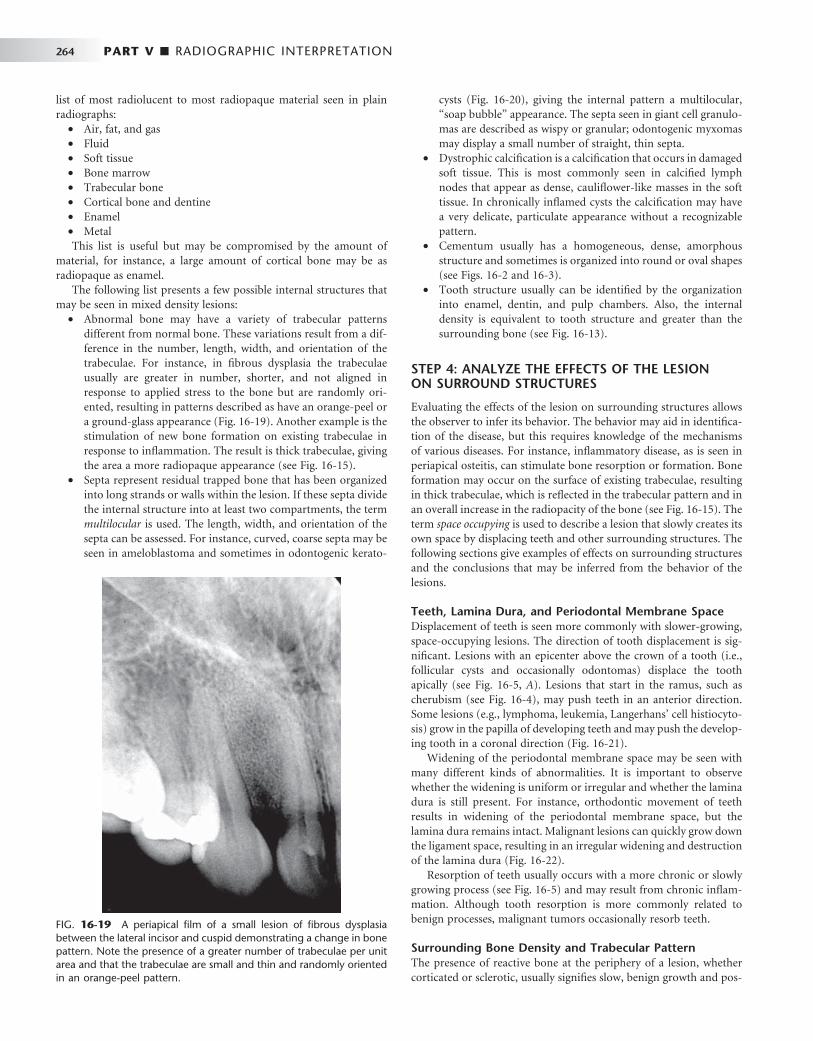
264 PART V ■ RADIOGRAPHIC INTERPRETATION
list of most radiolucent to most radiopaque material seen in plain radiographs:
• Air, fat, and gas • Fluid • Soft tissue • Bone marrow • Trabecular bone • Cortical bone and dentine • Enamel • Metal This list is useful but may be compromised by the amount of
material, for instance, a large amount of cortical bone may be as radiopaque as enamel.
The following list presents a few possible internal structures that may be seen in mixed density lesions:
• Abnormal bone may have a variety of trabecular patterns different from normal bone. These variations result from a dif-ference in the number, length, width, and orientation of the trabeculae. For instance, in fi brous dysplasia the trabeculae usually are greater in number, shorter, and not aligned in response to applied stress to the bone but are randomly ori-ented, resulting in patterns described as have an orange-peel or a ground-glass appearance ( Fig. 16-19 ). Another example is the stimulation of new bone formation on existing trabeculae in response to infl ammation. The result is thick trabeculae, giving the area a more radiopaque appearance (see Fig. 16-15 ).
• Septa represent residual trapped bone that has been organized into long strands or walls within the lesion. If these septa divide the internal structure into at least two compartments, the term multilocular is used. The length, width, and orientation of the septa can be assessed. For instance, curved, coarse septa may be seen in ameloblastoma and sometimes in odontogenic kerato-
cysts ( Fig. 16-20 ), giving the internal pattern a multilocular, “ soap bubble ” appearance. The septa seen in giant cell granulo-mas are described as wispy or granular; odontogenic myxomas may display a small number of straight, thin septa.
• Dystrophic calcifi cation is a calcifi cation that occurs in damaged soft tissue. This is most commonly seen in calcifi ed lymph nodes that appear as dense, caulifl ower-like masses in the soft tissue. In chronically infl amed cysts the calcifi cation may have a very delicate, particulate appearance without a recognizable pattern.
• Cementum usually has a homogeneous, dense, amorphous structure and sometimes is organized into round or oval shapes (see Figs. 16-2 and 16-3 ).
• Tooth structure usually can be identifi ed by the organization into enamel, dentin, and pulp chambers. Also, the internal density is equivalent to tooth structure and greater than the surrounding bone (see Fig. 16-13 ).
STEP 4: ANALYZE THE EFFECTS OF THE LESION ON SURROUND STRUCTURES
Evaluating the effects of the lesion on surrounding structures allows the observer to infer its behavior. The behavior may aid in identifi ca-tion of the disease, but this requires knowledge of the mechanisms of various diseases. For instance, infl ammatory disease, as is seen in periapical osteitis, can stimulate bone resorption or formation. Bone formation may occur on the surface of existing trabeculae, resulting in thick trabeculae, which is refl ected in the trabecular pattern and in an overall increase in the radiopacity of the bone (see Fig. 16-15 ). The term space occupying is used to describe a lesion that slowly creates its own space by displacing teeth and other surrounding structures. The following sections give examples of effects on surrounding structures and the conclusions that may be inferred from the behavior of the lesions.
Teeth, Lamina Dura, and Periodontal Membrane Space Displacement of teeth is seen more commonly with slower-growing, space-occupying lesions. The direction of tooth displacement is sig-nifi cant. Lesions with an epicenter above the crown of a tooth (i.e., follicular cysts and occasionally odontomas) displace the tooth apically (see Fig. 16-5, A ). Lesions that start in the ramus, such as cherubism (see Fig. 16-4 ), may push teeth in an anterior direction. Some lesions (e.g., lymphoma, leukemia, Langerhans ’ cell histiocyto-sis) grow in the papilla of developing teeth and may push the develop-ing tooth in a coronal direction ( Fig. 16-21 ).
Widening of the periodontal membrane space may be seen with many different kinds of abnormalities. It is important to observe whether the widening is uniform or irregular and whether the lamina dura is still present. For instance, orthodontic movement of teeth results in widening of the periodontal membrane space, but the lamina dura remains intact. Malignant lesions can quickly grow down the ligament space, resulting in an irregular widening and destruction of the lamina dura ( Fig. 16-22 ).
Resorption of teeth usually occurs with a more chronic or slowly growing process (see Fig. 16-5 ) and may result from chronic infl am-mation. Although tooth resorption is more commonly related to benign processes, malignant tumors occasionally resorb teeth.
Surrounding Bone Density and Trabecular Pattern The presence of reactive bone at the periphery of a lesion, whether corticated or sclerotic, usually signifi es slow, benign growth and pos-
FIG. 16-19 A periapical fi lm of a small lesion of fi brous dysplasia between the lateral incisor and cuspid demonstrating a change in bone pattern. Note the presence of a greater number of trabeculae per unit area and that the trabeculae are small and thin and randomly oriented in an orange-peel pattern.

CHAPTER 16 ■ PRINCIPLES OF RADIOGRAPHIC INTERPRETATION 265
FIG. 16-20 A, A periapical fi lm of an ameloblastoma. The multilocular pattern created by septa (arrows) divides the internal structure into small soap-bubble-like compartments. B, An axial CT image of an ameloblastoma has typically curved septa (arrow), whereas in C, a coronal CT image of a myxoma has typically straight septa (arrow).
A
B C
FIG. 16-21 Leukemic infi ltration of the mandible showing coronal displacement of the developing second molar (white arrow) from the remnants of its crypt (black arrow). There is a lack of a lamina dura around the apex of the fi rst molar and widening of the periodontal ligament space around the second deciduous molar.
sibly the ability to stimulate osteoblastic activity in the surrounding bone (see Fig. 16-3 ).
Inferior Alveolar Nerve Canal and Mental Foramen Some changes tend to be characteristic. For example, superior dis-placement of the inferior alveolar canal is strongly associated with fi brous dysplasia. Widening of the inferior alveolar canal with the maintenance of a cortical boundary may indicate the presence of a benign lesion of vascular or neural origin (see Fig. 16-8 ). Irregular widening with cortical destruction may indicate the pres-ence of a malignant neoplasm growing down the length of the canal.
Outer Cortical Bone and Periosteal Reactions The cortex of bone may remodel in response to a lesion. A slowly growing lesion may allow time for the outer periosteum to manufac-ture new bone so that the resulting expanded bone appears to have maintained an outer cortical plate (see Fig. 16-5 ). On the other hand,

266 PART V ■ RADIOGRAPHIC INTERPRETATION
a rapidly growing lesion outstrips the ability of the periosteum to respond, and the cortical plate may be missing (see Fig. 16-12 ). Exudate from an infl ammatory lesion can lift the periosteum off the surface of the cortical bone and then stimulate the periosteum to lay down new bone ( Fig. 16-23 ). When this process occurs more than once, an onion-skin type of pattern can be seen. This is most com-monly seen in infl ammatory lesions and more rarely in some malig-nant lesions (e.g., leukemia) and in Langerhans ’ cell histiocytosis. Some periosteal reactions are very specifi c, such as spiculated new bone formed at right angles to the outer cortical plate, which is seen
A B
FIG. 16-22 A and B, Periapical fi lms revealing a malignant lymphoma that has invaded the mandible. There is irregular widening of the periodontal ligament spaces (arrows).
FIG. 16-23 A panoramic image of osteomyelitis revealing at least two layers of new bone (arrows) produced by the periosteum at the inferior aspect of the mandible.
with metastatic lesions of the prostate gland or in a radiating pattern in osteogenic sarcoma ( Fig. 16-24 ).
STEP 5: FORMULATE A RADIOGRAPHIC INTERPRETATION
The preceding steps enable the observer to collect all the radiographic fi ndings in an organized fashion. ( Box 16-1 presents the process in
FIG. 16-24 Specimen radiograph of a resected mandible with an osteosarcoma. Note the fi ne linear spicules of bone at the superior margin of the alveolar process.
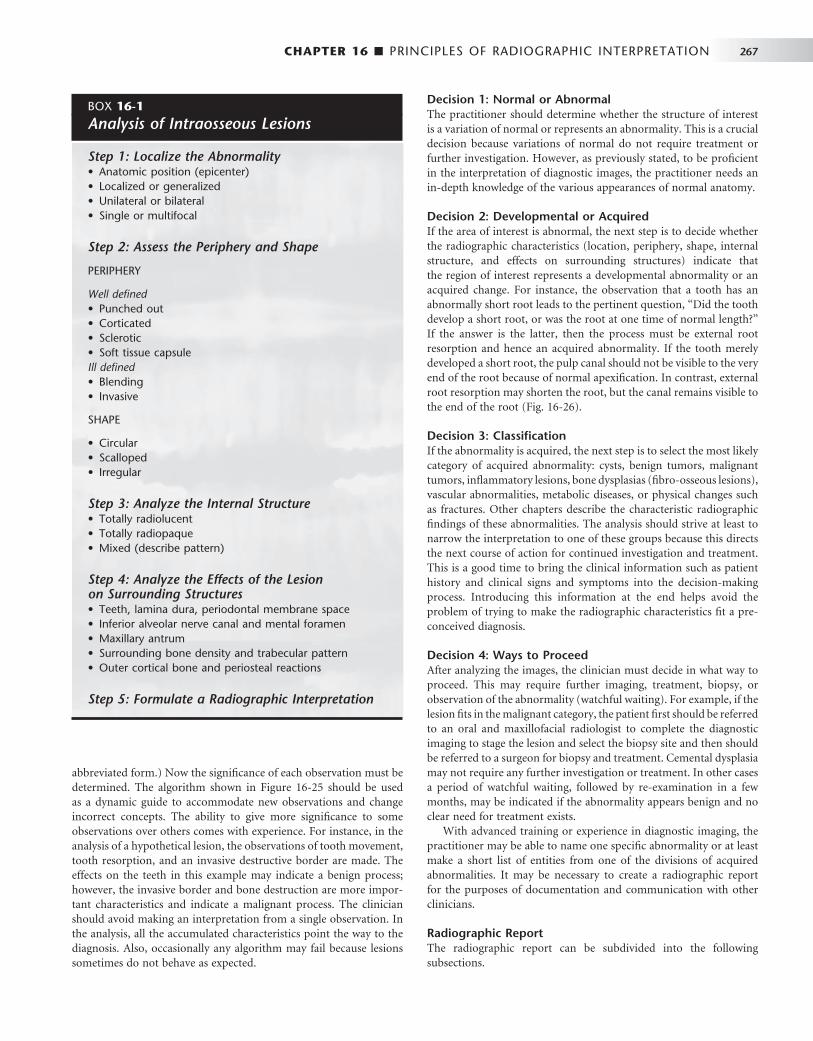
CHAPTER 16 ■ PRINCIPLES OF RADIOGRAPHIC INTERPRETATION 267
abbreviated form.) Now the signifi cance of each observation must be determined. The algorithm shown in Figure 16-25 should be used as a dynamic guide to accommodate new observations and change incorrect concepts. The ability to give more signifi cance to some observations over others comes with experience. For instance, in the analysis of a hypothetical lesion, the observations of tooth movement, tooth resorption, and an invasive destructive border are made. The effects on the teeth in this example may indicate a benign process; however, the invasive border and bone destruction are more impor-tant characteristics and indicate a malignant process. The clinician should avoid making an interpretation from a single observation. In the analysis, all the accumulated characteristics point the way to the diagnosis. Also, occasionally any algorithm may fail because lesions sometimes do not behave as expected.
Decision 1: Normal or Abnormal The practitioner should determine whether the structure of interest is a variation of normal or represents an abnormality. This is a crucial decision because variations of normal do not require treatment or further investigation. However, as previously stated, to be profi cient in the interpretation of diagnostic images, the practitioner needs an in-depth knowledge of the various appearances of normal anatomy.
Decision 2: Developmental or Acquired If the area of interest is abnormal, the next step is to decide whether the radiographic characteristics (location, periphery, shape, internal structure, and effects on surrounding structures) indicate that the region of interest represents a developmental abnormality or an acquired change. For instance, the observation that a tooth has an abnormally short root leads to the pertinent question, “ Did the tooth develop a short root, or was the root at one time of normal length? ” If the answer is the latter, then the process must be external root resorption and hence an acquired abnormality. If the tooth merely developed a short root, the pulp canal should not be visible to the very end of the root because of normal apexifi cation. In contrast, external root resorption may shorten the root, but the canal remains visible to the end of the root ( Fig. 16-26 ).
Decision 3: Classifi cation If the abnormality is acquired, the next step is to select the most likely category of acquired abnormality: cysts, benign tumors, malignant tumors, infl ammatory lesions, bone dysplasias (fi bro-osseous lesions), vascular abnormalities, metabolic diseases, or physical changes such as fractures. Other chapters describe the characteristic radiographic fi ndings of these abnormalities. The analysis should strive at least to narrow the interpretation to one of these groups because this directs the next course of action for continued investigation and treatment. This is a good time to bring the clinical information such as patient history and clinical signs and symptoms into the decision-making process. Introducing this information at the end helps avoid the problem of trying to make the radiographic characteristics fi t a pre-conceived diagnosis.
Decision 4: Ways to Proceed After analyzing the images, the clinician must decide in what way to proceed. This may require further imaging, treatment, biopsy, or observation of the abnormality (watchful waiting). For example, if the lesion fi ts in the malignant category, the patient fi rst should be referred to an oral and maxillofacial radiologist to complete the diagnostic imaging to stage the lesion and select the biopsy site and then should be referred to a surgeon for biopsy and treatment. Cemental dysplasia may not require any further investigation or treatment. In other cases a period of watchful waiting, followed by re-examination in a few months, may be indicated if the abnormality appears benign and no clear need for treatment exists.
With advanced training or experience in diagnostic imaging, the practitioner may be able to name one specifi c abnormality or at least make a short list of entities from one of the divisions of acquired abnormalities. It may be necessary to create a radiographic report for the purposes of documentation and communication with other clinicians.
Radiographic Report The radiographic report can be subdivided into the following subsections.
BOX 16-1
Analysis of Intraosseous Lesions
Step 1: Localize the Abnormality • Anatomic position (epicenter) • Localized or generalized • Unilateral or bilateral • Single or multifocal
Step 2: Assess the Periphery and Shape
PERIPHERY Well defi ned • Punched out • Corticated • Sclerotic • Soft tissue capsule Ill defi ned • Blending • Invasive
SHAPE • Circular • Scalloped • Irregular
Step 3: Analyze the Internal Structure • Totally radiolucent • Totally radiopaque • Mixed (describe pattern)
Step 4: Analyze the Effects of the Lesion on Surrounding Structures • Teeth, lamina dura, periodontal membrane space • Inferior alveolar nerve canal and mental foramen • Maxillary antrum • Surrounding bone density and trabecular pattern • Outer cortical bone and periosteal reactions
Step 5: Formulate a Radiographic Interpretation
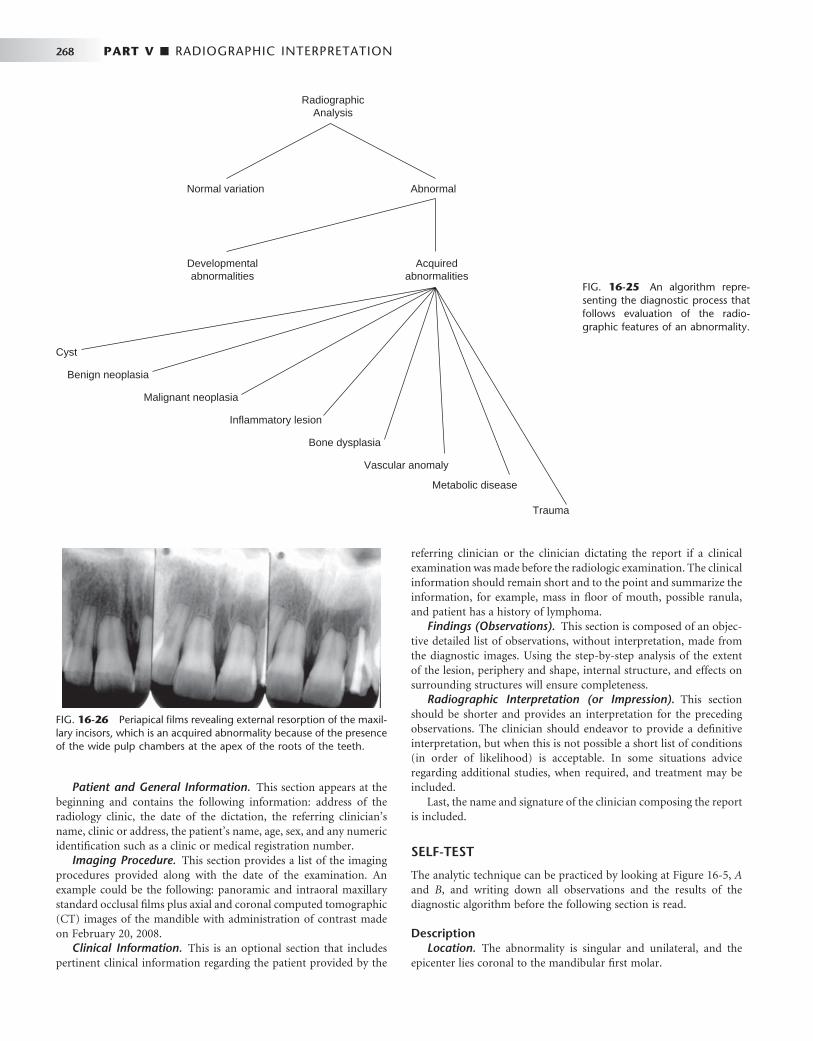
268 PART V ■ RADIOGRAPHIC INTERPRETATION
Patient and General Information. This section appears at the beginning and contains the following information: address of the radiology clinic, the date of the dictation, the referring clinician ’ s name, clinic or address, the patient ’ s name, age, sex, and any numeric identifi cation such as a clinic or medical registration number.
Imaging Procedure. This section provides a list of the imaging procedures provided along with the date of the examination. An example could be the following: panoramic and intraoral maxillary standard occlusal fi lms plus axial and coronal computed tomographic (CT) images of the mandible with administration of contrast made on February 20, 2008.
Clinical Information. This is an optional section that includes pertinent clinical information regarding the patient provided by the
RadiographicAnalysis
Normal variation Abnormal
Developmentalabnormalities
Acquiredabnormalities
Cyst
Benign neoplasia
Malignant neoplasia
Inflammatory lesion
Bone dysplasia
Vascular anomaly
Metabolic disease
Trauma
FIG. 16-25 An algorithm repre-senting the diagnostic process that follows evaluation of the radio-graphic features of an abnormality.
referring clinician or the clinician dictating the report if a clinical examination was made before the radiologic examination. The clinical information should remain short and to the point and summarize the information, for example, mass in fl oor of mouth, possible ranula, and patient has a history of lymphoma.
Findings (Observations). This section is composed of an objec-tive detailed list of observations, without interpretation, made from the diagnostic images. Using the step-by-step analysis of the extent of the lesion, periphery and shape, internal structure, and effects on surrounding structures will ensure completeness.
Radiographic Interpretation (or Impression). This section should be shorter and provides an interpretation for the preceding observations. The clinician should endeavor to provide a defi nitive interpretation, but when this is not possible a short list of conditions (in order of likelihood) is acceptable. In some situations advice regarding additional studies, when required, and treatment may be included.
Last, the name and signature of the clinician composing the report is included.
SELF-TEST
The analytic technique can be practiced by looking at Figure 16-5, A and B , and writing down all observations and the results of the diagnostic algorithm before the following section is read.
Description Location. The abnormality is singular and unilateral, and the
epicenter lies coronal to the mandibular fi rst molar.
FIG. 16-26 Periapical fi lms revealing external resorption of the maxil-lary incisors, which is an acquired abnormality because of the presence of the wide pulp chambers at the apex of the roots of the teeth.

CHAPTER 16 ■ PRINCIPLES OF RADIOGRAPHIC INTERPRETATION 269
Periphery and Shape. The lesion has a well-defi ned cortical boundary and a spherical or round shape. The periphery also attaches to the cementoenamel junction.
Internal Structure. The internal structure is totally radiolucent. Effects. This lesion has displaced the fi rst molar in an apical direc-
tion, which reinforces the decision that the origin was coronal to this tooth. Also, the lesion has displaced the second molar distally and the second premolar in an anterior direction. Apical resorption of the distal root of the second deciduous molar has occurred. The occlusal radiograph reveals that the buccal cortical plate has expanded in a smooth, curved shape, and a thin cortical boundary still exists.
Analysis. Making all the observations is an important fi rst step; the following is an analysis built on these observations. To accomplish this next step, further knowledge of pathologic conditions and a certain amount of practice are required. The fi rst objective is to select the correct category of diseases (e.g., infl ammatory, benign tumor, cyst); at this point, the clinician should try not to let all the names of specifi c diseases be overwhelming.
These images reveal an abnormal appearance. The coronal loca-tion of the lesion suggests that the tissue making up this abnormality
probably is derived from a component of the dental follicle. The effects on the surrounding structures indicate that this abnormality is acquired. The displacement and resorption of teeth, intact peripheral cortex, curved shape, and radiolucent internal structure all indicate a slow-growing, benign, space-occupying lesion, most likely in the cyst category. Odontogenic tumors such as an ameloblastic fi broma may be considered but are less likely because of the shape. The most common type of cyst in a follicular location is a dentigerous cyst. Odontogenic keratocysts occasionally are seen in this location, but the tooth resorption and degree of expansion are not characteristic of that pathologic condition. Therefore the fi nal interpretation is a follicular cyst, with odontogenic keratocyst and ameloblastic fi broma as possi-bilities in the differential diagnosis but less likely. Treatment usually is indicated for follicular cysts; therefore the patient is referred for surgical consultation.
BIBLIOGRAPHY 1 Worth HM : Principles and practice of oral radiologic interpretation , Chicago ,
1972 , Mosby .
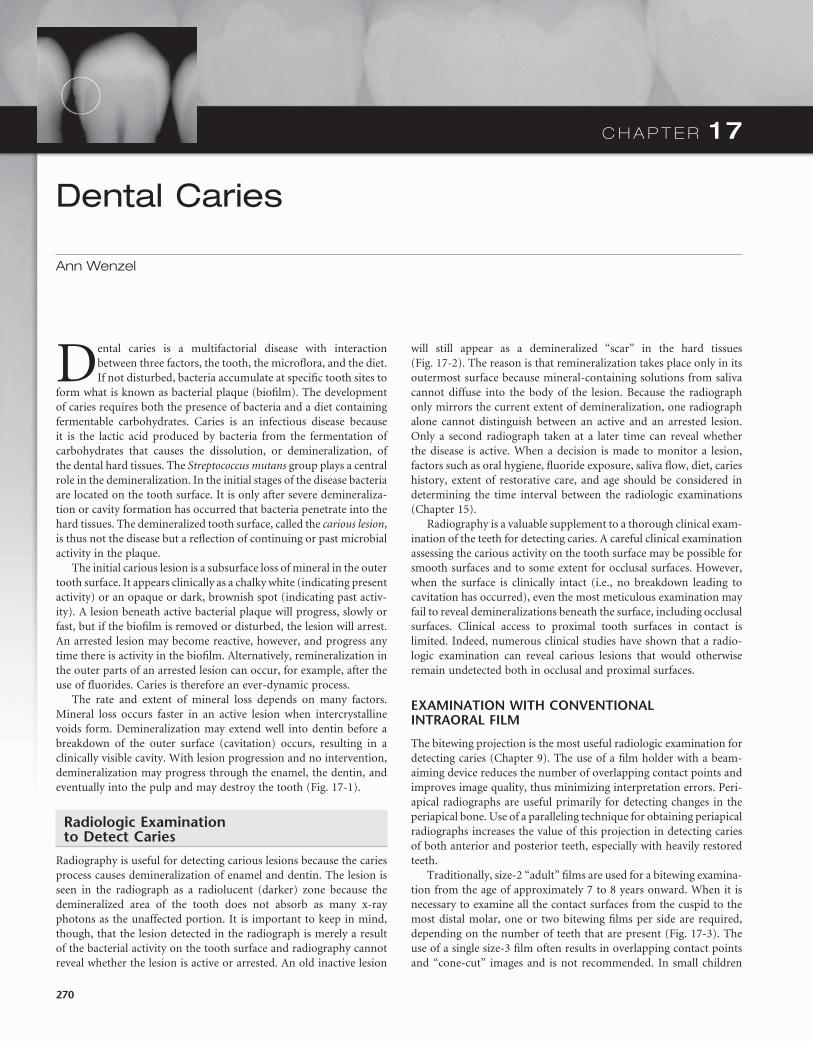
C H A P T E R 1 7
Dental Caries
Ann Wenzel
Dental caries is a multifactorial disease with interaction between three factors, the tooth, the microfl ora, and the diet. If not disturbed, bacteria accumulate at specifi c tooth sites to
form what is known as bacterial plaque (biofi lm). The development of caries requires both the presence of bacteria and a diet containing fermentable carbohydrates. Caries is an infectious disease because it is the lactic acid produced by bacteria from the fermentation of carbohydrates that causes the dissolution, or demineralization, of the dental hard tissues. The Streptococcus mutans group plays a central role in the demineralization. In the initial stages of the disease bacteria are located on the tooth surface. It is only after severe demineraliza-tion or cavity formation has occurred that bacteria penetrate into the hard tissues. The demineralized tooth surface, called the carious lesion , is thus not the disease but a refl ection of continuing or past microbial activity in the plaque.
The initial carious lesion is a subsurface loss of mineral in the outer tooth surface. It appears clinically as a chalky white (indicating present activity) or an opaque or dark, brownish spot (indicating past activ-ity). A lesion beneath active bacterial plaque will progress, slowly or fast, but if the biofi lm is removed or disturbed, the lesion will arrest. An arrested lesion may become reactive, however, and progress any time there is activity in the biofi lm. Alternatively, remineralization in the outer parts of an arrested lesion can occur, for example, after the use of fl uorides. Caries is therefore an ever-dynamic process.
The rate and extent of mineral loss depends on many factors. Mineral loss occurs faster in an active lesion when intercrystalline voids form. Demineralization may extend well into dentin before a breakdown of the outer surface (cavitation) occurs, resulting in a clinically visible cavity. With lesion progression and no intervention, demineralization may progress through the enamel, the dentin, and eventually into the pulp and may destroy the tooth ( Fig. 17-1 ).
Radiologic Examination to Detect Caries
Radiography is useful for detecting carious lesions because the caries process causes demineralization of enamel and dentin. The lesion is seen in the radiograph as a radiolucent (darker) zone because the demineralized area of the tooth does not absorb as many x-ray photons as the unaffected portion. It is important to keep in mind, though, that the lesion detected in the radiograph is merely a result of the bacterial activity on the tooth surface and radiography cannot reveal whether the lesion is active or arrested. An old inactive lesion
will still appear as a demineralized “ scar ” in the hard tissues ( Fig. 17-2 ). The reason is that remineralization takes place only in its outermost surface because mineral-containing solutions from saliva cannot diffuse into the body of the lesion. Because the radiograph only mirrors the current extent of demineralization, one radiograph alone cannot distinguish between an active and an arrested lesion. Only a second radiograph taken at a later time can reveal whether the disease is active. When a decision is made to monitor a lesion, factors such as oral hygiene, fl uoride exposure, saliva fl ow, diet, caries history, extent of restorative care, and age should be considered in determining the time interval between the radiologic examinations ( Chapter 15 ).
Radiography is a valuable supplement to a thorough clinical exam-ination of the teeth for detecting caries. A careful clinical examination assessing the carious activity on the tooth surface may be possible for smooth surfaces and to some extent for occlusal surfaces. However, when the surface is clinically intact (i.e., no breakdown leading to cavitation has occurred), even the most meticulous examination may fail to reveal demineralizations beneath the surface, including occlusal surfaces. Clinical access to proximal tooth surfaces in contact is limited. Indeed, numerous clinical studies have shown that a radio-logic examination can reveal carious lesions that would otherwise remain undetected both in occlusal and proximal surfaces.
EXAMINATION WITH CONVENTIONAL INTRAORAL FILM
The bitewing projection is the most useful radiologic examination for detecting caries ( Chapter 9 ). The use of a fi lm holder with a beam-aiming device reduces the number of overlapping contact points and improves image quality, thus minimizing interpretation errors. Peri-apical radiographs are useful primarily for detecting changes in the periapical bone. Use of a paralleling technique for obtaining periapical radiographs increases the value of this projection in detecting caries of both anterior and posterior teeth, especially with heavily restored teeth.
Traditionally, size-2 “ adult ” fi lms are used for a bitewing examina-tion from the age of approximately 7 to 8 years onward. When it is necessary to examine all the contact surfaces from the cuspid to the most distal molar, one or two bitewing fi lms per side are required, depending on the number of teeth that are present ( Fig. 17-3 ). The use of a single size-3 fi lm often results in overlapping contact points and “ cone-cut ” images and is not recommended. In small children
270
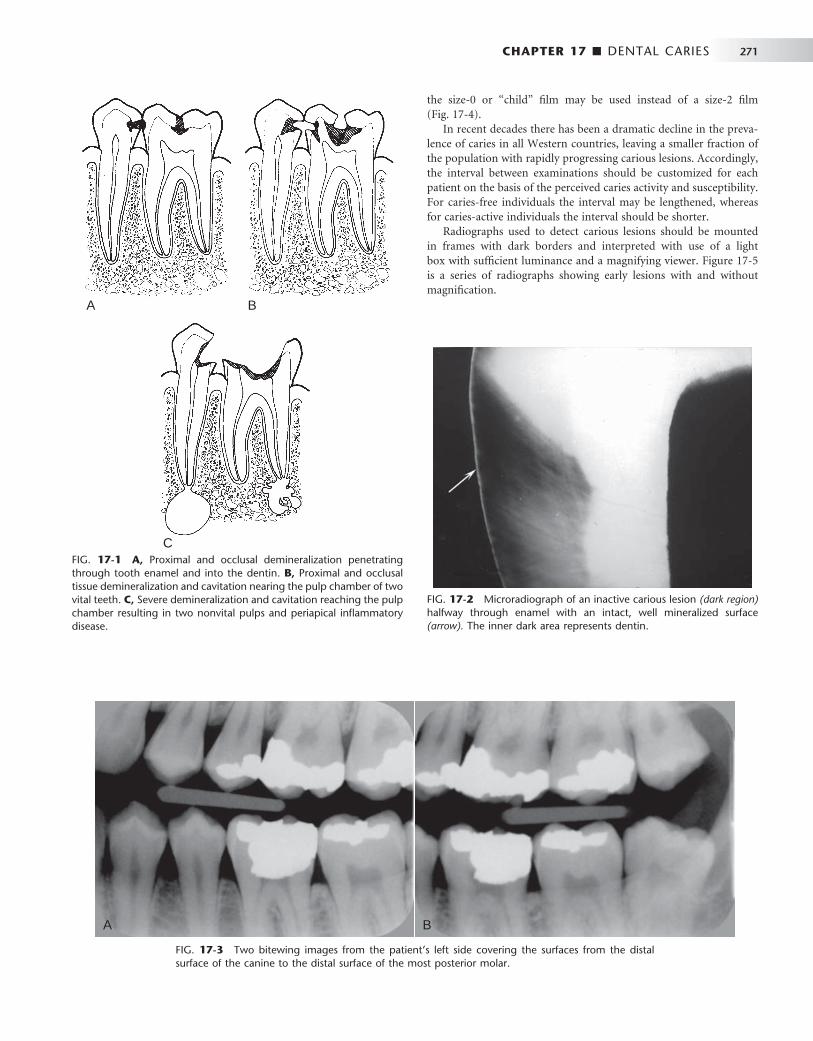
CHAPTER 17 ■ DENTAL CARIES 271
FIG. 17-1 A, Proximal and occlusal demineralization penetrating through tooth enamel and into the dentin. B, Proximal and occlusal tissue demineralization and cavitation nearing the pulp chamber of two vital teeth. C, Severe demineralization and cavitation reaching the pulp chamber resulting in two nonvital pulps and periapical infl ammatory disease.
A B
C
FIG. 17-2 Microradiograph of an inactive carious lesion (dark region) halfway through enamel with an intact, well mineralized surface (arrow). The inner dark area represents dentin.
FIG. 17-3 Two bitewing images from the patient ’ s left side covering the surfaces from the distal surface of the canine to the distal surface of the most posterior molar.
A B
the size-0 or “ child ” fi lm may be used instead of a size-2 fi lm ( Fig. 17-4 ).
In recent decades there has been a dramatic decline in the preva-lence of caries in all Western countries, leaving a smaller fraction of the population with rapidly progressing carious lesions. Accordingly, the interval between examinations should be customized for each patient on the basis of the perceived caries activity and susceptibility. For caries-free individuals the interval may be lengthened, whereas for caries-active individuals the interval should be shorter.
Radiographs used to detect carious lesions should be mounted in frames with dark borders and interpreted with use of a light box with suffi cient luminance and a magnifying viewer. Figure 17-5 is a series of radiographs showing early lesions with and without magnifi cation.

272 PART V ■ RADIOGRAPHIC INTERPRETATION
bitewing examination. First, the surface area of the sensor is smaller than the surface area of a size-2 fi lm, resulting in the display of fewer interproximal tooth surfaces per bitewing image than with fi lm. Further, the stiffness and increased thickness of these sensors may result in more projection errors and retakes. When digital bitewing images are used, they should be displayed on a monitor in their full resolution for interpretation and viewed in a room with subdued light.
Radiographic Detection of Lesions
PROXIMAL SURFACES
Typical Radiographic Appearance
The shape of the early radiolucent lesion in the enamel is classically a triangle with its broad base at the tooth surface ( Fig. 17-5 ) spreading along the enamel rods, but other appearances are common, such as a “ notch, ” a dot, a band, or a thin line ( Fig. 17-6 ). When the demineral-izing front reaches the dentinoenamel junction (DEJ), it spreads along the junction, frequently forming the base of a second triangle with apex directed toward the pulp chamber ( Fig. 17-7 ). This triangle typi-cally has a wider base than in the enamel and progresses toward the pulp along the direction of the dentinal tubules. Again, more irregular shapes of decalcifi cation may be seen.
Lesions involving proximal surfaces most commonly are found in the area between the contact point and the free gingival margin ( Fig. 17-8 ). The fact that this type of lesion does not start below the gingival margin helps distinguish a carious lesion from cervical burnout. Close attention should be paid to intact proximal surfaces adjacent to a tooth surface with a restoration because occasionally this surface is inadvertently damaged during the restorative procedure and is thus at greater risk for caries ( Fig. 17-9 ).
FIG. 17-4 This bitewing image of the mixed dentition demonstrates dentinal carious lesions involving the mesial and distal surfaces of the second deciduous molars and small enamel lesions in the mesial sur-faces of the fi rst permanent molars. An extensive lesion involves the crown and root structure of the mandibular fi rst deciduous molar.
FIG. 17-5 An example of the use of image magnifi cation to detect enamel carious lesions in premolars. A and C are not mag-nifi ed. B and D are magnifi ed.
A
C D
B
EXAMINATION WITH DIGITAL IMAGING
Digital image receptors may replace fi lm for intraoral radiography. There are two different methods available: (1) solid-state sensors (charge-coupled device [CCD] and complementary metal oxide semi-conductor technology [CMOS]) with a cord that connects the recep-tor to the computer or without a cord (signal is transferred by radio wave) and (2) storage phosphors (PSP plates) that use a fi lmlike plate that is processed (scanned) after exposure ( Chapter 7 ). The holders available for bitewing examinations with phosphor plates appear like those for fi lm, and universal sensor holders are also available. However, there may be some problems when solid-state sensors are used for

CHAPTER 17 ■ DENTAL CARIES 273
FIG. 17-6 A, This bitewing image demonstrates bandlike lesions involving the enamel of the maxil-lary premolars and a triangular lesion (arrow) in the mandibular second premolar. B, This bitewing image shows an enamel lesion (arrow) and a lesion extending into the dentin involving the mesial surface of the maxillary second molar. C, This bitewing image reveals lesions involving the enamel of the mandibular second premolar (white arrow) and the distal surface of the maxillary second premolar and lesions extending into the dentin of the mesial surface of the maxillary fi rst molar and the distal surface of the fi rst premolar (black arrow).
A B C
FIG. 17-7 A, This periapical image demonstrates several proximal carious lesions that have extended into the dentin. Note that the lesions extend along the dentinoenamel junction to involve a greater amount of dentin than enamel (arrow). B, This bitewing image demonstrates an extensive proximal carious lesion involving the distal aspect of the mandibular fi rst molar (arrow). Note that the pulp horn has been reduced as a result of the formation of tertiary (irritation) dentin. C, This bitewing image shows two lesions involving the dentin in the distal surfaces of the second premolars, and one lesion has resulted in cavitation (arrow).
A B C
Because the proximal surfaces of posterior teeth are often broad, the loss of small amounts of mineral from incipient lesions and the advancing front of active lesions are often diffi cult to detect in the radiographic image. Lesions confi ned to enamel may not be evident radiographically until approximately 30% to 40% demineralization has occurred. For this reason, the actual depth of penetration of a carious lesion is often deeper than seen radiographically.
False Interpretations Even experienced dentists often do not agree on the presence or absence of carious lesions when examining the same set of radio-
graphs, especially when the lesions are limited to the enamel. On occasion a carious lesion may be incorrectly detected when the tooth surface is actually unaffected (a false-positive outcome). Various mor-phologic phenomena, such as pits and fi ssures, cervical burnout, and Mach band effect, and dental anomalies, such as hypoplastic pits and concavities produced by wear, can mimic the appearance of a carious lesion ( Fig. 17-10 ). In cases where the demineralization is not yet radiographically visible, failure to detect the lesion is a false-negative outcome ( Fig. 17-11 ). Also, overlapping contact points in the radio-graphic image may obscure a lesion ( Fig. 17-12 ). Approximately half of all proximal lesions in enamel cannot be detected by radiography.
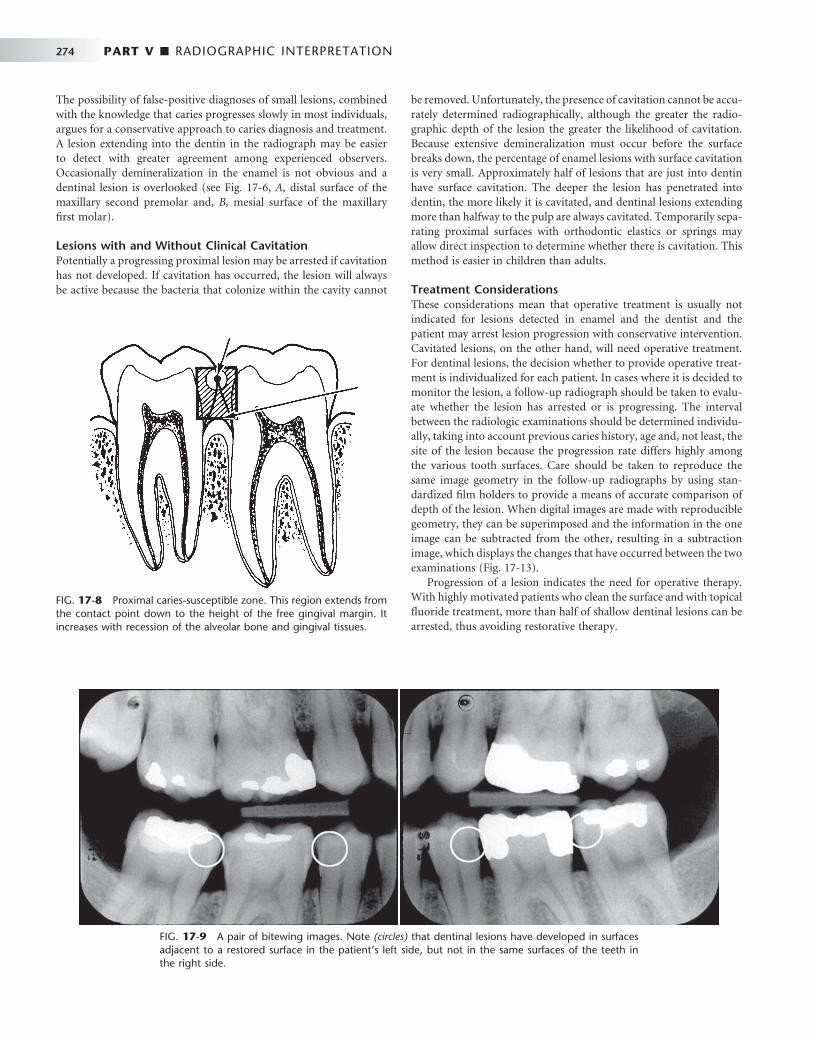
274 PART V ■ RADIOGRAPHIC INTERPRETATION
FIG. 17-8 Proximal caries-susceptible zone. This region extends from the contact point down to the height of the free gingival margin. It increases with recession of the alveolar bone and gingival tissues.
FIG. 17-9 A pair of bitewing images. Note (circles) that dentinal lesions have developed in surfaces adjacent to a restored surface in the patient ’ s left side, but not in the same surfaces of the teeth in the right side.
The possibility of false-positive diagnoses of small lesions, combined with the knowledge that caries progresses slowly in most individuals, argues for a conservative approach to caries diagnosis and treatment. A lesion extending into the dentin in the radiograph may be easier to detect with greater agreement among experienced observers. Occasionally demineralization in the enamel is not obvious and a dentinal lesion is overlooked (see Fig. 17-6 , A, distal surface of the maxillary second premolar and, B, mesial surface of the maxillary fi rst molar).
Lesions with and Without Clinical Cavitation Potentially a progressing proximal lesion may be arrested if cavitation has not developed. If cavitation has occurred, the lesion will always be active because the bacteria that colonize within the cavity cannot
be removed. Unfortunately, the presence of cavitation cannot be accu-rately determined radiographically, although the greater the radio-graphic depth of the lesion the greater the likelihood of cavitation. Because extensive demineralization must occur before the surface breaks down, the percentage of enamel lesions with surface cavitation is very small. Approximately half of lesions that are just into dentin have surface cavitation. The deeper the lesion has penetrated into dentin, the more likely it is cavitated, and dentinal lesions extending more than halfway to the pulp are always cavitated. Temporarily sepa-rating proximal surfaces with orthodontic elastics or springs may allow direct inspection to determine whether there is cavitation. This method is easier in children than adults.
Treatment Considerations These considerations mean that operative treatment is usually not indicated for lesions detected in enamel and the dentist and the patient may arrest lesion progression with conservative intervention. Cavitated lesions, on the other hand, will need operative treatment. For dentinal lesions, the decision whether to provide operative treat-ment is individualized for each patient. In cases where it is decided to monitor the lesion, a follow-up radiograph should be taken to evalu-ate whether the lesion has arrested or is progressing. The interval between the radiologic examinations should be determined individu-ally, taking into account previous caries history, age and, not least, the site of the lesion because the progression rate differs highly among the various tooth surfaces. Care should be taken to reproduce the same image geometry in the follow-up radiographs by using stan-dardized fi lm holders to provide a means of accurate comparison of depth of the lesion. When digital images are made with reproducible geometry, they can be superimposed and the information in the one image can be subtracted from the other, resulting in a subtraction image, which displays the changes that have occurred between the two examinations ( Fig. 17-13 ).
Progression of a lesion indicates the need for operative therapy. With highly motivated patients who clean the surface and with topical fl uoride treatment, more than half of shallow dentinal lesions can be arrested, thus avoiding restorative therapy.

CHAPTER 17 ■ DENTAL CARIES 275
FIG. 17-10 A, This periapical image reveals a radiolucent region similar in appearance to a carious lesion in the distal cervical aspect of the maxillary cuspid, which is caused by abrasion from a clasp from a partial denture. B, In this bitewing image cervical burnout (arrows) can mimic carious lesions. C, In this periapical image a small concavity in the mesial surface of the lateral incisor creates a radio-lucent region similar in appearance to a carious lesion (arrow). D, In this periapical image a band of enamel hypoplasia involving the left central incisor produces a linear radiolucent region that may be misinterpreted as carious lesion. E, In this bitewing image the overlapping shadow of the alveolar process creates a Mach band effect (arrows) resulting in apparent radiolucent regions in the crowns of the premolars and fi rst molar that may mimic carious lesions.
A B
C D
E
FIG. 17-11 A, A radiograph of an extracted tooth with a lesion just into dentin in the left side (circle) but no visible lesion in the right side. B, The same tooth after sectioning assessed under a microscope reveals lesions in both sides; the lesion in the right side is only in enamel. Note that enamel in the left side has broken off during sectioning.
A B
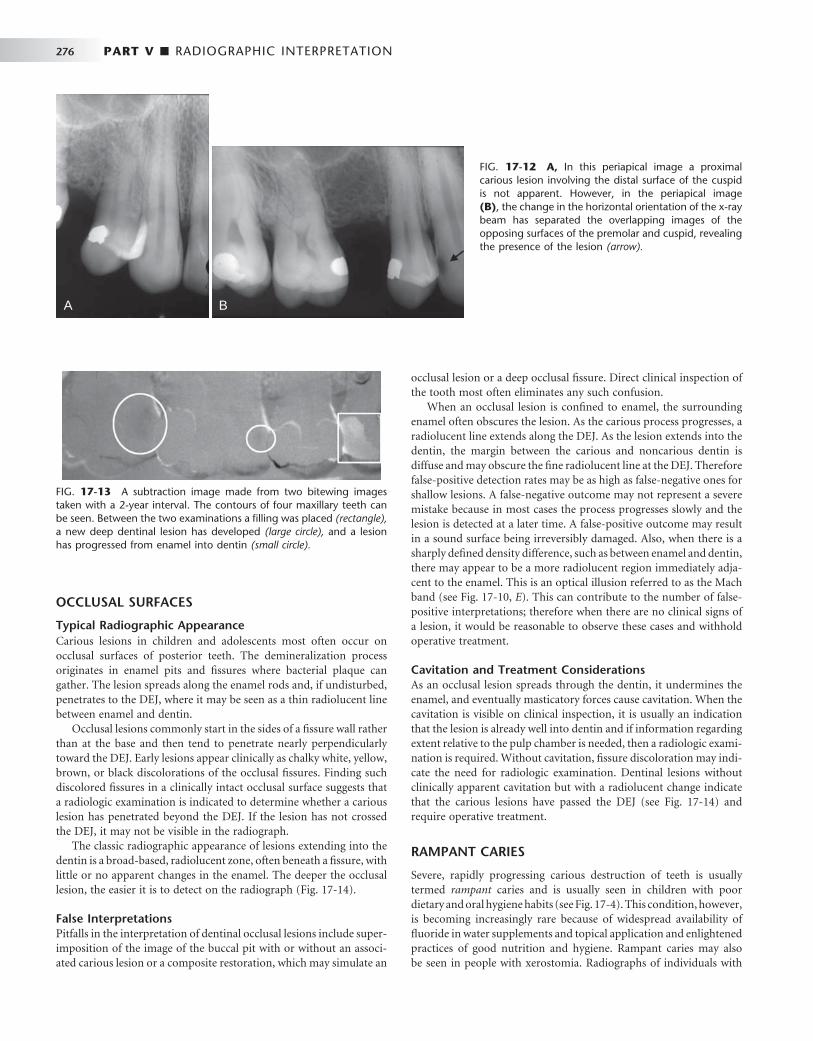
276 PART V ■ RADIOGRAPHIC INTERPRETATION
FIG. 17-12 A, In this periapical image a proximal carious lesion involving the distal surface of the cuspid is not apparent. However, in the periapical image (B) , the change in the horizontal orientation of the x-ray beam has separated the overlapping images of the opposing surfaces of the premolar and cuspid, revealing the presence of the lesion (arrow).
A B
FIG. 17-13 A subtraction image made from two bitewing images taken with a 2-year interval. The contours of four maxillary teeth can be seen. Between the two examinations a fi lling was placed (rectangle), a new deep dentinal lesion has developed (large circle), and a lesion has progressed from enamel into dentin (small circle).
OCCLUSAL SURFACES
Typical Radiographic Appearance Carious lesions in children and adolescents most often occur on occlusal surfaces of posterior teeth. The demineralization process originates in enamel pits and fi ssures where bacterial plaque can gather. The lesion spreads along the enamel rods and, if undisturbed, penetrates to the DEJ, where it may be seen as a thin radiolucent line between enamel and dentin.
Occlusal lesions commonly start in the sides of a fi ssure wall rather than at the base and then tend to penetrate nearly perpendicularly toward the DEJ. Early lesions appear clinically as chalky white, yellow, brown, or black discolorations of the occlusal fi ssures. Finding such discolored fi ssures in a clinically intact occlusal surface suggests that a radiologic examination is indicated to determine whether a carious lesion has penetrated beyond the DEJ. If the lesion has not crossed the DEJ, it may not be visible in the radiograph.
The classic radiographic appearance of lesions extending into the dentin is a broad-based, radiolucent zone, often beneath a fi ssure, with little or no apparent changes in the enamel. The deeper the occlusal lesion, the easier it is to detect on the radiograph ( Fig. 17-14 ).
False Interpretations Pitfalls in the interpretation of dentinal occlusal lesions include super-imposition of the image of the buccal pit with or without an associ-ated carious lesion or a composite restoration, which may simulate an
occlusal lesion or a deep occlusal fi ssure. Direct clinical inspection of the tooth most often eliminates any such confusion.
When an occlusal lesion is confi ned to enamel, the surrounding enamel often obscures the lesion. As the carious process progresses, a radiolucent line extends along the DEJ. As the lesion extends into the dentin, the margin between the carious and noncarious dentin is diffuse and may obscure the fi ne radiolucent line at the DEJ. Therefore false-positive detection rates may be as high as false-negative ones for shallow lesions. A false-negative outcome may not represent a severe mistake because in most cases the process progresses slowly and the lesion is detected at a later time. A false-positive outcome may result in a sound surface being irreversibly damaged. Also, when there is a sharply defi ned density difference, such as between enamel and dentin, there may appear to be a more radiolucent region immediately adja-cent to the enamel. This is an optical illusion referred to as the Mach band (see Fig. 17-10, E ). This can contribute to the number of false-positive interpretations; therefore when there are no clinical signs of a lesion, it would be reasonable to observe these cases and withhold operative treatment.
Cavitation and Treatment Considerations As an occlusal lesion spreads through the dentin, it undermines the enamel, and eventually masticatory forces cause cavitation. When the cavitation is visible on clinical inspection, it is usually an indication that the lesion is already well into dentin and if information regarding extent relative to the pulp chamber is needed, then a radiologic exami-nation is required. Without cavitation, fi ssure discoloration may indi-cate the need for radiologic examination. Dentinal lesions without clinically apparent cavitation but with a radiolucent change indicate that the carious lesions have passed the DEJ (see Fig. 17-14 ) and require operative treatment.
RAMPANT CARIES
Severe, rapidly progressing carious destruction of teeth is usually termed rampant caries and is usually seen in children with poor dietary and oral hygiene habits (see Fig. 17-4 ). This condition, however, is becoming increasingly rare because of widespread availability of fl uoride in water supplements and topical application and enlightened practices of good nutrition and hygiene. Rampant caries may also be seen in people with xerostomia. Radiographs of individuals with

CHAPTER 17 ■ DENTAL CARIES 277
rampant caries demonstrate severe (advanced) carious destructions, especially of the mandibular anterior teeth.
BUCCAL AND LINGUAL SURFACES
Buccal and lingual carious lesions often occur in enamel pits and fi s-sures of teeth. When small, these lesions are usually round; as they enlarge, they become elliptic or semilunar. They demonstrate sharp, well-defi ned borders.
It may be diffi cult to differentiate between buccal and lingual carious lesions on a radiograph. When viewing buccal or lingual lesions, the clinician should look for a uniform noncarious region of enamel surrounding the apparent radiolucency ( Fig. 17-15 ). This well-defi ned circular area represents parallel noncarious enamel rods surrounding the buccal or palatal lesion. Occlusal lesions, however, ordinarily are more extensive than lingual or buccal caries, and their outline is not as well defi ned. Clinical evaluation with visual and tactile methods is usually the defi nitive method of detecting buccal or lingual lesions.
ROOT SURFACES
Root surface lesions involve both cementum and dentin and are asso-ciated with gingival recession. The exposed cementum is relatively soft and usually only 20 to 50 μ m thick near the cementoenamel junction, so it rapidly degrades by attrition, abrasion, and erosion. Root surface caries should be detected clinically, and most often radiographs are not needed for diagnosis. In proximal root surfaces radiologic exami-nation may reveal lesions that have gone undetected ( Fig. 17-16 ).
A pitfall in the detection of root lesions is that a surface may appear to be carious as a result of the cervical burnout phenomenon (see Figs. 17-10, B, and 17-16, C ). The true carious lesion may be distinguished from the intact surface primarily by the absence of an image of the
FIG. 17-14 A and B, These bitewing images demonstrate a classic appear-ance of an occlusal carious lesion with a triangular shape in the enamel with the base oriented to the dentinoenamel junction (arrows). The bitewing image (C) is not as clear, but there is an ill-defi ned radiolucent region under the occlusal enamel surface (arrow). In the periapical image (D) there is a subtle occlusal lesion in the fi rst molar (short arrow) and an extensive cavitated lesion in the second molar (long arrow).
A
C D
B
FIG. 17-15 This bitewing image reveals the presence of a small buccal lesion (arrow) involving the mandibular fi rst molar. Note the presence of 12 proximal carious lesions. Also, the abnormal position of the mandibular third molar created an enhanced site for plaque accumulation resulting in an extensive carious lesion involving the second molar.
root edge and by the appearance of a diffuse rounded inner border where the tooth substance has been lost.
ASSOCIATED WITH DENTAL RESTORATIONS
A carious lesion developing at the margin of an existing restoration may be termed secondary or recurrent caries. It should be noted, though, that a lesion developing in a restored surface is most fre-quently a new primary demineralization, either because of faulty shaping or inadequate extension of the restoration leading to plaque accumulation ( Fig. 17-17 ). These lesions (secondary caries) should be treated as any new carious lesion. It is important not to confuse secondary (primary) caries with residual caries, which is caries that
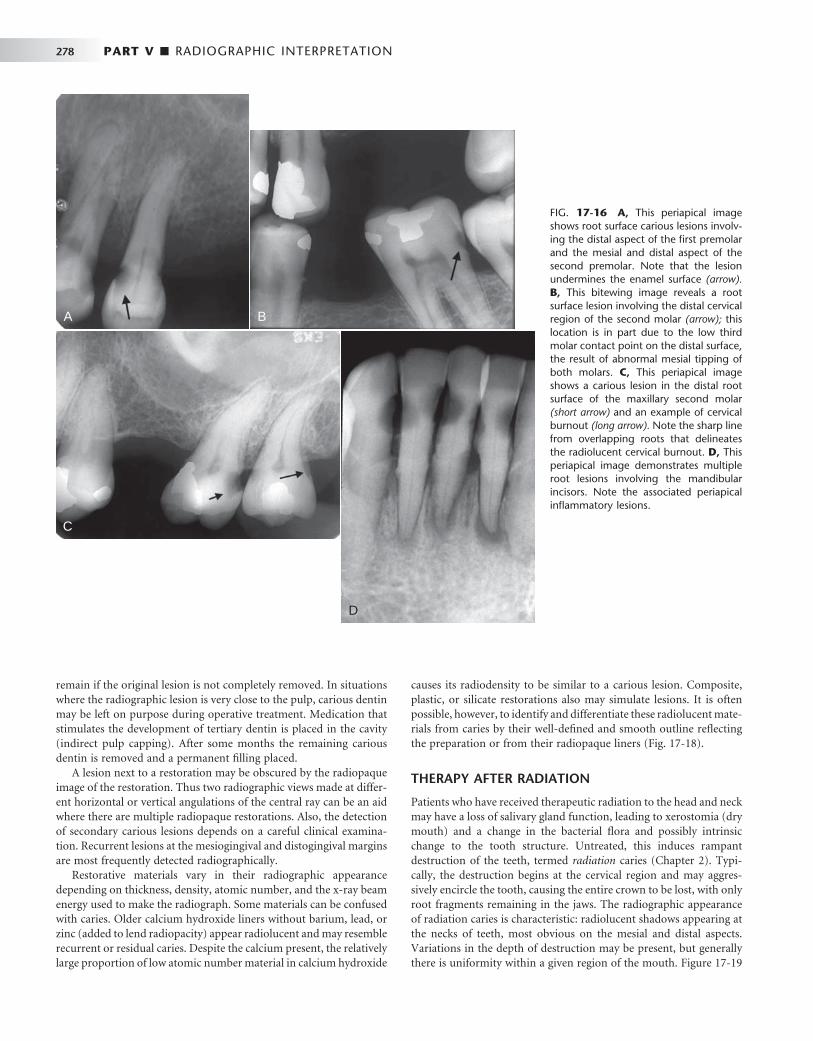
278 PART V ■ RADIOGRAPHIC INTERPRETATION
remain if the original lesion is not completely removed. In situations where the radiographic lesion is very close to the pulp, carious dentin may be left on purpose during operative treatment. Medication that stimulates the development of tertiary dentin is placed in the cavity (indirect pulp capping). After some months the remaining carious dentin is removed and a permanent fi lling placed.
A lesion next to a restoration may be obscured by the radiopaque image of the restoration. Thus two radiographic views made at differ-ent horizontal or vertical angulations of the central ray can be an aid where there are multiple radiopaque restorations. Also, the detection of secondary carious lesions depends on a careful clinical examina-tion. Recurrent lesions at the mesiogingival and distogingival margins are most frequently detected radiographically.
Restorative materials vary in their radiographic appearance depending on thickness, density, atomic number, and the x-ray beam energy used to make the radiograph. Some materials can be confused with caries. Older calcium hydroxide liners without barium, lead, or zinc (added to lend radiopacity) appear radiolucent and may resemble recurrent or residual caries. Despite the calcium present, the relatively large proportion of low atomic number material in calcium hydroxide
causes its radiodensity to be similar to a carious lesion. Composite, plastic, or silicate restorations also may simulate lesions. It is often possible, however, to identify and differentiate these radiolucent mate-rials from caries by their well-defi ned and smooth outline refl ecting the preparation or from their radiopaque liners ( Fig. 17-18 ).
THERAPY AFTER RADIATION
Patients who have received therapeutic radiation to the head and neck may have a loss of salivary gland function, leading to xerostomia (dry mouth) and a change in the bacterial fl ora and possibly intrinsic change to the tooth structure. Untreated, this induces rampant destruction of the teeth, termed radiation caries ( Chapter 2 ). Typi-cally, the destruction begins at the cervical region and may aggres-sively encircle the tooth, causing the entire crown to be lost, with only root fragments remaining in the jaws. The radiographic appearance of radiation caries is characteristic: radiolucent shadows appearing at the necks of teeth, most obvious on the mesial and distal aspects. Variations in the depth of destruction may be present, but generally there is uniformity within a given region of the mouth. Figure 17-19
FIG. 17-16 A, This periapical image shows root surface carious lesions involv-ing the distal aspect of the fi rst premolar and the mesial and distal aspect of the second premolar. Note that the lesion undermines the enamel surface (arrow). B, This bitewing image reveals a root surface lesion involving the distal cervical region of the second molar (arrow); this location is in part due to the low third molar contact point on the distal surface, the result of abnormal mesial tipping of both molars. C, This periapical image shows a carious lesion in the distal root surface of the maxillary second molar (short arrow) and an example of cervical burnout (long arrow). Note the sharp line from overl apping roots that delineates the radiolucent cervical burnout. D, This periapical image demonstrates multiple root lesions involving the mandibular incisors. Note the associated periapical infl ammatory lesions.
A B
C
D

CHAPTER 17 ■ DENTAL CARIES 279
FIG. 17-17 A, This bitewing image reveals several interproximal carious lesions; three are recurrent caries (arrows). B, This bitewing image dem-onstrates a recurrent carious lesion in the distal surface of the maxillary second premolar (arrow). Note the overhang to the restoration placed on the mesial surface of the fi rst molar. C, This periapical image reveals a recurrent carious lesion (arrow) involv-ing the distal surface of the second premolar. D, Note that there is an overhang to the restoration on the distal aspect of this maxillary second molar and an associated recurrent carious lesion (arrow).
A B
C
D
FIG. 17-18 A, This periapical image shows radiolucent restora-tions placed in the mesial and distal surfaces of the lateral incisor and mesial surface of the cuspid. Note the well-defi ned margins, useful to differentiate from carious lesions. B, In this periapical image the radiopaque liner on the internal aspect of the restora-tion placed on the distal surface of the central incisor is useful to differentiate from a carious lesion. Note the sharp margins of the restoration placed in the mesial surface of the lateral incisor. C, In this periapical image there are four radiolucent restorations and one carious lesion. The carious lesion involves the distal surface of the lateral incisor. Note the diffuse margin of the lesion in contrast to the well-defi ned margins of the restorations. D, This periapical image shows a recurrent carious lesion (arrow) involving the distal surface of the central incisor in contact with the radiolucent res-toration. Note the diffuse ill-defi ned margin of the lesion com-pared with the well-defi ned margin of the restoration.
A B
C D

280 PART V ■ RADIOGRAPHIC INTERPRETATION
FIG. 17-19 A and B, These two periapical images reveal multiple carious lesions that occurred after therapeutic radiation exposure. Note that the lesions start in the region of the cementoenamel junction.
A B
shows examples of radiation caries in patients with xerostomia after therapeutic radiation for cancer of the head and neck. Use of topical fl uorides as remineralizing solutions and meticulous oral hygiene can markedly reduce the radiation damage to teeth resulting from xerostomia.
Alternative Diagnostic Tools to Detect Dental Caries
Other methods have been developed in addition to clinical inspection and radiography to detect carious lesions. These include light fl uor-escence (QLF), “ Diagnodent ” laser-light fi beroptic transillumination (FOTI), electrical conductance measurements (ECM), and ultraso-nography. QLF may be used to quantify mineral loss on smooth sur-faces, whereas Diagnodent and ECM have been applied on occlusal surfaces. These two methods operate by displaying a value that pro-vides quantitative information on the depth of the lesion. None of the methods can unequivocally distinguish between enamel and dentin lesions or between shallow and deep dentin lesions. FOTI has been used primarily for proximal surfaces but may also be applied to occlu-sal surfaces. FOTI is less sensitive than radiography for distinguishing shallow and deep lesions. ECM is better than FOTI in identifying occlusal caries in young children. There is little evidence yet that these methods can substitute traditional diagnostic methods in the clinic.
Treatment Considerations
Carious lesions in enamel require interceptive treatment but rarely operative treatment. The radiographic detection of small areas of demineralization requires a decision as to whether these represent active or inactive arrested lesions. When the radiograph shows a lesion limited to enamel, the probability of cavitation is low and the prospect of arresting or reversing the caries process is good. Also, if the radio-graph shows a lesion just into the dentin, treatment should include a means to stop the microbiologic activity and possibly reverse the demineralization process. Treatment of such lesions may include reductions in sugar intake, proper oral hygiene to reduce bacteria, and use of topical fl uorides to inhibit microbiologic activity, retard demin-
eralization, and promote remineralization of the outermost parts of the lesion. This may be successful if the surface of the tooth is not cavitated and a follow-up radiograph shows no progression of the lesion. However, when the surface of a lesion is cavitated or follow-up radiographs reveal progression of the lesion in dentin, a restoration is required. Cavitated carious lesions require removal of the infected tissues, possibly stepwise over a period for extensive lesions, and res-toration of the tooth to form and function.
BIBLIOGRAPHY 5 Fejerskov O , Kidd EAM : Dental caries: the disease and its clinical
management , ed 1 , Munksgaard , 2003 , Blackwell . 1 Newbrun E : Cariology , ed 3 , Baltimore , 1989 , Williams & Wilkins . 2 NIH Consensus Development Conference on Diagnosis and Management of
Dental Caries Throughout Life . Bethesda, MD, March 26-28, 2001. Conference papers. J Dent Educ 65 : 935 - 1179 , 2001 .
3 Pitts NB , Stamm JW : International Consensus Workshop on Caries Clinical Trials (ICW-CCT) — fi nal consensus statements: agreeing where the evidence leads . J Dent Res 83 ( Spec No. C ): C125 - C128 , 2004 .
4 Selwitz RH , Ismail AI , Pitts NB : Dental caries , Lancet 369 : 51 - 59 , 2007 .
SUGGESTED READINGS
RADIOGRAPHIC CARIES DETECTION
6 De Araujo FB , Rosito DB , Toigo E et al : Diagnosis of approximal caries: radiographic versus clinical examination using tooth separation , Am J Dent 5 : 245 - 248 , 1992 .
7 Hintze H , Wenzel A : A two-fi lm versus a four-fi lm bite-wing examination for caries diagnosis in adults , Caries Res 33 : 380 - 396 , 1999 .
8 Hintze H , Wenzel A , Danielsen B : Behaviour of approximal carious lesions assessed by clinical examination after tooth separation and radiography: a 2.5-year longitudinal study in young adults , Caries Res 33 : 415 - 422 , 1999 .
9 Mej á re I : Bitewing examination to detect caries in children and adolescents — when and how often? Dent Update 32 : 588 - 590 , 593-594, 596-597, 2005 .
10 Mej á re I , Stenlund H , Zelezny-Holmlund C : Caries incidence and lesions progression from adolescence to young adulthood: a prospective 15-year cohort study in Sweden , Caries Res 38 : 130 - 141 , 2004 .
CHAPTER 17 ■ DENTAL CARIES 281
11 Mj ö r IA , Toffenetti F : Secondary caries: a literature review with case reports , Quintessence Int 31 : 165 - 179 , 2000 .
12 Nielsen LL , Hoernoe M , Wenzel A : Radiographic detection of cavitation in approximal surfaces of primary teeth using a digital storage phosphor system and conventional fi lm, and the relationship between cavitation and radiographic lesion depth: an in vitro study , Int J Paediatr Dent 6 : 167 - 172 , 1996 .
13 Nyvad B , Fejerskov O : Assessing the stage of caries lesion activity on the basis of clinical and microbiological examination , Community Dent Oral Epidemiol 25 : 69 - 75 , 1997 .
14 Nyvad B , Machiulskiene V , Baelum V : Reliability of a new caries diagnostic system differentiating between active and inactive caries lesions , Caries Res 33 : 252 - 260 , 1999 .
15 Petersson GH , Bratthall D : The caries decline: a review of reviews , Eur J Oral Sci 104 : 436 - 443 , 1996 .
16 Poorterman JHG , Weerheijm KL , Groen HJ et al : Clinical and radiographic judgement of occlusal caries in adolescents , Eur J Oral Sci 108 : 93 - 98 , 2000 .
17 Qvist V , Johannesen L , Bruun M : Progression of approximal caries in relation to iatrogenic preparation damage , J Dent Res 71 : 1370 - 1373 , 1992 .
18 Ratledge DK , Kidd EA , Beighton D : A clinical and microbiological study of approximal carious lesions, 1: the relationship between cavitation, radiographic lesion depth, the site specifi c gingival index and the level of infection of the dentine , Caries Res 35 : 3 - 7 , 2001 .
19 Wenzel A : A review of dentists ’ use of digital radiography and caries diagnosis with digital systems , Dentomaxillofac Radiol 35 : 307 - 314 , 2006 .
20 Wenzel A , Anthonisen PN , Juul MB : Reproducibility in the assessment of caries lesion behaviour: a comparison between conventional fi lm and subtraction radiography , Caries Res 34 : 214 - 218 , 2000 .
21 Wenzel A , Haiter-Neto F , Gotfredsen E : Risk factors for a false positive test outcome in diagnosis of caries in approximal surfaces: impact of
radiographic modality and observer characteristics , Caries Res 41 : 170 - 176 , 2007 .
22 White SC , Yoon DC : Comparative performance of digital and conventional images for detecting proximal surface caries , Dentomaxillofac Radiol 26 : 32 - 38 , 1997 .
TREATMENT DECISION
23 Bader JD , Shugars DA : What do we know about how dentists make caries-related treatment decisions? Community Dent Oral Epidemiol 25 : 97 - 103 , 1997 .
24 Bader JD , Shugars DA : The evidence supporting alternative management strategies for early occlusal caries and suspected occlusal dentinal caries , J Evid Based Dent Pract 6 : 91 - 100 , 2006 .
25 Bjorndal L , Kidd EA : The treatment of deep dentine caries lesions , Dent Update 32 : 402 - 404 , 407-410, 413, 2005 .
26 Pitts NB : Diagnostic tools and measurements — impact on appropriate care , Community Dent Oral Epidemiol 25 : 24 - 35 , 1997 .
27 Pitts NB : Are we ready to move from operative to non-operative / preventive treatment of dental caries in clinical practice? Caries Res 38 : 294 - 304 , 2004 .
28 Ricketts DN , Kidd EA , Innes N et al : Complete or ultraconservative removal of decayed tissue in unfi lled teeth , Cochrane Database Syst Rev 3 : CD003808 , 2006 .
29 Rimmer PA , Pitts NB : Temporary elective tooth separation as a diagnostic aid in general dental practice , Br Dent J 169 : 87 - 92 , 1990 .
30 Verdonschot EH , Angmar-M å nsson B , ten Bosch JJ et al : Developments in caries diagnosis and their relationship to treatment decisions and quality of care. ORCA Saturday Afternoon Symposium 1997 . Caries Res 33 : 32 - 40 , 1999 .
31 Woodward GL , Leake JL : The use of dental radiographs to estimate the probability of cavitation of carious interproximal lesions, I: evidence from the literature , J Can Dent Assoc 62 : 731 - 736 , 1996 .

C H A P T E R 1 8
Periodontal Diseases
Susanne Perschbacher
Several distinct yet related disorders of the periodontium are collectively known as periodontal diseases. They are a set of conditions characterized by an infl ammatory host response in
the periodontal tissues that may lead to localized or generalized altera-tions in the soft tissues around the teeth, loss of supporting bone, and ultimately, loss of the teeth. Periodontal diseases are broadly classifi ed as gingival diseases and periodontitis. Gingival diseases may be dental plaque-induced or non – plaque-induced. Bacterial plaque-associated gingivitis is much more common than non – plaque-induced infl am-matory diseases affecting the gingiva such as viral or fungal infections, mucocutaneous and allergic conditions, and traumatic injuries. Gingivitis presents as infl ammation of the soft tissue surrounding the teeth with gingival swelling, edema, and erythema.
Periodontitis is classifi ed, primarily by the clinical presentation, as chronic, aggressive, and periodontitis as a manifestation of a systemic disease. Other subtypes of periodontal conditions include necrotizing periodontal diseases, periodontal abscesses, and periodontitis associ-ated with endodontic lesions. Periodontitis is distinguished from gin-givitis by the clinically detectable destruction of host tissues seen as the loss of soft tissue attachment and supporting bone of the involved teeth. Although periodontitis is always preceded by gingivitis, gingi-vitis does not always progress to periodontitis.
Dental plaque, which may vary greatly in its bacterial composition, plays a primary role in the initiation of periodontitis. Periodontitis-implicated plaque bacteria species, predominantly gram-negative rods and spirochetes, have the ability to colonize on the tooth and root surfaces, spread into the region between the root and the gingival margin, and in some cases invade the surrounding tissue. These bac-teria are capable of causing damage to the host tissue either directly, through the release of toxins, or more signifi cantly, indirectly, by stimulating a host infl ammatory reaction. As part of the host response, the release of infl ammatory mediators, especially from neutrophils, is responsible for much of the injury to the surrounding soft tissue and stimulation of osteoclastic bone resorption. The resulting infl amma-tory response causes loss of, and apical migration of, the epithelial attachment, resulting in pocket formation and thus further enhancing bacterial colonization.
The clinical manifestation of this interplay between bacterial plaque and the host tissues are clinical signs of infl ammation. Gingivitis seen as gingival swelling, edema, and erythema is the most common fi rst clinical sign. Progression to periodontitis is manifested with pocket formation, the universal presentation of this disease. Other clinical signs include bleeding, purulent exudate, edema, resorption of the alveolar crest, and tooth mobility. Rather than pro-gressing smoothly from mild to moderate to severe, periodontitis
often progresses in bursts. There are active periods of infl ammation and tissue destruction followed by healing and quiescent periods (often years) of no appreciable change. The extent of disease activity is best measured by longitudinal probing of periodontal attachment level. This cycle of disease activity may repeat. The relative duration of the destructive and quiescent phases depends on the form of peri-odontitis, the nature of the bacterial pathogens, and the host response. Host factors such as systemic disease, age, genetic predisposition, immune system status, occlusal trauma, and stress infl uence the onset and progression of the disease. Spontaneous remission of the destruc-tive process may even occur. The disease usually is painless, and most patients are unaware of its presence. Various forms of therapy are effective, including oral hygiene, scaling, and surgical treatment.
Those more prone to periodontal disease include smokers, older individuals, and people with poor education, neglected dental care, previous periodontal destruction, and systemic diseases such as dia-betes or infection with human immunodefi ciency virus.
The prevalence of periodontal disease in the American population depends on the method of assessment and the threshold used. If loss of attachment by the formation of pockets measuring greater than 4 mm is used, then the prevalence is about 23%. The incidence of adult periodontitis increases with age. The prevalence of aggressive periodontitis is less than 1%. It also appears that the prevalence of periodontal disease in the United States has declined in the last 30 years, but this may change with an increasing elderly population and an increase in retention of teeth.
Assessment of Periodontal Disease
CONTRIBUTIONS OF RADIOGRAPHS
Radiographs play an integral role in the assessment of periodontal disease. They provide unique information about the status of the periodontium and a permanent record of the condition of the bone throughout the course of the disease. Radiographs aid the clinician in identifying the extent of destruction of alveolar bone, local contribut-ing factors, and features of the periodontium that infl uence the prog-nosis. Important features related to periodontal status that may be identifi ed radiographically are listed in Box 18-1 .
It is important to emphasize that the clinical and radiographic examinations are complementary. The clinical examination should include periodontal probing, a gingival index, mobility charting, and an evaluation of the amount of attached gingiva. Features that are not well delineated by the radiograph are most apparent clinically, and
282
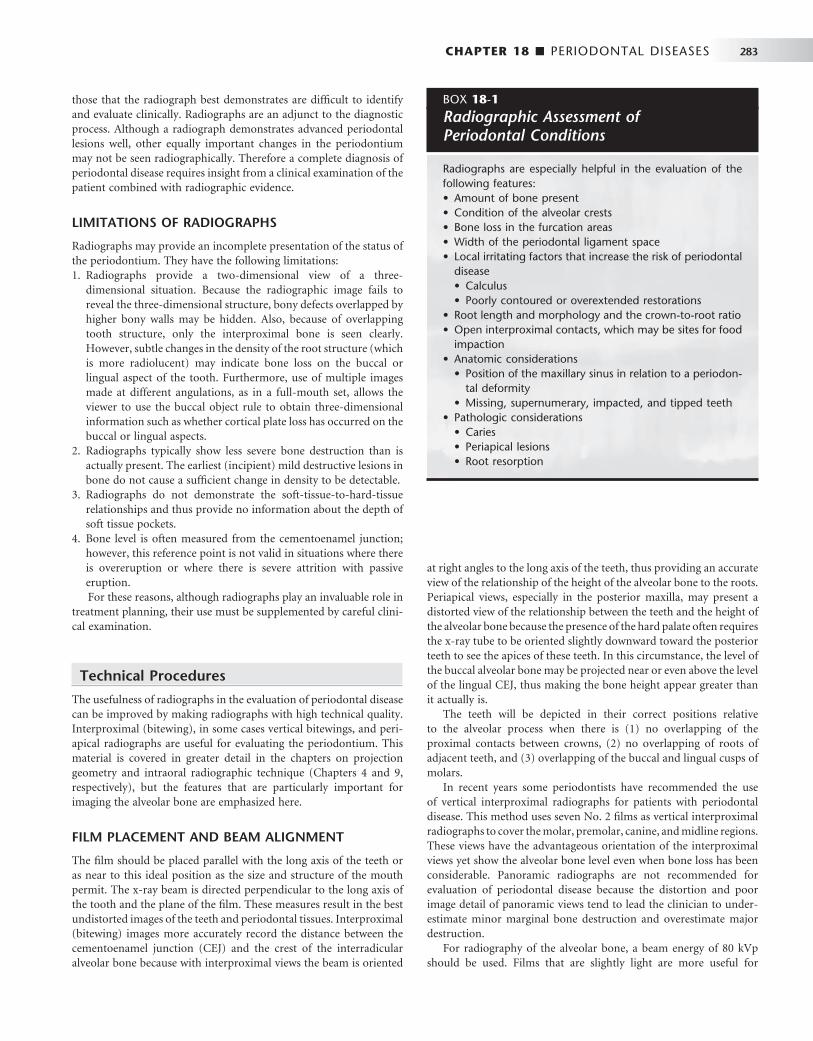
CHAPTER 18 ■ PERIODONTAL DISEASES 283
those that the radiograph best demonstrates are diffi cult to identify and evaluate clinically. Radiographs are an adjunct to the diagnostic process. Although a radiograph demonstrates advanced periodontal lesions well, other equally important changes in the periodontium may not be seen radiographically. Therefore a complete diagnosis of periodontal disease requires insight from a clinical examination of the patient combined with radiographic evidence.
LIMITATIONS OF RADIOGRAPHS
Radiographs may provide an incomplete presentation of the status of the periodontium. They have the following limitations: 1. Radiographs provide a two-dimensional view of a three-
dimensional situation. Because the radiographic image fails to reveal the three-dimensional structure, bony defects overlapped by higher bony walls may be hidden. Also, because of overlapping tooth structure, only the interproximal bone is seen clearly. However, subtle changes in the density of the root structure (which is more radiolucent) may indicate bone loss on the buccal or lingual aspect of the tooth. Furthermore, use of multiple images made at different angulations, as in a full-mouth set, allows the viewer to use the buccal object rule to obtain three-dimensional information such as whether cortical plate loss has occurred on the buccal or lingual aspects.
2. Radiographs typically show less severe bone destruction than is actually present. The earliest (incipient) mild destructive lesions in bone do not cause a suffi cient change in density to be detectable.
3. Radiographs do not demonstrate the soft-tissue-to-hard-tissue relationships and thus provide no information about the depth of soft tissue pockets.
4. Bone level is often measured from the cementoenamel junction; however, this reference point is not valid in situations where there is overeruption or where there is severe attrition with passive eruption. For these reasons, although radiographs play an invaluable role in
treatment planning, their use must be supplemented by careful clini-cal examination.
Technical Procedures
The usefulness of radiographs in the evaluation of periodontal disease can be improved by making radiographs with high technical quality. Interproximal (bitewing), in some cases vertical bitewings, and peri-apical radiographs are useful for evaluating the periodontium. This material is covered in greater detail in the chapters on projection geometry and intraoral radiographic technique ( Chapters 4 and 9 , respectively), but the features that are particularly important for imaging the alveolar bone are emphasized here.
FILM PLACEMENT AND BEAM ALIGNMENT
The fi lm should be placed parallel with the long axis of the teeth or as near to this ideal position as the size and structure of the mouth permit. The x-ray beam is directed perpendicular to the long axis of the tooth and the plane of the fi lm. These measures result in the best undistorted images of the teeth and periodontal tissues. Interproximal (bitewing) images more accurately record the distance between the cementoenamel junction (CEJ) and the crest of the interradicular alveolar bone because with interproximal views the beam is oriented
at right angles to the long axis of the teeth, thus providing an accurate view of the relationship of the height of the alveolar bone to the roots. Periapical views, especially in the posterior maxilla, may present a distorted view of the relationship between the teeth and the height of the alveolar bone because the presence of the hard palate often requires the x-ray tube to be oriented slightly downward toward the posterior teeth to see the apices of these teeth. In this circumstance, the level of the buccal alveolar bone may be projected near or even above the level of the lingual CEJ, thus making the bone height appear greater than it actually is.
The teeth will be depicted in their correct positions relative to the alveolar process when there is (1) no overlapping of the proximal contacts between crowns, (2) no overlapping of roots of adjacent teeth, and (3) overlapping of the buccal and lingual cusps of molars.
In recent years some periodontists have recommended the use of vertical interproximal radiographs for patients with periodontal disease. This method uses seven No. 2 fi lms as vertical interproximal radiographs to cover the molar, premolar, canine, and midline regions. These views have the advantageous orientation of the interproximal views yet show the alveolar bone level even when bone loss has been considerable. Panoramic radiographs are not recommended for evaluation of periodontal disease because the distortion and poor image detail of panoramic views tend to lead the clinician to under-estimate minor marginal bone destruction and overestimate major destruction.
For radiography of the alveolar bone, a beam energy of 80 kVp should be used. Films that are slightly light are more useful for
BOX 18-1
Radiographic Assessment of Periodontal Conditions
Radiographs are especially helpful in the evaluation of the following features: • Amount of bone present • Condition of the alveolar crests • Bone loss in the furcation areas • Width of the periodontal ligament space • Local irritating factors that increase the risk of periodontal
disease • Calculus • Poorly contoured or overextended restorations
• Root length and morphology and the crown-to-root ratio • Open interproximal contacts, which may be sites for food
impaction • Anatomic considerations
• Position of the maxillary sinus in relation to a periodon-tal deformity
• Missing, supernumerary, impacted, and tipped teeth • Pathologic considerations
• Caries • Periapical lesions • Root resorption
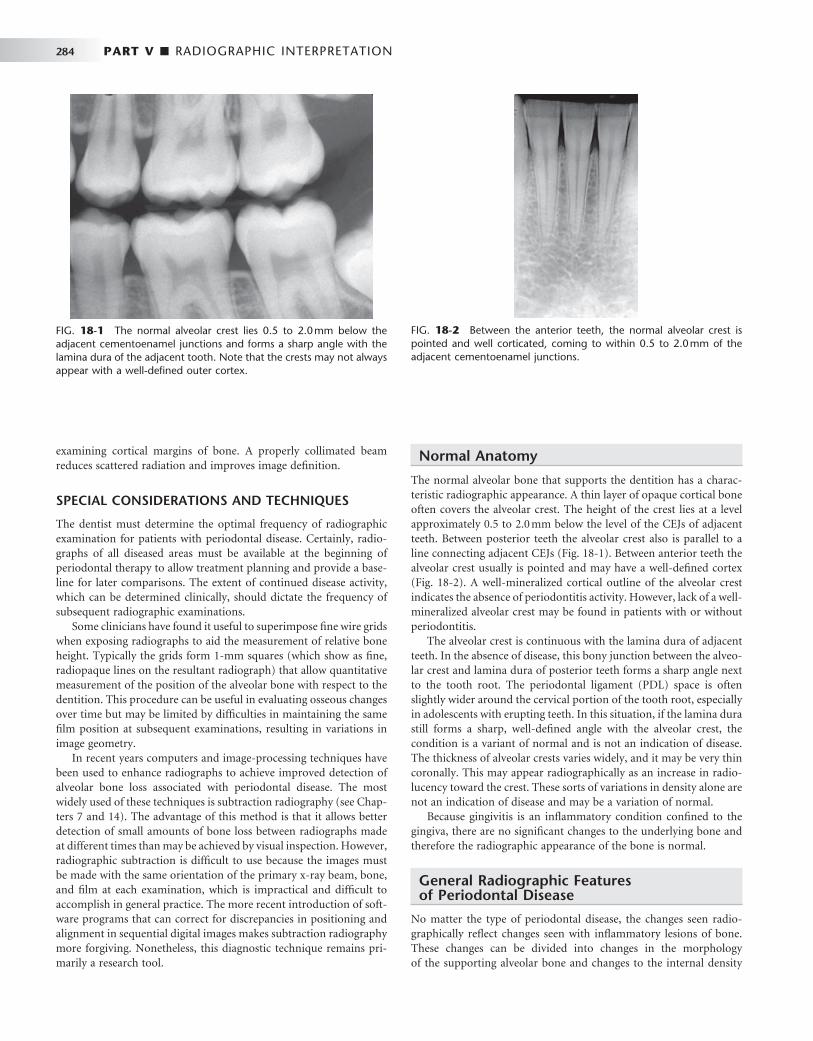
284 PART V ■ RADIOGRAPHIC INTERPRETATION
examining cortical margins of bone. A properly collimated beam reduces scattered radiation and improves image defi nition.
SPECIAL CONSIDERATIONS AND TECHNIQUES
The dentist must determine the optimal frequency of radiographic examination for patients with periodontal disease. Certainly, radio-graphs of all diseased areas must be available at the beginning of periodontal therapy to allow treatment planning and provide a base-line for later comparisons. The extent of continued disease activity, which can be determined clinically, should dictate the frequency of subsequent radiographic examinations.
Some clinicians have found it useful to superimpose fi ne wire grids when exposing radiographs to aid the measurement of relative bone height. Typically the grids form 1-mm squares (which show as fi ne, radiopaque lines on the resultant radiograph) that allow quantitative measurement of the position of the alveolar bone with respect to the dentition. This procedure can be useful in evaluating osseous changes over time but may be limited by diffi culties in maintaining the same fi lm position at subsequent examinations, resulting in variations in image geometry.
In recent years computers and image-processing techniques have been used to enhance radiographs to achieve improved detection of alveolar bone loss associated with periodontal disease. The most widely used of these techniques is subtraction radiography (see Chap-ters 7 and 14 ). The advantage of this method is that it allows better detection of small amounts of bone loss between radiographs made at different times than may be achieved by visual inspection. However, radiographic subtraction is diffi cult to use because the images must be made with the same orientation of the primary x-ray beam, bone, and fi lm at each examination, which is impractical and diffi cult to accomplish in general practice. The more recent introduction of soft-ware programs that can correct for discrepancies in positioning and alignment in sequential digital images makes subtraction radiography more forgiving. Nonetheless, this diagnostic technique remains pri-marily a research tool.
Normal Anatomy
The normal alveolar bone that supports the dentition has a charac-teristic radiographic appearance. A thin layer of opaque cortical bone often covers the alveolar crest. The height of the crest lies at a level approximately 0.5 to 2.0 mm below the level of the CEJs of adjacent teeth. Between posterior teeth the alveolar crest also is parallel to a line connecting adjacent CEJs ( Fig. 18-1 ). Between anterior teeth the alveolar crest usually is pointed and may have a well-defi ned cortex ( Fig. 18-2 ). A well-mineralized cortical outline of the alveolar crest indicates the absence of periodontitis activity. However, lack of a well-mineralized alveolar crest may be found in patients with or without periodontitis.
The alveolar crest is continuous with the lamina dura of adjacent teeth. In the absence of disease, this bony junction between the alveo-lar crest and lamina dura of posterior teeth forms a sharp angle next to the tooth root. The periodontal ligament (PDL) space is often slightly wider around the cervical portion of the tooth root, especially in adolescents with erupting teeth. In this situation, if the lamina dura still forms a sharp, well-defi ned angle with the alveolar crest, the condition is a variant of normal and is not an indication of disease. The thickness of alveolar crests varies widely, and it may be very thin coronally. This may appear radiographically as an increase in radio-lucency toward the crest. These sorts of variations in density alone are not an indication of disease and may be a variation of normal.
Because gingivitis is an infl ammatory condition confi ned to the gingiva, there are no signifi cant changes to the underlying bone and therefore the radiographic appearance of the bone is normal.
General Radiographic Features of Periodontal Disease
No matter the type of periodontal disease, the changes seen radio-graphically refl ect changes seen with infl ammatory lesions of bone. These changes can be divided into changes in the morphologyof the supporting alveolar bone and changes to the internal density
FIG. 18-1 The normal alveolar crest lies 0.5 to 2.0 mm below the adjacent cementoenamel junctions and forms a sharp angle with the lamina dura of the adjacent tooth. Note that the crests may not always appear with a well-defi ned outer cortex.
FIG. 18-2 Between the anterior teeth, the normal alveolar crest is pointed and well corticated, coming to within 0.5 to 2.0 mm of the adjacent cementoenamel junctions.
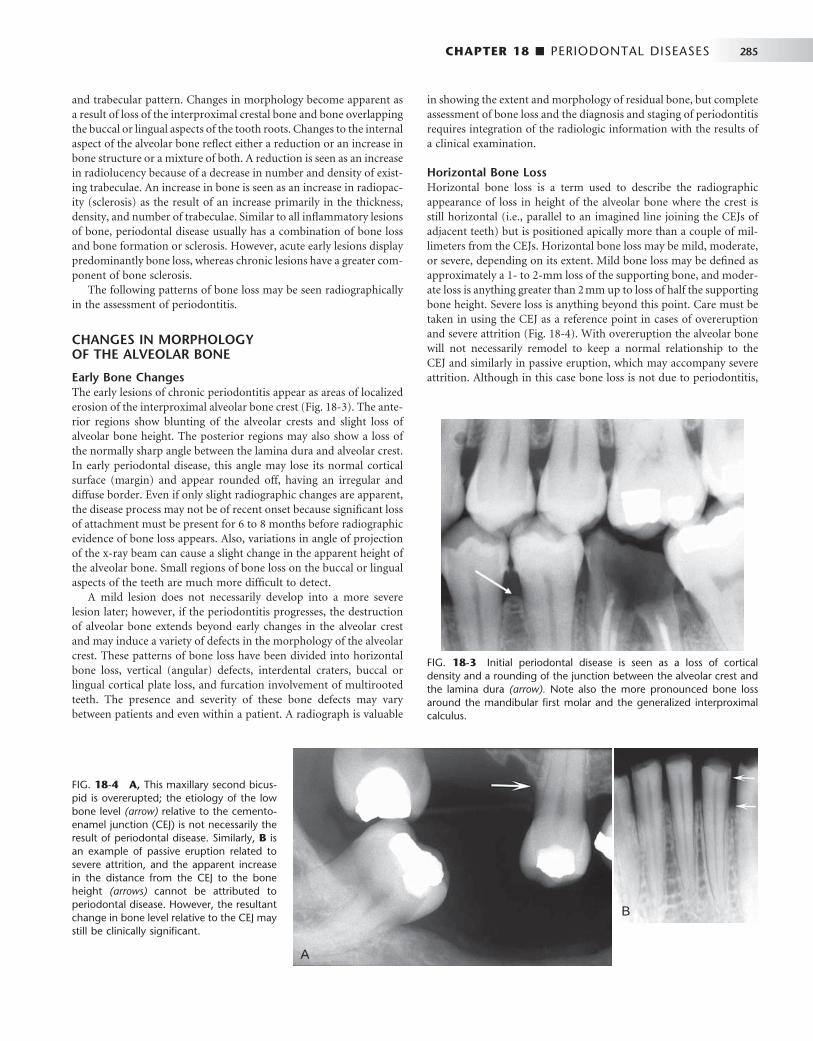
CHAPTER 18 ■ PERIODONTAL DISEASES 285
and trabecular pattern. Changes in morphology become apparent as a result of loss of the interproximal crestal bone and bone overlapping the buccal or lingual aspects of the tooth roots. Changes to the internal aspect of the alveolar bone refl ect either a reduction or an increase in bone structure or a mixture of both. A reduction is seen as an increase in radiolucency because of a decrease in number and density of exist-ing trabeculae. An increase in bone is seen as an increase in radiopac-ity (sclerosis) as the result of an increase primarily in the thickness, density, and number of trabeculae. Similar to all infl ammatory lesions of bone, periodontal disease usually has a combination of bone loss and bone formation or sclerosis. However, acute early lesions display predominantly bone loss, whereas chronic lesions have a greater com-ponent of bone sclerosis.
The following patterns of bone loss may be seen radiographically in the assessment of periodontitis.
CHANGES IN MORPHOLOGY OF THE ALVEOLAR BONE
Early Bone Changes The early lesions of chronic periodontitis appear as areas of localized erosion of the interproximal alveolar bone crest ( Fig. 18-3 ). The ante-rior regions show blunting of the alveolar crests and slight loss of alveolar bone height. The posterior regions may also show a loss of the normally sharp angle between the lamina dura and alveolar crest. In early periodontal disease, this angle may lose its normal cortical surface (margin) and appear rounded off, having an irregular and diffuse border. Even if only slight radiographic changes are apparent, the disease process may not be of recent onset because signifi cant loss of attachment must be present for 6 to 8 months before radiographic evidence of bone loss appears. Also, variations in angle of projection of the x-ray beam can cause a slight change in the apparent height of the alveolar bone. Small regions of bone loss on the buccal or lingual aspects of the teeth are much more diffi cult to detect.
A mild lesion does not necessarily develop into a more severe lesion later; however, if the periodontitis progresses, the destruction of alveolar bone extends beyond early changes in the alveolar crest and may induce a variety of defects in the morphology of the alveolar crest. These patterns of bone loss have been divided into horizontal bone loss, vertical (angular) defects, interdental craters, buccal or lingual cortical plate loss, and furcation involvement of multirooted teeth. The presence and severity of these bone defects may vary between patients and even within a patient. A radiograph is valuable
in showing the extent and morphology of residual bone, but complete assessment of bone loss and the diagnosis and staging of periodontitis requires integration of the radiologic information with the results of a clinical examination.
Horizontal Bone Loss Horizontal bone loss is a term used to describe the radiographic appearance of loss in height of the alveolar bone where the crest is still horizontal (i.e., parallel to an imagined line joining the CEJs of adjacent teeth) but is positioned apically more than a couple of mil-limeters from the CEJs. Horizontal bone loss may be mild, moderate, or severe, depending on its extent. Mild bone loss may be defi ned as approximately a 1- to 2-mm loss of the supporting bone, and moder-ate loss is anything greater than 2 mm up to loss of half the supporting bone height. Severe loss is anything beyond this point. Care must be taken in using the CEJ as a reference point in cases of overeruption and severe attrition ( Fig. 18-4 ). With overeruption the alveolar bone will not necessarily remodel to keep a normal relationship to the CEJ and similarly in passive eruption, which may accompany severe attrition. Although in this case bone loss is not due to periodontitis,
FIG. 18-3 Initial periodontal disease is seen as a loss of cortical density and a rounding of the junction between the alveolar crest and the lamina dura (arrow). Note also the more pronounced bone loss around the mandibular fi rst molar and the generalized interproximal calculus.
FIG. 18-4 A, This maxillary second bicus-pid is overerupted; the etiology of the low bone level (arrow) relative to the cemento-enamel junction (CEJ) is not necessarily the result of periodontal disease. Similarly, B is an example of passive eruption related to severe attrition, and the apparent increase in the distance from the CEJ to the bone height (arrows) cannot be attributed to periodontal disease. However, the resultant change in bone level relative to the CEJ may still be clinically signifi cant.
A
B

286 PART V ■ RADIOGRAPHIC INTERPRETATION
there may be still loss of attachment, which could be of clinical signifi cance.
In horizontal bone loss, the crest of the buccal and lingual cortical plates and the intervening interdental bone have been resorbed ( Fig. 18-5 ). The extent of bone loss evident at a single examination does not indicate the current activity of the disease. For example, a patient who previously had generalized periodontal disease and sub-sequent successful therapy will likely always show bone loss, but the bone level may remain stable.
Vertical Bone Defects The term vertical (or angular) osseous defect describes a bony lesion that is localized to a single tooth, although an individual may have multiple vertical osseous defects. These defects develop when bone loss progresses down the root of the tooth, resulting in deepening of the clinical periodontal pocket. The radiographic presentation is a vertical deformity within the alveolus that extends apically along the root of the affected tooth from the alveolar crest. The outline of the remaining alveolar bone typically displays an oblique angulation to an imaginary line connecting the CEJ of the affected tooth to the neighboring tooth. In its early form, a vertical defect appears as abnormal widening of the PDL space at the alveolar crest ( Fig. 18-6, A ). The vertical defect is
described as three walled (surrounded by three bony walls) when both buccal and lingual cortical plates remain; it is described as two walled when one of these plates has been resorbed and as one walled when both plates have been lost ( Fig. 18-6, B ). The distinctions among these groups are important in designing the treatment plan.
Often vertical defects are diffi cult or impossible to recognize on a radiograph because one or both of the cortical bony plates remain superimposed over the defect. Clinical and surgical inspections are the best means of determining the number of remaining bony walls. Visualization of the depth of pockets may be aided by inserting a gutta-percha point. The point follows the defect and appears on the radiograph because gutta-percha is relatively infl exible and radi-opaque ( Fig. 18-7 ).
Interdental Craters The interproximal crater is a two-walled, troughlike depression that forms in the crest of the interdental bone between adjacent teeth. The buccal and lingual outer cortical walls of the interproximal bone extend further coronally than does the cancellous bone between them, which has been resorbed. Radiographically this presents as a bandlike or irregular region of bone with less density at the crest, immediately adjacent to the more dense normal bone apical to the base of the crater ( Fig. 18-8 ). These defects are more common in the posterior
FIG. 18-5 Horizontal bone loss is seen in the anterior region (A) and the posterior region (B) as a loss of the buccal and lingual cortical plates and interdental alveolar bone.
AB
FIG. 18-6 A, Example of a developing vertical defect; note the abnormal widening of the periodontal ligament space (arrow). B, Maxillary periapical fi lm reveals two examples of more severe vertical defects affecting the mesial surface of the fi rst molar and the distal surface of the canine.
A B
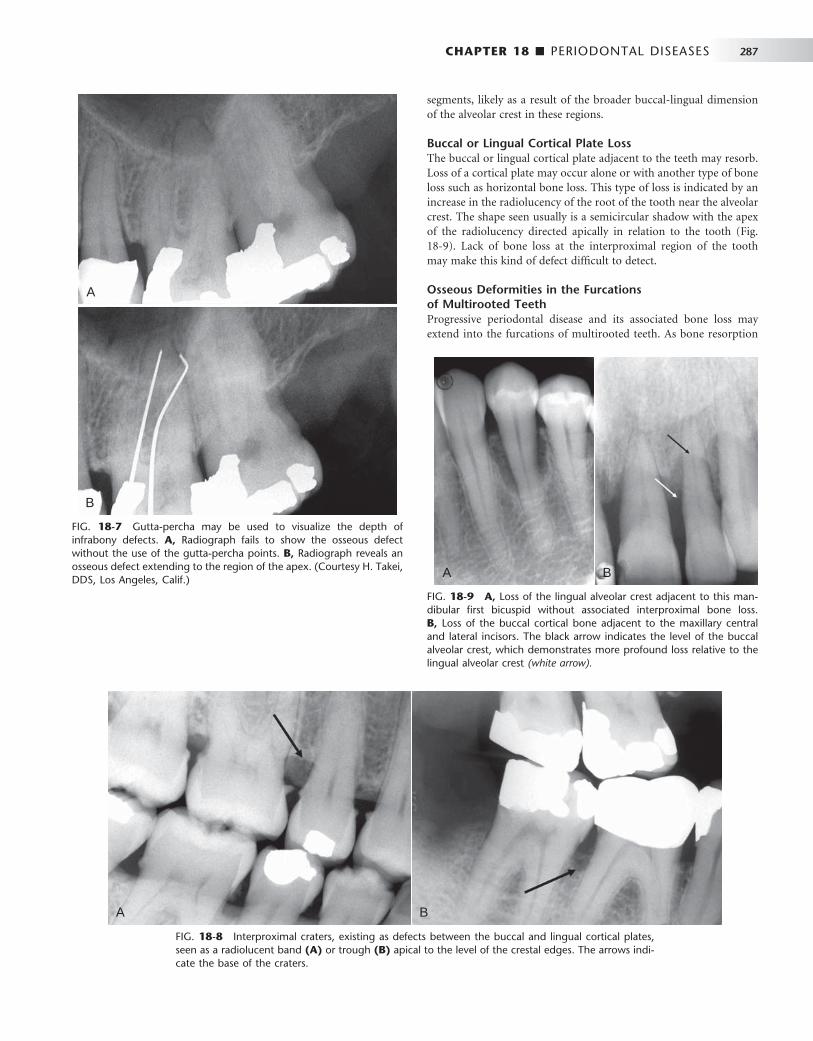
CHAPTER 18 ■ PERIODONTAL DISEASES 287
FIG. 18-7 Gutta-percha may be used to visualize the depth of infrabony defects. A, Radiograph fails to show the osseous defect without the use of the gutta-percha points. B, Radiograph reveals an osseous defect extending to the region of the apex. (Courtesy H. Takei, DDS, Los Angeles, Calif.)
A
B
FIG. 18-8 Interproximal craters, existing as defects between the buccal and lingual cortical plates, seen as a radiolucent band (A) or trough (B) apical to the level of the crestal edges. The arrows indi-cate the base of the craters.
A B
segments, likely as a result of the broader buccal-lingual dimension of the alveolar crest in these regions.
Buccal or Lingual Cortical Plate Loss The buccal or lingual cortical plate adjacent to the teeth may resorb. Loss of a cortical plate may occur alone or with another type of bone loss such as horizontal bone loss. This type of loss is indicated by an increase in the radiolucency of the root of the tooth near the alveolar crest. The shape seen usually is a semicircular shadow with the apex of the radiolucency directed apically in relation to the tooth ( Fig. 18-9 ). Lack of bone loss at the interproximal region of the tooth may make this kind of defect diffi cult to detect.
Osseous Deformities in the Furcations of Multirooted Teeth Progressive periodontal disease and its associated bone loss may extend into the furcations of multirooted teeth. As bone resorption
FIG. 18-9 A, Loss of the lingual alveolar crest adjacent to this man-dibular fi rst bicuspid without associated interproximal bone loss. B, Loss of the buccal cortical bone adjacent to the maxillary central and lateral incisors. The black arrow indicates the level of the buccal alveolar crest, which demonstrates more profound loss relative to the lingual alveolar crest (white arrow).
A B

288 PART V ■ RADIOGRAPHIC INTERPRETATION
extends down the side of a multirooted tooth, eliminating the bone covering the root, it can reach the level of the furcation and beyond. Widening of the PDL space at the apex of the interradicular bony crest of the furcation is strong evidence that the periodontal disease process involves the furcation ( Fig. 18-10, A ). If suffi cient bone loss has occurred on the lingual and buccal aspects of a mandibular molar furcation, the radiolucent image of the lesion becomes prominent ( Fig. 18-10, B ). The bony defect may also involve only the buccal or lingual cortical plate and extend under the roof of the furcation. In such a case, if the defect does not extend through to the other cortical plate, it appears more irregular and radiolucent than does the adjacent normal bone. By use of the buccal object rule with fi lms of different angulations, it may be possible to determine whether the buccal or the lingual cortical plate has been resorbed.
If the crestal bone is below the furcation but the disease process has not extended into the interradicular bone, the width of the peri-odontal membrane space appears normal. Also, the septal bone may appear more radiolucent but otherwise be normal. In the mandible, the external oblique ridge may mask furcation involvement of the
third molars. Convergent roots may also obscure furcation defects in maxillary and mandibular second and third molars.
The loss of interradicular bone in the furcation of a maxillary molar may originate from the buccal, mesial, or distal surface of the tooth. The most common route for furcation involvement of the max-illary permanent fi rst molar is from the mesial side. The image of fur-cation involvement is not as sharply defi ned around maxillary molars as around mandibular molars because the palatal root is superimposed on the defect (see Fig. 18-10, C ). However, occasionally this pattern of bone destruction is prominent and appears as an inverted “ J ” shadow with the hook of the J extending into the trifurcation (see Fig. 18-10, D ) or as a radiolucent triangle superimposed over the roots of the involved tooth with its apex pointing toward the furcation.
Defi nitive diagnosis of complex furcation deformities requires careful clinical examination and sometimes surgical exploration. Radiographs, though, are an important tool in identifying potentially involved sites as well as providing important information about root morphology and length, which is of signifi cance to treatment plan-ning and prognosis.
FIG. 18-10 A, A periapical fi lm revealing very early furcation involvement of a mandibular molar characterized by slight widening of the periodontal ligament space in the furcation region (arrow). B, A periapical fi lm revealing a profound radiolucent lesion within the furcation region (arrow) resulting from loss of bone in the furcation region and the buccal and lingual cortical plates. C, The angulation of this periapical view of a maxillary fi rst molar projected the palatal root away from the trifurcation region revealing early widening of the furcation periodontal ligament space (arrow). D, Example of an inverted “ J ” shadow (arrow) resulting from bone destruction extending into the trifurcation region of a three-rooted maxillary fi rst bicuspid.
A
C D
B

CHAPTER 18 ■ PERIODONTAL DISEASES 289
CHANGES TO INTERNAL DENSITY AND TRABECULAR PATTERN OF BONE
As with all other infl ammatory lesions, the periodontal lesion may stimulate a reaction in the surrounding bone. The peripheral bone may appear more radiolucent, or more sclerotic (radiopaque), or more commonly with a mixture of these patterns. Very rarely no apparent change will be seen in the surrounding bone. A radiolucent change refl ects loss of density and number of trabeculae. The trabecu-lae appear very faint, which is more commonly seen in early or acute lesions ( Fig. 18-11, A ). If the trabeculae are suffi ciently decalcifi ed, they may not appear in the radiographic image although they are still present. This accounts for the apparent reformation of bone in some cases where the acute infl ammation resolves with successful treatment and the trabeculae remineralize. The sclerotic bone reaction appears radiopaque because of deposition of bone on existing trabeculae at the expense of the marrow, resulting in thicker trabeculae that may eventually be so dense as to appear as an amorphous radiopaque mass ( Fig. 18-11, B ). This sclerotic reaction may extend some distance from the periodontal lesion, sometimes to the inferior aspect of the man-dible. Usually the surrounding bone reaction is a mixture of both bone loss and sclerosis.
Infl ammatory products from a periodontal lesion can even extend through the cortex of the fl oor of the maxillary sinus to cause a regional mucositis ( Fig. 18-12 ). In rare cases a periosteal reaction might be seen on the buccal or lingual aspect of the alveolar process.
Other Patterns of Periodontal Bone Loss
PERIODONTAL ABSCESS
A periodontal abscess is a rapidly progressing, destructive lesion that usually originates in a deep soft tissue pocket. It occurs when the coronal portion of the pocket becomes occluded or when foreign material becomes lodged between a tooth and the gingiva. Clinically, pain and swelling and sometimes a draining sinus are present in the region. If the lesion is acute, there may be no visible radiographic changes. If the lesion persists, a radiolucent region appears, often superimposed over the root of a tooth. The radiolucency may be a rounded area of rarefaction and a bridge of bone may be present over
the coronal aspect of the lesion, separating it from the crest of the alveolar ridge ( Fig. 18-13 ). After treatment, some of the lost bone may regenerate.
AGGRESSIVE PERIODONTITIS
Aggressive periodontitis refers to periodontal disease of an aggressive and rapid nature that usually occurs in patients younger than 30 years. The severity of the disease appears to be an exuberant reaction to a minimum amount of plaque accumulation and may result in early tooth loss. The term aggressive periodontitis has replaced the term early-onset periodontitis , which included three former classifi cations: localized juvenile periodontitis, generalized juvenile periodontitis, and rapidly progressing periodontitis. Aggressive periodontitis is now subclassifi ed into localized aggressive periodontitis and generalized aggressive periodontitis. The cause of aggressive periodontitis is not known; however, specifi c bacterial pathogens, especially Actinobacillus actinomycetemcomitans , functional defects of polymorphonuclear
FIG. 18-11 A, Example of a primarily radiolucent reaction around this maxillary lateral incisor. Note that the trabeculae toward the alveolar crest on the mesial and distal aspect of the tooth are barely percep-tible and the marrow spaces are enlarged. B, A periapical fi lm revealing a predomi-nantly sclerotic bone reaction resulting from the periodontal disease involving the man-dibular molars. Note that the trabeculae are thickened and the marrow spaces are barely perceptible.
AB
FIG. 18-12 A periapical fi lm revealing a localized mucositis within the maxillary sinus (arrows) immediately adjacent to a vertical periodontal defect.
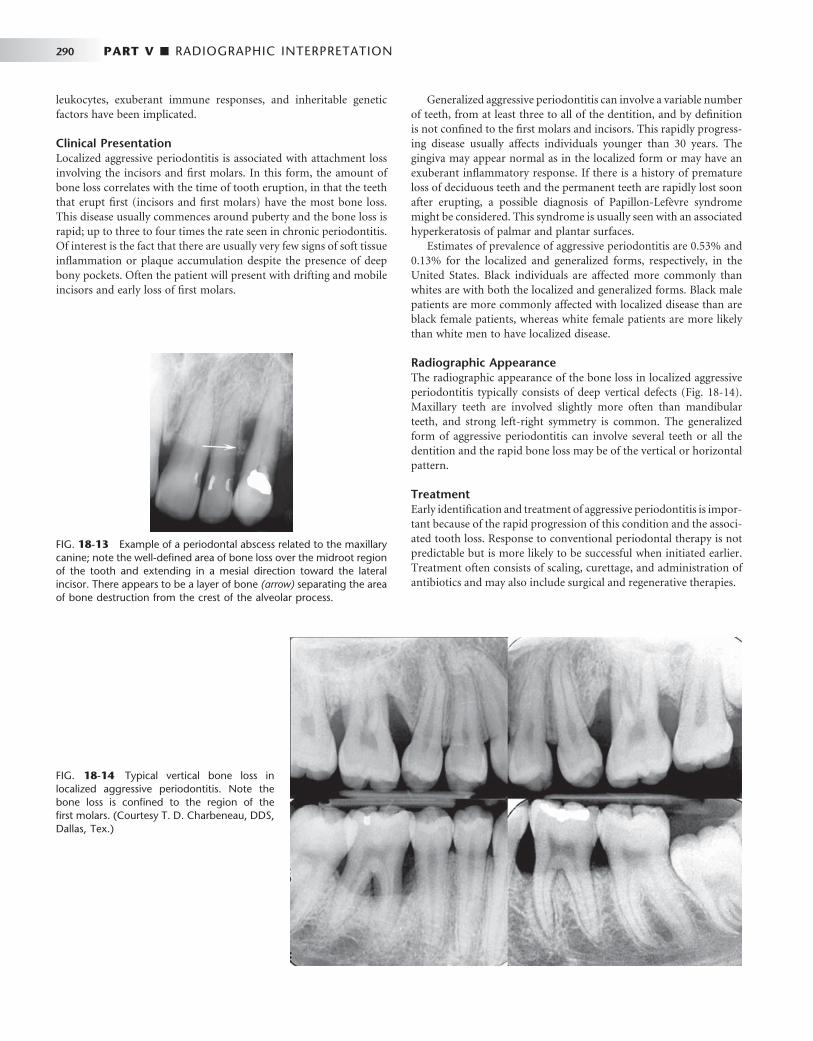
290 PART V ■ RADIOGRAPHIC INTERPRETATION
FIG. 18-13 Example of a periodontal abscess related to the maxillary canine; note the well-defi ned area of bone loss over the midroot region of the tooth and extending in a mesial direction toward the lateral incisor. There appears to be a layer of bone (arrow) separating the area of bone destruction from the crest of the alveolar process.
FIG. 18-14 Typical vertical bone loss in localized aggressive periodontitis. Note the bone loss is confi ned to the region of the fi rst molars. (Courtesy T. D. Charbeneau, DDS, Dallas, Tex.)
leukocytes, exuberant immune responses, and inheritable genetic factors have been implicated.
Clinical Presentation Localized aggressive periodontitis is associated with attachment loss involving the incisors and fi rst molars. In this form, the amount of bone loss correlates with the time of tooth eruption, in that the teeth that erupt fi rst (incisors and fi rst molars) have the most bone loss. This disease usually commences around puberty and the bone loss is rapid; up to three to four times the rate seen in chronic periodontitis. Of interest is the fact that there are usually very few signs of soft tissue infl ammation or plaque accumulation despite the presence of deep bony pockets. Often the patient will present with drifting and mobile incisors and early loss of fi rst molars.
Generalized aggressive periodontitis can involve a variable number of teeth, from at least three to all of the dentition, and by defi nition is not confi ned to the fi rst molars and incisors. This rapidly progress-ing disease usually affects individuals younger than 30 years. The gingiva may appear normal as in the localized form or may have an exuberant infl ammatory response. If there is a history of premature loss of deciduous teeth and the permanent teeth are rapidly lost soon after erupting, a possible diagnosis of Papillon-Lef è vre syndrome might be considered. This syndrome is usually seen with an associated hyperkeratosis of palmar and plantar surfaces.
Estimates of prevalence of aggressive periodontitis are 0.53% and 0.13% for the localized and generalized forms, respectively, in the United States. Black individuals are affected more commonly than whites are with both the localized and generalized forms. Black male patients are more commonly affected with localized disease than are black female patients, whereas white female patients are more likely than white men to have localized disease.
Radiographic Appearance The radiographic appearance of the bone loss in localized aggressive periodontitis typically consists of deep vertical defects ( Fig. 18-14 ). Maxillary teeth are involved slightly more often than mandibular teeth, and strong left-right symmetry is common. The generalized form of aggressive periodontitis can involve several teeth or all the dentition and the rapid bone loss may be of the vertical or horizontal pattern.
Treatment Early identifi cation and treatment of aggressive periodontitis is impor-tant because of the rapid progression of this condition and the associ-ated tooth loss. Response to conventional periodontal therapy is not predictable but is more likely to be successful when initiated earlier. Treatment often consists of scaling, curettage, and administration of antibiotics and may also include surgical and regenerative therapies.
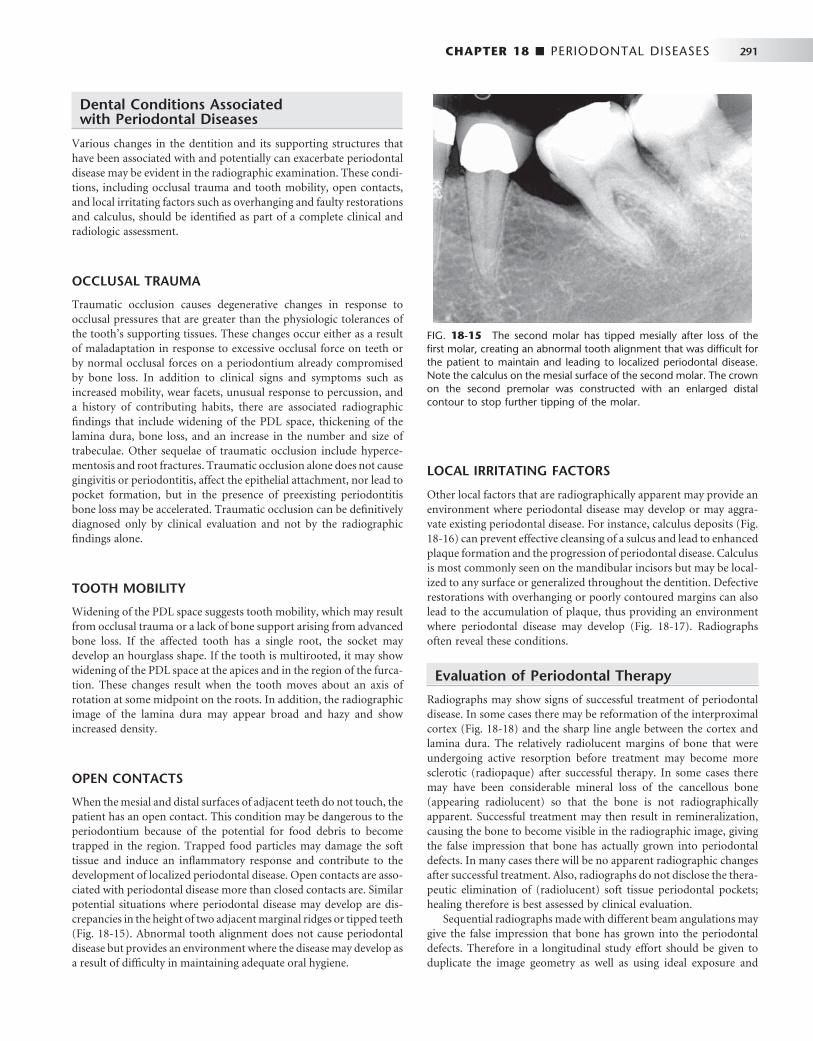
CHAPTER 18 ■ PERIODONTAL DISEASES 291
Dental Conditions Associated with Periodontal Diseases
Various changes in the dentition and its supporting structures that have been associated with and potentially can exacerbate periodontal disease may be evident in the radiographic examination. These condi-tions, including occlusal trauma and tooth mobility, open contacts, and local irritating factors such as overhanging and faulty restorations and calculus, should be identifi ed as part of a complete clinical and radiologic assessment.
OCCLUSAL TRAUMA
Traumatic occlusion causes degenerative changes in response to occlusal pressures that are greater than the physiologic tolerances of the tooth ’ s supporting tissues. These changes occur either as a result of maladaptation in response to excessive occlusal force on teeth or by normal occlusal forces on a periodontium already compromised by bone loss. In addition to clinical signs and symptoms such as increased mobility, wear facets, unusual response to percussion, and a history of contributing habits, there are associated radiographic fi ndings that include widening of the PDL space, thickening of the lamina dura, bone loss, and an increase in the number and size of trabeculae. Other sequelae of traumatic occlusion include hyperce-mentosis and root fractures. Traumatic occlusion alone does not cause gingivitis or periodontitis, affect the epithelial attachment, nor lead to pocket formation, but in the presence of preexisting periodontitis bone loss may be accelerated. Traumatic occlusion can be defi nitively diagnosed only by clinical evaluation and not by the radiographic fi ndings alone.
TOOTH MOBILITY
Widening of the PDL space suggests tooth mobility, which may result from occlusal trauma or a lack of bone support arising from advanced bone loss. If the affected tooth has a single root, the socket may develop an hourglass shape. If the tooth is multirooted, it may show widening of the PDL space at the apices and in the region of the furca-tion. These changes result when the tooth moves about an axis of rotation at some midpoint on the roots. In addition, the radiographic image of the lamina dura may appear broad and hazy and show increased density.
OPEN CONTACTS
When the mesial and distal surfaces of adjacent teeth do not touch, the patient has an open contact. This condition may be dangerous to the periodontium because of the potential for food debris to become trapped in the region. Trapped food particles may damage the soft tissue and induce an infl ammatory response and contribute to the development of localized periodontal disease. Open contacts are asso-ciated with periodontal disease more than closed contacts are. Similar potential situations where periodontal disease may develop are dis-crepancies in the height of two adjacent marginal ridges or tipped teeth ( Fig. 18-15 ). Abnormal tooth alignment does not cause periodontal disease but provides an environment where the disease may develop as a result of diffi culty in maintaining adequate oral hygiene.
LOCAL IRRITATING FACTORS
Other local factors that are radiographically apparent may provide an environment where periodontal disease may develop or may aggra-vate existing periodontal disease. For instance, calculus deposits ( Fig. 18-16 ) can prevent effective cleansing of a sulcus and lead to enhanced plaque formation and the progression of periodontal disease. Calculus is most commonly seen on the mandibular incisors but may be local-ized to any surface or generalized throughout the dentition. Defective restorations with overhanging or poorly contoured margins can also lead to the accumulation of plaque, thus providing an environment where periodontal disease may develop ( Fig. 18-17 ). Radiographs often reveal these conditions.
Evaluation of Periodontal Therapy
Radiographs may show signs of successful treatment of periodontal disease. In some cases there may be reformation of the interproximal cortex ( Fig. 18-18 ) and the sharp line angle between the cortex and lamina dura. The relatively radiolucent margins of bone that were undergoing active resorption before treatment may become more sclerotic (radiopaque) after successful therapy. In some cases there may have been considerable mineral loss of the cancellous bone (appearing radiolucent) so that the bone is not radiographically apparent. Successful treatment may then result in remineralization, causing the bone to become visible in the radiographic image, giving the false impression that bone has actually grown into periodontal defects. In many cases there will be no apparent radiographic changes after successful treatment. Also, radiographs do not disclose the thera-peutic elimination of (radiolucent) soft tissue periodontal pockets; healing therefore is best assessed by clinical evaluation.
Sequential radiographs made with different beam angulations may give the false impression that bone has grown into the periodontal defects. Therefore in a longitudinal study effort should be given to duplicate the image geometry as well as using ideal exposure and
FIG. 18-15 The second molar has tipped mesially after loss of the fi rst molar, creating an abnormal tooth alignment that was diffi cult for the patient to maintain and leading to localized periodontal disease. Note the calculus on the mesial surface of the second molar. The crown on the second premolar was constructed with an enlarged distal contour to stop further tipping of the molar.

292 PART V ■ RADIOGRAPHIC INTERPRETATION
processing variables. For instance, too high an x-ray exposure or too long a developing time increases the density of the image (more radiolucent) and thin bone such as the alveolar crest may not be apparent, giving the false impression that the bone has been resorbed. Alternatively, underexposed or underdeveloped fi lms may give the false impression of bone growth.
The clinical crown-to-tooth ratio is a useful criterion not only for determining the nature of the restorative treatment to be performed on a tooth but also for deciding on the prognosis of an individual tooth. It is a measure of the tooth ’ s bony support, relating the propor-tion of tooth length that is beyond the level of bone (clinical crown) to that supported by the lowest level of bone (bony investment). Teeth have an unfavorable crown-to-root ratio when the length of the tooth out of bone exceeds the length of root supported by bone.
DIFFERENTIAL DIAGNOSIS
The majority of cases of bone loss around teeth are caused by peri-odontal diseases. This fact can make the clinician less sensitive to other diseases with similar manifestations that should always be considered in the differential diagnosis. Occasionally, more serious diseases are missed or recognized late. The most likely clinical sign of disease other than periodontal disease is the presence of one or a few adjacent loose teeth when the rest of the mouth shows no signs of periodontal disease. Radiographically, suspicion should be heightened if the bone destruction does not have the pattern or morphology normally associ-ated with periodontal disease. Squamous cell carcinoma of the alveo-lar process occasionally is treated as periodontal disease, resulting in an unfortunate delay in diagnosis and treatment ( Fig. 18-19, A ). This malignancy may display characteristics that suggest its true nature, such as extensive bone destruction of a localized region or invasive characteristics (see Chapter 23 ), or it may mimic periodontal disease. In some cases only the clinical characteristics of the lesion and the failure to respond to treatment indicate the presence of malignancy.
Any lesion of bone destruction that has ill-defi ned borders and a lack of peripheral bone response (sclerosis) should be viewed with suspicion. Another disease to be considered is Langerhans ’ cell histio-cytosis ( Fig. 18-19, B ). Often this disease may manifest as single or multiple regions of bone destruction around the roots of teeth, similar to periodontal disease. The condition may appear similar to localized
FIG. 18-16 Calculus may be seen as small angular radiopaque deposits pro-jecting between interproximal surfaces of the teeth (A) or as radiopaque bands across the roots representing circumfer-ential accumulation ( B, arrow ).
A B
FIG. 18-17 These overhanging restorations provided an environment suitable for plaque accumulation and subsequent localized periodontal bone loss (arrow).
FIG. 18-18 An example of a case where the interproximal cortex of the alveolar crest has reformed after successful periodontal therapy.
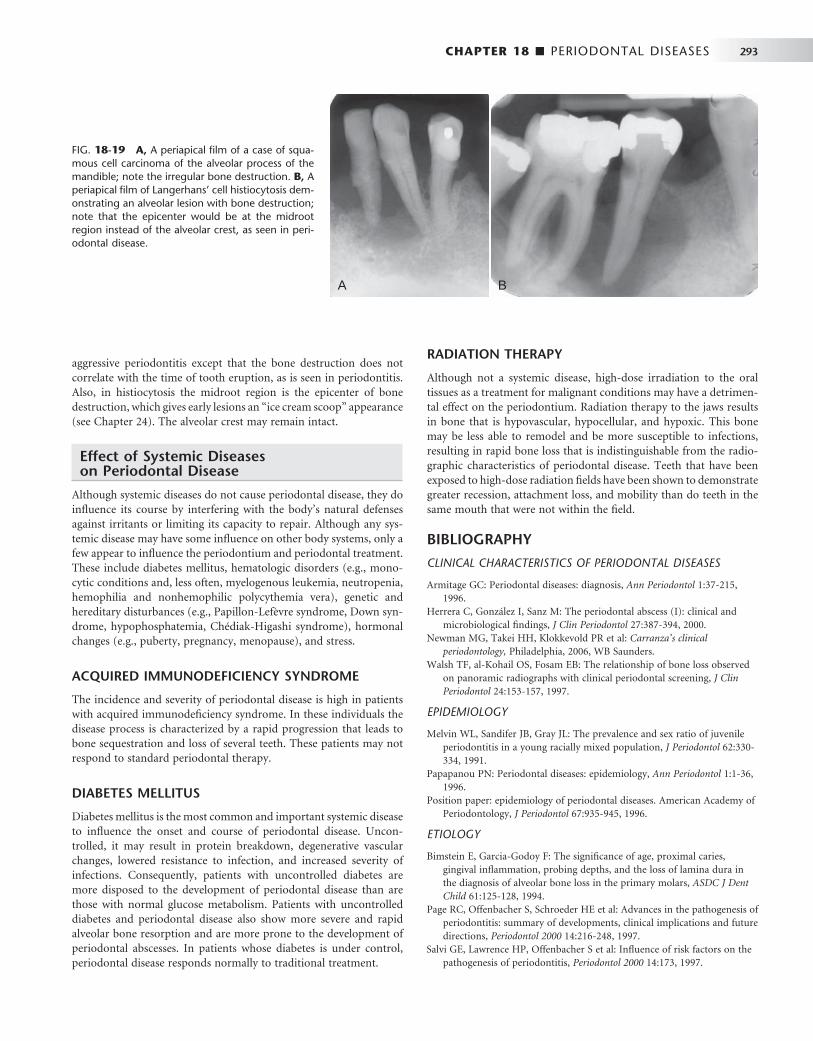
CHAPTER 18 ■ PERIODONTAL DISEASES 293
aggressive periodontitis except that the bone destruction does not correlate with the time of tooth eruption, as is seen in periodontitis. Also, in histiocytosis the midroot region is the epicenter of bone destruction, which gives early lesions an “ ice cream scoop ” appearance (see Chapter 24 ). The alveolar crest may remain intact.
Effect of Systemic Diseases on Periodontal Disease
Although systemic diseases do not cause periodontal disease, they do infl uence its course by interfering with the body ’ s natural defenses against irritants or limiting its capacity to repair. Although any sys-temic disease may have some infl uence on other body systems, only a few appear to infl uence the periodontium and periodontal treatment. These include diabetes mellitus, hematologic disorders (e.g., mono-cytic conditions and, less often, myelogenous leukemia, neutropenia, hemophilia and nonhemophilic polycythemia vera), genetic and hereditary disturbances (e.g., Papillon-Lef è vre syndrome, Down syn-drome, hypophosphatemia, Ch é diak-Higashi syndrome), hormonal changes (e.g., puberty, pregnancy, menopause), and stress.
ACQUIRED IMMUNODEFICIENCY SYNDROME
The incidence and severity of periodontal disease is high in patients with acquired immunodefi ciency syndrome. In these individuals the disease process is characterized by a rapid progression that leads to bone sequestration and loss of several teeth. These patients may not respond to standard periodontal therapy.
DIABETES MELLITUS
Diabetes mellitus is the most common and important systemic disease to infl uence the onset and course of periodontal disease. Uncon-trolled, it may result in protein breakdown, degenerative vascular changes, lowered resistance to infection, and increased severity of infections. Consequently, patients with uncontrolled diabetes are more disposed to the development of periodontal disease than are those with normal glucose metabolism. Patients with uncontrolled diabetes and periodontal disease also show more severe and rapid alveolar bone resorption and are more prone to the development of periodontal abscesses. In patients whose diabetes is under control, periodontal disease responds normally to traditional treatment.
RADIATION THERAPY
Although not a systemic disease, high-dose irradiation to the oral tissues as a treatment for malignant conditions may have a detrimen-tal effect on the periodontium. Radiation therapy to the jaws results in bone that is hypovascular, hypocellular, and hypoxic. This bone may be less able to remodel and be more susceptible to infections, resulting in rapid bone loss that is indistinguishable from the radio-graphic characteristics of periodontal disease. Teeth that have been exposed to high-dose radiation fi elds have been shown to demonstrate greater recession, attachment loss, and mobility than do teeth in the same mouth that were not within the fi eld.
BIBLIOGRAPHY
CLINICAL CHARACTERISTICS OF PERIODONTAL DISEASES
1 Armitage GC : Periodontal diseases: diagnosis , Ann Periodontol 1 : 37 - 215 , 1996 .
2 Herrera C , Gonz á lez I , Sanz M : The periodontal abscess (I): clinical and microbiological fi ndings , J Clin Periodontol 27 : 387 - 394 , 2000 .
3 Newman MG , Takei HH , Klokkevold PR et al : Carranza ’ s clinical periodontology , Philadelphia , 2006 , WB Saunders.
4 Walsh TF , al-Kohail OS , Fosam EB : The relationship of bone loss observed on panoramic radiographs with clinical periodontal screening , J Clin Periodontol 24 : 153 - 157 , 1997 .
EPIDEMIOLOGY
5 Melvin WL , Sandifer JB , Gray JL : The prevalence and sex ratio of juvenile periodontitis in a young racially mixed population , J Periodontol 62 : 330 - 334 , 1991 .
6 Papapanou PN : Periodontal diseases: epidemiology , Ann Periodontol 1 : 1 - 36 , 1996 .
7 Position paper: epidemiology of periodontal diseases . American Academy of Periodontology, J Periodontol 67 : 935 - 945 , 1996 .
ETIOLOGY
8 Bimstein E , Garcia-Godoy F : The signifi cance of age, proximal caries, gingival infl ammation, probing depths, and the loss of lamina dura in the diagnosis of alveolar bone loss in the primary molars , ASDC J Dent Child 61 : 125 - 128 , 1994 .
9 Page RC , Offenbacher S , Schroeder HE et al : Advances in the pathogenesis of periodontitis: summary of developments, clinical implications and future directions , Periodontol 2000 14 : 216 - 248 , 1997 .
10 Salvi GE , Lawrence HP , Offenbacher S et al : Infl uence of risk factors on the pathogenesis of periodontitis , Periodontol 2000 14 : 173 , 1997 .
FIG. 18-19 A, A periapical fi lm of a case of squa-mous cell carcinoma of the alveolar process of the mandible; note the irregular bone destruction. B, A periapical fi lm of Langerhans ’ cell histiocytosis dem-onstrating an alveolar lesion with bone destruction; note that the epicenter would be at the midroot region instead of the alveolar crest, as seen in peri-odontal disease.
A B

294 PART V ■ RADIOGRAPHIC INTERPRETATION
11 Schwartz Z , Goultschin J , Dean DD et al : Mechanisms of alveolar bone destruction in periodontitis , Periodontol 2000 14 : 158 , 1997 .
12 Van Dyke TE , Serhan CN : Resolution of infl ammation: a new paradigm for the pathogenesis of periodontal diseases , J Dent Res 82 : 82 - 90 , 2003 .
RADIOGRAPHIC MANIFESTATIONS
13 Gutteridge DL : The use of radiographic techniques in the diagnosis and management of periodontal diseases , Dentomaxillofac Radiol 24 : 107 - 113 , 1995 .
14 Jeffcoat MK , Wang IC , Reddy MS : Radiographic diagnosis in periodontics , Periodontol 2000 7 : 54 - 68 , 1995 .
15 Khocht A , Zohn H , Deasy M et al : Screening for periodontal disease: radiographs vs PSR , J Am Dent Assoc 127 : 749 - 756 , 1996 .
16 Koral SM , Howell TH , Jeffcoat MK : Alveolar bone loss due to open interproximal contacts in periodontal disease , J Periodontol 52 : 447 - 450 , 1981 .
17 Mann J , Pettigrew J , Beideman R et al : Investigation of the relationship between clinically detected loss of attachment and radiographic changes in early periodontal disease , J Clin Periodontol 12 : 247 - 253 , 1985 .
18 Nielsen IM , Glavind L , Karring T : Interproximal periodontal intrabony defects: prevalence, localization, and etiological factors , J Clin Periodontol 7 : 187 - 198 , 1980 .
19 Rams TE , Listgarten MA , Slots J : Utility of radiographic crestal lamina dura for predicting periodontitis disease activity , J Clin Periodontol 21 : 571 - 576 , 1994 .
20 Waite IM , Furniss JS , Wong WM : Relationship between clinical periodontal condition and the radiological appearance at fi rst molar sites in adolescents: a 3-year study , J Clin Periodontol 21 : 155 - 160 , 1994 .
AGGRESSIVE PERIODONTITIS
21 Albandar JM , Brown LJ , L ö e H : Dental caries and tooth loss in adolescents with early onset periodontitis , J Periodontol 67 : 960 - 967 , 1996 .
22 Albandar JM , Brown LJ , L ö e H : Clinical features of early onset periodontitis , J Am Dent Assoc 128 : 1393 - 1399 , 1997 .
23 Brown LJ , Albandar JM , Brunelle JA et al : Early onset periodontitis: progression of attachment loss during 6 years , J Periodontol 67 : 968 - 975 , 1996 .
24 Loe H , Brown LJ : Early onset periodontitis in the United States of America , J Periodontol 62 : 608 - 616 , 1991 ,
25 Page RC , Altman LC , Ebersole JL et al : Rapidly progressive periodontitis: a distinct clinical condition , J Periodontol 54 : 197 - 209 , 1983 .
RADIOGRAPHIC TECHNIQUE
26 Bragger I : Radiographic diagnosis of periodontal disease progression , Curr Opin Periodontol 3 : 59 - 67 , 1996 .
27 Gr ö ndahl K , Gr ö ndahl HG , Webber RL et al : Infl uence of variations in projection geometry on the detectability of periodontal bone lesions: a comparison between subtraction radiography and conventional radiographic technique , J Clin Periodontol 11 : 411 - 420 , 1984 .
28 Pepelassi EA , Diamanti-Kipioti A : Selection of the most accurate method of conventional radiography for the assessment of periodontal osseous destruction , J Clin Periodontol 24 : 557 - 567 , 1997 .
29 Reed B , Polson A : Relationships between bitewing and periapical radiographs in assessing crestal alveolar bone levels , J Periodontol 55 : 22 - 27 , 1984 .
SUBTRACTION RADIOGRAPHY
30 Eickholz P , Hausmann E : Evidence for healing of periodontal defects 5 years after conventional and regenerative therapy: digital subtraction and bone level measurements , J Clin Periodontol 29 : 922 - 928 , 2002 .
OCCLUSAL TRAUMA
31 Burgett FG : Trauma from occlusion: periodontal concerns , Dent Clin North Am 39 : 301 - 311 , 1995 .
32 Wank GS , Kroll YJ : Occlusal trauma: an evaluation of its relationship to periodontal prostheses , Dent Clin North Am 25 : 511 - 532 , 1981 .
SYSTEMIC DISEASE
33 Emrich LJ , Shlossman M , Genco RJ : Periodontal disease in non-insulin-dependent diabetes mellitus , J Periodontol 62 : 123 - 131 , 1991 .
34 Epstein JB , Lunn R , Le N et al : Periodontal attachment loss in patients after head and neck radiation therapy , Oral Surg Oral Med Oral Path Oral Radiol Endod 86 : 673 - 677 , 1998 .
35 Farzim I , Edalat M : Periodontosis with hyperkeratosis palmaris and plantaris (the Papillon-Lef è vre syndrome): a case report , J Periodontol 45 : 316 - 318 , 1974 .
36 Nelson RG , Schlossman M , Budding LM et al : Periodontal diseases and NIDDM in Pima Indians , Diabetes Care 13 : 836 - 840 , 1990 .
37 Rateitschak-Pl ü ss EM , Schroeder HE : History of periodontitis in a child with Papillon-L è f è vre syndrome. A case report , J Periodontol 55 : 35 - 46 , 1984 .
38 Winkler JR , Grassi M , Murray PA : Clinical description and etiology of HIV-associated periodontal disease . In Robinson PB , Greenspan JS , editors: Prospectus on oral manifestations of AIDS , Littleton, MA , 1988 , PSG Publishing .
C H A P T E R 1 9
Dental Anomalies
Ernest W.N. Lam
Dental anomalies may be congenital, developmental, or acquired and may include variations in the normal number, size, morphology, or eruptive pattern of the teeth. Congenital
abnormalities are typically genetically inherited anomalies and devel-opmental anomalies occur during the formation of a tooth or teeth. In contrast, acquired abnormalities result from changes to teeth after normal formation. Teeth that form abnormally short roots may rep-resent congenital or developmental anomalies, whereas the shortening of normal tooth roots by external resorption represents an acquired change.
Developmental Abnormalities
NUMBER OF TEETH
Supernumerary Teeth
Synonyms Hyperdontia, distodens, mesiodens, peridens, parateeth, and supple-mental teeth
Defi nition Supernumerary teeth are those that develop in addition to the normal complement as a result of excess dental lamina in the jaws, and the tooth or teeth that develop may be morphologically normal or abnor-mal. When supernumerary teeth have normal morphologic features, the term supplemental is sometimes used. Supernumerary teeth that occur between the maxillary central incisors are termed mesiodens . Those that occur in the premolar area are peridens, and those found in the molar area are distodens.
Clinical Features Supernumerary teeth occur in 1% to 4% of the population, may have a greater incidence in Asians and Native Americans, and occur twice as often in males. Although supernumerary teeth can arise in either the deciduous or permanent dentitions, they are more common in the permanent dentition and can arise anywhere in either jaw. Single supernumerary teeth are most common in the anterior maxilla, where they are referred to as mesiodens ( Figs. 19-1 to 19-3 ), and in the maxillary molar region ( Fig. 19-4 ), whereas multiple supernumerary teeth occur most frequently in the premolar regions, usually in the mandible ( Figs. 19-5 and 19-6 ).
Supernumerary teeth are usually discovered radiographically because they may interfere with normal tooth eruption ( Fig. 19-7 ).
When a supernumerary tooth does erupt, it commonly does so outside the normal arch form because of space restrictions.
Radiographic Features The radiographic features of supernumerary teeth are variable. They may appear entirely normal in both size and shape, but they may also be smaller in size compared with the adjacent normal dentition or have a conical shape with the appearance of a canine tooth. In extreme cases, the supernumerary teeth may appear grossly deformed. Super-numerary teeth are easily identifi ed by counting and identifying all the teeth in the jaws.
Radiographs may reveal supernumerary teeth in the deciduous dentition ( Fig. 19-8 ) after 3 or 4 years of age when the deciduous teeth have formed or in the permanent dentition of children older than 9 to 12 years.
In addition to periapical radiography, occlusal radiographs may aid in determining the location and number of unerupted supernu-merary teeth. Care should be taken to review panoramic radiographs for supernumerary teeth. In some cases, the distorted image of a supernumerary tooth lying outside the focal trough (i.e., in the hard palate) may be easily missed.
Differential Diagnosis Multiple supernumerary teeth have been associated with a number of genetically inherited syndromes including cleidocranial dysplasia (see Chapter 30 ), Gardner ’ s syndrome (see Chapter 22 ), and pykodysostosis.
Management The management of supernumerary teeth depends on many factors, including their potential effect on the developing normal dentition, their position and number, and the potential complications that may result from surgical intervention. If supernumerary teeth erupt, they can cause malalignment of the normal dentition. Those that remain in the jaws may cause root resorption and their follicles develop into dentigerous cysts or interfere with the normal eruption sequence. All the preceding factors infl uence the decision to either remove a super-numerary tooth or keep it under observation.
Missing Teeth
Synonyms Hypodontia, oligodontia, and anodontia
295

296 PART V ■ RADIOGRAPHIC INTERPRETATION
FIG. 19-1 Periapical radiographs of inverted mesiodens.
A
B
FIG. 19-2 Axial (A) and cross-sectional (B and C) cone-beam computed tomographic views of two mesiodens erupting to the palatal aspect of the adjacent permanent central incisors.
A CB
FIG. 19-3 Periapical radiograph of a supplemental lateral incisor.

CHAPTER 19 ■ DENTAL ANOMALIES 297
FIG. 19-4 A, An example of two supplemental teeth in the maxillary third molar area (distodens). B, An example in the mandibular third molar region. ( A courtesy Dr. H. Grubisa, Oakville, Ontario, Canada).
A B
FIG. 19-5 Periapical radiographs show bilateral supplemental premolar teeth (peridens).
A B
FIG. 19-6 Axial (A), right cross-sectional (B), and left cross-sectional (C) cone-beam computed tomographic views of peridens developing to the lingual of the adjacent mandibular fi rst premolars.
A B C

298 PART V ■ RADIOGRAPHIC INTERPRETATION
Defi nition
The expression of developmentally missing teeth may range from the absence of one or a few teeth (hypodontia), to the absence of numer-ous teeth (oligodontia), to the failure of all teeth to develop (anodon-tia). Developmentally missing teeth may also be the result of numerous independent pathologic mechanisms that can affect the orderly for-mation of the dental lamina (e.g., orofaciodigital syndrome), failure of a tooth germ to develop at the optimal time, lack of necessary space imposed by a malformed jaw, or disproportion between tooth mass and jaw size.
Clinical Features Hypodontia in the permanent dentition, excluding third molars, is found in 3% to 10% of the population. Hypodontia is more frequently found in Asians and Native Americans. Although missing primary teeth are relatively uncommon, when one tooth is missing, it is usually a maxillary incisor. The most commonly missing teeth are third molars, followed by second premolars ( Fig. 19-9 ), and maxillary lateral and mandibular central incisors. The absence may be either unilateral or bilateral. Children who have developmentally missing teeth tend to have more than one absent and more than one morpho-logic group (incisors, premolars, and molars) involved.
Radiographic Features The development of teeth may vary markedly between individuals. Missing teeth may be recognized by identifying and counting the teeth present. For some individuals, however, the eruption of some teeth may be delayed by a number of years after the established time (espe-cially mandibular second premolars), whereas others may erupt as late as a year after the contralateral tooth.
Differential Diagnosis A tooth may be considered to be developmentally missing when it cannot be discerned clinically or radiographically, and no history exists of its extraction. Anodontia or oligodontia may occur in patients with ectodermal dysplasia ( Fig. 19-10 ). This genetically inherited autosomal dominant disorder results in the absence of at least two ectodermally derived structures such as sweat glands, hair, skin, nails, and teeth. When the teeth are involved, the condition may present with multiple missing and/or malformed teeth that often have a conical or canine shape or a notable decrease in tooth size.
Management Missing teeth, abnormal occlusion, or altered facial appearance may cause some patients psychologic distress. If the extent of hypodontia is mild, the associated changes may likewise be slight and manageable by orthodontics. In more severe cases restorative, implant, and pros-thetic procedures can be undertaken.
SIZE OF TEETH
A positive correlation exists between tooth size (mesiodistal or buc-colingual dimension) and body height. Males also have larger primary
FIG. 19-7 Examples of mesiodens interfering with eruption of adja-cent permanent teeth.
FIG. 19-8 Supplemental deciduous molar (arrow).
FIG. 19-9 Developmental absence of maxillary and mandibular second premolars and maxillary canines. Note the apically positioned deciduous mandibular second molars. This appearance is suggestive of ankylosis of the teeth.

CHAPTER 19 ■ DENTAL ANOMALIES 299
and permanent teeth than do females. Beyond these normal varia-tions, however, individuals may occasionally have unusually large or small teeth.
Macrodontia
Defi nition In macrodontia, the teeth are larger than normal. Macrodontia rarely affects the entire dentition. Often a single tooth, individual contralat-eral teeth, or a group of teeth may be involved ( Fig. 19-11 ). Macro-dontia may occur sporadically, and its cause is unknown. Vascular abnormalities such as a hemangioma (arising from within the bone or the soft tissues) can result in an increase in the size and accelerate the development of adjacent teeth. Macrodontia can also occur in hemihypertrophy of the face or in pituitary gigantism.
Clinical Features Clinically, macrodont teeth appear large and may be associated with crowding, malocclusion, or impaction.
Radiographic Features Radiographs reveal the increased size of both unerupted and erupted macrodont teeth. The shape of the tooth is usually normal, but some cases may exhibit mildly distorted morphology. Crowding may cause impaction of adjacent teeth.
FIG. 19-10 Two examples of multiple missing and malformed teeth in ectodermal dysplasia.
A
B
FIG. 19-11 A large macrodont molar shows an increased mesiodistal dimension (A). The macrodont central incisor shows enlarged mesiodistal and coronal-apical dimensions (B). ( A courtesy Dr. B. Gratt, Los Angeles, Calif.)
A
B
Differential Diagnosis The differential diagnosis of a sporadic macrodont tooth includes gemination and fusion. When fusion occurs, a count of the teeth present will reveal a missing tooth. In gemination all the teeth may be present and often evidence exists of a division or cleft of the crown or root of the tooth. The differentiation between these three condi-tions may not infl uence the treatment provided.
Management In most cases macrodontia does not require treatment. Orthodontic treatment may be necessary if a malocclusion is present.
Microdontia
Defi nition In microdontia, the teeth are smaller than normal. As with macrodon-tia, microdontia may involve all the teeth or be limited to a single tooth or group of teeth. Often the lateral incisors and third molars may be small. Generalized microdontia is extremely rare, although it does occur in some patients with pituitary dwarfi sm. Supernumerary teeth may also be microdonts.
Clinical Features The involved teeth are noticeably small and may have altered mor-phology. Microdont molars may have an altered shape. For example,

300 PART V ■ RADIOGRAPHIC INTERPRETATION
mandibular molars may have four cusps rather than fi ve, and maxil-lary molars may have four cusps rather than three ( Fig. 19-12 ). Micro-dont lateral incisors may be peg shaped ( Fig. 19-13 ).
Radiographic Features These small teeth are frequently malformed.
Differential Diagnosis The recognition of small teeth indicates the diagnosis. The number and distribution of microdonts may also suggest consideration of syndromes (e.g., congenital heart disease, progeria).
Management Restorative or prosthetic treatment may be considered to create a more normal-appearing tooth, especially when considering esthetic concerns in the anterior dentition.
ERUPTION OF TEETH
Transposition
Defi nition
Transposition is the condition in which two typically adjacent teeth have exchanged positions in the dental arch.
Clinical Features The most frequently transposed teeth are the permanent canine and the fi rst premolar. Second premolars infrequently lie between the fi rst
and second molars. The transposition of central and lateral incisors is rare. Transposition can occur with hypodontia, supernumerary teeth, or the persistence of a deciduous predecessor. Transposition in the primary dentition has not been reported.
Radiographic Features Radiographs reveal transposition when the teeth are not in their usual sequence in the dental arch ( Fig. 19-14 ).
Differential Diagnosis Transposed teeth are usually easily recognized.
Management Transposed teeth are frequently altered prosthetically for function and/or esthetics.
ALTERED MORPHOLOGY OF TEETH
Fusion
Synonym
Synodontia
FIG. 19-12 Periapical radiographs show a reduction in both the size and number of cusps in microdontia of the maxillary third molars.
FIG. 19-13 The “ peg-shaped ” deformity in microdontia of a maxil-lary lateral incisor.
FIG. 19-14 A cropped panoramic image demonstrating bilateral transposition of the maxillary canines and fi rst premolars.

CHAPTER 19 ■ DENTAL ANOMALIES 301
Defi nition Fusion of teeth results from the union of adjacent tooth germs of developing teeth. Some authors think that fusion results when two tooth germs develop so close together that, as they grow, they contact and fuse before calcifi cation. Others contend that a physical force or pressure produced during development causes contact of adjacent tooth buds. Males and females experience fusion in equal numbers, and the incidence is higher in Asians and Native Americans.
Clinical Features Fusion results in a reduced number of teeth in the arch. Although more common between deciduous teeth, fusion may also occur in the permanent dentition. When a deciduous canine and lateral incisor fuse, the corresponding permanent lateral incisor may be absent. Fusion is more common in anterior teeth of both the permanent and deciduous dentition ( Fig. 19-15 ). Fusion may be total or partial, depending on the stage of odontogenesis and the proximity of the developing teeth. The result can vary from a single tooth of about normal size to a tooth of nearly twice the normal size. The crowns of fused teeth usually appear to be large and single, although incisal clefts of varying depth or a bifi d crown can sometimes occur.
Radiographic Features Radiographs disclose the unusual shape or size of the fused teeth. The true nature and extent of the union are frequently more evident on the radiograph than can be determined by clinical examination. Fused teeth may also show an unusual confi guration of the pulp chamber or root canal.
Differential Diagnosis The differential diagnosis for fused teeth includes gemination and macrodontia. Fusion may be differentiated from gemination when the number of teeth is reduced by one, except in the unusual case in which a normal tooth and a supernumerary tooth have fused. The differen-tiation is usually academic because little difference exists in the treat-ment provided.
Management The management of a case of fusion depends on which teeth are involved, the degree of fusion, and the morphologic result. If the affected teeth are deciduous, they may be retained as they are. If the clinician contemplates extraction, it is important fi rst to deter-mine whether the permanent teeth are present. In the case of fused permanent teeth, the fused crowns may be reshaped with a res-toration that mimics two independent crowns. The morphology of fused teeth require radiographic evaluation before the teeth are reshaped. Endodontic therapy may be necessary and perhaps may be diffi cult or impossible if the root canals are of unusual shape. In some cases it is most prudent to leave the teeth as they are.
Concrescence
Defi nition Concrescence occurs when the roots of two or more primary or per-manent teeth are fused by cementum. Although its cause is unknown, many authorities suspect that space restriction during development, local trauma, excessive occlusal force, or local infection after develop-ment plays an important role. If the condition occurs during develop-ment, it is sometimes referred to as true concrescence. If the condition occurs later, it is acquired concrescence.
Clinical Features Maxillary molars are the teeth most frequently involved, especially a third molar and a supernumerary tooth. Involved teeth may fail to erupt or may erupt incompletely. The sexes are equally affected.
Radiographic Features A radiographic examination may not always distinguish between con-crescence and teeth that are in close contact or that are simply super-imposed ( Fig. 19-16 ). When the condition is suspected on a radiograph and extraction of one of the teeth is being considered, additional projections at different angles may be obtained to better delineate the condition.
Differential Diagnosis It is usually impossible to determine radiographically with certainty whether the teeth whose root images are superimposed are actually joined. If the roots are joined, it may not be possible to tell whether the union is by cementum or by dentin (fusion). In this regard, the absence of a periodontal ligament (PDL) space between the roots may be helpful.
Management Concrescence affects treatment only when the decision is made to remove one or both of the involved teeth because this condition complicates the extraction. The clinician should warn the patient that an effort to remove one might result in the unintended and simultane-ous removal of the other.
Gemination
Synonym Twinning
Defi nition Gemination is a rare anomaly that arises when a single tooth bud attempts to divide. The result may be an invagination of the crown with partial division or, in rare cases, complete division through the crown and root, producing identical structures. Complete twinning results in a normal tooth plus a supernumerary tooth in the arch. The cause of gemination is unknown, but some evidence suggests that it is familial.
FIG. 19-15 Fusion of the central and lateral incisors in both the primary and the permanent dentitions. Note the reduction in number of teeth and the increased width of the fused tooth mass.

302 PART V ■ RADIOGRAPHIC INTERPRETATION
Clinical Features Although gemination may occur in both the deciduous and perma-nent dentitions, it more frequently affects the primary teeth, usually in the incisor region. It can be detected clinically after the anomalous tooth erupts. The occurrence in males and females is about equal. The enamel or dentin of geminated teeth may be hypoplastic or hypocalcifi ed.
Radiographic Features Radiographs reveal the altered shape of the hard tissue and pulp chamber of the geminated tooth. Radiopaque enamel outlines the clefts in the crowns and invaginations and thus accentuates them. The pulp chamber is usually single and enlarged and may be partially divided ( Fig. 19-17 ). In the rare case of premolar gemination, the tooth image suggests a molar with an enlarged crown and two roots.
Differential Diagnosis The differential diagnosis of gemination includes fusion. If the mal-formed tooth is counted as one, individuals with gemination have a
normal tooth count, whereas those with fusion are seen to be missing a tooth.
Management A geminated tooth in the anterior region may compromise arch esthetics and arch length. Areas of hypoplasia and invagination lines or areas of coronal separation represent caries-susceptible sites that may in time result in pulpal infl ammation. Affected teeth can cause malocclusion and lead to periodontal disease. Consequently, the affected tooth may be removed (especially if it is deciduous), the crown(s) may be restored or reshaped, or the tooth may be left untreated and periodically examined to preclude the development of complications. Before treatment is initiated on a primary tooth, the status of the permanent succedaneous tooth and confi guration of its root canals should be determined radiographically.
Taurodontism
Defi nition The body of taurodont teeth appears elongated and the roots short. The pulp chamber extends from a normal position in the crown
FIG. 19-16 A, Concrescence occurs when two teeth are joined by cementum. B, Extraction of one tooth may result in the unintended removal of the second because the cementum bridge may not be well visualized radiographically. (Courtesy Dr. R. Kienholz, Dallas, Tex.)
A B
FIG. 19-17 Gemination of a mandibular lateral incisor showing bifurcation of the crown and pulp chamber (A). Almost complete gemination of a deciduous lateral incisor (B).
AB
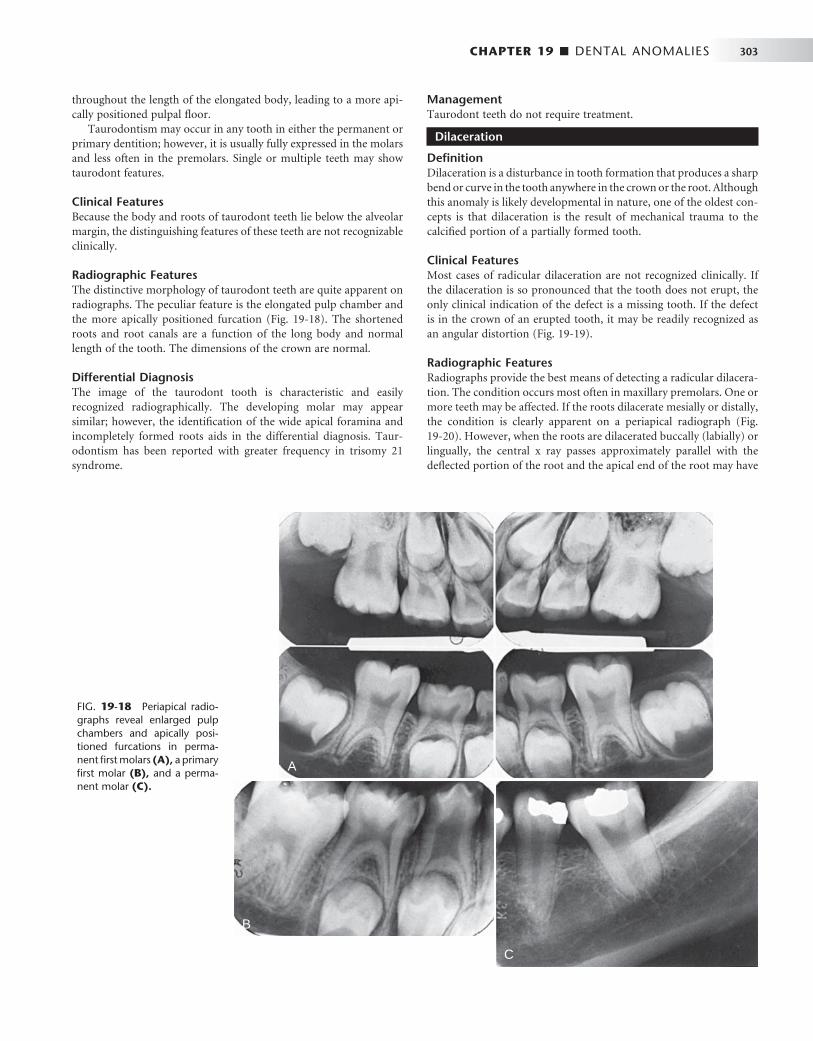
CHAPTER 19 ■ DENTAL ANOMALIES 303
throughout the length of the elongated body, leading to a more api-cally positioned pulpal fl oor.
Taurodontism may occur in any tooth in either the permanent or primary dentition; however, it is usually fully expressed in the molars and less often in the premolars. Single or multiple teeth may show taurodont features.
Clinical Features Because the body and roots of taurodont teeth lie below the alveolar margin, the distinguishing features of these teeth are not recognizable clinically.
Radiographic Features The distinctive morphology of taurodont teeth are quite apparent on radiographs. The peculiar feature is the elongated pulp chamber and the more apically positioned furcation ( Fig. 19-18 ). The shortened roots and root canals are a function of the long body and normal length of the tooth. The dimensions of the crown are normal.
Differential Diagnosis The image of the taurodont tooth is characteristic and easily recognized radiographically. The developing molar may appear similar; however, the identifi cation of the wide apical foramina and incompletely formed roots aids in the differential diagnosis. Taur-odontism has been reported with greater frequency in trisomy 21 syndrome.
Management Taurodont teeth do not require treatment.
Dilaceration
Defi nition Dilaceration is a disturbance in tooth formation that produces a sharp bend or curve in the tooth anywhere in the crown or the root. Although this anomaly is likely developmental in nature, one of the oldest con-cepts is that dilaceration is the result of mechanical trauma to the calcifi ed portion of a partially formed tooth.
Clinical Features Most cases of radicular dilaceration are not recognized clinically. If the dilaceration is so pronounced that the tooth does not erupt, the only clinical indication of the defect is a missing tooth. If the defect is in the crown of an erupted tooth, it may be readily recognized as an angular distortion ( Fig. 19-19 ).
Radiographic Features Radiographs provide the best means of detecting a radicular dilacera-tion. The condition occurs most often in maxillary premolars. One or more teeth may be affected. If the roots dilacerate mesially or distally, the condition is clearly apparent on a periapical radiograph ( Fig. 19-20 ). However, when the roots are dilacerated buccally (labially) or lingually, the central x ray passes approximately parallel with the defl ected portion of the root and the apical end of the root may have
FIG. 19-18 Periapical radio-graphs reveal enlarged pulp chambers and apically posi-tioned furcations in perma-nent fi rst molars (A), a primary fi rst molar (B), and a perma-nent molar (C).
A
B
C
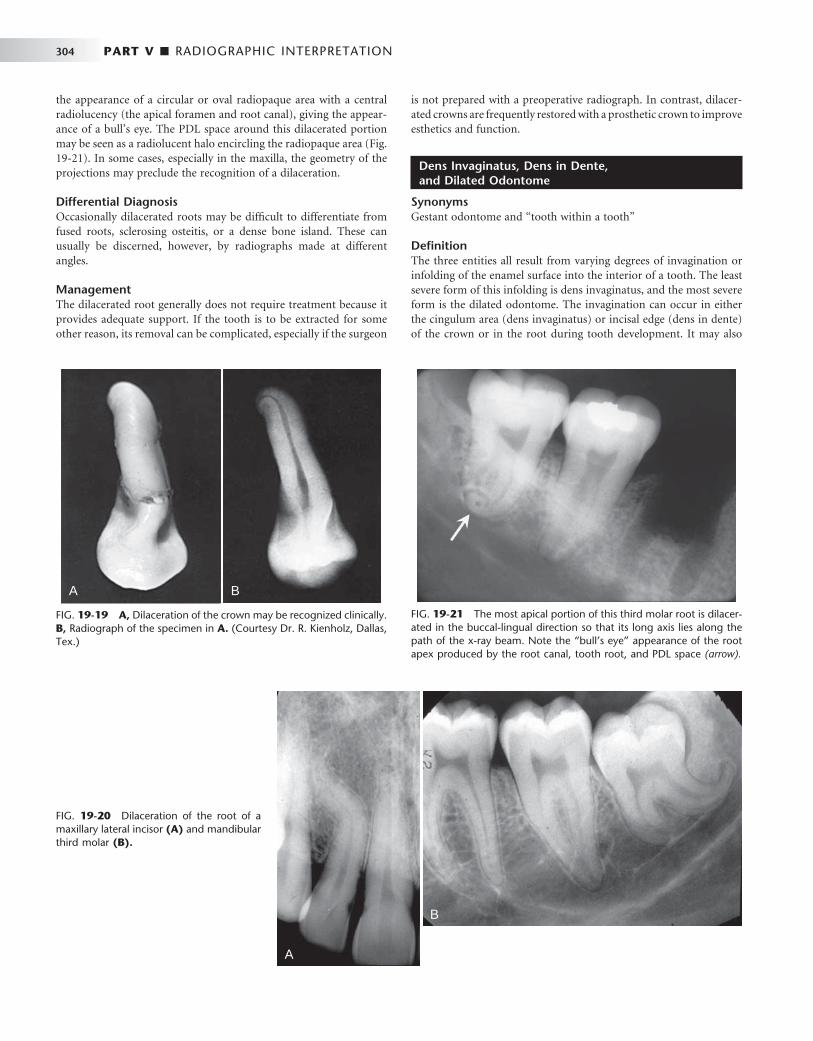
304 PART V ■ RADIOGRAPHIC INTERPRETATION
is not prepared with a preoperative radiograph. In contrast, dilacer-ated crowns are frequently restored with a prosthetic crown to improve esthetics and function.
Dens Invaginatus, Dens in Dente, and Dilated Odontome
Synonyms Gestant odontome and “ tooth within a tooth ”
Defi nition The three entities all result from varying degrees of invagination or infolding of the enamel surface into the interior of a tooth. The least severe form of this infolding is dens invaginatus, and the most severe form is the dilated odontome. The invagination can occur in either the cingulum area (dens invaginatus) or incisal edge (dens in dente) of the crown or in the root during tooth development. It may also
FIG. 19-19 A, Dilaceration of the crown may be recognized clinically. B, Radiograph of the specimen in A. (Courtesy Dr. R. Kienholz, Dallas, Tex.)
A B
FIG. 19-20 Dilaceration of the root of a maxillary lateral incisor (A) and mandibular third molar (B).
A
B
the appearance of a circular or oval radiopaque area with a central radiolucency (the apical foramen and root canal), giving the appear-ance of a bull ’ s eye. The PDL space around this dilacerated portion may be seen as a radiolucent halo encircling the radiopaque area ( Fig. 19-21 ). In some cases, especially in the maxilla, the geometry of the projections may preclude the recognition of a dilaceration.
Differential Diagnosis Occasionally dilacerated roots may be diffi cult to differentiate from fused roots, sclerosing osteitis, or a dense bone island. These can usually be discerned, however, by radiographs made at different angles.
Management The dilacerated root generally does not require treatment because it provides adequate support. If the tooth is to be extracted for some other reason, its removal can be complicated, especially if the surgeon
FIG. 19-21 The most apical portion of this third molar root is dilacer-ated in the buccal-lingual direction so that its long axis lies along the path of the x-ray beam. Note the “ bull ’ s eye ” appearance of the root apex produced by the root canal, tooth root, and PDL space (arrow).
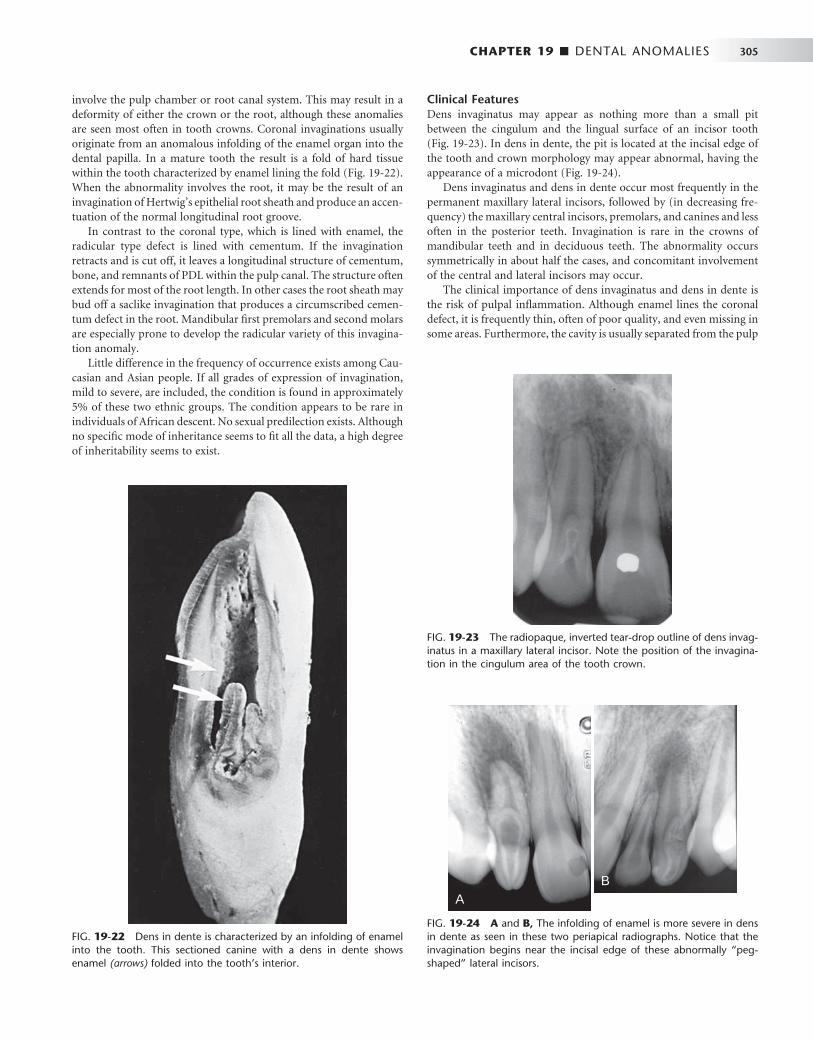
CHAPTER 19 ■ DENTAL ANOMALIES 305
involve the pulp chamber or root canal system. This may result in a deformity of either the crown or the root, although these anomalies are seen most often in tooth crowns. Coronal invaginations usually originate from an anomalous infolding of the enamel organ into the dental papilla. In a mature tooth the result is a fold of hard tissue within the tooth characterized by enamel lining the fold ( Fig. 19-22 ). When the abnormality involves the root, it may be the result of an invagination of Hertwig ’ s epithelial root sheath and produce an accen-tuation of the normal longitudinal root groove.
In contrast to the coronal type, which is lined with enamel, the radicular type defect is lined with cementum. If the invagination retracts and is cut off, it leaves a longitudinal structure of cementum, bone, and remnants of PDL within the pulp canal. The structure often extends for most of the root length. In other cases the root sheath may bud off a saclike invagination that produces a circumscribed cemen-tum defect in the root. Mandibular fi rst premolars and second molars are especially prone to develop the radicular variety of this invagina-tion anomaly.
Little difference in the frequency of occurrence exists among Cau-casian and Asian people. If all grades of expression of invagination, mild to severe, are included, the condition is found in approximately 5% of these two ethnic groups. The condition appears to be rare in individuals of African descent. No sexual predilection exists. Although no specifi c mode of inheritance seems to fi t all the data, a high degree of inheritability seems to exist.
Clinical Features Dens invaginatus may appear as nothing more than a small pit between the cingulum and the lingual surface of an incisor tooth ( Fig. 19-23 ). In dens in dente, the pit is located at the incisal edge of the tooth and crown morphology may appear abnormal, having the appearance of a microdont ( Fig. 19-24 ).
Dens invaginatus and dens in dente occur most frequently in the permanent maxillary lateral incisors, followed by (in decreasing fre-quency) the maxillary central incisors, premolars, and canines and less often in the posterior teeth. Invagination is rare in the crowns of mandibular teeth and in deciduous teeth. The abnormality occurs symmetrically in about half the cases, and concomitant involvement of the central and lateral incisors may occur.
The clinical importance of dens invaginatus and dens in dente is the risk of pulpal infl ammation. Although enamel lines the coronal defect, it is frequently thin, often of poor quality, and even missing in some areas. Furthermore, the cavity is usually separated from the pulp
FIG. 19-22 Dens in dente is characterized by an infolding of enamel into the tooth. This sectioned canine with a dens in dente shows enamel (arrows) folded into the tooth ’ s interior.
FIG. 19-23 The radiopaque, inverted tear-drop outline of dens invag-inatus in a maxillary lateral incisor. Note the position of the invagina-tion in the cingulum area of the tooth crown.
FIG. 19-24 A and B, The infolding of enamel is more severe in dens in dente as seen in these two periapical radiographs. Notice that the invagination begins near the incisal edge of these abnormally “ peg-shaped ” lateral incisors.
AB

306 PART V ■ RADIOGRAPHIC INTERPRETATION
chamber by a relatively thin wall that opens into the oral environment through a narrow constriction. The pit is often diffi cult if not impos-sible to keep clean, and consequently it offers conditions favorable for the development of caries. Such carious lesions are diffi cult to detect clinically and rapidly involve the pulp. In addition, sometimes fi ne canals extend between the invagination and the pulp chamber, result-ing in pulpal disease even in the absence of caries.
Radiographic Features Most cases of dens invaginatus or dens in dente are discovered radio-graphically and can be identifi ed in the radiographic image even before the tooth erupts. The infolding of the enamel lining is more radiopaque than the surrounding tooth structure and can easily be identifi ed as an inverted teardrop-shaped radiolucency with a radi-opaque border ( Figs. 19-23 and 19-24 ). Less frequently the radicular invaginations appear as poorly defi ned, slightly radiolucent structures running longitudinally within the root. The defects, especially the coronal variety, may vary in size and shape from small and superfi cial to large and deep. If a coronal invagination is extensive, the crown is almost invariably malformed and the apical foramen is usually wide ( Fig. 19-25 ). A frequent cause of an open apical foramen is the cessa-tion of root development that occurs as a result of death of the pulpal tissue.
In the most severe form (dilated odontome) the tooth is severely deformed, having a circular or oval shape with a radiolucent interior ( Fig. 19-26 ).
Differential Diagnosis The appearance and usual occurrence in incisors are so characteristic that, once recognized, little probability exists that the anomaly will be confused with another condition.
Management Although it is important to evaluate every case individually, the place-ment of a prophylactic restoration in the defect is typically the treat-ment of choice and should ensure a normal life span for the tooth.
Failure of early identifi cation and hence treatment may result in pre-mature tooth loss or the requirement for root canal therapy.
Dens Evaginatus
Synonym Leong ’ s premolar
Defi nition In contrast to dens invaginatus or dens in dente, dens evaginatus is the result of an outpouching of the enamel organ. The resultant enamel-covered tubercle usually occurs in or near the middle of the occlusal surface of a premolar or occasionally a molar ( Fig. 19-27 ). Lateral incisors are most commonly involved, whereas canines are rarely affected. The frequency of occurrence of dens evaginatus is highest in Asians and Native Americans.
Clinical Features Clinically, dens evaginatus appears as a tubercle of enamel on the occlusal surface of the affected tooth. A hard, polyplike protuberance predominantly exists in the central groove or lingual ridge of a buccal cusp of posterior teeth and in the cingulum fossa of anterior teeth. Dens evaginatus may occur bilaterally and usually in the mandible.
FIG. 19-25 A and B, Severe forms of dens in dente usually result in necrosis of the pulp, open apices, and rarefying osteitis at the tooth apices.
A
B
FIG. 19-26 A, A dilated odontome, the most severe of the enamel invaginations, is positioned just posterior to the developing mandibular third molar in this panoramic image. B, Radiographs of the extracted dilated odontome from two different angulations.
A
B
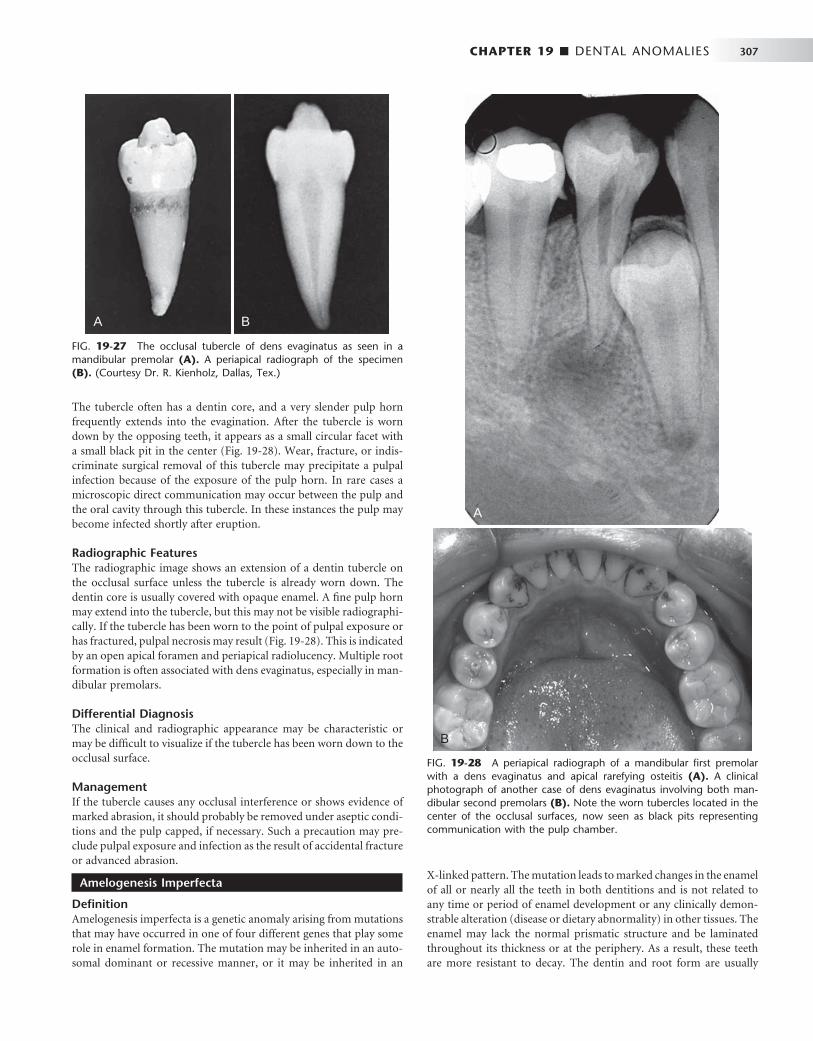
CHAPTER 19 ■ DENTAL ANOMALIES 307
The tubercle often has a dentin core, and a very slender pulp horn frequently extends into the evagination. After the tubercle is worn down by the opposing teeth, it appears as a small circular facet with a small black pit in the center ( Fig. 19-28 ). Wear, fracture, or indis-criminate surgical removal of this tubercle may precipitate a pulpal infection because of the exposure of the pulp horn. In rare cases a microscopic direct communication may occur between the pulp and the oral cavity through this tubercle. In these instances the pulp may become infected shortly after eruption.
Radiographic Features The radiographic image shows an extension of a dentin tubercle on the occlusal surface unless the tubercle is already worn down. The dentin core is usually covered with opaque enamel. A fi ne pulp horn may extend into the tubercle, but this may not be visible radiographi-cally. If the tubercle has been worn to the point of pulpal exposure or has fractured, pulpal necrosis may result ( Fig. 19-28 ). This is indicated by an open apical foramen and periapical radiolucency. Multiple root formation is often associated with dens evaginatus, especially in man-dibular premolars.
Differential Diagnosis The clinical and radiographic appearance may be characteristic or may be diffi cult to visualize if the tubercle has been worn down to the occlusal surface.
Management If the tubercle causes any occlusal interference or shows evidence of marked abrasion, it should probably be removed under aseptic condi-tions and the pulp capped, if necessary. Such a precaution may pre-clude pulpal exposure and infection as the result of accidental fracture or advanced abrasion.
Amelogenesis Imperfecta
Defi nition Amelogenesis imperfecta is a genetic anomaly arising from mutations that may have occurred in one of four different genes that play some role in enamel formation. The mutation may be inherited in an auto-somal dominant or recessive manner, or it may be inherited in an
X-linked pattern. The mutation leads to marked changes in the enamel of all or nearly all the teeth in both dentitions and is not related to any time or period of enamel development or any clinically demon-strable alteration (disease or dietary abnormality) in other tissues. The enamel may lack the normal prismatic structure and be laminated throughout its thickness or at the periphery. As a result, these teeth are more resistant to decay. The dentin and root form are usually
FIG. 19-27 The occlusal tubercle of dens evaginatus as seen in a mandibular premolar (A). A periapical radiograph of the specimen (B). (Courtesy Dr. R. Kienholz, Dallas, Tex.)
A B
FIG. 19-28 A periapical radiograph of a mandibular fi rst premolar with a dens evaginatus and apical rarefying osteitis (A). A clinical photograph of another case of dens evaginatus involving both man-dibular second premolars (B). Note the worn tubercles located in the center of the occlusal surfaces, now seen as black pits representing communication with the pulp chamber.
A
B

308 PART V ■ RADIOGRAPHIC INTERPRETATION
normal. Eruption of the affected teeth is often delayed, and a tendency for tooth impaction exists. Although at least 14 variants of the condi-tion have been described, four general types have been delineated on the basis of their clinical or radiographic appearances: a hypoplastic type, a hypomaturation type, a hypocalcifi ed type, and a hypomatura-tion/hypoplastic type associated with taurodontism.
Clinical Features Hypoplastic Type. The enamel of the affected teeth fails to
develop to its normal thickness. Consequently, the color of the under-lying dentin imparts a yellowish-brown color to the tooth. As well, the enamel may be abnormal: rough, pitted, smooth, or glossy. The crowns of the teeth may appear undersized with a roughly square shape. The reduced enamel thickness also causes a loss of contact between adjacent teeth ( Fig. 19-29 ). The occlusal surfaces of the pos-
terior teeth are relatively fl at with low cusps. This is a result of the attrition of cusp tips that were initially low and not fully formed.
Hypomaturation. In the hypomaturation form of amelogenesis imperfecta, the enamel has a mottled appearance but is of normal thickness. The enamel is softer than normal, its density comparable to dentin, and it may break away from the crown. Its color may range from clear to cloudy white, yellow, or brown. In one form of hypomaturation amelogenesis imperfecta, the teeth may be capped with white, opaque enamel. This appearance has been referred to as “ snow-capped ” teeth.
Hypocalcifi cation. The hypocalcifi c form of amelogenesis imperfecta is more common than the hypoplastic variety. The crowns of the teeth are normal in size and shape when they erupt because the enamel is of regular thickness ( Fig. 19-30 ). However, because the enamel is poorly mineralized (it is less dense than dentin), it starts to fracture away shortly after it comes into function. This creates clini-cally recognizable defects. The soft enamel abrades rapidly and the softer dentin also wears down rapidly, resulting in a grossly worn tooth, sometimes to the level of the gingiva. An explorer point under pressure can penetrate the soft enamel, yet caries in these worn teeth is unusual. The hypocalcifi ed enamel has increased permeability and becomes stained and darkened. The teeth of a young person with generalized hypomineralization of the enamel are frequently dark brown from food stains.
Hypomaturation/Hypocalcifi cation. This classifi cation indi-cates a combination of hypomaturation and hypocalcifi cation that involves both the permanent and deciduous dentition. If the domi-nant defect is hypomaturation, then the term hypomaturation-hypocalcifi cation is used. The enamel is usually mottled and discolored to a yellow or brown color. The enamel has the same radiopacity as the dentin. When the dominant defect is hypocalcifi cation, the term hypocalcifi cation-hypomaturation is used. The appearance of the teeth is similar, but the enamel is thin.
Radiographic Features Identifi cation of amelogenesis imperfecta is made primarily by clini-cal examination, although the radiographic features substantiate the clinical impression. The radiographic signs of hypoplastic amelogen-esis imperfecta include a square crown, a relatively thin radiopaque
FIG. 19-29 A, A cropped panoramic image of hypoplastic amelogen-esis imperfecta. Note the absence of interproximal contacts and the “ picket fence ” – like appearance of the teeth. B, Intraoral radiographs of another case of amelogenises imperfecta. Note the very thin enamel layer. ( A Courtesy Dr. S. Roth, Halifax, Nova Scotia, Canada.)
A
B
FIG. 19-30 The reduced radiopacity of the enamel and the rapid abrasion of the crowns of the primary teeth are features of hypomin-eralized amelogenesis imperfecta.
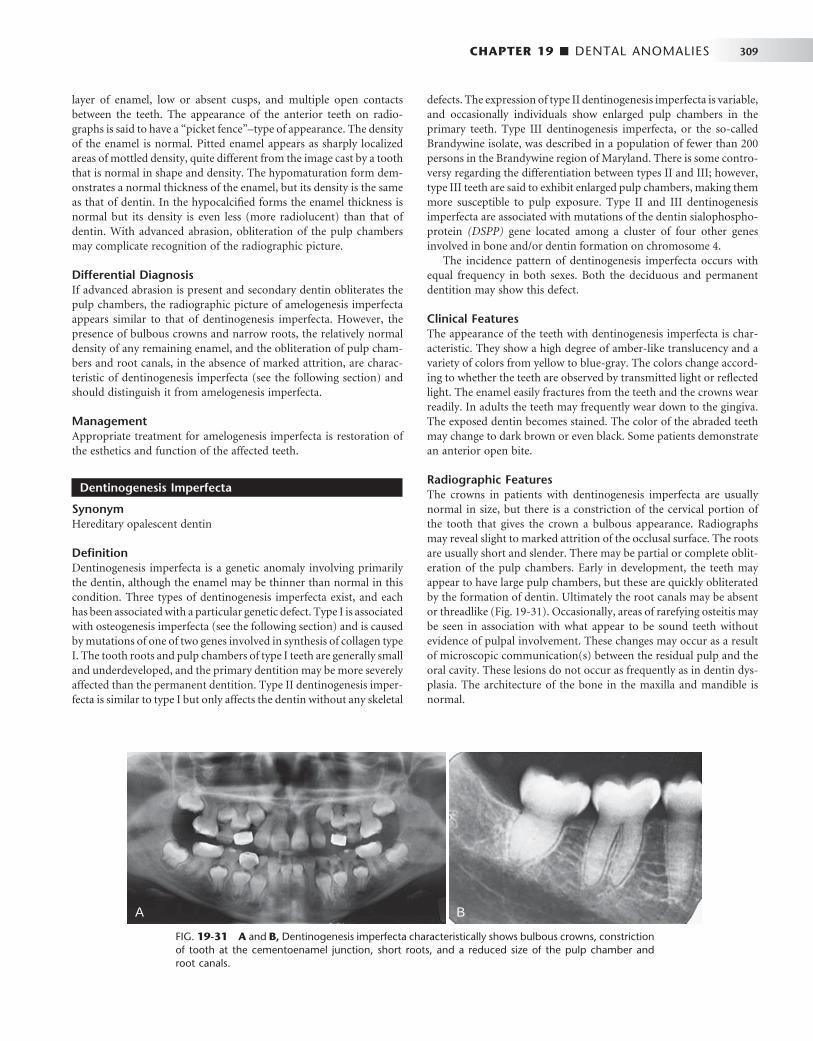
CHAPTER 19 ■ DENTAL ANOMALIES 309
layer of enamel, low or absent cusps, and multiple open contacts between the teeth. The appearance of the anterior teeth on radio-graphs is said to have a “ picket fence ” – type of appearance. The density of the enamel is normal. Pitted enamel appears as sharply localized areas of mottled density, quite different from the image cast by a tooth that is normal in shape and density. The hypomaturation form dem-onstrates a normal thickness of the enamel, but its density is the same as that of dentin. In the hypocalcifi ed forms the enamel thickness is normal but its density is even less (more radiolucent) than that of dentin. With advanced abrasion, obliteration of the pulp chambers may complicate recognition of the radiographic picture.
Differential Diagnosis If advanced abrasion is present and secondary dentin obliterates the pulp chambers, the radiographic picture of amelogenesis imperfecta appears similar to that of dentinogenesis imperfecta. However, the presence of bulbous crowns and narrow roots, the relatively normal density of any remaining enamel, and the obliteration of pulp cham-bers and root canals, in the absence of marked attrition, are charac-teristic of dentinogenesis imperfecta (see the following section) and should distinguish it from amelogenesis imperfecta.
Management Appropriate treatment for amelogenesis imperfecta is restoration of the esthetics and function of the affected teeth.
Dentinogenesis Imperfecta
Synonym Hereditary opalescent dentin
Defi nition Dentinogenesis imperfecta is a genetic anomaly involving primarily the dentin, although the enamel may be thinner than normal in this condition. Three types of dentinogenesis imperfecta exist, and each has been associated with a particular genetic defect. Type I is associated with osteogenesis imperfecta (see the following section) and is caused by mutations of one of two genes involved in synthesis of collagen type I. The tooth roots and pulp chambers of type I teeth are generally small and underdeveloped, and the primary dentition may be more severely affected than the permanent dentition. Type II dentinogenesis imper-fecta is similar to type I but only affects the dentin without any skeletal
defects. The expression of type II dentinogenesis imperfecta is variable, and occasionally individuals show enlarged pulp chambers in the primary teeth. Type III dentinogenesis imperfecta, or the so-called Brandywine isolate, was described in a population of fewer than 200 persons in the Brandywine region of Maryland. There is some contro-versy regarding the differentiation between types II and III; however, type III teeth are said to exhibit enlarged pulp chambers, making them more susceptible to pulp exposure. Type II and III dentinogenesis imperfecta are associated with mutations of the dentin sialophospho-protein (DSPP) gene located among a cluster of four other genes involved in bone and/or dentin formation on chromosome 4.
The incidence pattern of dentinogenesis imperfecta occurs with equal frequency in both sexes. Both the deciduous and permanent dentition may show this defect.
Clinical Features The appearance of the teeth with dentinogenesis imperfecta is char-acteristic. They show a high degree of amber-like translucency and a variety of colors from yellow to blue-gray. The colors change accord-ing to whether the teeth are observed by transmitted light or refl ected light. The enamel easily fractures from the teeth and the crowns wear readily. In adults the teeth may frequently wear down to the gingiva. The exposed dentin becomes stained. The color of the abraded teeth may change to dark brown or even black. Some patients demonstrate an anterior open bite.
Radiographic Features The crowns in patients with dentinogenesis imperfecta are usually normal in size, but there is a constriction of the cervical portion of the tooth that gives the crown a bulbous appearance. Radiographs may reveal slight to marked attrition of the occlusal surface. The roots are usually short and slender. There may be partial or complete oblit-eration of the pulp chambers. Early in development, the teeth may appear to have large pulp chambers, but these are quickly obliterated by the formation of dentin. Ultimately the root canals may be absent or threadlike ( Fig. 19-31 ). Occasionally, areas of rarefying osteitis may be seen in association with what appear to be sound teeth without evidence of pulpal involvement. These changes may occur as a result of microscopic communication(s) between the residual pulp and the oral cavity. These lesions do not occur as frequently as in dentin dys-plasia. The architecture of the bone in the maxilla and mandible is normal.
FIG. 19-31 A and B, Dentinogenesis imperfecta characteristically shows bulbous crowns, constriction of tooth at the cementoenamel junction, short roots, and a reduced size of the pulp chamber and root canals.
A B

310 PART V ■ RADIOGRAPHIC INTERPRETATION
Differential Diagnosis Dentin dysplasia (see the following section)
Management The placement of prosthetic crowns on the affected teeth is usually unsuccessful unless the teeth have good root support. The teeth should not be extracted from patients 5 to 15 years of age. It is generally preferable to place full overdentures on the teeth to prevent alveolar resorption. In adults, extraction of the teeth and their replacement can be recommended.
Osteogenesis Imperfecta
Osteogenesis imperfecta is a hereditary disorder characterized by osseous fractures. The pathogenesis is thought to be an inborn error in the synthesis of type I collagen, which results in brittle bones. It is usually transmitted as an autosomal dominant trait. Patients may have blue sclera, wormian bones (bones in skull sutures), skeletal deformi-ties, and progressive osteopenia. Dentinogenesis imperfecta is found in approximately 25% of cases. In addition, oral fi ndings may include class III malocclusions and an increased incidence of impacted fi rst and second molars.
Dentin Dysplasia
Defi nition Dentin dysplasia is a genetically inherited autosomal-dominant abnormality that resembles dentinogenesis imperfecta. Two types have been described: type I (radicular) and type II (coronal). In the type I form, the most marked changes are found in the appearances of the roots. In the type II form, changes in the crown are most clearly
seen in the altered shape of the pulp chambers. The genetic lesion giving rise to type I dentin dysplasia has not been identifi ed; however, the same gene that has been implicated in dentinogenesis imperfecta type II and III has also been implicated in type II dentin dysplasia, the DSPP gene. Dentin dysplasia is rarer than dentinogenesis imper-fecta (1 : 100,000 compared with 1 : 8,000).
Clinical Features Clinically, teeth with dentin dysplasia have characteristic features. Type I (the radicular form) teeth have mostly normal color and shape in both dentitions. Occasionally a slight bluish-brown translucency is apparent. The teeth are often misaligned in the arch, and patients may describe drifting and spontaneous exfoliation with little or no trauma. In type II (the coronal form), the crowns of the primary teeth appear to be of the same color, size, and contour as those in dentino-genesis imperfecta. This is interesting evidence in light of the pur-ported close genetic linkage between the two dentin abnormalities. Although not universally accepted, reports exist that primary teeth rapidly abrade. The permanent teeth have clinically normal-appearing crowns.
Radiographic Features In type I dentin dysplasia, the roots of both the primary and perma-nent teeth are either short or abnormally shaped ( Fig. 19-32 ). The molar roots have been described as having a shallow “ W ” shape. The roots of primary teeth may be only thin spicules. The pulp chambers and root canals completely fi ll in before eruption. The extent of oblit-eration of the pulp chambers and canals is variable. In addition, about 20% of type I dentin dysplasia teeth are associated with rarefying osteitis. This is likely the result of microscopic communication(s) between the residual pulp and the oral cavity. Association of these infl ammatory lesions with noncarious teeth is an important feature for recognition of this particular entity. In type II dentin dysplasia, obliteration of the pulp chamber ( Fig. 19-33 ) and reduction in the caliber of the root canals occurs after eruption (at least by 5 or 6 years). These changes are not seen before eruption. As the chambers of the molars are being fi lled with hypertrophic dentin, the pulp chambers may become fl ame or thistle shaped and may have multiple pulp stones. Occasionally the anterior teeth and premolars develop a pulp chamber that is thistle-tube in shape because of its extension into the root. The roots of the coronal variety are normal in shape and proportions.
Differential Diagnosis The differential diagnosis for dentin dysplasia may include only one other entity, dentinogenesis imperfecta, because the appearances of both abnormalities can appear clinically similar. Both entities can produce crowns with altered color and occluded pulp chambers. The fi nding of a thistle-tube – shaped pulp chamber in a single-rooted tooth strengthens the probability of dentin dysplasia. In type II dentin dysplasia, however, the pulp chambers become obliterated after erup-tion. Sometimes, crown size can help distinguish between the two: the teeth in dentinogenesis imperfecta typically have bulbous shaped crowns with a constriction in the cervical region, whereas the crowns in dentin dysplasia are usually of normal shape, size, and proportion. If the roots are short and narrow, the condition is likely to be dentino-genesis imperfecta. On the other hand, normal-appearing roots or practically no roots at all should suggest dentin dysplasia. Periapical rarefying osteitis in association with noncarious teeth are more com-monly seen in dentin dysplasia.
FIG. 19-32 Panoramic (A) and periapical images (B) of the same case show the short and poorly developed roots, obliterated pulp chambers and root canals, and periapical rarefying osteitis associated with type 1 (radicular) dentin dysplasia. Note the half-moon or “ demi-lune ” shape of the pulp chambers.
A
B

CHAPTER 19 ■ DENTAL ANOMALIES 311
damaged permanent teeth that become pulpally involved may require removal and replacement.
Enamel Pearl
Synonyms Enamel drop, enamel nodule, and enameloma
Defi nition The enamel pearl is a small globule of enamel 1 to 3 mm in diameter that occurs on the roots of molars ( Fig. 19-35 ). It is found in about 3% of the population, probably formed by Hertwig ’ s epithelial root sheath before the epithelium loses its enamel-forming potential. Usually only one pearl develops, but occasionally more develop. Enamel pearls may have a core of dentin and rarely a pulp horn extending from the chamber of the host tooth.
Clinical Features Most enamel pearls form below the crest of the gingiva and are not detected during a clinical examination. They typically develop in the furcal areas of molar teeth, often lying at or just apical to the cemen-toenamel junction. Those that form on the maxillary molars are
FIG. 19-33 Panoramic (A) and periapical (B) radiographs of the same case show obliteration of the pulp chamber, reduction in the caliber of root canals, and pulp stones obscuring the fl ame- or thistle-shaped pulp chambers associated with type II (coronal) dentin dyspla-sia. Note the areas of rarefying osteitis associated with some of the mandibular anterior teeth.
A
B
Management Teeth with type I dentin dysplasia have such poor root support that prosthetic replacement is about the only practical treatment. On the other hand, teeth that are of normal shape, size, and support (type II) can be crowned if they seem to be rapidly abrading. At the same time the esthetics of discolored anterior teeth can be improved by pros-thetic treatment.
Regional Odontodysplasia
Synonyms Odontogenesis imperfecta and ghost teeth
Defi nition Regional odontodysplasia is a relatively rare condition in which both enamel and dentin are hypoplastic and hypocalcifi ed. This localized arrest in tooth development typically affects only a few adjacent teeth in a quadrant. These teeth may be either primary or permanent. If the primary teeth are affected, their successors are usually involved. Although many theories exist regarding the etiology of this condition, its cause is unknown.
Clinical Features Teeth affected with regional odontodysplasia are small and mottled brown as a result of staining of the hypocalcifi ed and hypoplastic enamel. They are especially susceptible to caries, are brittle, and are subject to fracture and pulpal infection. Central incisors are most often affected, with lateral incisors and canines also occasionally showing the defect (most often in the maxilla). Eruption of the defec-tive teeth is often delayed and in severe cases they may not erupt.
Radiographic Features Because these teeth are very poorly mineralized, the radiographic images of teeth with regional odontodysplasia are have been described as having a “ ghostlike ” appearance. The pulp chambers are large and the root canals wide because the hypoplastic dentin is thin, just serving to outline the image of the root ( Fig. 19-34 ). As well, the poorly out-lined roots are short. The enamel is, likewise, thin and less dense than usual, sometimes so thin and poorly mineralized that it may not be evident on the radiograph. The tooth is little more than a thin shell of hypoplastic enamel and dentin. Teeth that do not erupt are so hypomineralized and hypoplastic that they appear to be resorbing.
Differential Diagnosis The malformed teeth occasionally seen in one of the expressions of dentinogenesis imperfecta may occasionally be confused with those in regional odontodysplasia. The fact that the dentinogenesis imper-fecta trait usually carries a history of familial involvement, however, in contrast to odontodysplasia (which is not hereditary), is an impor-tant distinguishing feature. Also the enamel in regional odontodys-plasia is obviously hypoplastic, which is not the case in dentinogenesis imperfecta. Finally, only a few teeth of either dentition in an isolated segment of the arch are affected in regional odontodysplasia, whereas the type of dentinogenesis imperfecta that resembles regional odon-todysplasia involves all primary teeth.
Management With the advent of newer restorative materials, it is recommended to retain and restore the affected teeth as much as possible. Unerupted teeth should be retained during the period of skeletal growth. Severely
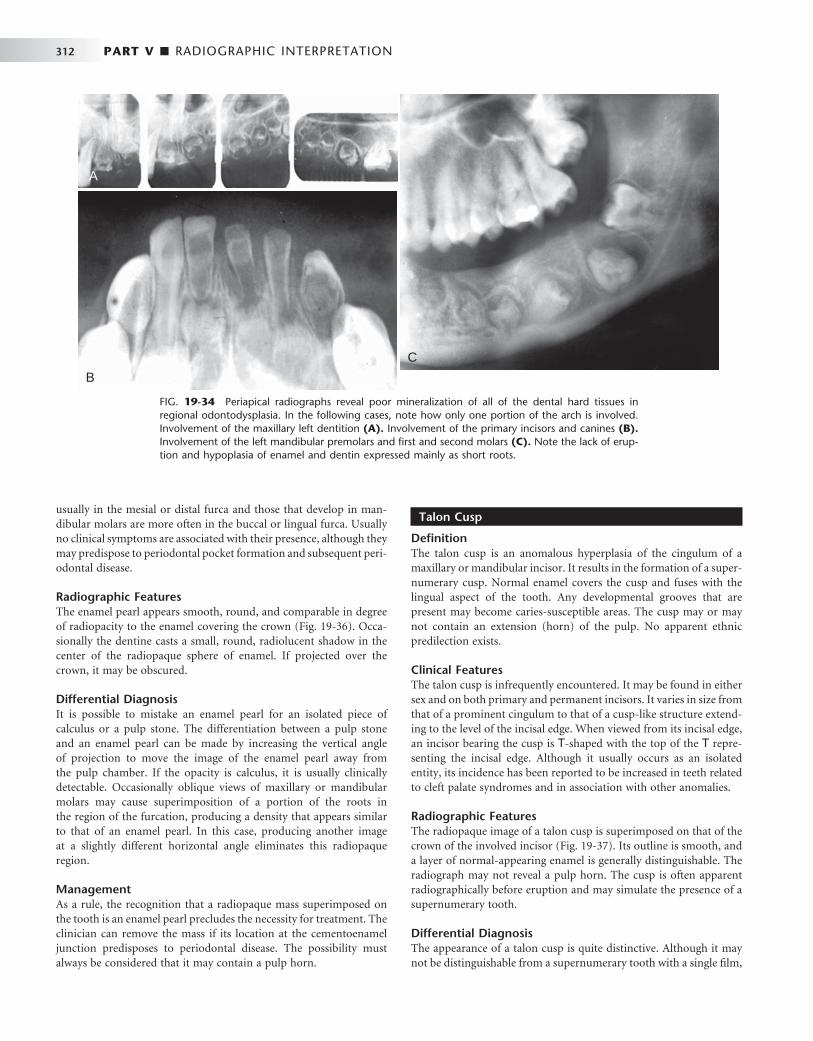
312 PART V ■ RADIOGRAPHIC INTERPRETATION
FIG. 19-34 Periapical radiographs reveal poor mineralization of all of the dental hard tissues in regional odontodysplasia. In the following cases, note how only one portion of the arch is involved. Involvement of the maxillary left dentition (A). Involvement of the primary incisors and canines (B). Involvement of the left mandibular premolars and fi rst and second molars (C). Note the lack of erup-tion and hypoplasia of enamel and dentin expressed mainly as short roots.
A
B
C
usually in the mesial or distal furca and those that develop in man-dibular molars are more often in the buccal or lingual furca. Usually no clinical symptoms are associated with their presence, although they may predispose to periodontal pocket formation and subsequent peri-odontal disease.
Radiographic Features The enamel pearl appears smooth, round, and comparable in degree of radiopacity to the enamel covering the crown ( Fig. 19-36 ). Occa-sionally the dentine casts a small, round, radiolucent shadow in the center of the radiopaque sphere of enamel. If projected over the crown, it may be obscured.
Differential Diagnosis It is possible to mistake an enamel pearl for an isolated piece of calculus or a pulp stone. The differentiation between a pulp stone and an enamel pearl can be made by increasing the vertical angle of projection to move the image of the enamel pearl away from the pulp chamber. If the opacity is calculus, it is usually clinically detectable. Occasionally oblique views of maxillary or mandibular molars may cause superimposition of a portion of the roots in the region of the furcation, producing a density that appears similar to that of an enamel pearl. In this case, producing another image at a slightly different horizontal angle eliminates this radiopaque region.
Management As a rule, the recognition that a radiopaque mass superimposed on the tooth is an enamel pearl precludes the necessity for treatment. The clinician can remove the mass if its location at the cementoenamel junction predisposes to periodontal disease. The possibility must always be considered that it may contain a pulp horn.
Talon Cusp
Defi nition The talon cusp is an anomalous hyperplasia of the cingulum of a maxillary or mandibular incisor. It results in the formation of a super-numerary cusp. Normal enamel covers the cusp and fuses with the lingual aspect of the tooth. Any developmental grooves that are present may become caries-susceptible areas. The cusp may or may not contain an extension (horn) of the pulp. No apparent ethnic predilection exists.
Clinical Features The talon cusp is infrequently encountered. It may be found in either sex and on both primary and permanent incisors. It varies in size from that of a prominent cingulum to that of a cusp-like structure extend-ing to the level of the incisal edge. When viewed from its incisal edge, an incisor bearing the cusp is T -shaped with the top of the T repre-senting the incisal edge. Although it usually occurs as an isolated entity, its incidence has been reported to be increased in teeth related to cleft palate syndromes and in association with other anomalies.
Radiographic Features The radiopaque image of a talon cusp is superimposed on that of the crown of the involved incisor ( Fig. 19-37 ). Its outline is smooth, and a layer of normal-appearing enamel is generally distinguishable. The radiograph may not reveal a pulp horn. The cusp is often apparent radiographically before eruption and may simulate the presence of a supernumerary tooth.
Differential Diagnosis The appearance of a talon cusp is quite distinctive. Although it may not be distinguishable from a supernumerary tooth with a single fi lm,
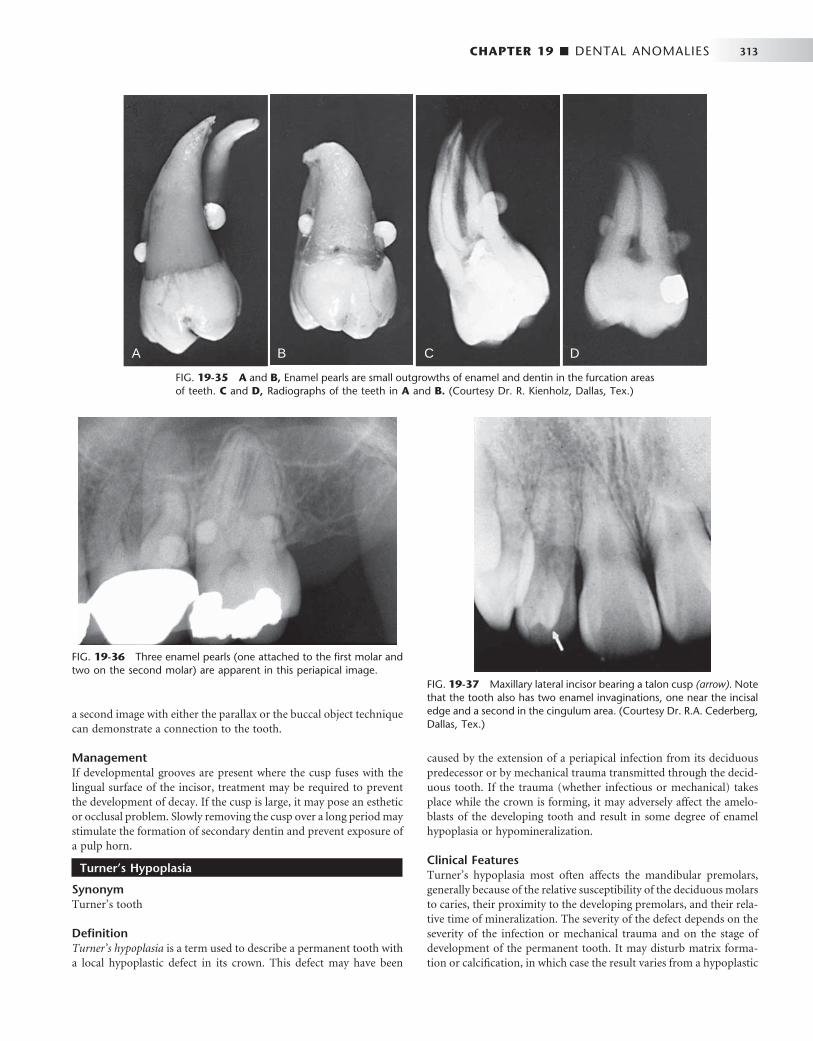
CHAPTER 19 ■ DENTAL ANOMALIES 313
FIG. 19-35 A and B, Enamel pearls are small outgrowths of enamel and dentin in the furcation areas of teeth. C and D, Radiographs of the teeth in A and B. (Courtesy Dr. R. Kienholz, Dallas, Tex.)
A B C D
FIG. 19-36 Three enamel pearls (one attached to the fi rst molar and two on the second molar) are apparent in this periapical image.
FIG. 19-37 Maxillary lateral incisor bearing a talon cusp (arrow). Note that the tooth also has two enamel invaginations, one near the incisal edge and a second in the cingulum area. (Courtesy Dr. R.A. Cederberg, Dallas, Tex.)
a second image with either the parallax or the buccal object technique can demonstrate a connection to the tooth.
Management If developmental grooves are present where the cusp fuses with the lingual surface of the incisor, treatment may be required to prevent the development of decay. If the cusp is large, it may pose an esthetic or occlusal problem. Slowly removing the cusp over a long period may stimulate the formation of secondary dentin and prevent exposure of a pulp horn.
Turner ’ s Hypoplasia
Synonym Turner ’ s tooth
Defi nition Turner ’ s hypoplasia is a term used to describe a permanent tooth with a local hypoplastic defect in its crown. This defect may have been
caused by the extension of a periapical infection from its deciduous predecessor or by mechanical trauma transmitted through the decid-uous tooth. If the trauma (whether infectious or mechanical) takes place while the crown is forming, it may adversely affect the amelo-blasts of the developing tooth and result in some degree of enamel hypoplasia or hypomineralization.
Clinical Features Turner ’ s hypoplasia most often affects the mandibular premolars, generally because of the relative susceptibility of the deciduous molars to caries, their proximity to the developing premolars, and their rela-tive time of mineralization. The severity of the defect depends on the severity of the infection or mechanical trauma and on the stage of development of the permanent tooth. It may disturb matrix forma-tion or calcifi cation, in which case the result varies from a hypoplastic
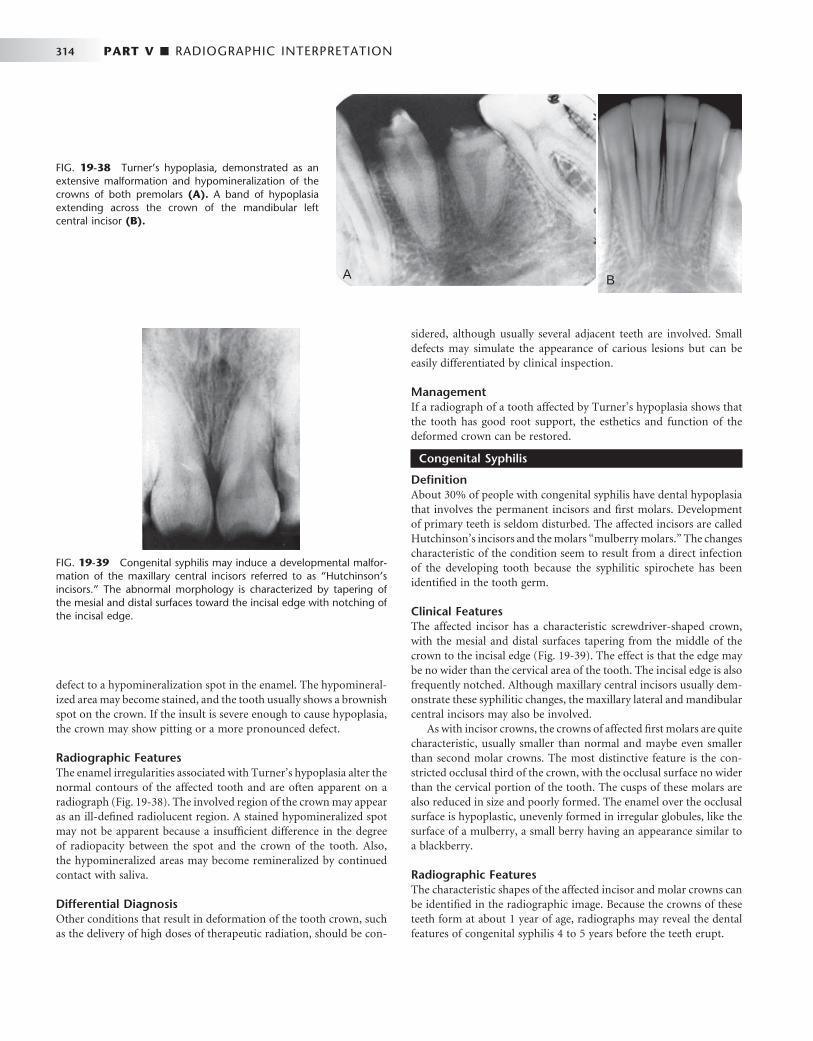
314 PART V ■ RADIOGRAPHIC INTERPRETATION
defect to a hypomineralization spot in the enamel. The hypomineral-ized area may become stained, and the tooth usually shows a brownish spot on the crown. If the insult is severe enough to cause hypoplasia, the crown may show pitting or a more pronounced defect.
Radiographic Features The enamel irregularities associated with Turner ’ s hypoplasia alter the normal contours of the affected tooth and are often apparent on a radiograph ( Fig. 19-38 ). The involved region of the crown may appear as an ill-defi ned radiolucent region. A stained hypomineralized spot may not be apparent because a insuffi cient difference in the degree of radiopacity between the spot and the crown of the tooth. Also, the hypomineralized areas may become remineralized by continued contact with saliva.
Differential Diagnosis Other conditions that result in deformation of the tooth crown, such as the delivery of high doses of therapeutic radiation, should be con-
sidered, although usually several adjacent teeth are involved. Small defects may simulate the appearance of carious lesions but can be easily differentiated by clinical inspection.
Management If a radiograph of a tooth affected by Turner ’ s hypoplasia shows that the tooth has good root support, the esthetics and function of the deformed crown can be restored.
Congenital Syphilis
Defi nition About 30% of people with congenital syphilis have dental hypoplasia that involves the permanent incisors and fi rst molars. Development of primary teeth is seldom disturbed. The affected incisors are called Hutchinson ’ s incisors and the molars “ mulberry molars. ” The changes characteristic of the condition seem to result from a direct infection of the developing tooth because the syphilitic spirochete has been identifi ed in the tooth germ.
Clinical Features The affected incisor has a characteristic screwdriver-shaped crown, with the mesial and distal surfaces tapering from the middle of the crown to the incisal edge ( Fig. 19-39 ). The effect is that the edge may be no wider than the cervical area of the tooth. The incisal edge is also frequently notched. Although maxillary central incisors usually dem-onstrate these syphilitic changes, the maxillary lateral and mandibular central incisors may also be involved.
As with incisor crowns, the crowns of affected fi rst molars are quite characteristic, usually smaller than normal and maybe even smaller than second molar crowns. The most distinctive feature is the con-stricted occlusal third of the crown, with the occlusal surface no wider than the cervical portion of the tooth. The cusps of these molars are also reduced in size and poorly formed. The enamel over the occlusal surface is hypoplastic, unevenly formed in irregular globules, like the surface of a mulberry, a small berry having an appearance similar to a blackberry.
Radiographic Features The characteristic shapes of the affected incisor and molar crowns can be identifi ed in the radiographic image. Because the crowns of these teeth form at about 1 year of age, radiographs may reveal the dental features of congenital syphilis 4 to 5 years before the teeth erupt.
FIG. 19-38 Turner ’ s hypoplasia, demonstrated as an extensive malformation and hypomineralization of the crowns of both premolars (A). A band of hypoplasia extending across the crown of the mandibular left central incisor (B).
A B
FIG. 19-39 Congenital syphilis may induce a developmental malfor-mation of the maxillary central incisors referred to as “ Hutchinson ’ s incisors. ” The abnormal morphology is characterized by tapering of the mesial and distal surfaces toward the incisal edge with notching of the incisal edge.
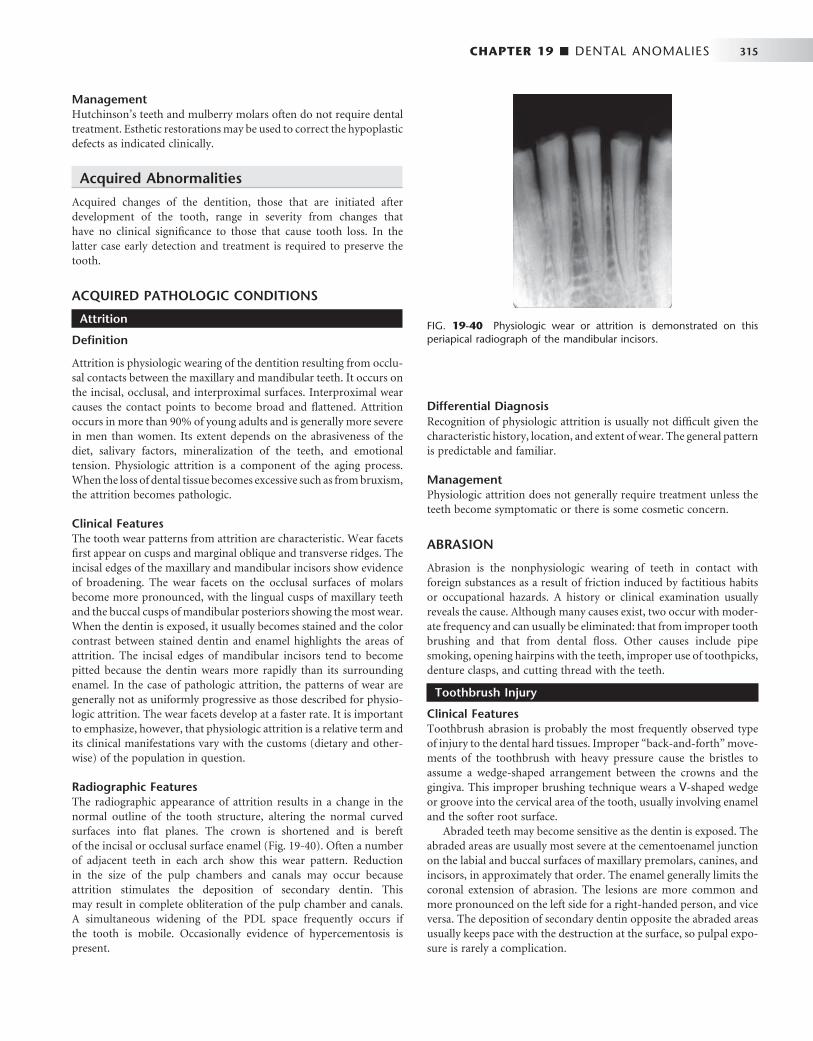
CHAPTER 19 ■ DENTAL ANOMALIES 315
Management Hutchinson ’ s teeth and mulberry molars often do not require dental treatment. Esthetic restorations may be used to correct the hypoplastic defects as indicated clinically.
Acquired Abnormalities
Acquired changes of the dentition, those that are initiated after development of the tooth, range in severity from changes that have no clinical signifi cance to those that cause tooth loss. In the latter case early detection and treatment is required to preserve the tooth.
ACQUIRED PATHOLOGIC CONDITIONS
Attrition
Defi nition
Attrition is physiologic wearing of the dentition resulting from occlu-sal contacts between the maxillary and mandibular teeth. It occurs on the incisal, occlusal, and interproximal surfaces. Interproximal wear causes the contact points to become broad and fl attened. Attrition occurs in more than 90% of young adults and is generally more severe in men than women. Its extent depends on the abrasiveness of the diet, salivary factors, mineralization of the teeth, and emotional tension. Physiologic attrition is a component of the aging process. When the loss of dental tissue becomes excessive such as from bruxism, the attrition becomes pathologic.
Clinical Features The tooth wear patterns from attrition are characteristic. Wear facets fi rst appear on cusps and marginal oblique and transverse ridges. The incisal edges of the maxillary and mandibular incisors show evidence of broadening. The wear facets on the occlusal surfaces of molars become more pronounced, with the lingual cusps of maxillary teeth and the buccal cusps of mandibular posteriors showing the most wear. When the dentin is exposed, it usually becomes stained and the color contrast between stained dentin and enamel highlights the areas of attrition. The incisal edges of mandibular incisors tend to become pitted because the dentin wears more rapidly than its surrounding enamel. In the case of pathologic attrition, the patterns of wear are generally not as uniformly progressive as those described for physio-logic attrition. The wear facets develop at a faster rate. It is important to emphasize, however, that physiologic attrition is a relative term and its clinical manifestations vary with the customs (dietary and other-wise) of the population in question.
Radiographic Features The radiographic appearance of attrition results in a change in the normal outline of the tooth structure, altering the normal curved surfaces into fl at planes. The crown is shortened and is bereft of the incisal or occlusal surface enamel ( Fig. 19-40 ). Often a number of adjacent teeth in each arch show this wear pattern. Reduction in the size of the pulp chambers and canals may occur because attrition stimulates the deposition of secondary dentin. This may result in complete obliteration of the pulp chamber and canals. A simultaneous widening of the PDL space frequently occurs if the tooth is mobile. Occasionally evidence of hypercementosis is present.
Differential Diagnosis Recognition of physiologic attrition is usually not diffi cult given the characteristic history, location, and extent of wear. The general pattern is predictable and familiar.
Management Physiologic attrition does not generally require treatment unless the teeth become symptomatic or there is some cosmetic concern.
ABRASION
Abrasion is the nonphysiologic wearing of teeth in contact with foreign substances as a result of friction induced by factitious habits or occupational hazards. A history or clinical examination usually reveals the cause. Although many causes exist, two occur with moder-ate frequency and can usually be eliminated: that from improper tooth brushing and that from dental fl oss. Other causes include pipe smoking, opening hairpins with the teeth, improper use of toothpicks, denture clasps, and cutting thread with the teeth.
Toothbrush Injury
Clinical Features Toothbrush abrasion is probably the most frequently observed type of injury to the dental hard tissues. Improper “ back-and-forth ” move-ments of the toothbrush with heavy pressure cause the bristles to assume a wedge-shaped arrangement between the crowns and the gingiva. This improper brushing technique wears a V -shaped wedge or groove into the cervical area of the tooth, usually involving enamel and the softer root surface.
Abraded teeth may become sensitive as the dentin is exposed. The abraded areas are usually most severe at the cementoenamel junction on the labial and buccal surfaces of maxillary premolars, canines, and incisors, in approximately that order. The enamel generally limits the coronal extension of abrasion. The lesions are more common and more pronounced on the left side for a right-handed person, and vice versa. The deposition of secondary dentin opposite the abraded areas usually keeps pace with the destruction at the surface, so pulpal expo-sure is rarely a complication.
FIG. 19-40 Physiologic wear or attrition is demonstrated on this periapical radiograph of the mandibular incisors.
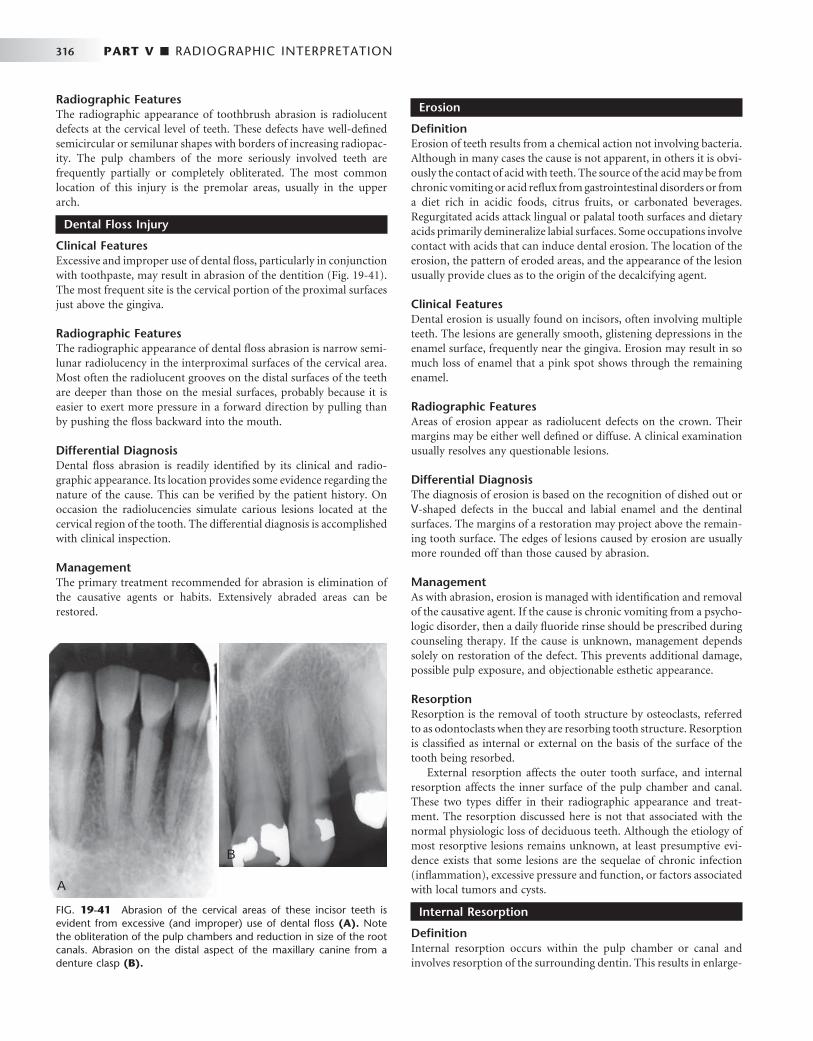
316 PART V ■ RADIOGRAPHIC INTERPRETATION
Radiographic Features The radiographic appearance of toothbrush abrasion is radiolucent defects at the cervical level of teeth. These defects have well-defi ned semicircular or semilunar shapes with borders of increasing radiopac-ity. The pulp chambers of the more seriously involved teeth are frequently partially or completely obliterated. The most common location of this injury is the premolar areas, usually in the upper arch.
Dental Floss Injury
Clinical Features Excessive and improper use of dental fl oss, particularly in conjunction with toothpaste, may result in abrasion of the dentition ( Fig. 19-41 ). The most frequent site is the cervical portion of the proximal surfaces just above the gingiva.
Radiographic Features The radiographic appearance of dental fl oss abrasion is narrow semi-lunar radiolucency in the interproximal surfaces of the cervical area. Most often the radiolucent grooves on the distal surfaces of the teeth are deeper than those on the mesial surfaces, probably because it is easier to exert more pressure in a forward direction by pulling than by pushing the fl oss backward into the mouth.
Differential Diagnosis Dental fl oss abrasion is readily identifi ed by its clinical and radio-graphic appearance. Its location provides some evidence regarding the nature of the cause. This can be verifi ed by the patient history. On occasion the radiolucencies simulate carious lesions located at the cervical region of the tooth. The differential diagnosis is accomplished with clinical inspection.
Management The primary treatment recommended for abrasion is elimination of the causative agents or habits. Extensively abraded areas can be restored.
Erosion
Defi nition Erosion of teeth results from a chemical action not involving bacteria. Although in many cases the cause is not apparent, in others it is obvi-ously the contact of acid with teeth. The source of the acid may be from chronic vomiting or acid refl ux from gastrointestinal disorders or from a diet rich in acidic foods, citrus fruits, or carbonated beverages. Regurgitated acids attack lingual or palatal tooth surfaces and dietary acids primarily demineralize labial surfaces. Some occupations involve contact with acids that can induce dental erosion. The location of the erosion, the pattern of eroded areas, and the appearance of the lesion usually provide clues as to the origin of the decalcifying agent.
Clinical Features Dental erosion is usually found on incisors, often involving multiple teeth. The lesions are generally smooth, glistening depressions in the enamel surface, frequently near the gingiva. Erosion may result in so much loss of enamel that a pink spot shows through the remaining enamel.
Radiographic Features Areas of erosion appear as radiolucent defects on the crown. Their margins may be either well defi ned or diffuse. A clinical examination usually resolves any questionable lesions.
Differential Diagnosis The diagnosis of erosion is based on the recognition of dished out or V -shaped defects in the buccal and labial enamel and the dentinal surfaces. The margins of a restoration may project above the remain-ing tooth surface. The edges of lesions caused by erosion are usually more rounded off than those caused by abrasion.
Management As with abrasion, erosion is managed with identifi cation and removal of the causative agent. If the cause is chronic vomiting from a psycho-logic disorder, then a daily fl uoride rinse should be prescribed during counseling therapy. If the cause is unknown, management depends solely on restoration of the defect. This prevents additional damage, possible pulp exposure, and objectionable esthetic appearance.
Resorption Resorption is the removal of tooth structure by osteoclasts, referred to as odontoclasts when they are resorbing tooth structure. Resorption is classifi ed as internal or external on the basis of the surface of the tooth being resorbed.
External resorption affects the outer tooth surface, and internal resorption affects the inner surface of the pulp chamber and canal. These two types differ in their radiographic appearance and treat-ment. The resorption discussed here is not that associated with the normal physiologic loss of deciduous teeth. Although the etiology of most resorptive lesions remains unknown, at least presumptive evi-dence exists that some lesions are the sequelae of chronic infection (infl ammation), excessive pressure and function, or factors associated with local tumors and cysts.
Internal Resorption
Defi nition Internal resorption occurs within the pulp chamber or canal and involves resorption of the surrounding dentin. This results in enlarge-
FIG. 19-41 Abrasion of the cervical areas of these incisor teeth is evident from excessive (and improper) use of dental fl oss (A). Note the obliteration of the pulp chambers and reduction in size of the root canals. Abrasion on the distal aspect of the maxillary canine from a denture clasp (B).
A
B

CHAPTER 19 ■ DENTAL ANOMALIES 317
ment of the size of the pulp space at the expense of tooth structure. This condition may be transient and self-limiting or progressive. The etiology of the recruitment and activation of odontoclasts is unknown but may be related to infl ammation of the pulpal tissues. Internal resorption has been reported to be initiated by acute trauma to the tooth, direct and indirect pulp capping, pulpotomy, and enamel invagination.
Clinical Features Internal resorption may affect any tooth in either the primary or secondary dentitions. It occurs most frequently in permanent teeth, usually in central incisors and fi rst and second molars. The resorptive process most commonly begins during the fourth and fi fth decades and is more common in males. When the lesion is in the pulp chamber of the crown, a radiolucent area may appear to envelope the crown. If the enlarging pulp perforates the dentin and the enamel becomes
involved, the area may appear clinically as a pink spot. If the condition is not intercepted, it may perforate the crown, with hemorrhagic tissue projecting from the perforation, and lead to infectious pulpitis. When the lesion occurs in the root of a tooth, it is, for the most part, clini-cally silent. If the resorption is extensive, it may weaken the tooth and result in fracture. It is also possible that the pulp may expand into the periodontal ligament and communicate with a deep periodontal pocket or the gingival sulcus, also leading to pulpal infection.
Radiographic Features Radiographs can reveal symptomless early lesions of internal resorp-tion. The lesions are localized, radiolucent, and round, oval, or elon-gated within the root or crown and continuous with the image of the pulp chamber or root canal. The outline is usually sharply defi ned and smooth or slightly scalloped. The result is an irregular widening of the pulp chamber or canal ( Fig. 19-42 ). It is characteristically homo-
FIG. 19-42 Internal root resorption may occur in either the crown or the root of teeth. Periapical radiographs show internal resorption centered in the root canal system ( A and B ) and in both the crown and the roots ( C and D ), in a sectioned incisor (after crown reduction).
A
C
D
B
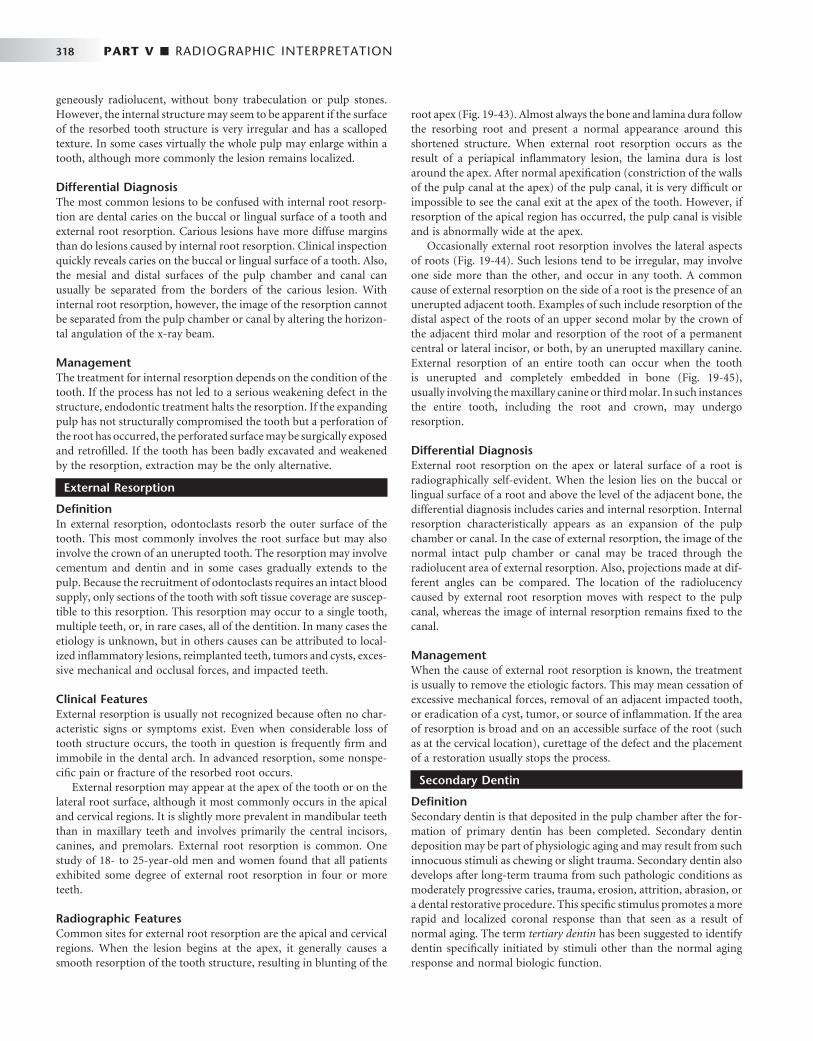
318 PART V ■ RADIOGRAPHIC INTERPRETATION
geneously radiolucent, without bony trabeculation or pulp stones. However, the internal structure may seem to be apparent if the surface of the resorbed tooth structure is very irregular and has a scalloped texture. In some cases virtually the whole pulp may enlarge within a tooth, although more commonly the lesion remains localized.
Differential Diagnosis The most common lesions to be confused with internal root resorp-tion are dental caries on the buccal or lingual surface of a tooth and external root resorption. Carious lesions have more diffuse margins than do lesions caused by internal root resorption. Clinical inspection quickly reveals caries on the buccal or lingual surface of a tooth. Also, the mesial and distal surfaces of the pulp chamber and canal can usually be separated from the borders of the carious lesion. With internal root resorption, however, the image of the resorption cannot be separated from the pulp chamber or canal by altering the horizon-tal angulation of the x-ray beam.
Management The treatment for internal resorption depends on the condition of the tooth. If the process has not led to a serious weakening defect in the structure, endodontic treatment halts the resorption. If the expanding pulp has not structurally compromised the tooth but a perforation of the root has occurred, the perforated surface may be surgically exposed and retrofi lled. If the tooth has been badly excavated and weakened by the resorption, extraction may be the only alternative.
External Resorption
Defi nition In external resorption, odontoclasts resorb the outer surface of the tooth. This most commonly involves the root surface but may also involve the crown of an unerupted tooth. The resorption may involve cementum and dentin and in some cases gradually extends to the pulp. Because the recruitment of odontoclasts requires an intact blood supply, only sections of the tooth with soft tissue coverage are suscep-tible to this resorption. This resorption may occur to a single tooth, multiple teeth, or, in rare cases, all of the dentition. In many cases the etiology is unknown, but in others causes can be attributed to local-ized infl ammatory lesions, reimplanted teeth, tumors and cysts, exces-sive mechanical and occlusal forces, and impacted teeth.
Clinical Features External resorption is usually not recognized because often no char-acteristic signs or symptoms exist. Even when considerable loss of tooth structure occurs, the tooth in question is frequently fi rm and immobile in the dental arch. In advanced resorption, some nonspe-cifi c pain or fracture of the resorbed root occurs.
External resorption may appear at the apex of the tooth or on the lateral root surface, although it most commonly occurs in the apical and cervical regions. It is slightly more prevalent in mandibular teeth than in maxillary teeth and involves primarily the central incisors, canines, and premolars. External root resorption is common. One study of 18- to 25-year-old men and women found that all patients exhibited some degree of external root resorption in four or more teeth.
Radiographic Features Common sites for external root resorption are the apical and cervical regions. When the lesion begins at the apex, it generally causes a smooth resorption of the tooth structure, resulting in blunting of the
root apex ( Fig. 19-43 ). Almost always the bone and lamina dura follow the resorbing root and present a normal appearance around this shortened structure. When external root resorption occurs as the result of a periapical infl ammatory lesion, the lamina dura is lost around the apex. After normal apexifi cation (constriction of the walls of the pulp canal at the apex) of the pulp canal, it is very diffi cult or impossible to see the canal exit at the apex of the tooth. However, if resorption of the apical region has occurred, the pulp canal is visible and is abnormally wide at the apex.
Occasionally external root resorption involves the lateral aspects of roots ( Fig. 19-44 ). Such lesions tend to be irregular, may involve one side more than the other, and occur in any tooth. A common cause of external resorption on the side of a root is the presence of an unerupted adjacent tooth. Examples of such include resorption of the distal aspect of the roots of an upper second molar by the crown of the adjacent third molar and resorption of the root of a permanent central or lateral incisor, or both, by an unerupted maxillary canine. External resorption of an entire tooth can occur when the tooth is unerupted and completely embedded in bone ( Fig. 19-45 ), usually involving the maxillary canine or third molar. In such instances the entire tooth, including the root and crown, may undergo resorption.
Differential Diagnosis External root resorption on the apex or lateral surface of a root is radiographically self-evident. When the lesion lies on the buccal or lingual surface of a root and above the level of the adjacent bone, the differential diagnosis includes caries and internal resorption. Internal resorption characteristically appears as an expansion of the pulp chamber or canal. In the case of external resorption, the image of the normal intact pulp chamber or canal may be traced through the radiolucent area of external resorption. Also, projections made at dif-ferent angles can be compared. The location of the radiolucency caused by external root resorption moves with respect to the pulp canal, whereas the image of internal resorption remains fi xed to the canal.
Management When the cause of external root resorption is known, the treatment is usually to remove the etiologic factors. This may mean cessation of excessive mechanical forces, removal of an adjacent impacted tooth, or eradication of a cyst, tumor, or source of infl ammation. If the area of resorption is broad and on an accessible surface of the root (such as at the cervical location), curettage of the defect and the placement of a restoration usually stops the process.
Secondary Dentin
Defi nition Secondary dentin is that deposited in the pulp chamber after the for-mation of primary dentin has been completed. Secondary dentin deposition may be part of physiologic aging and may result from such innocuous stimuli as chewing or slight trauma. Secondary dentin also develops after long-term trauma from such pathologic conditions as moderately progressive caries, trauma, erosion, attrition, abrasion, or a dental restorative procedure. This specifi c stimulus promotes a more rapid and localized coronal response than that seen as a result of normal aging. The term tertiary dentin has been suggested to identify dentin specifi cally initiated by stimuli other than the normal aging response and normal biologic function.

CHAPTER 19 ■ DENTAL ANOMALIES 319
FIG. 19-43 External root resorption results in a loss of tooth structure from the apex. Note the blunted root apices, the widened pulp root canals, and the intact lamina dura.
FIG. 19-44 External root resorption of the lateral surface of the root of the mandibular central incisors. These are sharply defi ned radiolu-cencies confi ned to the root surfaces (A). In B, the root has been replaced by an ingrowth of bone. This is sometimes referred to as inostosis.
AB
FIG. 19-45 External resorption of an impacted second premolar. Although both enamel and dentin have been resorbed, the residual enamel of the crown can still be seen as well as a hint of a pulp chamber.
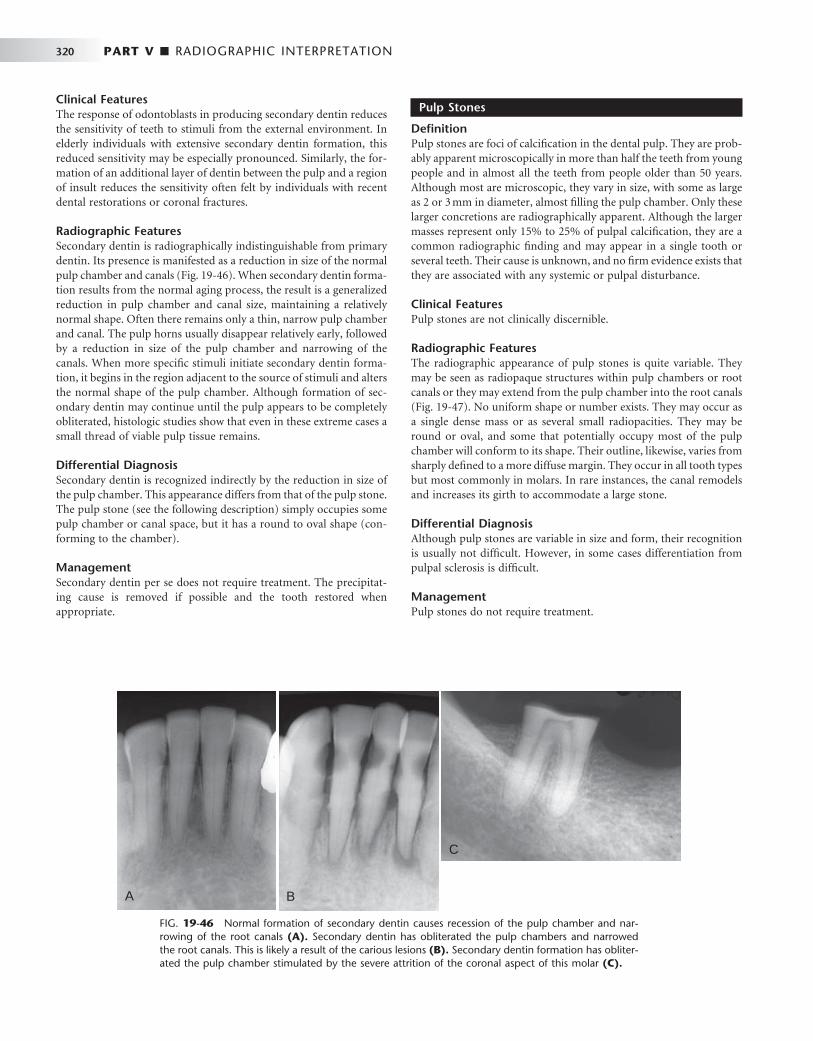
320 PART V ■ RADIOGRAPHIC INTERPRETATION
Clinical Features The response of odontoblasts in producing secondary dentin reduces the sensitivity of teeth to stimuli from the external environment. In elderly individuals with extensive secondary dentin formation, this reduced sensitivity may be especially pronounced. Similarly, the for-mation of an additional layer of dentin between the pulp and a region of insult reduces the sensitivity often felt by individuals with recent dental restorations or coronal fractures.
Radiographic Features Secondary dentin is radiographically indistinguishable from primary dentin. Its presence is manifested as a reduction in size of the normal pulp chamber and canals ( Fig. 19-46 ). When secondary dentin forma-tion results from the normal aging process, the result is a generalized reduction in pulp chamber and canal size, maintaining a relatively normal shape. Often there remains only a thin, narrow pulp chamber and canal. The pulp horns usually disappear relatively early, followed by a reduction in size of the pulp chamber and narrowing of the canals. When more specifi c stimuli initiate secondary dentin forma-tion, it begins in the region adjacent to the source of stimuli and alters the normal shape of the pulp chamber. Although formation of sec-ondary dentin may continue until the pulp appears to be completely obliterated, histologic studies show that even in these extreme cases a small thread of viable pulp tissue remains.
Differential Diagnosis Secondary dentin is recognized indirectly by the reduction in size of the pulp chamber. This appearance differs from that of the pulp stone. The pulp stone (see the following description) simply occupies some pulp chamber or canal space, but it has a round to oval shape (con-forming to the chamber).
Management Secondary dentin per se does not require treatment. The precipitat-ing cause is removed if possible and the tooth restored when appropriate.
Pulp Stones
Defi nition Pulp stones are foci of calcifi cation in the dental pulp. They are prob-ably apparent microscopically in more than half the teeth from young people and in almost all the teeth from people older than 50 years. Although most are microscopic, they vary in size, with some as large as 2 or 3 mm in diameter, almost fi lling the pulp chamber. Only these larger concretions are radiographically apparent. Although the larger masses represent only 15% to 25% of pulpal calcifi cation, they are a common radiographic fi nding and may appear in a single tooth or several teeth. Their cause is unknown, and no fi rm evidence exists that they are associated with any systemic or pulpal disturbance.
Clinical Features Pulp stones are not clinically discernible.
Radiographic Features The radiographic appearance of pulp stones is quite variable. They may be seen as radiopaque structures within pulp chambers or root canals or they may extend from the pulp chamber into the root canals ( Fig. 19-47 ). No uniform shape or number exists. They may occur as a single dense mass or as several small radiopacities. They may be round or oval, and some that potentially occupy most of the pulp chamber will conform to its shape. Their outline, likewise, varies from sharply defi ned to a more diffuse margin. They occur in all tooth types but most commonly in molars. In rare instances, the canal remodels and increases its girth to accommodate a large stone.
Differential Diagnosis Although pulp stones are variable in size and form, their recognition is usually not diffi cult. However, in some cases differentiation from pulpal sclerosis is diffi cult.
Management Pulp stones do not require treatment.
FIG. 19-46 Normal formation of secondary dentin causes recession of the pulp chamber and nar-rowing of the root canals (A). Secondary dentin has obliterated the pulp chambers and narrowed the root canals. This is likely a result of the carious lesions (B). Secondary dentin formation has obliter-ated the pulp chamber stimulated by the severe attrition of the coronal aspect of this molar (C).
A B
C
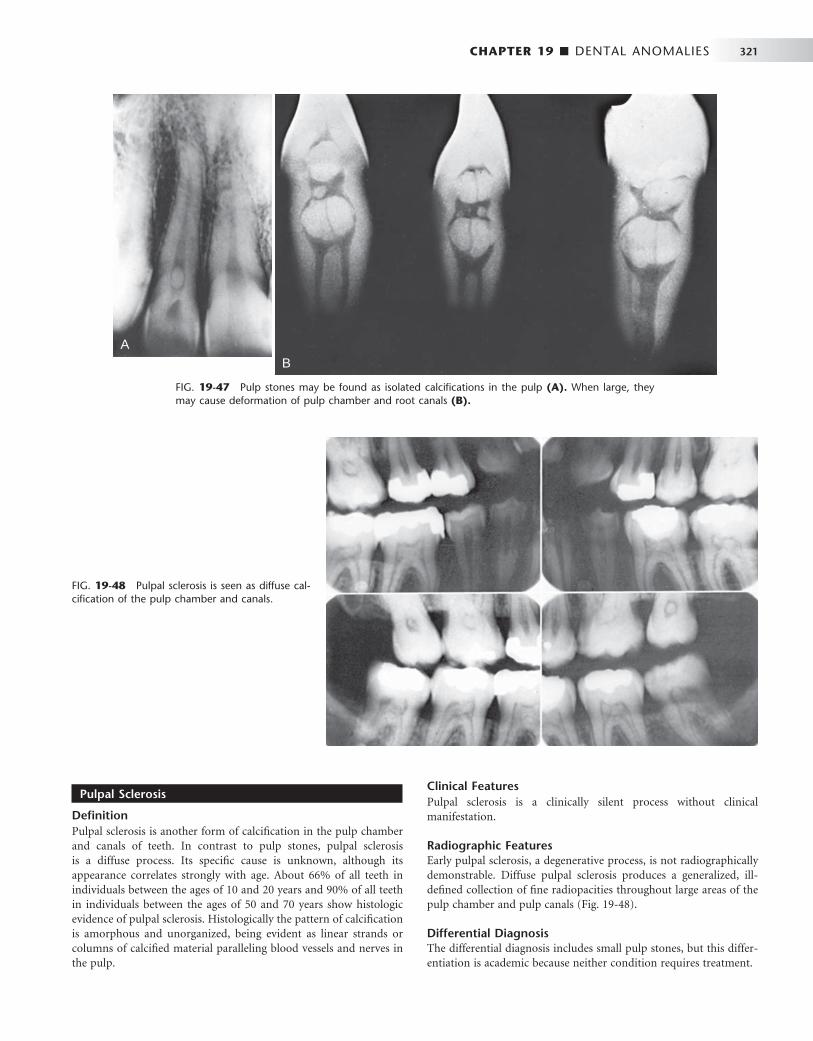
CHAPTER 19 ■ DENTAL ANOMALIES 321
Pulpal Sclerosis
Defi nition Pulpal sclerosis is another form of calcifi cation in the pulp chamber and canals of teeth. In contrast to pulp stones, pulpal sclerosis is a diffuse process. Its specifi c cause is unknown, although its appearance correlates strongly with age. About 66% of all teeth in individuals between the ages of 10 and 20 years and 90% of all teeth in individuals between the ages of 50 and 70 years show histologic evidence of pulpal sclerosis. Histologically the pattern of calcifi cation is amorphous and unorganized, being evident as linear strands or columns of calcifi ed material paralleling blood vessels and nerves in the pulp.
Clinical Features Pulpal sclerosis is a clinically silent process without clinical manifestation.
Radiographic Features Early pulpal sclerosis, a degenerative process, is not radiographically demonstrable. Diffuse pulpal sclerosis produces a generalized, ill-defi ned collection of fi ne radiopacities throughout large areas of the pulp chamber and pulp canals ( Fig. 19-48 ).
Differential Diagnosis The differential diagnosis includes small pulp stones, but this differ-entiation is academic because neither condition requires treatment.
FIG. 19-47 Pulp stones may be found as isolated calcifi cations in the pulp (A). When large, they may cause deformation of pulp chamber and root canals (B).
AB
FIG. 19-48 Pulpal sclerosis is seen as diffuse cal-cifi cation of the pulp chamber and canals.

322 PART V ■ RADIOGRAPHIC INTERPRETATION
Management Pulpal sclerosis does not require treatment. As with pulp stones, its only importance may be that it can cause diffi culty in the performance of endodontic therapy when such a procedure is indicated for other reasons.
Hypercementosis
Defi nition Hypercementosis is excessive deposition of cementum on the tooth roots. In most cases its cause is unknown. Occasionally it appears on a supraerupted tooth after the loss of an opposing tooth. Another cause of hypercementosis is infl ammation, usually resulting from rar-efying or sclerosing osteitis. In the context of infl ammation, cemen-tum is deposited on the root surface adjacent to the apex. Occasionally hypercementosis has been associated with teeth that are in hyperoc-clusion or that have been fractured. Finally, hypercementosis occurs in patients with Paget ’ s disease of bone (see Chapter 24 ) and with hyperpituitarism (gigantism and acromegaly).
Clinical Features Hypercementosis does not cause any clinical signs or symptoms.
Radiographic Features Hypercementosis is evident radiographically as an excessive buildup of cementum around all or part of a root ( Fig. 19-49 ). The outline is
FIG. 19-49 Hypercementosis of the roots. In all cases, note the continuity of the lamina dura and the PDL space that encompasses the extra cementum (A-C). An extracted molar, showing extensive hypercementosis (D). (Courtesy Dr. R. Kienholz, Dallas, Tex.)
A B
DC
usually smooth but on occasion may be seen as an irregular but somewhat bulbous enlargement of the root. It is most evident at the apical end and is usually seen as a mildly irregular accumulation of cementum. This cementum is slightly more radiolucent than dentin. Of importance is the fact that the lamina dura and PDL space encom-pass the extra dentin. In the case of Paget ’ s disease the hypercemen-tosis is usually very exuberant and irregular in outline.
Differential Diagnosis The differential diagnosis may include any radiopaque structure that is seen within the vicinity of the root such as a dense bone island or mature cemento-osseous dysplasia. The differentiating characteristic is the presence of the periodontal membrane space around the hyper-cementosis. There may be a resemblance to a small cementoblastoma. Occasionally a severely dilacerated root may have the appearance of hypercementosis.
Management Hypercementosis itself requires no treatment. If a related condition such as a periapical infl ammatory lesion exists, treatment may be necessary. Perhaps the primary signifi cance of hypercementosis relates to the diffi culty that the root confi guration can pose if extraction is indicated.
CHAPTER 19 ■ DENTAL ANOMALIES 323
SUGGESTED READINGS
DEVELOPMENTAL ABNORMALITIES
1 Bergsma D , editor: Birth defects compendium , ed 2 , New York , 1979 , Alan R Liss .
2 Dixon GH , Stewart RE : Genetic aspects of anomalous tooth development . In Stewart RE , Prescott GH , editors: Oral facial genetics , St Louis , 1976 , Mosby .
3 MacDougall M , Dong J , Acevedo AC : Molecular basis of human dentin diseases , Am J Med Genet A 140A : 2536 - 2546 , 2006 .
4 Pindborg JJ : Pathology of the dental hard tissues , Copenhagen , 1970 , Munksgaard .
5 Schulze C : Developmental abnormalities of the teeth and jaws . In Gorlin RJ , Goldman HM , editors: Thoma ’ s oral pathology , ed 6 , vol 1 , St Louis , 1970 , Mosby .
6 Witkop CJ Jr , Rao S : Inherited defects in tooth structure . In Bergsma D , editor: Birth defects, XI: orofacial structures , vol 7, no 7 , Baltimore , 1971 , Williams & Wilkins .
7 Witkop CJ Jr : Amelogenesis imperfecta, dentinogenesis imperfecta and dentin dysplasia revisited: problems with classifi cation , J Oral Pathol 17 : 547 - 553 , 1989 .
8 Worth HM : Principles and practice of oral radiologic interpretation , Chicago , 1963 , Year Book Medical .
9 Wright JT : The molecular etiologies and associated phenotypes of amelogenesis imperfecta , Am J Med Genet A 140A : 2547 - 2555 , 2006 .
SUPERNUMERARY TEETH
10 Grahnen H , Lindahl B : Supernumerary teeth in the permanent dentition: a frequency study , Odontol Rev 12 : 290 - 294 , 1961 .
11 Grimanis GA , Kyriakides AT , Spyropoulos ND : A survey on supernumerary molars , Quintessence Int 22 : 989 - 995 , 1991 .
12 Niswander JD : Effects of heredity and environment on development of the dentition , J Dent Res 42 : 1288 - 1296 , 1963 .
13 Rao SR : Supernumerary teeth . In Bergsma D , editor: Birth defects compendium , ed 2 , New York , 1979 , Alan R Liss .
14 Yusof WZ : Non-syndrome multiple supernumerary teeth: literature review , J Can Dent Assoc 56 : 147 - 149 , 1990 .
DEVELOPMENTALLY MISSING TEETH
15 al-Emran S : Prevalence of hypodontia and developmental malformation of permanent teeth in Saudi Arabian school children , Br J Orthod 17 : 115 - 118 , 1990 .
16 Garn SM , Lewis AB : The relationship between third molar agenesis and reduction in tooth number , Angle Orthod 32 : 14 - 18 , 1962 .
17 Keene HJ : The relationship between third molar agenesis and the morphologic variability of the molar teeth , Angle Orthod 35 : 289 - 298 , 1965 .
18 Levin LS : Dental and oral abnormalities in selected ectodermal dysplasia syndromes , Birth Defects Orig Artic Ser 24 : 205 - 227 , 1988 .
19 O ’ Dowling IB , McNamara TG : Congenital absence of permanent teeth among Irish school-children , J Ir Dent Assoc 36 : 136 - 138 , 1990 .
MACRODONTIA
20 Garn SM , Lewis AB , Kerewsky BS : The magnitude and implications of the relationship between tooth size and body size , Arch Oral Biol 13 : 129 - 131 , 1968 .
TRANSPOSITION
21 Schacter H : A treated case of transposed upper canine , Dent Rec (London) 71 : 105 - 108 , 1951 .
FUSION
22 Hagman FT : Anomalies of form and number, fused primary teeth, a correlation of the dentitions , ASDC J Dent Child 55 : 359 - 361 , 1988 .
23 Sperber GH : Genetic mechanisms and anomalies in odontogenesis , J Can Dent Assoc (Tor) 33 : 433 - 442 , 1967 .
GEMINATION
24 Tannenbaum KA , Alling EE : Anomalous tooth development: case report of gemination and twinning , Oral Surg Oral Med Oral Pathol 16 : 883 - 887 , 1963 .
TAURODONTISM
25 Bixler D : Heritable disorders affecting dentin . In Steward RE , Prescott GA , editors: Oral facial genetics , St Louis , 1976 , Mosby .
DENS IN DENTE
26 Oehlers FA : The radicular variety of dens invaginatus , Oral Surg Oral Med Oral Pathol 11 : 1251 - 1260 , 1958 .
27 Rushton MA : A collection of dilated composite odontomes , Br Dent J 63 : 65 - 86 , 1937 .
28 Soames JV , Kuyebi TA : A radicular dens invaginatus , Br Dent J 152 : 308 - 309 , 1982 .
DENS INVAGINATUS
29 Oehlers FA , Lee KW , Lee EC : Dens invaginatus (invaginated odontome): its structure and responses to external stimuli , Dent Pract Dent Rec 17 : 239 - 244 , 1967 .
30 Sykaras SN : Occlusal anomalous tubercle on premolars of a Greek girl , Oral Surg Oral Med Oral Pathol 38 : 88 - 91 , 1974 .
31 Yip WK : The prevalence of dens invaginatus , Oral Surg Oral Med Oral Pathol 38 : 80 - 87 , 1974 .
AMELOGENESIS IMPERFECTA
32 Crawford PJ , Aldred MJ : X-linked amelogenesis imperfecta: presentation of two kindreds and a review of the literature , Oral Surg Oral Med Oral Pathol 73 : 449 - 455 , 1992 .
33 Toller PA : A clinical report of six cases of amelogenesis imperfecta , Oral Surg Oral Med Oral Pathol 12 : 325 - 333 , 1959 .
34 Witkop CJ Jr : Amelogenesis imperfecta, dentinogenesis imperfecta and dentin dysplasia revisited: problems in classifi cation , J Oral Pathol 17 : 547 - 553 , 1988 .
35 Witkop CJ Jr , Saulk JJ : Heritable defects of enamel . In Stewart RE , Prescott GA , editors: Oral facial genetics , St Louis , 1976 , Mosby .
DENTINOGENESIS IMPERFECTA
36 Schwartz S , Tsipouras P : Oral fi ndings in osteogenesis imperfecta , Oral Surg Oral Med Oral Pathol 57 : 161 - 167 , 1984 .
37 Winter GB : Hereditary and idiopathic anomalies of tooth number, structure, and form , Dent Clin North Am 13 : 355 - 373 , 1969 .
38 Witkop CJ : Hereditary defects in enamel and dentin , Acta Genet Stat Med 7 : 236 - 239 , 1957 .
DENTIN DYSPLASIA
39 O ’ Carroll MK , Duncan WK , Perkins TM : Dentin dysplasia: review of the literature and a proposed subclassifi cation based on radiographic fi ndings , Oral Surg Oral Med Oral Pathol 72 : 119 - 125 , 1991 .
40 Richardson AS , Fantin TD : Occlusal anomalous dysplasia of dentin: report of a case , J Can Dent Assoc (Tor) 36 : 189 - 191 , 1970 .
41 Shields ED , Bixler D , el-Kafrawy AM : A proposed classifi cation for heritable human dentin defects with a description of a new entity , Arch Oral Biol 18 : 543 , 1973 .
42 Witkop CJ Jr : Hereditary defects of dentin , Dent Clin North Am 19 : 25 - 45 , 1975 .
REGIONAL ODONTODYSPLASIA
43 Crawford PJ , Aldred MJ : Regional odontodysplasia: a bibliography , J Oral Pathol Med 18 : 251 - 263 , 1989 .
324 PART V ■ RADIOGRAPHIC INTERPRETATION
ENAMEL PEARL
44 Moskow BS , Canut PM : Studies on root enamel, II: enamel pearls: a review of their morphology, localization, nomenclature, occurrence, classifi cation, histogenesis, and incidence , J Clin Periodontol 17 : 275 - 281 , 1990 .
TALON CUSP
45 Meskin LH , Gorlin RJ : Agenesis and peg-shaped permanent lateral incisors , J Dent Res 42 : 1476 - 1479 , 1963 .
46 Natkin E , Pitts DL , Worthington P : A case of talon cusp associated with other odontogenic abnormalities , J Endod 9 : 491 - 495 , 1983 .
TURNER ’ S HYPOPLASIA
47 Via WF Jr : Enamel defects induced by trauma during tooth formation , Oral Surg Oral Med Oral Pathol 25 : 49 - 54 , 1968 .
CONGENITAL SYPHILIS
48 Bradlaw RV : The dental stigmata of prenatal syphilis , Oral Surg Oral Med Oral Pathol 6 : 147 - 158 , 1953 .
49 Putkonen T : Dental changes in congenital syphilis: relationship to other syphilitic stigmata , Acta Derm Venereol 42 : 44 - 62 , 1962 .
50 Sarnat BG , Shaw NG : Dental development in congenital syphilis , Am J Orthod 29 : 270 , 1943 .
ACQUIRED ABNORMALITIES
51 Baden E : Environmental pathology of the teeth . In Gorlin RJ , Goodman HM , editors: Thoma ’ s oral pathology , ed 6 , vol 1 , St Louis , 1970 , Mosby .
52 Mitchell DF , Standish SM , Fast TB : Oral diagnosis / oral medicine , Philadelphia , 1978 , Lea & Febiger .
53 Pindborg JJ : Pathology of the dental hard tissues , Philadelphia , 1970 , WB Saunders .
54 Shafer WG , Hine MK , Levy BM : Oral pathology , ed 4 , Philadelphia , 1983 , WB Saunders .
ATTRITION
55 Johnson GK , Sivers JE : Attrition, abrasion, and erosion: diagnosis and therapy , Clin Prev Dent 9 : 12 - 16 , 1987 .
56 Murphy TR : Reduction of the dental arch by approximal attrition: quantitative assessment , Br Dent J 116 : 483 - 488 , 1964 .
57 Russell MD : The distinction between physiological and pathological attrition: a review , J Ir Dent Assoc 33 : 23 - 31 , 1987 .
58 Seligman DA , Pullinger AG , Solberg WK : The prevalence of dental attrition and its association with factors of age, gender, occlusion, and TMJ symptomatology , J Dent Res 67 : 1323 - 1333 , 1988 .
ABRASION
59 Bull WH , Callender RM , Pugh BR et al : The abrasion and cleaning properties of dentifrices , Br Dent J 125 : 331 , 1968 .
60 Erwin JC , Buchner CM : Prevalence of tooth root exposure and abrasion among dental patients , Dent Items Interest 66 : 760 , 1944 .
EROSION
61 ten Bruggen Cate HJ : Dental erosion in industry , Br J Industr Med 25 : 249 , 1968 .
62 Stafne EC , Lovestedt SA : Dissolution of tooth substance by lemon juice, acid beverages, and acid from some other sources , J Am Dent Assoc 34 : 586 - 592 , 1947 .
RESORPTION
63 Bakland LK : Root resorption , Dent Clin North Am 36 : 491 - 507 , 1992 . 64 Bennett CG , Poleway SA : Internal resorption, postpulpotomy type , Oral Surg
17 : 228 - 234 , 1964 . 65 Goldman HM : Spontaneous intermittent resorption of teeth , J Am Dent
Assoc 49 : 522 - 532 , 1954 . 66 Massler M , Perreault JG : Root resorption in the permanent teeth of young
adults , J Dent Child 21 : 158 - 164 , 1954 . 67 Phillips JR : Apical root resorption under orthodontic therapy , Angle Orthod
20 : 1 - 22 , 1955 . 68 Simpson HE : Internal resorption , J Can Dent Assoc 30 : 355 , 1964 . 69 Solomon CS , Notaro PJ , Kellert M : External root resorption: fact or fancy ,
J Endod 15 : 219 - 223 , 1989 . 70 Stafne EC , Austin LT : Resorption of embedded teeth , J Am Dent Assoc
32 : 1003 - 1009 , 1945 . 71 Tronstad L : Root resorption: etiology, terminology, and clinical
manifestations , Endod Dent Traumatol 4 : 241 - 252 , 1988 .
SECONDARY DENTIN
72 Kuttler Y : Classifi cation of dentine into primary, secondary and tertiary , Oral Surg Oral Med Oral Pathol 12 : 966 - 969 , 1959 .
PULP STONES
73 Moss-Salentijn L , Hendricks-Klyvert M : Calcifi ed structures in human dental pulps , J Endod 14 : 184 - 189 , 1988 .
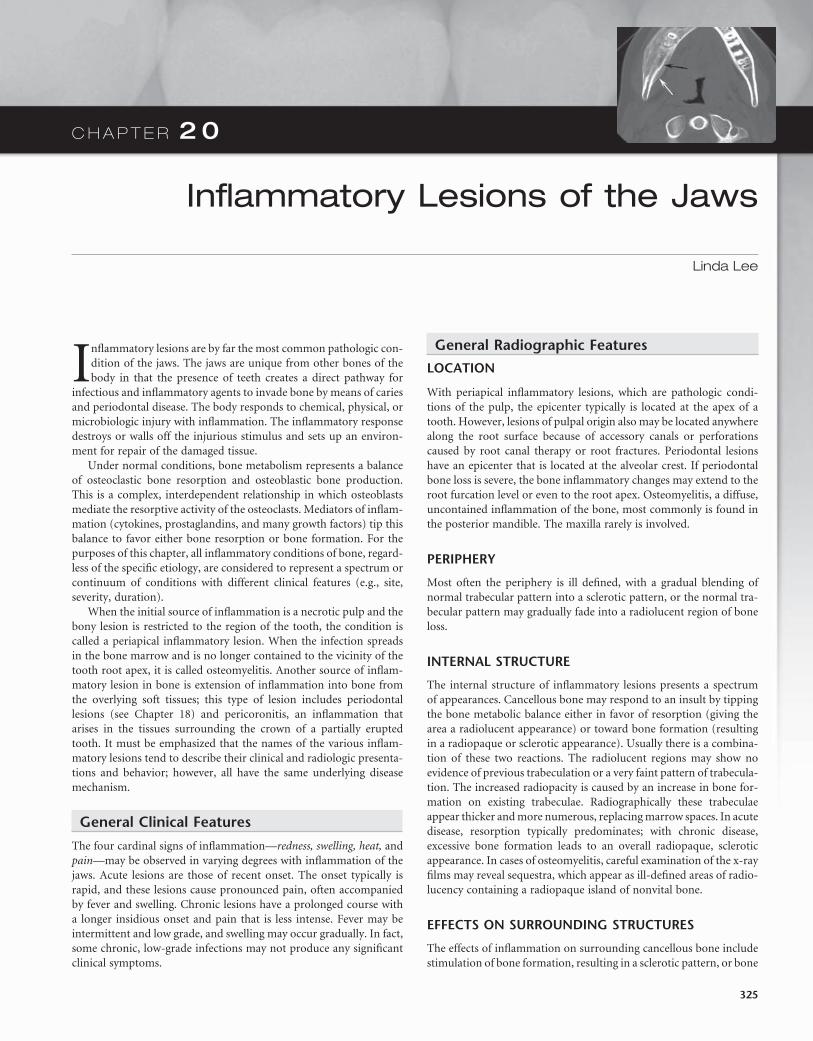
C H A P T E R 2 0
Infl ammatory Lesions of the Jaws
Linda Lee
Infl ammatory lesions are by far the most common pathologic con-dition of the jaws. The jaws are unique from other bones of the body in that the presence of teeth creates a direct pathway for
infectious and infl ammatory agents to invade bone by means of caries and periodontal disease. The body responds to chemical, physical, or microbiologic injury with infl ammation. The infl ammatory response destroys or walls off the injurious stimulus and sets up an environ-ment for repair of the damaged tissue.
Under normal conditions, bone metabolism represents a balance of osteoclastic bone resorption and osteoblastic bone production. This is a complex, interdependent relationship in which osteoblasts mediate the resorptive activity of the osteoclasts. Mediators of infl am-mation (cytokines, prostaglandins, and many growth factors) tip this balance to favor either bone resorption or bone formation. For the purposes of this chapter, all infl ammatory conditions of bone, regard-less of the specifi c etiology, are considered to represent a spectrum or continuum of conditions with different clinical features (e.g., site, severity, duration).
When the initial source of infl ammation is a necrotic pulp and the bony lesion is restricted to the region of the tooth, the condition is called a periapical infl ammatory lesion. When the infection spreads in the bone marrow and is no longer contained to the vicinity of the tooth root apex, it is called osteomyelitis. Another source of infl am-matory lesion in bone is extension of infl ammation into bone from the overlying soft tissues; this type of lesion includes periodontal lesions (see Chapter 18 ) and pericoronitis, an infl ammation that arises in the tissues surrounding the crown of a partially erupted tooth. It must be emphasized that the names of the various infl am-matory lesions tend to describe their clinical and radiologic presenta-tions and behavior; however, all have the same underlying disease mechanism.
General Clinical Features
The four cardinal signs of infl ammation — redness, swelling, heat, and pain — may be observed in varying degrees with infl ammation of the jaws. Acute lesions are those of recent onset. The onset typically is rapid, and these lesions cause pronounced pain, often accompanied by fever and swelling. Chronic lesions have a prolonged course with a longer insidious onset and pain that is less intense. Fever may be intermittent and low grade, and swelling may occur gradually. In fact, some chronic, low-grade infections may not produce any signifi cant clinical symptoms.
General Radiographic Features
LOCATION
With periapical infl ammatory lesions, which are pathologic condi-tions of the pulp, the epicenter typically is located at the apex of a tooth. However, lesions of pulpal origin also may be located anywhere along the root surface because of accessory canals or perforations caused by root canal therapy or root fractures. Periodontal lesions have an epicenter that is located at the alveolar crest. If periodontal bone loss is severe, the bone infl ammatory changes may extend to the root furcation level or even to the root apex. Osteomyelitis, a diffuse, uncontained infl ammation of the bone, most commonly is found in the posterior mandible. The maxilla rarely is involved.
PERIPHERY
Most often the periphery is ill defi ned, with a gradual blending of normal trabecular pattern into a sclerotic pattern, or the normal tra-becular pattern may gradually fade into a radiolucent region of bone loss.
INTERNAL STRUCTURE
The internal structure of infl ammatory lesions presents a spectrum of appearances. Cancellous bone may respond to an insult by tipping the bone metabolic balance either in favor of resorption (giving the area a radiolucent appearance) or toward bone formation (resulting in a radiopaque or sclerotic appearance). Usually there is a combina-tion of these two reactions. The radiolucent regions may show no evidence of previous trabeculation or a very faint pattern of trabecula-tion. The increased radiopacity is caused by an increase in bone for-mation on existing trabeculae. Radiographically these trabeculae appear thicker and more numerous, replacing marrow spaces. In acute disease, resorption typically predominates; with chronic disease, excessive bone formation leads to an overall radiopaque, sclerotic appearance. In cases of osteomyelitis, careful examination of the x-ray fi lms may reveal sequestra, which appear as ill-defi ned areas of radio-lucency containing a radiopaque island of nonvital bone.
EFFECTS ON SURROUNDING STRUCTURES
The effects of infl ammation on surrounding cancellous bone include stimulation of bone formation, resulting in a sclerotic pattern, or bone
325

326 PART V ■ RADIOGRAPHIC INTERPRETATION
resorption, resulting in radiolucency. The periodontal ligament space involved in the lesion will be widened; this widening is greatest at the source of the infl ammation. For example, with periapical lesions the widening is greatest around the apical region of the root and in peri-odontal disease the widening is greatest at the alveolar crest. With chronic infections, root resorption may occur and cortical boundaries may be resorbed. The periosteal component of bone, whether on the surface of the jaws or lining the fl oor of the maxillary sinus, also responds to infl ammation. The periosteum contains a layer of pluri-potential lining cells that, under the right conditions, differentiate into osteoblasts and lay down new bone. Infl ammatory exudate from infection within the bone can penetrate the cortex, lift up the perios-teum from the surface of the bone, and stimulate the periosteum to produce new bone. Because infl ammatory exudate is a fl uid, the peri-osteum is lifted from the surface of bone in a manner that positions the periosteum almost parallel to the surface of the bone; thus the layer of new bone is almost parallel to the bone surface.
PERIAPICAL INFLAMMATORY LESIONS
Synonyms Periapical infl ammatory lesions have been called acute apical peri-odontitis, chronic apical periodontitis, periapical abscess, and periapi-cal granuloma. Radiolucent presentations have been called rarefying osteitis, whereas radiopaque presentations have been called sclerosing osteitis, condensing osteitis, and focal sclerosing osteitis. Chapter 21 presents a discussion of periapical cysts of infl ammatory origin (radicular cysts).
Defi nition A periapical infl ammatory lesion is defi ned as a local response of the bone around the apex of a tooth that occurs as a result of necrosis of the pulp or through destruction of the periapical tissues by extensive periodontal disease ( Fig. 20-1 ). The pulpal necrosis may occur as a result of pulpal invasion of bacteria through caries or trauma. In Figure 20-1 , the periapical infl ammatory lesion is characterized by apical periodontitis, an infl ammatory process that may histologically represent either a periapical abscess or a periapical granuloma. Toxic metabolites from the necrotic pulp exit the root apex to incite an infl ammatory reaction in the periapical periodontal ligament and surrounding bone (apical periodontitis). This reaction is character-ized histologically by an infl ammatory infi ltrate composed predomi-nantly of lymphocytes mixed with polymorphonuclear neutrophils. Depending on the severity of the response, the neutrophils may collect to form pus, resulting in an apical abscess. This result is categorized as acute infl ammation. Alternatively, in an attempt to heal from apical periodontitis, the body stimulates the formation of granulation tissue mixed with a chronic infl ammatory infi ltrate composed predomi-nantly of lymphocytes, plasma cells, and histiocytes, giving rise to periapical granuloma. Entrapped epithelium (the rests of Malassez)
may proliferate to form a radicular or apical cyst. Acute exacerbations of the chronic lesions may occur intermittently.
If the surrounding bone marrow becomes involved with the infl ammatory reaction through the spread of pyogenic organisms, the localized periapical abscess may transform into osteomyelitis. The exact point at which a periapical infl ammatory lesion becomes osteo-myelitis is not easily determined or defi ned. The size of the area of infl ammation is not as important as the severity of the reaction. However, considering the size of the lesion as one factor, periapical infl ammatory lesions usually involve only the local bone adjacent to the apex of the tooth, and osteomyelitis involves a larger area of bone. Periapical lesions occasionally may be large, but the epicenter of the lesion remains in the vicinity of the tooth apex. If the periapical lesion extends farther, so that the lesion no longer is centered on the tooth apex, osteomyelitis may be considered as a possible diagnosis. The distinction between periapical infl ammation and osteomyelitis can be made if sequestra are detected radiographically. Progression from periapical infl ammation to osteomyelitis is relatively rare, and other factors play a role in its development, such as a decrease in the host defenses and an increase in the virulence of pathogenic microorganisms.
Clinical Features The symptoms of periapical infl ammatory lesions can range across a broad spectrum, from being asymptomatic to an occasional toothache to severe pain with or without facial swelling, fever, and lymphade-nopathy. A periapical abscess usually manifests with severe pain, mobility and sometimes elevation of the involved tooth, swelling, and tenderness to percussion. Palpation of the apical region elicits pain. Spontaneous drainage into the oral cavity through a fi stula (parulis) may relieve the acute pain. In rare cases a dental abscess may manifest with systemic symptoms (e.g., fever, facial swelling, lymphadenopa-thy) along with the pain. The acute lesion may evolve into a chronic one (periapical granuloma or cyst), which may be asymptomatic except for intermittent fl are-ups of “ toothache ” pain, which mark the acute exacerbation of the chronic lesion. Patients often give a history of intermittent pain. The associated tooth may be asymptomatic, or it may be sensitive to percussion and mobile. More often, however, the periapical lesion arises in the chronic form de novo; in this case it may be asymptomatic. It is important to understand that the clinical presentation does not necessarily correlate with the histologic or radiographic fi ndings.
Radiographic Features The radiographic features of periapical infl ammatory lesions vary depending on the time course of the lesion. Because very early lesions may not show any radiographic changes, diagnosis of these lesions relies solely on the clinical symptoms ( Fig. 20-2 ). More chronic lesions may show lytic (radiolucent) or sclerotic (radiopaque) changes, or both.
FIG. 20-1 Interrelationship of possible results of periapical infl ammation.
Caries
Trauma
Necrotic Pulp Apical periodontitis
Acute
Chronic
Periapical Abscess
Periapical Granuloma
Osteomyelitis
Periapical cyst
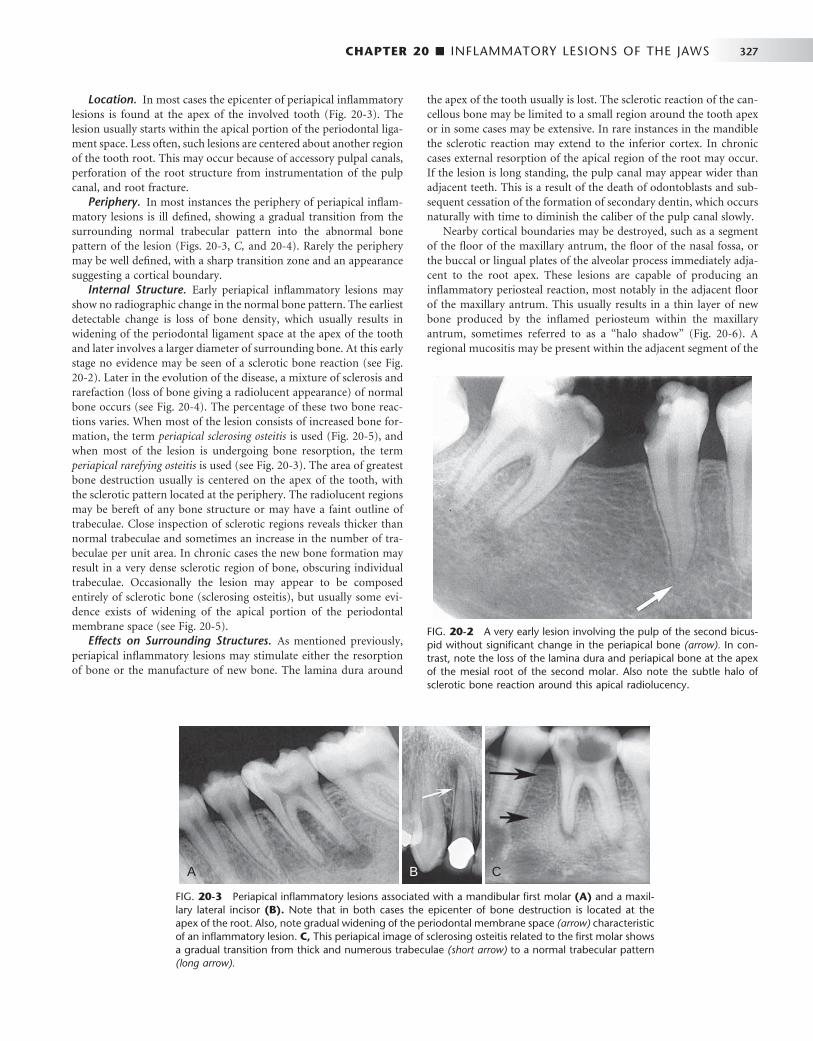
CHAPTER 20 ■ INFLAMMATORY LESIONS OF THE JAWS 327
Location. In most cases the epicenter of periapical infl ammatory lesions is found at the apex of the involved tooth ( Fig. 20-3 ). The lesion usually starts within the apical portion of the periodontal liga-ment space. Less often, such lesions are centered about another region of the tooth root. This may occur because of accessory pulpal canals, perforation of the root structure from instrumentation of the pulp canal, and root fracture.
Periphery. In most instances the periphery of periapical infl am-matory lesions is ill defi ned, showing a gradual transition from the surrounding normal trabecular pattern into the abnormal bone pattern of the lesion ( Figs. 20-3, C, and 20-4 ). Rarely the periphery may be well defi ned, with a sharp transition zone and an appearance suggesting a cortical boundary.
Internal Structure. Early periapical infl ammatory lesions may show no radiographic change in the normal bone pattern. The earliest detectable change is loss of bone density, which usually results in widening of the periodontal ligament space at the apex of the tooth and later involves a larger diameter of surrounding bone. At this early stage no evidence may be seen of a sclerotic bone reaction (see Fig. 20-2 ). Later in the evolution of the disease, a mixture of sclerosis and rarefaction (loss of bone giving a radiolucent appearance) of normal bone occurs (see Fig. 20-4 ). The percentage of these two bone reac-tions varies. When most of the lesion consists of increased bone for-mation, the term periapical sclerosing osteitis is used ( Fig. 20-5 ), and when most of the lesion is undergoing bone resorption, the term periapical rarefying osteitis is used (see Fig. 20-3 ). The area of greatest bone destruction usually is centered on the apex of the tooth, with the sclerotic pattern located at the periphery. The radiolucent regions may be bereft of any bone structure or may have a faint outline of trabeculae. Close inspection of sclerotic regions reveals thicker than normal trabeculae and sometimes an increase in the number of tra-beculae per unit area. In chronic cases the new bone formation may result in a very dense sclerotic region of bone, obscuring individual trabeculae. Occasionally the lesion may appear to be composed entirely of sclerotic bone (sclerosing osteitis), but usually some evi-dence exists of widening of the apical portion of the periodontal membrane space (see Fig. 20-5 ).
Effects on Surrounding Structures. As mentioned previously, periapical infl ammatory lesions may stimulate either the resorption of bone or the manufacture of new bone. The lamina dura around
the apex of the tooth usually is lost. The sclerotic reaction of the can-cellous bone may be limited to a small region around the tooth apex or in some cases may be extensive. In rare instances in the mandible the sclerotic reaction may extend to the inferior cortex. In chronic cases external resorption of the apical region of the root may occur. If the lesion is long standing, the pulp canal may appear wider than adjacent teeth. This is a result of the death of odontoblasts and sub-sequent cessation of the formation of secondary dentin, which occurs naturally with time to diminish the caliber of the pulp canal slowly.
Nearby cortical boundaries may be destroyed, such as a segment of the fl oor of the maxillary antrum, the fl oor of the nasal fossa, or the buccal or lingual plates of the alveolar process immediately adja-cent to the root apex. These lesions are capable of producing an infl ammatory periosteal reaction, most notably in the adjacent fl oor of the maxillary antrum. This usually results in a thin layer of new bone produced by the infl amed periosteum within the maxillary antrum, sometimes referred to as a “ halo shadow ” ( Fig. 20-6 ). A regional mucositis may be present within the adjacent segment of the
FIG. 20-2 A very early lesion involving the pulp of the second bicus-pid without signifi cant change in the periapical bone (arrow). In con-trast, note the loss of the lamina dura and periapical bone at the apex of the mesial root of the second molar. Also note the subtle halo of sclerotic bone reaction around this apical radiolucency.
FIG. 20-3 Periapical infl ammatory lesions associated with a mandibular fi rst molar (A) and a maxil-lary lateral incisor (B). Note that in both cases the epicenter of bone destruction is located at the apex of the root. Also, note gradual widening of the periodontal membrane space (arrow) characteristic of an infl ammatory lesion. C, This periapical image of sclerosing osteitis related to the fi rst molar shows a gradual transition from thick and numerous trabeculae (short arrow) to a normal trabecular pattern (long arrow).
A B C
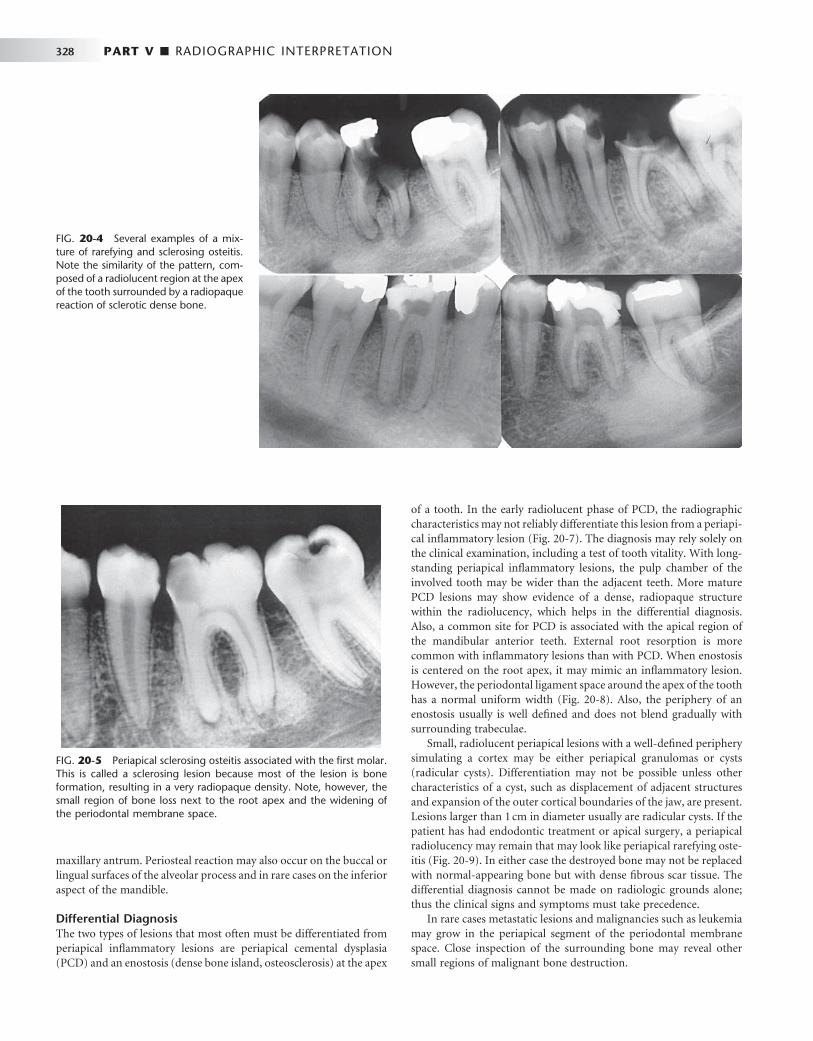
328 PART V ■ RADIOGRAPHIC INTERPRETATION
FIG. 20-4 Several examples of a mix-ture of rarefying and sclerosing osteitis. Note the similarity of the pattern, com-posed of a radiolucent region at the apex of the tooth surrounded by a radiopaque reaction of sclerotic dense bone.
FIG. 20-5 Periapical sclerosing osteitis associated with the fi rst molar. This is called a sclerosing lesion because most of the lesion is bone formation, resulting in a very radiopaque density. Note, however, the small region of bone loss next to the root apex and the widening of the periodontal membrane space.
maxillary antrum. Periosteal reaction may also occur on the buccal or lingual surfaces of the alveolar process and in rare cases on the inferior aspect of the mandible.
Differential Diagnosis The two types of lesions that most often must be differentiated from periapical infl ammatory lesions are periapical cemental dysplasia (PCD) and an enostosis (dense bone island, osteosclerosis) at the apex
of a tooth. In the early radiolucent phase of PCD, the radiographic characteristics may not reliably differentiate this lesion from a periapi-cal infl ammatory lesion ( Fig. 20-7 ). The diagnosis may rely solely on the clinical examination, including a test of tooth vitality. With long-standing periapical infl ammatory lesions, the pulp chamber of the involved tooth may be wider than the adjacent teeth. More mature PCD lesions may show evidence of a dense, radiopaque structure within the radiolucency, which helps in the differential diagnosis. Also, a common site for PCD is associated with the apical region of the mandibular anterior teeth. External root resorption is more common with infl ammatory lesions than with PCD. When enostosis is centered on the root apex, it may mimic an infl ammatory lesion. However, the periodontal ligament space around the apex of the tooth has a normal uniform width ( Fig. 20-8 ). Also, the periphery of an enostosis usually is well defi ned and does not blend gradually with surrounding trabeculae.
Small, radiolucent periapical lesions with a well-defi ned periphery simulating a cortex may be either periapical granulomas or cysts (radicular cysts). Differentiation may not be possible unless other characteristics of a cyst, such as displacement of adjacent structures and expansion of the outer cortical boundaries of the jaw, are present. Lesions larger than 1 cm in diameter usually are radicular cysts. If the patient has had endodontic treatment or apical surgery, a periapical radiolucency may remain that may look like periapical rarefying oste-itis ( Fig. 20-9 ). In either case the destroyed bone may not be replaced with normal-appearing bone but with dense fi brous scar tissue. The differential diagnosis cannot be made on radiologic grounds alone; thus the clinical signs and symptoms must take precedence.
In rare cases metastatic lesions and malignancies such as leukemia may grow in the periapical segment of the periodontal membrane space. Close inspection of the surrounding bone may reveal other small regions of malignant bone destruction.

CHAPTER 20 ■ INFLAMMATORY LESIONS OF THE JAWS 329
FIG. 20-6 Periostitis resulting in bone formation emanating from the fl oor of the maxillary antrum that arises from apical infl ammatory lesions. A, Laminated type of periosteal bone formation (arrow). B, Periostitis and mucositis. The mucositis is characterized by a slight radiopaque band (arrow) next to the periosteal bone formation.
A
B
FIG. 20-7 Two early lesions of periapical cemental dysplasia related to the apical region of the mandibular central incisors; note the similar-ity to apical rarefying osteitis.
Management Standard dental treatment of periapical lesions includes root canal therapy or extraction with the intention of eliminating the necrotic material in the root canal and hence the source of infl ammation. If left untreated, the tooth may become asymptomatic because of drain-age established through the carious lesion or a parulis. However, the possibility always exists that the lesion will spread to involve a larger area of bone, resulting in osteomyelitis or into the surrounding soft tissue, which may result in a space infection or cellulitis.
PERICORONITIS
Synonym Operculitis
Defi nition The term pericoronitis refers to infl ammation of the tissues surround-ing the crown of a partially erupted tooth. It is most often seen in association with the mandibular third molars in young adults. The gingiva surrounding the erupted portion of the crown becomes infl amed when food or microbial debris becomes trapped under the soft tissue. The gingiva subsequently becomes swollen and may become secondarily traumatized by the opposing occlusion. This infl ammation may extend into the bone surrounding the crown of the tooth.
Clinical Features Patients with pericoronitis typically complain of pain and swelling. Trismus is a common presentation when the partially erupted tooth is a lower third molar, and usually pain is felt on occlusion. An

330 PART V ■ RADIOGRAPHIC INTERPRETATION
A B
FIG. 20-8 Enostosis (dense bone island) in periapical positions. A, Enostosis around the apex of a second bicuspid. Note that the periodontal membrane space is uniform in width. B, Enostosis associ-ated with apical root resorption of a vital tooth. The most common site of enostosis and root resorption is the mesial or distal root of mandibular fi rst molars.
FIG. 20-9 A, Radiolucent apical scar left after suc-cessful endodontic treatment. B, Healing periapical infl ammatory lesion associated with the apical region of a maxillary lateral incisor. Note the radiating, spoke-like pattern of new bone forming from the periphery of the lesion.
A B
ulcerated operculum is usually the source of the pain. Pericoronitis can affect patients of any age or sex but is most commonly seen during the time of eruption of the third molars in young adults.
Radiographic Features The radiologic signs of pericoronitis can range from no changes when the infl ammatory lesion is confi ned to the soft tissues to localized rarefaction and sclerosis to osteomyelitis in the most severe cases.
Location. When bone changes are associated with pericoronitis, they are centered on the follicular space or the portion of the crown still embedded in bone or in close proximity to bone. The mandibular third molar region is the most common location.
Periphery. The periphery of pericoronitis is ill defi ned, with a gradual transition of the normal trabecular pattern into a sclerotic region.
Internal Structure. The internal structure of bone adjacent to the pericoronitis most often is sclerotic with thick trabeculae. An area of bone loss or radiolucency immediately adjacent to the crown that enlarges the follicular space may be seen ( Fig. 20-10 ). If this lesion spreads considerably, the internal pattern becomes consistent with osteomyelitis (see the next section).
Effects on Surrounding Structures. As with the periapical infl ammatory lesions, pericoronitis may cause the typical changes of sclerosis and rarefaction of surrounding bone. In extensive cases,

CHAPTER 20 ■ INFLAMMATORY LESIONS OF THE JAWS 331
evidence of periosteal new bone formation may be seen at the inferior cortex, the posterior border of the ramus, and along the coronoid notch of the mandible.
Differential Diagnosis The differential diagnosis of pericoronitis includes other mixed density or sclerotic lesions that can exist adjacent to the crown of a partially erupted third molar. These include enostosis and fi brous dysplasia. The clinical symptoms indicative of an infl ammatory lesion usually exclude these conditions. Neoplasms to be considered include the sclerotic form of osteosarcoma and, in older patients, squamous cell carcinoma. The occurrence of squamous cell carcinoma in the midst of a preexisting infl ammatory lesion may be diffi cult to identify. Features characteristic of malignant neoplasia, such as profound cor-tical bone destruction and invasion, aids with the diagnosis.
Management The aim of treatment of pericoronitis is removal of the partially erupted tooth. However, in the acute phase, when trismus may prevent adequate access, antibiotic therapy and reduction in occlusion of the opposing tooth should relieve the symptoms until defi nitive treat-ment is provided.
OSTEOMYELITIS
Defi nition Osteomyelitis is an infl ammation of bone. The infl ammatory process may spread through the bone to involve the marrow, cortex, cancel-lous portion, and periosteum. In the jaws pyogenic organisms that reach the bone marrow from abscessed teeth or postsurgical infection usually cause osteomyelitis. However, in some instances no source of infection can be identifi ed, and hematogenous spread is presumed to be the origin. In some patients no infectious organisms can be identi-fi ed, possibly because of previous antibiotic therapy or inadequate methods of bacterial isolation. Bacterial colonies also may be present in small, isolated pockets of bone that may be missed during sampling.
In patients with osteomyelitis, the bacteria and their products stimulate an infl ammatory reaction in bone, causing destruction of the endosteal surface of the cortical bone. This destruction may pro-gress through the cortical bone to the outer periosteum. In young patients, in whom the periosteum is more loosely attached to the outer cortex of bone than it is in adults, the periosteum is lifted up by infl ammatory exudate, and new bone is laid down. This periosteal reaction is a characteristic but not pathognomonic feature of osteomyelitis. The hallmark of osteomyelitis is the develop-ment of sequestra. A sequestrum is a segment of bone that has become necrotic because of ischemic injury caused by the infl ammatory process.
Numerous forms of osteomyelitis have been described. For the sake of simplicity, we group them into two major phases, acute and chronic, recognizing that these represent two ends of a continuum without a defi nite separating boundary in the process of bone infl am-mation. Other forms of osteomyelitis have been described as separate and distinct clinicopathologic entities with unique radiographic fea-tures. These are Garr é ’ s osteomyelitis and diffuse sclerosing osteomy-elitis. We consider them as part of the same continuum. Garr é ’ s osteomyelitis is an exuberant periosteal response to infl ammation. Diffuse sclerosing osteomyelitis is a chronic form of osteomyelitis with a pronounced sclerotic response. It is important to understand
that all these variations of osteomyelitis have the same underlying process of the bone ’ s response to infl ammation. The features expressed by each subtype represent only variations in the type and degree of bone reaction.
Osteomyelitis may resolve spontaneously or with appropriate anti-biotic intervention. However, if the condition is not treated or is treated inadequately, the infection may persist and continue to spread and become chronic in about 20% of patients. Some chronic systemic diseases, immunosuppressive states, and disorders of decreased vas-cularity may predispose an individual to the development of osteo-myelitis. For example, osteopetrosis, sickle cell anemia, and acquired immunodefi ciency syndrome have been documented as underlying factors in the development of osteomyelitis.
Acute Phase
Synonyms Acute suppurative osteomyelitis, pyogenic osteomyelitis, subacute suppurative osteomyelitis, Garr é ’ s osteomyelitis, proliferative perios-titis, and periostitis ossifi cans are synonyms for the acute phase of osteomyelitis.
Defi nition The acute phase of osteomyelitis is caused by infection that has spread to the bone marrow. With this condition, the medullary spaces of the bone contain an infl ammatory infi ltrate consisting predominantly of neutrophils and, to a lesser extent, mononuclear cells. In the jaws the most common source of infection is a periapical lesion from a non-vital tooth. Infection also can occur as a result of trauma or hematog-enous spread.
The changes described by Garr é may accompany acute osteomy-elitis. It is thought that the infl ammatory exudate spreads subperioste-ally, elevating the periosteum and stimulating formation of new bone. This condition is more common in younger people because in these individuals the periosteum is loosely attached to the bone surface and has greater osteogenic potential.
FIG. 20-10 Cropped panoramic view of a case of pericoronitis related to a partially erupted third molar. Note the sclerotic bone reaction adjacent to the follicular cortex (black arrow) and the periosteal reac-tion (white arrow).

332 PART V ■ RADIOGRAPHIC INTERPRETATION
Clinical Features The acute phase of osteomyelitis can affect people of all ages, and it has a strong male predilection. It is much more common in the man-dible than in the maxilla, possibly because of the poorer vascular supply to the mandible. The typical signs and symptoms of acute osteomyelitis are rapid onset, pain, swelling of the adjacent soft tissues, fever, lymphadenopathy, and leukocytosis. The associated teeth may be mobile and sensitive to percussion. Purulent drainage also may be present. Paresthesia of the lower lip in the third division of the fi fth cranial nerve distribution is not uncommon.
Radiologic Examination In addition to a complete examination with plain fi lms (panoramic, intraoral periapical and occlusal fi lms), the following additional modalities may be used. A two-phase nuclear medicine study com-posed of a technetium bone scan followed by a gallium citrate scan may help to confi rm the diagnosis. With infl ammatory lesions, a posi-tive result on the technetium scan indicates increased bone metabolic activity, and a positive result on the gallium scan in the same location indicates an infl ammatory cell infi ltrate. Computed tomography (CT) is the imaging method of choice. CT reveals more bone surface for
detecting periosteal new bone and is the best imaging method for detecting sequestra ( Fig. 20-11 ). Magnetic resonance imaging (MRI) with T2 weighted images to display abnormal bone marrow edema has been used.
Radiographic Features Very early in the disease, no radiographic changes may be identifi able. The bone may be fi lled with infl ammatory exudate and infl ammatory cells and may show no radiographic change.
Location. The most common location is the posterior body of the mandible. The maxilla is a rare site.
Periphery. Acute osteomyelitis most often presents an ill-defi ned periphery with a gradual transition to normal trabeculae.
Internal Structure. The fi rst radiographic evidence of the acute form of osteomyelitis is a slight decrease in the density of the involved bone, with a loss of sharpness of the existing trabeculae. In time the bone destruction becomes more profound, resulting in an area of radiolucency in one focal area or in scattered regions throughout the involved bone ( Fig. 20-12 ). Later, the appearance of sclerotic regions becomes apparent. Sequestra may be present but usually are more apparent and numerous in chronic forms ( Fig. 20-13 ). Sequestra can
FIG. 20-11 CT image of multiple sequestra. A, An axial scan (bone window) revealing multiple sequestra (arrows), and B, a coronal scan (bone window) demonstrating a sequestrum (arrow) in two different cases of chronic osteomyelitis.
A
B
FIG. 20-12 Acute osteomyelitis involving the body of the right mandible, with initial blurring of bony trabeculae. (Courtesy Lars Hollender, DDS, PhD, Seattle, Wash.)

CHAPTER 20 ■ INFLAMMATORY LESIONS OF THE JAWS 333
be identifi ed by closely inspecting a region of bone destruction (radio-lucency) for an island of bone. This island of nonvital bone may vary in size from a small dot (smaller sequestra usually are seen in young patients) to larger segments of radiopaque bone.
Effects on Surrounding Structures. Acute osteomyelitis can stimulate either bone resorption or bone formation. Portions of corti-cal bone may be resorbed. An infl ammatory exudate can lift the peri-osteum and stimulate bone formation. Radiographically, this appears as a thin, faint, radiopaque line adjacent to and almost parallel or slightly convex to the surface of the bone. A radiolucent band sepa-rates this periosteal new bone from the bone surface ( Fig. 20-14 ). As the lesion develops into a more chronic phase, cyclic and periodic acute exacerbations may produce more infl ammatory exudate, which again lifts the periosteum from the bone surface and stimulates the periosteum to form a second layer of bone. This is detected radio-graphically as a second radiopaque line almost parallel to the fi rst and separated from it by a radiolucent band. This process may continue and may result in several lines (an onion-skin appearance), and even-tually a massive amount of new bone may be formed. This is referred to as proliferative periostitis and is seen more often in children ( Fig. 20-15 ). The effects on the teeth and lamina dura may be the same as those described for periapical infl ammatory lesions.
Differential Diagnosis The differential diagnosis of the acute phase of osteomyelitis may include fi brous dysplasia, especially in children. Aside from the clinical signs of acute infection, the most useful radiographic characteristic to distinguish osteomyelitis from fi brous dysplasia is the way the enlarge-ment of the bone occurs. The new bone that enlarges the jaws in osteomyelitis is laid down by the periosteum and therefore is on the
FIG. 20-13 Examples of Sequestra. A, Occlusal fi lm demonstrates small sequestra as radiopaque islands of bone in radiolucent regions in the chronic phase of osteomyelitis (arrows). B, Panoramic fi lm reveals large seques-tra (black arrow) and a periosteal reaction at the inferior border of the mandible in a case of chronic osteomyelitis (white arrow).
A
B
FIG. 20-14 Osteomyelitis of the mandible with a periosteal reaction located at the inferior cortex. Note the radiolucent line (arrow) between the inferior cortex of the mandible and the fi rst layer of periosteal new bone. A second radiolucent line separates the second layer of new bone from the fi rst layer.
outside of the outer cortical plate. In fi brous dysplasia the new bone is manufactured on the inside of the mandible; thus the outer cortex, which may be thinned, is on the outside and contains the lesion. This point of differentiation is important because the histologic appear-ance of a biopsy of new periosteal bone in osteomyelitis may be similar to that of fi brous dysplasia, and the condition may be reported as such.
Malignant neoplasia (e.g., osteosarcoma, squamous cell carci-noma) that invades the mandible at times may be diffi cult to differ-entiate from the acute phase of osteomyelitis, especially if the malignancy has been secondarily infected via an oral ulcer; this may
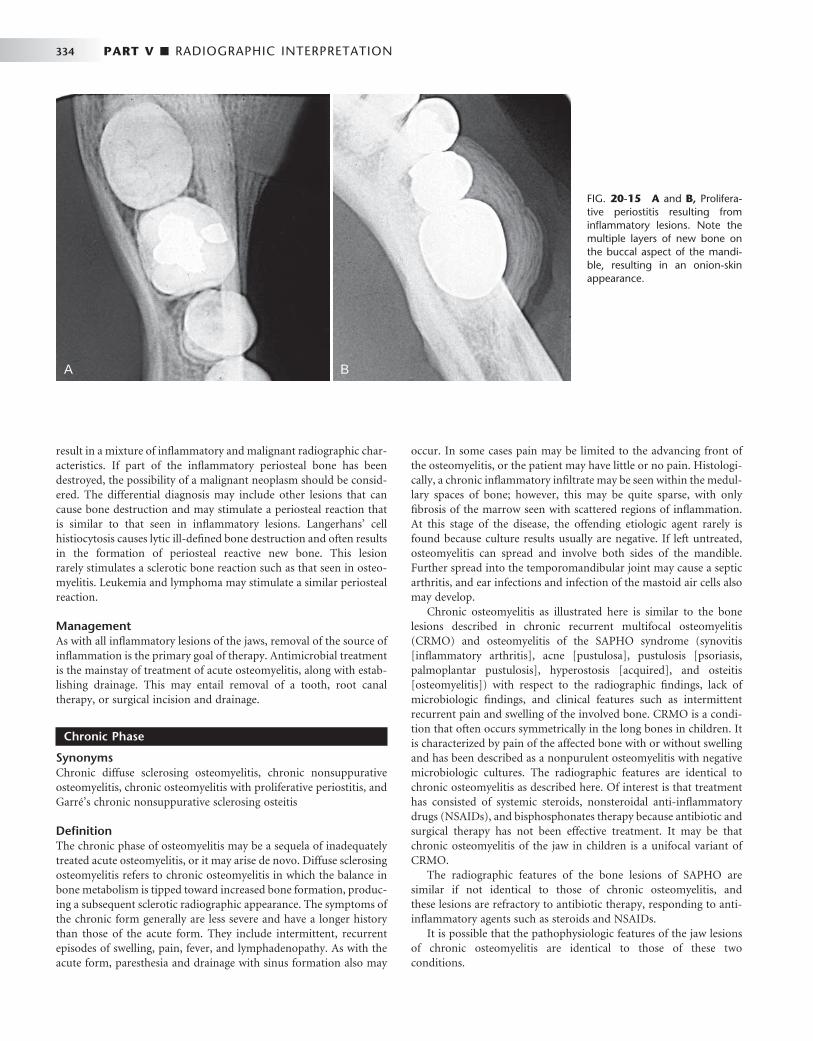
334 PART V ■ RADIOGRAPHIC INTERPRETATION
result in a mixture of infl ammatory and malignant radiographic char-acteristics. If part of the infl ammatory periosteal bone has been destroyed, the possibility of a malignant neoplasm should be consid-ered. The differential diagnosis may include other lesions that can cause bone destruction and may stimulate a periosteal reaction that is similar to that seen in infl ammatory lesions. Langerhans ’ cell histiocytosis causes lytic ill-defi ned bone destruction and often results in the formation of periosteal reactive new bone. This lesion rarely stimulates a sclerotic bone reaction such as that seen in osteo-myelitis. Leukemia and lymphoma may stimulate a similar periosteal reaction.
Management As with all infl ammatory lesions of the jaws, removal of the source of infl ammation is the primary goal of therapy. Antimicrobial treatment is the mainstay of treatment of acute osteomyelitis, along with estab-lishing drainage. This may entail removal of a tooth, root canal therapy, or surgical incision and drainage.
Chronic Phase
Synonyms Chronic diffuse sclerosing osteomyelitis, chronic nonsuppurative osteomyelitis, chronic osteomyelitis with proliferative periostitis, and Garr é ’ s chronic nonsuppurative sclerosing osteitis
Defi nition The chronic phase of osteomyelitis may be a sequela of inadequately treated acute osteomyelitis, or it may arise de novo. Diffuse sclerosing osteomyelitis refers to chronic osteomyelitis in which the balance in bone metabolism is tipped toward increased bone formation, produc-ing a subsequent sclerotic radiographic appearance. The symptoms of the chronic form generally are less severe and have a longer history than those of the acute form. They include intermittent, recurrent episodes of swelling, pain, fever, and lymphadenopathy. As with the acute form, paresthesia and drainage with sinus formation also may
occur. In some cases pain may be limited to the advancing front of the osteomyelitis, or the patient may have little or no pain. Histologi-cally, a chronic infl ammatory infi ltrate may be seen within the medul-lary spaces of bone; however, this may be quite sparse, with only fi brosis of the marrow seen with scattered regions of infl ammation. At this stage of the disease, the offending etiologic agent rarely is found because culture results usually are negative. If left untreated, osteomyelitis can spread and involve both sides of the mandible. Further spread into the temporomandibular joint may cause a septic arthritis, and ear infections and infection of the mastoid air cells also may develop.
Chronic osteomyelitis as illustrated here is similar to the bone lesions described in chronic recurrent multifocal osteomyelitis (CRMO) and osteomyelitis of the SAPHO syndrome (synovitis [ infl ammatory arthritis ] , acne [ pustulosa ] , pustulosis [ psoriasis, palmoplantar pustulosis ] , hyperostosis [ acquired ] , and osteitis [ osteomyelitis ] ) with respect to the radiographic fi ndings, lack of microbiologic fi ndings, and clinical features such as intermittent recurrent pain and swelling of the involved bone. CRMO is a condi-tion that often occurs symmetrically in the long bones in children. It is characterized by pain of the affected bone with or without swelling and has been described as a nonpurulent osteomyelitis with negative microbiologic cultures. The radiographic features are identical to chronic osteomyelitis as described here. Of interest is that treatment has consisted of systemic steroids, nonsteroidal anti-infl ammatory drugs (NSAIDs), and bisphosphonates therapy because antibiotic and surgical therapy has not been effective treatment. It may be that chronic osteomyelitis of the jaw in children is a unifocal variant of CRMO.
The radiographic features of the bone lesions of SAPHO are similar if not identical to those of chronic osteomyelitis, and these lesions are refractory to antibiotic therapy, responding to anti-infl ammatory agents such as steroids and NSAIDs.
It is possible that the pathophysiologic features of the jaw lesions of chronic osteomyelitis are identical to those of these two conditions.
FIG. 20-15 A and B, Prolifera-tive periostitis resulting from infl ammatory lesions. Note the multiple layers of new bone on the buccal aspect of the mandi-ble, resulting in an onion-skin appearance.
A B

CHAPTER 20 ■ INFLAMMATORY LESIONS OF THE JAWS 335
Radiologic Examination If chronic osteomyelitis is suspected from the clinical examination, in addition to a complete series of plain fi lms, CT is the imaging method of choice. CT is important for a correct diagnosis with the ability to demonstrate sequestra (see Fig. 20-11 ) and periosteal new bone and allows accurate staging of the disease, which is important for future assessment of healing. MRI is not as useful because of the lack of bone marrow edema in the chronic phase; however, it may be of use during acute exacerbation of the disease. Scintigraphy by use of bone scans, gallium, or labeled white blood cells is not particularly useful for dif-ferential diagnosis. Bone scans indicate increased bone formation, which is nonspecifi c, and often gallium scans (which highlight infl am-matory cells) are not positive because of a very low population of infl ammatory cells. The amount of bone activity assessed with bone scans with SPECT (single-photon emission CT) has been used to monitor healing. There are also reports of the use of positron emission tomography to detect a high cellular metabolic rate in tissues, but this type of imaging is nonspecifi c.
Radiographic Features Location. As in the acute phase of osteomyelitis, the most
common site is the posterior mandible. Periphery. The periphery may be better defi ned than in the acute
phase, but it is still diffi cult to determine the exact extent of chronic osteomyelitis. Usually a gradual transition is seen between the normal surrounding trabecular pattern and the dense granular pattern char-acteristic of this disease. When the disease is active and is spreading through bone, the periphery may be more radiolucent and have poorly defi ned borders.
Internal Structure. The internal structure comprises regions of greater and lesser radiopacity compared with surrounding normal bone. Most of the lesion usually is composed of the more radiopaque or sclerotic bone pattern ( Fig. 20-16 ). In older, more chronic lesions the internal bone density can be exceedingly radiopaque and equiva-lent to cortical bone. In these cases no obvious regions of radiolucency may be seen. In other cases, small regions of radiolucency may be scattered throughout the radiopaque bone. A close inspection of the radiolucent regions may reveal an island of bone or sequestrum within the center ( Fig. 20-17 ). Often the sequestrum appears more radiopaque than the surrounding bone. Detection may require illu-mination of the radiolucent regions of the fi lm with an intense light source. CT is superior for revealing the internal structure and seques-tra, especially in cases with very dense sclerotic bone. The bone pattern usually is very granular, obscuring individual bone trabeculae.
Effects on Surrounding Structures. Chronic osteomyelitis often stimulates the formation of periosteal new bone, which is seen radio-graphically as a single radiopaque line or a series of radiopaque lines (similar to onion skin) parallel to the surface of the cortical bone. Over time the radiolucent strip that separates this new bone from the outer cortical bone surface may be fi lled in with granular sclerotic bone. When this occurs, it may not be possible to identify the original cortex, which makes it diffi cult to determine whether the new bone is derived from the periosteum. After a considerable amount of time the outer contour of the mandible also may be altered, assuming an abnormal shape, and the girth of the mandible may be much larger than on the unaffected side. The roots of teeth may undergo external resorption, and the lamina dura may become less apparent as it blends with the surrounding granular sclerotic bone. If a tooth is nonvital, the periodontal ligament space usually is enlarged in the apical region. In patients with extensive chronic osteomyelitis, the disease may
FIG. 20-16 Chronic osteomyelitis. A, This panoramic fi lm demon-strates chronic osteomyelitis of the patient ’ s right mandible; note the increase in density and size of the right mandible compared with the left side. B, An axial CT image using bone window of the mandible of the same case. Note the increase in bone density, width of the man-dible, and the new periosteal bone formation (white arrow) and evi-dence of the original cortex (black arrow).
A
B
slowly spread to the mandibular condyle and into the joint, resulting in a septic arthritis. Further spread may involve the inner ear and mastoid air cells. Chronic lesions may develop a draining fi stula, which may appear as a well-defi ned break in the outer cortex or in the periosteal new bone ( Fig. 20-18 ).
Differential Diagnosis Very sclerotic, radiopaque chronic lesions of osteomyelitis may be diffi cult to differentiate from fi brous dysplasia, Paget ’ s disease, and osteosarcoma. In children, osteomyelitis with a proliferative periosteal response may be misinterpreted as fi brous dysplasia (see the section Differential Diagnosis under Acute Osteomyelitis). Differentiation of the chronic form of osteomyelitis may be even more diffi cult if con-siderable remodeling and loss of a distinct original cortex have occurred. In these cases, inspection of the bone surface at the most peripheral part of the lesion may reveal subtle evidence of peri-osteal new bone formation. The presence of sequestra indicates osteo-myelitis. Paget ’ s disease affects the entire mandible, which is rare in

336 PART V ■ RADIOGRAPHIC INTERPRETATION
Management Chronic osteomyelitis tends to be more diffi cult to eradicate than the acute form. In cases involving an extreme osteoblastic response (very sclerotic mandible), the subsequent lack of a good blood supply may work against healing. Hyperbaric oxygen therapy and creative modes of long-term antibiotic delivery have been used with limited success. Sur-gical intervention, which may include sequestrectomy, decortication, or resection, often is necessary. The probability of successful treatment, especially when using long-term antibiotic therapy with decortication, is greater in the fi rst two decades of life. If cultures are negative, anti-biotic therapy is not effective. It may be that the infl ammatory response has become the main disease process and anti-infl ammatory agents such as steroids and NSAIDs are more effective. More recently, the use of bisphosphonate therapy has provided some therapeutic success.
Diagnostic Imaging of Soft Tissue Infections
Diagnostic imaging may be used to confi rm the presence and extent of soft tissue infections. MRI and CT may be used to differentiate soft tissue neoplasia from infl ammatory lesions. MRI can be used in the T2 or TI with gadolinium and fat suppression modes to detect the presence of soft tissue edema. CT usually is used with intravenous contrast. The CT image characteristics that suggest the presence of a soft tissue infl ammation include abnormal fascial planes, thickening of the overlying skin and adjacent muscles, streaking of the fat planes, and abnormal collections of gas in the soft tissue ( Fig. 20-19 ). Over time the contrast between soft tissue planes may disappear, and the presence of an abscess may become evident as a well-defi ned region of low density surrounded by a wide border of contrast-enhanced (more radiopaque) tissue. Lymphadenopathy resulting from infec-tions such as tuberculosis of the head and neck may be visualized on magnetic resonance and CT images ( Fig. 20-20 ).
RADIATION-INDUCED CHANGES TO BONE
Therapeutic radiation damages the cellular elements of bone tissue by immediate or delayed cell death, cellular injury with recovery, arrested cellular division, or abnormal repair with neoplasia. The maturity and type of bone and the dose of radiation are factors that affect how the bone responds to this injury. When immature bone is irradiated, growth retardation occurs; the amount is related to the radiation dose and the stage of bone growth: the earlier the stage the greater the effect. Radiation damage to mature bone affects the osteoblasts, result-ing in a decrease in matrix formation and damage to the fi ne blood vessels. The following discussion is limited to the mature bone of the maxillofacial region.
As with osteomyelitis, there is a spectrum of radiographic appear-ances of radiation damage to bone. These range from sclerosis with patchy radiolucency to osteoradionecrosis. When radiation damage to bone progresses to osteoradionecrosis, it is often fi rst diagnosed clini-cally as an exposed bone sequestrum in the oral cavity before there are signifi cant radiographic changes.
OSTEORADIONECROSIS
Defi nition Osteoradionecrosis refers to an infl ammatory condition of bone (osteomyelitis) that occurs after the bone has been exposed to thera-
FIG. 20-17 An axial CT image using bone window of chronic osteo-myelitis with a mixture of increased bone density (black arrow), areas of radiolucency, and presence of sequestra (white arrow).
FIG. 20-18 A fi stulous tract extending inferiorly from the apex of the fi rst molar through the inferior cortex of the mandible (arrows).
osteomyelitis. Periosteal new bone formation and sequestra are not seen in Paget ’ s disease. Dense, granular bone may be seen in some forms of osteosarcoma, but usually evidence of bone destruction is found. A characteristic spiculated (sunraylike) periosteal response also may be seen. As mentioned in the section on acute osteomyelitis, other entities such as Langerhans ’ cell histiocytosis, leukemia, and lymphoma may stimulate a similar periosteal response, but these usually produce evidence of bone destruction characteristic of malig-nant tumors.
The imaging method of choice for aiding in the differential diag-nosis is CT because of its ability to reveal sequestra and periosteal new bone.
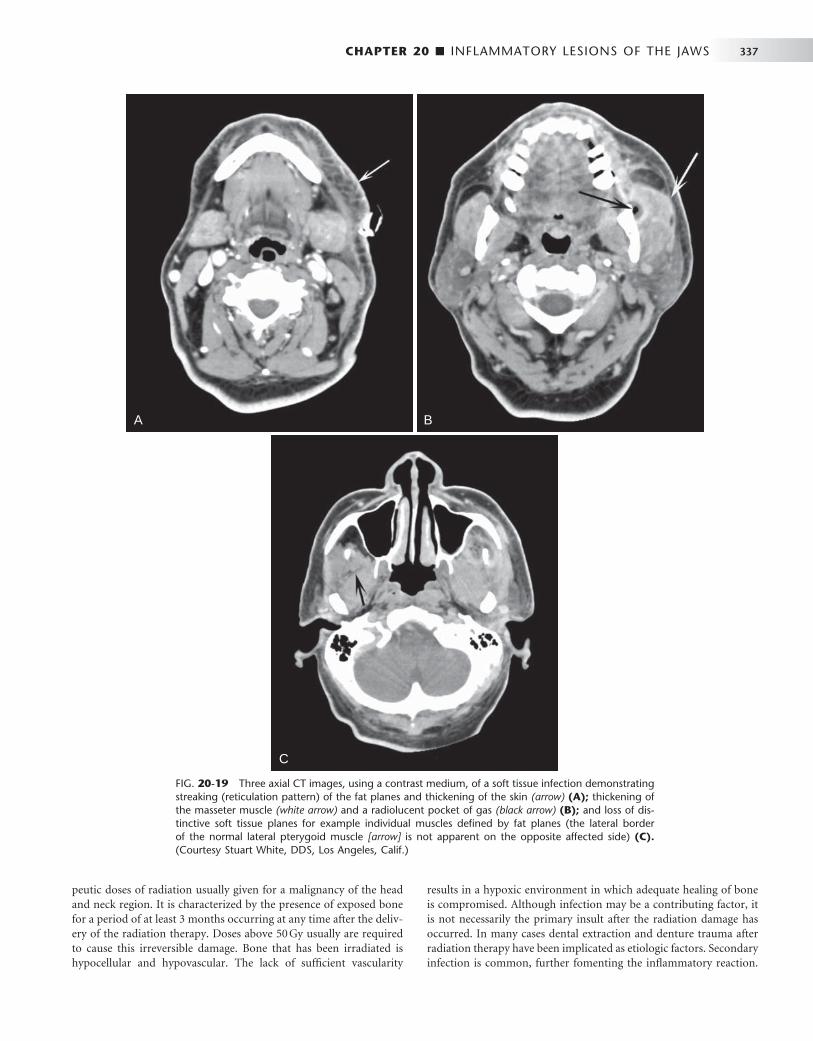
CHAPTER 20 ■ INFLAMMATORY LESIONS OF THE JAWS 337
FIG. 20-19 Three axial CT images, using a contrast medium, of a soft tissue infection demonstrating streaking (reticulation pattern) of the fat planes and thickening of the skin (arrow) (A); thickening of the masseter muscle (white arrow) and a radiolucent pocket of gas (black arrow) (B); and loss of dis-tinctive soft tissue planes for example individual muscles defi ned by fat planes (the lateral border of the normal lateral pterygoid muscle [ arrow ] is not apparent on the opposite affected side) (C). (Courtesy Stuart White, DDS, Los Angeles, Calif.)
A
C
B
peutic doses of radiation usually given for a malignancy of the head and neck region. It is characterized by the presence of exposed bone for a period of at least 3 months occurring at any time after the deliv-ery of the radiation therapy. Doses above 50 Gy usually are required to cause this irreversible damage. Bone that has been irradiated is hypocellular and hypovascular. The lack of suffi cient vascularity
results in a hypoxic environment in which adequate healing of bone is compromised. Although infection may be a contributing factor, it is not necessarily the primary insult after the radiation damage has occurred. In many cases dental extraction and denture trauma after radiation therapy have been implicated as etiologic factors. Secondary infection is common, further fomenting the infl ammatory reaction.
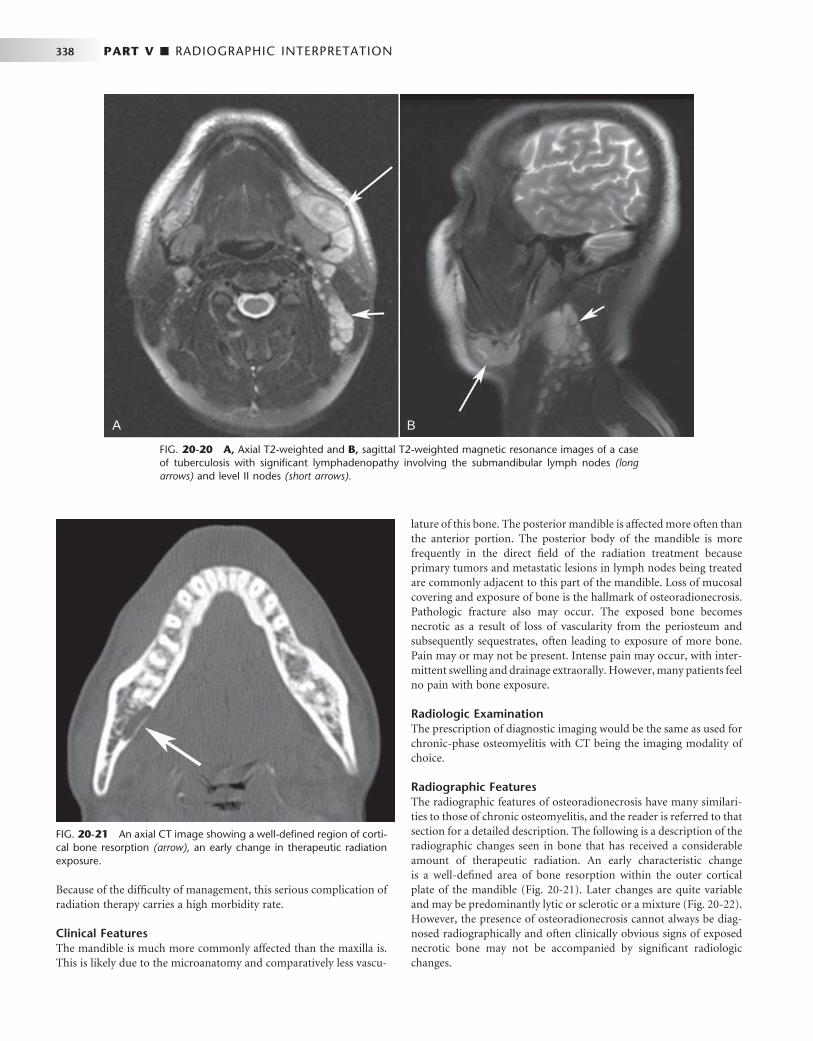
338 PART V ■ RADIOGRAPHIC INTERPRETATION
Because of the diffi culty of management, this serious complication of radiation therapy carries a high morbidity rate.
Clinical Features The mandible is much more commonly affected than the maxilla is. This is likely due to the microanatomy and comparatively less vascu-
lature of this bone. The posterior mandible is affected more often than the anterior portion. The posterior body of the mandible is more frequently in the direct fi eld of the radiation treatment because primary tumors and metastatic lesions in lymph nodes being treated are commonly adjacent to this part of the mandible. Loss of mucosal covering and exposure of bone is the hallmark of osteoradionecrosis. Pathologic fracture also may occur. The exposed bone becomes necrotic as a result of loss of vascularity from the periosteum and subsequently sequestrates, often leading to exposure of more bone. Pain may or may not be present. Intense pain may occur, with inter-mittent swelling and drainage extraorally. However, many patients feel no pain with bone exposure.
Radiologic Examination The prescription of diagnostic imaging would be the same as used for chronic-phase osteomyelitis with CT being the imaging modality of choice.
Radiographic Features The radiographic features of osteoradionecrosis have many similari-ties to those of chronic osteomyelitis, and the reader is referred to that section for a detailed description. The following is a description of the radiographic changes seen in bone that has received a considerable amount of therapeutic radiation. An early characteristic change is a well-defi ned area of bone resorption within the outer cortical plate of the mandible ( Fig. 20-21 ). Later changes are quite variable and may be predominantly lytic or sclerotic or a mixture ( Fig. 20-22 ). However, the presence of osteoradionecrosis cannot always be diag-nosed radiographically and often clinically obvious signs of exposed necrotic bone may not be accompanied by signifi cant radiologic changes.
FIG. 20-20 A, Axial T2-weighted and B, sagittal T2-weighted magnetic resonance images of a case of tuberculosis with signifi cant lymphadenopathy involving the submandibular lymph nodes (long arrows) and level II nodes (short arrows).
A B
FIG. 20-21 An axial CT image showing a well-defi ned region of corti-cal bone resorption (arrow), an early change in therapeutic radiation exposure.
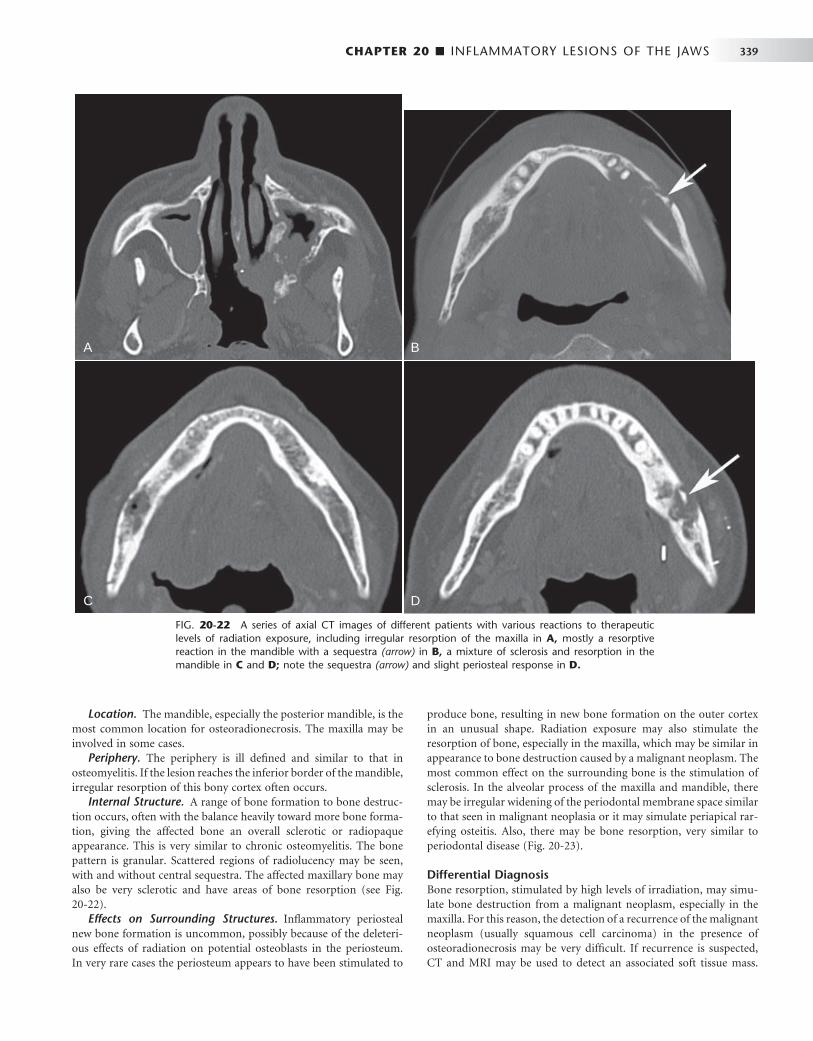
CHAPTER 20 ■ INFLAMMATORY LESIONS OF THE JAWS 339
Location. The mandible, especially the posterior mandible, is the most common location for osteoradionecrosis. The maxilla may be involved in some cases.
Periphery. The periphery is ill defi ned and similar to that in osteomyelitis. If the lesion reaches the inferior border of the mandible, irregular resorption of this bony cortex often occurs.
Internal Structure. A range of bone formation to bone destruc-tion occurs, often with the balance heavily toward more bone forma-tion, giving the affected bone an overall sclerotic or radiopaque appearance. This is very similar to chronic osteomyelitis. The bone pattern is granular. Scattered regions of radiolucency may be seen, with and without central sequestra. The affected maxillary bone may also be very sclerotic and have areas of bone resorption (see Fig. 20-22 ).
Effects on Surrounding Structures. Infl ammatory periosteal new bone formation is uncommon, possibly because of the deleteri-ous effects of radiation on potential osteoblasts in the periosteum. In very rare cases the periosteum appears to have been stimulated to
produce bone, resulting in new bone formation on the outer cortex in an unusual shape. Radiation exposure may also stimulate the resorption of bone, especially in the maxilla, which may be similar in appearance to bone destruction caused by a malignant neoplasm. The most common effect on the surrounding bone is the stimulation of sclerosis. In the alveolar process of the maxilla and mandible, there may be irregular widening of the periodontal membrane space similar to that seen in malignant neoplasia or it may simulate periapical rar-efying osteitis. Also, there may be bone resorption, very similar to periodontal disease ( Fig. 20-23 ).
Differential Diagnosis Bone resorption, stimulated by high levels of irradiation, may simu-late bone destruction from a malignant neoplasm, especially in the maxilla. For this reason, the detection of a recurrence of the malignant neoplasm (usually squamous cell carcinoma) in the presence of osteoradionecrosis may be very diffi cult. If recurrence is suspected, CT and MRI may be used to detect an associated soft tissue mass.
FIG. 20-22 A series of axial CT images of different patients with various reactions to therapeutic levels of radiation exposure, including irregular resorption of the maxilla in A, mostly a resorptive reaction in the mandible with a sequestra (arrow) in B, a mixture of sclerosis and resorption in the mandible in C and D; note the sequestra (arrow) and slight periosteal response in D.
A B
C D

340 PART V ■ RADIOGRAPHIC INTERPRETATION
Differentiation from other sclerotic lesions, as in chronic osteomyeli-tis, is less diffi cult because of the history of radiation therapy.
Management The treatment of osteoradionecrosis currently is unsatisfactory. Decortication with sequestrectomy and hyperbaric oxygen with anti-biotics have been used with limited success because of poor healing after surgery. Conservative approaches with the aim of therapy to maintain the integrity of the lower border of the mandible, keeping the site free of infection and the patient free of pain, may in the long term prove more successful. Fortunately, the incidence of osteoradio-necrosis has declined because preventive therapy has proved quite effective. Removal of teeth that have signifi cant periodontal disease or have a poor prognosis before radiation treatment and excellent oral and denture hygiene are the mainstays of preventive treatment.
FIG. 20-23 Osteoradionecrosis of the maxilla. These periapical fi lms were taken before radiotherapy (A) and within 6 months of receiving the radiation (B) . Note the combination of bone sclerosis and pro-found bone destruction around the teeth and alveolar crest and widen-ing of the periodontal membrane space.
A
B
FIG. 20-24 An axial CT image of a patient with bisphosphonate-related osteonecrosis; note the several sequestra in the anterior palate.
FIG. 20-25 Two cropped panoramic images ( A and B ) of the same patient taken 1 year apart demonstrate a developing sclerotic bone pattern with a sequestra (arrow) related to bisphosphonate therapy.
A
B
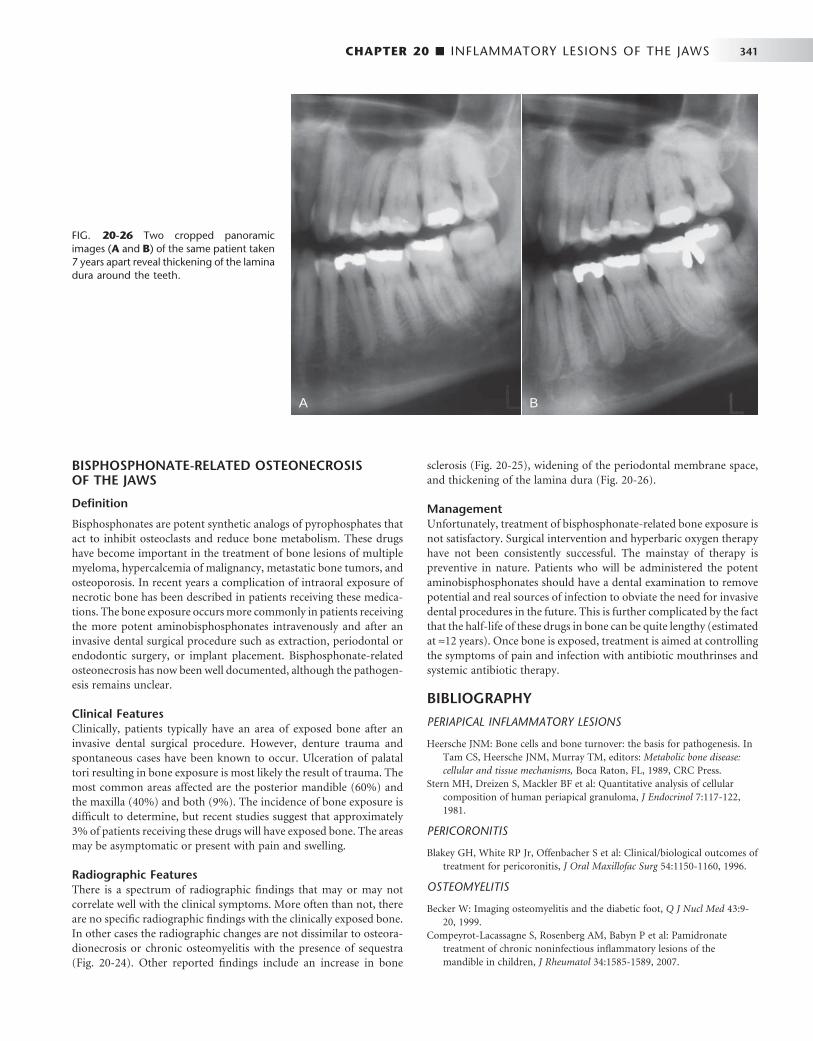
CHAPTER 20 ■ INFLAMMATORY LESIONS OF THE JAWS 341
FIG. 20-26 Two cropped panoramic images ( A and B ) of the same patient taken 7 years apart reveal thickening of the lamina dura around the teeth.
A B
BISPHOSPHONATE-RELATED OSTEONECROSIS OF THE JAWS
Defi nition
Bisphosphonates are potent synthetic analogs of pyrophosphates that act to inhibit osteoclasts and reduce bone metabolism. These drugs have become important in the treatment of bone lesions of multiple myeloma, hypercalcemia of malignancy, metastatic bone tumors, and osteoporosis. In recent years a complication of intraoral exposure of necrotic bone has been described in patients receiving these medica-tions. The bone exposure occurs more commonly in patients receiving the more potent aminobisphosphonates intravenously and after an invasive dental surgical procedure such as extraction, periodontal or endodontic surgery, or implant placement. Bisphosphonate-related osteonecrosis has now been well documented, although the pathogen-esis remains unclear.
Clinical Features Clinically, patients typically have an area of exposed bone after an invasive dental surgical procedure. However, denture trauma and spontaneous cases have been known to occur. Ulceration of palatal tori resulting in bone exposure is most likely the result of trauma. The most common areas affected are the posterior mandible (60%) and the maxilla (40%) and both (9%). The incidence of bone exposure is diffi cult to determine, but recent studies suggest that approximately 3% of patients receiving these drugs will have exposed bone. The areas may be asymptomatic or present with pain and swelling.
Radiographic Features There is a spectrum of radiographic fi ndings that may or may not correlate well with the clinical symptoms. More often than not, there are no specifi c radiographic fi ndings with the clinically exposed bone. In other cases the radiographic changes are not dissimilar to osteora-dionecrosis or chronic osteomyelitis with the presence of sequestra ( Fig. 20-24 ). Other reported fi ndings include an increase in bone
sclerosis ( Fig. 20-25 ), widening of the periodontal membrane space, and thickening of the lamina dura ( Fig. 20-26 ).
Management Unfortunately, treatment of bisphosphonate-related bone exposure is not satisfactory. Surgical intervention and hyperbaric oxygen therapy have not been consistently successful. The mainstay of therapy is preventive in nature. Patients who will be administered the potent aminobisphosphonates should have a dental examination to remove potential and real sources of infection to obviate the need for invasive dental procedures in the future. This is further complicated by the fact that the half-life of these drugs in bone can be quite lengthy (estimated at ≈ 12 years). Once bone is exposed, treatment is aimed at controlling the symptoms of pain and infection with antibiotic mouthrinses and systemic antibiotic therapy.
BIBLIOGRAPHY
PERIAPICAL INFLAMMATORY LESIONS
1 Heersche JNM : Bone cells and bone turnover: the basis for pathogenesis . In Tam CS , Heersche JNM , Murray TM , editors: Metabolic bone disease: cellular and tissue mechanisms , Boca Raton, FL , 1989 , CRC Press .
2 Stern MH , Dreizen S , Mackler BF et al : Quantitative analysis of cellular composition of human periapical granuloma , J Endocrinol 7 : 117 - 122 , 1981 .
PERICORONITIS
3 Blakey GH , White RP Jr , Offenbacher S et al : Clinical / biological outcomes of treatment for pericoronitis , J Oral Maxillofac Surg 54 : 1150 - 1160 , 1996 .
OSTEOMYELITIS
4 Becker W : Imaging osteomyelitis and the diabetic foot , Q J Nucl Med 43 : 9 - 20 , 1999 .
5 Compeyrot-Lacassagne S , Rosenberg AM , Babyn P et al : Pamidronate treatment of chronic noninfectious infl ammatory lesions of the mandible in children , J Rheumatol 34 : 1585 - 1589 , 2007 .

342 PART V ■ RADIOGRAPHIC INTERPRETATION
6 Guhlmann A , Brecht-Krauss D , Suger G et al : Chronic osteomyelitis: detection with FDG PET and correlation with histopathologic fi ndings , Radiology 2006 : 749 - 754 , 2006 .
7 Ledermann HP , Kaim A , Bongartz G et al : Pitfalls and limitations of magnetic resonance imaging in chronic posttraumatic osteomyelitis , Eur Radiol 10 : 1815 - 1823 , 2000 .
8 Morrison WB , Schweitzer ME , Batte WG et al : Osteomyelitis of the foot: relative importance of primary and secondary MR imaging signs , Radiology 207 : 625 - 632 , 1998 .
9 Nordin U , Wannfors K , Colque-Navarro P et al : Antibody response in patients with osteomyelitis of the mandible , Oral Surg Oral Med Oral Pathol Oral Radiol Endod 79 : 429 , 1995 .
10 Orpe EC , Lee L , Pharoah MJ : A radiological analysis of chronic sclerosing osteomyelitis of the mandible , Dentomaxillofac Radiol 25 : 125 - 129 , 1996 .
11 Petrikowski CG , Pharoah MJ , Lee L et al : Radiographic differentiation of osteogenic sarcoma, osteomyelitis, and fi brous dysplasia of the jaws , Oral Surg Oral Med Oral Pathol Oral Radiol Endod 80 : 744 - 750 , 1995 .
12 Suei Y , Taguchi A , Tanimoto K : Diagnostic points and possible origin of osteomyelitis in synovitis, acne, pustulosis, hyperostosis and osteitis (SAPHO) syndrome: a gradiographic study of 77 mandibular osteomyelitis cases , Rheumatology 42 : 1398 - 1403 , 2003 .
13 Suei Y , Tanimoto K , Taguchi A et al : Possible identity of diffuse sclerosing osteomyelitis and chronic recurrent multifocal osteomyelitis: one entity or two , Oral Med Oral Pathol Oral Radiol Endod 80 : 401 - 408 , 1995 .
14 Van Merkesteyn JP , Groot RH , Bras J et al : Diffuse sclerosing osteomyelitis of the mandible: clinical radiographic and histologic fi ndings in twenty-seven patients , J Oral Maxillofac Surg 46 : 825 - 829 , 1988 .
15 Wannfors K , Hammarstr ö m L : Infectious foci in chronic osteomyelitis of the jaws , Int J Oral Surg 14 : 493 - 503 , 1985 .
16 Wood RE , Nortj é CJ , Grotepass F et al : Periostitis ossifi cans versus Garr é ’ s osteomyelitis, Part I: what did Garr é really say? Oral Surg Oral Med Oral Pathol 65 : 773 - 777 , 1988 .
RADIATION-INDUCED CHANGES TO BONE
17 Becker M , Schroth G , Zb ä ren P et al : Long-term changes induced by high-dose irradiation of the head and neck region: imaging fi ndings , Radiographics 17 : 5 - 26 , 1997 .
18 Williams HJ , Davies AM : The effect of x-rays on bone: a pictorial review , Eur Radiol 16 : 619 - 633 , 2006 .
OSTERADIONECROSIS
19 Curi MM , Dib LL : Osteoradionecrosis of the jaws: a retrospective study of the background factors and treatment in 104 cases , J Oral Maxillofac Surg 55 : 540 - 544 , 1997 .
20 Hermans R , Fossion E , Ioannides C et al : CT fi ndings in osteoradionecrosis of the mandible , Skeletal Radiol 25 : 31 - 36 , 1996 .
21 Hutchison IL , Cullum ID , Langford JA et al : The investigation of osteoradionecrosis of the mandible by 99mTc-methylene diphosphonate radionuclide bone scans , Br J Oral Maxillofac Surg 28 : 143 - 149 , 1990 .
22 Marx RE : Osteoradionecrosis: a new concept of its pathophysiology , J Oral Maxillofac Surg 41 : 283 - 288 , 1983 .
23 Wong JK , Wood RE , McLean M : Conservative management of osteoradionecrosis , Oral Surg Oral Med Oral Pathol Oral Radiol Endod 84 : 16 - 21 , 1997 .
BISPHOSPHONATE-RELATED OSTEONECROSIS
24 Jadu F , Lee L , Pharoah M et al : A retrospective study assessing the incidence, risk factors and comorbidities of pamidronate-related necrosis of the jaws in multiple myeloma patients , Ann Oncol 18 : 2015 - 2019 , 2007 .
25 Woo SB , Hellstein J , Kalmar JR : Narrative [ corrected ] review: bisphosphonates and osteonecrosis of the jaws , Ann Intern Med 144 : 753 - 761 , 2006 .
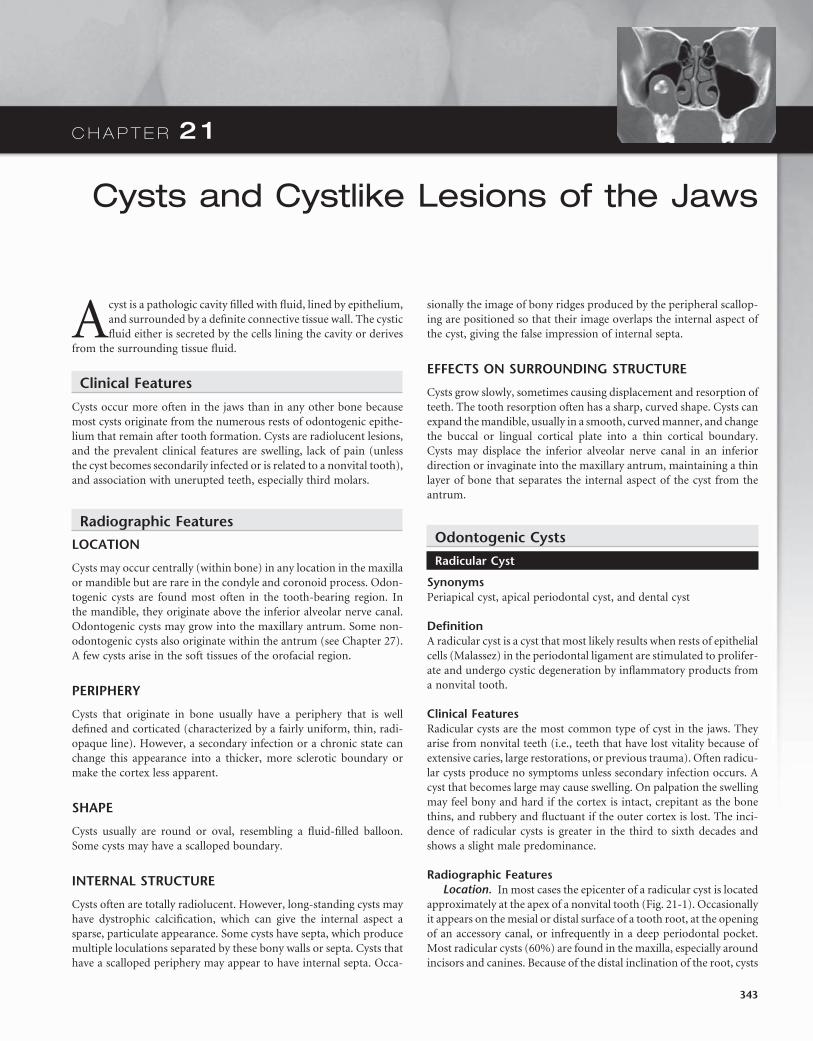
C H A P T E R 2 1
Cysts and Cystlike Lesions of the Jaws
A cyst is a pathologic cavity fi lled with fl uid, lined by epithelium, and surrounded by a defi nite connective tissue wall. The cystic fl uid either is secreted by the cells lining the cavity or derives
from the surrounding tissue fl uid.
Clinical Features
Cysts occur more often in the jaws than in any other bone because most cysts originate from the numerous rests of odontogenic epithe-lium that remain after tooth formation. Cysts are radiolucent lesions, and the prevalent clinical features are swelling, lack of pain (unless the cyst becomes secondarily infected or is related to a nonvital tooth), and association with unerupted teeth, especially third molars.
Radiographic Features
LOCATION
Cysts may occur centrally (within bone) in any location in the maxilla or mandible but are rare in the condyle and coronoid process. Odon-togenic cysts are found most often in the tooth-bearing region. In the mandible, they originate above the inferior alveolar nerve canal. Odontogenic cysts may grow into the maxillary antrum. Some non-odontogenic cysts also originate within the antrum (see Chapter 27 ). A few cysts arise in the soft tissues of the orofacial region.
PERIPHERY
Cysts that originate in bone usually have a periphery that is well defi ned and corticated (characterized by a fairly uniform, thin, radi-opaque line). However, a secondary infection or a chronic state can change this appearance into a thicker, more sclerotic boundary or make the cortex less apparent.
SHAPE
Cysts usually are round or oval, resembling a fl uid-fi lled balloon. Some cysts may have a scalloped boundary.
INTERNAL STRUCTURE
Cysts often are totally radiolucent. However, long-standing cysts may have dystrophic calcifi cation, which can give the internal aspect a sparse, particulate appearance. Some cysts have septa, which produce multiple loculations separated by these bony walls or septa. Cysts that have a scalloped periphery may appear to have internal septa. Occa-
sionally the image of bony ridges produced by the peripheral scallop-ing are positioned so that their image overlaps the internal aspect of the cyst, giving the false impression of internal septa.
EFFECTS ON SURROUNDING STRUCTURE
Cysts grow slowly, sometimes causing displacement and resorption of teeth. The tooth resorption often has a sharp, curved shape. Cysts can expand the mandible, usually in a smooth, curved manner, and change the buccal or lingual cortical plate into a thin cortical boundary. Cysts may displace the inferior alveolar nerve canal in an inferior direction or invaginate into the maxillary antrum, maintaining a thin layer of bone that separates the internal aspect of the cyst from the antrum.
Odontogenic Cysts
Radicular Cyst
Synonyms Periapical cyst, apical periodontal cyst, and dental cyst
Defi nition A radicular cyst is a cyst that most likely results when rests of epithelial cells (Malassez) in the periodontal ligament are stimulated to prolifer-ate and undergo cystic degeneration by infl ammatory products from a nonvital tooth.
Clinical Features Radicular cysts are the most common type of cyst in the jaws. They arise from nonvital teeth (i.e., teeth that have lost vitality because of extensive caries, large restorations, or previous trauma). Often radicu-lar cysts produce no symptoms unless secondary infection occurs. A cyst that becomes large may cause swelling. On palpation the swelling may feel bony and hard if the cortex is intact, crepitant as the bone thins, and rubbery and fl uctuant if the outer cortex is lost. The inci-dence of radicular cysts is greater in the third to sixth decades and shows a slight male predominance.
Radiographic Features Location. In most cases the epicenter of a radicular cyst is located
approximately at the apex of a nonvital tooth ( Fig. 21-1 ). Occasionally it appears on the mesial or distal surface of a tooth root, at the opening of an accessory canal, or infrequently in a deep periodontal pocket. Most radicular cysts (60%) are found in the maxilla, especially around incisors and canines. Because of the distal inclination of the root, cysts
343
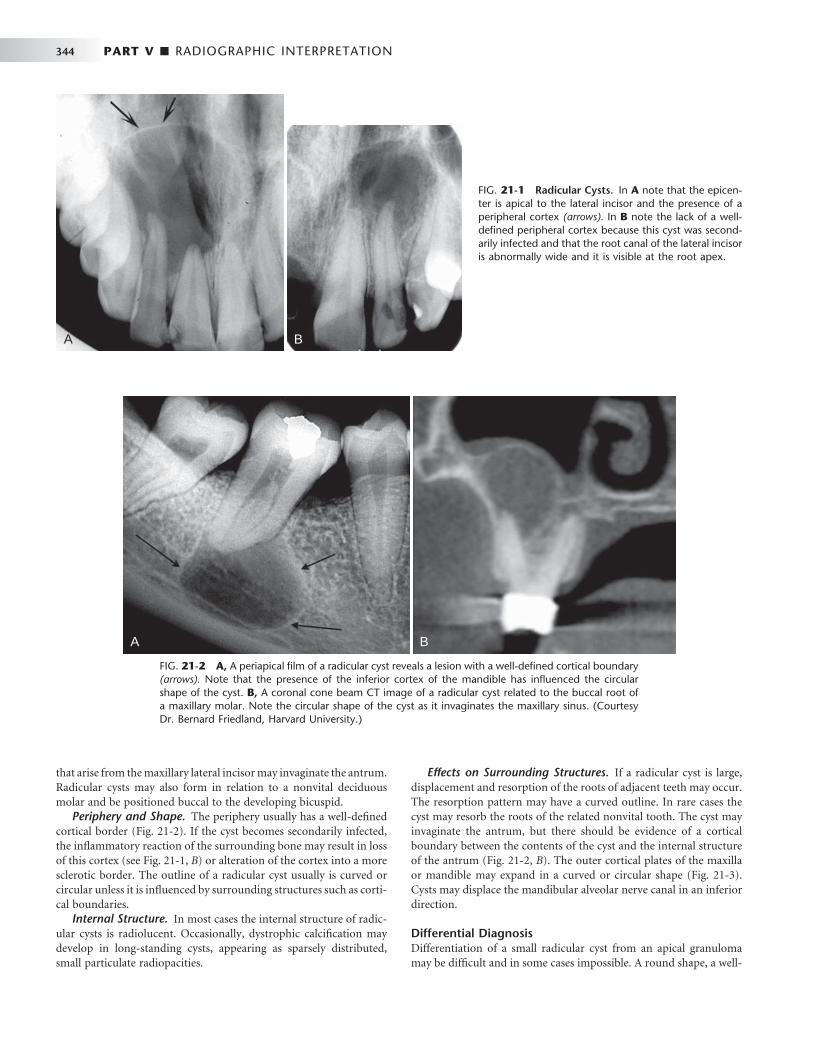
344 PART V ■ RADIOGRAPHIC INTERPRETATION
FIG. 21-1 Radicular Cysts. In A note that the epicen-ter is apical to the lateral incisor and the presence of a peripheral cortex (arrows). In B note the lack of a well-defi ned peripheral cortex because this cyst was second-arily infected and that the root canal of the lateral incisor is abnormally wide and it is visible at the root apex.
A B
FIG. 21-2 A, A periapical fi lm of a radicular cyst reveals a lesion with a well-defi ned cortical boundary (arrows). Note that the presence of the inferior cortex of the mandible has infl uenced the circular shape of the cyst. B, A coronal cone beam CT image of a radicular cyst related to the buccal root of a maxillary molar. Note the circular shape of the cyst as it invaginates the maxillary sinus. (Courtesy Dr. Bernard Friedland, Harvard University.)
A B
that arise from the maxillary lateral incisor may invaginate the antrum. Radicular cysts may also form in relation to a nonvital deciduous molar and be positioned buccal to the developing bicuspid.
Periphery and Shape. The periphery usually has a well-defi ned cortical border ( Fig. 21-2 ). If the cyst becomes secondarily infected, the infl ammatory reaction of the surrounding bone may result in loss of this cortex (see Fig. 21-1, B ) or alteration of the cortex into a more sclerotic border. The outline of a radicular cyst usually is curved or circular unless it is infl uenced by surrounding structures such as corti-cal boundaries.
Internal Structure. In most cases the internal structure of radic-ular cysts is radiolucent. Occasionally, dystrophic calcifi cation may develop in long-standing cysts, appearing as sparsely distributed, small particulate radiopacities.
Effects on Surrounding Structures. If a radicular cyst is large, displacement and resorption of the roots of adjacent teeth may occur. The resorption pattern may have a curved outline. In rare cases the cyst may resorb the roots of the related nonvital tooth. The cyst may invaginate the antrum, but there should be evidence of a cortical boundary between the contents of the cyst and the internal structure of the antrum ( Fig. 21-2, B ). The outer cortical plates of the maxilla or mandible may expand in a curved or circular shape ( Fig. 21-3 ). Cysts may displace the mandibular alveolar nerve canal in an inferior direction.
Differential Diagnosis Differentiation of a small radicular cyst from an apical granuloma may be diffi cult and in some cases impossible. A round shape, a well-
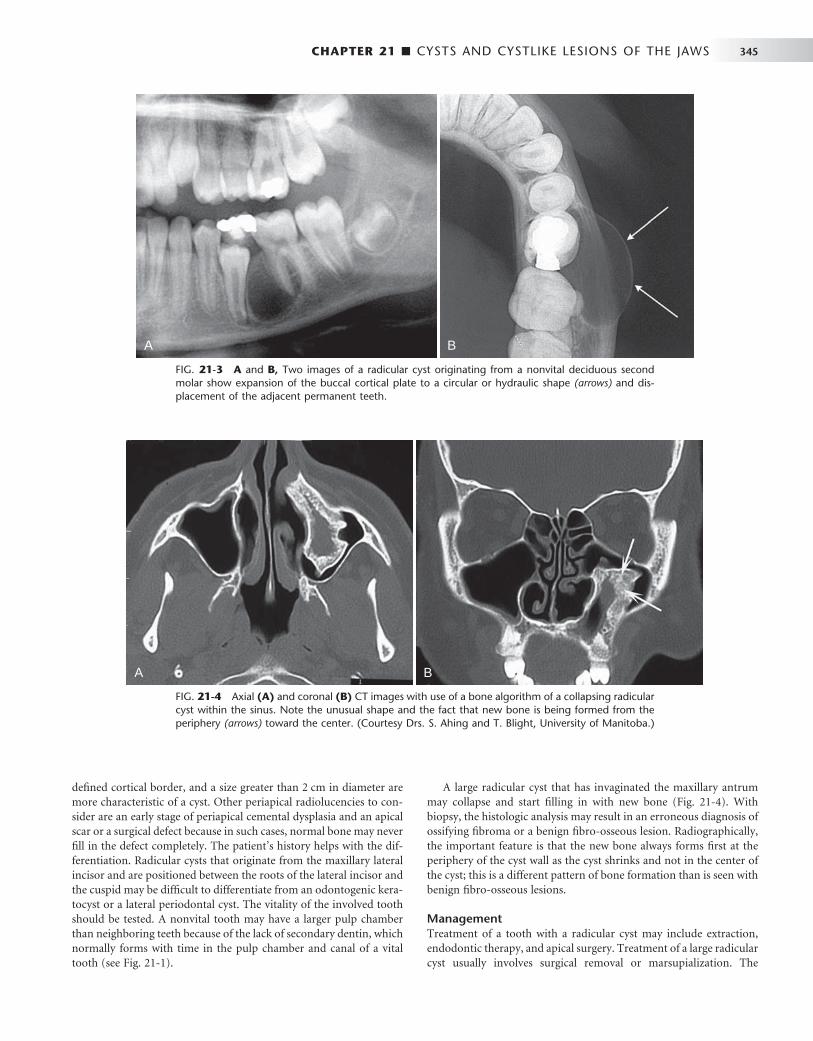
CHAPTER 21 ■ CYSTS AND CYSTLIKE LESIONS OF THE JAWS 345
defi ned cortical border, and a size greater than 2 cm in diameter are more characteristic of a cyst. Other periapical radiolucencies to con-sider are an early stage of periapical cemental dysplasia and an apical scar or a surgical defect because in such cases, normal bone may never fi ll in the defect completely. The patient ’ s history helps with the dif-ferentiation. Radicular cysts that originate from the maxillary lateral incisor and are positioned between the roots of the lateral incisor and the cuspid may be diffi cult to differentiate from an odontogenic kera-tocyst or a lateral periodontal cyst. The vitality of the involved tooth should be tested. A nonvital tooth may have a larger pulp chamber than neighboring teeth because of the lack of secondary dentin, which normally forms with time in the pulp chamber and canal of a vital tooth (see Fig. 21-1 ).
A large radicular cyst that has invaginated the maxillary antrum may collapse and start fi lling in with new bone ( Fig. 21-4 ). With biopsy, the histologic analysis may result in an erroneous diagnosis of ossifying fi broma or a benign fi bro-osseous lesion. Radiographically, the important feature is that the new bone always forms fi rst at the periphery of the cyst wall as the cyst shrinks and not in the center of the cyst; this is a different pattern of bone formation than is seen with benign fi bro-osseous lesions.
Management Treatment of a tooth with a radicular cyst may include extraction, endodontic therapy, and apical surgery. Treatment of a large radicular cyst usually involves surgical removal or marsupialization. The
FIG. 21-3 A and B, Two images of a radicular cyst originating from a nonvital deciduous second molar show expansion of the buccal cortical plate to a circular or hydraulic shape (arrows) and dis-placement of the adjacent permanent teeth.
A B
FIG. 21-4 Axial (A) and coronal (B) CT images with use of a bone algorithm of a collapsing radicular cyst within the sinus. Note the unusual shape and the fact that new bone is being formed from the periphery (arrows) toward the center. (Courtesy Drs. S. Ahing and T. Blight, University of Manitoba.)
A B
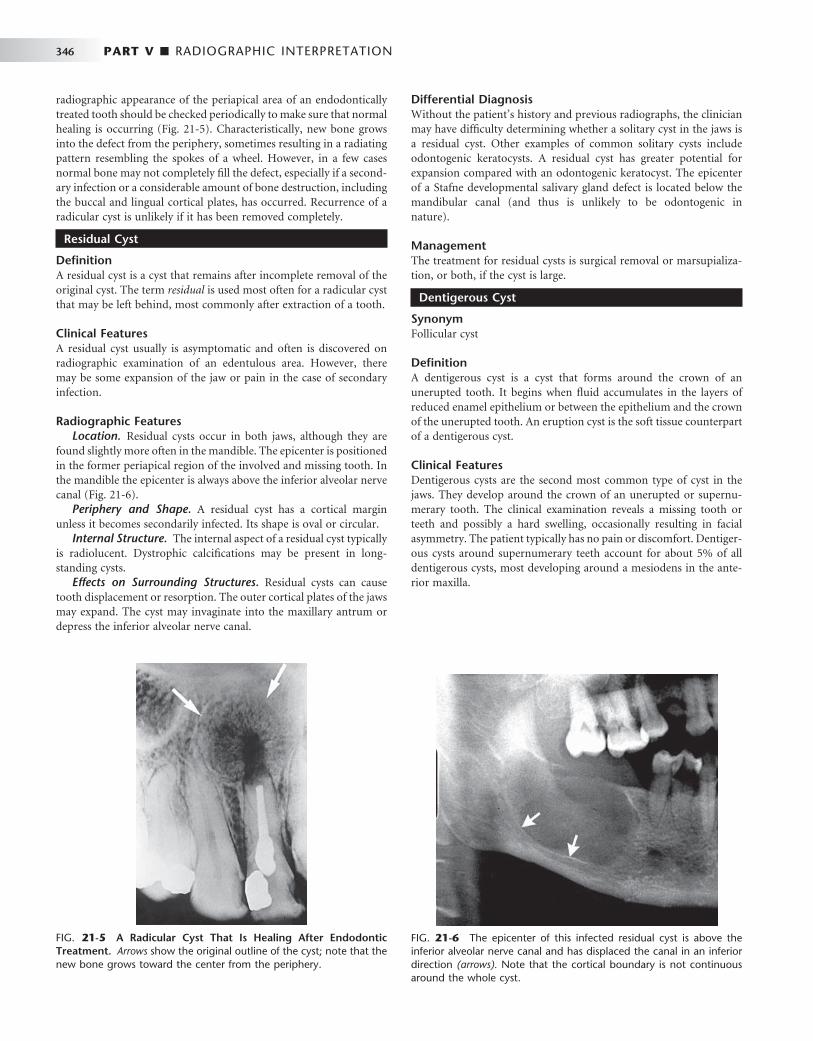
346 PART V ■ RADIOGRAPHIC INTERPRETATION
radiographic appearance of the periapical area of an endodontically treated tooth should be checked periodically to make sure that normal healing is occurring ( Fig. 21-5 ). Characteristically, new bone grows into the defect from the periphery, sometimes resulting in a radiating pattern resembling the spokes of a wheel. However, in a few cases normal bone may not completely fi ll the defect, especially if a second-ary infection or a considerable amount of bone destruction, including the buccal and lingual cortical plates, has occurred. Recurrence of a radicular cyst is unlikely if it has been removed completely.
Residual Cyst
Defi nition A residual cyst is a cyst that remains after incomplete removal of the original cyst. The term residual is used most often for a radicular cyst that may be left behind, most commonly after extraction of a tooth.
Clinical Features A residual cyst usually is asymptomatic and often is discovered on radiographic examination of an edentulous area. However, there may be some expansion of the jaw or pain in the case of secondary infection.
Radiographic Features Location. Residual cysts occur in both jaws, although they are
found slightly more often in the mandible. The epicenter is positioned in the former periapical region of the involved and missing tooth. In the mandible the epicenter is always above the inferior alveolar nerve canal ( Fig. 21-6 ).
Periphery and Shape. A residual cyst has a cortical margin unless it becomes secondarily infected. Its shape is oval or circular.
Internal Structure. The internal aspect of a residual cyst typically is radiolucent. Dystrophic calcifi cations may be present in long-standing cysts.
Effects on Surrounding Structures. Residual cysts can cause tooth displacement or resorption. The outer cortical plates of the jaws may expand. The cyst may invaginate into the maxillary antrum or depress the inferior alveolar nerve canal.
Differential Diagnosis Without the patient ’ s history and previous radiographs, the clinician may have diffi culty determining whether a solitary cyst in the jaws is a residual cyst. Other examples of common solitary cysts include odontogenic keratocysts. A residual cyst has greater potential for expansion compared with an odontogenic keratocyst. The epicenter of a Stafne developmental salivary gland defect is located below the mandibular canal (and thus is unlikely to be odontogenic in nature).
Management The treatment for residual cysts is surgical removal or marsupializa-tion, or both, if the cyst is large.
Dentigerous Cyst
Synonym Follicular cyst
Defi nition A dentigerous cyst is a cyst that forms around the crown of an unerupted tooth. It begins when fl uid accumulates in the layers of reduced enamel epithelium or between the epithelium and the crown of the unerupted tooth. An eruption cyst is the soft tissue counterpart of a dentigerous cyst.
Clinical Features Dentigerous cysts are the second most common type of cyst in the jaws. They develop around the crown of an unerupted or supernu-merary tooth. The clinical examination reveals a missing tooth or teeth and possibly a hard swelling, occasionally resulting in facial asymmetry. The patient typically has no pain or discomfort. Dentiger-ous cysts around supernumerary teeth account for about 5% of all dentigerous cysts, most developing around a mesiodens in the ante-rior maxilla.
FIG. 21-5 A Radicular Cyst That Is Healing After Endodontic Treatment. Arrows show the original outline of the cyst; note that the new bone grows toward the center from the periphery.
FIG. 21-6 The epicenter of this infected residual cyst is above the inferior alveolar nerve canal and has displaced the canal in an inferior direction (arrows). Note that the cortical boundary is not continuous around the whole cyst.
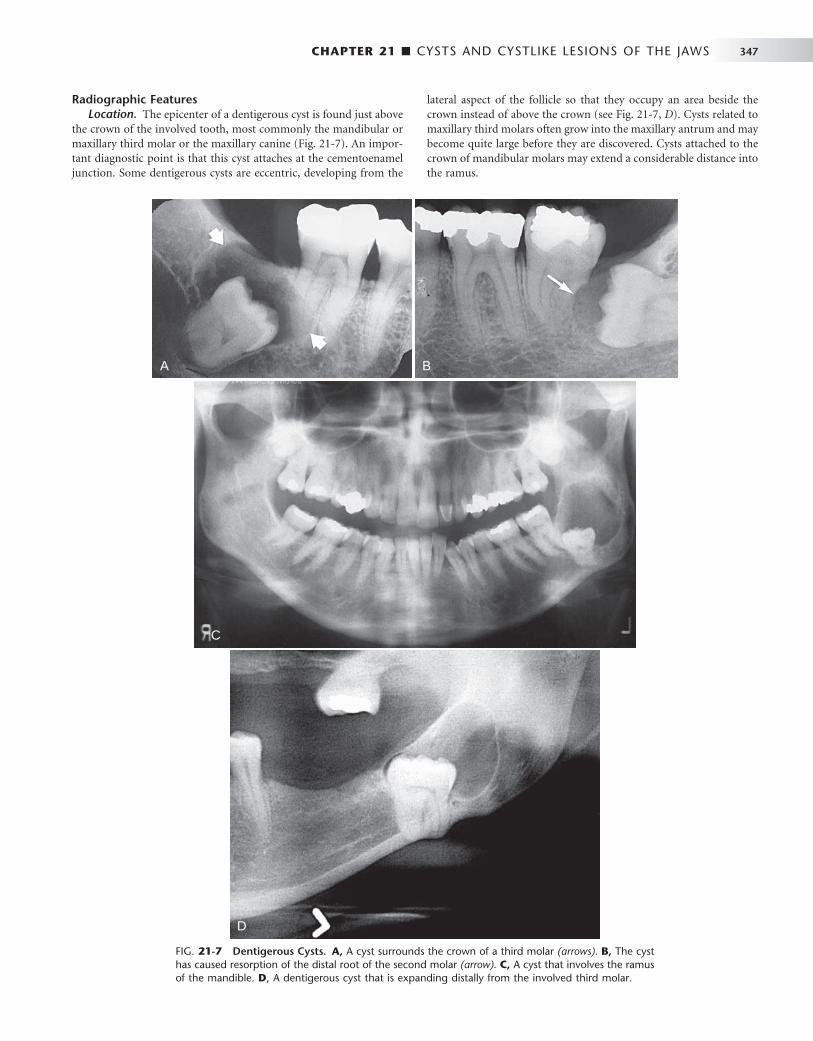
CHAPTER 21 ■ CYSTS AND CYSTLIKE LESIONS OF THE JAWS 347
Radiographic Features Location. The epicenter of a dentigerous cyst is found just above
the crown of the involved tooth, most commonly the mandibular or maxillary third molar or the maxillary canine ( Fig. 21-7 ). An impor-tant diagnostic point is that this cyst attaches at the cementoenamel junction. Some dentigerous cysts are eccentric, developing from the
lateral aspect of the follicle so that they occupy an area beside the crown instead of above the crown (see Fig. 21-7, D ). Cysts related to maxillary third molars often grow into the maxillary antrum and may become quite large before they are discovered. Cysts attached to the crown of mandibular molars may extend a considerable distance into the ramus.
FIG. 21-7 Dentigerous Cysts. A, A cyst surrounds the crown of a third molar (arrows). B, The cyst has caused resorption of the distal root of the second molar (arrow). C, A cyst that involves the ramus of the mandible. D , A dentigerous cyst that is expanding distally from the involved third molar.
A
C
D
B
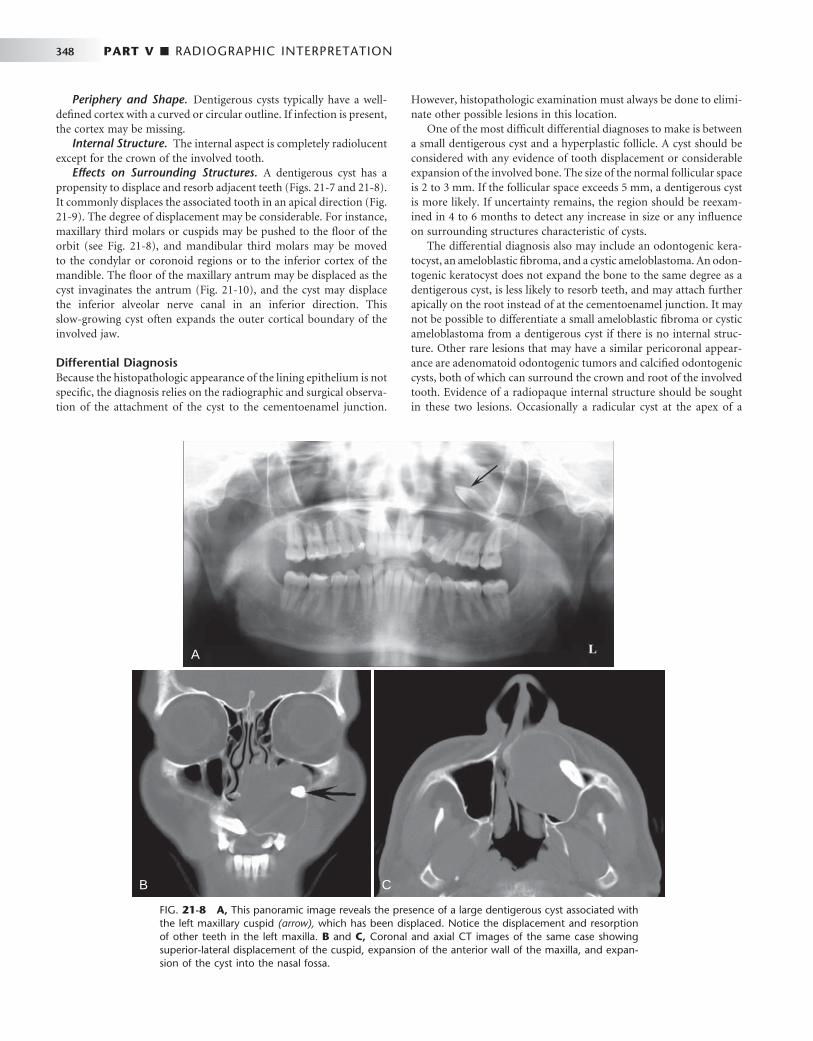
348 PART V ■ RADIOGRAPHIC INTERPRETATION
Periphery and Shape. Dentigerous cysts typically have a well-defi ned cortex with a curved or circular outline. If infection is present, the cortex may be missing.
Internal Structure. The internal aspect is completely radiolucent except for the crown of the involved tooth.
Effects on Surrounding Structures. A dentigerous cyst has a propensity to displace and resorb adjacent teeth ( Figs. 21-7 and 21-8 ). It commonly displaces the associated tooth in an apical direction ( Fig. 21-9 ). The degree of displacement may be considerable. For instance, maxillary third molars or cuspids may be pushed to the fl oor of the orbit (see Fig. 21-8 ), and mandibular third molars may be moved to the condylar or coronoid regions or to the inferior cortex of the mandible. The fl oor of the maxillary antrum may be displaced as the cyst invaginates the antrum ( Fig. 21-10 ), and the cyst may displace the inferior alveolar nerve canal in an inferior direction. This slow-growing cyst often expands the outer cortical boundary of the involved jaw.
Differential Diagnosis Because the histopathologic appearance of the lining epithelium is not specifi c, the diagnosis relies on the radiographic and surgical observa-tion of the attachment of the cyst to the cementoenamel junction.
However, histopathologic examination must always be done to elimi-nate other possible lesions in this location.
One of the most diffi cult differential diagnoses to make is between a small dentigerous cyst and a hyperplastic follicle. A cyst should be considered with any evidence of tooth displacement or considerable expansion of the involved bone. The size of the normal follicular space is 2 to 3 mm. If the follicular space exceeds 5 mm, a dentigerous cyst is more likely. If uncertainty remains, the region should be reexam-ined in 4 to 6 months to detect any increase in size or any infl uence on surrounding structures characteristic of cysts.
The differential diagnosis also may include an odontogenic kera-tocyst, an ameloblastic fi broma, and a cystic ameloblastoma. An odon-togenic keratocyst does not expand the bone to the same degree as a dentigerous cyst, is less likely to resorb teeth, and may attach further apically on the root instead of at the cementoenamel junction. It may not be possible to differentiate a small ameloblastic fi broma or cystic ameloblastoma from a dentigerous cyst if there is no internal struc-ture. Other rare lesions that may have a similar pericoronal appear-ance are adenomatoid odontogenic tumors and calcifi ed odontogenic cysts, both of which can surround the crown and root of the involved tooth. Evidence of a radiopaque internal structure should be sought in these two lesions. Occasionally a radicular cyst at the apex of a
FIG. 21-8 A, This panoramic image reveals the presence of a large dentigerous cyst associated with the left maxillary cuspid (arrow), which has been displaced. Notice the displacement and resorption of other teeth in the left maxilla. B and C, Coronal and axial CT images of the same case showing superior-lateral displacement of the cuspid, expansion of the anterior wall of the maxilla, and expan-sion of the cyst into the nasal fossa.
A
B C

CHAPTER 21 ■ CYSTS AND CYSTLIKE LESIONS OF THE JAWS 349
FIG. 21-9 A and B, These panoramic fi lms of the same case taken several years apart demonstrate superior-posterior displacement of a maxillary third molar by a dentigerous cyst.
A B
FIG. 21-10 Dentigerous cysts displacing teeth. A, The third molar has been displaced to the inferior cortex. B, The developing second molar has been displaced into the ramus by a cyst associated with the fi rst molar. Axial (C) and coronal (D) CT images with bone algorithm reveal a maxillary third molar displaced into the space occupied by the maxillary antrum; note the presence of a cortex between the cyst and the antrum.
A B
C D

350 PART V ■ RADIOGRAPHIC INTERPRETATION
primary tooth surrounds the crown of the developing permanent tooth positioned apical to it, giving the false impression of a dentiger-ous cyst associated with the permanent tooth. This occurs most often with the mandibular deciduous molars and the developing bicuspids. In these cases the clinician should look for extensive caries or large restorations in a primary tooth that would indicate a radicular cyst.
Management Dentigerous cysts are treated by surgical removal, which may include the tooth as well. Large cysts may be treated by marsupialization before removal. The cyst lining should be submitted for histologic examination because ameloblastomas have been reported to occur in the cyst lining. In addition, squamous cell carcinoma has been reported to arise from the cyst lining of chronically infected cysts. Mucoepider-moid carcinoma also has been reported.
Buccal Bifurcation Cyst
Synonyms Mandibular infected buccal cyst, paradental cyst, and infl ammatory paradental cyst
Defi nition The source of epithelium probably is the epithelial cell rests in the periodontal membrane of the buccal bifurcation of mandibular molars. The histopathologic characteristics of the lining are not dis-tinctive. The etiology of proliferation is unknown; one theory holds that infl ammation is the stimulus, but infl ammation is not always
present. The World Health Organization includes these cysts under infl ammatory cysts.
It is possible that the paradental cyst of the third molar and the buccal bifurcation cyst (BBC) (associated with fi rst and second molars) are the same entity. The BBC is certainly a distinct clinical entity. An associated enamel extension into the furcation region of third molars with paradental cysts has not been documented with molars involved in a BBC. Also, the infl ammatory component associ-ated with paradental cysts is not always present with BBCs.
Clinical Features A common sign is the lack of or a delay in eruption of a mandibular fi rst or second molar. On clinical examination the molar may be missing or the lingual cusp tips may be abnormally protruding through the mucosa, higher than the position of the buccal cusps. The fi rst molar is involved more frequently than is the second molar. The teeth are always vital. A hard swelling may occur buccal to the involved molar, and if it is secondarily infected, the patient has pain. The age of detection is younger, within the fi rst two decades for a BBC rather than the third decade with a paradental cyst of the third molar.
Radiographic Features Location. The mandibular fi rst molar is the most common loca-
tion of a BBC, followed by the second molar. The cyst occasionally is bilateral. It is always located in the buccal furcation of the affected molar ( Fig. 21-11 ). On periapical and panoramic fi lms the lesion may
FIG. 21-11 Bilateral Buccal Bifur-cation Cysts. A, A panoramic image showing cysts related to the mandibular fi rst molars. The occlusal surface of each tooth has been tipped in relation to the other teeth and adjacent teeth have been displaced. B and C, Occlusal fi lms of the same case. Note the smooth curved expansion of the buccal cortex and the displacement of the roots of the fi rst molars into the lingual cortical plate (arrows).
A
B C
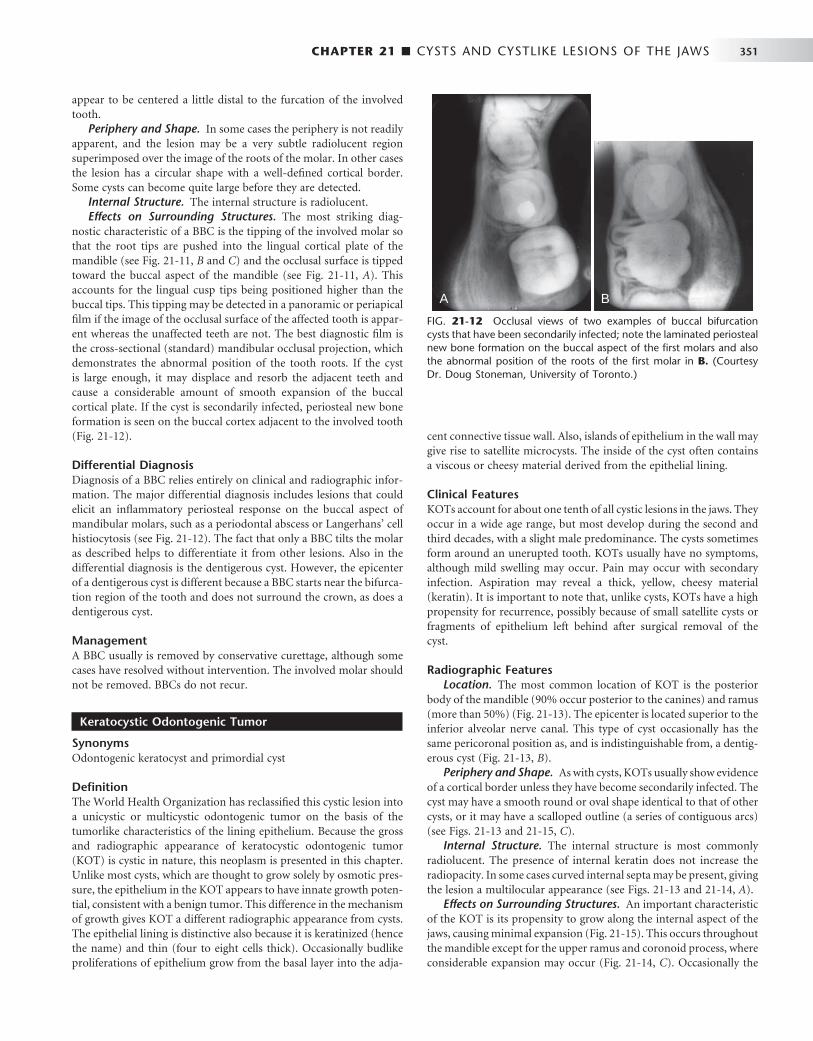
CHAPTER 21 ■ CYSTS AND CYSTLIKE LESIONS OF THE JAWS 351
appear to be centered a little distal to the furcation of the involved tooth.
Periphery and Shape. In some cases the periphery is not readily apparent, and the lesion may be a very subtle radiolucent region superimposed over the image of the roots of the molar. In other cases the lesion has a circular shape with a well-defi ned cortical border. Some cysts can become quite large before they are detected.
Internal Structure. The internal structure is radiolucent. Effects on Surrounding Structures. The most striking diag-
nostic characteristic of a BBC is the tipping of the involved molar so that the root tips are pushed into the lingual cortical plate of the mandible (see Fig. 21-11, B and C ) and the occlusal surface is tipped toward the buccal aspect of the mandible (see Fig. 21-11, A ). This accounts for the lingual cusp tips being positioned higher than the buccal tips. This tipping may be detected in a panoramic or periapical fi lm if the image of the occlusal surface of the affected tooth is appar-ent whereas the unaffected teeth are not. The best diagnostic fi lm is the cross-sectional (standard) mandibular occlusal projection, which demonstrates the abnormal position of the tooth roots. If the cyst is large enough, it may displace and resorb the adjacent teeth and cause a considerable amount of smooth expansion of the buccal cortical plate. If the cyst is secondarily infected, periosteal new bone formation is seen on the buccal cortex adjacent to the involved tooth ( Fig. 21-12 ).
Differential Diagnosis Diagnosis of a BBC relies entirely on clinical and radiographic infor-mation. The major differential diagnosis includes lesions that could elicit an infl ammatory periosteal response on the buccal aspect of mandibular molars, such as a periodontal abscess or Langerhans ’ cell histiocytosis (see Fig. 21-12 ). The fact that only a BBC tilts the molar as described helps to differentiate it from other lesions. Also in the differential diagnosis is the dentigerous cyst. However, the epicenter of a dentigerous cyst is different because a BBC starts near the bifurca-tion region of the tooth and does not surround the crown, as does a dentigerous cyst.
Management A BBC usually is removed by conservative curettage, although some cases have resolved without intervention. The involved molar should not be removed. BBCs do not recur.
Keratocystic Odontogenic Tumor
Synonyms Odontogenic keratocyst and primordial cyst
Defi nition The World Health Organization has reclassifi ed this cystic lesion into a unicystic or multicystic odontogenic tumor on the basis of the tumorlike characteristics of the lining epithelium. Because the gross and radiographic appearance of keratocystic odontogenic tumor (KOT) is cystic in nature, this neoplasm is presented in this chapter. Unlike most cysts, which are thought to grow solely by osmotic pres-sure, the epithelium in the KOT appears to have innate growth poten-tial, consistent with a benign tumor. This difference in the mechanism of growth gives KOT a different radiographic appearance from cysts. The epithelial lining is distinctive also because it is keratinized (hence the name) and thin (four to eight cells thick). Occasionally budlike proliferations of epithelium grow from the basal layer into the adja-
cent connective tissue wall. Also, islands of epithelium in the wall may give rise to satellite microcysts. The inside of the cyst often contains a viscous or cheesy material derived from the epithelial lining.
Clinical Features KOTs account for about one tenth of all cystic lesions in the jaws. They occur in a wide age range, but most develop during the second and third decades, with a slight male predominance. The cysts sometimes form around an unerupted tooth. KOTs usually have no symptoms, although mild swelling may occur. Pain may occur with secondary infection. Aspiration may reveal a thick, yellow, cheesy material (keratin). It is important to note that, unlike cysts, KOTs have a high propensity for recurrence, possibly because of small satellite cysts or fragments of epithelium left behind after surgical removal of the cyst.
Radiographic Features Location. The most common location of KOT is the posterior
body of the mandible (90% occur posterior to the canines) and ramus (more than 50%) ( Fig. 21-13 ). The epicenter is located superior to the inferior alveolar nerve canal. This type of cyst occasionally has the same pericoronal position as, and is indistinguishable from, a dentig-erous cyst ( Fig. 21-13, B ).
Periphery and Shape. As with cysts, KOTs usually show evidence of a cortical border unless they have become secondarily infected. The cyst may have a smooth round or oval shape identical to that of other cysts, or it may have a scalloped outline (a series of contiguous arcs) (see Figs. 21-13 and 21-15, C ).
Internal Structure. The internal structure is most commonly radiolucent. The presence of internal keratin does not increase the radiopacity. In some cases curved internal septa may be present, giving the lesion a multilocular appearance (see Figs. 21-13 and 21-14, A ).
Effects on Surrounding Structures. An important characteristic of the KOT is its propensity to grow along the internal aspect of the jaws, causing minimal expansion ( Fig. 21-15 ). This occurs throughout the mandible except for the upper ramus and coronoid process, where considerable expansion may occur ( Fig. 21-14, C ). Occasionally the
FIG. 21-12 Occlusal views of two examples of buccal bifurcation cysts that have been secondarily infected; note the laminated periosteal new bone formation on the buccal aspect of the fi rst molars and also the abnormal position of the roots of the fi rst molar in B. (Courtesy Dr. Doug Stoneman, University of Toronto.)
A B
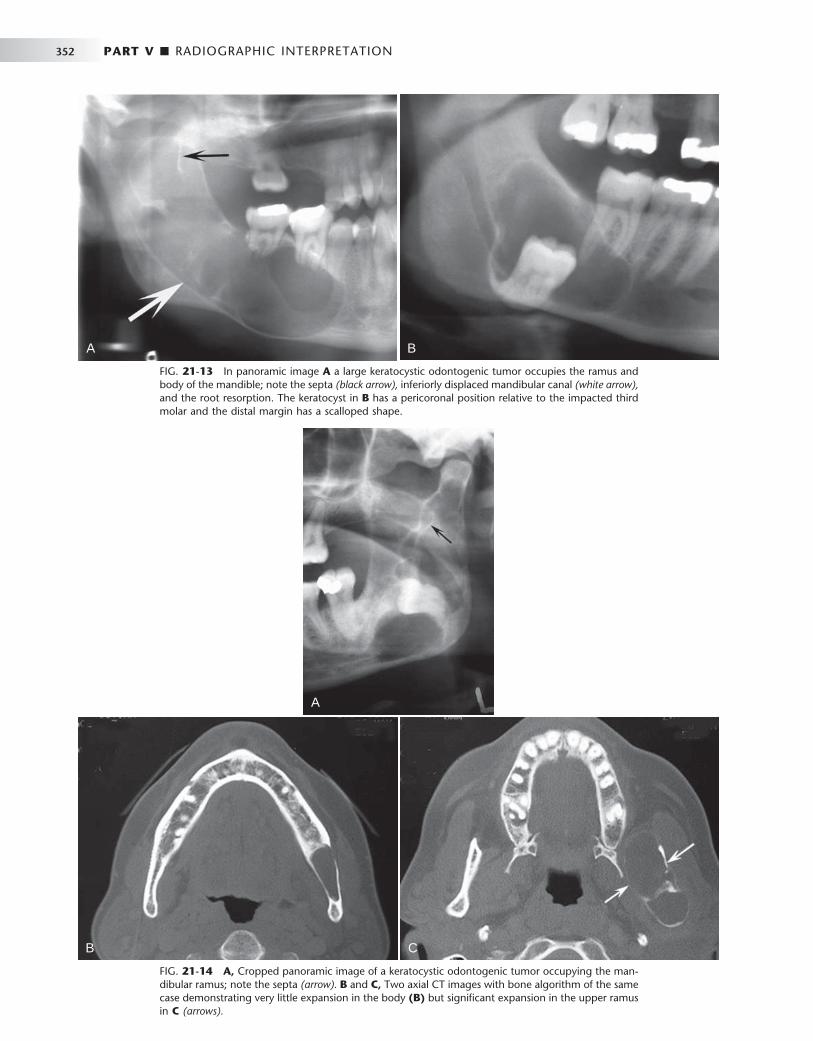
352 PART V ■ RADIOGRAPHIC INTERPRETATION
FIG. 21-13 In panoramic image A a large keratocystic odontogenic tumor occupies the ramus and body of the mandible; note the septa (black arrow), inferiorly displaced mandibular canal (white arrow), and the root resorption. The keratocyst in B has a pericoronal position relative to the impacted third molar and the distal margin has a scalloped shape.
A B
FIG. 21-14 A, Cropped panoramic image of a keratocystic odontogenic tumor occupying the man-dibular ramus; note the septa (arrow). B and C, Two axial CT images with bone algorithm of the same case demonstrating very little expansion in the body (B) but signifi cant expansion in the upper ramus in C (arrows).
A
B C
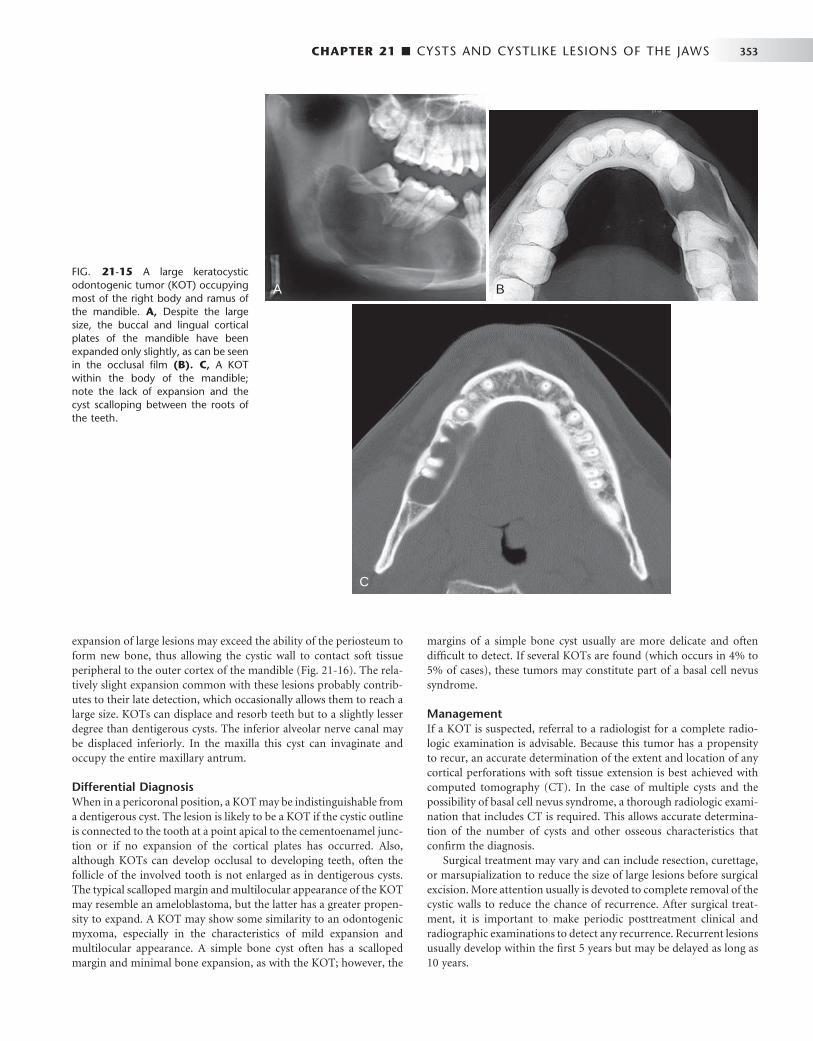
CHAPTER 21 ■ CYSTS AND CYSTLIKE LESIONS OF THE JAWS 353
expansion of large lesions may exceed the ability of the periosteum to form new bone, thus allowing the cystic wall to contact soft tissue peripheral to the outer cortex of the mandible ( Fig. 21-16 ). The rela-tively slight expansion common with these lesions probably contrib-utes to their late detection, which occasionally allows them to reach a large size. KOTs can displace and resorb teeth but to a slightly lesser degree than dentigerous cysts. The inferior alveolar nerve canal may be displaced inferiorly. In the maxilla this cyst can invaginate and occupy the entire maxillary antrum.
Differential Diagnosis When in a pericoronal position, a KOT may be indistinguishable from a dentigerous cyst. The lesion is likely to be a KOT if the cystic outline is connected to the tooth at a point apical to the cementoenamel junc-tion or if no expansion of the cortical plates has occurred. Also, although KOTs can develop occlusal to developing teeth, often the follicle of the involved tooth is not enlarged as in dentigerous cysts. The typical scalloped margin and multilocular appearance of the KOT may resemble an ameloblastoma, but the latter has a greater propen-sity to expand. A KOT may show some similarity to an odontogenic myxoma, especially in the characteristics of mild expansion and multilocular appearance. A simple bone cyst often has a scalloped margin and minimal bone expansion, as with the KOT; however, the
margins of a simple bone cyst usually are more delicate and often diffi cult to detect. If several KOTs are found (which occurs in 4% to 5% of cases), these tumors may constitute part of a basal cell nevus syndrome.
Management If a KOT is suspected, referral to a radiologist for a complete radio-logic examination is advisable. Because this tumor has a propensity to recur, an accurate determination of the extent and location of any cortical perforations with soft tissue extension is best achieved with computed tomography (CT). In the case of multiple cysts and the possibility of basal cell nevus syndrome, a thorough radiologic exami-nation that includes CT is required. This allows accurate determina-tion of the number of cysts and other osseous characteristics that confi rm the diagnosis.
Surgical treatment may vary and can include resection, curettage, or marsupialization to reduce the size of large lesions before surgical excision. More attention usually is devoted to complete removal of the cystic walls to reduce the chance of recurrence. After surgical treat-ment, it is important to make periodic posttreatment clinical and radiographic examinations to detect any recurrence. Recurrent lesions usually develop within the fi rst 5 years but may be delayed as long as 10 years.
FIG. 21-15 A large keratocystic odontogenic tumor (KOT) occupying most of the right body and ramus of the mandible. A, Despite the large size, the buccal and lingual cortical plates of the mandible have been expanded only slightly, as can be seen in the occlusal fi lm (B). C, A KOT within the body of the mandible; note the lack of expansion and the cyst scalloping between the roots of the teeth.
A
C
B

354 PART V ■ RADIOGRAPHIC INTERPRETATION
telorism, and mild prognathism. Calcifi cation of the falx cerebri and other parts of the dura occur early in life.
Radiographic Features Location. The location is the same as that of solitary KOTs,
as described previously. The multiple KOTs may develop bilaterally and can vary in size from 1 mm to several centimeters in diameter ( Fig. 21-17 ).
Other Radiographic Features. The reader should refer to the preceding radiographic description of KOTs. In addition, a radiopaque line of the calcifi ed falx cerebri may be prominent on the postero-anterior skull projection. Occasionally this calcifi cation may appear laminated.
Differential Diagnosis The presence of a cortical boundary and other cystic characteristics differentiate basal cell nevus syndrome from other abnormalities characterized by multiple radiolucencies (e.g., multiple myeloma). Cherubism appears as bilateral multilocular lesions but usually has signifi cant jaw expansion, which is not characteristic of basal cell nevus syndrome. Also, cherubism pushes posterior teeth in an ante-rior direction, a distinctive characteristic. Occasionally patients with multiple dentigerous cysts may show some similarities, but dentiger-ous cysts are more expansile.
Management The KOTs are treated more aggressively than other solitary KOTs because there appears to be an even greater propensity for recurrence.
FIG. 21-16 A, This cropped panoramic image reveals a large keratocystic odontogenic tumor occu-pying most of the ramus; note the scalloping margin (arrows). B, This axial CT with soft tissue window of the same case showing perforation of the medial cortex and contacting the medial pterygoid muscle (arrow).
A B
Basal Cell Nevus Syndrome
Synonyms Nevoid basal cell carcinoma syndrome or Gorlin-Goltz syndrome
Defi nition The term basal cell nevus syndrome comprises a number of abnor-malities such as multiple nevoid basal cell carcinomas of the skin, skeletal abnormalities, central nervous system abnormalities, eye abnormalities, and multiple KOTs. It is inherited as an autosomal dominant trait with variable expressivity.
Clinical Features Basal cell nevus syndrome starts to appear early in life, usually after 5 years of age and before 30 years of age, with the development of KOTs within the jaws and skin basal cell carcinomas. Typically there are multiple KOTs, usually appearing in multiple quadrants and earlier in life than solitary KOTs do. The recurrence rate of KOTs in this syndrome appears to be higher than with the solitary variety. A thorough radiologic examination including CT imaging is required to detect all the jaw lesions. The skin lesions are small, fl attened, fl esh-colored or brown papules that can occur anywhere on the body but are especially prominent on the face, neck, and trunk. Occasionally the basal cell carcinomas will form later in life than the jaw lesions or not at all. Skeletal anomalies include bifi d rib (most common) and other costal abnormalities such as agenesis, deformity, and synostosis of the ribs, kyphoscoliosis, vertebral fusion, polydactyly, shortening of the metacarpals, temporal and temporoparietal bossing, minor hyper-
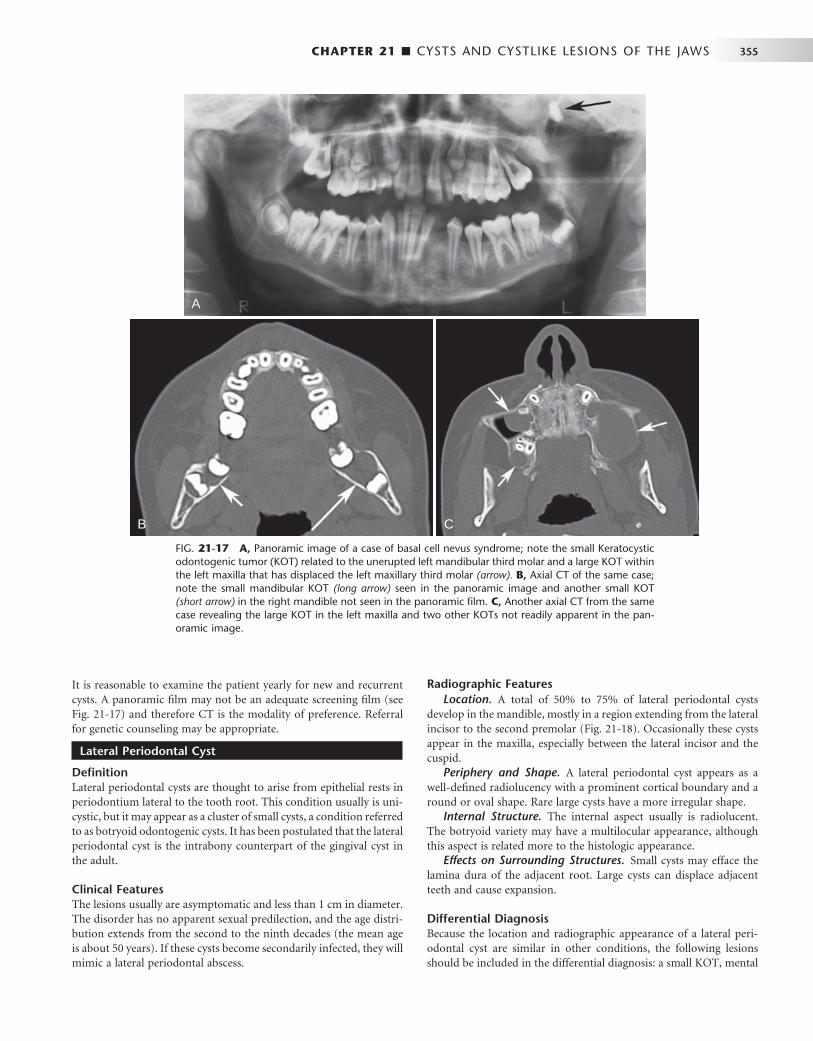
CHAPTER 21 ■ CYSTS AND CYSTLIKE LESIONS OF THE JAWS 355
Radiographic Features Location. A total of 50% to 75% of lateral periodontal cysts
develop in the mandible, mostly in a region extending from the lateral incisor to the second premolar ( Fig. 21-18 ). Occasionally these cysts appear in the maxilla, especially between the lateral incisor and the cuspid.
Periphery and Shape. A lateral periodontal cyst appears as a well-defi ned radiolucency with a prominent cortical boundary and a round or oval shape. Rare large cysts have a more irregular shape.
Internal Structure. The internal aspect usually is radiolucent. The botryoid variety may have a multilocular appearance, although this aspect is related more to the histologic appearance.
Effects on Surrounding Structures. Small cysts may efface the lamina dura of the adjacent root. Large cysts can displace adjacent teeth and cause expansion.
Differential Diagnosis Because the location and radiographic appearance of a lateral peri-odontal cyst are similar in other conditions, the following lesions should be included in the differential diagnosis: a small KOT, mental
FIG. 21-17 A, Panoramic image of a case of basal cell nevus syndrome; note the small Keratocystic odontogenic tumor (KOT) related to the unerupted left mandibular third molar and a large KOT within the left maxilla that has displaced the left maxillary third molar (arrow). B, Axial CT of the same case; note the small mandibular KOT (long arrow) seen in the panoramic image and another small KOT (short arrow) in the right mandible not seen in the panoramic fi lm. C, Another axial CT from the same case revealing the large KOT in the left maxilla and two other KOTs not readily apparent in the pan-oramic image.
A
B C
It is reasonable to examine the patient yearly for new and recurrent cysts. A panoramic fi lm may not be an adequate screening fi lm (see Fig. 21-17 ) and therefore CT is the modality of preference. Referral for genetic counseling may be appropriate.
Lateral Periodontal Cyst
Defi nition Lateral periodontal cysts are thought to arise from epithelial rests in periodontium lateral to the tooth root. This condition usually is uni-cystic, but it may appear as a cluster of small cysts, a condition referred to as botryoid odontogenic cysts. It has been postulated that the lateral periodontal cyst is the intrabony counterpart of the gingival cyst in the adult.
Clinical Features The lesions usually are asymptomatic and less than 1 cm in diameter. The disorder has no apparent sexual predilection, and the age distri-bution extends from the second to the ninth decades (the mean age is about 50 years). If these cysts become secondarily infected, they will mimic a lateral periodontal abscess.

356 PART V ■ RADIOGRAPHIC INTERPRETATION
foramen, small neurofi broma, or a radicular cyst at the foramen of a lateral (accessory) pulp canal. The multiple (botryoid) cysts with a multilocular appearance may resemble a small ameloblastoma.
Management Lateral periodontal cysts usually do not require sophisticated imaging because of their small size. Excisional biopsy or simple enucleation is the treatment of choice because these cysts do not tend to recur.
Glandular Odontogenic Cyst
Synonym Sialo-odontogenic cyst
Defi nition The glandular odontogenic cyst is a rare cyst derived from odonto-genic epithelium with a spectrum of characteristics including salivary gland features such as mucus-producing cells. Some authors hypoth-esize a relationship to a central mucoepidermoid carcinoma.
Clinical Features There is a slight female predominance with a mean age ranging from 46 to 50 years. This cyst has an aggressive behavior and a tendency to recur after surgery.
Radiographic Features Location. This cyst occurs more commonly in the mandible and
most often in the anterior mandible and in the maxilla, commonly the globulomaxillary region.
Periphery and Shape. There is usually a cortical boundary that may be smooth or scalloped.
Internal Structure. This cyst has been reported in both unilocu-lar and multilocular appearances ( Fig. 21-19 ).
Effects on Surrounding Structures. Expansion of the outer cor-tical plates of the jaws with regions of perforation through the cortex has been reported. Displacement of teeth is a common feature.
Differential Diagnosis This cyst can appear identical to an ameloblastoma and in some cases may be similar to a KOT. It is interesting to note that similar multi-
locular appearances have been associated with central mucoepider-moid carcinomas.
Treatment Because of the high rate of recurrence with conservative treatments such as enucleation, more aggressive treatment including resection may be considered. Treated cases should be followed with periodic radiographic examinations to assess for recurrence.
Calcifying Cystic Odontogenic Tumor
Synonyms Calcifying odontogenic cyst, calcifying epithelial odontogenic cyst, or Gorlin cyst
Defi nition The World Health Organization now categorizes this entity as a tumor. Calcifying cystic odontogenic tumors (CCOTs) are uncommon, slow-growing, benign lesions. They occupy a spectrum ranging from a cyst to an odontogenic tumor, with characteristics of a cyst alone or some-times those of a solid neoplasm (epithelial proliferation and a ten-dency to continue growing). This lesion may manufacture calcifi ed tissue identifi ed as dysplastic dentin, and in some instances the lesion is associated with an odontoma. This lesion also sometimes contains a more solid component that gives it an appearance resembling an ameloblastoma, although it does not behave like one.
FIG. 21-18 A lateral periodontal cyst in the mandibular premolar region; note the classic well defi ned cortical border.
FIG. 21-19 A, Cropped panoramic image of a glandular odontogenic cyst with a multilocular appearance very similar to an ameloblastoma. B, Axial CT image detailing the multilocular internal cystic structure.
A
B

CHAPTER 21 ■ CYSTS AND CYSTLIKE LESIONS OF THE JAWS 357
Clinical Features CCOTs have a wide age distribution that peaks at 10 to 19 years of age, with a mean age of 36 years. A second incidence peak occurs during the seventh decade. Clinically, the lesion usually appears as a slow-growing, painless swelling of the jaw. Occasionally the patient complains of pain. In some cases the expanding lesion may destroy the cortical plate, and the cystic mass may become palpable as it extends into the soft tissue. The patient may report a discharge from such advanced lesions. Aspiration often yields a viscous, granular, yellow fl uid.
Radiographic Features Location. At least 75% of CCOTs occur in bone, with a nearly
equal distribution between the jaws. Most (75%) occur anterior to the fi rst molar, especially associated with cuspids and incisors, where the cyst sometimes manifests as a pericoronal radiolucency.
Periphery and Shape. The periphery can vary from well defi ned and corticated with a curved, cystlike shape to ill defi ned and irregular.
Internal Structure. The internal aspect can vary in appearance. It may be completely radiolucent; it may show evidence of small foci of calcifi ed material that appear as white fl ecks or small smooth
pebbles; or it may show even larger, solid, amorphous masses ( Fig. 21-20 ). In rare cases the lesion may appear multilocular.
Effects on Surrounding Structures. Occasionally (20% to 50% of cases) this tumor is associated with a tooth (most commonly a cuspid) and impedes its eruption. Displacement of teeth and resorp-tion of roots may occur. Perforation of the cortical plate may be seen radiographically with enlarging lesions.
Differential Diagnosis When no internal calcifi cations are evident and this lesion has a peri-coronal position, it may be indistinguishable from a dentigerous cyst. Other lesions that have internal calcifi cations to be considered include an adenomatoid odontogenic tumor, ameloblastic fi bro-odontoma, and calcifying epithelial odontogenic tumor. The common location for the CCOT is not common for either the fi bro-odontoma or the calcifying epithelial odontogenic tumor. Finally, long-standing cysts may have dystrophic calcifi cation, giving a similar appearance.
Management This tumor can be treated with enucleation and curettage. Because clinicians generally have little experience with the more solid neoplas-tic variants, it is wise to follow treatment with periodic radiographic evaluations for recurrence.
FIG. 21-20 A and B, Calcifying cystic odonto-genic tumor (CCOT) related to the lateral incisor. Note the well-defi ned corticated border, internal calcifi cations, and resorption of part of the root of the central incisor. C, Axial CT image of a large CCOT invaginating into the maxillary sinus; note the small calcifi cations along the posterior border (arrow).
A
C
B
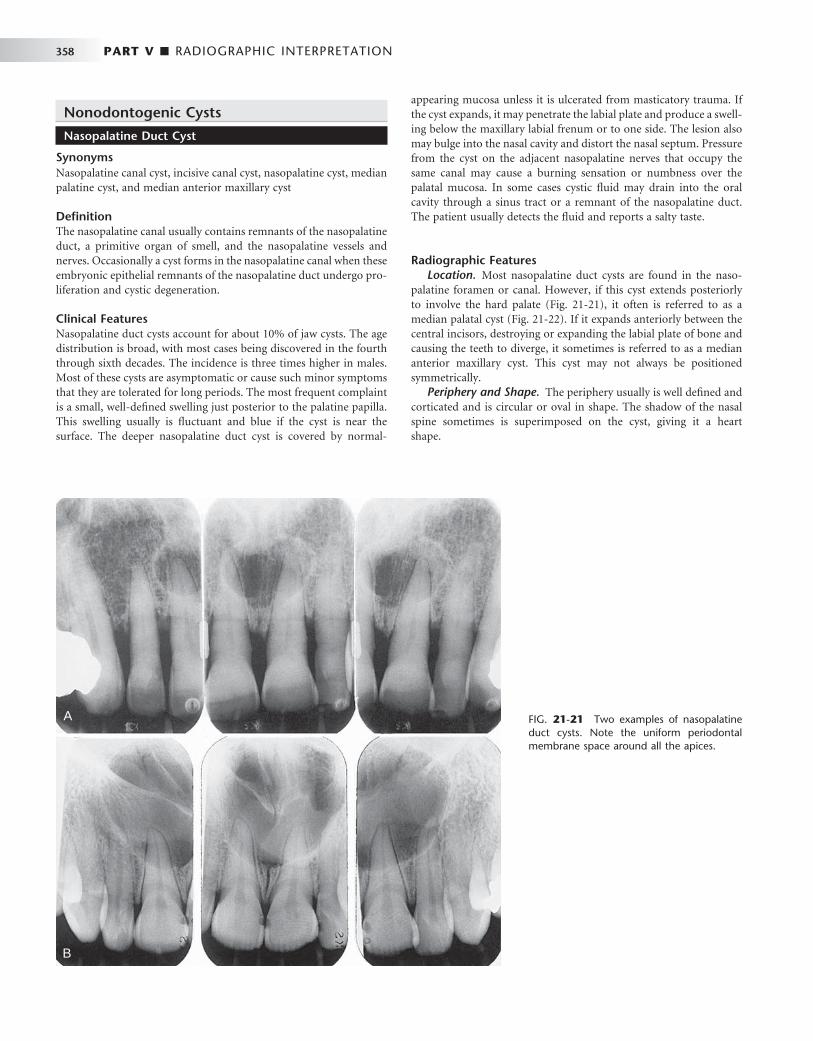
358 PART V ■ RADIOGRAPHIC INTERPRETATION
Nonodontogenic Cysts
Nasopalatine Duct Cyst
Synonyms Nasopalatine canal cyst, incisive canal cyst, nasopalatine cyst, median palatine cyst, and median anterior maxillary cyst
Defi nition The nasopalatine canal usually contains remnants of the nasopalatine duct, a primitive organ of smell, and the nasopalatine vessels and nerves. Occasionally a cyst forms in the nasopalatine canal when these embryonic epithelial remnants of the nasopalatine duct undergo pro-liferation and cystic degeneration.
Clinical Features Nasopalatine duct cysts account for about 10% of jaw cysts. The age distribution is broad, with most cases being discovered in the fourth through sixth decades. The incidence is three times higher in males. Most of these cysts are asymptomatic or cause such minor symptoms that they are tolerated for long periods. The most frequent complaint is a small, well-defi ned swelling just posterior to the palatine papilla. This swelling usually is fl uctuant and blue if the cyst is near the surface. The deeper nasopalatine duct cyst is covered by normal-
appearing mucosa unless it is ulcerated from masticatory trauma. If the cyst expands, it may penetrate the labial plate and produce a swell-ing below the maxillary labial frenum or to one side. The lesion also may bulge into the nasal cavity and distort the nasal septum. Pressure from the cyst on the adjacent nasopalatine nerves that occupy the same canal may cause a burning sensation or numbness over the palatal mucosa. In some cases cystic fl uid may drain into the oral cavity through a sinus tract or a remnant of the nasopalatine duct. The patient usually detects the fl uid and reports a salty taste.
Radiographic Features Location. Most nasopalatine duct cysts are found in the naso-
palatine foramen or canal. However, if this cyst extends posteriorly to involve the hard palate ( Fig. 21-21 ), it often is referred to as a median palatal cyst ( Fig. 21-22 ). If it expands anteriorly between the central incisors, destroying or expanding the labial plate of bone and causing the teeth to diverge, it sometimes is referred to as a median anterior maxillary cyst. This cyst may not always be positioned symmetrically.
Periphery and Shape. The periphery usually is well defi ned and corticated and is circular or oval in shape. The shadow of the nasal spine sometimes is superimposed on the cyst, giving it a heart shape.
FIG. 21-21 Two examples of nasopalatine duct cysts. Note the uniform periodontal membrane space around all the apices.
A
B
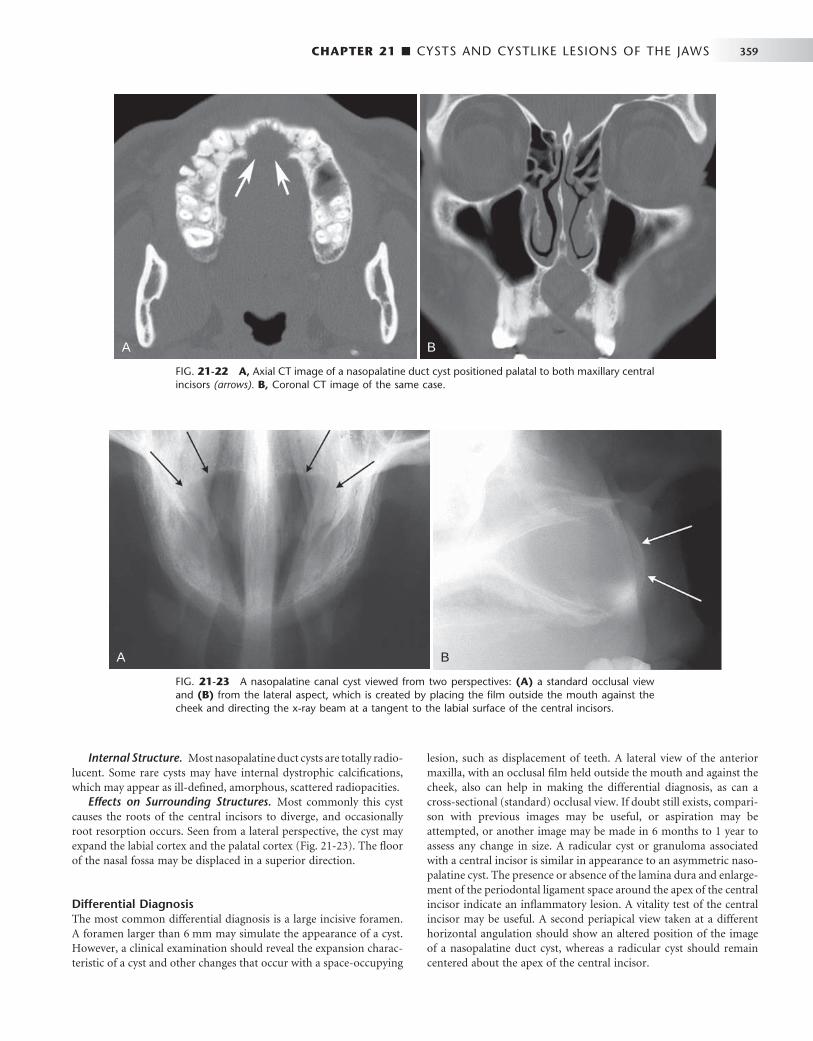
CHAPTER 21 ■ CYSTS AND CYSTLIKE LESIONS OF THE JAWS 359
Internal Structure. Most nasopalatine duct cysts are totally radio-lucent. Some rare cysts may have internal dystrophic calcifi cations, which may appear as ill-defi ned, amorphous, scattered radiopacities.
Effects on Surrounding Structures. Most commonly this cyst causes the roots of the central incisors to diverge, and occasionally root resorption occurs. Seen from a lateral perspective, the cyst may expand the labial cortex and the palatal cortex ( Fig. 21-23 ). The fl oor of the nasal fossa may be displaced in a superior direction.
Differential Diagnosis The most common differential diagnosis is a large incisive foramen. A foramen larger than 6 mm may simulate the appearance of a cyst. However, a clinical examination should reveal the expansion charac-teristic of a cyst and other changes that occur with a space-occupying
lesion, such as displacement of teeth. A lateral view of the anterior maxilla, with an occlusal fi lm held outside the mouth and against the cheek, also can help in making the differential diagnosis, as can a cross-sectional (standard) occlusal view. If doubt still exists, compari-son with previous images may be useful, or aspiration may be attempted, or another image may be made in 6 months to 1 year to assess any change in size. A radicular cyst or granuloma associated with a central incisor is similar in appearance to an asymmetric naso-palatine cyst. The presence or absence of the lamina dura and enlarge-ment of the periodontal ligament space around the apex of the central incisor indicate an infl ammatory lesion. A vitality test of the central incisor may be useful. A second periapical view taken at a different horizontal angulation should show an altered position of the image of a nasopalatine duct cyst, whereas a radicular cyst should remain centered about the apex of the central incisor.
FIG. 21-22 A, Axial CT image of a nasopalatine duct cyst positioned palatal to both maxillary central incisors (arrows). B, Coronal CT image of the same case.
A B
FIG. 21-23 A nasopalatine canal cyst viewed from two perspectives: (A) a standard occlusal view and (B) from the lateral aspect, which is created by placing the fi lm outside the mouth against the cheek and directing the x-ray beam at a tangent to the labial surface of the central incisors.
A B
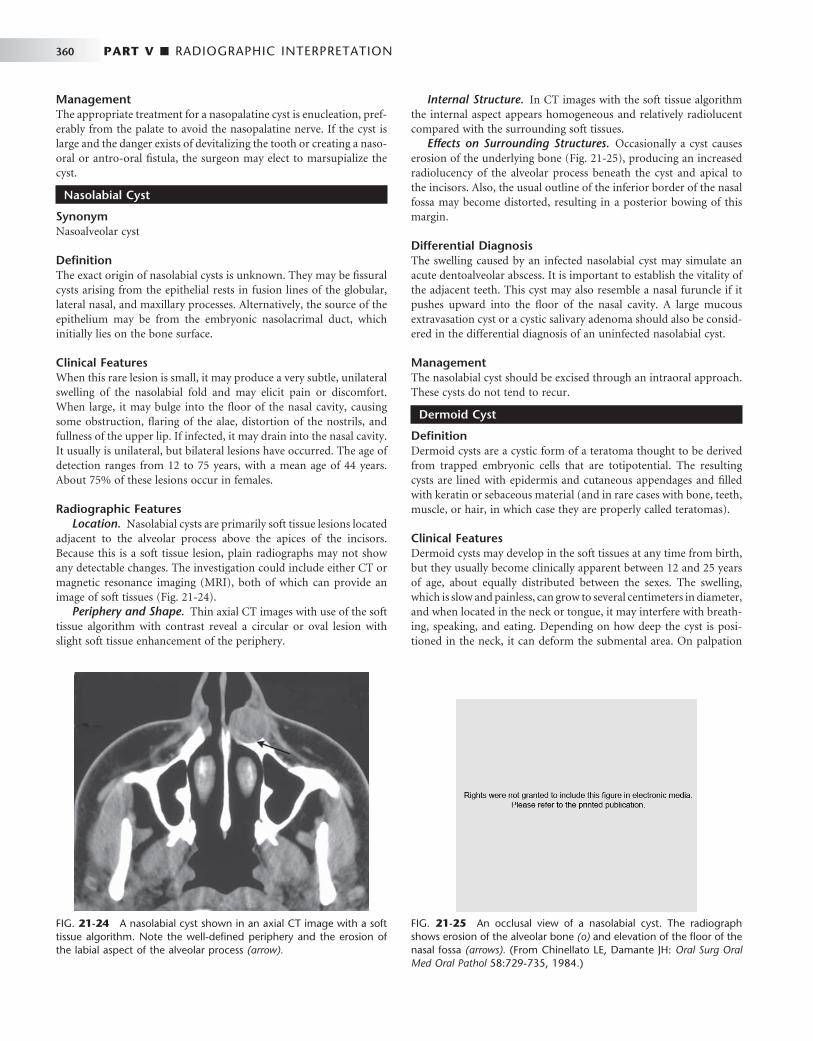
360 PART V ■ RADIOGRAPHIC INTERPRETATION
Management The appropriate treatment for a nasopalatine cyst is enucleation, pref-erably from the palate to avoid the nasopalatine nerve. If the cyst is large and the danger exists of devitalizing the tooth or creating a naso-oral or antro-oral fi stula, the surgeon may elect to marsupialize the cyst.
Nasolabial Cyst
Synonym Nasoalveolar cyst
Defi nition The exact origin of nasolabial cysts is unknown. They may be fi ssural cysts arising from the epithelial rests in fusion lines of the globular, lateral nasal, and maxillary processes. Alternatively, the source of the epithelium may be from the embryonic nasolacrimal duct, which initially lies on the bone surface.
Clinical Features When this rare lesion is small, it may produce a very subtle, unilateral swelling of the nasolabial fold and may elicit pain or discomfort. When large, it may bulge into the fl oor of the nasal cavity, causing some obstruction, fl aring of the alae, distortion of the nostrils, and fullness of the upper lip. If infected, it may drain into the nasal cavity. It usually is unilateral, but bilateral lesions have occurred. The age of detection ranges from 12 to 75 years, with a mean age of 44 years. About 75% of these lesions occur in females.
Radiographic Features Location. Nasolabial cysts are primarily soft tissue lesions located
adjacent to the alveolar process above the apices of the incisors. Because this is a soft tissue lesion, plain radiographs may not show any detectable changes. The investigation could include either CT or magnetic resonance imaging (MRI), both of which can provide an image of soft tissues ( Fig. 21-24 ).
Periphery and Shape. Thin axial CT images with use of the soft tissue algorithm with contrast reveal a circular or oval lesion with slight soft tissue enhancement of the periphery.
Internal Structure. In CT images with the soft tissue algorithm the internal aspect appears homogeneous and relatively radiolucent compared with the surrounding soft tissues.
Effects on Surrounding Structures. Occasionally a cyst causes erosion of the underlying bone ( Fig. 21-25 ), producing an increased radiolucency of the alveolar process beneath the cyst and apical to the incisors. Also, the usual outline of the inferior border of the nasal fossa may become distorted, resulting in a posterior bowing of this margin.
Differential Diagnosis The swelling caused by an infected nasolabial cyst may simulate an acute dentoalveolar abscess. It is important to establish the vitality of the adjacent teeth. This cyst may also resemble a nasal furuncle if it pushes upward into the fl oor of the nasal cavity. A large mucous extravasation cyst or a cystic salivary adenoma should also be consid-ered in the differential diagnosis of an uninfected nasolabial cyst.
Management The nasolabial cyst should be excised through an intraoral approach. These cysts do not tend to recur.
Dermoid Cyst
Defi nition Dermoid cysts are a cystic form of a teratoma thought to be derived from trapped embryonic cells that are totipotential. The resulting cysts are lined with epidermis and cutaneous appendages and fi lled with keratin or sebaceous material (and in rare cases with bone, teeth, muscle, or hair, in which case they are properly called teratomas).
Clinical Features Dermoid cysts may develop in the soft tissues at any time from birth, but they usually become clinically apparent between 12 and 25 years of age, about equally distributed between the sexes. The swelling, which is slow and painless, can grow to several centimeters in diameter, and when located in the neck or tongue, it may interfere with breath-ing, speaking, and eating. Depending on how deep the cyst is posi-tioned in the neck, it can deform the submental area. On palpation
FIG. 21-24 A nasolabial cyst shown in an axial CT image with a soft tissue algorithm. Note the well-defi ned periphery and the erosion of the labial aspect of the alveolar process (arrow).
FIG. 21-25 An occlusal view of a nasolabial cyst. The radiograph shows erosion of the alveolar bone (o) and elevation of the fl oor of the nasal fossa (arrows). (From Chinellato LE, Damante JH: Oral Surg Oral Med Oral Pathol 58:729-735, 1984.)
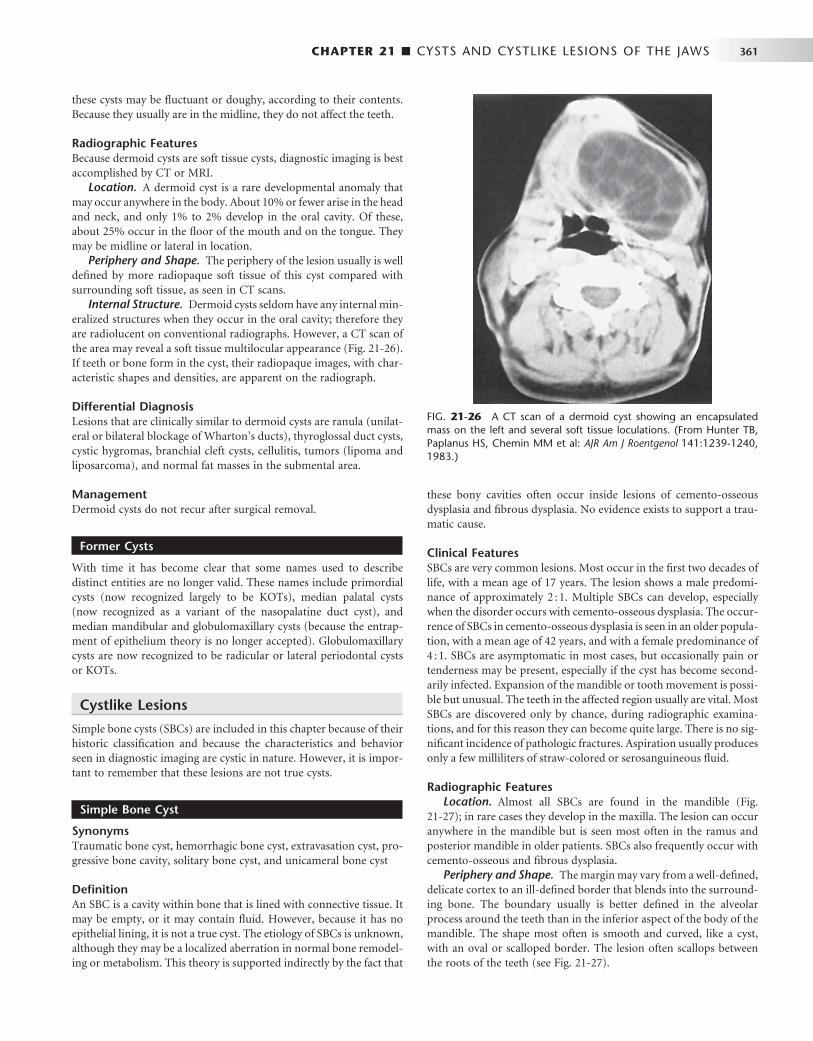
CHAPTER 21 ■ CYSTS AND CYSTLIKE LESIONS OF THE JAWS 361
these cysts may be fl uctuant or doughy, according to their contents. Because they usually are in the midline, they do not affect the teeth.
Radiographic Features Because dermoid cysts are soft tissue cysts, diagnostic imaging is best accomplished by CT or MRI.
Location. A dermoid cyst is a rare developmental anomaly that may occur anywhere in the body. About 10% or fewer arise in the head and neck, and only 1% to 2% develop in the oral cavity. Of these, about 25% occur in the fl oor of the mouth and on the tongue. They may be midline or lateral in location.
Periphery and Shape. The periphery of the lesion usually is well defi ned by more radiopaque soft tissue of this cyst compared with surrounding soft tissue, as seen in CT scans.
Internal Structure. Dermoid cysts seldom have any internal min-eralized structures when they occur in the oral cavity; therefore they are radiolucent on conventional radiographs. However, a CT scan of the area may reveal a soft tissue multilocular appearance ( Fig. 21-26 ). If teeth or bone form in the cyst, their radiopaque images, with char-acteristic shapes and densities, are apparent on the radiograph.
Differential Diagnosis Lesions that are clinically similar to dermoid cysts are ranula (unilat-eral or bilateral blockage of Wharton ’ s ducts), thyroglossal duct cysts, cystic hygromas, branchial cleft cysts, cellulitis, tumors (lipoma and liposarcoma), and normal fat masses in the submental area.
Management Dermoid cysts do not recur after surgical removal.
Former Cysts
With time it has become clear that some names used to describe distinct entities are no longer valid. These names include primordial cysts (now recognized largely to be KOTs), median palatal cysts (now recognized as a variant of the nasopalatine duct cyst), and median mandibular and globulomaxillary cysts (because the entrap-ment of epithelium theory is no longer accepted). Globulomaxillary cysts are now recognized to be radicular or lateral periodontal cysts or KOTs.
Cystlike Lesions
Simple bone cysts (SBCs) are included in this chapter because of their historic classifi cation and because the characteristics and behavior seen in diagnostic imaging are cystic in nature. However, it is impor-tant to remember that these lesions are not true cysts.
Simple Bone Cyst
Synonyms Traumatic bone cyst, hemorrhagic bone cyst, extravasation cyst, pro-gressive bone cavity, solitary bone cyst, and unicameral bone cyst
Defi nition An SBC is a cavity within bone that is lined with connective tissue. It may be empty, or it may contain fl uid. However, because it has no epithelial lining, it is not a true cyst. The etiology of SBCs is unknown, although they may be a localized aberration in normal bone remodel-ing or metabolism. This theory is supported indirectly by the fact that
these bony cavities often occur inside lesions of cemento-osseous dysplasia and fi brous dysplasia. No evidence exists to support a trau-matic cause.
Clinical Features SBCs are very common lesions. Most occur in the fi rst two decades of life, with a mean age of 17 years. The lesion shows a male predomi-nance of approximately 2 : 1. Multiple SBCs can develop, especially when the disorder occurs with cemento-osseous dysplasia. The occur-rence of SBCs in cemento-osseous dysplasia is seen in an older popula-tion, with a mean age of 42 years, and with a female predominance of 4 : 1. SBCs are asymptomatic in most cases, but occasionally pain or tenderness may be present, especially if the cyst has become second-arily infected. Expansion of the mandible or tooth movement is possi-ble but unusual. The teeth in the affected region usually are vital. Most SBCs are discovered only by chance, during radiographic examina-tions, and for this reason they can become quite large. There is no sig-nifi cant incidence of pathologic fractures. Aspiration usually produces only a few milliliters of straw-colored or serosanguineous fl uid.
Radiographic Features Location. Almost all SBCs are found in the mandible ( Fig.
21-27 ); in rare cases they develop in the maxilla. The lesion can occur anywhere in the mandible but is seen most often in the ramus and posterior mandible in older patients. SBCs also frequently occur with cemento-osseous and fi brous dysplasia.
Periphery and Shape. The margin may vary from a well-defi ned, delicate cortex to an ill-defi ned border that blends into the surround-ing bone. The boundary usually is better defi ned in the alveolar process around the teeth than in the inferior aspect of the body of the mandible. The shape most often is smooth and curved, like a cyst, with an oval or scalloped border. The lesion often scallops between the roots of the teeth (see Fig. 21-27 ).
FIG. 21-26 A CT scan of a dermoid cyst showing an encapsulated mass on the left and several soft tissue loculations. (From Hunter TB, Paplanus HS, Chemin MM et al: AJR Am J Roentgenol 141:1239-1240, 1983.)

362 PART V ■ RADIOGRAPHIC INTERPRETATION
Internal Structure. The internal structure is totally radiolucent, but occasionally it may appear multilocular, although the lesion does not contain true septa. This appearance is the result of pronounced scalloping of the endosteal surface of either the buccal or lingual plates ( Fig. 21-28 ). The ridges of bone produced by the scalloping give the appearance of septa on a lateral view of the mandible.
Effects on Surrounding Structures. In most cases these lesions have no effect on the surrounding teeth, although rare cases of tooth displacement and resorption have been documented. Often the lesion involves all the bone around the roots of the teeth but leaves the lamina dura intact or only partly disrupted ( Fig. 21-29 ). Similarly, the sparing of the cortical boundary of the crypt around a developing tooth is characteristic. As previously mentioned, these lesions have a propensity to scallop the endosteal surface of the outer cortex of the mandible. SBCs also have a tendency to grow along the long axis of the bone, causing minimal expansion ( Fig. 21-30 ). However, expan-sion of the involved bone can occur and is more common with larger lesions ( Fig. 21-31 ).
Differential Diagnosis An SBC may have an appearance similar to that of a true cyst, espe-cially a KOT. This is because KOTs tend to grow along bone with very
FIG. 21-27 A panoramic fi lm demonstrating an SBC (A), an occlusal fi lm (B), and a periapical fi lm (C). The occlusal fi lm shows that no expansion has occurred in the buccal or lingual cortical plates. Except for the superior border, the borders are ill defi ned and the lesion has scalloped around the teeth and thinned the inferior border of the mandible, but the lamina dura is still present.
BA C
FIG. 21-28 A, A simple bone cyst has a multilocular appearance in this lateral oblique view of the mandible. B, The periapical view appears to show internal septa (arrows) because of the scalloping of the endosteal surface of the cortical plates, as seen in the inferior cortex (arrows) in A and of the endosteal surface of the buccal cortex in the occlusal view (C).
A B C
FIG. 21-29 A simple bone cyst in which the lamina dura is main-tained on most root surfaces involved with the lesion except for the mesial surface of the distal root tip of the fi rst molar.

CHAPTER 21 ■ CYSTS AND CYSTLIKE LESIONS OF THE JAWS 363
FIG. 21-30 A and B, A simple bone cyst extending from the fi rst bicuspid posteriorly to the base of the ramus and occupying most of the mandible. Considering the extent of the lesion, very little expan-sion of the buccal or lingual cortical plates has occurred, as can be seen in the axial CT image (B) with bone algorithm.
A
B FIG. 21-31 A simple bone cyst (arrow) positioned in the anterior of the mandible. Note that the superior aspect of the peripheral cortex is better defi ned than the inferior border and that evidence exists of some expansion of the mandible ’ s lingual cortex, which in part may due to muscle attachment at the genial tubercles.
FIG. 21-32 An axial CT image with a bone algorithm displaying a small simple bone cyst in the process of healing (arrow). Note the fi ne internal granular bone and very slight expansion of the ramus.
little expansion and often have scalloped borders similar to those of an SBC. However, KOTs usually have a more defi nite cortical bound-ary, resorb and displace teeth, and occur in an older age group. Because the SBC may remove bone around teeth without affecting the teeth, there may be a tendency to include a malignant lesion in the differ-ential diagnosis. However, maintenance of some lamina dura and the lack of an invasive periphery and bone destruction should be enough to remove this category of diseases from consideration.
The diagnosis relies primarily on radiographic and surgical obser-vations because the histopathologic aspects are not characteristic. These lesions occasionally heal spontaneously. A biopsy and analysis of a healing cyst may falsely indicate the presence of an ossifying fi broma or fi brous dysplasia because of the formation of new imma-ture bone ( Fig. 21-32 ).
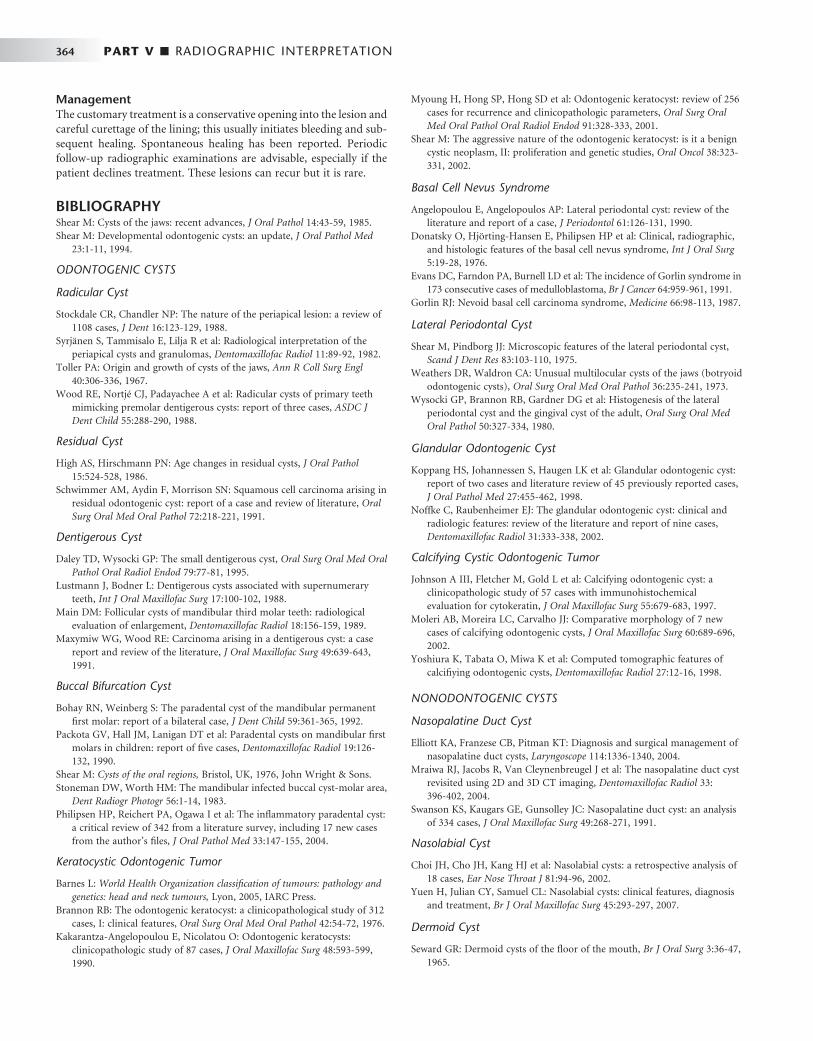
364 PART V ■ RADIOGRAPHIC INTERPRETATION
Management The customary treatment is a conservative opening into the lesion and careful curettage of the lining; this usually initiates bleeding and sub-sequent healing. Spontaneous healing has been reported. Periodic follow-up radiographic examinations are advisable, especially if the patient declines treatment. These lesions can recur but it is rare.
BIBLIOGRAPHY Shear M : Cysts of the jaws: recent advances , J Oral Pathol 14 : 43 - 59 , 1985 . Shear M : Developmental odontogenic cysts: an update , J Oral Pathol Med
23 : 1 - 11 , 1994 .
ODONTOGENIC CYSTS
Radicular Cyst
Stockdale CR , Chandler NP : The nature of the periapical lesion: a review of 1108 cases , J Dent 16 : 123 - 129 , 1988 .
Syrj ä nen S , Tammisalo E , Lilja R et al : Radiological interpretation of the periapical cysts and granulomas , Dentomaxillofac Radiol 11 : 89 - 92 , 1982 .
Toller PA : Origin and growth of cysts of the jaws , Ann R Coll Surg Engl 40 : 306 - 336 , 1967 .
Wood RE , Nortj é CJ , Padayachee A et al : Radicular cysts of primary teeth mimicking premolar dentigerous cysts: report of three cases , ASDC J Dent Child 55 : 288 - 290 , 1988 .
Residual Cyst
High AS , Hirschmann PN : Age changes in residual cysts , J Oral Pathol 15 : 524 - 528 , 1986 .
Schwimmer AM , Aydin F , Morrison SN : Squamous cell carcinoma arising in residual odontogenic cyst: report of a case and review of literature , Oral Surg Oral Med Oral Pathol 72 : 218 - 221 , 1991 .
Dentigerous Cyst
Daley TD , Wysocki GP : The small dentigerous cyst , Oral Surg Oral Med Oral Pathol Oral Radiol Endod 79 : 77 - 81 , 1995 .
Lustmann J , Bodner L : Dentigerous cysts associated with supernumerary teeth , Int J Oral Maxillofac Surg 17 : 100 - 102 , 1988 .
Main DM : Follicular cysts of mandibular third molar teeth: radiological evaluation of enlargement , Dentomaxillofac Radiol 18 : 156 - 159 , 1989 .
Maxymiw WG , Wood RE : Carcinoma arising in a dentigerous cyst: a case report and review of the literature , J Oral Maxillofac Surg 49 : 639 - 643 , 1991 .
Buccal Bifurcation Cyst
Bohay RN , Weinberg S : The paradental cyst of the mandibular permanent fi rst molar: report of a bilateral case , J Dent Child 59 : 361 - 365 , 1992 .
Packota GV , Hall JM , Lanigan DT et al : Paradental cysts on mandibular fi rst molars in children: report of fi ve cases , Dentomaxillofac Radiol 19 : 126 - 132 , 1990 .
Shear M : Cysts of the oral regions , Bristol, UK , 1976 , John Wright & Sons . Stoneman DW , Worth HM : The mandibular infected buccal cyst-molar area ,
Dent Radiogr Photogr 56 : 1 - 14 , 1983 . Philipsen HP , Reichert PA , Ogawa I et al : The infl ammatory paradental cyst:
a critical review of 342 from a literature survey, including 17 new cases from the author ’ s fi les , J Oral Pathol Med 33 : 147 - 155 , 2004 .
Keratocystic Odontogenic Tumor
Barnes L : World Health Organization classifi cation of tumours: pathology and genetics: head and neck tumours , Lyon , 2005 , IARC Press .
Brannon RB : The odontogenic keratocyst: a clinicopathological study of 312 cases, I: clinical features , Oral Surg Oral Med Oral Pathol 42 : 54 - 72 , 1976 .
Kakarantza-Angelopoulou E , Nicolatou O : Odontogenic keratocysts: clinicopathologic study of 87 cases , J Oral Maxillofac Surg 48 : 593 - 599 , 1990 .
Myoung H , Hong SP , Hong SD et al : Odontogenic keratocyst: review of 256 cases for recurrence and clinicopathologic parameters , Oral Surg Oral Med Oral Pathol Oral Radiol Endod 91 : 328 - 333 , 2001 .
Shear M : The aggressive nature of the odontogenic keratocyst: is it a benign cystic neoplasm, II: proliferation and genetic studies , Oral Oncol 38 : 323 - 331 , 2002 .
Basal Cell Nevus Syndrome
Angelopoulou E , Angelopoulos AP : Lateral periodontal cyst: review of the literature and report of a case , J Periodontol 61 : 126 - 131 , 1990 .
Donatsky O , Hj ö rting-Hansen E , Philipsen HP et al : Clinical, radiographic, and histologic features of the basal cell nevus syndrome , Int J Oral Surg 5 : 19 - 28 , 1976 .
Evans DC , Farndon PA , Burnell LD et al : The incidence of Gorlin syndrome in 173 consecutive cases of medulloblastoma , Br J Cancer 64 : 959 - 961 , 1991 .
Gorlin RJ : Nevoid basal cell carcinoma syndrome , Medicine 66 : 98 - 113 , 1987 .
Lateral Periodontal Cyst
Shear M , Pindborg JJ : Microscopic features of the lateral periodontal cyst , Scand J Dent Res 83 : 103 - 110 , 1975 .
Weathers DR , Waldron CA : Unusual multilocular cysts of the jaws (botryoid odontogenic cysts) , Oral Surg Oral Med Oral Pathol 36 : 235 - 241 , 1973 .
Wysocki GP , Brannon RB , Gardner DG et al : Histogenesis of the lateral periodontal cyst and the gingival cyst of the adult , Oral Surg Oral Med Oral Pathol 50 : 327 - 334 , 1980 .
Glandular Odontogenic Cyst
Koppang HS , Johannessen S , Haugen LK et al : Glandular odontogenic cyst: report of two cases and literature review of 45 previously reported cases , J Oral Pathol Med 27 : 455 - 462 , 1998 .
Noffke C , Raubenheimer EJ : The glandular odontogenic cyst: clinical and radiologic features: review of the literature and report of nine cases , Dentomaxillofac Radiol 31 : 333 - 338 , 2002 .
Calcifying Cystic Odontogenic Tumor
Johnson A III , Fletcher M , Gold L et al : Calcifying odontogenic cyst: a clinicopathologic study of 57 cases with immunohistochemical evaluation for cytokeratin , J Oral Maxillofac Surg 55 : 679 - 683 , 1997 .
Moleri AB , Moreira LC , Carvalho JJ : Comparative morphology of 7 new cases of calcifying odontogenic cysts , J Oral Maxillofac Surg 60 : 689 - 696 , 2002 .
Yoshiura K , Tabata O , Miwa K et al : Computed tomographic features of calcifi ying odontogenic cysts , Dentomaxillofac Radiol 27 : 12 - 16 , 1998 .
NONODONTOGENIC CYSTS
Nasopalatine Duct Cyst
Elliott KA , Franzese CB , Pitman KT : Diagnosis and surgical management of nasopalatine duct cysts , Laryngoscope 114 : 1336 - 1340 , 2004 .
Mraiwa RJ , Jacobs R , Van Cleynenbreugel J et al : The nasopalatine duct cyst revisited using 2D and 3D CT imaging , Dentomaxillofac Radiol 33 : 396 - 402 , 2004 .
Swanson KS , Kaugars GE , Gunsolley JC : Nasopalatine duct cyst: an analysis of 334 cases , J Oral Maxillofac Surg 49 : 268 - 271 , 1991 .
Nasolabial Cyst
Choi JH , Cho JH , Kang HJ et al : Nasolabial cysts: a retrospective analysis of 18 cases , Ear Nose Throat J 81 : 94 - 96 , 2002 .
Yuen H , Julian CY , Samuel CL : Nasolabial cysts: clinical features, diagnosis and treatment , Br J Oral Maxillofac Surg 45 : 293 - 297 , 2007 .
Dermoid Cyst
Seward GR : Dermoid cysts of the fl oor of the mouth , Br J Oral Surg 3 : 36 - 47 , 1965 .

CHAPTER 21 ■ CYSTS AND CYSTLIKE LESIONS OF THE JAWS 365
CYSTLIKE LESIONS
Simple Bone Cyst
Damante JH , Da S , Guerra EN et al : Spontaneous resolution of simple bone cysts , Dentomaxillofac Radiol 31 : 182 - 186 , 2002 .
Kaugars GE , Cale AE : Traumatic bone cyst , Oral Surg Oral Med Oral Pathol 63 : 318 - 324 , 1987 .
Perdigao AF , Silva EC , Sakurai E et al : Idiopathic bone cavity: a clinical, radiographic and histological study , Br J Oral Maxillofac Surg 41 : 407 - 409 , 2003 .
Saito Y , Hoshina Y , Nagamine T et al : Simple bone cyst: a clinical and histopathologic study of fi fteen cases , Oral Surg Oral Med Oral Pathol 74 : 487 - 491 , 1992 .
Sapp PJ , Stark ML : Self-healing traumatic bone cysts , Oral Surg Oral Med Oral Pathol 69 : 597 - 602 , 1990 .
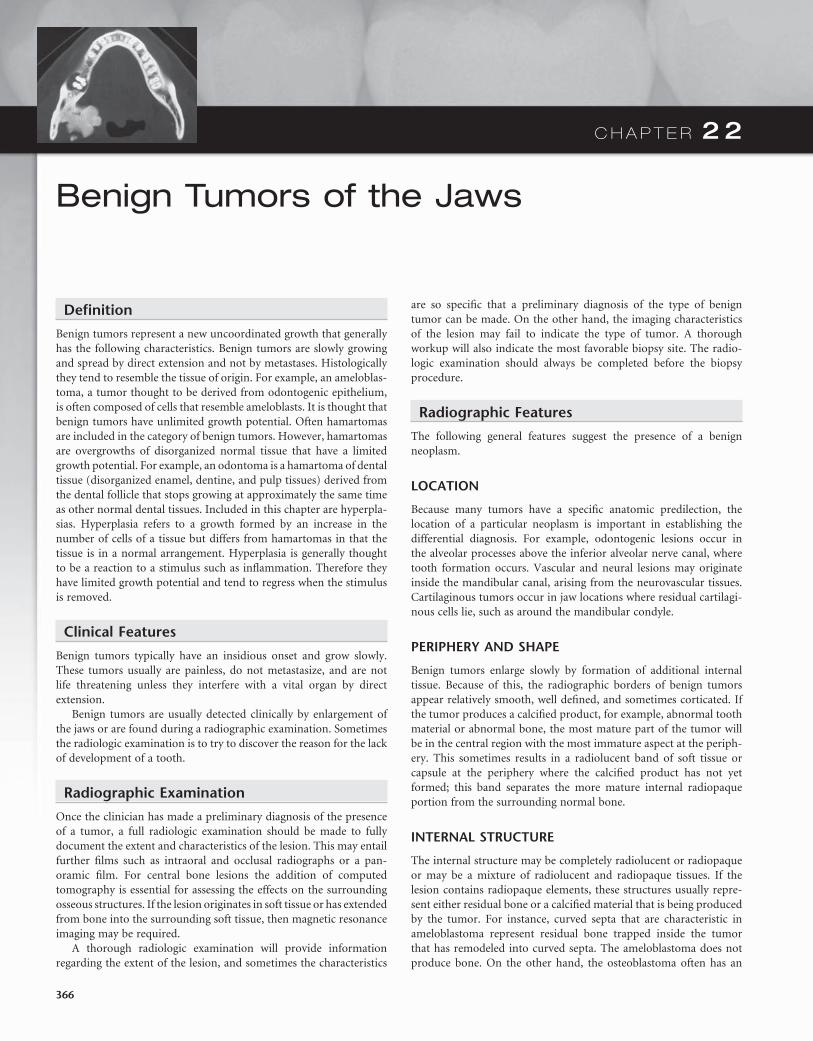
C H A P T E R 2 2
Benign Tumors of the Jaws
Defi nition
Benign tumors represent a new uncoordinated growth that generally has the following characteristics. Benign tumors are slowly growing and spread by direct extension and not by metastases. Histologically they tend to resemble the tissue of origin. For example, an ameloblas-toma, a tumor thought to be derived from odontogenic epithelium, is often composed of cells that resemble ameloblasts. It is thought that benign tumors have unlimited growth potential. Often hamartomas are included in the category of benign tumors. However, hamartomas are overgrowths of disorganized normal tissue that have a limited growth potential. For example, an odontoma is a hamartoma of dental tissue (disorganized enamel, dentine, and pulp tissues) derived from the dental follicle that stops growing at approximately the same time as other normal dental tissues. Included in this chapter are hyperpla-sias. Hyperplasia refers to a growth formed by an increase in the number of cells of a tissue but differs from hamartomas in that the tissue is in a normal arrangement. Hyperplasia is generally thought to be a reaction to a stimulus such as infl ammation. Therefore they have limited growth potential and tend to regress when the stimulus is removed.
Clinical Features
Benign tumors typically have an insidious onset and grow slowly. These tumors usually are painless, do not metastasize, and are not life threatening unless they interfere with a vital organ by direct extension.
Benign tumors are usually detected clinically by enlargement of the jaws or are found during a radiographic examination. Sometimes the radiologic examination is to try to discover the reason for the lack of development of a tooth.
Radiographic Examination
Once the clinician has made a preliminary diagnosis of the presence of a tumor, a full radiologic examination should be made to fully document the extent and characteristics of the lesion. This may entail further fi lms such as intraoral and occlusal radiographs or a pan-oramic fi lm. For central bone lesions the addition of computed tomography is essential for assessing the effects on the surrounding osseous structures. If the lesion originates in soft tissue or has extended from bone into the surrounding soft tissue, then magnetic resonance imaging may be required.
A thorough radiologic examination will provide information regarding the extent of the lesion, and sometimes the characteristics
are so specifi c that a preliminary diagnosis of the type of benign tumor can be made. On the other hand, the imaging characteristics of the lesion may fail to indicate the type of tumor. A thorough workup will also indicate the most favorable biopsy site. The radio-logic examination should always be completed before the biopsy procedure.
Radiographic Features
The following general features suggest the presence of a benign neoplasm.
LOCATION
Because many tumors have a specifi c anatomic predilection, the location of a particular neoplasm is important in establishing the differential diagnosis. For example, odontogenic lesions occur in the alveolar processes above the inferior alveolar nerve canal, where tooth formation occurs. Vascular and neural lesions may originate inside the mandibular canal, arising from the neurovascular tissues. Cartilaginous tumors occur in jaw locations where residual cartilagi-nous cells lie, such as around the mandibular condyle.
PERIPHERY AND SHAPE
Benign tumors enlarge slowly by formation of additional internal tissue. Because of this, the radiographic borders of benign tumors appear relatively smooth, well defi ned, and sometimes corticated. If the tumor produces a calcifi ed product, for example, abnormal tooth material or abnormal bone, the most mature part of the tumor will be in the central region with the most immature aspect at the periph-ery. This sometimes results in a radiolucent band of soft tissue or capsule at the periphery where the calcifi ed product has not yet formed; this band separates the more mature internal radiopaque portion from the surrounding normal bone.
INTERNAL STRUCTURE
The internal structure may be completely radiolucent or radiopaque or may be a mixture of radiolucent and radiopaque tissues. If the lesion contains radiopaque elements, these structures usually repre-sent either residual bone or a calcifi ed material that is being produced by the tumor. For instance, curved septa that are characteristic in ameloblastoma represent residual bone trapped inside the tumor that has remodeled into curved septa. The ameloblastoma does not produce bone. On the other hand, the osteoblastoma often has an
366

CHAPTER 22 ■ BENIGN TUMORS OF THE JAWS 367
internal granular radiopaque pattern produced by the abnormal bone that is actually being manufactured by the tumor. Often the internal pattern is characteristic for specifi c types of tumors and may help with the diagnosis. A totally radiolucent internal structure is not as useful as an aid to the diagnosis.
EFFECTS ON SURROUNDING STRUCTURES
The manner in which a tumor affects adjacent tissues may suggest a benign behavior. For example, a benign tumor exerts pressure on neighboring structures, resulting in the displacement of teeth or bony cortices. If the growth is slow enough, there will be adequate time for the outer cortex to remodel in response to the pressure, resulting in an appearance that the cortex has been displaced by the tumor ( Fig. 22-1 ). This is caused by simultaneous resorption of bone along the inner surface (endosteal) of the cortex and deposition of bone along the outer cortical surface by the periosteum ( Fig. 22-2 ). Through this remodeling process, the cortex maintains its integrity and resists per-foration, although faster growing tumors may exceed this process, resulting in perforation of the cortex. Benign tumors may also cause bodily displacement of nearby teeth ( Fig. 22-3 ). The movement of teeth adjacent to benign tumors is slow because these lesions grow slowly.
The roots of teeth may be resorbed by either benign or malignant tumors, but root resorption is more commonly associated with benign processes. The benign tumors especially likely to resorb roots are ameloblastomas, ossifying fi bromas, and central giant cell granulo-mas. Benign tumors tend to resorb the adjacent root surfaces in a smooth fashion. Bone dysplasias such as fi brous dysplasia do not usually resorb teeth. When root resorption is associated with malig-nant tumors, the resorption is usually in smaller quantities, causing thinning of the root into a “ spiked ” shape.
Hyperplasias
Bony hyperplasias are included in this chapter but are not considered tumors because of the normal arrangement of the tissue and the limited growth potential; in some cases this growth is in response to a stimulus. Bony hyperplasias are growths of normal new bone that sometimes occur in characteristic locations. In dentistry the terms exostosis and hyperostosis are both used to describe a bony growth that occurs on the surface of normal bone. It should be noted that in medicine the term exostosis often is used for a surface bony growth with a cartilage cap (osteochondroma). Therefore the term hyperos-tosis may be preferred to avoid confusion.
Torus Palatinus
Synonym Palatine torus
FIG. 22-1 Benign lesions growing in bone tend to be round or oval. They grow by displacing adjacent tissues. (From Matteson SR, Tyndall DA, Burkes EJ et al: The radiology of benign and malignant lesion, Dent Radiogr Photogr 57:35-52, 78-84, 1985.)
BenignLesion
BenignLesion
PeriosteumExpansion andthinning of inferiorborder of mandible
FIG. 22-2 The host bone of a benign tumor may expand as a result of outward remodeling of its cortical borders. As the benign tumor extends toward the periphery of the bone, the periosteum lays down new bone along the outer cortex, thereby maintaining the integrity of the cortex.
Periosteum
Bone cortex
Erosion of endostealsurface
Periosteal newbone
Benignlesion
FIG. 22-3 A benign lesion usually grows slowly, causing displacement of adjacent teeth. (From Matteson SR, Tyndall DA, Burkes EJ et al: The radiology of benign and malignant lesions, Dent Radiogr Photogr 57:35-52, 78-84, 1985.)
Benignlesion

368 PART V ■ RADIOGRAPHIC INTERPRETATION
Defi nition Torus palatinus is a bony protuberance (hyperostosis) that occurs in the middle third of the midline of the hard palate.
Clinical Features Torus palatinus, the most common exostoses, occurs in about 20% of the population, although various studies have shown marked differences in racial groups. It develops about twice as often in women as in men and more often in Native Americans, Eskimos, and Norwegians. Although it may be discovered at any age, it is rare in children. It usually begins developing in young adults before 30 years of age and is thought to arise through interplay of genetic and envi-ronmental factors. The base of the bony nodule extends along the central portion of the hard palate, and the bulk reaches downward into the oral cavity. The size and shape of a torus palatinus can vary, and these lesions have been described as fl at, lobulated, nodular, or mushroomlike ( Fig. 22-4, A ). Normal mucosa covers the bony mass and may appear pale and sometimes ulcerated when traumatized. Patients often are unaware of this hyperplasia, and those who do dis-cover it may insist that it occurred suddenly and has been growing rapidly.
Radiographic Features Location. On maxillary periapical or panoramic radiographs, a
torus palatinus appears as a dense radiopaque shadow below and
FIG. 22-4 A, A clinical photograph of torus palatinus. B, A panoramic radiograph shows the radi-opaque shadow of torus palatinus above the maxillary premolars and canine. (Courtesy Ronald Baker, DDS, Chapel Hill, N.C.)
A B
FIG. 22-5 Maxillary periapical radiographs show a radiopaque area with the well-defi ned borders of torus palatinus.
attached to the hard palate. It may be superimposed over the apical areas of the maxillary teeth, especially if the torus has developed in the middle or anterior regions of the palate. The image of a palatal torus may project over the roots of the maxillary molars ( Fig. 22-4, B ), but the shadow will usually move in its position relative to the roots of the teeth if another fi lm is taken with a different horizontal or vertical angulation of the central ray ( Fig. 22-5 ).
Periphery and Shape. The border of the radiopaque shadow usually is well defi ned and may have a convex or a lobulated outline ( Fig. 22-6 ).
Internal Structure. The internal aspect is homogeneously radiopaque.
Treatment A torus palatinus usually does not require treatment, although removal may be necessary if a maxillary denture is to be made.
Torus Mandibularis
Synonym Mandibular torus
Defi nition Torus mandibularis is a hyperostosis that protrudes from the lingual aspect of the mandibular alveolar process, usually near the premolar teeth.

CHAPTER 22 ■ BENIGN TUMORS OF THE JAWS 369
FIG. 22-6 A, A torus palatinus (arrowhead) in an occlusal image and, B, in a coronal CT image.
A B
Clinical Features Tori occur less often on the lingual surface of the mandible than on the palate, with the former occurring in about 8% of the population. These tori develop singly or multiply, unilaterally or bilaterally (usually bilaterally), and most often in the premolar region. The size also varies, ranging from an outgrowth that is just palpable to one that contacts a torus on the opposite side. In contrast to torus palatinus, torus mandibularis develops later, being fi rst discovered in middle-aged adults. However, it has the same sex predilection as torus palati-nus. In women the occurrence of torus mandibularis correlates with that of torus palatinus, but this apparently is not the case in men. As with torus palatinus, torus mandibularis may occur more often in those of East Asian ancestry.
Genetic and environmental factors seem to be involved in the development of torus mandibularis, but masticatory stress is reported as an essential factor underlying its formation. The high prevalence among Eskimos and other subarctic peoples who make extraordinary chewing demands on their teeth seems to support this suggestion. Also, a patient with a torus mandibularis has, on average, more teeth present than a patient without a torus.
Radiographic Features Location. Recognition of mandibular tori relies on their appear-
ance and location. Their presence bilaterally reinforces this impres-sion, although they can occur unilaterally. On mandibular periapical radiographs, a torus mandibularis appears as a radiopaque shadow, usually superimposed on the roots of premolars and molars and occa-sionally over a canine or incisor. It usually is superimposed over about three teeth.
Periphery. Mandibular tori are sharply demarcated anteriorly on periapical fi lms and are less dense and less well defi ned as they extend posteriorly ( Fig. 22-7 ). There is no margin between the periphery of the torus and the surface of the mandible because the torus is continu-ous with the mandibular cortex.
Internal Structure. On occlusal radiographs a mandibular torus appears as a radiopaque and homogeneous ( Fig. 22-8 ).
Treatment A torus mandibularis usually does not require treatment, although removal may be necessary if a mandibular denture is planned.
OTHER EXOSTOSES
Synonym Hyperostosis
Defi nition In addition to the torus, other exostoses may occur at other sites in the jaws. These are usually small regions of osseous hyperplasia of cortical bone and occasionally internal cancellous bone that usually occur on the surface of the alveolar process.
Clinical Features Exostoses may develop most commonly on the buccal surface of the maxillary alveolar process, usually in the canine or molar area. They may also occur on the palatal surface or crest and less commonly on the mandibular alveolar process. Occasionally they will grow on the crest under a pontic of a fi xed bridge. They are less common than mandibular or palatine tori, may attain a large size, and may be soli-tary or multiple. They are nodular, pedunculated, or fl at prominences on the surface of the bone. They are covered with a normal mucosa and are bony hard on palpation. No published data indicate their actual incidence or whether they occur more often in one sex. As with the exostoses described previously, they appear to be more prevalent in Native Americans.
Radiographic Features Location. The maxillary alveolar process is the most common
location and usually the image overlaps the roots of the adjacent teeth.
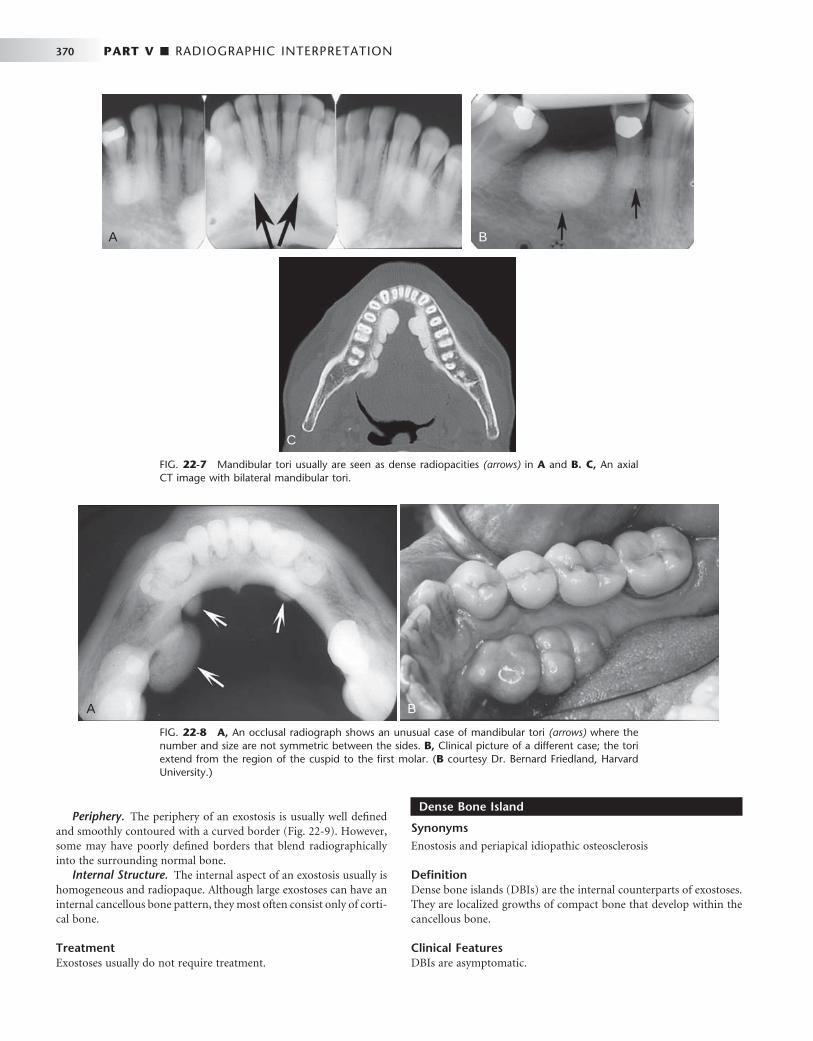
370 PART V ■ RADIOGRAPHIC INTERPRETATION
Dense Bone Island
Synonyms Enostosis and periapical idiopathic osteosclerosis
Defi nition Dense bone islands (DBIs) are the internal counterparts of exostoses. They are localized growths of compact bone that develop within the cancellous bone.
Clinical Features DBIs are asymptomatic.
A B
C
FIG. 22-7 Mandibular tori usually are seen as dense radiopacities (arrows) in A and B. C, An axial CT image with bilateral mandibular tori.
FIG. 22-8 A, An occlusal radiograph shows an unusual case of mandibular tori (arrows) where the number and size are not symmetric between the sides. B, Clinical picture of a different case; the tori extend from the region of the cuspid to the fi rst molar. ( B courtesy Dr. Bernard Friedland, Harvard University.)
A B
Periphery. The periphery of an exostosis is usually well defi ned and smoothly contoured with a curved border ( Fig. 22-9 ). However, some may have poorly defi ned borders that blend radiographically into the surrounding normal bone.
Internal Structure. The internal aspect of an exostosis usually is homogeneous and radiopaque. Although large exostoses can have an internal cancellous bone pattern, they most often consist only of corti-cal bone.
Treatment Exostoses usually do not require treatment.

CHAPTER 22 ■ BENIGN TUMORS OF THE JAWS 371
FIG. 22-9 A, A periapical fi lm of a region of hyperostosis on the buccal aspect of the maxillary alveolar process, seen as an region of slight increase in radiopacity overlapping the roots of the molars (arrows). B, Another example overlapping an edentulous ridge. C, An example occurring on the crest of the alveolar ridge. D, An example occurring under a bridge pontic. E, A coronal CT image of hyperostosis located on the palatal aspect of the right maxillary alveolar process; note the presence of a maxillary torus. F, A clinical photograph of a small hyperostosis occurring on the labial surface of the maxillary alveolar ridge.
A
E
F
C
D
B

372 PART V ■ RADIOGRAPHIC INTERPRETATION
Radiographic Features Location. DBIs are more common in the mandible than in the
maxilla. They occur most often in the premolar-molar area ( Fig. 22-10 ), although their existence does not correlate with the presence or absence of teeth.
Periphery. The periphery is usually well defi ned but occasionally blends with the trabeculae of the surrounding bone. There is no trace of a radiolucent margin or capsule; the radiopaque dense bone island abuts directly against normal bone.
Internal Structure. The internal aspect of DBIs usually is uni-formly radiopaque without any characteristic pattern, but sometimes, depending on its form and thickness, there may be patches of more radiolucent areas.
Effects on Surrounding Structures. In rare instances a DBI is located periapical to a tooth root and is associated with external root resorption (see Fig. 22-10, C ). The tooth most often involved is the mandibular fi rst molar. In all circumstances the tooth is vital and the
root resorption appears to be self-limiting. In very rare cases DBIs can inhibit the eruption of a tooth and even displace a tooth.
Differential Diagnosis Several radiopaque lesions must be considered in forming a differen-tial diagnosis. Periapical cemental dysplasia can be differentiated by the presence of its radiolucent periphery. When a DBI is located at the root apex, it may resemble periapical sclerosing osteitis. However, in periapical osteitis there is an associated widening of the periapical portion of the periodontal membrane space. Also, periapical osteitis should be centered on the root apex of the tooth and extend in a more symmetric form in every direction. Finally, an infl ammatory lesion may have an apparent etiology such as a large restoration or carious lesion. There may be some similarity to hypercementosis or a benign cementoblastoma, but in both cases there should be a soft tissue (radiolucent) capsule at the periphery. DBIs are often static but may increase in size, especially when there is active growth of the jaws. If
FIG. 22-10 A, A small dense bone island apical to the fi rst bicuspid; note the lack of a soft tissue capsule and that some of the surrounding trabeculae appear to merge into the radiopaque mass. B, A larger dense bone island between the bicuspids; note the normal-appearing periodontal mem-brane space. C, Another example apical to the fi rst molar causing external root resorption of the mesial root. D, A large dense bone island occupying the body of the left mandible.
A B
DC

CHAPTER 22 ■ BENIGN TUMORS OF THE JAWS 373
several DBIs (fi ve or more) are present, multiple polyposis syndromes (e.g., Gardner ’ s syndrome) should be considered.
Treatment Enostosis does not require treatment. If multiple, the patient ’ s family history should be reviewed for incidences of cancer of the intestine.
Benign Tumors
The benign neoplasias are separated into two major groups, odonto-genic tumors and nonodontogenic tumors.
ODONTOGENIC TUMORS
Odontogenic tumors arise from the tissues of the odontogenic appa-ratus. According to the World Health Organization (WHO), these tumors can be classifi ed into three categories depending on the type of tissue that comprises each tumor. The categories are tumors of odontogenic epithelium, mixed tumors of both odontogenic epithelium and odontogenic ectomesenchyme (connective tissue), and tumors composed of primarily ectomesenchyme. Odontogenic tumors comprise 1.3% to 15% of all oral tumors. The following text presents benign jaw tumors according to their tissues of origin. This format should assist the reader in learning to correlate the radio-graphic appearance of tumors with the underlying pathologic basis of the disease process.
ODONTOGENIC EPITHELIAL TUMORS
Ameloblastoma
Synonyms Adamantinoma, adamantoblastoma, adontomes embryolastiques, and epithelial odontoma
Defi nition The ameloblastoma, a true neoplasm of odontogenic epithelium, is a persistent and locally invasive tumor; it has aggressive but benign growth characteristics. The ameloblastoma represents about 1% of all oral odontogenic epithelial tumors and 11% of all odontogenic tumors. It is an aggressive neoplasm that arises from remnants of the dental lamina and dental organ (odontogenic epithelium). Malignant forms of this neoplasm do exist and are discussed in Chapter 23 . Ameloblastomas may be divided into the solid/multicystic type, the unicystic type, and the desmoplastic type. The unicystic variant may develop as a single entity or may form from the epithelial lining of a
dentigerous cyst, called a mural (within the wall) ameloblastoma. The existence of peripheral (soft tissue location) forms of this neoplasm is well documented.
Clinical Features. There is a slight predilection for this lesion to occur in men, and it develops more often in blacks. Although it may be found in the young (age 3 years) and in individuals older than 80 years, most patients are between 20 and 50 years, with the average age at discovery about 40 years.
Ameloblastomas grow slowly, and few, if any, symptoms occur in the early stages. The tumor is frequently discovered during a routine dental examination. Usually the patient eventually notices gradually increasing facial asymmetry. Swelling of the cheek, gingiva, or hard palate has been reported as the chief complaint in 95% of untreated maxillary ameloblastomas. The mucosa over the mass is normal, but teeth in the involved region may be displaced and become mobile. In most cases patients with ameloblastomas do not have pain, paresthe-sia, fi stula, ulcer formation, or tooth mobility. As the tumor enlarges, palpation may elicit a bony hard sensation or crepitus as the bone thins. If the lesion destroys overlying bone, the swelling may feel fi rm or fl uctuant. As it grows, this tumor can cause bony expansion and sometimes erosion through the adjacent cortical plate with subse-quent invasion of the adjacent soft tissues.
An untreated tumor may grow to great size and is more of a concern in the maxilla, where it can extend into vital structures and reach into the cranial base. Tumors that develop in the maxilla may extend into the paranasal sinuses, orbit, nasopharynx, or vital struc-tures at the base of the skull. Recurrence rates are higher in older patients and in those with multilocular lesions. As seen with other jaw tumors, local recurrence, whether detected radiographically or histologically, may have a more aggressive character than the original tumor.
Radiographic Features Location. Most ameloblastomas (80%) develop in the molar-
ramus region of the mandible, but they may extend to the symphyseal area. Most lesions that occur in the maxilla are in the third molar area and extend into the maxillary sinus and nasal fl oor. In either jaw this tumor can originate in an occlusal position to a developing tooth ( Fig. 22-11 ).
Periphery. The ameloblastoma is usually well defi ned and fre-quently delineated by a cortical border. The border is often curved, and in small lesions the border and shape may be indistinguishable from a cyst ( Fig. 22-12 ). The periphery of lesions in the maxilla is usually more ill defi ned.
FIG. 22-11 A unicystic ameloblastoma devel-oping occlusal to the left second mandibular molar causing expansion of the mandibular body and ramus to the sigmoid notch and condylar neck and inferior displacement of the mandibular second molar and root resorption of the alveolar left fi rst molar. (Courtesy E. J. Burkes, DDS, Chapel Hill, N.C.)
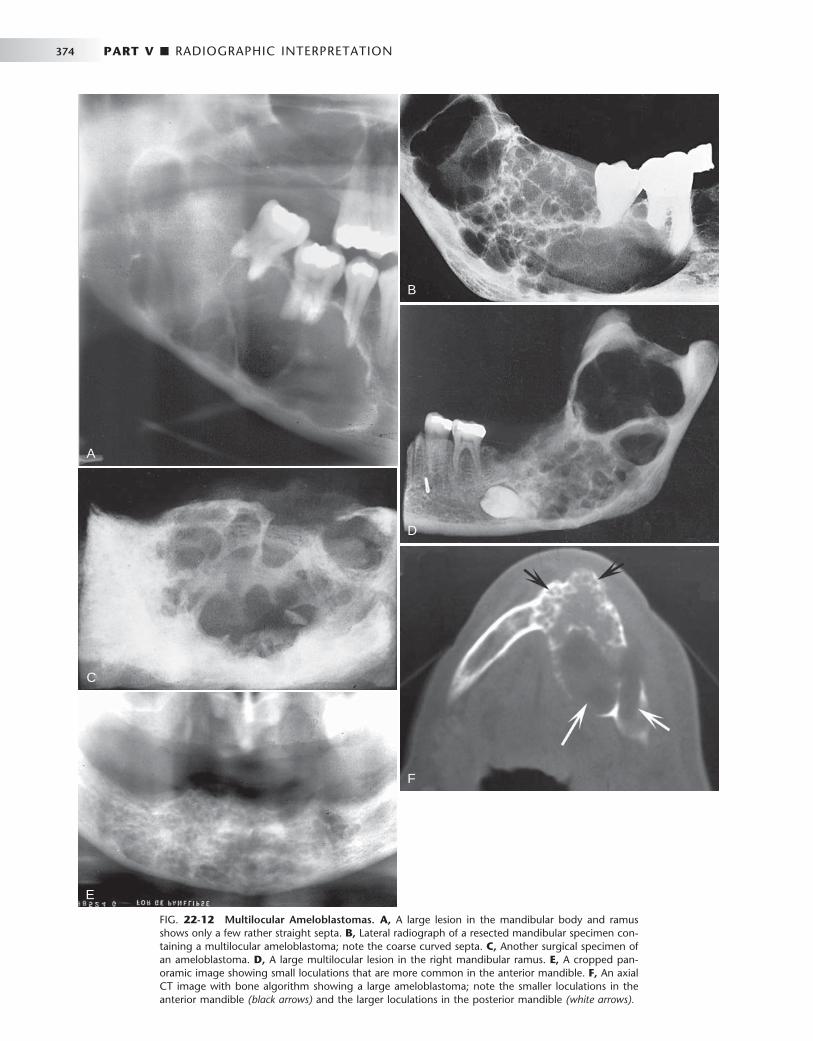
374 PART V ■ RADIOGRAPHIC INTERPRETATION
FIG. 22-12 Multilocular Ameloblastomas. A, A large lesion in the mandibular body and ramus shows only a few rather straight septa. B, Lateral radiograph of a resected mandibular specimen con-taining a multilocular ameloblastoma; note the coarse curved septa. C, Another surgical specimen of an ameloblastoma. D, A large multilocular lesion in the right mandibular ramus. E, A cropped pan-oramic image showing small loculations that are more common in the anterior mandible. F, An axial CT image with bone algorithm showing a large ameloblastoma; note the smaller loculations in the anterior mandible (black arrows) and the larger loculations in the posterior mandible (white arrows).
A
C
E
B
D
F

CHAPTER 22 ■ BENIGN TUMORS OF THE JAWS 375
FIG. 22-13 An example of the desmoplastic type of ameloblastoma; note the internal irregular bone formation in this axial CT image.
FIG. 22-14 Root resorption of the premolars and canine adjacent to a radiolucent ameloblas-toma in the left mandible.
FIG. 22-15 An occlusal fi lm demonstrating expansion of the lingual cortex with maintenance of a thin outer shell of bone (arrow).
Internal Structure. The internal structure varies from totally radiolucent (see Fig. 22-11 ) to mixed with the presence of bony septa creating internal compartments. These septa can be straight but are more commonly coarse and curved and originate from normal bone that has been trapped within the tumor. Because this tumor frequently has internal cystic components, these septa are often remodeled into curved shapes providing a honeycomb (numerous small compart-ments or loculations) or soap bubble (larger compartments of vari-able size) patterns (see Fig. 22-12 ). Generally the loculations are larger in the posterior mandible and smaller in the anterior mandible. In the desmoplastic variety the internal structure can be composed of very irregular sclerotic bone resembling a bone dysplasia or bone-forming tumor ( Fig. 22-13 ).
Effects on Surrounding Structures. There is a pronounced ten-dency for ameloblastomas to cause extensive root resorption ( Fig. 22-14 ). Tooth displacement is common. Because a common point of origin is occlusal to a tooth, some teeth may be displaced apically. An occlusal radiograph may demonstrate cystlike expansion and thinning
of an adjacent cortical plate leaving a thin “ eggshell ” of bone ( Fig. 22-15 ). Computed tomographic (CT) images often reveal regions of perforation of the expanded cortical plate as a result of the inability of the production of periosteal new bone to keep up with the rate of growth of the expanding ameloblastoma ( Fig. 22-16 ). Unicystic types of ameloblastoma may cause extreme expansion of the mandibular ramus, and often the anterior border of the ramus is no longer visible in the panoramic image ( Fig. 22-17 ).
RECURRENT AMELOBLASTOMA
Ameloblastomas may recur when the initial surgical procedure inad-equately removes the entire tumor. Recurrent tumor has a character-istic appearance of multiple small cystlike structures with very coarse sclerotic cortical margins ( Fig. 22-18 ) sometimes separated by normal bone.

376 PART V ■ RADIOGRAPHIC INTERPRETATION
FIG. 22-16 A cropped panoramic image of an ameloblastoma involving the left maxilla; note the multilocular appearance in the tuberosity region. It is not possible to determine the extent of the lesion with the panoramic fi lm. B and C, The same coronal CT image slices with both bone and soft tissue algorithms of the same case; note the aggressive nature of the tumor as it has grown into the sinus and nasal fossa and perforated the lateral cortical plate of the maxilla.
A
B C
Additional Imaging If a preliminary diagnosis of ameloblastoma is made, then CT imaging is highly recommended. CT imaging cannot only confi rm the diag-nosis but also will accurately demonstrate the anatomic extent of the tumor (see Fig. 22-16 ). Of importance is the ability of CT imaging to detect perforation of the outer cortex and invasion into the surround-ing soft tissues. If soft tissue invasion is extensive, magnetic resonance imaging (MRI) will provide superior images of the nature and extent of the invasion. CT examination is essential in the postsurgical follow-up assessment of ameloblastoma.
Differential Diagnosis Small unilocular ameloblastomas that are located around the crown of an unerupted tooth often cannot be differentiated from a dentiger-
ous cyst. Because the appearance of the internal bony septa is important for the identifi cation of ameloblastoma, other types of lesions that also have internal septa such as the odontogenic kerato-cyst, giant cell granuloma, odontogenic myxoma, and ossifying fi broma may have a similar appearance. The odontogenic keratocyst may contain curved septa, but usually the keratocyst tends to grow along the bone without marked expansion, which is characteristic of ameloblastomas. Giant cell granulomas occur in a younger age group and have more granular or wispy ill-defi ned septa. Odonto-genic myxomas may have similar-appearing septa; however, there are usually one or two thin sharp, straight septa, which is characteristic of the myxoma. Even the presence of one such septum may indicate a myxoma. Also, myxomas are not as expansile as ameloblastomas and tend to grow along the bone. The septa in ossifying fi broma are usually

CHAPTER 22 ■ BENIGN TUMORS OF THE JAWS 377
FIG. 22-17 A, Panoramic fi lm of a unicystic ameloblastoma occupy-ing the left mandibular ramus; note the absence of the anterior border of the ramus. B, An axial CT image with soft tissue algorithm showing signifi cant expansion toward the masseter (m) and lateral pterygoid (p) muscles.
A
B
FIG. 22-18 Periapical fi lms of a recurrent ameloblastoma of the right maxilla. Note the sclerotic margins of the small cystic lesions.
A B
wide, granular, and ill defi ned and often there are small irregular trabeculae.
Treatment The most common treatment is surgical resection. The surgical pro-cedure should take into account the tendency of the neoplasm to invade adjacent bone beyond its apparent radiographic margins. CT and MRI are useful in determining the exact extent of the tumor. If the ameloblastoma is relatively small, it may be removed completely by an intraoral approach, but larger lesions may require resection of the jaw. The maxilla is usually treated more aggressively because of the tendency of ameloblastoma to invade adjacent vital structures. Radiation therapy may be used for inoperable tumors, especially those in the posterior maxilla.
Calcifying Epithelial Odontogenic Tumor
Synonyms Pindborg tumor and ameloblastoma of unusual type with calcifi -cation
Defi nition Calcifying epithelial odontogenic tumors (CEOTs) are rare neoplasms. They account for about 1% of odontogenic tumors. These tumors usually are located within bone and produce a mineralized substance within amyloid-like material. CEOTs have a distinctive microscopic appearance with epithelium that resembles the stratum intermedium of the enamel organ.
Clinical Features A CEOT is less aggressive than the ameloblastoma and is found in about the same age group. Rarely this tumor may have an extraosseous location. The neoplasm is somewhat more common in men, and patients range in age from 8 to 92 years, with an average age of about 42 years (considerably younger in men and somewhat older in women). Jaw expansion is a regular feature and usually the only symptom. Palpation of the swelling reveals a hard tumor.
Radiographic Features Location. As with ameloblastomas, CEOTs have a defi nite predi-
lection for the mandible, with a ratio of at least 2 : 1, and most develop in the premolar-molar area, with a 52% association with an unerupted or impacted tooth. In about half of cases, radiographs taken early in the development of these tumors reveal a radiolucent area around the crown of a mature, unerupted tooth.
Periphery. The border may have a well defi ned cystlike cortex. In some tumors the boundary may be irregular and ill defi ned.
Internal Structure. The internal aspect may appear unilocular or multilocular with numerous scattered, radiopaque foci of varying size and density. The most characteristic and diagnostic fi nding is the appearance of radiopacities close to the crown of the embedded tooth ( Fig. 22-19 ). In addition, small, thin, opaque trabeculae may cross the radiolucency in many directions.
Effects on Surrounding Structures. CEOTs may displace a developing tooth or prevent its eruption. Associated expansion of the jaw with maintenance of a cortical boundary may also occur.
Differential Diagnosis Lesions with completely radiolucent internal structures may mimic dentigerous cysts or even ameloblastomas. Other lesions with radi-opaque foci, including adenomatoid odontogenic tumor, ameloblastic
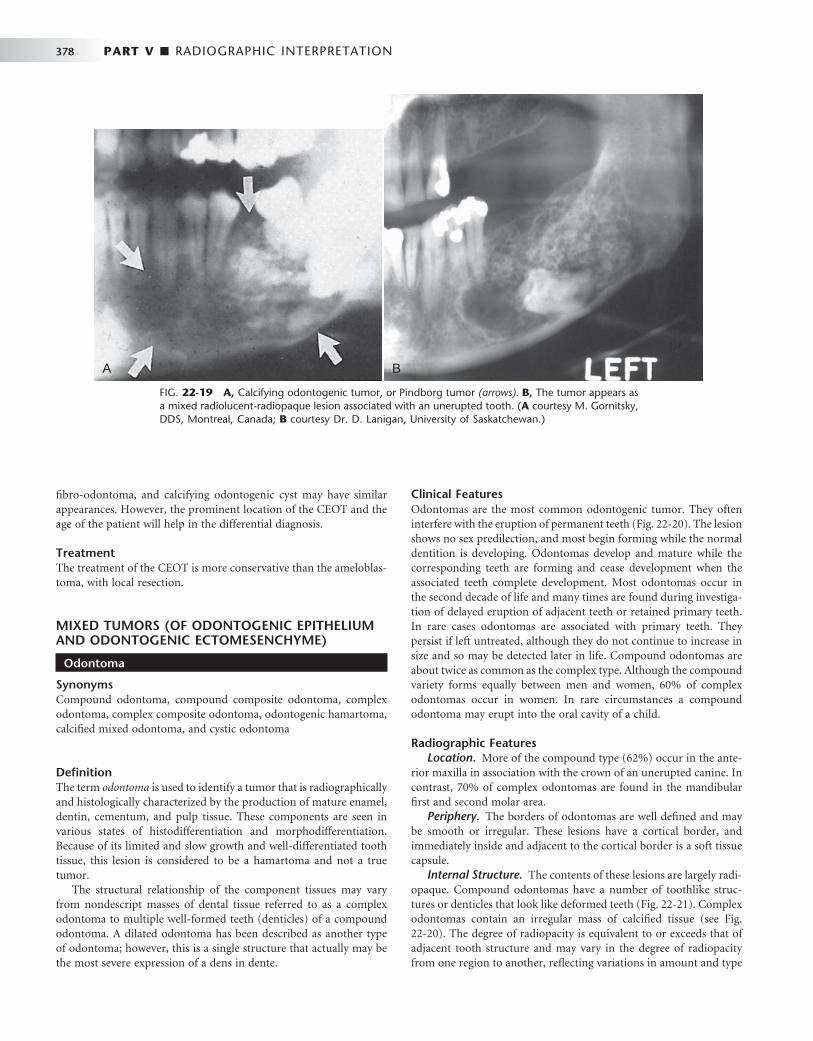
378 PART V ■ RADIOGRAPHIC INTERPRETATION
fi bro-odontoma, and calcifying odontogenic cyst may have similar appearances. However, the prominent location of the CEOT and the age of the patient will help in the differential diagnosis.
Treatment The treatment of the CEOT is more conservative than the ameloblas-toma, with local resection.
MIXED TUMORS (OF ODONTOGENIC EPITHELIUM AND ODONTOGENIC ECTOMESENCHYME)
Odontoma
Synonyms Compound odontoma, compound composite odontoma, complex odontoma, complex composite odontoma, odontogenic hamartoma, calcifi ed mixed odontoma, and cystic odontoma
Defi nition The term odontoma is used to identify a tumor that is radiographically and histologically characterized by the production of mature enamel, dentin, cementum, and pulp tissue. These components are seen in various states of histodifferentiation and morphodifferentiation. Because of its limited and slow growth and well-differentiated tooth tissue, this lesion is considered to be a hamartoma and not a true tumor.
The structural relationship of the component tissues may vary from nondescript masses of dental tissue referred to as a complex odontoma to multiple well-formed teeth (denticles) of a compound odontoma. A dilated odontoma has been described as another type of odontoma; however, this is a single structure that actually may be the most severe expression of a dens in dente.
Clinical Features Odontomas are the most common odontogenic tumor. They often interfere with the eruption of permanent teeth ( Fig. 22-20 ). The lesion shows no sex predilection, and most begin forming while the normal dentition is developing. Odontomas develop and mature while the corresponding teeth are forming and cease development when the associated teeth complete development. Most odontomas occur in the second decade of life and many times are found during investiga-tion of delayed eruption of adjacent teeth or retained primary teeth. In rare cases odontomas are associated with primary teeth. They persist if left untreated, although they do not continue to increase in size and so may be detected later in life. Compound odontomas are about twice as common as the complex type. Although the compound variety forms equally between men and women, 60% of complex odontomas occur in women. In rare circumstances a compound odontoma may erupt into the oral cavity of a child.
Radiographic Features Location. More of the compound type (62%) occur in the ante-
rior maxilla in association with the crown of an unerupted canine. In contrast, 70% of complex odontomas are found in the mandibular fi rst and second molar area.
Periphery. The borders of odontomas are well defi ned and may be smooth or irregular. These lesions have a cortical border, and immediately inside and adjacent to the cortical border is a soft tissue capsule.
Internal Structure. The contents of these lesions are largely radi-opaque. Compound odontomas have a number of toothlike struc-tures or denticles that look like deformed teeth ( Fig. 22-21 ). Complex odontomas contain an irregular mass of calcifi ed tissue (see Fig. 22-20 ). The degree of radiopacity is equivalent to or exceeds that of adjacent tooth structure and may vary in the degree of radiopacity from one region to another, refl ecting variations in amount and type
FIG. 22-19 A, Calcifying odontogenic tumor, or Pindborg tumor (arrows). B, The tumor appears as a mixed radiolucent-radiopaque lesion associated with an unerupted tooth. ( A courtesy M. Gornitsky, DDS, Montreal, Canada; B courtesy Dr. D. Lanigan, University of Saskatchewan.)
A B

CHAPTER 22 ■ BENIGN TUMORS OF THE JAWS 379
FIG. 22-20 A series of complex odontomas; note the toothlike density of the internal structure, a thin radiolucent capsule that in many cases interfered with the eruption of associated teeth.
A B
C
E
D
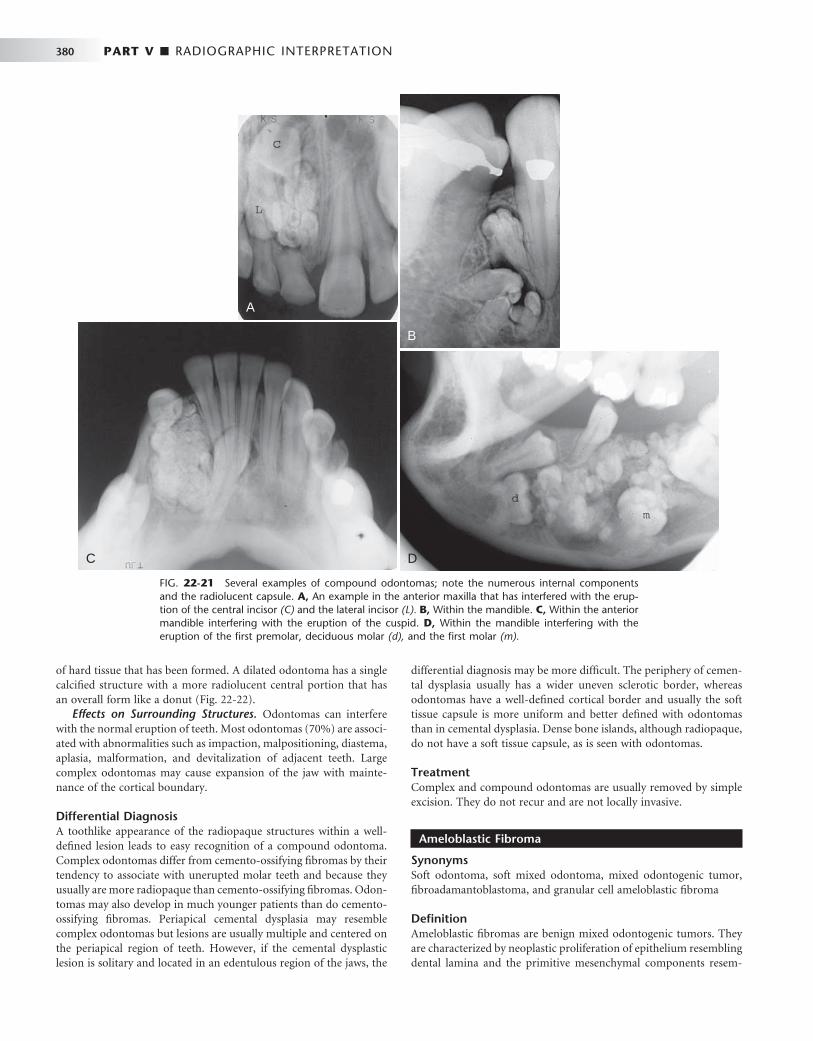
380 PART V ■ RADIOGRAPHIC INTERPRETATION
of hard tissue that has been formed. A dilated odontoma has a single calcifi ed structure with a more radiolucent central portion that has an overall form like a donut ( Fig. 22-22 ).
Effects on Surrounding Structures. Odontomas can interfere with the normal eruption of teeth. Most odontomas (70%) are associ-ated with abnormalities such as impaction, malpositioning, diastema, aplasia, malformation, and devitalization of adjacent teeth. Large complex odontomas may cause expansion of the jaw with mainte-nance of the cortical boundary.
Differential Diagnosis A toothlike appearance of the radiopaque structures within a well-defi ned lesion leads to easy recognition of a compound odontoma. Complex odontomas differ from cemento-ossifying fi bromas by their tendency to associate with unerupted molar teeth and because they usually are more radiopaque than cemento-ossifying fi bromas. Odon-tomas may also develop in much younger patients than do cemento-ossifying fi bromas. Periapical cemental dysplasia may resemble complex odontomas but lesions are usually multiple and centered on the periapical region of teeth. However, if the cemental dysplastic lesion is solitary and located in an edentulous region of the jaws, the
differential diagnosis may be more diffi cult. The periphery of cemen-tal dysplasia usually has a wider uneven sclerotic border, whereas odontomas have a well-defi ned cortical border and usually the soft tissue capsule is more uniform and better defi ned with odontomas than in cemental dysplasia. Dense bone islands, although radiopaque, do not have a soft tissue capsule, as is seen with odontomas.
Treatment Complex and compound odontomas are usually removed by simple excision. They do not recur and are not locally invasive.
Ameloblastic Fibroma
Synonyms Soft odontoma, soft mixed odontoma, mixed odontogenic tumor, fi broadamantoblastoma, and granular cell ameloblastic fi broma
Defi nition Ameloblastic fi bromas are benign mixed odontogenic tumors. They are characterized by neoplastic proliferation of epithelium resembling dental lamina and the primitive mesenchymal components resem-
FIG. 22-21 Several examples of compound odontomas; note the numerous internal components and the radiolucent capsule. A, An example in the anterior maxilla that has interfered with the erup-tion of the central incisor (C) and the lateral incisor (L). B, Within the mandible. C, Within the anterior mandible interfering with the eruption of the cuspid. D, Within the mandible interfering with the eruption of the fi rst premolar, deciduous molar (d), and the fi rst molar (m).
A
B
C D
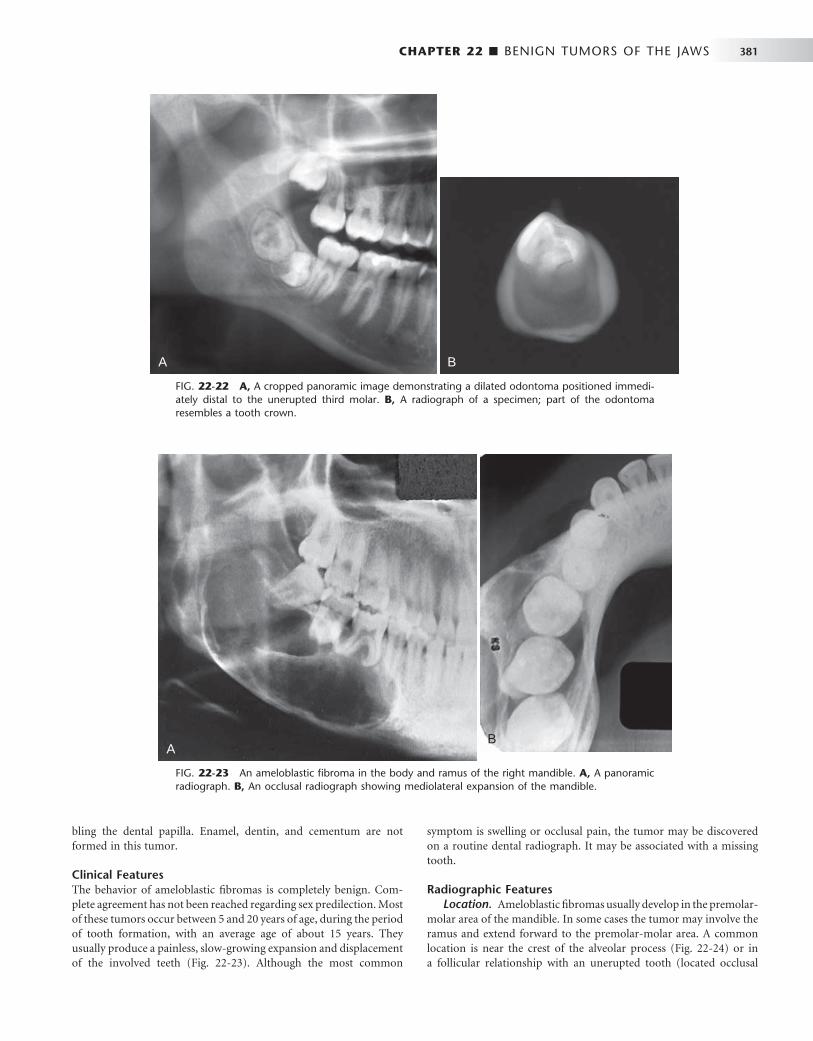
CHAPTER 22 ■ BENIGN TUMORS OF THE JAWS 381
bling the dental papilla. Enamel, dentin, and cementum are not formed in this tumor.
Clinical Features The behavior of ameloblastic fi bromas is completely benign. Com-plete agreement has not been reached regarding sex predilection. Most of these tumors occur between 5 and 20 years of age, during the period of tooth formation, with an average age of about 15 years. They usually produce a painless, slow-growing expansion and displacement of the involved teeth ( Fig. 22-23 ). Although the most common
FIG. 22-22 A, A cropped panoramic image demonstrating a dilated odontoma positioned immedi-ately distal to the unerupted third molar. B, A radiograph of a specimen; part of the odontoma resembles a tooth crown.
A B
FIG. 22-23 An ameloblastic fi broma in the body and ramus of the right mandible. A, A panoramic radiograph. B, An occlusal radiograph showing mediolateral expansion of the mandible.
symptom is swelling or occlusal pain, the tumor may be discovered on a routine dental radiograph. It may be associated with a missing tooth.
Radiographic Features Location. Ameloblastic fi bromas usually develop in the premolar-
molar area of the mandible. In some cases the tumor may involve the ramus and extend forward to the premolar-molar area. A common location is near the crest of the alveolar process ( Fig. 22-24 ) or in a follicular relationship with an unerupted tooth (located occlusal
AB

382 PART V ■ RADIOGRAPHIC INTERPRETATION
to the tooth), or it may arise in an area where a tooth failed to develop.
Periphery. The borders of an ameloblastic fi broma are well defi ned and often corticated in a manner similar to that of a cyst.
Internal Structure. An ameloblastic fi broma is more commonly unilocular (totally radiolucent) ( Fig. 22-25 ) but may be multilocular with indistinct curved septa (see Fig. 22-23 ).
Effects on Surrounding Structures. If the lesion is large, there may be expansion with an intact cortical plate. The associated tooth or teeth may be inhibited from normal eruption or may be displaced in an apical direction.
Differential Diagnosis A common diffi culty will occur in differentiating a small tumor with a follicular relationship to an unerupted tooth from a small dentiger-ous cyst or a hyperplastic follicle. In fact, the radiologic features may not allow differentiation among these three entities. This tumor may have similar features to an ameloblastoma; however, the ameloblastic fi broma occurs at an earlier age and the septa in an ameloblastoma are more defi ned and coarse. The septa in ameloblastic fi broma are infrequent and often very fi ne. Giant cell granulomas may appear multilocular, but these tumors usually have an epicenter anterior to the fi rst molar in young patients and the septa are characteristically
FIG. 22-24 An ameloblastic fi broma. A, An ameloblastic fi broma seen as a radiolucency above the unerupted third molar (arrow). B, A bitewing radiograph of the same lesion. C, A periapical radiograph. (Courtesy G. Sanders, DDS, LaCrosse, Wis.)
A
B C
granular and ill defi ned. Odontogenic myxomas can appear multi-locular, but usually a few sharp straight septa can be identifi ed, which are not characteristic of ameloblastic fi bromas and myxomas, and usually occur in an older age group.
Treatment Ameloblastic fi bromas are benign, and the rate of recurrence is low. A conservative surgical approach, including enucleation and mechan-ical curettage of the surrounding bone, is reported to be successful for these cases.
Ameloblastic Fibro-odontoma
Defi nition An ameloblastic fi bro-odontoma is a mixed tumor with all the ele-ments of an ameloblastic fi broma but with scattered collections of enamel and dentine. Some authorities consider the ameloblastic fi bro-odontoma to be an early stage of a developing odontoma; however, there is compelling evidence that the ameloblastic fi bro-odontoma is a separate entity that has a more neoplastic behavior than does the odontoma. On the other hand, there are probably some lesions that are incorrectly identifi ed as an ameloblastic fi bro-odontoma that are really developing odontomas.
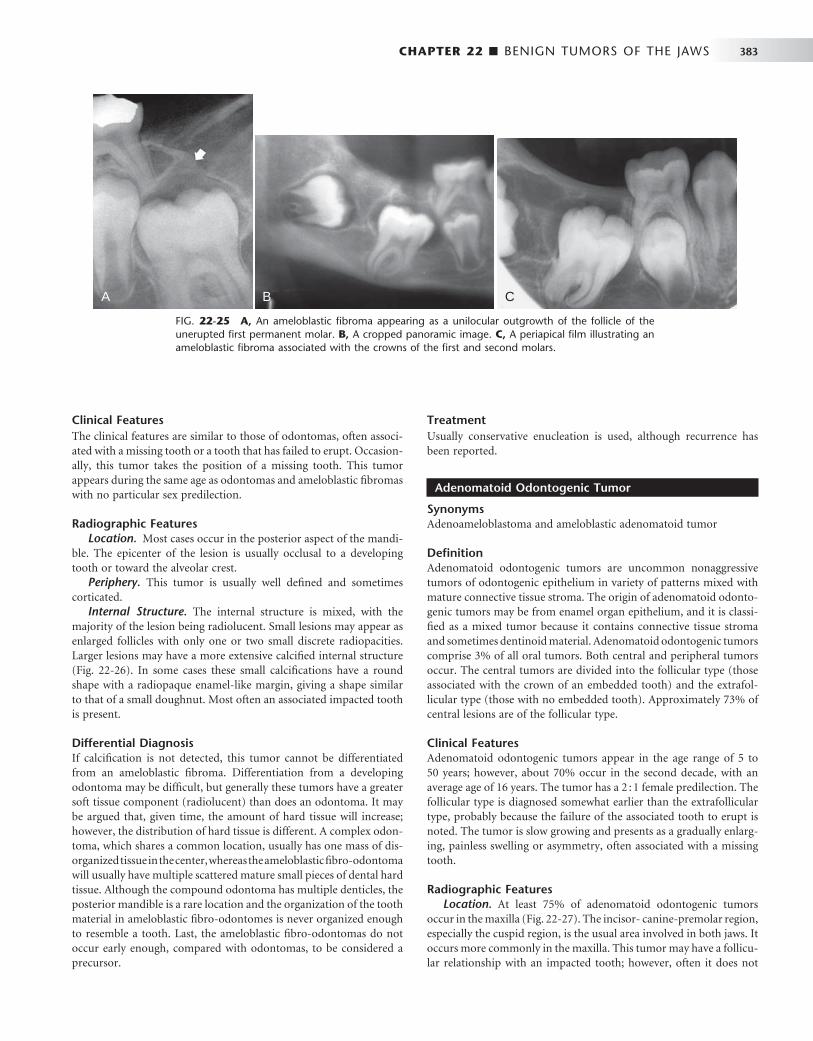
CHAPTER 22 ■ BENIGN TUMORS OF THE JAWS 383
Clinical Features The clinical features are similar to those of odontomas, often associ-ated with a missing tooth or a tooth that has failed to erupt. Occasion-ally, this tumor takes the position of a missing tooth. This tumor appears during the same age as odontomas and ameloblastic fi bromas with no particular sex predilection.
Radiographic Features Location. Most cases occur in the posterior aspect of the mandi-
ble. The epicenter of the lesion is usually occlusal to a developing tooth or toward the alveolar crest.
Periphery. This tumor is usually well defi ned and sometimes corticated.
Internal Structure. The internal structure is mixed, with the majority of the lesion being radiolucent. Small lesions may appear as enlarged follicles with only one or two small discrete radiopacities. Larger lesions may have a more extensive calcifi ed internal structure ( Fig. 22-26 ). In some cases these small calcifi cations have a round shape with a radiopaque enamel-like margin, giving a shape similar to that of a small doughnut. Most often an associated impacted tooth is present.
Differential Diagnosis If calcifi cation is not detected, this tumor cannot be differentiated from an ameloblastic fi broma. Differentiation from a developing odontoma may be diffi cult, but generally these tumors have a greater soft tissue component (radiolucent) than does an odontoma. It may be argued that, given time, the amount of hard tissue will increase; however, the distribution of hard tissue is different. A complex odon-toma, which shares a common location, usually has one mass of dis-organized tissue in the center, whereas the ameloblastic fi bro-odontoma will usually have multiple scattered mature small pieces of dental hard tissue. Although the compound odontoma has multiple denticles, the posterior mandible is a rare location and the organization of the tooth material in ameloblastic fi bro-odontomes is never organized enough to resemble a tooth. Last, the ameloblastic fi bro-odontomas do not occur early enough, compared with odontomas, to be considered a precursor.
FIG. 22-25 A, An ameloblastic fi broma appearing as a unilocular outgrowth of the follicle of the unerupted fi rst permanent molar. B, A cropped panoramic image. C, A periapical fi lm illustrating an ameloblastic fi broma associated with the crowns of the fi rst and second molars.
A B C
Treatment Usually conservative enucleation is used, although recurrence has been reported.
Adenomatoid Odontogenic Tumor
Synonyms Adenoameloblastoma and ameloblastic adenomatoid tumor
Defi nition Adenomatoid odontogenic tumors are uncommon nonaggressive tumors of odontogenic epithelium in variety of patterns mixed with mature connective tissue stroma. The origin of adenomatoid odonto-genic tumors may be from enamel organ epithelium, and it is classi-fi ed as a mixed tumor because it contains connective tissue stroma and sometimes dentinoid material. Adenomatoid odontogenic tumors comprise 3% of all oral tumors. Both central and peripheral tumors occur. The central tumors are divided into the follicular type (those associated with the crown of an embedded tooth) and the extrafol-licular type (those with no embedded tooth). Approximately 73% of central lesions are of the follicular type.
Clinical Features Adenomatoid odontogenic tumors appear in the age range of 5 to 50 years; however, about 70% occur in the second decade, with an average age of 16 years. The tumor has a 2 : 1 female predilection. The follicular type is diagnosed somewhat earlier than the extrafollicular type, probably because the failure of the associated tooth to erupt is noted. The tumor is slow growing and presents as a gradually enlarg-ing, painless swelling or asymmetry, often associated with a missing tooth.
Radiographic Features Location. At least 75% of adenomatoid odontogenic tumors
occur in the maxilla ( Fig. 22-27 ). The incisor- canine-premolar region, especially the cuspid region, is the usual area involved in both jaws. It occurs more commonly in the maxilla. This tumor may have a follicu-lar relationship with an impacted tooth; however, often it does not
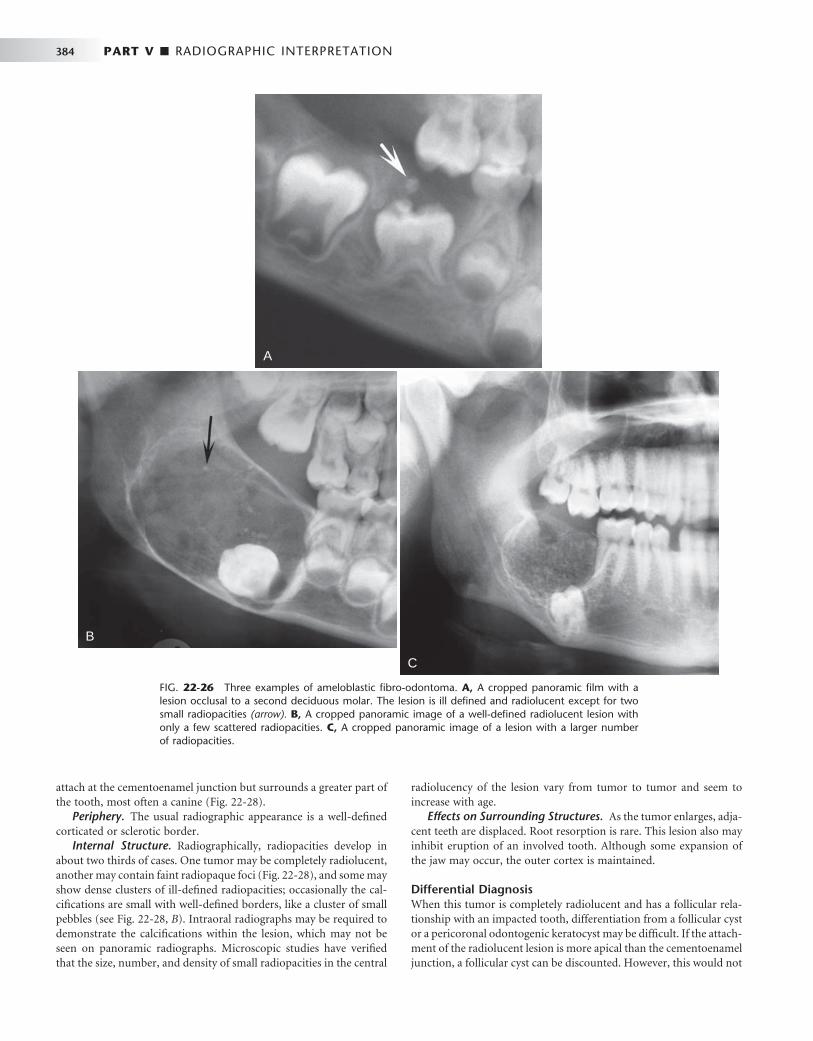
384 PART V ■ RADIOGRAPHIC INTERPRETATION
A
B
C
FIG. 22-26 Three examples of ameloblastic fi bro-odontoma. A, A cropped panoramic fi lm with a lesion occlusal to a second deciduous molar. The lesion is ill defi ned and radiolucent except for two small radiopacities (arrow). B, A cropped panoramic image of a well-defi ned radiolucent lesion with only a few scattered radiopacities. C, A cropped panoramic image of a lesion with a larger number of radiopacities.
attach at the cementoenamel junction but surrounds a greater part of the tooth, most often a canine ( Fig. 22-28 ).
Periphery. The usual radiographic appearance is a well-defi ned corticated or sclerotic border.
Internal Structure. Radiographically, radiopacities develop in about two thirds of cases. One tumor may be completely radiolucent, another may contain faint radiopaque foci ( Fig. 22-28 ), and some may show dense clusters of ill-defi ned radiopacities; occasionally the cal-cifi cations are small with well-defi ned borders, like a cluster of small pebbles (see Fig. 22-28, B ). Intraoral radiographs may be required to demonstrate the calcifi cations within the lesion, which may not be seen on panoramic radiographs. Microscopic studies have verifi ed that the size, number, and density of small radiopacities in the central
radiolucency of the lesion vary from tumor to tumor and seem to increase with age.
Effects on Surrounding Structures. As the tumor enlarges, adja-cent teeth are displaced. Root resorption is rare. This lesion also may inhibit eruption of an involved tooth. Although some expansion of the jaw may occur, the outer cortex is maintained.
Differential Diagnosis When this tumor is completely radiolucent and has a follicular rela-tionship with an impacted tooth, differentiation from a follicular cyst or a pericoronal odontogenic keratocyst may be diffi cult. If the attach-ment of the radiolucent lesion is more apical than the cementoenamel junction, a follicular cyst can be discounted. However, this would not

CHAPTER 22 ■ BENIGN TUMORS OF THE JAWS 385
people, it occasionally is related to a tooth that failed to erupt or is missing, and in some cases odontogenic epithelium can be detected microscopically.
Clinical Features If odontogenic myxomas have a sex predilection, they slightly favor females. Although the lesion can occur at any age, more than half arise in individuals between 10 and 30 years old; it rarely occurs before age
FIG. 22-27 An adenomatoid odontogenic tumor in the region of the right maxillary canine and lateral incisor. Calcifi cation is present within the tumor mass, and the canine and lateral incisor have been displaced by the lesion. (Courtesy R. Howell, DDS, Morgantown, W.V.)
FIG. 22-28 Examples of adenomatoid odontogenic tumor with various amount of internal calcifi ca-tion. A, A cropped panoramic fi lm with a totally radiolucent lesion associated with a mandibular cuspid. B, A lesion with sparse pebblelike calcifi cations associated with a maxillary cuspid. C, A lesion related to a maxillary lateral incisor with abundant calcifi cation.
A B C
exclude an odontogenic keratocyst. If there is a calcifi ed product (radi-opacities) in this tumor, then other lesions with calcifi cations might be entertained in the differential diagnosis. The maxillary and man-dibular anterior regions are also common sites for calcifying odonto-genic cysts. It may not be possible to differentiate the extrafollicular type of adenomatoid odontogenic tumor from the calcifying odonto-genic cyst. The ameloblastic fi bro-odontoma and the CEOT occur more commonly in the posterior mandible.
Treatment Conservative surgical excision is adequate because the tumor is not locally invasive, is well encapsulated, and is separated easily from the bone. The theory that adenomatoid odontogenic tumors are hamar-tomas is supported by the innocuous behavior of the lesion because, as with odontomas, adenomatoid odontogenic tumors stop develop-ing about the time tooth structures complete their growth. The recur-rence rate is 0.2%.
MESENCHYMAL TUMORS (ODONTOGENIC ECTOMESENCHYME)
Odontogenic Myxoma
Synonyms Myxoma, myxofi broma, and fi bromyxoma
Defi nition Odontogenic myxomas are uncommon, accounting for only 3% to 6% of odontogenic tumors. They are benign, intraosseous neoplasms that arise from odontogenic ectomesenchyme and resemble the mesenchymal portion of the dental papilla. These myxomas are not encapsulated and tend to infi ltrate the surrounding cancellous bone but do not metastasize. They have a loose, gelatinous consistency and show microscopic characteristics similar to those of soft tissue myxomas of the extremities. Odontogenic myxomas develop only in the bones of the facial skeleton. The theory that this lesion develops from odontogenic rather than nonodontogenic ectomesenchyme is supported by the fact that it appears only in the jaws, it affects young

386 PART V ■ RADIOGRAPHIC INTERPRETATION
10 years or after age 50 years. It grows slowly and may or may not cause pain. Eventually it causes swelling and may grow quite large if left untreated. It may also invade the maxillary sinus. Recurrence rates as high as 25% have been reported. This high rate may be explained by the lack of encapsulation of the tumor, its poorly defi ned boundar-ies, and the extension of nests or pockets of myxoid (jellylike) tumor into trabecular spaces, where they are diffi cult to detect and remove surgically.
Radiographic Features Location. Myxomas more commonly affect the mandible by a
margin of 3 : 1. In the mandible these tumors occur in the premolar and molar areas and only rarely in the ramus and condyle (non – tooth-bearing areas). Myxomas in the maxilla usually involve the alveolar process in the premolar and molar regions and the zygomatic process.
Periphery. The lesion usually is well defi ned, and it may have a corticated margin but most often is poorly defi ned, especially in the maxilla.
Internal Structure. When it occurs pericoronally with an impacted tooth, an odontogenic myxoma may have a cystlike unilocu-lar outline, although the majority has a mixed radiolucent-radiopaque internal pattern. Residual bone trapped within the tumor will remodel into curved and straight, coarse or fi ne septa. The presence of these septa gives the tumor a multilocular appearance. A characteristic septa identifi ed with this tumor is a straight, thin-etched septa ( Fig. 22-29 ). These have been described as making a tennis racket – like or stepladder-like pattern, but this pattern is rarely seen. In reality, the majority of the septa are curved and coarse but the fi nding of one or two of these straight septa will help in the identifi cation of this tumor ( Fig. 22-30 ).
Effects on Surrounding Structures. When growing in a tooth-bearing area, the tumor displaces and loosens teeth but rarely causes resorption of teeth. The lesion also frequently scallops between the roots of adjacent teeth, similar to a simple bone cyst. This tumor has a tendency to grow along the involved bone without the same amount of expansion seen with other benign tumors; however, when a large size is achieved, there may be considerable expansion.
FIG. 22-29 An odontogenic myxoma. A, A panoramic fi lm of a large myxoma in the body and ramus of the right mandible. B, A periapical view. C, A coronal CT image of the same case; note the presence of a few straight septa, especially visible in the CT image (arrow). The CT image also shows some modest expansion considering the overall size of the tumor. D, A periapical view of a different lesion; note the one straight sharp septa (arrow).
A
C D
B

CHAPTER 22 ■ BENIGN TUMORS OF THE JAWS 387
Internal Structure. Benign cementoblastomas are mixed radio-lucent-radiopaque lesions where the majority of the internal structure is radiopaque. The resulting pattern may be amorphous or may have a wheel spoke pattern ( Fig. 22-32 ). The density of the cemental mass usually obscures the outline of the enveloped root. This central radi-opaque mass as mentioned is surrounded by a radiolucent band, indicating that the tumor is maturing from the central aspect to the periphery.
Effects on Surrounding Structures. If the root outline is appar-ent, in most cases various amounts of external resorption can be seen. If large enough, this tumor can cause expansion of the mandible but with an intact outer cortex.
Differential Diagnosis The most common lesion to simulate this appearance is a solitary lesion of periapical cemental dysplasia. The differential diagnosis may be diffi cult in some cases and the presence or absence of symptoms or observation of the lesion over a period of time may be required. In general, the radiolucent band around the benign cementoblastoma is usually better defi ned and uniform than with cemental dysplasia. Also, the pattern of growth of the cementoblastoma results in a more uniform circular shape than the more irregular undulating outline of cemental dysplasia. Other lesions that may be included in the differ-ential diagnosis would be periapical sclerosing osteitis, dense bone island, and hypercementosis. However, periapical sclerosing osteitis and dense bone islands do not have a soft tissue capsule, as does the benign cementoblastoma. Hypercementosis should be surrounded by a periodontal membrane space, which is usually thinner than the soft tissue capsule of the benign cementoblastoma, and there is no root resorption or jaw expansion with hypercementosis.
Treatment. Benign cementoblastomas are apparently self-limiting and rarely recur after enucleation. Simple excision and extraction of the associated tooth are suffi cient treatment. In some cases the tumor may be amputated from the tooth, which is then treated endodontically.
Central Odontogenic Fibroma
Synonyms Simple odontogenic fi broma and odontogenic fi broma (WHO type)
Defi nition Central odontogenic fi bromas are rare neoplasms that sometimes are divided into two types according to histologic appearance: the simple type contains mature fi brous tissue with sparsely scattered
FIG. 22-30 A fi lm of a surgical specimen of an odontogenic myxoma; note the sharp straight septa (arrow).
Additional Imaging. CT and in particular MRI can help in establishing the intraosseous extent of the tumor and thus guide the surgeon in planning the resection margins. The high tissue signal characteristic of this tumor in T2-weighted magnetic resonance images is particularly useful in establishing tumor extent and the presence of a recurrent tumor ( Fig. 22-31 ).
Differential Diagnosis Because odontogenic myxomas most often have a multilocular inter-nal pattern, the differential diagnosis should include other multilocu-lar lesions such as ameloblastomas, central giant cell granulomas, and central hemangiomas. The fi nding of characteristic thin straight septa with less-than-expected bone expansion is very useful in the differen-tial diagnosis. On occasion, a small area of expansion with straight septa may be projected over an intact outer bony cortex and give a spiculated appearance seen in osteogenic sarcomas (see Fig. 22-29, D ). Careful inspection of this area of expansion will reveal a thin but intact outer cortex that would not be seen in osteogenic sarcoma. On occa-sion, the odontogenic fi broma will have the same radiographic char-acteristics as, and cannot be reliably differentiated from, the myxoma.
Treatment Odontogenic myxomas are treated by resection with a generous amount of surrounding bone to ensure removal of myxomatous tumor that infi ltrates the adjacent marrow spaces. With appropriate treatment, the prognosis is good.
Benign Cementoblastoma
Synonyms Cementoblastoma and true cementoma
Defi nition Benign cementoblastomas are slow-growing mesenchymal neoplasms composed principally of cementum-like tissue. The tumor manifests as a bulbous growth around and attached to the apex of a tooth root. Its histologic characteristics are similar to those of osteoblastomas, and some authors consider cementoblastomas to be osteoblastomas. Putative cementoblasts that compose this tumor produce cementum-like material and abnormal bone. The tumor most often develops with permanent teeth but in rare cases occurs with primary teeth.
Clinical Features Although statistical data suggest that benign cementoblastomas are uncommon, many believe that they occur more often than published accounts indicate. The lesion is more common in males than in females, and the ages of reported patients range from 12 to 65 years, although most patients are relatively young. There is no racial predi-lection. The tumor usually is a solitary lesion that is slow growing but that may eventually displace teeth. The involved tooth is vital and often painful. The pain seems to vary from patient to patient and can be relieved by anti-infl ammatory drugs.
Radiographic Features Location. Benign cementoblastomas occur more often in the
mandible (78%) and form most commonly on a premolar or fi rst molar (90%).
Periphery. The lesion is a well-defi ned radiopacity with a cortical border and then a well-defi ned radiolucent band just inside the corti-cal border.
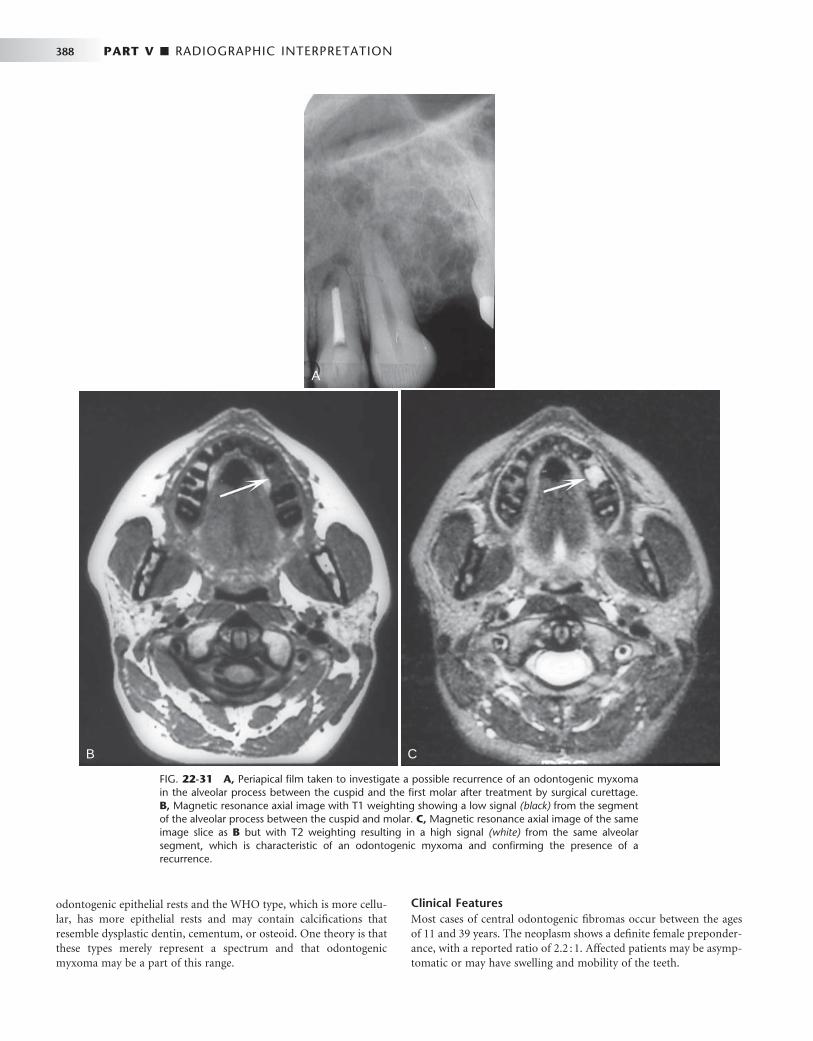
388 PART V ■ RADIOGRAPHIC INTERPRETATION
A
B C
FIG. 22-31 A, Periapical fi lm taken to investigate a possible recurrence of an odontogenic myxoma in the alveolar process between the cuspid and the fi rst molar after treatment by surgical curettage. B, Magnetic resonance axial image with T1 weighting showing a low signal (black) from the segment of the alveolar process between the cuspid and molar. C, Magnetic resonance axial image of the same image slice as B but with T2 weighting resulting in a high signal (white) from the same alveolar segment, which is characteristic of an odontogenic myxoma and confi rming the presence of a recurrence.
odontogenic epithelial rests and the WHO type, which is more cellu-lar, has more epithelial rests and may contain calcifi cations that resemble dysplastic dentin, cementum, or osteoid. One theory is that these types merely represent a spectrum and that odontogenic myxoma may be a part of this range.
Clinical Features Most cases of central odontogenic fi bromas occur between the ages of 11 and 39 years. The neoplasm shows a defi nite female preponder-ance, with a reported ratio of 2.2 : 1. Affected patients may be asymp-tomatic or may have swelling and mobility of the teeth.

CHAPTER 22 ■ BENIGN TUMORS OF THE JAWS 389
Nonodontogenic Tumors
BENIGN TUMORS OF NEURAL ORIGIN
Neurilemmoma
Synonym Schwannoma
Defi nition A central neurilemmoma is a tumor of neuroectodermal origin, arising from the Schwann cells that make up the inner layer covering the peripheral nerves. Although rare, it is the most common intraos-seous nerve tumor. This tumor has practically no potential for malig-nant transformation.
Clinical Features Neurilemmomas grow slowly, can occur at any age (but most com-monly arise in the second and third decades), and occur with equal frequency in both males and females. The mandible and sacrum are the most common sites. These lesions cause few symptoms other than those related to the location and size of the tumor. The usual com-plaint is a swelling. Although pain is uncommon unless the tumor encroaches on adjacent nerves, paresthesia may arise, especially with lesions originating in the inferior alveolar canal. Pain, when present, usually develops at the site of the tumor; if paresthesia occurs, it is felt anterior to the tumor.
Radiographic Features Location. Neurilemmomas most often involve the mandible,
with fewer than 1 in 10 cases occurring in the maxilla. The tumor most often is located within an expanded inferior alveolar nerve canal posterior to the mental foramen ( Fig. 22-33 ).
FIG. 22-32 Cementoblastoma. A, A portion of a panoramic radiograph showing a large, bulbous, radiopaque mass attached to the roots of the mandibular right fi rst molar. A radiolucent band can be seen surrounding the mass, and root resorption of the molar roots has occurred. B, A periapical radiograph of a lesion associated with a bicuspid. (Courtesy B. Pynn, Canada.)
A B
Radiographic Features Location. Central odontogenic fi bromas occur slightly more
often in the mandible. The prevalent site in the mandible is the molar-premolar region and in the maxilla anterior to the fi rst molar.
Periphery. The periphery usually is well defi ned. Internal Structure. Smaller lesions usually are unilocular, and
larger lesions have a multilocular pattern. The internal septa may be fi ne and straight, as in odontogenic myxomas, or it may be granular, resembling those seen in giant cell granulomas. Some lesions are totally radiolucent, whereas unorganized internal calcifi cation has been reported in others.
Effects on Surrounding Structures. A central odontogenic fi broma may cause expansion with maintenance of a thin cortical boundary or on occasion can grow along the bone with minimum expansion, similar to an odontogenic myxoma. Tooth displacement is common, and root resorption has been reported.
Differential Diagnosis The histologic features may resemble those of a central (originating in bone) desmoplastic fi broma if no epithelial rests are apparent. Desmoplastic fi bromas are more aggressive and tend to break through the peripheral cortex and invade surrounding soft tissue. The septa in desmoplastic fi broma will be very thick, straight, and angular. If thin, straight septa are present in the odontogenic fi broma, it may not be possible to differentiate this neoplasm from an odontogenic myxoma on radiographic criteria alone. If granular septa are present, the radiographic appearance may be identical to that of a giant cell granuloma.
Treatment Central odontogenic fi bromas are treated with simple excision. These lesions have a very low recurrence rate.
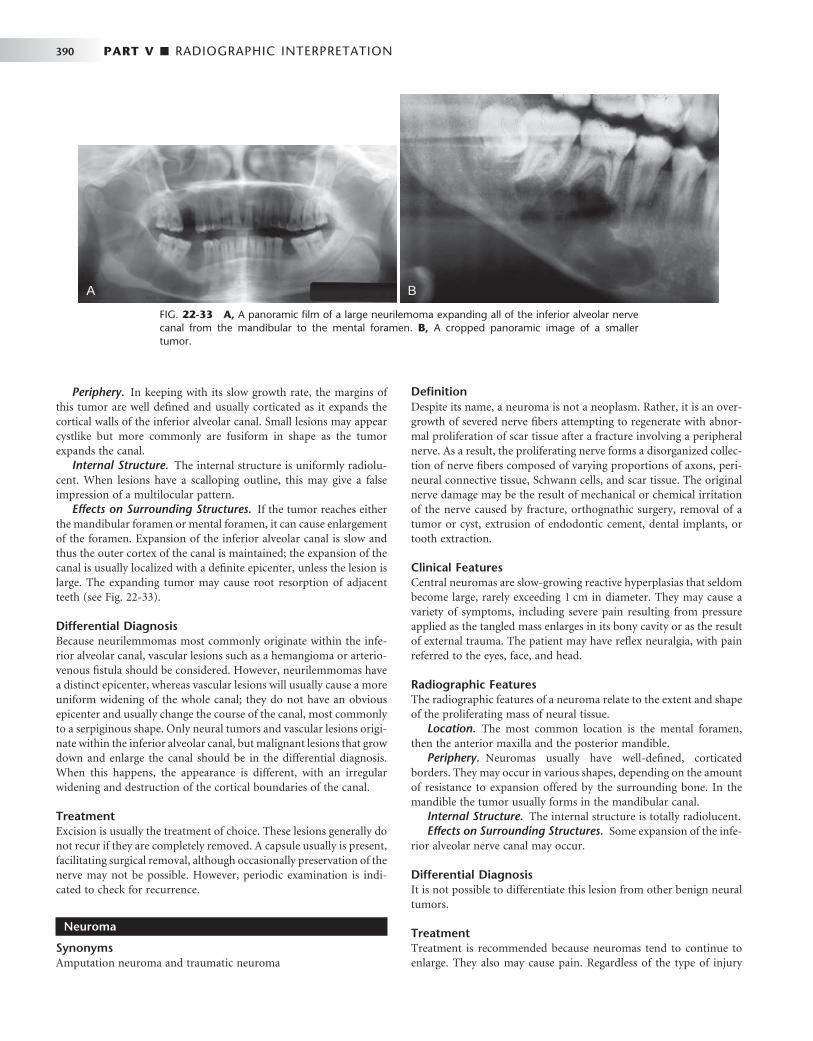
390 PART V ■ RADIOGRAPHIC INTERPRETATION
Defi nition Despite its name, a neuroma is not a neoplasm. Rather, it is an over-growth of severed nerve fi bers attempting to regenerate with abnor-mal proliferation of scar tissue after a fracture involving a peripheral nerve. As a result, the proliferating nerve forms a disorganized collec-tion of nerve fi bers composed of varying proportions of axons, peri-neural connective tissue, Schwann cells, and scar tissue. The original nerve damage may be the result of mechanical or chemical irritation of the nerve caused by fracture, orthognathic surgery, removal of a tumor or cyst, extrusion of endodontic cement, dental implants, or tooth extraction.
Clinical Features Central neuromas are slow-growing reactive hyperplasias that seldom become large, rarely exceeding 1 cm in diameter. They may cause a variety of symptoms, including severe pain resulting from pressure applied as the tangled mass enlarges in its bony cavity or as the result of external trauma. The patient may have refl ex neuralgia, with pain referred to the eyes, face, and head.
Radiographic Features The radiographic features of a neuroma relate to the extent and shape of the proliferating mass of neural tissue.
Location. The most common location is the mental foramen, then the anterior maxilla and the posterior mandible.
Periphery. Neuromas usually have well-defi ned, corticated borders. They may occur in various shapes, depending on the amount of resistance to expansion offered by the surrounding bone. In the mandible the tumor usually forms in the mandibular canal.
Internal Structure. The internal structure is totally radiolucent. Effects on Surrounding Structures. Some expansion of the infe-
rior alveolar nerve canal may occur.
Differential Diagnosis It is not possible to differentiate this lesion from other benign neural tumors.
Treatment Treatment is recommended because neuromas tend to continue to enlarge. They also may cause pain. Regardless of the type of injury
FIG. 22-33 A, A panoramic fi lm of a large neurilemoma expanding all of the inferior alveolar nerve canal from the mandibular to the mental foramen. B, A cropped panoramic image of a smaller tumor.
Periphery. In keeping with its slow growth rate, the margins of this tumor are well defi ned and usually corticated as it expands the cortical walls of the inferior alveolar canal. Small lesions may appear cystlike but more commonly are fusiform in shape as the tumor expands the canal.
Internal Structure. The internal structure is uniformly radiolu-cent. When lesions have a scalloping outline, this may give a false impression of a multilocular pattern.
Effects on Surrounding Structures. If the tumor reaches either the mandibular foramen or mental foramen, it can cause enlargement of the foramen. Expansion of the inferior alveolar canal is slow and thus the outer cortex of the canal is maintained; the expansion of the canal is usually localized with a defi nite epicenter, unless the lesion is large. The expanding tumor may cause root resorption of adjacent teeth (see Fig. 22-33 ).
Differential Diagnosis Because neurilemmomas most commonly originate within the infe-rior alveolar canal, vascular lesions such as a hemangioma or arterio-venous fi stula should be considered. However, neurilemmomas have a distinct epicenter, whereas vascular lesions will usually cause a more uniform widening of the whole canal; they do not have an obvious epicenter and usually change the course of the canal, most commonly to a serpiginous shape. Only neural tumors and vascular lesions origi-nate within the inferior alveolar canal, but malignant lesions that grow down and enlarge the canal should be in the differential diagnosis. When this happens, the appearance is different, with an irregular widening and destruction of the cortical boundaries of the canal.
Treatment Excision is usually the treatment of choice. These lesions generally do not recur if they are completely removed. A capsule usually is present, facilitating surgical removal, although occasionally preservation of the nerve may not be possible. However, periodic examination is indi-cated to check for recurrence.
Neuroma
Synonyms Amputation neuroma and traumatic neuroma
A B

CHAPTER 22 ■ BENIGN TUMORS OF THE JAWS 391
that precipitates development of the neuroma, recurrence is uncom-mon after simple excision.
Neurofi broma
Synonym Neurinoma
Defi nition Neurofi bromas are moderately fi rm, benign, well-circumscribed tumors caused by proliferation of Schwann cells in a disorderly pattern that includes portions of nerve fi bers, such as peripheral nerves, axons, and connective tissue of the sheath of Schwann. As neurofi bromas grow, they incorporate axons. In contrast, neurilemomas are com-posed entirely of Schwann cells and grow by displacing axons.
Clinical Features The central lesion of a neurofi broma may be the same as the multiple lesions that develop in von Recklinghausen disease. Central lesions also may occur in that syndrome but are rare. Neurofi bromas can occur at any age but usually are found in young patients. Neurofi bro-mas associated with the mandibular nerve may produce pain or par-esthesia. Neurofi bromas also may expand and perforate the cortex; causing swelling that is hard or fi rm to palpation.
Radiographic Features Location. Central neurofi bromas may occur in the mandibular
canal, in the cancellous bone, and below the periosteum. Periphery. As with neurilemomas, the margins of the radiolu-
cency in neurofi bromas usually are sharply defi ned and may be cor-ticated. However, despite the benign nature and slow growth of the neurofi broma, some of these lesions have indistinct margins.
Internal Structure. The tumors usually appear unilocular but on occasion may have a multilocular appearance.
Effects on Surrounding Structures. A neurofi broma of the inferior dental nerve shows a fusiform enlargement of the canal ( Fig. 22-34 ).
Differential Diagnosis Differentiation from other types of neural lesions may not be possible. This tumor can be differentiated from vascular lesions because the expansion of the canal is in a fusiform shape, whereas vascular lesions enlarge the whole canal and alter its path.
Treatment Solitary central lesions that have been excised seldom recur. However, it is wise to re-examine the area periodically because these tumors are not encapsulated and some undergo malignant change.
Neurofi bromatosis
Synonym von Recklinghausen disease
Defi nition Neurofi bromatosis is a syndrome consisting of caf é -au-lait spots on the skin, multiple peripheral nerve tumors, and a variety of other dysplastic abnormalities of the skin, nervous system, bones, endocrine organs, and blood vessels. The two major classifi cations are NF-1, a generalized form, and NF-2, a central form. Oral lesions may occur as part of NF-1 or may be solitary and are called segmental or forme fruste manifestations ( Fig. 22-35 ). Recent observations of abnormal fat tissue in close association with changes in the osseous structure of the mandible support the theory that a mesodermal dys-plasia is part of the spectrum of changes that may be observed in NF-1 lesions.
Clinical Features Neurofi bromatosis is one of the most common genetic diseases, occurring in 1 in every 3000 births and present in about 30 people per 10,000 population. The peripheral nerve tumors are of two types, schwannomas and neurofi bromas. Some manifestations are congeni-tal, but most appear gradually during childhood and adult life. Caf é -au-lait spots become larger and more numerous with age; most
FIG. 22-34 Neurofi broma. A, A portion of a panoramic radiograph showing a neurofi broma forming in the mandibular body along the path of the mandibular canal. B, A cropped panoramic image of a neurofi broma within the body of the left mandible; note the fusiform shape as the tumor expands the canal.
A B

392 PART V ■ RADIOGRAPHIC INTERPRETATION
patients eventually have more than six spots larger than 1.5 cm in diameter. Other skin lesions include freckles, soft pedunculated cuta-neous neurofi bromas, and fi rm subcutaneous neurofi bromas.
Radiographic Features The radiographic changes in the jaws with neurofi bromatosis can be characteristic. These changes include the following alterations in the shape of the mandible: enlargement of the coronoid notch in either or both the horizontal and vertical dimensions, an obtuse angle between the body and the ramus, deformity of the condylar head, lengthening of the condylar neck, and lateral bowing and thinning of the ramus, as seen in basal skull views (see Fig. 22-35 ). Changes in mandibular morphology can continue to increase in severity through the second decade. Other radiographic changes include enlargement of the mandibular canal and mental and mandibular foramina and an increased incidence of branched mandibular canal. Erosive changes to the outer contour of the mandible and interference with normal
eruption of the molars also may occur. Abnormal accumulations of fatty tissue within deformities of the mandible have been observed in images produced by CT (see Fig. 22-35, C ).
Treatment Most patients live a normal life with few or no symptoms. Small cutaneous and subcutaneous neurofi bromas can be removed if they are painful, but large plexiform neurofi bromas should be left alone. Malignant conversion of these lesions has occurred in rare cases.
MESODERMAL TUMORS
Osteoma
Defi nition Osteomas can form from membranous bones of the skull and face. The cause of the slowly growing osteoma is obscure, but the tumor may arise from cartilage or embryonal periosteum. It is not clear
FIG. 22-35 An example of segmental neurofi bromatosis involving the mandible. A, Panoramic fi lm demonstrating enlargement of the left coronoid notch, enlargement of the mandibular foramen, and interference of the eruption of the fi rst and second molars. B, Basal skull view of the same case reveal-ing thinning and bowing of the ramus in a lateral direction (arrow). C, CT axial image with soft tissue algorithm showing fatty tissue adjacent to the abnormal ramus (arrow).
A
B C
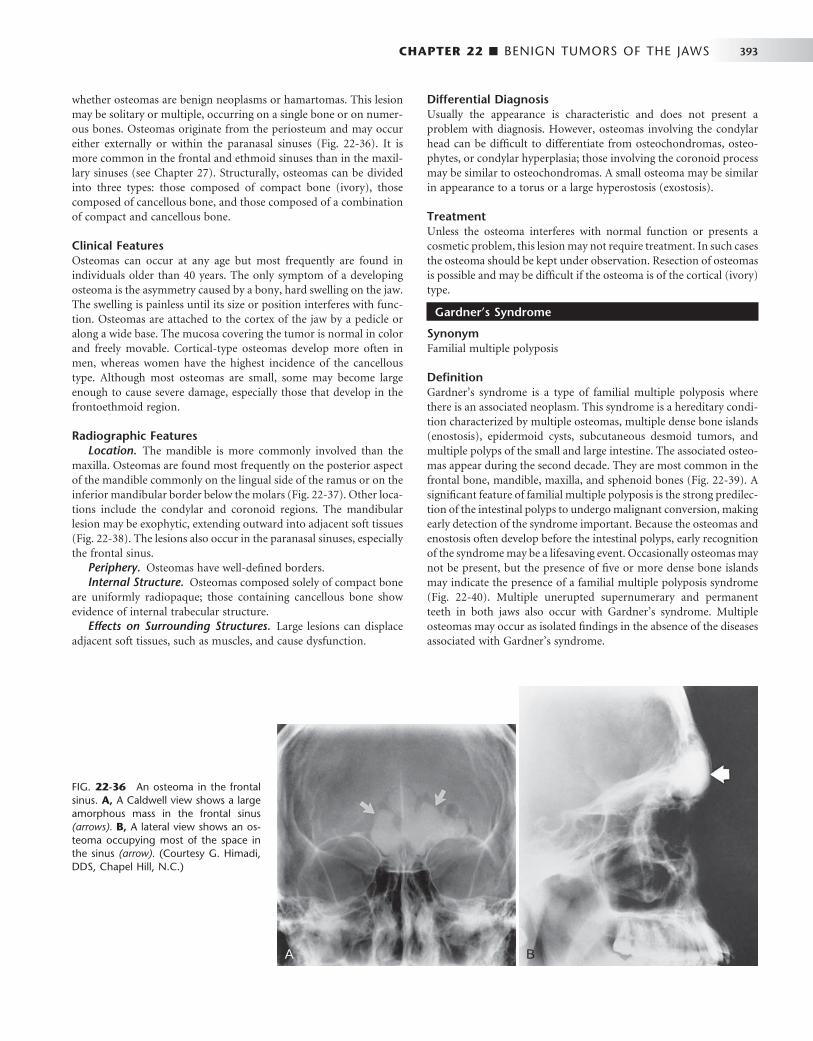
CHAPTER 22 ■ BENIGN TUMORS OF THE JAWS 393
whether osteomas are benign neoplasms or hamartomas. This lesion may be solitary or multiple, occurring on a single bone or on numer-ous bones. Osteomas originate from the periosteum and may occur either externally or within the paranasal sinuses ( Fig. 22-36 ). It is more common in the frontal and ethmoid sinuses than in the maxil-lary sinuses (see Chapter 27 ). Structurally, osteomas can be divided into three types: those composed of compact bone (ivory), those composed of cancellous bone, and those composed of a combination of compact and cancellous bone.
Clinical Features Osteomas can occur at any age but most frequently are found in individuals older than 40 years. The only symptom of a developing osteoma is the asymmetry caused by a bony, hard swelling on the jaw. The swelling is painless until its size or position interferes with func-tion. Osteomas are attached to the cortex of the jaw by a pedicle or along a wide base. The mucosa covering the tumor is normal in color and freely movable. Cortical-type osteomas develop more often in men, whereas women have the highest incidence of the cancellous type. Although most osteomas are small, some may become large enough to cause severe damage, especially those that develop in the frontoethmoid region.
Radiographic Features Location. The mandible is more commonly involved than the
maxilla. Osteomas are found most frequently on the posterior aspect of the mandible commonly on the lingual side of the ramus or on the inferior mandibular border below the molars ( Fig. 22-37 ). Other loca-tions include the condylar and coronoid regions. The mandibular lesion may be exophytic, extending outward into adjacent soft tissues ( Fig. 22-38 ). The lesions also occur in the paranasal sinuses, especially the frontal sinus.
Periphery. Osteomas have well-defi ned borders. Internal Structure. Osteomas composed solely of compact bone
are uniformly radiopaque; those containing cancellous bone show evidence of internal trabecular structure.
Effects on Surrounding Structures. Large lesions can displace adjacent soft tissues, such as muscles, and cause dysfunction.
FIG. 22-36 An osteoma in the frontal sinus. A, A Caldwell view shows a large amorphous mass in the frontal sinus (arrows). B, A lateral view shows an os-teoma occupying most of the space in the sinus (arrow). (Courtesy G. Himadi, DDS, Chapel Hill, N.C.)
A B
Differential Diagnosis Usually the appearance is characteristic and does not present a problem with diagnosis. However, osteomas involving the condylar head can be diffi cult to differentiate from osteochondromas, osteo-phytes, or condylar hyperplasia; those involving the coronoid process may be similar to osteochondromas. A small osteoma may be similar in appearance to a torus or a large hyperostosis (exostosis).
Treatment Unless the osteoma interferes with normal function or presents a cosmetic problem, this lesion may not require treatment. In such cases the osteoma should be kept under observation. Resection of osteomas is possible and may be diffi cult if the osteoma is of the cortical (ivory) type.
Gardner ’ s Syndrome
Synonym Familial multiple polyposis
Defi nition Gardner ’ s syndrome is a type of familial multiple polyposis where there is an associated neoplasm. This syndrome is a hereditary condi-tion characterized by multiple osteomas, multiple dense bone islands (enostosis), epidermoid cysts, subcutaneous desmoid tumors, and multiple polyps of the small and large intestine. The associated osteo-mas appear during the second decade. They are most common in the frontal bone, mandible, maxilla, and sphenoid bones ( Fig. 22-39 ). A signifi cant feature of familial multiple polyposis is the strong predilec-tion of the intestinal polyps to undergo malignant conversion, making early detection of the syndrome important. Because the osteomas and enostosis often develop before the intestinal polyps, early recognition of the syndrome may be a lifesaving event. Occasionally osteomas may not be present, but the presence of fi ve or more dense bone islands may indicate the presence of a familial multiple polyposis syndrome ( Fig. 22-40 ). Multiple unerupted supernumerary and permanent teeth in both jaws also occur with Gardner ’ s syndrome. Multiple osteomas may occur as isolated fi ndings in the absence of the diseases associated with Gardner ’ s syndrome.
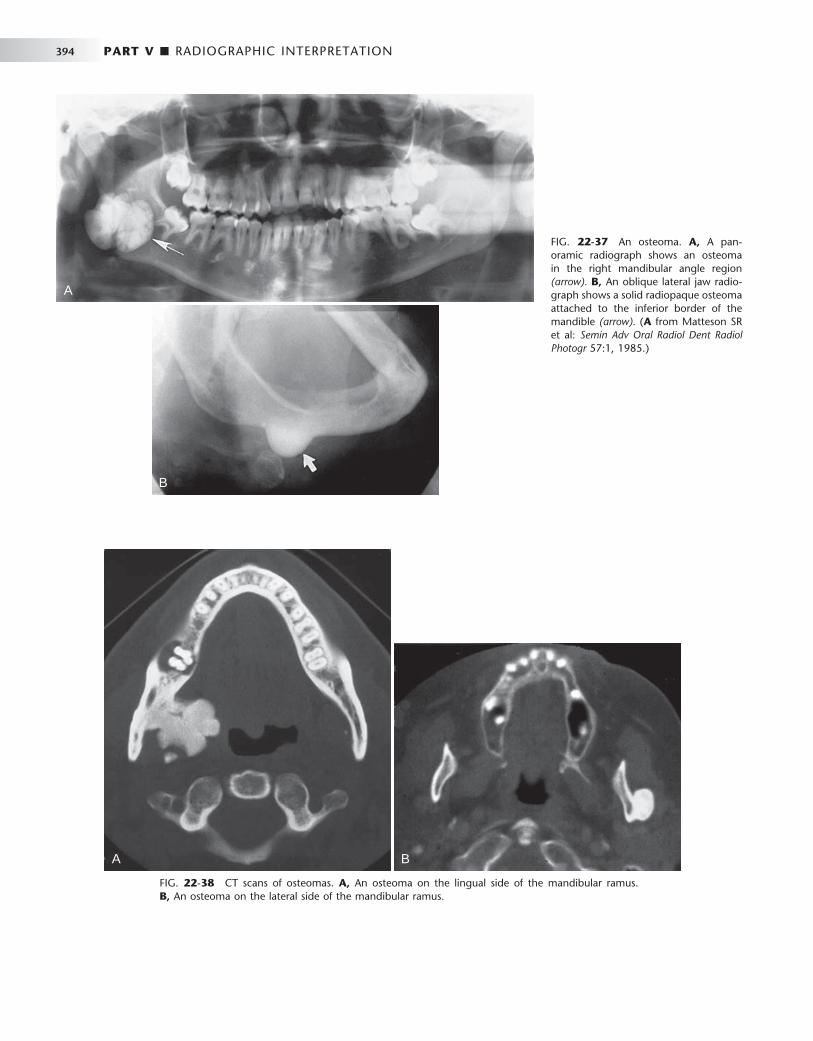
394 PART V ■ RADIOGRAPHIC INTERPRETATION
A
B
FIG. 22-37 An osteoma. A, A pan-oramic radiograph shows an osteoma in the right mandibular angle region (arrow). B, An oblique lateral jaw radio-graph shows a solid radiopaque osteoma attached to the inferior border of the mandible (arrow). ( A from Matteson SR et al: Semin Adv Oral Radiol Dent Radiol Photogr 57:1, 1985.)
FIG. 22-38 CT scans of osteomas. A, An osteoma on the lingual side of the mandibular ramus. B, An osteoma on the lateral side of the mandibular ramus.
A B
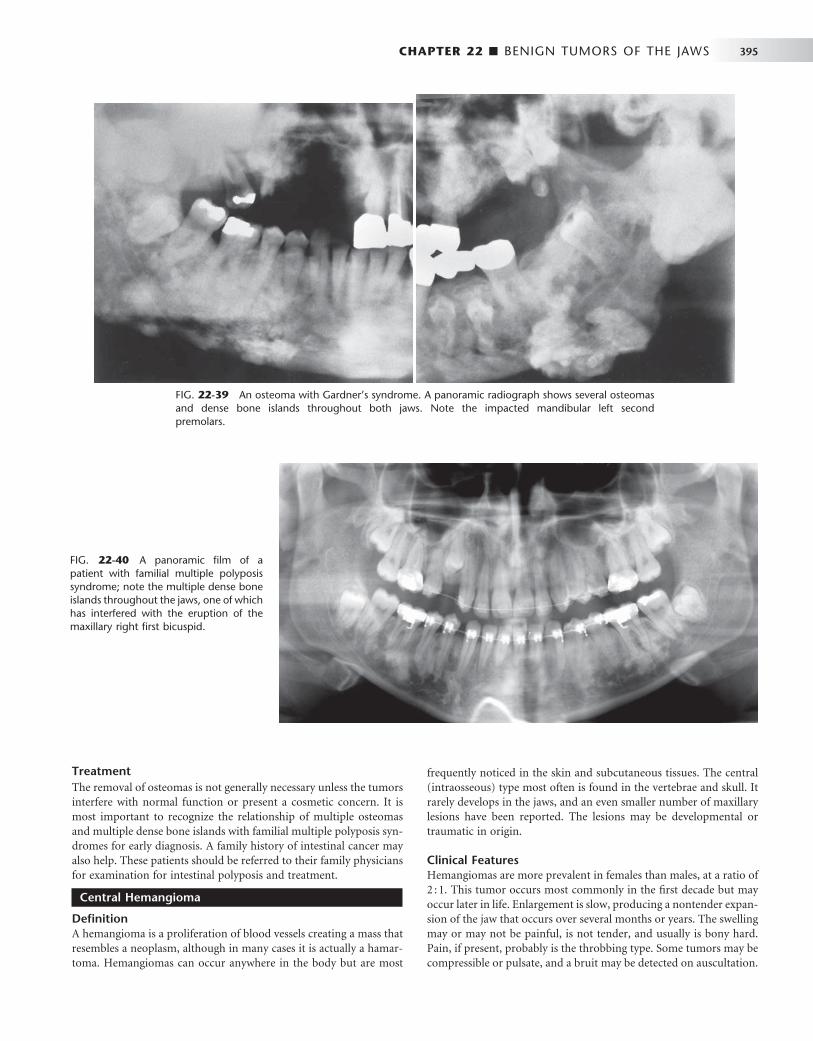
CHAPTER 22 ■ BENIGN TUMORS OF THE JAWS 395
frequently noticed in the skin and subcutaneous tissues. The central (intraosseous) type most often is found in the vertebrae and skull. It rarely develops in the jaws, and an even smaller number of maxillary lesions have been reported. The lesions may be developmental or traumatic in origin.
Clinical Features Hemangiomas are more prevalent in females than males, at a ratio of 2 : 1. This tumor occurs most commonly in the fi rst decade but may occur later in life. Enlargement is slow, producing a nontender expan-sion of the jaw that occurs over several months or years. The swelling may or may not be painful, is not tender, and usually is bony hard. Pain, if present, probably is the throbbing type. Some tumors may be compressible or pulsate, and a bruit may be detected on auscultation.
FIG. 22-39 An osteoma with Gardner ’ s syndrome. A panoramic radiograph shows several osteomas and dense bone islands throughout both jaws. Note the impacted mandibular left second premolars.
Treatment The removal of osteomas is not generally necessary unless the tumors interfere with normal function or present a cosmetic concern. It is most important to recognize the relationship of multiple osteomas and multiple dense bone islands with familial multiple polyposis syn-dromes for early diagnosis. A family history of intestinal cancer may also help. These patients should be referred to their family physicians for examination for intestinal polyposis and treatment.
Central Hemangioma
Defi nition A hemangioma is a proliferation of blood vessels creating a mass that resembles a neoplasm, although in many cases it is actually a hamar-toma. Hemangiomas can occur anywhere in the body but are most
FIG. 22-40 A panoramic fi lm of a patient with familial multiple polyposis syndrome; note the multiple dense bone islands throughout the jaws, one of which has interfered with the eruption of the maxillary right fi rst bicuspid.

396 PART V ■ RADIOGRAPHIC INTERPRETATION
Anesthesia of the skin supplied by the mental nerve may occur. The lesion may cause loosening and migration of teeth in the affected area. Bleeding may occur from the gingiva around the neck of the affected teeth. These teeth may demonstrate rebound mobility; that is, when depressed into their sockets, they rebound to their original position within several minutes because of the pressure of the vascular network around the tooth. Aspiration with a syringe produces arterial blood that may be under considerable pressure.
Radiographic Features Location. Hemangiomas affect the mandible about twice as often
as the maxilla. In the mandible the most common site is the posterior body and ramus and within the inferior alveolar canal.
Periphery. In some instances the periphery is well defi ned and corticated, and in other cases it may be ill defi ned and even simulate the appearance of a malignant tumor. This variation probably is related to the amount of residual bone present around the blood vessels. The formation of linear spicules of bone emanating from the surface of the bone in a sunraylike appearance can occur when the
hemangioma breaks through the outer cortex and displaces the peri-osteum ( Fig. 22-41 ).
Internal Structure. When residual bone is trapped around the blood vessels, the result may be a multilocular appearance. Small radiolucent locules may resemble enlarged marrow spaces surrounded by coarse, dense, and well-defi ned trabeculae ( Fig. 22-42 ). These internal trabeculae may produce a honeycomb pattern composed of small circular radiolucent spaces that represent blood vessels that are oriented in the same direction of the x-ray beam. When the inferior alveolar canal is involved, the whole canal is increased in width, and often the normal path of the canal is altered into a serpiginous shape sometimes creating a multilocular appearance ( Fig. 22-43 ). Some lesions may be totally radiolucent. When the hemangioma involves soft tissue, the formation of phlebolith (small areas of calcifi cation or
FIG. 22-41 An occlusal fi lm of a case of a central hemangioma of the mandible with adjacent spiculation (arrows), which has a very similar appearance to the spiculation seen in osteogenic sarcoma.
FIG. 22-42 A hemangioma in the anterior maxilla shows a coarse trabecular pattern. (Courtesy E. J. Burkes, DDS, Chapel Hill, N.C.)
FIG. 22-43 A panoramic fi lm of a vas-cular lesion; the whole width of the left inferior alveolar canal is enlarged and it has an irregular abnormal path and the mental foramen has been enlarged (arrow).

CHAPTER 22 ■ BENIGN TUMORS OF THE JAWS 397
FIG. 22-44 A soft tissue hemangioma with phleboliths (arrows).
concretions found in a vein with slow blood fl ow) may occur within surrounding soft tissues ( Fig. 22-44 ). They develop from thrombi that become organized and mineralized and consist of calcium phosphate and calcium carbonate.
Effects on Surrounding Structures. The roots of teeth in the region of the vascular lesion are often resorbed or displaced. When the lesion involves the inferior alveolar nerve canal, the canal can be enlarged along its entire length and its shape may be changed to a serpiginous path. The mandibular and mental foramen may be enlarged. Hemangiomas can infl uence the growth of bone and teeth. The involved bone may be enlarged and have coarse internal trabecu-lae. Also, developing teeth may be larger and erupt earlier when in intimate relationship with a hemangioma ( Fig. 22-45 ).
Further diagnostic imaging to better document the distribution and degree of involvement of the osseous and soft tissues of the maxil-lofacial region should include modalities such as conventional angi-ography and magnetic resonance angiography.
Differential Diagnosis Hemangiomas should be considered in the differential diagnosis of multilocular lesions involving the body of the ramus and body of the
FIG. 22-45 A, A panoramic fi lm dem-onstrating the effect of a soft tissue hem-angioma on the developing dentition. The root development and eruption of the right cuspids and bicuspids are sig-nifi cantly advanced compared with the left side. B, An occlusal photograph from the same case; note the difference in size of the maxillary deciduous cuspids.
A
B
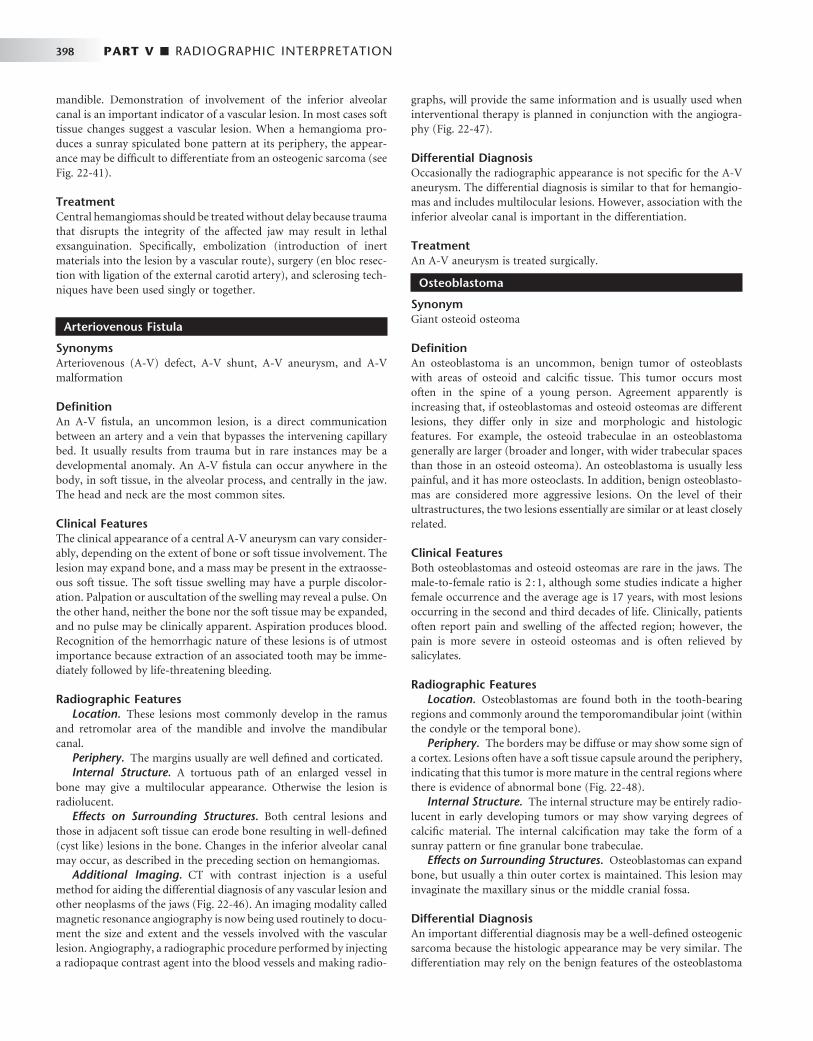
398 PART V ■ RADIOGRAPHIC INTERPRETATION
mandible. Demonstration of involvement of the inferior alveolar canal is an important indicator of a vascular lesion. In most cases soft tissue changes suggest a vascular lesion. When a hemangioma pro-duces a sunray spiculated bone pattern at its periphery, the appear-ance may be diffi cult to differentiate from an osteogenic sarcoma (see Fig. 22-41 ).
Treatment Central hemangiomas should be treated without delay because trauma that disrupts the integrity of the affected jaw may result in lethal exsanguination. Specifi cally, embolization (introduction of inert materials into the lesion by a vascular route), surgery (en bloc resec-tion with ligation of the external carotid artery), and sclerosing tech-niques have been used singly or together.
Arteriovenous Fistula
Synonyms Arteriovenous (A-V) defect, A-V shunt, A-V aneurysm, and A-V malformation
Defi nition An A-V fi stula, an uncommon lesion, is a direct communication between an artery and a vein that bypasses the intervening capillary bed. It usually results from trauma but in rare instances may be a developmental anomaly. An A-V fi stula can occur anywhere in the body, in soft tissue, in the alveolar process, and centrally in the jaw. The head and neck are the most common sites.
Clinical Features The clinical appearance of a central A-V aneurysm can vary consider-ably, depending on the extent of bone or soft tissue involvement. The lesion may expand bone, and a mass may be present in the extraosse-ous soft tissue. The soft tissue swelling may have a purple discolor-ation. Palpation or auscultation of the swelling may reveal a pulse. On the other hand, neither the bone nor the soft tissue may be expanded, and no pulse may be clinically apparent. Aspiration produces blood. Recognition of the hemorrhagic nature of these lesions is of utmost importance because extraction of an associated tooth may be imme-diately followed by life-threatening bleeding.
Radiographic Features Location. These lesions most commonly develop in the ramus
and retromolar area of the mandible and involve the mandibular canal.
Periphery. The margins usually are well defi ned and corticated. Internal Structure. A tortuous path of an enlarged vessel in
bone may give a multilocular appearance. Otherwise the lesion is radiolucent.
Effects on Surrounding Structures. Both central lesions and those in adjacent soft tissue can erode bone resulting in well-defi ned (cyst like) lesions in the bone. Changes in the inferior alveolar canal may occur, as described in the preceding section on hemangiomas.
Additional Imaging. CT with contrast injection is a useful method for aiding the differential diagnosis of any vascular lesion and other neoplasms of the jaws ( Fig. 22-46 ). An imaging modality called magnetic resonance angiography is now being used routinely to docu-ment the size and extent and the vessels involved with the vascular lesion. Angiography, a radiographic procedure performed by injecting a radiopaque contrast agent into the blood vessels and making radio-
graphs, will provide the same information and is usually used when interventional therapy is planned in conjunction with the angiogra-phy ( Fig. 22-47 ).
Differential Diagnosis Occasionally the radiographic appearance is not specifi c for the A-V aneurysm. The differential diagnosis is similar to that for hemangio-mas and includes multilocular lesions. However, association with the inferior alveolar canal is important in the differentiation.
Treatment An A-V aneurysm is treated surgically.
Osteoblastoma
Synonym Giant osteoid osteoma
Defi nition An osteoblastoma is an uncommon, benign tumor of osteoblasts with areas of osteoid and calcifi c tissue. This tumor occurs most often in the spine of a young person. Agreement apparently is increasing that, if osteoblastomas and osteoid osteomas are different lesions, they differ only in size and morphologic and histologic features. For example, the osteoid trabeculae in an osteoblastoma generally are larger (broader and longer, with wider trabecular spaces than those in an osteoid osteoma). An osteoblastoma is usually less painful, and it has more osteoclasts. In addition, benign osteoblasto-mas are considered more aggressive lesions. On the level of their ultrastructures, the two lesions essentially are similar or at least closely related.
Clinical Features Both osteoblastomas and osteoid osteomas are rare in the jaws. The male-to-female ratio is 2 : 1, although some studies indicate a higher female occurrence and the average age is 17 years, with most lesions occurring in the second and third decades of life. Clinically, patients often report pain and swelling of the affected region; however, the pain is more severe in osteoid osteomas and is often relieved by salicylates.
Radiographic Features Location. Osteoblastomas are found both in the tooth-bearing
regions and commonly around the temporomandibular joint (within the condyle or the temporal bone).
Periphery. The borders may be diffuse or may show some sign of a cortex. Lesions often have a soft tissue capsule around the periphery, indicating that this tumor is more mature in the central regions where there is evidence of abnormal bone ( Fig. 22-48 ).
Internal Structure. The internal structure may be entirely radio-lucent in early developing tumors or may show varying degrees of calcifi c material. The internal calcifi cation may take the form of a sunray pattern or fi ne granular bone trabeculae.
Effects on Surrounding Structures. Osteoblastomas can expand bone, but usually a thin outer cortex is maintained. This lesion may invaginate the maxillary sinus or the middle cranial fossa.
Differential Diagnosis An important differential diagnosis may be a well-defi ned osteogenic sarcoma because the histologic appearance may be very similar. The differentiation may rely on the benign features of the osteoblastoma

CHAPTER 22 ■ BENIGN TUMORS OF THE JAWS 399
FIG. 22-46 A, A panoramic fi lm of a patient with an A-V malformation; note the enlarged and irregular inferior alveolar canal. B and C, Axial and coronal CT images with soft tissue algorithm and after intravascular contrast was administered, which will cause the blood vessels to be more radiopaque (arrows).
A B
C
as revealed in the radiographic images. Osteoblastomas do not nor-mally break through cortical boundaries and invade surrounding soft tissue. Osteoid osteomas are usually smaller and have an associated sclerotic bone reaction at the periphery. Sometimes the appearance of an osteoblastoma may be similar to a large area of cemental dysplasia. Both have a soft tissue capsule, but the osteoblastoma behaves more aggressively, like a tumor.
Treatment Osteoblastomas are treated with curettage or local excision. Recur-rences have been described, and in a few cases the differentiation from a low-grade osteosarcoma may be diffi cult.
Osteoid Osteoma
Defi nition An osteoid osteoma is a benign tumor that is extremely rare in the jaws. Its true nature is not known, but some investigators think it is a variant of osteoblastoma. The tumor has an oval or round, tumorlike core usually only about 1 cm in diameter, although some may reach 5 or 6 cm. This core consists of osteoid and newly formed trabeculae within highly vascularized, osteogenic connective tissue. The tumor usually develops within the outer cortex but may form within the cancellous bone. There is a sclerotic bone reaction around the periph-ery, often thinner in lesions within the cancellous bone.

400 PART V ■ RADIOGRAPHIC INTERPRETATION
FIG. 22-47 A vascular lesion in the right maxillary sinus. A, A Waters ’ radiograph shows the opacifi ed maxillary antrum (arrow). B, Note the tumor vascularization in this angiogram. A radiopaque dye has been injected into the vasculature to enhance visualization. (Courtesy G. Himadi, DDS, Chapel Hill, N.C.)
A B
FIG. 22-48 A, A cropped panoramic fi lm of an osteoblastoma occupying the left condyle; note the enlargement of the condyle and the presence of a soft tissue capsule surrounding an internal structure of granular bone. B, A tomograph of the left condyle.
A B

CHAPTER 22 ■ BENIGN TUMORS OF THE JAWS 401
C
D
Clinical Features Osteoid osteomas occur most often in young people, usually males between the ages of 10 and 25 years. They seldom occur before 4 years or after 40 years. This condition affects at least twice as many males as females. Most of the lesions occur in the femur and tibia; the jaws are rarely involved. Severe pain in the bone that can be relieved by anti-infl ammatory drugs is characteristic. In addition, the soft tissue over the involved bony area may be swollen and tender.
Radiographic Features Location. The lesion is most common in the cortex of the limb
bones. In those that do occur in the jaws, somewhat more develop in the body of the mandible.
Periphery. The margins are well defi ned by a rim of sclerotic bone ( Fig. 22-49 ).
Internal Structure. The internal aspect of young lesions is com-posed of a small ovoid or round radiolucent area (core). In more mature lesions the central radiolucency may have a radiopaque foci representing abnormal bone.
Effects on Surrounding Structures. As previously mentioned, this tumor can stimulate a sclerotic bone reaction and cause thickening of the outer cortex by stimulating periosteal new bone formation.
Differential Diagnosis Osteoid osteomas are extremely rare in the jaws. A clinician who sus-pects that a sclerotic lesion is an osteoid osteoma should also consider sclerosing osteitis, cemento-ossifying fi broma, benign cementoblas-toma, and cemental dysplasia. The presence of a central radiolucency usually eliminates enostosis or osteosclerosis. Scintigraphy by a bone scan will help in the differential diagnosis by revealing considerable vascularity in the blood pool phase and a very high comparative bone metabolism.
FIG. 22-49 An osteoid osteoma (arrow) appears as a mixed radiolucent-radiopaque lesion in the molar region; the lesion has caused expansion of the buccal and lingual cortex of the mandible (arrows). (Courtesy A. Shawkat, DDS, Radcliff, Ky.)
Treatment Complete excision is currently the recommended treatment because it often relieves the pain and cures the disease. Although spontaneous remission can occur in some cases, the data are insuffi cient for iden-tifying such cases in advance.
FIG. 22-48, cont’d C, A technetium bone scan demonstrating increased bone activity in the left condyle (arrow). D, A radiograph of the surgical speci-men; note the internal granular bone surrounded by a soft tissue capsule (arrow).
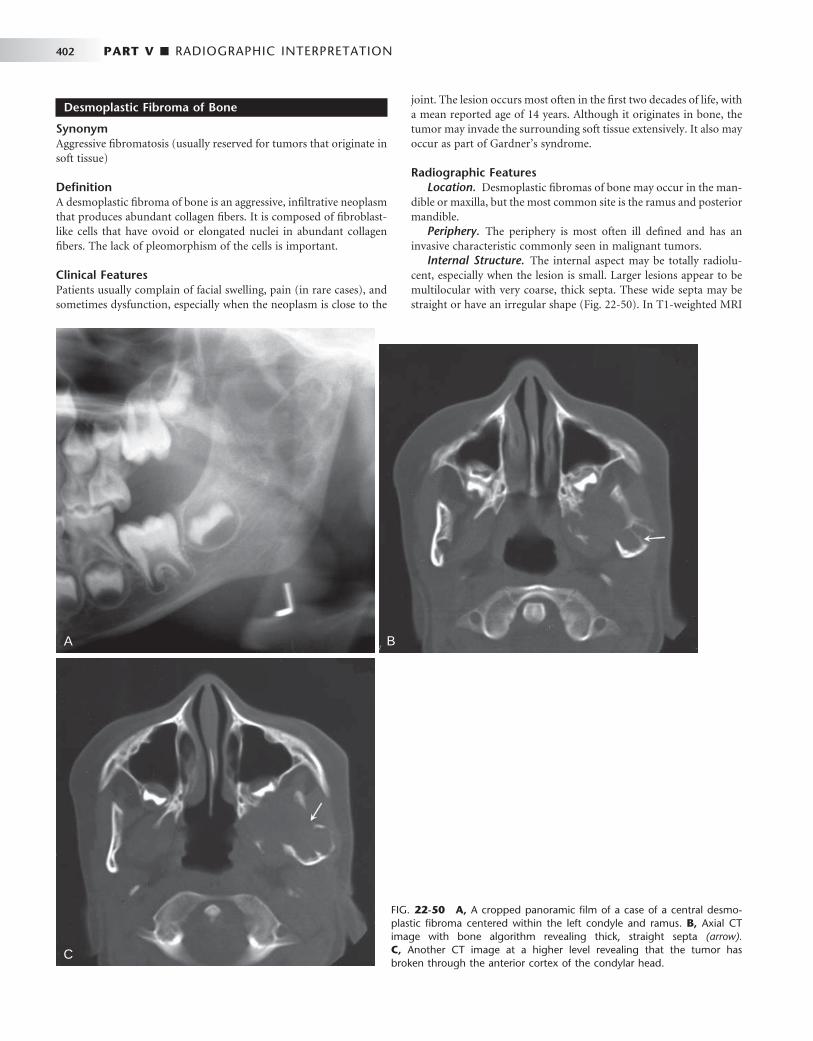
402 PART V ■ RADIOGRAPHIC INTERPRETATION
FIG. 22-50 A, A cropped panoramic fi lm of a case of a central desmo-plastic fi broma centered within the left condyle and ramus. B, Axial CT image with bone algorithm revealing thick, straight septa (arrow). C, Another CT image at a higher level revealing that the tumor has broken through the anterior cortex of the condylar head.
A
Desmoplastic Fibroma of Bone
Synonym Aggressive fi bromatosis (usually reserved for tumors that originate in soft tissue)
Defi nition A desmoplastic fi broma of bone is an aggressive, infi ltrative neoplasm that produces abundant collagen fi bers. It is composed of fi broblast-like cells that have ovoid or elongated nuclei in abundant collagen fi bers. The lack of pleomorphism of the cells is important.
Clinical Features Patients usually complain of facial swelling, pain (in rare cases), and sometimes dysfunction, especially when the neoplasm is close to the
B
C
joint. The lesion occurs most often in the fi rst two decades of life, with a mean reported age of 14 years. Although it originates in bone, the tumor may invade the surrounding soft tissue extensively. It also may occur as part of Gardner ’ s syndrome.
Radiographic Features Location. Desmoplastic fi bromas of bone may occur in the man-
dible or maxilla, but the most common site is the ramus and posterior mandible.
Periphery. The periphery is most often ill defi ned and has an invasive characteristic commonly seen in malignant tumors.
Internal Structure. The internal aspect may be totally radiolu-cent, especially when the lesion is small. Larger lesions appear to be multilocular with very coarse, thick septa. These wide septa may be straight or have an irregular shape ( Fig. 22-50 ). In T1-weighted MRI
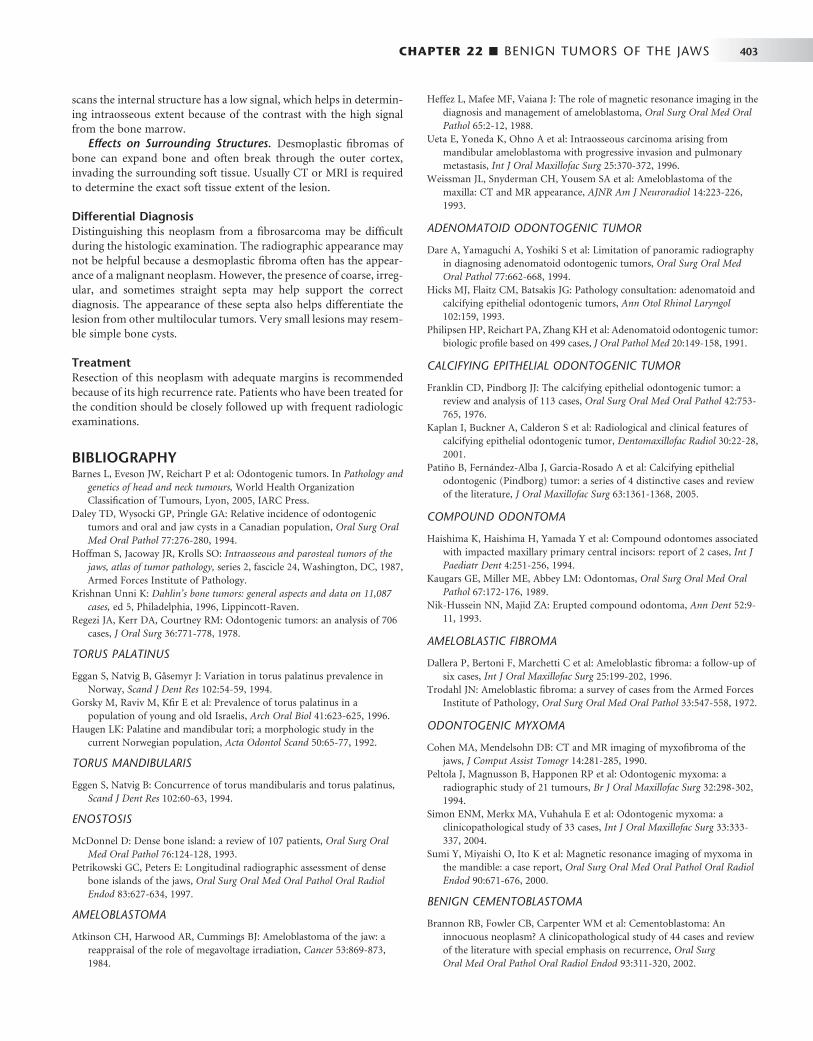
CHAPTER 22 ■ BENIGN TUMORS OF THE JAWS 403
scans the internal structure has a low signal, which helps in determin-ing intraosseous extent because of the contrast with the high signal from the bone marrow.
Effects on Surrounding Structures. Desmoplastic fi bromas of bone can expand bone and often break through the outer cortex, invading the surrounding soft tissue. Usually CT or MRI is required to determine the exact soft tissue extent of the lesion.
Differential Diagnosis Distinguishing this neoplasm from a fi brosarcoma may be diffi cult during the histologic examination. The radiographic appearance may not be helpful because a desmoplastic fi broma often has the appear-ance of a malignant neoplasm. However, the presence of coarse, irreg-ular, and sometimes straight septa may help support the correct diagnosis. The appearance of these septa also helps differentiate the lesion from other multilocular tumors. Very small lesions may resem-ble simple bone cysts.
Treatment Resection of this neoplasm with adequate margins is recommended because of its high recurrence rate. Patients who have been treated for the condition should be closely followed up with frequent radiologic examinations.
BIBLIOGRAPHY Barnes L , Eveson JW , Reichart P et al : Odontogenic tumors . In Pathology and
genetics of head and neck tumours , World Health Organization Classifi cation of Tumours , Lyon , 2005 , IARC Press .
Daley TD , Wysocki GP , Pringle GA : Relative incidence of odontogenic tumors and oral and jaw cysts in a Canadian population , Oral Surg Oral Med Oral Pathol 77 : 276 - 280 , 1994 .
Hoffman S, Jacoway JR, Krolls SO: Intraosseous and parosteal tumors of the jaws, atlas of tumor pathology, series 2, fascicle 24, Washington, DC, 1987, Armed Forces Institute of Pathology.
Krishnan Unni K : Dahlin ’ s bone tumors: general aspects and data on 11,087 cases , ed 5 , Philadelphia , 1996 , Lippincott-Raven .
Regezi JA , Kerr DA , Courtney RM : Odontogenic tumors: an analysis of 706 cases , J Oral Surg 36 : 771 - 778 , 1978 .
TORUS PALATINUS
Eggan S , Natvig B , G å semyr J : Variation in torus palatinus prevalence in Norway , Scand J Dent Res 102 : 54 - 59 , 1994 .
Gorsky M , Raviv M , Kfi r E et al : Prevalence of torus palatinus in a population of young and old Israelis , Arch Oral Biol 41 : 623 - 625 , 1996 .
Haugen LK : Palatine and mandibular tori; a morphologic study in the current Norwegian population , Acta Odontol Scand 50 : 65 - 77 , 1992 .
TORUS MANDIBULARIS
Eggen S , Natvig B : Concurrence of torus mandibularis and torus palatinus , Scand J Dent Res 102 : 60 - 63 , 1994 .
ENOSTOSIS
McDonnel D : Dense bone island: a review of 107 patients , Oral Surg Oral Med Oral Pathol 76 : 124 - 128 , 1993 .
Petrikowski GC , Peters E : Longitudinal radiographic assessment of dense bone islands of the jaws , Oral Surg Oral Med Oral Pathol Oral Radiol Endod 83 : 627 - 634 , 1997 .
AMELOBLASTOMA
Atkinson CH , Harwood AR , Cummings BJ : Ameloblastoma of the jaw: a reappraisal of the role of megavoltage irradiation , Cancer 53 : 869 - 873 , 1984 .
Heffez L , Mafee MF , Vaiana J : The role of magnetic resonance imaging in the diagnosis and management of ameloblastoma , Oral Surg Oral Med Oral Pathol 65 : 2 - 12 , 1988 .
Ueta E , Yoneda K , Ohno A et al : Intraosseous carcinoma arising from mandibular ameloblastoma with progressive invasion and pulmonary metastasis , Int J Oral Maxillofac Surg 25 : 370 - 372 , 1996 .
Weissman JL , Snyderman CH , Yousem SA et al : Ameloblastoma of the maxilla: CT and MR appearance , AJNR Am J Neuroradiol 14 : 223 - 226 , 1993 .
ADENOMATOID ODONTOGENIC TUMOR
Dare A , Yamaguchi A , Yoshiki S et al : Limitation of panoramic radiography in diagnosing adenomatoid odontogenic tumors , Oral Surg Oral Med Oral Pathol 77 : 662 - 668 , 1994 .
Hicks MJ , Flaitz CM , Batsakis JG : Pathology consultation: adenomatoid and calcifying epithelial odontogenic tumors , Ann Otol Rhinol Laryngol 102 : 159 , 1993 .
Philipsen HP , Reichart PA , Zhang KH et al : Adenomatoid odontogenic tumor: biologic profi le based on 499 cases , J Oral Pathol Med 20 : 149 - 158 , 1991 .
CALCIFYING EPITHELIAL ODONTOGENIC TUMOR
Franklin CD , Pindborg JJ : The calcifying epithelial odontogenic tumor: a review and analysis of 113 cases , Oral Surg Oral Med Oral Pathol 42 : 753 - 765 , 1976 .
Kaplan I , Buckner A , Calderon S et al : Radiological and clinical features of calcifying epithelial odontogenic tumor , Dentomaxillofac Radiol 30 : 22 - 28 , 2001 .
Pati ñ o B , Fern á ndez-Alba J , Garcia-Rosado A et al : Calcifying epithelial odontogenic (Pindborg) tumor: a series of 4 distinctive cases and review of the literature , J Oral Maxillofac Surg 63 : 1361 - 1368 , 2005 .
COMPOUND ODONTOMA
Haishima K , Haishima H , Yamada Y et al : Compound odontomes associated with impacted maxillary primary central incisors: report of 2 cases , Int J Paediatr Dent 4 : 251 - 256 , 1994 .
Kaugars GE , Miller ME , Abbey LM : Odontomas , Oral Surg Oral Med Oral Pathol 67 : 172 - 176 , 1989 .
Nik-Hussein NN , Majid ZA : Erupted compound odontoma , Ann Dent 52 : 9 - 11 , 1993 .
AMELOBLASTIC FIBROMA
Dallera P , Bertoni F , Marchetti C et al : Ameloblastic fi broma: a follow-up of six cases , Int J Oral Maxillofac Surg 25 : 199 - 202 , 1996 .
Trodahl JN : Ameloblastic fi broma: a survey of cases from the Armed Forces Institute of Pathology , Oral Surg Oral Med Oral Pathol 33 : 547 - 558 , 1972 .
ODONTOGENIC MYXOMA
Cohen MA , Mendelsohn DB : CT and MR imaging of myxofi broma of the jaws , J Comput Assist Tomogr 14 : 281 - 285 , 1990 .
Peltola J , Magnusson B , Happonen RP et al : Odontogenic myxoma: a radiographic study of 21 tumours , Br J Oral Maxillofac Surg 32 : 298 - 302 , 1994 .
Simon ENM , Merkx MA , Vuhahula E et al : Odontogenic myxoma: a clinicopathological study of 33 cases , Int J Oral Maxillofac Surg 33 : 333 - 337 , 2004 .
Sumi Y , Miyaishi O , Ito K et al : Magnetic resonance imaging of myxoma in the mandible: a case report , Oral Surg Oral Med Oral Pathol Oral Radiol Endod 90 : 671 - 676 , 2000 .
BENIGN CEMENTOBLASTOMA
Brannon RB , Fowler CB , Carpenter WM et al : Cementoblastoma: An innocuous neoplasm? A clinicopathological study of 44 cases and review of the literature with special emphasis on recurrence , Oral Surg Oral Med Oral Pathol Oral Radiol Endod 93 : 311 - 320 , 2002 .

404 PART V ■ RADIOGRAPHIC INTERPRETATION
Jelic JS , Loftus MJ , Miller AS et al : Benign cementoblastoma: report of an unusual case and analysis of 14 additional cases , J Oral Maxillofac Surg 51 : 1033 - 1037 , 1993 .
Ruprecht A , Ross AS : Benign cementoblastoma (true cementoblastoma) , Dentomaxillofac Radiol 12 : 31 - 33 , 1983 .
CENTRAL ODONTOGENIC FIBROMA
Gardner DG : Central odontogenic fi broma: current concepts , J Oral Pathol Med 25 : 556 - 561 , 1996 .
Handlers JP , Abrams AM , Melrose RJ et al : Central odontogenic fi broma: clinicopathologic features of 19 cases and review of the literature , J Oral Maxillofac Surg 49 : 46 - 54 , 1991 .
Kaffe I , Buchner A : Radiologic features of central odontogenic fi broma , Oral Surg Oral Med Oral Pathol 78 : 811 - 818 , 1994 .
NEURILEMMOMA
Chi AC , Carey J , Muller S et al : Intraosseous schwannoma of the mandible; case report and review of the literature , Oral Surg Oral Med Oral Pathol Oral Radiol Endod 96 : 54 , 2003 .
Minowa K , Sakakibara N , Yoshikawa K et al : CT and MRI fi ndings of intraosseous schwannoma of the mandible: a case report , Dentomaxillofac Radiol 36 : 113 - 116 , 2007 .
HEMANGIOMA
Fan X , Qiu W , Zhang Z et al : Comparative study of clinical manifestation, plain-fi lm radiography and computed tomographic scan in arteriovenous malformations of the jaws , Oral Surg Oral Med Oral Pathol Oral Radiol Endod 94 : 503 - 509 , 2002 .
Lund BA , Dahlin DC : Hemangiomas of the mandible and maxilla , J Oral Surg 22 : 234 - 242 , 1964 .
Zlotogorski A , Buchner A , Kaffe I et al : Radiological features of central haemangioma of the jaws , Dentomaxillofac Radiol 34 : 292 - 296 , 2005 .
OSTEOMA
Bilkay U , Erdem O , Ozek C et al : Benign osteoma with Gardner syndrome: review of the literature and report of a case , J Craniofac Surg 15 : 506 - 509 , 2004 .
Earwaker J : Paranasal osteomas: a review of 46 cases , Skeletal Radiol 22 : 417 - 423 , 1993 .
Matteson S , Deahl ST , Alder ME et al : Advanced imaging methods , Crit Rev Oral Biol Med 7 : 346 - 395 , 1996 .
Thakker NS , Evans DG , Horner K et al : Florid oral manifestations in an atypical familial adenomatous polyposis family with late presentation of colorectal polyps , J Oral Pathol Med 25 : 459 - 462 , 1996 .
NEUROFIBROMATOSIS
D ’ Ambrosio JA , Langlais RP , Young RS : Jaw and skull changes in neurofi bromatosis , Oral Surg Oral Med Oral Pathol 66 : 391 , 1988 .
Lee L , Yan YH , Pharaoah MJ : Radiographic features of the mandible in neurofi bromatosis: a report of 10 cases and review of the literature , Oral Surg Oral Med Oral Pathol Oral Radiol Endod 81 : 361 - 367 , 1996 .
OSTEOBLASTOMA
Alvares Capelozza AL , Gi ã o Dezotti MS , Casati Alvares L et al : Osteoblastoma of the mandible: systematic review of the literature and report of a case , Dentomaxillofac Radiol 34 : 1 - 8 , 2005 .
Jones AC , Prihoda TJ , Kacher JE et al : Osteoblastoma of the maxilla and mandible: a report of 24 cases, review of the literature, and discussion of its relationship to osteoid osteoma of the jaws , Oral Surg Oral Med Oral Pathol Oral Radiol Endod 102 : 639 - 650 , 2006 .
Lucas DR , Unni KK , McLeod RA et al : Osteoblastoma: clinicopathologic study of 306 cases , Hum Pathol 25 : 117 - 134 , 1994 .
DESMOPLASTIC FIBROMA OF BONE
Hopkins KM , Huttula CS , Kahn MA et al : Desmoplastic fi broma of the mandible: review and report of two cases , J Oral Maxillofac Surg 54 : 1249 - 1254 , 1996 .
Said-Al-Naief N , Fernandes R , Louis P et al : Desmoplastic fi broma of the jaw: a case report and review of literature , Oral Surg Oral Med Oral Pathol Oral Radiol Endod 101 : 82 - 94 , 2006 .

C H A P T E R 2 3
Malignant Diseases of the Jaws
Robert E. Wood
Defi nition
Malignant tumors represent an uncontrolled growth of tissue. Unlike benign neoplasms, they are more locally invasive, have a greater degree of cellular anaplasia, and have the ability to metastasize regionally to lymph nodes or distantly to other sites. Malignant tumors that arise de novo are termed primary tumors, and those that originate from distant primary tumors are termed secondary or metastatic malig-nancy. Cancers may be caused by viruses, signifi cant radiation expo-sure, genetic defects, or exposure to carcinogenic chemicals. For instance, using tobacco is strongly associated with oral carcinoma.
The most convenient method of classifi cation of cancers is on the basis of histopathologic characteristics. In the following text the malignancies that commonly affect the jaws have been divided into four categories: carcinomas (lesions of epithelial origin), metastatic lesions from distant sites, sarcomas (lesions of mesenchymal origin), and malignancies of the hematopoietic system. Of these four catego-ries, carcinomas are by far the most commonly encountered in dental practice. Unusual malignant tumors have been omitted to concentrate on those lesions that a general practitioner may encounter.
Clinical Features
The following are clinical signs and symptoms that suggest that a lesion may be malignant: displaced teeth, loosened teeth over a short time, foul smell, ulceration, presence of an indurated or rolled border, exposure of underlying bone, sensory or motor neural defi cits, lymph-adenopathy, weight loss, dysgeusia, dysphagia, dysphonia, hemor-rhage, lack of normal healing after oral surgery, and pain or rapid swelling with no demonstrable dental cause. Most oral cancers occur in men aged 50 years and older; however, malignant tumors may occur at any age in either sex.
Dentists must watch vigilantly for the possibility of malignancy in their patients. Because the prevalence of oral malignancy is low, many general practitioners practice years without encountering a patient with a malignant tumor. This rarity may make a dentist less likely to recognize a malignant condition when it is present. The risks of lack of attention to this possibility are delayed diagnosis, delayed treat-ment, increased need for aggressive treatment with added morbidity, and, in the worst case, premature death.
Radiographic Examination
Radiology has a number of important roles in the management of the patient with cancer. First, diagnostic images may aid in the establish-
ment of an initial diagnosis of a tumor. Diagnostic imaging also aids in the appropriate staging of disease from early small cancers to large cancers that have spread. Appropriate radiologic investigations assist the surgeon or radiation oncologist to determine the anatomic spread of the tumor so that it can be excised or irradiated adequately. Radio-logic investigation has the potential to determine the presence of osseous involvement from soft tissue tumors and allow the practitio-ner to assess the involvement of lymph nodes and treatment outcome. Finally, a thorough radiographic dental examination plays a part in the management of the cancer survivor, who often is rendered xero-stomic, neutropenic, and susceptible to dental caries, periodontal disease, and systemic infection.
There are various diagnostic imaging modalities available to aid in the diagnosis. Intraoral radiographs still provide the best image reso-lution and are able to reveal subtle malignant changes such as irregular widening of the periodontal membrane space. Panoramic radiographs provide an overall assessment of the maxillofacial osseous structures and can reveal relevant changes such as destruction of the boundaries of the maxillary sinus. Either cone beam computed tomography (CT) or medical CT images can provide a superior three-dimensional anal-ysis of the osseous structures and better determine the position and extent of the tumor. Positron emission tomographic (PET) scans, a technique capable of detecting abnormal cellular metabolic activity associated with malignant tumors, have been fused with CT images to provide an accurate location of the tumor in preparation for radio-therapy. Finally, magnetic resonance imaging (MRI) has provided three-dimensional soft tissue images of tumors and information regarding perineural spread and involvement of lymph nodes.
RADIOGRAPHIC FEATURES
The following features may suggest the presence of a malignant tumor. The absence of visible radiologic signs as described does not preclude malignancy. It only implies that no visible radiographic signs exist.
Location Primary and metastatic malignant tumors may occur anywhere in the oral and maxillofacial region. Primary carcinomas are more com-monly seen in the tongue, fl oor of mouth, tonsillar area, lip, soft palate, or gingiva and may invade the jaws from any of these sites. Sarcomas are more common in the mandible and in posterior regions of both jaws. Metastatic tumors are most common in the posterior mandible and maxilla. Some metastatic lesions grow at the apices of teeth or in the follicles of developing teeth ( Fig. 23-1, D ).
405

406 PART V ■ RADIOGRAPHIC INTERPRETATION
A B
C
E
D
F
FIG. 23-1 Diagrammatic representation of radiologic features of oral malignancy. A, Ill-defi ned invasive borders followed by bone destruction. B, Destruction of the cortical boundary (fl oor of maxillary antrum) with an adjacent soft tissue mass (arrows). C, Tumor invasion along the periodontal membrane space causing irregular thickening of this space. D, Multifocal lesions located at root apices and in the papilla of a develop-ing tooth destroying the crypt cortex and displacing the developing tooth in an occlusal direction (arrow). E, Four types of effects on cortical bone and periosteal reaction, from top to the bottom: cortical bone destruction without periosteal reaction, laminated periosteal reaction with destruction of the cortical bone and the new periosteal bone, destruction of cortical bone with periosteal reaction at the periphery forming Codman ’ s triangles, and a spiculated or sunray type of periosteal reaction. F, Bone destruction around existing teeth, producing an appearance of teeth fl oating in space.
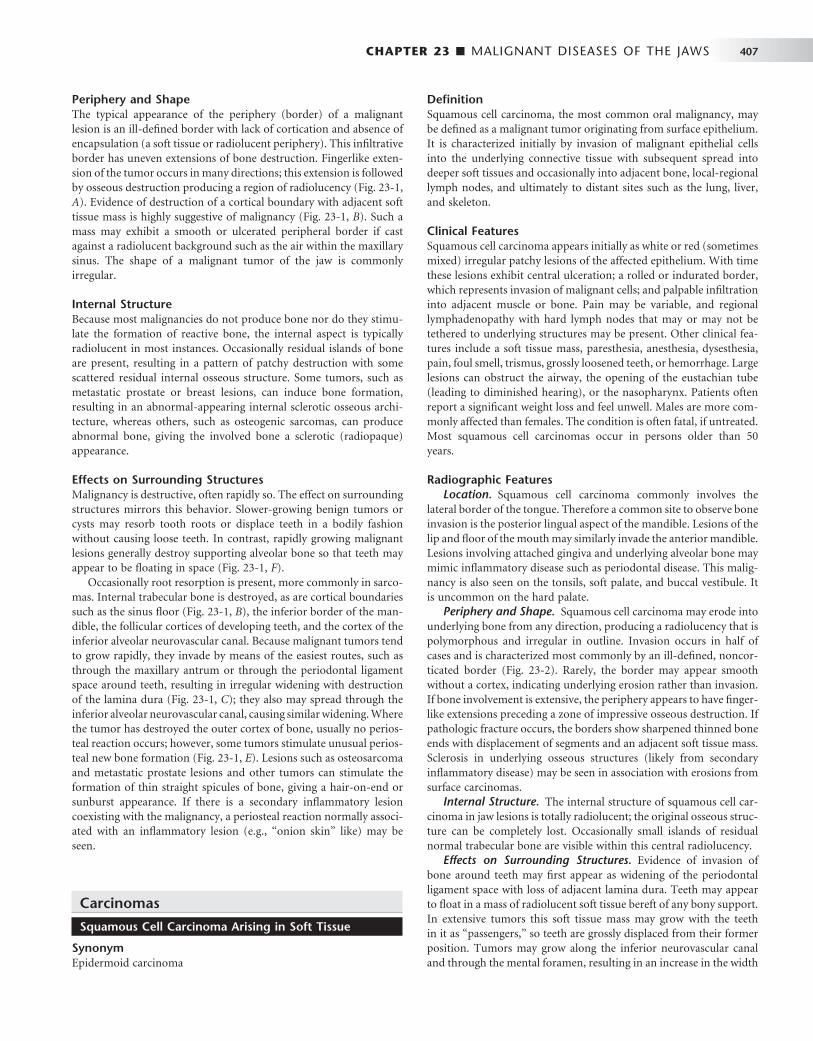
CHAPTER 23 ■ MALIGNANT DISEASES OF THE JAWS 407
Periphery and Shape The typical appearance of the periphery (border) of a malignant lesion is an ill-defi ned border with lack of cortication and absence of encapsulation (a soft tissue or radiolucent periphery). This infi ltrative border has uneven extensions of bone destruction. Fingerlike exten-sion of the tumor occurs in many directions; this extension is followed by osseous destruction producing a region of radiolucency ( Fig. 23-1, A ). Evidence of destruction of a cortical boundary with adjacent soft tissue mass is highly suggestive of malignancy ( Fig. 23-1, B ). Such a mass may exhibit a smooth or ulcerated peripheral border if cast against a radiolucent background such as the air within the maxillary sinus. The shape of a malignant tumor of the jaw is commonly irregular.
Internal Structure Because most malignancies do not produce bone nor do they stimu-late the formation of reactive bone, the internal aspect is typically radiolucent in most instances. Occasionally residual islands of bone are present, resulting in a pattern of patchy destruction with some scattered residual internal osseous structure. Some tumors, such as metastatic prostate or breast lesions, can induce bone formation, resulting in an abnormal-appearing internal sclerotic osseous archi-tecture, whereas others, such as osteogenic sarcomas, can produce abnormal bone, giving the involved bone a sclerotic (radiopaque) appearance.
Effects on Surrounding Structures Malignancy is destructive, often rapidly so. The effect on surrounding structures mirrors this behavior. Slower-growing benign tumors or cysts may resorb tooth roots or displace teeth in a bodily fashion without causing loose teeth. In contrast, rapidly growing malignant lesions generally destroy supporting alveolar bone so that teeth may appear to be fl oating in space ( Fig. 23-1, F ).
Occasionally root resorption is present, more commonly in sarco-mas. Internal trabecular bone is destroyed, as are cortical boundaries such as the sinus fl oor ( Fig. 23-1, B ), the inferior border of the man-dible, the follicular cortices of developing teeth, and the cortex of the inferior alveolar neurovascular canal. Because malignant tumors tend to grow rapidly, they invade by means of the easiest routes, such as through the maxillary antrum or through the periodontal ligament space around teeth, resulting in irregular widening with destruction of the lamina dura ( Fig. 23-1, C ); they also may spread through the inferior alveolar neurovascular canal, causing similar widening. Where the tumor has destroyed the outer cortex of bone, usually no perios-teal reaction occurs; however, some tumors stimulate unusual perios-teal new bone formation ( Fig. 23-1, E ). Lesions such as osteosarcoma and metastatic prostate lesions and other tumors can stimulate the formation of thin straight spicules of bone, giving a hair-on-end or sunburst appearance. If there is a secondary infl ammatory lesion coexisting with the malignancy, a periosteal reaction normally associ-ated with an infl ammatory lesion (e.g., “ onion skin ” like) may be seen.
Carcinomas
Squamous Cell Carcinoma Arising in Soft Tissue
Synonym Epidermoid carcinoma
Defi nition Squamous cell carcinoma, the most common oral malignancy, may be defi ned as a malignant tumor originating from surface epithelium. It is characterized initially by invasion of malignant epithelial cells into the underlying connective tissue with subsequent spread into deeper soft tissues and occasionally into adjacent bone, local-regional lymph nodes, and ultimately to distant sites such as the lung, liver, and skeleton.
Clinical Features Squamous cell carcinoma appears initially as white or red (sometimes mixed) irregular patchy lesions of the affected epithelium. With time these lesions exhibit central ulceration; a rolled or indurated border, which represents invasion of malignant cells; and palpable infi ltration into adjacent muscle or bone. Pain may be variable, and regional lymphadenopathy with hard lymph nodes that may or may not be tethered to underlying structures may be present. Other clinical fea-tures include a soft tissue mass, paresthesia, anesthesia, dysesthesia, pain, foul smell, trismus, grossly loosened teeth, or hemorrhage. Large lesions can obstruct the airway, the opening of the eustachian tube (leading to diminished hearing), or the nasopharynx. Patients often report a signifi cant weight loss and feel unwell. Males are more com-monly affected than females. The condition is often fatal, if untreated. Most squamous cell carcinomas occur in persons older than 50 years.
Radiographic Features Location. Squamous cell carcinoma commonly involves the
lateral border of the tongue. Therefore a common site to observe bone invasion is the posterior lingual aspect of the mandible. Lesions of the lip and fl oor of the mouth may similarly invade the anterior mandible. Lesions involving attached gingiva and underlying alveolar bone may mimic infl ammatory disease such as periodontal disease. This malig-nancy is also seen on the tonsils, soft palate, and buccal vestibule. It is uncommon on the hard palate.
Periphery and Shape. Squamous cell carcinoma may erode into underlying bone from any direction, producing a radiolucency that is polymorphous and irregular in outline. Invasion occurs in half of cases and is characterized most commonly by an ill-defi ned, noncor-ticated border ( Fig. 23-2 ). Rarely, the border may appear smooth without a cortex, indicating underlying erosion rather than invasion. If bone involvement is extensive, the periphery appears to have fi nger-like extensions preceding a zone of impressive osseous destruction. If pathologic fracture occurs, the borders show sharpened thinned bone ends with displacement of segments and an adjacent soft tissue mass. Sclerosis in underlying osseous structures (likely from secondary infl ammatory disease) may be seen in association with erosions from surface carcinomas.
Internal Structure. The internal structure of squamous cell car-cinoma in jaw lesions is totally radiolucent; the original osseous struc-ture can be completely lost. Occasionally small islands of residual normal trabecular bone are visible within this central radiolucency.
Effects on Surrounding Structures. Evidence of invasion of bone around teeth may fi rst appear as widening of the periodontal ligament space with loss of adjacent lamina dura. Teeth may appear to fl oat in a mass of radiolucent soft tissue bereft of any bony support. In extensive tumors this soft tissue mass may grow with the teeth in it as “ passengers, ” so teeth are grossly displaced from their former position. Tumors may grow along the inferior neurovascular canal and through the mental foramen, resulting in an increase in the width
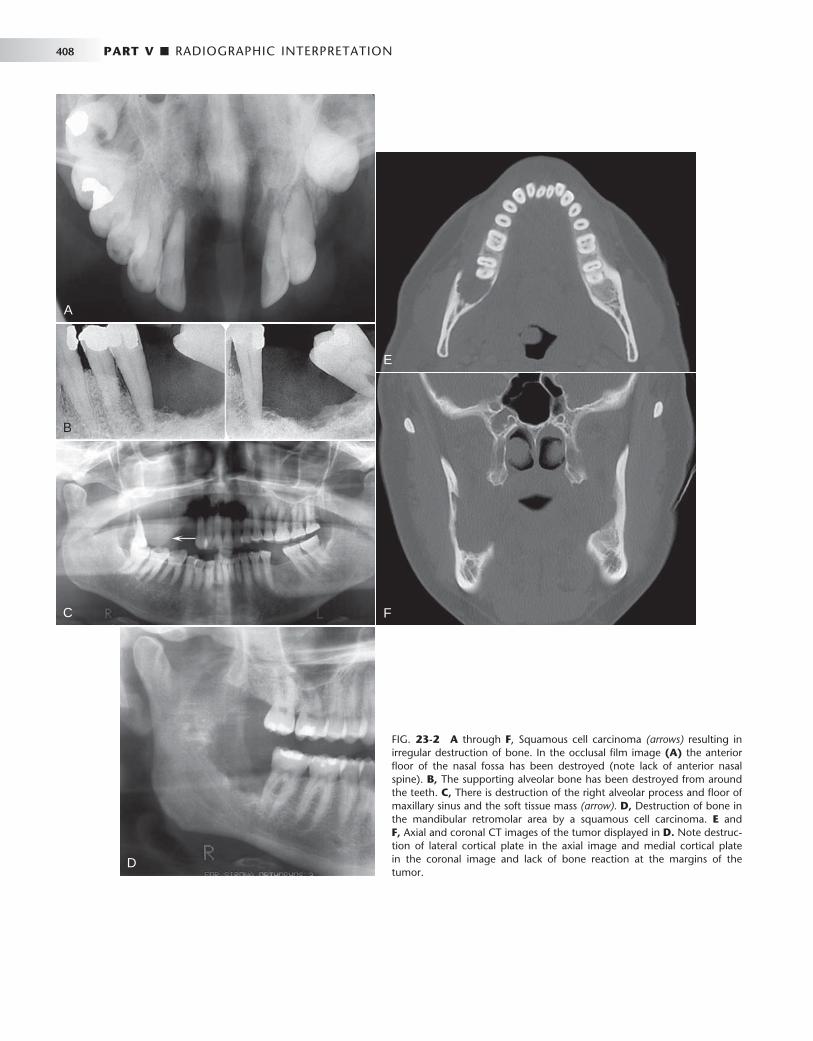
408 PART V ■ RADIOGRAPHIC INTERPRETATION
FIG. 23-2 A through F , Squamous cell carcinoma (arrows) resulting in irregular destruction of bone. In the occlusal fi lm image (A) the anterior fl oor of the nasal fossa has been destroyed (note lack of anterior nasal spine). B, The supporting alveolar bone has been destroyed from around the teeth. C, There is destruction of the right alveolar process and fl oor of maxillary sinus and the soft tissue mass (arrow). D, Destruction of bone in the mandibular retromolar area by a squamous cell carcinoma. E and F, Axial and coronal CT images of the tumor displayed in D. Note destruc-tion of lateral cortical plate in the axial image and medial cortical plate in the coronal image and lack of bone reaction at the margins of the tumor.
A
B
C F
E
D
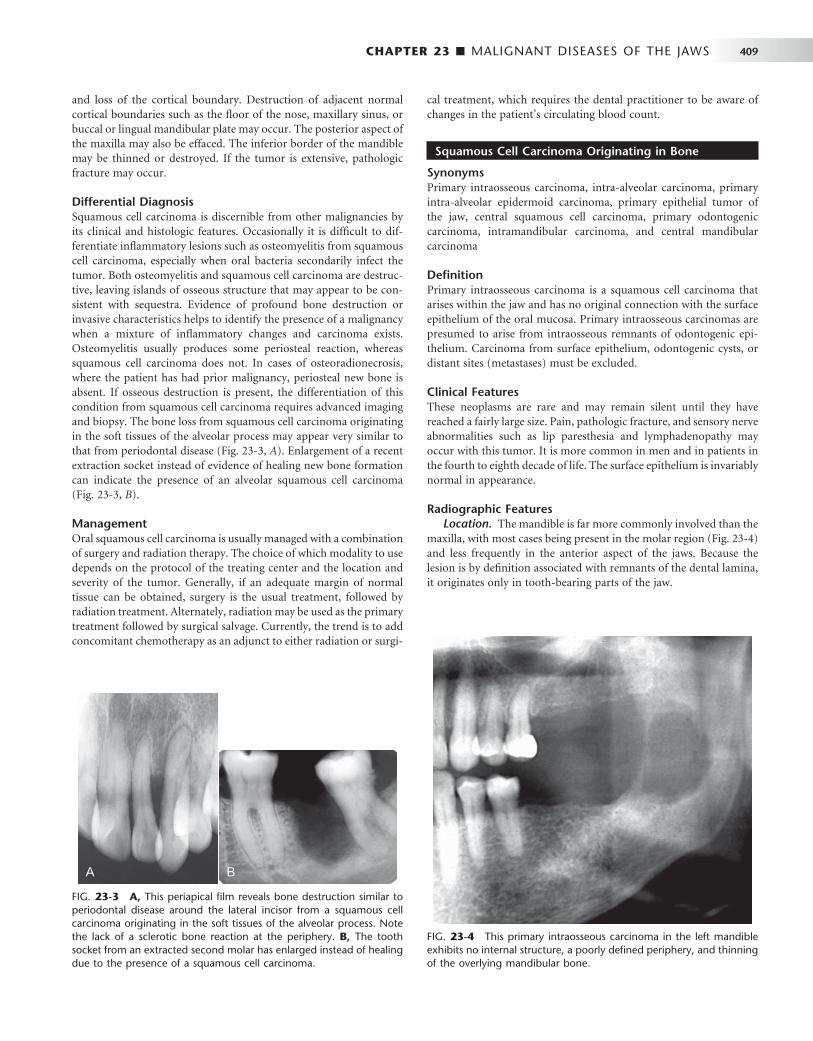
CHAPTER 23 ■ MALIGNANT DISEASES OF THE JAWS 409
and loss of the cortical boundary. Destruction of adjacent normal cortical boundaries such as the fl oor of the nose, maxillary sinus, or buccal or lingual mandibular plate may occur. The posterior aspect of the maxilla may also be effaced. The inferior border of the mandible may be thinned or destroyed. If the tumor is extensive, pathologic fracture may occur.
Differential Diagnosis Squamous cell carcinoma is discernible from other malignancies by its clinical and histologic features. Occasionally it is diffi cult to dif-ferentiate infl ammatory lesions such as osteomyelitis from squamous cell carcinoma, especially when oral bacteria secondarily infect the tumor. Both osteomyelitis and squamous cell carcinoma are destruc-tive, leaving islands of osseous structure that may appear to be con-sistent with sequestra. Evidence of profound bone destruction or invasive characteristics helps to identify the presence of a malignancy when a mixture of infl ammatory changes and carcinoma exists. Osteomyelitis usually produces some periosteal reaction, whereas squamous cell carcinoma does not. In cases of osteoradionecrosis, where the patient has had prior malignancy, periosteal new bone is absent. If osseous destruction is present, the differentiation of this condition from squamous cell carcinoma requires advanced imaging and biopsy. The bone loss from squamous cell carcinoma originating in the soft tissues of the alveolar process may appear very similar to that from periodontal disease ( Fig. 23-3, A ). Enlargement of a recent extraction socket instead of evidence of healing new bone formation can indicate the presence of an alveolar squamous cell carcinoma ( Fig. 23-3, B ).
Management Oral squamous cell carcinoma is usually managed with a combination of surgery and radiation therapy. The choice of which modality to use depends on the protocol of the treating center and the location and severity of the tumor. Generally, if an adequate margin of normal tissue can be obtained, surgery is the usual treatment, followed by radiation treatment. Alternately, radiation may be used as the primary treatment followed by surgical salvage. Currently, the trend is to add concomitant chemotherapy as an adjunct to either radiation or surgi-
cal treatment, which requires the dental practitioner to be aware of changes in the patient ’ s circulating blood count.
Squamous Cell Carcinoma Originating in Bone
Synonyms Primary intraosseous carcinoma, intra-alveolar carcinoma, primary intra-alveolar epidermoid carcinoma, primary epithelial tumor of the jaw, central squamous cell carcinoma, primary odontogenic carcinoma, intramandibular carcinoma, and central mandibular carcinoma
Defi nition Primary intraosseous carcinoma is a squamous cell carcinoma that arises within the jaw and has no original connection with the surface epithelium of the oral mucosa. Primary intraosseous carcinomas are presumed to arise from intraosseous remnants of odontogenic epi-thelium. Carcinoma from surface epithelium, odontogenic cysts, or distant sites (metastases) must be excluded.
Clinical Features These neoplasms are rare and may remain silent until they have reached a fairly large size. Pain, pathologic fracture, and sensory nerve abnormalities such as lip paresthesia and lymphadenopathy may occur with this tumor. It is more common in men and in patients in the fourth to eighth decade of life. The surface epithelium is invariably normal in appearance.
Radiographic Features Location. The mandible is far more commonly involved than the
maxilla, with most cases being present in the molar region ( Fig. 23-4 ) and less frequently in the anterior aspect of the jaws. Because the lesion is by defi nition associated with remnants of the dental lamina, it originates only in tooth-bearing parts of the jaw.
FIG. 23-3 A, This periapical fi lm reveals bone destruction similar to periodontal disease around the lateral incisor from a squamous cell carcinoma originating in the soft tissues of the alveolar process. Note the lack of a sclerotic bone reaction at the periphery. B, The tooth socket from an extracted second molar has enlarged instead of healing due to the presence of a squamous cell carcinoma.
A B
FIG. 23-4 This primary intraosseous carcinoma in the left mandible exhibits no internal structure, a poorly defi ned periphery, and thinning of the overlying mandibular bone.

410 PART V ■ RADIOGRAPHIC INTERPRETATION
Periphery and Shape. The periphery of the majority of lesions is ill defi ned, although some have been described as well defi ned. They are most often rounded or irregular in shape and have a border that demonstrates osseous destruction and varying degrees of extension at the periphery. The degree of raggedness of the border may refl ect the aggressiveness of the lesion. If the lesion is of suffi cient size, pathologic fracture occurs, with its associated step defects, thinned cortical borders, and subsequent soft tissue mass.
Internal Structure. The internal structure is wholly radiolucent with no evidence of bone production and very little residual bone left within the center of the lesion. If the lesion is small, overlying buccal or lingual plates may cast a shadow that may mimic the appearance of internal trabecular bone.
Effects on Surrounding Structures. These lesions are capable of causing destruction of the antral or nasal fl oors, loss of the cortical outline of the mandibular neurovascular canal, and effacement of the lamina dura. Root resorption is unusual. Teeth that lose both lamina dura and supporting bone appear to be fl oating in space.
Differential Diagnosis If the lesions are not aggressive and have a smooth border and radio-lucent area, they may be mistaken for periapical cysts or granulomas. Alternately, if lesions are not centered about the apex of a tooth, occasionally it is diffi cult to differentiate this condition from odonto-genic cysts or tumors. If the border is obviously infi ltrative with exten-sive bone destruction, a metastatic lesion must be excluded, as well as multiple myeloma, fi brosarcoma, and carcinoma arising in a dental cyst. Examination of the oral cavity and especially the surface epithe-lium assists in differentiating this condition from surface squamous cell carcinoma.
Management Generally these tumors are excised with their surrounding osseous structure in an en bloc resection. Radiation and chemotherapy may be used as adjunctive therapies.
Squamous Cell Carcinoma Originating in a Cyst
Synonyms Epidermoid cell carcinoma and carcinoma ex odontogenic cyst
Defi nition Squamous cell carcinoma arising in a preexisting dental cyst is uncom-mon and excludes invasion from surface epithelial carcinomas, meta-static tumors, and primary intraosseous carcinoma. They may arise from infl ammatory periapical, residual, dentigerous, and odontogenic keratocysts. Histologically the lining squamous epithelium of the cyst gives rise to the malignant neoplasm.
Clinical Features The most common presenting sign or symptom associated with this condition is pain. The pain may be characterized as dull and of several months ’ duration. Swelling is occasionally reported. Pathologic fracture may occur, as may fi stula formation and regional lymphadenopathy. If the upper jaw is involved, sinus pain or swelling may be present.
Radiographic Features Location. This tumor may occur anywhere an odontogenic cyst
is found, namely, the tooth-bearing portions of the jaws. Most cases occur in the mandible ( Fig. 23-5 ), with a few cases reported in the anterior maxilla.
Periphery and Shape. The radiologic picture of squamous cell carcinoma originating in a cyst mirrors the histologic fi ndings. Because the lesion arises from a cyst, the shape is often round or ovoid. If it is a small lesion in a cyst wall, the periphery may be mostly well defi ned and even corticated. In this case the radiographic differentia-tion from a normal cyst is impossible. As the malignant tissue progres-sively replaces cyst lining, the smooth border is lost or becomes ill defi ned. The advanced lesion has an ill-defi ned, infi ltrative periphery that lacks any cortication. Its shape becomes less “ hydraulic ” looking and more diffuse.
Internal Structure. This lesion lacks any ability to produce bone. It is wholly radiolucent, perhaps more so than invasive surface carci-noma, owing to prior osteolysis from the cyst.
Effects on Surrounding Structures. Carcinoma arising in dental cysts is capable of thinning and destroying the lamina dura of adjacent teeth or adjacent cortical boundaries, such as the inferior border of the jaw or the fl oor of the nose. It can produce complete destruction of the alveolar process.
Differential Diagnosis If a dental cyst is infected, it may lose its normal cortical boundary and appear ragged and identical to a malignant lesion arising in a preexisting cyst. However, infl amed cysts usually show a reactive peripheral sclerosis because of infl ammatory products present in the cyst lumen. This is not normally present in a cyst, which has under-gone malignant transformation. Nevertheless, the two may be diffi cult to differentiate radiologically, and therefore cysts should always be submitted for histologic examination. Multiple myeloma may appear as a solitary lesion and may be diffi cult to distinguish, especially if it has a cystic well-defi ned shape. Metastatic disease may be similar, although it is commonly multifocal.
Management The treatment of squamous cell carcinoma originating in a cyst is identical to that described with primary intraosseous carcinoma.
FIG. 23-5 Carcinoma arising in a preexisting dentigerous cyst related to the mandibular left third molar shows absence of a cyst cortex, invasion into adjacent bone, and ill-defi ned borders.

CHAPTER 23 ■ MALIGNANT DISEASES OF THE JAWS 411
Central Mucoepidermoid Carcinoma
Synonym Mucoepidermoid carcinoma
Defi nition Central mucoepidermoid carcinoma is an epithelial tumor arising in bone, likely originating from pluripotential odontogenic epithelium or from a cyst lining. It is histologically indistinguishable from its soft tissue counterpart. The criteria for diagnosis of a central mucoepider-moid tumor are the presence of intact cortical plates, radiographic evidence of bone destruction, and typical histologic fi ndings consis-tent with mucoepidermoid tumor. Additionally, the practitioner must exclude the possibility of an invasive overlying mucoepidermoid tumor or odontogenic tumor.
Clinical Features Unlike other malignant tumors of the jaws, the central mucoepider-moid tumor is more likely to mimic a benign tumor or cyst. The most common complaint is of a painless swelling. The swelling may have been present for months or even years and has been reported to cause facial asymmetry. Occasionally it may feel as if teeth have been moved or a denture may no longer fi t. Tenderness rather than severe pain may also be present. Paresthesia of the inferior alveolar nerve and spreading of the lesion to regional lymph nodes has been reported. Central mucoepidermoid tumor, unlike other oral malignancies, is more common in females than males.
Radiographic Features Location. The lesion is twice as common in the mandible as the
in maxilla, usually in the premolar and molar region with a few cases reported in the anterior mandible. The lesion most commonly occurs above the mandibular canal, similar to odontogenic tumors.
Periphery and Shape. Mucoepidermoid tumor presents as a unilocular or multilocular expansile mass ( Fig. 23-6 ). The border is most often well defi ned and well corticated and often crenated or undulating in nature, which is similar to benign odontogenic tumors. The peripheral cortication may be impressively thick, which belies its malignant nature. Rarely, the periphery is not corticated and has a more malignant appearance.
Internal Structure. The internal structure has features like those of a benign odontogenic tumor such as an ameloblastoma. Lesions are often described as being multilocular or having either a soap bubble or honeycomb internal structure, implying the presence of compartments separated by thin or thick cortical septa. This bone is not produced by the tumor but is merely remodeled residual bone taking the form of septa.
Effects on Surrounding Structures. Mucoepidermoid tumor is capable of causing expansion of adjacent normal bony walls. The buccal and lingual cortical plates, inferior border of the mandible, and alveolar crest are usually intact; however, they may be thinned and grossly displaced. The mandibular canal may be depressed or pushed laterally or medially. These characteristics are more similar to benign tumors than to malignant tumors. Teeth remain largely unaffected by this disease, although adjacent lamina dura may be lost.
Differential Diagnosis The differential diagnosis of this lesion refl ects its lack of features commonly associated with oral malignancy. The chief differential diagnosis is ameloblastoma and glandular odontogenic cyst, with
which it shares similarities in its peripheral and internal features. It may not be possible to differentiate the two. Odontogenic myxoma and central giant cell granuloma also may be confused with mucoepi-dermoid tumor, as may other odontogenic cysts or tumors.
Management Mucoepidermoid carcinoma is treated surgically with en bloc resec-tion encompassing a margin of adjacent normal bone. Neck dissection and postoperative radiation therapy may be required to control spread to lymph nodes.
Malignant Ameloblastoma and Ameloblastic Carcinoma
Defi nition Malignant ameloblastoma is defi ned as an ameloblastoma with typical benign histologic features that is deemed malignant because of its biologic behavior, namely, metastasis. The histologic features may not correlate with the clinical behavior. On the other hand, ameloblastic carcinoma is an ameloblastoma exhibiting the histologic criteria of a malignant neoplasm such as increased and abnormal mitosis and large hyperchromatic, pleomorphic nuclei.
Clinical Features Clinically these lesions may behave as benign ameloblastomas, exhib-iting a hard expansile mass of the jaw with displaced and perhaps loosened teeth and normal overlying mucosa. Tenderness of the over-lying soft tissue has been reported. Metastatic spread may be to the cervical lymph nodes, lung or other viscera, and the skeleton, espe-cially the spine. Local extension may occur into adjacent bones, con-nective tissue, or salivary glands. These tumors occur most commonly between the fi rst and sixth decades of life and are more common in males than in females.
Radiographic Features Location. These lesions are more common in the mandible than
in the maxilla, with most occurring in the premolar and molar region, where ameloblastoma is typically found.
Periphery and Shape. Similar to ameloblastoma, a well-defi ned border occurs with cortication, presence of crenations, or scalloping of the border. Malignant ameloblastoma may show some of the signs more commonly seen in malignant neoplasms, namely, loss of and
FIG. 23-6 The multilocular radiolucency in this radiograph is charac-teristic of central mucoepidermoid carcinoma; this lesion has displaced the mandibular canal and destroyed the superior crest of the alveolar process and the distal supporting bone of the second molar.
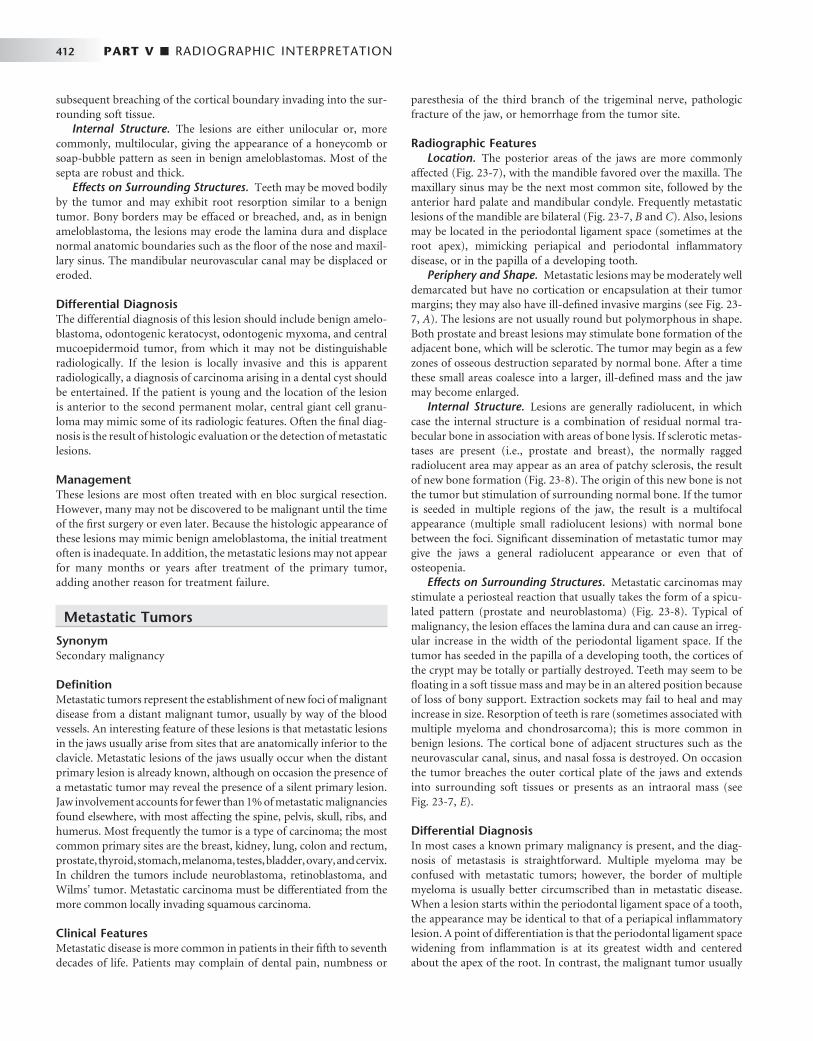
412 PART V ■ RADIOGRAPHIC INTERPRETATION
subsequent breaching of the cortical boundary invading into the sur-rounding soft tissue.
Internal Structure. The lesions are either unilocular or, more commonly, multilocular, giving the appearance of a honeycomb or soap-bubble pattern as seen in benign ameloblastomas. Most of the septa are robust and thick.
Effects on Surrounding Structures. Teeth may be moved bodily by the tumor and may exhibit root resorption similar to a benign tumor. Bony borders may be effaced or breached, and, as in benign ameloblastoma, the lesions may erode the lamina dura and displace normal anatomic boundaries such as the fl oor of the nose and maxil-lary sinus. The mandibular neurovascular canal may be displaced or eroded.
Differential Diagnosis The differential diagnosis of this lesion should include benign amelo-blastoma, odontogenic keratocyst, odontogenic myxoma, and central mucoepidermoid tumor, from which it may not be distinguishable radiologically. If the lesion is locally invasive and this is apparent radiologically, a diagnosis of carcinoma arising in a dental cyst should be entertained. If the patient is young and the location of the lesion is anterior to the second permanent molar, central giant cell granu-loma may mimic some of its radiologic features. Often the fi nal diag-nosis is the result of histologic evaluation or the detection of metastatic lesions.
Management These lesions are most often treated with en bloc surgical resection. However, many may not be discovered to be malignant until the time of the fi rst surgery or even later. Because the histologic appearance of these lesions may mimic benign ameloblastoma, the initial treatment often is inadequate. In addition, the metastatic lesions may not appear for many months or years after treatment of the primary tumor, adding another reason for treatment failure.
Metastatic Tumors
Synonym Secondary malignancy
Defi nition Metastatic tumors represent the establishment of new foci of malignant disease from a distant malignant tumor, usually by way of the blood vessels. An interesting feature of these lesions is that metastatic lesions in the jaws usually arise from sites that are anatomically inferior to the clavicle. Metastatic lesions of the jaws usually occur when the distant primary lesion is already known, although on occasion the presence of a metastatic tumor may reveal the presence of a silent primary lesion. Jaw involvement accounts for fewer than 1% of metastatic malignancies found elsewhere, with most affecting the spine, pelvis, skull, ribs, and humerus. Most frequently the tumor is a type of carcinoma; the most common primary sites are the breast, kidney, lung, colon and rectum, prostate, thyroid, stomach, melanoma, testes, bladder, ovary, and cervix. In children the tumors include neuroblastoma, retinoblastoma, and Wilms ’ tumor. Metastatic carcinoma must be differentiated from the more common locally invading squamous carcinoma.
Clinical Features Metastatic disease is more common in patients in their fi fth to seventh decades of life. Patients may complain of dental pain, numbness or
paresthesia of the third branch of the trigeminal nerve, pathologic fracture of the jaw, or hemorrhage from the tumor site.
Radiographic Features Location. The posterior areas of the jaws are more commonly
affected ( Fig. 23-7 ), with the mandible favored over the maxilla. The maxillary sinus may be the next most common site, followed by the anterior hard palate and mandibular condyle. Frequently metastatic lesions of the mandible are bilateral ( Fig. 23-7, B and C ). Also, lesions may be located in the periodontal ligament space (sometimes at the root apex), mimicking periapical and periodontal infl ammatory disease, or in the papilla of a developing tooth.
Periphery and Shape. Metastatic lesions may be moderately well demarcated but have no cortication or encapsulation at their tumor margins; they may also have ill-defi ned invasive margins (see Fig. 23-7, A ). The lesions are not usually round but polymorphous in shape. Both prostate and breast lesions may stimulate bone formation of the adjacent bone, which will be sclerotic. The tumor may begin as a few zones of osseous destruction separated by normal bone. After a time these small areas coalesce into a larger, ill-defi ned mass and the jaw may become enlarged.
Internal Structure. Lesions are generally radiolucent, in which case the internal structure is a combination of residual normal tra-becular bone in association with areas of bone lysis. If sclerotic metas-tases are present (i.e., prostate and breast), the normally ragged radiolucent area may appear as an area of patchy sclerosis, the result of new bone formation ( Fig. 23-8 ). The origin of this new bone is not the tumor but stimulation of surrounding normal bone. If the tumor is seeded in multiple regions of the jaw, the result is a multifocal appearance (multiple small radiolucent lesions) with normal bone between the foci. Signifi cant dissemination of metastatic tumor may give the jaws a general radiolucent appearance or even that of osteopenia.
Effects on Surrounding Structures. Metastatic carcinomas may stimulate a periosteal reaction that usually takes the form of a spicu-lated pattern (prostate and neuroblastoma) ( Fig. 23-8 ). Typical of malignancy, the lesion effaces the lamina dura and can cause an irreg-ular increase in the width of the periodontal ligament space. If the tumor has seeded in the papilla of a developing tooth, the cortices of the crypt may be totally or partially destroyed. Teeth may seem to be fl oating in a soft tissue mass and may be in an altered position because of loss of bony support. Extraction sockets may fail to heal and may increase in size. Resorption of teeth is rare (sometimes associated with multiple myeloma and chondrosarcoma); this is more common in benign lesions. The cortical bone of adjacent structures such as the neurovascular canal, sinus, and nasal fossa is destroyed. On occasion the tumor breaches the outer cortical plate of the jaws and extends into surrounding soft tissues or presents as an intraoral mass (see Fig. 23-7, E ).
Differential Diagnosis In most cases a known primary malignancy is present, and the diag-nosis of metastasis is straightforward. Multiple myeloma may be confused with metastatic tumors; however, the border of multiple myeloma is usually better circumscribed than in metastatic disease. When a lesion starts within the periodontal ligament space of a tooth, the appearance may be identical to that of a periapical infl ammatory lesion. A point of differentiation is that the periodontal ligament space widening from infl ammation is at its greatest width and centered about the apex of the root. In contrast, the malignant tumor usually

CHAPTER 23 ■ MALIGNANT DISEASES OF THE JAWS 413
FIG. 23-7 Metastatic carcinomas. A, Metastatic breast carcinoma surrounding the apical half of the second and third molar roots and extending inferiorly. It has destroyed the inferior border of the mandible. B, Bilateral metastatic lesions from the lung destroying the mandibular rami. C, Coronal CT image with soft tissue algorithm of the same case. D, Destruction of the left mandibular condyle (arrows) from a thyroid metastatic lesion. E, Axial CT image with soft tissue algorithm of the same case showing invasion into surrounding soft tissue (arrows).
A
C
B
D
E
causes irregular widening, which may extend up the side of the root. Odontogenic cysts, if secondarily infected, may have an ill-defi ned border giving a similar appearance to a metastatic lesion. Invasion of the jaws by primary tumors of the overlying epithelium such as squa-mous cell carcinoma may be indistinguishable from metastatic disease but can be differentiated by clinical examination.
Management The presence of a metastatic tumor in the jaw indicates a poor prog-nosis. If metastatic disease is present, the patient will usually die
within 1 to 2 years. If the radiographic appearance is suspicious, an opinion from a dental radiologist should be sought and tissue submit-ted for histologic analysis. Nuclear medicine may be used to detect other metastatic lesions. Isolated malignant deposits, if symptomatic, may be treated with localized high-dose radiation. In the rare occasion that the jaw is the fi rst diagnosed site of malignant spread, it is impera-tive that the patient be referred quickly to an oncologist so that anti-cancer treatment can be delivered promptly. This treatment may take the form of chemotherapy, radiation therapy, surgery, immunother-apy, or hormone treatment.
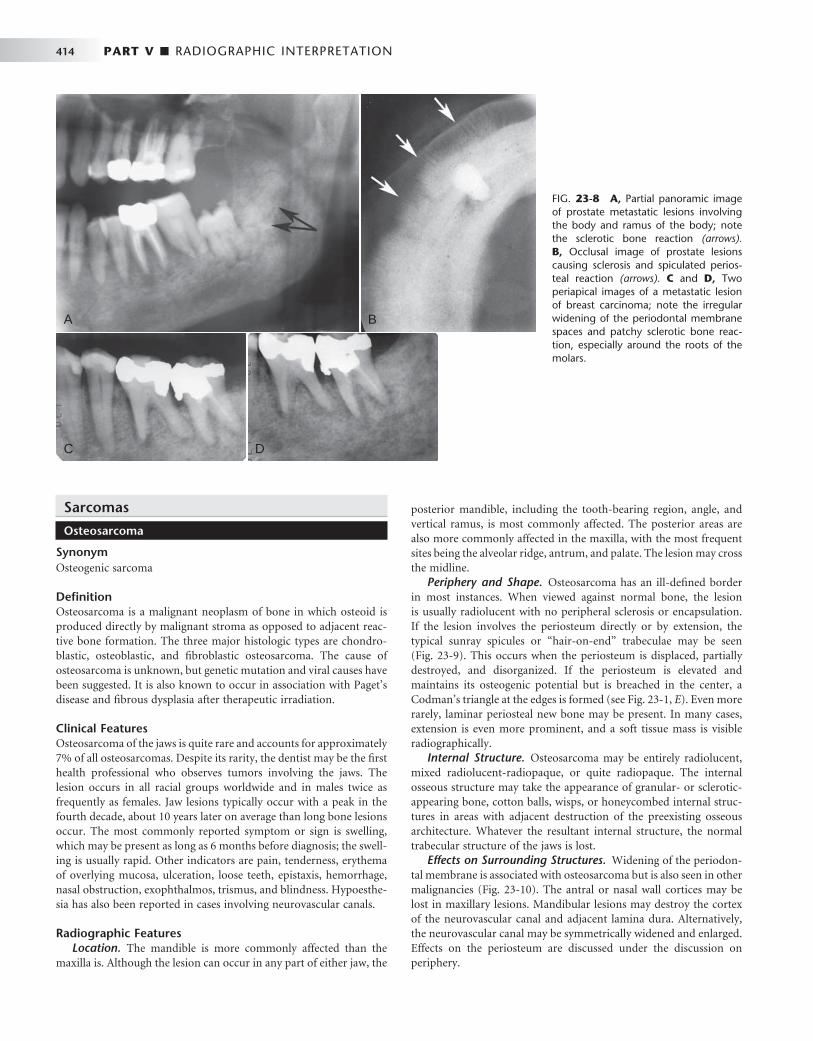
414 PART V ■ RADIOGRAPHIC INTERPRETATION
A
C D
B
FIG. 23-8 A, Partial panoramic image of prostate metastatic lesions involving the body and ramus of the body; note the sclerotic bone reaction (arrows). B, Occlusal image of prostate lesions causing sclerosis and spiculated perios-teal reaction (arrows). C and D, Two periapical images of a metastatic lesion of breast carcinoma; note the irregular widening of the periodontal membrane spaces and patchy sclerotic bone reac-tion, especially around the roots of the molars.
Sarcomas
Osteosarcoma
Synonym Osteogenic sarcoma
Defi nition Osteosarcoma is a malignant neoplasm of bone in which osteoid is produced directly by malignant stroma as opposed to adjacent reac-tive bone formation. The three major histologic types are chondro-blastic, osteoblastic, and fi broblastic osteosarcoma. The cause of osteosarcoma is unknown, but genetic mutation and viral causes have been suggested. It is also known to occur in association with Paget ’ s disease and fi brous dysplasia after therapeutic irradiation.
Clinical Features Osteosarcoma of the jaws is quite rare and accounts for approximately 7% of all osteosarcomas. Despite its rarity, the dentist may be the fi rst health professional who observes tumors involving the jaws. The lesion occurs in all racial groups worldwide and in males twice as frequently as females. Jaw lesions typically occur with a peak in the fourth decade, about 10 years later on average than long bone lesions occur. The most commonly reported symptom or sign is swelling, which may be present as long as 6 months before diagnosis; the swell-ing is usually rapid. Other indicators are pain, tenderness, erythema of overlying mucosa, ulceration, loose teeth, epistaxis, hemorrhage, nasal obstruction, exophthalmos, trismus, and blindness. Hypoesthe-sia has also been reported in cases involving neurovascular canals.
Radiographic Features Location. The mandible is more commonly affected than the
maxilla is. Although the lesion can occur in any part of either jaw, the
posterior mandible, including the tooth-bearing region, angle, and vertical ramus, is most commonly affected. The posterior areas are also more commonly affected in the maxilla, with the most frequent sites being the alveolar ridge, antrum, and palate. The lesion may cross the midline.
Periphery and Shape. Osteosarcoma has an ill-defi ned border in most instances. When viewed against normal bone, the lesion is usually radiolucent with no peripheral sclerosis or encapsulation. If the lesion involves the periosteum directly or by extension, the typical sunray spicules or “ hair-on-end ” trabeculae may be seen ( Fig. 23-9 ). This occurs when the periosteum is displaced, partially destroyed, and disorganized. If the periosteum is elevated and maintains its osteogenic potential but is breached in the center, a Codman ’ s triangle at the edges is formed (see Fig. 23-1, E ). Even more rarely, laminar periosteal new bone may be present. In many cases, extension is even more prominent, and a soft tissue mass is visible radiographically.
Internal Structure. Osteosarcoma may be entirely radiolucent, mixed radiolucent-radiopaque, or quite radiopaque. The internal osseous structure may take the appearance of granular- or sclerotic-appearing bone, cotton balls, wisps, or honeycombed internal struc-tures in areas with adjacent destruction of the preexisting osseous architecture. Whatever the resultant internal structure, the normal trabecular structure of the jaws is lost.
Effects on Surrounding Structures. Widening of the periodon-tal membrane is associated with osteosarcoma but is also seen in other malignancies ( Fig. 23-10 ). The antral or nasal wall cortices may be lost in maxillary lesions. Mandibular lesions may destroy the cortex of the neurovascular canal and adjacent lamina dura. Alternatively, the neurovascular canal may be symmetrically widened and enlarged. Effects on the periosteum are discussed under the discussion on periphery.
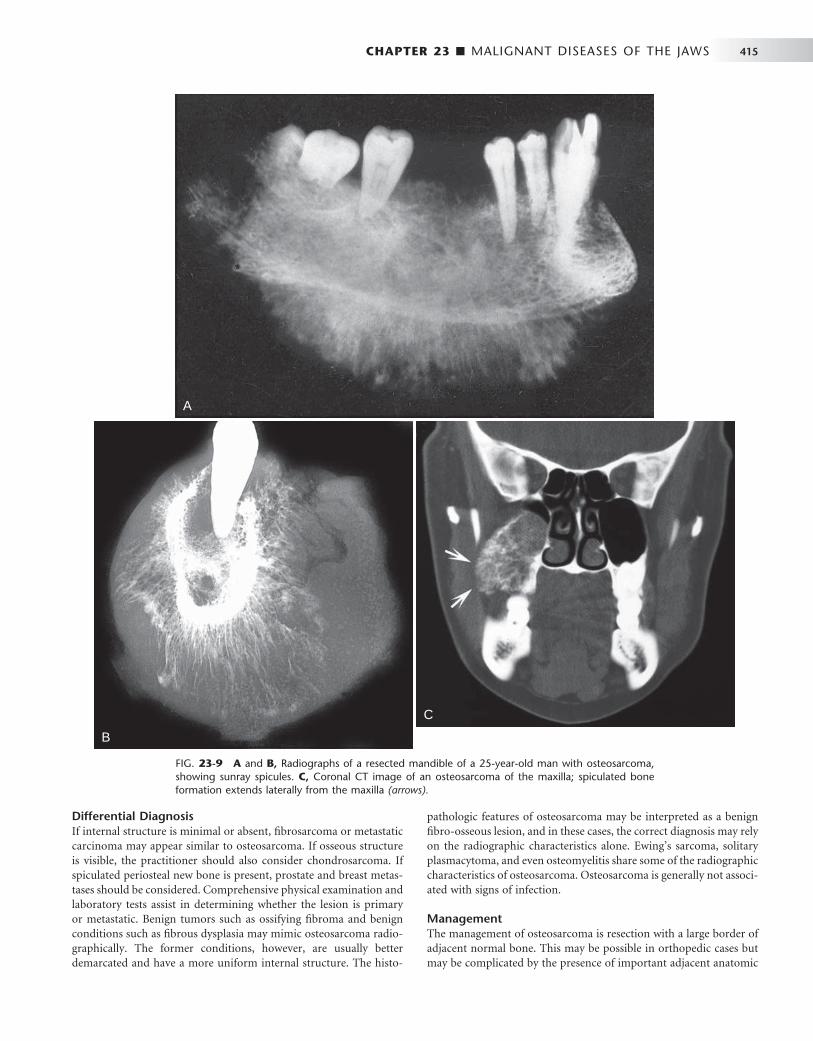
CHAPTER 23 ■ MALIGNANT DISEASES OF THE JAWS 415
FIG. 23-9 A and B, Radiographs of a resected mandible of a 25-year-old man with osteosarcoma, showing sunray spicules. C, Coronal CT image of an osteosarcoma of the maxilla; spiculated bone formation extends laterally from the maxilla (arrows).
A
B
C
Differential Diagnosis If internal structure is minimal or absent, fi brosarcoma or metastatic carcinoma may appear similar to osteosarcoma. If osseous structure is visible, the practitioner should also consider chondrosarcoma. If spiculated periosteal new bone is present, prostate and breast metas-tases should be considered. Comprehensive physical examination and laboratory tests assist in determining whether the lesion is primary or metastatic. Benign tumors such as ossifying fi broma and benign conditions such as fi brous dysplasia may mimic osteosarcoma radio-graphically. The former conditions, however, are usually better demarcated and have a more uniform internal structure. The histo-
pathologic features of osteosarcoma may be interpreted as a benign fi bro-osseous lesion, and in these cases, the correct diagnosis may rely on the radiographic characteristics alone. Ewing ’ s sarcoma, solitary plasmacytoma, and even osteomyelitis share some of the radiographic characteristics of osteosarcoma. Osteosarcoma is generally not associ-ated with signs of infection.
Management The management of osteosarcoma is resection with a large border of adjacent normal bone. This may be possible in orthopedic cases but may be complicated by the presence of important adjacent anatomic
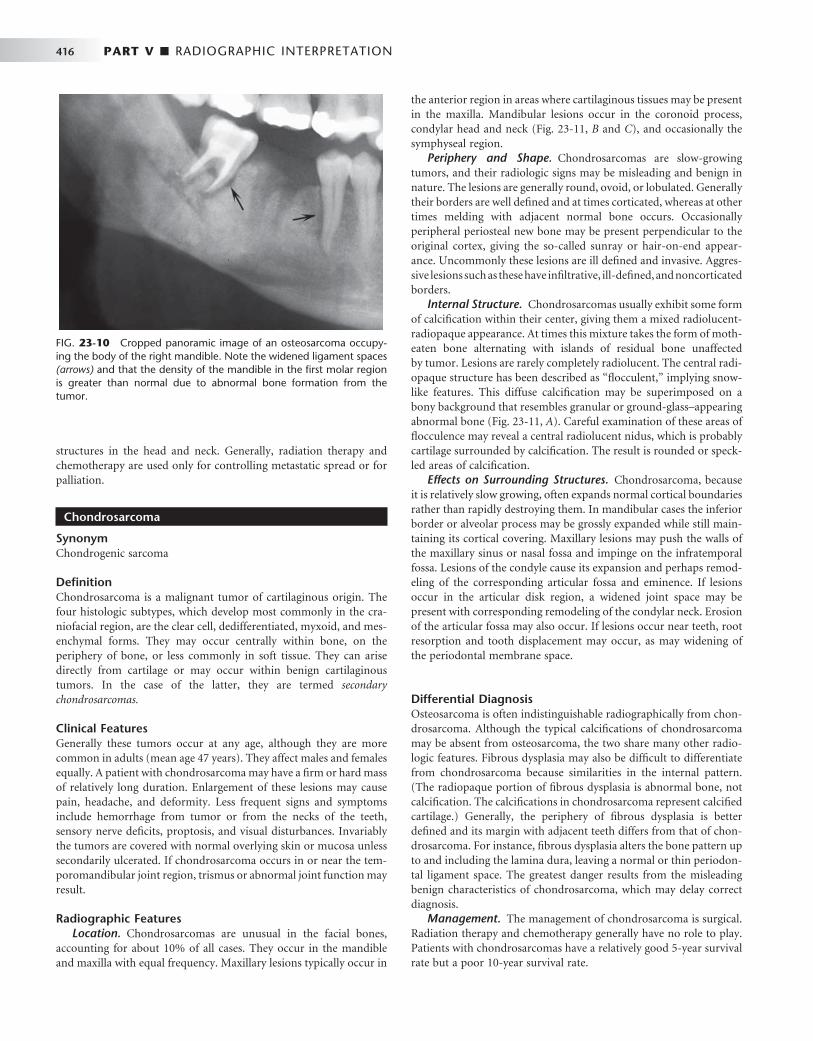
416 PART V ■ RADIOGRAPHIC INTERPRETATION
structures in the head and neck. Generally, radiation therapy and chemotherapy are used only for controlling metastatic spread or for palliation.
Chondrosarcoma
Synonym Chondrogenic sarcoma
Defi nition Chondrosarcoma is a malignant tumor of cartilaginous origin. The four histologic subtypes, which develop most commonly in the cra-niofacial region, are the clear cell, dedifferentiated, myxoid, and mes-enchymal forms. They may occur centrally within bone, on the periphery of bone, or less commonly in soft tissue. They can arise directly from cartilage or may occur within benign cartilaginous tumors. In the case of the latter, they are termed secondary chondrosarcomas.
Clinical Features Generally these tumors occur at any age, although they are more common in adults (mean age 47 years). They affect males and females equally. A patient with chondrosarcoma may have a fi rm or hard mass of relatively long duration. Enlargement of these lesions may cause pain, headache, and deformity. Less frequent signs and symptoms include hemorrhage from tumor or from the necks of the teeth, sensory nerve defi cits, proptosis, and visual disturbances. Invariably the tumors are covered with normal overlying skin or mucosa unless secondarily ulcerated. If chondrosarcoma occurs in or near the tem-poromandibular joint region, trismus or abnormal joint function may result.
Radiographic Features Location. Chondrosarcomas are unusual in the facial bones,
accounting for about 10% of all cases. They occur in the mandible and maxilla with equal frequency. Maxillary lesions typically occur in
the anterior region in areas where cartilaginous tissues may be present in the maxilla. Mandibular lesions occur in the coronoid process, condylar head and neck ( Fig. 23-11, B and C ), and occasionally the symphyseal region.
Periphery and Shape. Chondrosarcomas are slow-growing tumors, and their radiologic signs may be misleading and benign in nature. The lesions are generally round, ovoid, or lobulated. Generally their borders are well defi ned and at times corticated, whereas at other times melding with adjacent normal bone occurs. Occasionally peripheral periosteal new bone may be present perpendicular to the original cortex, giving the so-called sunray or hair-on-end appear-ance. Uncommonly these lesions are ill defi ned and invasive. Aggres-sive lesions such as these have infi ltrative, ill-defi ned, and noncorticated borders.
Internal Structure. Chondrosarcomas usually exhibit some form of calcifi cation within their center, giving them a mixed radiolucent-radiopaque appearance. At times this mixture takes the form of moth-eaten bone alternating with islands of residual bone unaffected by tumor. Lesions are rarely completely radiolucent. The central radi-opaque structure has been described as “ fl occulent, ” implying snow-like features. This diffuse calcifi cation may be superimposed on a bony background that resembles granular or ground-glass – appearing abnormal bone ( Fig. 23-11, A ). Careful examination of these areas of fl occulence may reveal a central radiolucent nidus, which is probably cartilage surrounded by calcifi cation. The result is rounded or speck-led areas of calcifi cation.
Effects on Surrounding Structures. Chondrosarcoma, because it is relatively slow growing, often expands normal cortical boundaries rather than rapidly destroying them. In mandibular cases the inferior border or alveolar process may be grossly expanded while still main-taining its cortical covering. Maxillary lesions may push the walls of the maxillary sinus or nasal fossa and impinge on the infratemporal fossa. Lesions of the condyle cause its expansion and perhaps remod-eling of the corresponding articular fossa and eminence. If lesions occur in the articular disk region, a widened joint space may be present with corresponding remodeling of the condylar neck. Erosion of the articular fossa may also occur. If lesions occur near teeth, root resorption and tooth displacement may occur, as may widening of the periodontal membrane space.
Differential Diagnosis Osteosarcoma is often indistinguishable radiographically from chon-drosarcoma. Although the typical calcifi cations of chondrosarcoma may be absent from osteosarcoma, the two share many other radio-logic features. Fibrous dysplasia may also be diffi cult to differentiate from chondrosarcoma because similarities in the internal pattern. (The radiopaque portion of fi brous dysplasia is abnormal bone, not calcifi cation. The calcifi cations in chondrosarcoma represent calcifi ed cartilage.) Generally, the periphery of fi brous dysplasia is better defi ned and its margin with adjacent teeth differs from that of chon-drosarcoma. For instance, fi brous dysplasia alters the bone pattern up to and including the lamina dura, leaving a normal or thin periodon-tal ligament space. The greatest danger results from the misleading benign characteristics of chondrosarcoma, which may delay correct diagnosis.
Management. The management of chondrosarcoma is surgical. Radiation therapy and chemotherapy generally have no role to play. Patients with chondrosarcomas have a relatively good 5-year survival rate but a poor 10-year survival rate.
FIG. 23-10 Cropped panoramic image of an osteosarcoma occupy-ing the body of the right mandible. Note the widened ligament spaces (arrows) and that the density of the mandible in the fi rst molar region is greater than normal due to abnormal bone formation from the tumor.

CHAPTER 23 ■ MALIGNANT DISEASES OF THE JAWS 417
FIG. 23-11 A, Chondrosarcoma of the anterior maxilla, with irregular calcifi cation in the internal structure of the tumor (arrows). B, Coronal CT image with bone algorithm of a chondrosarcoma involving the mandibular condyle (note the two areas of bone destruction). C, Axial CT scan with soft tissue algorithm demonstrating the soft tissue extent of the lesion (arrows) and sparse calcifi cations. ( A courtesy L. Hollender, DDS, Seattle, Wash.)
A
B
C
Ewing ’ s Sarcoma
Synonyms Endothelial myeloma and round cell sarcoma
Defi nition Ewing ’ s sarcoma is of indeterminate histogenesis. It is a tumor of long bones that is relatively rare in the jaws. Lesions arise in the medullary portion of the bone and spread to the endosteal and later to the peri-osteal surfaces.
Clinical Features Ewing ’ s sarcoma is most common in the second decade of life; most patients are between the ages of 5 and 30 years. Males are twice as likely to manifest the disease as females. In addition, multicentric
lesions have been reported. Other reported fi ndings at the time of presentation include, in descending frequency, swelling, pain, loose teeth, paresthesia, exophthalmos, ptosis, epistaxis, ulceration, shifted teeth, trismus, and sinusitis. Cervical lymphadenopathy has also been reported.
Radiographic Features Location. Mandibular cases outnumber maxillary cases by about
two to one, with the highest frequency found in posterior areas in both jaws. Generally the lesions develop within the marrow space fi rst and then extend to involve overlying cortical plates. This neoplasm rarely occurs in the jaws.
Periphery and Shape. Ewing ’ s sarcoma is a radiolucency that is poorly demarcated and never corticated. Its advancing edge destroys

418 PART V ■ RADIOGRAPHIC INTERPRETATION
bone in an uneven fashion, resulting in a ragged border. The lesions are usually solitary and may cause pathologic fracture with adjacent radiographically visible soft tissue masses ( Fig. 23-12 ). They may be round or ovoid but generally have no typical shape.
Internal Structure. Ewing ’ s sarcoma is a destructive process with little induction of bone formation. Because it commences on the internal aspect of the bone and involves the endosteal and periosteal surfaces later in its course, it is usually entirely radiolucent.
Effects on Surrounding Structures. Ewing ’ s sarcoma may stim-ulate the periosteum to produce new bone. This is usually the result of gross disturbances to the overlying periosteum and takes the form of Codman ’ s triangle or sunray or hair-on-end spiculation. Laminar periosteal new bone formation has been reported to occur but is not a common feature of active Ewing ’ s sarcoma lesions. Adjacent normal structures such as the mandibular neurovascular canal, inferior border of the mandible, and alveolar cortical plates may be effaced. If the lesion abuts teeth or tooth follicles, the cortices of these structures are destroyed. This tumor does not characteristically cause root resorp-tion, although it does destroy the supporting bone of adjacent teeth.
Differential Diagnosis Infl ammatory or infectious lesions such as osteomyelitis of the jaw may share some of the radiographic features of Ewing ’ s sarcoma. Although both are radiolucent, osteomyelitis is likely to have demon-strable sequestra present within the confi nes of the lesion, whereas Ewing ’ s sarcoma does not. Infl ammatory lesions contain some sign of reactive bone formation, resulting in some sclerosis internally or at the periphery, and differ in the associated periosteal bone formation.
Eosinophilic granuloma of the jaw is also a destructive process that occurs in the same part of the bone. It is associated with laminar periosteal bone reaction, whereas, in the jaws, Ewing ’ s sarcoma is not. The other central primary malignancies of bone such as osteosar-coma, chondrosarcoma, and fi brosarcoma may be diffi cult to differ-entiate from this condition.
Management Too few cases of maxillofacial Ewing ’ s sarcoma are available at any single treatment center for any specifi c treatment policy to have been
adopted. Surgery, radiation therapy, and chemotherapy may be used alone or in combination.
Fibrosarcoma
Defi nition Fibrosarcoma is a neoplasm composed of malignant fi broblasts that produce collagen and elastin. The etiology is unknown, although it may arise secondarily in tissues that have received therapeutic levels of radiation.
Clinical Features These lesions occur equally in males and females with a mean age in the fourth decade. A slowly to rapidly enlarging mass is the usual presenting symptom. The mass may be within bone, in which case it usually is accompanied by pain. Peripheral lesions or those exiting from bone may invade local soft tissues, causing a bulky, clinically obvious lesion. If central or peripheral lesions reach a large size, pathologic fracture may occur. If fi brosarcomas involve the course of peripheral nerves, sensory-neural abnormalities may occur. Overlying mucosa, although initially normal, may become erythematous or ulcerated. Involvement of the temporomandibular joint or paraman-dibular musculature is often accompanied by trismus.
Radiographic Features Location. Most cases of fi brosarcoma of the jaws occur in the
mandible, with the greatest number of these occurring in the premo-lar/molar region.
Periphery and Shape. Fibrosarcomas have ill-defi ned borders that are best described as ragged ( Fig. 23-13 ). They are poorly demar-cated, noncorticated, and lack any semblance of a capsule. These tumors are generally shaped in a fashion that suggests that they have grown along a bone, so they tend to be elongated through the marrow space. The radiographic border may underestimate the extent of the tumor because these lesions typically are infi ltrative. If soft tissue lesions occur adjacent to bone, they may cause a saucerlike depression in the underlying bone or invade it as would a squamous cell carci-noma. Finally, sclerosis may occur in the adjacent normal bone whether the fi brosarcoma is peripheral to bone or central.
FIG. 23-12 A and B, Coronal CT images with bone algorithm demonstrating Ewing ’ s sarcoma involving the left mandibular condyle; note the irregular margins, destruction of the medial cortex of the condyle, and a small pathologic fracture (arrow).
A B
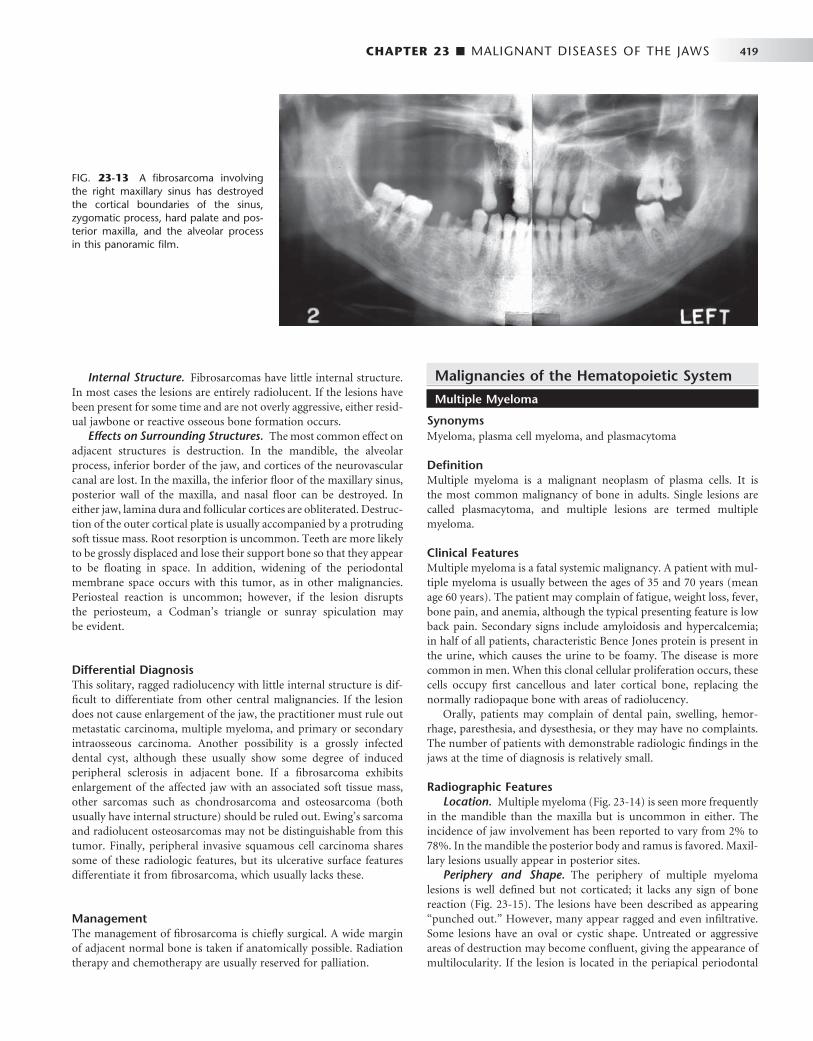
CHAPTER 23 ■ MALIGNANT DISEASES OF THE JAWS 419
Internal Structure. Fibrosarcomas have little internal structure. In most cases the lesions are entirely radiolucent. If the lesions have been present for some time and are not overly aggressive, either resid-ual jawbone or reactive osseous bone formation occurs.
Effects on Surrounding Structures. The most common effect on adjacent structures is destruction. In the mandible, the alveolar process, inferior border of the jaw, and cortices of the neurovascular canal are lost. In the maxilla, the inferior fl oor of the maxillary sinus, posterior wall of the maxilla, and nasal fl oor can be destroyed. In either jaw, lamina dura and follicular cortices are obliterated. Destruc-tion of the outer cortical plate is usually accompanied by a protruding soft tissue mass. Root resorption is uncommon. Teeth are more likely to be grossly displaced and lose their support bone so that they appear to be fl oating in space. In addition, widening of the periodontal membrane space occurs with this tumor, as in other malignancies. Periosteal reaction is uncommon; however, if the lesion disrupts the periosteum, a Codman ’ s triangle or sunray spiculation may be evident.
Differential Diagnosis This solitary, ragged radiolucency with little internal structure is dif-fi cult to differentiate from other central malignancies. If the lesion does not cause enlargement of the jaw, the practitioner must rule out metastatic carcinoma, multiple myeloma, and primary or secondary intraosseous carcinoma. Another possibility is a grossly infected dental cyst, although these usually show some degree of induced peripheral sclerosis in adjacent bone. If a fi brosarcoma exhibits enlargement of the affected jaw with an associated soft tissue mass, other sarcomas such as chondrosarcoma and osteosarcoma (both usually have internal structure) should be ruled out. Ewing ’ s sarcoma and radiolucent osteosarcomas may not be distinguishable from this tumor. Finally, peripheral invasive squamous cell carcinoma shares some of these radiologic features, but its ulcerative surface features differentiate it from fi brosarcoma, which usually lacks these.
Management The management of fi brosarcoma is chiefl y surgical. A wide margin of adjacent normal bone is taken if anatomically possible. Radiation therapy and chemotherapy are usually reserved for palliation.
Malignancies of the Hematopoietic System
Multiple Myeloma
Synonyms Myeloma, plasma cell myeloma, and plasmacytoma
Defi nition Multiple myeloma is a malignant neoplasm of plasma cells. It is the most common malignancy of bone in adults. Single lesions are called plasmacytoma, and multiple lesions are termed multiple myeloma.
Clinical Features Multiple myeloma is a fatal systemic malignancy. A patient with mul-tiple myeloma is usually between the ages of 35 and 70 years (mean age 60 years). The patient may complain of fatigue, weight loss, fever, bone pain, and anemia, although the typical presenting feature is low back pain. Secondary signs include amyloidosis and hypercalcemia; in half of all patients, characteristic Bence Jones protein is present in the urine, which causes the urine to be foamy. The disease is more common in men. When this clonal cellular proliferation occurs, these cells occupy fi rst cancellous and later cortical bone, replacing the normally radiopaque bone with areas of radiolucency.
Orally, patients may complain of dental pain, swelling, hemor-rhage, paresthesia, and dysesthesia, or they may have no complaints. The number of patients with demonstrable radiologic fi ndings in the jaws at the time of diagnosis is relatively small.
Radiographic Features Location. Multiple myeloma ( Fig. 23-14 ) is seen more frequently
in the mandible than the maxilla but is uncommon in either. The incidence of jaw involvement has been reported to vary from 2% to 78%. In the mandible the posterior body and ramus is favored. Maxil-lary lesions usually appear in posterior sites.
Periphery and Shape. The periphery of multiple myeloma lesions is well defi ned but not corticated; it lacks any sign of bone reaction ( Fig. 23-15 ). The lesions have been described as appearing “ punched out. ” However, many appear ragged and even infi ltrative. Some lesions have an oval or cystic shape. Untreated or aggressive areas of destruction may become confl uent, giving the appearance of multilocularity. If the lesion is located in the periapical periodontal
FIG. 23-13 A fi brosarcoma involving the right maxillary sinus has destroyed the cortical boundaries of the sinus, zygomatic process, hard palate and pos-terior maxilla, and the alveolar process in this panoramic fi lm.
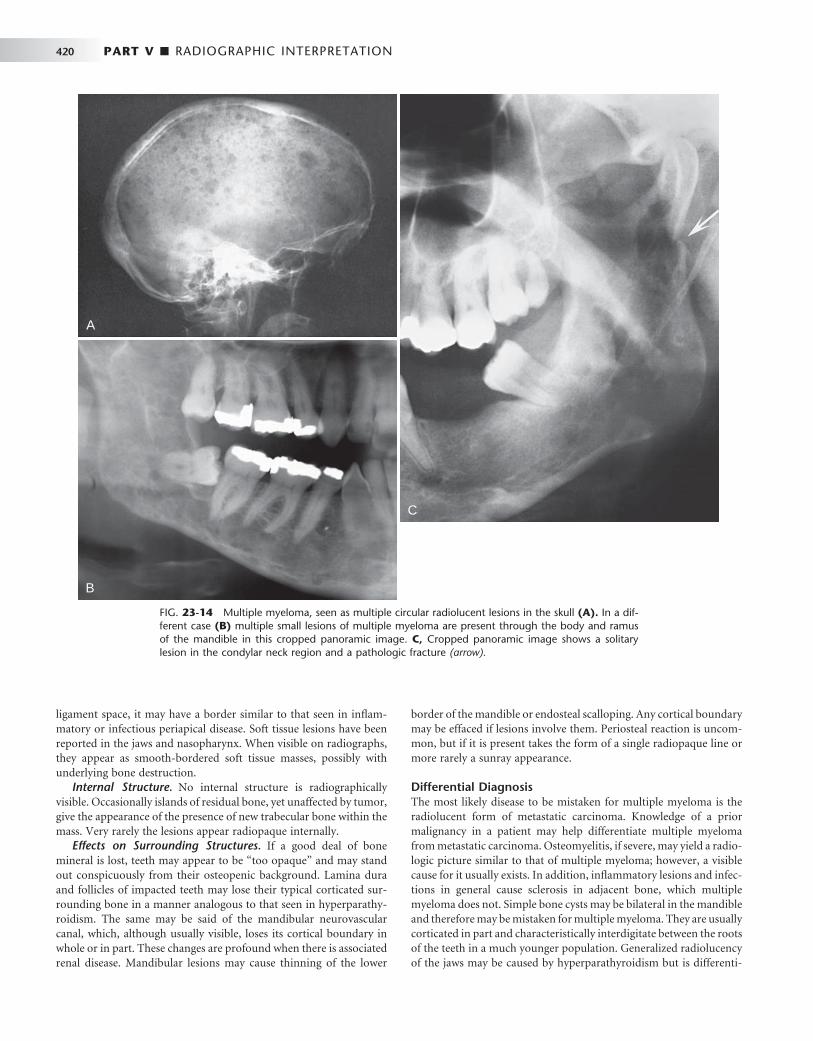
420 PART V ■ RADIOGRAPHIC INTERPRETATION
ligament space, it may have a border similar to that seen in infl am-matory or infectious periapical disease. Soft tissue lesions have been reported in the jaws and nasopharynx. When visible on radiographs, they appear as smooth-bordered soft tissue masses, possibly with underlying bone destruction.
Internal Structure. No internal structure is radiographically visible. Occasionally islands of residual bone, yet unaffected by tumor, give the appearance of the presence of new trabecular bone within the mass. Very rarely the lesions appear radiopaque internally.
Effects on Surrounding Structures. If a good deal of bone mineral is lost, teeth may appear to be “ too opaque ” and may stand out conspicuously from their osteopenic background. Lamina dura and follicles of impacted teeth may lose their typical corticated sur-rounding bone in a manner analogous to that seen in hyperparathy-roidism. The same may be said of the mandibular neurovascular canal, which, although usually visible, loses its cortical boundary in whole or in part. These changes are profound when there is associated renal disease. Mandibular lesions may cause thinning of the lower
border of the mandible or endosteal scalloping. Any cortical boundary may be effaced if lesions involve them. Periosteal reaction is uncom-mon, but if it is present takes the form of a single radiopaque line or more rarely a sunray appearance.
Differential Diagnosis The most likely disease to be mistaken for multiple myeloma is the radiolucent form of metastatic carcinoma. Knowledge of a prior malignancy in a patient may help differentiate multiple myeloma from metastatic carcinoma. Osteomyelitis, if severe, may yield a radio-logic picture similar to that of multiple myeloma; however, a visible cause for it usually exists. In addition, infl ammatory lesions and infec-tions in general cause sclerosis in adjacent bone, which multiple myeloma does not. Simple bone cysts may be bilateral in the mandible and therefore may be mistaken for multiple myeloma. They are usually corticated in part and characteristically interdigitate between the roots of the teeth in a much younger population. Generalized radiolucency of the jaws may be caused by hyperparathyroidism but is differenti-
FIG. 23-14 Multiple myeloma, seen as multiple circular radiolucent lesions in the skull (A). In a dif-ferent case (B) multiple small lesions of multiple myeloma are present through the body and ramus of the mandible in this cropped panoramic image. C, Cropped panoramic image shows a solitary lesion in the condylar neck region and a pathologic fracture (arrow).
A
B
C

CHAPTER 23 ■ MALIGNANT DISEASES OF THE JAWS 421
ated on the basis of abnormal blood chemistry. However, brown tumors of hyperparathyroidism, if present with generalized radiolu-cency of the jaws and similar symptoms, can readily be confused with multiple myeloma radiographically. Other metabolic diseases such as Gaucher ’ s disease or oxalosis may cause many of the changes similar to multiple myeloma that are observed on dental radiographs.
Management The management of multiple myeloma is usually chemotherapeutic with or without autologous or allogeneic bone marrow transplanta-tion. Radiation therapy may be used for treatment of symptomatic osseous lesions when palliation is required.
Non-Hodgkin ’ s Lymphoma
Synonyms Malignant lymphoma and lymphosarcoma
Defi nition Non-Hodgkin ’ s lymphoma is a malignant tumor of cells normally resident in the lymphatic system. In general, lymphomas occur within lymph nodes; however, extranodal sites such as bone, skin, gastrointes-tinal mucosa, tonsils, and Waldeyer ’ s ring can be involved. The term non-Hodgkin ’ s lymphoma describes a family of heterogeneous tumors of varying type and severity. The classifi cation of these diseases is dif-fi cult, and numerous means exist of subdividing these tumors. Cur-rently the working formulation for clinical usage classifi es tumors on the basis of their histologic appearance into low grade, intermediate grade, or high grade tumors, with the last being the most aggressive.
Clinical Features Non-Hodgkin ’ s lymphoma occurs in all age groups but is rare in patients in the fi rst decade. The maxillary sinus, palate, tonsillar area, and bone may be sites of primary or secondary lymphoma spread. Lesions occurring outside lymph nodes in the head and neck are present in as much as one out of fi ve cases. Patients may feel unwell, experiencing night sweats, pruritus, and weight loss. Palpable painless swelling, lymphadenopathy, and sensorineural defi cits may accom-pany isolated lesions of the jaws. Lesions present for some time may cause pain and ulceration. Teeth resident in a lymphoma may become mobile as the supporting bone is lost.
Radiographic Features Location. Most non-Hodgkin ’ s lymphomas of the head and neck
occur in the lymph nodes. Those that are extranodal are likely to affect the maxillary sinus, posterior mandible, and maxillary regions.
Periphery and Shape. Most non-Hodgkin ’ s lymphomas initially take the shape and form of the host bone. If untreated, however, they are capable of causing destruction of the overlying cortex ( Fig. 23-16 ). They may appear rounded or multiloculated and lack a defi ning outer cortex. Generally the borders are ill defi ned and invasive. Occasionally, lymphoma appears as multiple areas of destruction, which likely appear as fi ngerlike extensions of malignant tumor cells in a buccal or lingual direction. Visible lesions occurring in the maxillary sinus or nasopharynx have a smooth periphery.
Internal Structure. The internal structure of lymphoma is almost always entirely radiolucent. It is rare to see reactive bone formation. Occasionally patchy radiopacity may be present, but this is rare.
Effects on Surrounding Structures. In maxillary sinus lesions the antral walls may be effaced and a soft tissue mass may be
visible radiographically, either internally within the sinus or external to the maxillary sinus. Lesions involving the mandible destroy the cortex of the neurovascular canal. This tumor has a propensity to grow in the periodontal ligament space of mature teeth ( Fig. 23-17 ). The cortex of the crypts of developing teeth may be lost when the lymphoma is located in the developing papilla, and the involved teeth may be displaced in an occlusal direction and exfoliated. Peri-osteal reaction is not common but may take the form of laminated or spiculated bone formation. With the advent of soft tissue imaging with MRI, it has become apparent that this tumor has a habit of growing along soft tissue spaces (fat layers) and along the surface of bone.
Differential Diagnosis Multiple myeloma and metastatic carcinoma are easily confused with non-Hodgkin ’ s lymphoma of the jaws. However, Ewing ’ s sarcoma and Langerhans ’ histiocytosis, although also capable of producing the same effects, occur in a slightly younger age group. Osteolytic osteo-sarcoma and any of the central squamous cell carcinomas may not be distinguishable radiographically from non-Hodgkin ’ s lymphoma. Squamous cell carcinoma arising in the maxillary sinus may be diffi -cult to differentiate from lymphoma of the maxillary sinus. Other lesions that can displace developing teeth in an occlusal direction include leukemia and Langerhans ’ histiocytosis. Differentiation from apical rarefying osteitis may be diffi cult; however, careful inspection of the radiographic fi lm may reveal the presence of an infi ltrative border and adjacent bone destruction.
Management The management of extranodal or isolated nodal disease is radiation therapy with or without concomitant chemotherapy. Treatment depends on histologic variants and the location and extent of disease.
FIG. 23-15 Cropped panoramic image depicting multiple areas of well-defi ned bone destruction lacking any cortical boundary. The lesions are multiple, separate, and appear to be “ punched out, ” typical of changes seen in multiple myeloma. (Courtesy G. Petrikowski, DDS, Toronto, Ontario, Canada.)

422 PART V ■ RADIOGRAPHIC INTERPRETATION
A
B
FIG. 23-16 A, A panoramic image revealing a malignant lymphoma invading the right maxilla. Note the ill-defi ned bone destruction and loss of the anterior aspect of the fl oor of the maxillary antrum (arrows). The intraoral radiographs (B) also show ill-defi ned bone destruction and the lack of any bone reaction or formation.

CHAPTER 23 ■ MALIGNANT DISEASES OF THE JAWS 423
Burkitt ’ s Lymphoma
Synonym African jaw lymphoma
Defi nition Burkitt ’ s lymphoma is a high-grade B-cell lymphoma that differs from other B-cell lymphomas with respect to its histologic appearance and clinical behavior. It was fi rst described by Denis Burkitt in East Africa as an African jaw lymphoma.
Two separate forms of the disease have been described: the endemic African Burkitt ’ s lymphoma and the American form. The latter is not characterized by jaw involvement (although it occurs), but by involve-ment of abdominal viscera. African Burkitt ’ s lymphoma affects young children, whereas American Burkitt ’ s lymphoma affects adolescents and young adults. Cases of endemic and nonendemic Burkitt ’ s tumor have been described throughout the world.
Clinical Features The disease affects more males than females. Clinically the hallmark of this tumor is rapidity of growth with a tumor doubling time of less than 24 hours. It may involve children as young as 2 years and adults in the seventh decade, although it is primarily a disease of youth. Jaw tumors are rapidly growing and cause facial deformity very early in their course. They are capable of blocking nasal passages, displacing orbital contents, causing gross facial swelling, and eroding through skin. These rapidly growing tumors are more characteristic of African Burkitt ’ s lymphoma than the American form and cause pain and paresthesia. Teeth may become loosened rapidly and alveolar bone grossly distended. Paresthesia of the inferior alveolar nerve or other sensory facial nerves is common.
Radiographic Features Location. Extranodal disease is the norm in Burkitt ’ s tumor.
African cases may involve one jaw or both the maxilla and mandible and affect the posterior parts of the jaws. By contrast, American cases
may not involve the facial bones but are more likely to affect the abdominal viscera and testes.
Periphery and Shape. The lesions may begin as multiple ill-defi ned noncorticated radiolucencies that later coalesce into larger ill-defi ned radiolucencies with an expansile periphery. They are of no specifi c shape, although they expand rapidly and have been likened to a balloon. This expansion breaches its outer cortical limits, causing gross balloonlike expansion with thinning of adjacent structures and production of a soft tissue tumor mass adjacent to the osseous lesion. Lesions that abut the orbital contents or the maxillary sinus may show a smooth surface soft tissue mass radiologically.
Internal Structure. Burkitt ’ s lymphoma does not produce bone and rarely induces production of reactive bone within its center. For this reason, the lesions are radiolucent in almost all cases. It is particu-larly radiolucent in the jaw of a child.
Effects on Surrounding Structures. Erupted teeth in the area of Burkitt ’ s tumor are grossly displaced, as are developing tooth crypts. Tumor cells within the crypt may displace the developing tooth bud to one side of its crypt. A tumor that is located apical to a developing tooth may cause it to be displaced such that it appears to erupt with little if any root formation. After tumor involvement of the developing dental structures occurs, root development ceases. Lamina dura of teeth in the area is destroyed, and cortical boundaries such as the maxillary sinus, nasal fl oor, orbital walls, and inferior border of the mandible are thinned and later destroyed. The cortex of the inferior alveolar canal is lost, although it is diffi cult to see in the radiographs of a normal pediatric patient in any case. If periosteum is involved, the border may show sunray spiculation, although this is rare. Cases that involve the orbit displace the orbital contents, seen both clinically and radiologically.
Differential Diagnosis Metastatic neuroblastoma may give similar changes clinically and radiologically, as may Ewing ’ s tumor. Osteolytic osteosarcoma can grow rapidly and may be indistinguishable from Burkitt ’ s tumor on
FIG. 23-17 A cropped panoramic image (A) revealing an ill-defi ned lymphoma invading the left body of the mandible; note the irregular widening of the periodontal ligament spaces (arrows). Intra-oral fi lms of the same case (B) and the widened periodontal ligament spaces (white arrows) compared with the normal periodontal ligament space of the right mandibular cuspid (black arrow).
A B

424 PART V ■ RADIOGRAPHIC INTERPRETATION
clinical and radiologic grounds. Cherubism has more internal struc-ture, does not breach bony borders, is bilateral, and grows much more slowly. Finally, non-Hodgkin ’ s lymphoma must be considered, although it occurs in a much older age group in most cases.
Management The management of Burkitt ’ s tumor is chemotherapeutic. Chemo-therapy regimens vary from geographic locales, but the tumor is exquisitely sensitive to combinations of chemotherapeutic agents.
Leukemia
Synonyms Acute myelogenous leukemia, acute lymphoblastic leukemia, chronic myelogenous leukemia, and chronic lymphocytic leukemia are types of leukemia.
Defi nition Leukemia is a malignant tumor of hematopoietic stem cells. These malignant cells displace normal bone marrow constituents and spill out into the peripheral blood. They are subdivided into acute leuke-mias and chronic leukemias and further subdivided by the cell of origin. The acute leukemias occur with a bimodal age distribution, with very young patients and very old patients being the most com-monly affected. Most cases of leukemia are associated with nonran-dom chromosomal abnormalities.
Clinical Features The patient with chronic leukemia may have no presenting signs or complaints. Acute leukemia patients generally feel unwell with weak-ness and bone pain. They may exhibit pallor, spontaneous hemor-rhage, hepatomegaly, splenomegaly, lymphadenopathy, and fever. Oral symptoms are generally absent but, if present, include loose teeth, petechiae, ulceration, and boggy enlarged gingiva.
Radiographic Features Radiologic signs associated with chronic leukemia are comparatively rare.
Location. Leukemia affects the entire body because it is a malig-nancy of bone marrow, which discharges malignant cells into circulat-ing blood. Its manifestations in the jaws may be seen more often in areas of developing teeth. Frequently, leukemia may be localized around the periapical region of a tooth, giving the appearance of a rarefying osteitis.
Periphery and Shape. Leukemia must be considered a systemic malignancy, and as such its oral radiologic features may be present bilaterally as ill-defi ned patchy radiolucent areas. With time and lack of treatment, these patchy areas may coalesce to form larger areas of ill-defi ned radiolucent regions of bone ( Fig. 23-18 ). The teeth may appear to stand out conspicuously from their surrounding, osteopenic bone.
Internal Structure. The internal structure of leukemia is charac-terized by patchy areas of radiolucency and generalized radiolucency of the bone. Rarely, granular bone may be seen within these lesions. Occasionally, foci of leukemic cells may be present as a mass that may behave like a localized malignant tumor. These lesions, called chloro-mas, are rare in the jaws.
Effects on Surrounding Structures. Leukemia does not cause expansion of bone, although occasionally a single layer of periosteal new bone may be seen in association with this disease, which is uncommon in chronic leukemia. Developing teeth in their crypts and teeth undergoing eruption may be displaced in an occlusal direction ( Fig. 23-19 ) or into the oral cavity before root development. Less commonly, developing teeth may be displaced from their normal positions. The result of this is premature loss of teeth. The lamina dura and cortical outlines of follicles may be effaced. If lesions affect the periodontal structures, the crestal bone may be lost.
Differential Diagnosis Generally, by the time oral radiologic signs of leukemia are present, a medical diagnosis has been reached. However, the development of radiologic changes may be the fi rst indication of the relapse of treat-ment. Occasionally, lymphoma or neuroblastoma may mimic some of the features of destruction seen in leukemia. Metabolic disorders may be considered in those cases in which generalized rarefaction of bone
FIG. 23-18 Periapical radiographs of the left mandible illustrating multifocal areas of bone destruc-tion and widening of portions of the periodontal ligament space (arrow) characteristic of infi ltration of the mandible with leukemia.
A B

CHAPTER 23 ■ MALIGNANT DISEASES OF THE JAWS 425
is seen. These conditions are all excluded on the basis of blood testing. With apical lesions, careful examination of the involved tooth clini-cally and radiologically typically shows no apparent cause for rarefy-ing osteitis.
Management The management of leukemia is primarily through a combination of chemotherapy with or without allogeneic or autologous bone marrow transplantation. Some chronic leukemias are managed with low-dose chemotherapy.
Dental Radiology for the Cancer Survivor
The cancer survivor requires dental treatment just as any other patient. For the cancer survivor, dental radiologic examination may be more important than for a healthy patient receiving a routine examination. Some patients who have received a full course of radiation therapy are concerned about the additional exposure from a dental radiographic examination. However, this is not a valid concern because the small dose associated with dental radiographic examinations is negligible compared with the radiation dose received from cancer therapy.
The patient treated for head and neck malignancy with radiation therapy, even with today ’ s advanced radiotherapeutic methods, is prone to development of postradiation dental caries and osteoradio-necrosis. Careful clinical examination and a thorough dental radio-logic examination may be required periodically to ensure that the remaining dentition and periodontal apparatus is in good shape. Radiation caries occur in many patients and appears clinically differ-ent from typical dental caries. If untreated, these carious teeth become nonvital and may cause infection in the underlying jaw. If they require extraction, healing can be expected to be slow and occasionally osteo-radionecrosis may result.
The role of radiology in these patients, however, is not restricted to examination of the teeth and supporting structures. Equally impor-tant is the monitoring of the outcome of treatment, specifi cally the examination of dental radiographs for evidence of tumor recurrence, development of metastases, and osteoradionecrosis.
SUGGESTED READINGS
SQUAMOUS CELL CARCINOMA
Carter RL : Patterns and mechanisms of spread of squamous carcinomas of the oral cavity , Clin Otolaryngol Allied Sci 15 : 185 - 191 , 1990 .
Casiglia J , Woo SB : A comprehensive review of oral cancer , Gen Dent 49 : 72 - 82 , 2001 .
Marchetta FC , Sako K , Murphy JB : The periosteum of the mandible and intraoral carcinoma , Am J Surg 122 : 711 - 713 , 1971 .
McGregor AD , MacDonald DG : Routes of entry of squamous cell carcinoma to the mandible , Head Neck Surg 10 : 294 - 301 , 1988 .
Noyek AM , Wortzman G , Holgate RC et al : The radiologic diagnosis of malignant tumors of the paranasal sinuses and related structures , J Otolaryngol 6 : 399 - 406 , 1977 .
O ’ Brien CJ , Carter RL , Soo KC et al : Invasions of the mandible by squamous carcinomas of the oral cavity and oropharynx , Head Neck Surg 8 : 247 - 256 , 1986 .
Rao LP , Das SR , Mathews A et al : Mandibular invasion in oral squamous cell carcinoma: investigation by clinical examination and orthopantomogram , Int J Oral Maxillofac Surg 33 : 454 - 457 , 2004 .
Stambuk HE , Karimi S , Lee N et al : Oral cavity and oropharynx tumors , Radiol Clin North Am 45 : 1 - 20 , 2007 .
SQUAMOUS CELL CARCINOMA ORIGINATING IN BONE
Ariji E , Ozeki S , Yonetsu K et al : Central squamous cell carcinoma of the mandible: computed tomographic fi ndings , Oral Surg Oral Med Oral Pathol 77 : 541 - 548 , 1994 .
Elzay RP : Primary intraosseous carcinoma of the jaws. Review and update of odontogenic carcinomas , Oral Surg Oral Med Oral Pathol 54 : 299 - 303 , 1982 .
Lin YJ , Chen CH , Wang WC et al : Primary intraosseous carcinoma of the mandible , Dentomaxillofacial Radiol 34 : 112 - 116 , 2005 .
Suei Y , Tanimoto K , Taguchi A et al : Primary intra-osseous carcinoma: review of the literature and diagnostic criteria , J OralMaxillofac Surg 52 : 580 , 1994 .
SQUAMOUS CELL CARCINOMA ORGINATING IN A CYST
Cavalcanti MG , Veltrini VC , Ruprecht A et al : Squamous-cell carcinoma arising from an odontogenic cyst — the importance of computed tomography in the diagnosis of malignancy , Oral Surg Oral Med Oral Pathol Oral Radiol Endod 100 : 365 - 368 , 2005 .
Dabbs DJ , Schweitzer RJ , Schweitzer LE et al : Squamous cell carcinoma arising in recurrent odontogenic keratocyst , Head Neck 16 : 375 - 378 , 1994 .
Eversole LR , Sabes WR , Rovin S : Aggressive growth and neoplastic potential of odontogenic cysts: with special reference to central epidermoid and mucoepidermoid carcinomas , Cancer 35 : 270 - 282 , 1975 .
Kaffe I , Ardekian L , Peled M et al : Radiological features of primary intra-osseous carcinoma of the jaws: analysis of the literature and report of a new case , Dentomaxillofac Radiol 27 : 209 - 214 , 1998 .
van der Wal KG , de Visscher JG , Eggink HF : Squamous cell carcinoma arising in a residual cyst. A case report , Int J Oral Maxillofac Surg 23 : 350 - 352 , 1993 .
MUCOEPIDERMOID CARCINOMA
Bilge OM , Dayi E : Central mucoepidermoid carcinoma of the jaws: review of the literature and case report , Ann Dent 51 : 36 - 39 , 1992 .
Browand BC , Waldron CA : Central mucoepidermoid tumors of the jaws: report of nine cases and review of the literature , Oral Surg Oral Med Oral Pathol 40 : 631 - 643 , 1975 .
Freije JE , Campbell BH , Yousif NJ et al : Central mucoepidermoid carcinoma of the mandible , Otolaryngol Head Neck Surg 112 : 453 - 456 , 1995 .
Inagaki M , Yuasa K , Nakayama E et al : Mucoepidermoid carcinoma in the mandible: fi ndings of panoramic radiography and computed tomography , Oral Surg Oral Med Oral Pathol Oral Radiol Endod : 85 : 613 - 618 , 1998 .
FIG. 23-19 A cropped panoramic fi lm demonstrating occlusal dis-placement of the developing mandibular second molar out of its follicle (arrow).

426 PART V ■ RADIOGRAPHIC INTERPRETATION
Lopez JI , Elizalde JM , Landa S : Central mucoepidermoid carcinoma: report of a case and review of the literature , Pathol Res Pract 189 : 365 , 368, 1993 .
Sidoni A , D ’ Errico P , Simoncelli C et al : Central mucoepidermoid carcinoma of the mandible , J Oral Maxillofac Surg 54 : 1242 - 1245 , 1996 .
Strick MJ , Kelly C , Soames JV et al : Malignant tumours of the minor salivary glands — a 20 year review , Br J Plas Surg 57 : 624 - 631 , 2004 .
MALIGNANT AMELOBLASTOMA AND AMELOBLASTIC CARCINOMA
Ameerally P , McGurk M , Shaheen O : Atypical ameloblastoma: report of 3 cases and review of the literature , Br J Oral Maxillofac Surg 34 : 235 - 239 , 1996 .
Buff SJ , Chen JT , Ravin CC et al : Pulmonary metastasis from ameloblastoma of the mandible: report of a case and review of the literature , J Oral Surg 38 : 374 - 376 , 1980 .
Slootweg PJ , M ü ller H : Malignant ameloblastoma or amelo-blastic carcinoma , Oral Surg Oral Med Oral Pathol 57 : 168 - 176 , 1984 .
Suomalainen A , Hietanen J , Robinson S et al : Ameloblastic carcinoma of the mandible resembling odontogenic cyst in a panoramic radiograph , Oral Surg Oral Med Oral Pathol Oral Radiol Endod 101 : 638 - 642 , 2006 .
METASTATIC TUMORS
Ciola B : Oral radiographic manifestations of a metastatic prostatic carcinoma , Oral Surg Oral Med Oral Pathol 52 : 105 - 108 , 1981 .
Mast HL , Nissenblatt MJ : Metastatic colon carcinoma to the jaw: a case report and review of the literature , J Surg Oncol 34 : 202 - 207 , 1987 .
Mucitelli DR , Zuna RE , Archard HO : Hepatocellular carcinoma presenting as an oral cavity lesion , Oral Surg Oral Med Oral Pathol 66 : 701 - 705 , 1988 .
Nevins A , Ruden S , Pruden P et al : Metastatic carcinoma of the mandible mimicking periapical lesion of endodontic origin , Endod Dent Traumatol 4 : 238 - 239 , 1988 .
Redman RS , Behrens AS , Calhoun NR : Carcinoma of the lung presenting as a mandibular metastasis , J Oral Maxillofac Surg 40 : 745 - 750 , 1982 .
Vigneul JC , Nouel O , Klap P et al : Metastatic hepatocellular carcinoma of the mandible , J Oral Maxillofac Surg 40 : 745 - 749 , 1982 .
OSTEOGENIC SARCOMA
Bainchi SD , Boccardi A : Radiological aspects of osteosarcoma of the jaws , Dentomaxillofac Radiol 28 : 42 - 47 , 1999 .
Batsakis JG : Osteogenic and chondrogenic sarcomas of the jaws , Ann Otol Rhinol Laryngol 96 : 474 - 475 , 1987 .
Chindia ML : Osteosarcoma of the jaw bones , Oral Oncol . 37 : 545 - 547 , 2001 . Clark JL , Unni KK , Dahlin DC et al : Osteosarcoma of the jaw , Cancer
51 : 2311 - 2316 , 1983 . Gardner DG , Mills DM : The widened periodontal ligament of osteosarcoma
of the jaws , Oral Surg Oral Med Oral Pathol 41 : 652 - 656 , 1976 . Givol N , Buchner A , Taicher S et al : Radiological features of osteogenic
sarcoma of the jaws: a comparative study of different radiographic modalities , Dentomaxillofac Radiol 27 : 313 - 320 , 1998 .
Seeger LL , Gold RH , Chandnani VP : Diagnostic imaging of osteosarcoma , Clin Orthop Rel Res 270 : 254 - 263 , 1991 .
Vener J , Rice DH , Newman AN : Osteosarcoma and chondrosarcoma of the head and neck , Laryngoscope 94 : 240 - 242 , 1984 .
CHONDROSARCOMA
Garrington GE , Collett WK : Chondrosarcoma, I: a selected literature review , J Oral Pathol 17 : 1 - 11 , 1988 .
Garrington GE , Collett WK : Chondrosarcoma, II: Chondrosarcoma of the jaws: analysis of 37 cases , J Oral Pathol 17 : 12 - 20 , 1988 .
Gorsky M , Epstein JB : Craniofacial osseous and chondromatous sarcomas in British Columbia — a review of 34 cases , Oral Oncol 36 : 27 - 31 , 2000 .
Hayt MW Becker L Katz DS : Chondrosarcoma of the maxilla: panoramic radiographic and computed tomographic with multiplanar reconstruction fi ndings , Dentomaxillofac Radiol 27 : 113 - 116 , 1998 .
Hertzanu Y , Mendelsohn DB , Davidge-Pitts K et al : Chondrosarcoma of the head and neck-the value of computed tomography , J Surg Oncol 28 : 97 - 102 , 1985 .
EWING ’ S SARCOMA
Dahlin DC , Coventry MB , Scanlon PW : Ewing ’ s sarcoma. A critical analysis of 165 cases , J Bone Joint Surg Am 2 : 185 - 192 , 1961 .
Greer RO , Mierau GW , Favara BE : Tumors of the head and neck in children , New York , 1983 , Praeger .
Wood RE , Nortje CJ , Hesseling P et al : Ewing ’ s tumor of the jaw , Oral Surg Oral Med Oral Pathol 69 : 120 - 127 , 1990 .
FIBROSARCOMA
Dahlin DC : Bone tumors , Springfi eld, IL , 1981 , Charles C Thomas . Huvos AG : Bone tumors , Philadelphia , 1979 , WB Saunders . O ’ Day RA , Soule EH , Goresg RJ : Soft tissue sarcomas of the oral cavity ,
Mayo Clin Proc 39 : 169 - 181 , 1964 . Slootweg PJ , M ü ller H : Fibrosarcoma of the jaws. A study of 7 cases ,
J Maxillofac Surg 12 : 157 - 162 , 1984 . Taconis WK , van Rijssel TG : Fibrosarcoma of the jaws , Skeletal Radiol 15 :
10 - 13 , 1986 . van Blarcom CW , Masson JMK , Dahlin DC : Fibrosarcoma of the mandible.
A clinicopathologic study , Oral Surg Oral Med Oral Pathol 32 : 428 - 439 , 1971 .
RHABDOMYOSARCOMA
Bras J , Batsakis JG , Luna MA : Rhabdomyosarcoma of the oral soft tissues , Oral Surg Oral Med Oral Pathol 64 : 585 - 596 , 1987 .
Grieman RB , Katsikeris NK , Symington JM : Rhabdomyosarcoma of the maxillary sinus: review of the literature and report of a case , J Oral Maxillofac Surg 46 : 1090 , 1988 .
Masson JK , Soule EH : Embryonal rhabdomyosarcoma of the head and neck: report of 88 cases , Am J Surg 110 : 585 , 1965 .
Sekhar MS , Desai S , Kumar GS: Alveolar rhabdomyosarcoma involving the jaws: a case report , J Oral Maxillofac Surg 58 : 1062 - 1065 , 2000 .
Stobbe GD , Dargeon HW : Embryonal rhabdomyosarcoma of the head and neck in children and adolescents , Cancer 3 : 826 - 836 , 1950 .
MULTIPLE MYELOMA
Furutani M , Ohnishi M , Tanaka Y : Mandibular involvement in patients with multiple myeloma , J Oral Maxillofac Surg 52 : 23 - 25 , 1994 .
Huvos AG : Bone tumors , Philadelphia , 1979 , WB Saunders . Kaffe I , Ramon Y , Hertz M : Radiographic manifestations of multiple
myeloma in the mandible , Dentomaxillofac Radiol 15 : 31 - 35 , 1986 . Witt C , Borges AC , Klein K et al : Radiographic manifestations of multiple
myeloma in the mandible: a retrospective study of 77 patients , J Oral Maxillofac Surg 55 : 450 - 453 , 1997 .
NON-HODGKIN ’ S LYMPHOMA
Dahlin DC : Bone tumors , ed 3 , Springfi eld, IL , 1981 , Charles C Thomas . Daramola JO , Ajagbe HA : Presentation and behaviour of primary malignant
lymphoma of the oral cavity in adult Africans , J Oral Med 38 : 177 - 179 , 1983 .
Maxymiw WG , Goldstein M , Wood RE : Extranodal non-Hodgkin ’ s lymphoma of the maxillofacial region: analysis of 88 consecutive cases , SADJ 56 : 524 - 527 , 2001 .
Pazoki A , Jansisyanont P , Ord RA: Primary non-Hodgkin ’ s lymphoma of the jaws: report of 4 cases and review of the literature , J Oral Maxillofac Surg 61 : 112 - 117 , 2003 .
Yamada T , Kitagawa Y , Ogasawara T et al : Enlargement of the mandibular canal without hypesthesia caused by extranodal non-Hodgkin ’ s lymphoma: a case report , Oral Surg Oral Med Oral Pathol Oral Radiol Endod 89 : 388 - 392 , 2000 .
CHAPTER 23 ■ MALIGNANT DISEASES OF THE JAWS 427
BURKITT ’ S LYMPHOMA
Adatia AK : Signifi cance of jaw lesions in Burkitt ’ s lymphoma , Br Dent J 145 : 263 - 266 , 1978 .
Adatia AK : Radiology of Burkitt ’ s tumour in the jaws , East Afr Med J 43 : 290 - 297 , 1966 .
Burkitt D : A sarcoma involving the jaws in African children , Br J Surg 46 : 218 - 223 , 1958 .
Jan A , Vora K , Sandor GKB : Sporadic Burkitt ’ s lymphoma of the jaws: the essentials of prompt life-saving referral and management , J Can Dent Assoc 71 : 165 - 168 , 2005 .
Levine PH , Kamaraju LS , Connelly RR et al : The American Burkitt ’ s lymphoma registry: eight years ’ experience , Cancer 49 : 1016 , 1982 .
Sariban E , Donahue A , Magrath IT : Jaw involvement in American Burkitt ’ s Lymphoma , Cancer 53 : 1777 - 1782 , 1984 .
LEUKEMIA
Curtis AB : Childhood leukemias: initial oral manifestations , J Am Dent Assoc 83 : 159 - 164 , 1971 .
Ficarra G , Silverman S Jr , Quivey JM et al : Granulocytic sarcoma (chloroma) of the oral cavity: a case with a leukemic presentation , Oral Surg 53 : 709 - 714 , 1987 .
Greer RO , Mierau GW , Favara BE : Tumors of the head and neck in children , New York , 1983 , Praeger Scientifi c .
Nortj é CJ : General practitioner ’ s radiology case 16. Acute leukemia , SADJ 58 : 393 , 2001 .
C H A P T E R 2 4
Diseases of Bone Manifested in the Jaws
This chapter discusses disorders of bone that do not easily fi t into well-defi ned categories of disease.
Bone Dysplasias
Bone dysplasias constitute a group of conditions in which normal bone is replaced with fi brous tissue containing abnormal bone or cementum. These lesions must be differentiated from tumors because the treatment is very different. Fibro-osseous lesion, originally a histo-pathologic term, is a commonly used term that includes the following bone dysplasias and neoplasms and other lesions of bone.
FIBROUS DYSPLASIA
Defi nition Fibrous dysplasia results from a localized change in normal bone metabolism that results in the replacement of all the components of cancellous bone by fi brous tissue containing varying amounts of abnormal-appearing bone. This may be the result of a sporadic gene mutation. At the histologic level, the result is the appearance of numerous short, irregularly shaped trabeculae of woven bone. These trabeculae are not aligned in response to stress, but rather have a random orientation. This histologic appearance is responsible for the abnormal internal trabecular pattern seen in radiographs. Fibrous dysplasias may be solitary or multiple (Jaffe type) or may occur in another multiple form associated with McCune-Albright syndrome, which usually comprises polyostotic fi brous dysplasia, cutaneous pig-mentation (caf é au lait spots), and hyperfunction of one or more of the endocrine glands.
Clinical Features The solitary (monostotic) form of fi brous dysplasia, which accounts for 70% of all cases, is the type that most often involves the jaws. The most common sites (in order) are the ribs, femur, tibia, maxilla, and mandible. The multiple (polyostotic) form usually is found in chil-dren younger than 10 years, whereas monostotic disease typically is discovered in a slightly older age group. The lesions usually become static when skeletal growth stops, but proliferation may continue, particularly in the polyostotic form. The lesions may become active in pregnant women or with the use of oral contraceptives; and abnor-mal growth may occur after surgical intervention in young patients. Studies of the sex distribution of fi brous dysplasia show no sexual predilection except for McCune-Albright syndrome, which affects females almost exclusively. Symptoms of the disease may be mild or
absent. Monostotic fi brous dysplasia often is discovered as an inciden-tal radiographic fi nding. Patients with jaw involvement fi rst may com-plain of unilateral facial swelling or an enlarging deformity of the alveolar process. Pain and pathologic fractures are rare. If extensive craniofacial lesions have impinged on nerve foramina, neurologic symptoms such as anosmia (loss of the sense of smell), deafness, or blindness may develop.
Radiographic Features Location. Fibrous dysplasia involves the maxilla almost twice
as often as the mandible and occurs more frequently in the posterior aspect. Lesions more commonly are unilateral ( Fig. 24-1 ) except for very rare extensive lesions of the maxillofacial region that are bilateral.
Periphery. The periphery of fi brous dysplasia lesions most com-monly is ill defi ned, with a gradual blending of normal trabecular bone into an abnormal trabecular pattern. Occasionally the boundary between normal bone and the lesion can appear sharp and even cor-ticated, especially in young lesions ( Fig. 24-2 ).
Internal Structure. The density and trabecular pattern of fi brous dysplasia lesions vary considerably. The variation is more pronounced in the mandible and more homogeneous in the maxilla. The internal aspect of bone may be more radiolucent, more radiopaque, or a mixture of these two variations compared with normal bone (see Fig. 24-1 ). The internal density is more radiopaque in the maxilla and the base of the skull. Early lesions may be more radiolucent ( Fig. 24-3 ) than are mature lesions and in rare cases may appear to have granular internal septa, giving the internal aspect a multilocular appearance.
The abnormal trabeculae usually are shorter, thinner, irregularly shaped, and more numerous than normal trabeculae are. This creates a radiopaque pattern that can vary; it may have a granular appearance (or “ ground-glass ” appearance, resembling the small fragments of a shattered windshield), a pattern resembling the surface of an orange (peau d ’ orange), a wispy arrangement (cotton wool), or an amor-phous, dense pattern ( Fig. 24-4 ). A distinctive characteristic is the organization of the abnormal trabeculae into a swirling pattern similar to a fi ngerprint ( Fig. 24-5 ). Occasionally, radiolucent regions resembling cysts may occur in mature lesions of fi brous dysplasia. These are bone cavities that are analogous to simple bone cysts ( Fig. 24-6 ).
Effects on Surrounding Structures. If the fi brous dysplasia lesion is small, it may have no effect on surrounding structures (sub-clinical variety). The effects on the involved bone may include expan-sion with maintenance of a thinned outer cortex ( Fig. 24-7 ). Fibrous
428
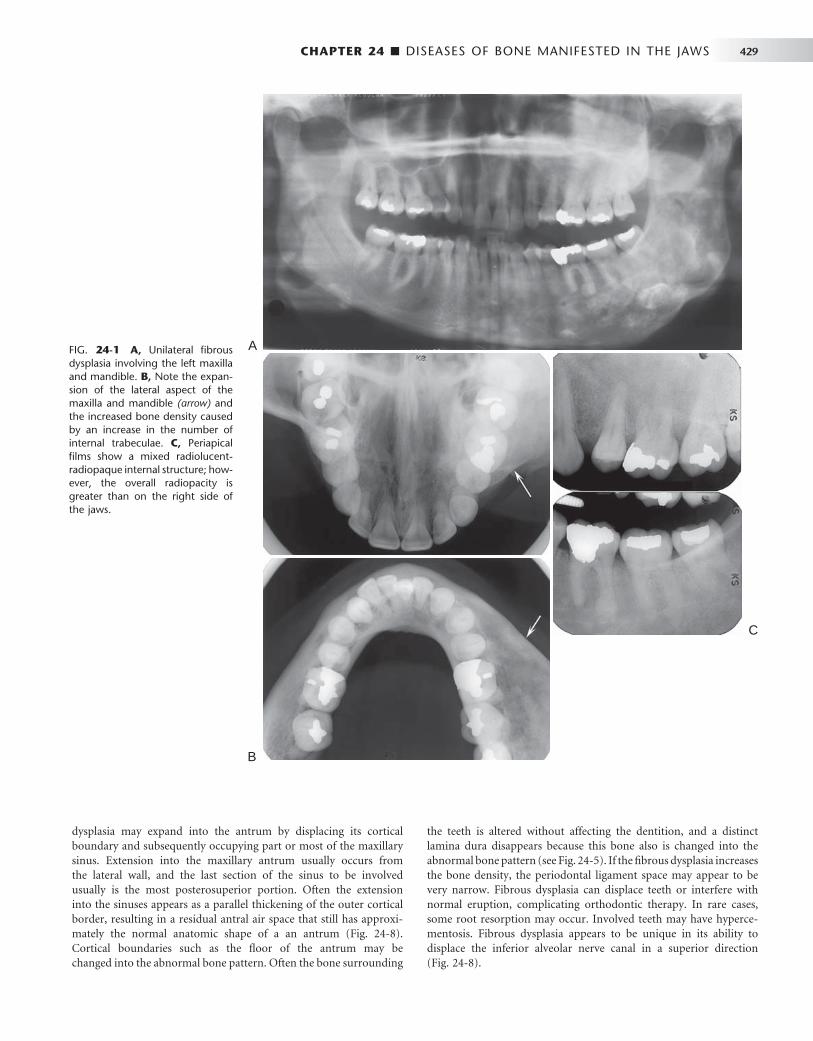
CHAPTER 24 ■ DISEASES OF BONE MANIFESTED IN THE JAWS 429
FIG. 24-1 A, Unilateral fi brous dysplasia involving the left maxilla and mandible. B, Note the expan-sion of the lateral aspect of the maxilla and mandible (arrow) and the increased bone density caused by an increase in the number of internal trabeculae. C, Periapical fi lms show a mixed radiolucent-radiopaque internal structure; how-ever, the overall radiopacity is greater than on the right side of the jaws.
A
C
B
dysplasia may expand into the antrum by displacing its cortical boundary and subsequently occupying part or most of the maxillary sinus. Extension into the maxillary antrum usually occurs from the lateral wall, and the last section of the sinus to be involved usually is the most posterosuperior portion. Often the extension into the sinuses appears as a parallel thickening of the outer cortical border, resulting in a residual antral air space that still has approxi-mately the normal anatomic shape of a an antrum ( Fig. 24-8 ). Cortical boundaries such as the fl oor of the antrum may be changed into the abnormal bone pattern. Often the bone surrounding
the teeth is altered without affecting the dentition, and a distinct lamina dura disappears because this bone also is changed into the abnormal bone pattern (see Fig. 24-5 ). If the fi brous dysplasia increases the bone density, the periodontal ligament space may appear to be very narrow. Fibrous dysplasia can displace teeth or interfere with normal eruption, complicating orthodontic therapy. In rare cases, some root resorption may occur. Involved teeth may have hyperce-mentosis. Fibrous dysplasia appears to be unique in its ability to displace the inferior alveolar nerve canal in a superior direction ( Fig. 24-8 ).

430 PART V ■ RADIOGRAPHIC INTERPRETATION
remaining cortex maintains its position at the outer surface of the bone. The identifi cation of sequestra aids in the identifi cation of osteomyelitis. Osteogenic sarcoma may produce a similar pattern but should show malignant radiologic features (see Chapter 23 ).
Some diffi culty may arise in differentiating cemento-ossifying fi broma of the maxilla, especially the juvenile ossifying fi broma type. If the bone pattern is altered around the teeth without displacement of the teeth from one specifi c epicenter, the lesion probably is fi brous dysplasia. The shape of the bone expansion of fi brous dysplasia into the antrum refl ects the original outer contour of the antral wall, which is different from the more convex extension of a neoplasm.
Management In most cases the radiographic characteristics of fi brous dysplasia and the clinical information are suffi cient to allow the practitioner to make a diagnosis without a biopsy. There are reports of exaggerated growth from stimulation of a lesion during surgical intervention in young patients. A consultation with a dental radiologist is advisable. The radiologist may supplement the examination with computed tomography (CT), which can give a more accurate, three-dimensional representation of the extent of the lesion and can serve as a precise baseline study for future comparisons. It is reasonable to continue occasional monitoring of the lesion or ask the patient to report any
FIG. 24-2 A, Fibrous dysplasia in the posterior maxilla, with an ill-defi ned anterior margin that blends into the normal bone pattern in the region of the unerupted cuspid. The internal pattern is granular (arrow). B, In contrast, the margin of this case of mandibular fi brous dysplasia has a well-defi ned, almost cor-ticated margin (arrows).
A B
FIG. 24-3 Fibrous dysplasia in the mandible. A, An early radiolucent stage. B, The same case 18 years later shows a more mature radiopaque appearance.
A B
Differential Diagnosis Other diseases can alter the bone pattern in a similar fashion. Meta-bolic bone diseases such as hyperparathyroidism may produce a similar pattern. However, these diseases are polyostotic; bilateral; and, unlike fi brous dysplasia, do not cause bone expansion. Paget ’ s disease may produce a similar pattern and may cause expansion, but it occurs in an older age group, and when it involves the mandible, the whole mandible is involved, unlike the unilateral tendency of fi brous dyspla-sia. Occasionally periapical cemental dysplasia may show a similar bone pattern, but the distribution is different in that it often is bilat-eral, with an epicenter in the periapical region. Furthermore, periapi-cal cemental dysplasia also occurs in an older age group. With spontaneous healing of a simple bone cyst, the radiographic and his-tologic appearance of the new bone may be very similar to that of fi brous dysplasia.
Of paramount importance is the differentiation of osteomyelitis and osteogenic sarcoma because of both radiologic and histologic similarities. Osteomyelitis may result in enlargement of the jaws, but the additional bone is generated by the periosteum; therefore the new bone is laid down on the surface of the outer cortex, and close exami-nation may reveal evidence of the original cortex within the expanded portion of the jaw. Fibrous dysplasia, in contrast, expands the internal aspect of bone, displacing and thinning the outer cortex so that the
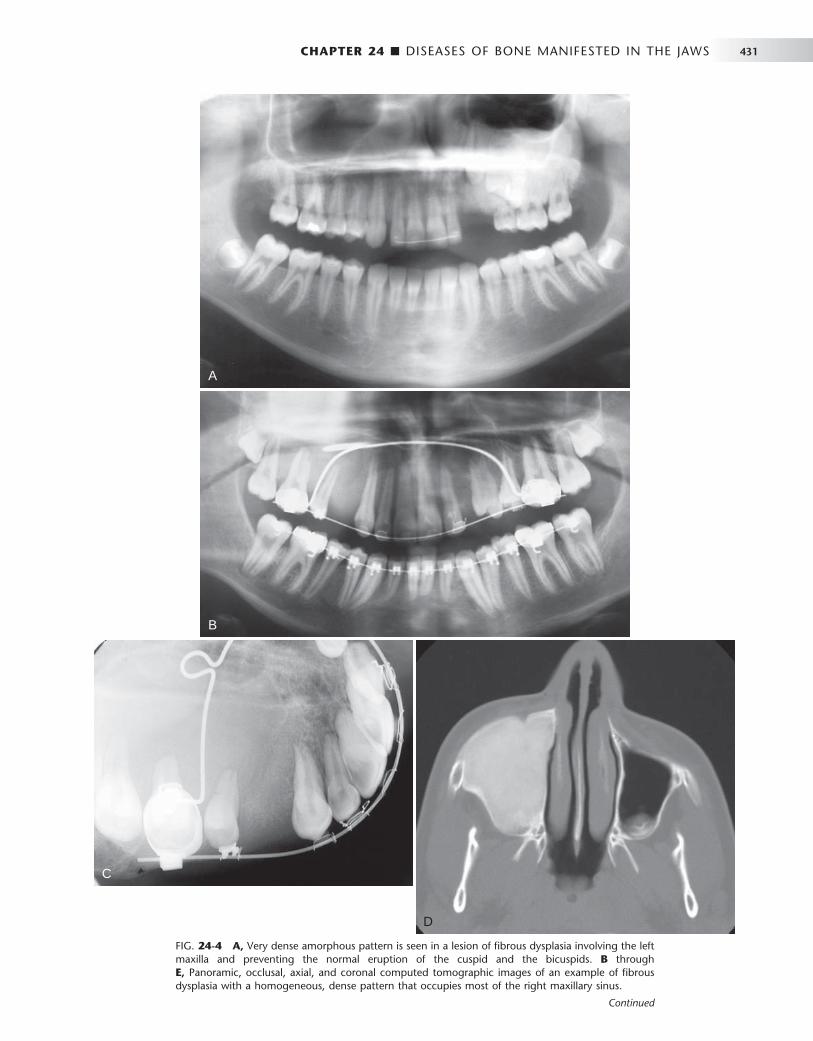
CHAPTER 24 ■ DISEASES OF BONE MANIFESTED IN THE JAWS 431
FIG. 24-4 A, Very dense amorphous pattern is seen in a lesion of fi brous dysplasia involving the left maxilla and preventing the normal eruption of the cuspid and the bicuspids. B through E, Panoramic, occlusal, axial, and coronal computed tomographic images of an example of fi brous dysplasia with a homogeneous, dense pattern that occupies most of the right maxillary sinus.
A
B
C
D
Continued

432 PART V ■ RADIOGRAPHIC INTERPRETATION
E
FIG. 24-4, cont’d For legend see p. 431.
FIG. 24-5 A series of fi lms showing a variety of internal patterns of fi brous dysplasia. A, A fi ngerprint pattern around the roots of the fi rst molar (arrow). Note the change in the lamina dura around the molars into the abnormal bone pattern. B, A granular, or ground-glass, pattern (arrow). C, A cotton wool pattern. Note the almost circular radiopaque regions (arrows). D, An orange-peel pattern.
A B
C
D
changes. With most lesions, growth is complete at skeletal maturation; therefore orthodontic treatment and cosmetic surgery may be delayed until this time. Sarcomatous changes are unusual but have been reported, especially if therapeutic radiation has been given. In the case of female patients, hormonal changes from pregnancy or the use of oral contraceptives may stimulate growth or result in the development of lesions within the area of fi brous dysplasia, such as aneurysmal bone cysts or giant cell granulomas.
CEMENTO-OSSEOUS DYSPLASIAS
Periapical cemental dysplasia and fl orid osseous dysplasia are essen-tially the same process but are separated on the basis of the extent of involvement of the jaws.
Periapical Cemental Dysplasia
Synonyms Cementoma, fi brocementoma, sclerosing cementoma, periapical osteofi brosis, periapical fi brous dysplasia, and periapical fi bro-osteoma
Defi nition Periapical cemental dysplasia (PCD) is a localized change in normal bone metabolism that results in the replacement of the components

CHAPTER 24 ■ DISEASES OF BONE MANIFESTED IN THE JAWS 433
FIG. 24-6 A, A cropped panoramic image of fi brous dysplasia of the mandible. There is a cystlike radiolucent lesion in the region of the bicuspids (arrow). B, An axial computed tomographic scan with bone algorithm of the same case also revealing the same simple bonelike cyst (arrow).
A B
FIG. 24-7 Occlusal views of both sides of the mandible of the same patient. Note the expansion of the right side of the mandible caused by fi brous dysplasia. The outer cortical plates have been displaced and thinned but are still intact (arrow).
of normal cancellous bone with fi brous tissue and cementum-like material, abnormal bone (similar to that seen in fi brous dysplasia), or a mixture of the two. By defi nition the lesion is located near the apex of a tooth.
Clinical Features PCD is a common bone dysplasia that typically occurs in middle age; the mean age is 39 years. It occurs nine times more often in females than in males and almost three times more often in blacks than in whites. It also frequently is seen in Asians. The involved teeth are vital, and the patient usually has no history of pain or sensitivity. The lesions usually come to light as an incidental fi nding during a periapi-cal or panoramic radiographic examination made for other purposes. The lesions can become quite large, causing a notable expansion of the alveolar process, and may continue to enlarge slowly.
Radiographic Features Location. The epicenter of a PCD lesion usually lies at the apex
of a tooth ( Fig. 24-9 ). In rare cases the epicenter is slightly higher and over the apical third of the root. The condition has a predilection for the periapical bone of the mandibular anterior teeth, although any tooth can be involved, and in rare cases the maxillary teeth may be involved ( Fig. 24-10 ). In most cases the lesion is multiple and bilateral, but occasionally a solitary lesion arises. If the involved teeth have been extracted, this lesion can still develop but the periapical location is less evident ( Fig. 24-11 ). In these cases the term cemental dysplasia may be more appropriate.
Periphery and Shape. In most cases the periphery of a PCD lesion is well defi ned. Often a radiolucent border of varying width is present, surrounded by a band of sclerotic bone that also can vary in width ( Fig. 24-12 ). The sclerotic bone represents a reaction of the immediate surrounding bone. The lesion may be irregularly shaped or may have an overall round or oval shape centered over the apex of the tooth.
Internal Structure. The internal structure varies, depending on the maturity of the lesion. In the early stage, normal bone is resorbed and replaced with fi brous tissue that usually is continuous with the periodontal ligament (causing loss of the lamina dura). Radiographi-cally, this appears as a radiolucency at the apex of the involved tooth (see Fig. 24-9 ).
In the mixed stage, radiopaque tissue appears in the radiolucent structure. This material usually is amorphous; has a round, oval, or irregular shape; and is composed of cementum or abnormal bone ( Fig. 24-12 ). Sometimes the cementum-like material forms a swirling pattern ( Fig. 24-13 ). These structures sometimes are called cementi-

434 PART V ■ RADIOGRAPHIC INTERPRETATION
FIG. 24-8 A, A coronal CT scan with bone algorithm of a maxillary lesion of fi brous dysplasia. The lesion has caused the lateral wall of the maxilla to expand into the maxillary antrum. The shape of the lateral wall of the sinus has maintained the zygomatic recess (arrow). B, Mandibular fi brous dys-plasia that has displaced the inferior alveolar nerve canal in a superior direction (arrows).
A B
FIG. 24-9 Periapical Cemental Dysplasia: Radiolucent Stage. Two periapical fi lms showing loss of lamina dura; however, the peri-odontal membrane space can still be seen around some of the teeth.
A B
cles; however, this is a radiographic term that does not necessarily represent the histologic appearance. In rare cases the radiopaque material resembles the abnormal trabecular patterns seen in fi brous dysplasia ( Fig. 24-13 ).
In the mature stage, the internal aspect may be totally radiopaque without any obvious pattern. Usually, a thin radiolucent margin can be seen at the periphery because this lesion matures from the center outward ( Fig. 24-14 ). Occasionally, this radiolucent margin is not apparent, which makes the differential diagnosis more diffi cult. The
internal structure may appear dramatically radiolucent if cavities resembling simple bone cysts form within the cemental lesions ( Fig. 24-15 ). In some cases the simple bone cyst extends beyond the original margin of the cemental lesion.
Effects on Surrounding Structures. The normal lamina dura of the teeth involved with the lesion is lost, making the periodontal liga-ment space either less apparent or giving it a wider appearance (see Fig. 24-9 ). The tooth structure usually is not affected, although in rare cases some root resorption may occur. Also, occasionally hypercemen-tosis occurs on the root of a tooth positioned within the lesion. Some lesions stimulate a sclerotic bone reaction from the surrounding bone. Small lesions do not cause expansion of the involved jaw. However, larger lesions may cause expansion of the jaw, an area that is always bordered by a thin, intact outer cortex similar to that seen in fi brous dysplasia. The expansion is usually undulating in shape. This lesion may elevate the fl oor of the maxillary antrum.
Differential Diagnosis In early (radiolucent) PCD lesions, the most important differential diagnosis is periapical rarefying osteitis. Occasionally PCD cannot be distinguished from this infl ammatory lesion by radiographic charac-teristics alone. In these cases the fi nal diagnosis must rely on clinical information such as testing of the vitality of the involved tooth.
In the case of a solitary mature form of PCD, the differential diagnosis may include a benign cementoblastoma, especially when the lesion is periapical to the mandibular fi rst molar. This tumor is usually is attached to the surface of the root, which may be partly resorbed. Also, the peripheral soft tissue capsule is better defi ned and there may be a unique pattern to the internal structure, such as a radiating pattern. Expansion caused by the tumor is more concentric and less undulating than in PCD. The presence or absence of clinical symp-toms may help distinguish PCD from benign cementoblastoma.
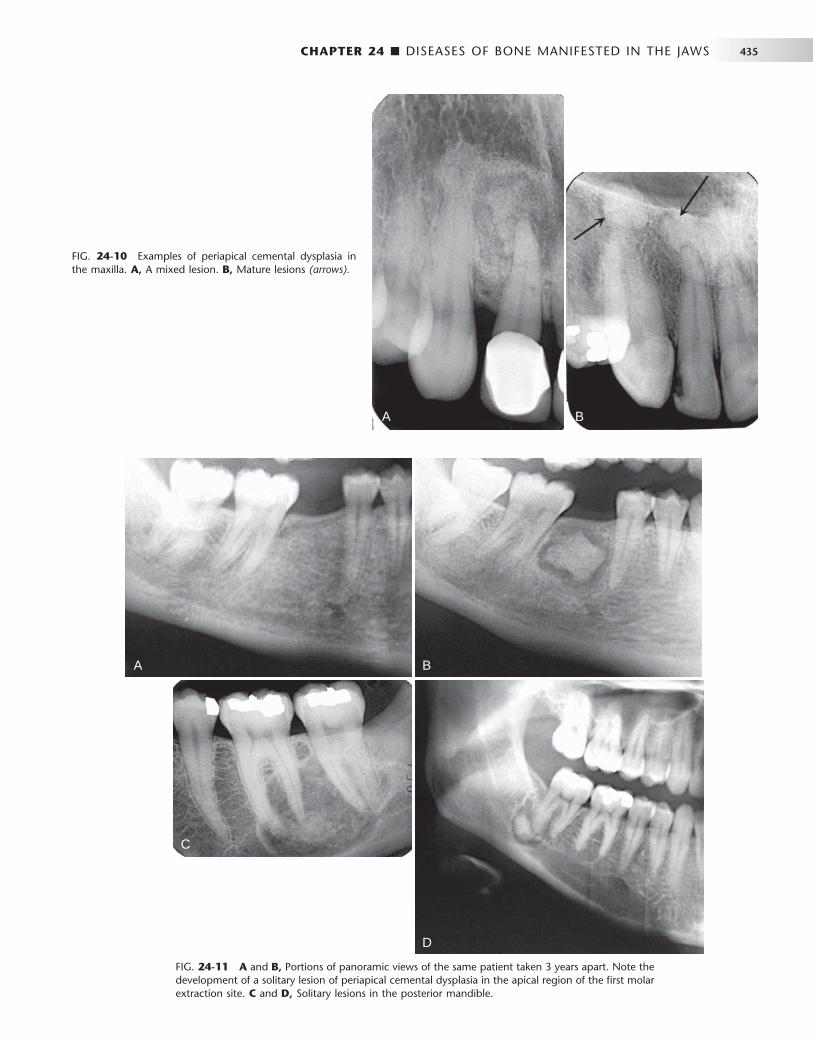
CHAPTER 24 ■ DISEASES OF BONE MANIFESTED IN THE JAWS 435
FIG. 24-10 Examples of periapical cemental dysplasia in the maxilla. A, A mixed lesion. B, Mature lesions (arrows).
A B
FIG. 24-11 A and B, Portions of panoramic views of the same patient taken 3 years apart. Note the development of a solitary lesion of periapical cemental dysplasia in the apical region of the fi rst molar extraction site. C and D, Solitary lesions in the posterior mandible.
A B
D
C

436 PART V ■ RADIOGRAPHIC INTERPRETATION
FIG. 24-12 Periapical Cemental Dysplasia: Mixed Stage. A and B, Radiopacity in the center of a radiolucent area. C, Multiple lesions. Note the band of sclerotic bone reaction at the periphery of the lesion.
A
C
B
FIG. 24-13 A, Periapical cemental dysplasia with a fi brous dysplasia type of internal bone pattern. B, A swirling internal pattern of cemental dysplasia.
A B

CHAPTER 24 ■ DISEASES OF BONE MANIFESTED IN THE JAWS 437
chronic sclerosing osteomyelitis without the identifi cation of the underlying bone dysplasia. A CT examination should be ordered to determine the extent of involvement with osteomyelitis. Teeth in the involved bone are vital unless other dental disease coincidentally affects them.
Radiographic Features Location. FOD lesions usually are bilateral and present in both
jaws ( Fig. 24-16 ). However, when they are present in only one jaw, the mandible is the more common location. The epicenter is apical to the teeth, within the alveolar process and usually posterior to the cuspid. In the mandible, lesions occur above the inferior alveolar canal.
Periphery. The periphery usually is well defi ned and has a scle-rotic border that can vary in width, very similar to PCD. The soft tissue capsule may not be apparent in mature lesions.
FIG. 24-14 The mature stage of periapical cemental dysplasia. Note the thin radiolucent periphery (arrows).
FIG. 24-15 A simple bone cyst within an area of periapical cemental dysplasia. Only a few regions of cementum-like tissue remain (arrows).
Another lesion to consider is an odontoma. Odontomas often start occlusal to a tooth and prevent its eruption, but some odontomas may have a periapical position. The organization of the internal aspect into toothlike structures and the identifi cation of enamel (very radi-opaque) can help in the differential diagnosis. Also, the peripheral cortex and soft tissue capsule of an odontoma are more uniform in width and better defi ned than is the periphery of PCD. In mature PCD lesions, the appearance may resemble that of a dense bone island. The fi nding of a radiolucent periphery, even if very slight, indicates a diagnosis of PCD. Solitary lesions may be diffi cult to differentiate from a cemento-ossifying fi broma. Cases that have been quiescent and then suddenly start to grow aggressively suggest that there may be a continuum between the category of cemento-osseous dysplasia and cemento-osseous tumors.
Management The diagnosis of PCD can be made on the basis of the appropriate radiologic and clinical characteristics. In fact, a possible complication of biopsy is secondary infection, which may occur in lesions that have abundant cementum formation and poor vascularity. Normally treat-ment is not required. However, if the teeth have been removed and if considerable atrophy of the alveolar ridge has occurred, these seg-ments of cementum may reach the mucosal surface, much in the same way as stones become exposed in old, worn concrete. These pieces of cementum can perforate the mucosa when positioned under a denture, and the result is secondary infection. If this occurs, the pieces of cementum may have to be removed surgically because they can act as sequestra in osteomyelitis.
Florid Osseous Dysplasia
Synonyms Florid cemento-osseous dysplasia, gigantiform cementoma, and familial multiple cementomas
Defi nition Florid osseous dysplasia (FOD) is a widespread form of PCD. Normal cancellous bone is replaced with dense acellular cemento-osseous tissue in a background of fi brous connective tissue. The lesion has a poor vascular supply, a condition that likely contributes to its suscep-tibility to infection. In some cases a familial trend can be seen. No clear defi nition indicates when multiple regions of PCD should be termed FOD. However, if PCD is identifi ed in three or four quadrants or is extensive throughout one jaw, it usually is considered to be FOD.
Clinical Features Several key similarities exist between FOD and PCD, including the age, sex, and racial profi les of patients and comparable radiographic and histologic appearances. Most patients with FOD are female and middle aged (mean age, 42 years), although the age range is broad. The condition shows a marked predilection for blacks and Asians. A few documented cases appear to have a familial pattern. Often FOD produces no symptoms and is found incidentally during a radio-graphic examination. Occasionally patients complain of low-grade, intermittent, poorly localized pain in the affected bone, especially when a simple bone cyst has developed within the lesion. Extensive lesions often have an associated bony swelling. If the lesions become secondarily infected, features of osteomyelitis may develop, including mucosal ulceration, fi stulous tracts with suppuration, and pain. In fact, historically, FOD that was secondarily infected was diagnosed as
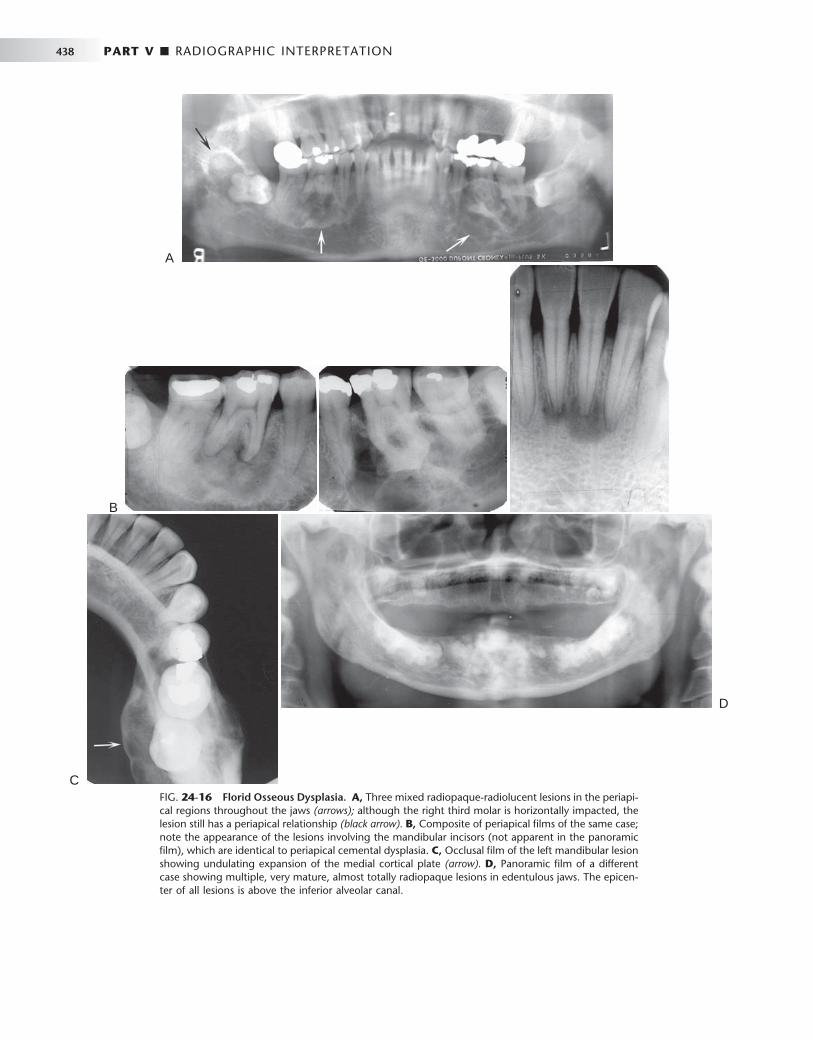
438 PART V ■ RADIOGRAPHIC INTERPRETATION
FIG. 24-16 Florid Osseous Dysplasia. A, Three mixed radiopaque-radiolucent lesions in the periapi-cal regions throughout the jaws (arrows); although the right third molar is horizontally impacted, the lesion still has a periapical relationship (black arrow). B, Composite of periapical fi lms of the same case; note the appearance of the lesions involving the mandibular incisors (not apparent in the panoramic fi lm), which are identical to periapical cemental dysplasia. C, Occlusal fi lm of the left mandibular lesion showing undulating expansion of the medial cortical plate (arrow). D, Panoramic fi lm of a different case showing multiple, very mature, almost totally radiopaque lesions in edentulous jaws. The epicen-ter of all lesions is above the inferior alveolar canal.
A
B
C
D

CHAPTER 24 ■ DISEASES OF BONE MANIFESTED IN THE JAWS 439
Internal Structure. The density of the internal structure can vary from an equal mixture of radiolucent and radiopaque regions to almost complete radiopacity. Some prominent radiolucent regions, which usually represent the development of a simple bone cyst, may be present ( Fig. 24-17 ). These cysts may enlarge with time, even beyond the boundary of the lesion into the surrounding normal bone, or may fi ll in with abnormal dysplastic cemento-osseous tissue. The radiopaque regions can vary from small oval and circular regions (cotton-wool appearance) to large, irregular, amorphous areas of cal-cifi cation. These calcifi ed masses are similar in appearance to those seen in mature PCD lesions.
Effects on Surrounding Structures. Large FOD lesions can dis-place the inferior alveolar nerve canal in an inferior direction. FOD also can displace the fl oor of the antrum in a superior direction and can cause enlargement of the alveolar bone by displacement of the buccal and lingual cortical plates. The roots of associated teeth may have a considerable amount of hypercementosis, which may fuse with the abnormal surrounding cemental tissue of the lesion. Extraction of these teeth may be diffi cult.
Differential Diagnosis The fact that FOD is bilateral and centered in the alveolar process helps in the differentiation from other lesions. Paget ’ s disease of bone may also show cotton wool – type radiopaque regions with associated hypercementosis. However, Paget ’ s disease affects the bone of the entire mandible, whereas FOD is centered above the inferior alveolar canal. Furthermore, Paget ’ s disease often is polyostotic, involving other bones as well as the jaws. The well-defi ned nature of FOD, with
its radiolucent periphery and surrounding sclerotic border, also is useful in making the differential diagnosis.
Another disease that may resemble FOD is chronic sclerosing osteomyelitis. Regions of cementum-like masses may appear similar to the sequestrum seen in osteomyelitis. This is not to be confused with a situation where FOD has become secondarily infected, result-ing in osteomyelitis. The cemental-like masses that are secondarily infected have a wider and more profound radiolucent border ( Fig. 24-18 ). CT imaging is essential for the diagnosis and to determine the extent of the osteomyelitis within the FOD.
Management Under normal circumstances, FOD does not require treatment, although there is value in obtaining a panoramic fi lm to establish the extent of the disease. Unlike with fi brous dysplasia, no age limit is apparent for the cessation of growth of FOD. Because of the propen-sity for development of secondary infections in FOD, the patient should be encouraged to maintain an effective oral hygiene program to avoid odontogenic infections. Also, if the teeth are extracted and severe atrophy of the alveolar process occurs, as in PCD, the cementum-like masses emerge and the pressure of the overlying denture may cause dehiscence in the mucosa, resulting in osteomyelitis. If this occurs, the avascular cementum-like masses become large sequestra. The osteomyelitis may spread slowly throughout the jaw from one region of FOD to another. It may be necessary to remove large areas of cementum-like tissue, leaving very little residual bone for pros-thetic treatment.
FIG. 24-17 Two examples of fl orid osseous dys-plasia (FOD) associated with multiple simple bone cysts. A, Large cysts occupy most of the bone involved with the FOD lesions. B , Another example of multiple simple bone cysts in lesions of FOD.
A
B
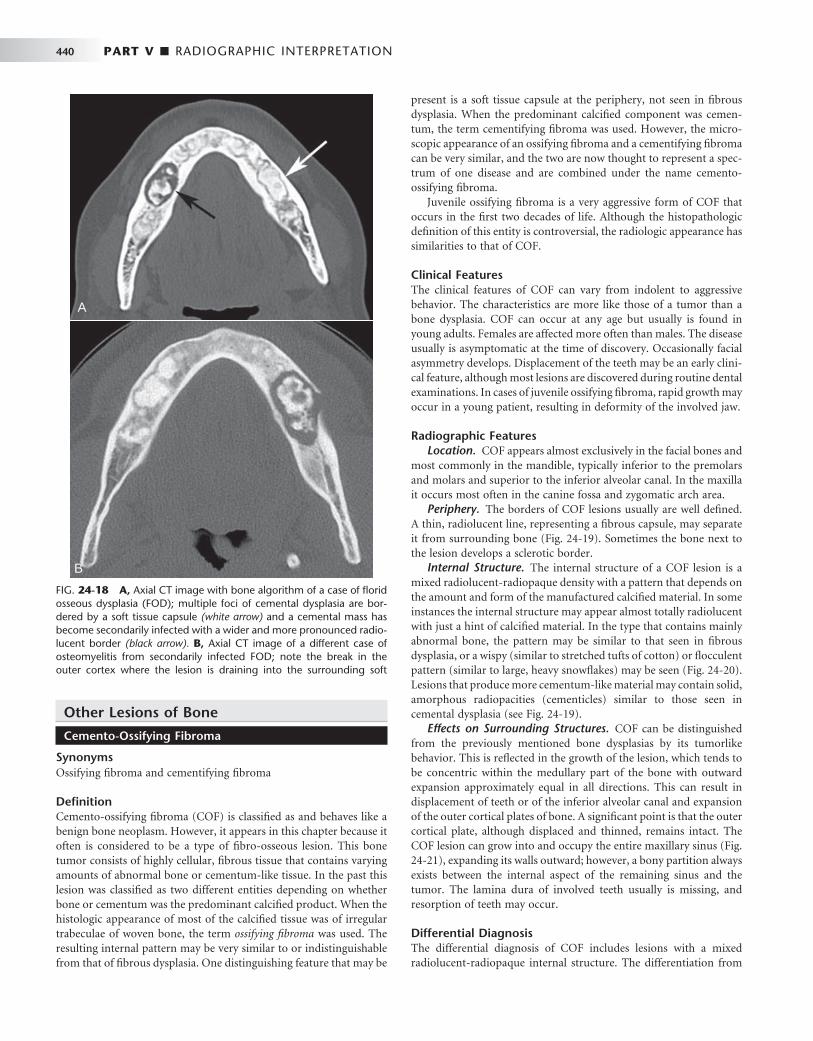
440 PART V ■ RADIOGRAPHIC INTERPRETATION
Other Lesions of Bone
Cemento-Ossifying Fibroma
Synonyms Ossifying fi broma and cementifying fi broma
Defi nition Cemento-ossifying fi broma (COF) is classifi ed as and behaves like a benign bone neoplasm. However, it appears in this chapter because it often is considered to be a type of fi bro-osseous lesion. This bone tumor consists of highly cellular, fi brous tissue that contains varying amounts of abnormal bone or cementum-like tissue. In the past this lesion was classifi ed as two different entities depending on whether bone or cementum was the predominant calcifi ed product. When the histologic appearance of most of the calcifi ed tissue was of irregular trabeculae of woven bone, the term ossifying fi broma was used. The resulting internal pattern may be very similar to or indistinguishable from that of fi brous dysplasia. One distinguishing feature that may be
present is a soft tissue capsule at the periphery, not seen in fi brous dysplasia. When the predominant calcifi ed component was cemen-tum, the term cementifying fi broma was used. However, the micro-scopic appearance of an ossifying fi broma and a cementifying fi broma can be very similar, and the two are now thought to represent a spec-trum of one disease and are combined under the name cemento-ossifying fi broma.
Juvenile ossifying fi broma is a very aggressive form of COF that occurs in the fi rst two decades of life. Although the histopathologic defi nition of this entity is controversial, the radiologic appearance has similarities to that of COF.
Clinical Features The clinical features of COF can vary from indolent to aggressive behavior. The characteristics are more like those of a tumor than a bone dysplasia. COF can occur at any age but usually is found in young adults. Females are affected more often than males. The disease usually is asymptomatic at the time of discovery. Occasionally facial asymmetry develops. Displacement of the teeth may be an early clini-cal feature, although most lesions are discovered during routine dental examinations. In cases of juvenile ossifying fi broma, rapid growth may occur in a young patient, resulting in deformity of the involved jaw.
Radiographic Features Location. COF appears almost exclusively in the facial bones and
most commonly in the mandible, typically inferior to the premolars and molars and superior to the inferior alveolar canal. In the maxilla it occurs most often in the canine fossa and zygomatic arch area.
Periphery. The borders of COF lesions usually are well defi ned. A thin, radiolucent line, representing a fi brous capsule, may separate it from surrounding bone ( Fig. 24-19 ). Sometimes the bone next to the lesion develops a sclerotic border.
Internal Structure. The internal structure of a COF lesion is a mixed radiolucent-radiopaque density with a pattern that depends on the amount and form of the manufactured calcifi ed material. In some instances the internal structure may appear almost totally radiolucent with just a hint of calcifi ed material. In the type that contains mainly abnormal bone, the pattern may be similar to that seen in fi brous dysplasia, or a wispy (similar to stretched tufts of cotton) or fl occulent pattern (similar to large, heavy snowfl akes) may be seen ( Fig. 24-20 ). Lesions that produce more cementum-like material may contain solid, amorphous radiopacities (cementicles) similar to those seen in cemental dysplasia (see Fig. 24-19 ).
Effects on Surrounding Structures. COF can be distinguished from the previously mentioned bone dysplasias by its tumorlike behavior. This is refl ected in the growth of the lesion, which tends to be concentric within the medullary part of the bone with outward expansion approximately equal in all directions. This can result in displacement of teeth or of the inferior alveolar canal and expansion of the outer cortical plates of bone. A signifi cant point is that the outer cortical plate, although displaced and thinned, remains intact. The COF lesion can grow into and occupy the entire maxillary sinus ( Fig. 24-21 ), expanding its walls outward; however, a bony partition always exists between the internal aspect of the remaining sinus and the tumor. The lamina dura of involved teeth usually is missing, and resorption of teeth may occur.
Differential Diagnosis The differential diagnosis of COF includes lesions with a mixed radiolucent-radiopaque internal structure. The differentiation from
FIG. 24-18 A, Axial CT image with bone algorithm of a case of fl orid osseous dysplasia (FOD); multiple foci of cemental dysplasia are bor-dered by a soft tissue capsule (white arrow) and a cemental mass has become secondarily infected with a wider and more pronounced radio-lucent border (black arrow). B, Axial CT image of a different case of osteomyelitis from secondarily infected FOD; note the break in the outer cortex where the lesion is draining into the surrounding soft
A
B
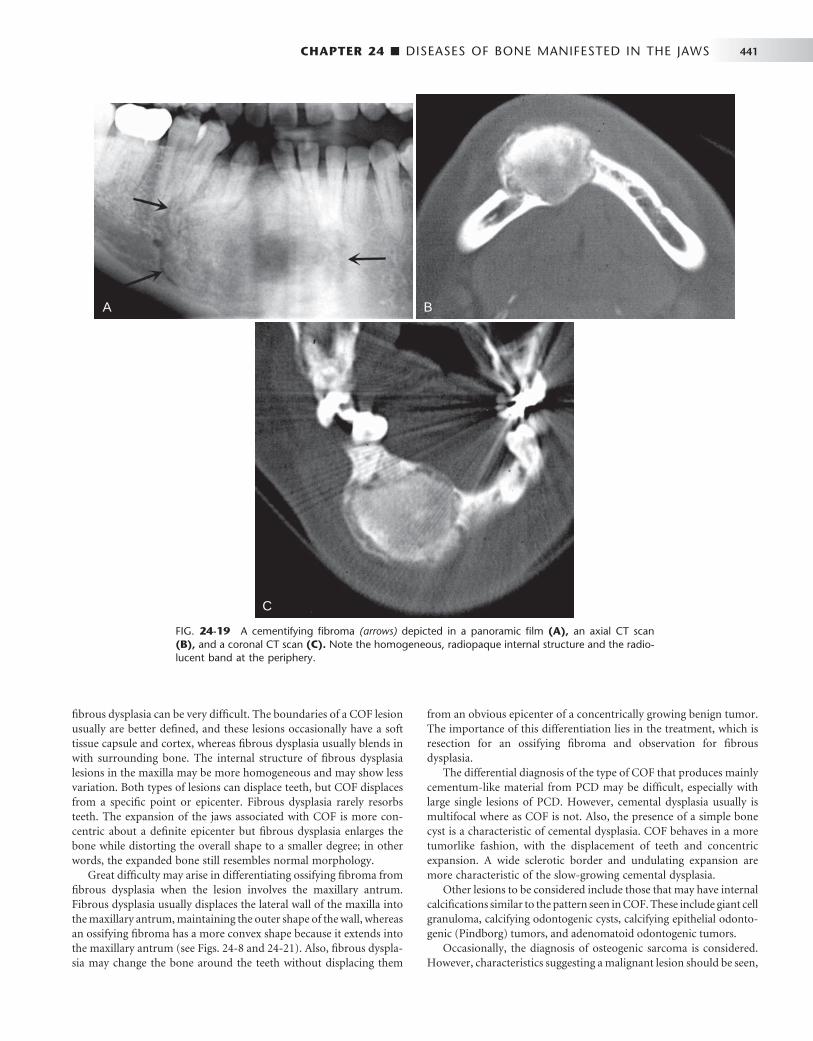
CHAPTER 24 ■ DISEASES OF BONE MANIFESTED IN THE JAWS 441
FIG. 24-19 A cementifying fi broma (arrows) depicted in a panoramic fi lm (A), an axial CT scan (B), and a coronal CT scan (C). Note the homogeneous, radiopaque internal structure and the radio-lucent band at the periphery.
A B
C
fi brous dysplasia can be very diffi cult. The boundaries of a COF lesion usually are better defi ned, and these lesions occasionally have a soft tissue capsule and cortex, whereas fi brous dysplasia usually blends in with surrounding bone. The internal structure of fi brous dysplasia lesions in the maxilla may be more homogeneous and may show less variation. Both types of lesions can displace teeth, but COF displaces from a specifi c point or epicenter. Fibrous dysplasia rarely resorbs teeth. The expansion of the jaws associated with COF is more con-centric about a defi nite epicenter but fi brous dysplasia enlarges the bone while distorting the overall shape to a smaller degree; in other words, the expanded bone still resembles normal morphology.
Great diffi culty may arise in differentiating ossifying fi broma from fi brous dysplasia when the lesion involves the maxillary antrum. Fibrous dysplasia usually displaces the lateral wall of the maxilla into the maxillary antrum, maintaining the outer shape of the wall, whereas an ossifying fi broma has a more convex shape because it extends into the maxillary antrum (see Figs. 24-8 and 24-21 ). Also, fi brous dyspla-sia may change the bone around the teeth without displacing them
from an obvious epicenter of a concentrically growing benign tumor. The importance of this differentiation lies in the treatment, which is resection for an ossifying fi broma and observation for fi brous dysplasia.
The differential diagnosis of the type of COF that produces mainly cementum-like material from PCD may be diffi cult, especially with large single lesions of PCD. However, cemental dysplasia usually is multifocal where as COF is not. Also, the presence of a simple bone cyst is a characteristic of cemental dysplasia. COF behaves in a more tumorlike fashion, with the displacement of teeth and concentric expansion. A wide sclerotic border and undulating expansion are more characteristic of the slow-growing cemental dysplasia.
Other lesions to be considered include those that may have internal calcifi cations similar to the pattern seen in COF. These include giant cell granuloma, calcifying odontogenic cysts, calcifying epithelial odonto-genic (Pindborg) tumors, and adenomatoid odontogenic tumors.
Occasionally, the diagnosis of osteogenic sarcoma is considered. However, characteristics suggesting a malignant lesion should be seen,
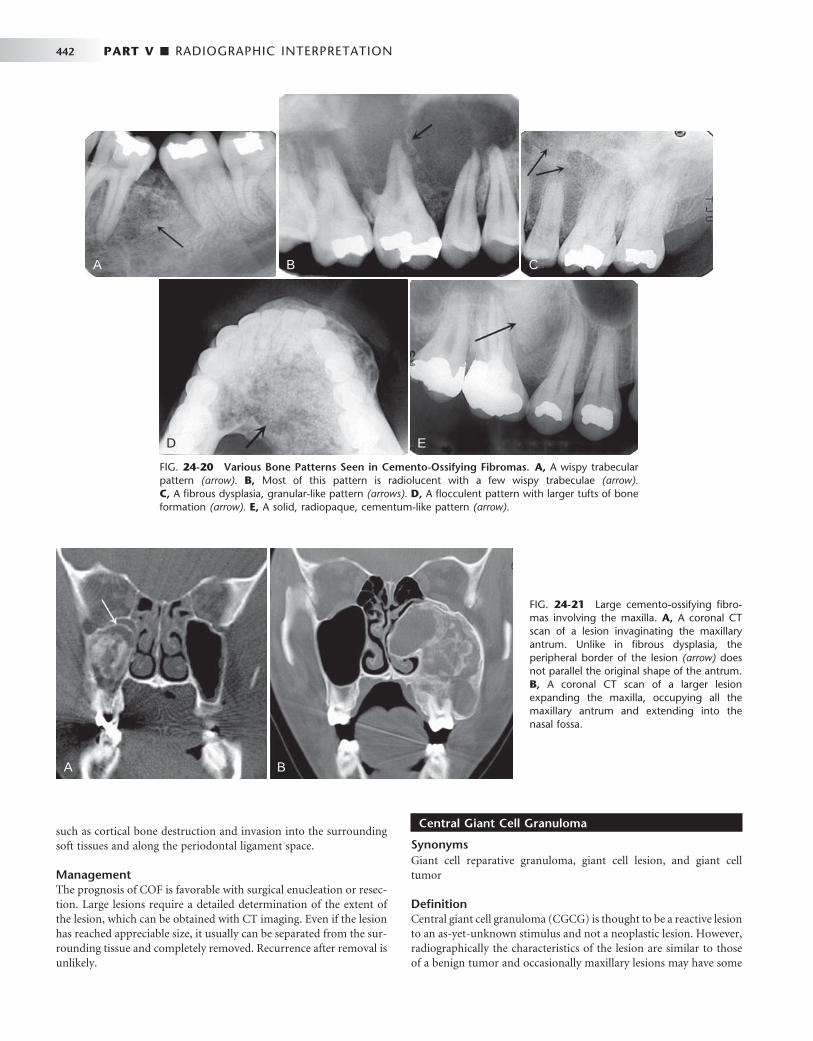
442 PART V ■ RADIOGRAPHIC INTERPRETATION
Central Giant Cell Granuloma
Synonyms Giant cell reparative granuloma, giant cell lesion, and giant cell tumor
Defi nition Central giant cell granuloma (CGCG) is thought to be a reactive lesion to an as-yet-unknown stimulus and not a neoplastic lesion. However, radiographically the characteristics of the lesion are similar to those of a benign tumor and occasionally maxillary lesions may have some
A B
D E
C
FIG. 24-20 Various Bone Patterns Seen in Cemento-Ossifying Fibromas. A, A wispy trabecular pattern (arrow). B, Most of this pattern is radiolucent with a few wispy trabeculae (arrow). C, A fi brous dysplasia, granular-like pattern (arrows). D, A fl occulent pattern with larger tufts of bone formation (arrow). E, A solid, radiopaque, cementum-like pattern (arrow).
FIG. 24-21 Large cemento-ossifying fi bro-mas involving the maxilla. A, A coronal CT scan of a lesion invaginating the maxillary antrum. Unlike in fi brous dysplasia, the peripheral border of the lesion (arrow) does not parallel the original shape of the antrum. B, A coronal CT scan of a larger lesion expanding the maxilla, occupying all the maxillary antrum and extending into the nasal fossa.
such as cortical bone destruction and invasion into the surrounding soft tissues and along the periodontal ligament space.
Management The prognosis of COF is favorable with surgical enucleation or resec-tion. Large lesions require a detailed determination of the extent of the lesion, which can be obtained with CT imaging. Even if the lesion has reached appreciable size, it usually can be separated from the sur-rounding tissue and completely removed. Recurrence after removal is unlikely.
A B
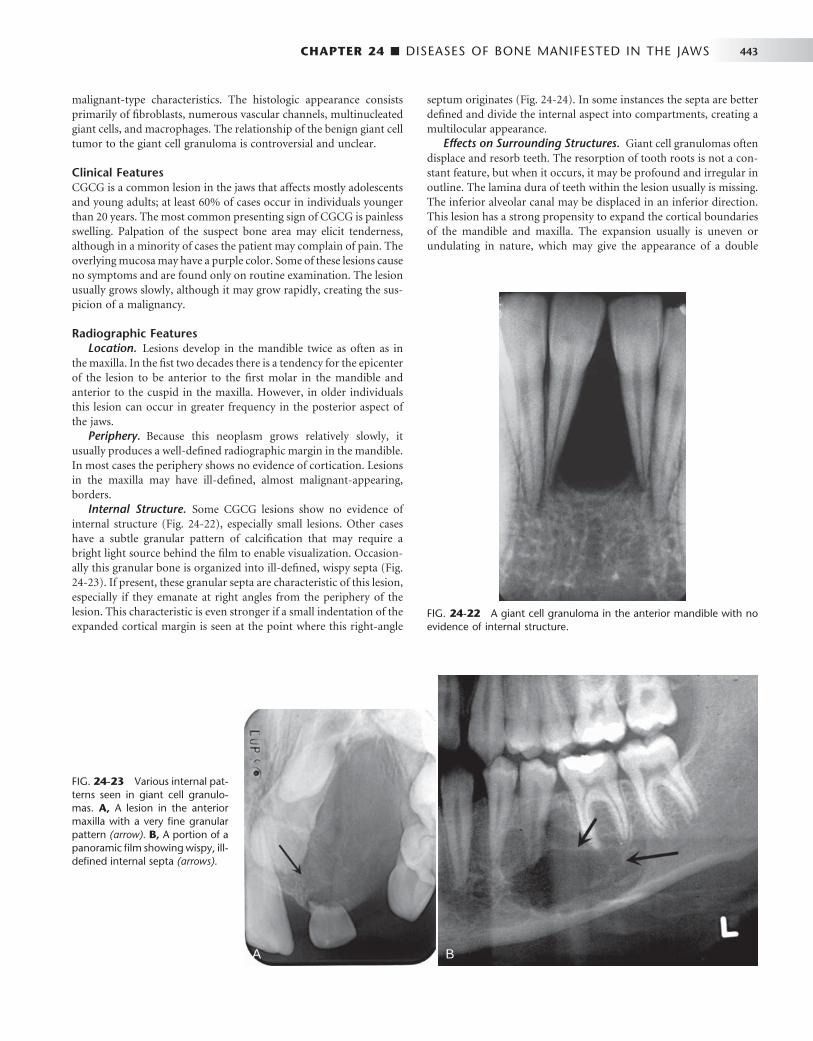
CHAPTER 24 ■ DISEASES OF BONE MANIFESTED IN THE JAWS 443
malignant-type characteristics. The histologic appearance consists primarily of fi broblasts, numerous vascular channels, multinucleated giant cells, and macrophages. The relationship of the benign giant cell tumor to the giant cell granuloma is controversial and unclear.
Clinical Features CGCG is a common lesion in the jaws that affects mostly adolescents and young adults; at least 60% of cases occur in individuals younger than 20 years. The most common presenting sign of CGCG is painless swelling. Palpation of the suspect bone area may elicit tenderness, although in a minority of cases the patient may complain of pain. The overlying mucosa may have a purple color. Some of these lesions cause no symptoms and are found only on routine examination. The lesion usually grows slowly, although it may grow rapidly, creating the sus-picion of a malignancy.
Radiographic Features Location. Lesions develop in the mandible twice as often as in
the maxilla. In the fi st two decades there is a tendency for the epicenter of the lesion to be anterior to the fi rst molar in the mandible and anterior to the cuspid in the maxilla. However, in older individuals this lesion can occur in greater frequency in the posterior aspect of the jaws.
Periphery. Because this neoplasm grows relatively slowly, it usually produces a well-defi ned radiographic margin in the mandible. In most cases the periphery shows no evidence of cortication. Lesions in the maxilla may have ill-defi ned, almost malignant-appearing, borders.
Internal Structure. Some CGCG lesions show no evidence of internal structure ( Fig. 24-22 ), especially small lesions. Other cases have a subtle granular pattern of calcifi cation that may require a bright light source behind the fi lm to enable visualization. Occasion-ally this granular bone is organized into ill-defi ned, wispy septa ( Fig. 24-23 ). If present, these granular septa are characteristic of this lesion, especially if they emanate at right angles from the periphery of the lesion. This characteristic is even stronger if a small indentation of the expanded cortical margin is seen at the point where this right-angle
septum originates ( Fig. 24-24 ). In some instances the septa are better defi ned and divide the internal aspect into compartments, creating a multilocular appearance.
Effects on Surrounding Structures. Giant cell granulomas often displace and resorb teeth. The resorption of tooth roots is not a con-stant feature, but when it occurs, it may be profound and irregular in outline. The lamina dura of teeth within the lesion usually is missing. The inferior alveolar canal may be displaced in an inferior direction. This lesion has a strong propensity to expand the cortical boundaries of the mandible and maxilla. The expansion usually is uneven or undulating in nature, which may give the appearance of a double
FIG. 24-22 A giant cell granuloma in the anterior mandible with no evidence of internal structure.
FIG. 24-23 Various internal pat-terns seen in giant cell granulo-mas. A, A lesion in the anterior maxilla with a very fi ne granular pattern (arrow). B, A portion of a panoramic fi lm showing wispy, ill-defi ned internal septa (arrows).
A B

444 PART V ■ RADIOGRAPHIC INTERPRETATION
boundary when the expansion is viewed by use of occlusal fi lm. The bone forming the border of the expanded mandible often has a granular texture compared with cortical bone (see Fig. 24-23, C ). In some instances the outer cortical plate of bone is destroyed instead of expanded; this occurs more often in the maxilla, where the cortical bone destruction may give the lesion a malignant appearance.
Differential Diagnosis If the internal structure of the CGCG contains septa, the differential diagnosis may include ameloblastoma, odontogenic myxoma, and aneurysmal bone cyst. If a granular internal structure is present, COF may be considered. Useful characteristics for differentiating an amelo-blastoma include the following: ameloblastomas tend to occur in an older age group and more often in the posterior mandible, and amelo-blastomas have coarse, curved, well-defi ned trabeculae, whereas giant cell granulomas have wispy, ill-defi ned trabeculae, some of which are at right angles to the periphery. Odontogenic myxomas occur in an older age group, may have sharper and straighter septa, and do not have the same propensity to expand as do giant cell granulomas. Interestingly, aneurysmal bone cysts can appear identical radiographi-cally to giant cell granulomas, especially in the appearance of the
internal septa. However, aneurysmal bone cysts are comparatively rare lesions that occur more often in the posterior aspect of the jaws and usually cause profound expansion.
A small CGCG lesion with a totally radiolucent internal structure may be similar in appearance to a cyst, especially a simple bone cyst. Evidence of displacement or resorption of the adjacent teeth or expan-sion of the outer cortical bone is more characteristic of a giant cell granuloma. The radiographic image and histologic appearance of brown tumors of hyperparathyroidism may be identical to those of CGCG. Also, the appearance may be identical to that seen in cherubism; however, the lesions in cherubism or multiple and have epicenters that are located in the most posterior aspect of the mandi-ble and maxilla.
Management If the lesion is in the maxilla, CT scans can be used to establish the exact extent and involvement of surrounding structures, such as the maxillary antrum or nasal cavity. Also, CT imaging is required for large lesions, which pose the possibility of destruction of the outer cortical bone, to determine whether the adjacent soft tissue has been invaded. Occasionally this lesion behaves very aggressively. If CGCG occurs after the second decade of life, hyperparathyroidism should be
FIG. 24-24 Characteristic expansion of the outer cortical plates caused by giant cell granu-lomas. Note the uneven expansion in A (arrow) and the indentation of the expansion with a right-angled septum in B (arrow). C, Axial CT scan with bone algorithm revealing a giant cell granuloma within the mandible causing undu-lating expansion and containing two right-angled septa (arrows).
A B
C

CHAPTER 24 ■ DISEASES OF BONE MANIFESTED IN THE JAWS 445
considered and serum testing for elevated calcium or parathormone levels or full-body technetium bone scans can be ordered.
Treatment may include enucleation and curettage and in some instances resection of the jaw. The patient should be followed up care-fully to rule out recurrence, especially if conservative treatment is used. Recurrences are rare and are more common in the maxilla.
Aneurysmal Bone Cyst
Defi nition An aneurysmal bone cyst (ABC) usually is considered to be a reactive lesion of bone rather than a cyst or true neoplasm. Some believe that it represents an exaggerated localized proliferative response of vascu-lar tissue in bone. This lesion may be related to the CGCG because of similarities in both the radiographic and histologic appearance (pres-ence of giant cells). ABCs occasionally develop in association with
other primary lesions such as fi brous dysplasia, central hemangioma, giant cell granuloma, and osteosarcoma. Its etiology remains unclear.
Clinical Features More than 90% of reported jaw lesions have occurred in individuals younger than 30 years. The condition appears to have a predilection for females. An ABC in the jaw usually manifests as a fairly rapid bony swelling (usually buccal or labial). Pain is an occasional complaint, and the involved area may be tender on palpation.
Radiographic Features Location. The mandible is involved more often than the maxilla
(ratio of 3 : 2), and the molar and ramus regions are more involved than the anterior region ( Fig. 24-25 ).
FIG. 24-25 A, A cropped panoramic image of aneurysmal bone cyst occupying the body of the right mandible. Two axial CT images at the same level of this case with bone algorithm (B); note the wispy, faint septa and soft tissue algorithm (C) and the low-attenuation regions of the internal structure representing fl uid density.
A B
C

446 PART V ■ RADIOGRAPHIC INTERPRETATION
Periphery and Shape. The periphery usually is well defi ned, and the shape is circular or “ hydraulic. ”
Internal Structure. Small initial lesions may show no evidence of an internal structure. Often the internal aspect has a multilocular appearance. The septa bear a striking resemblance to the wispy, ill-defi ned septa seen in giant cell granulomas ( Figs. 24-25 and 24-26 ). Another similar fi nding is septa positioned at right angles to the outer expanded border. In CT soft tissue algorithm images, there may be more radiolucent regions, some of which have a roughly circular shape. These likely represent large vascular spaces.
Effects on Surrounding Structures. After an ABC becomes large, there is a strong propensity for extreme expansion of the outer cortical plates (see Figs. 24-25 and 24-26 ). This characteristic is more dramatic in these cysts than in most other lesions. ABCs can displace and resorb teeth.
Differential Diagnosis The multilocular appearance of ABCs most resembles that of giant cell granulomas; in fact, the radiographic appearance of the two lesions may be identical. However, ABCs may expand to a greater degree, and they are more common in the posterior parts of the mandible. Ameloblastoma may be considered, but this lesion usually occurs in an older age group. ABCs may show a similarity to cherubism, which interestingly has giant cell – like features, but cherubism is a multifocal bilateral disease.
The diagnosis is based on biopsy results. A hemorrhagic aspirate favors the diagnosis of ABC. A CT scan also is recommended to better determine the extent of the lesion.
Management Surgical curettage and partial resection are the primary means of treatment. The recurrence rate is fairly high, ranging from 19% to about 50% after curettage and approximately 11% after resection. This indicates a need for careful follow-up.
Cherubism
Synonym Familial fi brous dysplasia
Defi nition Cherubism is a rare inherited autosomal dominant disease that causes bilateral enlargement of the jaws, giving the child a cherubic facial appearance. Rare unilateral lesions have been reported. The term familial fi brous dysplasia was an unfortunate choice of early terminol-ogy because this lesion is not a bone dysplasia. It is composed of giant cell granuloma – like tissue and does not form a bone matrix. These lesions regress with age.
Clinical Features Cherubism develops in early childhood between 2 and 6 years of age. The most common presenting sign is a painless, fi rm, bilateral enlarge-ment of the lower face. Enlargement of the submandibular lymph nodes may occur, but no systemic abnormalities are involved. Because children ’ s faces are rather chubby, mild cases may go undetected until the second decade. Profound swelling of the maxilla may result in stretching of the skin of the cheeks, which depresses the lower eyelids, exposing a thin line of sclera and causing an “ eyes raised to heaven ” appearance.
Radiographic Features Location. This lesion is bilateral and often affects both jaws.
When it is present in only one jaw, the mandible is the most common location. The epicenter is always in the posterior aspect of the jaws, in the ramus of the mandible or the tuberosity of the maxilla ( Fig. 24-27 ). The lesion grows in an anterior direction and in severe cases can extend almost to the midline.
Periphery. The periphery usually is well defi ned and in some instances corticated.
Internal Structure. The internal structure resembles that of CGCG, with fi ne, granular bone and wispy trabeculae forming a prominent multilocular pattern.
Effects on Surrounding Structures. Expansion of the cortical boundaries of the maxilla and mandible by cherubism can result in severe enlargement of the jaws. Maxillary lesions enlarge into the maxillary sinuses. Because the epicenter is in the posterior aspect of the jaws, the teeth are displaced in an anterior direction. The degree of displacement can be severe, and with some lesions the tooth buds are destroyed.
Differential Diagnosis Although the radiographic appearance of cherubism may be similar to that of giant cell granuloma, the fact that cherubism is bilateral with an epicenter in the ramus should provide a clear differentiation. The differentiation of cherubism from fi brous dysplasia should not present any diffi culties because fi brous dysplasia is more commonly a unilateral disease; also, the multilocular appearance and anterior displacement of teeth are more characteristic of cherubism. Cherubism may bear some similarity to multiple odontogenic keratocysts in basal cell nevus syndrome. The bilateral symmetry of cherubism, along with the anterior displacement of teeth and multilocular appearance, are characteristics that will help with the differential diagnosis.
Management The distinctive radiographic features of cherubism may be more diag-nostic than the histopathologic fi ndings; therefore the diagnosis can
FIG. 24-26 An axial CT scan with a soft tissue algorithm demonstrat-ing the presence of an aneurysmal bone cyst of the left mandibular condyle. Note the severe expansion and the wispy ill-defi ned septa (arrows).

CHAPTER 24 ■ DISEASES OF BONE MANIFESTED IN THE JAWS 447
rely on the radiologic fi ndings alone. Treatment can be delayed because the cystlike lesions usually become static and fi ll in with granular bone during adolescence and at the end of skeletal growth. After skeletal growth has stopped, conservative surgical procedures, if required, may be done for cosmetic problems. Surgery also may be required to uncover displaced teeth, and orthodontic treatment may be needed.
Paget ’ s Disease
Synonym Osteitis deformans
Defi nition Paget ’ s disease is a skeletal disorder and essentially a disease involving osteoclasts, resulting in abnormal resorption and apposition of osseous tissue in one or more bones. The disease may involve many bones simultaneously, but it is not a generalized skeletal disease. It is initiated by an intense wave of osteoclastic activity, with resorption of normal bone resulting in irregularly shaped resorption cavities. After a period of time, vigorous osteoblastic activity ensues, forming woven bone. Paget ’ s disease is seen most frequently in Britain and Australia and somewhat less often in North America.
Clinical Features Paget ’ s disease is primarily a disease of later middle and old age, having an incidence of about 3.5% in individuals older than 40 years. The incidence of involvement in males is approximately twice that of females at age 65 years.
Affected bone is enlarged and commonly deformed, resulting in bowing of the legs, curvature of the spine, and enlargement of the skull. The jaws also enlarge when affected. Separation and movement of teeth may occur, causing malocclusion. Dentures may be tight or may fi t poorly in edentulous patients.
Bone pain is an inconsistent symptom, most often directed toward the weight-bearing bones; facial or jaw pain is uncommon. Patients with Paget ’ s disease may also have ill-defi ned neurologic pain as the result of bone impingement on foramina and nerve canals. Patients with Paget ’ s disease often have severely elevated levels of serum alka-line phosphatase (greater than with any other disorder) during osteo-
FIG. 24-27 A case of cherubism. A, A panoramic image showing four lesions in the maxilla and mandible. The epicenters of the lesions are in the maxillary tuberosity and mandibular ramus; note the anterior displacement of the unerupted maxillary fi rst molars. The internal structure contains ill-defi ned septa. B, A portion of the posteroanterior skull view showing expansion of the mandible.
A B
blastic phases of the disease. These patients also often have high levels of hydroxyproline in the urine.
Radiographic Features Location. Paget ’ s disease occurs most often in the pelvis, femur,
skull, and vertebrae and infrequently in the jaws ( Fig. 24-28 ). It affects the maxilla about twice as often as the mandible. Whenever the jaws are involved, it is important to note that the entire mandible or maxilla is affected. Although this disease is bilateral, occasionally it affects only one maxilla or the involvement may be signifi cantly greater on one side.
Internal Structure. Generally the appearance of the internal structure depends on the developmental stage of the disease. Paget ’ s disease has three radiographic stages, although these often overlap in the clinical setting: an early radiolucent resorptive stage, a granular or ground glass – appearing second stage, and a denser, more radiopaque appositional late stage. These stages are less apparent in the jaws.
The trabeculae are altered in number and shape. Most often they increase in number, but in the early stage they may decrease. The tra-beculae may be long and may align themselves in a linear pattern ( Fig. 24-29 ), which is more common in the mandible. They also may be short, with random orientation, and may have a granular pattern similar to that of fi brous dysplasia. A third pattern occurs when the trabeculae may be organized into rounded, radiopaque patches of abnormal bone, creating a cotton-wool appearance ( Fig. 24-30 ).
The overall density of the jaws may decrease or increase, depend-ing on the number of trabeculae. Often the disease produces areas of bone that appear radiolucent (commonly the alveolar process) and regions of increased density in one bone.
Effects on Surrounding Structures. Paget ’ s disease always enlarges an affected bone to some extent, even in the early stage. Often the bone enlargement is impressive. Prominent pagetoid skull bones may swell to three or four times their normal thickness. In enlarged jaws the outer cortex may be thinned but remains intact. The outer cortex may appear to be laminated in occlusal projections (see Fig. 24-29 ). When the maxilla is involved, the disease invariably involves the sinus fl oor. However, the air space usually is not diminished to a great extent. Cortical boundaries such as the sinus fl oor may be more granular and less apparent

448 PART V ■ RADIOGRAPHIC INTERPRETATION
bilateral. In the maxilla, fi brous dysplasia has a tendency to encroach on the antral air space, whereas Paget ’ s disease does not. The linear trabeculae and cotton-wool appearance of Paget ’ s disease are distinc-tive. FOD may have a cotton-wool pattern, but these lesions are cen-tered above the inferior alveolar nerve canal and most commonly have a radiolucent capsule. The changes seen in FOD do not affect all of the jaw, unlike with Paget ’ s disease. The bone pattern in Paget ’ s disease may show some similarities to the bone pattern in metabolic bone diseases, and both conditions may be bilateral. However, Paget ’ s disease enlarges bone, and metabolic diseases do not.
The specifi c bone pattern changes, the late age of onset, the enlargement of the involved bone, and the extreme elevation of serum alkaline phosphatase aid in the differential diagnosis.
Management Currently Paget ’ s disease usually is managed medically, with calcito-nin, sodium etidronate, or lately bisphosophonates. Medication relieves pain and reduces the serum alkaline phosphatase levels and osteoclastic activity. Surgery may be required to correct deformities of the long bones and to treat fractures.
There are complications of this disease that are of concern. Extrac-tion sites heal slowly. The incidence of jaw osteomyelitis is higher than for nonaffected individuals. Osteogenic sarcoma develops in about 10% of patients with polyostotic disease. Characteristics such as inva-sion and bone destruction, as described in Chapter 22 , indicate the presence of a malignant neoplasm.
Langerhans ’ Cell Histiocytosis
Synonyms Histiocytosis X, idiopathic histiocytosis, and Langerhans ’ cell disease
Defi nition The disorders included in the category of Langerhans ’ cell histiocyto-sis (LCH) are abnormalities that result from the abnormal prolifera-tion of Langerhans ’ cells or their precursors. Langerhans ’ cells are specialized cells of the histiocytic cell line that normally are found in the skin. The abnormal proliferation of Langerhans ’ cells and eosino-phils results in a spectrum of clinical diseases. Historically, histiocy-tosis X was classifi ed into three distinct clinical forms: eosinophilic granuloma (solitary), Hand-Sch ü ller-Christian disease (chronic dis-seminated), and Letterer-Siwe disease (acute disseminated).
A newly proposed LCH classifi cation creates two categories: non-malignant disorders, such as unifocal or multifocal eosinophilic gran-uloma, and malignant disorders, including Letterer-Siwe disease and variants of histiocytic lymphoma. Research has shown that all forms of LCH are clonal and therefore have a neoplastic nature.
Clinical Features Head and neck lesions are common at initial presentation, and approximately 10% of all patients with LCH have oral lesions. Often the oral changes are the fi rst clinical signs of the disease.
Eosinophilic granuloma (EG) usually appears in the skeleton (ribs, pelvis, long bones, skull, and jaws) and in rare cases in soft tissue. This condition occurs most often in older children and young adults but may develop later in life. The lesions often form quickly and may cause a dull, steady pain. In the jaws the disease may cause bony swelling, a soft tissue mass, gingivitis, bleeding gingiva, pain, and ulceration. Loosening or sloughing of the teeth often occurs after destruction of alveolar bone by one or more foci of EG. The sockets of teeth lost to
FIG. 24-28 A, Sagittal and, B, coronal bone algorithm CT images of a case of Paget ’ s disease involving all the cranial bones and the maxilla and mandible; note the increase in bone density and dimension between the internal and outer cortex of the skull. The coronal CT image demonstrates enlargement of the mandibular ramus.
A
B
as sharp boundaries. The lamina dura may become less evident and may be altered into the abnormal bone pattern. Often hyper-cementosis develops on a few or most of the teeth in the involved jaw. This hypercementosis may be exuberant and irregular, which is characteristic of Paget ’ s disease ( Fig. 24-31 ). As previously men-tioned, the teeth may become spaced or displaced in the enlarging jaw.
Differential Diagnosis Paget ’ s disease may appear similar to fi brous dysplasia. However, Paget ’ s disease occurs in an older age group and is almost always

CHAPTER 24 ■ DISEASES OF BONE MANIFESTED IN THE JAWS 449
FIG. 24-29 A, An edentulous mandible involved with Paget ’ s disease. B, An occlusal fi lm of another case; note the loss of normal outer cortex and the linear alignment of trabeculae. ( B courtesy Dr. Ross Macdonald, Adelaide, Australia.)
A B
A B
FIG. 24-31 Two periapical fi lms of Paget ’ s disease showing exuberant irregular hypercementosis of the roots.
A B
the disease generally do not heal normally. EG may have a single focus or may develop into a multifocal, aggressive disease. The disseminated form may involve multiple bone lesions, diabetes insipidus, and exophthalmos, a condition previously defi ned as Hand-Sch ü ller-Christian disease.
Letterer-Siwe disease is a malignant form of LCH that most often occurs in infants less than 3 years of age. Soft tissue and bony granu-lomatous reactions disseminate throughout the body, and the condi-tion is marked by intermittent fever, hepatosplenomegaly, anemia, lymphadenopathy, hemorrhage, and failure to thrive. Lesions in bone are rare. Death usually occurs within several weeks of the onset of the disease.
FIG. 24-30 Paget ’ s Disease. A, Multiple radiopaque masses in the mandible that have a cotton-wool appearance. B, Note the expansion of the mandible and the maintenance of a thin outer cortical plate.

450 PART V ■ RADIOGRAPHIC INTERPRETATION
Radiographic Features For ease of discussion, this chapter divides LCH jaw lesions into two groups: those that occur in the alveolar process and intraos-seous lesions that occur elsewhere in the jaws. The radiographic features of this condition generally are similar to those of malignant neoplasms.
Location. The alveolar type of LCH lesions are commonly mul-tiple, whereas the intraosseous type usually is solitary. The mandible is a more common site than the maxilla, and the posterior regions are more involved than are the anterior regions ( Fig. 24-32 ). The man-dibular ramus is a common site of intraosseous lesions. Solitary lesions of the jaws may be accompanied by lesions in other bones.
Periphery and Shape. The periphery of EG lesions varies from moderately to well defi ned but without cortication; the periphery sometimes appears punched out ( Fig. 24-33 ). The margins may be smooth or somewhat irregular. The alveolar lesions commonly start in the midroot region of the teeth. The bone destruction progresses in a circular shape, and after it includes a portion of the superior
border of the alveolar process, it may give the impression that a section of the alveolar process has been scooped out (see Figs. 24-32 and 24-34 ). The shape of intraosseous lesions may be irregular, oval, or round.
Internal Structure. The internal structure usually is totally radiolucent.
Effects on Surrounding Structures. LCH destroys bone. In alveolar lesions the bone around teeth, including the lamina dura, is destroyed, and as a result the teeth appear to be standing in space. The lesion does not displace teeth, although teeth may move because they are bereft of bone support ( Fig. 24-35 ). Only minor root resorption has been reported. Of note is the ability of these lesions to stimulate periosteal new bone formation; this occurs more commonly with the intraosseous type of lesion ( Fig. 24-36 ). The periosteal new bone for-mation is indistinguishable from the appearance seen in infl amma-tory lesions of the jaws. This lesion can destroy the outer cortical plate and in rare cases it extends into the surrounding soft tissues on CT examination.
FIG. 24-32 A panoramic fi lm of mul-tiple lesions of Langerhans ’ cell histiocy-tosis. Note the scooped out shape of the bone destruction in the mandible. The fl oor of the right maxillary antrum has been destroyed.
FIG. 24-33 Two lateral skull fi lms of lesions of Langerhans ’ cell histiocytosis showing well-defi ned, punched-out lesions. (Courtesy Dr. H. G. Poyton, Toronto, Ontario.)
A B
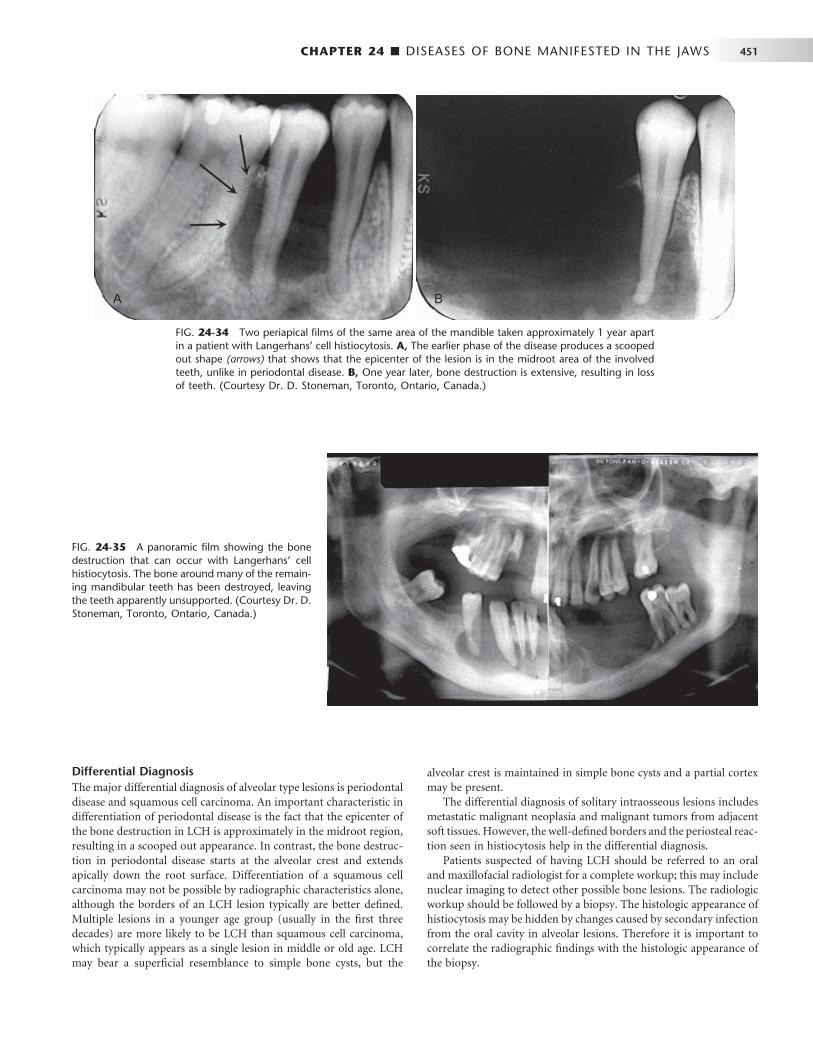
CHAPTER 24 ■ DISEASES OF BONE MANIFESTED IN THE JAWS 451
Differential Diagnosis The major differential diagnosis of alveolar type lesions is periodontal disease and squamous cell carcinoma. An important characteristic in differentiation of periodontal disease is the fact that the epicenter of the bone destruction in LCH is approximately in the midroot region, resulting in a scooped out appearance. In contrast, the bone destruc-tion in periodontal disease starts at the alveolar crest and extends apically down the root surface. Differentiation of a squamous cell carcinoma may not be possible by radiographic characteristics alone, although the borders of an LCH lesion typically are better defi ned. Multiple lesions in a younger age group (usually in the fi rst three decades) are more likely to be LCH than squamous cell carcinoma, which typically appears as a single lesion in middle or old age. LCH may bear a superfi cial resemblance to simple bone cysts, but the
alveolar crest is maintained in simple bone cysts and a partial cortex may be present.
The differential diagnosis of solitary intraosseous lesions includes metastatic malignant neoplasia and malignant tumors from adjacent soft tissues. However, the well-defi ned borders and the periosteal reac-tion seen in histiocytosis help in the differential diagnosis.
Patients suspected of having LCH should be referred to an oral and maxillofacial radiologist for a complete workup; this may include nuclear imaging to detect other possible bone lesions. The radiologic workup should be followed by a biopsy. The histologic appearance of histiocytosis may be hidden by changes caused by secondary infection from the oral cavity in alveolar lesions. Therefore it is important to correlate the radiographic fi ndings with the histologic appearance of the biopsy.
FIG. 24-34 Two periapical fi lms of the same area of the mandible taken approximately 1 year apart in a patient with Langerhans ’ cell histiocytosis. A, The earlier phase of the disease produces a scooped out shape (arrows) that shows that the epicenter of the lesion is in the midroot area of the involved teeth, unlike in periodontal disease. B, One year later, bone destruction is extensive, resulting in loss of teeth. (Courtesy Dr. D. Stoneman, Toronto, Ontario, Canada.)
A B
FIG. 24-35 A panoramic fi lm showing the bone destruction that can occur with Langerhans ’ cell histiocytosis. The bone around many of the remain-ing mandibular teeth has been destroyed, leaving the teeth apparently unsupported. (Courtesy Dr. D. Stoneman, Toronto, Ontario, Canada.)
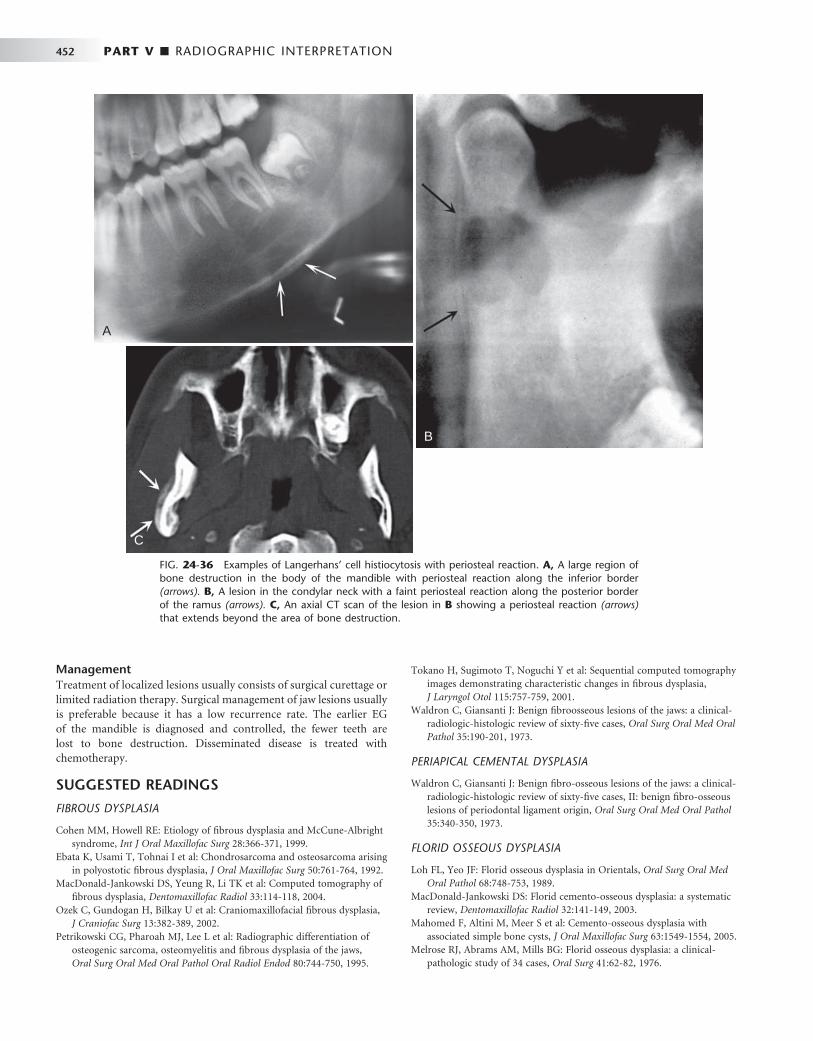
452 PART V ■ RADIOGRAPHIC INTERPRETATION
FIG. 24-36 Examples of Langerhans ’ cell histiocytosis with periosteal reaction. A, A large region of bone destruction in the body of the mandible with periosteal reaction along the inferior border (arrows). B, A lesion in the condylar neck with a faint periosteal reaction along the posterior border of the ramus (arrows). C, An axial CT scan of the lesion in B showing a periosteal reaction (arrows) that extends beyond the area of bone destruction.
A
C
B
Management Treatment of localized lesions usually consists of surgical curettage or limited radiation therapy. Surgical management of jaw lesions usually is preferable because it has a low recurrence rate. The earlier EG of the mandible is diagnosed and controlled, the fewer teeth are lost to bone destruction. Disseminated disease is treated with chemotherapy.
SUGGESTED READINGS
FIBROUS DYSPLASIA
Cohen MM , Howell RE : Etiology of fi brous dysplasia and McCune-Albright syndrome , Int J Oral Maxillofac Surg 28 : 366 - 371 , 1999 .
Ebata K , Usami T , Tohnai I et al : Chondrosarcoma and osteosarcoma arising in polyostotic fi brous dysplasia , J Oral Maxillofac Surg 50 : 761 - 764 , 1992 .
MacDonald-Jankowski DS , Yeung R , Li TK et al : Computed tomography of fi brous dysplasia , Dentomaxillofac Radiol 33 : 114 - 118 , 2004 .
Ozek C , Gundogan H , Bilkay U et al : Craniomaxillofacial fi brous dysplasia , J Craniofac Surg 13 : 382 - 389 , 2002 .
Petrikowski CG , Pharoah MJ , Lee L et al : Radiographic differentiation of osteogenic sarcoma, osteomyelitis and fi brous dysplasia of the jaws , Oral Surg Oral Med Oral Pathol Oral Radiol Endod 80 : 744 - 750 , 1995 .
Tokano H , Sugimoto T , Noguchi Y et al : Sequential computed tomography images demonstrating characteristic changes in fi brous dysplasia , J Laryngol Otol 115 : 757 - 759 , 2001 .
Waldron C , Giansanti J : Benign fi broosseous lesions of the jaws: a clinical-radiologic-histologic review of sixty-fi ve cases , Oral Surg Oral Med Oral Pathol 35 : 190 - 201 , 1973 .
PERIAPICAL CEMENTAL DYSPLASIA
Waldron C , Giansanti J : Benign fi bro-osseous lesions of the jaws: a clinical-radiologic-histologic review of sixty-fi ve cases, II: benign fi bro-osseous lesions of periodontal ligament origin , Oral Surg Oral Med Oral Pathol 35 : 340 - 350 , 1973 .
FLORID OSSEOUS DYSPLASIA
Loh FL , Yeo JF : Florid osseous dysplasia in Orientals , Oral Surg Oral Med Oral Pathol 68 : 748 - 753 , 1989 .
MacDonald-Jankowski DS : Florid cemento-osseous dysplasia: a systematic review , Dentomaxillofac Radiol 32 : 141 - 149 , 2003 .
Mahomed F , Altini M , Meer S et al : Cemento-osseous dysplasia with associated simple bone cysts , J Oral Maxillofac Surg 63 : 1549 - 1554 , 2005 .
Melrose RJ , Abrams AM , Mills BG : Florid osseous dysplasia: a clinical-pathologic study of 34 cases , Oral Surg 41 : 62 - 82 , 1976 .

CHAPTER 24 ■ DISEASES OF BONE MANIFESTED IN THE JAWS 453
Toffanin A , Bennett R , Manconi R : Familial fl orid cemento-osseous dysplasia: a case report , J Oral Maxillofac Surg 58 : 1440 - 1446 , 2000 .
CEMENTOOSSIFYING FIBROMA
Eversole L , Merrell PW , Strub D : Radiographic characteristics of central ossifying fi broma , Oral Surg 59 : 522 - 527 , 1985 .
Sciubba JJ , Younai F : Ossifying fi broma of the mandible and maxilla: review of 18 cases , J Oral Pathol Med 18 : 315 - 321 , 1989 .
Williams HK , Mangham C , Speight PM : Juvenile ossifying fi broma: an analysis of eight cases and a comparison with other fi bro-osseous lesions , J Oral Pathol Med 29 : 13 - 18 , 2000 .
GIANT CELL GRANULOMA
De Lange J , Van den Akker HP : Clinical and radiological features of central giant-cell lesions of the jaw , Oral Surg Oral Med Oral Pathol Oral Radiol Endod 99 : 464 - 470 , 2005 .
Kaffe I , Ardekian L , Taicher S et al : Radiologic features of central giant cell granuloma of the jaws , Oral Surg Oral Med Oral Pathol Oral Radiol Endod 81 : 720 - 726 , 1996 .
Waldron CA , Shafer WG : The central giant cell reparative granuloma of the jaws. An analysis of 38 cases , Am J Clin Pathol 45 : 437 - 447 , 1966 .
ANEURYSMAL BONE CYST
Buraczewski J , Dabska M : Pathogenesis of aneurysmal bone cyst. Relationship between the aneurysmal bone cyst and fi brous dysplasia of bone , Cancer 28 : 597 - 604 , 1971 .
Kaffe I , Naor H , Calderon S et al : Radiological and clinical features of aneurysmal bone cyst of the jaws , Dentomaxillofac Radiol 28 : 167 - 172 , 1999 .
Struthers P , Shear M : Aneurysmal bone cyst of the jaws, I: clinicopathological features , Int J Oral Surg 13 : 85 - 91 , 1984 .
Struthers P , Shear M : Aneurysmal bone cyst of the jaws, II: pathogenesis , Int J Oral Surg 13 : 92 - 100 , 1984 .
CHERUBISM
Bianchi SD , Boccardi A , Mela F et al : The computed tomographic appearances of cherubism , Skeletal Radiol 16 : 6 - 10 , 1987 .
Hyckel P , Berndt A , Schleier P et al : Cherubism — new hypotheses on pathogenesis and therapeutic consequences , J Craniomaxillofac Surg 33 : 61 - 68 , 2005 .
Von Wowern N : Cherubism: a 36-year long-term follow-up of 2 generations in different families and review of the literature , Oral Surg Oral Med Oral Pathol Oral Radiol Endod 90 : 765 - 772 , 2000 .
PAGET ’ S DISEASE
Rao VM , Karasick D : Hypercementosis — an important clue to Paget disease of the maxilla , Skeletal Radiol 9 : 126 - 128 , 1982 .
Reddy SV : Etiology of Paget ’ s disease and osteoclast abnormalities , J Cell Biochem 93 : 688 - 696 , 2004 .
Sofaer J : Dental extractions in Paget ’ s disease of bone , Int J Oral Surg 13 : 79 - 84 , 1984 .
Van Staa TP , Selby P , Leufkens FG et al : Incidence and natural history of Paget ’ s disease in bone in England and Wales , J Bone Miner Res 17 : 465 - 471 , 2002 .
LANGERHANS ’ CELL HISTIOCYTOSIS
Cline MJ : Histiocytes and histiocytosis , Blood 84 : 2840 - 2853 , 1996 . Coppes-Zantinga A , Egeler RM : The Langerhans cell histiocystosis X fi les
revealed , Br J Haematol 116 : 3 - 9 , 2002 . Dagenais M , Pharoah MJ , Sikorski PA : The radiographic characteristics of
histiocytosis X. A study of 29 cases that involve the jaws , Oral Surg Oral Med Oral Pathol 74 : 230 - 236 , 1992 .
Hicks J , Flaitz CM : Langerhans cell histiocytosis: current insights in a molecular age with emphasis on clinical oral and maxillofacial pathology practice , Oral Surg Oral Med Oral Pathol Oral Radiol Endod 100 ( 2 suppl ): S42 - S66 , 2005 .
Wong GB , Pharoah MJ , Weinberg S et al : Eosinophilic granuloma of the mandibular condyle: report of three cases and review of the literature , J Oral Maxillofac Surg 55 : 870 - 878 , 1997 .
C H A P T E R 2 5
Systemic Diseases Manifested in the Jaws
Defi nition
Disorders of the endocrine system, bone metabolism, and other sys-temic diseases may have an effect on the form and function of bone and teeth. The function of bone not only includes support, protection, and an environment for hemopoiesis but also serves as a major reserve of calcium for the body. More than 99% of the total body calcium is contained within the skeletal structure. When the infl uence of sys-temic conditions on the jaws is considered, it is important to bear in mind that bone is constantly remodeling. Approximately 5% to 10% of the total bone mass is replaced each year. The turnover rate of tra-becular bone is higher than for cortical bone; 20% of its mass is replaced per year compared with 5% for cortical bone. The effects of systemic diseases of bone are brought about by changes in the number and activity of osteoclasts, osteoblasts, and osteocytes.
Radiographic Features
Because systemic disorders affect the entire body, the radiographic changes manifested in the jaws are generalized ( Table 25-1 ). In most cases it is not possible to identify diseases on the basis of radiographic characteristics. The general changes include the following: 1. A change in size and shape of the bone 2. A change in the number, size, and orientation of trabeculae 3. Altered thickness and density of cortical structures 4. An increase or decrease in overall bone density Changes in the fi rst three elements can result in a decrease or increase in bone density.
Because many parameters in the production of a radiograph infl u-ence the density of the image, it may be diffi cult to detect genuine changes in the density of bone. Systemic conditions that result in a decrease in bone density do not affect mature teeth; therefore the image of the teeth may stand out with normal density against a gener-ally radiolucent jaw. In severe cases the teeth may appear to be bereft of any bony support. Also, cortical structures appear thin, less defi ned, and occasionally disappear. On the other hand, a true increase in bone density may be detected by a loss of contrast of the inferior cortex of the mandible as the radiopacity of the cancellous bone approaches that of cortical bone. Often the inferior alveolar nerve canal appears more distinct in contrast to the surrounding dense bone.
Some systemic diseases that occur during tooth formation may result in dental alterations. Lamina dura is part of the bone structure of the alveolar process, but because it is usually examined in conjunc-tion with the periodontal membrane space and roots of teeth, it is
included with the description of the dental structures ( Table 25-2 ). Changes to teeth and associated structures include the following: 1. Accelerated or delayed eruption 2. Hypoplasia 3. Hypocalcifi cation 4. Loss of a distinct lamina dura
Often bone and teeth exhibit no detectable radiographic changes associated with systemic diseases. However, on occasion the fi rst symptoms of a disease may present as a dental problem.
Endocrine Disorders
HYPERPARATHYROIDISM
Defi nition Hyperparathyroidism is an endocrine abnormality in which there is an excess of circulating parathyroid hormone (PTH). An excess of serum PTH increases bone remodeling in preference of osteoclastic resorption, which mobilizes calcium from the skeleton. In addition, PTH increases renal tubular reabsorption of calcium and renal pro-duction of the active vitamin D metabolite 1,25(OH)2D. The net result of these functions is in an increase in serum calcium levels.
Primary hyperparathyroidism usually results from a benign tumor (adenoma) of one of the four parathyroid glands, resulting in the production of excess PTH. An abnormality named hyperparathyroid-ism – jaw tumor syndrome, which involves tumors of parathyroid glands, jaws, and kidneys, has been shown to have genetic basis. Less frequently, individuals may have hyperplastic parathyroid glands that secrete excess PTH. The combination of hypercalcemia and an ele-vated serum level of PTH is diagnostic of primary hyperparathyroid-ism. The incidence of primary hyperparathyroidism is about 0.1%.
Secondary hyperparathyroidism results from a compensatory increase in the output of PTH in response to hypocalcemia. The underlying hypocalcemia may result from an inadequate dietary intake or poor intestinal absorption of vitamin D or from defi cient metabolism of vitamin D in the liver or kidney. This condition pro-duces clinical and radiographic effects similar to those of primary hyperparathyroidism.
Clinical Features Women are two to three times more commonly affected than men by primary hyperparathyroidism. The condition occurs mainly in those 30 to 60 years of age. Clinical manifestations of the disease cover a broad range, but most patients have renal calculi, peptic ulcers,
454
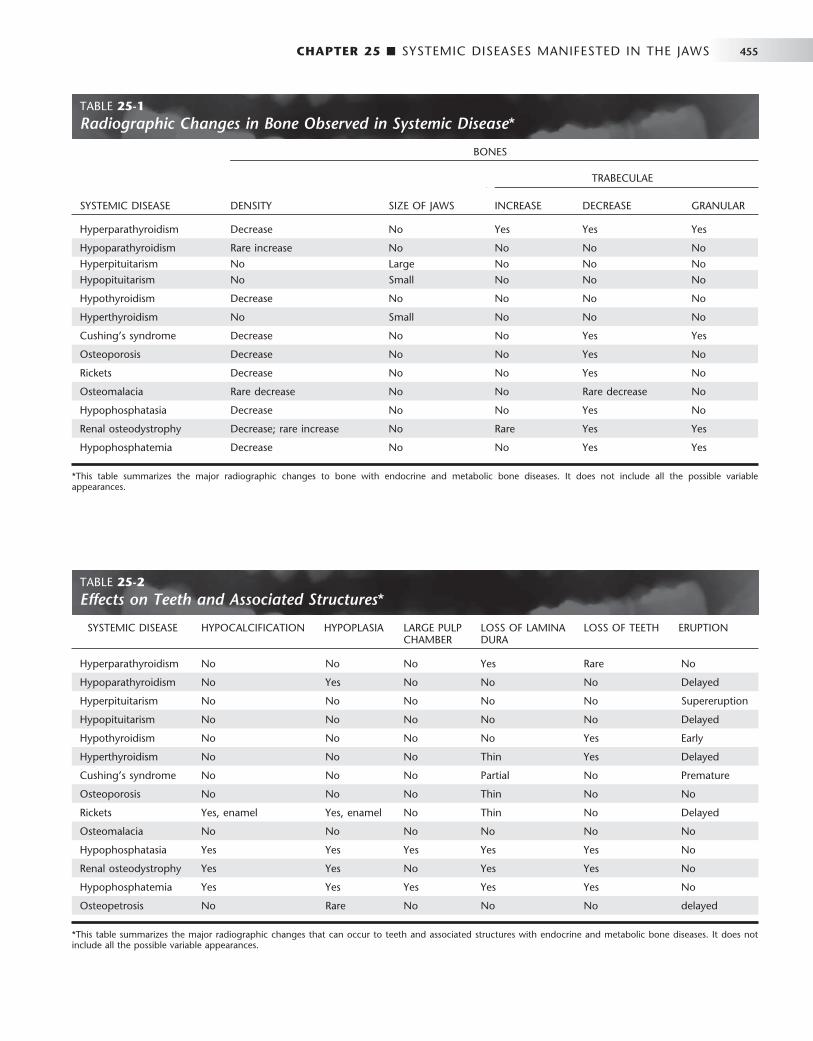
CHAPTER 25 ■ SYSTEMIC DISEASES MANIFESTED IN THE JAWS 455
TABLE 25-2 Effects on Teeth and Associated Structures *
SYSTEMIC DISEASE HYPOCALCIFICATION HYPOPLASIA LARGE PULP CHAMBER
LOSS OF LAMINA DURA
LOSS OF TEETH ERUPTION
Hyperparathyroidism No No No Yes Rare No
Hypoparathyroidism No Yes No No No Delayed
Hyperpituitarism No No No No No Supereruption
Hypopituitarism No No No No No Delayed
Hypothyroidism No No No No Yes Early
Hyperthyroidism No No No Thin Yes Delayed
Cushing ’ s syndrome No No No Partial No Premature
Osteoporosis No No No Thin No No
Rickets Yes, enamel Yes, enamel No Thin No Delayed
Osteomalacia No No No No No No
Hypophosphatasia Yes Yes Yes Yes Yes No
Renal osteodystrophy Yes Yes No Yes Yes No
Hypophosphatemia Yes Yes Yes Yes Yes No
Osteopetrosis No Rare No No No delayed
* This table summarizes the major radiographic changes that can occur to teeth and associated structures with endocrine and metabolic bone diseases. It does not include all the possible variable appearances.
TABLE 25-1 Radiographic Changes in Bone Observed in Systemic Disease *
BONES
TRABECULAE
SYSTEMIC DISEASE DENSITY SIZE OF JAWS INCREASE DECREASE GRANULAR
Hyperparathyroidism Decrease No Yes Yes Yes
Hypoparathyroidism Rare increase No No No No
Hyperpituitarism No Large No No No
Hypopituitarism No Small No No No
Hypothyroidism Decrease No No No No
Hyperthyroidism No Small No No No
Cushing ’ s syndrome Decrease No No Yes Yes
Osteoporosis Decrease No No Yes No
Rickets Decrease No No Yes No
Osteomalacia Rare decrease No No Rare decrease No
Hypophosphatasia Decrease No No Yes No
Renal osteodystrophy Decrease; rare increase No Rare Yes Yes
Hypophosphatemia Decrease No No Yes Yes
* This table summarizes the major radiographic changes to bone with endocrine and metabolic bone diseases. It does not include all the possible variable appearances.

456 PART V ■ RADIOGRAPHIC INTERPRETATION
psychiatric problems, or bone and joint pain. These clinical symptoms are mainly related to hypercalcemia. Gradual loosening, drifting, and loss of teeth may occur. Defi nite consistent hypercalcemia is virtually pathognomonic of primary hyperparathyroidism. (Rarely, multiple myeloma and metastatic tumors may produce the same serum altera-tions.) Because of daily fl uctuations, the serum calcium level should be tested at different intervals. The serum alkaline phosphatase level, a reliable indicator of bone turnover, may also be elevated in hyperparathyroidism.
Radiographic Features Only about one in fi ve patients with hyperparathyroidism has radio-graphically observable bone changes.
General Radiographic Features. The following are the major manifestations of hyperparathyroidism: 1. The earliest and most reliable changes of hyperparathyroidism are
subtle erosions of bone from the subperiosteal surfaces of the pha-langes of the hands.
2. Demineralization of the skeleton results in an unusual radiolucent appearance.
3. Osteitis fi brosa cystica are localized regions of bone loss produced by osteoclastic activity resulting in a loss of all apparent bone structure.
4. Brown tumors occur late in the disease and in about 10% of cases. These peripheral or central tumors of bone are radiolucent. The gross specimen has a brown or reddish-brown color.
5. Pathologic calcifi cations in soft tissues have a punctate or nodular appearance and occur in the kidneys and joints.
6. In prominent hyperparathyroidism, the entire calvarium has a granular appearance caused by the loss of central (diploic) trabecu-lae and thinning of the cortical tables ( Fig. 25-1 ).
Radiographic Features of the Jaws. Demineralization and thinning of cortical boundaries often occur in the jaws in cortical boundaries such as the inferior border, mandibular canal, and the cortical outlines of the maxillary sinuses. The density of the jaws is decreased, resulting in a radiolucent appearance that contrasts with the density of the teeth. The teeth stand out in contrast to the radio-lucent jaws ( Fig. 25-2 ). A change in the normal trabecular pattern may occur, resulting in a ground-glass appearance of numerous, small, randomly oriented trabeculae.
Brown tumors of hyperparathyroidism may appear in any bone but are frequently found in the facial bones and jaws, particularly in long-standing cases of the disease. These lesions may be multiple within a single bone. They have variably defi ned margins and may produce cortical expansion. If solitary, the tumor may resemble a central giant cell granuloma or an aneurysmal bone cyst ( Fig. 25-3 ). It is interesting to note that the histologic appearance of the brown tumor is identical to that of the giant cell granuloma. Therefore if a giant cell granuloma occurs later than the second decade, the patient should be screened for an increase in serum calcium, PTH, and alka-line phosphatase levels.
Radiographic Features of the Teeth and Associated Structures. Occasionally periapical radiographs reveal loss of the lamina dura in patients (only about 10%) with hyperparathyroidism. Depending on the duration and severity of the disease, loss of the lamina dura may occur around one tooth or all the remaining teeth
FIG. 25-1 A, Axial and, B, sagittal computed tomographic images with bone algorithm of a case of secondary hyperparathyroidism. Note the lack of normal cortical bone at the inner and outer tables of the skull, internal granular bone pattern, and generalized lack of defi ned outer cortical boundary of the osseous structures.
A B

CHAPTER 25 ■ SYSTEMIC DISEASES MANIFESTED IN THE JAWS 457
HYPOPARATHYROIDISM AND PSEUDOHYPOPARATHYROIDISM
Defi nition Hypoparathyroidism is an uncommon condition in which insuffi cient secretion of PTH occurs. Several causes exist, but the most common is damage or removal of the parathyroid glands during thyroid surgery. In pseudohypoparathyroidism there is a defect in the response of the tissue target cells to normal levels of PTH.
Clinical Features Both hypoparathyroidism and pseudohypoparathyroidism produce hypocalcemia, which has a variety of clinical manifestations. Most
FIG. 25-2 A, Panoramic image. The loss of bone in hyperparathyroidism results in the radiopaque teeth standing out in contrast to the radiolucent jaws. B, Note the loss of a distinct lamina dura and the granular texture of the bone pattern in this periapical fi lm of a different case. ( B courtesy H. G. Poyton, DDS, Toronto, Ontario, Canada.)
A B
FIG. 25-3 A, Axial and, B, coronal computed tomographic images with bone algorithm of a case of secondary hyperparathyroidism with a brown tumor involving the maxilla. This tumor has features of a central giant cell granuloma with a granular expanded cortex of the maxilla and very subtle and ill-defi ned internal septa.
( Fig. 25-4 ). The loss may be either complete or partial around a par-ticular tooth. The result of lamina dura loss may give the root a tapered appearance because of loss of image contrast. Although PTH mobilizes minerals from the skeleton, mature teeth are immune to this systemic demineralizing process.
Management After successful surgical removal of the causative parathyroid adenoma, almost all radiographic changes revert to normal. The only exception may be the site of a brown tumor, which often heals with bone that is radiographically more sclerotic than normal. Many people with this disease are being diagnosed earlier, resulting in fewer severe cases.
A B
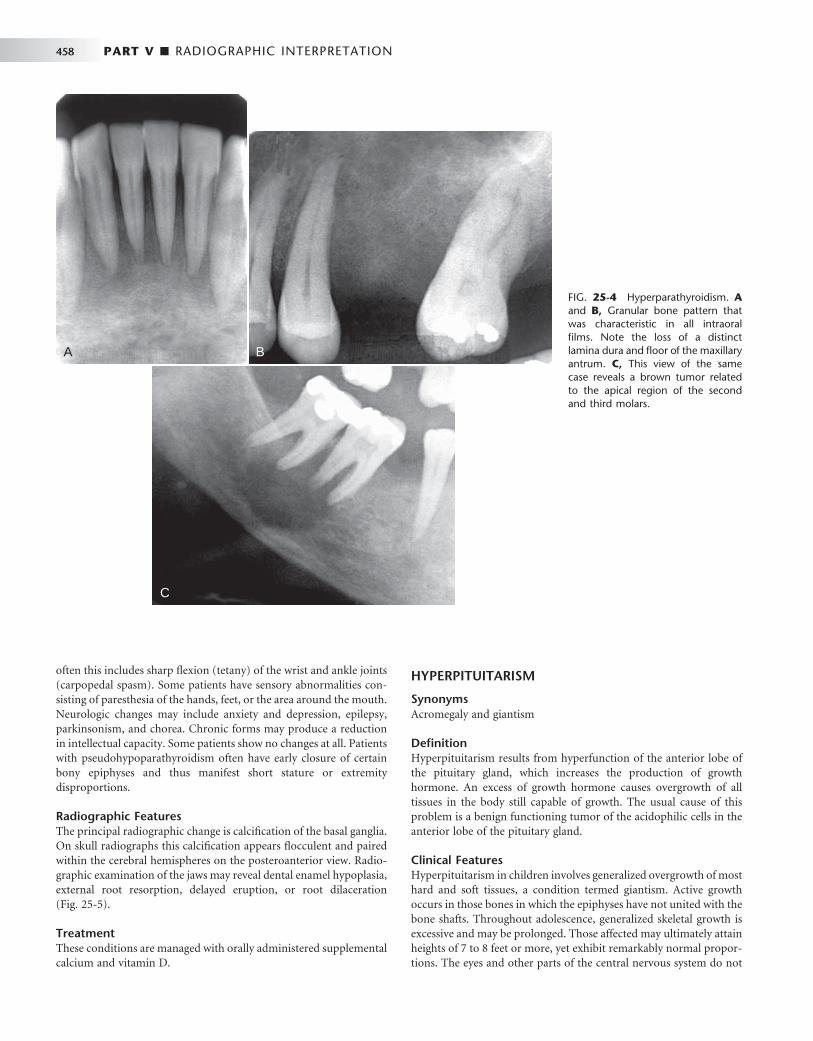
458 PART V ■ RADIOGRAPHIC INTERPRETATION
often this includes sharp fl exion (tetany) of the wrist and ankle joints (carpopedal spasm). Some patients have sensory abnormalities con-sisting of paresthesia of the hands, feet, or the area around the mouth. Neurologic changes may include anxiety and depression, epilepsy, parkinsonism, and chorea. Chronic forms may produce a reduction in intellectual capacity. Some patients show no changes at all. Patients with pseudohypoparathyroidism often have early closure of certain bony epiphyses and thus manifest short stature or extremity disproportions.
Radiographic Features The principal radiographic change is calcifi cation of the basal ganglia. On skull radiographs this calcifi cation appears fl occulent and paired within the cerebral hemispheres on the posteroanterior view. Radio-graphic examination of the jaws may reveal dental enamel hypoplasia, external root resorption, delayed eruption, or root dilaceration ( Fig. 25-5 ).
Treatment These conditions are managed with orally administered supplemental calcium and vitamin D.
HYPERPITUITARISM
Synonyms Acromegaly and giantism
Defi nition Hyperpituitarism results from hyperfunction of the anterior lobe of the pituitary gland, which increases the production of growth hormone. An excess of growth hormone causes overgrowth of all tissues in the body still capable of growth. The usual cause of this problem is a benign functioning tumor of the acidophilic cells in the anterior lobe of the pituitary gland.
Clinical Features Hyperpituitarism in children involves generalized overgrowth of most hard and soft tissues, a condition termed giantism. Active growth occurs in those bones in which the epiphyses have not united with the bone shafts. Throughout adolescence, generalized skeletal growth is excessive and may be prolonged. Those affected may ultimately attain heights of 7 to 8 feet or more, yet exhibit remarkably normal propor-tions. The eyes and other parts of the central nervous system do not
FIG. 25-4 Hyperparathyroidism. A and B, Granular bone pattern that was characteristic in all intraoral fi lms. Note the loss of a distinct lamina dura and fl oor of the maxillary antrum. C, This view of the same case reveals a brown tumor related to the apical region of the second and third molars.
A B
C
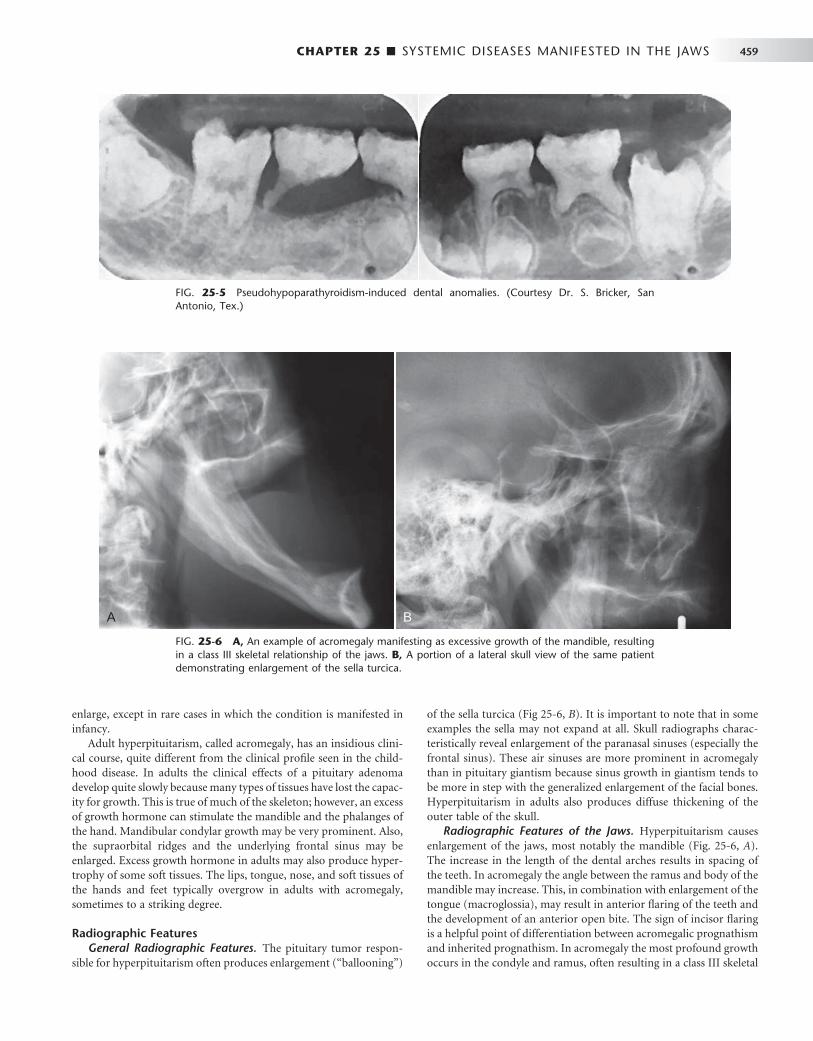
CHAPTER 25 ■ SYSTEMIC DISEASES MANIFESTED IN THE JAWS 459
enlarge, except in rare cases in which the condition is manifested in infancy.
Adult hyperpituitarism, called acromegaly, has an insidious clini-cal course, quite different from the clinical profi le seen in the child-hood disease. In adults the clinical effects of a pituitary adenoma develop quite slowly because many types of tissues have lost the capac-ity for growth. This is true of much of the skeleton; however, an excess of growth hormone can stimulate the mandible and the phalanges of the hand. Mandibular condylar growth may be very prominent. Also, the supraorbital ridges and the underlying frontal sinus may be enlarged. Excess growth hormone in adults may also produce hyper-trophy of some soft tissues. The lips, tongue, nose, and soft tissues of the hands and feet typically overgrow in adults with acromegaly, sometimes to a striking degree.
Radiographic Features General Radiographic Features. The pituitary tumor respon-
sible for hyperpituitarism often produces enlargement ( “ ballooning ” )
of the sella turcica ( Fig 25-6, B ). It is important to note that in some examples the sella may not expand at all. Skull radiographs charac-teristically reveal enlargement of the paranasal sinuses (especially the frontal sinus). These air sinuses are more prominent in acromegaly than in pituitary giantism because sinus growth in giantism tends to be more in step with the generalized enlargement of the facial bones. Hyperpituitarism in adults also produces diffuse thickening of the outer table of the skull.
Radiographic Features of the Jaws. Hyperpituitarism causes enlargement of the jaws, most notably the mandible ( Fig. 25-6, A ). The increase in the length of the dental arches results in spacing of the teeth. In acromegaly the angle between the ramus and body of the mandible may increase. This, in combination with enlargement of the tongue (macroglossia), may result in anterior fl aring of the teeth and the development of an anterior open bite. The sign of incisor fl aring is a helpful point of differentiation between acromegalic prognathism and inherited prognathism. In acromegaly the most profound growth occurs in the condyle and ramus, often resulting in a class III skeletal
FIG. 25-5 Pseudohypoparathyroidism-induced dental anomalies. (Courtesy Dr. S. Bricker, San Antonio, Tex.)
FIG. 25-6 A, An example of acromegaly manifesting as excessive growth of the mandible, resulting in a class III skeletal relationship of the jaws. B, A portion of a lateral skull view of the same patient demonstrating enlargement of the sella turcica.
A B

460 PART V ■ RADIOGRAPHIC INTERPRETATION
relationship between the jaws. The thickness and height of the alveolar processes may also increase.
Radiographic Changes Associated with the Teeth. The tooth crowns are usually normal in size, although the roots of posterior teeth often enlarge as a result of hypercementosis. This hypercemen-tosis may be the result of functional and structural demands on teeth instead of a secondary hormonal effect. Supereruption of the poste-rior teeth may occur in an attempt to compensate for the growth of the mandible.
HYPOPITUITARISM
Defi nition Hypopituitarism results from reduced secretion of pituitary hor-mones.
Clinical Features Individuals with this condition show dwarfi sm but have relatively well-proportioned bodies. One study reported a marked failure of development of the maxilla and the mandible. The dimensions of these bones in adults with this disorder were approximately those of normal children 5 to 7 years of age.
Radiographic Features Eruption of the primary dentition occurs at the normal time, but exfoliation is delayed by several years. The crowns of the permanent teeth form normally, but their eruption is delayed several years. The third molar buds may be completely absent. In hypopituitarism the jaws, especially the mandible, are small, which results in crowding and malocclusion.
Treatment Treatment is usually directed toward removal of the cause or replace-ment of the pituitary hormones or those of its target gland. The response of the dentition to treatment with growth hormone is vari-able but seems to parallel the skeletal response.
HYPERTHYROIDISM
Synonyms Thyrotoxicosis and Graves ’ disease
Defi nition Hyperthyroidism is a syndrome that involves excessive production of thyroxin in the thyroid gland. This condition occurs most commonly with diffuse toxic goiter (Graves ’ disease) and less frequently with toxic nodular goiter or toxic adenoma, a benign tumor of the thyroid gland. Each of these conditions results in increased levels of circulat-ing thyroxine. Excessive thyroxine causes a generalized increase in the metabolic rate of all body tissues, resulting in tachycardia, increased blood pressure, sensitivity to heat, and irritability. Hyperthyroidism is more common in females.
Radiographic Features Hyperthyroidism results in an advanced rate of dental development and early eruption, with premature loss of the primary teeth. Adults may show a generalized decrease in bone density or loss of some areas of edentulous alveolar bone.
HYPOTHYROIDISM
Synonyms Myxedema and cretinism
Defi nition Hypothyroidism usually results from insuffi cient secretion of thyrox-ine by the thyroid glands despite the presence of thyroid-stimulating hormone.
Clinical Features In children, hypothyroidism may result in retarded mental and physi-cal development. The base of the skull shows delayed ossifi cation, and the paranasal sinuses only partially pneumatize. Dental development is delayed, and the primary teeth are slow to exfoliate.
Hypothyroidism in the adult results in myxedematous swelling but not the dental or skeletal changes seen in children. Adult symptoms may range from lethargy, poor memory, inability to concentrate, con-stipation, and cold intolerance to the more fl orid clinical picture of dull and expressionless face, periorbital edema, large tongue, sparse hair, and skin that feels “ doughy ” to the touch.
Radiographic Features Radiographic features in children include delayed closing of the epiphyses and skull sutures with the production of numerous wormian bones (accessory bones in the sutures). Effects on the teeth include delayed eruption, short roots, and thinning of the lamina dura. The maxilla and mandible are relatively small. Patients with adult hypo-thyroidism may show periodontal disease, loss of teeth, separation of teeth as a result of enlargement of the tongue, and external root resorption.
DIABETES MELLITUS
Defi nition Diabetes mellitus is a metabolic disorder that has two primary forms. Type I, insulin-dependent diabetes mellitus (previously known as juvenile-onset diabetes), results from an absence or insuffi ciency of insulin, a hormone normally produced by the beta cells of the islets of Langerhans in the pancreas. Type II, non – insulin-dependent dia-betes mellitus, results from insulin resistance. Patients with type I diabetes have virtually no β cells (in the islets), whereas patients with type II diabetes have approximately half the normal number. A short-age of insulin adversely affects carbohydrate metabolism. The princi-pal clinical laboratory signs of the disease are hyperglycemia and glycosuria, both refl ecting a complex biochemical imbalance between tissue demand for glucose and the release of this nutrient by the liver.
Clinical Features Untreated diabetes may manifest classic symptoms and signs such as polydipsia (excessive intake of fl uids), polyuria (excessive urination), and, in more severe cases, acetone present in the urine and on the breath. This metabolic disorder, if not adequately treated, lowers the resistance of the body to infection. Diabetes may demonstrate a number of adverse effects in the oral cavity. Most prominently, uncon-trolled diabetes acts as a continuing factor that predisposes to, aggra-vates, and accelerates periodontal disease. Patients with controlled diabetes do not appear to have more periodontal problems than do

CHAPTER 25 ■ SYSTEMIC DISEASES MANIFESTED IN THE JAWS 461
persons without diabetes. Some children with uncontrolled diabetes have an increased likelihood of caries activity because of a high-car-bohydrate diet. Another occasional oral complication of diabetes mel-litus is xerostomia resulting from a reduced salivary fl ow (about one third of normal). Recently diabetes has been documented as a risk factor in the development of bisphosphonate-related osteonecrosis.
Radiographic Features Diabetes mellitus exhibits no characteristic radiographic features of the jaws or teeth. Periodontal disease associated with diabetes is indis-tinguishable radiographically from periodontal disease in patients without diabetes.
CUSHING ’ S SYNDROME
Defi nition Cushing ’ s syndrome arises from an excess of secretion of glucocorti-coids by the adrenal glands. This may result from any of the following: 1. An adrenal adenoma 2. An adrenal carcinoma 3. Adrenal hyperplasia (usually bilateral) 4. A basophilic adenoma of the anterior lobe of the pituitary
gland (Cushing ’ s disease), producing excess adrenocorticotropic hormone
5. Medical therapy with exogenous corticosteroids The increased level of glucocorticoid results in a loss of bone mass
from reduced osteoblastic function and either directly or indirectly increased osteoclastic function.
Clinical Features Patients with Cushing ’ s syndrome often show obesity (which spares the extremities), kyphosis of the thoracic spine ( “ buffalo hump ” ), weakness, hypertension, striae, or concurrent diabetes. This condition affects females three to fi ve times as frequently as males. Onset may occur at any age but is usually seen in the third or fourth decade.
Radiographic Features The primary radiographic feature of Cushing ’ s syndrome is general-ized osteoporosis, which may have a granular bone pattern. This demineralization may result in pathologic fractures. The skull can show diffuse thinning accompanied by a mottled appearance. The teeth may erupt prematurely, and partial loss of the lamina dura may occur ( Fig. 25-7 ).
Metabolic Bone Diseases
OSTEOPOROSIS
Defi nition
Osteoporosis is a generalized decrease in bone mass in which the his-tologic appearance of bone is normal. An imbalance occurs in bone resorption and formation. Decrease in bone formation results in changes in trabecular architecture, the volume of trabecular bone, and the size and thickness of individual trabeculae.
Osteoporosis occurs with the aging process of bone and can be considered a variation of normal (primary osteoporosis). Bone mass normally increases from infancy to about 30 years of age. At this time there begins a gradual and progressive decline, occurring at the rate
of about 8% per decade in women and 3% per decade in men. The loss of bone mass with age is so gradual that it is virtually impercep-tible until it reaches signifi cant proportions.
Secondary osteoporosis may result from nutritional defi ciencies, hormonal imbalance, inactivity, or corticosteroid or heparin therapy.
Clinical Features The most important clinical manifestation of osteoporosis is fracture. The most common locations are the distal radius, proximal femur, ribs, and vertebrae. Patients may have bone pain. The population most at risk is postmenopausal women.
Radiographic Features Osteoporosis results in an overall reduction in the density of bone. This reduction may be observed in the jaws by using the unaltered density of teeth as a comparison. There may be evidence of a reduced density and thinning of cortical boundaries such as the inferior man-dibular cortex ( Fig. 25-8 ). Reduction in the volume of cancellous bone is more diffi cult to assess, although new techniques to analyze the trabecular pattern in intraoral fi lms are being developed. Reduction in the number of trabeculae is least evident in the alveolar process, possibly because of the constant stress applied to this region of bone by the teeth. On occasion the lamina dura may appear thinner than normal. In other regions of the mandible a reduction in the number of trabeculae may be evident. Accurate assessment of bone mass loss is diffi cult but may be done with sophisticated techniques such as dual-energy photon absorption or quantitative computed tomogra-phy programs.
Treatment The administration of estrogens and calcium and vitamin D supple-ments after menopause helps to reduce the rate of cortical and tra-becular bone loss. Weight-bearing exercise programs are also effective (not swimming, for instance).
FIG. 25-7 Cushing ’ s syndrome manifested in the jaws as thinning of the lamina dura. (Courtesy H. G. Poyton, DDS, Toronto, Ontario, Canada.)
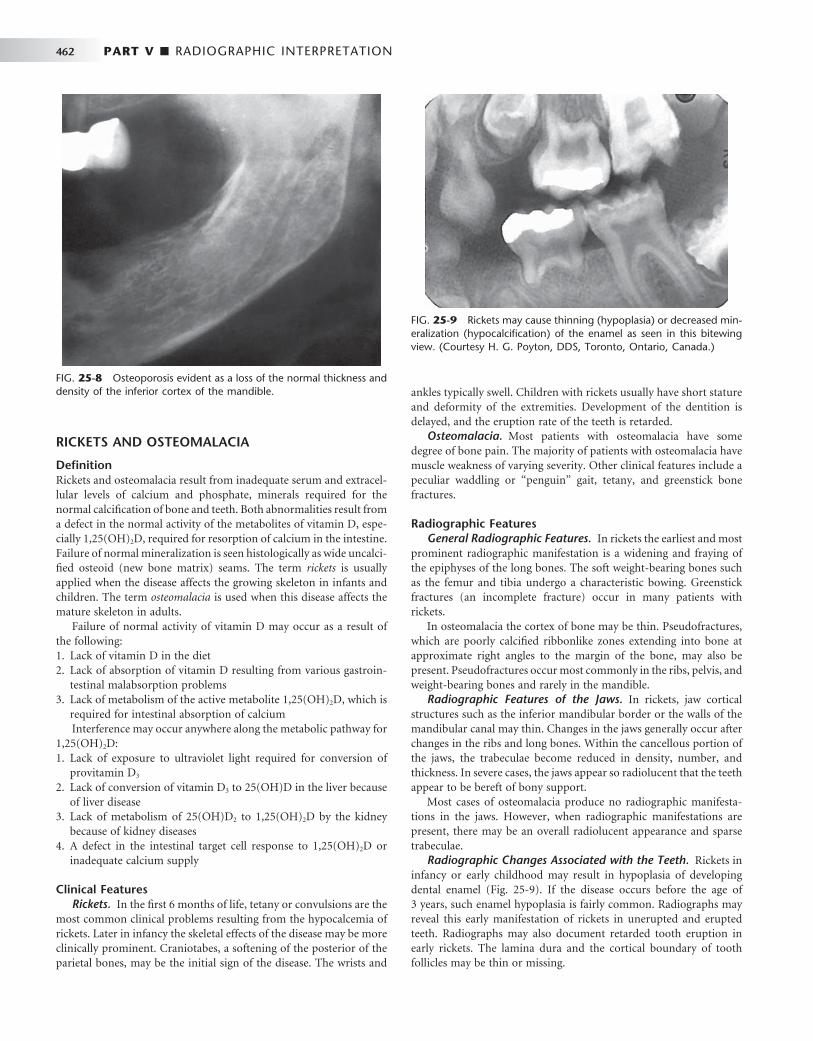
462 PART V ■ RADIOGRAPHIC INTERPRETATION
RICKETS AND OSTEOMALACIA
Defi nition Rickets and osteomalacia result from inadequate serum and extracel-lular levels of calcium and phosphate, minerals required for the normal calcifi cation of bone and teeth. Both abnormalities result from a defect in the normal activity of the metabolites of vitamin D, espe-cially 1,25(OH) 2 D, required for resorption of calcium in the intestine. Failure of normal mineralization is seen histologically as wide uncalci-fi ed osteoid (new bone matrix) seams. The term rickets is usually applied when the disease affects the growing skeleton in infants and children. The term osteomalacia is used when this disease affects the mature skeleton in adults.
Failure of normal activity of vitamin D may occur as a result of the following: 1. Lack of vitamin D in the diet 2. Lack of absorption of vitamin D resulting from various gastroin-
testinal malabsorption problems 3. Lack of metabolism of the active metabolite 1,25(OH) 2 D, which is
required for intestinal absorption of calcium Interference may occur anywhere along the metabolic pathway for
1,25(OH) 2 D: 1. Lack of exposure to ultraviolet light required for conversion of
provitamin D 3 2. Lack of conversion of vitamin D 3 to 25(OH)D in the liver because
of liver disease 3. Lack of metabolism of 25(OH)D 2 to 1,25(OH) 2 D by the kidney
because of kidney diseases 4. A defect in the intestinal target cell response to 1,25(OH) 2 D or
inadequate calcium supply
Clinical Features Rickets. In the fi rst 6 months of life, tetany or convulsions are the
most common clinical problems resulting from the hypocalcemia of rickets. Later in infancy the skeletal effects of the disease may be more clinically prominent. Craniotabes, a softening of the posterior of the parietal bones, may be the initial sign of the disease. The wrists and
ankles typically swell. Children with rickets usually have short stature and deformity of the extremities. Development of the dentition is delayed, and the eruption rate of the teeth is retarded.
Osteomalacia. Most patients with osteomalacia have some degree of bone pain. The majority of patients with osteomalacia have muscle weakness of varying severity. Other clinical features include a peculiar waddling or “ penguin ” gait, tetany, and greenstick bone fractures.
Radiographic Features General Radiographic Features. In rickets the earliest and most
prominent radiographic manifestation is a widening and fraying of the epiphyses of the long bones. The soft weight-bearing bones such as the femur and tibia undergo a characteristic bowing. Greenstick fractures (an incomplete fracture) occur in many patients with rickets.
In osteomalacia the cortex of bone may be thin. Pseudofractures, which are poorly calcifi ed ribbonlike zones extending into bone at approximate right angles to the margin of the bone, may also be present. Pseudofractures occur most commonly in the ribs, pelvis, and weight-bearing bones and rarely in the mandible.
Radiographic Features of the Jaws. In rickets, jaw cortical structures such as the inferior mandibular border or the walls of the mandibular canal may thin. Changes in the jaws generally occur after changes in the ribs and long bones. Within the cancellous portion of the jaws, the trabeculae become reduced in density, number, and thickness. In severe cases, the jaws appear so radiolucent that the teeth appear to be bereft of bony support.
Most cases of osteomalacia produce no radiographic manifesta-tions in the jaws. However, when radiographic manifestations are present, there may be an overall radiolucent appearance and sparse trabeculae.
Radiographic Changes Associated with the Teeth. Rickets in infancy or early childhood may result in hypoplasia of developing dental enamel ( Fig. 25-9 ). If the disease occurs before the age of 3 years, such enamel hypoplasia is fairly common. Radiographs may reveal this early manifestation of rickets in unerupted and erupted teeth. Radiographs may also document retarded tooth eruption in early rickets. The lamina dura and the cortical boundary of tooth follicles may be thin or missing.
FIG. 25-8 Osteoporosis evident as a loss of the normal thickness and density of the inferior cortex of the mandible.
FIG. 25-9 Rickets may cause thinning (hypoplasia) or decreased min-eralization (hypocalcifi cation) of the enamel as seen in this bitewing view. (Courtesy H. G. Poyton, DDS, Toronto, Ontario, Canada.)

CHAPTER 25 ■ SYSTEMIC DISEASES MANIFESTED IN THE JAWS 463
Osteomalacia does not alter the teeth because they are fully devel-oped before the onset of the disease. The lamina dura may be espe-cially thin in individuals with long-standing or severe osteomalacia.
HYPOPHOSPHATASIA
Defi nition Hypophosphatasia is a rare inherited disorder that is caused by either a reduced production or a defective function of alkaline phosphatase. This enzyme is required for normal mineralization of osteoid. Patients have a low level of serum alkaline phosphatase activity and elevated urinary excretion of phosphoethanolamine. The usual pattern of inheritance is an autosomal dominant mode of disease transmission, although an autosomal recessive pattern exists.
Clinical Features The disease in individuals with homozygous involvement usually begins in utero, and affected patients often die within the fi rst year. These infants demonstrate bowed limb bones and a marked defi ciency of skull ossifi cation. Individuals with heterozygous disease show the biochemical defects but a milder disease clinically. These children show poor growth, fractures, and deformities similar to those of rickets. A history may exist of fractures, delayed walking, or ricketslike deformities that heal spontaneously. About 85% of these children show premature loss of the primary teeth, particularly the incisors, and delayed eruption of the permanent dentition. This is often the fi rst clinical sign of hypophosphatasia.
Radiographic Features General Radiographic Features. In young children with hypo-
phosphatasia, the long bones show irregular defects in the epiphysis, and the skull is poorly calcifi ed. In older children with premature closure of the skull sutures, multiple lucent areas of the calvarium may exist, called gyral or convolutional markings. These markings resem-ble hammered copper. The skull may assume a brachycephalic shape. A generalized reduction in bone density may occur in adults.
Radiographic Features of the Jaws. A generalized radiolucency of the mandible and maxilla is evident. The cortical bone and lamina dura are thin, and the alveolar bone is poorly calcifi ed and may appear defi cient.
FIG. 25-10 An example of hypophosphatasia; note the large pulp chambers in the deciduous denti-tion and the premature loss of the mandibular incisors. (Courtesy H. G. Poyton, DDS, Toronto, Ontario, Canada.)
Radiographic Changes Associated with the Teeth. Both primary and permanent teeth have a thin enamel layer and large pulp chambers and root canals ( Fig. 25-10 ). The teeth may also be hypo-plastic and may be lost prematurely.
RENAL OSTEODYSTROPHY
Synonym Renal rickets
Defi nition In renal osteodystrophy, bone changes result from chronic renal failure. The kidney disease interferes with the hydroxylation of 25(OH)D into 1,25(OH) 2 D, which normally occurs in the kidney. The vitamin D metabolite 1,25(OH) 2 D is responsible for the active trans-port of calcium in the duodenum and upper jejunum. Affected patients often have hypocalcemia as a result of impaired calcium absorption and hyperphosphatemia resulting from reduction in renal phosphorus excretion. A prolonged low serum level of calcium stimu-lates the parathyroid glands to produce PTH. The result is a secondary hyperparathyroidism.
Clinical Features The clinical features of renal osteodystrophy are those of chronic renal failure. In children, growth retardation and frequent bone fractures may occur. Adults may have a gradual softening and bowing of the bones.
Radiographic Features General Radiographic Features. The radiographic features of
renal osteodystrophy are quite variable. Some changes of the skeleton resemble those seen in rickets, and other changes are consistent with hyperparathyroidism, including generalized loss of bone density and thinning of bony cortices. Of interest is the occasional fi nding of an increase in bone density ( Fig. 25-11 ). There may be brown tumors, similar to those seen in primary hyperthyroidism, but these are less frequent. Also, jaw enlargement has been reported in patients with renal disease who were treated with renal dialysis. The size increase is due to enlargement of the cancellous bone component that has a dense granular trabecular pattern.
A B

464 PART V ■ RADIOGRAPHIC INTERPRETATION
Radiographic Features of the Jaws. In renal osteodystrophy the density of the mandible and maxilla may be less than normal and occasionally may be greater than normal. Manifestations include a decrease or an increase in the number of internal trabeculae, and the trabecular bone pattern may be granular. The cortical boundaries may be thinner or less apparent. It is important to note that these bone changes may persist after a successful renal transplant because of hyperplasia of the parathyroid glands, resulting in a continued eleva-tion of PTH.
Radiographic Changes Associated with the Teeth. Hypoplasia and hypocalcifi cation of the teeth are possible, sometimes resulting in loss of any radiographic evidence of enamel. The lamina dura may be absent or less apparent in instances of bone sclerosis.
HYPOPHOSPHATEMIA
Synonym Vitamin D – resistant rickets and hypophosphatemic rickets
Defi nition Hypophosphatemia represents a group of inherited conditions that produce renal tubular disorders resulting in excessive loss of phospho-rus. There is a failure to reabsorb phosphorus in the distal renal tubules, resulting in a decrease in serum phosphorus (hypophospha-temia). Normal calcifi cation of the osseous structures requires the correct amount and ratio of serum calcium and phosphorus. Multiple
myeloma may induce hypophosphatemia as a result of secondary damage to the kidneys.
Clinical Features Children with hypophosphatemia show reduced growth and rickets-like bony changes. These include bowing of the legs, enlarged epiphy-ses, and skull changes. Adults have bone pain, muscle weakness, and vertebral fractures.
Radiographic Features General Radiographic Features. In children with hypophos-
phatemia, radiographic fi ndings are indistinguishable from those of rickets. In adults the long bones may show persistent deformity, frac-tures, or pseudofractures.
Radiographic Features of the Jaws. The jaws are usually osteo-porotic and in extreme cases are remarkably radiolucent. Cortical boundaries may be unusually radiolucent or not apparent ( Fig. 25-12 ).
Other possibilities include fewer visible trabeculae and a granular trabecular pattern.
Radiographic Features Associated with the Teeth. The teeth may be poorly formed, with thin enamel caps and large pulp cham-bers and root canals ( Fig. 25-12, B and C ). In addition, periapical and periodontal abscesses occur frequently. The occurrence of periapical rarefying osteitis without an etiology may be a result of large pulp chambers and defects in the formation of dentin. This may allow for the ingress of oral microorganisms and subsequent pulp necrosis. If
FIG. 25-11 Two cases of renal osteodystrophy. A, This panoramic image reveals areas of radiolu-cency corresponding to loss of bone mass, loss of distinct lamina dura, and a sclerotic bone pattern around the roots of the teeth. B, This panoramic image reveals a diffuse sclerotic (radiopaque) bone pattern throughout the jaws. Note the loss of a distinct inferior cortex of the mandible resulting from an increase in the radiopacity of the internal aspect of the bone.
A
B
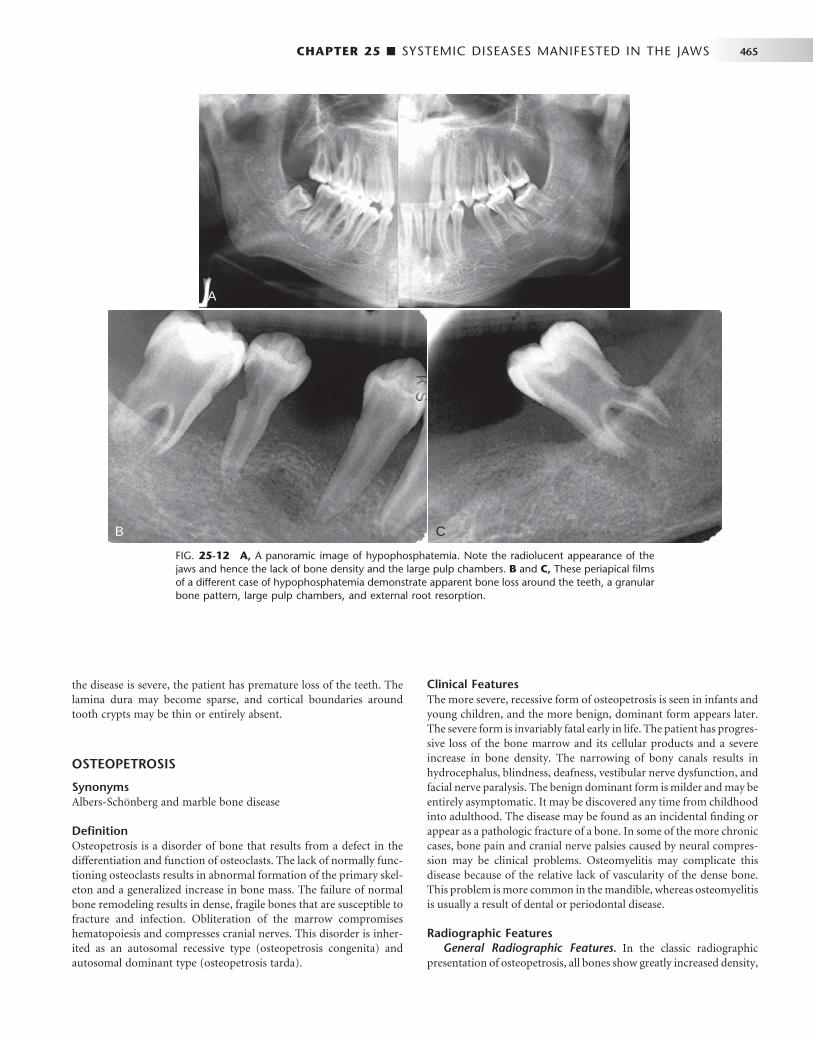
CHAPTER 25 ■ SYSTEMIC DISEASES MANIFESTED IN THE JAWS 465
the disease is severe, the patient has premature loss of the teeth. The lamina dura may become sparse, and cortical boundaries around tooth crypts may be thin or entirely absent.
OSTEOPETROSIS
Synonyms Albers-Sch ö nberg and marble bone disease
Defi nition Osteopetrosis is a disorder of bone that results from a defect in the differentiation and function of osteoclasts. The lack of normally func-tioning osteoclasts results in abnormal formation of the primary skel-eton and a generalized increase in bone mass. The failure of normal bone remodeling results in dense, fragile bones that are susceptible to fracture and infection. Obliteration of the marrow compromises hematopoiesis and compresses cranial nerves. This disorder is inher-ited as an autosomal recessive type (osteopetrosis congenita) and autosomal dominant type (osteopetrosis tarda).
Clinical Features The more severe, recessive form of osteopetrosis is seen in infants and young children, and the more benign, dominant form appears later. The severe form is invariably fatal early in life. The patient has progres-sive loss of the bone marrow and its cellular products and a severe increase in bone density. The narrowing of bony canals results in hydrocephalus, blindness, deafness, vestibular nerve dysfunction, and facial nerve paralysis. The benign dominant form is milder and may be entirely asymptomatic. It may be discovered any time from childhood into adulthood. The disease may be found as an incidental fi nding or appear as a pathologic fracture of a bone. In some of the more chronic cases, bone pain and cranial nerve palsies caused by neural compres-sion may be clinical problems. Osteomyelitis may complicate this disease because of the relative lack of vascularity of the dense bone. This problem is more common in the mandible, whereas osteomyelitis is usually a result of dental or periodontal disease.
Radiographic Features General Radiographic Features. In the classic radiographic
presentation of osteopetrosis, all bones show greatly increased density,
FIG. 25-12 A, A panoramic image of hypophosphatemia. Note the radiolucent appearance of the jaws and hence the lack of bone density and the large pulp chambers. B and C, These periapical fi lms of a different case of hypophosphatemia demonstrate apparent bone loss around the teeth, a granular bone pattern, large pulp chambers, and external root resorption.
A
B C
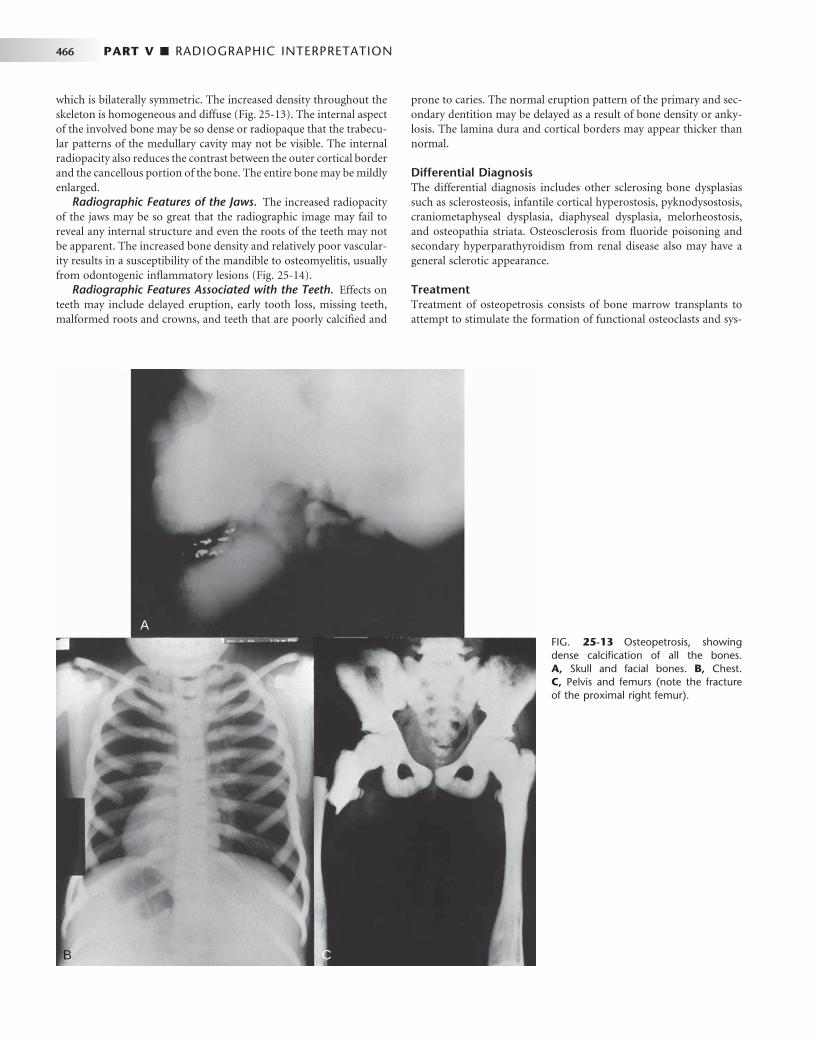
466 PART V ■ RADIOGRAPHIC INTERPRETATION
which is bilaterally symmetric. The increased density throughout the skeleton is homogeneous and diffuse ( Fig. 25-13 ). The internal aspect of the involved bone may be so dense or radiopaque that the trabecu-lar patterns of the medullary cavity may not be visible. The internal radiopacity also reduces the contrast between the outer cortical border and the cancellous portion of the bone. The entire bone may be mildly enlarged.
Radiographic Features of the Jaws. The increased radiopacity of the jaws may be so great that the radiographic image may fail to reveal any internal structure and even the roots of the teeth may not be apparent. The increased bone density and relatively poor vascular-ity results in a susceptibility of the mandible to osteomyelitis, usually from odontogenic infl ammatory lesions ( Fig. 25-14 ).
Radiographic Features Associated with the Teeth. Effects on teeth may include delayed eruption, early tooth loss, missing teeth, malformed roots and crowns, and teeth that are poorly calcifi ed and
prone to caries. The normal eruption pattern of the primary and sec-ondary dentition may be delayed as a result of bone density or anky-losis. The lamina dura and cortical borders may appear thicker than normal.
Differential Diagnosis The differential diagnosis includes other sclerosing bone dysplasias such as sclerosteosis, infantile cortical hyperostosis, pyknodysostosis, craniometaphyseal dysplasia, diaphyseal dysplasia, melorheostosis, and osteopathia striata. Osteosclerosis from fl uoride poisoning and secondary hyperparathyroidism from renal disease also may have a general sclerotic appearance.
Treatment Treatment of osteopetrosis consists of bone marrow transplants to attempt to stimulate the formation of functional osteoclasts and sys-
FIG. 25-13 Osteopetrosis, showing dense calcifi cation of all the bones. A, Skull and facial bones. B, Chest. C, Pelvis and femurs (note the fracture of the proximal right femur).
A
B C

CHAPTER 25 ■ SYSTEMIC DISEASES MANIFESTED IN THE JAWS 467
temic steroids for the hematologic component. The osteomyelitis is diffi cult to treat, and a combination of antibiotics and hyperbaric oxygen therapy is used. It is imperative that affected patients avoid odontogenic infl ammatory disease.
Other Systemic Diseases
PROGRESSIVE SYSTEMIC SCLEROSIS
Synonym Scleroderma
Defi nition Progressive systemic sclerosis (PSS) is a generalized connective tissue disease that causes excessive collagen deposition resulting in harden-ing (sclerosis) of the skin and other tissues. The involvement of the gastrointestinal tract, heart, lungs, and kidneys usually results in more serious complications. The cause of the disease is unknown.
Clinical Features PSS is a disease of middle age, with the greatest incidence between the ages of 30 and 50 years. It is seen rarely in adolescence or in the elderly. Women are affected about three times as often as men.
FIG. 25-14 A panoramic fi lm of a patient with osteopetrosis; note the increased density of the jaws, lack of eruption of the mandibular second bicuspids, narrow inferior alveolar nerve canal, and development of osteomyelitis in the body of the left mandible with periostitis (arrow).
In most patients with moderate to severe PSS, the involved skin has a thickened, leathery quality. The skin is not mobile over the underlying soft tissues, and involvement of the facial region may inhibit normal mandibular opening. Patients with diffuse disease are also likely to have xerostomia; increased numbers of decayed, missing, or fi lled teeth; and carious lesions. Further, patients with systemic disease are more likely to have deeper periodontal pockets and higher gingivitis scores. Patients with cardiac and pulmonary problems may have varying degrees of heart failure and respiratory insuffi ciencies. Renal involvement usually leads to some degree of uremia, with or without hypertension.
Radiographic Features Radiographic Features of the Jaws. A radiographic feature in
some cases of PSS is an unusual pattern of mandibular erosions at regions of muscle attachment such as the angles, coronoid process, digastric region, or condyles ( Fig. 25-15 ). This type of resorption is typically bilateral and fairly symmetric. Most of these erosive borders are smooth and sharply defi ned. This resorption may be progressive with the disease.
Radiographic Changes Associated with the Teeth. The most common oral radiographic manifestation of PSS is an increase in the width of the periodontal ligament (PDL) spaces around the teeth ( Fig.
FIG. 25-15 Progressive systemic sclerosis demon-strating a loss of bone in the region of the angle of the mandible (arrows) and at the right coronoid process (arrow), which are locations of muscle attachments.
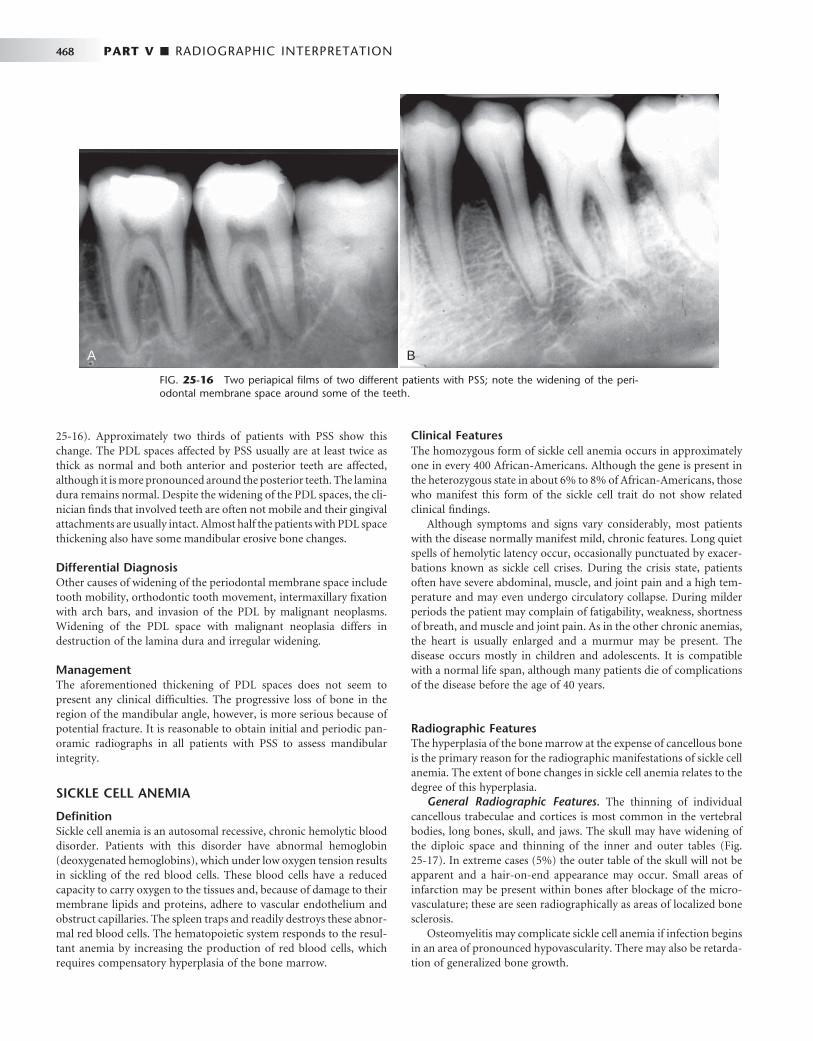
468 PART V ■ RADIOGRAPHIC INTERPRETATION
25-16 ). Approximately two thirds of patients with PSS show this change. The PDL spaces affected by PSS usually are at least twice as thick as normal and both anterior and posterior teeth are affected, although it is more pronounced around the posterior teeth. The lamina dura remains normal. Despite the widening of the PDL spaces, the cli-nician fi nds that involved teeth are often not mobile and their gingival attachments are usually intact. Almost half the patients with PDL space thickening also have some mandibular erosive bone changes.
Differential Diagnosis Other causes of widening of the periodontal membrane space include tooth mobility, orthodontic tooth movement, intermaxillary fi xation with arch bars, and invasion of the PDL by malignant neoplasms. Widening of the PDL space with malignant neoplasia differs in destruction of the lamina dura and irregular widening.
Management The aforementioned thickening of PDL spaces does not seem to present any clinical diffi culties. The progressive loss of bone in the region of the mandibular angle, however, is more serious because of potential fracture. It is reasonable to obtain initial and periodic pan-oramic radiographs in all patients with PSS to assess mandibular integrity.
SICKLE CELL ANEMIA
Defi nition Sickle cell anemia is an autosomal recessive, chronic hemolytic blood disorder. Patients with this disorder have abnormal hemoglobin (deoxygenated hemoglobins), which under low oxygen tension results in sickling of the red blood cells. These blood cells have a reduced capacity to carry oxygen to the tissues and, because of damage to their membrane lipids and proteins, adhere to vascular endothelium and obstruct capillaries. The spleen traps and readily destroys these abnor-mal red blood cells. The hematopoietic system responds to the resul-tant anemia by increasing the production of red blood cells, which requires compensatory hyperplasia of the bone marrow.
Clinical Features The homozygous form of sickle cell anemia occurs in approximately one in every 400 African-Americans. Although the gene is present in the heterozygous state in about 6% to 8% of African-Americans, those who manifest this form of the sickle cell trait do not show related clinical fi ndings.
Although symptoms and signs vary considerably, most patients with the disease normally manifest mild, chronic features. Long quiet spells of hemolytic latency occur, occasionally punctuated by exacer-bations known as sickle cell crises. During the crisis state, patients often have severe abdominal, muscle, and joint pain and a high tem-perature and may even undergo circulatory collapse. During milder periods the patient may complain of fatigability, weakness, shortness of breath, and muscle and joint pain. As in the other chronic anemias, the heart is usually enlarged and a murmur may be present. The disease occurs mostly in children and adolescents. It is compatible with a normal life span, although many patients die of complications of the disease before the age of 40 years.
Radiographic Features The hyperplasia of the bone marrow at the expense of cancellous bone is the primary reason for the radiographic manifestations of sickle cell anemia. The extent of bone changes in sickle cell anemia relates to the degree of this hyperplasia.
General Radiographic Features. The thinning of individual cancellous trabeculae and cortices is most common in the vertebral bodies, long bones, skull, and jaws. The skull may have widening of the diploic space and thinning of the inner and outer tables ( Fig. 25-17 ). In extreme cases (5%) the outer table of the skull will not be apparent and a hair-on-end appearance may occur. Small areas of infarction may be present within bones after blockage of the micro-vasculature; these are seen radiographically as areas of localized bone sclerosis.
Osteomyelitis may complicate sickle cell anemia if infection begins in an area of pronounced hypovascularity. There may also be retarda-tion of generalized bone growth.
FIG. 25-16 Two periapical fi lms of two different patients with PSS; note the widening of the peri-odontal membrane space around some of the teeth.
A B

CHAPTER 25 ■ SYSTEMIC DISEASES MANIFESTED IN THE JAWS 469
Radiographic Features of the Jaws. The radiographic manifes-tations of sickle cell anemia in the jaws include general osteoporosis. This occurs because of a decrease in the volume of trabecular bone and, to a lesser extent, thinning of the cortical plates. In most cases the change is mild or moderate, with extreme radiographic manifesta-tions being unusual. The bone pattern may be altered to one with fewer but coarser trabeculae. Radiographs of the jaws of children with sickle cell anemia have been reported to show a high frequency of severe osteoporosis. Rarely, bone marrow hyperplasia may cause enlargement and protrusion of the maxillary alveolar ridge.
THALASSEMIA
Synonyms Cooley ’ s anemia, Mediterranean anemia, and erythroblastic anemia
Defi nition Thalassemia is a hereditary disorder that results in a defect in hemo-globin synthesis. This defect may involve either the a α - or β -globulin genes. The resultant red blood cells have reduced hemoglobin content, are thin, and have a shortened life span. The heterozygous form of the disease (thalassemia minor) is mild. The homozygous form (thalas-semia major) may be severe. A less severe form, thalassemia interme-dia, also occurs.
Clinical Features In the severe form of the disease, the onset is in infancy and the sur-vival time may be short. The face develops prominent cheekbones and a protrusive premaxilla, resulting in a “ rodentlike ” face. The milder form of the disease occurs in adults.
FIG. 25-17 A, Radiograph of a patient with sickle cell anemia showing a thickened diploic space and thinning of the skull cortex. B, Normal skull for comparison. C, Skull showing the hair-on-end bone pattern. ( B courtesy Dr. B. Sarnat, Los Angeles, Calif.; C courtesy H. G. Poyton, DDS, Toronto, Ontario, Canada.)
C
A B
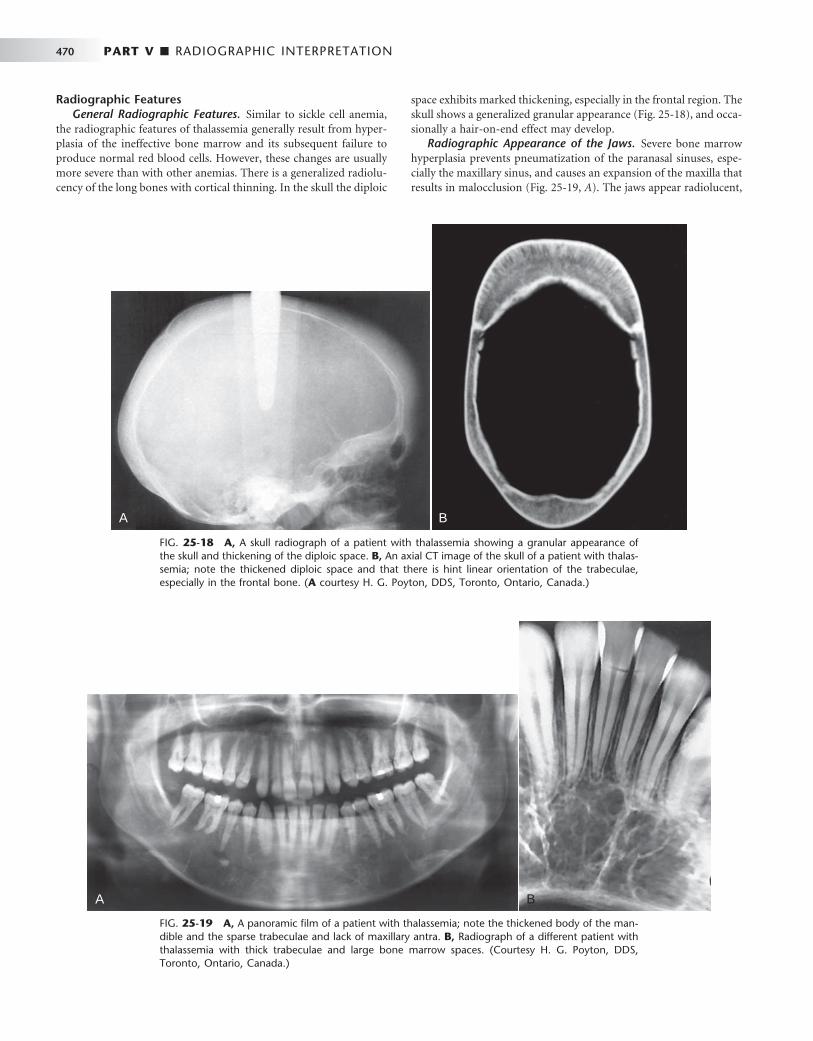
470 PART V ■ RADIOGRAPHIC INTERPRETATION
FIG. 25-18 A, A skull radiograph of a patient with thalassemia showing a granular appearance of the skull and thickening of the diploic space. B, An axial CT image of the skull of a patient with thalas-semia; note the thickened diploic space and that there is hint linear orientation of the trabeculae, especially in the frontal bone. ( A courtesy H. G. Poyton, DDS, Toronto, Ontario, Canada.)
A B
FIG. 25-19 A, A panoramic fi lm of a patient with thalassemia; note the thickened body of the man-dible and the sparse trabeculae and lack of maxillary antra. B, Radiograph of a different patient with thalassemia with thick trabeculae and large bone marrow spaces. (Courtesy H. G. Poyton, DDS, Toronto, Ontario, Canada.)
A B
Radiographic Features General Radiographic Features. Similar to sickle cell anemia,
the radiographic features of thalassemia generally result from hyper-plasia of the ineffective bone marrow and its subsequent failure to produce normal red blood cells. However, these changes are usually more severe than with other anemias. There is a generalized radiolu-cency of the long bones with cortical thinning. In the skull the diploic
space exhibits marked thickening, especially in the frontal region. The skull shows a generalized granular appearance ( Fig. 25-18 ), and occa-sionally a hair-on-end effect may develop.
Radiographic Appearance of the Jaws. Severe bone marrow hyperplasia prevents pneumatization of the paranasal sinuses, espe-cially the maxillary sinus, and causes an expansion of the maxilla that results in malocclusion ( Fig. 25-19, A ). The jaws appear radiolucent,
CHAPTER 25 ■ SYSTEMIC DISEASES MANIFESTED IN THE JAWS 471
with thinning of the cortical borders and enlargement of the marrow spaces. The trabeculae are large and coarse ( Fig. 25-19, B ). The lamina dura is thin, and the roots of the teeth may be short.
SUGGESTED READINGS Adler C : Bone diseases: macroscopic, histological and radiological diagnosis of
structural changes in the skeleton , Berlin , 2000 , Springer-Verlag . Paterson CR : Metabolic disorders of bone , Oxford , 1974 , Blackwell Scientifi c . Trapnell DH , Boweman JE : Dental manifestation of systemic disease , London ,
1973 , Butterworth .
DIABETES MELLITUS
Collin HL , Niskanen L , Uusitupa M et al : Oral symptoms and signs in elderly patients with type 2 diabetes mellitus. A focus on diabetic neuropathy , Oral Surg Oral Med Oral Pathol Oral Radiol Endod 90 : 299 - 305 , 2000 .
Lamey PJ , Darwazeh AM , Frier BM : Oral disorders associated with diabetes mellitus , Diabetes Med 9 : 410 - 416 , 1992 .
Murrah VA : Diabetes mellitus and associated oral manifestations: a review , J Oral Pathol 14 : 271 - 281 , 1985 .
HYPERPARATHYROIDISM
Aldred MJ , Talacko AA , Savarirayan R et al : Dental fi ndings in a family with hyperparathyroidism-jaw tumor syndrome and a novel HRPT2 gene mutation , Oral Surg Oral Med Oral Pathol Oral Radiol Endod 101 : 212 - 218 , 2006 .
Bilezikian JP : Hyper- and hypoparathyroidism . In Rakel R , editor: Conn ’ s current therapy , Philadelphia , 1985 , WB Saunders .
Daniels JM : Primary hyperparathryroidism presenting as a palatal brown tumor , Oral Surg Oral Med Oral Pathol Oral Radiol Endod 98 : 409 - 413 , 2004 .
Rosenberg EH , Guralnick W : Hyperparathyroidism: a review of 220 proved cases with special emphasis on fi ndings in the jaws , Oral Surg Oral Med Oral Pathol 15 ( 2 Suppl ): 84 - 94 , 1962 .
HYPOPARATHYROIDISM
Frensilli J , Stoner R , Hinrichs E : Dental changes of idiopathic hypoparathyroidism: report of three cases , J Oral Surg 29 : 727 - 731 , 1971 .
Glynne A , Hunter I , Thomson J : Pseudohypoparathyroidism with paradoxical increase in hypocalcemic seizures due to long-term anticonvulsant therapy , Postgrad Med J 48 : 632 , 1972 .
HYPOPHOSPHATASIA
Eastman JR , Bixler D : Clinical, laboratory, and genetic investigations of hypophosphatasia: support for autosomal dominant inheritance with homozygous lethality , J Craniofac Genet Dev Biol 3 : 213 - 234 , 1983 .
Jedrychowski JR , Duperon D : Childhood hypophosphatasia with oral manifestations , J Oral Med 34 : 18 - 22 , 1979 .
Macfarlane JD , Swart JGN : Dental aspects of hypophosphatasia: a case report, family study, and literature review , Oral Surg Oral Med Oral Pathol 67 : 521 - 526 , 1989 .
HYPOPITUITARISM
Conley H , Stefl ik DE , Singh B et al : Clinical and histologic fi ndings of the dentition in a hypopituitary patient: report of case , ASDC J Dent Child 57 : 376 - 379 , 1990 .
Edler RJ : Dental and skeletal ages in hypopituitary patients , J Dent Res 56 : 1145 - 1153 , 1977 .
Kosowicz J , Rzymski K : Abnormalities of tooth development in pituitary dwarfi sm , Oral Surg Oral Med Oral Pathol 44 : 853 - 863 , 1977 .
Myllarniemi S , Lenko HL , Perheentupa J : Dental maturity in hypopituitarism, and dental response to substitution treatment , Scand J Dent Res 86 : 307 - 312 , 1978 .
OSTEOPOROSIS
Lee BD , White SC : Age and trabecular features of alveolar bone associated with osteoporosis , Oral Surg Oral Med Oral Pathol Oral Radiol Endod 100 : 92 - 98 , 2005 .
Mohammad AR , Alder M , McNally MA : A pilot study of panoramic fi lm density at selected sites in the mandible to predict osteoporosis , Int J Prosthodont 9 : 290 - 294 , 1996 .
Taguchi A , Suei Y , Ohtsuka M et al : Usefulness of panoramic radiography in the diagnosis of postmenopausal osteoporosis in women: width and morphology of inferior cortex of the mandible , Dentomaxillofac Radiol 25 : 263 - 267 , 1996 .
White SC : Oral radiographic predictors of osteoporosis , Dentomaxillofac Radiol 31 : 84 - 92 , 2002 .
OSTEOPETROSIS
Barry CP , Ryan CD , Stassen LF : Osteomyelitis of the maxilla secondary to osteopetrosis: a report of 2 cases in sisters , J Oral Maxillofac Surg 65 : 144 - 147 , 2007 .
Ruprecht A , Wagner H , Engel H : Osteopetrosis: report of a case and discussion of the differential diagnosis , Oral Surg Oral Med Oral Pathol 66 : 674 - 679 , 1988 .
Waguespack SG , Hui SL , Dimeglio LA et al : Autosomal dominant osteopetrosis: clinical severity and natural history of 94 subjects with a chloride channel 7 gene mutation , J Clin Endocrinol Metab 92 : 771 - 778 , 2007 .
Younai F , Eisenbud L , Sciubba JJ : Osteopetrosis: a case report including gross and microscopic fi ndings in the mandible at autopsy , Oral Surg Oral Med Oral Pathol 65 : 214 - 221 , 1988 .
PROGRESSIVE SYSTEMIC SCLEROSIS
Alexandridis C , White SC : Periodontal ligament changes in patients with progressive systemic sclerosis , Oral Surg Oral Med Oral Pathol 58 : 113 - 118 , 1984 .
Auluck A , Pai KM , Shetty C et al : Mandibular resorption in progressive systemic sclerosis: a report of three cases , Dentomaxillofac Radiol 34 : 384 - 386 , 2005 .
Rout PG , Hamburger J , Potts AJ : Orofacial radiological manifestations of systemic sclerosis , Dentomaxillofac Radiol 25 : 193 - 196 , 1996 .
Wood RE , Lee P : Analysis of the oral manifestations of systemic sclerosis (scleroderma) , Oral Surg Oral Med Oral Pathol 65 : 172 - 178 , 1988 .
RENAL OSTEODYSTROPHY
Damm DD , Neville BW , McKenna S et al : Macrognathia of renal osteodystrophy in dialysis patients , Oral Surg Oral Med Oral Pathol Oral Radiol Endod 83 : 489 - 495 , 1997 .
Hata T , Irei I , Tanaka K et al : Macrognathia secondary to dialysis-related renal osteodystrophy treated successfully by parathyroidectomy , Int J Oral Maxillofac Surg 35 : 378 - 382 , 2006 .
Proctor R , Kumar N , Stein A et al : Oral and dental aspects of chronic renal failure , J Dent Res 84 : 199 - 208 , 2005 .
Scutellari PN , Orzincolo C , Bedani PL et al : Radiographic manifestations in teeth and jaws in chronic kidney insuffi ciency , Radiol Med (Torino) 92 : 415 - 420 , 1996 .
RICKETS
Harris R , Sullivan HR : Dental sequelae in deciduous dentition in vitamin-D resistant rickets: case report , Aust Dent J 5 : 200 - 203 , 1960 .
Marks SC , Lindahl RL , Bawden JW : Dental and cephalometric fi ndings in vitamin D resistant rickets , J Dent Child 32 : 259 , 1965 .
SICKLE CELL ANEMIA
Brown DL , Sebes JI : Sickle cell gnathopathy: radiologic assessment , Oral Surg Oral Med Oral Pathol 61 : 653 - 656 , 1986 .

472 PART V ■ RADIOGRAPHIC INTERPRETATION
Ejindu VC , Hine AL , Mashayeckhi M et al : Musculoskeletal manifestations of sickle cell disease . Radiographics 27 : 1005 - 1021 , 2007 .
Lawrenz DR : Sickle cell disease: a review and update of current therapy . J Oral Maxillofac Surg 57 : 171 - 178 , 1999 .
Sears RS , Nazif MM , Zullo T : The effects of sickle-cell disease on dental and skeletal maturation , ASDC J Dent Child 48 : 275 - 277 , 1981 .
White SC , Cohen JM , Mourshed FA : Digital analysis of trabecular pattern in jaws of patients with sickle cell anemia , Dentomaxillofac Radiol 29 : 119 - 124 , 2000 .
THALASSEMIA
Hazza ’ a AM , Al-Jamal G : Radiographic features of the jaws and teeth in thalassaemia major , Dentomaxillofac Radiol 35 : 283 - 288 , 2006 .
Poyton HG , Davey KW : Thalassemia: changes visible in radiographs used in dentistry , Oral Surg Oral Med Oral Pathol 25 : 564 - 576 , 1968 .

C H A P T E R 2 6
Diagnostic Imaging of the Temporomandibular Joint
C. Grace Petrikowski
Disorders of the temporomandibular joint are abnormalities that interfere with the normal form or function of the joint. These disorders include dysfunction of the articular disk and
associated ligaments and muscles, joint arthritides, infl ammatory lesions, neoplasms, and growth or developmental abnormalities.
Clinical Features
Temporomandibular joint (TMJ) dysfunction is the most common jaw disorder, with 28% to 86% of adults and adolescents showing one or more clinical signs or symptoms. A higher incidence of the disorder has been reported in females, although the reason for this preponder-ance is not clear. Signs and symptoms of dysfunction may include one or more of the following: pain in the TMJ or ear or both, headache, muscle tenderness, joint stiffness, clicking or other joint noises, reduced range of motion, locking, and subluxation. In most cases the clinical signs and symptoms are transitory, and treatment is not indi-cated. A small group of patients (5%) has severe dysfunction (e.g., severe pain, marked functional impairment, or both), which requires a thorough diagnostic workup, including diagnostic imaging, before treatment is begun.
The clinical signs and symptoms of other disorders of the TMJ may include swelling in and around the joint, an elevated tempera-ture, and redness of the overlying skin.
Application of Diagnostic Imaging
TMJ imaging may be necessary to supplement information obtained from the clinical examination, particularly when an osseous abnor-mality or infection is suspected, conservative treatment has failed, or symptoms are worsening. Diagnostic imaging also should be consid-ered for patients with a history of trauma, signifi cant dysfunction, alteration in range of motion, sensory or motor abnormalities, or signifi cant changes in occlusion. TMJ imaging is not indicated for joint sounds if other signs or symptoms are absent or for asympto-matic children and adolescents before orthodontic treatment. The purposes of TMJ imaging are to evaluate the integrity and relation-ships of the hard and soft tissues, confi rm the extent or stage of pro-gression of known disease, and evaluate the effects of treatment. The clinician must correlate the radiographic information with the patient ’ s history and clinical fi ndings to arrive at a fi nal diagnosis and plan the management of the underlying disease process.
Radiographic Anatomy of the Temporomandibular Joint
A thorough understanding of the anatomy and morphology of the TMJ is essential so that a normal variant is not mistaken for an abnor-mality. The TMJs are unique in that, although they constitute two separate joints anatomically, they function together as a single unit. Each condyle articulates with the mandibular fossa of the temporal bone. A disk composed of fi brocartilage is interposed between the condyle and mandibular fossa. A fi brous capsule lined with synovial membrane surrounds and encloses the joint. Ligaments and muscles restrict or allow movement of the condyle.
CONDYLE
The condyle is a bony ellipsoid structure connected to the mandibular ramus by a narrow neck ( Fig. 26-1 ). The condyle is approximately 20 mm long mediolaterally and 8 to 10 mm thick anteroposteriorly. The shape of the condyle varies considerably; the superior aspect may be fl attened, rounded, or markedly convex, whereas the mediolateral contour usually is slightly convex. These variations in shape may cause diffi culty with radiographic interpretation; this underlines the impor-tance of understanding the range of normal appearance. The extreme aspects of the condyle are called the medial pole and lateral pole. The long axis of the condyle is slightly rotated on the condylar neck so that the medial pole is angled posteriorly, forming an angle of 15 to 33 degrees with the sagittal plane. The two condylar axes typically inter-sect near the anterior border of the foramen magnum in the axial or horizontal plane of the skull.
Most condyles have a pronounced ridge oriented mediolaterally on the anterior surface, marking the anteroinferior limit of the articu-lating area. This ridge is the upper limit of the pterygoid fovea, a small depression on the anterior surface at the junction of the condyle and neck. It is the attachment site of the superior head of the lateral ptery-goid muscle and should not be mistaken for an osteophyte (spur), which indicates degenerative joint disease.
Although the mandibular and temporal components of the TMJ are calcifi ed by 6 months of age, complete calcifi cation of cortical borders may not be completed until 20 years of age. As a result, radio-graphs of condyles in children may show little or no evidence of a cortical border. In the absence of disease, the cortical borders in adults
473
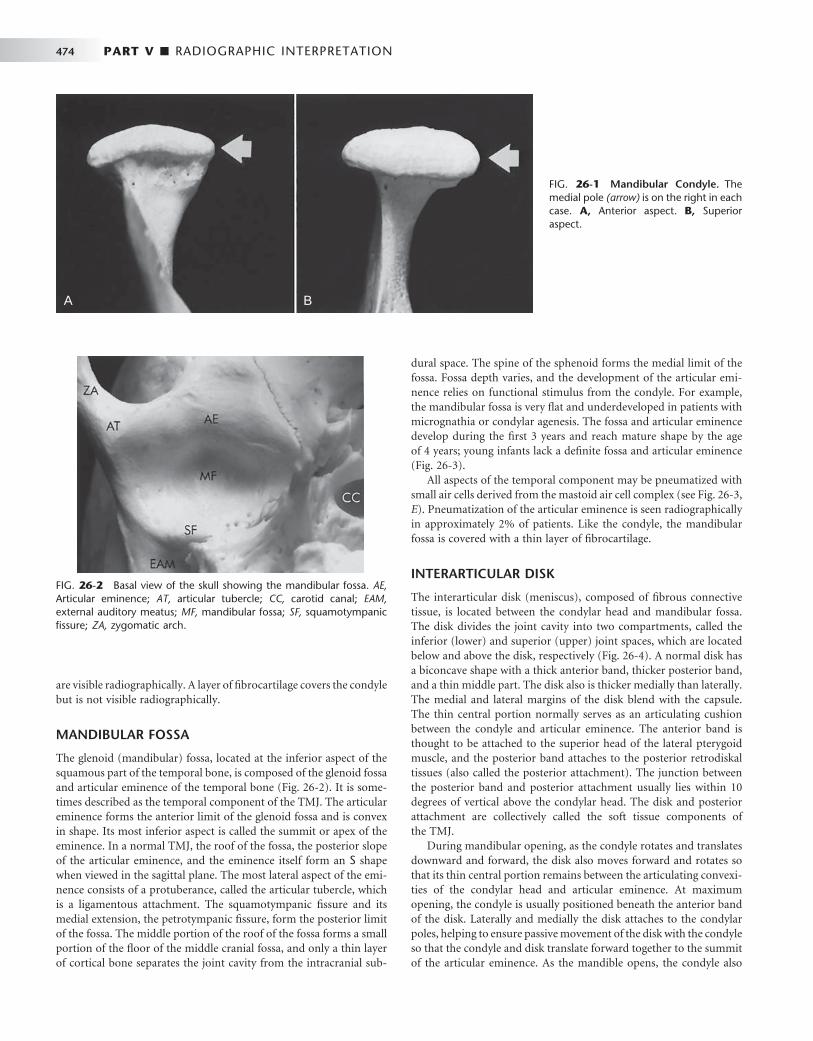
474 PART V ■ RADIOGRAPHIC INTERPRETATION
are visible radiographically. A layer of fi brocartilage covers the condyle but is not visible radiographically.
MANDIBULAR FOSSA
The glenoid (mandibular) fossa, located at the inferior aspect of the squamous part of the temporal bone, is composed of the glenoid fossa and articular eminence of the temporal bone ( Fig. 26-2 ). It is some-times described as the temporal component of the TMJ. The articular eminence forms the anterior limit of the glenoid fossa and is convex in shape. Its most inferior aspect is called the summit or apex of the eminence. In a normal TMJ, the roof of the fossa, the posterior slope of the articular eminence, and the eminence itself form an S shape when viewed in the sagittal plane. The most lateral aspect of the emi-nence consists of a protuberance, called the articular tubercle, which is a ligamentous attachment. The squamotympanic fi ssure and its medial extension, the petrotympanic fi ssure, form the posterior limit of the fossa. The middle portion of the roof of the fossa forms a small portion of the fl oor of the middle cranial fossa, and only a thin layer of cortical bone separates the joint cavity from the intracranial sub-
dural space. The spine of the sphenoid forms the medial limit of the fossa. Fossa depth varies, and the development of the articular emi-nence relies on functional stimulus from the condyle. For example, the mandibular fossa is very fl at and underdeveloped in patients with micrognathia or condylar agenesis. The fossa and articular eminence develop during the fi rst 3 years and reach mature shape by the age of 4 years; young infants lack a defi nite fossa and articular eminence ( Fig. 26-3 ).
All aspects of the temporal component may be pneumatized with small air cells derived from the mastoid air cell complex (see Fig. 26-3, E ). Pneumatization of the articular eminence is seen radiographically in approximately 2% of patients. Like the condyle, the mandibular fossa is covered with a thin layer of fi brocartilage.
INTERARTICULAR DISK
The interarticular disk (meniscus), composed of fi brous connective tissue, is located between the condylar head and mandibular fossa. The disk divides the joint cavity into two compartments, called the inferior (lower) and superior (upper) joint spaces, which are located below and above the disk, respectively ( Fig. 26-4 ). A normal disk has a biconcave shape with a thick anterior band, thicker posterior band, and a thin middle part. The disk also is thicker medially than laterally. The medial and lateral margins of the disk blend with the capsule. The thin central portion normally serves as an articulating cushion between the condyle and articular eminence. The anterior band is thought to be attached to the superior head of the lateral pterygoid muscle, and the posterior band attaches to the posterior retrodiskal tissues (also called the posterior attachment). The junction between the posterior band and posterior attachment usually lies within 10 degrees of vertical above the condylar head. The disk and posterior attachment are collectively called the soft tissue components of the TMJ.
During mandibular opening, as the condyle rotates and translates downward and forward, the disk also moves forward and rotates so that its thin central portion remains between the articulating convexi-ties of the condylar head and articular eminence. At maximum opening, the condyle is usually positioned beneath the anterior band of the disk. Laterally and medially the disk attaches to the condylar poles, helping to ensure passive movement of the disk with the condyle so that the condyle and disk translate forward together to the summit of the articular eminence. As the mandible opens, the condyle also
FIG. 26-1 Mandibular Condyle. The medial pole (arrow) is on the right in each case. A, Anterior aspect. B, Superior aspect.
A B
FIG. 26-2 Basal view of the skull showing the mandibular fossa. AE, Articular eminence; AT, articular tubercle; CC, carotid canal; EAM, external auditory meatus; MF, mandibular fossa; SF, squamotympanic fi ssure; ZA, zygomatic arch.

CHAPTER 26 ■ DIAGNOSTIC IMAGING OF THE TEMPOROMANDIBULAR JOINT 475
A B
C D E
TEMPOROMANDIBULAR JOINT BONY RELATIONSHIPS
Radiographic joint space is a general term used to describe the radiolucent area between the condyle and temporal component (see Fig. 26-4 ). This general term should not be confused with the terms superior joint space and inferior joint space described earlier, which refer to soft tissue spaces above and below the disk. The radiographic joint space contains the soft tissue components of the joint. The left and right condylar positions within the fossa can be determined and compared by the dimensions of the radio-graphic joint space viewed on corrected lateral images. A condyle is positioned concentrically when the anterior and posterior aspects of the radiolucent joint space are uniform in width. The condyle is retruded when the posterior joint space width is less than the anterior and protruded when the posterior joint space is wider than the anterior. However, because the radiographic outline of the glenoid fossa and the condyle do not match like a smooth ball-and-socket
FIG. 26-3 Sagittal reformat (A) and coronal reformat (B) cone-beam computed tomographic images of the right temporomandibular joint (TMJ) in an adult. Note the thick regular cortication of all articulating surfaces and development of the glenoid fossa and articular eminence. Sagittal reformat (C) and coronal reformat (D) cone-beam computed tomographic images of the right TMJ in a 7-year-old child. Note the thin cortication of the articulating surfaces, shallow glenoid fossa, and short articular eminence. E, Sagittal reformat cone-beam computed tomographic image of the left TMJ (adult) showing pneumatization of the temporal com-ponent including the articular eminence (arrow) with mastoid air cells.
rotates against the lower surface of the disk in the inferior joint space. On mandibular closing, this process reverses, with the disk moving back with the condyle into the mandibular fossa.
POSTERIOR ATTACHMENT (RETRODISKAL TISSUES)
The posterior attachment consists of a bilaminar zone of vascularized and innervated loose fi broelastic tissue. The superior lamina, which is rich in elastin, inserts into the posterior wall of the mandibular fossa. The superior lamina stretches and allows the disk to move forward with condylar translation. The inferior lamina attaches to the posterior surface of the condyle. The posterior attachment is covered with a synovial membrane that secretes synovial fl uid, which lubri-cates the joint. As the condyle moves forward, tissues of the posterior attachment expand in volume, primarily as a result of venous disten-tion, and as the disk moves forward, tension is produced in the elastic posterior attachment. This tension is thought to be responsible for the smooth recoil of the disk posteriorly as the mandible closes.
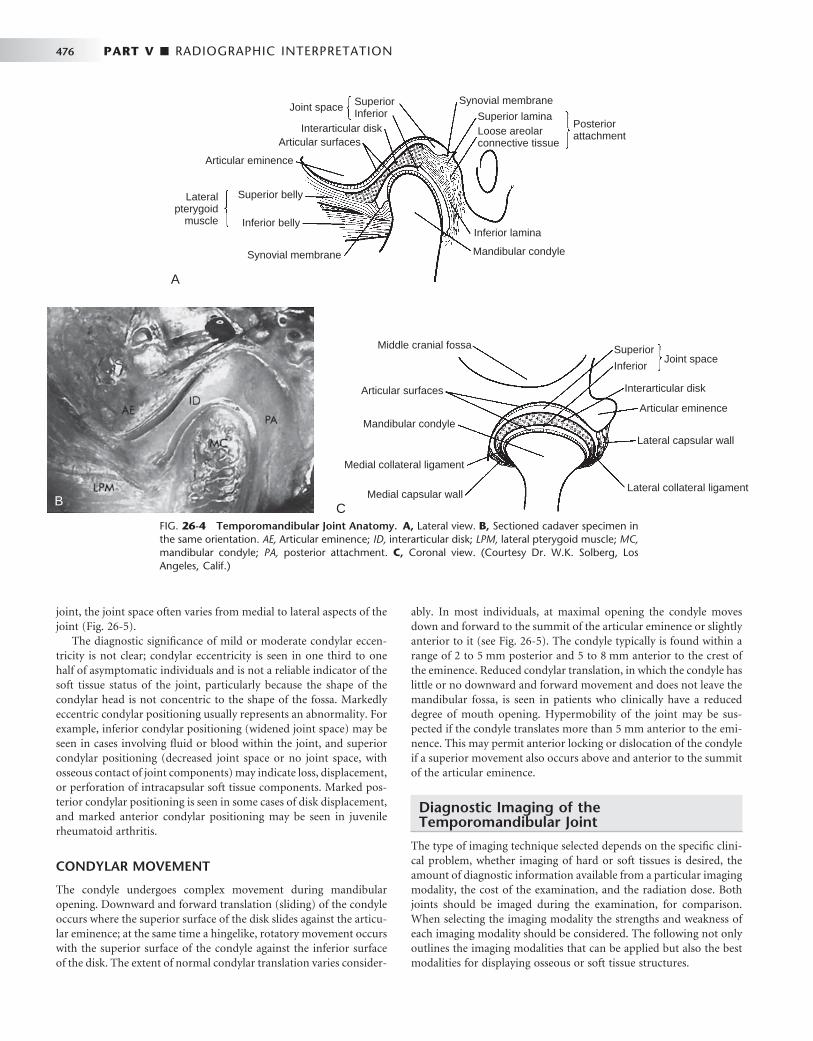
476 PART V ■ RADIOGRAPHIC INTERPRETATION
joint, the joint space often varies from medial to lateral aspects of the joint ( Fig. 26-5 ).
The diagnostic signifi cance of mild or moderate condylar eccen-tricity is not clear; condylar eccentricity is seen in one third to one half of asymptomatic individuals and is not a reliable indicator of the soft tissue status of the joint, particularly because the shape of the condylar head is not concentric to the shape of the fossa. Markedly eccentric condylar positioning usually represents an abnormality. For example, inferior condylar positioning (widened joint space) may be seen in cases involving fl uid or blood within the joint, and superior condylar positioning (decreased joint space or no joint space, with osseous contact of joint components) may indicate loss, displacement, or perforation of intracapsular soft tissue components. Marked pos-terior condylar positioning is seen in some cases of disk displacement, and marked anterior condylar positioning may be seen in juvenile rheumatoid arthritis.
CONDYLAR MOVEMENT
The condyle undergoes complex movement during mandibular opening. Downward and forward translation (sliding) of the condyle occurs where the superior surface of the disk slides against the articu-lar eminence; at the same time a hingelike, rotatory movement occurs with the superior surface of the condyle against the inferior surface of the disk. The extent of normal condylar translation varies consider-
Joint space SuperiorInferior
Posteriorattachment
Synovial membrane
Superior laminaLoose areolarconnective tissue
Inferior lamina
Mandibular condyleSynovial membrane
A
CB
Middle cranial fossa SuperiorJoint space
Interarticular disk
Articular eminence
Lateral capsular wall
Lateral collateral ligament
Inferior
Articular surfaces
Mandibular condyle
Medial collateral ligament
Medial capsular wall
Lateralpterygoid
muscle
Superior belly
Articular eminence
Articular surfacesInterarticular disk
Inferior belly
FIG. 26-4 Temporomandibular Joint Anatomy. A, Lateral view. B, Sectioned cadaver specimen in the same orientation. AE, Articular eminence; ID, interarticular disk; LPM, lateral pterygoid muscle; MC, mandibular condyle; PA, posterior attachment. C, Coronal view. (Courtesy Dr. W.K. Solberg, Los Angeles, Calif.)
ably. In most individuals, at maximal opening the condyle moves down and forward to the summit of the articular eminence or slightly anterior to it (see Fig. 26-5 ). The condyle typically is found within a range of 2 to 5 mm posterior and 5 to 8 mm anterior to the crest of the eminence. Reduced condylar translation, in which the condyle has little or no downward and forward movement and does not leave the mandibular fossa, is seen in patients who clinically have a reduced degree of mouth opening. Hypermobility of the joint may be sus-pected if the condyle translates more than 5 mm anterior to the emi-nence. This may permit anterior locking or dislocation of the condyle if a superior movement also occurs above and anterior to the summit of the articular eminence.
Diagnostic Imaging of the Temporomandibular Joint
The type of imaging technique selected depends on the specifi c clini-cal problem, whether imaging of hard or soft tissues is desired, the amount of diagnostic information available from a particular imaging modality, the cost of the examination, and the radiation dose. Both joints should be imaged during the examination, for comparison. When selecting the imaging modality the strengths and weakness of each imaging modality should be considered. The following not only outlines the imaging modalities that can be applied but also the best modalities for displaying osseous or soft tissue structures.
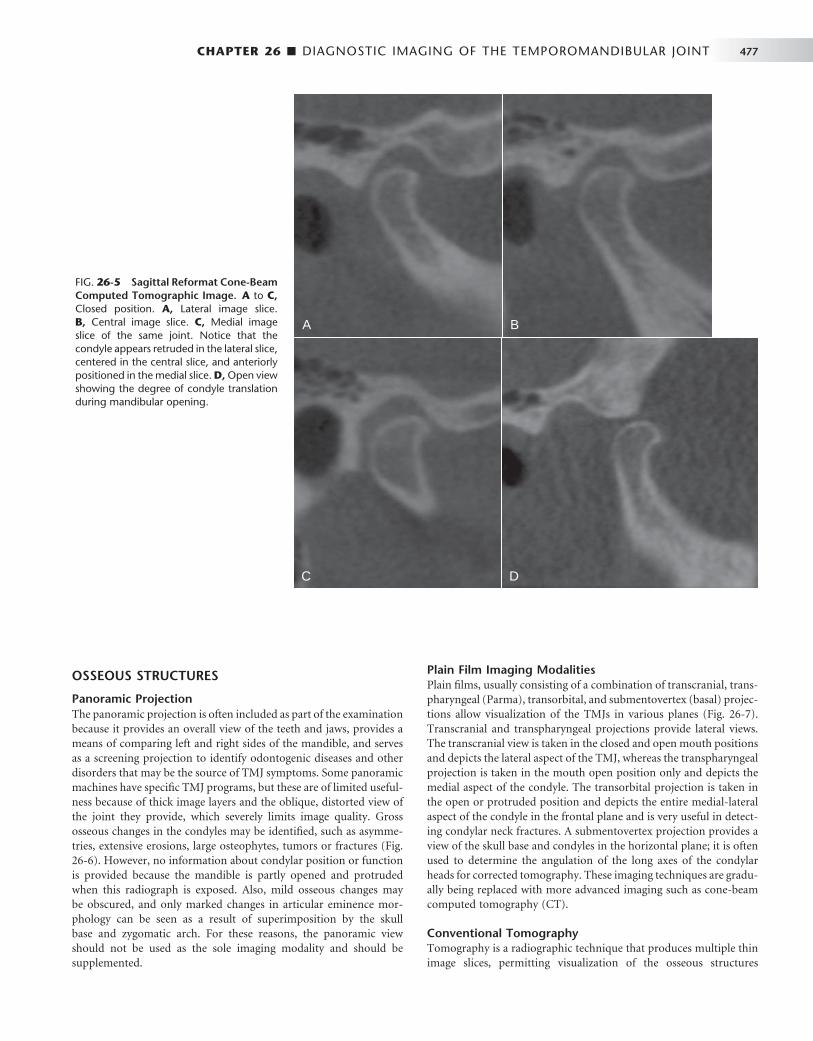
CHAPTER 26 ■ DIAGNOSTIC IMAGING OF THE TEMPOROMANDIBULAR JOINT 477
OSSEOUS STRUCTURES
Panoramic Projection The panoramic projection is often included as part of the examination because it provides an overall view of the teeth and jaws, provides a means of comparing left and right sides of the mandible, and serves as a screening projection to identify odontogenic diseases and other disorders that may be the source of TMJ symptoms. Some panoramic machines have specifi c TMJ programs, but these are of limited useful-ness because of thick image layers and the oblique, distorted view of the joint they provide, which severely limits image quality. Gross osseous changes in the condyles may be identifi ed, such as asymme-tries, extensive erosions, large osteophytes, tumors or fractures ( Fig. 26-6 ). However, no information about condylar position or function is provided because the mandible is partly opened and protruded when this radiograph is exposed. Also, mild osseous changes may be obscured, and only marked changes in articular eminence mor-phology can be seen as a result of superimposition by the skull base and zygomatic arch. For these reasons, the panoramic view should not be used as the sole imaging modality and should be supplemented.
Plain Film Imaging Modalities Plain fi lms, usually consisting of a combination of transcranial, trans-pharyngeal (Parma), transorbital, and submentovertex (basal) projec-tions allow visualization of the TMJs in various planes ( Fig. 26-7 ). Transcranial and transpharyngeal projections provide lateral views. The transcranial view is taken in the closed and open mouth positions and depicts the lateral aspect of the TMJ, whereas the transpharyngeal projection is taken in the mouth open position only and depicts the medial aspect of the condyle. The transorbital projection is taken in the open or protruded position and depicts the entire medial-lateral aspect of the condyle in the frontal plane and is very useful in detect-ing condylar neck fractures. A submentovertex projection provides a view of the skull base and condyles in the horizontal plane; it is often used to determine the angulation of the long axes of the condylar heads for corrected tomography. These imaging techniques are gradu-ally being replaced with more advanced imaging such as cone-beam computed tomography (CT).
Conventional Tomography Tomography is a radiographic technique that produces multiple thin image slices, permitting visualization of the osseous structures
FIG. 26-5 Sagittal Reformat Cone-Beam Computed Tomographic Image. A to C, Closed position. A, Lateral image slice. B, Central image slice. C, Medial image slice of the same joint. Notice that the condyle appears retruded in the lateral slice, centered in the central slice, and anteriorly positioned in the medial slice. D, Open view showing the degree of condyle translation during mandibular opening.
A B
C D
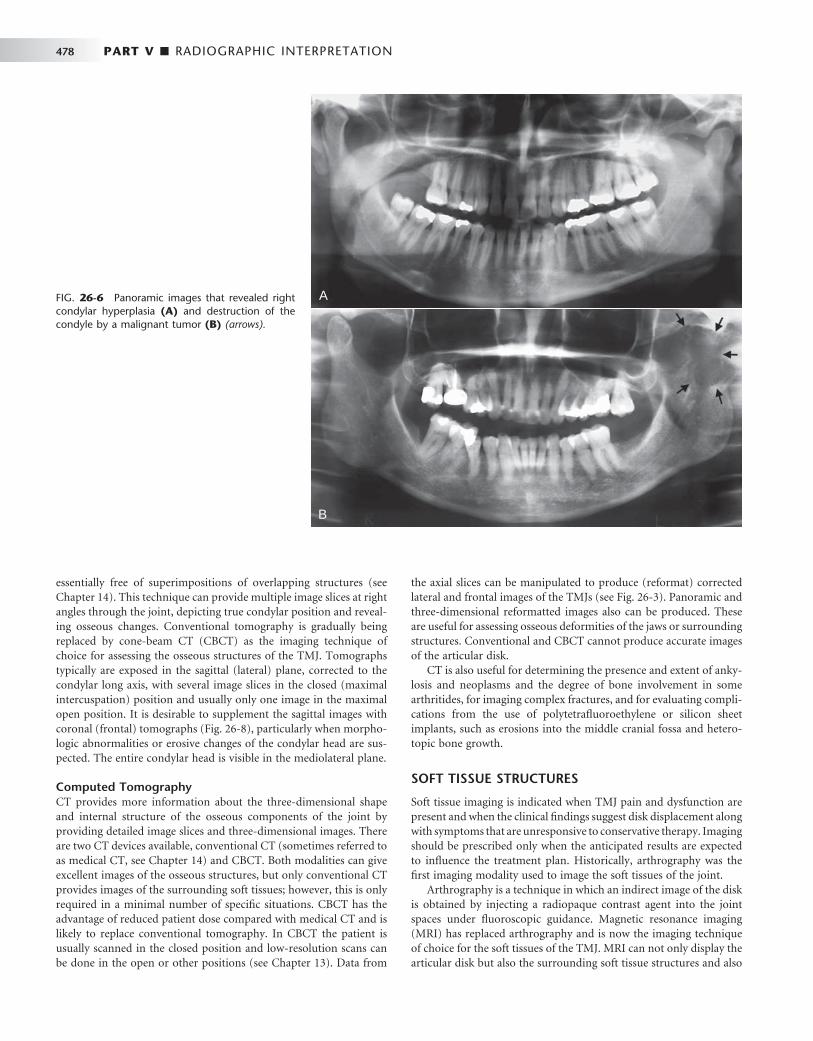
478 PART V ■ RADIOGRAPHIC INTERPRETATION
essentially free of superimpositions of overlapping structures (see Chapter 14 ). This technique can provide multiple image slices at right angles through the joint, depicting true condylar position and reveal-ing osseous changes. Conventional tomography is gradually being replaced by cone-beam CT (CBCT) as the imaging technique of choice for assessing the osseous structures of the TMJ. Tomographs typically are exposed in the sagittal (lateral) plane, corrected to the condylar long axis, with several image slices in the closed (maximal intercuspation) position and usually only one image in the maximal open position. It is desirable to supplement the sagittal images with coronal (frontal) tomographs ( Fig. 26-8 ), particularly when morpho-logic abnormalities or erosive changes of the condylar head are sus-pected. The entire condylar head is visible in the mediolateral plane.
Computed Tomography CT provides more information about the three-dimensional shape and internal structure of the osseous components of the joint by providing detailed image slices and three-dimensional images. There are two CT devices available, conventional CT (sometimes referred to as medical CT, see Chapter 14 ) and CBCT. Both modalities can give excellent images of the osseous structures, but only conventional CT provides images of the surrounding soft tissues; however, this is only required in a minimal number of specifi c situations. CBCT has the advantage of reduced patient dose compared with medical CT and is likely to replace conventional tomography. In CBCT the patient is usually scanned in the closed position and low-resolution scans can be done in the open or other positions (see Chapter 13 ). Data from
the axial slices can be manipulated to produce (reformat) corrected lateral and frontal images of the TMJs (see Fig. 26-3 ). Panoramic and three-dimensional reformatted images also can be produced. These are useful for assessing osseous deformities of the jaws or surrounding structures. Conventional and CBCT cannot produce accurate images of the articular disk.
CT is also useful for determining the presence and extent of anky-losis and neoplasms and the degree of bone involvement in some arthritides, for imaging complex fractures, and for evaluating compli-cations from the use of polytetrafl uoroethylene or silicon sheet implants, such as erosions into the middle cranial fossa and hetero-topic bone growth.
SOFT TISSUE STRUCTURES
Soft tissue imaging is indicated when TMJ pain and dysfunction are present and when the clinical fi ndings suggest disk displacement along with symptoms that are unresponsive to conservative therapy. Imaging should be prescribed only when the anticipated results are expected to infl uence the treatment plan. Historically, arthrography was the fi rst imaging modality used to image the soft tissues of the joint.
Arthrography is a technique in which an indirect image of the disk is obtained by injecting a radiopaque contrast agent into the joint spaces under fl uoroscopic guidance. Magnetic resonance imaging (MRI) has replaced arthrography and is now the imaging technique of choice for the soft tissues of the TMJ. MRI can not only display the articular disk but also the surrounding soft tissue structures and also
FIG. 26-6 Panoramic images that revealed right condylar hyperplasia (A) and destruction of the condyle by a malignant tumor (B) (arrows).
A
B
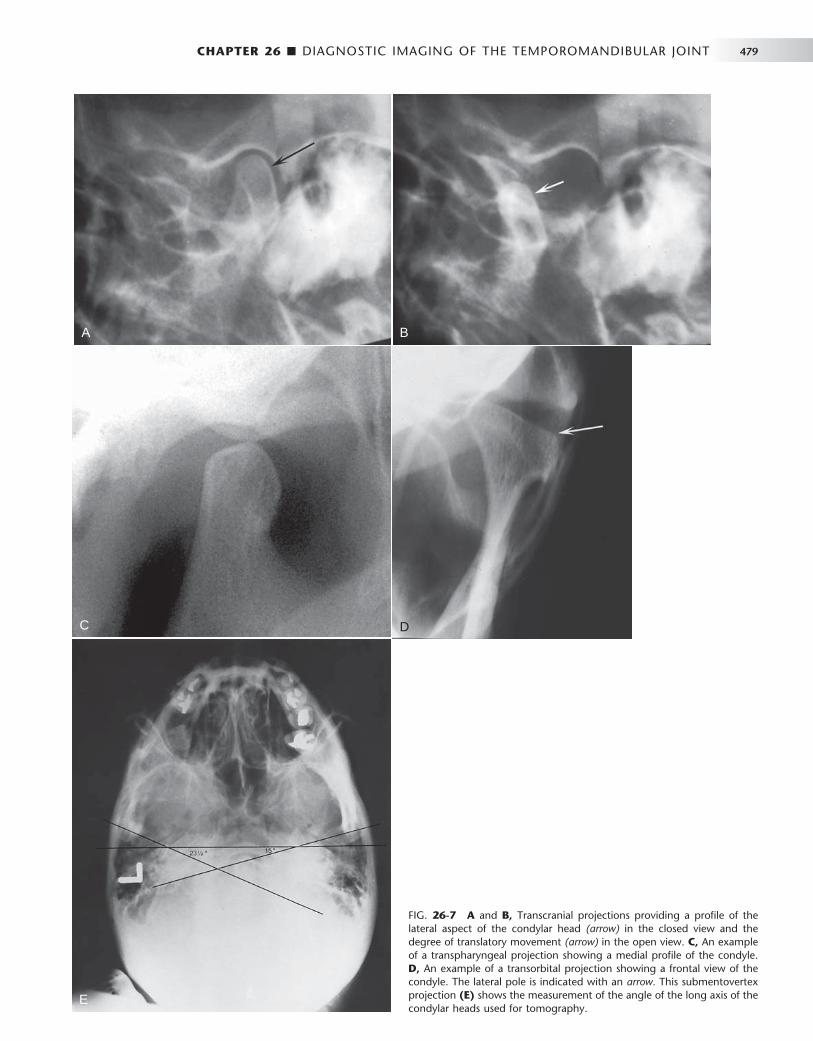
CHAPTER 26 ■ DIAGNOSTIC IMAGING OF THE TEMPOROMANDIBULAR JOINT 479
A B
C
E
D
FIG. 26-7 A and B, Transcranial projections providing a profi le of the lateral aspect of the condylar head (arrow) in the closed view and the degree of translatory movement (arrow) in the open view. C, An example of a transpharyngeal projection showing a medial profi le of the condyle. D, An example of a transorbital projection showing a frontal view of the condyle. The lateral pole is indicated with an arrow. This submentovertex projection (E) shows the measurement of the angle of the long axis of the condylar heads used for tomography.

480 PART V ■ RADIOGRAPHIC INTERPRETATION
can reveal the presence of joint effusion. MRI displays the osseous structures of the TMJ but not in the comparable detail seen in CT imaging. The technique is noninvasive and does not use ionizing radiation.
Magnetic Resonance Imaging MRI uses a magnetic fi eld and radiofrequency pulses rather than ion-izing radiation to produce multiple digital image slices (see Chapter 14 ). Because MRI can provide superb images of soft tissues, this tech-nique can be used for imaging the articular disk. MRI allows construc-tion of images in the sagittal and coronal planes without repositioning the patient ( Fig. 26-9 ). These images usually are acquired in open and closed mandibular positions with use of surface coils to improve image resolution. Sagittal slices should be oriented perpendicular to the condylar long axis. The examinations usually are performed with use of T1-weighted, proton-weighted, or T2-weighted pulse sequences. T1-weighted and proton-weighted images best demonstrate osseous and diskal tissues, whereas T2-weighted images demonstrate infl am-mation and joint effusion. Motion MRI studies during opening and closing can be obtained by having the patient open in a series of
FIG. 26-8 A, Sagittal tomograph through the mid region of the joint. B, Frontal tomographic image of the mandibular condyle.
A B
FIG. 26-9 MRI of a Normal Temporomandibu-lar Joint. A, Closed sagittal view showing the condyle and temporal component. The biconcave disk is located with its posterior band (arrow) over the condyle. B, Closed coronal view showing the osseous components and disk (arrows) superior to the condyle. (Courtesy Dr. Per-Lennart Westesson, Rochester, N.Y.)
A B
stepped distances and with use of rapid image acquisition ( “ fast scan ” ) techniques.
MRI is contraindicated in patients who are pregnant or who have pacemakers, intracranial vascular clips, or metal particles in vital structures. Some patients may not be able to tolerate the procedure because of claustrophobia or an inability to remain motionless.
Radiographic Abnormalities of the Temporomandibular Joint
DEVELOPMENTAL ABNORMALITIES
Developmental abnormalities may be broadly categorized as anoma-lies in the form and size of joint components. The most striking radiographic changes usually are seen in the condyle, although the temporal component also may be deformed, often remodeling to accommodate the abnormal condyle. Condylar articular cartilage is a mandibular growth site, and, as a result, developmental abnormalities at this location may manifest as altered growth on the affected side of
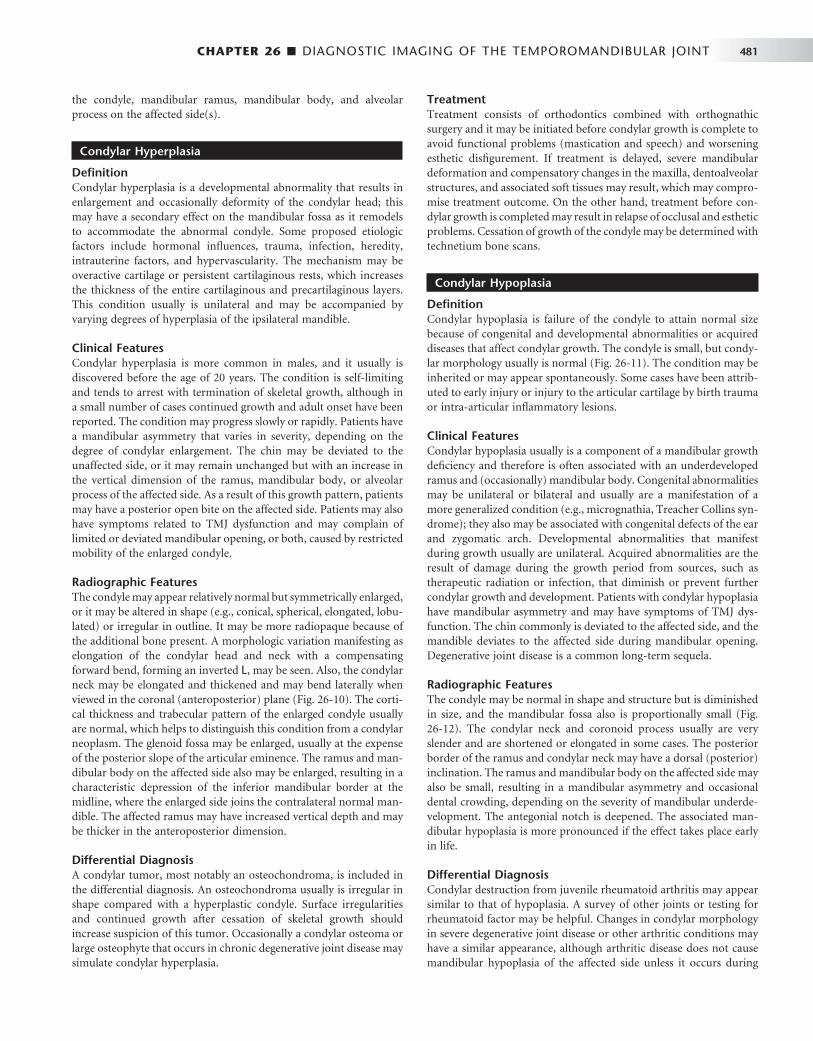
CHAPTER 26 ■ DIAGNOSTIC IMAGING OF THE TEMPOROMANDIBULAR JOINT 481
the condyle, mandibular ramus, mandibular body, and alveolar process on the affected side(s).
Condylar Hyperplasia
Defi nition Condylar hyperplasia is a developmental abnormality that results in enlargement and occasionally deformity of the condylar head; this may have a secondary effect on the mandibular fossa as it remodels to accommodate the abnormal condyle. Some proposed etiologic factors include hormonal infl uences, trauma, infection, heredity, intrauterine factors, and hypervascularity. The mechanism may be overactive cartilage or persistent cartilaginous rests, which increases the thickness of the entire cartilaginous and precartilaginous layers. This condition usually is unilateral and may be accompanied by varying degrees of hyperplasia of the ipsilateral mandible.
Clinical Features Condylar hyperplasia is more common in males, and it usually is discovered before the age of 20 years. The condition is self-limiting and tends to arrest with termination of skeletal growth, although in a small number of cases continued growth and adult onset have been reported. The condition may progress slowly or rapidly. Patients have a mandibular asymmetry that varies in severity, depending on the degree of condylar enlargement. The chin may be deviated to the unaffected side, or it may remain unchanged but with an increase in the vertical dimension of the ramus, mandibular body, or alveolar process of the affected side. As a result of this growth pattern, patients may have a posterior open bite on the affected side. Patients may also have symptoms related to TMJ dysfunction and may complain of limited or deviated mandibular opening, or both, caused by restricted mobility of the enlarged condyle.
Radiographic Features The condyle may appear relatively normal but symmetrically enlarged, or it may be altered in shape (e.g., conical, spherical, elongated, lobu-lated) or irregular in outline. It may be more radiopaque because of the additional bone present. A morphologic variation manifesting as elongation of the condylar head and neck with a compensating forward bend, forming an inverted L , may be seen. Also, the condylar neck may be elongated and thickened and may bend laterally when viewed in the coronal (anteroposterior) plane ( Fig. 26-10 ). The corti-cal thickness and trabecular pattern of the enlarged condyle usually are normal, which helps to distinguish this condition from a condylar neoplasm. The glenoid fossa may be enlarged, usually at the expense of the posterior slope of the articular eminence. The ramus and man-dibular body on the affected side also may be enlarged, resulting in a characteristic depression of the inferior mandibular border at the midline, where the enlarged side joins the contralateral normal man-dible. The affected ramus may have increased vertical depth and may be thicker in the anteroposterior dimension.
Differential Diagnosis A condylar tumor, most notably an osteochondroma, is included in the differential diagnosis. An osteochondroma usually is irregular in shape compared with a hyperplastic condyle. Surface irregularities and continued growth after cessation of skeletal growth should increase suspicion of this tumor. Occasionally a condylar osteoma or large osteophyte that occurs in chronic degenerative joint disease may simulate condylar hyperplasia.
Treatment Treatment consists of orthodontics combined with orthognathic surgery and it may be initiated before condylar growth is complete to avoid functional problems (mastication and speech) and worsening esthetic disfi gurement. If treatment is delayed, severe mandibular deformation and compensatory changes in the maxilla, dentoalveolar structures, and associated soft tissues may result, which may compro-mise treatment outcome. On the other hand, treatment before con-dylar growth is completed may result in relapse of occlusal and esthetic problems. Cessation of growth of the condyle may be determined with technetium bone scans.
Condylar Hypoplasia
Defi nition Condylar hypoplasia is failure of the condyle to attain normal size because of congenital and developmental abnormalities or acquired diseases that affect condylar growth. The condyle is small, but condy-lar morphology usually is normal ( Fig. 26-11 ). The condition may be inherited or may appear spontaneously. Some cases have been attrib-uted to early injury or injury to the articular cartilage by birth trauma or intra-articular infl ammatory lesions.
Clinical Features Condylar hypoplasia usually is a component of a mandibular growth defi ciency and therefore is often associated with an underdeveloped ramus and (occasionally) mandibular body. Congenital abnormalities may be unilateral or bilateral and usually are a manifestation of a more generalized condition (e.g., micrognathia, Treacher Collins syn-drome); they also may be associated with congenital defects of the ear and zygomatic arch. Developmental abnormalities that manifest during growth usually are unilateral. Acquired abnormalities are the result of damage during the growth period from sources, such as therapeutic radiation or infection, that diminish or prevent further condylar growth and development. Patients with condylar hypoplasia have mandibular asymmetry and may have symptoms of TMJ dys-function. The chin commonly is deviated to the affected side, and the mandible deviates to the affected side during mandibular opening. Degenerative joint disease is a common long-term sequela.
Radiographic Features The condyle may be normal in shape and structure but is diminished in size, and the mandibular fossa also is proportionally small ( Fig. 26-12 ). The condylar neck and coronoid process usually are very slender and are shortened or elongated in some cases. The posterior border of the ramus and condylar neck may have a dorsal (posterior) inclination. The ramus and mandibular body on the affected side may also be small, resulting in a mandibular asymmetry and occasional dental crowding, depending on the severity of mandibular underde-velopment. The antegonial notch is deepened. The associated man-dibular hypoplasia is more pronounced if the effect takes place early in life.
Differential Diagnosis Condylar destruction from juvenile rheumatoid arthritis may appear similar to that of hypoplasia. A survey of other joints or testing for rheumatoid factor may be helpful. Changes in condylar morphology in severe degenerative joint disease or other arthritic conditions may have a similar appearance, although arthritic disease does not cause mandibular hypoplasia of the affected side unless it occurs during
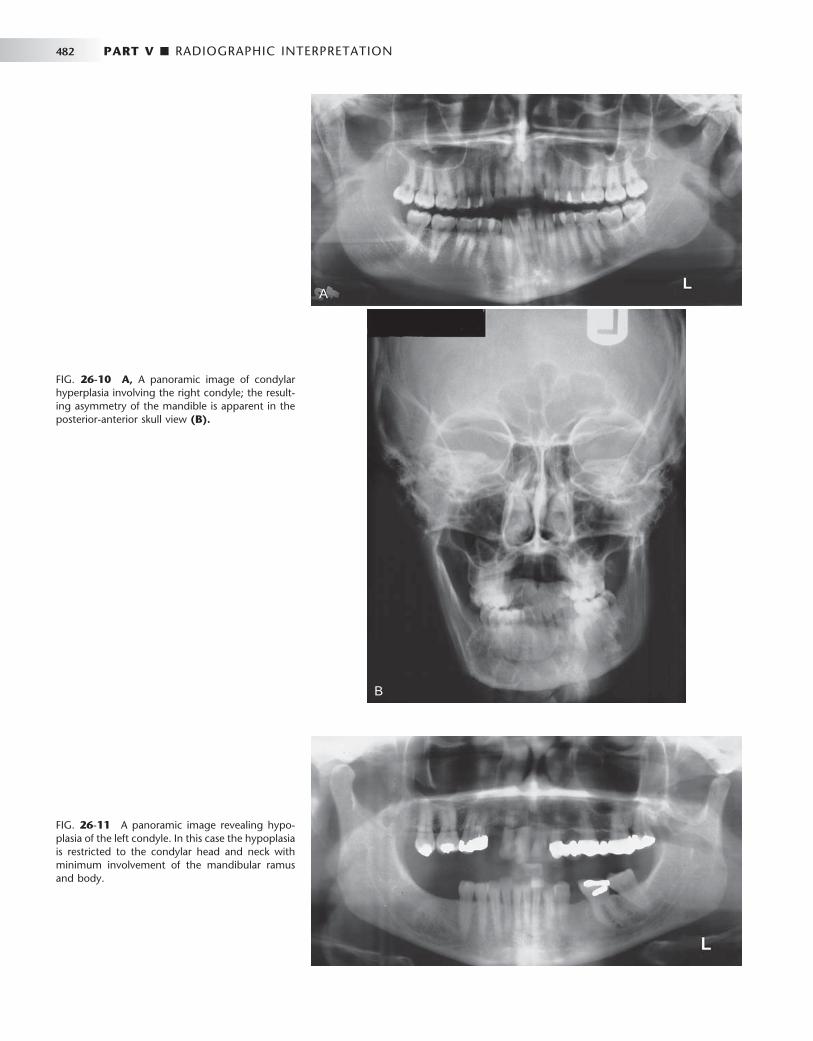
482 PART V ■ RADIOGRAPHIC INTERPRETATION
A
B
FIG. 26-10 A, A panoramic image of condylar hyperplasia involving the right condyle; the result-ing asymmetry of the mandible is apparent in the posterior-anterior skull view (B).
FIG. 26-11 A panoramic image revealing hypo-plasia of the left condyle. In this case the hypoplasia is restricted to the condylar head and neck with minimum involvement of the mandibular ramus and body.
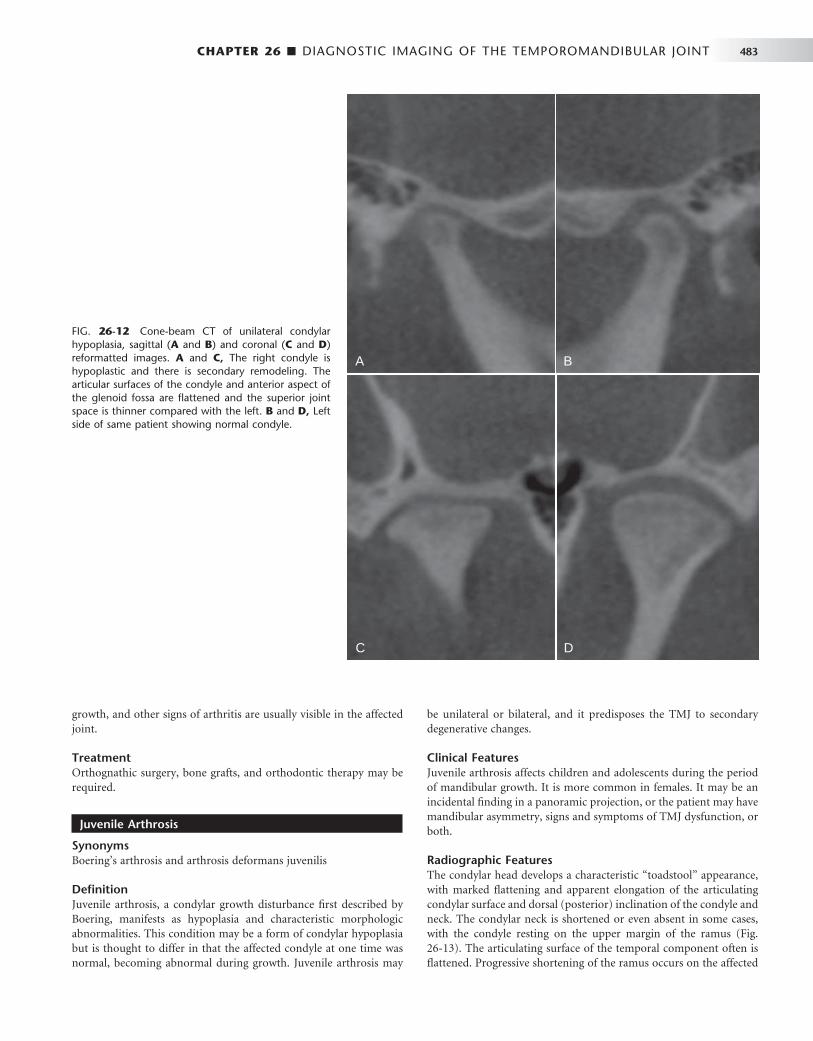
CHAPTER 26 ■ DIAGNOSTIC IMAGING OF THE TEMPOROMANDIBULAR JOINT 483
growth, and other signs of arthritis are usually visible in the affected joint.
Treatment Orthognathic surgery, bone grafts, and orthodontic therapy may be required.
Juvenile Arthrosis
Synonyms Boering ’ s arthrosis and arthrosis deformans juvenilis
Defi nition Juvenile arthrosis, a condylar growth disturbance fi rst described by Boering, manifests as hypoplasia and characteristic morphologic abnormalities. This condition may be a form of condylar hypoplasia but is thought to differ in that the affected condyle at one time was normal, becoming abnormal during growth. Juvenile arthrosis may
be unilateral or bilateral, and it predisposes the TMJ to secondary degenerative changes.
Clinical Features Juvenile arthrosis affects children and adolescents during the period of mandibular growth. It is more common in females. It may be an incidental fi nding in a panoramic projection, or the patient may have mandibular asymmetry, signs and symptoms of TMJ dysfunction, or both.
Radiographic Features The condylar head develops a characteristic “ toadstool ” appearance, with marked fl attening and apparent elongation of the articulating condylar surface and dorsal (posterior) inclination of the condyle and neck. The condylar neck is shortened or even absent in some cases, with the condyle resting on the upper margin of the ramus ( Fig. 26-13 ). The articulating surface of the temporal component often is fl attened. Progressive shortening of the ramus occurs on the affected
FIG. 26-12 Cone-beam CT of unilateral condylar hypoplasia, sagittal ( A and B ) and coronal ( C and D ) reformatted images. A and C, The right condyle is hypoplastic and there is secondary remodeling. The articular surfaces of the condyle and anterior aspect of the glenoid fossa are fl attened and the superior joint space is thinner compared with the left. B and D, Left side of same patient showing normal condyle.
A B
C D

484 PART V ■ RADIOGRAPHIC INTERPRETATION
side, and the antegonial notch may be deepened, indicating mandibu-lar hypoplasia. In long-standing cases, superimposed degenerative changes may be present.
Differential Diagnosis The radiographic appearance of juvenile arthrosis may be very similar to, and in some cases is indistinguishable from, developmental hypo-plasia of the condyle. Destruction of the anterior aspect of the con-dylar head from rheumatoid arthritis and severe degenerative joint disease or severe condylar degeneration after orthognathic surgery or joint surgery also may simulate juvenile arthrosis.
Treatment Orthognathic surgery and orthodontic therapy may be required to correct the mandibular asymmetry. Caution should be exercised in
FIG. 26-13 Panoramic Image of Juvenile Arthrosis. The condylar heads have a “ toadstool ” appearance and are posteriorly inclined. The con-dylar necks are absent.
FIG. 26-14 Sagittal Tomogram of Coronoid Hyperplasia. The coronoid process is elongated and extends above the inferior rim of the zygomatic arch (arrow) but otherwise is shaped normally.
undertaking orthodontic therapy because stress on the joint may result in further degeneration and orthodontic relapse.
Coronoid Hyperplasia
Defi nition Coronoid process hyperplasia may be acquired or developmental, resulting in elongation of the coronoid process. In the developmental variant, the condition usually is bilateral. Acquired types may be uni-lateral or bilateral and usually are a response to restricted condylar movement caused by abnormalities such as ankylosis.
Clinical Features Bilateral developmental coronoid hyperplasia is more common in males, often commencing at the onset of puberty, although the condi-tion was reported in a 3-year-old child. Patients complain of a pro-gressive inability to open the mouth and may have an apparent closed lock. The condition is painless.
Radiographic Features Coronoid hyperplasia is best seen in panoramic, Waters, and lateral tomographic views and on CT scans. The coronoid processes are elongated, and the tips extend at least 1 cm above the inferior rim of the zygomatic arch ( Fig. 26-14 ). As a result, the coronoid processes may impinge on the medial surface of the zygomatic arch during opening, restricting condylar translation. This can be confi rmed by using CT imaging ( Fig. 26-15 ). The coronoid processes may have a large but normal shape or may curve anteriorly and may appear very radiopaque. The posterior surface of the zygomatic process of the maxilla may be remodeled to accommodate the enlarged coronoid process during function. The radiographic appearance of the TMJs usually is normal.
Differential Diagnosis Unilateral cases should be differentiated from a tumor of the coronoid process such as an osteochondroma or osteoma. Unlike coronoid hyperplasia, tumors usually have an irregular shape. The differential diagnosis also includes any cause of inability to open, such as soft tissue abnormalities and ankylosis, emphasizing the importance of including the coronoid process in images of the TMJs. An axial CT image with the patient in a wide open position is useful in establishing coronoid interference to opening.

CHAPTER 26 ■ DIAGNOSTIC IMAGING OF THE TEMPOROMANDIBULAR JOINT 485
Treatment Treatment consists of surgical removal of the coronoid process and postoperative physiotherapy. Regrowth of the coronoid process after surgery has been reported.
Bifi d Condyle
Defi nition A bifi d condyle has a vertical depression, notch, or deep cleft in the center of the condylar head, seen in the frontal or sagittal plane, or actual duplication of the condyle, resulting in the appearance of a “ double ” or “ bifi d ” condylar head. This condition is rare and is more often unilateral, although it may be bilateral. It may result from an obstructed blood supply or other embryopathy, although a traumatic
cause has been postulated as a result of a longitudinal linear fracture of the condyle.
Clinical Features Bifi d condyle usually is an incidental fi nding in panoramic views or anteroposterior projections. Some patients have signs and symptoms of temporomandibular dysfunction, including joint noises and pain.
Radiographic Features A depression or notch is present on the superior condylar surface, giving the anteroposterior silhouette a heart shape; in more severe cases a duplicate condylar head is present in the mediolateral plane ( Fig. 26-16 ). The orientation of the bifi d condyle may be anteropos-terior or mediolateral. The mandibular fossa may remodel to accom-modate the altered condylar morphology.
FIG. 26-15 Two axial CT images taken in the closed mouth (A) and open mouth (B) positions showing impingement of hyperplastic coronoid processes with the medial aspect of the zygomatic arch (arrows). Note the hyperostosis on the medial surface of the zygomatic process at the point of impingement.
A B
A B
FIG. 26-16 Bifi d Condyle. A, Sagittal tomogram showing a deep central notch with duplication of the condylar head (arrows). The glenoid fossa has remodeled (enlarged) to accommodate the abnor-mal condyle. B, Coronal tomogram showing a depression in the center of the condylar head.

486 PART V ■ RADIOGRAPHIC INTERPRETATION
Differential Diagnosis A slight medial depression on the superior condylar surface may be considered a normal variation; the point at which the depth of the depression signifi es a bifi d condyle is unclear. The differential diag-nosis also includes a vertical fracture through the condylar head.
Treatment Treatment is not indicated unless pain or functional impairment is present.
SOFT TISSUE ABNORMALITIES
Internal Derangements
Defi nition An internal derangement is an abnormality in the position and some-times the morphology of the articular disk that may interfere with normal function. The disk most often is displaced in an anterior direc-tion, but it may be displaced anteromedially, medially, or anterolater-ally. Lateral and posterior displacements are extremely rare. Some hypothesize that disk displacements may be considered a normal variation on the basis of the frequency of this fi nding in asymptomatic patients. The cause of internal derangements is unknown, although parafunction, jaw injuries (e.g., direct trauma), whiplash injury, and forced opening beyond the normal range have been implicated.
Internal derangements can be diagnosed by MRI. In some instances the disk may resume a normal position with respect to the condyle (called reduction of the disk) during mandibular opening; when the disk remains displaced throughout the entire range of mandibular
movement, the term nonreduction is used ( Fig. 26-17 ). A long-standing displaced disk may become deformed, losing its normal biconcave shape, and it may become thickened and fi brotic. Possible complications are degenerative joint disease and perforation through the disk or (more commonly) the posterior attachment.
Clinical Features Disk displacement has been found both in symptomatic patients and in healthy volunteers, suggesting that it may be a normal variant and not necessarily a predisposing factor in TMJ dysfunction. It is not known why some disks remain displaced or why symptoms of pain and dysfunction are not found in all affected patients. Symptomatic patients may have a decreased range of mandibular motion. Internal derangements can be unilateral or bilateral; unilateral cases may mani-fest clinically as mandibular deviation to the affected side on opening. Joint noises are common and may manifest as a click as the disk reduces to a normal position during mandibular opening and occa-sionally as a softer click as the disk becomes displaced again during mandibular closing. Noises may be absent in long-term displaced, nonreducing disks, or crepitus may be heard. Patients may complain of pain in the preauricular region or headaches and may have episodes of closed or open locking of the joint. Patients may have to manipulate the mandible to open it fully past an apparent closed lock by applying medially directed pressure to the affected joint or mandible with the hand.
Radiographic Features The disk cannot be visualized with conventional radiography or tomography; MRI is the technique of choice. Although a retruded
FIG. 26-17 Position and movement of the disk during jaw opening. Normal position (A), mildly displaced anteriorly (with reduc-tion, B ), and severely displaced anteriorly (without reduction, C ). (Courtesy Dr. W. K. Solberg, Los Angeles, Calif.)
Normal position Partially displaced Fully displaced
Click!
A B C
Locking
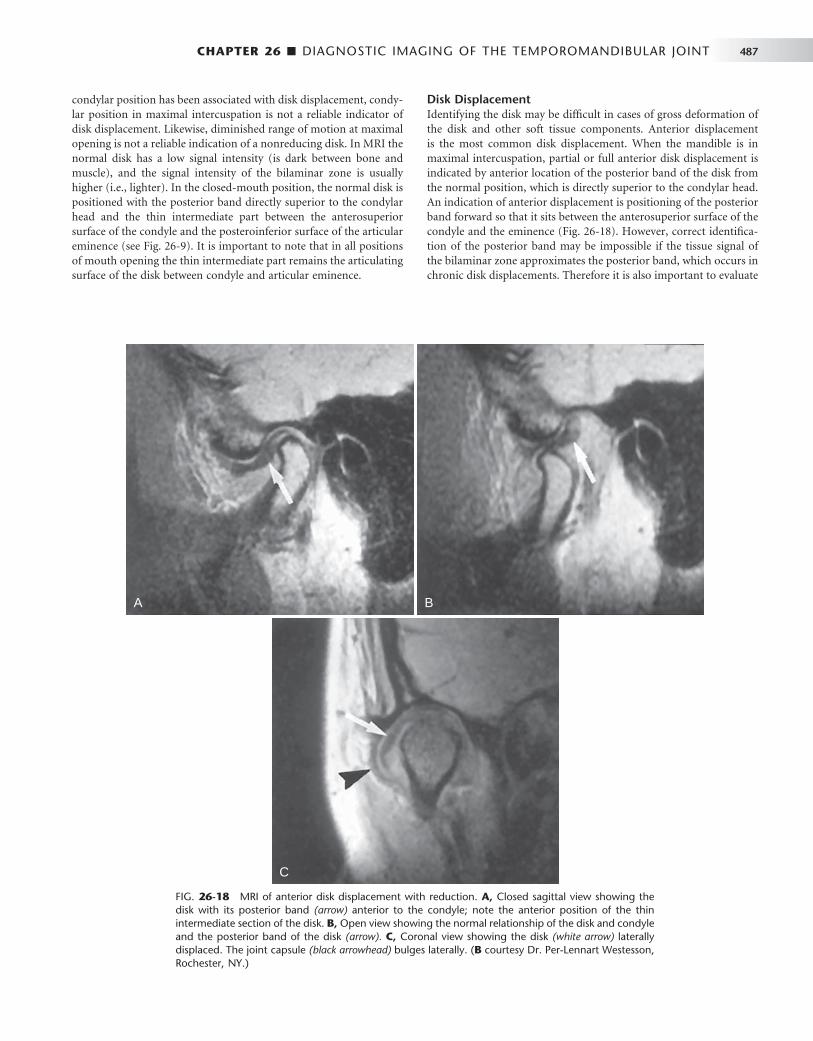
CHAPTER 26 ■ DIAGNOSTIC IMAGING OF THE TEMPOROMANDIBULAR JOINT 487
condylar position has been associated with disk displacement, condy-lar position in maximal intercuspation is not a reliable indicator of disk displacement. Likewise, diminished range of motion at maximal opening is not a reliable indication of a nonreducing disk. In MRI the normal disk has a low signal intensity (is dark between bone and muscle), and the signal intensity of the bilaminar zone is usually higher (i.e., lighter). In the closed-mouth position, the normal disk is positioned with the posterior band directly superior to the condylar head and the thin intermediate part between the anterosuperior surface of the condyle and the posteroinferior surface of the articular eminence (see Fig. 26-9 ). It is important to note that in all positions of mouth opening the thin intermediate part remains the articulating surface of the disk between condyle and articular eminence.
Disk Displacement Identifying the disk may be diffi cult in cases of gross deformation of the disk and other soft tissue components. Anterior displacement is the most common disk displacement. When the mandible is in maximal intercuspation, partial or full anterior disk displacement is indicated by anterior location of the posterior band of the disk from the normal position, which is directly superior to the condylar head. An indication of anterior displacement is positioning of the posterior band forward so that it sits between the anterosuperior surface of the condyle and the eminence ( Fig. 26-18 ). However, correct identifi ca-tion of the posterior band may be impossible if the tissue signal of the bilaminar zone approximates the posterior band, which occurs in chronic disk displacements. Therefore it is also important to evaluate
FIG. 26-18 MRI of anterior disk displacement with reduction. A, Closed sagittal view showing the disk with its posterior band (arrow) anterior to the condyle; note the anterior position of the thin intermediate section of the disk. B, Open view showing the normal relationship of the disk and condyle and the posterior band of the disk (arrow). C, Coronal view showing the disk (white arrow) laterally displaced. The joint capsule (black arrowhead) bulges laterally. ( B courtesy Dr. Per-Lennart Westesson, Rochester, NY.)
A B
C

488 PART V ■ RADIOGRAPHIC INTERPRETATION
the position of the thin intermediate part of the disk, which should be adjacent to the anterosuperior part of the condyle. Anteromedial displacement is indicated in sagittal image slices when the disk is in a normal position in the medial images of the joint but anteriorly posi-tioned in the lateral images of the same joint. Medial or lateral dis-placement is indicated in MRI coronal images when the body of the disk is positioned at the medial aspect of the condyle ( Fig. 26-18 ). Posterior disk displacement is rare.
Disk Reduction and Nonreduction During mouth opening, an anteriorly displaced disk may reduce to a normal relationship with the condylar head during any part of the opening movement. In motion studies, this is usually a rapid posterior
movement of the disk and it is often accompanied by an audible click. This is referred to as disk reduction and can be diagnosed if the disk is in a normal position in the open mouth magnetic resonance images (see Fig. 26-18 ).
If the disk remains anteriorly displaced (nonreduction) on opening, it may bend or deform as the condyle pushes against it ( Fig. 26-19 ). If the disk remains displaced, it will undergo permanent deformation, losing its biconcave shape. The nonreduced disk is readily seen on MRI scans, although fi brotic changes of the bilaminar zone may alter its tissue signal to approximate the signal of the disk and thus make identifi cation of the disk itself diffi cult. In such cases the disk may be erroneously interpreted as occupying a normal position at maximal opening.
FIG. 26-19 MRI of disk displacement without reduction in the presence of joint effusion. A, The disk (arrow) is anteriorly displaced in this closed T1-weighted image. B, A T2-weighted image of the same section shows the collection of joint effusion (arrowheads) in the anterior recess of the upper joint space. C, Open T1-weighted image showing the disk remains anterior to the condyle. The posterior band of the disk is indicated with an arrow. D, This T2-weighted image is at the same level as C. Note the joint effusion (arrowheads) in the anterior and posterior recesses of the upper joint space. (Courtesy Dr. Per-Lennart Westesson, Rochester, N.Y.)
A B
C D

CHAPTER 26 ■ DIAGNOSTIC IMAGING OF THE TEMPOROMANDIBULAR JOINT 489
Perforation and Deformities Perforations between the superior and inferior joint spaces most com-monly occur in the retrodiskal tissue, just behind the posterior band of the disk ( Fig. 26-20, C ) and can be detected in arthrographic inves-tigations but are not reliably detected with MRI. MRI can indicate alteration in the normal biconcave outline of the disk, which may vary from enlargement of the posterior band to a bilinear or biconvex disk outline. Disk deformities may be accompanied by changes in its signal intensity, sometimes an increase in signal. Changes to the condyle and temporal component of the joint consistent with degenerative joint disease often accompany cases with long-standing displaced disks ( Fig. 26-20 ).
Fibrous Adhesions and Effusion Fibrous adhesions are masses of fi brous tissue or scar tissue that form in the joint space, particularly after TMJ surgery. Adhesions are best identifi ed with arthrography by resistance to injection of contrast agent or they may be detected in MRI studies as tissue with low signal intensity. The pressure of injected contrast agent may tear some of these adhesions, resulting in increased joint mobility after the proce-dure. Joint effusion (fl uid in the joint) is considered to be an early change that may precede degenerative joint disease. MRI can detect joint effusion, which presents as an area of high-signal intensity in the joint spaces in T2-weighted images (see Fig. 26-19 ).
Remodeling and Arthritic Conditions
Remodeling
Defi nition Remodeling is an adaptive response of cartilage and osseous tissue to forces applied to the joint that may be excessive, resulting in alteration of the shape of the condyle and articular eminence. This adaptive response may result in fl attening of curved joint surfaces, which effec-tively distributes forces over a greater surface area. The number of trabeculae also increases, increasing the density of subchondral can-cellous bone (sclerosis) to better resist applied forces. No destruction or degeneration of articular soft tissues occurs. TMJ remodeling occurs throughout adult life and is considered abnormal only if it is accompanied by clinical signs and symptoms of pain or dysfunction or if the degree of remodeling seen radiographically is judged to be severe. Remodeling may be unilateral and does not invariably serve as a precursor to degenerative joint disease.
Clinical Features Remodeling may be asymptomatic, or patients may have signs and symptoms of temporomandibular dysfunction that may be related to the soft tissue components, associated muscles, or ligaments. Accom-panying internal derangement of the disk may be a factor.
FIG. 26-20 Sagittal MRI of several cases of anteriorly displaced disks (arrows) with various stages of degenerative joint disease. A, An example of severe deformation of the disk and an increase in the tissue signal. B, Severe erosions of the superior aspect of the condyle. C, Erosions involving the condyle and a small osteophyte on the ante-rior aspect. D, An example of osteophytes forming on both the anterior and posterior surfaces of the condyle.
A B
C
D

490 PART V ■ RADIOGRAPHIC INTERPRETATION
Radiographic Features Radiographic changes may affect the condyle, temporal component, or both; they fi rst occur on the anterosuperior surface of the condyle and the posterior slope of the articular eminence. The lateral aspect of the joint is affected in early stages, and the central and medial aspects become involved as remodeling progresses. The radiographic appearance may include one or a combination of the following: fl at-tening, cortical thickening of articulating surfaces, and subchondral sclerosis ( Fig. 26-21 ).
Differential Diagnosis Severe joint fl attening and subchondral sclerosis may be diffi cult to differentiate from early degenerative joint disease. It is known that the microscopic changes of degeneration occur before they can be detected radiographically. The radiographic appearance of bone erosions, osteophytes, and loss of joint space are signs signifying degenerative joint disease.
Treatment When no clinical signs or symptoms are present, treatment is not indicated. Otherwise, treatment directed to relieve stress on the joint, such as splint therapy, may be considered. This should be preceded by an attempt to discover the cause of the joint stress.
Degenerative Joint Disease
Synonym Osteoarthritis
Defi nition Degenerative joint disease (DJD) is a noninfl ammatory disorder of joints characterized by joint deterioration and proliferation. Joint deterioration is characterized by loss of articular cartilage and bone erosion. The proliferative compon ent is characterized by new bone formation at the articular surface and in the subchondral region. Usually a variable combination of deterioration and proliferation occurs, but occasionally one aspect predominates; deterioration is more common in acute disease, and proliferation predominates in chronic disease. DJD is thought to occur when the ability of the joint
to adapt to excessive forces (remodel) is exceeded. The etiology of DJD is unknown, although a number of factors may be important, includ-ing acute trauma, hypermobility, and loading of the joint such as occurs in parafunction. Internal disk derangements may be contribut-ing etiologic factors, but this theory is controversial.
Clinical Features DJD can occur at any age, although the incidence increases with age. DJD has a female preponderance. The disease may be asymptomatic, or patients may complain of signs and symptoms of TMJ dysfunction, including pain on palpation and movement, joint noises (crepitus), limited range of motion, and muscle spasm. The onset of symptoms may be sudden or gradual, and symptoms may disappear spontane-ously, only to return in recurring cycles. Some studies report that the disease eventually “ burns out ” and symptoms disappear or markedly decrease in severity in long-standing cases.
Radiographic Features Osseous changes in DJD are more accurately depicted in CT images, but gross osseous changes may be evident in MRI studies, particularly in T1-weighted images. When the patient is in maximal intercuspa-tion, the joint space may be narrow or absent, which often correlates with an internal derangement and frequently with a perforation of the disk or posterior attachment, resulting in bone-to-bone contact of the joint components. Signs of previous remodeling, such as fl at-tening and subchondral sclerosis, may be evident, although degenera-tive changes may obscure these fi ndings. Loss of cortex or erosions of the articulating surfaces of the condyle or temporal component (or both) are characteristic of this disease ( Fig. 26-22 ). In some cases small, round, radiolucent areas with irregular margins surrounded by a varying area of increased density are visible deep to the articulating surfaces. These lesions are called “ Ely ” or subchondral bone cysts but are not true cysts; they are areas of degeneration that contain fi brous tissue, granulation tissue, and osteoid ( Fig. 26-22 ).
Later in the course of the disease, bony proliferation occurs at the periphery of the articulating surface, increasing the articulating surface area. This new bone is called an osteophyte, which typically appears on the anterosuperior surface of the condyle, the lateral aspect
FIG. 26-21 Cone-beam CT, sagittal (A) and coronal (B) reformat images of the right TMJ showing remodeling. A, The right temporal component shows subchondral sclerosis and fl attening (arrow). B, The right condyle shows mild fl attening of the lateral aspect and subchondral sclerosis of the medial aspect (arrow). The right temporal component is also fl attened (arrowhead). C, A cadaver specimen. Note the fl attening of the temporal component (black arrows) and large perforation posterior to a residual deformed disk (white arrow).
A B C
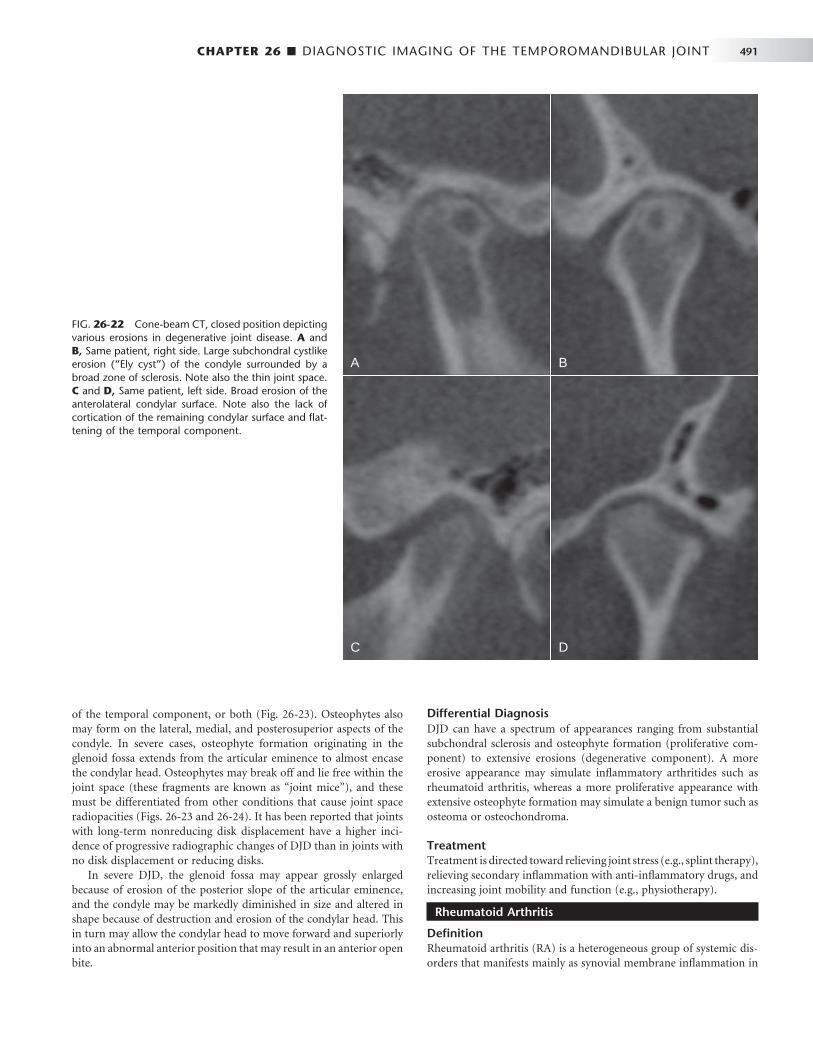
CHAPTER 26 ■ DIAGNOSTIC IMAGING OF THE TEMPOROMANDIBULAR JOINT 491
of the temporal component, or both ( Fig. 26-23 ). Osteophytes also may form on the lateral, medial, and posterosuperior aspects of the condyle. In severe cases, osteophyte formation originating in the glenoid fossa extends from the articular eminence to almost encase the condylar head. Osteophytes may break off and lie free within the joint space (these fragments are known as “ joint mice ” ), and these must be differentiated from other conditions that cause joint space radiopacities ( Figs. 26-23 and 26-24 ). It has been reported that joints with long-term nonreducing disk displacement have a higher inci-dence of progressive radiographic changes of DJD than in joints with no disk displacement or reducing disks.
In severe DJD, the glenoid fossa may appear grossly enlarged because of erosion of the posterior slope of the articular eminence, and the condyle may be markedly diminished in size and altered in shape because of destruction and erosion of the condylar head. This in turn may allow the condylar head to move forward and superiorly into an abnormal anterior position that may result in an anterior open bite.
Differential Diagnosis DJD can have a spectrum of appearances ranging from substantial subchondral sclerosis and osteophyte formation (proliferative com-ponent) to extensive erosions (degenerative component). A more erosive appearance may simulate infl ammatory arthritides such as rheumatoid arthritis, whereas a more proliferative appearance with extensive osteophyte formation may simulate a benign tumor such as osteoma or osteochondroma.
Treatment Treatment is directed toward relieving joint stress (e.g., splint therapy), relieving secondary infl ammation with anti-infl ammatory drugs, and increasing joint mobility and function (e.g., physiotherapy).
Rheumatoid Arthritis
Defi nition Rheumatoid arthritis (RA) is a heterogeneous group of systemic dis-orders that manifests mainly as synovial membrane infl ammation in
FIG. 26-22 Cone-beam CT, closed position depicting various erosions in degenerative joint disease. A and B, Same patient, right side. Large subchondral cystlike erosion ( “ Ely cyst ” ) of the condyle surrounded by a broad zone of sclerosis. Note also the thin joint space. C and D, Same patient, left side. Broad erosion of the anterolateral condylar surface. Note also the lack of cortication of the remaining condylar surface and fl at-tening of the temporal component.
A B
C D
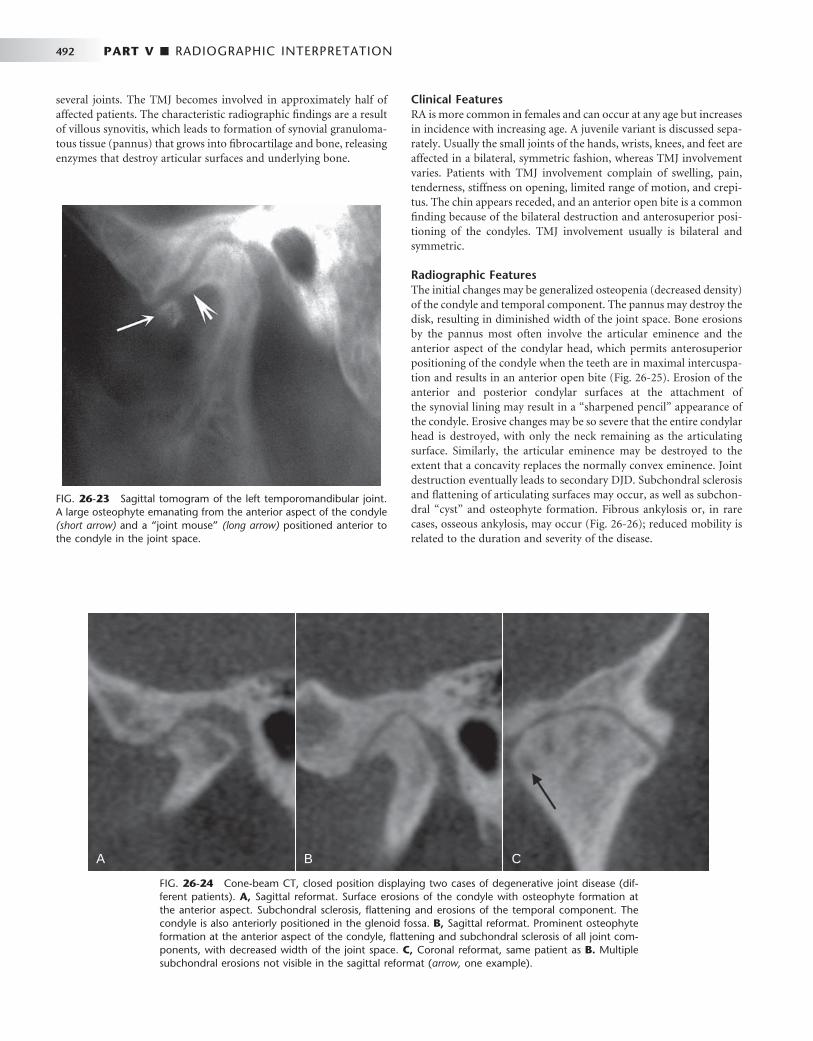
492 PART V ■ RADIOGRAPHIC INTERPRETATION
Clinical Features RA is more common in females and can occur at any age but increases in incidence with increasing age. A juvenile variant is discussed sepa-rately. Usually the small joints of the hands, wrists, knees, and feet are affected in a bilateral, symmetric fashion, whereas TMJ involvement varies. Patients with TMJ involvement complain of swelling, pain, tenderness, stiffness on opening, limited range of motion, and crepi-tus. The chin appears receded, and an anterior open bite is a common fi nding because of the bilateral destruction and anterosuperior posi-tioning of the condyles. TMJ involvement usually is bilateral and symmetric.
Radiographic Features The initial changes may be generalized osteopenia (decreased density) of the condyle and temporal component. The pannus may destroy the disk, resulting in diminished width of the joint space. Bone erosions by the pannus most often involve the articular eminence and the anterior aspect of the condylar head, which permits anterosuperior positioning of the condyle when the teeth are in maximal intercuspa-tion and results in an anterior open bite ( Fig. 26-25 ). Erosion of the anterior and posterior condylar surfaces at the attachment of the synovial lining may result in a “ sharpened pencil ” appearance of the condyle. Erosive changes may be so severe that the entire condylar head is destroyed, with only the neck remaining as the articulating surface. Similarly, the articular eminence may be destroyed to the extent that a concavity replaces the normally convex eminence. Joint destruction eventually leads to secondary DJD. Subchondral sclerosis and fl attening of articulating surfaces may occur, as well as subchon-dral “ cyst ” and osteophyte formation. Fibrous ankylosis or, in rare cases, osseous ankylosis, may occur ( Fig. 26-26 ); reduced mobility is related to the duration and severity of the disease.
FIG. 26-23 Sagittal tomogram of the left temporomandibular joint. A large osteophyte emanating from the anterior aspect of the condyle (short arrow) and a “ joint mouse ” (long arrow) positioned anterior to the condyle in the joint space.
FIG. 26-24 Cone-beam CT, closed position displaying two cases of degenerative joint disease (dif-ferent patients). A, Sagittal reformat. Surface erosions of the condyle with osteophyte formation at the anterior aspect. Subchondral sclerosis, fl attening and erosions of the temporal component. The condyle is also anteriorly positioned in the glenoid fossa. B, Sagittal reformat. Prominent osteophyte formation at the anterior aspect of the condyle, fl attening and subchondral sclerosis of all joint com-ponents, with decreased width of the joint space. C, Coronal reformat, same patient as B. Multiple subchondral erosions not visible in the sagittal reformat ( arrow, one example).
A B C
several joints. The TMJ becomes involved in approximately half of affected patients. The characteristic radiographic fi ndings are a result of villous synovitis, which leads to formation of synovial granuloma-tous tissue (pannus) that grows into fi brocartilage and bone, releasing enzymes that destroy articular surfaces and underlying bone.

CHAPTER 26 ■ DIAGNOSTIC IMAGING OF THE TEMPOROMANDIBULAR JOINT 493
Differential Diagnosis The differential diagnosis includes severe DJD and psoriatic arthritis. Osteopenia and severe erosions, particularly of the articular eminence, are more characteristic of RA. Psoriatic arthritis may be ruled out by the patient ’ s history.
Treatment Treatment is directed toward pain relief (analgesics), reduction or suppression of infl ammation (nonsteroidal anti-infl ammatory drugs, gold salts, corticosteroids), and preservation of muscle and joint func-tion (physiotherapy). Joint replacement surgery may be necessary in patients with severe joint destruction.
Juvenile Arthritis Synonyms
Juvenile rheumatoid arthritis, juvenile chronic arthritis, and Still ’ s disease
Defi nition Juvenile arthritis (JA), formerly called juvenile rheumatoid arthritis and juvenile chronic arthritis, is a chronic infl ammatory disease that appears before the age of 16 years (the mean age is 5 years). It is characterized by chronic, intermittent synovial infl ammation that results in synovial hypertrophy, joint effusion, and swollen, painful joints. As the disease progresses, cartilage and bone are destroyed. Rheumatoid factor may be absent, hence the preferred terminology of JA rather than juvenile rheumatoid arthritis. JA differs from adult RA in that it has an earlier onset, and systemic involvement usually is more severe. TMJ involvement occurs in approximately 40% of patients and may be unilateral or bilateral.
Clinical Features The patient usually has pain and tenderness in the affected joint or joints, although the disease can be asymptomatic. Unilateral onset is common, but contralateral involvement may occur as the disease pro-gresses. Severe TMJ involvement results in inhibition of mandibular growth. Affected patients may have micrognathia and posteroinferior chin rotation, resulting in a facial appearance known as “ bird face, ” which may also be accompanied by an anterior open bite. The degree of micrognathia is proportional to the severity of joint involvement and the early onset of disease. Additionally, when only one TMJ is involved or if one side is more severely affected, the patient may have a mandibular asymmetry with the chin deviated to the affected side.
Radiographic Features Osteopenia (decreased density) of the affected TMJ components may be the only initial radiographic fi nding. Radiographic fi ndings are similar to those for the adult form except for the addition of impaired mandibular growth. Erosions may extend to the mandibular fossa, and the articular eminence may be destroyed. Similarly, erosion of the anterior or superior aspect of the condyle may occur, and in more severe cases only a pencil-shaped small condyle remains; the condyle may be destroyed. Because the infl ammation is intermittent, during quiescent periods the cortex of the joint surfaces may reappear, and the surfaces will appear fl attened. As a result of bone destruction, the condylar head typically is positioned anterosuperiorly in the man-dibular fossa ( Fig. 26-27 ). Hypomobility at maximal opening is common, and fi brous ankylosis may occur in some cases. Secondary degenerative changes manifesting as sclerosis and osteophyte forma-tion may be superimposed on the rheumatoid changes, and ankylosis may occur. An abnormal disk shape is often observed in patients with long-term TMJ involvement. Manifestations of inhibited mandibular
FIG. 26-25 Rheumatoid arthritis. A, Lateral cephalometric view illustrating a steep mandibular plane and anterior open bite. B, Lateral tomogram (closed position) illustrating a large erosion of the antero-superior condylar head accompanied by severe erosions of the temporal component, including the articular eminence.
A B
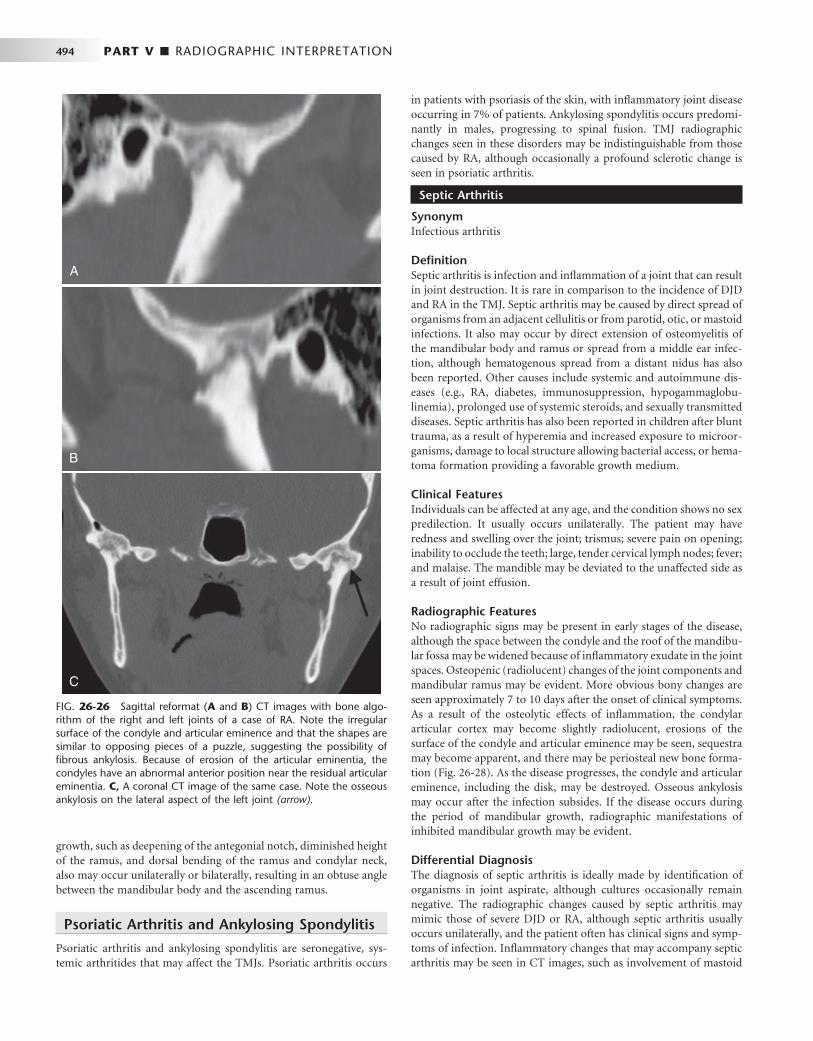
494 PART V ■ RADIOGRAPHIC INTERPRETATION
growth, such as deepening of the antegonial notch, diminished height of the ramus, and dorsal bending of the ramus and condylar neck, also may occur unilaterally or bilaterally, resulting in an obtuse angle between the mandibular body and the ascending ramus.
Psoriatic Arthritis and Ankylosing Spondylitis
Psoriatic arthritis and ankylosing spondylitis are seronegative, sys-temic arthritides that may affect the TMJs. Psoriatic arthritis occurs
in patients with psoriasis of the skin, with infl ammatory joint disease occurring in 7% of patients. Ankylosing spondylitis occurs predomi-nantly in males, progressing to spinal fusion. TMJ radiographic changes seen in these disorders may be indistinguishable from those caused by RA, although occasionally a profound sclerotic change is seen in psoriatic arthritis.
Septic Arthritis
Synonym Infectious arthritis
Defi nition Septic arthritis is infection and infl ammation of a joint that can result in joint destruction. It is rare in comparison to the incidence of DJD and RA in the TMJ. Septic arthritis may be caused by direct spread of organisms from an adjacent cellulitis or from parotid, otic, or mastoid infections. It also may occur by direct extension of osteomyelitis of the mandibular body and ramus or spread from a middle ear infec-tion, although hematogenous spread from a distant nidus has also been reported. Other causes include systemic and autoimmune dis-eases (e.g., RA, diabetes, immunosuppression, hypogammaglobu-linemia), prolonged use of systemic steroids, and sexually transmitted diseases. Septic arthritis has also been reported in children after blunt trauma, as a result of hyperemia and increased exposure to microor-ganisms, damage to local structure allowing bacterial access, or hema-toma formation providing a favorable growth medium.
Clinical Features Individuals can be affected at any age, and the condition shows no sex predilection. It usually occurs unilaterally. The patient may have redness and swelling over the joint; trismus; severe pain on opening; inability to occlude the teeth; large, tender cervical lymph nodes; fever; and malaise. The mandible may be deviated to the unaffected side as a result of joint effusion.
Radiographic Features No radiographic signs may be present in early stages of the disease, although the space between the condyle and the roof of the mandibu-lar fossa may be widened because of infl ammatory exudate in the joint spaces. Osteopenic (radiolucent) changes of the joint components and mandibular ramus may be evident. More obvious bony changes are seen approximately 7 to 10 days after the onset of clinical symptoms. As a result of the osteolytic effects of infl ammation, the condylar articular cortex may become slightly radiolucent, erosions of the surface of the condyle and articular eminence may be seen, sequestra may become apparent, and there may be periosteal new bone forma-tion ( Fig. 26-28 ). As the disease progresses, the condyle and articular eminence, including the disk, may be destroyed. Osseous ankylosis may occur after the infection subsides. If the disease occurs during the period of mandibular growth, radiographic manifestations of inhibited mandibular growth may be evident.
Differential Diagnosis The diagnosis of septic arthritis is ideally made by identifi cation of organisms in joint aspirate, although cultures occasionally remain negative. The radiographic changes caused by septic arthritis may mimic those of severe DJD or RA, although septic arthritis usually occurs unilaterally, and the patient often has clinical signs and symp-toms of infection. Infl ammatory changes that may accompany septic arthritis may be seen in CT images, such as involvement of mastoid
FIG. 26-26 Sagittal reformat ( A and B ) CT images with bone algo-rithm of the right and left joints of a case of RA. Note the irregular surface of the condyle and articular eminence and that the shapes are similar to opposing pieces of a puzzle, suggesting the possibility of fi brous ankylosis. Because of erosion of the articular eminentia, the condyles have an abnormal anterior position near the residual articular eminentia. C, A coronal CT image of the same case. Note the osseous ankylosis on the lateral aspect of the left joint (arrow).

CHAPTER 26 ■ DIAGNOSTIC IMAGING OF THE TEMPOROMANDIBULAR JOINT 495
FIG. 26-27 A and B, Sagittal CT reformat images of a case of juvenile arthritis. Note the severe erosion of the articular eminence and the condyles and the abnormal anterior positioning of both condyles. C, This coronal CT image of the same case shows small rem-nants of the condylar heads after severe erosion.
A B
C
A
B C
FIG. 26-28 A, Axial CT image. B, Sagittal reformat CT image. C, Coronal reformat CT image of a case of septic arthritis involving the right joint. Note the erosions, sclerosis and periosteal reaction that extends along the back of the condyle and lateral neck of the condyle (arrows).

496 PART V ■ RADIOGRAPHIC INTERPRETATION
air cells, osteomyelitis of the mandible, and infl ammation of sur-rounding soft tissue. MRI, with T2-weighted images, may show muscle enlargement, joint effusion, or abscess. Scintigraphy by use of a tech-netium bone scan will show increased bone metabolism within the osseous components, especially the condyle, and gallium confi rms the presence of infection.
Treatment Treatment includes antimicrobial therapy, drainage of effusion, and joint rest. Physiotherapy to re-establish joint mobility is initiated after the acute phase of infection has passed.
Articular Loose Bodies
Articular loose bodies are radiopacities of varying origin located in the synovium, within the capsule in the joint spaces, or outside the capsule in soft tissue. They appear radiographically as soft tissue calcifi cations positioned around the condylar head. The loose bodies may represent bone that has separated from joint components, as in DJD (joint mice), hyaline cartilage metaplasia (calcifi cation) that occurs in synovial chondromatosis, crystals depos-ited in the joint space in crystal-associated arthropathy (pseudogout), or tumoral calcinosis associated with renal disease. In rare cases chon-drosarcoma also may mimic the appearance of articular loose bodies.
Synovial Chondromatosis
Synonyms Synovial chondrometaplasia and osteochondromatosis
Defi nition Synovial chondromatosis is an uncommon disorder characterized by metaplastic formation of multiple cartilaginous and osteocartilagi-nous nodules within connective tissue of the synovial membrane of joints. Some of these nodules may detach and form loose bodies in the joint space, where they persist and may increase in size, being nourished by synovial fl uid. This condition is more common in the axial skeleton than in the TMJ. When the cartilaginous nodules ossify, the term synovial osteochondromatosis may be used.
Clinical Features Patients may be asymptomatic or may complain of preauricular swell-ing, pain, and decreased range of motion. Some patients have crepitus or other joint noises. The condition usually occurs unilaterally.
Radiographic Features The osseous components may appear normal or may exhibit osseous changes similar to those in DJD. The joint space may be widened, and if ossifi cation of the cartilaginous nodules has occurred, a radiopaque mass or several radiopaque loose bodies may be seen surrounding the condylar head ( Fig. 26-29 ). CT imaging can identify the location of the calcifi cations. Sclerosis of the glenoid fossa and condyle may be seen, which is considered to be a chronic bone reaction to an active lesion. Occasionally, erosion through the glenoid fossa into the middle cranial fossa may occur, which is best detected with CT. MRI may be useful in defi ning the tissue planes between the synovial chondroma-tosis mass and surrounding soft tissue.
Differential Diagnosis The appearance of synovial osteochondromatosis cannot always be differentiated from chondrocalcinosis; however, often the soft tissue calcifi cations in osteochondromatosis are larger and may have a peripheral cortex that identifi es their bony nature. Conditions that appear similar include DJD with joint mice or chondrosarcoma or osteosarcoma. Either sarcoma may be accompanied by severe bone destruction, which may help in differentiating the condition from synovial chondromatosis.
Treatment Treatment consists of removal of the loose bodies and resection of abnormal synovial tissue in the joint by arthroscopic or open joint surgery.
Chondrocalcinosis
Synonyms Pseudogout and calcium pyrophosphate dihydrate deposition disease
Defi nition Chondrocalcinosis is characterized by acute or chronic synovitis and precipitation of calcium pyrophosphate dihydrate crystals in the joint space. It differs from gout, in which urate crystals are precipitated, hence the term pseudogout.
Clinical Features The joints more commonly affected are the knee, wrist, hip, shoulder, and elbow; TMJ involvement is uncommon. The condition occurs unilaterally and is more common in males. Patients may be asymp-tomatic or may complain of pain and joint swelling.
Radiographic Features The radiographic appearance of chondrocalcinosis may simulate synovial chondromatosis, described previously. Often the radiopaci-ties within the joint space are fi ner and have a more even distribution than in osteochondromatosis ( Fig. 26-30 ). Bone erosions and a severe increase in condylar bone density also have been described. Erosions of the glenoid fossa may be present, which require CT for detection. Soft tissue swelling and edema of the surrounding muscles may be seen with MRI.
Differential Diagnosis The differential diagnosis is the same as for synovial chondromatosis.
Treatment Treatment consists of surgical removal of the crystalline deposits. Steroids, aspirin, and nonsteroidal anti-infl ammatory agents may provide relief. Colchicine may be used to alleviate acute symptoms and for prophylaxis.
Trauma
Effusion
Defi nition Effusion is an infl ux of fl uid into the joint, usually as a result of trauma (hemorrhage) or infl ammation (exudate). Infl ammation may result from an internal derangement, traumatic injuries, arthritis, or rheu-matic diseases.

CHAPTER 26 ■ DIAGNOSTIC IMAGING OF THE TEMPOROMANDIBULAR JOINT 497
Clinical Features The patient may have swelling over the affected joint; pain in the TMJ, preauricular region, or ear; and limited range of motion. Patients may also complain of the sensation of fl uid in the ear, tinnitus, hearing diffi culties, and diffi culty occluding the posterior teeth.
Radiographic Features Joint effusion is more commonly seen in conjunction with internal derangements, although it has been described in normal joints. The joint space is widened, and T2-weighted MRI studies may show a bright signal (white), indicating fl uid adjacent to the disk or posterior to the condyle (see Fig. 26-19 ).
Differential Diagnosis Effusion must be differentiated from septic arthritis; in the latter case the accompanying signs and symptoms of infection are present.
Treatment Treatment may include anti-infl ammatory drugs, although surgical drainage of the effusion occasionally is necessary.
FIG. 26-29 A, Cropped panoramic image of a right joint involved with osteochondromatosis. B , Sagittal CT reformat image. C, Axial CT image revealing multiple ossifi ed bodies surrounding the condyle and within the joint capsule.
A
B C
FIG. 26-30 Chondrocalcinosis (CT, axial image, bone algorithm). Note the calcifi cations anterior to the right condyle (arrow) and the large erosion involving the medial pole of the condyle.
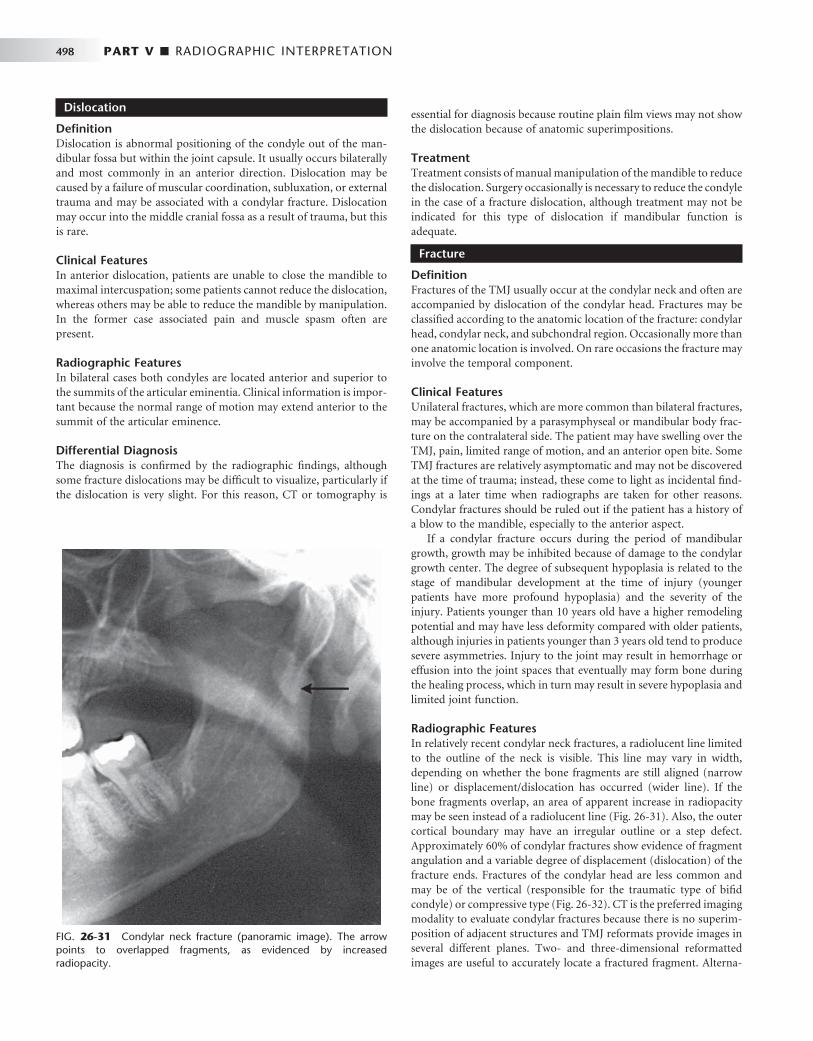
498 PART V ■ RADIOGRAPHIC INTERPRETATION
Dislocation
Defi nition Dislocation is abnormal positioning of the condyle out of the man-dibular fossa but within the joint capsule. It usually occurs bilaterally and most commonly in an anterior direction. Dislocation may be caused by a failure of muscular coordination, subluxation, or external trauma and may be associated with a condylar fracture. Dislocation may occur into the middle cranial fossa as a result of trauma, but this is rare.
Clinical Features In anterior dislocation, patients are unable to close the mandible to maximal intercuspation; some patients cannot reduce the dislocation, whereas others may be able to reduce the mandible by manipulation. In the former case associated pain and muscle spasm often are present.
Radiographic Features In bilateral cases both condyles are located anterior and superior to the summits of the articular eminentia. Clinical information is impor-tant because the normal range of motion may extend anterior to the summit of the articular eminence.
Differential Diagnosis The diagnosis is confi rmed by the radiographic fi ndings, although some fracture dislocations may be diffi cult to visualize, particularly if the dislocation is very slight. For this reason, CT or tomography is
essential for diagnosis because routine plain fi lm views may not show the dislocation because of anatomic superimpositions.
Treatment Treatment consists of manual manipulation of the mandible to reduce the dislocation. Surgery occasionally is necessary to reduce the condyle in the case of a fracture dislocation, although treatment may not be indicated for this type of dislocation if mandibular function is adequate.
Fracture
Defi nition Fractures of the TMJ usually occur at the condylar neck and often are accompanied by dislocation of the condylar head. Fractures may be classifi ed according to the anatomic location of the fracture: condylar head, condylar neck, and subchondral region. Occasionally more than one anatomic location is involved. On rare occasions the fracture may involve the temporal component.
Clinical Features Unilateral fractures, which are more common than bilateral fractures, may be accompanied by a parasymphyseal or mandibular body frac-ture on the contralateral side. The patient may have swelling over the TMJ, pain, limited range of motion, and an anterior open bite. Some TMJ fractures are relatively asymptomatic and may not be discovered at the time of trauma; instead, these come to light as incidental fi nd-ings at a later time when radiographs are taken for other reasons. Condylar fractures should be ruled out if the patient has a history of a blow to the mandible, especially to the anterior aspect.
If a condylar fracture occurs during the period of mandibular growth, growth may be inhibited because of damage to the condylar growth center. The degree of subsequent hypoplasia is related to the stage of mandibular development at the time of injury (younger patients have more profound hypoplasia) and the severity of the injury. Patients younger than 10 years old have a higher remodeling potential and may have less deformity compared with older patients, although injuries in patients younger than 3 years old tend to produce severe asymmetries. Injury to the joint may result in hemorrhage or effusion into the joint spaces that eventually may form bone during the healing process, which in turn may result in severe hypoplasia and limited joint function.
Radiographic Features In relatively recent condylar neck fractures, a radiolucent line limited to the outline of the neck is visible. This line may vary in width, depending on whether the bone fragments are still aligned (narrow line) or displacement/dislocation has occurred (wider line). If the bone fragments overlap, an area of apparent increase in radiopacity may be seen instead of a radiolucent line ( Fig. 26-31 ). Also, the outer cortical boundary may have an irregular outline or a step defect. Approximately 60% of condylar fractures show evidence of fragment angulation and a variable degree of displacement (dislocation) of the fracture ends. Fractures of the condylar head are less common and may be of the vertical (responsible for the traumatic type of bifi d condyle) or compressive type ( Fig. 26-32 ). CT is the preferred imaging modality to evaluate condylar fractures because there is no superim-position of adjacent structures and TMJ reformats provide images in several different planes. Two- and three-dimensional reformatted images are useful to accurately locate a fractured fragment. Alterna-
FIG. 26-31 Condylar neck fracture (panoramic image). The arrow points to overlapped fragments, as evidenced by increased radiopacity.

CHAPTER 26 ■ DIAGNOSTIC IMAGING OF THE TEMPOROMANDIBULAR JOINT 499
FIG. 26-32 Open Towne ’ s view of a compression fracture of the right condylar head (arrow).
FIG. 26-33 A, A cropped panoramic image of a neonatal fracture of the right condyle. Note the unusual shape of the coronoid notch, similar to a partially opened pair of scissors. B, Tomographic image slice of the lateral aspect of the same joint. Note the normal-appearing coronoid notch but a lack of formation of the glenoid fossa and eminence and the abnormal anterior position of the condyle. C, Medial tomographic slice of the same case disclosing the fractured segment.
A B C
( Fig. 26-33 ). This presentation results from the overlapping images of the medially displaced carrot-shaped condyle and remnants of the condylar neck.
Differential Diagnosis This condition often is not diagnosed until later in life, at which time a diagnosis of fracture may be made without a history that the fracture occurred at the time of birth. The condition must be differentiated from a developmental hypoplasia of the mandible, which is unrelated to birth injury.
Treatment The fracture usually is not treated, but the mandibular asymmetry may be corrected with a combination of orthodontics and orthogna-thic surgery.
tively, if CT is not available, multiple right-angle radiographic projec-tions from the lateral, frontal, and basilar aspects may be used to detect a fracture.
The amount of remodeling seen in the TMJ after a condylar frac-ture with medial displacement varies considerably. In some cases the condyle remodels to a form that is essentially normal, whereas in other cases the condyle and mandibular fossa become fl attened, with loss of vertical height on the affected side. The condyle eventually may show degenerative changes, including fl attening, erosion, osteophyte forma-tion, and ankylosis. These changes are more severe if the condyle is displaced. Condylar fractures can also be associated with damage of the intracapsular soft tissues, including the disk, joint capsule and retrodiskal tissues, and with hemarthrosis and joint effusion.
Differential Diagnosis Occasionally old fractures that have remodeled may be diffi cult to differentiate from developmental abnormalities of the condyle. The most common diffi culty is in determining whether a fracture is indeed present. Panoramic views taken as an initial examination must be supplemented with a Towne ’ s view, especially if there is suspected medial displacement of the condylar head.
Treatment Treatment may not be indicated if mandibular mobility is adequate; otherwise, the fracture is reduced surgically.
Neonatal Fractures
The use of forceps during delivery of neonates may result in fracture and displacement of the rudimentary condyle, which later manifests as severe mandibular hypoplasia and lack of development of the glenoid fossa and articular eminence. Such cases have a characteristic radiographic appearance in the panoramic image, having the appear-ance of a partly opened pair of scissors in place of a normal condyle

500 PART V ■ RADIOGRAPHIC INTERPRETATION
Ankylosis
Defi nition Ankylosis is a condition in which condylar movement is limited by a mechanical problem in the joint ( “ true ” ankylosis) or by a mechanical cause not related to joint components ( “ false ” ankylosis). True anky-losis may be bony or fi brous. In bony ankylosis the condyle or ramus is attached to the temporal or zygomatic bone by an osseous bridge. In fi brous ankylosis a soft tissue (fi brous) union of joint components occurs; the bone components appear normal. False ankylosis may result from conditions that inhibit condylar movement, such as muscle spasm, myositis ossifi cans, or coronoid process hyperplasia.
Clinical Features Most unilateral cases are caused by mandibular trauma or infection. The most common cause of bilateral TMJ ankylosis is rheumatoid arthritis, although in rare cases bilateral fractures may be the cause. Most if not all cases of TMJ ankylosis in infancy occur as a result of birth injury. Patients have a history of progressively restricted jaw opening, or they may have a long-standing history of limited opening. Some degree of mandibular opening usually is possible through fl exing of the mandible, although opening may be restricted to only a few millimeters, particularly in the case of bony ankylosis.
Radiographic Features In fi brous ankylosis the articulating surfaces are usually irregular because of erosions. The joint space is usually very narrow and the two irregular surfaces may appear to fi t one another like a jigsaw puzzle (see Fig. 26-26 ). Little or no condylar movement is seen. Radio-graphic signs of remodeling occasionally are visible as the joint com-ponents adapt to repeated attempts at mandibular opening. In bony ankylosis the joint space may be partly or completely obliterated by
the osseous bridge, which can vary from a slender segment of bone, which may be diffi cult to locate, to a large bony mass. This extensive new bone may fuse the condyle to the cranial base ( Fig. 26-34 ). Sec-ondary degenerative changes of the joint components are common. Often morphologic changes occur, such as compensatory progressive elongation of the coronoid processes and deepening of the antegonial notch in the mandibular ramus on the affected side as a result of muscle function during attempted mandibular opening. If ankylosis occurs before mandibular growth is complete, growth of the affected side of the mandible is inhibited. Coronal CT images are the best diagnostic imaging method to evaluate ankylosis.
Differential Diagnosis The major differential diagnosis is a condylar tumor. However, a history of trauma, infection, or other joint diseases should help rule out neoplastic disease. Detection of fi brous ankylosis is diffi cult because fi brous tissue is not visible in the radiographic image and therefore may be diffi cult to differentiate from false ankylosis.
Treatment Joint mobility is improved by surgical removal of the osseous bridge or creation of a pseudarthrosis.
Tumors
Benign and malignant tumors originating in or involving the TMJ are rare. Tumors may be intrinsic or extrinsic (adjacent) to the TMJ. Intrinsic tumors may develop in the condyle, temporal bone, or coronoid process. Extrinsic tumors may affect the morphology, structure, or function of the joint without invading the joint itself. They may cause indirect effects on growth, such as those seen with vascular lesions or from pressure, or may infl uence mandibular positioning.
Benign Tumors
The most common benign intrinsic tumors affecting the TMJ are osteomas, osteochondromas, Langerhans histiocytosis, and osteoblas-tomas. Chondroblastomas, fi bromyxomas, benign giant cell lesions, and aneurysmal bone cysts also occur. Benign tumors and cysts of the mandible (e.g., ameloblastomas, odontogenic keratocysts, simple bone cysts) may involve the entire ramus and in rare cases the condyle. In cases of false ankylosis in which the TMJs appear radio-graphically normal, hyperplasia or a tumor of the coronoid process must be ruled out.
Clinical Features Condylar tumors grow slowly and may attain considerable size before becoming clinically noticeable. Patients may complain of TMJ swell-ing, which may be accompanied by pain and decreased range of motion; the symptoms often mimic TMJ dysfunction. The clinical examination may reveal facial asymmetry, malocclusion, and devia-tion of the mandible to the unaffected side; these may be accompanied by symptoms of TMJ dysfunction. Tumors of the coronoid process typically are painless, but patients may complain of progressive limita-tion of motion.
Radiographic Features Condylar tumors cause condylar enlargement that often is irregular in outline. The trabecular pattern may be altered, resulting in regions of destruction seen as radiolucencies or new abnormal bone forma-
FIG. 26-34 Bony ankylosis (CT, coronal image slice, bone algorithm). The right condyle and ramus are markedly enlarged. The articulating surface is irregular, and the central and lateral aspects are fused to the roof of the glenoid fossa, as evidenced by a lack of joint space. Note that the left condylar articulating surface is eroded, and the joint space is decreased on the medial aspect; these changes are consistent with degenerative joint disease.

CHAPTER 26 ■ DIAGNOSTIC IMAGING OF THE TEMPOROMANDIBULAR JOINT 501
tion, which may increase the radiopacity of the condyle with abnor-mal trabeculae. An osteoma or osteochondroma appears as an abnormal, pedunculated mass attached to the condyle ( Fig. 26-35 ). Osteochondromas often extend from the anterior or superior surface of the condyle. Tumors of the coronoid process may affect TMJ func-tion, which emphasizes the need to image and evaluate the coronoid process when evaluating joint abnormalities. The most common benign tumor is the osteochondroma. This tumor may interfere with joint function and erode adjacent osseous structures.
Differential Diagnosis Condylar neoplasms may simulate unilateral condylar hyperplasia because of condylar enlargement, although osteomas and osteochon-dromas give an irregular appearance, such as bulbous or globular expansion of the condyle or, more commonly, a pedunculated growth. Also, the characteristic condylar shape and proportions are better preserved in condylar hyperplasia. Coronoid tumors must be differ-entiated from coronoid hyperplasia, which differs from a condylar tumor in that the coronoid process remains regular in shape.
Treatment Treatment consists of surgical excision of the tumor and occasionally excision of the condylar head or coronoid process.
Malignant Tumors
Malignant tumors of the jaws may be primary or, more commonly, metastatic. Primary intrinsic malignant tumors of the condyle are extremely rare and include chondrosarcoma, osteogenic sarcoma, synovial sarcoma, and fi brosarcoma of the joint capsule. Extrinsic malignant tumors may represent direct extension of adjacent parotid salivary gland malignancies, rhabdomyosarcoma (particularly in
children), or other regional carcinomas from the skin, ear, and naso-pharynx. The most common metastatic lesions include neoplasms originating in the breast, kidney, lung, colon, prostate, and thyroid gland.
Clinical Features Malignant tumors (primary or metastatic) may be asymptomatic or patients may have symptoms of TMJ dysfunction such as pain, limited mandibular opening, mandibular deviation, and swelling. Unfortu-nately, a patient occasionally is treated for TMJ dysfunction without recognition that the underlying condition is a malignancy.
Radiographic Features Malignant primary and metastatic TMJ tumors appear as a variable degree of bone destruction with ill-defi ned, irregular margins. Most lack tumor bone formation, with the exception of osteogenic sarcoma. Chondrosarcoma may appear as an indistinct, essentially radiolucent destructive lesion of the condyle with surrounding discrete soft tissue calcifi cations that may simulate the appearance of the articular loose bodies seen in chondrocalcinosis or pseudogout ( Fig. 26-36 ). In the case of metastatic tumors, the radiographic appearance usually is nonspecifi c condylar destruction (with a few exceptions, such as met-astatic prostate carcinoma) and does not indicate the site of origin ( Fig. 26-37 ). CT is the imaging modality of choice to view bone involvement and MRI is useful for displaying the extent of involve-ment into the surrounding soft tissues.
Differential Diagnosis Joint destruction caused by a malignant tumor must be differentiated from the osseous destruction seen in severe DJD. Malignant tumors cause profound central bone destruction, whereas DJD causes more
FIG. 26-35 A, Axial bone algorithm CT image of an osteochondroma extending from the anterior surface of the left condylar head (arrow). B, Sagittal reformat CT image of a different case; the internal aspect of the osteochondroma (arrow) is continuous with the cancellous portion of the condylar head.
A B

502 PART V ■ RADIOGRAPHIC INTERPRETATION
peripheral bone destruction. Proliferative changes such as osteophyte formation may be seen in DJD, but unlike with a malignant tumor, no soft tissue mass or swelling is evident. Chondrosarcoma may simu-late joint space calcifi cations (discussed earlier), but in the case of malignancy, severe bone destruction also occurs.
Treatment In the case of primary malignant tumors, treatment consists of wide surgical removal of the tumor. Tumor extension to vital anatomic structures may compromise survival. Metastatic tumors of the TMJ rarely are treated surgically; treatment mainly is palliative and may include radiotherapy and chemotherapy.
SUGGESTED READINGS
DISORDERS OF THE TEMPOROMANDIBULAR JOINT
Brooks SL , Brand JW , Gibbs SJ et al : Imaging of the temporomandibular joint, position paper of the American Academy of Oral and Maxillofacial Radiology [ review ] , Oral Surg Oral Med Oral Pathol Oral Radiol Endod 83 : 609 - 618 , 1997 .
Helkimo M : Studies on function and dysfunction of the masticatory system, II: index for anamnestic and clinical dysfunction and occlusal state , Sven Tandlak Tidskr 67 : 101 - 121 , 1974 .
McNeill C , Mohl ND , Rugh JD et al : Temporomandibular disorders: diagnosis, management, education, and research , J Am Dent Assoc 120 : 253 , 255, 257, 1990 .
Petrikowski CG , Grace MG : Temporomandibular joint radiographic fi ndings in adolescents , Cranio 14 : 30 - 36 , 1996 .
Rugh JD , Solberg WK : Oral health status in the United States: temporomandibular disorders , J Dent Educ 49 : 398 - 406 , 1985 .
W ä nman A , Agerberg G : Mandibular dysfunction in adolescents, I: prevalence of symptoms , Acta Odontol Scand 44 : 47 - 54 , 1986 .
ANATOMY OF THE TEMPOROMANDIBULAR JOINT
Blaschke DD , Blaschke TJ : A method for quantitatively determining temporomandibular joint bony relationships , J Dent Res 60 : 35 - 43 , 1981 .
Drace JE , Enzmann DR : Defi ning the normal temporomandibular joint: closed, partially open, and open mouth MR imaging of asymptomatic subjects , Radiology 177 : 67 - 76 , 1990 .
Hansson LG , Hansson T , Petersson A : A comparison between clinical and radiologic fi ndings in 259 temporomandibular joint patients , J Prosthet Dent 50 : 89 - 94 , 1983 .
Ingervall B , Carlsson GE , Thilander B : Postnatal development of the human temporomandibular joint. II. A microradiographic study , Acta Odont Scand 34 : 133 - 139 , 1976 .
Larheim TA : Radiographic appearance of the normal temporomandibular joint in newborns and small children , Acta Radiol Diagn (Stockh) 22 : 593 - 599 , 1981 .
Pullinger AG , Hollender L , Solberg WK et al : A tomographic study of mandibular condyle position in an asymptomatic population , J Prosthet Dent 53 : 706 - 713 , 1985 .
Taylor RC , Ware WH , Fowler D et al : A study of temporomandibular joint morphology and its relationship to the dentition , Oral Surg 33 : 1002 - 1013 , 1972 .
Ten Cate AR : Gross and micro anatomy . In Zarb GA , Carlsson BJ , Mohl ND , editors: Temporomandibular joint and masticatory muscle disorders , ed 2 , Copenhagen , 1994 , Munksgaard .
Westesson P-L , Kurita K , Eriksson L et al : Cryosectional observations of functional anatomy of the temporomandibular joint , Oral Surg Oral Med Oral Pathol 68 : 247 - 251 , 1989 .
Yale SH , Allison BD , Hauptfuehrer JD : An epidemiological assessment of mandibular condyle morphology , Oral Surg 21 : 169 - 177 , 1966 .
DIAGNOSTIC IMAGING OF THE TEMPOROMANDIBULAR JOINT
Brooks SL , Brand AW , Gibbs SJ et al : Imaging of the temporomandibular joint, position paper of the American Academy of Oral and Maxillofacial
FIG. 26-36 Chondrosarcoma (CT, axial section, bone algorithm). A radiolucent destructive lesion is present in the left condylar head, and faint radiopacities (soft tissue calcifi cations) are visible anterior to the condylar head (arrows).
FIG. 26-37 An axial, soft tissue algorithm, CT image of a metastatic lesion from a carcinoma of the thyroid gland that has destroyed all of the left mandibular condyle.

CHAPTER 26 ■ DIAGNOSTIC IMAGING OF THE TEMPOROMANDIBULAR JOINT 503
Radiology , Oral Surg Oral Med Oral Pathol Oral Radiol Endod 83 : 609 - 618 , 1997 .
Helms CA , Kaplan P : Diagnostic imaging of the temporomandibular joint: recommendations for use of the various techniques , AJR Am J Roentgenol 154 : 319 - 322 , 1990 .
Katzberg RW : Temporomandibular joint imaging , Radiology 170 : 297 - 307 , 1989 .
Hard Tissue Imaging
Christiansen EL , Chan TT , Thompson JR et al : Computed tomography of the normal temporomandibular joint , Scand J Dent Res 95 : 499 - 509 , 1987 .
Coin CG : Tomography of the temporomandibular joint , Med Radiogr Photogr 50 : 26 - 39 , 1974 .
Tsiklakis K , Syriopoulos K , Stamatakis HC : Radiographic examination of the temporomandibular joint using cone beam computed tomography , Dentomaxillofac Radiol 33 : 196 - 201 , 2004 .
Soft Tissue Imaging
Conway WF , Hayes CW , Campbell RL : Dynamic magnetic resonance imaging of the temporomandibular joint using FLASH sequences , J Oral Maxillofac Surg 46 : 930 - 938 , 1988 .
Hansson LG , Westesson PL , Eriksson L : Comparison of tomography and midfi eld magnetic resonance imaging for osseous changes of the temporomandibular joint , Oral Surg Oral Med Oral Pathol Oral Radiol Endod 82 : 698 - 703 , 1996 .
Moses JJ , Salinas E , Goergen T et al : Magnetic resonance imaging or arthrographic diagnosis of internal derangement of the temporomandibular joint , Oral Surg Oral Med Oral Pathol 75 : 268 - 272 , 1993 .
Tomas X , Pomes J , Berenquer J et al : MR Imaging of temporomandibular joint dysfunction: a pictorial review , Radiographics 26 : 765 - 781 , 2006 .
RADIOGRAPHIC ABNORMALITIES OF THE TEMPOROMANDIBULAR JOINT
Condylar Hyperplasia
Gray RJM , Sloan P , Quayle AA et al : Histopathological and scintigraphic features of condylar hyperplasia , Int J Oral Maxillofac Surg 19 : 65 - 71 , 1990 .
Rubenstein LK , Campbell RL : Acquired unilateral condylar hyperplasia and facial asymmetry: report of a case , ASDC J Dent Child 52 : 114 - 120 , 1985 .
Shira RB : Facial asymmetry and condylar hyperplasia , Oral Surg 40 : 567 , 1975 .
Wolford LM , Mehra P , Reiche-Fischel O et al : Effi cacy of high condylectomy for management of condylar hyperplasia , Am J Orthod Dentofacial Orthop 121 : 136 - 151 , 2002 .
Condylar Hypoplasia
Jerell RG , Fuselier B , Mahan P : Acquired condylar hypoplasia: report of a case , ASDC J Dent Child 58 : 147 - 153 , 1991 .
Worth HM : Radiology of the temporomandibular joint . In Zarb GA , Carlsson BJ , Mohl ND , editors: Temporomandibular joint function and dysfunction , Copenhagen , 1979 , Munksgaard .
Juvenile Arthrosis
Boering G : Temporomandibular joint arthrosis and facial deformity , Trans Int Conf Oral Surg 258 - 260 , 1967 .
Worth HM : Radiology of the temporomandibular joint . In Zarb GA , Carlsson BJ , Mohl ND , editors: Temporomandibular joint function and dysfunction , Copenhagen , 1979 , Munksgaard .
Coronoid Hyperplasia
McLoughlin PM , Hopper C , Bowley NB : Hyperplasia of the mandibular coronoid process: an analysis of 31 cases and a review of the literature , J Oral Maxillofac Surg 53 : 250 - 255 , 1995 .
Satoh K , Ohno S , Aizawa T et al : Bilateral coronoid hyperplasia in an adolescent: report of a case and review of the literature , J Oral Maxillofac Surg 64 : 334 - 338 , 2006 .
Bifi d Condyle
Daniels JSM , Ali I : Post-traumatic bifi d condyle associated with temporomandibular joint ankylosis: report of a case and review of the literature , Oral Surg Oral Med Oral Pathol Oral Radiol Endod 99 : 682 - 688 . 2005 .
Loh FC , Yeo JF : Bifi d mandibular condyle , Oral Surg Oral Med Oral Pathol 69 : 24 - 27 , 1990 .
SOFT TISSUE ABNORMALITIES
Dolwick MF , Sanders B : TMJ internal derangement and arthrosis . In Surgical atlas , St. Louis , 1985 , Mosby .
Helms CA , Kaban LB , McNeill C et al : Temporomandibular joint: morphology and signal intensity characteristics of the disk at MR imaging , Radiology 172 : 817 - 820 , 1989 .
Katzberg RW : Temporomandibular joint imaging , Radiology 170 : 297 , 1989 . Katzberg RW , Tallents RH , Hayakawa K et al : Internal derangements of the
temporomandibular joint: fi ndings in the pediatric age group , Radiology 154 : 125 - 127 , 1985 .
Larheim TA : Current trends in temporomandibular joint imaging , Oral Surg Oral Med Oral Pathol Oral Radiol Endod 80 : 555 - 576 , 1995 .
Nuelle DG , Alpern MC , Ufema JW : Arthroscopic surgery of the temporomandibular joint , Angle Orthod 56 : 118 - 142 , 1986 .
Rammelsberg P , Pospiech PR , J ä ger L et al : Variability of disk position in asymptomatic volunteers and patients with internal derangements of the TMJ , Oral Surg Oral Med Oral Pathol Oral Radiol Endod 83 : 393 - 399 , 1997 .
Sano T , Westesson P-L : Magnetic resonance imaging of the temporomandibular joint: increased T2 signal in the retro-diskal tissue of painful joints , Oral Surg Oral Med Oral Pathol Oral Radiol Endod 79 : 511 - 516 , 1995 .
Wilkes CH : Internal derangements of the temporomandibular joint: pathological variations , Arch Otolaryngol Head Neck Surg 115 : 469 - 477 , 1989 .
REMODELING AND ARTHRITIC CONDITIONS
Remodeling
Brooks SL , Westesson PL , Eriksson L et al : Prevalence of osseous changes in the temporomandibular joint of asymptomatic persons without internal derangement , Oral Surg Oral Med Oral Pathol 73 : 118 - 122 , 1992 .
Moffett BC , Johnson LC , McCabe JB et al : Articular remodeling in the adult human temporomandibular joint , Am J Anat 115 : 119 - 141 , 1964 .
Degenerative Joint Disease
de Leeuw R , Boering G , Stegenga B et al : Temporomandibular joint osteoarthrosis: clinical and radiographic characteristics 30 years after nonsurgical treatment — a preliminary report , Cranio 11 : 15 - 24 , 1993 .
Helenius LMJ , Tervahartiala P , Helenius I et al : Clinical, radiographic and MRI fi ndings of the temporomandibular joint in patients with different rheumatic diseases , Int J Oral Maxillofac Surg 35 : 983 - 989 , 2006 .
Kurita H , Uehara S , Yokochi M et al : A long-term follow-up study of radiographically evident degenerative changes in the temporomandibular joint with different conditions of disk displacement , Int J Oral Maxillfoacial Surg 35 : 49 - 54 , 2006 .
Mayne JG , Hatch GS : Arthritis of the temporomandibular joint , J Am Dent Assoc 79 : 125 - 130 , 1969 .
Radin EL , Paul IL , Rose RM : Role of mechanical factors in pathogenesis of primary osteoarthritis , Lancet 1 : 519 - 522 , 1972 .
Sato H , Fujii T , Yamada N et al : Temporomandibular joint osteoarthritis: a comparative clinical and tomographic study pre- and post-treatment , J Oral Rehabil 21 : 383 - 395 , 1994 .
504 PART V ■ RADIOGRAPHIC INTERPRETATION
Rheumatoid Arthritis
Gynther GW , Tronje G , Holmlund AB : Radiographic changes in the temporomandibular joint in patients with generalized osteoarthritis and rheumatoid arthritis , Oral Surg Oral Med Oral Pathol Oral Radiol Endod 81 : 613 - 618 , 1996 .
Larheim TA , Smith HJ , Aspestrand F : Rheumatic disease of the temporomandibular joint: MR imaging and tomographic manifestations , Radiology 175 : 527 - 531 , 1990 .
Syrj ä nen SM : The temporomandibular joint in rheumatoid arthritis , Acta Radiol Diagn (Stockh) 26 : 235 - 243 , 1985 .
Juvenile Chronic Arthritis
Ganik R , Williams FA : Diagnosis and management of juvenile rheumatoid arthritis with TMJ involvement , Cranio 4 : 254 - 262 , 1986 .
Hu Y-S , Schneiderman ED : The temporomandibular joint in juvenile rheumatoid arthritis, I: computed tomographic fi ndings , Pediatr Dent 17 : 46 - 53 , 1995 .
Hu Y-S , Schneiderman ED , Harper RP : The temporomandibular joint in juvenile rheumatoid arthritis, II: relationship between computed tomographic and clinical fi ndings , Pediatr Dent 18 : 312 - 319 , 1996 .
Karhulahti T , Ylijoki H , R ö nning O : Mandibular condyle lesions related to age at onset and subtypes of juvenile rheumatoid arthritis in 15-year-old children , Scand J Dent Res 101 : 332 - 338 , 1993 .
Psoriatic Arthritis
Koorbusch GF , Zeitler DL , Fotos PG et al : Psoriatic arthritis of the temporomandibular joints with ankylosis , Oral Surg Oral Med Oral Pathol 71 : 267 - 274 , 1991 .
Wilson AW , Brown JS , Ord RA : Psoriatic arthropathy of the temporomandibular joint , Oral Surg Oral Med Oral Pathol 70 : 555 - 558 , 1990 .
Ankylosing Spondylitis
Locher MC , Felder M , Sailer HF : Involvement of the temporomandibular joints in ankylosing spondylitis (Bechterew ’ s disease) , J Craniomaxillofac Surg 24 : 205 - 213 , 1996 .
Ramos-Remus C , Major P , Gomez-Vargas A et al : Temporomandibular joint osseous morphology in a consecutive sample of ankylosing spondylitis patients , Ann Rheum Dis 56 : 103 - 107 , 1997 .
Septic Arthritis
Leighty SM , Spach DH , Myall RW et al : Septic arthritis of the temporomandibular joint: review of the literature and report of two cases in children , Int J Oral Maxillofac Surg 22 : 292 - 297 , 1993 .
Sembronio S , Albiero AM , Robiony M et al : Septic arthritis of the temporomandibular joint successfully treated with arthroscopic lysis and lavage: case report and review of the literature , Oral Surg Oral Med Oral Pathol Oral Radiol Endod 103 : e1 - 6 , 2007 .
ARTICULAR LOOSE BODIES
Ardekian L , Faquin W , Troulis MJ et al : Synovial chondromatosis of the temporomandibular joint: report and analysis of eleven cases , J Oral Maxillofac Surg 63 : 941 - 947 , 2005 .
Carls FR , von Hochstetter A , Engelke W et al : Loose bodies in the temporomandibular joint , J Craniomaxillofac Surg 23 : 215 - 221 , 1995 .
Chuong R , Piper MA : Bilateral pseudogout of the temporomandibular joint: report of a case and review of the literature , J Oral Maxillofac Surg 53 : 691 - 694 , 1995 .
Dijkgraaf LC , Liem RS , de Bont LG et al : Calcium pyrophosphate dihydrate crystal deposition disease: a review of the literature and a light and electron microscopic study of a case of the temporomandibular joint with numerous intracellular crystals in the chondrocytes , Osteoarthritis Cartilage 3 : 35 - 45 , 1995 .
Lustmann J , Zeltser R : Synovial chondromatosis of the temporomandibular joint: review of the literature and case report , Int J Oral Maxillofac Surg 18 : 90 - 94 , 1989 .
Orden A , Laskin DM , Lew D : Chronic preauricular swelling , J Oral Maxillofac Surg 47 : 390 - 397 , 1989 .
Pynn BR , Weinberg S , Irish J : Calcium pyrophosphate dihydrate deposition disease of the temporomandibular joint: a case report and review of the literature , Oral Surg Oral Med Oral Pathol Oral Radiol Endod 79 : 278 - 284 , 1995 .
Yu Q , Yang J , Wang P et al : CT features of synovial chondromatosis in the temporomandibular joint , Oral Surg Oral Med Oral Pathol Oral Radiol Endod 97 : 524 - 528 , 2007 .
TRAUMA
Effusion
Emshoff R , Brandimaier I , Bertram S et al : Magnetic resonance imaging fi ndings of osteoarthrosis and effusion in patients with unilateral temporomandibular joint pain , Int J Oral Maxillofac Surg 31 : 598 - 602 , 2002 .
Schellhas KP , Wilkes CH : Temporomandibular joint infl ammation: comparison of MR fast scanning with T1- and T2-weighted imaging techniques , AJR Am J Roentgenol 153 : 93 - 98 , 1989 .
Schellhas KP , Wilkes CH , Baker CC : Facial pain, headache, and temporomandibular joint infl ammation , Headache 29 : 229 - 232 , 1989 .
Westesson P-L , Brooks SL : Temporomandibular joint: relationship between MR evidence of effusion and the presence of pain and disk displacement , AJR Am J Roentgenol 159 : 559 , 1992 .
Dislocation
Kai S , Kai H , Nakayama E et al : Clinical symptoms of open lock position of the condyle: relation to anterior dislocation of the temporomandibular joint , Oral Surg Oral Med Oral Pathol 74 : 143 - 148 , 1992 .
Ohura N , Ichioka S , Sudo T et al : Dislocation of the bilateral mandibular condyle into the middle cranial fossa: review of the literature and clinical experience , J Oral Maxillofac Surg 64 : 1165 - 1172 , 2006 .
Wijmenga JP , Boering G , Blankestijn J : Protracted dislocation of the temporomandibular joint , Int J Oral Maxillofac Surg 15 : 380 - 388 , 1986 .
Fracture
Choi J , Oh I-K : A follow-up study of condyle fracture in children , Int J Oral Maxillofac Surg 34 : 851 - 858 , 2005 .
Dahlstr ö m L , Kahnberg KE , Lindahl L : Fifteen years follow-up on condylar fractures , Int J Oral Maxillofac Surg 18 : 18 - 23 , 1989 .
Gerhard S , Ennemoser T , Rudisch A et al : Condylar injury: magnetic resonance imaging fi ndings of the temporomandibular joint soft tissue changes , Int J Oral Maxillofac Surg 36 : 214 - 218 , 2007 .
Horowitz I , Abrahami E , Mintz SS : Demonstration of condylar fractures of the mandible by computed tomography , Oral Surg 54 : 263 - 268 , 1982 .
Lindahl L , Hollender L : Condylar fractures of the mandible, II: a radiographic study of remodeling processes in the temporomandibular joint , Int J Oral Surg 6 : 153 - 165 , 1977 .
Pharoah MJ : Radiology of the temporomandibular joint . In Zarb GA , Carlsson BJ , Mohl ND , editors: Temporomandibular joint and masticatory muscle disorders , ed 2 , Copenhagen , 1994 , Munksgaard .
Raustia AM , Pyhtinen J , Oikarinen KS et al : Conventional radiographic and computed tomographic fi ndings in cases of fracture of the mandibular condylar process , J Oral Maxillofac Surg 48 : 1258 - 1264 , 1990 .
Schellhas KP : Temporomandibular joint injuries , Radiology 173 : 211 - 216 , 1989 .
Neonatal Fractures
Pharoah MJ : Radiology of the temporomandibular joint . In Zarb GA , Carlsson BJ , Mohl ND , editors: Temporomandibular joint and masticatory muscle disorders , ed 2 , Copenhagen , 1994 , Munksgaard .

CHAPTER 26 ■ DIAGNOSTIC IMAGING OF THE TEMPOROMANDIBULAR JOINT 505
Worth HM : Radiology of the temporomandibular joint . In Zarb GA , Carlsson GE , editors: Temporomandibular joint function and dysfunction , Copenhagen , 1979 , Munksgaard .
Ankylosis
Ferretti C , Bryant R , Becker P et al : Temporomandibular joint morphology following post-traumatic ankylosis in 26 patients , Int J Oral Maxillofac Surg 34 : 376 - 381 , 2005 .
Rowe NL : Ankylosis of the temporomandibular joint , J R Coll Surg Edinb 27 : 67 - 79 , 1982 .
Wood RE , Harris AM , Nortj é et al : The radiologic features of true ankylosis of the temporomandibular joint: an analysis of 25 cases , Dentomaxillofac Radiol 17 : 121 - 127 , 1988 .
TUMORS
Benign Tumors
James RB , Alexander RW , Traver JG Jr : Osteochondroma of the mandibular coronoid process: report of a case , Oral Surg 37 : 189 - 195 , 1974 .
Nwoku AL , Koch H : The temporomandibular joint: a rare localisation for bone tumors , J Maxillofac Surg 2 : 113 - 119 , 1974 .
Pharoah MJ : Radiology of the temporomandibular joint . In Zarb GA , Carlsson BJ , Mohl ND , editors: Temporomandibular joint and masticatory muscle disorders , ed 2 , Copenhagen , 1994 , Munksgaard .
Svensson B , Isacsson G : Benign osteoblastoma associated with an aneurysmal bone cyst of the mandibular ramus and condyle , Oral Surg Oral Med Oral Pathol 76 : 433 - 436 , 1993 .
Thoma KH : Tumors of the mandibular joint , J Oral Surg Anesth Hosp Dent Serv 22 : 157 - 167 , 1964 .
Worth HM : Radiology of the temporomandibular joint . In Zarb GA , Carlsson GE , editors: Temporomandibular joint function and dysfunction , Copenhagen , 1979 , Munksgaard .
Malignant Tumors
Morris MR , Clark SK , Porter BA et al : Chondrosarcoma of the temporomandibular joint: case report , Head Neck Surg 10 : 113 - 117 , 1987 .
Rubin MM , Jui V , Cozzi GM : Metastatic carcinoma of the mandibular condyle presenting as temporomandibular joint syndrome , J Oral Maxillofac Surg 47 : 507 - 510 , 1989 .
Takehana dos Santos D , Cavalcanti MGP : Osteosarcoma of the temporomandibular joint: report of 2 cases , Oral Surg Oral Med Oral Pathol Oral Radiol Endod 94 : 641 - 647 , 2002 .
C H A P T E R 2 7
Paranasal Sinuses
Axel Ruprecht • Ernest W.N. Lam
The paranasal sinuses are the four paired sets of air-fi lled cavities of the craniofacial complex composed of the maxillary, frontal, and sphenoid sinuses and the ethmoid air cells. The maxillary
sinuses are of particular importance to the dentist because of their proximity to the teeth and their associated structures. Consequently, abnormalities arising from within the maxillary sinuses can cause symptoms that may mimic diseases of odontogenic origin, and con-versely, abnormalities that arise in and around the teeth may affect the sinuses or mimic the symptoms of sinus disease.
Part or all of the paranasal sinuses may appear on radiographs made for dental purposes, including maxillary periapical, occlusal, and panoramic radiographs. All the paranasal sinuses can appear on skull radiographs made for orthodontic or orthognathic surgical pur-poses (see Chapter 12 ), although not necessarily in the most diagnos-tic fashion. Therefore, the dentist should have some familiarity with variations to the normal appearances of the sinuses and the more common diseases that may affect them.
Normal Development and Variations
The paranasal sinuses develop as invaginations from the nasal fossae into their respective bones (maxillary, frontal, sphenoid, and ethmoid). Consequently, the mucosal lining of the paranasal sinuses is similar to that found in the nasal cavity, but with slightly fewer mucus glands. In the absence of disease the epithelial cilia move mucus toward their respective communications with the nasal fossae.
The maxillary sinuses (sometimes called the maxillary antra or antra of Highmore) are the fi rst to develop in the second month of intrauterine life. An invagination develops in the lateral wall of the nasal fossa in the middle meatus, and the sinus enlarges laterally into the body of the maxilla. At birth, each sinus is a thin, small slit no more than 8 mm in length in its anteroposterior dimension. With time, the maxilla becomes progressively more pneumatized as the air cavity expands further into the bone both laterally under the orbits toward the zygomatic bone and inferiorly toward the alveolar process. Consequently, it may be very common to see the inferior or “ depen-dent ” portion of the air-fi lled maxillary sinus and fl oor near, or superimposed over, the roots of the premolar or molar teeth to some degree.
The fl oor of the maxillary sinus is a thin, radiopaque line on radiographs. Where the alveolar process of the maxilla is not well pneumatized, the fl oor of the maxillary sinus may not be visible on periapical radiographs ( Fig. 27-1, A ), or it may be seen superior to the roots of the maxillary premolar and/or molar teeth ( Fig. 27-1, B ).
With greater pneumatization of the alveolar process, the fl oor of the maxillary sinus may appear to undulate around the roots of the teeth or be superimposed over the roots of the adjacent teeth, giving the appearance that the tooth roots have penetrated the sinus fl oor ( Fig. 27-1, C and D ). The very close relationship between the tooth roots and the maxillary sinus is referred to as “ draping. ” Closer examination of the periapical aspect of the teeth usually reveals intact laminae durae and periodontal ligament spaces around the tooth root apices. In some instances, the appearance of the maxillary sinus may be mis-takenly confused with a benign space-occupying lesion ( Fig. 27-2 ).
In patients with considerable pneumatization extending into the alveolar process of the maxilla, the lamina dura of a premolar or molar tooth may form a portion of the sinus fl oor. In addition to the alveolar process, the maxillary pneumatization may extend into the palatal, zygomatic, and frontal processes of the maxilla, which can be appreci-ated in plain fi lms but are more notable in advanced imaging such as computed tomography (CT) or magnetic resonance imaging (MRI) ( Fig. 27-3 ).
Hypoplasia of the maxillary sinuses occurs unilaterally in about 1.7% of patients and bilaterally in 7.2%. In these patients, the radio-graphic images of the affected sinus may appear more radiopaque than normal because of the relatively large amount of surrounding maxillary bone. The confi guration of the maxillary sinus walls fre-quently helps to distinguish between a hypoplastic sinus and one that is pathologically radiopaque. A Waters view will show an inward bowing of the sinus wall resulting in a smaller than normal air cavity. In contrast, extensive enlargement of the maxillary and other parana-sal sinuses is a well-known feature of acromegaly.
The development of the frontal sinuses does not usually begin until the fi fth or sixth year. These sinuses develop either directly as extensions from the nasal fossae or from anterior ethmoid air cells (see Fig. 27-4, B ). In about 4% of the population, the frontal sinuses fail to develop. As with the other paranasal sinuses, the right and left frontal sinus cavities develop separately, and as they expand, they approach each other in the midline. In most instances, a thin bony septum may separate the two cavities. In the adult, the frontal sinuses are often asymmetric cavities located above the supraorbital ridges and the nasion; however, in some patients the sinuses may also extend posteriorly over the orbits.
The sphenoid sinus begins growth in the fourth fetal month as invaginations from the sphenoethmoidal recesses of the nasal fossae. Located in the body of the sphenoid bone, the right and left sphenoid sinuses are separated by a bony septum and are usually asymmetric in size and shape. The overall size of the sinus is quite variable, and
506
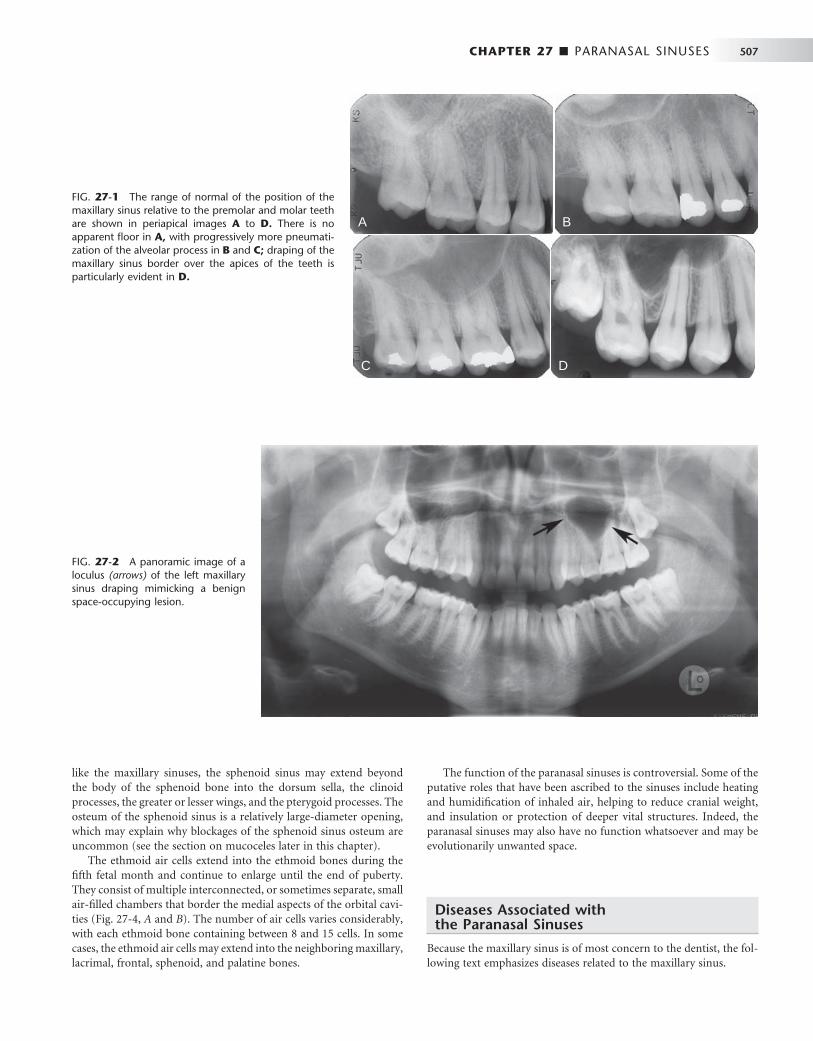
CHAPTER 27 ■ PARANASAL SINUSES 507
FIG. 27-1 The range of normal of the position of the maxillary sinus relative to the premolar and molar teeth are shown in periapical images A to D. There is no apparent fl oor in A, with progressively more pneumati-zation of the alveolar process in B and C; draping of the maxillary sinus border over the apices of the teeth is particularly evident in D.
A
C D
B
FIG. 27-2 A panoramic image of a loculus (arrows) of the left maxillary sinus draping mimicking a benign space-occupying lesion.
like the maxillary sinuses, the sphenoid sinus may extend beyond the body of the sphenoid bone into the dorsum sella, the clinoid processes, the greater or lesser wings, and the pterygoid processes. The osteum of the sphenoid sinus is a relatively large-diameter opening, which may explain why blockages of the sphenoid sinus osteum are uncommon (see the section on mucoceles later in this chapter).
The ethmoid air cells extend into the ethmoid bones during the fi fth fetal month and continue to enlarge until the end of puberty. They consist of multiple interconnected, or sometimes separate, small air-fi lled chambers that border the medial aspects of the orbital cavi-ties ( Fig. 27-4, A and B ). The number of air cells varies considerably, with each ethmoid bone containing between 8 and 15 cells. In some cases, the ethmoid air cells may extend into the neighboring maxillary, lacrimal, frontal, sphenoid, and palatine bones.
The function of the paranasal sinuses is controversial. Some of the putative roles that have been ascribed to the sinuses include heating and humidifi cation of inhaled air, helping to reduce cranial weight, and insulation or protection of deeper vital structures. Indeed, the paranasal sinuses may also have no function whatsoever and may be evolutionarily unwanted space.
Diseases Associated with the Paranasal Sinuses
Because the maxillary sinus is of most concern to the dentist, the fol-lowing text emphasizes diseases related to the maxillary sinus.
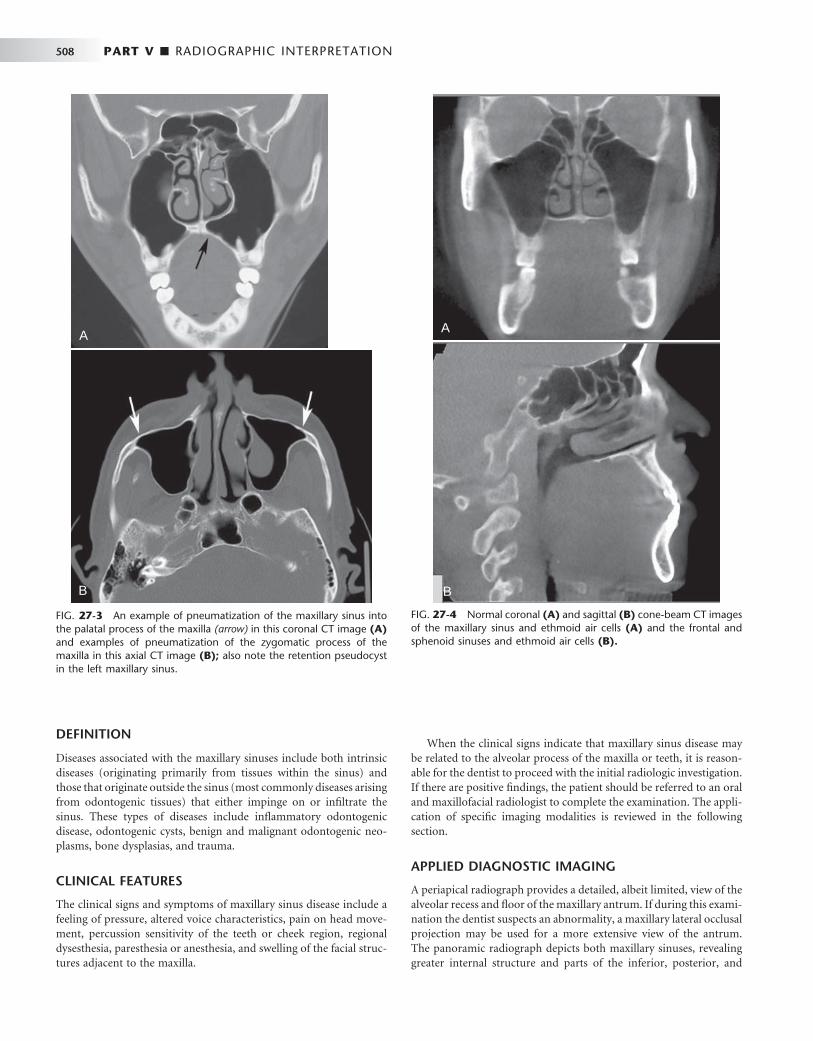
508 PART V ■ RADIOGRAPHIC INTERPRETATION
DEFINITION
Diseases associated with the maxillary sinuses include both intrinsic diseases (originating primarily from tissues within the sinus) and those that originate outside the sinus (most commonly diseases arising from odontogenic tissues) that either impinge on or infi ltrate the sinus. These types of diseases include infl ammatory odontogenic disease, odontogenic cysts, benign and malignant odontogenic neo-plasms, bone dysplasias, and trauma.
CLINICAL FEATURES
The clinical signs and symptoms of maxillary sinus disease include a feeling of pressure, altered voice characteristics, pain on head move-ment, percussion sensitivity of the teeth or cheek region, regional dysesthesia, paresthesia or anesthesia, and swelling of the facial struc-tures adjacent to the maxilla.
When the clinical signs indicate that maxillary sinus disease may be related to the alveolar process of the maxilla or teeth, it is reason-able for the dentist to proceed with the initial radiologic investigation. If there are positive fi ndings, the patient should be referred to an oral and maxillofacial radiologist to complete the examination. The appli-cation of specifi c imaging modalities is reviewed in the following section.
APPLIED DIAGNOSTIC IMAGING
A periapical radiograph provides a detailed, albeit limited, view of the alveolar recess and fl oor of the maxillary antrum. If during this exami-nation the dentist suspects an abnormality, a maxillary lateral occlusal projection may be used for a more extensive view of the antrum. The panoramic radiograph depicts both maxillary sinuses, revealing greater internal structure and parts of the inferior, posterior, and
A
B
FIG. 27-3 An example of pneumatization of the maxillary sinus into the palatal process of the maxilla (arrow) in this coronal CT image (A) and examples of pneumatization of the zygomatic process of the maxilla in this axial CT image (B); also note the retention pseudocyst in the left maxillary sinus.
FIG. 27-4 Normal coronal (A) and sagittal (B) cone-beam CT images of the maxillary sinus and ethmoid air cells (A) and the frontal and sphenoid sinuses and ethmoid air cells (B).
A
B

CHAPTER 27 ■ PARANASAL SINUSES 509
anteromedial walls. It is diffi cult to compare the internal radiopacities of the right and left sinus in the panoramic image because of variations that result from overlapping phantom images of other structures.
Specialized skull views are the next step in the investigation. The standard series of plane radiographic views of the sinuses includes the Waters (occipitomental), lateral, submentovertex, and Caldwell (15-degree posteroanterior) skull views. The Waters projection is optimal for visualization of the maxillary sinuses, especially to compare inter-nal radiopacities, and the frontal sinuses and ethmoid air cells. If the Waters view is made with the mouth open, parts of the sphenoid sinuses may also be visualized. The submentovertex view may be useful in evaluating the lateral and posterior borders of the maxillary sinuses and the ethmoid air cells. The Caldwell view is most useful in evaluating the frontal sinuses and ethmoid air cells. The lateral skull view allows examination of all four pairs of the paranasal sinuses, but with each member of a pair superimposed on the other.
CT and MRI have become increasingly important for evaluation of sinus disease and have virtually replaced plane radiography and conventional tomography for investigations of the paranasal sinuses. Because CT and MRI provide multiple sections through the sinuses in different planes, they may contribute signifi cantly to delineating the extent of disease and the fi nal diagnosis. High-resolution axial and coronal CT and MRI examinations are the most revealing imaging techniques for the paranasal sinuses and the adjacent structures and areas.
CT examination is appropriate to determine the extent of disease in patients who have chronic or recurrent sinusitis. Indeed, coronal CT provides superior visualization of the ostiomeatal complex (the region of the ostium of the maxillary sinus and the ethmoidal ostium) and nasal cavities and for demonstrating any reac-tion in the surrounding bone to sinus disease. MRI provides superior visualization of the soft tissues, especially the extension of infi ltrating neoplasms into the sinuses or surrounding soft tissues, or the differ-entiation of retained fl uid secretions from soft tissue masses in the sinuses.
Intrinsic Diseases of the Paranasal Sinuses
The following are abnormalities that originate from tissues within the sinuses.
INFLAMMATORY DISEASE
Infl ammation may result from a variety of causes such as infection, chemical irritation, allergy, introduction of a foreign body, or facial trauma. The radiographic changes associated with infl ammation include thickened sinus mucosa, air-fl uid levels in the sinuses, polyps, empyema, and retention pseudocysts. Viral infections may, however, not cause any radiographic change in a sinus.
Mucositis
Synonym Thickened sinus mucosa
Defi nition The mucosal lining of the paranasal sinuses is composed of respira-tory epithelium and is normally about 1 mm thick. Normal sinus mucosa is not visualized on radiographs; however, when the mucosa becomes infl amed from either an infectious or allergic process, it may
increase in thickness 10 to 15 times, which may be seen radiographi-cally. This infl ammatory change is referred to as mucositis.
Clinical Features The thickness of sinus mucosa in an asymptomatic individual may vary considerably over a relatively short period of time. Consequently, the discovery of thickened mucosa in an individual who is otherwise asymptomatic does not necessarily imply that further investigations are warranted or that treatment is required. Most of the infl ammatory episodes that result in thickening of the mucosal lining of the sinuses are unrecognized by the patient and are discovered only incidentally on a radiograph.
Radiographic Features The image of thickened mucosa is readily detectable in the radiograph as a noncorticated band noticeably more radiopaque than the air-fi lled sinus, paralleling the bony wall of the sinus ( Fig. 27-5 ).
Sinusitis
Defi nition Sinusitis is a condition involving generalized infl ammation of the paranasal sinus mucosa caused by an allergen, bacteria, or a virus. Sinusitis may cause blockage of drainage through the ostiomeatal complex. Infl ammatory changes may lead to ciliary dysfunction and retention of sinus secretions. Perhaps 10% of infl ammatory episodes of the maxillary sinuses are extensions of dental infections. The term pansinusitis describes sinusitis affecting all the paranasal sinuses. In children with pansinusitis, the possibility of cystic fi brosis should be considered.
Clinical Features Acute maxillary sinusitis is often a complication of the common cold, which is accompanied by a clear nasal discharge or pharyngeal drain-age. After a few days, the stuffi ness and nasal discharge increase, and the patient may complain of pain and tenderness to pressure or swell-ing over the involved sinus. The pain may also be referred to the pre-molar and molar teeth on the affected side, and these teeth may also be sensitive to percussion, although this is more commonly seen in bacterial sinusitis. Under these conditions, a green or greenish yellow
FIG. 27-5 Thickened sinus mucosa is portrayed as a radiopaque band paralleling the contour of the maxillary antral fl oor.

510 PART V ■ RADIOGRAPHIC INTERPRETATION
nasal discharge may also be appreciated. This fi nding requires that the teeth be ruled out as a possible source of the pain or infection. However, the key signs and symptoms are those of sepsis: fever, chills, malaise, and an elevated leukocyte count. Acute sinusitis is the most common of the sinus conditions that cause pain.
Chronic maxillary sinusitis is typically a sequela of an acute infec-tion that fails to resolve by 3 months. In general, no external signs occur, except during periods of acute exacerbations when increased pain and discomfort are apparent. Chronic sinusitis is often associated with anatomic derangements including deviation of the nasal septum and the presence of concha bullosa (pneumatization of the middle concha) that inhibit the outfl ow of mucus. Chronic sinusitis is also often associated with allergic rhinitis, asthma, cystic fi brosis, and dental infections.
Radiographic Features Thickening of sinus mucosa and the accumulation of secretions that accompany sinusitis reduce the air content of the sinus and cause it to become increasingly radiopaque. The most common radiopaque patterns that occur in the Waters view are localized mucosal thicken-ing along the sinus fl oor, generalized thickening of the mucosal lining around the entire wall of the sinus, and near-complete or complete radiopacifi cation of the sinus ( Figs. 27-6 and 27-7 ). Such changes are best seen in the maxillary sinuses, but the frontal and sphenoid sinuses may be similarly affected. Scrutinizing the area around the maxillary ostium on any of the views from Waters projections to CT images may reveal the presence of thickened mucosal tissue, which may cause blockage of the ostium. Mucosal thickening in just the base of the sinus may not represent sinusitis. Rather, it may represent the more
localized thickening that can occur in association with rarefying oste-itis from a tooth with a nonvital pulp. This may, however, progress to involve the entire sinus.
The image of thickened sinus mucosa on the radiograph may be uniform or polypoid. In the case of an allergic reaction, the mucosa tends to be more lobulated. In contrast, in cases of infection, the thickened mucosal outline tends to be smoother, with its contour following that of the sinus wall. The inability to perceive the delicate walls of the ethmoid air cells is a particularly sensitive sign of ethmoid sinusitis.
An air-fl uid level resulting from the accumulation of secretions may also be present. Because the radiopacities of transudates, exu-dates, blood, and pathologically altered mucosa are similar, the dif-ferentiation among them relies on their shape and distribution. When present, fl uid appears radiopaque and occupies the inferior aspect of the sinus. The border between the radiopaque fl uid and the relatively radiolucent antrum is horizontal and straight, or with a meniscus (see
FIG. 27-6 Waters view demonstrating complete radiopacifi cation of the left maxillary and frontal sinuses, and ethmoid air cells. An air-fl uid level is visible in the right maxillary sinus (arrows).
FIG. 27-7 Coronal (A) view of the maxillary sinuses showing com-plete radiopacifi cation of the left sinus and circumferential mucosal thickening of the right sinus, and sagittal (B) CT image of mucositis of the ethmoid air cells.
A
B
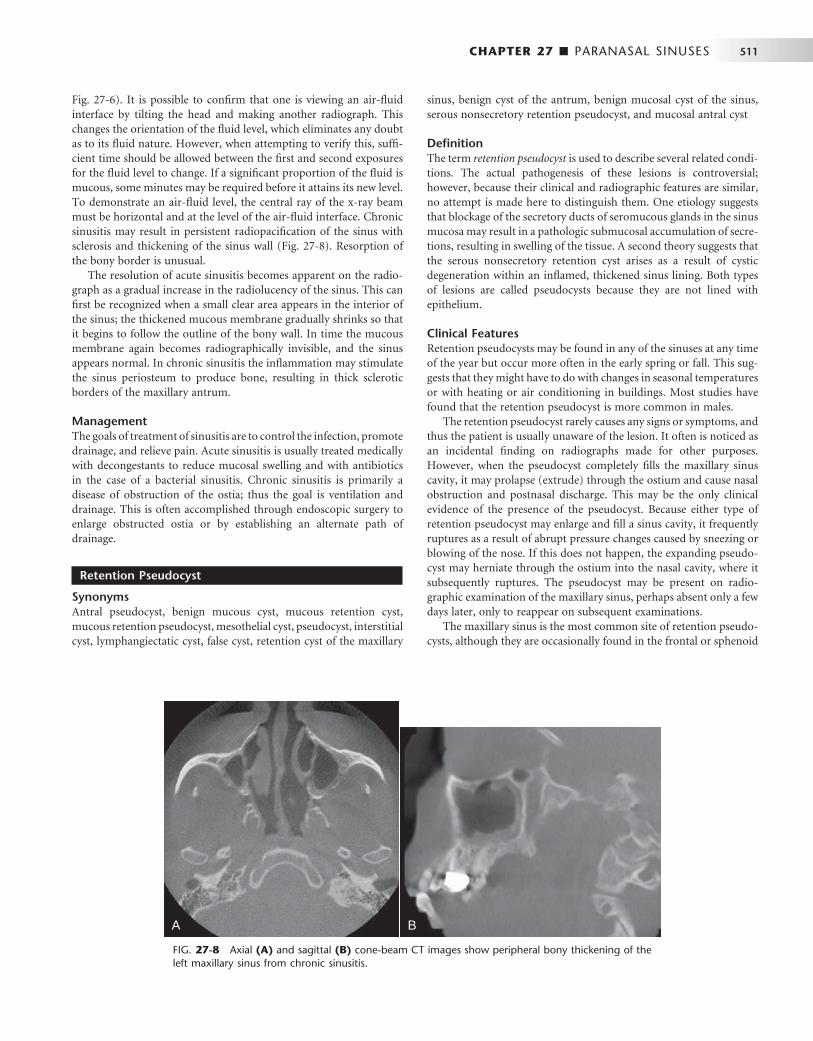
CHAPTER 27 ■ PARANASAL SINUSES 511
Fig. 27-6 ). It is possible to confi rm that one is viewing an air-fl uid interface by tilting the head and making another radiograph. This changes the orientation of the fl uid level, which eliminates any doubt as to its fl uid nature. However, when attempting to verify this, suffi -cient time should be allowed between the fi rst and second exposures for the fl uid level to change. If a signifi cant proportion of the fl uid is mucous, some minutes may be required before it attains its new level. To demonstrate an air-fl uid level, the central ray of the x-ray beam must be horizontal and at the level of the air-fl uid interface. Chronic sinusitis may result in persistent radiopacifi cation of the sinus with sclerosis and thickening of the sinus wall ( Fig. 27-8 ). Resorption of the bony border is unusual.
The resolution of acute sinusitis becomes apparent on the radio-graph as a gradual increase in the radiolucency of the sinus. This can fi rst be recognized when a small clear area appears in the interior of the sinus; the thickened mucous membrane gradually shrinks so that it begins to follow the outline of the bony wall. In time the mucous membrane again becomes radiographically invisible, and the sinus appears normal. In chronic sinusitis the infl ammation may stimulate the sinus periosteum to produce bone, resulting in thick sclerotic borders of the maxillary antrum.
Management The goals of treatment of sinusitis are to control the infection, promote drainage, and relieve pain. Acute sinusitis is usually treated medically with decongestants to reduce mucosal swelling and with antibiotics in the case of a bacterial sinusitis. Chronic sinusitis is primarily a disease of obstruction of the ostia; thus the goal is ventilation and drainage. This is often accomplished through endoscopic surgery to enlarge obstructed ostia or by establishing an alternate path of drainage.
Retention Pseudocyst
Synonyms Antral pseudocyst, benign mucous cyst, mucous retention cyst, mucous retention pseudocyst, mesothelial cyst, pseudocyst, interstitial cyst, lymphangiectatic cyst, false cyst, retention cyst of the maxillary
sinus, benign cyst of the antrum, benign mucosal cyst of the sinus, serous nonsecretory retention pseudocyst, and mucosal antral cyst
Defi nition The term retention pseudocyst is used to describe several related condi-tions. The actual pathogenesis of these lesions is controversial; however, because their clinical and radiographic features are similar, no attempt is made here to distinguish them. One etiology suggests that blockage of the secretory ducts of seromucous glands in the sinus mucosa may result in a pathologic submucosal accumulation of secre-tions, resulting in swelling of the tissue. A second theory suggests that the serous nonsecretory retention cyst arises as a result of cystic degeneration within an infl amed, thickened sinus lining. Both types of lesions are called pseudocysts because they are not lined with epithelium.
Clinical Features Retention pseudocysts may be found in any of the sinuses at any time of the year but occur more often in the early spring or fall. This sug-gests that they might have to do with changes in seasonal temperatures or with heating or air conditioning in buildings. Most studies have found that the retention pseudocyst is more common in males.
The retention pseudocyst rarely causes any signs or symptoms, and thus the patient is usually unaware of the lesion. It often is noticed as an incidental fi nding on radiographs made for other purposes. However, when the pseudocyst completely fi lls the maxillary sinus cavity, it may prolapse (extrude) through the ostium and cause nasal obstruction and postnasal discharge. This may be the only clinical evidence of the presence of the pseudocyst. Because either type of retention pseudocyst may enlarge and fi ll a sinus cavity, it frequently ruptures as a result of abrupt pressure changes caused by sneezing or blowing of the nose. If this does not happen, the expanding pseudo-cyst may herniate through the ostium into the nasal cavity, where it subsequently ruptures. The pseudocyst may be present on radio-graphic examination of the maxillary sinus, perhaps absent only a few days later, only to reappear on subsequent examinations.
The maxillary sinus is the most common site of retention pseudo-cysts, although they are occasionally found in the frontal or sphenoid
FIG. 27-8 Axial (A) and sagittal (B) cone-beam CT images show peripheral bony thickening of the left maxillary sinus from chronic sinusitis.
A B
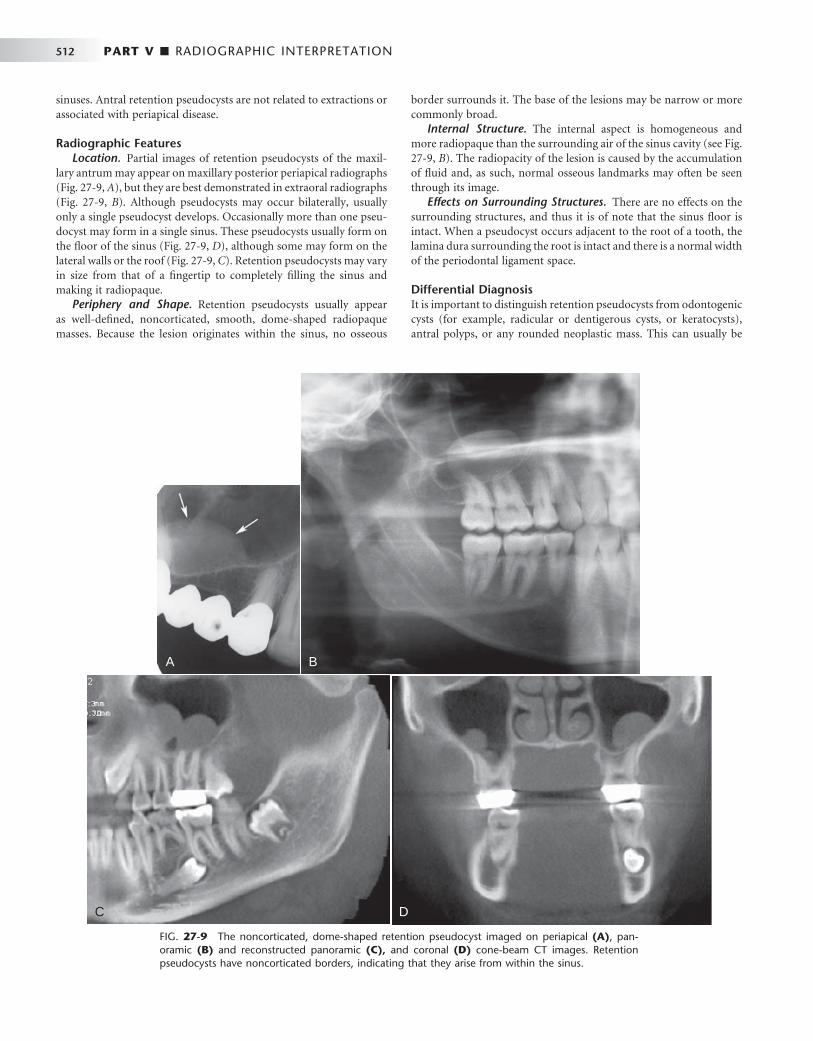
512 PART V ■ RADIOGRAPHIC INTERPRETATION
sinuses. Antral retention pseudocysts are not related to extractions or associated with periapical disease.
Radiographic Features Location. Partial images of retention pseudocysts of the maxil-
lary antrum may appear on maxillary posterior periapical radiographs ( Fig. 27-9, A ), but they are best demonstrated in extraoral radiographs ( Fig. 27-9, B ). Although pseudocysts may occur bilaterally, usually only a single pseudocyst develops. Occasionally more than one pseu-docyst may form in a single sinus. These pseudocysts usually form on the fl oor of the sinus ( Fig. 27-9, D ), although some may form on the lateral walls or the roof ( Fig. 27-9, C ). Retention pseudocysts may vary in size from that of a fi ngertip to completely fi lling the sinus and making it radiopaque.
Periphery and Shape. Retention pseudocysts usually appear as well-defi ned, noncorticated, smooth, dome-shaped radiopaque masses. Because the lesion originates within the sinus, no osseous
border surrounds it. The base of the lesions may be narrow or more commonly broad.
Internal Structure. The internal aspect is homogeneous and more radiopaque than the surrounding air of the sinus cavity (see Fig. 27-9, B ). The radiopacity of the lesion is caused by the accumulation of fl uid and, as such, normal osseous landmarks may often be seen through its image.
Effects on Surrounding Structures. There are no effects on the surrounding structures, and thus it is of note that the sinus fl oor is intact. When a pseudocyst occurs adjacent to the root of a tooth, the lamina dura surrounding the root is intact and there is a normal width of the periodontal ligament space.
Differential Diagnosis It is important to distinguish retention pseudocysts from odontogenic cysts (for example, radicular or dentigerous cysts, or keratocysts), antral polyps, or any rounded neoplastic mass. This can usually be
FIG. 27-9 The noncorticated, dome-shaped retention pseudocyst imaged on periapical (A) , pan-oramic (B) and reconstructed panoramic (C), and coronal (D) cone-beam CT images. Retention pseudocysts have noncorticated borders, indicating that they arise from within the sinus.
A B
C D

CHAPTER 27 ■ PARANASAL SINUSES 513
done radiographically and by the patient ’ s history. Commonly, the fl oor of the antrum is displaced by the odontogenic cyst, and the border of the cyst becomes coincident with the bony sinus fl oor. In some instances, periodic fenestrations can be seen through the bony sinus fl oor or cyst border. The retention pseudocyst is dome shaped but lacks the thin marginal radiopaque line representing the corti-cated border characteristic of the odontogenic cyst or tumor. The odontogenic cyst is also more rounded or tear drop shaped, and in the case of a radicular cyst, the lamina dura of the involved tooth or teeth is not intact in the apical area.
Antral polyps of infectious or allergic origin may be distinguished radiographically from a retention pseudocyst in that they are more often multiple. They are also commonly associated with a thickened mucous membrane, which is less frequently observed with retention pseudocysts.
Neoplasms may also mimic a retention pseudocyst. If they are benign and originating from outside the sinus, they are separated from the cavity of the sinus by a radiopaque border, similar to the odontogenic cysts. Malignant neoplasms may destroy the osseous border of the sinus, whether they arise from within the sinus or from the alveolar process. The neoplasm is, however, less likely to be as dome shaped as the retention pseudocyst.
Management Retention pseudocysts in the maxillary sinus usually require no treat-ment because they customarily resolve spontaneously without any residual effect on the antral mucosa.
Polyps
Defi nition The thickened mucous membrane of a chronically infl amed sinus frequently forms into irregular folds called polyps. Polyposis of the sinus mucosa may develop in an isolated area or in a number of areas throughout the sinus.
Clinical Features Polyps may cause displacement or destruction of bone. In the ethmoid air cells, polyps may cause destruction of the medial wall of the orbit (lamina papyracea of the ethmoid bone) and a unilateral proptosis.
Radiographic Features A polyp may be differentiated from a retention pseudocyst on a radio-graph by noting that a polyp usually occurs with a thickened mucous membrane lining because the polypoid mass is no more than an accentuation of the mucosal thickening. In the case of a retention pseudocyst, however, the adjacent mucous membrane lining is not usually apparent. If multiple retention pseudocysts are seen within a sinus, the possibility of sinus polyposis should be entertained.
The radiographic image of the bone displacement or destruction associated with polyps may mimic a benign or malignant neoplasm. Because many sinus neoplasms are asymptomatic, examination of a paranasal sinus that reveals bone destruction associated with radio pacifi cation is an indication for biopsy and should not be delayed by initial conservative treatment.
Antrolith
Defi nition Antroliths occur within the maxillary sinuses and are the result of deposition of mineral salts such as calcium phosphate, calcium car-bonate, and magnesium around a nidus, which may be introduced into the sinus (extrinsic) or could be intrinsic such as masses of stag-nant or inspissated mucous or cellular debris in sites of previous infl ammation.
Clinical Features The smaller antroliths are usually asymptomatic and usually are dis-covered as incidental fi ndings on radiographic examination. If they continue to grow, the patient may have associated sinusitis, blood-stained nasal discharge, nasal obstruction, or facial pain.
Radiographic Features Location. Antroliths occur within the maxillary sinus and thus
are positioned above the fl oor of the maxillary antrum in either peri-apical or panoramic radiographs ( Fig. 27-10 ).
Periphery and Shape. Antroliths have a well-defi ned periphery and may have a smooth or irregular shape.
Internal Structure. The internal aspect may vary in density from a barely perceptible radiopacity to an extremely radiopaque structure. The internal density may be homogenous or heterogeneous, and in
FIG. 27-10 The alternating circular radiopaque and radiolucent pattern of an antrolith is seen on a panoramic image (A) superimposed over the posterior wall of the right maxillary sinus. The coronal multidirectional tomographic image (B) confi rms the location of the antrolith within the sinus and, furthermore, shows the antrolith not to be attached to the adjacent sinus wall.
A B

514 PART V ■ RADIOGRAPHIC INTERPRETATION
some instances alternating layers of radiolucency and radiopacity in the form of laminations may be seen.
Differential Diagnosis Antroliths may be distinguished from root fragments in the sinus by inspection of the mass for the usual root anatomy such as the presence of a root canal. A displaced root fragment in the sinus may move when radiography is performed with the head in different positions, unless it is lodged between the bone and the sinus lining. Rhinoliths are similar calcifi cations but are found within the nasal fossae. Postero-anterior and lateral skull views help identify the location of a rhinolith.
Management An otolaryngologist may need to remove symptomatic antroliths.
Mucocele
Synonyms Pyocele and mucopyocele
Defi nition A mucocele is an expanding, destructive lesion that results from a blocked sinus ostium. The blockage may result from intra-antral or intranasal infl ammation, polyp, or neoplasm. The entire sinus thus becomes the pathologic cavity. As mucous secretions accumulate and the sinus cavity fi lls, the increase in intra-antral pressure results in thinning, displacement, and, in some cases, destruction of the sinus walls. When the cavity is fi lled with pus, it is termed an empyema, pyocele, or mucopyocele.
Clinical Features A mucocele in the maxillary sinus may exert pressure on the superior alveolar nerves and thus cause radiating pain. The patient may fi rst complain of a sensation of fullness in the cheek, and the area may swell. This swelling may fi rst become apparent over the anteroinferior aspect of the antrum, the area where the wall is thin, or destroyed. If the lesion expands inferiorly, it may cause loosening of the posterior teeth in the area. If the medial wall of the sinus is expanded, the lateral wall of the nasal cavity will deform and the nasal airway may be obstructed. Should it expand into the orbit, it may cause diplopia (double vision) or proptosis (protrusion of the globe of the eye).
Radiographic Features Location. About 90% of mucoceles occur in the ethmoid air cells
and frontal sinuses and rarely in the maxillary and sphenoid sinuses. Periphery and Shape. The normal shape of the sinus is changed
into a more circular, “ hydraulic ” shape as the mucocele enlarges. Internal Structure. The internal aspect of the sinus cavity is uni-
formly radiopaque ( Fig. 27-11, A ). Effects on Surrounding Structures. The shape of the sinus
changes as its margins are displaced outward and the bone expands. Septa and the bony walls may be severely thinned. When the mucocele is associated with the maxillary antrum, teeth may be displaced or roots resorbed. In the frontal sinus the usually scalloped border is smoothed by expansion, and the intersinus septum may be displaced ( Fig. 27-11, B ). The supramedial border of the orbit may be displaced or destroyed. In the ethmoid air cells, displacement of the lamina papyracea may occur, displacing the contents of the orbit. In the sphenoid sinus the expansion may be in a superior direction, suggest-ing a pituitary neoplasm.
Differential Diagnosis Although it may not be possible to distinguish between a mucocele in the maxillary antrum and a cyst or neoplasm, any suggestion that the lesion is associated with an occluded ostium should strengthen the likelihood of a mucocele. Blockage of the ostium is usually the result of a previous surgical procedure, although a deviated nasal septum or polyps may be a factor. A large odontogenic cyst displacing the maxil-lary antral fl oor may mimic a mucocele. Look for any remnants of the internal aspect of the antrum between the wall of the cyst and the wall of the antrum. CT is the imaging method of choice for making these distinctions.
Management Treatment of the mucocele is usually surgical, with a Caldwell-Luc operation to allow excision of the lesion. The prognosis is excellent.
Neoplasms
Benign neoplasms of the paranasal sinuses other than infl ammatory polyps are rare. The radiographic images of such benign neoplasms are nonspecifi c. Usually the involved portion of the sinus appears
FIG. 27-11 A mucocele has caused the radiopacifi cation of the right maxillary sinus. Note the lack of a distinct border to the sinus on the panoramic image (A). A coronal CT image (B) through the mucocele shows expansion into the nasal fossa (arrow) and the infratemporal fossa.
A B
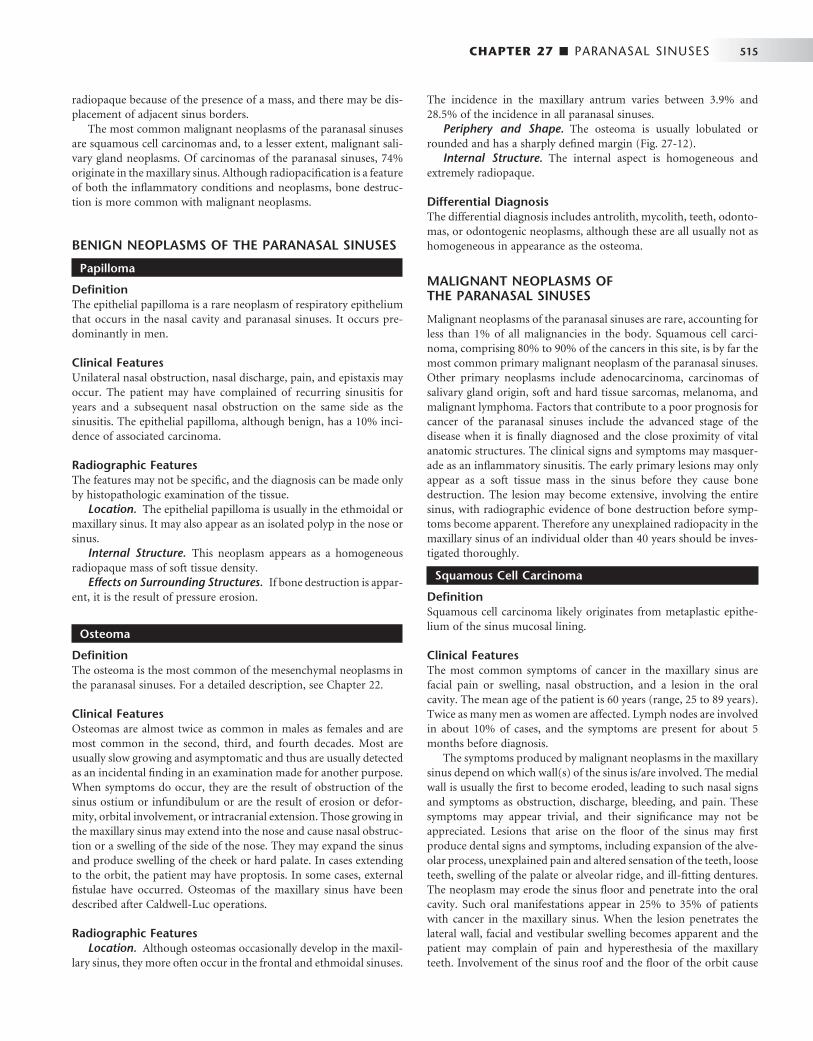
CHAPTER 27 ■ PARANASAL SINUSES 515
radiopaque because of the presence of a mass, and there may be dis-placement of adjacent sinus borders.
The most common malignant neoplasms of the paranasal sinuses are squamous cell carcinomas and, to a lesser extent, malignant sali-vary gland neoplasms. Of carcinomas of the paranasal sinuses, 74% originate in the maxillary sinus. Although radiopacifi cation is a feature of both the infl ammatory conditions and neoplasms, bone destruc-tion is more common with malignant neoplasms.
BENIGN NEOPLASMS OF THE PARANASAL SINUSES
Papilloma
Defi nition The epithelial papilloma is a rare neoplasm of respiratory epithelium that occurs in the nasal cavity and paranasal sinuses. It occurs pre-dominantly in men.
Clinical Features Unilateral nasal obstruction, nasal discharge, pain, and epistaxis may occur. The patient may have complained of recurring sinusitis for years and a subsequent nasal obstruction on the same side as the sinusitis. The epithelial papilloma, although benign, has a 10% inci-dence of associated carcinoma.
Radiographic Features The features may not be specifi c, and the diagnosis can be made only by histopathologic examination of the tissue.
Location. The epithelial papilloma is usually in the ethmoidal or maxillary sinus. It may also appear as an isolated polyp in the nose or sinus.
Internal Structure. This neoplasm appears as a homogeneous radiopaque mass of soft tissue density.
Effects on Surrounding Structures. If bone destruction is appar-ent, it is the result of pressure erosion.
Osteoma
Defi nition The osteoma is the most common of the mesenchymal neoplasms in the paranasal sinuses. For a detailed description, see Chapter 22 .
Clinical Features Osteomas are almost twice as common in males as females and are most common in the second, third, and fourth decades. Most are usually slow growing and asymptomatic and thus are usually detected as an incidental fi nding in an examination made for another purpose. When symptoms do occur, they are the result of obstruction of the sinus ostium or infundibulum or are the result of erosion or defor-mity, orbital involvement, or intracranial extension. Those growing in the maxillary sinus may extend into the nose and cause nasal obstruc-tion or a swelling of the side of the nose. They may expand the sinus and produce swelling of the cheek or hard palate. In cases extending to the orbit, the patient may have proptosis. In some cases, external fi stulae have occurred. Osteomas of the maxillary sinus have been described after Caldwell-Luc operations.
Radiographic Features Location. Although osteomas occasionally develop in the maxil-
lary sinus, they more often occur in the frontal and ethmoidal sinuses.
The incidence in the maxillary antrum varies between 3.9% and 28.5% of the incidence in all paranasal sinuses.
Periphery and Shape. The osteoma is usually lobulated or rounded and has a sharply defi ned margin ( Fig. 27-12 ).
Internal Structure. The internal aspect is homogeneous and extremely radiopaque.
Differential Diagnosis The differential diagnosis includes antrolith, mycolith, teeth, odonto-mas, or odontogenic neoplasms, although these are all usually not as homogeneous in appearance as the osteoma.
MALIGNANT NEOPLASMS OF THE PARANASAL SINUSES
Malignant neoplasms of the paranasal sinuses are rare, accounting for less than 1% of all malignancies in the body. Squamous cell carci-noma, comprising 80% to 90% of the cancers in this site, is by far the most common primary malignant neoplasm of the paranasal sinuses. Other primary neoplasms include adenocarcinoma, carcinomas of salivary gland origin, soft and hard tissue sarcomas, melanoma, and malignant lymphoma. Factors that contribute to a poor prognosis for cancer of the paranasal sinuses include the advanced stage of the disease when it is fi nally diagnosed and the close proximity of vital anatomic structures. The clinical signs and symptoms may masquer-ade as an infl ammatory sinusitis. The early primary lesions may only appear as a soft tissue mass in the sinus before they cause bone destruction. The lesion may become extensive, involving the entire sinus, with radiographic evidence of bone destruction before symp-toms become apparent. Therefore any unexplained radiopacity in the maxillary sinus of an individual older than 40 years should be inves-tigated thoroughly.
Squamous Cell Carcinoma
Defi nition Squamous cell carcinoma likely originates from metaplastic epithe-lium of the sinus mucosal lining.
Clinical Features The most common symptoms of cancer in the maxillary sinus are facial pain or swelling, nasal obstruction, and a lesion in the oral cavity. The mean age of the patient is 60 years (range, 25 to 89 years). Twice as many men as women are affected. Lymph nodes are involved in about 10% of cases, and the symptoms are present for about 5 months before diagnosis.
The symptoms produced by malignant neoplasms in the maxillary sinus depend on which wall(s) of the sinus is/are involved. The medial wall is usually the fi rst to become eroded, leading to such nasal signs and symptoms as obstruction, discharge, bleeding, and pain. These symptoms may appear trivial, and their signifi cance may not be appreciated. Lesions that arise on the fl oor of the sinus may fi rst produce dental signs and symptoms, including expansion of the alve-olar process, unexplained pain and altered sensation of the teeth, loose teeth, swelling of the palate or alveolar ridge, and ill-fi tting dentures. The neoplasm may erode the sinus fl oor and penetrate into the oral cavity. Such oral manifestations appear in 25% to 35% of patients with cancer in the maxillary sinus. When the lesion penetrates the lateral wall, facial and vestibular swelling becomes apparent and the patient may complain of pain and hyperesthesia of the maxillary teeth. Involvement of the sinus roof and the fl oor of the orbit cause
516 PART V ■ RADIOGRAPHIC INTERPRETATION
signs and symptoms related to the eye: diplopia, proptosis, pain, and hyperesthesia or anesthesia and pain over the cheek and upper teeth. Invasion and penetration of the posterior wall lead to invasion of the muscles of mastication, causing painful trismus, obstruction of the eustachian tube causing a stuffy ear, and referred pain and hyperes-thesia over the distribution of the second and third divisions of the fi fth nerve.
Radiographic Features Sometimes the radiographic fi ndings, especially in early malignant disease of the paranasal sinuses, are nonspecifi c. It may not be possible to differentiate the early manifestations in radiographs of the maxil-lary sinus from the radiopacity of the sinus that develops in sinusitis and polyp formation. Evidence relies on changes seen in the sur-rounding bone, the sinus walls, and the maxillary alveolar process.
Location. Most carcinomas occur in the maxillary sinuses, but involvement of the frontal and sphenoid sinuses is also comparatively common.
Internal Structure. The internal aspect of the maxillary sinus has a soft tissue radiopaque appearance.
Effects on Surrounding Structures. As the lesion enlarges, it may destroy sinus walls and in general, cause irregular radiolucent areas in the surrounding bone. A detailed examination of the adjacent alveolar process may reveal bone destruction around the teeth or irregular widening of the periodontal ligament space. Frequently the medial wall of the maxillary sinus is thinned or destroyed, although there may also be destruction of the fl oor and anterior or posterior walls that may be detected in the panoramic fi lm. The medial wall of the maxillary sinus is best seen on the Caldwell and Waters projections. In addition to loss of the medial wall, it may extend into the nasal cavity.
A B
D
C
FIG. 27-12 Coronal (A) and sagittal (B) cone-beam CT images show an osteoma attached to the lateral wall of an anterior ethmoid air cell and coronal (C) and axial (D) CT images of an osteoma in the frontal sinus. (Courtesy Dr. Eugene Yu, Princess Margaret Hospital.)

CHAPTER 27 ■ PARANASAL SINUSES 517
Additional Imaging If a conventional radiograph of any radiopacifi ed sinus reveals the slightest suggestion of bone destruction, advanced imaging is impera-tive ( Fig. 27-13 ). On CT, the most characteristic sign of malignancy is invasion into the soft tissue facial planes beyond the sinus walls ( Fig. 27-14 ). Consequently, CT is useful in revealing the extent of paranasal sinus neoplasms, especially when extension into the orbit, infratem-poral fossa, or cranial cavity has occurred. MRI examinations are excellent for revealing the extent of soft tissue penetration into adja-cent structures and in differentiating mucus accumulation from the soft tissue mass of the neoplasm.
Differential Diagnosis The differential diagnosis includes all the conditions that may cause radiopacity of the antrum, such as sinusitis, large retention pseudo-cysts, and odontogenic cysts. It is important to note that bone destruc-tion may also occur in infectious and some benign conditions. Neoplasms should be suspected in any older patient in whom chronic sinusitis develops for the fi rst time without an obvious cause.
Management Treatment of squamous cell carcinoma in the paranasal sinuses gener-ally combines surgery and radiation therapy. Malignant neoplasms in the paranasal sinuses usually have a poor prognosis because they are usually well advanced by the time of diagnosis. Other factors contrib-uting to the poor prognosis include frequently inaccurate preopera-tive staging and the complex anatomy of the region.
Pseudotumor
Synonyms Invasive fungal sinusitis, infl ammatory pseudotumor, fi broinfl amma-tory pseudotumor, plasma cell granuloma, sinonasal fungal disease, mucormycosis, aspergillosis, zygomycosis of the paranasal sinuses, and Rhizopus sinusitis
Defi nition Pseudotumor is a descriptive name for a group of apparently related diseases of fungal origin that occur in the paranasal sinuses and in other parts of the head and neck.
FIG. 27-13 A, This panoramic image of a squa-mous cell carcinoma shows a loss of defi nition of the cortex of the left maxillary sinus, nasal fl oor, and alveolar crest. B, The Waters view of the same patient shows a similar loss of cortical integrity to the lateral wall of the left maxilla and radiopacifi ca-tion of the left maxillary sinus. (Courtesy Dr. K. Dolan.)
A
B

518 PART V ■ RADIOGRAPHIC INTERPRETATION
Differential Diagnosis The differential diagnosis includes benign and malignant neoplasms.
Management The treatment of pseudotumor, which can include debridement of the sinuses and administration of antifungal medication, a Caldwell-Luc surgical approach, and therapy, refl ects the differences in the specifi c lesions included under the term pseudotumor of the sinuses, the exact location of the disease, the organism involved, and the medical status of the patient.
Extrinsic Diseases Involving the Paranasal Sinuses
INFLAMMATORY DISEASES
Dental infl ammatory lesions such as periodontal disease or rarefying or sclerosing osteitis may cause a localized mucositis in the adjacent fl oor of the maxillary antrum. This is a result of the diffusion of infl ammatory exudate (mediators) beyond the cortical fl oor of the antrum and into the periosteum and the mucosal lining of the sinus. The localized type of mucositis related to dental infl ammatory disease usually resolves in days or weeks after successful treatment of the underlying cause.
Radiographic Features The involved mucosa presents as a homogeneous radiopaque, ribbon-shaped shadow that follows the contour of the fl oor of the maxillary sinus (see Fig. 27-5 ). The thickened mucosa is usually centered directly above the infl ammatory lesion.
Periostitis
Defi nition As previously described, the exudate from dental infl ammatory lesions can diffuse through the cortical boundary of the antral fl oor. These products can strip and elevate the periosteal lining of the cortical bone of the fl oor of the maxillary antrum, stimulating the periosteum to produce an elevated thin layer of new bone adjacent to the root apex of the involved tooth ( Fig. 27-15 ). The presence of one or more halo-like layer(s) of new bone indicates infl ammation of the periosteum.
FIG. 27-14 A, This axial bone algorithm CT image of a squamous cell carcinoma of the left maxillary sinus shows destruction of the pos-terolateral wall and the medial wall of the sinus. B, The same axial image slice with soft tissue algorithm demonstrates extension of the malignant tumor into the surrounding soft tissues (arrows).
A
B
FIG. 27-15 The halolike appearance of bone surrounding the roots of a maxillary second molar is the result of periosteal new bone forma-tion and displacement of the adjacent maxillary sinus fl oor (arrows).
Clinical Features Pseudotumor often occurs after a series of recurrent infections. The symptoms may not be very specifi c. There may be recurring pain and a mass simulating a neoplasm. The latter may cause erosion of the walls of the involved sinus and proptosis if the orbit is involved. Altered nerve function resulting from involvement of the nerve or occlusion of blood vessels by the mass has also been reported. Although cases have been reported in otherwise healthy individuals, many cases appear in patients who are immunocompromised or who have sys-temic diseases such as diabetes mellitus, von Willebrand disease, or myelodysplasia.
Radiographic Features The radiographic fi ndings in pseudotumor include masses simulating malignant neoplasms that cause erosion of bony walls of the involved sinuses.
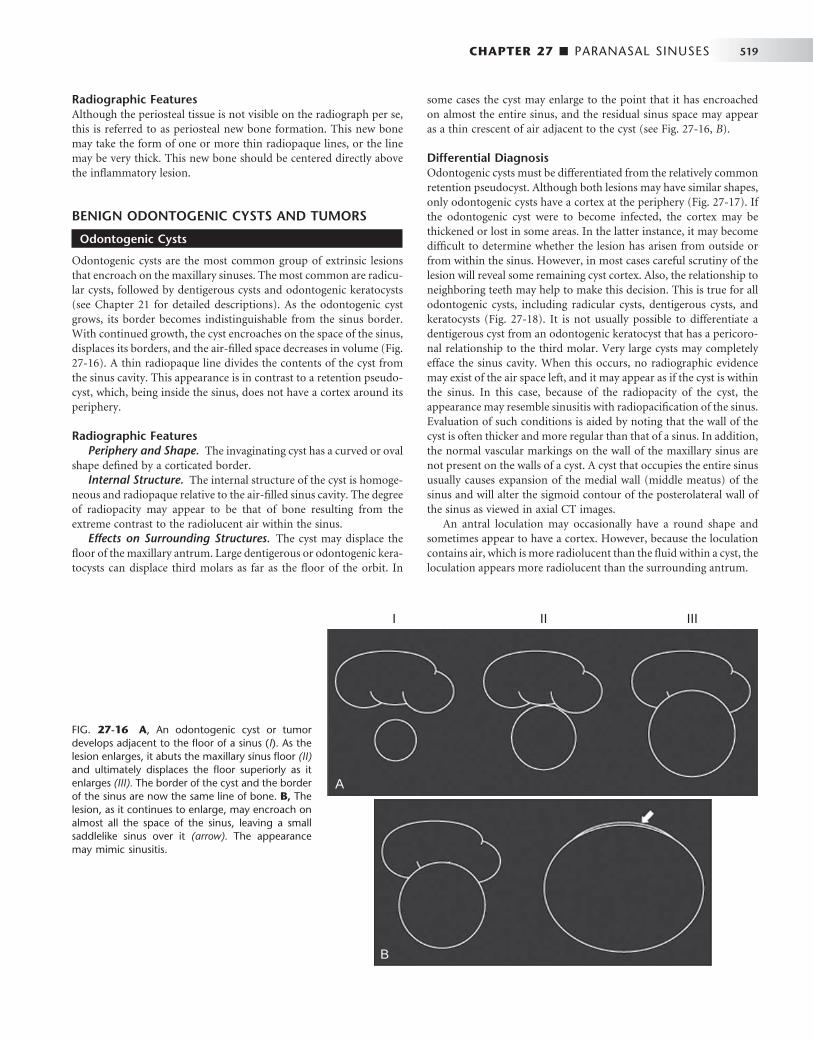
CHAPTER 27 ■ PARANASAL SINUSES 519
Radiographic Features Although the periosteal tissue is not visible on the radiograph per se, this is referred to as periosteal new bone formation. This new bone may take the form of one or more thin radiopaque lines, or the line may be very thick. This new bone should be centered directly above the infl ammatory lesion.
BENIGN ODONTOGENIC CYSTS AND TUMORS
Odontogenic Cysts
Odontogenic cysts are the most common group of extrinsic lesions that encroach on the maxillary sinuses. The most common are radicu-lar cysts, followed by dentigerous cysts and odontogenic keratocysts (see Chapter 21 for detailed descriptions). As the odontogenic cyst grows, its border becomes indistinguishable from the sinus border. With continued growth, the cyst encroaches on the space of the sinus, displaces its borders, and the air-fi lled space decreases in volume ( Fig. 27-16 ). A thin radiopaque line divides the contents of the cyst from the sinus cavity. This appearance is in contrast to a retention pseudo-cyst, which, being inside the sinus, does not have a cortex around its periphery.
Radiographic Features Periphery and Shape. The invaginating cyst has a curved or oval
shape defi ned by a corticated border. Internal Structure. The internal structure of the cyst is homoge-
neous and radiopaque relative to the air-fi lled sinus cavity. The degree of radiopacity may appear to be that of bone resulting from the extreme contrast to the radiolucent air within the sinus.
Effects on Surrounding Structures. The cyst may displace the fl oor of the maxillary antrum. Large dentigerous or odontogenic kera-tocysts can displace third molars as far as the fl oor of the orbit. In
some cases the cyst may enlarge to the point that it has encroached on almost the entire sinus, and the residual sinus space may appear as a thin crescent of air adjacent to the cyst (see Fig. 27-16, B ).
Differential Diagnosis Odontogenic cysts must be differentiated from the relatively common retention pseudocyst. Although both lesions may have similar shapes, only odontogenic cysts have a cortex at the periphery ( Fig. 27-17 ). If the odontogenic cyst were to become infected, the cortex may be thickened or lost in some areas. In the latter instance, it may become diffi cult to determine whether the lesion has arisen from outside or from within the sinus. However, in most cases careful scrutiny of the lesion will reveal some remaining cyst cortex. Also, the relationship to neighboring teeth may help to make this decision. This is true for all odontogenic cysts, including radicular cysts, dentigerous cysts, and keratocysts ( Fig. 27-18 ). It is not usually possible to differentiate a dentigerous cyst from an odontogenic keratocyst that has a pericoro-nal relationship to the third molar. Very large cysts may completely efface the sinus cavity. When this occurs, no radiographic evidence may exist of the air space left, and it may appear as if the cyst is within the sinus. In this case, because of the radiopacity of the cyst, the appearance may resemble sinusitis with radiopacifi cation of the sinus. Evaluation of such conditions is aided by noting that the wall of the cyst is often thicker and more regular than that of a sinus. In addition, the normal vascular markings on the wall of the maxillary sinus are not present on the walls of a cyst. A cyst that occupies the entire sinus usually causes expansion of the medial wall (middle meatus) of the sinus and will alter the sigmoid contour of the posterolateral wall of the sinus as viewed in axial CT images.
An antral loculation may occasionally have a round shape and sometimes appear to have a cortex. However, because the loculation contains air, which is more radiolucent than the fl uid within a cyst, the loculation appears more radiolucent than the surrounding antrum.
FIG. 27-16 A , An odontogenic cyst or tumor develops adjacent to the fl oor of a sinus ( I ). As the lesion enlarges, it abuts the maxillary sinus fl oor (II) and ultimately displaces the fl oor superiorly as it enlarges (III). The border of the cyst and the border of the sinus are now the same line of bone. B, The lesion, as it continues to enlarge, may encroach on almost all the space of the sinus, leaving a small saddlelike sinus over it (arrow). The appearance may mimic sinusitis.
A
B
I II III

520 PART V ■ RADIOGRAPHIC INTERPRETATION
FIG. 27-17 A, Periapical image of a small radicular cyst; note the peripheral cortex (arrows) com-pared with B, a periapical image of a pseudocyst; note the lack of a peripheral cortex. C, Axial CT image of a large radicular cyst; note the peripheral cortex (arrow) inside the outer cortex of the sinus.
A B
C
After the successful treatment of an odontogenic lesion in the maxilla, healing will ensue in the affected area. This may include “ col-lapse ” of the bony cavity and remodeling of the sinus fl oor. The end result is the appearance of an irregularly shaped bone formation along the fl oor of the sinus.
Odontogenic Tumors
Generally, benign odontogenic tumors can cause facial deformity, nasal obstruction, and displacement or loosening of teeth. For detailed descriptions of specifi c tumors, see Chapter 22 . The nature of bony barriers in this region of the face, and the relatively good blood supply, are probably also responsible for effi cient local spread. Some odonto-genic tumors, particularly the ameloblastoma and the myxoma, show a more aggressive pattern of growth in the maxilla and have a close proximity to vital structures in the skull base. Therefore management of such tumors in the maxillae is often more aggressive than in cases involving the mandible.
Radiographic Features Periphery and Shape. The enlarging tumor may have a curved,
oval, or multilocular shape that may be defi ned by a thin cortical
border as it encroaches on the sinus. More aggressively growing tumors may even lack a portion of the border.
Internal Structure. The internal structure of the tumor may have coarse or fi ne septae or regions of dystrophic calcifi cation, depending on the histopathologic nature of the tumor.
Effects on Surrounding Structures. The tumor may displace the fl oor of the maxillary antrum and cause thinning of the peripheral cortex. As with odontogenic cysts, in some cases the tumor may enlarge to the point where it has almost completely encroached on the sinus air space, and this residual space may appear as a thin saddle over the tumor.
The bony walls of the sinus may be thinned or eroded, and adja-cent structures may be displaced. A tooth or part of a tooth may be embedded in the neoplasm.
FIBROUS DYSPLASIA
Fibrous dysplasia may arise adjacent to any of the paranasal sinuses, cause displacement of sinus borders, and result in a smaller sinus on the affected side. For a detailed description of fi brous dysplasia, see Chapter 24 .

CHAPTER 27 ■ PARANASAL SINUSES 521
FIG. 27-18 A series of images showing displacement of the left maxillary sinus fl oor as a result of a developing dentigerous cyst associated with the maxillary left third molar. The corticated periphery of the cyst is well seen in the panoramic, occlusal, and Waters images ( A, B, and C ). The coronal CT image (D) shows the displaced fl oor of the left maxillary sinus, and the axial image (E) shows the bowing of the posterior sinus wall and the impacted tooth adjacent to it.
A B
C
D E
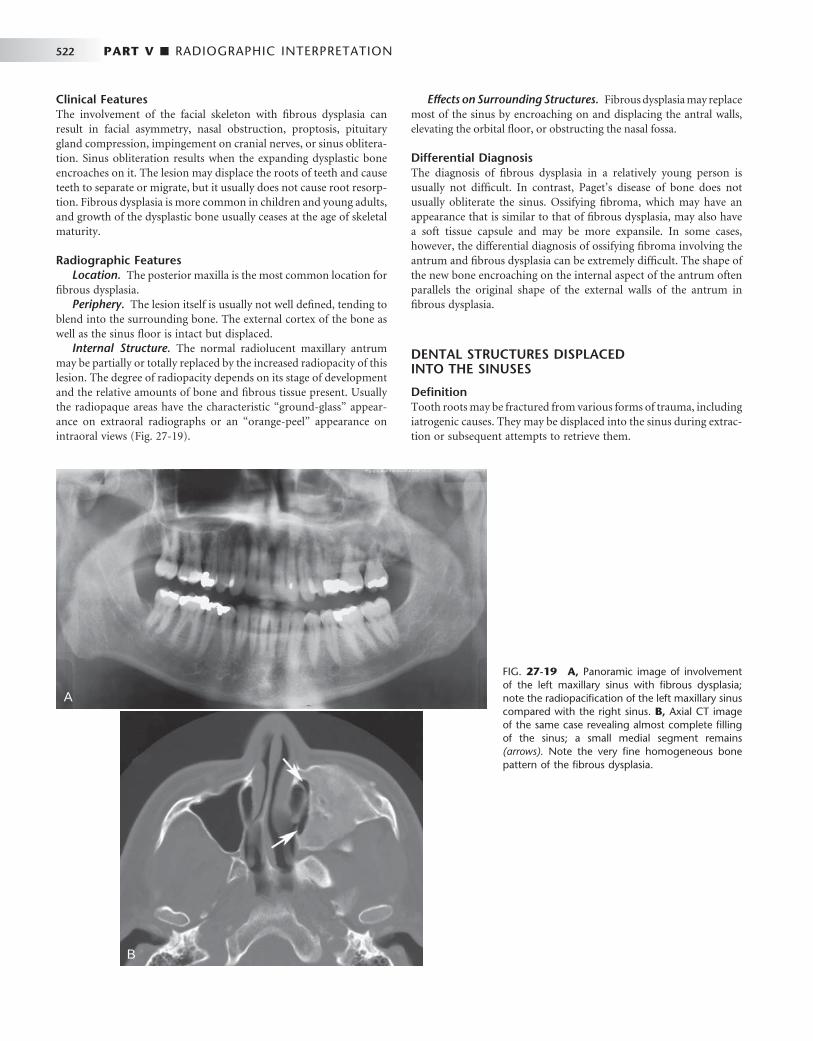
522 PART V ■ RADIOGRAPHIC INTERPRETATION
Clinical Features The involvement of the facial skeleton with fi brous dysplasia can result in facial asymmetry, nasal obstruction, proptosis, pituitary gland compression, impingement on cranial nerves, or sinus oblitera-tion. Sinus obliteration results when the expanding dysplastic bone encroaches on it. The lesion may displace the roots of teeth and cause teeth to separate or migrate, but it usually does not cause root resorp-tion. Fibrous dysplasia is more common in children and young adults, and growth of the dysplastic bone usually ceases at the age of skeletal maturity.
Radiographic Features Location. The posterior maxilla is the most common location for
fi brous dysplasia. Periphery. The lesion itself is usually not well defi ned, tending to
blend into the surrounding bone. The external cortex of the bone as well as the sinus fl oor is intact but displaced.
Internal Structure. The normal radiolucent maxillary antrum may be partially or totally replaced by the increased radiopacity of this lesion. The degree of radiopacity depends on its stage of development and the relative amounts of bone and fi brous tissue present. Usually the radiopaque areas have the characteristic “ ground-glass ” appear-ance on extraoral radiographs or an “ orange-peel ” appearance on intraoral views ( Fig. 27-19 ).
Effects on Surrounding Structures. Fibrous dysplasia may replace most of the sinus by encroaching on and displacing the antral walls, elevating the orbital fl oor, or obstructing the nasal fossa.
Differential Diagnosis The diagnosis of fi brous dysplasia in a relatively young person is usually not diffi cult. In contrast, Paget ’ s disease of bone does not usually obliterate the sinus. Ossifying fi broma, which may have an appearance that is similar to that of fi brous dysplasia, may also have a soft tissue capsule and may be more expansile. In some cases, however, the differential diagnosis of ossifying fi broma involving the antrum and fi brous dysplasia can be extremely diffi cult. The shape of the new bone encroaching on the internal aspect of the antrum often parallels the original shape of the external walls of the antrum in fi brous dysplasia.
DENTAL STRUCTURES DISPLACED INTO THE SINUSES
Defi nition Tooth roots may be fractured from various forms of trauma, including iatrogenic causes. They may be displaced into the sinus during extrac-tion or subsequent attempts to retrieve them.
FIG. 27-19 A, Panoramic image of involvement of the left maxillary sinus with fi brous dysplasia; note the radiopacifi cation of the left maxillary sinus compared with the right sinus. B, Axial CT image of the same case revealing almost complete fi lling of the sinus; a small medial segment remains (arrows). Note the very fi ne homogeneous bone pattern of the fi brous dysplasia.
A
B

CHAPTER 27 ■ PARANASAL SINUSES 523
Clinical Features No specifi c features may be visible if the root was displaced into the sinus recently. However, the dentist may note the absence of the root fragment on examining the extracted tooth and may be unable to locate it anywhere else. Sometimes asking the patient to hold his or her nose while attempting to breathe out through it, similar to a Valsalva maneuver, will cause bubbles to appear within the blood contained within the fresh extraction socket.
If the patient has had the root or tooth in the sinus for a number of days, the presenting symptom may be sinusitis (see the previous discussion on sinusitis).
Radiographic Features Location. Premolar or molar teeth or root fragments may be
displaced into the sinus because of their proximity. These may be found anywhere within the sinus, but more often they are located near the fl oor of the sinus because of gravity. Sometimes they may be sub-mucosal, between the osseous wall of the sinus and the periosteum.
Lateral maxillary occlusal views are useful for examining the max-illary sinus for displaced teeth or root fragments. Other radiographs made along a different projection axis, such as a Waters view, may help in the three-dimensional localization.
Periphery and Shape. No immediate evidence of change may be appreciated in the sinus, even when an oroantral fi stula has been created. The disruption of the sinus wall may be diffi cult or impossible to see on radiographs if it is not in the mesial, distal, or superior (apical) part of the alveolar process.
Internal Structure. In the early stages, no internal structural changes are present, except that the dental fragment may appear as a radiopaque mass of a size corresponding to the missing tooth or tooth root fragment.
Effects on Surrounding Structures. The dental fragment usually has no effect on surrounding structures; however, a sinusitis may result (see changes described earlier in this chapter under sinusitis). A break in the fl oor of the maxillary sinus caused by the displacement of the tooth or fragment into the sinus may be present but diffi cult to appreciate.
Differential Diagnosis Bony masses that are exostoses of the sinus wall or fl oor or septae within the sinus may mimic dental root fragments or even whole teeth. Antroliths may also have a similar appearance. The shape of the radiopacity or the presence of a pulp canal or layer of enamel may help in the differential diagnosis. It may also be possible to displace the tooth fragment by having the patient move the head abruptly between views. If the root tip remains in its socket, it may be super-imposed radiographically over the maxillary sinus, but the presence of a lamina dura and periodontal ligament space indicate a position within the alveolar process.
The displaced tooth or root fragment may be subperiosteal, and thus interior to the osseous wall of the sinus, but not within the antral lumen. Alternatively, the root may have been forced out of the socket into the surrounding bone, into the submucosal space, or surrounding anatomic space such as the infratemporal space. Another possibility is for the fragment to be displaced into a cyst that was preoperatively mistaken for a loculus of the sinus cavity. Use of radiographs at dif-ferent angles should help localize the dental structure.
Management Management ranges from following up the patient to see whether a small root tip will be removed from the sinus through the ostium by
ciliary action to surgically entering the sinus by a Caldwell-Luc pro-cedure to remove the dental structure. Sinusitis may develop and should be managed with the appropriate treatment.
For other trauma involving the paranasal sinuses, see Chapter 29 .
SUGGESTED READINGS
NORMAL DEVELOPMENT AND VARIATIONS
Dodd GD , Jing BS : Radiology of the nose, paranasal sinus and nasopharynx , Baltimore , 1977 , Williams & Wilkins .
DuBrul EL : Sicher ’ s oral anatomy , ed 7 , St. Louis , 1980 , Mosby . Grant JCB : A method of anatomy , Baltimore , 1958 , Williams & Wilkins . Hengerer AS : Embryonic development of the sinuses , Ear Nose Throat J
63 : 134 - 136 , 1984 . Karmody CS , Carter B , Vincent ME : Developmental anomalies of the
maxillary sinus , Trans Sect Otolaryngol Am Acad Ophthalmol Otolaryngol 84 : 723 - 728 , 1977 .
Lusted LB , Keats TE : Atlas of roentgenographic measurement , ed 3 , Chicago , 1972 , Year Book Medical Publishers .
Ritter FN : The paranasal sinuses: anatomy and surgical technique , St. Louis , 1973 , Mosby .
Scuderi AJ , Harnsberger HR , Boyer RS : Pneumatization of the paranasal sinuses: normal features of importance to the accurate interpretation of CT scans and MR images , AJR Am J Roentgenol 160 : 1101 - 1104 , 1993 .
Shapiro R : Radiology of the normal skull , Chicago , 1981 , Year Book Medical Publishers .
Som PM : The paranasal sinuses . In Bergeron RT , Osborn AG , Som PM , editors: Head and neck imaging: excluding the brain , St. Louis , 1984 , Mosby .
Takahashi R : The formation of the human paranasal sinuses , Acta Otolaryngol Suppl (Stockh) 408 : 1 - 28 , 1984 .
APPLIED DIAGNOSTIC IMAGING
Lloyd GA : Diagnostic imaging of the nose and paranasal sinuses , J Laryngol Otol 103 : 453 - 460 , 1989 .
Zinreich SJ : Imaging of chronic sinusitis in adults: x-ray, computed tomography, and magnetic resonance imaging , J Allergy Clin Immunol 90 : 445 - 451 , 1992 .
INFLAMMATORY CHANGES
Robinson K : Roentgenographic manifestations of benign paranasal disease , Ear Nose Throat J 63 : 144 , 1984 .
THICKENED MUCOUS MEMBRANE
Mucositis
Dolan K , Smoker W : Paranasal sinus radiology, Part 4A: maxillary sinuses , Head Neck Surg 5 : 345 - 362 , 1983 .
Killey HC , Kay LA : The maxillary sinus and its dental implications , Bristol , 1975 , John Wright .
PERIOSTITIS
Sinusitis
Druce HM : Diagnosis and medical management of recurrent and chronic sinusitis in adults . In Gershwin ME , Incaudo GA , editors: Diseases of the sinuses , Ottawa, Canada , 1996 , Humana Press .
Fireman P : Diagnosis of sinusitis in children: emphasis on the history and physical examination , J Allergy Clin Immunol 90 : 433 - 436 , 1992 .
Incaudo G , Gershwin ME , Nagy SM : The pathophysiology and treatment of sinusitis , Allergol Immunopathol (Madr) 14 : 423 - 434 , 1986 .
Kennedy DW : First-line management of sinusitis: a national problem? Surgical update , Otolaryngol Head Neck Surg 103 : 884 - 886 , 1990 .

524 PART V ■ RADIOGRAPHIC INTERPRETATION
Killey HC , Kay LA : The maxillary sinus and its dental implications , Bristol , 1975 , John Wright .
Palacios E , Valvassori G : Computed axial tomography in otorhinolaryngology , Adv Otorhinolaryngol 24 : 1 - 8 , 1978 .
Paparella MM : Mucosal cyst of the maxillary sinus , Arch Otolaryngol 77 : 650 - 670 , 1963 .
Poyton HG : Maxillary sinuses and the oral radiologist , Dent Radiogr Photogr 45 : 43 - 50 , 1972 .
Reilly JS : The sinusitis cycle , Otolaryngol Head Neck Surg 103 : 856 - 861 , 1990 .
Shapiro GG , Rachelefsky GS : Introduction and defi nition of sinusitis , J Allergy Clin Immunol 90 : 417 - 418 , 1992 .
Zinreich SJ : Imaging of chronic sinusitis in adults: x-ray, computed tomography, and magnetic resonance imaging , J Allergy Clin Immunol 90 : 445 - 451 , 1992 .
EMPYEMA
Ash JE , Raum M : An atlas of otolaryngic pathology , New York , 1956 , American Registry of Pathology .
Groves J , Gray RF : A synopsis of otolaryngology , Bristol , 1985 , John Wright .
POLYPS
Potter GD : Infl ammatory disease of the paranasal sinuses . In Valvassori GE , Potter GD , Hanefee WN , editors: Radiology of the ear, nose and throat , Philadelphia , 1982 , WB Saunders .
RETENTION PSEUDOCYSTS
Allard RH , van der Kwast WA , van der Waal JI : Mucosal antral cysts: review of the literature and report of a radiographic survey , Oral Surg Oral Med Oral Pathol 51 : 2 - 9 , 1981 .
Dolan K , Smoker W : Paranasal sinus radiology, Part 4A: maxillary sinuses , Head Neck Surg 5 : 345 - 362 , 1983 .
Gothberg K , Little JW , King DR et al : A clinical study of cysts arising from mucosa of the maxillary sinus , Oral Surg 41 : 52 - 58 , 1976 .
Hardy G : Benign cysts of the antrum , Ann Otol Rhinol Laryngol 48 : 649 , 1939 .
Kadymova MI : Lymphangiectatic (false) cysts of the maxillary sinuses and their relation with allergy , Vestn Otorhinolaringol 28 : 58 , 1966 .
Kaffe I , Littner MM , Moskona D : Mucosal-antral cysts: radiographic appearance and differential diagnosis , Clin Prev Dent 10 : 3 - 6 , 1988 .
McGregor GW : Formation and histologic structure of cysts of the maxillary sinus , Arch Otolaryngol 8 : 505 , 1928 .
Mills CP : Secretory cysts of the maxillary antrum and their relationship to the development of antrochoanal polypi , J Laryngol Otol 73 : 324 - 334 , 1959 .
Poyton HG : Oral radiology , Baltimore , 1982 , Williams & Wilkins . Ruprecht A , Batniji S , el-Neweihi E : Mucous retention cyst of the maxillary
sinus , Oral Surg Oral Med Oral Pathol 62 : 728 - 731 , 1986 . Shafer WG , Hine MK , Levy BM : A textbook of oral pathology , ed 4 ,
Philadelphia , 1983 , WB Saunders . van Norstrand AWP , Goodman WS : Pathologic aspects of mucosal lesions of
the maxillary sinus , Otolaryngol Clin North Am 9 : 21 - 34 , 1976 .
MUCOCELE
Atherino C , Atherino T : Maxillary sinus mucopyoceles , Arch Otolaryngol 110 : 200 , 1984 .
Jones JL , Kaufman PW : Mucopyocele of the maxillary sinus , J Oral Surg 39 : 948 , 1981 .
Zizmor JK , Noyek AM : The radiologic diagnosis of maxillary sinus disease , Otolaryngol Clin North Am 9 : 93 , 1976 .
ODONTOGENIC CYSTS
Killey HC , Kay LA : The maxillary sinus and its dental implications , Bristol , 1975 , John Wright .
Poyton H : Maxillary sinuses and the oral radiologist , Dent Radiogr Photogr 45 : 43 - 50 , 1972 .
Van Alyea OE : Nasal sinuses , Baltimore , 1951 , Williams & Wilkins .
Odontogenic Keratocysts
MacDonald-Jankowski DS : The involvement of the maxillary antrum by odontogenic keratocysts , Clin Radiol 45 : 31 - 33 , 1992 .
NEOPLASMS
Goepfert H , Luna MA , Lindberg RD et al : Malignant salivary gland tumors of the paranasal sinuses and nasal cavity , Arch Otolaryngol 109 : 662 - 668 , 1983 .
St-Pierre S , Baker SR : Squamous cell carcinoma of the maxillary sinus: analysis of 66 cases , Head Neck Surg 5 : 508 - 513 , 1983 .
Epithelial Papilloma
Rogers JH , Fredrickson JM , Noyek AM : Management of cysts, benign tumors, and bony dysplasia of the maxillary sinus , Otolaryngol Clin North Am 9 : 233 - 247 , 1976 .
Osteoma
Dolan K , Smoker W : Paranasal sinus radiology, Part 4B: maxillary sinuses , Head Neck Surg 5 : 428 - 446 , 1983 .
Goodnight J , Dulguerov P , Abemayor E : Calcifi ed mucor fungus ball of the maxillary sinus , Am J Otolaryngol 14 : 209 - 210 , 1993 .
Reuben BM : Odontoma of the maxillary sinus: a case report , Quintessence Int Dent Dig 14 : 287 - 290 , 1983 .
Samy LL , Mostofa H : Osteoma of the nose and paranasal sinuses with a report of twenty-one cases , J Laryngol Otol 85 : 449 - 469 , 1971 .
Ameloblastoma
Hames RS , Rakoff SJ : Diseases of the maxillary sinus , J Oral Med 27 : 90 - 95 , 1972 .
Reaume C , Wesley RK , Jung B et al : Ameloblastoma of the maxillary sinus , J Oral Surg 38 : 520 - 521 , 1980 .
Malignant Neoplasms of the Paranasal Sinuses
Batsakis JG : Tumors of the head and neck , ed 2 , Baltimore , 1979 , Williams & Wilkins .
St-Pierre S , Baker S : Squamous cell carcinoma of the maxillary sinus: analysis of 66 cases , Head Neck Surg 5 : 508 - 513 , 1983 .
Zizmor J , Noyek AM : Cysts, benign tumors and malignant tumors of the paranasal sinuses , Otolaryngol Clin North Am 6 : 487 - 508 , 1973 .
Squamous Cell Carcinoma
Batsakis JG , Rice DH , Solomon AR : The pathology of head and neck tumors: squamous and mucous-gland carcinomas of the nasal cavity, paranasal sinuses and larynx: part 6 , Head Neck Surg 2 : 497 - 508 , 1980 .
Bridger M , Beale F , Bryce D : Carcinoma of the paranasal sinuses: a review of 158 cases , J Otolaryngol 7 : 379 - 388 , 1978 .
Eddleston B , Johnson R : A comparison of conventional radiographic imaging and computed tomography in malignant disease of the paranasal sinuses and the post-nasal space , Clin Radiol 34 : 161 - 172 , 1983 .
Haso AN : CT of tumors and tumor-like conditions of the paranasal sinuses , Radiol Clin North Am 22 : 119 - 130 , 1984 .
Larheim TA , Kolbenstvedt A , Lien H : Carcinoma of maxillary sinus, palate and maxillary gingiva, occurrence of jaw destruction , Scand J Dent Res 92 : 235 - 240 , 1984 .
Lund VJ , Howard DJ , Lloyd GA : CT evaluation of paranasal sinus tumors for cranio-facial resection , Br J Radiol 56 : 439 - 446 , 1983 .
CHAPTER 27 ■ PARANASAL SINUSES 525
Mancuso A , Hanafee WN , Winter J et al : Extensions of paranasal sinus tumors and infl ammatory disease: an evaluation by CT and pluri- directional tomography , Neuroradiology 16 : 449 - 453 , 1978 .
St-Pierre S , Baker SR : Squamous cell carcinoma of the maxillary sinus: analysis of 66 cases , Head Neck Surg 5 : 508 - 513 , 1983 .
Thomas GK , Kasper KA : Ossifying fi broma of the frontal bone , Arch Otolaryngol 83 : 43 - 46 , 1966 .
Tsaknis PJ , Nelson JF : The maxillary ameloblastoma: an analysis of 24 cases , J Oral Surg 38 : 336 - 342 , 1980 .
Weber A , Tadmore R , Davis R et al : Malignant tumors of the sinuses: radiologic evaluation, including CT scanning, with clinical and pathologic correlation , Neuroradiology 16 : 443 - 448 , 1978 .
Pseudotumor
Butugan O , Sanchez TG , Gon ç alez F et al : Rhinocerebral mucormycosis: predisposing factors, diagnosis, therapy, complications and survival , Rev Laryngol Otol Rhinol (Bord) 117 : 53 , 1996 .
Del Valle Zapico A , Rubio Su á rez A , Mellado Encinas A et al : Mucormycosis of the sphenoid sinus in an otherwise healthy patient: case report and literature review , J Laryngol Otol 110 : 471 - 473 , 1996 .
Ishida M , Taya N , Noiri T et al : Five cases of mucormycosis in paranasal sinuses , Acta Otolaryngol 501 ( Suppl ): 92 - 96 , 1993 .
Lee BL , Holland GN , Glasgow BJ : Chiasmal infarction and sudden blindness caused by mucormycosis in AIDS and diabetes mellitus , Am J Ophthalmol 122 : 895 - 896 , 1996 .
Muzaffar M , Hussain SI , Chughtai A : Plasma cell granuloma: maxillary sinuses , J Laryngol Otol 108 : 357 - 358 , 1994 .
Ng TT , Campbell CK , Rothera M et al : Successful treatment of sinusitis caused by Cunninghamella bertholetiae , Clin Infect Dis 19 : 313 - 316 , 1994 .
Ozhan S , Ara ç M , Isik S et al : Pseudotumor of the maxillary sinus in a patient with von Willebrand ’ s disease , AJR Am J Roentgenol 166 : 950 - 951 , 1996 .
Perolada Valmana JM , Morera Perez C , Blanes Julia M et al : Mucormycosis of the paranasal sinuses , Rev Laryngol Otol Rhinol (Bord) 117 : 51 - 52 , 1996 .
Som PM , Brandwein MS , Maldjian C et al : Infl ammatory pseudotumor of the maxillary sinus: CT and MR fi ndings in six cases , AJR Am J Roentgenol 163 : 689 - 692 , 1994 .
Tkatch LS , Kusne S , Eibling D : Successful treatment of zygomycosis of the paranasal sinuses with surgical debridement and amphotericin B colloidal dispersion , Am J Otolaryngol 14 : 249 - 253 , 1993 .
Utas C , Unl ü hizarci K , Okten T et al : Acute renal failure associated with rhinosinuso-orbital mucormycosis infection in a patient with diabetic nephropathy [ letter ] , Nephron 71 : 235 , 1995 .
Zapater E , Armengot M , Campos A et al : Invasive fungal sinusitis in immunosuppressed patients: report of three cases , Acta Otorhinolaryngol Belg 50 : 137 - 142 , 1996 .
FIBROUS DYSPLASIA
Malcolmson KG : Ossifying fi broma of the sphenoid , J Laryngol Otol 81 : 87 - 92 , 1967 .
Thomas GK , Kasper KA : Ossifying fi broma of the frontal bone , Arch Otolaryngol 83 : 43 - 46 , 1966 .
Wong A , Vaughan CW , Strong MS : Fibrous dysplasia of temporal bone , Arch Otolaryngol 81 : 131 - 133 , 1965 .

C H A P T E R 2 8
Soft Tissue Calcifi cation and Ossifi cation
Laurie C. Carter
The deposition of calcium salts, primarily calcium phosphate, usually occurs in the skeleton. When it occurs in an unorga-nized fashion in soft tissue, it is referred to as heterotopic cal-
cifi cation. This soft tissue mineralization may develop in a wide variety of unrelated disorders and degenerative processes. Heterotopic calcifi cations may be divided into three categories:
• Dystrophic calcifi cation • Idiopathic calcifi cation • Metastatic calcifi cation Dystrophic calcifi cation refers to calcifi cation that forms in degen-
erating, diseased, and dead tissue despite normal serum calcium and phosphate levels. The soft tissue may be damaged by blunt trauma, infl ammation, injections, the presence of parasites, soft tissue changes arising from disease, and many other causes. This calcifi cation usually is localized to the site of injury. Idiopathic calcifi cation (or calcinosis) results from deposition of calcium in normal tissue despite normal serum calcium and phosphate levels. Examples include chondrocalci-nosis and phleboliths. Metastatic calcifi cation results when minerals precipitate into normal tissue as a result of higher than normal serum levels of calcium (e.g., hyperparathyroidism, hypercalcemia, of malig-nancy) or phosphate (e.g., chronic renal failure). Metastatic calcifi ca-tion usually occurs bilaterally and symmetrically.
When the mineral is deposited in soft tissue as organized, well-formed bone, the process is known as heterotopic ossifi cation. The term heterotopic indicates that bone has formed in an abnormal (extraskeletal) location. The heterotopic bone may be all compact bone, or it may show some trabeculae and fatty marrow. The deposits may range from 1 mm to several centimeters in diameter, and one or more may be present. The causes range from posttraumatic ossifi ca-tion, bone produced by tumors, and ossifi cation caused by diseases such as progressive myositis ossifi cans and ankylosing spondylitis.
Clinical Features
Sites of heterotopic calcifi cation or ossifi cation may not cause signifi -cant signs or symptoms; they most often are detected as incidental fi ndings during radiographic examination.
Radiographic Features
Soft tissue opacities are fairly common, present on about 4% of pan-oramic radiographs. In most cases the goal is to identify the calcifi ca-tion correctly to determine whether treatment or further investigation is required. Some soft tissue calcifi cations require no intervention or long-term surveillance, whereas others may be life threatening and the
underlying cause requires treatment. When the soft tissue calcifi cation is adjacent to bone, it sometimes is diffi cult to determine whether the calcifi cation is within bone or soft tissue. Another radiographic view at right angles is useful. The important criteria to consider in arriving at the correct interpretation are the anatomic location, number, dis-tribution, and shape of the calcifi cations. Analysis of the location requires knowledge of soft tissue anatomy, such as the position of lymph nodes, stylohyoid ligaments, blood vessels, laryngeal cartilages, and the major ducts of the salivary glands.
Dystrophic Calcifi cation
GENERAL DYSTROPHIC CALCIFICATION OF THE ORAL REGIONS
Defi nition Dystrophic calcifi cation is the precipitation of calcium salts into primary sites of chronic infl ammation or dead and dying tissue. This process is usually associated with a high local concentration of phos-phatase, as in normal bone calcifi cation, an increase in local alkalinity, and anoxic conditions within the inactive or devitalized tissue. A long-standing chronically infl amed cyst is a common location of dystrophic calcifi cation.
Clinical Features Common soft tissue sites include the gingiva, tongue, lymph nodes, and cheek. Dystrophic calcifi cations may produce no signs or symp-toms, although occasionally enlargement and ulceration of overlying soft tissues may occur, and a solid mass of calcium salts sometimes can be palpated.
Radiographic Features The radiographic appearance of dystrophic calcifi cation varies from barely perceptible, fi ne grains of radiopacities to larger, irregular radi-opaque particles that rarely exceed 0.5 cm in diameter. One or more of these radiopacities may be seen, and the calcifi cation may be homo-geneous or may contain punctate areas. The outline of the calcifi ed area usually is irregular or indistinct. Common sites are long-standing chronically infl amed cysts ( Fig. 28-1 ) and polyps ( Fig. 28-2 ).
CALCIFIED LYMPH NODES
Defi nition Dystrophic calcifi cation occurs in lymph nodes that have been chroni-cally infl amed because of various diseases, frequently granulomatous disorders. The lymphoid tissue becomes replaced by hydroxyapatite-
526
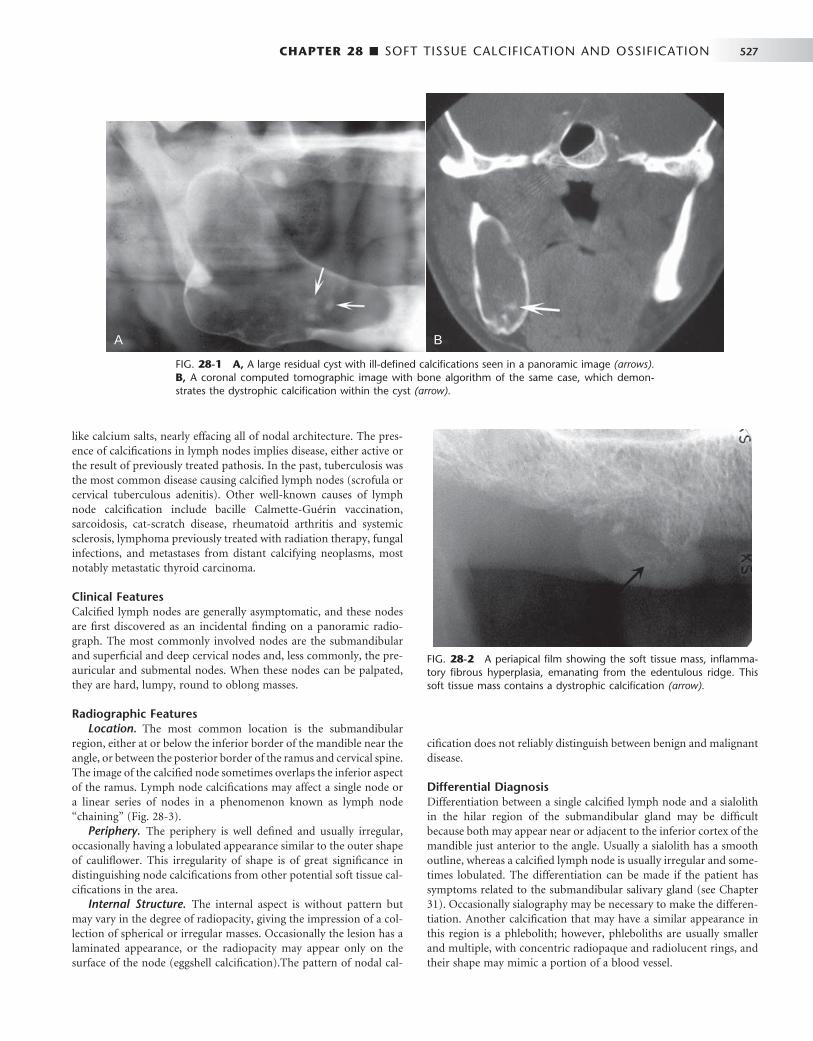
CHAPTER 28 ■ SOFT TISSUE CALCIFICATION AND OSSIFICATION 527
like calcium salts, nearly effacing all of nodal architecture. The pres-ence of calcifi cations in lymph nodes implies disease, either active or the result of previously treated pathosis. In the past, tuberculosis was the most common disease causing calcifi ed lymph nodes (scrofula or cervical tuberculous adenitis). Other well-known causes of lymph node calcifi cation include bacille Calmette-Gu é rin vaccination, sarcoidosis, cat-scratch disease, rheumatoid arthritis and systemic sclerosis, lymphoma previously treated with radiation therapy, fungal infections, and metastases from distant calcifying neoplasms, most notably metastatic thyroid carcinoma.
Clinical Features Calcifi ed lymph nodes are generally asymptomatic, and these nodes are fi rst discovered as an incidental fi nding on a panoramic radio-graph. The most commonly involved nodes are the submandibular and superfi cial and deep cervical nodes and, less commonly, the pre-auricular and submental nodes. When these nodes can be palpated, they are hard, lumpy, round to oblong masses.
Radiographic Features Location. The most common location is the submandibular
region, either at or below the inferior border of the mandible near the angle, or between the posterior border of the ramus and cervical spine. The image of the calcifi ed node sometimes overlaps the inferior aspect of the ramus. Lymph node calcifi cations may affect a single node or a linear series of nodes in a phenomenon known as lymph node “ chaining ” ( Fig. 28-3 ).
Periphery. The periphery is well defi ned and usually irregular, occasionally having a lobulated appearance similar to the outer shape of caulifl ower. This irregularity of shape is of great signifi cance in distinguishing node calcifi cations from other potential soft tissue cal-cifi cations in the area.
Internal Structure. The internal aspect is without pattern but may vary in the degree of radiopacity, giving the impression of a col-lection of spherical or irregular masses. Occasionally the lesion has a laminated appearance, or the radiopacity may appear only on the surface of the node (eggshell calcifi cation).The pattern of nodal cal-
cifi cation does not reliably distinguish between benign and malignant disease.
Differential Diagnosis Differentiation between a single calcifi ed lymph node and a sialolith in the hilar region of the submandibular gland may be diffi cult because both may appear near or adjacent to the inferior cortex of the mandible just anterior to the angle. Usually a sialolith has a smooth outline, whereas a calcifi ed lymph node is usually irregular and some-times lobulated. The differentiation can be made if the patient has symptoms related to the submandibular salivary gland (see Chapter 31 ). Occasionally sialography may be necessary to make the differen-tiation. Another calcifi cation that may have a similar appearance in this region is a phlebolith; however, phleboliths are usually smaller and multiple, with concentric radiopaque and radiolucent rings, and their shape may mimic a portion of a blood vessel.
FIG. 28-1 A, A large residual cyst with ill-defi ned calcifi cations seen in a panoramic image (arrows). B, A coronal computed tomographic image with bone algorithm of the same case, which demon-strates the dystrophic calcifi cation within the cyst (arrow).
A BA B
FIG. 28-2 A periapical fi lm showing the soft tissue mass, infl amma-tory fi brous hyperplasia, emanating from the edentulous ridge. This soft tissue mass contains a dystrophic calcifi cation (arrow).

528 PART V ■ RADIOGRAPHIC INTERPRETATION
Management Calcifi ed lymph nodes usually do not require treatment; however, the underlying cause should be established in case treatment is required, such as in the case of active disease.
Dystrophic Calcifi cation in the Tonsils
Synonyms Tonsillar calculi, tonsil concretions, and tonsilloliths
Defi nition Tonsillar calculi are formed when repeated bouts of infl ammation enlarge the tonsillar crypts. Incomplete resolution of organic debris (dead bacteria and pus, epithelial cells, and food) can serve as the nidus for dystrophic calcifi cation.
Clinical Features Tonsilloliths usually present as hard, round, white or yellow objects projecting from the tonsillar crypts, usually of the palatine tonsil. Small calcifi cations usually produce no clinical signs or symptoms. However, pain, swelling, fetor oris, dysphagia, or a foreign body sensa-tion on swallowing has been reported with larger calcifi cations. Giant tonsilloliths stretching lymphoid tissue resulting in ulceration and extrusion are much less common. These calcifi cations have been
reported to occur between 20 and 68 years of age; they are found more often in older age groups.
Radiographic Features Location. In the panoramic fi lm, tonsilloliths appear as single or
multiple radiopacities that overlap the mid portion of the mandibular ramus in the region where the image of the dorsal surface of the tongue crosses the ramus in the oropharyngeal air spaces. Tonsilloliths frequently appear on the panoramic radiograph immediately inferior to the mandibular canal ( Fig. 28-4 ).
Periphery. The most common appearance of tonsilloliths is a cluster of multiple small, ill-defi ned radiopacities. Rarely this calcifi -cation may attain a large size.
Internal Structure. These calcifi cations appear slightly more radiopaque than cancellous bone and approximately the same as cortical bone.
Differential Diagnosis The clinical differential diagnosis includes calcifi ed granulomatous disease, syphilis, mycosis, or lymphoma, which may produce a fi rm tonsillar mass. The essential radiographic differential diagnosis is a radiopaque lesion within the mandibular ramus, such as a dense bone island. When in doubt, a right-angle view such as a posteroanterior skull view or an open Towne ’ s view may show that the calcifi cation
FIG. 28-3 Examples of dystrophic calcifi cation in the lymph nodes. A, Two large examples positioned behind the ramus with a caulifl ower-like shape and two smaller examples in a more superior position (arrows). B, Several smaller examples positioned below the lower border of the mandible. C, A larger example.
A B
C
A B
C
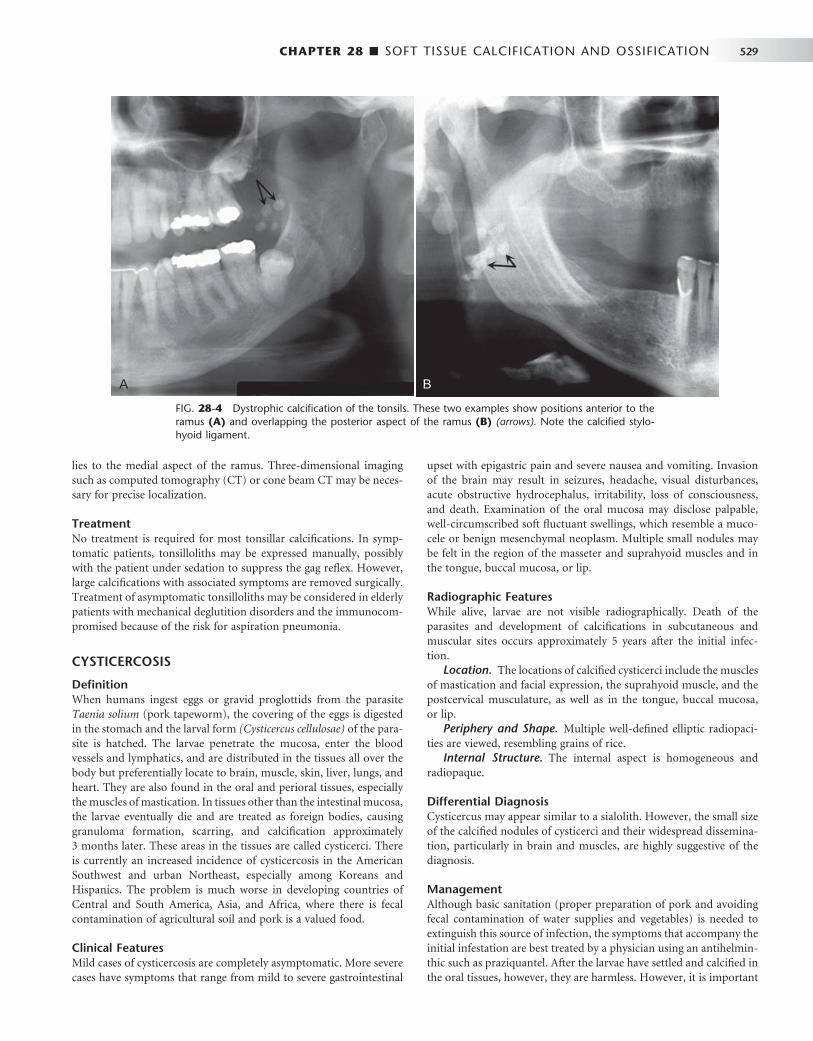
CHAPTER 28 ■ SOFT TISSUE CALCIFICATION AND OSSIFICATION 529
lies to the medial aspect of the ramus. Three-dimensional imaging such as computed tomography (CT) or cone beam CT may be neces-sary for precise localization.
Treatment No treatment is required for most tonsillar calcifi cations. In symp-tomatic patients, tonsilloliths may be expressed manually, possibly with the patient under sedation to suppress the gag refl ex. However, large calcifi cations with associated symptoms are removed surgically. Treatment of asymptomatic tonsilloliths may be considered in elderly patients with mechanical deglutition disorders and the immunocom-promised because of the risk for aspiration pneumonia.
CYSTICERCOSIS
Defi nition When humans ingest eggs or gravid proglottids from the parasite Taenia solium (pork tapeworm), the covering of the eggs is digested in the stomach and the larval form (Cysticercus cellulosae) of the para-site is hatched. The larvae penetrate the mucosa, enter the blood vessels and lymphatics, and are distributed in the tissues all over the body but preferentially locate to brain, muscle, skin, liver, lungs, and heart. They are also found in the oral and perioral tissues, especially the muscles of mastication. In tissues other than the intestinal mucosa, the larvae eventually die and are treated as foreign bodies, causing granuloma formation, scarring, and calcifi cation approximately 3 months later. These areas in the tissues are called cysticerci. There is currently an increased incidence of cysticercosis in the American Southwest and urban Northeast, especially among Koreans and Hispanics. The problem is much worse in developing countries of Central and South America, Asia, and Africa, where there is fecal contamination of agricultural soil and pork is a valued food.
Clinical Features Mild cases of cysticercosis are completely asymptomatic. More severe cases have symptoms that range from mild to severe gastrointestinal
upset with epigastric pain and severe nausea and vomiting. Invasion of the brain may result in seizures, headache, visual disturbances, acute obstructive hydrocephalus, irritability, loss of consciousness, and death. Examination of the oral mucosa may disclose palpable, well-circumscribed soft fl uctuant swellings, which resemble a muco-cele or benign mesenchymal neoplasm. Multiple small nodules may be felt in the region of the masseter and suprahyoid muscles and in the tongue, buccal mucosa, or lip.
Radiographic Features While alive, larvae are not visible radiographically. Death of the parasites and development of calcifi cations in subcutaneous and muscular sites occurs approximately 5 years after the initial infec-tion.
Location. The locations of calcifi ed cysticerci include the muscles of mastication and facial expression, the suprahyoid muscle, and the postcervical musculature, as well as in the tongue, buccal mucosa, or lip.
Periphery and Shape. Multiple well-defi ned elliptic radiopaci-ties are viewed, resembling grains of rice.
Internal Structure. The internal aspect is homogeneous and radiopaque.
Differential Diagnosis Cysticercus may appear similar to a sialolith. However, the small size of the calcifi ed nodules of cysticerci and their widespread dissemina-tion, particularly in brain and muscles, are highly suggestive of the diagnosis.
Management Although basic sanitation (proper preparation of pork and avoiding fecal contamination of water supplies and vegetables) is needed to extinguish this source of infection, the symptoms that accompany the initial infestation are best treated by a physician using an antihelmin-thic such as praziquantel. After the larvae have settled and calcifi ed in the oral tissues, however, they are harmless. However, it is important
FIG. 28-4 Dystrophic calcifi cation of the tonsils. These two examples show positions anterior to the ramus (A) and overlapping the posterior aspect of the ramus (B) (arrows). Note the calcifi ed stylo-hyoid ligament.
A BA B
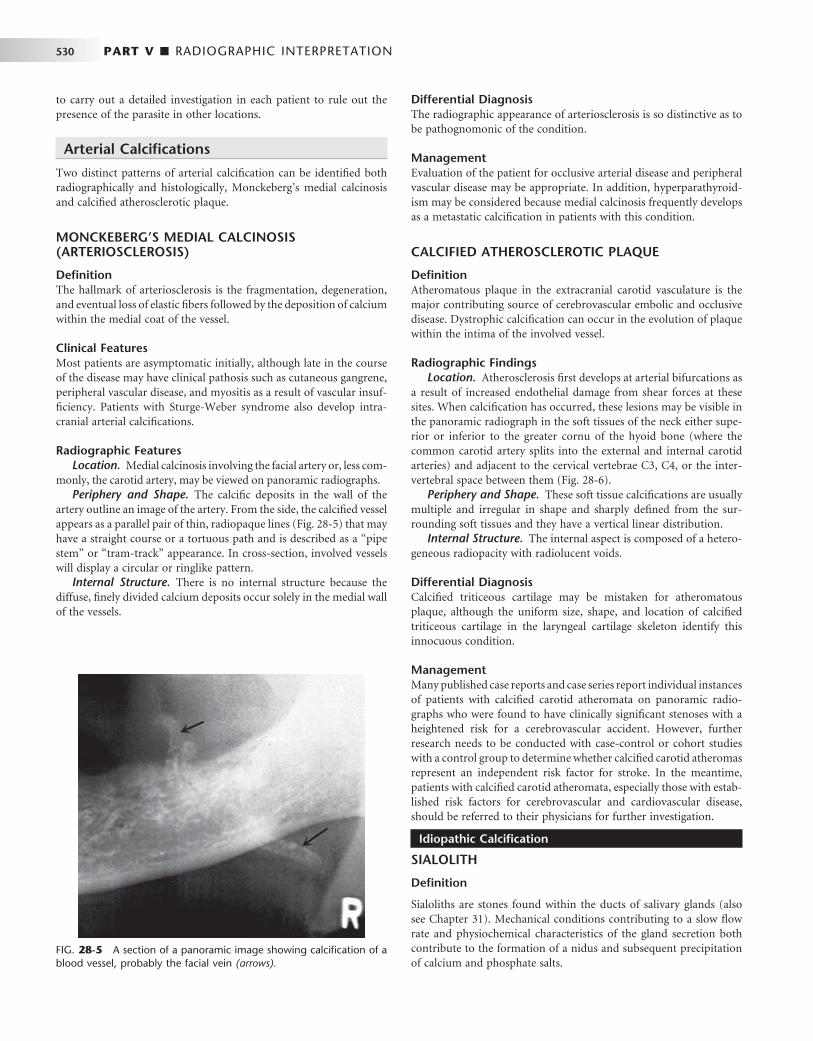
530 PART V ■ RADIOGRAPHIC INTERPRETATION
to carry out a detailed investigation in each patient to rule out the presence of the parasite in other locations.
Arterial Calcifi cations
Two distinct patterns of arterial calcifi cation can be identifi ed both radiographically and histologically, Monckeberg ’ s medial calcinosis and calcifi ed atherosclerotic plaque.
MONCKEBERG ’ S MEDIAL CALCINOSIS (ARTERIOSCLEROSIS)
Defi nition The hallmark of arteriosclerosis is the fragmentation, degeneration, and eventual loss of elastic fi bers followed by the deposition of calcium within the medial coat of the vessel.
Clinical Features Most patients are asymptomatic initially, although late in the course of the disease may have clinical pathosis such as cutaneous gangrene, peripheral vascular disease, and myositis as a result of vascular insuf-fi ciency. Patients with Sturge-Weber syndrome also develop intra-cranial arterial calcifi cations.
Radiographic Features Location. Medial calcinosis involving the facial artery or, less com-
monly, the carotid artery, may be viewed on panoramic radiographs. Periphery and Shape. The calcifi c deposits in the wall of the
artery outline an image of the artery. From the side, the calcifi ed vessel appears as a parallel pair of thin, radiopaque lines ( Fig. 28-5 ) that may have a straight course or a tortuous path and is described as a “ pipe stem ” or “ tram-track ” appearance. In cross-section, involved vessels will display a circular or ringlike pattern.
Internal Structure. There is no internal structure because the diffuse, fi nely divided calcium deposits occur solely in the medial wall of the vessels.
Differential Diagnosis The radiographic appearance of arteriosclerosis is so distinctive as to be pathognomonic of the condition.
Management Evaluation of the patient for occlusive arterial disease and peripheral vascular disease may be appropriate. In addition, hyperparathyroid-ism may be considered because medial calcinosis frequently develops as a metastatic calcifi cation in patients with this condition.
CALCIFIED ATHEROSCLEROTIC PLAQUE
Defi nition Atheromatous plaque in the extracranial carotid vasculature is the major contributing source of cerebrovascular embolic and occlusive disease. Dystrophic calcifi cation can occur in the evolution of plaque within the intima of the involved vessel.
Radiographic Findings Location. Atherosclerosis fi rst develops at arterial bifurcations as
a result of increased endothelial damage from shear forces at these sites. When calcifi cation has occurred, these lesions may be visible in the panoramic radiograph in the soft tissues of the neck either supe-rior or inferior to the greater cornu of the hyoid bone (where the common carotid artery splits into the external and internal carotid arteries) and adjacent to the cervical vertebrae C3, C4, or the inter-vertebral space between them ( Fig. 28-6 ).
Periphery and Shape. These soft tissue calcifi cations are usually multiple and irregular in shape and sharply defi ned from the sur-rounding soft tissues and they have a vertical linear distribution.
Internal Structure. The internal aspect is composed of a hetero-geneous radiopacity with radiolucent voids.
Differential Diagnosis Calcifi ed triticeous cartilage may be mistaken for atheromatous plaque, although the uniform size, shape, and location of calcifi ed triticeous cartilage in the laryngeal cartilage skeleton identify this innocuous condition.
Management Many published case reports and case series report individual instances of patients with calcifi ed carotid atheromata on panoramic radio-graphs who were found to have clinically signifi cant stenoses with a heightened risk for a cerebrovascular accident. However, further research needs to be conducted with case-control or cohort studies with a control group to determine whether calcifi ed carotid atheromas represent an independent risk factor for stroke. In the meantime, patients with calcifi ed carotid atheromata, especially those with estab-lished risk factors for cerebrovascular and cardiovascular disease, should be referred to their physicians for further investigation.
Idiopathic Calcifi cation
SIALOLITH
Defi nition
Sialoliths are stones found within the ducts of salivary glands (also see Chapter 31 ). Mechanical conditions contributing to a slow fl ow rate and physiochemical characteristics of the gland secretion both contribute to the formation of a nidus and subsequent precipitation of calcium and phosphate salts.
FIG. 28-5 A section of a panoramic image showing calcifi cation of a blood vessel, probably the facial vein (arrows).

CHAPTER 28 ■ SOFT TISSUE CALCIFICATION AND OSSIFICATION 531
Clinical Features Sialoliths are most common in the submandibular glands of men in their middle and later years. They usually occur singly (70% to 80%) but may be multiple, especially in the parotid gland. Patients with salivary stones may be asymptomatic, but they usually have a history of pain and swelling in the fl oor of the mouth and in the involved submandibular gland or in the cheek in the case of parotid sialoliths. This discomfort may intensify at mealtimes, when salivary fl ow is stimulated. Because the stone usually does not block the fl ow of saliva completely, the pain and swelling gradually subside. As many as 9% of patients have recurrent sialolithiasis, and about 10% of patients with sialolithiasis also have nephrolithiasis.
Radiographic Features Location. The submandibular gland is involved more often (83%
to 94% of cases) than the parotid gland (4% to 10%) or the sublingual gland (1% to 7%), probably because the submandibular gland has a longer and more tortuous duct, an uphill fl ow in the proximal portion, and more viscous saliva with a higher mineral content. About half of submandibular stones lie in the distal portion of Wharton ’ s duct, 20% in the proximal portion, and 30% in the gland itself.
Periphery and Shape. Sialoliths located in the duct of the sub-mandibular gland usually are cylindric and very smooth in their out-lines. Stones that form in the hilus of a submandibular gland tend to be larger and more irregularly shaped ( Fig. 28-7 ).
Internal Structure. Some stones are homogeneously radiopaque, and others show evidence of multiple layers of calcifi cation ( Fig. 28-8, A ). Less than 20% of submandibular gland sialoliths and 40% of those in the parotid gland are radiolucent because of the low mineral content of the parotid secretions.
Applied Radiology Salivary stones occasionally are seen on periapical views superim-posed over the mandibular premolar and molar apices ( Fig. 28-8, C ). The best view for visualizing stones in the distal portion of Wharton ’ s duct is a standard mandibular occlusal view using half the usual exposure time, which displays the fl oor of the mouth without overlap from the mandible. Stones in a more posterior location are best visual-ized on lateral oblique views of the mandible or on a panoramic fi lm. To demonstrate stones in the parotid gland duct, the clinician places a periapical fi lm in the buccal vestibule, reduces the exposure time, and orients x-ray beam through the cheek. Also, stones in the parotid duct
FIG. 28-6 A, Panoramic image with bilateral examples of calcifi cations associated with the carotid arteries (arrows). B, Axial CT image of the same case with soft tissue algorithm showing bilateral cal-cifi cation with the walls of the carotid arteries (arrows). C and D, Coronal and sagittal CT images of the same case demonstrating the carotid calcifi cations (arrows) .
A
B
CD
A
B
CD
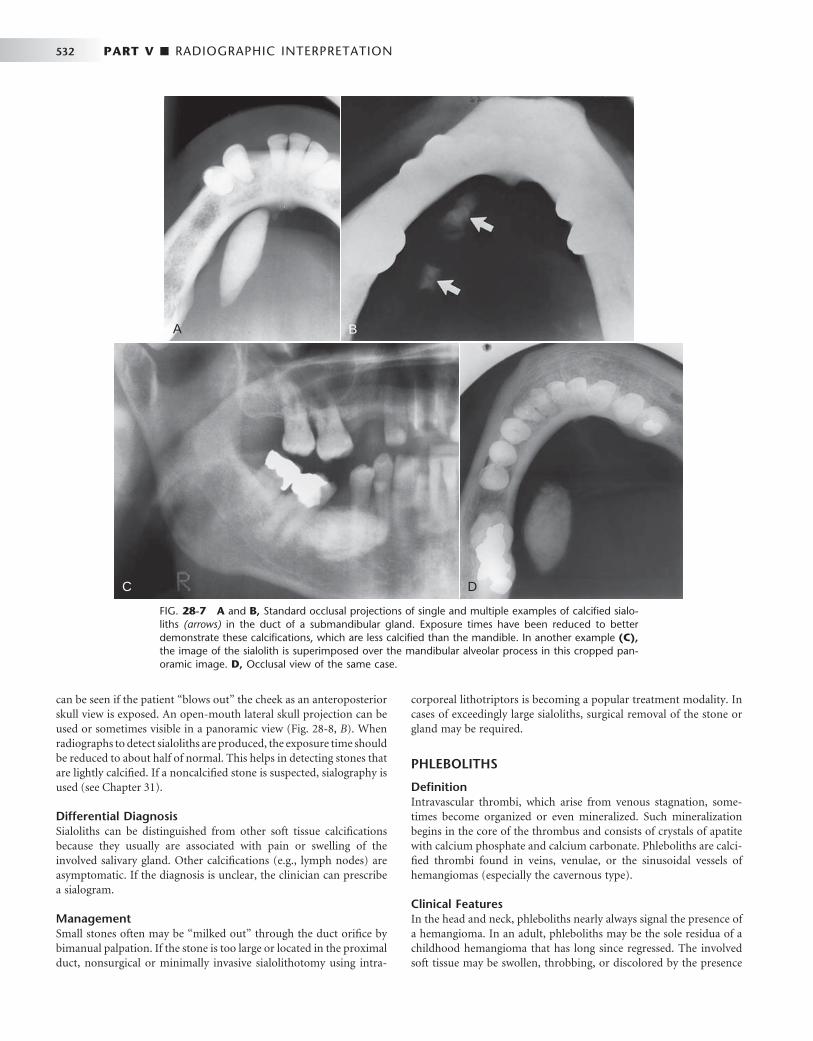
532 PART V ■ RADIOGRAPHIC INTERPRETATION
can be seen if the patient “ blows out ” the cheek as an anteroposterior skull view is exposed. An open-mouth lateral skull projection can be used or sometimes visible in a panoramic view ( Fig. 28-8, B ). When radiographs to detect sialoliths are produced, the exposure time should be reduced to about half of normal. This helps in detecting stones that are lightly calcifi ed. If a noncalcifi ed stone is suspected, sialography is used (see Chapter 31 ).
Differential Diagnosis Sialoliths can be distinguished from other soft tissue calcifi cations because they usually are associated with pain or swelling of the involved salivary gland. Other calcifi cations (e.g., lymph nodes) are asymptomatic. If the diagnosis is unclear, the clinician can prescribe a sialogram.
Management Small stones often may be “ milked out ” through the duct orifi ce by bimanual palpation. If the stone is too large or located in the proximal duct, nonsurgical or minimally invasive sialolithotomy using intra-
corporeal lithotriptors is becoming a popular treatment modality. In cases of exceedingly large sialoliths, surgical removal of the stone or gland may be required.
PHLEBOLITHS
Defi nition Intravascular thrombi, which arise from venous stagnation, some-times become organized or even mineralized. Such mineralization begins in the core of the thrombus and consists of crystals of apatite with calcium phosphate and calcium carbonate. Phleboliths are calci-fi ed thrombi found in veins, venulae, or the sinusoidal vessels of hemangiomas (especially the cavernous type).
Clinical Features In the head and neck, phleboliths nearly always signal the presence of a hemangioma. In an adult, phleboliths may be the sole residua of a childhood hemangioma that has long since regressed. The involved soft tissue may be swollen, throbbing, or discolored by the presence
FIG. 28-7 A and B, Standard occlusal projections of single and multiple examples of calcifi ed sialo-liths (arrows) in the duct of a submandibular gland. Exposure times have been reduced to better demonstrate these calcifi cations, which are less calcifi ed than the mandible. In another example (C), the image of the sialolith is superimposed over the mandibular alveolar process in this cropped pan-oramic image. D, Occlusal view of the same case.
A
C D
BA
C D
B
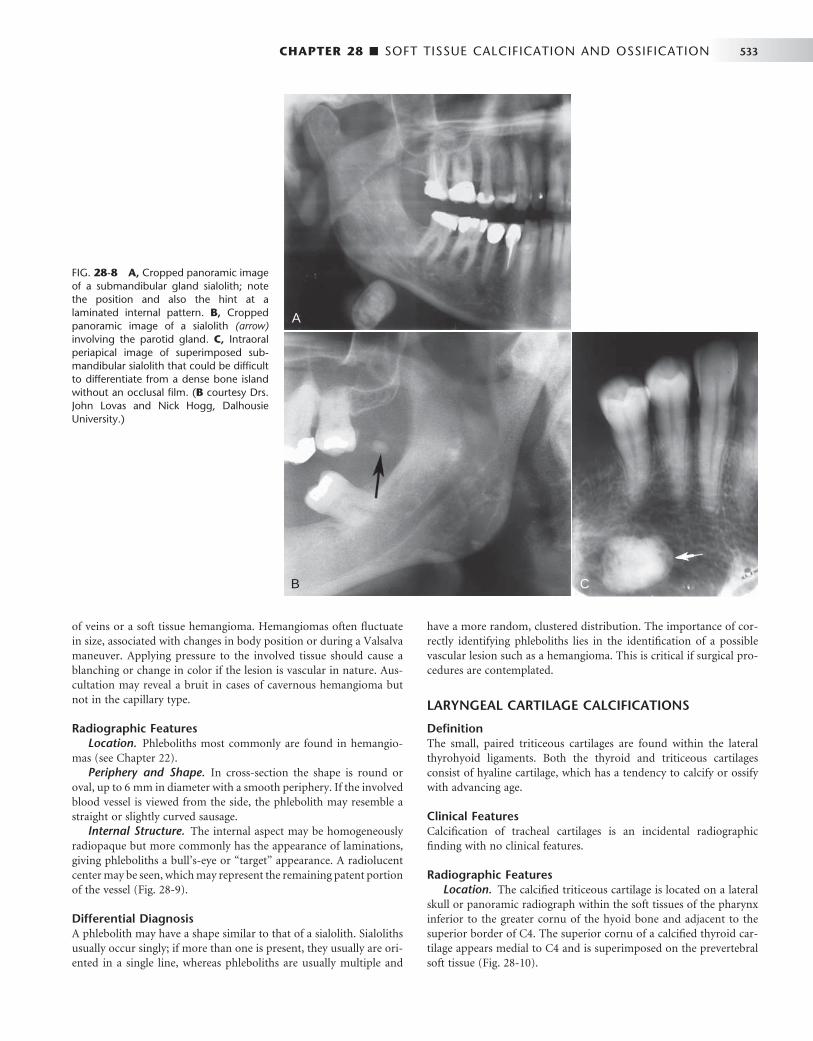
CHAPTER 28 ■ SOFT TISSUE CALCIFICATION AND OSSIFICATION 533
of veins or a soft tissue hemangioma. Hemangiomas often fl uctuate in size, associated with changes in body position or during a Valsalva maneuver. Applying pressure to the involved tissue should cause a blanching or change in color if the lesion is vascular in nature. Aus-cultation may reveal a bruit in cases of cavernous hemangioma but not in the capillary type.
Radiographic Features Location. Phleboliths most commonly are found in hemangio-
mas (see Chapter 22 ). Periphery and Shape. In cross-section the shape is round or
oval, up to 6 mm in diameter with a smooth periphery. If the involved blood vessel is viewed from the side, the phlebolith may resemble a straight or slightly curved sausage.
Internal Structure. The internal aspect may be homogeneously radiopaque but more commonly has the appearance of laminations, giving phleboliths a bull ’ s-eye or “ target ” appearance. A radiolucent center may be seen, which may represent the remaining patent portion of the vessel ( Fig. 28-9 ).
Differential Diagnosis A phlebolith may have a shape similar to that of a sialolith. Sialoliths usually occur singly; if more than one is present, they usually are ori-ented in a single line, whereas phleboliths are usually multiple and
have a more random, clustered distribution. The importance of cor-rectly identifying phleboliths lies in the identifi cation of a possible vascular lesion such as a hemangioma. This is critical if surgical pro-cedures are contemplated.
LARYNGEAL CARTILAGE CALCIFICATIONS
Defi nition The small, paired triticeous cartilages are found within the lateral thyrohyoid ligaments. Both the thyroid and triticeous cartilages consist of hyaline cartilage, which has a tendency to calcify or ossify with advancing age.
Clinical Features Calcifi cation of tracheal cartilages is an incidental radiographic fi nding with no clinical features.
Radiographic Features Location. The calcifi ed triticeous cartilage is located on a lateral
skull or panoramic radiograph within the soft tissues of the pharynx inferior to the greater cornu of the hyoid bone and adjacent to the superior border of C4. The superior cornu of a calcifi ed thyroid car-tilage appears medial to C4 and is superimposed on the prevertebral soft tissue ( Fig. 28-10 ).
FIG. 28-8 A, Cropped panoramic image of a submandibular gland sialolith; note the position and also the hint at a laminated internal pattern. B, Cropped panoramic image of a sialolith (arrow) involving the parotid gland. C, Intraoral periapical image of superimposed sub-mandibular sialolith that could be diffi cult to differentiate from a dense bone island without an occlusal fi lm. ( B courtesy Drs. John Lovas and Nick Hogg, Dalhousie University.)
A
B C

534 PART V ■ RADIOGRAPHIC INTERPRETATION
Periphery and Shape. The word triticeous means “ grain of wheat, ” and the cartilage measures 7 to 9 mm in length and 2 to 4 mm in width. The periphery of the calcifi ed triticeous cartilage is well defi ned and smooth, and the geometry is exceedingly regular. Usually only the top 2 to 3 mm of a calcifi ed thyroid cartilage will be visible at the lower edge of a panoramic radiograph with 6-inch systems.
Internal Structure. Calcifi ed tracheal cartilages generally present a homogeneous radiopacity but may occasionally demonstrate an outer cortex.
Differential Diagnosis Calcifi ed triticeous cartilage may be confused with calcifi ed athero-matous plaque in the carotid bifurcation, but the solitary nature and extremely uniform size and shape of the former should be discriminatory.
Management No treatment is needed for calcifi ed tracheal cartilages, but careful attention to the differences in morphology and location enable the clinician to distinguish between calcifi ed triticeous cartilage and calci-fi ed carotid atheromata.
RHINOLITH/ANTROLITH
Defi nition Calcareous concretions that occur in the nose (rhinoliths) or the antrum of the maxillary sinus (antroliths) arise from the deposition of nasal, lacrimal, and infl ammatory mineral salts such as calcium phosphate, calcium carbonate, and magnesium by accretion around a nidus. In cases of rhinolith, the nidus is usually an exogenous foreign body (coins, beads, etc.), especially in the pediatric population. The route of entry is usually anterior, but some may enter the choana posteriorly during sneezing, coughing, or emesis. The nidus for an antrolith is usually endogenous (root tip, bone fragment, blood clot, inspissated mucus, etc.), especially in the adult population.
Clinical Features The patient may be asymptomatic for extended periods of time, but the expanding mass may impinge on the mucosa, producing pain,
FIG. 28-9 Phleboliths are soft tissue dystrophic calcifi cations found in veins. They are usually associ-ated with hemangiomas.
A BA B
FIG. 28-10 A lateral cephalometric fi lm revealing calcifi cation of the thyroid cartilage (arrow).

CHAPTER 28 ■ SOFT TISSUE CALCIFICATION AND OSSIFICATION 535
congestion, and ulceration. The patient may have a unilateral purulent rhinorrhea, sinusitis, headache, epistaxis, anosmia, fetor, and fever.
Radiographic Features Location. Rhinoliths develop in the nose ( Fig. 28-11 ), whereas
antroliths develop in the antrum of the maxillary sinus (see Fig. 27-10 ).
Periphery and Shape. These stones have a variety of shapes and sizes, depending on the nature of the nidus.
Internal Structure. They may present as homogeneous or het-erogeneous radiopacities, depending on the nature of the nidus, and may sometimes have laminations. Occasionally the density will exceed the surrounding bone.
Differential Diagnosis The differential diagnosis includes osteoma, odontoma, surgical cili-ated cyst, and mycolith.
Management Patients should be referred to an otorhinolaryngologist for endonasal surgical removal of the mass. In some cases, lithotripsy has been used to debulk large rhinoliths.
Metastatic Calcifi cation
Calcifi cation of the soft tissues in the oral region caused by conditions involving elevated serum calcium and phosphate levels, such as hyper-parathyroidism (see Chapter 25 ) or hypercalcemia of malignancy, are extremely rare.
Heterotopic Bone
OSSIFICATION OF THE STYLOHYOID LIGAMENT
Defi nition
Embryologically, the styloid process arises from the second branchial arch (Reichert cartilage), which consists of four sections that give rise to the stylohyoid complex. Ossifi cation of the stylohyoid ligament
usually extends downward from the base of the skull and commonly occurs bilaterally. However, in rare cases the ossifi cation begins at the lesser horn of the hyoid and in fewer still in a central area of the ligament.
Clinical Features The ossifi ed ligament usually can be detected by palpation over the tonsil as a hard, pointed structure. Only a minority of patients have symptoms and there is very little correlation between the extent of ossifi cation and the intensity of the accompanying symptoms. Symp-toms related to this ossifi ed ligament are termed Eagle syndrome, which is expressed as one of two subtypes: classic Eagle syndrome resulting from cranial nerve impingement, and the carotid artery syndrome, resulting from impingement on the carotid vessels. When this entity is associated with discomfort and the patient has a recent history of neck trauma (typically tonsillectomy), the condition is called classic Eagle syndrome. The ossifi ed stylohyoid complex and local scar tissue are thought to cause symptoms by impinging on cranial nerves V, VII, IX, X, or XII, all of which pass in close proximity to the styloid process. Symptoms may include vague, nagging to intense pain in the pharynx on swallowing, turning the head, or opening the mouth, especially on yawning, and tinnitus or otalgia. Clinical fi ndings without a history of neck trauma constitute carotid artery syndrome. The patient may describe referred pain along the distribution of the external (ECA) or internal carotid artery (ICA). This is the result of mechanical impingement of the involved artery and stimulation of its sympathetic nerve plexus. When the ECA is impinged and stimulated, the patient may feel suborbital facial pain. Symptoms when the ICA is affected may include eye pain, temporal or parietal headache, aphasia, visual symptoms, weakness, and transient hemispheric ischemia with vertigo or syncope, notably on turning the head to the ipsilateral side. In these patients, pain is pro-duced by mechanical irritation of sympathetic nerve tissue in the arterial wall, producing regional carotidynia. This may occur even in the absence of ossifi cation of the stylohyoid complex. Only deviation of the styloid process, usually medially, is required for the tip of
FIG. 28-11 A, Lateral occlusal fi lm shows a rhinolith (arrow) positioned above the fl oor of the nose. B, Posteroanterior skull fi lm of the same case demonstrating that the rhinolith is positioned within the nasal fossa (arrow).
A BA B
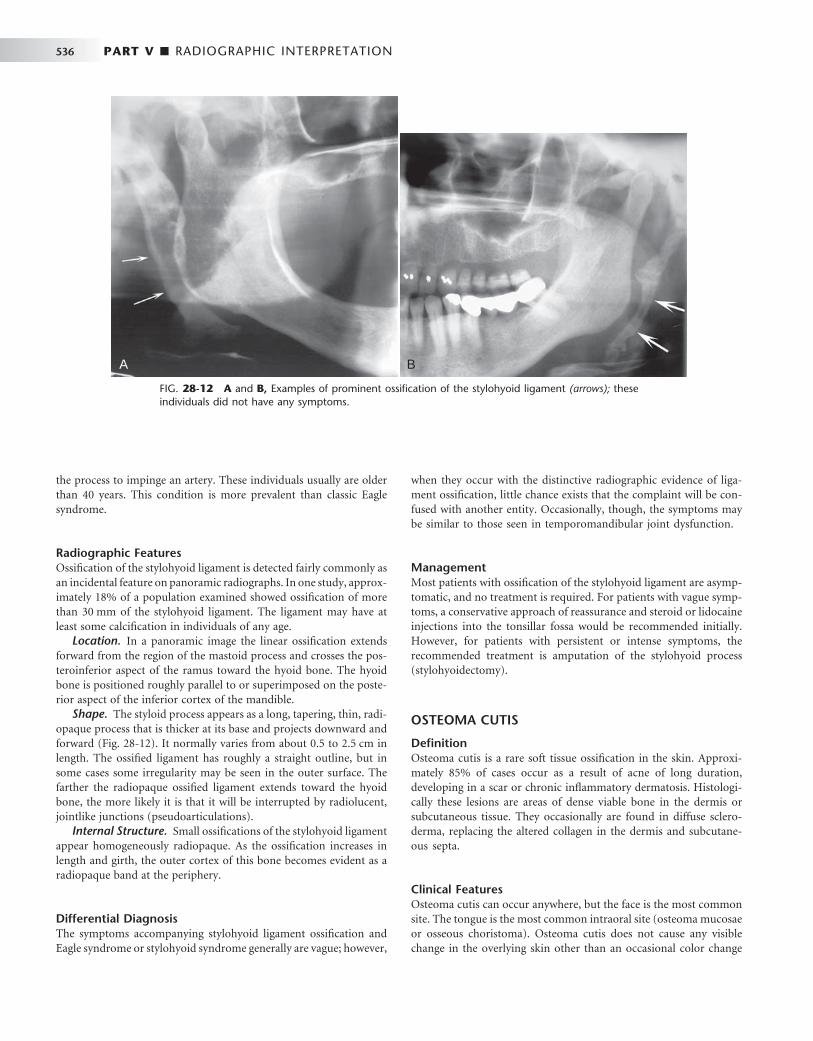
536 PART V ■ RADIOGRAPHIC INTERPRETATION
the process to impinge an artery. These individuals usually are older than 40 years. This condition is more prevalent than classic Eagle syndrome.
Radiographic Features Ossifi cation of the stylohyoid ligament is detected fairly commonly as an incidental feature on panoramic radiographs. In one study, approx-imately 18% of a population examined showed ossifi cation of more than 30 mm of the stylohyoid ligament. The ligament may have at least some calcifi cation in individuals of any age.
Location. In a panoramic image the linear ossifi cation extends forward from the region of the mastoid process and crosses the pos-teroinferior aspect of the ramus toward the hyoid bone. The hyoid bone is positioned roughly parallel to or superimposed on the poste-rior aspect of the inferior cortex of the mandible.
Shape. The styloid process appears as a long, tapering, thin, radi-opaque process that is thicker at its base and projects downward and forward ( Fig. 28-12 ). It normally varies from about 0.5 to 2.5 cm in length. The ossifi ed ligament has roughly a straight outline, but in some cases some irregularity may be seen in the outer surface. The farther the radiopaque ossifi ed ligament extends toward the hyoid bone, the more likely it is that it will be interrupted by radiolucent, jointlike junctions (pseudoarticulations).
Internal Structure. Small ossifi cations of the stylohyoid ligament appear homogeneously radiopaque. As the ossifi cation increases in length and girth, the outer cortex of this bone becomes evident as a radiopaque band at the periphery.
Differential Diagnosis The symptoms accompanying stylohyoid ligament ossifi cation and Eagle syndrome or stylohyoid syndrome generally are vague; however,
when they occur with the distinctive radiographic evidence of liga-ment ossifi cation, little chance exists that the complaint will be con-fused with another entity. Occasionally, though, the symptoms may be similar to those seen in temporomandibular joint dysfunction.
Management Most patients with ossifi cation of the stylohyoid ligament are asymp-tomatic, and no treatment is required. For patients with vague symp-toms, a conservative approach of reassurance and steroid or lidocaine injections into the tonsillar fossa would be recommended initially. However, for patients with persistent or intense symptoms, the recommended treatment is amputation of the stylohyoid process (stylohyoidectomy).
OSTEOMA CUTIS
Defi nition Osteoma cutis is a rare soft tissue ossifi cation in the skin. Approxi-mately 85% of cases occur as a result of acne of long duration, developing in a scar or chronic infl ammatory dermatosis. Histologi-cally these lesions are areas of dense viable bone in the dermis or subcutaneous tissue. They occasionally are found in diffuse sclero-derma, replacing the altered collagen in the dermis and subcutane-ous septa.
Clinical Features Osteoma cutis can occur anywhere, but the face is the most common site. The tongue is the most common intraoral site (osteoma mucosae or osseous choristoma). Osteoma cutis does not cause any visible change in the overlying skin other than an occasional color change
FIG. 28-12 A and B, Examples of prominent ossifi cation of the stylohyoid ligament (arrows); these individuals did not have any symptoms.
A BA B
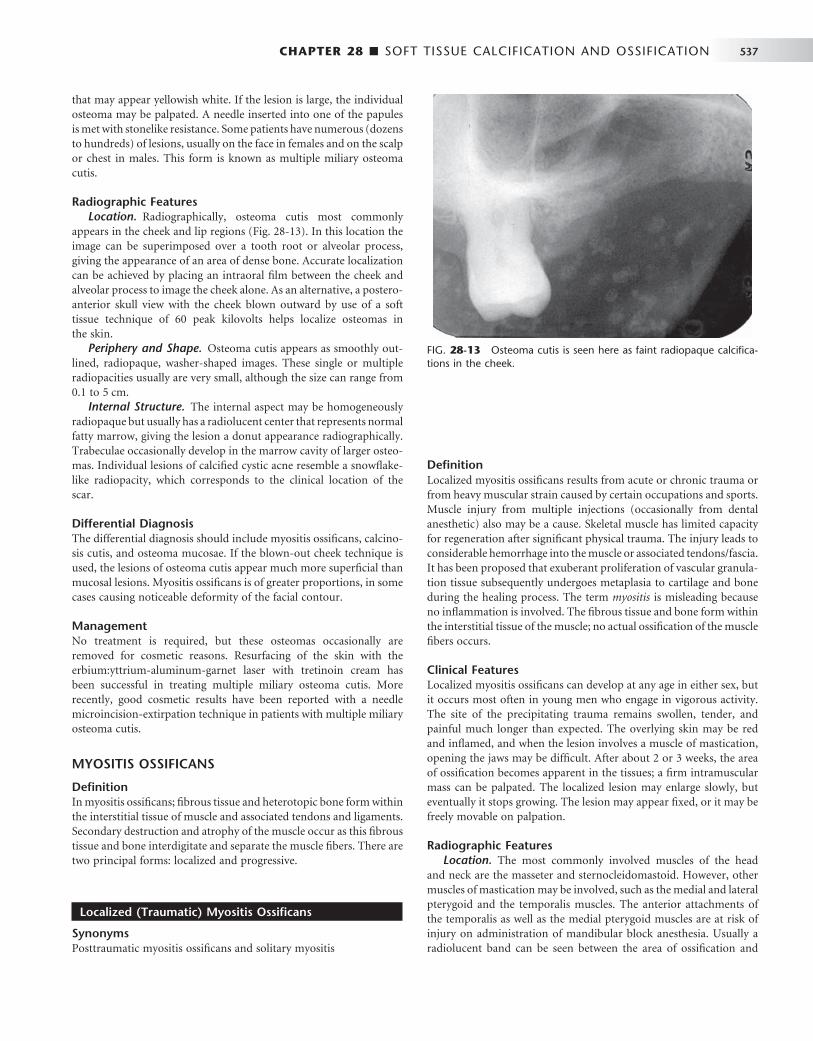
CHAPTER 28 ■ SOFT TISSUE CALCIFICATION AND OSSIFICATION 537
that may appear yellowish white. If the lesion is large, the individual osteoma may be palpated. A needle inserted into one of the papules is met with stonelike resistance. Some patients have numerous (dozens to hundreds) of lesions, usually on the face in females and on the scalp or chest in males. This form is known as multiple miliary osteoma cutis.
Radiographic Features Location. Radiographically, osteoma cutis most commonly
appears in the cheek and lip regions ( Fig. 28-13 ). In this location the image can be superimposed over a tooth root or alveolar process, giving the appearance of an area of dense bone. Accurate localization can be achieved by placing an intraoral fi lm between the cheek and alveolar process to image the cheek alone. As an alternative, a postero-anterior skull view with the cheek blown outward by use of a soft tissue technique of 60 peak kilovolts helps localize osteomas in the skin.
Periphery and Shape. Osteoma cutis appears as smoothly out-lined, radiopaque, washer-shaped images. These single or multiple radiopacities usually are very small, although the size can range from 0.1 to 5 cm.
Internal Structure. The internal aspect may be homogeneously radiopaque but usually has a radiolucent center that represents normal fatty marrow, giving the lesion a donut appearance radiographically. Trabeculae occasionally develop in the marrow cavity of larger osteo-mas. Individual lesions of calcifi ed cystic acne resemble a snowfl ake-like radiopacity, which corresponds to the clinical location of the scar.
Differential Diagnosis The differential diagnosis should include myositis ossifi cans, calcino-sis cutis, and osteoma mucosae. If the blown-out cheek technique is used, the lesions of osteoma cutis appear much more superfi cial than mucosal lesions. Myositis ossifi cans is of greater proportions, in some cases causing noticeable deformity of the facial contour.
Management No treatment is required, but these osteomas occasionally are removed for cosmetic reasons. Resurfacing of the skin with the erbium:yttrium-aluminum-garnet laser with tretinoin cream has been successful in treating multiple miliary osteoma cutis. More recently, good cosmetic results have been reported with a needle microincision-extirpation technique in patients with multiple miliary osteoma cutis.
MYOSITIS OSSIFICANS
Defi nition In myositis ossifi cans; fi brous tissue and heterotopic bone form within the interstitial tissue of muscle and associated tendons and ligaments. Secondary destruction and atrophy of the muscle occur as this fi brous tissue and bone interdigitate and separate the muscle fi bers. There are two principal forms: localized and progressive.
Localized (Traumatic) Myositis Ossifi cans
Synonyms Posttraumatic myositis ossifi cans and solitary myositis
Defi nition Localized myositis ossifi cans results from acute or chronic trauma or from heavy muscular strain caused by certain occupations and sports. Muscle injury from multiple injections (occasionally from dental anesthetic) also may be a cause. Skeletal muscle has limited capacity for regeneration after signifi cant physical trauma. The injury leads to considerable hemorrhage into the muscle or associated tendons/fascia. It has been proposed that exuberant proliferation of vascular granula-tion tissue subsequently undergoes metaplasia to cartilage and bone during the healing process. The term myositis is misleading because no infl ammation is involved. The fi brous tissue and bone form within the interstitial tissue of the muscle; no actual ossifi cation of the muscle fi bers occurs.
Clinical Features Localized myositis ossifi cans can develop at any age in either sex, but it occurs most often in young men who engage in vigorous activity. The site of the precipitating trauma remains swollen, tender, and painful much longer than expected. The overlying skin may be red and infl amed, and when the lesion involves a muscle of mastication, opening the jaws may be diffi cult. After about 2 or 3 weeks, the area of ossifi cation becomes apparent in the tissues; a fi rm intramuscular mass can be palpated. The localized lesion may enlarge slowly, but eventually it stops growing. The lesion may appear fi xed, or it may be freely movable on palpation.
Radiographic Features Location. The most commonly involved muscles of the head
and neck are the masseter and sternocleidomastoid. However, other muscles of mastication may be involved, such as the medial and lateral pterygoid and the temporalis muscles. The anterior attachments of the temporalis as well as the medial pterygoid muscles are at risk of injury on administration of mandibular block anesthesia. Usually a radiolucent band can be seen between the area of ossifi cation and
FIG. 28-13 Osteoma cutis is seen here as faint radiopaque calcifi ca-tions in the cheek.
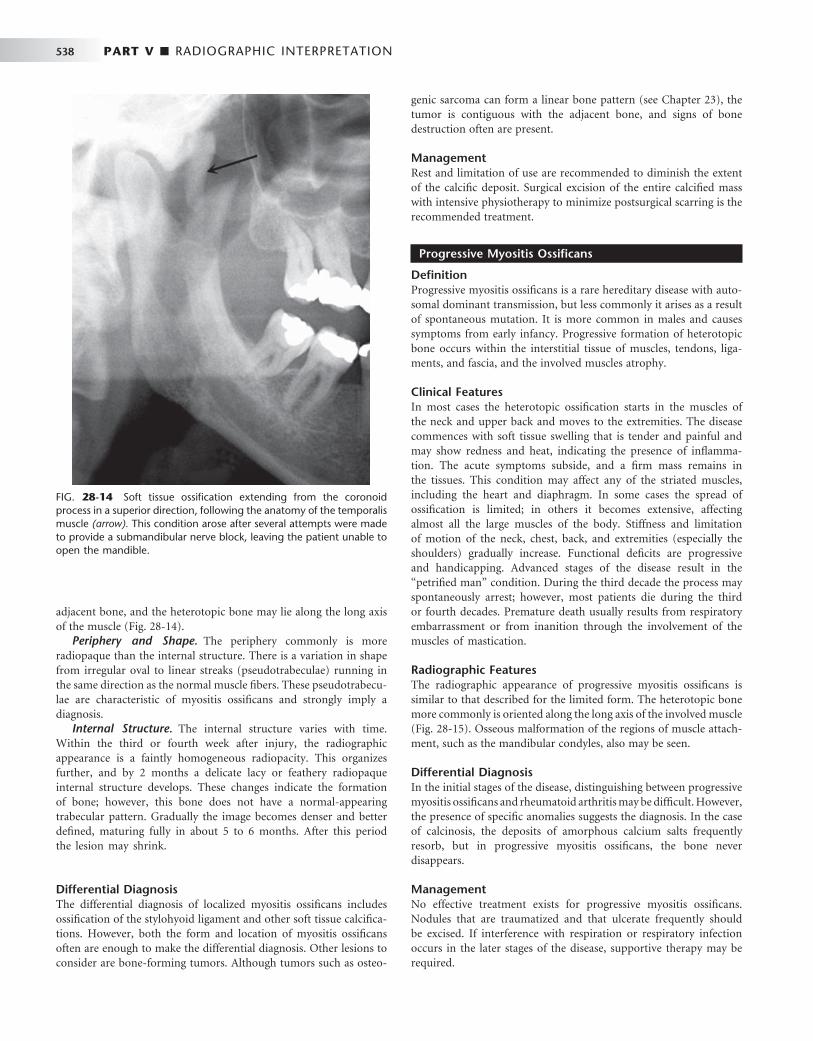
538 PART V ■ RADIOGRAPHIC INTERPRETATION
adjacent bone, and the heterotopic bone may lie along the long axis of the muscle ( Fig. 28-14 ).
Periphery and Shape. The periphery commonly is more radiopaque than the internal structure. There is a variation in shape from irregular oval to linear streaks (pseudotrabeculae) running in the same direction as the normal muscle fi bers. These pseudotrabecu-lae are characteristic of myositis ossifi cans and strongly imply a diagnosis.
Internal Structure. The internal structure varies with time. Within the third or fourth week after injury, the radiographic appearance is a faintly homogeneous radiopacity. This organizes further, and by 2 months a delicate lacy or feathery radiopaque internal structure develops. These changes indicate the formation of bone; however, this bone does not have a normal-appearing trabecular pattern. Gradually the image becomes denser and better defi ned, maturing fully in about 5 to 6 months. After this period the lesion may shrink.
Differential Diagnosis The differential diagnosis of localized myositis ossifi cans includes ossifi cation of the stylohyoid ligament and other soft tissue calcifi ca-tions. However, both the form and location of myositis ossifi cans often are enough to make the differential diagnosis. Other lesions to consider are bone-forming tumors. Although tumors such as osteo-
genic sarcoma can form a linear bone pattern (see Chapter 23 ), the tumor is contiguous with the adjacent bone, and signs of bone destruction often are present.
Management Rest and limitation of use are recommended to diminish the extent of the calcifi c deposit. Surgical excision of the entire calcifi ed mass with intensive physiotherapy to minimize postsurgical scarring is the recommended treatment.
Progressive Myositis Ossifi cans
Defi nition Progressive myositis ossifi cans is a rare hereditary disease with auto-somal dominant transmission, but less commonly it arises as a result of spontaneous mutation. It is more common in males and causes symptoms from early infancy. Progressive formation of heterotopic bone occurs within the interstitial tissue of muscles, tendons, liga-ments, and fascia, and the involved muscles atrophy.
Clinical Features In most cases the heterotopic ossifi cation starts in the muscles of the neck and upper back and moves to the extremities. The disease commences with soft tissue swelling that is tender and painful and may show redness and heat, indicating the presence of infl amma-tion. The acute symptoms subside, and a fi rm mass remains in the tissues. This condition may affect any of the striated muscles, including the heart and diaphragm. In some cases the spread of ossifi cation is limited; in others it becomes extensive, affecting almost all the large muscles of the body. Stiffness and limitation of motion of the neck, chest, back, and extremities (especially the shoulders) gradually increase. Functional defi cits are progressive and handicapping. Advanced stages of the disease result in the “ petrifi ed man ” condition. During the third decade the process may spontaneously arrest; however, most patients die during the third or fourth decades. Premature death usually results from respiratory embarrassment or from inanition through the involvement of the muscles of mastication.
Radiographic Features The radiographic appearance of progressive myositis ossifi cans is similar to that described for the limited form. The heterotopic bone more commonly is oriented along the long axis of the involved muscle ( Fig. 28-15 ). Osseous malformation of the regions of muscle attach-ment, such as the mandibular condyles, also may be seen.
Differential Diagnosis In the initial stages of the disease, distinguishing between progressive myositis ossifi cans and rheumatoid arthritis may be diffi cult. However, the presence of specifi c anomalies suggests the diagnosis. In the case of calcinosis, the deposits of amorphous calcium salts frequently resorb, but in progressive myositis ossifi cans, the bone never disappears.
Management No effective treatment exists for progressive myositis ossifi cans. Nodules that are traumatized and that ulcerate frequently should be excised. If interference with respiration or respiratory infection occurs in the later stages of the disease, supportive therapy may be required.
FIG. 28-14 Soft tissue ossifi cation extending from the coronoid process in a superior direction, following the anatomy of the temporalis muscle (arrow). This condition arose after several attempts were made to provide a submandibular nerve block, leaving the patient unable to open the mandible.
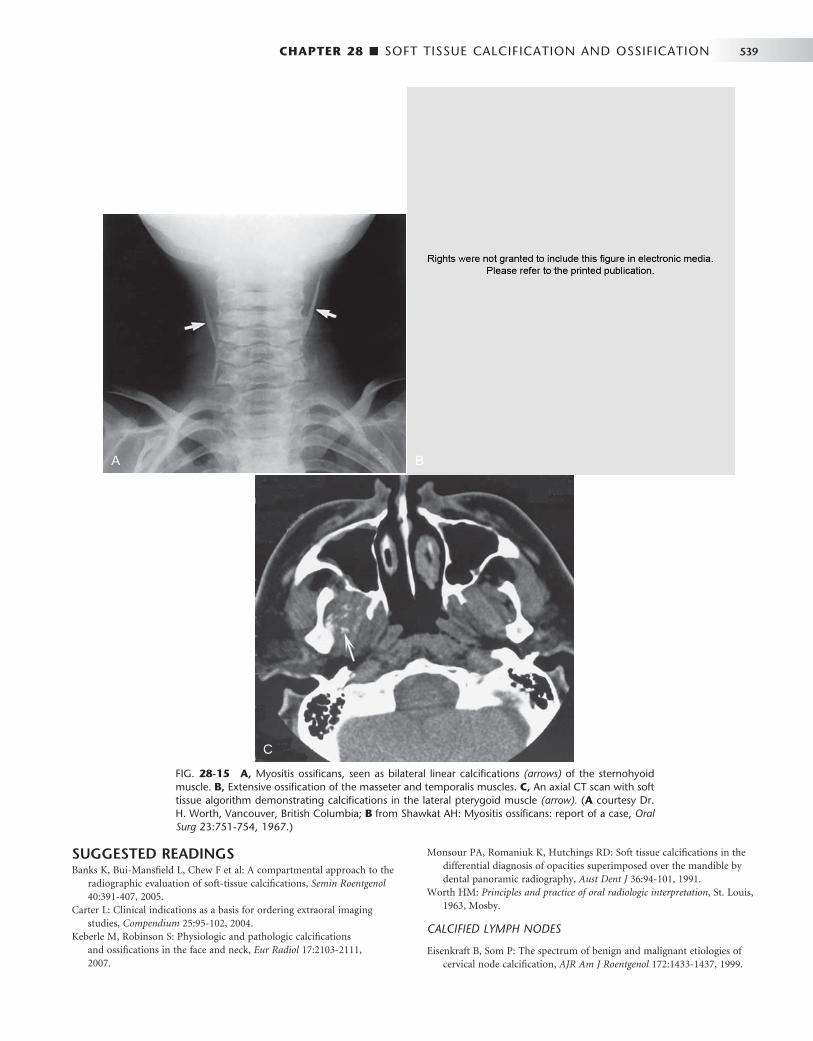
CHAPTER 28 ■ SOFT TISSUE CALCIFICATION AND OSSIFICATION 539
SUGGESTED READINGS Banks K , Bui-Mansfi eld L , Chew F et al : A compartmental approach to the
radiographic evaluation of soft-tissue calcifi cations , Semin Roentgenol 40 : 391 - 407 , 2005 .
Carter L : Clinical indications as a basis for ordering extraoral imaging studies , Compendium 25 : 95 - 102 , 2004 .
Keberle M , Robinson S : Physiologic and pathologic calcifi cations and ossifi cations in the face and neck , Eur Radiol 17 : 2103 - 2111 , 2007 .
Monsour PA , Romaniuk K , Hutchings RD : Soft tissue calcifi cations in the differential diagnosis of opacities superimposed over the mandible by dental panoramic radiography , Aust Dent J 36 : 94 - 101 , 1991 .
Worth HM : Principles and practice of oral radiologic interpretation , St. Louis , 1963 , Mosby .
CALCIFIED LYMPH NODES
Eisenkraft B , Som P : The spectrum of benign and malignant etiologies of cervical node calcifi cation , AJR Am J Roentgenol 172 : 1433 - 1437 , 1999 .
FIG. 28-15 A, Myositis ossifi cans, seen as bilateral linear calcifi cations (arrows) of the sternohyoid muscle. B, Extensive ossifi cation of the masseter and temporalis muscles. C, An axial CT scan with soft tissue algorithm demonstrating calcifi cations in the lateral pterygoid muscle (arrow). ( A courtesy Dr. H. Worth, Vancouver, British Columbia; B from Shawkat AH: Myositis ossifi cans: report of a case, Oral Surg 23:751-754, 1967.)
A
C
BA
C
B

540 PART V ■ RADIOGRAPHIC INTERPRETATION
Paquette M , Terezhalmy G , Moore W : Calcifi ed lymph nodes , Quint Int 34 : 562 - 563 , 2003 .
DYSTROPHIC CALCIFICATION IN THE TONSILS
Ansai T , Takehara T : Tonsillolith as a halitosis-inducing factor , Br Dent J 198 : 263 - 264 , 2005 .
Dal Rio A , Franchi-Teixeira A , Nicola E : Relationship between the presence of tonsilloliths and halitosis in patients with chronic caseous tonsillitis , Br Dent J Published on-line November 23, 2007 .
Mandel L : Multiple bilateral tonsilloliths: case report , J Oral Maxillofac Surg 66 : 148 - 150 , 2008 .
CYSTICERCOSIS
Delgado-Aza ñ ero WA , Mosqueda-Taylor A , Carlos-Bregni R et al : Oral cysticercosis: a collaborative study of 16 cases , Oral Surg Oral Med Oral Pathol Oral Radiol Endod 103 : 528 - 533 , 2007 .
Ribeiro A , Luvizotto M , Soubhia A et al : Oral cysticercosis: case report , Oral Surg Oral Med Oral Pathol Oral Radiol Endod 104 : e56 - e58 , 2007 .
CALCIFIED BLOOD VESSEL
Almog DM , Horev T , Illig K et al : Correlating carotid artery stenosis detected by panoramic radiography with clinically relevant carotid artery stenosis determined by duplex ultrasound , Oral Surg Oral Med Oral Pathol Oral Radiol Endod 94 : 768 - 773 , 2002 .
Carter LC , Tsimidis K , Fabiano J : Carotid calcifi cations on panoramic radiography identify an asymptomatic male patient at risk for stroke: a case report , Oral Surg Oral Med Oral Pathol Oral Radiol Endod 85 : 119 - 122 , 1998 .
Friedlander AH , Altman L : Carotid artery atheromas in postmenopausal women: their prevalence on panoramic radiographs and their relationship to atherogenic risk , J Am Dent Assoc 132 : 1130 - 1136 , 2001 .
Mupparapu M , Kim I : Calcifi ed carotid artery atheroma and stroke , J Am Dent Assoc 138 : 483 - 492 , 2007 .
RHINOLITH/ANTROLITH
G ü neri P , Kaya A , Caliskan M : Antroliths: survey of the literature and report of a case , Oral Surg Oral Med Oral Pathol Oral Radiol Endod 99 : 517 - 521 , 2005 .
Kaushik V , Bhalla R , Pahade A : Rhinolithiasis , ENT Ear Nose Throat J 83 : 512 , 514, 2004 .
Munoz A , Pedrosa I , Villafruela M : “ Eraseroma ” as a cause of rhinolith: CT and MRI in a child , Neuroradiology 39 : 824 - 826 , 1997 .
Orhan K , Kocyigit D , Kisnisci R et al : Rhinolithiasis: an uncommon entity of the nasal cavity , Oral Surg Oral Med Oral Pathol Oral Radiol Endod 101 : e28 - e32 , 2007 .
Pinto LS , Campagnoli EB , de Souza Azevedo R et al : Rhinoliths causing palatal perforation: case report and literature review , Oral Surg Oral Med Oral Pathol Oral Radiol Endod 104 : e42 - e46 , 2007 .
SIALOLITH
Ho V , Currie WJ , Walker A : Sialolithiasis of minor salivary glands , Br J Oral Maxillofac Surg 30 : 273 - 275 , 1992 .
McGurk M , Escudier M , Thomas B et al : A revolution in the management of obstructive salivary gland disease , Dent Update 33 : 28 - 30 , 2006 ; erratum: Dent Update 33:83, 2006.
Nahlieli O , Nakar L , Nazarian Y et al : Sialoendoscopy: a new approach to salivary gland obstructive pathology , J Am Dent Assoc 137 : 1394 - 1400 , 2006 .
Nakayama E , Okamura K , Mitsuyasu T et al : A newly developed interventional sialendoscope for a completely nonsurgical sialolithectomy using intracorporeal electrohydraulic lithotripsy , J Oral Maxillofac Surg 65 : 1402 - 1405 , 2007 .
Williams MF : Sialolithiasis , Otolaryngol Clin North Am 32 : 819 - 834 , 1999 .
PHLEBOLITHS
Altug H , B ü y ü ksoy V , Ok ç u K , Dogan N : Hemangiomas of the head and neck with phleboliths: clinical features, diagnostic imaging, and treatment of 3 cases , Oral Surg Oral Med Oral Pathol Oral Radiol Endod 103 : e60 - e64 , 2007 .
Chuang C-C , Lin H-C , Huang C-W : Submandibular cavernous hemangiomas with multiple phleboliths masquerading as sialolithiasis , J Chin Med Assoc 68 : 441 - 443 , 2005 .
Kakimoto N , Tanimoto K , Nishiyama H et al : CT and MR imaging features of oral and maxillofacial hemangioma and vascular malformation , Eur J Radiol 55 : 108 - 112 , 2005 .
CALCIFIED TRACHEAL CARTILAGES
Ahmad M , Madden R , Perez L : Triticeous cartilage: prevalence on panoramic radiographs and diagnostic criteria , Oral Surg Oral Med Oral Pathol Oral Radiol Endod 99 : 225 - 230 , 2005 .
Carter L : Discrimination between calcifi ed triticeous cartilage and calcifi ed carotid atheroma on panoramic radiography , Oral Surg Oral Med Oral Pathol Oral Radiol Endod 90 : 108 - 110 , 2000 .
Mupparrapu M , Vuppalapati A : Ossifi cation of laryngeal cartilages on lateral cephalometric radiographs , Angle Orthod 75 : 196 - 201 , 2005 .
OSSIFIED STYLOHYOID LIGAMENT
Bafaqeeh SA : Eagle syndrome: classic and carotid artery types , J Otolaryngol 29 : 88 - 94 , 2000 .
Balbuena L , Hayes D , Ramirez SG et al : Eagle ’ s syndrome (elongated styloid process) , South Med J 90 : 331 - 334 , 1997 .
Chuang WC , Short JH , McKinney AM et al : Reversible left hemispheric ischemia secondary to carotid compression in Eagle syndrome: surgical and CT angiographic correlation , AJNR Am J Neuroradiol 28 : 143 - 145 , 2007 .
Eagle WW : Elongated styloid process, symptoms and treatment , AMA Arch Otolaryngol 67 : 172 - 176 , 1958 .
OSTEOMA CUTIS
Baskan EB , Turan H , Tunali S et al : Miliary osteoma cutis of the face: treatment with the needle microincision-extirpation method , J Dermatol Treat 18 : 252 - 254 , 2007 .
Farhood V , Steed DL , Krolls SO : Osteoma cutis: cutaneous ossifi cation with oral manifestations , Oral Surg 45 : 98 - 103 , 1978 .
Hughes PS : Multiple miliary osteomas of the face ablated with the erbium:YAG laser , Arch Dermatol 135 : 378 - 380 , 1999 .
Shigehara H , Honda Y , Kishi K et al : Radiographic and morphologic studies of multiple miliary osteomas of cadaver skin , Oral Surg Oral Med Oral Pathol Oral Radiol Endod 86 : 121 - 125 , 1998 .
Thielen AM , Stucki L , Braun RP et al : Multiple cutaneous osteomas of the face associated with chronic infl ammatory acne , J Eur Acad Dermatol Venereol 20 : 321 - 326 , 2006 .
MYOSITIS OSSIFICANS
Kaplan FS , McCluskey W , Hahn G et al : Genetic transmission of fi brodysplasia ossifi cans progressive: report of a family , J Bone Joint Surg Am 75 : 1214 - 1220 , 1993 .
Sarac S , Sennaroglu L , Hosal AS et al : Myositis ossifi cans in the neck , Eur Arch Otorhinolaryngol 256 : 199 - 201 , 1999 .
Spinazze R , Heffez L , Bays R : Chronic progressive limitation of mouth opening , J Oral Maxillofac Surg 56 : 1178 - 1186 , 1998 .
St.-Hilaire H , Weber W , Ramer M et al : Clinicopatholgic conference: trismus following dental treatment , Oral Surg Oral Med Oral Pathol Oral Radiol Endod 98 : 261 - 266 , 2004 .
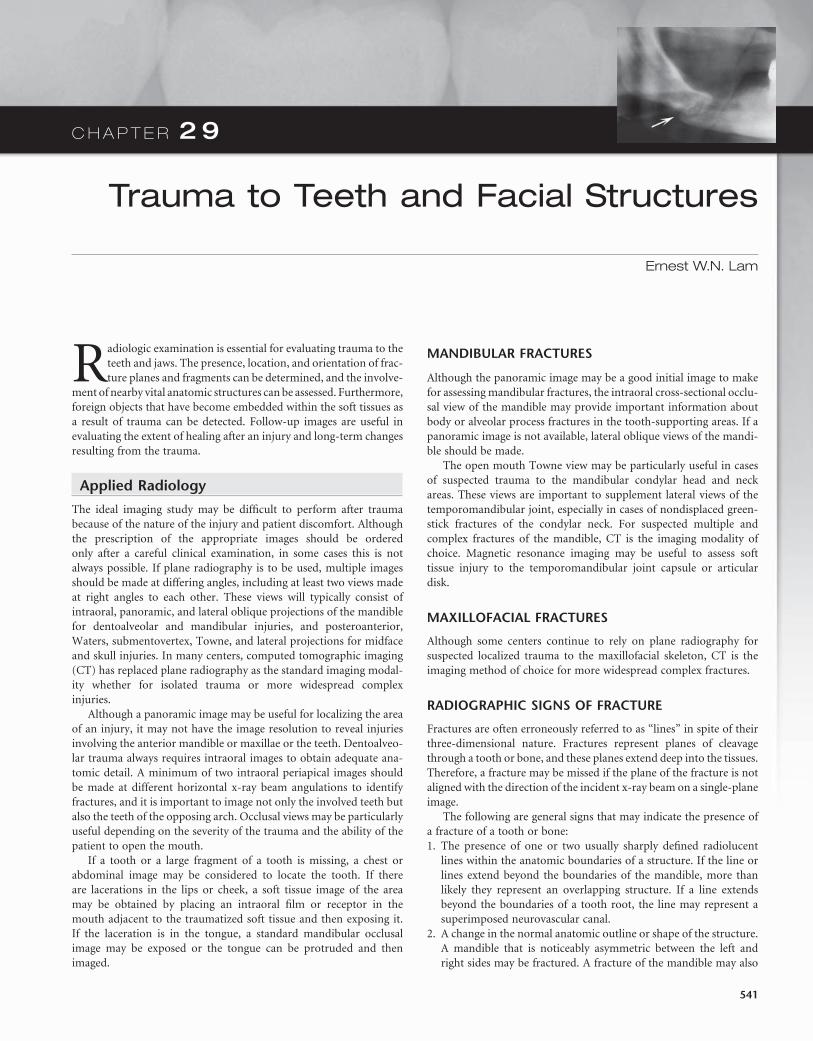
C H A P T E R 2 9
Trauma to Teeth and Facial Structures
Ernest W.N. Lam
Radiologic examination is essential for evaluating trauma to the teeth and jaws. The presence, location, and orientation of frac-ture planes and fragments can be determined, and the involve-
ment of nearby vital anatomic structures can be assessed. Furthermore, foreign objects that have become embedded within the soft tissues as a result of trauma can be detected. Follow-up images are useful in evaluating the extent of healing after an injury and long-term changes resulting from the trauma.
Applied Radiology
The ideal imaging study may be diffi cult to perform after trauma because of the nature of the injury and patient discomfort. Although the prescription of the appropriate images should be ordered only after a careful clinical examination, in some cases this is not always possible. If plane radiography is to be used, multiple images should be made at differing angles, including at least two views made at right angles to each other. These views will typically consist of intraoral, panoramic, and lateral oblique projections of the mandible for dentoalveolar and mandibular injuries, and posteroanterior, Waters, submentovertex, Towne, and lateral projections for midface and skull injuries. In many centers, computed tomographic imaging (CT) has replaced plane radiography as the standard imaging modal-ity whether for isolated trauma or more widespread complex injuries.
Although a panoramic image may be useful for localizing the area of an injury, it may not have the image resolution to reveal injuries involving the anterior mandible or maxillae or the teeth. Dentoalveo-lar trauma always requires intraoral images to obtain adequate ana-tomic detail. A minimum of two intraoral periapical images should be made at different horizontal x-ray beam angulations to identify fractures, and it is important to image not only the involved teeth but also the teeth of the opposing arch. Occlusal views may be particularly useful depending on the severity of the trauma and the ability of the patient to open the mouth.
If a tooth or a large fragment of a tooth is missing, a chest or abdominal image may be considered to locate the tooth. If there are lacerations in the lips or cheek, a soft tissue image of the area may be obtained by placing an intraoral fi lm or receptor in the mouth adjacent to the traumatized soft tissue and then exposing it. If the laceration is in the tongue, a standard mandibular occlusal image may be exposed or the tongue can be protruded and then imaged.
MANDIBULAR FRACTURES
Although the panoramic image may be a good initial image to make for assessing mandibular fractures, the intraoral cross-sectional occlu-sal view of the mandible may provide important information about body or alveolar process fractures in the tooth-supporting areas. If a panoramic image is not available, lateral oblique views of the mandi-ble should be made.
The open mouth Towne view may be particularly useful in cases of suspected trauma to the mandibular condylar head and neck areas. These views are important to supplement lateral views of the temporomandibular joint, especially in cases of nondisplaced green-stick fractures of the condylar neck. For suspected multiple and complex fractures of the mandible, CT is the imaging modality of choice. Magnetic resonance imaging may be useful to assess soft tissue injury to the temporomandibular joint capsule or articular disk.
MAXILLOFACIAL FRACTURES
Although some centers continue to rely on plane radiography for suspected localized trauma to the maxillofacial skeleton, CT is the imaging method of choice for more widespread complex fractures.
RADIOGRAPHIC SIGNS OF FRACTURE
Fractures are often erroneously referred to as “ lines ” in spite of their three-dimensional nature. Fractures represent planes of cleavage through a tooth or bone, and these planes extend deep into the tissues. Therefore, a fracture may be missed if the plane of the fracture is not aligned with the direction of the incident x-ray beam on a single-plane image.
The following are general signs that may indicate the presence of a fracture of a tooth or bone: 1. The presence of one or two usually sharply defi ned radiolucent
lines within the anatomic boundaries of a structure. If the line or lines extend beyond the boundaries of the mandible, more than likely they represent an overlapping structure. If a line extends beyond the boundaries of a tooth root, the line may represent a superimposed neurovascular canal.
2. A change in the normal anatomic outline or shape of the structure. A mandible that is noticeably asymmetric between the left and right sides may be fractured. A fracture of the mandible may also
541
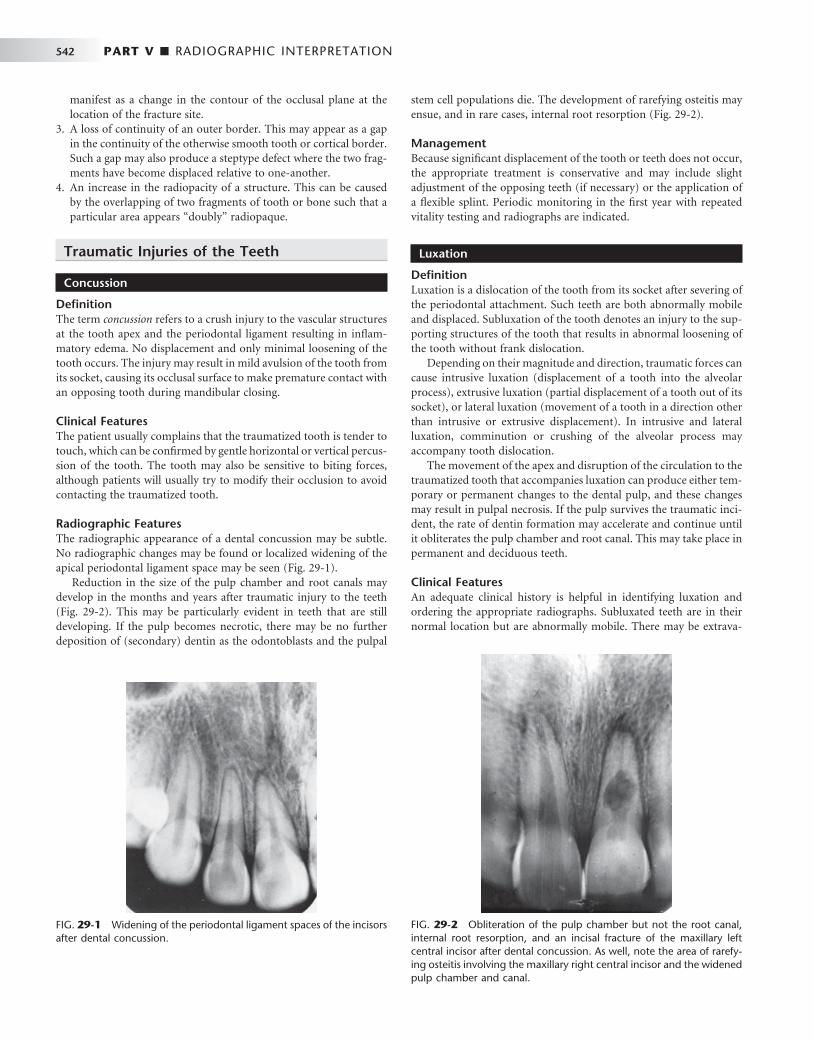
542 PART V ■ RADIOGRAPHIC INTERPRETATION
FIG. 29-1 Widening of the periodontal ligament spaces of the incisors after dental concussion.
FIG. 29-2 Obliteration of the pulp chamber but not the root canal, internal root resorption, and an incisal fracture of the maxillary left central incisor after dental concussion. As well, note the area of rarefy-ing osteitis involving the maxillary right central incisor and the widened pulp chamber and canal.
manifest as a change in the contour of the occlusal plane at the location of the fracture site.
3. A loss of continuity of an outer border. This may appear as a gap in the continuity of the otherwise smooth tooth or cortical border. Such a gap may also produce a steptype defect where the two frag-ments have become displaced relative to one-another.
4. An increase in the radiopacity of a structure. This can be caused by the overlapping of two fragments of tooth or bone such that a particular area appears “ doubly ” radiopaque.
Traumatic Injuries of the Teeth
Concussion
Defi nition The term concussion refers to a crush injury to the vascular structures at the tooth apex and the periodontal ligament resulting in infl am-matory edema. No displacement and only minimal loosening of the tooth occurs. The injury may result in mild avulsion of the tooth from its socket, causing its occlusal surface to make premature contact with an opposing tooth during mandibular closing.
Clinical Features The patient usually complains that the traumatized tooth is tender to touch, which can be confi rmed by gentle horizontal or vertical percus-sion of the tooth. The tooth may also be sensitive to biting forces, although patients will usually try to modify their occlusion to avoid contacting the traumatized tooth.
Radiographic Features The radiographic appearance of a dental concussion may be subtle. No radiographic changes may be found or localized widening of the apical periodontal ligament space may be seen ( Fig. 29-1 ).
Reduction in the size of the pulp chamber and root canals may develop in the months and years after traumatic injury to the teeth ( Fig. 29-2 ). This may be particularly evident in teeth that are still developing. If the pulp becomes necrotic, there may be no further deposition of (secondary) dentin as the odontoblasts and the pulpal
stem cell populations die. The development of rarefying osteitis may ensue, and in rare cases, internal root resorption ( Fig. 29-2 ).
Management Because signifi cant displacement of the tooth or teeth does not occur, the appropriate treatment is conservative and may include slight adjustment of the opposing teeth (if necessary) or the application of a fl exible splint. Periodic monitoring in the fi rst year with repeated vitality testing and radiographs are indicated.
Luxation
Defi nition Luxation is a dislocation of the tooth from its socket after severing of the periodontal attachment. Such teeth are both abnormally mobile and displaced. Subluxation of the tooth denotes an injury to the sup-porting structures of the tooth that results in abnormal loosening of the tooth without frank dislocation.
Depending on their magnitude and direction, traumatic forces can cause intrusive luxation (displacement of a tooth into the alveolar process), extrusive luxation (partial displacement of a tooth out of its socket), or lateral luxation (movement of a tooth in a direction other than intrusive or extrusive displacement). In intrusive and lateral luxation, comminution or crushing of the alveolar process may accompany tooth dislocation.
The movement of the apex and disruption of the circulation to the traumatized tooth that accompanies luxation can produce either tem-porary or permanent changes to the dental pulp, and these changes may result in pulpal necrosis. If the pulp survives the traumatic inci-dent, the rate of dentin formation may accelerate and continue until it obliterates the pulp chamber and root canal. This may take place in permanent and deciduous teeth.
Clinical Features An adequate clinical history is helpful in identifying luxation and ordering the appropriate radiographs. Subluxated teeth are in their normal location but are abnormally mobile. There may be extrava-
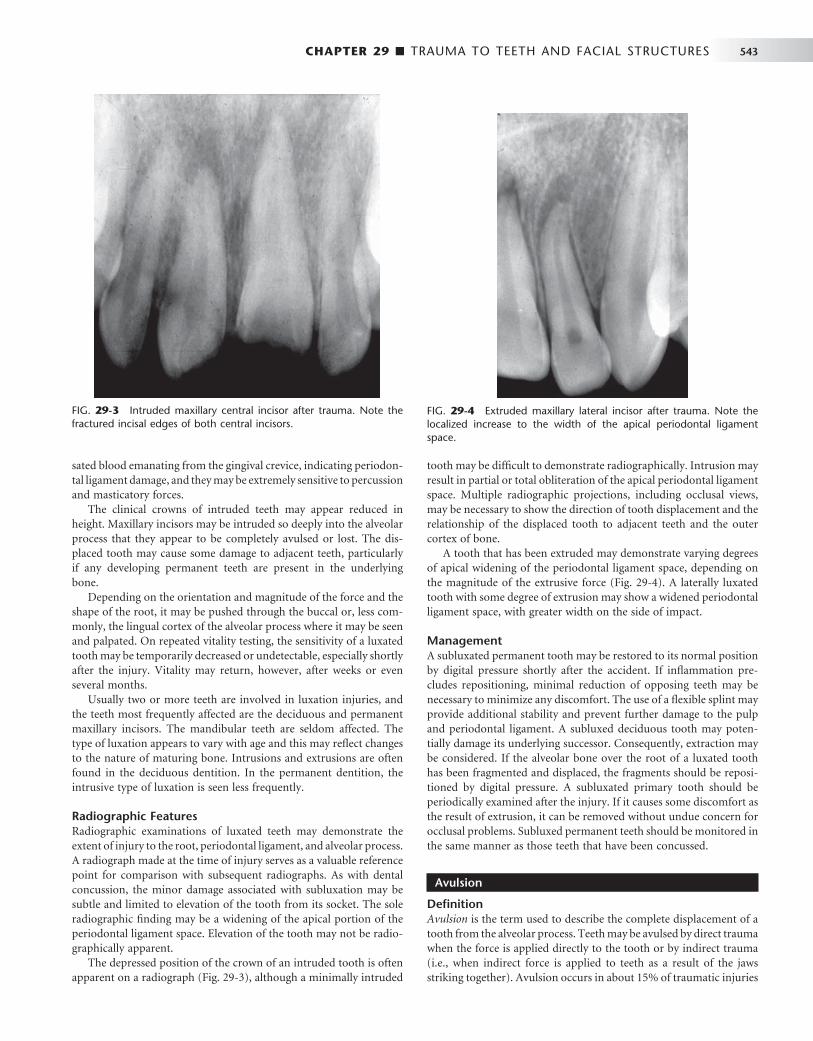
CHAPTER 29 ■ TRAUMA TO TEETH AND FACIAL STRUCTURES 543
sated blood emanating from the gingival crevice, indicating periodon-tal ligament damage, and they may be extremely sensitive to percussion and masticatory forces.
The clinical crowns of intruded teeth may appear reduced in height. Maxillary incisors may be intruded so deeply into the alveolar process that they appear to be completely avulsed or lost. The dis-placed tooth may cause some damage to adjacent teeth, particularly if any developing permanent teeth are present in the underlying bone.
Depending on the orientation and magnitude of the force and the shape of the root, it may be pushed through the buccal or, less com-monly, the lingual cortex of the alveolar process where it may be seen and palpated. On repeated vitality testing, the sensitivity of a luxated tooth may be temporarily decreased or undetectable, especially shortly after the injury. Vitality may return, however, after weeks or even several months.
Usually two or more teeth are involved in luxation injuries, and the teeth most frequently affected are the deciduous and permanent maxillary incisors. The mandibular teeth are seldom affected. The type of luxation appears to vary with age and this may refl ect changes to the nature of maturing bone. Intrusions and extrusions are often found in the deciduous dentition. In the permanent dentition, the intrusive type of luxation is seen less frequently.
Radiographic Features Radiographic examinations of luxated teeth may demonstrate the extent of injury to the root, periodontal ligament, and alveolar process. A radiograph made at the time of injury serves as a valuable reference point for comparison with subsequent radiographs. As with dental concussion, the minor damage associated with subluxation may be subtle and limited to elevation of the tooth from its socket. The sole radiographic fi nding may be a widening of the apical portion of the periodontal ligament space. Elevation of the tooth may not be radio-graphically apparent.
The depressed position of the crown of an intruded tooth is often apparent on a radiograph ( Fig. 29-3 ), although a minimally intruded
FIG. 29-3 Intruded maxillary central incisor after trauma. Note the fractured incisal edges of both central incisors.
FIG. 29-4 Extruded maxillary lateral incisor after trauma. Note the localized increase to the width of the apical periodontal ligament space.
tooth may be diffi cult to demonstrate radiographically. Intrusion may result in partial or total obliteration of the apical periodontal ligament space. Multiple radiographic projections, including occlusal views, may be necessary to show the direction of tooth displacement and the relationship of the displaced tooth to adjacent teeth and the outer cortex of bone.
A tooth that has been extruded may demonstrate varying degrees of apical widening of the periodontal ligament space, depending on the magnitude of the extrusive force ( Fig. 29-4 ). A laterally luxated tooth with some degree of extrusion may show a widened periodontal ligament space, with greater width on the side of impact.
Management A subluxated permanent tooth may be restored to its normal position by digital pressure shortly after the accident. If infl ammation pre-cludes repositioning, minimal reduction of opposing teeth may be necessary to minimize any discomfort. The use of a fl exible splint may provide additional stability and prevent further damage to the pulp and periodontal ligament. A subluxed deciduous tooth may poten-tially damage its underlying successor. Consequently, extraction may be considered. If the alveolar bone over the root of a luxated tooth has been fragmented and displaced, the fragments should be reposi-tioned by digital pressure. A subluxated primary tooth should be periodically examined after the injury. If it causes some discomfort as the result of extrusion, it can be removed without undue concern for occlusal problems. Subluxed permanent teeth should be monitored in the same manner as those teeth that have been concussed.
Avulsion
Defi nition Avulsion is the term used to describe the complete displacement of a tooth from the alveolar process. Teeth may be avulsed by direct trauma when the force is applied directly to the tooth or by indirect trauma (i.e., when indirect force is applied to teeth as a result of the jaws striking together). Avulsion occurs in about 15% of traumatic injuries

544 PART V ■ RADIOGRAPHIC INTERPRETATION
to the teeth, with fi ghts being responsible for the avulsion of most permanent teeth and accidental falls accounting for the traumatic loss of most deciduous teeth.
Clinical Features Maxillary central incisors are the most commonly avulsed teeth from both dentitions. Most often only a single tooth is lost. Typically this injury occurs in a relatively young age group when the permanent central incisors are just erupting. Fractures of the alveolar process and lip lacerations may be seen with an avulsed tooth.
Radiographic Features In a recent avulsion, the lamina dura of the empty socket is apparent and usually persists for several months. The missing tooth may be displaced into the adjacent soft tissue, and its image may project over the alveolar process on an image, giving the false impression that it lies within the bone. Therefore, to differentiate between an intruded tooth and an avulsed tooth lying within the adjacent soft tissues, a soft tissue image of the lacerated lip or tongue should be made. In some instances new bone within the healing socket may be very dense and simulate a retained root tip ( Fig. 29-5 ).
Management If the avulsed tooth is not found by clinical or radiographic examina-tion, a chest or abdominal radiograph may be considered to locate it within the airway or gastrointestinal tract. Reimplanting permanent teeth after avulsion is possible; however, the prognosis of the reim-plantation is dependent on the condition of the tooth while it is outside the mouth, the time it is out of its socket, and the viability of the residual periodontal ligament fi bers. Endodontic therapy may be necessary after reimplantation and there may be external root resorp-tion in the months and years after reimplantation. Reimplanting an avulsed deciduous tooth carries the danger of interfering with the underlying developing permanent tooth.
FRACTURES OF THE TEETH
Dental Crown Fractures
Defi nition Fractures of the dental crown account for about 25% of traumatic injuries to the permanent teeth and 40% of injuries to the deciduous teeth. The most common event responsible for the fracture of perma-nent teeth is a fall, followed by accidents involving vehicles (e.g., bicycles, automobiles) and blows from foreign objects striking the teeth. Fractures involving only the crown normally fall into three categories:
1. Fractures that involve only the enamel without the loss of enamel substance (infraction of the crown or crack)
2. Fractures that involve enamel or enamel and dentin with loss of tooth substance but without pulpal involvement (uncompli-cated fracture)
3. Fractures that pass through enamel, dentin, and pulp with loss of tooth substance and exposure of the pulp (complicated fracture)
Clinical Features Fractures of the dental crowns most frequently involve anterior teeth. Infractions or cracks in the enamel are quite common but frequently are not readily detectable. Illuminating crowns with indirect light (directing the beam along the long axis of the tooth) causes cracks to appear distinctly in the enamel. Histologic studies show that they pass through the enamel but not into the dentin. The pattern and distribu-tion of these cracks are unpredictable and apparently relate to the trauma.
Uncomplicated crown fractures that do not involve dentin usually occur at the mesioincisal or distoincisal corners of the maxillary central incisor. Loss of the central portion of the incisal edge may also occur. Fractures that involve dentin can be recognized by the contrast in color between dentin and the peripheral layer of enamel. The exposed dentin is usually sensitive to chemical, thermal, and mechani-cal stimulation. In deep fractures, the pink blush of the pulp may be appreciated through the thin remaining dentin wall.
Uncomplicated fractures that involve both the enamel and the dentin of permanent teeth are more common than complicated frac-tures are. In contrast, the incidence of complicated and uncompli-cated fractures is about equal in the deciduous teeth.
Complicated crown fractures are distinguishable by bleeding from the exposed pulp or by droplets of blood forming from pinpoint exposures. The pulp is visible and may extrude from the open pulp chamber if the fracture is old. The exposed pulp is sensitive to most forms of stimulation.
Radiographic Features Radiographs provide information regarding the location and extent of the fracture and the relationship of the fracture plane and fragment to the pulp chamber. As well, the stage of root development of the involved tooth can be assessed with radiography ( Fig. 29-6 ). This initial image also provides a means of comparison for follow-up examinations of the involved teeth.
Management Although crown infractions do not require treatment, the vitality of the tooth should be evaluated. The sharp edges of enamel that result from an uncomplicated fracture should be smoothed and may require restoration for cosmetic reasons. It is reasonable to delay this proce-
FIG. 29-5 Bone formation during healing of a fi rst premolar tooth socket. Note how the bone is developing from the lateral walls of the socket. The central radiolucent line (arrow) may have a similar appear-ance to that of a pulp canal, falsely giving the impression of a retained tooth fragment.
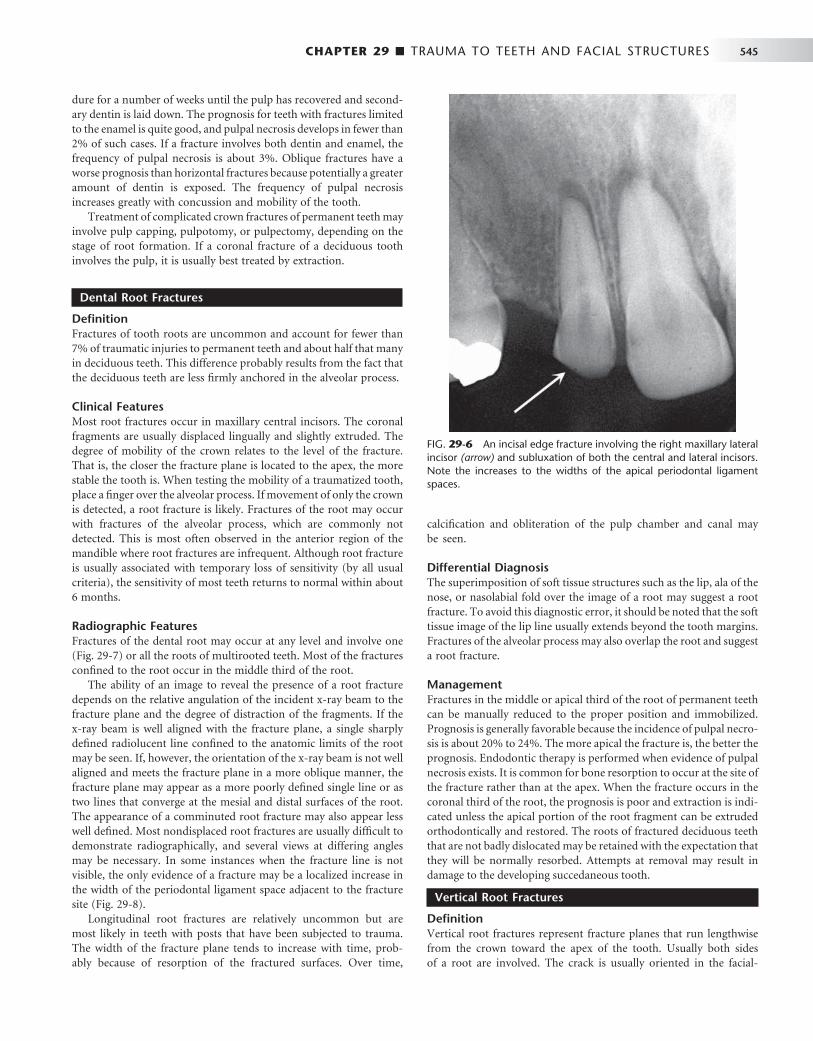
CHAPTER 29 ■ TRAUMA TO TEETH AND FACIAL STRUCTURES 545
dure for a number of weeks until the pulp has recovered and second-ary dentin is laid down. The prognosis for teeth with fractures limited to the enamel is quite good, and pulpal necrosis develops in fewer than 2% of such cases. If a fracture involves both dentin and enamel, the frequency of pulpal necrosis is about 3%. Oblique fractures have a worse prognosis than horizontal fractures because potentially a greater amount of dentin is exposed. The frequency of pulpal necrosis increases greatly with concussion and mobility of the tooth.
Treatment of complicated crown fractures of permanent teeth may involve pulp capping, pulpotomy, or pulpectomy, depending on the stage of root formation. If a coronal fracture of a deciduous tooth involves the pulp, it is usually best treated by extraction.
Dental Root Fractures
Defi nition Fractures of tooth roots are uncommon and account for fewer than 7% of traumatic injuries to permanent teeth and about half that many in deciduous teeth. This difference probably results from the fact that the deciduous teeth are less fi rmly anchored in the alveolar process.
Clinical Features Most root fractures occur in maxillary central incisors. The coronal fragments are usually displaced lingually and slightly extruded. The degree of mobility of the crown relates to the level of the fracture. That is, the closer the fracture plane is located to the apex, the more stable the tooth is. When testing the mobility of a traumatized tooth, place a fi nger over the alveolar process. If movement of only the crown is detected, a root fracture is likely. Fractures of the root may occur with fractures of the alveolar process, which are commonly not detected. This is most often observed in the anterior region of the mandible where root fractures are infrequent. Although root fracture is usually associated with temporary loss of sensitivity (by all usual criteria), the sensitivity of most teeth returns to normal within about 6 months.
Radiographic Features Fractures of the dental root may occur at any level and involve one ( Fig. 29-7 ) or all the roots of multirooted teeth. Most of the fractures confi ned to the root occur in the middle third of the root.
The ability of an image to reveal the presence of a root fracture depends on the relative angulation of the incident x-ray beam to the fracture plane and the degree of distraction of the fragments. If the x-ray beam is well aligned with the fracture plane, a single sharply defi ned radiolucent line confi ned to the anatomic limits of the root may be seen. If, however, the orientation of the x-ray beam is not well aligned and meets the fracture plane in a more oblique manner, the fracture plane may appear as a more poorly defi ned single line or as two lines that converge at the mesial and distal surfaces of the root. The appearance of a comminuted root fracture may also appear less well defi ned. Most nondisplaced root fractures are usually diffi cult to demonstrate radiographically, and several views at differing angles may be necessary. In some instances when the fracture line is not visible, the only evidence of a fracture may be a localized increase in the width of the periodontal ligament space adjacent to the fracture site ( Fig. 29-8 ).
Longitudinal root fractures are relatively uncommon but are most likely in teeth with posts that have been subjected to trauma. The width of the fracture plane tends to increase with time, prob-ably because of resorption of the fractured surfaces. Over time,
calcifi cation and obliteration of the pulp chamber and canal may be seen.
Differential Diagnosis The superimposition of soft tissue structures such as the lip, ala of the nose, or nasolabial fold over the image of a root may suggest a root fracture. To avoid this diagnostic error, it should be noted that the soft tissue image of the lip line usually extends beyond the tooth margins. Fractures of the alveolar process may also overlap the root and suggest a root fracture.
Management Fractures in the middle or apical third of the root of permanent teeth can be manually reduced to the proper position and immobilized. Prognosis is generally favorable because the incidence of pulpal necro-sis is about 20% to 24%. The more apical the fracture is, the better the prognosis. Endodontic therapy is performed when evidence of pulpal necrosis exists. It is common for bone resorption to occur at the site of the fracture rather than at the apex. When the fracture occurs in the coronal third of the root, the prognosis is poor and extraction is indi-cated unless the apical portion of the root fragment can be extruded orthodontically and restored. The roots of fractured deciduous teeth that are not badly dislocated may be retained with the expectation that they will be normally resorbed. Attempts at removal may result in damage to the developing succedaneous tooth.
Vertical Root Fractures
Defi nition Vertical root fractures represent fracture planes that run lengthwise from the crown toward the apex of the tooth. Usually both sides of a root are involved. The crack is usually oriented in the facial-
FIG. 29-6 An incisal edge fracture involving the right maxillary lateral incisor (arrow) and subluxation of both the central and lateral incisors. Note the increases to the widths of the apical periodontal ligament spaces.
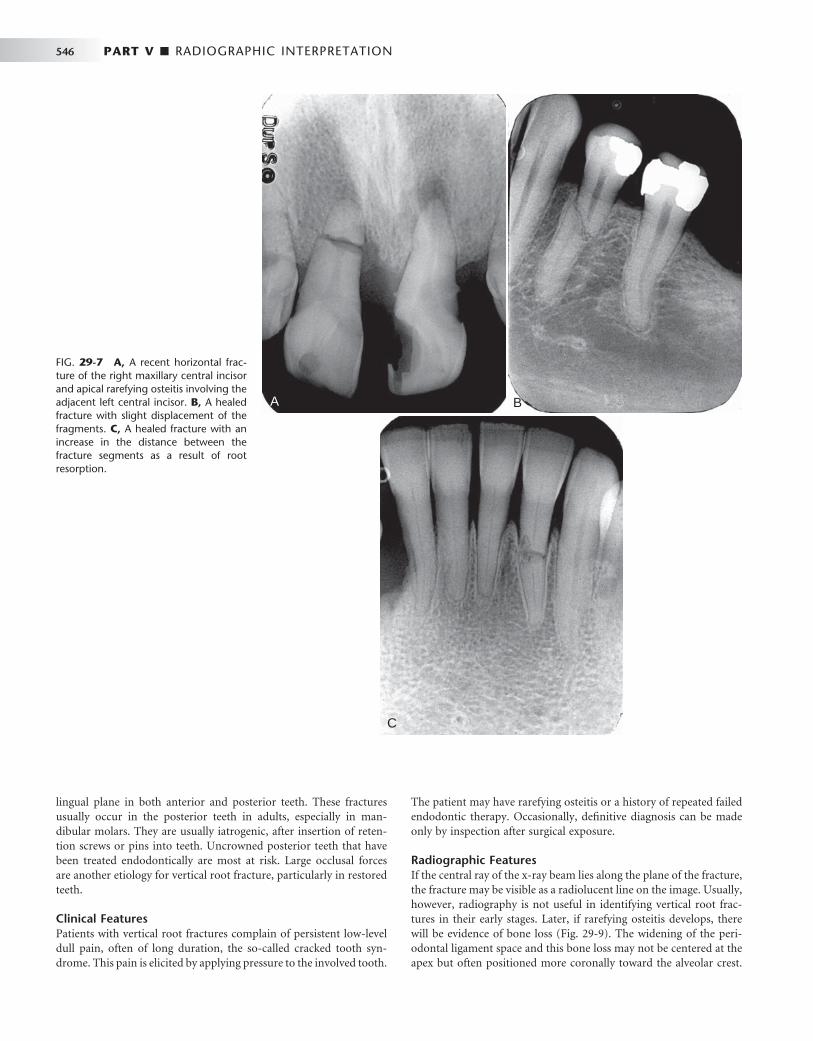
546 PART V ■ RADIOGRAPHIC INTERPRETATION
lingual plane in both anterior and posterior teeth. These fractures usually occur in the posterior teeth in adults, especially in man-dibular molars. They are usually iatrogenic, after insertion of reten-tion screws or pins into teeth. Uncrowned posterior teeth that have been treated endodontically are most at risk. Large occlusal forces are another etiology for vertical root fracture, particularly in restored teeth.
Clinical Features Patients with vertical root fractures complain of persistent low-level dull pain, often of long duration, the so-called cracked tooth syn-drome. This pain is elicited by applying pressure to the involved tooth.
The patient may have rarefying osteitis or a history of repeated failed endodontic therapy. Occasionally, defi nitive diagnosis can be made only by inspection after surgical exposure.
Radiographic Features If the central ray of the x-ray beam lies along the plane of the fracture, the fracture may be visible as a radiolucent line on the image. Usually, however, radiography is not useful in identifying vertical root frac-tures in their early stages. Later, if rarefying osteitis develops, there will be evidence of bone loss ( Fig. 29-9 ). The widening of the peri-odontal ligament space and this bone loss may not be centered at the apex but often positioned more coronally toward the alveolar crest.
FIG. 29-7 A, A recent horizontal frac-ture of the right maxillary central incisor and apical rarefying osteitis involving the adjacent left central incisor. B, A healed fracture with slight displacement of the fragments. C, A healed fracture with an increase in the distance between the fracture segments as a result of root resorption.
A
C
B

CHAPTER 29 ■ TRAUMA TO TEETH AND FACIAL STRUCTURES 547
FIG. 29-8 A, Subtle evidence of a root fracture involving the root of the maxillary right central incisor. Although a fracture plane is not apparent on the mesial aspect of the root because of malalignment of the x-ray beam, there is widening of the periodontal membrane space on the mesial surface (arrow) at the site of the fracture. B, Later dislocation of the root fragments.
A BA B
FIG. 29-9 A, Vertical fracture through the root of a mandibular fi rst premolar that has been endodontically treated. The fracture plane extends through the root canal and there is more displace-ment between the root fragments at the apex of the root. B, A vertical root fracture through the root of a mandibular canine with signifi cant displacement of the fragments.
A BA B

548 PART V ■ RADIOGRAPHIC INTERPRETATION
Infl ammatory lesions may also extend apically from the alveolar crest and may resemble periodontal lesions.
Management Single-rooted teeth with vertical root fractures must be extracted. Multirooted teeth may be hemisected and the intact remaining half of the tooth restored with endodontic therapy and a crown.
Combination Crown and Root Fractures
Defi nition Crown/root fractures involve both the crown and root(s). Although uncomplicated fractures may occur, crown/root fractures usually involve the pulp. About twice as many affect the permanent as the deciduous teeth. Most crown/root fractures of the anterior teeth are the result of direct trauma. Many posterior teeth are predisposed to such fractures by large restorations or extensive caries.
Clinical Features The fracture plane of a typical crown/root fracture of an anterior tooth extends obliquely from the labial surface near the gingival third of the crown to a position apical to the gingival attachment on the lingual surface. Displacement of the fragments is usually minimal. Crown/root fractures occasionally present with bleeding from the pulp. Because these teeth are sensitive to occlusal forces that may cause separation of the fragments, a patient with a crown/root fracture usually complains of pain during mastication.
Radiographic Features These fractures are often not visible on the radiographic image because the x-ray beam is rarely aligned with the plane of the fracture. Also, distraction of the fragments is usually not present. Vertical crown/root fractures that are oriented in a mainly tangential orientation relative to the direction of the x-ray beam are readily apparent on the image. Unfortunately, this is not common.
Management Removal of the coronal fragment permits the evaluation of the extent of the fracture. If the coronal fragment includes as much as 3 to 4 mm of clinical root, successful restoration of the tooth is doubtful and removal of the residual root is recommended. If the crown/root frac-ture is vertically oriented, prognosis is poor regardless of treatment.
If the pulp is not exposed and the fracture does not extend more than 3 to 4 mm below the epithelial attachment, conservative treat-ment is likely to be successful. Uncomplicated crown/root fractures are frequently encountered in posterior teeth, and with crown length-ening procedures the tooth is likely to be restorable. If only a small amount of root is lost with the coronal fragment but the pulp has been compromised, it is likely that the tooth can be restored after endodontic treatment.
Traumatic Injuries to the Facial Bones
Facial fractures most frequently affect the zygomatic bones or man-dible and, to a lesser extent, the maxillae. Radiography plays a crucial role in the diagnosis and management of traumatic injuries to these and the other facial bones.
Superfi cial signs of injury such as soft tissue swelling, hematoma formation, or hemorrhage from a laceration or abrasion may focus the radiologic examination. Localized injuries may be investigated with plane radiography. In this instance, it is important to make at
least two views of the injured site at right angles to one another to assess the presence, location, extent, and displacement of a fracture. Some fractures may not be readily apparent if the x-ray beam is not oriented parallel to the plane of the fracture. More and more com-monly, plane radiography is being replaced by CT, even for localized injuries. For more widespread trauma, CT is the imaging modality of choice.
MANDIBULAR FRACTURES
The most common mandibular fracture sites are the condyle, body, and angle, followed less frequently by the parasymphyseal region, ramus, coronoid process, and alveolar process. Trauma to the mandi-ble is often associated with other injuries, most commonly concussion (loss of consciousness) and other fractures, usually of the maxillae, zygomatic bones, and cranial vault.
The most common causes of mandibular fractures are assault, falls, and sports injuries. About half of all mandibular fractures occur in individuals between 16 and 35 years old, and injuries in males are reportedly three times more common than in females. Moreover, fractures are more likely to occur on weekend days than on other days of the week.
Mandibular Body Fractures
Defi nition The mandible is the most commonly fractured facial bone. It is important to realize that a fracture of the mandibular body on one side is frequently accompanied by a fracture of the condylar neck on the opposite side. Trauma to the anterior mandible may result in unilateral or bilateral fractures of the condylar necks. When a localized heavy force is directed posteriorly to the mandible, there may be fractures of the angle, ramus, or even the coronoid process. In chil-dren, fractures of the mandibular body usually occur in the anterior region.
Mandibular fractures are classifi ed as being either favorable or unfavorable, depending on the orientation of the fracture plane. Unfa-vorable fractures are those in which the action of muscles attached to the mandibular fragments displace the fragments away from one another. For example, if a fracture plane in the body of the mandible slants obliquely posteriorly and inferiorly from the base of the ante-rior border of the ramus, the masseter and medial pterygoid muscles may displace the ramal fragment superiorly and away from the body of the mandible. In favorable fractures, the muscle action tends to reduce the fracture.
Clinical Features A history of injury is typical, substantiated by some evidence of the trauma that caused the fracture, such as injury to the overlying skin. Frequently the patient has swelling and a deformity that is accentuated when the patient opens the mouth. A discrepancy is often present in the occlusal plane, and manipulation may produce crepitus or abnor-mal mobility. Intraoral examination may reveal ecchymosis in the fl oor of the mouth. In the case of bilateral fractures to the mandible, a risk exists that the digastric, mylohyoid, and omohyoid muscles will displace the anterior mandibular fragment posteriorly and inferiorly, causing impingement on the airway.
Radiographic Features The radiographic examination of a suspected mandibular fracture may include intraoral or occlusal views, a panoramic view, postero-

CHAPTER 29 ■ TRAUMA TO TEETH AND FACIAL STRUCTURES 549
anterior or submentovertex plain radiographic views, or CT. Intraoral images may, given their higher resolution, reveal fractures that extra-oral plane images may fail to reveal.
The margins of fracture planes usually appear as sharply defi ned radiolucent lines of separation that are confi ned to the structure of the mandible ( Fig. 29-10 ). They are best visualized when the x-ray beam is oriented along the plane of the fracture. Displacement of the fragments results in a cortical discontinuity or “ step ” ( Fig. 29-11 ) or an irregularity in the occlusal plane. Occasionally, the margins of the fracture overlap each other, resulting in an area of increased radiopac-ity at the fracture site.
Nondisplaced mandibular fractures may involve one or both buccal and lingual cortical plates. An incomplete fracture involving only one cortical plate is often called a greenstick fracture; these usually occur in children. An oblique fracture that involves both corti-cal plates may cause some diagnostic diffi culties if the fracture lines in the buccal and lingual plates are not superimposed ( Fig. 29-12 ). In this case, two lines are seen that converge at the periphery, suggesting two distinct fractures when in reality only one exists. A right-angle view such as an occlusal view may be useful.
Differential Diagnosis The superimposition of soft tissue images on the image of the man-dible may simulate fractures. A narrow air space between the dorsal surface of the tongue and the soft palate superimposed across the angle of the mandible in a panoramic image may simulate a fracture. The air space between the dorsal surface of the tongue and the poste-rior pharyngeal wall can appear similar to a fracture on lateral views of the mandible. Similar appearances can occur in the region of soft palate where it superimposes over the ramus.
Management The management of a fracture of the mandible presents a variety of surgical problems that involve the proper reduction, fi xation, and immobilization of the fractured bone fragments. Minimally displaced fractures are managed by closed reduction and intermaxillary fi xa-tion, whereas fractures with more severely displaced fragments may require open reduction. Treatment for fractures of the body often includes antibiotic therapy because a tooth root may be in the line of the fracture. When the fracture line involves third molars, severely mobile teeth, or teeth with at least half their roots exposed in the fracture line, the involved teeth are often extracted to reduce the risk of infection and problems with fi xation.
Mandibular Condyle Fractures
Defi nition Fractures involving the mandibular condyle can be divided into con-dylar neck fractures and condylar head fractures. Condylar neck frac-tures are more common and are located below the condylar head. When a condylar neck fracture occurs, the head is usually displaced
FIG. 29-10 Cropped panoramic image shows a fracture through the right parasymphyseal region and a condylar neck fracture on the same side. Note the step defect on the posterior surface of the mandibular ramus.
FIG. 29-11 CT images show a minimally displaced mandibular para-symphyseal fracture in the axial (A) and coronal (B) planes.
A
B
A
B
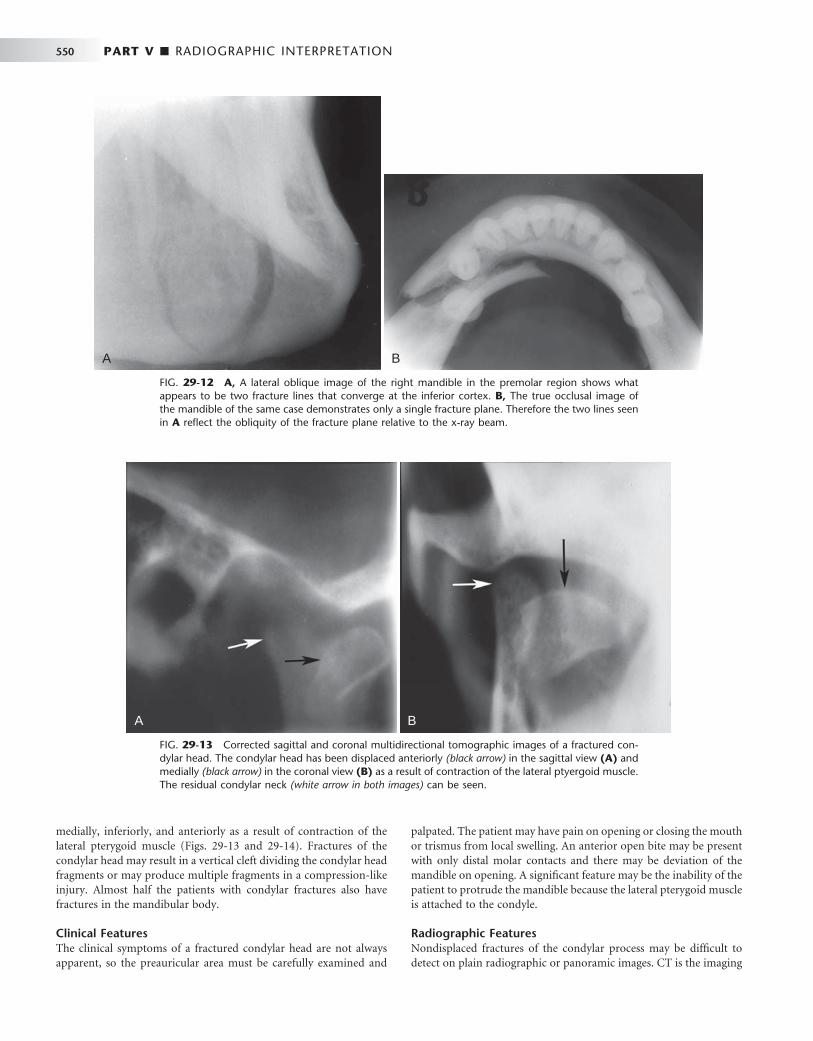
550 PART V ■ RADIOGRAPHIC INTERPRETATION
medially, inferiorly, and anteriorly as a result of contraction of the lateral pterygoid muscle ( Figs. 29-13 and 29-14 ). Fractures of the condylar head may result in a vertical cleft dividing the condylar head fragments or may produce multiple fragments in a compression-like injury. Almost half the patients with condylar fractures also have fractures in the mandibular body.
Clinical Features The clinical symptoms of a fractured condylar head are not always apparent, so the preauricular area must be carefully examined and
palpated. The patient may have pain on opening or closing the mouth or trismus from local swelling. An anterior open bite may be present with only distal molar contacts and there may be deviation of the mandible on opening. A signifi cant feature may be the inability of the patient to protrude the mandible because the lateral pterygoid muscle is attached to the condyle.
Radiographic Features Nondisplaced fractures of the condylar process may be diffi cult to detect on plain radiographic or panoramic images. CT is the imaging
FIG. 29-12 A, A lateral oblique image of the right mandible in the premolar region shows what appears to be two fracture lines that converge at the inferior cortex. B, The true occlusal image of the mandible of the same case demonstrates only a single fracture plane. Therefore the two lines seen in A refl ect the obliquity of the fracture plane relative to the x-ray beam.
A BA B
FIG. 29-13 Corrected sagittal and coronal multidirectional tomographic images of a fractured con-dylar head. The condylar head has been displaced anteriorly (black arrow) in the sagittal view (A) and medially (black arrow) in the coronal view (B) as a result of contraction of the lateral ptyergoid muscle. The residual condylar neck (white arrow in both images) can be seen.
A BA B
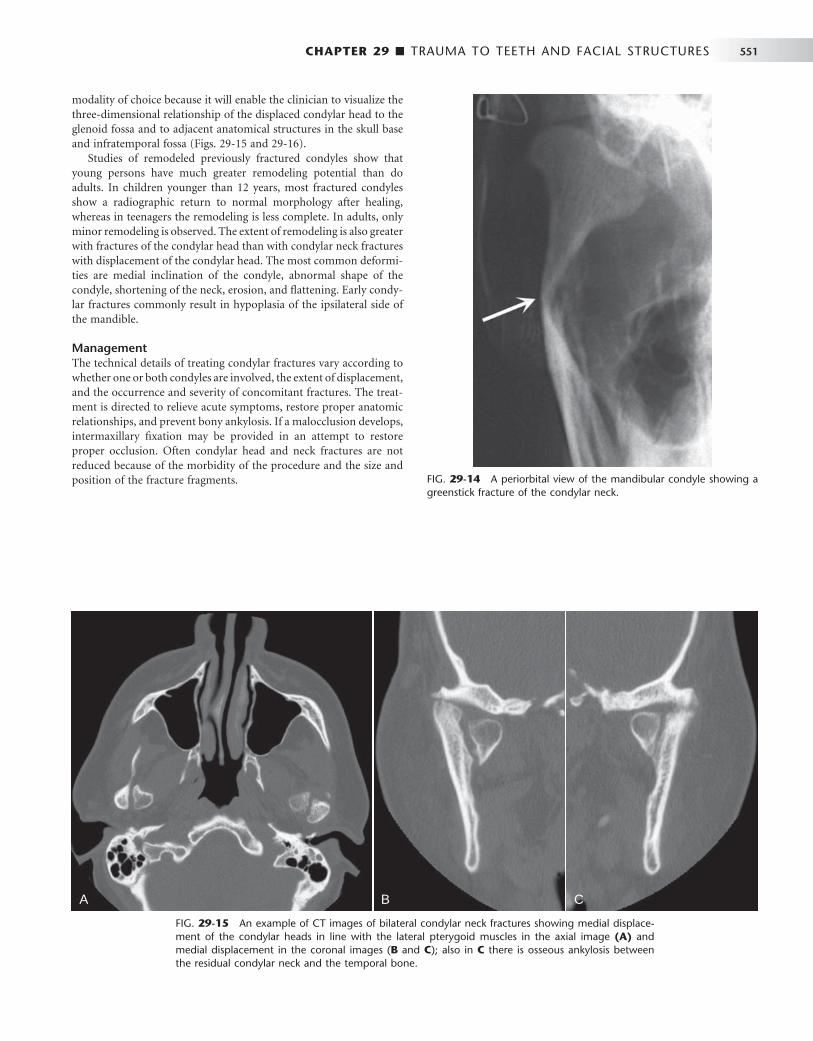
CHAPTER 29 ■ TRAUMA TO TEETH AND FACIAL STRUCTURES 551
modality of choice because it will enable the clinician to visualize the three-dimensional relationship of the displaced condylar head to the glenoid fossa and to adjacent anatomical structures in the skull base and infratemporal fossa ( Figs. 29-15 and 29-16 ).
Studies of remodeled previously fractured condyles show that young persons have much greater remodeling potential than do adults. In children younger than 12 years, most fractured condyles show a radiographic return to normal morphology after healing, whereas in teenagers the remodeling is less complete. In adults, only minor remodeling is observed. The extent of remodeling is also greater with fractures of the condylar head than with condylar neck fractures with displacement of the condylar head. The most common deformi-ties are medial inclination of the condyle, abnormal shape of the condyle, shortening of the neck, erosion, and fl attening. Early condy-lar fractures commonly result in hypoplasia of the ipsilateral side of the mandible.
Management The technical details of treating condylar fractures vary according to whether one or both condyles are involved, the extent of displacement, and the occurrence and severity of concomitant fractures. The treat-ment is directed to relieve acute symptoms, restore proper anatomic relationships, and prevent bony ankylosis. If a malocclusion develops, intermaxillary fi xation may be provided in an attempt to restore proper occlusion. Often condylar head and neck fractures are not reduced because of the morbidity of the procedure and the size and position of the fracture fragments. FIG. 29-14 A periorbital view of the mandibular condyle showing a
greenstick fracture of the condylar neck.
FIG. 29-15 An example of CT images of bilateral condylar neck fractures showing medial displace-ment of the condylar heads in line with the lateral pterygoid muscles in the axial image (A) and medial displacement in the coronal images ( B and C ); also in C there is osseous ankylosis between the residual condylar neck and the temporal bone.
A B CA B C

552 PART V ■ RADIOGRAPHIC INTERPRETATION
Fractures of the Alveolar Processes
Defi nition Simple fractures of the alveolar process may involve the buccal or lingual cortical plates of the alveolar processes of the maxillae or mandible. Commonly these fractures are associated with traumatic injuries to teeth that are luxated with or without dislocation. Several teeth are usually affected, and the fracture plane is most often hori-zontally oriented. Some fractures extend through the entire alveolar process (in contrast to the simple fracture that involves only one corti-cal plate), and the fracture plane may be located apical to the teeth or involve the tooth socket. These are also commonly associated with dental injuries and extrusive luxations with or without root fractures.
Clinical Features A common location of alveolar fractures is the anterior maxilla. Simple alveolar fractures are relatively rare in the posterior segments of the arches. In this location, fracture of the buccal plate usually occurs during removal of a maxillary posterior tooth. Fractures of the entire alveolar process occur in the anterior and premolar regions and in an older age group.
A characteristic feature of an alveolar process fracture is marked malocclusion with displacement and mobility of the fragment, and when the practitioner tests the mobility of a single tooth, the entire fragment of bone moves. The teeth in the fragment will have a recog-nizable dull sound when percussed and the attached gingiva may have lacerations. The detached bone may include the fl oor of the maxillary sinus, in which case bleeding from the nose on the involved side may occur as well as ecchymosis of the buccal vestibule.
Radiographic Features Periapical radiographs, if they can be made, will often not reveal frac-tures of a single cortical wall of the alveolar process, although evidence exists that the teeth have been luxated. However, a fracture of the anterior labial cortical plate may be apparent on an occlusal radio-graph or on a lateral extraoral image of the mandible if bone displace-ment has occurred and the x-ray beam is oriented at near right angles to the direction of bone displacement. Fractures of both cortical plates of the alveolar process are usually apparent ( Fig. 29-17 ).
The closer the fracture is to the alveolar crest, the greater the pos-sibility that root fractures are present. It may be diffi cult to differenti-ate a root fracture from an overlapping fracture line of the alveolar bone. Several images produced with different projection angles may help with this differentiation. If the fracture plane is truly associated with the tooth, the line should not shift relative to the tooth. Fractures of the posterior alveolar process may involve the fl oor of the maxillary sinus and result in abnormal thickening of the sinus mucosa or the accumulation of blood and sinus secretions, in which case an air-fl uid level may be appreciated.
Management Fractures of the alveolar process are treated by repositioning the displaced teeth and associated bone fragments with digital pressure. Gingival lacerations are sutured. If the luxated permanent teeth are splinted and stable, intermaxillary fi xation may not be necessary. Teeth that have lost their vascular supply may eventually require endodontic treatment.
A soft diet for 10 to 14 days is recommended. Antibiotic coverage is provided because of communication with tooth sockets.
MIDFACIAL FRACTURES INCLUDING MAXILLARY FRACTURES
Defi nition Fractures of the midfacial region one or multiple bones in the skull are discussed in this section.
Orbital Blow-Out Fractures
Defi nition The blow-out fracture is generated as a result of a direct blow to the orbit by an object that is too large to enter the orbital cavity, such as a fi st or a baseball. In this fracture, one or more of the walls of the orbit are damaged, but the orbital rim remains intact. The most common fractures involve the medial wall of the orbit formed by the lamina papyracea of the ethmoid bone and the fl oor of the orbit that separates this space from the maxillary sinus.
Clinical Features Periorbital edema is a common feature of the orbital blow-out frac-ture, as is enophthalmos. Eye movements may be restricted if one or
FIG. 29-17 These two images demonstrate an alveolar process frac-ture extending from the distal aspect of the mandibular right cuspid in an anterior direction (arrows) and through the tooth socket of the right central incisor.
A BA B
FIG. 29-16 Coronal CT image shows medial displacement and rotation of a condylar neck fracture.
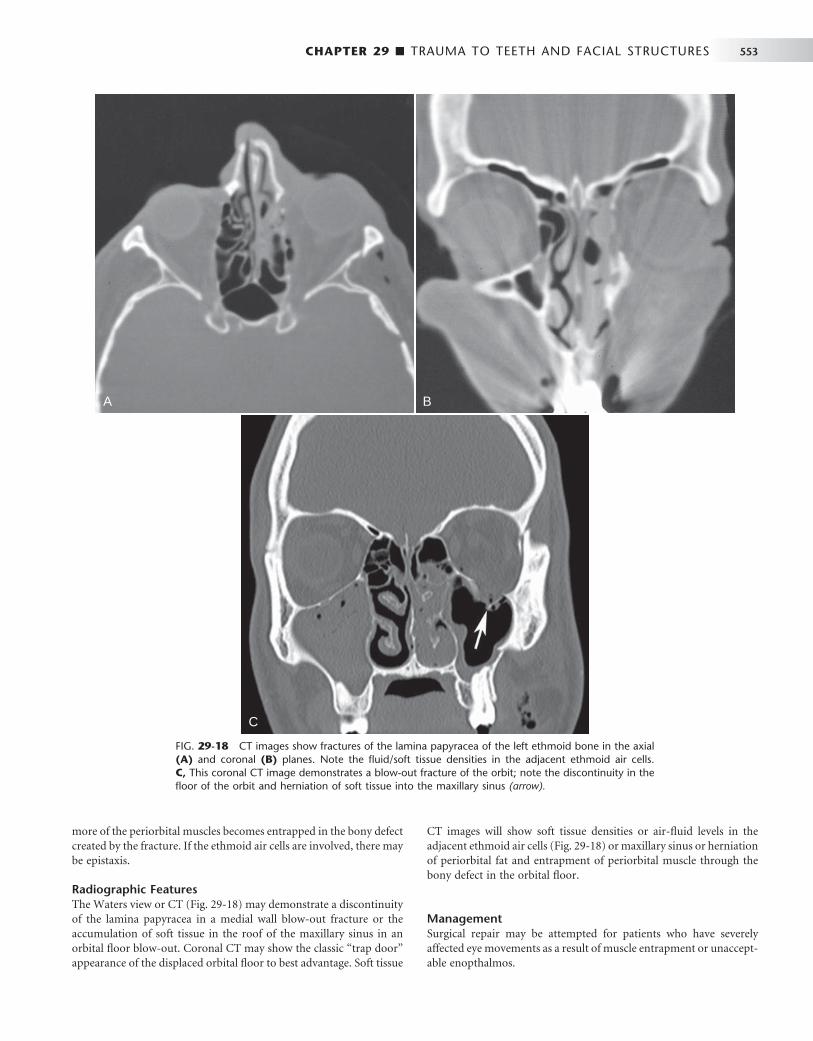
CHAPTER 29 ■ TRAUMA TO TEETH AND FACIAL STRUCTURES 553
more of the periorbital muscles becomes entrapped in the bony defect created by the fracture. If the ethmoid air cells are involved, there may be epistaxis.
Radiographic Features The Waters view or CT ( Fig. 29-18 ) may demonstrate a discontinuity of the lamina papyracea in a medial wall blow-out fracture or the accumulation of soft tissue in the roof of the maxillary sinus in an orbital fl oor blow-out. Coronal CT may show the classic “ trap door ” appearance of the displaced orbital fl oor to best advantage. Soft tissue
CT images will show soft tissue densities or air-fl uid levels in the adjacent ethmoid air cells ( Fig. 29-18 ) or maxillary sinus or herniation of periorbital fat and entrapment of periorbital muscle through the bony defect in the orbital fl oor.
Management Surgical repair may be attempted for patients who have severely affected eye movements as a result of muscle entrapment or unaccept-able enopthalmos.
FIG. 29-18 CT images show fractures of the lamina papyracea of the left ethmoid bone in the axial (A) and coronal (B) planes. Note the fl uid/soft tissue densities in the adjacent ethmoid air cells. C, This coronal CT image demonstrates a blow-out fracture of the orbit; note the discontinuity in the fl oor of the orbit and herniation of soft tissue into the maxillary sinus (arrow).
A B
C
A B
C
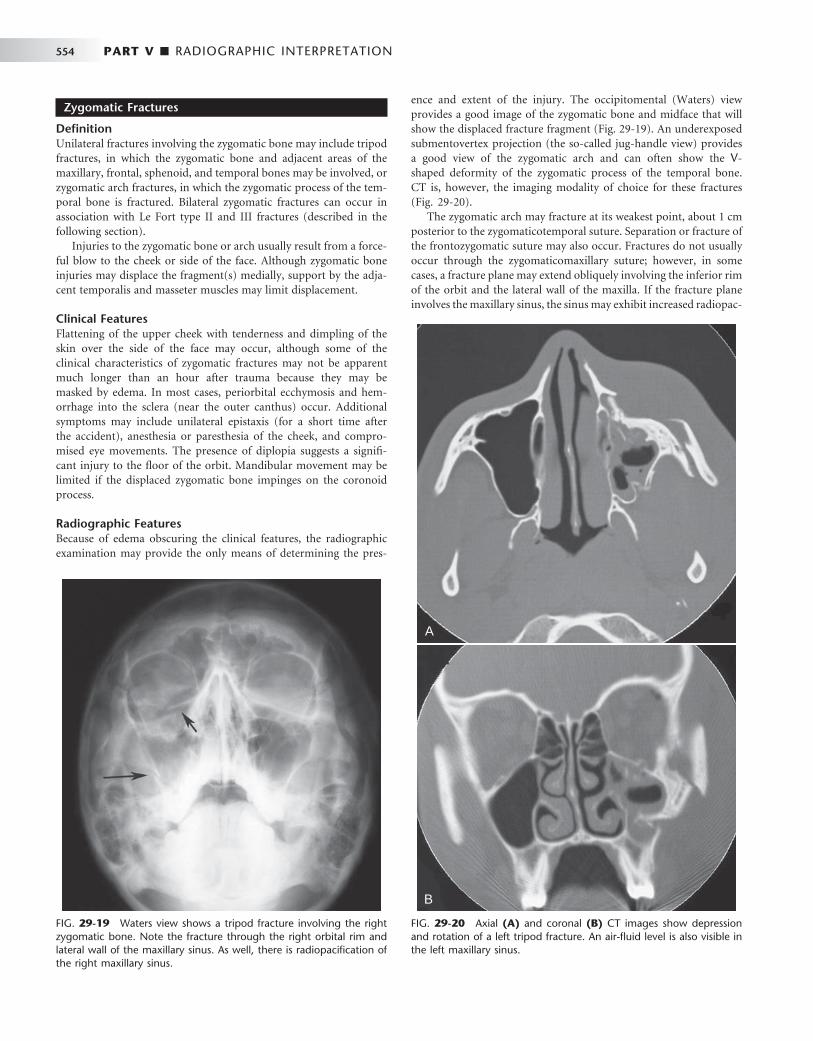
554 PART V ■ RADIOGRAPHIC INTERPRETATION
FIG. 29-19 Waters view shows a tripod fracture involving the right zygomatic bone. Note the fracture through the right orbital rim and lateral wall of the maxillary sinus. As well, there is radiopacifi cation of the right maxillary sinus.
FIG. 29-20 Axial (A) and coronal (B) CT images show depression and rotation of a left tripod fracture. An air-fl uid level is also visible in the left maxillary sinus.
A
B
A
B
Zygomatic Fractures
Defi nition Unilateral fractures involving the zygomatic bone may include tripod fractures, in which the zygomatic bone and adjacent areas of the maxillary, frontal, sphenoid, and temporal bones may be involved, or zygomatic arch fractures, in which the zygomatic process of the tem-poral bone is fractured. Bilateral zygomatic fractures can occur in association with Le Fort type II and III fractures (described in the following section).
Injuries to the zygomatic bone or arch usually result from a force-ful blow to the cheek or side of the face. Although zygomatic bone injuries may displace the fragment(s) medially, support by the adja-cent temporalis and masseter muscles may limit displacement.
Clinical Features Flattening of the upper cheek with tenderness and dimpling of the skin over the side of the face may occur, although some of the clinical characteristics of zygomatic fractures may not be apparent much longer than an hour after trauma because they may be masked by edema. In most cases, periorbital ecchymosis and hem-orrhage into the sclera (near the outer canthus) occur. Additional symptoms may include unilateral epistaxis (for a short time after the accident), anesthesia or paresthesia of the cheek, and compro-mised eye movements. The presence of diplopia suggests a signifi -cant injury to the fl oor of the orbit. Mandibular movement may be limited if the displaced zygomatic bone impinges on the coronoid process.
Radiographic Features Because of edema obscuring the clinical features, the radiographic examination may provide the only means of determining the pres-
ence and extent of the injury. The occipitomental (Waters) view provides a good image of the zygomatic bone and midface that will show the displaced fracture fragment ( Fig. 29-19 ). An underexposed submentovertex projection (the so-called jug-handle view) provides a good view of the zygomatic arch and can often show the V -shaped deformity of the zygomatic process of the temporal bone. CT is, however, the imaging modality of choice for these fractures ( Fig. 29-20 ).
The zygomatic arch may fracture at its weakest point, about 1 cm posterior to the zygomaticotemporal suture. Separation or fracture of the frontozygomatic suture may also occur. Fractures do not usually occur through the zygomaticomaxillary suture; however, in some cases, a fracture plane may extend obliquely involving the inferior rim of the orbit and the lateral wall of the maxilla. If the fracture plane involves the maxillary sinus, the sinus may exhibit increased radiopac-
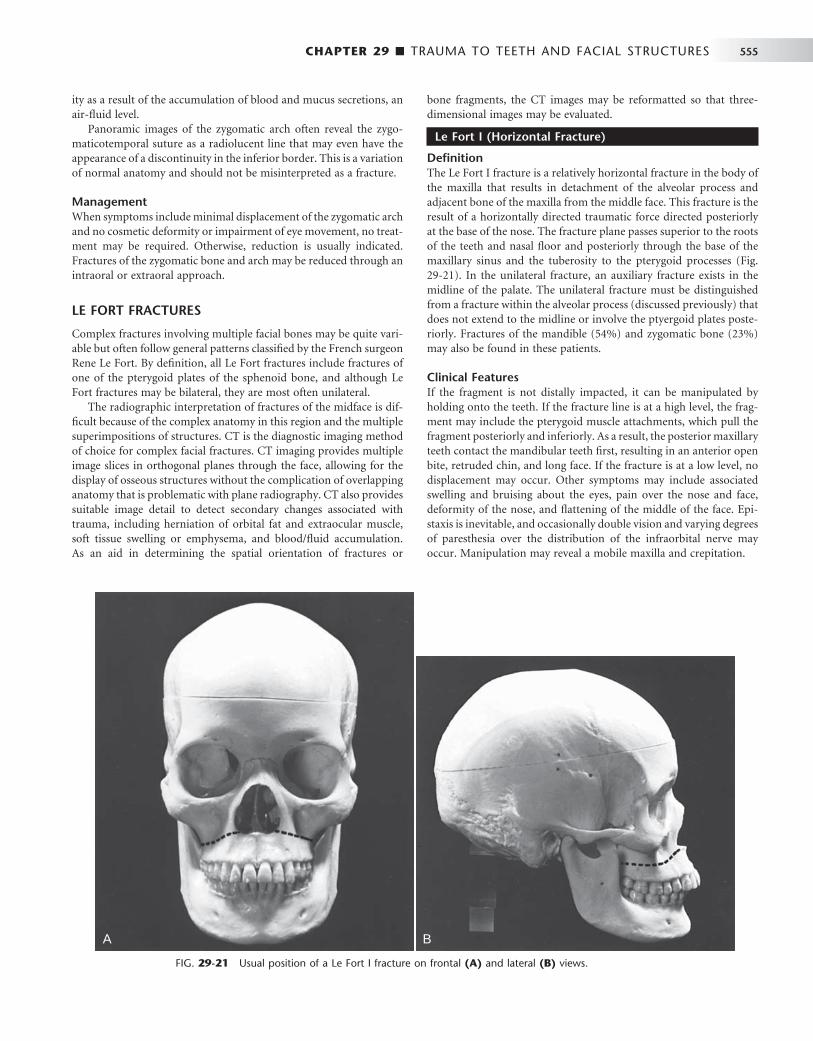
CHAPTER 29 ■ TRAUMA TO TEETH AND FACIAL STRUCTURES 555
ity as a result of the accumulation of blood and mucus secretions, an air-fl uid level.
Panoramic images of the zygomatic arch often reveal the zygo-maticotemporal suture as a radiolucent line that may even have the appearance of a discontinuity in the inferior border. This is a variation of normal anatomy and should not be misinterpreted as a fracture.
Management When symptoms include minimal displacement of the zygomatic arch and no cosmetic deformity or impairment of eye movement, no treat-ment may be required. Otherwise, reduction is usually indicated. Fractures of the zygomatic bone and arch may be reduced through an intraoral or extraoral approach.
LE FORT FRACTURES
Complex fractures involving multiple facial bones may be quite vari-able but often follow general patterns classifi ed by the French surgeon Rene Le Fort. By defi nition, all Le Fort fractures include fractures of one of the pterygoid plates of the sphenoid bone, and although Le Fort fractures may be bilateral, they are most often unilateral.
The radiographic interpretation of fractures of the midface is dif-fi cult because of the complex anatomy in this region and the multiple superimpositions of structures. CT is the diagnostic imaging method of choice for complex facial fractures. CT imaging provides multiple image slices in orthogonal planes through the face, allowing for the display of osseous structures without the complication of overlapping anatomy that is problematic with plane radiography. CT also provides suitable image detail to detect secondary changes associated with trauma, including herniation of orbital fat and extraocular muscle, soft tissue swelling or emphysema, and blood/fl uid accumulation. As an aid in determining the spatial orientation of fractures or
bone fragments, the CT images may be reformatted so that three-dimensional images may be evaluated.
Le Fort I (Horizontal Fracture)
Defi nition The Le Fort I fracture is a relatively horizontal fracture in the body of the maxilla that results in detachment of the alveolar process and adjacent bone of the maxilla from the middle face. This fracture is the result of a horizontally directed traumatic force directed posteriorly at the base of the nose. The fracture plane passes superior to the roots of the teeth and nasal fl oor and posteriorly through the base of the maxillary sinus and the tuberosity to the pterygoid processes ( Fig. 29-21 ). In the unilateral fracture, an auxiliary fracture exists in the midline of the palate. The unilateral fracture must be distinguished from a fracture within the alveolar process (discussed previously) that does not extend to the midline or involve the ptyergoid plates poste-riorly. Fractures of the mandible (54%) and zygomatic bone (23%) may also be found in these patients.
Clinical Features If the fragment is not distally impacted, it can be manipulated by holding onto the teeth. If the fracture line is at a high level, the frag-ment may include the pterygoid muscle attachments, which pull the fragment posteriorly and inferiorly. As a result, the posterior maxillary teeth contact the mandibular teeth fi rst, resulting in an anterior open bite, retruded chin, and long face. If the fracture is at a low level, no displacement may occur. Other symptoms may include associated swelling and bruising about the eyes, pain over the nose and face, deformity of the nose, and fl attening of the middle of the face. Epi-staxis is inevitable, and occasionally double vision and varying degrees of paresthesia over the distribution of the infraorbital nerve may occur. Manipulation may reveal a mobile maxilla and crepitation.
FIG. 29-21 Usual position of a Le Fort I fracture on frontal (A) and lateral (B) views.
A BA B
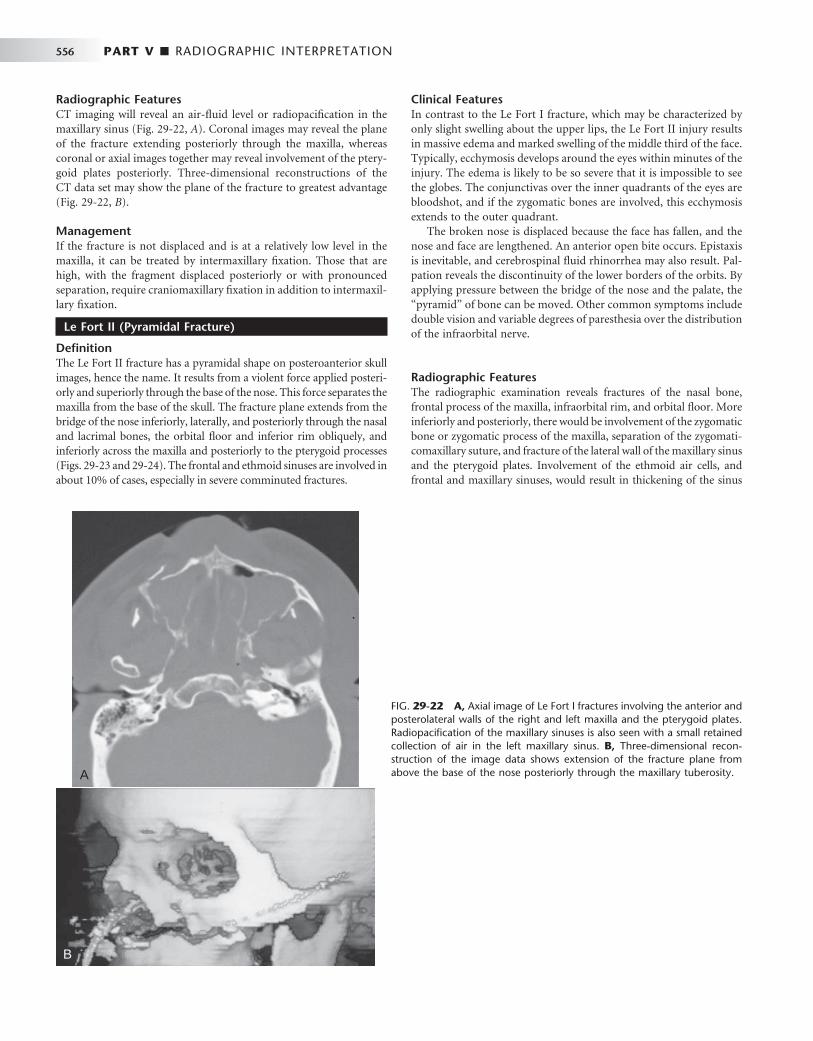
556 PART V ■ RADIOGRAPHIC INTERPRETATION
FIG. 29-22 A, Axial image of Le Fort I fractures involving the anterior and posterolateral walls of the right and left maxilla and the pterygoid plates. Radiopacifi cation of the maxillary sinuses is also seen with a small retained collection of air in the left maxillary sinus. B, Three-dimensional recon-struction of the image data shows extension of the fracture plane from above the base of the nose posteriorly through the maxillary tuberosity. A
B
Radiographic Features CT imaging will reveal an air-fl uid level or radiopacifi cation in the maxillary sinus ( Fig. 29-22, A ). Coronal images may reveal the plane of the fracture extending posteriorly through the maxilla, whereas coronal or axial images together may reveal involvement of the ptery-goid plates posteriorly. Three-dimensional reconstructions of the CT data set may show the plane of the fracture to greatest advantage ( Fig. 29-22, B ).
Management If the fracture is not displaced and is at a relatively low level in the maxilla, it can be treated by intermaxillary fi xation. Those that are high, with the fragment displaced posteriorly or with pronounced separation, require craniomaxillary fi xation in addition to intermaxil-lary fi xation.
Le Fort II (Pyramidal Fracture)
Defi nition The Le Fort II fracture has a pyramidal shape on posteroanterior skull images, hence the name. It results from a violent force applied posteri-orly and superiorly through the base of the nose. This force separates the maxilla from the base of the skull. The fracture plane extends from the bridge of the nose inferiorly, laterally, and posteriorly through the nasal and lacrimal bones, the orbital fl oor and inferior rim obliquely, and inferiorly across the maxilla and posteriorly to the pterygoid processes ( Figs. 29-23 and 29-24 ). The frontal and ethmoid sinuses are involved in about 10% of cases, especially in severe comminuted fractures.
Clinical Features In contrast to the Le Fort I fracture, which may be characterized by only slight swelling about the upper lips, the Le Fort II injury results in massive edema and marked swelling of the middle third of the face. Typically, ecchymosis develops around the eyes within minutes of the injury. The edema is likely to be so severe that it is impossible to see the globes. The conjunctivas over the inner quadrants of the eyes are bloodshot, and if the zygomatic bones are involved, this ecchymosis extends to the outer quadrant.
The broken nose is displaced because the face has fallen, and the nose and face are lengthened. An anterior open bite occurs. Epistaxis is inevitable, and cerebrospinal fl uid rhinorrhea may also result. Pal-pation reveals the discontinuity of the lower borders of the orbits. By applying pressure between the bridge of the nose and the palate, the “ pyramid ” of bone can be moved. Other common symptoms include double vision and variable degrees of paresthesia over the distribution of the infraorbital nerve.
Radiographic Features The radiographic examination reveals fractures of the nasal bone, frontal process of the maxilla, infraorbital rim, and orbital fl oor. More inferiorly and posteriorly, there would be involvement of the zygomatic bone or zygomatic process of the maxilla, separation of the zygomati-comaxillary suture, and fracture of the lateral wall of the maxillary sinus and the pterygoid plates. Involvement of the ethmoid air cells, and frontal and maxillary sinuses, would result in thickening of the sinus

CHAPTER 29 ■ TRAUMA TO TEETH AND FACIAL STRUCTURES 557
mucosa or the accumulation of blood-fl uid levels in the air spaces. CT is the imaging modality of choice for such complex fractures.
Management The treatment of this fracture is accomplished by reduction of the displaced maxilla by intermaxillary fi xation, open reduction, and
interosseous wiring of the infraorbital rims and plating of the accom-panying fractures of the nose, nasal septum, and orbital fl oor. Repair of the detached medial canthal ligaments may also be required. Leakage of cerebrospinal fl uid requires the attention of a neurosur-geon if the posterior or superior walls of the frontal sinuses are involved.
FIG. 29-23 Usual position of the Le Fort II fracture on frontal (A) and lateral (B) views.
A BA B
FIG. 29-24 Coronal tomographic view of a Le Fort II fracture. Note the fractures through the orbital rims bilat-erally. As well, there are fractures through the ethmoid bones and the lateral walls of the maxillae (arrows). (Cour-tesy Dr. C. Schow, Galveston, Tex.)
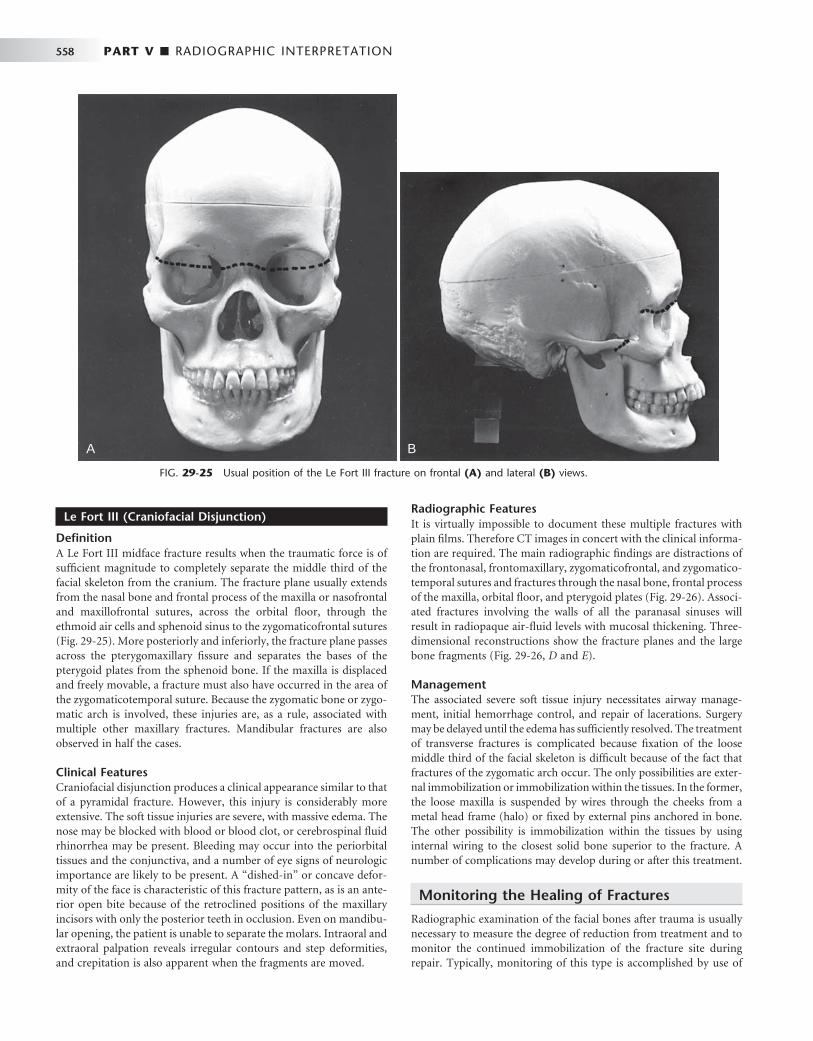
558 PART V ■ RADIOGRAPHIC INTERPRETATION
Le Fort III (Craniofacial Disjunction)
Defi nition A Le Fort III midface fracture results when the traumatic force is of suffi cient magnitude to completely separate the middle third of the facial skeleton from the cranium. The fracture plane usually extends from the nasal bone and frontal process of the maxilla or nasofrontal and maxillofrontal sutures, across the orbital fl oor, through the ethmoid air cells and sphenoid sinus to the zygomaticofrontal sutures ( Fig. 29-25 ). More posteriorly and inferiorly, the fracture plane passes across the pterygomaxillary fi ssure and separates the bases of the pterygoid plates from the sphenoid bone. If the maxilla is displaced and freely movable, a fracture must also have occurred in the area of the zygomaticotemporal suture. Because the zygomatic bone or zygo-matic arch is involved, these injuries are, as a rule, associated with multiple other maxillary fractures. Mandibular fractures are also observed in half the cases.
Clinical Features Craniofacial disjunction produces a clinical appearance similar to that of a pyramidal fracture. However, this injury is considerably more extensive. The soft tissue injuries are severe, with massive edema. The nose may be blocked with blood or blood clot, or cerebrospinal fl uid rhinorrhea may be present. Bleeding may occur into the periorbital tissues and the conjunctiva, and a number of eye signs of neurologic importance are likely to be present. A “ dished-in ” or concave defor-mity of the face is characteristic of this fracture pattern, as is an ante-rior open bite because of the retroclined positions of the maxillary incisors with only the posterior teeth in occlusion. Even on mandibu-lar opening, the patient is unable to separate the molars. Intraoral and extraoral palpation reveals irregular contours and step deformities, and crepitation is also apparent when the fragments are moved.
Radiographic Features It is virtually impossible to document these multiple fractures with plain fi lms. Therefore CT images in concert with the clinical informa-tion are required. The main radiographic fi ndings are distractions of the frontonasal, frontomaxillary, zygomaticofrontal, and zygomatico-temporal sutures and fractures through the nasal bone, frontal process of the maxilla, orbital fl oor, and pterygoid plates ( Fig. 29-26 ). Associ-ated fractures involving the walls of all the paranasal sinuses will result in radiopaque air-fl uid levels with mucosal thickening. Three-dimensional reconstructions show the fracture planes and the large bone fragments ( Fig. 29-26, D and E ).
Management The associated severe soft tissue injury necessitates airway manage-ment, initial hemorrhage control, and repair of lacerations. Surgery may be delayed until the edema has suffi ciently resolved. The treatment of transverse fractures is complicated because fi xation of the loose middle third of the facial skeleton is diffi cult because of the fact that fractures of the zygomatic arch occur. The only possibilities are exter-nal immobilization or immobilization within the tissues. In the former, the loose maxilla is suspended by wires through the cheeks from a metal head frame (halo) or fi xed by external pins anchored in bone. The other possibility is immobilization within the tissues by using internal wiring to the closest solid bone superior to the fracture. A number of complications may develop during or after this treatment.
Monitoring the Healing of Fractures
Radiographic examination of the facial bones after trauma is usually necessary to measure the degree of reduction from treatment and to monitor the continued immobilization of the fracture site during repair. Typically, monitoring of this type is accomplished by use of
FIG. 29-25 Usual position of the Le Fort III fracture on frontal (A) and lateral (B) views.
A BA B
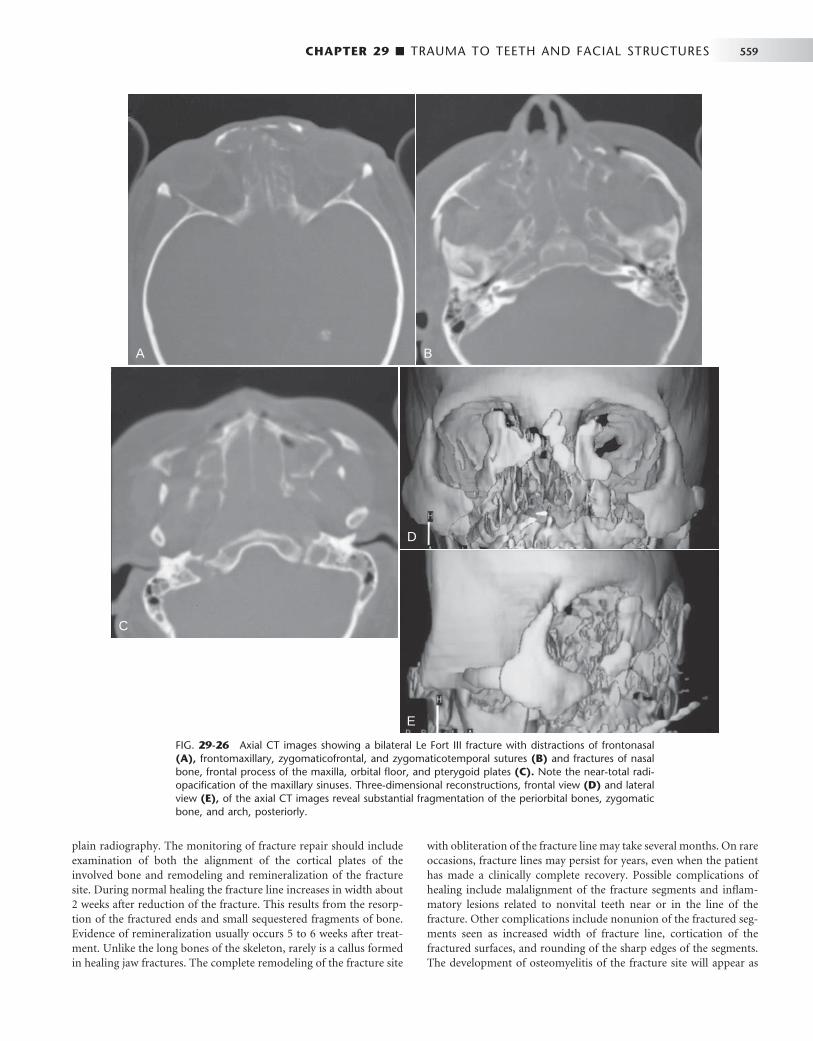
CHAPTER 29 ■ TRAUMA TO TEETH AND FACIAL STRUCTURES 559
plain radiography. The monitoring of fracture repair should include examination of both the alignment of the cortical plates of the involved bone and remodeling and remineralization of the fracture site. During normal healing the fracture line increases in width about 2 weeks after reduction of the fracture. This results from the resorp-tion of the fractured ends and small sequestered fragments of bone. Evidence of remineralization usually occurs 5 to 6 weeks after treat-ment. Unlike the long bones of the skeleton, rarely is a callus formed in healing jaw fractures. The complete remodeling of the fracture site
with obliteration of the fracture line may take several months. On rare occasions, fracture lines may persist for years, even when the patient has made a clinically complete recovery. Possible complications of healing include malalignment of the fracture segments and infl am-matory lesions related to nonvital teeth near or in the line of the fracture. Other complications include nonunion of the fractured seg-ments seen as increased width of fracture line, cortication of the fractured surfaces, and rounding of the sharp edges of the segments. The development of osteomyelitis of the fracture site will appear as
FIG. 29-26 Axial CT images showing a bilateral Le Fort III fracture with distractions of frontonasal (A), frontomaxillary, zygomaticofrontal, and zygomaticotemporal sutures (B) and fractures of nasal bone, frontal process of the maxilla, orbital fl oor, and pterygoid plates (C). Note the near-total radi-opacifi cation of the maxillary sinuses. Three-dimensional reconstructions, frontal view (D) and lateral view (E), of the axial CT images reveal substantial fragmentation of the periorbital bones, zygomatic bone, and arch, posteriorly.
A B
C
D
E
A B
C
D
E
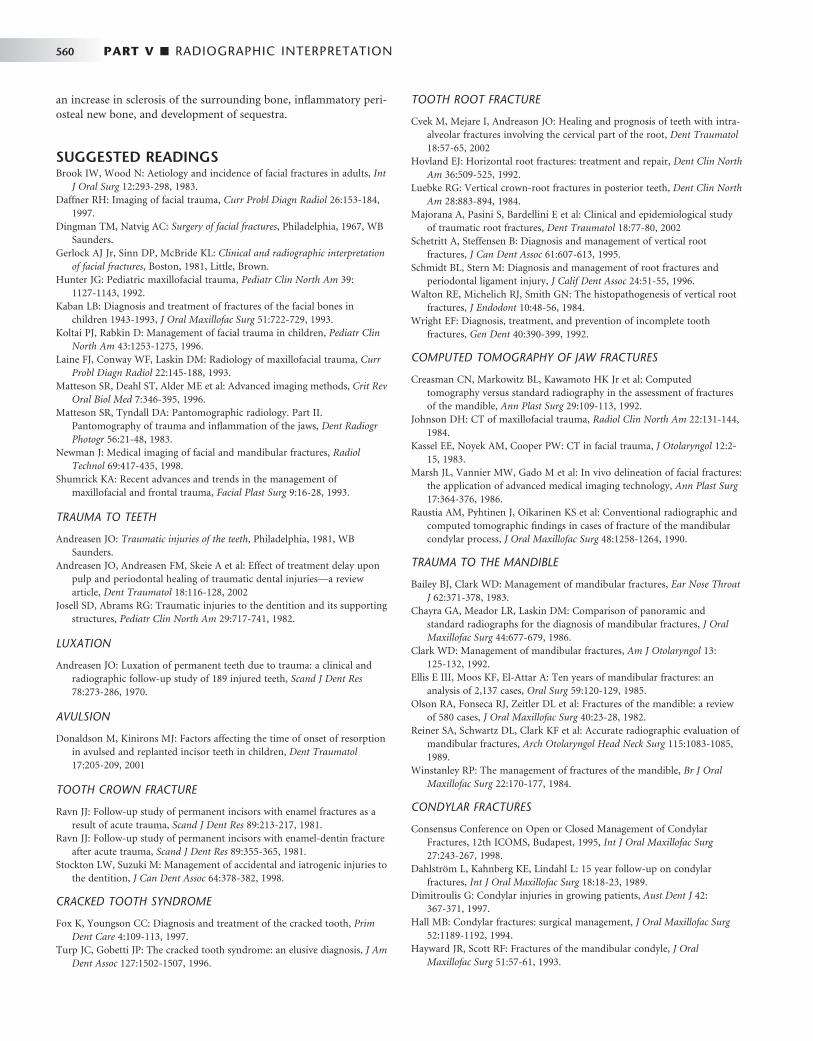
560 PART V ■ RADIOGRAPHIC INTERPRETATION
an increase in sclerosis of the surrounding bone, infl ammatory peri-osteal new bone, and development of sequestra.
SUGGESTED READINGS Brook IW , Wood N : Aetiology and incidence of facial fractures in adults , Int
J Oral Surg 12 : 293 - 298 , 1983 . Daffner RH : Imaging of facial trauma , Curr Probl Diagn Radiol 26 : 153 - 184 ,
1997 . Dingman TM , Natvig AC : Surgery of facial fractures , Philadelphia , 1967 , WB
Saunders . Gerlock AJ Jr , Sinn DP , McBride KL : Clinical and radiographic interpretation
of facial fractures , Boston , 1981 , Little, Brown . Hunter JG : Pediatric maxillofacial trauma , Pediatr Clin North Am 39 :
1127 - 1143 , 1992 . Kaban LB : Diagnosis and treatment of fractures of the facial bones in
children 1943-1993 , J Oral Maxillofac Surg 51 : 722 - 729 , 1993 . Koltai PJ , Rabkin D : Management of facial trauma in children , Pediatr Clin
North Am 43 : 1253 - 1275 , 1996 . Laine FJ , Conway WF , Laskin DM : Radiology of maxillofacial trauma , Curr
Probl Diagn Radiol 22 : 145 - 188 , 1993 . Matteson SR , Deahl ST , Alder ME et al : Advanced imaging methods , Crit Rev
Oral Biol Med 7 : 346 - 395 , 1996 . Matteson SR , Tyndall DA : Pantomographic radiology. Part II.
Pantomography of trauma and infl ammation of the jaws , Dent Radiogr Photogr 56 : 21 - 48 , 1983 .
Newman J : Medical imaging of facial and mandibular fractures , Radiol Technol 69 : 417 - 435 , 1998 .
Shumrick KA : Recent advances and trends in the management of maxillofacial and frontal trauma , Facial Plast Surg 9 : 16 - 28 , 1993 .
TRAUMA TO TEETH
Andreasen JO : Traumatic injuries of the teeth , Philadelphia , 1981 , WB Saunders .
Andreasen JO , Andreasen FM , Skeie A et al : Effect of treatment delay upon pulp and periodontal healing of traumatic dental injuries — a review article , Dent Traumatol 18 : 116 - 128 , 2002
Josell SD , Abrams RG : Traumatic injuries to the dentition and its supporting structures , Pediatr Clin North Am 29 : 717 - 741 , 1982 .
LUXATION
Andreasen JO : Luxation of permanent teeth due to trauma: a clinical and radiographic follow-up study of 189 injured teeth , Scand J Dent Res 78 : 273 - 286 , 1970 .
AVULSION
Donaldson M , Kinirons MJ : Factors affecting the time of onset of resorption in avulsed and replanted incisor teeth in children , Dent Traumatol 17 : 205 - 209 , 2001
TOOTH CROWN FRACTURE
Ravn JJ : Follow-up study of permanent incisors with enamel fractures as a result of acute trauma , Scand J Dent Res 89 : 213 - 217 , 1981 .
Ravn JJ : Follow-up study of permanent incisors with enamel-dentin fracture after acute trauma , Scand J Dent Res 89 : 355 - 365 , 1981 .
Stockton LW , Suzuki M : Management of accidental and iatrogenic injuries to the dentition , J Can Dent Assoc 64 : 378 - 382 , 1998 .
CRACKED TOOTH SYNDROME
Fox K , Youngson CC : Diagnosis and treatment of the cracked tooth , Prim Dent Care 4 : 109 - 113 , 1997 .
Turp JC , Gobetti JP : The cracked tooth syndrome: an elusive diagnosis , J Am Dent Assoc 127 : 1502 - 1507 , 1996 .
TOOTH ROOT FRACTURE
Cvek M , Mejare I , Andreason JO : Healing and prognosis of teeth with intra-alveolar fractures involving the cervical part of the root , Dent Traumatol 18 : 57 - 65 , 2002
Hovland EJ : Horizontal root fractures: treatment and repair , Dent Clin North Am 36 : 509 - 525 , 1992 .
Luebke RG : Vertical crown-root fractures in posterior teeth , Dent Clin North Am 28 : 883 - 894 , 1984 .
Majorana A , Pasini S , Bardellini E et al : Clinical and epidemiological study of traumatic root fractures , Dent Traumatol 18 : 77 - 80 , 2002
Schetritt A , Steffensen B : Diagnosis and management of vertical root fractures , J Can Dent Assoc 61 : 607 - 613 , 1995 .
Schmidt BL , Stern M : Diagnosis and management of root fractures and periodontal ligament injury , J Calif Dent Assoc 24 : 51 - 55 , 1996 .
Walton RE , Michelich RJ , Smith GN : The histopathogenesis of vertical root fractures , J Endodont 10 : 48 - 56 , 1984 .
Wright EF : Diagnosis, treatment, and prevention of incomplete tooth fractures , Gen Dent 40 : 390 - 399 , 1992 .
COMPUTED TOMOGRAPHY OF JAW FRACTURES
Creasman CN , Markowitz BL , Kawamoto HK Jr et al : Computed tomography versus standard radiography in the assessment of fractures of the mandible , Ann Plast Surg 29 : 109 - 113 , 1992 .
Johnson DH : CT of maxillofacial trauma , Radiol Clin North Am 22 : 131 - 144 , 1984 .
Kassel EE , Noyek AM , Cooper PW : CT in facial trauma , J Otolaryngol 12 : 2 - 15 , 1983 .
Marsh JL , Vannier MW , Gado M et al : In vivo delineation of facial fractures: the application of advanced medical imaging technology , Ann Plast Surg 17 : 364 - 376 , 1986 .
Raustia AM , Pyhtinen J , Oikarinen KS et al : Conventional radiographic and computed tomographic fi ndings in cases of fracture of the mandibular condylar process , J Oral Maxillofac Surg 48 : 1258 - 1264 , 1990 .
TRAUMA TO THE MANDIBLE
Bailey BJ , Clark WD : Management of mandibular fractures , Ear Nose Throat J 62 : 371 - 378 , 1983 .
Chayra GA , Meador LR , Laskin DM : Comparison of panoramic and standard radiographs for the diagnosis of mandibular fractures , J Oral Maxillofac Surg 44 : 677 - 679 , 1986 .
Clark WD : Management of mandibular fractures , Am J Otolaryngol 13 : 125 - 132 , 1992 .
Ellis E III, Moos KF , El-Attar A : Ten years of mandibular fractures: an analysis of 2,137 cases , Oral Surg 59 : 120 - 129 , 1985 .
Olson RA , Fonseca RJ , Zeitler DL et al : Fractures of the mandible: a review of 580 cases , J Oral Maxillofac Surg 40 : 23 - 28 , 1982 .
Reiner SA , Schwartz DL , Clark KF et al : Accurate radiographic evaluation of mandibular fractures , Arch Otolaryngol Head Neck Surg 115 : 1083 - 1085 , 1989 .
Winstanley RP : The management of fractures of the mandible , Br J Oral Maxillofac Surg 22 : 170 - 177 , 1984 .
CONDYLAR FRACTURES
Consensus Conference on Open or Closed Management of Condylar Fractures, 12th ICOMS, Budapest, 1995 , Int J Oral Maxillofac Surg 27 : 243 - 267 , 1998 .
Dahlstr ö m L , Kahnberg KE , Lindahl L : 15 year follow-up on condylar fractures , Int J Oral Maxillofac Surg 18 : 18 - 23 , 1989 .
Dimitroulis G : Condylar injuries in growing patients , Aust Dent J 42 : 367 - 371 , 1997 .
Hall MB : Condylar fractures: surgical management , J Oral Maxillofac Surg 52 : 1189 - 1192 , 1994 .
Hayward JR , Scott RF : Fractures of the mandibular condyle , J Oral Maxillofac Surg 51 : 57 - 61 , 1993 .

CHAPTER 29 ■ TRAUMA TO TEETH AND FACIAL STRUCTURES 561
Sahm G , Witt E : Long-term results after childhood condylar fractures: a computer-tomographic study , Eur J Orthod 11 : 154 - 160 , 1989 .
Silvennoinen U , Iizuka T , Lindqvist C et al : Different patterns of condylar fractures: an analysis of 382 patients in a 3-year period , J Oral Maxillofac Surg 50 : 1032 - 1037 , 1992 .
Walker RV : Condylar fractures: nonsurgical management , J Oral Maxillofac Surg 52 : 1185 - 1188 , 1994 .
FRACTURES OF THE ALVEOLAR PROCESS
Andreasen JO : Fractures of the alveolar process of the jaw: a clinical and radiographic follow-up study , Scand J Dent Res 78 : 263 - 272 , 1970 .
Giovannini UM , Goudot P : Radiologic evaluation of mandibular and dentoalveolar fractures , Plast Reconstr Surg 109 : 2165 - 2166 , 2002 .
TRAUMA TO THE MAXILLA
Banks P : Kiley ’ s fractures of the middle third of the facial skeleton , Bristol, UK , 1981 , Wright .
Close LG : Fractures of the maxilla , Ear Nose Throat J 62 : 365 - 370 , 1983 . Luce EA : Developing concepts and treatment of complex maxillary fractures ,
Clin Plast Surg 19 : 125 - 131 , 1992 .
Marciani RD : Management of midface fractures: fi fty years later , J Oral Maxillofac Surg 51 : 960 - 968 , 1993 .
Teichgraeber JF , Rappaport NJ , Harris JH Jr : The radiology of upper airway obstruction in maxillofacial trauma , Ann Plast Surg 27 : 103 - 109 , 1991 .
Tung TC , Chen YR , Santamaria E et al : Dislocation of anatomic structures into the maxillary sinus after craniofacial trauma , Plast Reconstr Surg 101 : 1904 - 1908 , 1998 .
ZYGOMATIC COMPLEX FRACTURES
Fujii N , Yamashiro M : Classifi cation of malar complex fractures using computed tomography , J Oral Maxillofac Surg 41 : 562 - 567 , 1983 .
McLoughlin P , Gilhooly M , Wood G : The management of zygomatic complex fractures — results of a survey , Br J Oral Maxillofac Surg 32 : 284 - 288 , 1994 .
Prendergast ML , Wildes TO : Evaluation of the orbital fl oor in zygoma fractures , Arch Otolaryngol Head Neck Surg 114 : 446 - 450 , 1988 .
Sands T , Symington O , Katsikeris N et al : Fractures of the zygomatic complex: a case report and review , J Can Dent Assoc 59 : 749 - 755 , 1993 .
Winstanley RP : The management of fractures of the zygoma , Int J Oral Surg 10 ( 1 Suppl ): 235 - 240 , 1981 .

C H A P T E R 3 0
Developmental Disturbances of the Face and Jaws
Carol Anne Murdoch-Kinch
Developmental disturbances affect the normal growth and dif-ferentiation of craniofacial structures. As a consequence, they are usually fi rst discovered in infancy or childhood. Many of
the conditions discussed in this chapter have an unknown etiology. Some are caused by known and recently discovered genetic mutations, whereas others result from environmental factors. These conditions result in a variety of abnormalities of the face and jaws including abnormalities of structure, shape, organization, and function of hard and soft tissues.
Common Developmental Abnormalities
There are a multitude of conditions that affect the morphogenesis of the face and jaws, many of which are rare syndromes. This chapter briefl y reviews the more common developmental abnormalities that may be encountered in dental practice.
CLEFT LIP AND PALATE
Defi nition A failure of fusion of the developmental processes of the face during fetal development may result in a variety of facial clefts. Cleft lip/palate (CL/P) and cleft palate (CP) are the most common develop-mental craniofacial anomalies. Their incidence varies with geographic location, ethnicity, and socioeconomic status. In Caucasian popula-tions the incidence of cleft lip is 1 : 800 to 1 : 1000 live births, and the incidence of cleft palate is approximately 1 : 1000. Cleft lip with or without cleft palate and cleft palate are two different conditions with different etiologies. CL/P results from a failure of fusion of the medial nasal process with the maxillary process. This condition can range in severity from a unilateral cleft lip to bilateral complete clefting through the lip, alveolus, and hard and soft palate in the most severe cases. CP develops from a failure of fusion of the lateral palatal shelves. The minimal manifestation of cleft palate is a submucous cleft. Here, the palate appears to be intact except for notching of the uvula (bifi d uvula) or notching in the posterior border of the hard palate detect-able by palpation. The most severe presentation is complete clefting of the hard and soft palate. The precise etiology of orofacial clefting is not completely understood. However, most cases of CL/P and CP are considered to be multifactorial with a strong genetic component. CL/P and CP can each be associated with other abnormalities, as part of a genetic malformation syndrome such as 22q.11 deletion syn-
drome (velocardiofacial syndrome — cleft palate and facial and cardiac abnormalities) or van der Woude syndrome (cleft lip and/or cleft palate and lip pits). Other factors that are implicated in the develop-ment of orofacial clefts include nutritional disturbances (prena-tal folate defi ciency); environmental teratogenic agents (maternal smoking, in utero exposure to anticonvulsants); stress, which results in increased secretion of hydrocortisone; defects of vascular supply to the involved region; and mechanical interference with the fusion of the embryonic processes (cleft palate in Pierre Robin sequence). Clefts involving the lower lip and mandible are extremely rare.
Clinical Features The frequency of CL/P and CP varies with sex and race but in general CL/P is most common in males and CP is more common in females. Both conditions are more common in Asians and Hispanics than blacks or Caucasians. The severity of CL/P varies from a notch in the upper lip to a cleft involving only the lip to extension into the nostril, resulting in deformity of the ala of the nose. As CL/P increases in severity, the cleft will include the alveolar process and palate. Bilateral cleft lip is more frequently associated with CP. CP also varies in sever-ity, ranging from involvement of only the uvula or soft palate to extension all the way through the palate to include the alveolar process in the region of the lateral incisor on one or both sides. With involve-ment of the alveolar process there is an increase in frequency of dental anomalies in the region of the cleft, including missing, hypoplastic, and supernumerary teeth and enamel hypoplasia. Dental anomalies are also more prevalent in the mandible in these patients. In both CL/P and CP the palatal defects interfere with speech and swallowing. Affected individuals with palatal clefts are also at increased risk for recurrent middle ear infections because of the abnormal anatomy and function of the eustachian tube.
Radiographic Features The typical appearance is a well-defi ned vertical radiolucent defect in the alveolar bone, including numerous associated dental anomalies ( Figs. 30-1 and 30-2 ). These may include the absence of the maxillary lateral incisor and the presence of supernumerary teeth in this region. Often the involved teeth are malformed and poorly positioned. In patients with CL/P, there may be a mild delay in the development of maxillary and mandibular teeth and an increased incidence of hypodontia in both arches. The osseous defect may extend to include the fl oor of the nasal cavity. In patients with a repaired cleft, a well-
562
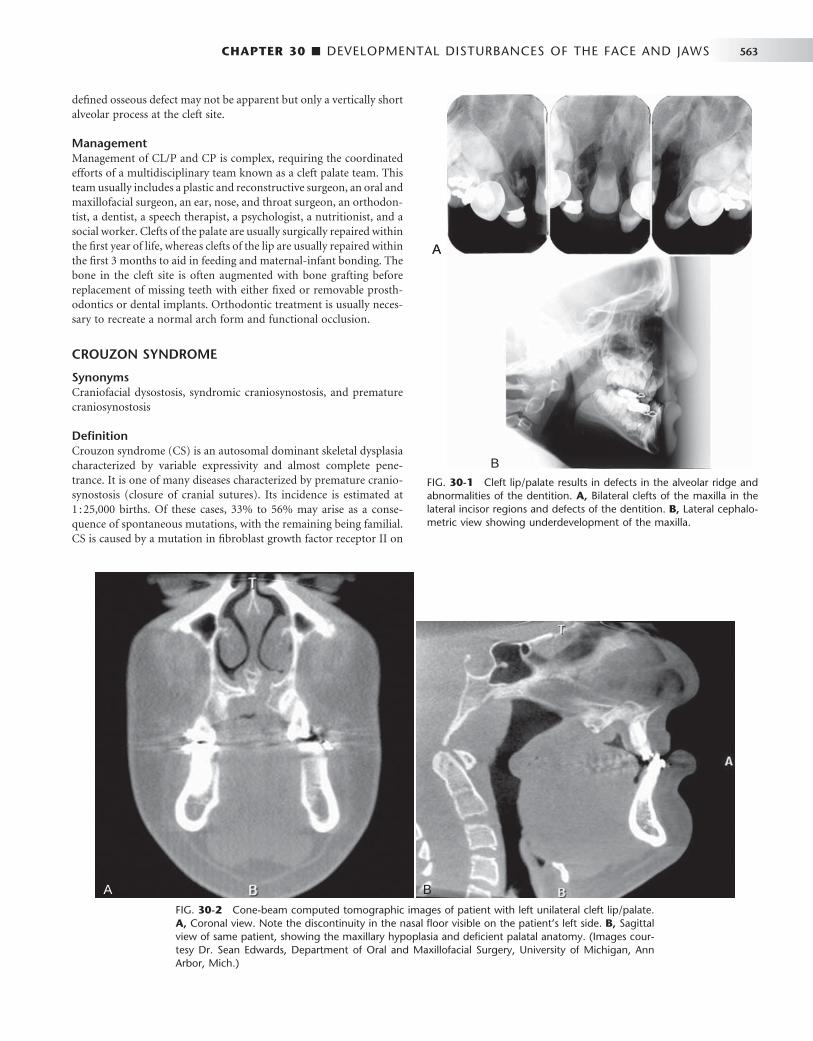
CHAPTER 30 ■ DEVELOPMENTAL DISTURBANCES OF THE FACE AND JAWS 563
FIG. 30-1 Cleft lip/palate results in defects in the alveolar ridge and abnormalities of the dentition. A, Bilateral clefts of the maxilla in the lateral incisor regions and defects of the dentition. B, Lateral cephalo-metric view showing underdevelopment of the maxilla.
A
B
A
B
defi ned osseous defect may not be apparent but only a vertically short alveolar process at the cleft site.
Management Management of CL/P and CP is complex, requiring the coordinated efforts of a multidisciplinary team known as a cleft palate team. This team usually includes a plastic and reconstructive surgeon, an oral and maxillofacial surgeon, an ear, nose, and throat surgeon, an orthodon-tist, a dentist, a speech therapist, a psychologist, a nutritionist, and a social worker. Clefts of the palate are usually surgically repaired within the fi rst year of life, whereas clefts of the lip are usually repaired within the fi rst 3 months to aid in feeding and maternal-infant bonding. The bone in the cleft site is often augmented with bone grafting before replacement of missing teeth with either fi xed or removable prosth-odontics or dental implants. Orthodontic treatment is usually neces-sary to recreate a normal arch form and functional occlusion.
CROUZON SYNDROME
Synonyms Craniofacial dysostosis, syndromic craniosynostosis, and premature craniosynostosis
Defi nition Crouzon syndrome (CS) is an autosomal dominant skeletal dysplasia characterized by variable expressivity and almost complete pene-trance. It is one of many diseases characterized by premature cranio-synostosis (closure of cranial sutures). Its incidence is estimated at 1 : 25,000 births. Of these cases, 33% to 56% may arise as a conse-quence of spontaneous mutations, with the remaining being familial. CS is caused by a mutation in fi broblast growth factor receptor II on
FIG. 30-2 Cone-beam computed tomographic images of patient with left unilateral cleft lip/palate. A, Coronal view. Note the discontinuity in the nasal fl oor visible on the patient ’ s left side. B, Sagittal view of same patient, showing the maxillary hypoplasia and defi cient palatal anatomy. (Images cour-tesy Dr. Sean Edwards, Department of Oral and Maxillofacial Surgery, University of Michigan, Ann Arbor, Mich.)
A BA B

564 PART V ■ RADIOGRAPHIC INTERPRETATION
chromosome 10. Mutations at this site are also responsible for other craniosynostosis syndromes with similar facial features but clinically visible limb abnormalities. In patients with CS the coronal suture usually closes fi rst and eventually all cranial sutures close early. There is also premature fusion of the synchondroses of the cranial base. The subsequent lack of bone growth perpendicular to the synchondroses and cranial coronal sutures produces the characteristic cranial shape and facial features.
Clinical Features Patients characteristically have brachycephaly (short skull front to back), hypertelorism (increased distance between eyes), and orbital proptosis (protruding eyes) ( Fig. 30-3, A and B ). In familial cases, the minimal criteria for diagnosis are hypertelorism and orbital proptosis. Patients may become blind as a result of early suture closure and increased intracranial pressure. The nose often appears prominent and pointed because the maxilla is narrow, and short in a vertical and an anteroposterior dimension. The anterior nasal spine is hypoplastic and retruded, failing to provide adequate support to the soft tissue of the nose. The palatal vault is high and the maxillary arch narrow and retruded, resulting in crowding of the dentition.
Radiographic Features General Radiographic Features. The earliest radiographic signs
of cranial suture synostosis are sclerosis and overlapping edges. Sutures that normally should look radiolucent on the skull fi lm will not be detectable or will show sclerotic changes. Interestingly, on rare occasions the facial features may present before radiographic evidence of sutural synostosis. Premature fusion of the cranial base leads to diminished facial growth. In some cases, prominent cranial markings are noted, which are also seen in normally growing patients, but are more prominent because of an increase in intracranial pressure from the growing brain. These markings may be seen as multiple radiolu-cencies appearing as depressions (so-called digital impressions) of the inner surface of the cranial vault, which results in a beaten metal appearance (see Fig. 30-3, C to E ).
Radiographic Features of the Jaws. The lack of growth in an anteroposterior direction at the cranial base results in maxillary hypo-plasia, creating a Class III malocclusion in some patients. The maxil-lary hypoplasia contributes to the characteristic orbital proptosis because the maxilla forms part of the inferior orbital rim and if severely hypoplastic fails to adequately support the orbital contents. The mandible is typically smaller than normal but appears prognathic in relation to the severely hypoplastic maxilla.
Differential Diagnosis Premature craniosynostosis, either isolated or part of a genetic syn-drome, is a fairly common disorder.
The incidence of CS is reported to range from 1 : 2100 to 1 : 2500 births. Other causes of craniosynostosis must be differentiated from CS, including other syndromic forms of craniosynostosis and non-syndromic coronal craniosynostosis. The characteristic facial features must be present to suggest CS.
Management The craniofacial features of CS worsen over time because of the abnormal craniofacial growth. Early diagnosis permits surgical and orthodontic treatment from infancy through adolescence, coordi-nated by a craniofacial team. The objectives of these treatments are to allow normal brain growth and development by preventing
increased intracranial pressure, protect the eyes by providing ade-quate bony support, and improve facial esthetics and occlusal func-tion. Because of early diagnosis and improvements in medical and dental care, most patients have normal intelligence and can expect a normal life span.
HEMIFACIAL MICROSOMIA
Synonyms Hemifacial hypoplasia, craniofacial microsomia, lateral facial dyspla-sia, Goldenhar syndrome, and oculoauriculovertebral dysplasia
Defi nition Hemifacial microsomia (HFM) is the second most common develop-mental craniofacial anomaly after cleft lip and palate, affecting approximately 1 : 56,000 live births. Patients with HFM typically display reduced growth and development of half of the face as a result of abnormal development of the fi rst and second branchial arches. This malformation sequence is usually unilateral but occasionally may involve both sides (craniofacial microsomia). When the whole side of the face is involved, the mandible, maxilla, zygoma, external and middle ear, hyoid bone, parotid gland, vertebrae, fi fth and seventh cranial nerves, musculature, and other soft tissues are diminished in size and sometimes fail to develop. Delayed dental eruption and hypodontia on the affected side have also been reported. Most cases occur spontaneously, but familial cases demonstrating autosomal dominant inheritance have been reported. There is a male predomi-nance of 3 : 2 and a right side predominance of 3 : 2. Cases with verte-bral abnormalities and epibulbar dermoids have been considered to form a separate category within this condition, known as Goldenhar syndrome or oculoauriculovertebral dysplasia.
Clinical Features HFM is usually apparent at birth. Patients with this condition have a striking appearance caused by progressive failure of the affected side to grow, which gives the involved side of the face a reduced dimension. In addition, aplasia or hypoplasia of the external ear (microtia) is common, and the ear canal is often missing. In some patients the skull is diminished in size. In about 90% of cases, there is malocclusion on the affected side. The midsagittal plane of the patient ’ s face is curved toward the affected side. The occlusal plane will often be canted up to the affected side.
Radiographic Features The primary radiographic fi nding is a reduction in the size of the bones on the affected side. This change is clearest in the mandible, which may show a reduction in the size of or, in severe cases, lack of any development of the condyle, coronoid process, or ramus. The body is reduced in size, and a portion of the distal aspect may be missing ( Fig. 30-4 ). The dentition on the affected side may show a reduction in the number or size of the teeth. Computed tomographic (CT) examination shows a reduction in the size of the muscles of mastication and muscles of facial expression and hypoplasia or atresia of the auditory canal and ossicles of the middle ear. The course of the facial nerve is often shown to be abnormal on CT examination of the temporal bone.
Differential Diagnosis The features of hemifacial microsomia are characteristic. Condylar hypoplasia, especially that caused by a fracture at birth or by juve-

CHAPTER 30 ■ DEVELOPMENTAL DISTURBANCES OF THE FACE AND JAWS 565
FIG. 30-3 A and B, Characteristic facial features of Crouzon syndrome in this 2-year-old boy include orbital proptosis, hypertelorism, and midfacial hypoplasia. Rarely, they may precede the radiographic features of sutural synostosis. C, Lateral and, D, 45-degree skull views demonstrating the short anterior-posterior dimension of the skull, digital impressions, and hypoplastic maxilla. E, Lateral skull of another patient demonstrating prominent digital markings. (Courtesy Department of Radiology, Baylor University Hospital, Dallas, Tex.)
A
B
C
D
E
A
B
C
D
E
566 PART V ■ RADIOGRAPHIC INTERPRETATION
nile arthrosis (Boering ’ s arthrosis), may be similar, but it does not produce the ear changes (see Chapter 26 ). Exposure of the face of a child to radiation therapy during growth also may result in under-development of the irradiated tissues. In progressive hemifacial atrophy (Parry-Romberg syndrome), the changes will become more severe over time but are generally not present at birth, and the ears are normal.
Management The mandibular abnormalities may be corrected by conventional orthognathic surgery or distraction osteogenesis to lengthen the ramus on the affected side. Orthodontic intervention may correct or prevent malocclusion. The ear abnormalities may be repaired by plastic surgery or corrected with maxillofacial prosthetics, and the hearing loss may be partly corrected by hearing aids. In bilateral cases
FIG. 30-4 A and B, Hemifacial microsomia, showing reduced size and malformation of the left ear and left side of the mandible. A, Clinical photograph of infant with hemifacial microsomia. B, Three-dimensional CT image of the affected side shows the extent of the bony malformation. Note the complete absence of the temporomandibular joint and coronoid process as well as auditory canal atresia. C and D, A panoramic image and a posteroanterior skull view of other cases showing lack of development of ramus, coronoid process, and condyle (arrows). ( A and B , courtesy Dr. Arlene Rozzelle, Children ’ s Hospital of Michigan, Detroit, Mich.)
A B
D
C
A B
D
C
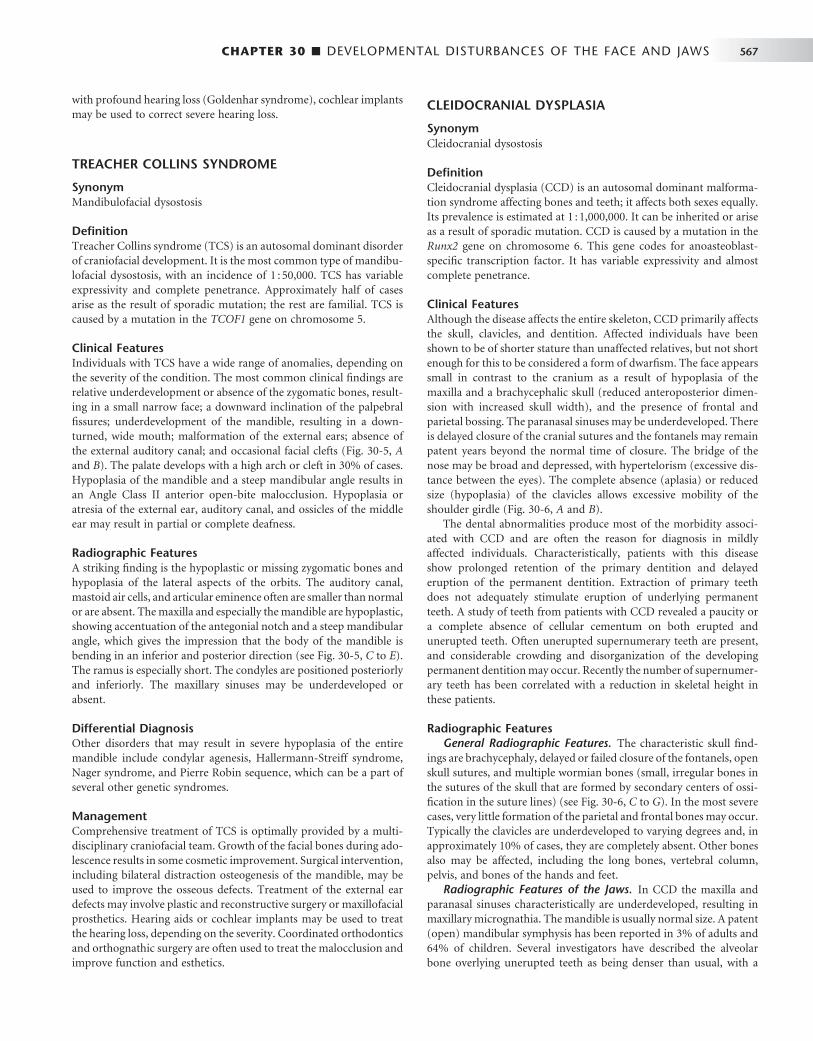
CHAPTER 30 ■ DEVELOPMENTAL DISTURBANCES OF THE FACE AND JAWS 567
with profound hearing loss (Goldenhar syndrome), cochlear implants may be used to correct severe hearing loss.
TREACHER COLLINS SYNDROME
Synonym Mandibulofacial dysostosis
Defi nition Treacher Collins syndrome (TCS) is an autosomal dominant disorder of craniofacial development. It is the most common type of mandibu-lofacial dysostosis, with an incidence of 1 : 50,000. TCS has variable expressivity and complete penetrance. Approximately half of cases arise as the result of sporadic mutation; the rest are familial. TCS is caused by a mutation in the TCOF1 gene on chromosome 5.
Clinical Features Individuals with TCS have a wide range of anomalies, depending on the severity of the condition. The most common clinical fi ndings are relative underdevelopment or absence of the zygomatic bones, result-ing in a small narrow face; a downward inclination of the palpebral fi ssures; underdevelopment of the mandible, resulting in a down-turned, wide mouth; malformation of the external ears; absence of the external auditory canal; and occasional facial clefts ( Fig. 30-5, A and B ). The palate develops with a high arch or cleft in 30% of cases. Hypoplasia of the mandible and a steep mandibular angle results in an Angle Class II anterior open-bite malocclusion. Hypoplasia or atresia of the external ear, auditory canal, and ossicles of the middle ear may result in partial or complete deafness.
Radiographic Features A striking fi nding is the hypoplastic or missing zygomatic bones and hypoplasia of the lateral aspects of the orbits. The auditory canal, mastoid air cells, and articular eminence often are smaller than normal or are absent. The maxilla and especially the mandible are hypoplastic, showing accentuation of the antegonial notch and a steep mandibular angle, which gives the impression that the body of the mandible is bending in an inferior and posterior direction (see Fig. 30-5, C to E ). The ramus is especially short. The condyles are positioned posteriorly and inferiorly. The maxillary sinuses may be underdeveloped or absent.
Differential Diagnosis Other disorders that may result in severe hypoplasia of the entire mandible include condylar agenesis, Hallermann-Streiff syndrome, Nager syndrome, and Pierre Robin sequence, which can be a part of several other genetic syndromes.
Management Comprehensive treatment of TCS is optimally provided by a multi-disciplinary craniofacial team. Growth of the facial bones during ado-lescence results in some cosmetic improvement. Surgical intervention, including bilateral distraction osteogenesis of the mandible, may be used to improve the osseous defects. Treatment of the external ear defects may involve plastic and reconstructive surgery or maxillofacial prosthetics. Hearing aids or cochlear implants may be used to treat the hearing loss, depending on the severity. Coordinated orthodontics and orthognathic surgery are often used to treat the malocclusion and improve function and esthetics.
CLEIDOCRANIAL DYSPLASIA
Synonym Cleidocranial dysostosis
Defi nition Cleidocranial dysplasia (CCD) is an autosomal dominant malforma-tion syndrome affecting bones and teeth; it affects both sexes equally. Its prevalence is estimated at 1 : 1,000,000. It can be inherited or arise as a result of sporadic mutation. CCD is caused by a mutation in the Runx2 gene on chromosome 6. This gene codes for anoasteoblast-specifi c trans cription factor. It has variable expressivity and almost complete penetrance.
Clinical Features Although the disease affects the entire skeleton, CCD primarily affects the skull, clavicles, and dentition. Affected individuals have been shown to be of shorter stature than unaffected relatives, but not short enough for this to be considered a form of dwarfi sm. The face appears small in contrast to the cranium as a result of hypoplasia of the maxilla and a brachycephalic skull (reduced anteroposterior dimen-sion with increased skull width), and the presence of frontal and parietal bossing. The paranasal sinuses may be underdeveloped. There is delayed closure of the cranial sutures and the fontanels may remain patent years beyond the normal time of closure. The bridge of the nose may be broad and depressed, with hypertelorism (excessive dis-tance between the eyes). The complete absence (aplasia) or reduced size (hypoplasia) of the clavicles allows excessive mobility of the shoulder girdle ( Fig. 30-6, A and B ).
The dental abnormalities produce most of the morbidity associ-ated with CCD and are often the reason for diagnosis in mildly affected individuals. Characteristically, patients with this disease show prolonged retention of the primary dentition and delayed eruption of the permanent dentition. Extraction of primary teeth does not adequately stimulate eruption of underlying permanent teeth. A study of teeth from patients with CCD revealed a paucity or a complete absence of cellular cementum on both erupted and unerupted teeth. Often unerupted supernumerary teeth are present, and considerable crowding and disorganization of the developing permanent dentition may occur. Recently the number of supernumer-ary teeth has been correlated with a reduction in skeletal height in these patients.
Radiographic Features General Radiographic Features. The characteristic skull fi nd-
ings are brachycephaly, delayed or failed closure of the fontanels, open skull sutures, and multiple wormian bones (small, irregular bones in the sutures of the skull that are formed by secondary centers of ossi-fi cation in the suture lines) (see Fig. 30-6, C to G ). In the most severe cases, very little formation of the parietal and frontal bones may occur. Typically the clavicles are underdeveloped to varying degrees and, in approximately 10% of cases, they are completely absent. Other bones also may be affected, including the long bones, vertebral column, pelvis, and bones of the hands and feet.
Radiographic Features of the Jaws. In CCD the maxilla and paranasal sinuses characteristically are underdeveloped, resulting in maxillary micrognathia. The mandible is usually normal size. A patent (open) mandibular symphysis has been reported in 3% of adults and 64% of children. Several investigators have described the alveolar bone overlying unerupted teeth as being denser than usual, with a

FIG. 30-5 A and B, Treacher Collins syndrome (TCS). Note the characteristic facies: downward-sloping palpebral fi ssures, colobomas of the outer third of the lower lids, depressed cheekbones, receding chin, little if any nasofrontal angle, and a nose that appears relatively large. C, Lateral skull image demonstrating short mandibular rami, steep mandibular angle, and an anterior open bite. The zygomas are poorly formed. D and E, Three-dimensional CT images of young child with TCS show the extent of the bony abnormalities, including the bilateral auditory canal atresia, aplasia of the zygomatic arch, and hypoplasia of the mandibular ramus with characteristic “ curved ” shape of the mandibular body and pronounced antegonial notching.
A
C
E
B
D
A
C
E
B
D
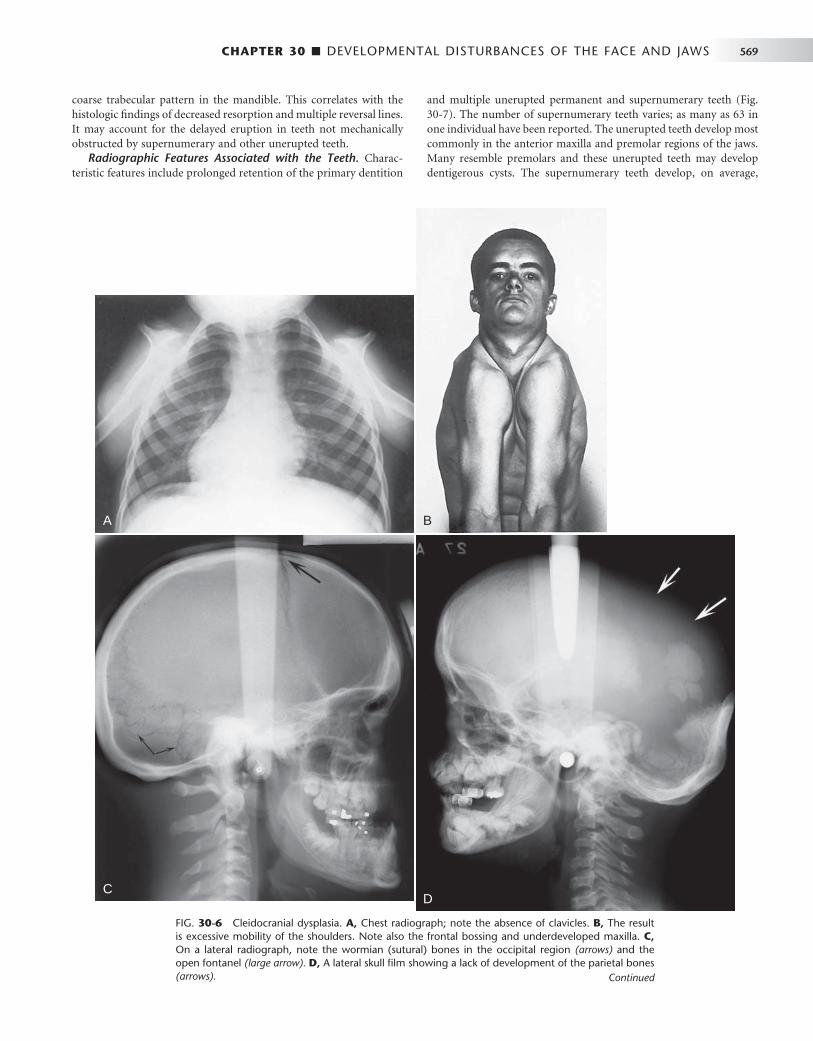
CHAPTER 30 ■ DEVELOPMENTAL DISTURBANCES OF THE FACE AND JAWS 569
FIG. 30-6 Cleidocranial dysplasia. A, Chest radiograph; note the absence of clavicles. B, The result is excessive mobility of the shoulders. Note also the frontal bossing and underdeveloped maxilla. C, On a lateral radiograph, note the wormian (sutural) bones in the occipital region (arrows) and the open fontanel (large arrow). D, A lateral skull fi lm showing a lack of development of the parietal bones (arrows).
BA
CD
coarse trabecular pattern in the mandible. This correlates with the histologic fi ndings of decreased resorption and multiple reversal lines. It may account for the delayed eruption in teeth not mechanically obstructed by supernumerary and other unerupted teeth.
Radiographic Features Associated with the Teeth. Charac-teristic features include prolonged retention of the primary dentition
and multiple unerupted permanent and supernumerary teeth ( Fig. 30-7 ). The number of supernumerary teeth varies; as many as 63 in one individual have been reported. The unerupted teeth develop most commonly in the anterior maxilla and premolar regions of the jaws. Many resemble premolars and these unerupted teeth may develop dentigerous cysts. The supernumerary teeth develop, on average,
Continued

570 PART V ■ RADIOGRAPHIC INTERPRETATION
E
F G
E, A posteroanterior skull fi lm. The brachycephaly results in a light bulb – like shape to the silhouette of the skull and mandible. F, Three-dimensional CT reconstruction with oblique ori-entation shows the typical skull shape; note the parietal and frontal bossing and open metopic suture in this 18-year-old man. G shows the light-bulb shape of the skull and the open metopic suture. ( A courtesy Department of Radiology, Baylor University Hospital, Dallas, Tex., F and G courtesy Dr. Sean Edwards, Department of Oral and Maxillofacial Surgery, University of Michigan, Ann Arbor, Mich.)
FIG. 30-6, cont’d

CHAPTER 30 ■ DEVELOPMENTAL DISTURBANCES OF THE FACE AND JAWS 571
4 years later than the corresponding normal teeth. Because of this, it has been proposed that the supernumerary teeth represent a third dentition.
Differential Diagnosis CCD may be identifi ed by the family history, excessive mobility of the shoulders, clinical examination of the skull, and pathognomonic radiographic fi ndings of prolonged retention of the primary teeth
with multiple unerupted supernumerary teeth. Other conditions associated with multiple unerupted and supernumerary teeth, such as Gardner ’ s syndrome and pycnodysostosis must be considered in the differential diagnosis.
Management In CCD dental care should include the removal of primary and super-numerary teeth to improve the possibility of spontaneous eruption of
FIG. 30-7 A and B, Panoramic images of cleido-cranial dysplasia; note the prolonged retention of the primary dentition and multiple unerupted supernumerary teeth and the lack of normal coro-noid notches. C, Axial CT view revealing multiple unerupted teeth, useful in identifi cation and local-ization of the unerupted teeth. ( C courtesy Dr. Sean Edwards, Department of Oral and Maxillofa-cial Surgery, University of Michigan, Ann Arbor, Mich.)
A
B
C
A
B
C
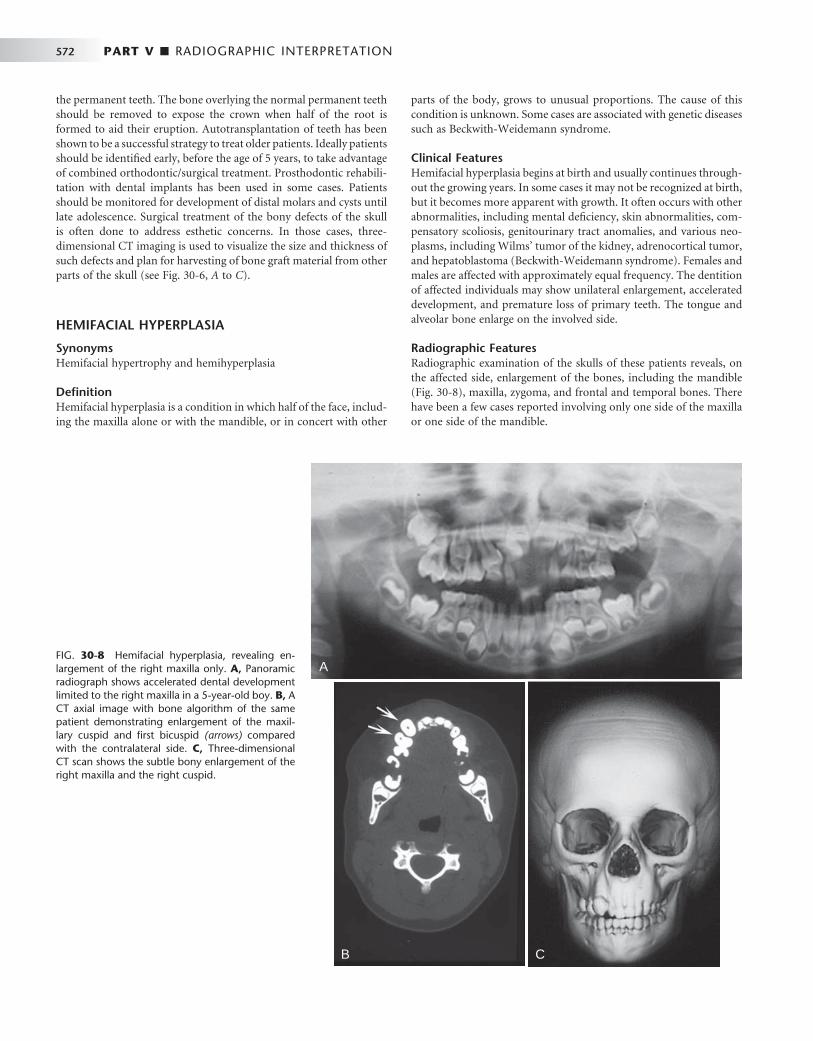
572 PART V ■ RADIOGRAPHIC INTERPRETATION
the permanent teeth. The bone overlying the normal permanent teeth should be removed to expose the crown when half of the root is formed to aid their eruption. Autotransplantation of teeth has been shown to be a successful strategy to treat older patients. Ideally patients should be identifi ed early, before the age of 5 years, to take advantage of combined orthodontic/surgical treatment. Prosthodontic rehabili-tation with dental implants has been used in some cases. Patients should be monitored for development of distal molars and cysts until late adolescence. Surgical treatment of the bony defects of the skull is often done to address esthetic concerns. In those cases, three-dimensional CT imaging is used to visualize the size and thickness of such defects and plan for harvesting of bone graft material from other parts of the skull (see Fig. 30-6, A to C ).
HEMIFACIAL HYPERPLASIA
Synonyms Hemifacial hypertrophy and hemihyperplasia
Defi nition Hemifacial hyperplasia is a condition in which half of the face, includ-ing the maxilla alone or with the mandible, or in concert with other
parts of the body, grows to unusual proportions. The cause of this condition is unknown. Some cases are associated with genetic diseases such as Beckwith-Weidemann syndrome.
Clinical Features Hemifacial hyperplasia begins at birth and usually continues through-out the growing years. In some cases it may not be recognized at birth, but it becomes more apparent with growth. It often occurs with other abnormalities, including mental defi ciency, skin abnormalities, com-pensatory scoliosis, genitourinary tract anomalies, and various neo-plasms, including Wilms ’ tumor of the kidney, adrenocortical tumor, and hepatoblastoma (Beckwith-Weidemann syndrome). Females and males are affected with approximately equal frequency. The dentition of affected individuals may show unilateral enlargement, accelerated development, and premature loss of primary teeth. The tongue and alveolar bone enlarge on the involved side.
Radiographic Features Radiographic examination of the skulls of these patients reveals, on the affected side, enlargement of the bones, including the mandible ( Fig. 30-8 ), maxilla, zygoma, and frontal and temporal bones. There have been a few cases reported involving only one side of the maxilla or one side of the mandible.
FIG. 30-8 Hemifacial hyperplasia, revealing en -large ment of the right maxilla only. A, Panoramic radiograph shows accelerated dental development limited to the right maxilla in a 5-year-old boy. B, A CT axial image with bone algorithm of the same patient demonstrating enlargement of the maxil-lary cuspid and fi rst bicuspid (arrows) compared with the contralateral side. C, Three-dimensional CT scan shows the subtle bony enlargement of the right maxilla and the right cuspid.
A
B C
A
B C

CHAPTER 30 ■ DEVELOPMENTAL DISTURBANCES OF THE FACE AND JAWS 573
Differential Diagnosis The differential diagnosis should consider hemifacial hypoplasia of the opposite side, arteriovenous aneurysms, hemangioma, and con-genital lymphedema. Also, severe condylar hyperplasia that may involve half of the mandible should be considered (see Chapter 26 ). The presence of enlarged teeth together with rapid eruption of the dentition suggests hemifacial hyperplasia. Cases limited to one side of the maxilla must be differentiated from monostotic fi brous dysplasia and segmental odontomaxillary dysplasia, both of which have char-acteristic changes in the radiographic appearance of the alveolar bone not present in hemifacial hyperplasia.
Management There have not been a signifi cant number of cases of hemifacial hyperplasia reported with long-term follow-up to make defi nitive recommendations for treatment. Although most cases are isolated, a child with suspected hemifacial hyperplasia should be referred to a medical geneticist for diagnosis and early detection of one of several genetic syndromes that can be associated with this condition.
SEGMENTAL ODONTOMAXILLARY DYSPLASIA
Synonym Hemimaxillofacial dysplasia
Defi nition Segmental odontomaxillary dysplasia (SOD) is a developmental abnormality of unknown etiology that affects the posterior alveolar process of one side of one maxilla, including the teeth and attached gingiva.
Clinical Features The abnormality is always unilateral and results in enlargement of the alveolar process, gingiva, and teeth. Frequently teeth are missing (most commonly the premolars), and some of the teeth that remain are unerupted. Unilateral hypertrichosis and mild facial enlargement have been reported in a few cases. Most cases are detected in childhood because a parent notices the lack of tooth eruption or mild facial asym-metry or the dentist notices missing premolars radiographically.
Radiographic Features The density of the maxillary alveolar process is increased, with a greater number of thick trabeculae that appear to be aligned in a vertical orientation, having an appearance similar to that of some intraosseous hemangiomas ( Fig. 30-9 ). The roots of the deciduous teeth are larger than on the unaffected side and usually are splayed in shape. The crowns of the deciduous teeth and sometimes the perma-n ent teeth are enlarged. Enlargement of pulp chambers and irregular resorption of the roots of deciduous teeth also may be seen. The maxillary sinus does not pneumatize the alveolar process and thus
FIG. 30-9 A, A panoramic view of segmental odontomaxillary dysplasia. Note the large left maxillary deciduous molars compared with the right side and the lack of formation of the bicuspids, delayed eruption of the fi rst molar, and the dense bone pattern of the left maxillary alveolar process. B and C, A second case demonstrating the coarse trabecular pattern of the right maxillary alveolar process and delayed eruption of the maxillary right fi rst bicuspid and molars.
A
B C
A
B C

574 PART V ■ RADIOGRAPHIC INTERPRETATION
appears smaller than on the contralateral side. There is often delayed eruption of the fi rst and second permanent molars.
Differential Diagnosis Other conditions that must be differentiated from SOD include seg-mental hemifacial hyperplasia, monostotic fi brous dysplasia, and regional odontodysplasia. Hemifacial hyperplasia is not associated with coarse vertically oriented trabeculae in the bone; monostotic fi brous dysplasia is not typically associated with missing teeth and, unlike SOD, will continue to show disproportionate growth of the affected side; and regional odontodysplasia typically is associated with ghost teeth and is not associated with expansion and alteration in trabecular pattern in the alveolar bone.
LINGUAL SALIVARY GLAND DEPRESSION
Synonyms Lingual mandibular bone depression, developmental salivary gland defect, Stafne defect, Stafne bone cyst, static bone cavity, and latent bone cyst
Defi nition Lingual mandibular bone depressions represent a group of concavities in the lingual surface of the mandible where the depression is lined with an intact outer cortex. Historically, they were referred to as pseu-docysts because they resemble cysts radiographically, but they are not true cysts because no epithelial lining is present. The most common location is within the submandibular gland fossa and often close to the inferior border of the mandible. This lingual posterior variant (LP) of these depressions was fi rst described by Stafne in 1942. This well-defi ned deep depression is thought to result from or be associ-ated with growth of the salivary gland adjacent to the lingual surface of the mandible. Similar defects have also been described in the ante-rior region near the apical region of the bicuspids, associated with the sublingual glands (lingual anterior variant or LA) and very rarely on the medial surface of the ascending ramus, associated with the parotid gland (medial ramus variant or MR). In LP developmental bone defects investigated surgically, an aberrant lobe of the submandibular gland has been described to extend into the bony depression; however, CT imaging of some of these defects reveals fat tissue and no evidence of gland. The etiology remains unknown, but the condition is a devel-opmental anomaly that has been documented to develop in patients as old as 30 years and as young as 11 years. These defects may continue to slowly grow in size.
Clinical Features Although lingual mandibular bone depressions appear to be relatively rare, with an incidence of LP of about 0.10% to 0.48%, it is likely that many go unreported. LA incidence is even less at 0.009%. They are asymptomatic and next to impossible to palpate and, generally dis-covered only incidentally during radiographic examination of the area. In a recent review of a large number of cases, males predomi-nated females at 6.1 : 1, with a peak incidence in the fi fth and sixth decades.
Radiographic Features A lingual mandibular bone depression is a well-defi ned round, ovoid, or, occasionally, lobulated radiolucency that ranges in diameter from 1 to 3 cm ( Fig. 30-10 ). The LP defect is located below the inferior alveolar nerve canal and anterior to the angle of mandible, in the
region of the antegonial notch and submandibular gland fossa. Rare LA examples are located in the apical region of the mandibular pre-molars or cuspids and are related to the sublingual gland fossa, above the mylohyoid muscle. The margins of the radiolucent defect are well defi ned by a dense sclerotic radiopaque margin of variable width, which is usually thicker on the superior aspect. This appearance is the result of the x rays passing tangentially through the relatively thick walls of the depression. This cortical outline is often less distinct in the LA variant. The LP defect may involve the inferior border of the mandible. CT images reportedly reveal tissue of fat density within the defect ( Fig. 30-11 ), or in some cases there is continuity of the tissue within the defect with the adjacent salivary gland.
Differential Diagnosis The appearance and location of the radiographic image of this devel-opmental bone defect are characteristic and easily identifi ed. Lingual mandibular bone depressions can be readily differentiated from odon-togenic lesions such as cysts because the epicenter of odontogenic lesions is located above the inferior alveolar canal. However, when the defect is related to the sublingual gland and appears above the canal, odontogenic lesions should be considered in the differential diagnosis.
Management Recognition of the lesion should preclude any treatment or surgical exploration or the need for advanced imaging such as CT. The defect may increase in size with time. There are rare reports of salivary gland neoplasms developing in the soft tissue within the defect. Destruction of the well-defi ned cortex of the defect may indicate the presence of a neoplasm.
FOCAL OSTEOPOROTIC BONE MARROW
Synonym Marrow space
Defi nition Focal osteoporotic bone marrow is a radiologic term indicating the presence of radiolucent defects within the cancellous portion of the jaws. Histologic examination reveals normal areas of hematopoietic or fatty marrow. The etiology is unknown but has been postulated to be (1) bone marrow hyperplasia, (2) persistent embryologic marrow remnants, or (3) sites of abnormal healing after extraction, trauma, or local infl ammation. This entity is a variation of normal anatomy.
Clinical Features Focal osteoporotic bone marrow defects are usually clinically asymp-tomatic and are commonly an incidental radiographic fi nding. These marrow spaces are more common in middle-aged women.
Radiographic Features A common site for focal osteoporotic bone marrow is the mandibular molar-premolar region. Other sites include the maxillary tuberosity region, mandibular retromolar area, edentulous locations, occasion-ally the furcation region of mandibular molars, and rarely near the apex of teeth. The radiographic appearance of focal osteoporotic bone marrow space is quite variable. The internal aspect is radiolucent because of the presence of fewer trabeculae in comparison with the surrounding bone. The periphery may be ill defi ned and blending or may appear to be corticated. The immediate surrounding bone is normal without any sign of a bone reaction ( Fig. 30-12 ).

CHAPTER 30 ■ DEVELOPMENTAL DISTURBANCES OF THE FACE AND JAWS 575
FIG. 30-10 A, Lingual mandibular bone depressions of the posterior variant usually are seen as sharply defi ned radiolucencies beneath the mandibular canal in the region of the submandibular gland fossa. These defects can erode the inferior border of the mandible. B, An unusual variant with a superior position above the inferior alveolar canal. C, An anterior variant within the sublingual gland fossa.
A
B
C
A
B
C

FIG. 30-12 A through C, Focal osteoporotic bone marrow defect, seen as a radiolucency (arrow). A few internal trabeculae may be present, and the periphery varies from well defi ned to ill defi ned. D, An example located in the furcation of a mandibular fi rst molar. The periodontal ligament space and lamina dura are intact.
FIG. 30-11 CT scans of lingual mandibular bone depressions, posterior variant. A and B, Axial bone and soft tissue windows of the same case. Note the well-defi ned defect extending from the medial surface of the mandible and the corresponding soft tissue image, which shows radiolucent tissue within the defect that has the density equivalent of fat tissue (arrow). C, A three-dimensional, reformatted CT image revealing a defect extending from the medial surface of the mandible.
A B
C
A B
C

CHAPTER 30 ■ DEVELOPMENTAL DISTURBANCES OF THE FACE AND JAWS 577
Differential Diagnosis A small simple bone cyst may have a similar appearance because there is usually no bone reaction at the periphery of a simple bone cyst. When osteoporotic bone marrow occurs in the furcation region or at the apex of a tooth, the differential diagnosis includes the presence of an infl ammatory lesion. If the area is normal bone marrow, the lamina dura should be intact. Very early infl ammatory lesions that have not yet stimulated a visible osteoblastic response may appear similar.
Management No treatment is required for the osteoporotic bone marrow space. Prior radiographs of the region should always be obtained if available. When doubt exists about the true nature of the radiolucency, a lon-gitudinal study with fi lms at 3-month intervals may be prescribed. The marrow space should not increase in size.
BIBLIOGRAPHY Cohen MM Jr , McLean RE : Craniosynostosis: diagnosis, evaluation, and
management , ed 2 . New York , 2000 , Oxford University Press . Gorlin RJ , Cohen MM Jr , Hennekam RCM : Syndromes of the head and neck ,
ed 4 , New York , 2001 , Oxford University Press . Neville BW , Damm DD , Allen CM et al : Oral and maxillofacial pathology , ed
2 , Philadelphia , 2002 , WB Saunders . Worth HM : Principles and practice of oral radiologic interpretation , Chicago ,
1963 , Year Book .
CLEFT LIP AND CLEFT PALATE
Habel A , Sell D , Mars M : Management of cleft lip and palate , Arch Dis Child 74 : 360 - 366 , 1996 .
Harris EF , Hullings JG : Delayed dental development in children with isolated cleft lip and palate , Arch Oral Biol 35 : 469 - 473 , 1990 .
Hibbert SA , Field JK : Molecular basis of familial cleft lip and palate , Oral Dis 2 : 238 - 241 , 1996 .
Honein MA , Rasmussen SA , Reefhuis J et al : Maternal and environmental tobacco smoke exposure and the risk of orofacial clefts , Epidemiology 18 : 226 - 233 , 2007 .
Shapira Y , Lubit E , Kuftinec MM : Hypodontia in children with various types of clefts , Angle Orthod 70 : 16 - 21 , 2000 .
Wyszynski DF , Beaty TH , Maestri NE : Genetics of nonsyndromic oral clefts revisited , Cleft Palate Craniofac J 33 : 406 - 417 , 1996 .
CROUZON SYNDROME
Murdoch-Kinch CA , Bixler D , Ward RE : Cephalometric analysis of families with dominantly inherited Crouzon syndrome: an aid to diagnosis in family studies , Am J Med Genet 77 : 405 - 411 , 1998 .
Tuite GF , Evanson J , Chong WK et al : The beaten copper cranium: a correlation between intracranial pressure, cranial radiographs, and computed tomographic scans in children with craniosynostosis , Neurosurgery 39 : 691 - 699 , 1996 .
HEMIFACIAL MICROSOMIA
Maruko E , Hayes C , Evans CA et al : Hypodontia in hemifacial microsomia , Cleft Palate Craniofac J 38 : 15 - 19 , 2001
Monahan R , Seder K , Patel P et al : Hemifacial microsomia: etiology, diagnosis and treatment , J Am Dent Assoc 132 : 1402 - 1408 , 2001 .
Sze RW , Paladin AM , Lee S et al : Hemifacial microsomia in pediatric patients: asymmetric abnormal development of the fi rst and second branchial arches . AJR Am J Roentgenol 178 : 1523 - 1530 , 2002 .
TREACHER COLLINS SYNDROME
Herman TE , Siegel MJ : Special imaging casebook: Treacher Collins syndrome , J Perinatol 16 : 413 - 415 , 1996 .
Posnick JC : Treacher Collins syndrome: perspectives in evaluation and treatment , J Oral Maxillofac Surg 55 : 1120 - 1133 , 1997 .
CLEIDOCRANIAL DYSPLASIA
Golan I , Baumert U , Hrala BP et al : Dentomaxillofacial variability of cleidocranial dysplasia: clinicoradiological presentation and systematic review , Dentomaxillofacial Radiol 32 : 347 - 354 , 2003
McGuire TP , Gomes PP , Lam DK et al : Cranioplasty for midline metopic suture defects in adults with cleidocranial dysplasia, Oral Surg Oral Med , Oral Pathol Oral Radiol Endod 103 : 175 - 179 , 2007
Seow WK , Hertzberg J : Dental development and molar root length in children with cleidocranial dysplasia , Pediatr Dent 17 : 101 - 105 , 1995 .
Yoshida T , Kanegane H , Osata M et al : Functional analysis of RUNX2 mutations in Japanese patients with cleidocranial dysplasia demonstrates novel genotype-phenotype correlations , Am J Hum Genet 71 : 724 - 738 , 2002 .
HEMIFACIAL HYPERPLASIA
Fraumeni JF Jr , Geiser CF , Manning MD et al : Wilms ’ tumor and congenital hemihypertrophy: report of fi ve new cases and review of the literature , Pediatrics 40 : 886 - 899 , 1967 .
Hoyme HE , Seaver LH , Procopio F et al : Isolated hemihyperplasia (hemihypertrophy): report of a prospective multicenter study of the incidence of neoplasia and review , Am J Med Genet 79 : 274 - 278 , 1998 .
Kogon SL , Jarvis AM , Daley TD et al : Hemifacial hypertrophy affecting the maxillary dentition: report of a case , Oral Surg Oral Med Oral Pathol 58 : 549 - 553 , 1984 .
SEGMENTAL ODONTOMAXILLARY DYSPLASIA
Danforth RA , Melrose RJ , Abrams AM et al : Segmental odontomaxillary dysplasia: report of eight cases and comparison with hemimaxillofacial dysplasia , Oral Surg Oral Med Oral Pathol 70 : 81 - 85 , 1990 .
Miles DA , Lovas JL , Cohen MM Jr : Hemimaxillofacial dysplasia: a newly recognized disorder of facial asymmetry, hypertrichosis of the facial skin, unilateral enlargement of the maxilla, and hypoplastic teeth in two patients , Oral Surg Oral Med Oral Pathol 64 : 445 - 448 , 1987 .
Packota GV , Pharaoh MJ , Petrikowski CG : Radiographic features of segmental odontomaxillary dysplasia: a study of 12 cases , Oral Surg Oral Med Oral Pathol Oral Radiol Endod 82 : 577 - 588 , 1996 .
LINGUAL MANDIBULAR BONE DEPRESSION
Parvizi F , Rout PG : An ossifying fi broma presenting as Stafne ’ s idiopathic bone cavity , Dentomaxillofac Radiol 26 : 361 - 363 , 1997 .
Philipsen HP , Takata T , Reichart PA et al : Lingual and buccal mandibular bone depressions: a review based on 583 cases from a world-wide literature survey, including 69 new cases from Japan , Dentomaxillofac Radiol 31 : 281 - 290 , 2002 .
FOCAL OSTEOPOROTIC BONE MARROW
Schneider LC , Mesa ML , Fraenkel D : Osteoporotic bone marrow defect: radiographic features and pathogenic factors , Oral Surg 65 : 127 - 129 , 1988 .
Standish SM , Shafer WG : Focal osteoporotic bone marrow defects of the jaws , J Oral Surg Anesth Hosp Dent Serv 20 : 123 - 128 , 1962 .

C H A P T E R 3 1
Salivary Gland Radiology
Byron W. Benson
Defi nition of Salivary Gland Disease
Dental diagnosticians have responsibility for detecting disorders of the salivary glands. A familiarity with salivary gland disorders and applicable current imaging techniques is an essential element of the clinician ’ s armamentarium. Both major and minor salivary glands may be involved pathologically; however, this chapter deals only with the major glands. Salivary gland disease processes may be divided into the following clinical categories: infl ammatory disorders, nonin-fl ammatory disorders, and space-occupying masses. Infl ammatory disorders are acute or chronic and may be secondary to ductal obstruc-tion by sialoliths, trauma, infection, or space-occupying lesions such as neoplasia. Noninfl ammatory disorders are metabolic and secretory abnormalities associated with diseases of nearly all the endo-crine glands, malnutrition, and neurologic disorders. Space-occupying masses are cystic or neoplastic; the neoplasms are benign or malignant.
Clinical Signs and Symptoms
Diseases of the major salivary glands may have single or multiple clinical features. Swellings in the areas of the parotid and subman-dibular glands should create a clinical suspicion of salivary gland disease. Pain and altered salivary fl ow may be present. Because the periodicity and longevity of these symptoms are important in the differential diagnosis, a review of the medical history and physical condition of the patient may provide important information. A history of skin, endocrine, or swallowing abnormalities may suggest a systemic collagen disease or metabolic disorder.
Differential Diagnosis of Salivary Enlargements
ENLARGEMENTS OF THE PAROTID AREA
Unilateral enlargements of the parotid area are categorized by the presence of a discrete, palpable mass or a diffuse swelling. If no mass is apparent, sialadenitis should be considered. Sialadenitis may be primary or secondary to ductal obstruction (retrograde). A mass superfi cial to the gland may represent lymphadenitis, infected preau-ricular cyst, infected sebaceous cyst, benign lymphoid hyperplasia, or extraparotid tumor. A mass intrinsic to the gland suggests a neoplasm (benign or malignant), intraglandular lymph node, or hamartoma.
Rapid growth, facial nerve paralysis, rock-hard texture, pain, and older age of occurrence are clinically suggestive of malignant neoplasms.
The differential diagnosis of asymptomatic bilateral enlargements of the parotid area may include benign lymphoepithelial lesion, Sj ö gren syndrome, alcoholism, medication (iodine and certain heavy metals), and Warthin tumor. Painful bilateral enlargement may occur after radiation treatment or as a result of bacterial or viral sialadenitis (including mumps) when accompanied by systemic symptoms.
A differential diagnosis of diffuse facial swelling in the parotid region, but not related to abnormalities of the gland, includes hyper-trophy of the masseter muscle, accessory parotid gland, lesions related to the temporomandibular joint, and osteomyelitis of the ramus of the mandible. A palpable mass superfi cial to the gland suggests lymph-adenitis, an infected preauricular or sebaceous cyst, benign lymphoid hyperplasia, or extraparotid tumor ( Box 31-1 ).
ENLARGEMENTS OF THE SUBMANDIBULAR AREA
Unilateral enlargement of the submandibular area associated with tender lymph nodes is suggestive of sialadenitis, which may be primary or secondary to ductal obstruction or decreased salivary fl ow (retro-grade). Unilateral enlargement without tender lymph nodes suggests a neoplasm, cyst, lymphoepithelial lesion, or fi brosis. An intraglandu-lar mass may be neoplastic or cystic. Neoplasms of the submandibular gland have a greater chance of being malignant than do those of the parotid gland. In turn, sublingual gland neoplasms have a still greater chance of being malignant than do those of the submandibular glands. Rapid growth, rock-hard texture, pain, and older age of occurrence are clinically suggestive of malignancy. Masses superfi cial or adjacent to the submandibular gland may be lymph nodes or extraglandular neoplasms.
Bilateral enlargement of the submandibular gland area suggests bacterial or viral sialadenitis. Although mumps is primarily a viral infection of the parotid glands, it may also occur in the submandibu-lar glands. Other causes of swelling in the submandibular region include Sj ö gren syndrome, enlarged lymph nodes, submandibular space infection, and branchial cleft cyst (see Box 31-1 ).
Applied Diagnostic Imaging of the Salivary Glands
Diagnostic imaging of salivary gland disease may be undertaken to differentiate infl ammatory processes from neoplastic disease, distin-
578

CHAPTER 31 ■ SALIVARY GLAND RADIOLOGY 579
conditions are the most common disorders and primarily involve the ductal system, conventional sialography is commonly the most appro-priate next imaging modality. If the patient is allergic to the iodine contrast agent used in sialography, magnetic resonance imaging (MRI), computed tomography (CT), or ultrasonography (US) may be selected as alternative imaging modalities. Recent studies compar-ing the diagnostic yield of MRI with that of sialography suggest that MRI might replace sialography in the future as the imaging modality of choice for ductal pathosis. Sialography or CT is the best imaging modality for the detection of sialoliths (sialolithiasis). If sialography eliminates infl ammatory disorders or suggests the presence of a space-occupying mass (either cystic or solid), then contrast-enhanced CT or MRI is appropriate for evaluation. US is an alternative technique to differentiate cystic lesions from solid masses and to identify advanced autoimmune lesions. Functional disorders such as xerosto-mia are appropriately imaged with sialography or scintigraphy. Scin-tigraphy can provide important physiologic information that may be helpful in forming the differential diagnosis.
PLAIN FILM RADIOGRAPHY
Plain fi lm radiography is a fundamental part of the examination of the salivary glands and may provide suffi cient information to preclude the use of more sophisticated and expensive imaging techniques. It has the potential to identify unrelated pathoses in the areas of the salivary glands that may be mistakenly identifi ed as salivary gland disease, such as resorptive or osteoblastic changes in adjacent bone causing periauricular swelling mimicking a parotid tumor. Panoramic and conventional posteroanterior (PA) skull radiographs may dem-onstrate bony lesions, thus eliminating salivary pathosis from the differential diagnosis. Unilateral or bilateral functional or congenital hypertrophy of the masseter muscle may clinically mimic a salivary tumor. A plain fi lm extraoral radiograph may demonstrate a deep antegonial notch, overdeveloped mandibular angle, and exostosis on the outer surface of the angle in cases of masseter hypertrophy.
Plain fi lm radiographs are useful when the clinical impression, supported by a compatible history, suggests the presence of sialoliths (stones or calculi). Such an examination should include both intraoral and extraoral images to demonstrate the entire region of the gland. Sialoliths may be multiple at different locations. It is expedient to decrease the usual exposure by about half to avoid overexposure of the sialoliths. However, this technique is limited by the fact that 20% of the sialoliths of the submandibular gland and 40% of those of the parotid gland are not well calcifi ed, rendering them radiolucent and not visible in plain fi lms. Radiolucent sialoliths are rarely found in the sublingual glands.
INTRAORAL RADIOGRAPHY
Sialoliths in the anterior two thirds of the submandibular duct are typically imaged with a cross-sectional mandibular occlusal projec-tion as described in Chapter 8 ( Fig. 31-1 ). The posterior part of the duct is demonstrated with an over-the-shoulder occlusal projection view, where the directing cone is placed on the shoulder and central ray directed in an anterior direction through the angle of the mandi-ble, with the patient ’ s head tilted to the unaffected side and rotated back ( Fig. 31-2 ).
Parotid sialoliths are more diffi cult to demonstrate than the sub-mandibular variety as a result of the tortuous course of Stensen duct around the anterior border of the masseter and through the buccina-
BOX 31-1
Differential Diagnosis of Enlargements in the Salivary Gland Areas
Parotid Gland Area UNILATERAL • Bacterial sialadenitis • Sialodochitis • Cyst • Benign neoplasm • Malignant neoplasm • Intraglandular lymph node • Masseter muscle hypertrophy • Lesions of adjacent osseous structures
BILATERAL • Bacterial sialadenitis • Viral sialadenitis (mumps) • Sj ö gren syndrome • Alcoholic hypertrophy • Medication-induced hypertrophy (iodine, heavy metals) • Human immunodefi ciency virus – associated multicentric
cysts • Masseter muscle hypertrophy • Accessory salivary glands • Temporomandibular joint – related lesions
Submandibular Gland Area UNILATERAL • Bacterial sialadenitis • Sialodochitis • Fibrosis • Cyst • Benign neoplasm • Malignant neoplasm
BILATERAL • Bacterial sialadenitis • Sj ö gren syndrome • Lymphadenitis • Branchial cleft cyst • Submandibular space infection
guish diffuse disease from focal suppurative disease, identify and localize sialoliths, and demonstrate ductal morphology. In addition, diagnostic imaging attempts to determine the anatomic location of a tumor, differentiate benign from malignant disease, demonstrate the relationship between a mass and adjacent anatomic structures, and aid in the selection of biopsy sites.
ALGORITHM FOR DIAGNOSTIC IMAGING
Plain fi lm radiography is an appropriate starting point for imaging the major salivary glands from a cost-benefi t point of view. It can demonstrate sialoliths and the possible involvement of adjacent osseous structures. Because obstructive and associated infl ammatory
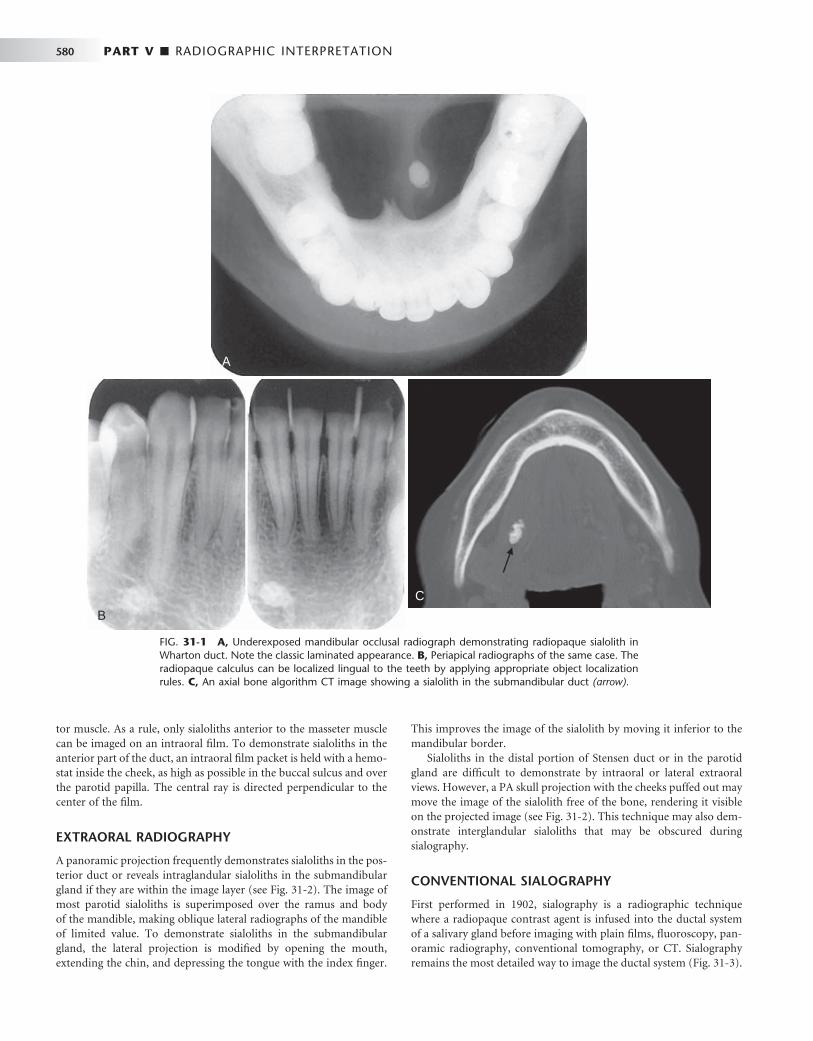
580 PART V ■ RADIOGRAPHIC INTERPRETATION
tor muscle. As a rule, only sialoliths anterior to the masseter muscle can be imaged on an intraoral fi lm. To demonstrate sialoliths in the anterior part of the duct, an intraoral fi lm packet is held with a hemo-stat inside the cheek, as high as possible in the buccal sulcus and over the parotid papilla. The central ray is directed perpendicular to the center of the fi lm.
EXTRAORAL RADIOGRAPHY
A panoramic projection frequently demonstrates sialoliths in the pos-terior duct or reveals intraglandular sialoliths in the submandibular gland if they are within the image layer (see Fig. 31-2 ). The image of most parotid sialoliths is superimposed over the ramus and body of the mandible, making oblique lateral radiographs of the mandible of limited value. To demonstrate sialoliths in the submandibular gland, the lateral projection is modifi ed by opening the mouth, extending the chin, and depressing the tongue with the index fi nger.
This improves the image of the sialolith by moving it inferior to the mandibular border.
Sialoliths in the distal portion of Stensen duct or in the parotid gland are diffi cult to demonstrate by intraoral or lateral extraoral views. However, a PA skull projection with the cheeks puffed out may move the image of the sialolith free of the bone, rendering it visible on the projected image (see Fig. 31-2 ). This technique may also dem-onstrate interglandular sialoliths that may be obscured during sialography.
CONVENTIONAL SIALOGRAPHY
First performed in 1902, sialography is a radiographic technique where a radiopaque contrast agent is infused into the ductal system of a salivary gland before imaging with plain fi lms, fl uoroscopy, pan-oramic radiography, conventional tomography, or CT. Sialography remains the most detailed way to image the ductal system ( Fig. 31-3 ).
FIG. 31-1 A, Underexposed mandibular occlusal radiograph demonstrating radiopaque sialolith in Wharton duct. Note the classic laminated appearance. B, Periapical radiographs of the same case. The radiopaque calculus can be localized lingual to the teeth by applying appropriate object localization rules. C, An axial bone algorithm CT image showing a sialolith in the submandibular duct (arrow).
A
B
C
A
B
C

CHAPTER 31 ■ SALIVARY GLAND RADIOLOGY 581
The parotid and submandibular glands are more readily studied with this technique. Although the sublingual gland is diffi cult to infuse intentionally, it may be fortuitously opacifi ed while the Wharton duct is infused to image the submandibular gland.
A survey or “ scout ” fi lm is usually made before the infusion of the contrast solution into the ductal system as an aid in verifying the optimal exposure factors and patient positioning parameters and for the detection of radiopaque sialoliths or extraglandular pathosis.
With this technique, a lacrimal or periodontal probe is used to dilate the sphincter at the ductal orifi ce before the passage of a cannula (blunt needle or catheter) connected by extension tubing to a syringe containing contrast agent. Lipid-soluble (e.g., Ethiodol) or non – lipid-soluble (e.g., Sinografi n) contrast solution is then slowly infused until the patient feels discomfort (usually between 0.2 and 1.5 ml, depending on the gland being studied). These iodine-containing agents render the ductal system radiopaque. The fi lling phase can be monitored by fl uoroscopy or with static fi lms. The intent is to opacify the ductal system all the way to the acini. The image of the ductal system appears as “ tree limbs, ” with no area of the gland devoid of ducts. With acinar fi lling, the “ tree ” comes into “ bloom, ” which is the typical appearance of the parenchymal opacifi cation phase ( Fig. 31-4 ). The gland is allowed to empty for 5 minutes without stimulation.
If postevacuation images suggest contrast retention, a sialogog such as lemon juice or 2% citric acid may be administered to augment evacuation by stimulating secretion. Non – lipid-soluble contrast agents are preferred because of reports of infl ammatory reactions subsequent to inadvertent extravasation of lipid-soluble agents.
Sialography is indicated for the evaluation of chronic infl amma-tory diseases and ductal pathoses. Contraindications include acute infection, known sensitivity to iodine-containing compounds, and immediately anticipated thyroid function tests.
COMPUTED TOMOGRAPHY
CT is useful in evaluating structures in and adjacent to salivary glands; it displays both soft and hard tissues and minute differences in soft tissue densities. Thin axial and coronal images with soft tissue algo-rithm commonly after intravenous administration of a contrast agent are typically acquired ( Fig. 31-5 ). (See Chapter 14 for a description of the CT process.) Glandular tissues are usually easily discernible from surrounding fat and muscle. The parotid glands are more radiopaque than the surrounding fat but less opaque than adjacent muscles. Although the submandibular and sublingual glands are similar in density to adjacent muscles, they are readily identifi ed on the basis of
FIG. 31-2 A, Stereoscopic panoramic plain fi lm projection. Note the laminated appearance of this sialolith in the submandibular gland. The image of the sialolith is magnifi ed because of its relatively lingual placement in the image layer. Taken from slightly different horizontal angles, a three-dimensional appearance can be obtained when viewed with stereobinoculars. B, Over-the-shoulder occlusal projection revealing a sialolith. C, Anteroposterior skull view with cheek blown out to provide air contrast to reveal a parotid sialolith (arrow).
A
B C
A
B C

582 PART V ■ RADIOGRAPHIC INTERPRETATION
shape and location. The submandibular and sublingual glands are most easily identifi ed on directly acquired contrast-enhanced coronal CT scans. CT is useful in assessing acute infl ammatory processes and abscesses as well as cysts, mucoceles, and neoplasia. Calcifi cations such as sialoliths are also well depicted with CT.
MAGNETIC RESONANCE IMAGING
MRI typically provides a different and better soft tissue contrast reso-lution than does CT; it also results in fewer problems with streak artifacts from metallic dental restorative materials ( Fig. 31-6 ). (See Chapter 14 for a description of the basic concepts and principles of MRI.) Axial views are acquired for all sequences, with coronal and sagittal views as needed. Noncontrast T1- and T2-weighted sequences are obtained, followed by T1-weighted postcontrast, fat-suppressed images. Fast-spin echo T2-weighted images may also require fat suppression.
Although indications for CT and MRI occasionally overlap, MRI is usually the imaging method of choice because of superior display of salivary gland masses, internal structures, and regional extension of the lesions into adjacent tissues or spaces, especially in examining the submandibular glands. The use of intravenous contrast (most commonly gadolinium) is helpful in distinguishing between cystic and solid masses and in the evaluation of perineural spread of malig-nant tumors. Studies have shown MRI with evoked salivation as a natural contrast medium to accurately reveal ductal morphology and to identify sialoliths.
FIG. 31-3 Sialography. A, Lateral projection of the parotid demonstrating opacifi cation all the way to the terminal ducts and acini. B, Anteroposterior projection of the same gland demonstrating “ parenchymal blushing ” from acinar opacifi cation. (Courtesy Oral and Maxillofacial Imaging Center, Baylor College of Dentistry, Dallas, Tex.)
A BA B
FIG. 31-4 Sialogram of Normal Submandibular Gland. This lateral view demonstrates parenchymal blushing. Normal fi ne branching is visible. Lack of parenchymal blushing at the anteroinferior margin is caused by radiographic burnout.
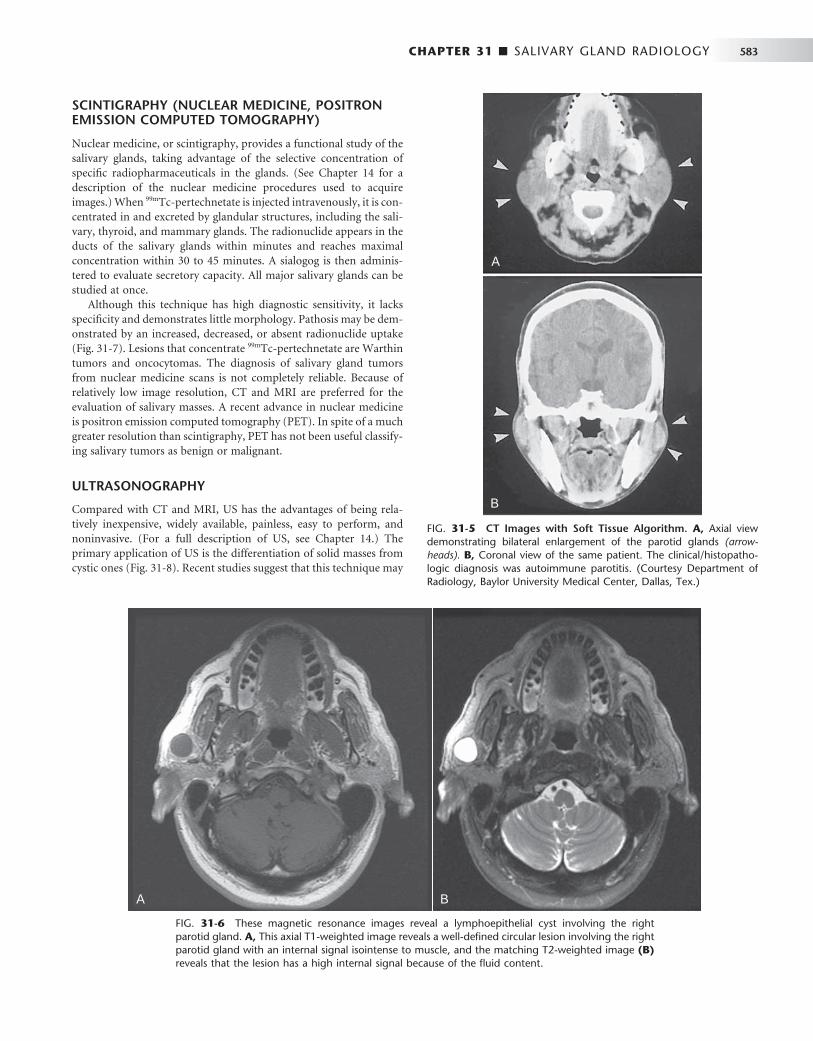
CHAPTER 31 ■ SALIVARY GLAND RADIOLOGY 583
SCINTIGRAPHY (NUCLEAR MEDICINE, POSITRON EMISSION COMPUTED TOMOGRAPHY)
Nuclear medicine, or scintigraphy, provides a functional study of the salivary glands, taking advantage of the selective concentration of specifi c radiopharmaceuticals in the glands. (See Chapter 14 for a description of the nuclear medicine procedures used to acquire images.) When 99m Tc-pertechnetate is injected intravenously, it is con-centrated in and excreted by glandular structures, including the sali-vary, thyroid, and mammary glands. The radionuclide appears in the ducts of the salivary glands within minutes and reaches maximal concentration within 30 to 45 minutes. A sialogog is then adminis-tered to evaluate secretory capacity. All major salivary glands can be studied at once.
Although this technique has high diagnostic sensitivity, it lacks specifi city and demonstrates little morphology. Pathosis may be dem-onstrated by an increased, decreased, or absent radionuclide uptake ( Fig. 31-7 ). Lesions that concentrate 99m Tc-pertechnetate are Warthin tumors and oncocytomas. The diagnosis of salivary gland tumors from nuclear medicine scans is not completely reliable. Because of relatively low image resolution, CT and MRI are preferred for the evaluation of salivary masses. A recent advance in nuclear medicine is positron emission computed tomography (PET). In spite of a much greater resolution than scintigraphy, PET has not been useful classify-ing salivary tumors as benign or malignant.
ULTRASONOGRAPHY
Compared with CT and MRI, US has the advantages of being rela-tively inexpensive, widely available, painless, easy to perform, and noninvasive. (For a full description of US, see Chapter 14 .) The primary application of US is the differentiation of solid masses from cystic ones ( Fig. 31-8 ). Recent studies suggest that this technique may
FIG. 31-5 CT Images with Soft Tissue Algorithm. A, Axial view demonstrating bilateral enlargement of the parotid glands (arrow-heads). B, Coronal view of the same patient. The clinical/histopatho-logic diagnosis was autoimmune parotitis. (Courtesy Department of Radiology, Baylor University Medical Center, Dallas, Tex.)
A
B
A
B
FIG. 31-6 These magnetic resonance images reveal a lymphoepithelial cyst involving the right parotid gland. A, This axial T1-weighted image reveals a well-defi ned circular lesion involving the right parotid gland with an internal signal isointense to muscle, and the matching T2-weighted image (B) reveals that the lesion has a high internal signal because of the fl uid content.
A BA B

584 PART V ■ RADIOGRAPHIC INTERPRETATION
also be helpful in detecting sialoliths and diagnosing advanced auto-immune lesions (Sj ö gren syndrome).
Image Interpretation of Salivary Gland Disorders
OBSTRUCTIVE AND INFLAMMATORY DISORDERS
Sialolithiasis
Synonyms Calculus and salivary stones
Defi nition Sialolithiasis is the formation of a calcifi ed obstruction within the salivary duct.
Clinical Features Sialoliths can obstruct the secretory ducts, resulting in chronic retro-grade infections because of a decrease in salivary fl ow. Clinical symp-toms include intermittent swelling and pain with eating and signs of infection. Sialoliths may form in any of the major or minor salivary glands or their ducts, but usually only one gland is involved. The submandibular gland and Wharton duct are by far the most fre-quently involved (83% of cases). If one stone is found, at least a one in four chance exists that others are present.
FIG. 31-7 Scintigraphy. A, 99m Tc-pertechnetate scan of the salivary glands (right and left anterior oblique views) demonstrates increased uptake of radioisotope in the right parotid gland (black arrowhead). B, Scintigram taken after administra-tion of a sialogog (lemon juice) demonstrates retention of isotope in right parotid gland (white arrowheads). This is a typical presentation of sali-vary stasis, Warthin tumor, or oncocytoma.
A
B
A
B
FIG. 31-8 Ultrasonography (US) Image of Right Parotid Gland. A well-delineated solid mass is suggested by echo returns within the lesion (arrows). US appearance is typical of a benign salivary tumor. (Courtesy Department of Radiology, Baylor University Medical Center, Dallas, Tex.)

CHAPTER 31 ■ SALIVARY GLAND RADIOLOGY 585
Radiographic Features Depending on their degree of calcifi cation, sialoliths may appear either radiopaque or radiolucent on radiographic examinations (20% to 40% of cases may not be calcifi ed enough to be radiopaque and are some-times referred to as “ mucous plugs ” ) (see Fig. 31-1 ). Sialoliths vary in shape from long cigar shapes to oval or round shapes. When visible, they usually have a homogeneous radiopaque internal structure. Sia-lography is helpful in locating obstructions that are undetectable with plain radiography, especially if the sialoliths are radiolucent. The con-trast agent usually fl ows around the sialolith, fi lling the duct proximal to the obstruction ( Fig. 31-9 and 31-10 ). The ductal system is frequently dilated proximal to the obstruction and implies the presence of an obstruction even when it is not visible. The contrast agent that fl ows around the sialolith is more radiopaque and may obscure small sialo-liths. Radiolucent sialoliths appear as ductal fi lling defects (see Figs. 31-9 and 31-12 ). Sialography should not be performed if a radiopaque stone has been shown by plain radiography to be in the distal portion of the duct because the procedure may displace it proximally into the ductal system, complicating subsequent removal. CT may also detect minimally calcifi ed sialoliths not visible on plain fi lms.
US is of limited value in the diagnosis of infl ammatory and obstructive diseases, but recent studies indicate it is fairly reliable in demonstrating sialoliths. More than 90% of stones larger than 2 mm are detected as echo-dense spots with a characteristic acoustic shadow.
Sialoliths must be differentiated from phleboliths and dystrophic calcifi cation of lymph nodes. Phleboliths typically demonstrate a radiolucent center. Calcifi ed lymph nodes usually appear to be “ cau-lifl ower ” shaped. In the panoramic image palatine tonsilliths have a similar location as parotid sialoliths, superimposed over the ramus, but can be differentiated in that they are typically multiple and punctate.
Treatment Treatment of sialolithiasis may consist of encouragement of spontane-ous discharge through the use of sialogogs to stimulate secretion. Sialography may also stimulate discharge, especially if an oil-based contrast agent is used. If discharge does not occur, the sialolith may
be removed by surgery or by more conservative retrieval methods, and as a last resort the involved salivary gland may be removed.
Bacterial Sialadenitis
Synonyms
Parotitis and submandibulitis
Defi nition Bacterial sialadenitis is an acute or chronic bacterial infection of the terminal acini or parenchyma of the salivary glands.
Clinical Features Acute bacterial infections most commonly affect the parotid gland, but the submandibular gland may also be involved. Most cases are unilateral and may occur at any age. The typical clinical presentation is swelling, redness, tenderness, and malaise. Enlarged regional lymph nodes and suppuration may also be noted. Those most commonly affl icted are elderly persons, postoperative patients, and debilitated patients who have poor hygiene as a result of reduced salivary secre-tion and retrograde infection by the oral fl ora (usually Staphylococcus aureus and Streptococcus viridans ). Reduced salivary secretion may also be drug related or the result of occlusion of a major duct. Untreated acute suppurative infections typically form abscesses. Diag-nosis is based on clinical observation, systemic symptoms, and the expression of pus from the duct.
Chronic infl ammation may affect any of the major salivary glands, causing extensive swelling and culminating in fi brosis. This may be a consequence of an untreated acute sialadenitis or associated with some type of obstruction resulting from sialolithiasis, noncalcifi ed organic debris, or stricture (scar or fi brosis) formation in the excre-tory ducts. Bacteria or viruses may not be detected in the gland or saliva. The parotid is most often involved. During periods of painful swelling, pus may be expressed from the ductal orifi ce and salivary stimulation may cause pain. Episodic in nature, signs of generalized sepsis are seldom present. The obstruction may be congenital or
FIG. 31-9 A, This partial image of a standard man-dibular occlusal fi lm reveals the presence of a sialolith (arrow). B, Sialograph of the same patient demonstrat-ing fl ow of contrast past the stone (short arrows) and a negative fi lling defect (long arrow) from a smaller radiolucent sialolith. The proximal secondary ducts within the gland show abnormal irregular widening indicating sialodochitis.
A BA B

586 PART V ■ RADIOGRAPHIC INTERPRETATION
caused by sialolithiasis, trauma, infection, or neoplasia. Typical clinical symptoms are intermittent swelling, pain when eating, and superimposed infection resulting from salivary stasis.
Radiographic Features Sialography is contraindicated in acute infections because disrupted ductal epithelium may allow extravasation of contrast agent, resulting in a foreign body reaction and severe pain. This technique is appropri-ate for use in cases of suspected chronic infections. Epithelial fl atten-ing may lead to mildly dilated terminal ducts and saclike acini, which is demonstrable with sialography. The saclike acinar areas are referred to as sialectasia. An even distribution throughout the gland is seen in recurrent parotitis and autoimmune disorders. If connected to the ductal system, abscess cavities may fi ll with contrast media during sialography. Abscess cavities appear on CT as walled-off areas of lower attenuation within an enlarged gland. US may distinguish between
FIG. 31-10 A, Cropped view of a posteroanterior skull view as part of a parotid investigation; the cheek has been puffed out, providing air contrast and revealing a poorly calcifi ed sialolith (arrow). B, Cropped view of a posteroanterior skull view of the sialograph of the same patient with the negative fi lling defect representing the sialolith (arrow) seen in A. C, Lateral view of the same patient revealing the fi lling defect (arrow) and abnormal dilation of the proximal ducts.
A
C
BA
C
B
FIG. 31-11 Contrast-Enhanced CT Image. The left parotid gland (arrows) is larger than the right, with no suggestion of abscess forma-tion. This appearance is consistent with diffuse parotitis and cellulitis. (Courtesy Department of Radiology, Baylor University Medical Center, Dallas, Tex.)
diffuse infl ammation (echo-free, light image) and suppuration (less echo-free, darker image) and detect sialoliths greater than 2 mm in diameter. US examination may also demonstrate abscess cavities, if present and may be the study of choice for recurrent parotitis, espe-cially in children. Contrast-enhanced CT may demonstrate glandular enlargement ( Fig. 31-11 ). However, MRI is an appropriate alternative examination in cases in which sialography is contraindicated or not technically possible. On MRI, infl amed glands are usually enlarged and demonstrate a lower tissue signal on T1-weighted images and a higher signal on T2-weighted images than that of the surrounding muscle. Advanced sialadenitis may present in combination with sialo-lithiasis, sialodochitis, abscess formation, and fi stulas.
Treatment Treatment of bacterial sialadenitis typically begins conservatively with attention to oral hygiene, local massage, increased fl uid intake, and the use of oral sialogogs (sour citrus fruit wedges or salivary stimu-lants). An appropriate antibiotic regimen may also be indicated. If symptoms continue, surgical remedies ranging from partial to total excision of the gland may be considered.
Sialodochitis
Synonym Ductal sialadenitis
Defi nition Sialodochitis is an infl ammation of the ductal system of the salivary glands.

CHAPTER 31 ■ SALIVARY GLAND RADIOLOGY 587
process may progress to benign lymphoepithelial lesions that can assume the proportions of a tumor. A presumptive diagnosis can be made on the basis of any two of the following three features: dry mouth, dry eyes, and rheumatoid disease. The disease is most common in adults, primarily in the 40- to 60-year-old age group with a 90% to 95% female prevalence. The childhood form is only one-tenth as common as the adult form and there is much less chance of advanced parotid disease. Studies have shown a 44 times greater risk for devel-opment of non-Hodgkin lymphoma than in control subjects. Miku-licz disease has been included within the diagnosis of primary Sj ö gren syndrome but represents a unique condition consisting of enlarge-ment of the lacrimal and salivary glands and characterized by few autoimmune reactions.
Radiographic Features Sialography is helpful in the diagnosis and staging of autoimmune disorders. The early stages of disease are witness to the initiation of punctate (less than 1 mm) and globular (1 to 2 mm) spheric collec-tions of contrast agent evenly distributed throughout the glands. These collections are referred to as sialectases ( Fig. 31-13 ). At this stage, the main duct may appear normal, but the intraglandular ducts may be narrowed or not even evident. Sialectasia typically remains after the administration of a sialogog, which is an indication that contrast agent is pooled extraductally.
As the disease progresses, the collections of contrast agent increase in size (greater than 2 mm in diameter) and are irregular in shape. These pools of contrast agent are termed cavitary sialectases . These larger sialectases are fewer in number and less uniformly distributed throughout the glands than are punctate or globular sialectases ( Fig. 31-14 ). Progressively larger cavities of contrast agent and dilation of the main ductal system may also be present. At the end point of this disorder, complete destruction of the gland occurs. Cavitation and glandular fi brosis are the result of recurrent infl ammation. The dif-ferential diagnosis of this appearance would include chronic bacterial or granulomatous infections and multiple parotid cysts associated with human immunodefi ciency virus (HIV) infection. However, diffuse cervical lymphadenopathy is common in HIV disease and uncommon in Sj ö gren syndrome. Thin-section MRI has been shown to be reliable in depicting sialodochitis and sialectasia, especially when globular changes are present.
Treatment The management of autoimmune disorders of the salivary glands is directed toward relief of symptoms. Underlying systemic rheumatoid conditions are typically treated with anti-infl ammatory agents, corti-costeroids, and immunosuppressive therapeutic agents. Salivary stim-ulants, increased fl uid intake, and artifi cial saliva and tears are symptomatic treatment regimens for the eyes and mouth. More advanced infl ammatory changes may be treated surgically by local or total excision of the symptomatic gland.
NONINFLAMMATORY DISORDERS
Sialadenosis
Synonym
Sialosis
Defi nition Sialadenosis is a nonneoplastic, noninfl ammatory enlargement of pri-marily the parotid salivary glands. It is usually related to metabolic
FIG. 31-12 Lateral view of a sialogram of a parotid gland demonstrat-ing a negative fi ll defect (arrow) representing a noncalcifi ed sialolith and prominent intermittent stricture and dilation of the main and sec-ondary ducts, which is typical of advanced sialodochitis.
Clinical Features Sialectasia or dilation of the ductal system is a prominent sialographic presentation of sialodochitis. It is common in both the submandibular ( Fig. 31-12 ) and parotid glands. If interstitial fi brosis develops, it is apparent in sialograms as a sausage-string appearance of the main duct and its major branches produced by alternate strictures and dila-tions. Recently these changes have been seen with the use of thin-section MRI. Scintigraphy and CT are not typically indicated in the diagnosis of infl ammatory ductal diseases of the salivary glands. They are costly and nonspecifi c and typically do not provide any more useful information than sialography does.
Treatment The management of sialodochitis is similar to that described for sialadenitis.
Autoimmune Sialadenitis
Synonyms Myoepithelial sialadenitis, Sj ö gren syndrome, benign lymphoepithe-lial lesion, Mikulicz disease, sicca syndrome, dacryosialoadenopathia atrophicans, and autoimmune sialosis
Defi nition Autoimmune sialadenitis represents a group of disorders that affect the salivary glands and share an autosensitivity. The range of clinical and histopathologic manifestations suggests that these disorders rep-resent different developmental stages of the same immunologic mech-anisms, differing only in the extent and intensity of tissue reaction. Different forms may share a common etiology.
Clinical Features The clinical manifestations range from recurrent painless swelling of the salivary glands (usually the parotid gland) to a stage that includes enlargement of the lacrimal glands. Glandular swelling may be accom-panied by xerostomia and xerophthalmia (primary Sj ö gren syn-drome), and subsequently by a connective tissue disease such as rheumatoid arthritis, progressive systemic sclerosis, systemic lupus erythematosus, or polymyositis (secondary Sj ö gren syndrome). The
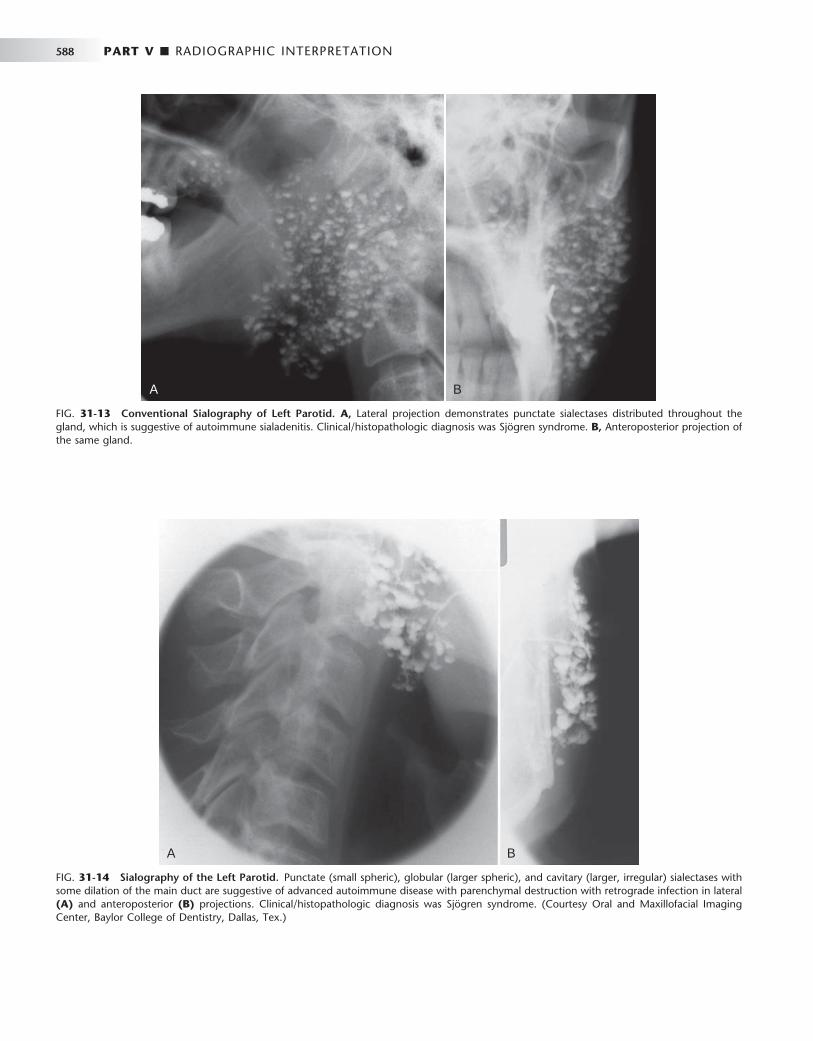
588 PART V ■ RADIOGRAPHIC INTERPRETATION
FIG. 31-14 Sialography of the Left Parotid. Punctate (small spheric), globular (larger spheric), and cavitary (larger, irregular) sialectases with some dilation of the main duct are suggestive of advanced autoimmune disease with parenchymal destruction with retrograde infection in lateral (A) and anteroposterior (B) projections. Clinical/histopathologic diagnosis was Sj ö gren syndrome. (Courtesy Oral and Maxillofacial Imaging Center, Baylor College of Dentistry, Dallas, Tex.)
A BA B
FIG. 31-13 Conventional Sialography of Left Parotid. A, Lateral projection demonstrates punctate sialectases distributed throughout the gland, which is suggestive of autoimmune sialadenitis. Clinical/histopathologic diagnosis was Sj ö gren syndrome. B, Anteroposterior projection of the same gland.
A BA B
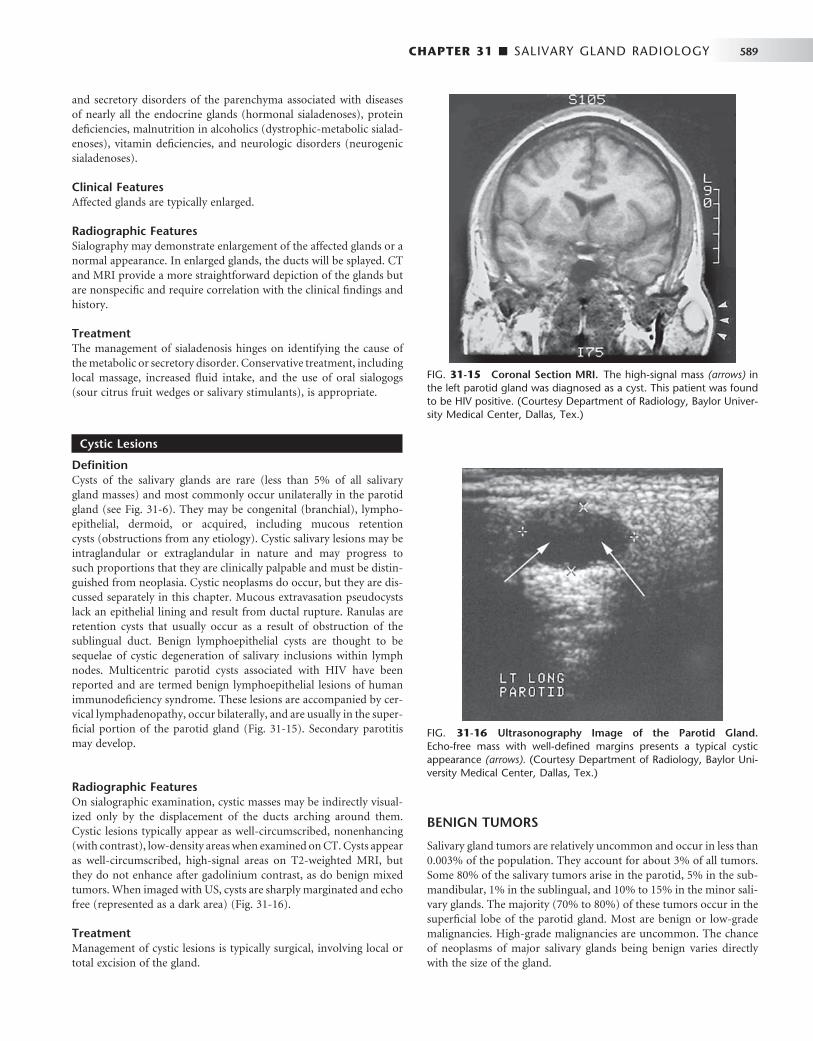
CHAPTER 31 ■ SALIVARY GLAND RADIOLOGY 589
and secretory disorders of the parenchyma associated with diseases of nearly all the endocrine glands (hormonal sialadenoses), protein defi ciencies, malnutrition in alcoholics (dystrophic-metabolic sialad-enoses), vitamin defi ciencies, and neurologic disorders (neurogenic sialadenoses).
Clinical Features Affected glands are typically enlarged.
Radiographic Features Sialography may demonstrate enlargement of the affected glands or a normal appearance. In enlarged glands, the ducts will be splayed. CT and MRI provide a more straightforward depiction of the glands but are nonspecifi c and require correlation with the clinical fi ndings and history.
Treatment The management of sialadenosis hinges on identifying the cause of the metabolic or secretory disorder. Conservative treatment, including local massage, increased fl uid intake, and the use of oral sialogogs (sour citrus fruit wedges or salivary stimulants), is appropriate.
Cystic Lesions
Defi nition Cysts of the salivary glands are rare (less than 5% of all salivary gland masses) and most commonly occur unilaterally in the parotid gland (see Fig. 31-6 ). They may be congenital (branchial), lympho-epithelial, dermoid, or acquired, including mucous retention cysts (obstructions from any etiology). Cystic salivary lesions may be intraglandular or extraglandular in nature and may progress to such proportions that they are clinically palpable and must be distin-guished from neoplasia. Cystic neoplasms do occur, but they are dis-cussed separately in this chapter. Mucous extravasation pseudocysts lack an epithelial lining and result from ductal rupture. Ranulas are retention cysts that usually occur as a result of obstruction of the sublingual duct. Benign lymphoepithelial cysts are thought to be sequelae of cystic degeneration of salivary inclusions within lymph nodes. Multicentric parotid cysts associated with HIV have been reported and are termed benign lymphoepithelial lesions of human immunodefi ciency syndrome. These lesions are accompanied by cer-vical lymphadenopathy, occur bilaterally, and are usually in the super-fi cial portion of the parotid gland ( Fig. 31-15 ). Secondary parotitis may develop.
Radiographic Features On sialographic examination, cystic masses may be indirectly visual-ized only by the displacement of the ducts arching around them. Cystic lesions typically appear as well-circumscribed, nonenhancing (with contrast), low-density areas when examined on CT. Cysts appear as well-circumscribed, high-signal areas on T2-weighted MRI, but they do not enhance after gadolinium contrast, as do benign mixed tumors. When imaged with US, cysts are sharply marginated and echo free (represented as a dark area) ( Fig. 31-16 ).
Treatment Management of cystic lesions is typically surgical, involving local or total excision of the gland.
BENIGN TUMORS
Salivary gland tumors are relatively uncommon and occur in less than 0.003% of the population. They account for about 3% of all tumors. Some 80% of the salivary tumors arise in the parotid, 5% in the sub-mandibular, 1% in the sublingual, and 10% to 15% in the minor sali-vary glands. The majority (70% to 80%) of these tumors occur in the superfi cial lobe of the parotid gland. Most are benign or low-grade malignancies. High-grade malignancies are uncommon. The chance of neoplasms of major salivary glands being benign varies directly with the size of the gland.
FIG. 31-15 Coronal Section MRI. The high-signal mass (arrows) in the left parotid gland was diagnosed as a cyst. This patient was found to be HIV positive. (Courtesy Department of Radiology, Baylor Univer-sity Medical Center, Dallas, Tex.)
FIG. 31-16 Ultrasonography Image of the Parotid Gland. Echo-free mass with well-defi ned margins presents a typical cystic appearance (arrows). (Courtesy Department of Radiology, Baylor Uni-versity Medical Center, Dallas, Tex.)
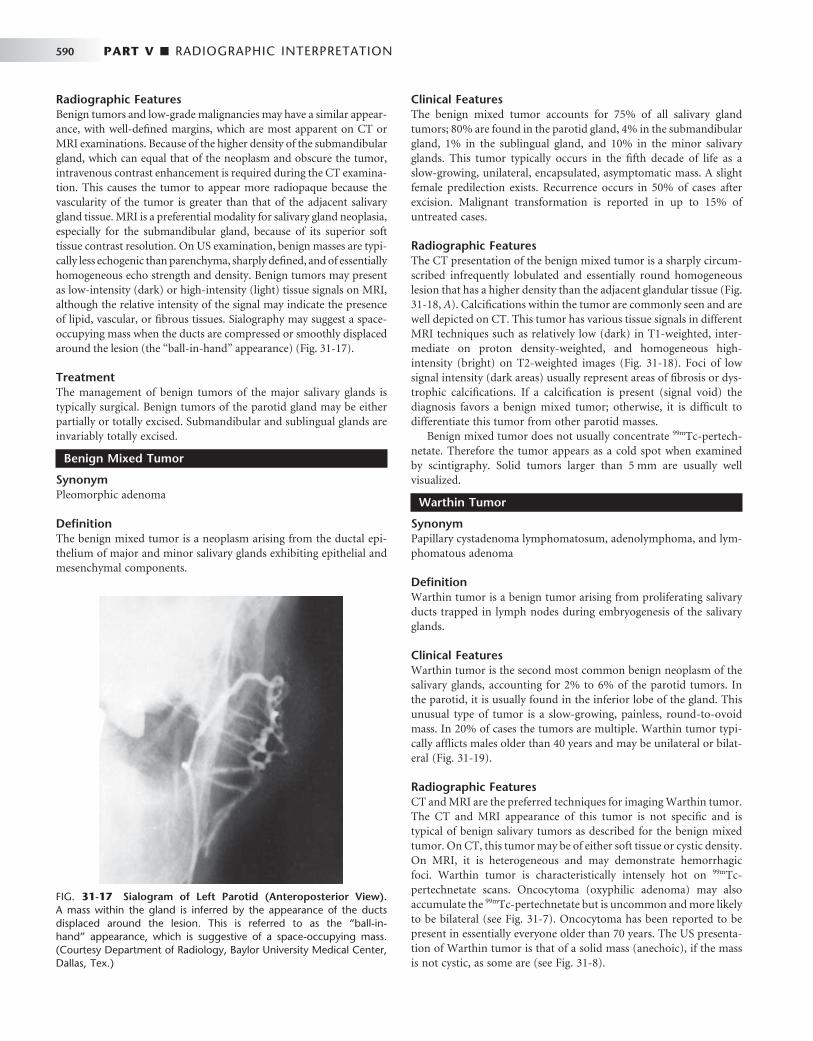
590 PART V ■ RADIOGRAPHIC INTERPRETATION
Radiographic Features Benign tumors and low-grade malignancies may have a similar appear-ance, with well-defi ned margins, which are most apparent on CT or MRI examinations. Because of the higher density of the submandibular gland, which can equal that of the neoplasm and obscure the tumor, intravenous contrast enhancement is required during the CT examina-tion. This causes the tumor to appear more radiopaque because the vascularity of the tumor is greater than that of the adjacent salivary gland tissue. MRI is a preferential modality for salivary gland neoplasia, especially for the submandibular gland, because of its superior soft tissue contrast resolution. On US examination, benign masses are typi-cally less echogenic than parenchyma, sharply defi ned, and of essentially homogeneous echo strength and density. Benign tumors may present as low-intensity (dark) or high-intensity (light) tissue signals on MRI, although the relative intensity of the signal may indicate the presence of lipid, vascular, or fi brous tissues. Sialography may suggest a space-occupying mass when the ducts are compressed or smoothly displaced around the lesion (the “ ball-in-hand ” appearance) ( Fig. 31-17 ).
Treatment The management of benign tumors of the major salivary glands is typically surgical. Benign tumors of the parotid gland may be either partially or totally excised. Submandibular and sublingual glands are invariably totally excised.
Benign Mixed Tumor
Synonym Pleomorphic adenoma
Defi nition The benign mixed tumor is a neoplasm arising from the ductal epi-thelium of major and minor salivary glands exhibiting epithelial and mesenchymal components.
Clinical Features The benign mixed tumor accounts for 75% of all salivary gland tumors; 80% are found in the parotid gland, 4% in the submandibular gland, 1% in the sublingual gland, and 10% in the minor salivary glands. This tumor typically occurs in the fi fth decade of life as a slow-growing, unilateral, encapsulated, asymptomatic mass. A slight female predilection exists. Recurrence occurs in 50% of cases after excision. Malignant transformation is reported in up to 15% of untreated cases.
Radiographic Features The CT presentation of the benign mixed tumor is a sharply circum-scribed infrequently lobulated and essentially round homogeneous lesion that has a higher density than the adjacent glandular tissue ( Fig. 31-18, A ). Calcifi cations within the tumor are commonly seen and are well depicted on CT. This tumor has various tissue signals in different MRI techniques such as relatively low (dark) in T1-weighted, inter-mediate on proton density-weighted, and homogeneous high-intensity (bright) on T2-weighted images ( Fig. 31-18 ). Foci of low signal intensity (dark areas) usually represent areas of fi brosis or dys-trophic calcifi cations. If a calcifi cation is present (signal void) the diagnosis favors a benign mixed tumor; otherwise, it is diffi cult to differentiate this tumor from other parotid masses.
Benign mixed tumor does not usually concentrate 99m Tc-pertech-netate. Therefore the tumor appears as a cold spot when examined by scintigraphy. Solid tumors larger than 5 mm are usually well visualized.
Warthin Tumor
Synonym Papillary cystadenoma lymphomatosum, adenolymphoma, and lym-phomatous adenoma
Defi nition Warthin tumor is a benign tumor arising from proliferating salivary ducts trapped in lymph nodes during embryogenesis of the salivary glands.
Clinical Features Warthin tumor is the second most common benign neoplasm of the salivary glands, accounting for 2% to 6% of the parotid tumors. In the parotid, it is usually found in the inferior lobe of the gland. This unusual type of tumor is a slow-growing, painless, round-to-ovoid mass. In 20% of cases the tumors are multiple. Warthin tumor typi-cally affl icts males older than 40 years and may be unilateral or bilat-eral ( Fig. 31-19 ).
Radiographic Features CT and MRI are the preferred techniques for imaging Warthin tumor. The CT and MRI appearance of this tumor is not specifi c and is typical of benign salivary tumors as described for the benign mixed tumor. On CT, this tumor may be of either soft tissue or cystic density. On MRI, it is heterogeneous and may demonstrate hemorrhagic foci. Warthin tumor is characteristically intensely hot on 99m Tc-pertechnetate scans. Oncocytoma (oxyphilic adenoma) may also accumulate the 99m Tc-pertechnetate but is uncommon and more likely to be bilateral (see Fig. 31-7 ). Oncocytoma has been reported to be present in essentially everyone older than 70 years. The US presenta-tion of Warthin tumor is that of a solid mass (anechoic), if the mass is not cystic, as some are (see Fig. 31-8 ).
FIG. 31-17 Sialogram of Left Parotid (Anteroposterior View). A mass within the gland is inferred by the appearance of the ducts displaced around the lesion. This is referred to as the “ ball-in-hand ” appearance, which is suggestive of a space-occupying mass. (Courtesy Department of Radiology, Baylor University Medical Center, Dallas, Tex.)
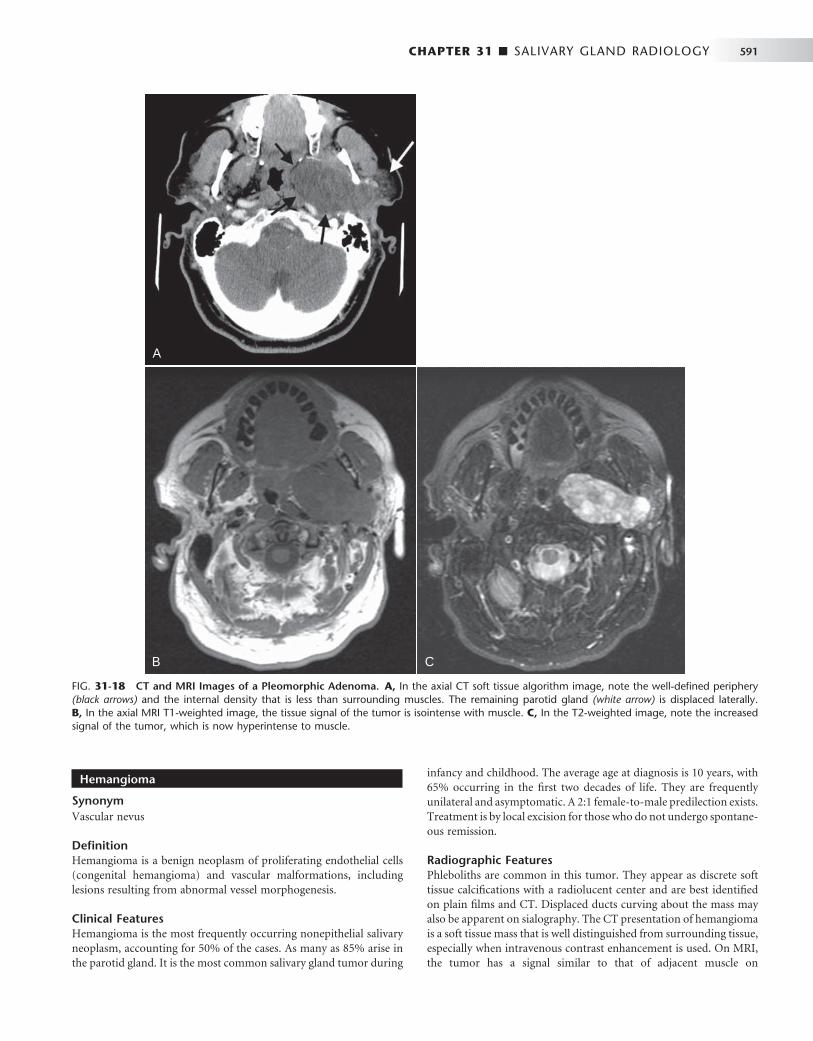
CHAPTER 31 ■ SALIVARY GLAND RADIOLOGY 591
Hemangioma
Synonym Vascular nevus
Defi nition Hemangioma is a benign neoplasm of proliferating endothelial cells (congenital hemangioma) and vascular malformations, including lesions resulting from abnormal vessel morphogenesis.
Clinical Features Hemangioma is the most frequently occurring nonepithelial salivary neoplasm, accounting for 50% of the cases. As many as 85% arise in the parotid gland. It is the most common salivary gland tumor during
infancy and childhood. The average age at diagnosis is 10 years, with 65% occurring in the fi rst two decades of life. They are frequently unilateral and asymptomatic. A 2:1 female-to-male predilection exists. Treatment is by local excision for those who do not undergo spontane-ous remission.
Radiographic Features Phleboliths are common in this tumor. They appear as discrete soft tissue calcifi cations with a radiolucent center and are best identifi ed on plain fi lms and CT. Displaced ducts curving about the mass may also be apparent on sialography. The CT presentation of hemangioma is a soft tissue mass that is well distinguished from surrounding tissue, especially when intravenous contrast enhancement is used. On MRI, the tumor has a signal similar to that of adjacent muscle on
FIG. 31-18 CT and MRI Images of a Pleomorphic Adenoma. A, In the axial CT soft tissue algorithm image, note the well-defi ned periphery (black arrows) and the internal density that is less than surrounding muscles. The remaining parotid gland (white arrow) is displaced laterally. B, In the axial MRI T1-weighted image, the tissue signal of the tumor is isointense with muscle. C, In the T2-weighted image, note the increased signal of the tumor, which is now hyperintense to muscle.
A
B C
A
B C
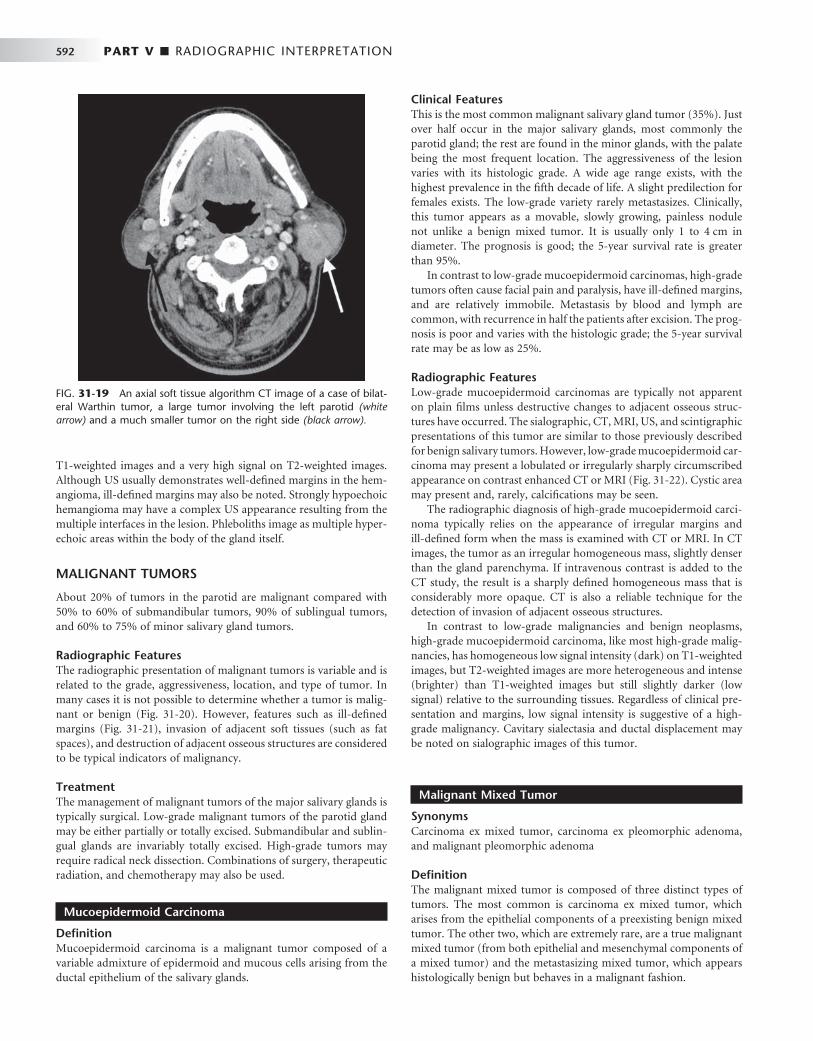
592 PART V ■ RADIOGRAPHIC INTERPRETATION
T1-weighted images and a very high signal on T2-weighted images. Although US usually demonstrates well-defi ned margins in the hem-angioma, ill-defi ned margins may also be noted. Strongly hypoechoic hemangioma may have a complex US appearance resulting from the multiple interfaces in the lesion. Phleboliths image as multiple hyper-echoic areas within the body of the gland itself.
MALIGNANT TUMORS
About 20% of tumors in the parotid are malignant compared with 50% to 60% of submandibular tumors, 90% of sublingual tumors, and 60% to 75% of minor salivary gland tumors.
Radiographic Features The radiographic presentation of malignant tumors is variable and is related to the grade, aggressiveness, location, and type of tumor. In many cases it is not possible to determine whether a tumor is malig-nant or benign ( Fig. 31-20 ). However, features such as ill-defi ned margins ( Fig. 31-21 ), invasion of adjacent soft tissues (such as fat spaces), and destruction of adjacent osseous structures are considered to be typical indicators of malignancy.
Treatment The management of malignant tumors of the major salivary glands is typically surgical. Low-grade malignant tumors of the parotid gland may be either partially or totally excised. Submandibular and sublin-gual glands are invariably totally excised. High-grade tumors may require radical neck dissection. Combinations of surgery, therapeutic radiation, and chemotherapy may also be used.
Mucoepidermoid Carcinoma
Defi nition Mucoepidermoid carcinoma is a malignant tumor composed of a variable admixture of epidermoid and mucous cells arising from the ductal epithelium of the salivary glands.
Clinical Features This is the most common malignant salivary gland tumor (35%). Just over half occur in the major salivary glands, most commonly the parotid gland; the rest are found in the minor glands, with the palate being the most frequent location. The aggressiveness of the lesion varies with its histologic grade. A wide age range exists, with the highest prevalence in the fi fth decade of life. A slight predilection for females exists. The low-grade variety rarely metastasizes. Clinically, this tumor appears as a movable, slowly growing, painless nodule not unlike a benign mixed tumor. It is usually only 1 to 4 cm in diameter. The prognosis is good; the 5-year survival rate is greater than 95%.
In contrast to low-grade mucoepidermoid carcinomas, high-grade tumors often cause facial pain and paralysis, have ill-defi ned margins, and are relatively immobile. Metastasis by blood and lymph are common, with recurrence in half the patients after excision. The prog-nosis is poor and varies with the histologic grade; the 5-year survival rate may be as low as 25%.
Radiographic Features Low-grade mucoepidermoid carcinomas are typically not apparent on plain fi lms unless destructive changes to adjacent osseous struc-tures have occurred. The sialographic, CT, MRI, US, and scintigraphic presentations of this tumor are similar to those previously described for benign salivary tumors. However, low-grade mucoepidermoid car-cinoma may present a lobulated or irregularly sharply circumscribed appearance on contrast enhanced CT or MRI ( Fig. 31-22 ). Cystic area may present and, rarely, calcifi cations may be seen.
The radiographic diagnosis of high-grade mucoepidermoid carci-noma typically relies on the appearance of irregular margins and ill-defi ned form when the mass is examined with CT or MRI. In CT images, the tumor as an irregular homogeneous mass, slightly denser than the gland parenchyma. If intravenous contrast is added to the CT study, the result is a sharply defi ned homogeneous mass that is considerably more opaque. CT is also a reliable technique for the detection of invasion of adjacent osseous structures.
In contrast to low-grade malignancies and benign neoplasms, high-grade mucoepidermoid carcinoma, like most high-grade malig-nancies, has homogeneous low signal intensity (dark) on T1-weighted images, but T2-weighted images are more heterogeneous and intense (brighter) than T1-weighted images but still slightly darker (low signal) relative to the surrounding tissues. Regardless of clinical pre-sentation and margins, low signal intensity is suggestive of a high-grade malignancy. Cavitary sialectasia and ductal displacement may be noted on sialographic images of this tumor.
Malignant Mixed Tumor
Synonyms Carcinoma ex mixed tumor, carcinoma ex pleomorphic adenoma, and malignant pleomorphic adenoma
Defi nition The malignant mixed tumor is composed of three distinct types of tumors. The most common is carcinoma ex mixed tumor, which arises from the epithelial components of a preexisting benign mixed tumor. The other two, which are extremely rare, are a true malignant mixed tumor (from both epithelial and mesenchymal components of a mixed tumor) and the metastasizing mixed tumor, which appears histologically benign but behaves in a malignant fashion.
FIG. 31-19 An axial soft tissue algorithm CT image of a case of bilat-eral Warthin tumor, a large tumor involving the left parotid (white arrow) and a much smaller tumor on the right side (black arrow).
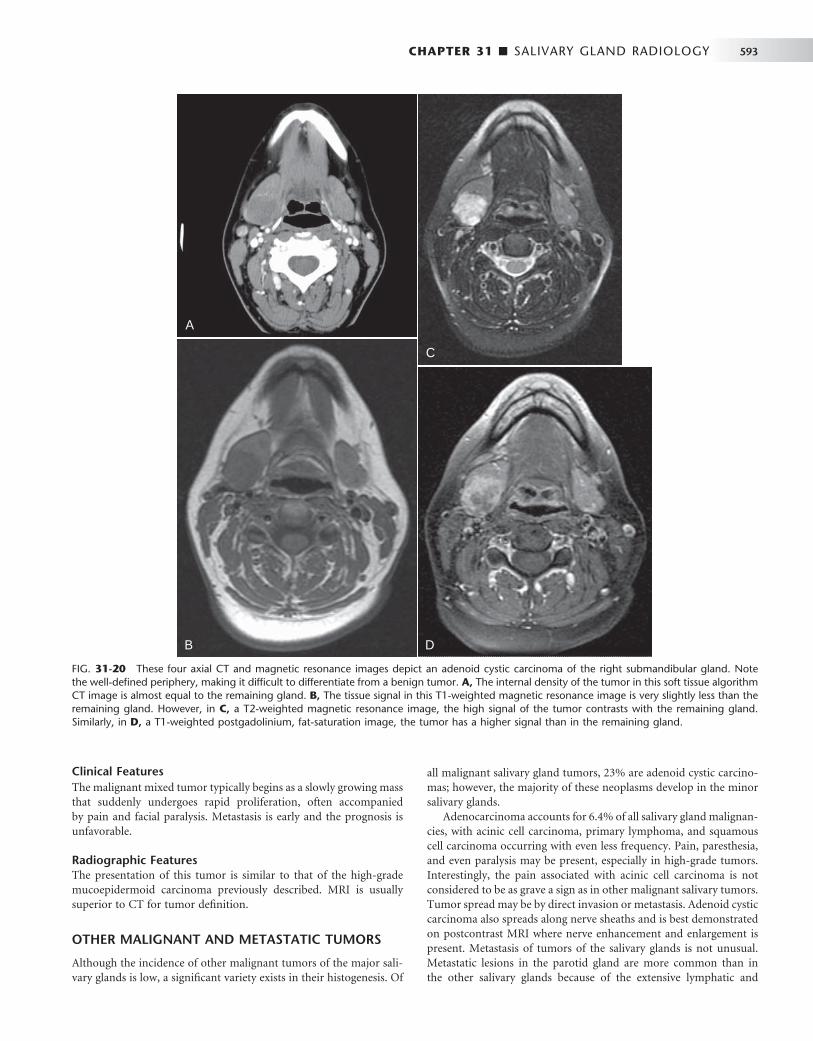
CHAPTER 31 ■ SALIVARY GLAND RADIOLOGY 593
Clinical Features The malignant mixed tumor typically begins as a slowly growing mass that suddenly undergoes rapid proliferation, often accompanied by pain and facial paralysis. Metastasis is early and the prognosis is unfavorable.
Radiographic Features The presentation of this tumor is similar to that of the high-grade mucoepidermoid carcinoma previously described. MRI is usually superior to CT for tumor defi nition.
OTHER MALIGNANT AND METASTATIC TUMORS
Although the incidence of other malignant tumors of the major sali-vary glands is low, a signifi cant variety exists in their histogenesis. Of
all malignant salivary gland tumors, 23% are adenoid cystic carcino-mas; however, the majority of these neoplasms develop in the minor salivary glands.
Adenocarcinoma accounts for 6.4% of all salivary gland malignan-cies, with acinic cell carcinoma, primary lymphoma, and squamous cell carcinoma occurring with even less frequency. Pain, paresthesia, and even paralysis may be present, especially in high-grade tumors. Interestingly, the pain associated with acinic cell carcinoma is not considered to be as grave a sign as in other malignant salivary tumors. Tumor spread may be by direct invasion or metastasis. Adenoid cystic carcinoma also spreads along nerve sheaths and is best demonstrated on postcontrast MRI where nerve enhancement and enlargement is present. Metastasis of tumors of the salivary glands is not unusual. Metastatic lesions in the parotid gland are more common than in the other salivary glands because of the extensive lymphatic and
FIG. 31-20 These four axial CT and magnetic resonance images depict an adenoid cystic carcinoma of the right submandibular gland. Note the well-defi ned periphery, making it diffi cult to differentiate from a benign tumor. A, The internal density of the tumor in this soft tissue algorithm CT image is almost equal to the remaining gland. B, The tissue signal in this T1-weighted magnetic resonance image is very slightly less than the remaining gland. However, in C, a T2-weighted magnetic resonance image, the high signal of the tumor contrasts with the remaining gland. Similarly, in D, a T1-weighted postgadolinium, fat-saturation image, the tumor has a higher signal than in the remaining gland.
A
B
C
D
A
B
C
D

594 PART V ■ RADIOGRAPHIC INTERPRETATION
circulatory components of the parotid gland. Most metastatic lesions of the parotid gland occur through the lymphatic system and include squamous cell carcinoma, lymphoma, and melanoma. Although con-siderably fewer lesions are the result of hematogenous dissemination, metastasis from the lung, breast, kidney, and gastrointestinal tract has been reported.
Radiographic Features The presentation of these tumors is nonspecifi c and similar to that of the high-grade mucoepidermoid carcinoma previously described. US may demonstrate echo-free cystic areas in adenoid cystic carcinomas ( Fig. 31-23 ).
SUGGESTED READINGS Del Balso AM , Ellis GE , Hartman KS et al : Diagnostic imaging of the
salivary glands and periglandular regions . In Del Balso AM , editor: Maxillofacial imaging , Philadelphia , 1990 , WB Saunders .
Freling NJM : Imaging of salivary gland disease , Semin Roentgenol 35 : 12 - 20 , 2000 .
Harnsberger HR , Hudgins PA , Wiggins RW III et al : Pocket radiologist, head and neck 100 top diagnoses , Salt Lake City , 2002 , Amirsys .
Harnsberger HR , Hudgins R , Wiggins P et al : Diagnostic imaging head and neck , Salt Lake City , 2004 , Amirsys .
Lufkin RB , Hanafee WN : MRI of the head and neck , New York , 1992 , Raven Press .
Rabinov K , Weber AL : Radiology of the salivary glands , Boston , 1985 , GK Hall Medical Publishers .
Rankow RM , Polayes IM : Diseases of the salivary glands , Philadelphia , 1976 , WB Saunders .
Rice DH , Becker TS : The salivary glands . In Hanafee WN , Ward PH , editors: Clinical correlations in the head and neck , vol 2 , New York , 1994 , Thieme Medical Publishers .
Seifert G , Miehlke A , Hanbrich J et al : Diseases of the salivary glands , Stuttgart, Germany , 1986 , George Thieme Verlag .
Van den Akker HP : Diagnostic imaging in salivary gland disease , Oral Surg 66 : 625 - 637 , 1988 .
Watson MG : Investigation of salivary gland disease , Ear Nose Throat J 68 : 84 , 87 - 93 , 1989 .
PLAIN FILM RADIOGRAPHY
Ollerenshaw R , Ross SS : Radiological diagnosis of salivary gland disease , Br J Radiol 24 : 538 - 548 , 1951 .
Silvers AR , Som PM : Salivary glands , Radiol Clin North Am 36 : 941 - 966 , 1998 .
FIG. 31-22 Contrast-enhanced axial soft tissue algorithm CT image demonstrating a mass in right parotid gland with a poorly marginated, heterogeneous, slightly lobulated appearance (white arrows). Poorly defi ned margins suggest a low-grade malignancy rather than a benign tumor, although the CT appearance of both is similar. Histo-pathologic diagnosis was low-grade mucoepidermoid carcinoma. (Courtesy Department of Radiology, Baylor University Medical Center, Dallas, Tex.)
FIG. 31-23 Ultrasonography. The mass in the submandibular gland (arrows) demonstrates a heterogeneous hypoechoic pattern compared with the adjacent tissue. The histopathologic diagnosis was adenoid cystic carcinoma. (Courtesy Department of Radiology, Baylor University Medical Center, Dallas, Tex.)
FIG. 31-21 This axial soft tissue algorithm CT image reveals an ade-nocarcinoma of the left parotid gland. Almost all the gland has been replaced by this ill-defi ned tumor that has some peripheral enhance-ment and lower density internal structure, likely representing necrotic regions.

CHAPTER 31 ■ SALIVARY GLAND RADIOLOGY 595
Weissman JL : Imaging of the salivary glands , Semin Ultrasound CT MR 16 : 546 - 568 , 1995 .
Yousem DM , Kraut MA , Chalian AA : Major salivary gland imaging , Radiology 216 : 19 - 29 , 2000 .
CONVENTIONAL SIALOGRAPHY
Drag NA , Brown JE , Wilson RF : Pain and swelling after sialography: is it a signifi cant problem? Oral Surg Oral Med Oral Pathol Oral Radiol Endod 90 : 385 - 388 , 2000 .
Eisenbud L , Cranin N : The role of sialography in the diagnosis and therapy of chronic obstructive sialadenitis , Oral Surg Oral Med Oral Pathol 16 : 1181 - 1199 , 1963 .
Kalk WW , Vissink A , Spijkervet HK et al : Parotid sialography for diagnosing Sj ö gren syndrome , Oral Surg Oral Med Oral Pathol Oral Radiol Endod 94 : 131 - 137 , 2002 .
Manashil GB : Clinical sialography , Springfi eld , 1978 , Charles C Thomas . Whaley K , Blair S , Low PS et al : Sialographic abnormalities in Sj ö gren ’ s
syndrome, rheumatoid arthritis, and other arthritides and connective tissue diseases: a clinical and radiological investigation using hydrostatic sialography , Clin Radiol 23 : 474 - 482 , 1972 .
Varghese JC , Thornton F , Lucey BC et al : A prospective comparative study of MR sialography and conventional sialography of salivary duct disease , AJR Am J Roentgenol 173 : 1497 - 1503 , 1999 .
Yune HY , Klatte EC : Current status of sialography , Am J Roentgenol Radiumt Ther Nucl Med 115 : 420 - 428 , 1972 .
COMPUTED TOMOGRAPHY OF THE MAJOR SALIVARY GLANDS
Bryan RN , Miller RH , Ferreyro RI et al : Computed tomography of the major salivary glands , AJR Am J Roentgenol 139 : 547 - 554 , 1982 .
Casselman JW , Mancuso AA : Major salivary gland masses: comparison of MR imaging and CT , Radiology 165 : 183 - 189 , 1987 .
Kosaka M , Kamiishi H : New strategy for the diagnosis of parotid gland lesions utilizing three-dimensional sialography , Comput Aided Surg 5 : 42 - 45 , 2000 .
Lloyd RE , Ho KH : Combined CT scanning and sialography in the management of parotid tumors , Oral Surg Oral Med Oral Pathol 65 : 142 - 144 , 1988 .
MAGNETIC RESONANCE IMAGING OF THE MAJOR SALIVARY GLANDS
Browne RFJ , Golding SJ , Watt-Smith SR : The role of MRI in facial swelling due to presumed salivary gland disease , Br J Radiol 74 : 127 - 133 , 2001 .
J ä ger L , Menauer F , Holzknecht N et al : MR sialography of the submandibular duct — an alternative to conventional sialography and US? Radiology 216 : 665 - 671 , 2000 .
Jungehulsing M , Fischbach R , Schroder U et al : Magnetic resonance sialography , Otolaryngol Head Neck Surg 121 : 488 - 494 , 1999 .
Kaneda T , Minami M , Ozawa K et al : MR of the submandibular gland: normal and pathologic states , AJNR Am J Neuroradiol 17 : 1575 - 1581 , 1996 .
Mandelblatt S , Braun IF , Davis PC et al : Parotid masses: MR imaging , Radiology 163 : 411 - 414 , 1987 .
Som PM , Biller HF : High-grade malignancies of the parotid gland; identifi cation with MR imaging , Radiology 173 : 823 - 826 , 1989 .
Swartz JD , Rothman MI , Marlowe FI et al : MR imaging of parotid mass lesions: attempts at histopathologic differentiation , J Comput Assist Tomogr 13 : 789 - 796 , 1989 .
NUCLEAR MEDICINE (SCINTIGRAPHY) OF THE MAJOR SALIVARY GLANDS
Chaudhuri TK , Stadalnik RC : Salivary gland imaging , Semin Nucl Med 10 : 400 - 401 , 1980 .
Garcia RR : Differential diagnosis of tumors of the salivary glands with radioactive isotopes , Int J Oral Surg 3 : 330 - 334 , 1974 .
Greyson ND , Noyek AM : Radionuclide salivary scanning , J Otolaryngol Suppl 10 : 1 - 47 , 1982 .
Keyes JW Jr , Harkness BA , Greven KM et al : Salivary gland tumors: pretherapy evaluation with PET , Radiology 192 : 99 - 102 , 1994 .
Mishkin FS : Radionuclide salivary gland imaging , Semin Nucl Med 11 : 258 - 265 , 1981 .
Van den Akker HP , Busemann-Sokole E : Absolute indications for salivary gland scintigraphy with 99m Tc-pertechnetate , Oral Surg 60 : 440 - 447 , 1985 .
ULTRASONOGRAPHY OF THE MAJOR SALIVARY GLANDS
Gooding GAW : Gray scale ultrasound of the parotid gland , AJR Am J Roentgenol 134 : 469 - 472 , 1980 .
Gritzmann G : Sonography of the salivary glands , AJR Am J Roentgenol 153 : 161 - 166 , 1989 .
Mandel LK. Ultrasound fi ndings in HIV-positive patients with parotid swellings , J Oral Maxillofac Surg 59 : 283 - 286 , 2001 .
Martinoli C , Derchi LE , Solbiati L et al : Color doppler sonography of salivary glands , AJR Am J Roentgenol 163 : 933 - 941 , 1994 .
Rothberg R , Noyek AM , Goldfi nger M et al : Diagnostic ultrasound imaging of parotid disease-a contemporary clinical perspective , J Otolaryngol 13 : 232 - 240 , 1984 .
Shimizu M , Ussm ü ller J , Donath K et al : Sonographic analysis of recurrent parotitis in children: a comparative study with sialographic fi ndings , Oral Surg Oral Med Oral Pathol Oral Radiol Endod 86 : 606 - 615 , 1998 .
OBSTRUCTIVE AND INFLAMMATORY DISORDERS
Aung W , Yamada I , Umehara I et al : Sj ö gren ’ s syndrome: comparison of assessments with quantitative salivary gland scintigraphy and contrast sialography , J Nucl Med 41 : 257 - 262 , 2000 .
Brook I : Acute bacterial suppurative parotitis: microbiology and management , J Craniofac Surg 14 : 37 - 40 , 2003 .
Gonzales L , Mackenzie AH , Tarar RA : Parotid sialography in Sj ö gren ’ s syndrome , Radiology 97 : 91 - 93 , 1970 .
Hughes M , Carson K , Hill J : Scintigraphic evaluation of sialadenitis , Br J Radiol 67 : 328 - 331 , 1994 .
Kassan SS , Moutsopoulos HM : Clinical manifestations and early diagnosis of Sj ö gren syndrome , Arch Intern Med 164 : 1275 - 1284 , 2004 .
Langlais RP , Kasle MJ : Sialolithiasis: the radiolucent stones , Oral Surg Oral Med Oral Pathol 40 : 686 - 690 , 1975 .
Lemon SI , Imbesi SG , Shikhman AR : Salivary gland imaging in Sj ö gren syndrome , Future Rheumatol 2 : 83 - 92 , 2007 .
Scully C : Sj ö gren ’ s syndrome: clinical and laboratory features, immunopathogenesis, and management , Oral Surg Oral Med Oral Pathol 62 : 510 - 523 , 1986 .
Som PM , Shugar JM , Train JS et al : Manifestations of parotid gland enlargement: radiographic, pathologic, and clinical correlation — part 1, the autoimmune pseudosialectasias , Radiology 141 : 415 - 419 , 1981 .
Yamamoto Y , Harada S , Ohara , M et al : Clinical and pathological differences between Mikulicz ’ s disease and Sj ö gren ’ s syndrome , Rheumatology (Oxford) 44 : 227 - 234 , 2005 .
NONINFLAMMATORY DISORDERS
Chilla R : Sialadenosis of the salivary glands of the head. Studies on the physiology and pathophysiology of parotid secretion , Adv Otorhinolaryngol 26 : 1 - 38 , 1981 .
CYSTS AND NEOPLASMS
Boahene DKO , Olsen KD , Lewis JE et al : Mucoepidermoid carcinoma of the parotid gland — the Mayo Clinic experience , Arch Otolaryngol Head Neck Surg 130 : 849 - 856 , 2004 .
Boles R , Raines J , Lebovits M et al : Malignant tumors of salivary glands: a university experience , Laryngoscope 90 : 729 - 736 , 1980 .
Byrne MN , Spector JG , Garvin CF et al : Preoperative assessment of parotid masses: a comparative evaluation of radiographic techniques to histologic diagnosis , Laryngoscope 99 : 284 - 292 , 1989 .

596 PART V ■ RADIOGRAPHIC INTERPRETATION
Day TA , Deveikis J , Gillespie MB et al : Salivary gland neoplasms , Curr Treat Options Oncol 5 : 11 - 26 , 2004 .
Del Balso AM , Williams E , Tane TT : Parotid masses: current modes of diagnostic imaging , Oral Surg 54 : 360 - 364 , 1982 .
Eneroth CM : Salivary gland tumors in the parotid gland and the palate region , Cancer 27 : 1415 - 1418 , 1971 .
Gottesman RI , Som PM , Mester J et al : Observations on two cases of apparent submandibular gland cysts in HIV positive patients: MR and CT fi ndings , J Comput Assist Tomogr 20 : 444 - 447 , 1996 .
Mirich DR , McArdle CB , Kulkarni MV : Benign pleomorphic adenomas of the salivary glands: surface coil MR imaging versus CT , J Comput Assist Tomogr 11 : 620 - 623 , 1987 .
Thawley SE , Panbje WR : Comprehensive management of head and neck tumors , Philadelphia , 1987 , WB Saunders .
Tsai SC , Hsu HT : Parotid neoplasms: diagnosis, treatment, and intraparotid facial nerve anatomy , J Laryngol Otol 116 : 359 - 362 , 2002 .

CHAPTER 32 ■ DENTAL IMPLANTS 597
C H A P T E R 3 2
Dental Implants
Byron W. Benson • Vivek Shetty
Few advances in dentistry have been as remarkable as the use of dental implants ( Fig. 32-1 ) to restore orofacial form and func-tion. Implant technology has enabled the dentist to help affected
patients regain the ability to chew normally and function without embarrassment. With the application of precise surgical and prosth-odontic techniques, implant-facilitated restorations allow for a very predictable prosthodontic successful rehabilitation of a broad spec-trum of patients with very challenging needs. The predictable results of contemporary implant systems derive, in part, from increasingly sophisticated imaging techniques used in all phases of implant treat-ment. These imaging modalities contribute information for every stage of the treatment, extending from presurgical diagnosis and treatment planning through surgical placement and postoperative assessment of the implant, to the prosthetic restoration and long-term surveillance phase.
Acceptance of dental implantology as an integral part of conven-tional practice makes it necessary for the general dentist to be knowl-edgeable of implant imaging techniques and their clinical application. With the exception of the occasional subperiosteal, blade, and trans-osteal implant systems ( Figs. 32-2 and 32-3 ), dental implants used today are almost exclusively root-form devices (see Fig. 32-1 ) embed-ded within the jaw bone (endosseous implants). The focus of this chapter is not only to provide information regarding the various imaging technologies available but also their specifi c application and the potential information that each can provide to facilitate the place-ment of endosseous implant restorations.
Diagnostic Imaging for Dental Implants
Basic imaging, such as panoramic and periapical radiographs, are generally useful and cost-effective but do not provide the cross-sectional visualization or interactive image analysis that can be obtained with more sophisticated imaging techniques. The various imaging techniques can be applied to various phases of the surgical and restorative procedures ( Table 32-1 ). The selection of a specifi c imaging technique should be based on the technique best suited to provide the information required by the implant team — the restor-ative dentist, surgeon, and radiologist ( Table 32-2 ).
Imaging Techniques
The ideal imaging technique for dental implant care should have several essential characteristics, including the ability to visualize the implant site in the mesiodistal, facial-lingual, and superoinferior
dimensions; the ability to allow reliable, accurate measurements; a capacity to evaluate trabecular bone density and cortical thickness; a capacity to correlate the imaged site with the clinical site; reasonable access and cost to the patient; and minimal radiation risk. Usually a combination of radiographic techniques is used. Available radiographic techniques include intraoral radiography (fi lm and digital), cephalometric radiography, panoramic radiography, and conventional tomography, as well as cone-beam and multidetector computed tomography (CBCT, MDCT). The following is a review of these imaging techniques as applied to dental implant case management.
INTRAORAL RADIOGRAPHY
Intraoral images may be acquired on analog fi lm or as digital images. Periapical and occlusal radiographic fi lms provide images with supe-rior resolution and sharpness. Periapical radiographs commonly are used to evaluate the status of adjoining teeth and remaining alveolar bone in the mesiodistal dimension. They also have been used for determining vertical height, architecture, and bone quality (bone density, amount of cortical bone, and amount of trabecular bone). Although readily available and relatively inexpensive, periapical radi-ography has geometric and anatomic limitations. Periapical radio-graphs, made on a dentate arch, typically are made with the paralleling technique, creating an image with minimal foreshortening and elon-gation ( Fig. 32-4 ). Because of variations in the morphology of the residual edentulous alveolar ridge ( Fig 32-5 ), the ridge may not have the same “ long axis ” as a tooth. Thus the position of the image recep-tor may not result in an accurate display of the height of the alveolar ridge as a result of image foreshortening and elongation. Also, it fre-quently is not possible to place the image receptor either superior or inferior enough to capture an image of the entire maxillary or man-dibular ridge. It is reported that 25% of mandibular periapical radio-graphs do not demonstrate the mandibular canal. In cases when the canal was identifi able, only 53% of measurements from the alveolar crest to the superior wall of the mandibular canal were accurate within 1 mm.
Because periapical radiographs are unable to provide any cross-sectional information, occlusal radiographs are used on occasion to determine the facial-lingual dimensions of the mandibular alveolar ridge. Although somewhat useful, the occlusal image records only the widest portion of the mandible, which typically is located inferior to the alveolar ridge. This may give the clinician the impression that more bone is available in the cross-sectional (facial-lingual)
597
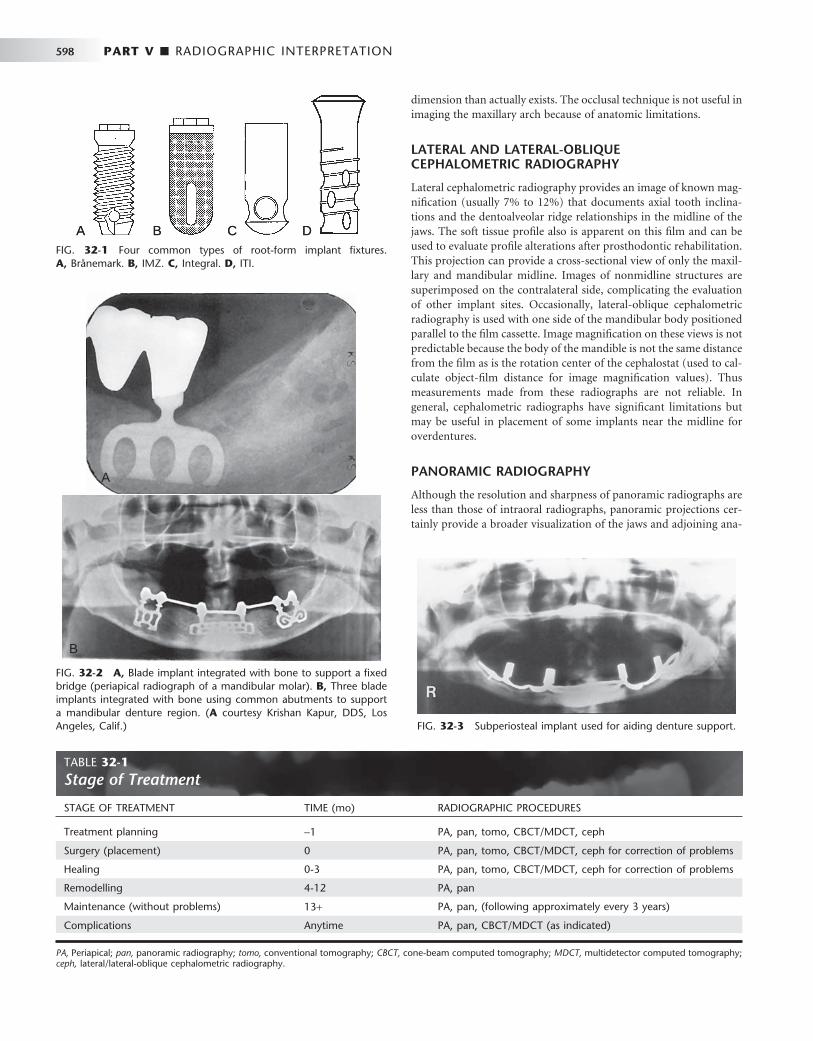
598 PART V ■ RADIOGRAPHIC INTERPRETATION
FIG. 32-3 Subperiosteal implant used for aiding denture support.
FIG. 32-1 Four common types of root-form implant fi xtures. A, Br å nemark. B, IMZ. C, Integral. D, ITI.
A B C DA B C D
FIG. 32-2 A, Blade implant integrated with bone to support a fi xed bridge (periapical radiograph of a mandibular molar). B, Three blade implants integrated with bone using common abutments to support a mandibular denture region. ( A courtesy Krishan Kapur, DDS, Los Angeles, Calif.)
A
B
A
B
TABLE 32-1 Stage of Treatment
STAGE OF TREATMENT TIME (mo) RADIOGRAPHIC PROCEDURES
Treatment planning − 1 PA, pan, tomo, CBCT/MDCT, ceph
Surgery (placement) 0 PA, pan, tomo, CBCT/MDCT, ceph for correction of problems
Healing 0-3 PA, pan, tomo, CBCT/MDCT, ceph for correction of problems
Remodelling 4-12 PA, pan
Maintenance (without problems) 13 + PA, pan, (following approximately every 3 years)
Complications Anytime PA, pan, CBCT/MDCT (as indicated)
PA, Periapical; pan, panoramic radiography; tomo, conventional tomography; CBCT, cone-beam computed tomography; MDCT, multidetector computed tomography; ceph, lateral/lateral-oblique cephalometric radiography.
dimension than actually exists. The occlusal technique is not useful in imaging the maxillary arch because of anatomic limitations.
LATERAL AND LATERAL-OBLIQUE CEPHALOMETRIC RADIOGRAPHY
Lateral cephalometric radiography provides an image of known mag-nifi cation (usually 7% to 12%) that documents axial tooth inclina-tions and the dentoalveolar ridge relationships in the midline of the jaws. The soft tissue profi le also is apparent on this fi lm and can be used to evaluate profi le alterations after prosthodontic rehabilitation. This projection can provide a cross-sectional view of only the maxil-lary and mandibular midline. Images of nonmidline structures are superimposed on the contralateral side, complicating the evaluation of other implant sites. Occasionally, lateral-oblique cephalometric radiography is used with one side of the mandibular body positioned parallel to the fi lm cassette. Image magnifi cation on these views is not predictable because the body of the mandible is not the same distance from the fi lm as is the rotation center of the cephalostat (used to cal-culate object-fi lm distance for image magnifi cation values). Thus measurements made from these radiographs are not reliable. In general, cephalometric radiographs have signifi cant limitations but may be useful in placement of some implants near the midline for overdentures.
PANORAMIC RADIOGRAPHY
Although the resolution and sharpness of panoramic radiographs are less than those of intraoral radiographs, panoramic projections cer-tainly provide a broader visualization of the jaws and adjoining ana-
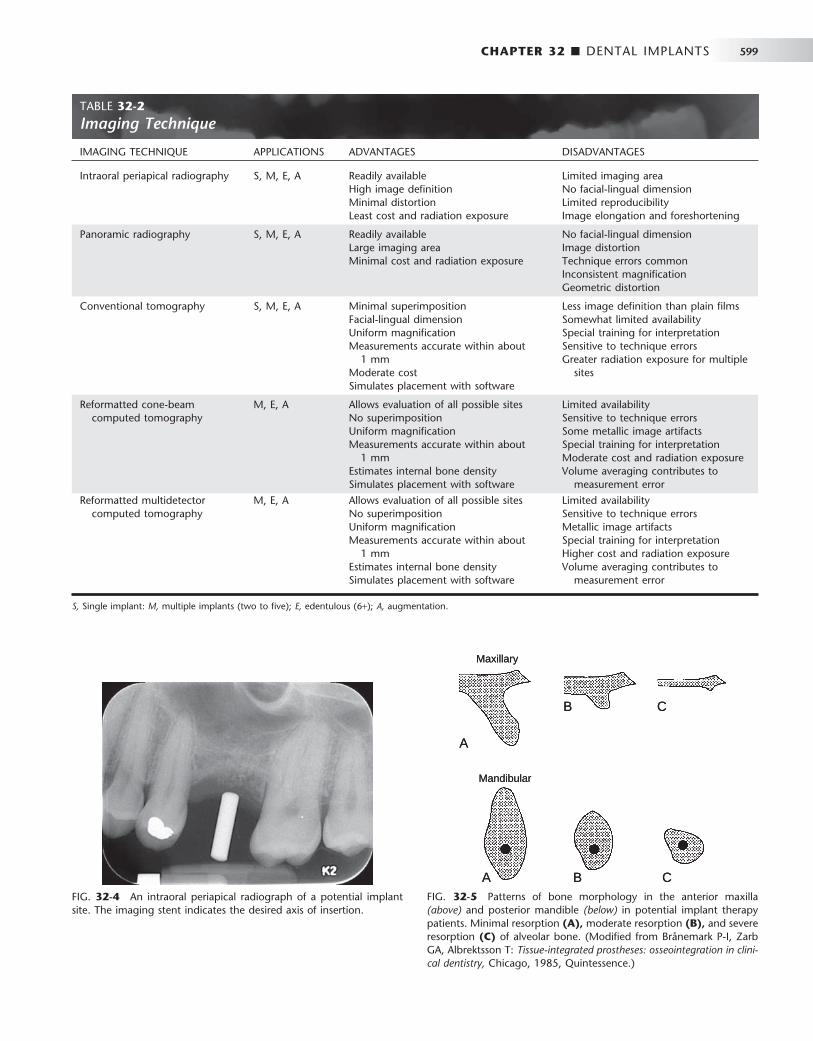
CHAPTER 32 ■ DENTAL IMPLANTS 599
FIG. 32-4 An intraoral periapical radiograph of a potential implant site. The imaging stent indicates the desired axis of insertion.
TABLE 32-2 Imaging Technique
IMAGING TECHNIQUE APPLICATIONS ADVANTAGES DISADVANTAGES
Intraoral periapical radiography S, M, E, A Readily available High image defi nition Minimal distortion Least cost and radiation exposure
Limited imaging area No facial-lingual dimension Limited reproducibility Image elongation and foreshortening
Panoramic radiography S, M, E, A Readily available Large imaging area Minimal cost and radiation exposure
No facial-lingual dimension Image distortion Technique errors common Inconsistent magnifi cation Geometric distortion
Conventional tomography S, M, E, A Minimal superimposition Facial-lingual dimension Uniform magnifi cation Measurements accurate within about
1 mm Moderate cost Simulates placement with software
Less image defi nition than plain fi lms Somewhat limited availability Special training for interpretation Sensitive to technique errors Greater radiation exposure for multiple
sites
Reformatted cone-beam computed tomography
M, E, A Allows evaluation of all possible sites No superimposition Uniform magnifi cation Measurements accurate within about
1 mm Estimates internal bone density Simulates placement with software
Limited availability Sensitive to technique errors Some metallic image artifacts Special training for interpretation Moderate cost and radiation exposure Volume averaging contributes to
measurement error
Reformatted multidetector computed tomography
M, E, A Allows evaluation of all possible sites No superimposition Uniform magnifi cation Measurements accurate within about
1 mm Estimates internal bone density Simulates placement with software
Limited availability Sensitive to technique errors Metallic image artifacts Special training for interpretation Higher cost and radiation exposure Volume averaging contributes to
measurement error
S, Single implant: M, multiple implants (two to fi ve); E, edentulous (6 + ); A, augmentation.
FIG. 32-5 Patterns of bone morphology in the anterior maxilla (above) and posterior mandible (below) in potential implant therapy patients. Minimal resorption (A), moderate resorption (B), and severe resorption (C) of alveolar bone. (Modifi ed from Br å nemark P-I, Zarb GA, Albrektsson T: Tissue-integrated prostheses: osseointegration in clini-cal dentistry, Chicago, 1985, Quintessence.)
A
Maxillary
Mandibular
A B C
B C
A
Maxillary
Mandibular
A B C
B C

600 PART V ■ RADIOGRAPHIC INTERPRETATION
tomic structures. Panoramic radiography units are widely available, making this imaging technique very useful and popular as a screening and assessment instrument. This technique is useful in making pre-liminary estimations of crestal alveolar bone and cortical boundaries of the mandibular canal, maxillary sinus, and nasal fossa ( Fig. 32-6 ).
Information acquired from panoramic radiographs must be applied judiciously because this technique has signifi cant limitations as a defi nitive presurgical planning tool. Angular measurements on panoramic radiographs tend to be accurate, but linear measurements are not. Image size distortion (magnifi cation) varies signifi cantly between fi lms from different panoramic units and even within differ-ent areas of the same fi lm. Vertical measurements are unreliable because of foreshortening and elongation of the anatomic structures because the x-ray beam is not perpendicular to the long axis of the anatomic structures or to the plane of the image receptor. The nega-tive vertical angulation of the x-ray beam also causes lingually posi-tioned objects such as mandibular tori to be projected superiorly on the fi lm, resulting in an overestimation of vertical bone height. Fur-thermore, the anatomic vertical axis varies within the image, particu-larly in nonmidline areas. Compared with contact radiographs of dissected anatomic specimens, only 17% of panoramic measurements between the alveolar crest and superior wall of the mandibular canal were found to be accurate within 1 mm.
Similarly, dimensional accuracy in the horizontal plane of pan-oramic radiographs is highly dependent on the position of the struc-tures of interest relative to the central plane of the image layer. The horizontal dimension of images of structures located facial or lingual to the central plane but still within the image layer tends to be minifi ed or magnifi ed. The degree of horizontal size distortion is diffi cult to ascertain on panoramic radiographs because the shape of the image layer is confi gured to a population average and the anatomic mor-phology of only a few individuals conforms totally to that image layer. In summary, horizontal image magnifi cation with panoramic radio-graphs varies from 0.70 to 2.2 times the actual size, which some manufacturers report as a 1.25 average magnifi cation (at the central plane of the image layer). Errors in patient positioning can further exacerbate measurement error in the horizontal dimension. The defi -cient dimensional accuracy of the two-dimensional panoramic image is further limited by the lack of any cross-sectional information.
CONVENTIONAL TOMOGRAPHY
Used as an adjunct to screening radiographs, cross-sectional tomo-grams enhance visualization of the available bone by providing reli-
able dimensional measurements at proposed implant sites, especially the cross-sectional (facial-lingual) dimension. Tomographic machines were readily available but now are being replaced with CBCT machines. This technique produces a cross-sectional, fl at-plane image layer that is perpendicular to the x-ray beam. Images of anatomic structures of interest are relatively sharp, and images of structures outside the image layer are blurred beyond recognition by the motion of the x-ray tube and image receptor. The thickness, orientation, and anatomic location of the image layer can be predetermined and manipulated. To obtain reliable measurements, it is critical that the image layer be a true cross-section of the curve of the alveolar process, rather than oblique. Scout images (usually a submentovertex, occlusal, or pan-oramic projection) or wax bite registrations or dental models are commonly used to determine the appropriate cross-sectional angula-tion. The complex (multidirectional) tube motion of current conven-tional tomographic units minimizes image superimposition and provides fi xed, uniform image magnifi cation, thus allowing for accu-rate measurements. Complex tube motion also permits use of a thicker image layer while retaining diagnostic quality. A thicker image layer is desirable to maximize image contrast, making the identifi ca-tion of structures such as the mandibular canal more predictable. Conventional tomographic images may be acquired as analog fi lms or digital images.
The dimensional accuracy of cross-sectional tomograms is par-ticularly useful in measuring the distance between the alveolar crest and adjacent structures, such as the fl oor of the nasal fossa, maxillary sinus fl oor, mandibular canal, mental canal, and inferior mandibular cortex. The appropriate buccal-lingual axis of insertion of the implant may also be assessed preoperatively. Measurements are directly acquired from the images and subsequently corrected by the magni-fi cation factor used. As an alternative, acetate overlays with appro-priately magnifi ed 1-mm grids may be used with fi lm-based images or on digital monitors when the display is life sized ( Fig. 32-7 ). Published research suggests a measurement error of less than 1 mm in optimal images. Typically, two to three cross-sectional tomographic slices are required to adequately image each intended implant site. Conventional tomography is especially convenient in the plan-ning of single implants or multiple implants within a quadrant ( Fig. 32-8 ).
REFORMATTED CONE-BEAM AND MULTIDETECTOR COMPUTED TOMOGRAPHY
Patients who are edentulous or who are being considered for multiple implants and augmentation procedures may be best imaged with either CBCT or MDCT to investigate all possible implant sites. For traditional MDCT, a lateral scout image of the selected jaw with the necessary alignment corrections for the mandible or maxilla is typi-cally an essential initial step for the MDCT study. The jaws are aligned so that the acquired axial computed tomographic image slices are parallel to the occlusal plane. These axial images are thin (1-2 mm) and overlapping, resulting in approximately 30 axial image slices per jaw. The image information of these sequential axial images can be postprocessed to produce multiple two-dimensional images in various planes, using a computer-based process called multiplanar reformat-ting (MPR).
CBCT images are acquired with an initial scout image followed by a single revolution imaging sequence. The vertical height of the imaging sequence can be adjusted to include only one jaw, both, or a larger area, especially if the temporomandibular joint needs to be
FIG. 32-6 Evaluation of potential implant sites by panoramic radio-graph; note the severe atrophy of the maxillary and mandibular alveo-lar process.
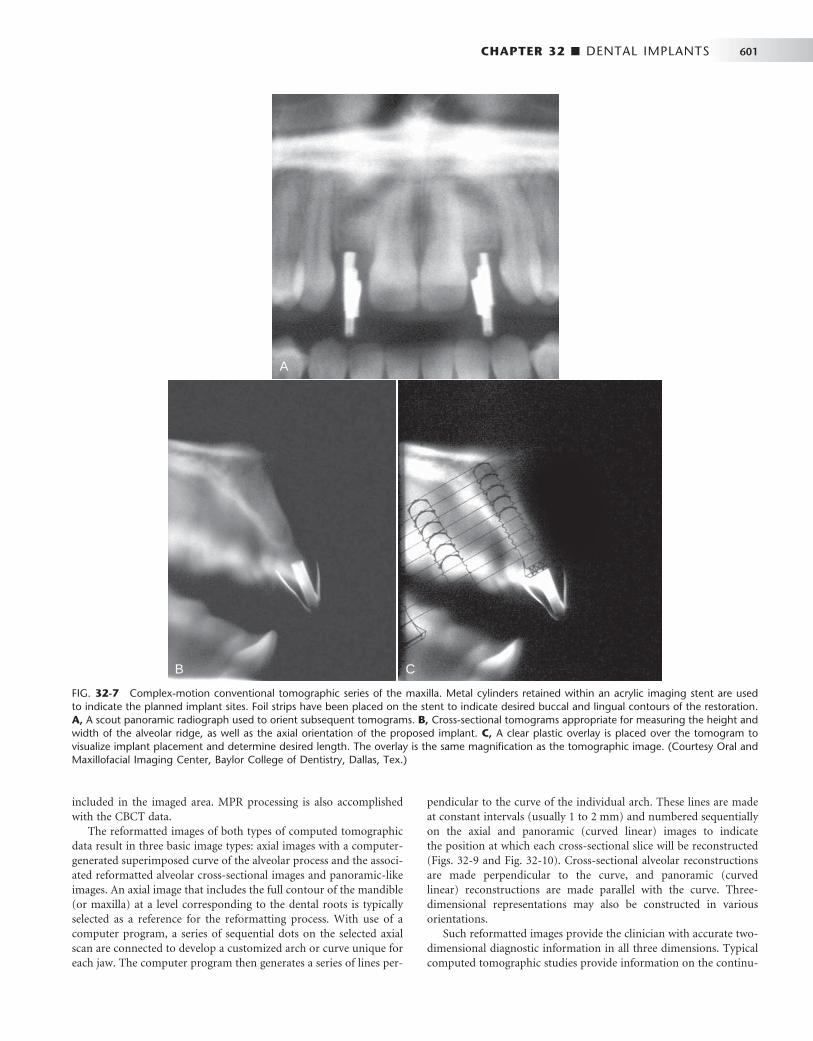
CHAPTER 32 ■ DENTAL IMPLANTS 601
included in the imaged area. MPR processing is also accomplished with the CBCT data.
The reformatted images of both types of computed tomographic data result in three basic image types: axial images with a computer-generated superimposed curve of the alveolar process and the associ-ated reformatted alveolar cross-sectional images and panoramic-like images. An axial image that includes the full contour of the mandible (or maxilla) at a level corresponding to the dental roots is typically selected as a reference for the reformatting process. With use of a computer program, a series of sequential dots on the selected axial scan are connected to develop a customized arch or curve unique for each jaw. The computer program then generates a series of lines per-
pendicular to the curve of the individual arch. These lines are made at constant intervals (usually 1 to 2 mm) and numbered sequentially on the axial and panoramic (curved linear) images to indicate the position at which each cross-sectional slice will be reconstructed ( Figs. 32-9 and Fig. 32-10 ). Cross-sectional alveolar reconstructions are made perpendicular to the curve, and panoramic (curved linear) reconstructions are made parallel with the curve. Three-dimensional representations may also be constructed in various orientations.
Such reformatted images provide the clinician with accurate two-dimensional diagnostic information in all three dimensions. Typical computed tomographic studies provide information on the continu-
FIG. 32-7 Complex-motion conventional tomographic series of the maxilla. Metal cylinders retained within an acrylic imaging stent are used to indicate the planned implant sites. Foil strips have been placed on the stent to indicate desired buccal and lingual contours of the restoration. A, A scout panoramic radiograph used to orient subsequent tomograms. B, Cross-sectional tomograms appropriate for measuring the height and width of the alveolar ridge, as well as the axial orientation of the proposed implant. C, A clear plastic overlay is placed over the tomogram to visualize implant placement and determine desired length. The overlay is the same magnifi cation as the tomographic image. (Courtesy Oral and Maxillofacial Imaging Center, Baylor College of Dentistry, Dallas, Tex.)
A
B C
A
B C
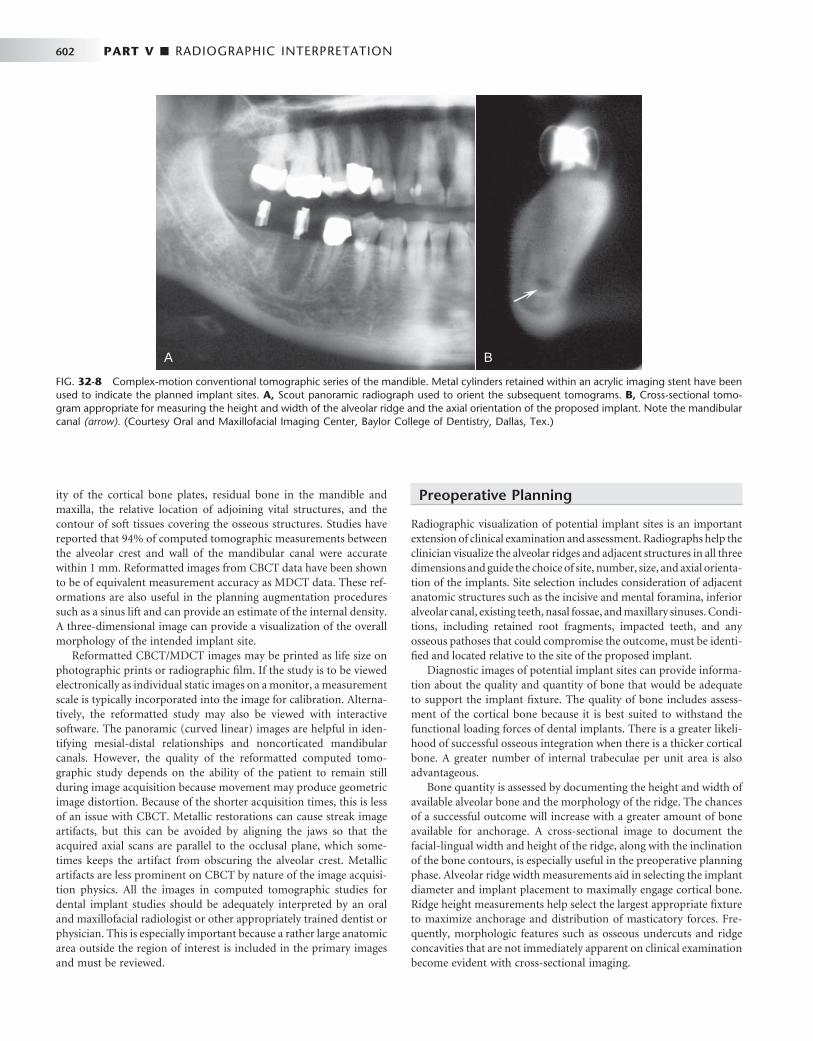
602 PART V ■ RADIOGRAPHIC INTERPRETATION
ity of the cortical bone plates, residual bone in the mandible and maxilla, the relative location of adjoining vital structures, and the contour of soft tissues covering the osseous structures. Studies have reported that 94% of computed tomographic measurements between the alveolar crest and wall of the mandibular canal were accurate within 1 mm. Reformatted images from CBCT data have been shown to be of equivalent measurement accuracy as MDCT data. These ref-ormations are also useful in the planning augmentation procedures such as a sinus lift and can provide an estimate of the internal density. A three-dimensional image can provide a visualization of the overall morphology of the intended implant site.
Reformatted CBCT/MDCT images may be printed as life size on photographic prints or radiographic fi lm. If the study is to be viewed electronically as individual static images on a monitor, a measurement scale is typically incorporated into the image for calibration. Alterna-tively, the reformatted study may also be viewed with interactive software. The panoramic (curved linear) images are helpful in iden-tifying mesial-distal relationships and noncorticated mandibular canals. However, the quality of the reformatted computed tomo-graphic study depends on the ability of the patient to remain still during image acquisition because movement may produce geometric image distortion. Because of the shorter acquisition times, this is less of an issue with CBCT. Metallic restorations can cause streak image artifacts, but this can be avoided by aligning the jaws so that the acquired axial scans are parallel to the occlusal plane, which some-times keeps the artifact from obscuring the alveolar crest. Metallic artifacts are less prominent on CBCT by nature of the image acquisi-tion physics. All the images in computed tomographic studies for dental implant studies should be adequately interpreted by an oral and maxillofacial radiologist or other appropriately trained dentist or physician. This is especially important because a rather large anatomic area outside the region of interest is included in the primary images and must be reviewed.
Preoperative Planning
Radiographic visualization of potential implant sites is an important extension of clinical examination and assessment. Radiographs help the clinician visualize the alveolar ridges and adjacent structures in all three dimensions and guide the choice of site, number, size, and axial orienta-tion of the implants. Site selection includes consideration of adjacent anatomic structures such as the incisive and mental foramina, inferior alveolar canal, existing teeth, nasal fossae, and maxillary sinuses. Condi-tions, including retained root fragments, impacted teeth, and any osseous pathoses that could compromise the outcome, must be identi-fi ed and located relative to the site of the proposed implant.
Diagnostic images of potential implant sites can provide informa-tion about the quality and quantity of bone that would be adequate to support the implant fi xture. The quality of bone includes assess-ment of the cortical bone because it is best suited to withstand the functional loading forces of dental implants. There is a greater likeli-hood of successful osseous integration when there is a thicker cortical bone. A greater number of internal trabeculae per unit area is also advantageous.
Bone quantity is assessed by documenting the height and width of available alveolar bone and the morphology of the ridge. The chances of a successful outcome will increase with a greater amount of bone available for anchorage. A cross-sectional image to document the facial-lingual width and height of the ridge, along with the inclination of the bone contours, is especially useful in the preoperative planning phase. Alveolar ridge width measurements aid in selecting the implant diameter and implant placement to maximally engage cortical bone. Ridge height measurements help select the largest appropriate fi xture to maximize anchorage and distribution of masticatory forces. Fre-quently, morphologic features such as osseous undercuts and ridge concavities that are not immediately apparent on clinical examination become evident with cross-sectional imaging.
FIG. 32-8 Complex-motion conventional tomographic series of the mandible. Metal cylinders retained within an acrylic imaging stent have been used to indicate the planned implant sites. A, Scout panoramic radiograph used to orient the subsequent tomograms. B, Cross-sectional tomo-gram appropriate for measuring the height and width of the alveolar ridge and the axial orientation of the proposed implant. Note the mandibular canal (arrow). (Courtesy Oral and Maxillofacial Imaging Center, Baylor College of Dentistry, Dallas, Tex.)
A BA B

CHAPTER 32 ■ DENTAL IMPLANTS 603
FIG. 32-9 Reformatted cone-beam CT study of the maxilla. A, Panoramic-like curved linear and alveolar cross-sectional reconstructed images using an imaging stent incorporating radiopaque strips to defi ne the buccal and palatal contours of the planned prosthesis. Note the measure-ments on the cross-section images. B, Three-dimensional reformatted images to visualize the morphology of the intended implant sites. (Courtesy Oral and Maxillofacial Imaging Center, Baylor College of Dentistry, Dallas, Tex.)
A
B1
B2
A
B1
B2

604 PART V ■ RADIOGRAPHIC INTERPRETATION
Accurate bone measurements are essential for determining the optimal size and length and orientation of the proposed implants. When measurements are made on any image, the fact that the mag-nifi cation factor of the image might vary with the imaging technique used must be considered. Except for specialized interactive reformat-ted computed tomography implant programs; all other radiographic images have a magnifi cation factor, which must be taken into account when the dimensions of the bone are calculated. The measurements obtained from the images (usually in millimeters) are divided by the magnifi cation factor for that particular imaging technique. As
described earlier, the magnifi cation factor of some techniques may be variable (periapical, panoramic), and thus a constant magnifi cation factor cannot be applied. With dental implant computed tomographic reformatting software, the image is reproduced in the actual size of the jaw without magnifi cation. If the magnifi cation factor is constant, clear plastic overlays with 1-mm grids or diagrams of available implant sizes already corrected for the specifi c magnifi cation factor can be used directly on printed images or on the viewing monitor with the image displayed at 1 : 1. The magnifi cation of electronic images can also be calibrated with the measurement tool.
FIG. 32-10 Reformatted cone-beam CT study of the mandible. A, Panoramic-like curved linear reconstructed image. The imaging stent incor-porates copper cylinders for the path of insertion and radiopaque strips defi ning the buccal and lingual contours of the proposed prosthesis. The copper cylinders will allow the imaging stent to be used as a surgical guide when the implants are placed. B, Correlating cross-sectional images. C, Reformatted axial image through the alveolar ridge depicting the panoramic arc and correlated cross-sectional images. (Courtesy Oral and Maxillofacial Imaging Center, Baylor College of Dentistry, Dallas, Tex.)
A C
B
A C
B

CHAPTER 32 ■ DENTAL IMPLANTS 605
IMAGING STENTS
The clinical utility of presurgical imaging can be enhanced by the use of an imaging stent that helps relate the radiographic image and its information to a precise anatomic location or a potential surgical site. In the case of conventional and computed tomography, an imaging stent also facilitates correlation of the individual image slices to an anatomic location in the scout fi lms. The intended implant sites are identifi ed by markers made of radiopaque spheres or rods (metal, composite resin, or gutta-percha) retained within an acrylic stent ( Fig. 32-11 ; see Fig. 32-7 ), which the patient wears during the imaging procedure so that images of the markers will be created in the diag-nostic images. The imaging stent subsequently may be used as a surgi-cal guide to orient the insertion angle of the guide bur and hence the angle of the implant. For optimal visualization, the width of the markers should be less than the thickness of the conventional tomo-graphic image layer. Diagnostic dentures coated with barium paste may be used during imaging for localization and can also establish the spatial relationships between the anticipated prosthesis and the implant fi xtures. Generally, nonmetallic radiopaque markers (gutta-percha, composite resin) are used in computed tomographic imaging
because of the image artifacts that would be produced by metal markers. However, some metals scatter less than others. The metallic scatter artifact of some CBCT units appears to be less than that of MDCT units. Existing rootform implants do not produce a signifi cant computed tomographic scatter artifact.
INTERACTIVE DIAGNOSTIC SOFTWARE
Several different interactive software packages that can simulate implant orientation and placement on a computer screen before surgery have been developed. They are designed for use on personal computers, typically requiring a Windows (Microsoft, Redmond, Wash.) operating system. Diagnostic software is available for both conventional tomography and reformatted computed tomography. These programs provide an interactive analysis of potential implant sites for bone quantity, quality, and morphology and can simulate the surgical placement of the implant. Visualization of anatomic struc-tures, volumetric analysis for bone grafts, and mechanical analysis of structural forces during restoration are also within the capability of the software packages ( Fig. 32-12 ).
FIG. 32-11 Three examples of imaging stents. A, A vacuum-formed imaging stent with a metal rod to indicate desired axis of insertion. B, A processed stent with metal cylinders marking the implant sites. This can also be used as a surgical stent by inserting the guide bur through the cylinders. C, A processed stent with insertion axis markers, along with a radiopaque strip outlining the buccal and lingual contours of the planned restoration. The stent provides an image of the emergence profi le of the restored implant and can also be used as a surgical guide.
A
B
C
A
B
C
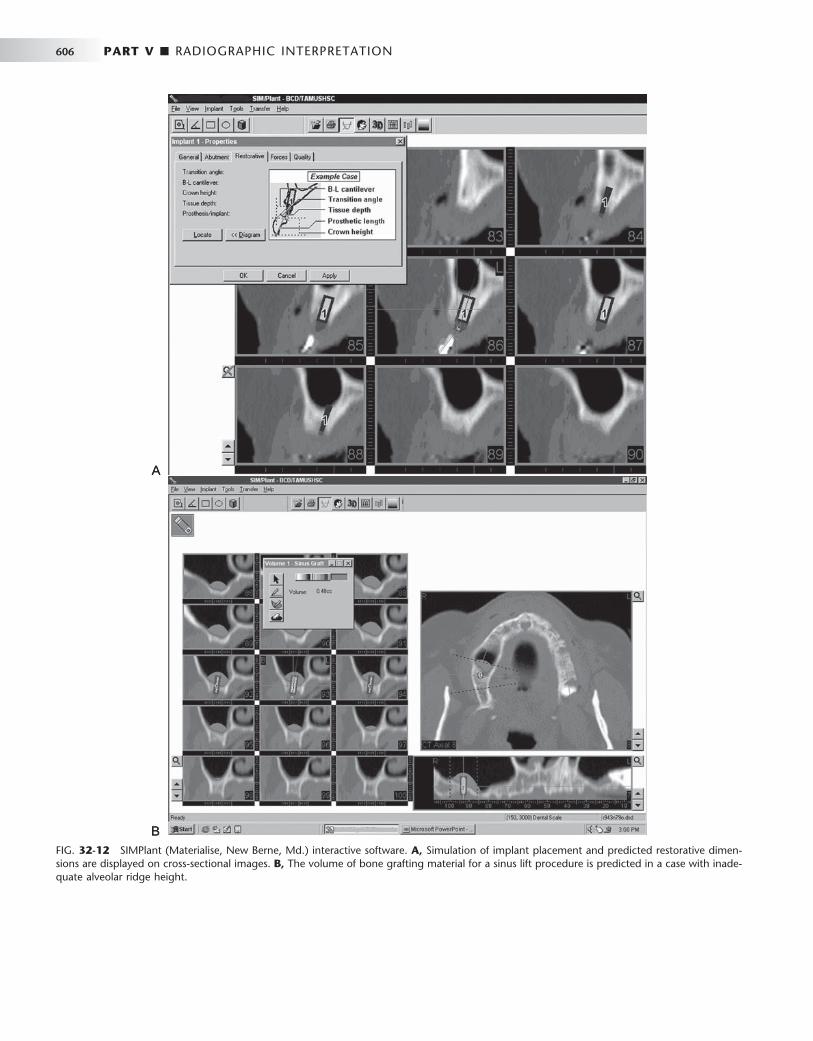
606 PART V ■ RADIOGRAPHIC INTERPRETATION
FIG. 32-12 SIMPlant (Materialise, New Berne, Md.) interactive software. A, Simulation of implant placement and predicted restorative dimen-sions are displayed on cross-sectional images. B, The volume of bone grafting material for a sinus lift procedure is predicted in a case with inade-quate alveolar ridge height.
A
B
A
B

CHAPTER 32 ■ DENTAL IMPLANTS 607
SELECTING DIAGNOSTIC IMAGING FOR PREOPERATIVE PLANNING
A good starting point would be to proceed with a panoramic image and possibly intraoral radiographs if greater image detail is required of any particular region of interest. These survey radiographs would help determine whether the patient is a good candidate for implant procedures. For instance, if there is a pathologic lesion in the planned implant site or if there is obviously inadequate vertical dimension from severe atrophy of the alveolar ridges, there is no sense in pro-ceeding with more expensive imaging procedures such as conven-tional or computed tomography. If the initial scout fi lms reveal reasonable potential implant sites, then either conventional or com-puted tomography can be used to obtain cross-sectional image slices of these sites (see Table 32-2 and Fig. 32-13 ). Generally, if images are required of all of the maxilla and mandible to evaluate possible implant sites, then computed tomography would be the best modality. If potential sites are restricted to a few selected regions, then conven-tional tomography would be a suitable choice. However, the ease of acquisition and relatively low radiation risk of CBCT makes this tech-nique a very viable alternative study even for single implants.
Intraoperative and Postoperative Assessments
Intraoral and panoramic radiographs usually are adequate for both intraoperative and postoperative assessments ( Fig. 32-14 ). Intraop-erative imaging may be required to confi rm correct placement of the implant or to locate a lost implant ( Fig. 32-15 ). The two aspects that are usually assessed with time after implant placement are the alveolar bone height around the implant and the appearance of the bone immediately adjacent to and surrounding the implant. If threaded rootform fi xtures have been placed, the optimal radiographic image must separate the threads for best visualization. This may not always be a predictable procedure because the exact angulation of the implant is not known. The angulation of the x-ray beam must be within 9 degrees of the long axis of the fi xture to open the threads on the image on most threaded fi xtures ( Fig. 32-16 ). Angular devia-tions of 13 degrees or more result in complete overlap of the threads. In general, periapical radiographs are appropriate for longitudinal assessments. However, in evaluating the bone height around an implant, an effort should be made to reproduce the vertical angula-tion of the central ray of the x-ray beam as closely as possible between
FIG. 32-13 Reformatted axial, coronal, and sagittal cone-beam CT images to assess the viability of an osseous graft before implant placement.

608 PART V ■ RADIOGRAPHIC INTERPRETATION
FIG. 32-14 A panoramic radiograph used for postoperative assessment of multiple successfully restored rootform implants. The threads are visual-ized on all of the implants except for the mandibu-lar right premolar, which is a smooth cylinder.
FIG. 32-15 Reformatted cone-beam CT study for postoperative assessment of an implant cylinder displaced into the right maxillary sinus, associated with mucositis in the right antrum. The implant on the left alveolus is not well supported by bone and extends well into the antrum. (Courtesy Oral and Maxillofacial Imaging Center, Baylor College of Dentistry, Dallas, Tex.)
FIG. 32-16 A periapical radiograph of two successful dental implants. Note the close apposition of the bone to the surface of each implant. A minor amount of saucerization is present at the alveolar crest adja-cent to the distal fi xture.
radiographs to closely duplicate the image geometry. Mesial and distal marginal bone height is measured from a standard landmark at the collar of the implant or, in the case of threaded implants, by use of known interthread measurements and compared with bone levels in previous periapical radiographs. The presence of relatively distinct bone margins with a constant height relative to the implant suggests successful osseous integration. Any resorptive changes, if present, are evidenced by apical migration of the alveolar bone or indistinct osseous margins. These adverse changes are progressive and should be differentiated from the initial circumscribed resorptive osseous changes around the cervical area of the fi xture occurring during the fi rst 6 months that are induced by the surgical procedure itself ( Fig. 32-17 ). Studies suggest that the rate of marginal bone loss after successful implantation is approximately 1.2 mm in the fi rst year, subsequently tapering off to about 0.1 mm in succeeding years. Subtle areas of bone resorption adjacent to the fi xture may be made more evident with intraoral digital images by evaluating a density
profi le graph of radiographic density values, a feature available on most digital imaging units. If intraoral digital images are acquired at surgery, they may be compared with subsequent digital images either by subjective visualization or digital subtraction. Digital sub-traction of sequential radiographs is a computerized process that may reveal areas of bone resorption not apparent visually but requires that the image geometry be reproduced between radiographic exami-nations. Occasionally, areas of marginal bone gain also may be noted.
The success of an implant can also be evaluated by the appearance of normal bone surrounding it and its apposition to the surface of the implant body. The development of a thin radiolucent area that closely follows the outline of the implant usually correlates to clinically detectable implant mobility; it is an important indicator of failed osseointegration ( Fig. 32-18 ). Changes in the periodontal ligament space of associated teeth (natural abutment) are also useful in moni-toring the functional competence of the implant-prostheses compos-

CHAPTER 32 ■ DENTAL IMPLANTS 609
FIG. 32-17 A, Marginal bone loss around the cervical region of a rootform dental implant (portion of a panoramic radiograph). B, Peri-apical radiograph of moderate bone loss ( “ saucerization ” type) around the cervical region of a rootform dental implant (arrows).
A
B
A
B
FIG. 32-18 A, Periapical radiograph of bone loss around a root-form dental implant (thin radiolucent band surrounding the implant), indi-cating failure of osseous integration. B, Periapical view of a fractured endosseous implant.
A BA B
TABLE 32-3 Radiographic Signs Associated with Failing Endosseous Implants
RADIOGRAPHIC APPEARANCE CLIINICAL IMPLICATIONS
Thin radiolucent area that closely follows the entire outline of the implant
Failure of the implant to integrate with the adjoining bone
Crestal bone loss around the coronal portion of the implant Osteitis resulting from poor plaque control, adverse loading, or both
Apical migration of alveolar bone on one side of the implant Nonaxial loading resulting from improper angulation of the implant
Widening of the periodontal ligament space of the nearest natural (tooth) abutment
Poor stress distribution resulting from biomechanically inadequate prosthesis-implant system
Fracture of the implant fi xture Unfavorable stress distribution during function
ite. Any widening of the periodontal ligament space compared with baseline radiographs indicates poor stress distribution and forecasts implant failure ( Table 32-3 ). After successful implantation, radio-graphs may be made at regular intervals to assess the success or failure of the implant fi xture. Advanced imaging studies may be necessary for adequate assessment in some cases ( Figs. 32-19 and 32-20 ).
In summary, diagnostic imaging is an integral part of dental implant therapy for presurgical planning, intraoperative assessment, and postoperative assessment by use of a variety of imaging tech-niques. Cross-sectional imaging is increasingly considered essential for optimal implant placement, especially in the case of complex reconstructions.

610 PART V ■ RADIOGRAPHIC INTERPRETATION
FIG. 32-19 A, Panoramic-like curved linear reformatted cone-beam CT (CBCT) image initially made for implant planning. In this image, the existing implants appear reasonably normal in orientation. B, The cross-sectional reformatted CBCT images reveal nonrestorable ectopic place-ment of the existing implants with lingual cortical perforation and extension into the lingual tissues. (Courtesy Oral and Maxillofacial Imaging Center, Baylor College of Dentistry, Dallas, Tex.)
A
B
A
B
FIG. 32-20 Reformatted cone-beam CT images of a symptomatic patient reveal embarrassment and compression of the mandibular canal by the implant.

CHAPTER 32 ■ DENTAL IMPLANTS 611
BIBLIOGRAPHY
COMPARATIVE DOSIMETRY
Avendanio B , Frederiksen NL , Benson BW et al : Estimate of radiation detriment: scanography and intraoral radiology , Oral Surg Oral Med Oral Pathol Oral Radiol Endod 82 : 713 - 719 , 1996 .
Cohnen M , Kemper J , M ö bes O et al : Radiation dose in dental radiology , Eur Radiol 12 : 634 - 637 , 2002 .
Frederiksen NL , Benson BW , Sokolowski TW : Risk assessment from fi lm tomography used for dental implant diagnostics , Dentomaxillofac Radiol 23 : 123 - 127 , 1994 .
Frederiksen NL , Benson BW , Sokolowski TW : Effective dose and risk assessment from computed tomography of the maxillofacial complex , Dentomaxillofac Radiol 24 : 55 - 58 , 1995 .
Lecomber AR , Yoneyama Y , Lovelock DJ et al : Comparison of patient dose from imaging protocols for dental implant planning suing conventional radiography and computed tomography , Dentomaxillofac Radiol 30 : 255 - 259 , 2001 .
Ludlow JB , Davies-Ludlow LE , Brooks SL et al : Dosimetry of 3 CBCT devices for oral and maxillofacial radiology: CB Mercuray, NewTom 3G and i-CAT , Dentomaxillofac Radiol 35 : 219 - 226 , 2006 ; erratum Dentomaxillofac Radiol 35:392.
Scaf G , Lurie AG , Mosier KM et al : Dosimetry and cost of imaging for osseointegrated implants with fi lm-based and computed tomography , Oral Surg Oral Med Oral Pathol Oral Radiol Endod 83 : 41 - 48 , 1997 .
Schulze D , Heiland M , Thurmann H et al : Radiation exposure during midfacial imaging using 4- and 16-slice computed tomography, cone beam computed tomography systems and conventional tomography , Dentomaxillofac Radiol 33 : 83 - 86 , 2004 .
COMPUTED TOMOGRAPHY (CBCT AND MDCT)
Hashimoto K , Kawashima S , Araki M et al : Comparison of image performance between cone-beam computed tomography for dental use and four-row multidetector helical CT , J Oral Sci 48 : 27 - 34 , 2006 .
Hatcher DC , Dial C , Mayorga C : Cone beam CT for presurgical assessment of implant sites , J Calif Dent Assoc 31 : 825 - 833 , 2003 .
Lascala CA , Panella J , Marques MM : Analysis of the accuracy of linear measurements obtained by cone beam computed tomography (CBCT – NewTom) , Dentomaxillofac Radiol 33 : 291 - 294 , 2004 .
McGivney GP , Haughton V , Strandt JA et al : A comparison of computer-assisted tomography and data-gathering modalities in prosthodontics , Int J Oral Maxillofac Implants 1 : 55 - 68 , 1986 .
Rothman SLG : Dental applications of computed tomography — surgical planning for implant placement , Chicago , 1998 , Quintessence .
Scarfe WC , Farman AG , Sukovic P : Clinical applications of cone-beam computed tomography in dental practice , J Can Dent Assoc 72 : 75 - 80 , 2006 .
Schwarz MS , Rothman SL , Rhodes ML et al : Computed tomography, I: preoperative assessment of the mandible for endosseous implant surgery , Int J Oral Maxillofac Implants 2 : 137 - 141 , 1987 .
Schwarz MS , Rothman SL , Rhodes ML et al : Computed tomography, II: preoperative assessment of the maxilla for endosseous implant surgery , Int J Oral Maxillofac Implants 2 : 143 - 148 , 1987 .
Sukovic P : Cone beam computed tomography in craniofacial imaging , Orthod Craniofacial Res 6 ( 1 Suppl ): 31 - 36 , 2003 .
Wishan MS , Bahat O , Krane M : Computed tomography as an adjunct in dental implant surgery , Int J Periodontics Restorative Dent 8 : 30 - 47 , 1988 .
Zhang L , Zhu XR , Lee AK et al : Reducing metal artifacts in cone-beam CT images by preprocessing projection data , Int J Radiat Oncol Biol Phys 67 : 924 - 932 , 2007 .
CONVENTIONAL TOMOGRAPHY
Ekestubbe A , Gr ö ndahl K , Gr ö ndahl HG : The use of tomography for dental implant planning , Dentomaxillofac Radiol 26 : 206 - 213 , 1997 .
Gr ö ndahl K , Ekestubbe A , Gr ö ndahl HG et al : Reliability of hypocycloidal tomography for the evaluation of the distance from the alveolar crest to the mandibular canal , Dentomaxillofac Radiol 20 : 200 - 204 , 1991 .
Stella JP , Tharanon W : A precise radiographic method to determine the location of the inferior alveolar canal in the posterior edentulous mandible: implications for dental implants, I: technique , Int J Oral Maxillofac Implants 5 : 15 - 22 , 1990 .
Stella JP , Tharanon W : A precise radiographic method to determine the location of the inferior alveolar canal in the posterior edentulous mandible: implications for dental implants, II: clinical application , Int J Oral Maxillofac Implants 5 : 23 - 29 , 1990 .
GENERAL IMAGING TECHNIQUES
Benson BW : Diagnostic imaging for dental implant assessment , Tex Dent J 112 : 37 - 41 , 1995 .
Benson BW : Presurgical radiographic planning for dental implants , Oral Maxillofac Surg Clin North Am 13 : 751 - 761 , 2001 .
DeSmet E , Jacobs R , Gijbels F et al : The accuracy and reliability of radiographic methods for the assessment of marginal bone level around oral implants , Dentomaxillofac Radiol 31 : 176 - 181 , 2002 .
Holmes SM : iCAT scanning in the dental offi ce , Fortress Guardian 9 : 2 , 2007 . Milgrom P , Getz T : Implants: growing concern , Dental Claims and Insurance
News 8 : 1 , 1994 [ newsletter ] . Reddy MS , Wang IC : Radiographic determinants of implant performance ,
Adv Dent Res 13 : 136 - 145 , 1999 . Sahiwal IG , Woody RD , Benson BW et al : Radiographic identifi cation of
nonthreaded endosseous dental implants , J Prosthet Dent 87 : 552 - 562 , 2002 .
Sahiwal IG , Woody RD , Benson BW et al : Radiographic identifi cation of threaded endosseous dental implants , J Prosthet Dent 87 : 563 - 577 , 2002 .
Tyndall DA , Brooks SL : Selection criteria for dental implant site imaging: a position paper of the American Academy of Oral and Maxillofacial Radiology , Oral Surg Oral Med Oral Pathol Oral Radiol Endod 89 : 630 - 637 , 2000 .
GENERAL IMPLANTOLOGY
Misch CE : Dental implant prosthodontics , St. Louis , 2005 , Elsevier Mosby . Miyamoto I , Tsuboi Y , Suwa H et al : Infl uence of cortical bone thickness and
implant length on implant stability at the time of surgery — clinical, prospective, biomechianical, and imaging study , Bone 37 : 776 - 780 , 2005 .
Palmer RM , Smith BJ , Howe LC et al : Implants in clinical dentistry , Chicago , 1998 , Quintessence .
Sahiwal I , Woody RD , Benson BW et al : Macro design morphology of endosseous dental implants , J Prosthet Dent 87 : 543 - 551 , 2002 .
IMAGING STENTS
Cehreli MC , Aslan Y , Sahin S : Bilaminar dual-purpose stent for placement of dental implants , J Prosthet Dent 84 : 55 - 58 , 2000 .
Kopp KC , Koslow AH , Abdo OS : Predictable implant placement with a diagnostic / surgical template and advanced radiographic imaging , J Prosthet Dent 89 : 611 - 615 , 2003 .
Ku YC , Shen YF : Fabrication of a radiographic and surgical stent for implants with a vacuum former , J Prosthet Dent 83 : 252 - 253 , 2000 .
INTERACTIVE COMPUTER SOFTWARE
Fortin T , Bosson JL , Coudert JL et al : Reliability of preoperative planning of an image-guiding system for oral implant placement based on 3-dimensional images: an in vivo study , Int J Oral Maxillofac Implants 18 : 886 - 893 , 2003 .

612 PART V ■ RADIOGRAPHIC INTERPRETATION
Guerrero ME , Jacobs R , Loubele M et al : State-of-the-art cone beam CT imaging for preoperative planning of implant placement , Clin Oral Investig 10 : 1 , 2006 .
Rosenfeld AL , Mandelaris GA , Tardieu PB : Prosthetically directed implant placement using computer software to ensure precise placement and predictable prosthetic outcomes, 1: diagnostics, imaging, and collaborative accountability , Int J Periodontics Restorative Dent 26 : 215 - 221 , 2006 .
PANORAMIC RADIOGRAPHY
Tal H , Moses O : A comparison of panoramic radiography with computed tomography in the planning of implant surgery , Dentomaxillofac Radiol 20 : 40 - 42 , 1991 .
Truhlar RS , Morris HF , Ochi S : A review of panoramic radiography and its potential use in implant dentistry , Implant Dent 2 : 122 - 130 , 1993 .
Index
A
ABC. See Aneurysmal bone cyst Abdomen and chest, CT of , 32 , 36 Abrasions
as acquired pathologic condition , 315 dental fl oss injury , 316 toothbrush , 315
Abscess periapical , 326 periodontal , 289 , 290f
Absorbed dose , 16 Absorption
Compton , 15f exponential pattern of , 2 , 15f K-edge , 15 photoelectric , 13 , 13t , 14f
Acidifi er , 68 Acinic cell carcinoma , 593 Acquired abnormalities, dental anomalies and , 315 Acquired immunodefi ciency syndrome (AIDS)
infection control and , 101 periodontal disease and , 293
Acquired pathologic conditions , 315 abrasion , 315 attrition , 315 erosion , 316 external resorption , 318 hypercementosis , 322 internal resorption , 316 pulp stones , 320 pulpal sclerosis , 321 secondary dentin , 318
Acquisition of diagnostic images , 256 image, CBCT and , 225 , 227t , 228t
Acquisition artifacts , 235 , 235f Acquisition stage, of reconstruction , 229 Acromegaly , 458 , 459f Activator , 67 Acute apical periodontitis , 326 Acute bacterial infections , 585 Acute lesions , 325 , 326 Acute lymphoblastic leukemia , 424 Acute maxillary sinusitis , 509 , 511 Acute myelogenous leukemia , 424 Acute phase, of osteomyelitis , 331
Acute radiation syndrome , 26 , 27t cardiovascular and central nervous system
syndrome , 27 gastrointestinal syndrome , 27 hematopoietic syndrome , 27 , 27f , 27t latent period , 27 management of , 28 prodromal period , 26
Acute suppurative osteomyelitis , 331 ADA. See American Dental Association Adamantinoma , 373 Adamantoblastoma , 373 ADC. See Analog-to-digital conversion Adenoameloblastoma , 383 Adenocarcinoma , 593 Adenoid cystic carcinomas , 593 Adenolymphoma , 590 Adenoma
adrenal , 461 basophilic , 461 carcinoma ex pleomorphic , 592 lymphomatous , 590 pleomorphic , 590 , 591f
malignant , 592 Adenomatoid odontogenic tumor , 383
clinical features of , 383 defi nition of , 383 differential diagnosis and , 384 radiographic features of , 383
internal structure , 384 , 385f location , 383 , 385f periphery , 384 surrounding structures relating to ,
384 synonyms for , 383 treatment for , 385
Adontomes , 373 Adrenal adenoma , 461 Adrenal carcinoma , 461 Adrenal hyperplasia , 461 Adult hyperpituitarism , 459 Advanced imaging , 207
conventional tomography , 222 , 223f CT , 207 MRI , 212 nuclear medicine , 218 , 221f , 583 procedures for, extraoral radiographs and ,
249 US , 221 , 223f
Advanced imaging procedures, for extraoral radiographs , 249
613
Page numbers followed by f indicate fi gures; t, tables; b, boxes.
African jaw lymphoma , 423 Aggressive fi bromatosis , 402 Aggressive periodontitis , 289
clinical presentation of , 290 radiographic appearance of , 290 , 290f treatment for , 290
Aging process, attrition relating to , 315 AIDS. See Acquired immunodefi ciency syndrome ALARA (As Low As Reasonably Achievable) , 36 ,
226 Albers-Sch õ nberg , 465 Algorithms
for applied diagnostic imaging, of salivary glands , 579
fi ltered back-projection , 209 images relating to , 208
Alkali compounds , 67 Alkaline phosphatase , 463 Altered morphology, of teeth , 300
amelogenesis imperfecta , 307 concrescence , 301 congenital syphilis , 314 dens evaginatus , 306 dens invaginatu/dens in dente/dilated
odontome , 304 dentin dysplasia , 310 dentinogenesis imperfecta , 309 dilaceration , 303 enamel pearl , 311 fusion , 300 gemination , 299 , 301 osteogenesis imperfecta , 310 regional odontodysplasia , 311 talon cusp , 312 taurodontism , 302 Turner ’ s hypoplasia , 313
Alveolar bone, changes in morphologic features of , 285
buccal or lingual cortical plate loss , 287 , 287f early bone changes , 285 , 285f horizontal bone loss , 285 , 285f , 286 interdental craters , 286 , 287f osseous deformities, in furcations of
multirooted teeth , 287 , 288f vertical bone defects , 286 , 286f , 287f
Alveolar crest , 154 , 155f , 284 , 284f Alveolar process
fractures of , 552 clinical features of , 552 defi nition of , 552 management of , 552
614 INDEX
radiographic features of , 552 , 552f squamous cell carcinoma of , 292 , 293f
Alveolus, supporting mandibular dentition and , 184 maxillary dentition and , 186
Ameloblastic adenomatoid tumor , 383 Ameloblastic carcinoma, malignant. See
Malignant ameloblastoma and ameloblastic carcinoma
Ameloblastic fi broma , 380 clinical features of , 381 , 381f defi nition of , 380 differential diagnosis and , 382 granular cell , 380 radiographic features of , 381
internal structure , 381f , 382 , 383f location , 381 , 382f periphery , 382 surrounding structures relating to , 382
synonyms for , 380 treatment for , 382
Ameloblastic fi bro-odontoma , 382 clinical features of , 383 defi nition of , 382 differential diagnosis and , 383 radiographic features of , 383
internal structure , 383 , 384f location , 383 periphery , 383
treatment for , 383 Ameloblastoma , 366 , 373
additional imaging of , 376 , 376f clinical features of , 373 CT of , 376 , 376f , 377 defi nition of , 373 differential diagnosis and , 376 malignant. See Malignant ameloblastoma and
ameloblastic carcinoma. MRI of , 376 , 377 multilocular , 374f radiographic features of , 373
internal structure , 373f , 374f , 375 , 375f location , 373 , 373f periphery , 373 , 374f surrounding structures relating to , 375 , 375f ,
376f , 377f recurrent , 375 , 377f synonyms for , 373 treatment of , 377 unicystic , 377f
Amelogenesis imperfecta , 307b clinical features of , 308
hypocalcifi cation , 308 , 308f , 454 hypomaturation , 308 hypomaturation/hypocalcifi cation ,
308 hypoplastic type , 308 , 308f
defi nition of , 307 differential diagnosis and , 309 management of , 309 radiographic features of , 308
American College of Radiology , 90 American Dental Association (ADA) , 36 , 39 , 77 ,
101 dental radiographs and , 245 , 250
Amputation neuroma , 390 Analog v. digital , 78 , 79f , 80f Analog-to-digital conversion (ADC) , 78 , 79
Anatomic structures dentition relating to , 189 , 189f of mandible , 185f , 186f , 187f
anterior sextant , 184 body and angle , 184 condylar process and TMJ , 184 coronoid process , 170 , 172f , 184 cortical border , 176 mandibular condylar , 175 mandibular dentition and supporting
alveolus , 184 ramus , 184
of midfacial region , 186 , 187f , 188f maxilla, cortical boundary of , 186 maxillary dentition and supporting alveolus ,
186 maxillary sinuses , 186 nasal cavity and conchae , 186 pterygomaxillary fi ssure , 186 , 188f TMJ , 184 , 186 zygomatic complex , 186 , 188
normal, absence of , 183 of soft tissues , 186f , 187f , 188f , 189 superimpositions and ghost images relating to ,
186f , 189 Anatomy
normal, periodontal disease and , 284 , 284f radiographic, normal , 152 of TMJ , 476f
Anemia Cooley ’ s , 469 erythroblastic , 469 Mediterranean , 469 Sickle cell , 468
Aneurysmal bone cyst (ABC) , 445b , 500 clinical features of , 445 CT of , 445f , 446 , 446f defi nition of , 445 differential diagnosis and , 446 management of , 446 radiographic features of , 445
internal structure , 445f , 446 , 446f location , 445 , 445f periphery and shape , 446 surrounding structures relating to , 445f , 446 ,
446f Angulation guidelines, for bisecting-angle
projections , 135t Angulation, of tube head
bisecting-angle technique , 135 paralleling technique , 109 , 135t
Ankylosing spondylitis , 541 psoriatic arthritis and, TMJ and , 494
Ankylosis, TMJ and , 500b clinical features of , 500 defi nition of , 500 differential diagnosis and , 500 radiographic features of , 494f , 500 ,
500f treatment of , 500
Anodes , 5 , 6 rotating , 6 , 7f , 208
Anodontia , 295 Anomalies
craniofacial , 562 dental. See Dental anomalies.
Anterior mandible , 156 Anterior mandibular occlusal projection , 144b ,
148
Anterior maxillary occlusal projection , 141b , 147
Anterior nasal spine , 157 , 157f Anterior sextant, of mandible , 184 Anteroposterior position radiograph, panoramic
imaging and , 181 Antral polyps , 513 Antrolith , 513 . See also Rhinolith/antrolith
clinical features of , 513 defi nition of , 513 differential diagnosis and , 514 management of , 514 radiographic features of , 513
internal structure , 513 location , 513 , 513f periphery and shape , 513
Antrum, benign cyst of , 511 Apex, of teeth , 152 , 154 Apical periodontal cyst , 343 Apoptosis , 20 Applied diagnostic imaging
algorithms for , 579 maxillary sinuses relating to , 508 of salivary gland disease , 578
Applied radiology for sialolith , 531 , 533f , 579 , 580 for teeth and facial structures , 541
Apron disinfecting and covering of , 104 , 104f ,
105f leaded , 39 , 39f , 103
Archiving, exporting, and distribution, CBCT relating to , 235
Arterial calcifi cations , 530 calcifi ed atherosclerotic plaque , 530 Monckeberg ’ s medial calcinosis , 530
Arteriosclerosis. See Monckeberg ’ s medial calcinosis
Arteriovenous (A-V) defect , 398 Arteriovenous (A-V) fi stula , 398
additional imaging of , 398 , 399f , 400f clinical features of , 398 CT for , 398 , 399f defi nition of , 398 differential diagnosis and , 398 radiographic features of , 398
internal structure , 398 location , 398 periphery , 398 surrounding structures relating to , 398
synonyms for , 398 treatment for , 398
Arthritis infectious , 494 JA , 493 psoriatic, and ankylosing spondylitis, TMJ and ,
494 RA , 491b septic , 494
Arthrography, TMJ relating to , 478 Arthrosis
Boering ’ s , 483 juvenile , 483 , 564
Arthrosis deformans juvenilis , 483 Articular loose bodies, TMJ and , 496 Artifacts. See also Image artifacts, CBCT and
acquisition , 235 , 235f beam-hardening , 210 CT and , 210
Alveolar process (Continued)

INDEX 615
cupping , 235 metal , 210 partial volume , 210
Aspergillosis , 517 Atomic structure
electrons and , 2 of helium , 3f of hydrogen , 3f of lithium , 3f neutrons and , 2 nucleus and , 2 protons and , 2
Atoms silver , 65
neutral , 65 structure of , 2 , 3f
Attrition , 315 aging process relating to , 315 clinical features of , 315 defi nition of , 315 differential diagnosis and , 315 management of , 315 radiographic features of , 315 , 315f
Autoimmune sialadenitis , 587 clinical features of , 587 defi nition of , 587 MRI of , 587 radiographic features of , 587 , 588f synonyms for , 587 treatment of , 587
Autoimmune sialosis , 587 Automatic exposure control , 226 Automatic fi lm processing , 72 , 73f Automatic fi lm processors, infection control and ,
107 Automatic processor, operation of , 73 Autotransformer , 7 A-V aneurysm , 398 A-V fi stula. See Arteriovenous fi stula A-V malformation , 398 A-V shunt , 398 Avulsion , 543
clinical features of , 544 defi nition of , 543 management of , 544 radiographic features of , 544 , 544f
B
Bacteria, dental caries relating to , 270 Bacterial plaque-associated gingivitis , 282 Bacterial sialadenitis , 585
clinical features of , 585 CT of , 586 , 586f defi nition of , 585 MRI of , 586 radiographic features of , 586 , 586f synonyms for , 585 treatment for , 586
Barium fl uorohalide, europium-doped , 81 Barrier-protected fi lm or disposable container, use
of , 105 , 106f Barriers, infection control and , 104 , 105 Basal cell nevus syndrome , 354
clinical features of , 354 CT of , 354 , 355f defi nitions of , 354 differential diagnosis and , 354
KOTs and , 354 management of , 354 , 355f radiographic features of , 354 , 355f
location , 354 , 355f other , 354
synonyms for , 354 Base
calcium hydroxide , 171 , 172f fi lm , 53 intensifying screens relating to , 57 x-ray fi lm relating to , 53
Base plus fog , 58 Basis images , 225 Basophilic adenoma , 461 BBC. See Buccal bifurcation cysts Beam alignment , 103
fi lm placement and , 283 Beam attenuation , 14 Beam energy , 103 Beam hardening , 235 Beam quality , 10 Beam quantity or beam intensity , 10 Beam, x-rays. See CBCT; X-ray beam Beam-hardening artifacts , 210 Benign ameloblastomas , 411 , 412 Benign cementoblastoma , 366 , 387
clinical features of , 387 defi nition of , 387 differential diagnosis and , 387 radiographic features of , 387
internal structure , 387 , 389f location , 387 periphery , 387 surrounding structures relating to , 387
synonyms for , 387 treatment for , 387
Benign cyst of antrum , 511 mucosal, of sinus , 511
Benign cysts, odontogenic , 519 , 519f differential diagnosis and , 519 , 520f , 521f radiographic features of , 519
internal structure , 519 periphery and shape , 519 surrounding structures relating to , 519 , 519f
Benign giant cell lesions , 500 Benign hemangioma, of salivary glands , 591 Benign lymphoepithelial lesion , 587 Benign mixed tumor, of salivary glands , 590
clinical features of , 590 defi nition of , 590 radiographic features of , 590 , 591f synonym for , 590
Benign neoplasms odontogenic, malignant and , 508 paranasal sinuses relating to , 515
osteoma , 515 papilloma , 515
Benign tumors , 373 of jaws. See Jaws, benign tumors of. mesenchymal , 385 mixed , 378 of neural origin , 389
neurilemmoma , 389 neurofi broma , 391 neurofi bromatosis , 391 neuroma , 390
odontogenic epithelial , 373
of salivary glands , 589 TMJ and , 500
clinical features of , 500 CT of , 481 differential diagnosis and , 501 radiographic features of , 500 , 501f treatment of , 501
Benign tumors, odontogenic , 519 , 519f conditions caused by , 520 radiographic features of , 520
internal structure , 520 periphery and shape , 520 surrounding structures relating to , 520
Benzotriazole , 67 Beta particles , 4 Bifi d canals , 168 , 170f Bifi d condyle , 485
clinical features of , 485 defi nition of , 485 differential diagnosis and , 486 radiographic features of , 485 , 485f treatment of , 486
Bilateral developmental coronoid hyperplasia , 484
Bilateral enlargements of parotid area , 578 , 579b of submandibular area , 578 , 579b
Biomodels , 238 Bisecting-angle projections, angulation guidelines
for , 135t Bisecting-angle technique , 48 , 49f
of periapical radiography , 109 , 111 , 112f patient positioning , 112 receptor-holding instruments , 112 tube head, angulation of , 135
Bisphosphonate-related osteonecrosis , 341 clinical features of , 341 defi nition of , 340 management of , 341 radiographic features of , 341 , 341f , 342f
Bisphosphonates , 340 Bit depth , 227 Bitewing examinations , 135
horizontal bitewing receptors , 135 vertical bitewing receptors , 136 , 136f
Bitewing fi lms , 54 , 55 , 56f Bitewing projections , 110b , 148
caries relating to , 270 molar , 139b posterior , 148 premolar , 137b primary dentition relating to , 148
Blurring. See Radiographic blurring Boering ’ s arthrosis , 483 Bone(s). See also DBI; Marble bone disease
alveolar, changes in morphologic features of , 285
cancellous , 155 , 325 cavity of
progressive , 361 static , 574
cysts of ABC , 445 , 500 hemorrhagic , 361 latent , 574 SBC , 361 solitary , 361 Stafne , 574
Artifacts (Continued) Basal cell nevus syndrome (Continued) Benign tumors (Continued)
616 INDEX
traumatic , 361 unicameral , 361
density of, trabecular pattern and , 259f , 265 depression of, lingual mandibular , 574 desmoplastic fi broma of , 402 diseases of jaws. See Jaws. facial, traumatic injuries to , 548 heterotopic , 535b loss of, periodontal , 289 marrow of. See Focal osteoporotic bone
marrow. metabolism of , 454 other lesions of , 440
CGCG , 442b cherubism , 354 , 446 COF , 440 LCH , 292 , 293f , 351 , 448 Paget ’ s disease , 322 , 335 , 414 , 439 , 447
outer cortical, intraosseous lesions relating to , 260f , 262f , 265 , 266f
quantity of, assessed for dental implants , 602 radiation damage to , 25 radiation-induced changes to , 336 resorption of , 339 squamous cell carcinoma in , 409 trabecular pattern of , 289 , 289f zygomatic , 164 , 164f , 165f
Bone dysplasias , 428 , 508 cemento-osseous , 432 fi brous , 428
Bony hyperplasia , 367 Bony relationships, TMJ and , 475 , 476f Brachycephaly , 564 Brain and nervous system cancer , 29 Brandywine isolate , 309 Bremsstrahlung radiation , 9 , 9f , 10f Brightness and contrast , 86 , 87f , 88f Bromide crystal, silver , 65 , 66f , 67 Bromide ion , 65 Bromide, potassium , 67 Brown tumors
hyperparathyroidism and , 456 renal osteodystrophy and , 456 , 463
Buccal and lingual surfaces, lesions on , 277 , 277f
Buccal bifurcation cysts (BBC) , 350b clinical features of , 350 defi nition of , 350 differential diagnosis and , 351 , 351f management of , 351 radiographic features of , 350
internal structure , 351 location , 350 , 350f periphery and shape , 351 surrounding structures relating to , 350f , 351 ,
351f synonyms for , 350
Buccal object rule , 50 Buccal or lingual cortical plate loss , 287 , 287f Buccal roots , 162 Bucky , 63 Burkitt ’ s lymphoma , 423
clinical features of , 423 defi nition of , 423 differential diagnosis and , 423 management of , 424 radiographic features of , 423
internal structure , 423
location , 423 periphery and shape , 423 surrounding structures relating to ,
423 synonym for , 423
Bystander effect , 20
C
Calcereous concretions , 534 Calcifi cations. See Dystrophic calcifi cation, in
tonsils; Heterotopic calcifi cation; Hypocalcifi cation; Laryngeal cartilage calcifi cations; Soft tissue(s)
Calcifi ed atherosclerotic plaque , 530 defi nition of , 530 differential diagnosis and , 530 management of , 530 radiographic fi ndings of , 530
internal structure , 530 location , 530 , 531f periphery and shape , 530
Calcifi ed lymph nodes , 526 clinical features of , 527 defi nition of , 526 differential diagnosis and , 527 management of , 528 radiographic features of , 527
internal structure , 527 location , 527 , 528f periphery , 527
Calcifi ed mixed odontoma , 378 Calcifying cystic odontogenic tumor (CCOT) ,
356b clinical features of , 357 CT of , 357f defi nition of , 356 differential diagnosis and , 357 management of , 357 radiographic features of , 357
internal structure , 357 , 357f location , 357 periphery and shape , 357 surrounding structures relating to , 357
synonyms for , 356 Calcifying epithelial odontogenic cyst , 356 Calcifying odontogenic epithelial tumors (CEOT) ,
377 clinical features of , 377 defi nition of , 377 differential diagnosis and , 377 radiographic features of , 377
internal structure , 377 , 378f location , 377 periphery , 377 surrounding structures relating to , 377
synonyms for , 377 treatment for , 378
Calcium , 454 Calcium hydroxide base , 171 , 172f Calcium phosphate , 526 Calcium pyrophosphate dihydrate deposition
disease , 496 Calcium salts , 526 Calculus , 584
deposits of , 291 , 292f Caldwell view , 509 , 516 Caldwell-Luc operation , 514 , 515 , 518 , 523
Calibration, of x-ray machine , 103 , 103f beam energy , 103 collimation and beam alignment , 103 focal spot size , 103 mA , 103 timer , 103 tube head stability , 103 x-ray output , 103 , 103f
Cancellous bone , 155 , 325 Cancer
atomic bomb survivors ’ mortality rate of , 28t brain and nervous system , 29 dental radiology for survivor of , 425 esophageal , 29 of other organs , 29 radiation-induced , 29b , 35 of salivary glands , 29 thyroid , 29
Candida albicans, 23 , 24 Canine projection
mandibular , 127b maxillary , 117b periapical , 148
Canines , 135t Carcinogenesis
brain and nervous system cancer , 29 cancer, of other organs , 29 esophageal cancer , 29 leukemia , 29 salivary gland cancer , 29 as stochastic effect of radiation , 28 , 28t , 29b , 29t thyroid cancer , 29
Carcinoma ex mixed tumor , 592 Carcinoma ex odontogenic cyst , 410 Carcinoma ex pleomorphic adenoma , 592 Carcinomas , 407 . See also Malignant and
metastatic tumors, of salivary glands ; specifi c Squamous cell carcinomas entries
adrenal , 461 central mandibular , 409 central mucoepidermoid , 411 central squamous cell , 409 CT of , 408f epidermoid , 407 epidermoid cell , 410 intra-alveolar , 409 intramandibular , 409 malignant ameloblastoma and ameloblastic ,
411 mucoepidermoid , 411 , 592 primary intra-alveolar epidermoid , 409 primary intraosseous , 409 , 410 primary odontogenic , 409 round cell , 417
Cardiovascular and central nervous system syndrome , 27
Caries. See also Dental caries bitewing projections and , 270 radiation , 24 , 26f , 278 radiographs and , 245 rampant , 272f , 276 recurrent , 277 residual , 277 secondary , 277
Carious lesions , 270 Cataracts , 28 Cathode ray tube (CRT) , 78 , 85
display of , 85 Cathodes , 5 , 6f
Bone(s) (Contined) Burkitt’s lymphoma (Continued)
INDEX 617
Cavitary sialectases , 587 , 592 Cavitation , 270
clinical, lesions relating to , 274 treatment considerations and, of lesions , 276 ,
277f CBCT. See Cone-beam computed tomography CCD. See Charge-coupled device; Cleidocranial
dysplasia CCOT. See Calcifying cystic odontogenic tumor CEJ. See Cementoenamel junction Cell(s)
deterministic effects on , 19 ethmoid air , 506 , 508f , 552 replication ’ effects on , 20
apoptosis , 20 bystander effect , 20 DNA damage , 20 recovery , 20
Schwann , 389 , 391 stages of cycle of , 20f type of, radiosensitivity and , 20 , 22t
Cementicles , 433 Cementifying fi broma , 440 Cementoblastoma, benign. See Benign
cementoblastoma Cementoenamel junction (CEJ) , 283 , 285 , 286 Cementoma , 387 , 432 Cemento-osseous dysplasias , 432
FOD , 437 PCD , 328 , 432
Cemento-ossifying fi broma (COF) , 440 clinical features of , 440 CT of , 441f , 442 defi nition of , 440 differential diagnosis and , 434f , 440 , 442f management of , 442 PCD v. , 441 radiographic features of , 440
internal structure , 440 , 441f , 442f location , 440 periphery , 440 , 441f surrounding structures relating to , 440 ,
442f synonyms for , 440
Cementum , 152 Central giant cell granuloma (CGCG) , 442b
clinical features of , 443 CT of , 444 , 444f defi nition of , 442 differential diagnosis and , 444 management of , 444 radiographic features of , 443
internal structure , 443 , 443f , 444f location , 443 periphery , 443 surrounding structures relating to , 443 , 443f
synonyms for , 442 Central hemangioma , 395b
clinical features of , 395 defi nition of , 395 differential diagnosis and , 396f , 397 radiographic features of , 396
internal structure , 396 , 396f , 397f location , 396 periphery , 396 , 396f surrounding structures relating to , 397 ,
397f treatment for , 397
Central incisor projection, maxillary , 113b
Central mandibular carcinoma , 409 Central mucoepidermoid carcinoma , 411
clinical features of , 411 defi nition of , 411 differential diagnosis and , 411 management of , 411 radiographics features of , 411
internal structure , 411 location , 411 periphery and shape , 411 , 411f surrounding structures relating to , 411
synonym for , 411 Central nervous system syndrome , 27 Central odontogenic fi broma , 387
clinical features of , 388 defi nition of , 387 differential diagnosis and , 389 radiographic features of , 389
internal structure , 389 location , 389 periphery , 389 surrounding structures relating to , 389
synonyms for , 387 treatment for , 389
Central squamous cell carcinoma , 409 Central x-ray beam
lateral skull projection and , 191 mandibular oblique lateral projections and ,
200 mandibular ramus projection and , 200 posteroanterior skull projection and , 197 reverse-Towne projection and , 197 SMV projection and , 193 Waters projection and , 194
CEOT. See Calcifying odontogenic epithelial tumors
Cephalometric and panoramic equipment, infection control and , 105
Cephalometric extraoral projection, in dentistry , 56
Cephalometric landmarks, defi nition of , 194b Cephalometric projection
extraoral , 56 lateral , 191
Cephalometric radiography, for dental implants , 597 , 598
Cephalometry , 191 three-dimensional, for orthodontics , 237 , 239f
Cervical burnout , 152 , 272 Cervical vertebrae , 184 CGCG. See Central giant cell granuloma Chair, disinfecting and covering of , 104 , 104f ,
105f Changing solutions , 72 Characteristic curve , 58 , 58f Characteristic radiation , 10 , 10f Characteristics
digital detector , 83 of HFM , 564 , 565f image , 58
Charge packets , 79 Charge-coupled device (CCD) , 79 , 80 , 80f , 81f
detector sensitivity and , 84 heat relating to , 98 image restoration and , 86 latitude in , 84 occlusal radiography and , 147 panoramic imaging and , 182 , 182f periapical radiography and , 109 , 111 , 112
Cherubism , 354 , 446 children and , 446 clinical features of , 446 defi nition of , 446 differential diagnosis and , 446 management of , 446 radiographic features of , 446
internal structure , 446 location , 446 , 447f periphery and shape , 446 surrounding structures relating to , 446
synonym for , 446 Chest and abdomen, CT of , 32 , 36 Children
cherubism and , 446 with diabetes mellitus , 460 hyperpituitarism in , 458 with hypophosphatasia , 463 with hypophosphatemia , 464 hypothyroidism in , 460 with juvenile arthrosis , 483 during panoramic imaging , 180 radiographic examination of , 147 with renal osteodystrophy , 463 with rickets , 462
Chin and occlusal plane, panoramic image relating to , 181 , 181f
Chondroblastomas , 500 Chondrocalcinosis , 496b
clinical features of , 496 CT for , 496 , 497f defi nition of , 496 differential diagnosis and , 496 MRI of , 496 radiographic features of , 496 , 497f synonyms for , 496 treatment of , 496
Chondrogenic sarcoma , 416 Chondromatosis, synovial , 496 Chondrosarcoma , 416 , 501 , 502f
clinical features of , 416 defi nition of , 416 differential diagnosis and , 416 management of , 416 radiographic features of , 416
internal structure , 416 , 417f location , 416 , 417f periphery and shape , 416 surrounding structures relating to , 416
synonym for , 416 Chromosome aberrations , 19 , 20f , 21f Chronic apical periodontitis , 326 Chronic diffuse sclerosing osteomyelitis , 334 Chronic JA , 493 Chronic lesions , 325 , 326 Chronic lymphocytic leukemia , 424 Chronic maxillary sinusitis , 510 , 511 Chronic myelogenous leukemia , 424 Chronic nonsuppurative osteomyelitis , 334 Chronic phase, of osteomyelitis , 331 , 334 Chronic recurrent multifocal osteomyelitis
(CRMO) , 334 Chronic renal failure , 463 Cieszynski ’ s rule of isometry , 111 Clark ’ s rule , 50 Clearing agent , 68 Cleft lip (CL/P) and palate (CP) , 562
clinical features of , 562 defi nition of , 562

618 INDEX
management of , 563 radiographic features of , 562 , 563f
Cleidocranial dysostosis , 567 Cleidocranial dysplasia (CCD) , 295 , 567
clinical features of , 567 , 569f CT of , 569f , 571f defi nition of , 567 differential diagnosis and , 571 management of , 569f , 571 radiographic features
associated with teeth , 569 , 571f general , 567 , 569f of jaws , 567
synonym for , 567 Clinical cavitation, lesions relating to , 274 Clinical comparisons, of intraoral imaging
alternatives , 91t Clinical considerations
of CBCT , 229 archiving, exporting, and distribution relating
to , 235 imaging optimization , 233 , 234f imaging protocol , 233 patient preparation , 233 patient selection criteria , 229 reports relating to , 233
of digital imaging , 82f , 91 , 91t , 92b PSP relating to , 91 , 98
Clinical examination, radiographic interpretation relating to , 256
CL/P. See Cleft lip and palate CMOS. See Complementary metal oxide
semiconductors COF. See Cemento-ossifying fi broma Coherent scattering , 13 , 13f , 13t Collars, leaded , 39 , 39f , 103 Collimation , 12 , 12f
beam alignment and , 103 rectangular , 37 , 38f , 39f
Combination crown and root fractures , 548
clinical features of , 548 defi nition of , 548 management of , 548 radiographic features of , 548
Complementary metal oxide semiconductors (CMOS) , 80 , 82f , 84
heat relating to , 98 occlusal radiography and , 147 periapical radiography and , 109 , 111 ,
112 Complex composite odontoma , 378 Complex odontoma , 378 Complicated dental crown fractures , 544 Composites
implant-prostheses , 608 restorative materials and , 171 , 174f
Composition of grids , 63 , 64f of intensifying screens , 57 , 57f of matter , 2 of x-ray fi lm , 53 , 54f , 54t
Compound composite odontoma , 378 Compound odontoma , 378 Compton absorption , 15f Compton interactions , 65 Compton scattering , 12 , 13f , 13t , 14 Computed radiology , 78
Computed tomography (CT) , 207 of ABC , 445f , 446 , 446f advantages of , 210 of ameloblastoma , 376 , 376f , 377 applications of , 211 for arteriovenous fi stula , 398 , 399f artifacts and , 210 of bacterial sialadenitis , 586 , 586f of basal cell nevus syndrome , 354 , 355f of carcinomas , 408f of CCD , 569f , 571f of CCOT , 357f of CGCG , 444 , 444f of chest and abdomen , 32 , 36 of chondrocalcinosis , 496 , 497f of COF , 441f , 442 contrast agents and , 211 , 212f of coronoid hyperplasia , 484 of cysts
dermoid , 361 , 361f glandular odontogenic , 356f nasolabial , 360 , 360f nasopalatine duct , 359f radicular , 344f , 345f residual , 348f
for desmoplastic fi broma, of bone , 402f , 403
detectors and , 208 of DJD , 490 of dystrophic calcifi cation, in tonsils , 528 of fi brous dysplasia , 430 of FOD , 440f full-body , 36 for Gardner ’ s syndrome , 394f of hemifacial hyperplasia , 572f of hemifacial microsomia , 564 , 566f image and , 209 , 210f , 211f image reconstruction and , 208 , 209f , 210f implants and , 247 of JA , 494f jaw disease and , 247 jaw lesions and , 330 , 332 , 335 , 336 , 339 of KOTs , 352f , 353 of lingual salivary gland depression , 574 ,
576f of mandible , 184 mechanical geometry of , 208f of neurofi bromatosis , 392 , 392f of odontogenic myxoma , 386f , 387 of osseous structures , 475f , 478 of Paget ’ s disease , 448f of paranasal sinuses , 248 , 506 , 509
fi brous dysplasia , 522f mucocele , 514f odontogenic cysts , 519 , 520f osteoma , 516f retention pseudocyst , 512f sinusitis , 510 , 510f , 511f squamous cell carcinoma , 518f
of PCD , 434f of sarcomas , 415f , 417f , 418f of SBC , 363f scanners and , 207 , 208f of sialioliths , 531f of synovial chondromatosis , 496 , 497f of teeth and facial structures , 541 , 548
Le Fort , 555 , 556 , 558 , 559f mandibular , 541 , 548 , 549f , 550 , 551f ,
552f
midfacial/maxillary , 553 , 553f zygomatic , 554 , 554f
of TMJ fracture , 498 trauma and , 248 of Treacher Collins syndrome , 568f of tumors
benign , 501f , 590 , 591 , 591f jaw , 369f , 370f , 371f , 374f , 375 , 375f malignant, of salivary glands , 592 , 593f ,
594f malignant, TMJ and , 501 , 501f , 502f metastatic , 413f
x-ray tubes and , 7f , 208 Computer-controlled multimodality machines ,
179 Conchae and nasal cavity , 186 Concrescence , 301b
clinical features of , 301 defi nition of , 301 differential diagnosis and , 301 management of , 301 radiographic features of , 301 , 302f
Concussion, teeth relating to , 542 clinical features of , 542 defi nition of , 542 management of , 542 radiographic features of , 542 , 542f
Condylar fractures , 498 , 498f , 499 Condylar hyperplasia , 481
clinical features of , 481 defi nition of , 481 differential diagnosis and , 481 radiographic features of , 481 , 482f treatment of , 481
Condylar hypoplasia , 481b , 564 CBCT and , 483f clinical features of , 481 defi nition of , 481 , 482f differential diagnosis and , 481 radiographic features of , 469f , 481 , 483f treatment of , 483
Condylar, mandibular , 175 Condylar movement, TMJ and , 476 , 477f Condylar process and TMJ, mandible relating to ,
184 Condyle. See also Bifi d condyle
mandibular fractures relating to , 549 TMJ and , 473 , 474f
Cone beam effect , 236 Cone beamed-related artifacts , 234f , 235 Cone-beam computed tomography (CBCT) , 179 ,
184 , 225 , 226f clinical considerations of , 229 condylar hypoplasia and , 483f DJD and , 490f , 491f , 492f FDA and , 227t , 228t image acquisition and , 225 , 227t , 228t image artifacts and , 235 implants and , 247 jaw disease and , 247 limitations of , 236
image noise , 236 poor soft tissue contrast , 236
of mandible, for dental implants , 604f of maxilla, for dental implants , 603f for orthodontic evaluation , 246 principles of , 225 , 226f RA and , 492f
Cleft lip (CL/P) and palate (CP) (Continued) Computed tomography (CT) (Continued)
INDEX 619
specifi c dental applications of , 237 strengths of , 236
high-speed scanning , 236 interactive analysis , 236 low patient radiation dose , 236 size and cost , 236 submillimeter resolution , 236
TMJ and , 477 , 477f , 478 trauma and , 248
Cone-beam imaging geometry , 226f Cone-beam scanners , 225 Congenital syphilis , 314
clinical features of , 314 , 314f defi nition of , 314 management of , 315 radiographic features of , 314
Consumer and industrial products, human-origin radiation and , 32
Contamination infection control and , 100 of processing equipment, prevention of , 106 ,
107f Continuing education, radiation exposure relating
to , 42 Contrast. See also High contrast fi lm;
Radiographic contrast brightness and , 86 , 87f , 88f gray scale of
long , 59 short , 59
insuffi cient , 74b , 76f low , 59 poor soft tissue, CBCT relating to , 236
Contrast agents CT and , 211 , 212f MRI and , 216 , 217f
Contrast resolution , 83 , 83f Conventional intraoral fi lm, for radiologic
examination , 270 , 271f , 272f Conventional radiographs , 46 Conventional sialography , 579 , 580 , 582f , 585 , 587 ,
588f Conventional tomography , 222 , 223f
for dental implants , 597 , 599t , 600 , 601f , 602f
for osseous structures , 477 , 487f Cooley ’ s anemia , 469 Coronoid hyperplasia , 484
bilateral developmental , 484 clinical features of , 484 CT of , 484 defi nition of , 484 differential diagnosis and , 484 radiographic features of , 484 , 484f , 485f treatment of , 485
Coronoid process , 170 , 172f mandible relating to , 184
Cortical bone, outer, periosteal reactions and, intraosseous lesions relating to , 260f , 262f , 265 , 266f
Cortical border, of mandible , 176 Cortical boundary, of maxilla , 186 Cortical margins, sclerotic , 375 , 377f Cortical outline, of maxilla , 186 Cortical plate loss, lingual or buccal , 287 , 287f Corticosteroids, exogenous , 461 Cosmic radiation , 32
CP. See Cleft lip and palate Cranial suture synostosis , 564 Craniofacial anomalies , 562 Craniofacial disjunction. See Le Fort fractures Craniofacial dysostosis , 563 Craniofacial microsomia , 564 Cretinism , 460 CRMO. See Chronic recurrent multifocal
osteomyelitis Cross-contamination , 101 Cross-sectional mandibular occlusal projection ,
145b Cross-sectional maxillary occlusal projection , 142b Crouzon syndrome (CS) , 563
clinical features of , 564 , 565f defi nition of , 563 differential diagnosis and , 564 management of , 564 mutations relating to , 563 radiographic features , 564
general , 564 , 565f of jaw , 564
synonyms for , 563 CRT. See Cathode ray tube CS. See Crouzon syndrome CT. See Computed tomography Cupping artifact , 235 Cushing ’ s syndrome , 455t , 461
clinical features of , 461 defi nition of , 461 radiographic features of , 461 , 461f
Cyst(s). See also Bone apical periodontal , 343 benign mucosal , 511 benign, of antrum , 511 cystlike lesions and, of jaws. See Jaws, cysts and
cystlike lesions of. dental , 343 extravasation , 361 false , 511 follicular , 346 globulomaxillary , 361 Gorlin , 356 incisive canal , 358 interstitial , 511 lymphangiectatic , 511 mandibular infected buccal , 350 median anterior maxillary , 358 median mandibular and globulomaxillary , 361 median palatine , 358 , 361 mesothelial , 511 mucosal antral , 511 mucous retention , 511 nasoalveolar , 360 nasopalatine canal , 358 nonodontogenic , 358 paradental , 350 , 350f periapical , 343 primordial , 351 , 361 retention , 511 squamous cell carcinoma in , 410
Cystic lesions of jaws
MRI of , 377 , 382 , 589f of salivary glands , 589
defi nition of , 589 , 589f radiographic features of , 589 , 589f treatment of , 589
Cystic odontoma , 378
Cysticercosis , 529 clinical features of , 529 defi nition of , 529 differential diagnosis and , 529 management of , 529 radiographic features of , 529
internal structure , 529 location , 529 periphery and shape , 529
D
Dacryosialoadenopathia atrophicans , 587 Dark spots or lines , 74b , 76f Darkroom equipment , 68 , 69f
drying racks , 71 lightproof , 69 manual processing tanks , 69 , 71f safelighting , 69 , 70f thermometer , 69 timer , 69
Darkroom, lightproof , 69 Darkroom safelighting, checking of , 102 Darkroom techniques, panoramic imaging and ,
182 DBI. See Dense bone island Decay , 215 Deciduous and permanent molar periapical
projection , 148 Deciduous mandibular molar projection , 148 Deciduous maxillary molar periapical projection ,
148 Deciduous predecessor , 300 Deformities
osseous, in furcations of multirooted teeth , 287 , 288f
perforation and, TMJ relating to , 489 , 489f Degenerative joint disease (DJD) , 490
CBCT of , 490f , 491f , 492f clinical features of , 490 CT of , 490 defi nition of , 490 radiographic features of , 490 , 491f ,
492f synonym for , 490
DEJ. See Dentinoenamel junction Demineralization , 270
hyperparathyroidism and , 456 Dens evaginatus , 306b
clinical features of , 306 , 307f defi nition of , 306 , 307f differential diagnosis and , 307 management of , 307 radiographic features of , 307 , 307f synonym for , 306
Dens invaginatu/dens in dente/dilated odontome , 304
clinical features of , 305 , 305f defi nition of , 304 , 305f differential diagnosis and , 306 management of , 306 radiographic features of , 305f , 306 , 306f synonyms for , 304
Dense bone island (DBI) , 370 clinical features of , 370 defi nition of , 370 differential diagnosis and , 372 radiographic features of , 372
internal structure , 372
Cone-beam computed tomography (CBCT) (Continued)
620 INDEX
location , 372 , 372f periphery , 372 surrounding structures relating to , 372 , 372f
synonyms for , 370 treatment for , 373
Densitometer , 100 Density
of bone, trabecular pattern and , 259f , 265 electron, Compton scattering relating to , 14 of fi lm , 65 , 67f image, nonuniform , 92b , 93f internal, trabecular pattern of bone and,
changes in , 289 , 289f proton , 215 radiographic , 58 , 58f spin , 215 subject , 59 variations in , 65
Dental anomalies acquired abnormalities , 315 developmental abnormalities , 295 disease detection/monitoring, dental
radiographs and , 245 radiographs and , 245
Dental caries , 270 , 271f alternative diagnostic tools, for detection of ,
280 bacteria relating to , 270 decline in , 271 mineral loss relating to , 270 operative treatment for , 274 radiologic examination, for detection of , 270 ,
271f , 272 tooth, microfl ora, diet relating to , 270 treatment considerations for , 280
Dental conditions, periodontal disease associated with , 291
local irritating factors , 291 , 292f occlusal trauma , 291 open contacts , 291 , 291f tooth mobility , 291
Dental crown fractures , 544 clinical features of , 544 complicated , 544 defi nition of , 544 management of , 544 radiographic features of , 544 , 545f uncomplicated , 544
Dental cyst , 343 Dental exposure, PID and , 37 , 38 , 38f , 39 Dental exposure, to radiation, reduction of , 36
continuing education relating to , 42 examination relating to , 37 patient selection criteria , 36 personnel protection relating to , 41 , 41f , 42f principles relating to
dose limitation , 42 justifi cation , 41 optimization , 42
quality assurance relating to , 41 Dental fl oss injury , 316b
clinical features of , 316 , 316f differential diagnosis and , 316 management of , 316 radiographic features of , 316
Dental implants , 598f bone quantity assessed for , 602 diagnostic imaging for , 597 , 598t , 599t
imaging techniques for , 597 conventional tomography , 597 , 599t , 600 ,
601f , 602f intraoral radiography , 597 , 599f , 599t lateral and lateral-oblique cephalometric
radiography , 597 , 598 panoramic radiography , 597 , 598 , 599t ,
600f reformatted CBCT and MDCT , 597 , 599t ,
600 , 603f , 604f , 605 , 607 , 607f , 608f , 610f
implant-prostheses composite relating to , 608 intraoperative and postoperative assessments
for , 607 , 608f , 609f , 609t , 610f periosteal , 598f potential sites for
diagnostic images of , 602 radiographic visualization of , 602
preoperative planning for , 602 imaging stents , 601f , 605 , 605f interactive diagnostic software , 605 , 606f selective diagnostic imaging for , 599t , 607 ,
607f success/failure of , 608 treatment stages relating to , 598t
Dental malocclusion and growth/development, radiographs relating to , 245 , 246f
Dental plaque-induced gingivitis , 282 Dental radiographs
ADA and , 245 , 250 cost v. benefi ts of , 245 disease detection/monitoring and , 244 examinations relating to , 248 guidelines for ordering of , 249
administrative radiographs and , 249 previous radiographs and , 249
guidelines for prescribing of , 244 , 252t philosophy of , 244 , 245
Dental radiographs, guidelines for ordering of , 250 , 252t
examples of , 251 patient examination relating to , 250
initial visit , 250 , 252t recall visit , 246f , 251
special considerations relating to , 251 pregnancy , 251 radiation therapy , 251
Dental radiography , 35 , 36 Dental radiology, for cancer survivor , 425 Dental restorations, radiographic detection of
lesions associated with , 277 , 279f Dental root fractures , 545
clinical features of , 545 defi nition of , 545 differential diagnosis and , 545 management of , 545 radiographic features of , 545 , 546f , 547f
Dental structures displaced into sinuses , 522
clinical features of , 523 defi nition of , 522 differential diagnosis and , 523 management of , 523 radiographic features of , 523
internal structure , 523 location , 523 periphery and shape , 523 surrounding structures relating to , 523
Dental x-ray beam , 12 , 13 coherent scattering relating to , 13 , 13f , 13t Compton scattering relating to , 13f , 13t , 14 photoelectric absorption scattering relating to ,
13 , 13f , 13t , 14f Dental x-ray machine circuitry , 7f , 8 Dentigerous cysts , 346
clinical features of , 346 defi nition of , 346 differential diagnosis and , 348 management of , 350 radiographic features of , 347
internal structure , 348 location , 347 , 347f periphery and shape , 347 surrounding structures relating to , 347f , 348 ,
348f , 349f synonym for , 346
Dentin , 152 . See also Secondary dentin hereditary opalescent , 309
Dentin dysplasia , 310b clinical features of , 310 coronal , 310 defi nition of , 310 differential diagnosis and , 310 management of , 311 radicular , 310 radiographic features of , 310 , 310f , 311f
Dentin sialophosphoprotein (DSPP) , 309 Dentinoenamel junction (DEJ) , 272 , 276 Dentinogenesis imperfecta , 309
clinical features of , 309 defi nition of , 309 differential diagnosis and , 310 management of , 310 radiographic features of , 309 , 309f synonym for , 309
Dentistry extraoral projection in , 56 specifi c CBCT applications in , 237
implant site assessment and , 237 , 237f , 238f
inferior alveolar canal, localization of , 238 , 240f
maxillofacial complex, conditions of , 238 , 241f , 242f
orthodontics and three-dimensional cephalometry , 237 , 239f
rapid prototyping , 238 , 242f TMJ , 238 , 240f
Dentition anatomic structures relating to , 189f mixed (7 to 12 years) , 148 , 149f primary (3 to 6 years) , 147 , 148f
Deoxyribonucleic acid (DNA) , 22 , 28 cell replication and , 20 changes in , 19 , 28 intracellular structures and , 19 , 20f
Dermoid cysts , 360b clinical features of , 360 CT of , 361 , 361f defi nition of , 360 differential diagnosis and , 361 management of , 361 MRI of , 361 radiographic features of , 361
internal structure , 361 , 361f location , 361 periphery and shape , 361
Dense bone island (DBI) (Continued) Dental implants (Continued)
INDEX 621
Desmoplastic fi broma, of bone , 402 clinical features of , 402 CT of , 402f , 403 defi nition of , 402 differential diagnosis and , 403 MRI of , 403 radiographic features of , 402
internal structure , 402 , 402f location , 402 periphery , 402 surrounding structures relating to , 403
synonyms for , 402 treatment for , 403
Despecking fi lters , 87 Detection/monitoring of disease , 244 Detective quantum effi ciency (DQE) , 63 Detector latitude , 84 , 84f Detector sensitivity , 84
CCD and , 84 as digital detector characteristic , 84 PSP and , 84
Detectors. See also Digital detector characteristics; Solid-state detectors
CT and , 208 Deterministic effects
on cells , 19 of radiation , 19 , 19t on tissues and organs , 20
long-term , 22 modifying factors , 22 short-term , 22 , 22b
of whole-body radiation , 26 Developer , 67 , 100 Developer replenisher , 65 , 68 , 73 Developing solution , 65
components of activator , 67 developer , 67 , 100 preservative , 67 restrainer , 67
Development and growth, of embryos and fetuses , 28
Developmental abnormalities dental anomalies and , 295 of TMJ , 480
bifi d condyle , 485 condylar hyperplasia , 481 condylar hypoplasia , 481 coronoid hyperplasia , 484 juvenile arthrosis , 483 , 564
Developmental disturbances, of face and jaws. See Face and jaws, developmental disturbances of
Developmental salivary gland defect , 574 Development/growth/dental malocclusion,
radiographs relating to , 245 , 246f Diabetes mellitus , 460
children with , 460 clinical features of , 460 defi nition of , 460 periodontal disease and , 293 radiographic features of , 461 types of , 460
Diagnodent laser-light fi beroptic transillumination (FOTI) , 280
Diagnosis , 89 treatment and, of human-origin radiation , 32
Diagnostic images, appropriate, acquisition of , 256
number and type of , 256
quality of , 256 viewing conditions relating to , 256
Diagnostic imaging. See also Applied diagnostic imaging
for dental implants , 597 , 598t , 599t , 602 of soft tissue infection , 336 , 337f , 338f of TMJ , 476
Diagnostic stent , 237 , 238f Diagnostic tools, for dental caries , 280 DICOM. See Digital Imaging and
Communications in Medicine Diet, microfl ora, tooth, dental caries relating to ,
270 Digital, defi nition of , 78 Digital detector characteristics , 83
contrast resolution , 83 , 83f latitude , 84 , 84f sensitivity , 84 spatial resolution , 46 , 83 , 84f
Digital image backup considerations , 90b Digital image receptor exposure, processing, and
handling , 92b damaged image receptors , 92b , 95f , 96f , 97f image processing, improper use of , 92b , 97f images
distorted , 92b , 94f double , 92b , 94f , 95f noisy , 92b , 93f
nonuniform image density , 92b , 93f Digital image receptors
infection and , 98 technology of , 78
photostimulable phosphor , 81 , 82f solid-state , 78
Digital image viewing , 85 cathode ray tube display , 85 electronic display considerations , 85 hard copies , 85 image analysis , 89 image enhancement , 86 image processing , 86 image restoration , 86 thin fi lm transistor display , 85
Digital images , 78 Digital imaging , 32 , 37 , 37f , 78
analog v. digital , 78 , 79f , 80f clinical considerations of , 82f , 91 , 91t , 92b digital detector characteristics , 83 digital image receptors , 78 digital image viewing , 85 fi lm or, intensifying screens and , 37 fi lm v. , 98t image storage , 90 , 90b PSP and , 272 for radiologic examination , 270 , 271f , 272 ,
272f solid-state detectors and , 272 systems compatibility , 90
Digital Imaging and Communications in Medicine (DICOM) , 90 , 182 , 237
Digital subtraction radiography (DSR) , 87 , 89f Dilaceration , 303
clinical features of , 303 , 304f defi nition of , 303 differential diagnosis and , 304 management of , 304 radiographic features of , 303 , 304f
Dimensional aberrations, panoramic imaging relating to , 178f , 179f , 181
Direct digital acquisition panoramic machines , 182
Direct effects free radicals , 18 of radiation chemistry , 18
Direct exposure fi lm , 53 Direct volume rendering , 229 , 232f Disabilities, patients with
mental , 149 physical , 150
Disease(s). See also DJD; Jaws; Paranasal sinuses; Periodontal disease; Salivary gland disease
calcium pyrophosphate dihydrate deposition , 496
detection/monitoring of, dental radiographs and , 244
caries and , 245 dental anomalies and , 245 growth/development/dental malocclusion
and , 245 , 246f implants and , 247 of jaw , 247 occult disease and , 246 paranasal sinuses and , 248 periodontal diseases and , 245 TMJ and , 247 trauma and , 248
Graves ’ , 460 Hand-Sch ü ller-Christian , 448 infl ammatory odontogenic , 508 Langerhans ’ cell , 448 , 460 , 500 Letterer-Siwe , 428 , 448 , 449 maxillary sinuses relating to , 507 Mikulicz , 587 periapical , 167 , 168f radiographic recognition of , 152 von Recklinghausen , 391
Disinfecting solution, infection control and , 107
Disinfection, infection control and , 104 , 104f , 105f
Disk displacement of , 486 interarticular, TMJ and , 474 , 476f reduction and nonreduction of, TMJ and , 487f ,
488 , 488f replacement of, TMJ and , 487 , 487f
Dislocation, TMJ and , 498 clinical features of , 498 defi nition , 498 differential diagnosis and , 498 radiographic features of , 498 treatment of , 498
Distodens , 295 Distorted images , 92b , 94f Distortion
of image shape. See Image shape distortion. of image size , 46
DJD. See Degenerative joint disease DNA. See Deoxyribonucleic acid Doppler ultrasound , 222 , 223f Dose , 15
absorbed , 16 doubling , 30 effective , 16 equivalent , 16 of ionizing radiation, annual effective , 33t
Diagnostic images, appropriate, acquisition of (Continued)
622 INDEX
irradiation relating to , 22 limitation of , 42 nonoccupational limits of , 34t occupational limits of , 34 , 34t patient exposure and , 35 , 35t radiation, low, CBCT relating to , 236 rate of, irradiation relating to , 22 risk and, in radiography , 34
Dosimetry, radiation relating to , 15 , 16t Dots per inch (DPI) , 86 Double images, digital image receptor relating to ,
92b , 94f , 95f Double lamina dura , 154 Double-emulsion fi lm , 53 Doubling dose , 30 DPI. See Dots per inch DQE. See Detective quantum effi ciency Drying racks , 71 DSPP. See Dentin sialophosphoprotein DSR. See Digital subtraction radiography Ductal sialadenitis , 586 Duplicating radiographs , 77 Dysplasia(s). See also Dentin dysplasia; Fibrous
dysplasia; Regional odontodysplasia bone , 428 , 508 CCD , 295 , 567 fl orid cemento-osseous , 437 FOD , 437 hemimaxillofacial , 573 lateral facial , 564 oculoauriculovertebral , 564 PCD , 328 , 432 SOD , 573
Dystrophic calcifi cation , 526 calcifi ed lymph nodes , 526 cysticercosis , 529 of oral regions , 526
clinical features of , 526 defi nition of , 526 radiographic features of , 526 , 527f
Dystrophic calcifi cation, in tonsils , 526 , 528b clinical features of , 528 CT of , 528 defi nition of , 528 differential diagnosis , 529 radiographic features of , 528
internal structure , 528 location , 528 , 529f periphery , 528
synonyms for , 528 treatment of , 528
E
Ear lobe and ear decorations , 184 Echo time (ET) , 215 ECM. See Electrical conductance measurement Edema, preorbital , 552 Edentulous patients , 151
radiographic techniques for , 151 Effective dose , 16 Effusion, TMJ and , 496
clinical features of , 497 defi nition , 496 differential diagnosis and , 497 fi brous adhesions and , 488f , 489 joint , 497 radiographic features of , 488f , 497 treatment of , 497
EG. See Eosinophilic granuloma Ektavision G fi lm , 70f Electrical conductance measurement (ECM) , 270 Electromagnetic radiation , 4 , 4f Electron beam CT , 207 Electron binding energy , 3 Electron density, Compton scattering relating to ,
14 Electron orbitals , 2 , 3f Electronic display considerations , 85 Electrons
atomic structure and , 2 ionization and , 4
Embryolastiques , 373 Embryos and fetuses
growth and development of , 28 radiation damage to , 28
Emulsion components of , 53 , 54f
silver halide grains , 53 , 54f , 56 , 65 vehicle matrix , 53
fi lm , 65 Enamel cap , 152 Enamel drop , 311 Enamel nodule , 311 Enamel pearl , 311
clinical features of , 311 defi nition of , 311 , 313f differential diagnosis and , 312 management of , 312 radiographic features of , 312 , 313f synonyms for , 311
Enameloma , 311 Endocrine disorders, of jaws , 454
Cushing ’ s syndrome , 455t , 461 diabetes mellitus , 460 hyperparathyroidism , 430 , 444 , 454 hyperpituitarism , 455t , 458 hyperthyroidism , 455t , 460 hypoparathyroidism and
pseudohypoparathyroidism , 455t , 457 hypopituitarism , 455t , 460 hypothyroidism , 455t , 460
Endodontic therapy , 171 Endodontics, radiographic techniques for ,
150 Endothelial myeloma , 417 Enostosis , 330f , 370 Environmental Protection Agency (EPA) , 104 Eosinophilic granuloma (EG) , 448 , 450 , 452 EPA. See Environmental Protection Agency Epidermoid carcinoma , 407 Epidermoid cell carcinoma , 410 Epithelial odontoma , 373 Epithelial papilloma , 515 Equivalent dose , 16 Erosion , 316
clinical features of , 316 defi nition of , 316 differential diagnosis and , 316 management of , 316 radiographic features of , 316 resorption , 316
Eruption accelerated or delayed , 454 of teeth , 300
Erythroblastic anemia , 469 Esophageal cancer , 29 ET. See Echo time Ethmoid air cells , 506 , 508f , 552
Ewing ’ s sarcoma , 417 clinical features of , 417 defi nition of , 417 differential diagnosis and , 418 management of , 418 radiographic features of , 417
internal structure , 418 location , 417 periphery and shape , 417 , 418f surrounding structures relating to , 418
synonyms for , 417 Exogenous corticosteroids , 461 Exostoses , 367 , 369
clinical features of , 369 defi nition of , 369 radiographic features of , 369
internal structure , 370 location , 369 periphery , 370 , 371f
synonym for , 369 treatment for , 370
Exponential pattern, of absorption , 2 , 15f Exporting, archiving, and distribution, CBCT
relating to , 235 Exposure. See also Radiation
to dental radiation. See also Dental exposure, to radiation, reduction of.
PID and , 37 , 38 , 38f , 39 digital image receptor relating to. See Digital
image receptor exposure, processing, and handling.
dose and, of patient, radiography relating to , 35 , 35t
human, to ionizing radiation , 34t , 36 radiographic density relating to , 58 steps for making of , 120
Exposure charts, checking of , 102 , 102f Exposure control, automatic , 226 Exposure fi lm, direct , 53 Exposure time
correct, establishment of , 75 x-ray beam relating to , 10 , 11f
External fi ltration , 11 External oblique ridge , 169 , 171f External radiation , 32 External resorption , 318
clinical features of , 318 defi nition , 318 differential diagnosis and , 318 management of , 318 radiographic features of , 318 , 319f
Extraoral fi lms , 68 Extraoral projection, in dentistry
cephalometric , 56 panoramic , 56
Extraoral radiographic examinations , 191 image, evaluation of , 200
lateral projection , 201 , 202f posteroanterior projection , 203 , 204f reverse-Towne projection , 191 SMV projection , 201 Waters projection , 191 , 203
selection criteria for , 204 , 205f technique for , 191 , 192t
lateral skull projection , 191 mandibular oblique lateral projections , 191 ,
200 mandibular ramus projection , 200 posteroanterior skull projection , 197 reverse-Towne projection , 191 , 197
Dose (Continued)
INDEX 623
SMV projection , 191 , 193 Waters projection , 194
Extraoral radiographs , 248t , 249 advanced imaging procedures and , 249 panoramic , 249
Extraoral radiography , 257 for salivary glands , 580 , 581f
Extravasation cyst , 361 Extrinsic diseases, involving paranasal sinuses , 518
benign odontogenic cysts and tumors , 519 , 519f dental structures displaced into sinuses , 522 fi brous dysplasia , 520 infl ammatory , 518
Extrinsic tumors , 500 , 501
F
Face and jaws, developmental disturbances of CL/P and CP , 562 CS , 563 focal osteoporotic bone marrow , 574 hemifacial hyperplasia , 572 HFM , 564 lingual salivary gland depression , 574 SOD , 573 TCS , 567
Facial bones, traumatic injuries to , 548 Facial structures and teeth, trauma to. See Teeth
and facial structures, trauma to False cyst , 511 Familial fi brous dysplasia , 446 Familial multiple cementoma , 437 Familial multiple polyposis , 393 FDA. See Food and Drug Administration Fetus. See Embryos and fetuses Fibroadamantoblastoma , 380 Fibrocementoma , 432 Fibroinfl ammatory pseudotumor , 517 Fibromas. See also Neurofi broma;
Neurofi bromatosis ameloblastic , 380 of bone, desmoplastic , 402 central odontogenic , 387
Fibromyxomas , 385 , 500 Fibro-osseous lesion , 428 , 440 Fibrosarcoma , 418
clinical features of , 418 defi nition of , 418 differential diagnosis and , 419 of joint capsule , 501 management of , 419 radiographic features of , 418
internal structure , 419 location , 418 periphery and shape , 418 , 419f surrounding structures relating to , 419
Fibrous adhesions and effusion, TMJ and , 488f , 489 Fibrous dysplasia
familial , 446 monostotic , 428
Fibrous dysplasia, involving paranasal sinuses , 520 clinical features of , 522 CT of , 522f differential diagnosis and , 522 radiographic features of , 522
internal structure , 522 , 522f location , 522 periphery , 522 surrounding structures relating to , 522
Fibrous dysplasia, jaw relating to , 428 clinical features of , 428 CT of , 430 defi nition of , 428 differential diagnosis and , 430 management of , 430 monostotic , 428 multiple , 428 periapical , 432 radiographic features of , 428
internal structure , 428 , 430f , 431f , 432f , 433f
location , 428 , 429f periphery , 428 , 430f surrounding structures relating to , 428 , 432f ,
433f , 434f solitary , 428
FID. See Free induction decay Field of view , 226 , 233 , 234f Filament , 5 , 6 , 6f
of transformer , 7 Film(s). See also Screen fi lm; TFT; X-ray fi lm
automatic processing of , 72 , 73f barrier-protected , 105 , 106f base of , 53 bitewing , 54 , 55 , 56f density of , 65 , 67f digital imaging
and , 37 , 37f v. , 98t or intensifying screens and , 37
direct exposure , 53 double-emulsion , 53 Ektavision G , 70f emulsion , 65 extraoral , 68 fi lm sensors and , 39 F-speed , 61 graininess of , 62 high contrast , 59 , 60 interproximal , 77 Kodak InSight , 53 , 54f , 61 Kodak T-Mat , 58f Kodak Ultra-Speed , 53 , 54f , 61 , 68f mounting of , 71f occlusal , 55 , 55f panoramic, darkroom techniques of , 182 periapical , 54 , 55f , 77 placement of, beam alignment and , 283 plain, imaging modalities , 479f posteroanterior , 183 processing of , 40 , 60 radiography, plain, for salivary glands , 579 reference, radiographs compared to , 100 ,
101f two, projected at right angles technique , 50 , 50f ,
51 , 51f wash and dry , 71 wide-latitude , 61 , 62
Film badges , 41 Film contrast , 58f , 60 , 60f Film fog , 60 , 74b , 76f , 102 Film latitude , 61 , 61f Film packets
infection control and , 106 , 107f reversed in mouth , 74b , 75f
Film printers , 85 Film processors, automatic, infection control and ,
107 Film stock, rotating of , 102
Film-holding instruments , 38f , 55 XCP , 38f , 135 , 135f , 136f
Filtered back-projection algorithms , 209 Filtration , 38
external , 11 inherent , 11 total , 11 x-ray beam relating to , 11 , 11f
First scan direction , 83 Fixer , 65 , 71 , 73 , 100 Fixing solution , 68 , 68f
components of , 68 acidifi er , 68 clearing agent , 68 hardener , 68 preservative , 68
function of , 65 silver halide crystals and , 68
Flat panel detectors , 80 Florid cemento-osseous dysplasia , 437 Florid osseous dysplasia (FOD) , 437
clinical features of , 437 CT of , 440f defi nition of , 437 differential diagnosis and , 439 , 440f management of , 439 PCD v. , 437 radiographic features of , 437
internal structure , 439 , 439f location , 437 , 438f periphery , 437 surrounding structures relating to , 439
synonyms for , 437 FMX. See Full-mouth examination Focal osteoporotic bone marrow , 574
clinical features of , 574 defi nition of , 574 differential diagnosis and , 577 management of , 577 radiographic features of , 574 , 576f synonym for , 574
Focal sclerosing osteitis , 326 Focal spot , 6 , 6f , 7f , 46 Focal spot size , 103 Focal trough or image layer , 177 , 177f , 178f Focused grids , 63 Focusing cup , 6 , 6f FOD. See Florid osseous dysplasia Fog , 58 , 60 Fogging, penny test for , 102 , 102f Follicular cyst , 346 Food and Drug Administration (FDA) , 148 , 227t ,
228t , 250 Foreshortening , 48 , 49 Former cysts , 361 FOTI. See Diagnodent laser-light fi beroptic
transillumination Fractionation , 23 Fractures
condylar , 498 , 498f , 499 Greenstick , 462 of maxilla, LeFort , 186 monitoring healing of , 558 to teeth and facial structures , 544 TMJ and , 498b
clinical features of , 498 CT of , 498 defi nition , 498 differential diagnosis and , 498 , 499 neonatal fractures , 499 , 499f
Extraoral radiographic examinations (Continued)

624 INDEX
radiographic features of , 498 , 498f , 499f treatment of , 499
Frame time , 227 Free induction decay (FID) , 215 Free interstitial silver ions , 65 , 66f Free radicals
direct effect and , 18 indirect effects and , 18 radiolysis of water and , 18
Frontal sinuses , 506 , 508f F-speed fi lm , 61 Full-body CT , 36 Full-mouth examination (FMX) , 249 Full-mouth set, of radiographs , 109 , 110b , 110f Fundamental particles , 2 , 3t Fusion , 300
CBCT relating to , 239f clinical features of , 301 , 301f defi nition of , 301 differential diagnosis and , 301 management of , 301 radiographic features of , 301 synonym for , 300
G
Gadolinium enhancement, of MRI , 218 , 220f Gadolinium oxybromide compounds , 79 Gag refl ex, radiographic examination and ,
150 γ -scintillation camera , 218 , 221f Gardner ’ s syndrome , 295 , 393b
CT for , 394f defi nition of , 393 , 395f synonyms for , 393 treatment for , 393
Garr é ’ s chronic nonsuppurative sclerosing osteomyelitis , 334
Garr é ’ s osteomyelitis , 331 Gas , 2 Gastrointestinal syndrome , 27 Gemination , 299 , 301
clinical features of , 302 defi nition of , 301 differential diagnosis and , 302 management of , 302 radiographic features of , 302 , 302f synonym for , 301
Genial tubercles , 165 , 166f Geometric blurring , 63 Geometric considerations, of image sharpness and
resolution , 46 Gestant odontome , 304 Ghost images, superimpositions and, anatomic
structures relating to , 186f , 189 Ghost shadows, of mandible , 169 , 184 Ghost teeth , 311 Giant cell granuloma, general , 442 Giant cell lesions , 442
benign , 500 Giant cell reparative granuloma , 442 Giant cell tumor , 442 Giant osteoid osteoma , 398 Giantism , 458 Gigantiform cementoma , 437 Gingival diseases , 282
dental plaque-induced , 282 non-plaque-induced , 282
Gingivitis , 448 bacterial plaque-associated , 282 dental plaque-induced , 282 non-plaque-induced , 282
Glandular odontogenic cysts , 356 clinical features of , 356 CT of , 356f defi nition of , 356 differential diagnosis and , 356 radiographic features of , 356
internal structure , 356 , 356f location , 356 periphery and shape , 356 surrounding structures relating to , 356
synonyms for , 356 treatment for , 356
Glenoid fossa , 474 Globulomaxillary cysts , 361 Gloves, infection control and , 104 Gold, as restorative material , 171 , 172f Goldenhar syndrome , 564 Gorlin cyst , 356 Gorlin-Goltz syndrome , 354 Granular cell ameloblastic fi broma , 380 Granuloma, plasma cell , 517 Graves ’ disease , 460 Grayscale, image detection system and ,
227 Greenstick fractures , 462 Grid ratio , 63 Grids , 63
composition of , 63 , 64f focused , 63 function of , 63
Gross fog or base plus fog , 58 Growth and development, of embryos and fetuses ,
28 Growth/development/dental malocclusion,
radiographs relating to , 245 , 246f Gutta-percha, as restorative material , 171 , 172f ,
287f
H
Hamartomas , 366 , 378 Hand-Sch ü ller-Christian disease , 448 Hard copies , 85 Hardener , 68 Head alignment and patient positioning, during
panoramic imaging , 180 Heat
CCD relating to , 98 CMOS relating to , 98 infl ammation relating to , 325 plate scans relating to , 98 PSP relating to , 98
Helical scanners , 208f multidetector (MDCT) , 207 , 209 , 210 pitch relating to , 207
Helium, atomic structure of , 3f Hemangioma , 299 , 532
benign, of salivary glands , 591 clinical features of , 591 defi nition of , 591 radiographic features of , 591 synonym for , 591
central , 395 MRI of , 591
Hematopoietic syndrome , 27 , 27f , 27t
Hematopoietic system, malignancies of , 419 Burkitt ’ s lymphoma , 423 leukemia , 424 multiple myeloma , 419 non-Hodgkin ’ s lymphoma , 421
Hemifacial hyperplasia , 572 clinical features of , 572 CT of , 572f defi nition of , 572 differential diagnosis and , 573 management of , 573 radiographic features of , 572 , 572f synonyms for , 572
Hemifacial hypertrophy , 572 Hemifacial hypoplasia , 564 Hemifacial microsomia (HFM) , 564
characteristics of , 564 , 565f clinical features of , 564 CT of , 564 , 566f defi nition of , 564 differential diagnosis and , 564 management of , 566 radiographic features of , 564 , 566f synonyms for , 564
Hemihyperplasia , 572 Hemimaxillofacial dysplasia , 573 Hemopoiesis , 454 Hemorrhagic bone cyst , 361 Hepatitis, infection control and , 103 , 104 Hereditary opalescent dentin , 309 Heritable effects, of radiation , 30
doubling dose , 30 on humans , 30
Hertwig ’ s epithelial root sheath , 304 Heterotopic bone , 535
ossifi cation, of stylohyoid ligament , 535 osteoma cutis , 536
Heterotopic calcifi cation , 526 dystrophic , 526 idiopathic , 526 , 530 metastatic , 526 , 535
Heterotopic ossifi cation , 526 HFM. See Hemifacial microsomia High contrast fi lm , 59 , 60 High-grade mucoepidermoid carcinoma , 592 High-speed scanning, CBCT relating to , 236 High-voltage transformer , 7 Histiocytic lymphoma , 448 Histiocytosis X , 448 HIV. See Human immunodefi ciency virus Horizontal angulation, of tube head , 135 Horizontal bitewing receptors , 135 Horizontal bone loss , 285 , 285f , 286f Horizontal fractures. See Le Fort fractures Hounsfi eld units (HU) , 209 , 210t Human immunodefi ciency virus (HIV) , 587 ,
589 Human-origin radiation , 32 , 33f , 34t
consumer and industrial products , 32 medical diagnosis and treatment , 32 nuclear power , 34 other sources of , 33
Humans heritable effects of radiation on , 30 ionizing radiation exposure to , 34t , 36
Hydrogen, atomic structure of , 3f Hydrogen nucleus , 212 , 213 , 213f Hydroquinone , 67 , 68 , 72 Hyperbaric oxygen therapy , 336 , 341
Fractures (Continued)

INDEX 625
Hypercementosis , 322 clinical features of , 322 defi nition , 322 differential diagnosis and , 322 management of , 322 radiographic features of , 322 , 322f
Hyperdontia , 295 Hyperechoic tissues , 222 Hyperostosis , 367 , 369 Hyperparathyroidism , 430 , 444 , 454
brown tumors and , 456 clinical features of , 454 defi nition of , 454 lamina dura and , 454 , 456 management of , 457 primary , 454 radiographic features , 455t , 456
general , 456 , 456f of jaws , 456 , 457f of teeth and associated structure , 456 , 458f
secondary , 454 vitamin D and , 454
Hyperpituitarism , 455t , 458 adult , 459 in children , 458 clinical features of , 458 defi nition of , 458 radiographic changes, associated with teeth , 460 radiographic features , 459
general , 459 , 459f of jaws , 459 , 459f
synonyms for , 458 Hyperplasia , 366 , 367
adrenal , 461 bony , 367 condylar , 481 coronoid , 484 DBI , 370 hemifacial , 572 other exostoses , 367 , 369 torus mandibularis , 368 torus palatinus , 367
Hyperplastic follicle , 348 Hyperthyroidism , 455t , 460 Hypertrophy, hemifacial , 572 Hypocalcemia , 457 , 463 Hypocalcifi cation , 308 , 308f , 454 Hypodentia , 295 , 298 , 300 Hypoechoic tissues , 222 Hypomaturation , 308 Hypomaturation/hypocalcifi cation , 308 Hypoparathyroidism and
pseudohypoparathyroidism , 455t , 457 clinical features of , 457 defi nition of , 457 PTH and , 457 radiographic features of , 458 , 459f treatment for , 458 vitamin D and , 458
Hypophosphatasia , 455t , 463 children with , 463 clinical features of , 463 defi nition of , 463 radiographic changes, associated with teeth ,
463 , 463f radiographic features , 463
associated with teeth , 464 , 465f general , 463 of jaws , 463
Hypophosphatemia , 455t , 464 children with , 464 clinical features of , 464 defi nition of , 464 radiographic features , 464
general , 464 of jaws , 464 , 465f
synonym for , 464 Hypophosphatemic rickets , 464 Hypopituitarism , 455t , 460
defi nition of , 460 radiographic features of , 460 synonyms for , 460
Hypoplasia , 454 condylar , 481 , 564 hemifacial , 564 maxillary , 564 of maxillary sinus , 506 Turner ’ s , 313
Hypoplastic type, of amelogenesis imperfecta , 308 , 308f
Hypothyroidism , 455t , 460 in children , 460 clinical features of , 460 defi nition of , 460 radiographic features of , 460 synonyms for , 460
I
IAC. See Inferior alveolar nerve canal ICRP. See International Commission on
Radiological Protection Idiopathic calcifi cation , 526 , 530b
laryngeal cartilage , 533 phleboliths , 532 rhinolith/antrolith , 534 sialolith , 530
Idiopathic histiocytosis , 448 Idiopathic osteosclerosis, periapical , 370 Image(s). See also specifi c Digital image entries
algorithms relating to , 208 basis , 225 characteristics of , 58
fi lm latitude , 61 , 61f image quality , 63 radiographic blurring , 62 radiographic contrast , 59 , 59f radiographic density , 58 , 58f radiographic noise , 62 radiographic speed , 61 , 61f , 61t
CT and , 209 , 210f , 211f digital , 78 interpretation of , 40 latent. See Latent images. partial , 74b , 76f subtraction , 89 T1-weighted , 216 , 217f T2-weighted , 216 , 217f
Image acquisition, CBCT and , 225 , 227t , 228t image detection system , 225 , 227 image display , 225 , 229 , 230f image reconstruction , 225 , 229f x-ray generation , 225
Image analysis , 89 diagnosis , 89 measurement , 89 , 89f radiographic interpretation and , 257
extraoral radiography , 257
intraoral images relating to , 257 systematic radiographic examination relating
to , 257 Image artifacts, CBCT and , 235 . See also Artifacts
cone-beamed-related , 234f , 235 patient-related , 235 scanner-related , 235 , 235f
Image compression , 90 Image detection system , 225 , 227
grayscale , 227 voxel size , 227
Image display , 225 , 229 , 230f Image enhancement , 86
brightness and contrast , 86 , 87f , 88f color , 87 digital subtraction radiography , 87 , 89f sharpening and smoothing , 87
Image fi eld anterior
mandibular occlusal projection , 144b , 148 maxillary occlusal projection , 141b , 147
cross-sectional mandibular occlusal projection , 145b maxillary occlusal projection , 142b
lateral mandibular occlusal projection , 146b maxillary occlusal projection , 143b
mandibular canine projection , 127b centrolateral projection , 125b distal oblique molar projection , 133b molar projection , 131b premolar projection , 129b
maxillary canine projection , 117b central incisor projection , 113b distal oblique molar projection , 123b lateral projection , 115b molar projection , 121b premolar projection , 119b
premolar bitewing projection , 137b Image layer or focal trough , 177 , 177f , 178f
mandible and , 170 , 177 , 178f sagittal plane relating to , 179 , 179f structure of , 177 , 179
Image noise, of CBCT , 236 Image processing , 86 Image quality , 63 Image receptor , 109
blurring of , 57f , 62 , 63f panoramic imaging and , 182 patient placement and
for lateral skull projection , 191 for mandibular oblique lateral projections ,
200 for mandibular ramus projection , 200 for posteroanterior skull projection , 197 for reverse-Towne projection , 197 for SMV projection , 193 for Waters projection , 194
Image reconstruction CBCT and , 225 , 229f CT and , 208 , 209f , 210f
Image restoration CCD and , 86 digital image viewing and , 86
Image shape distortion (magnifi cation) , 46 , 48f minimization of , 48 , 49f
Image analysis (Continued)

626 INDEX
Image sharpness and resolution , 46 , 47f geometric considerations contributing to , 46 methods to minimize loss of , 46 , 47f , 48f
Image size distortion , 46 Image storage , 90 , 90b Imaging. See also MRI
advanced , 207 diagnostic. See Diagnostic imaging. digital. See Digital imaging. intraoral alternatives to , 91t multiplanar reformatted , 210 , 211f optimization of, CBCT and , 233 , 234f panoramic. See Panoramic imaging. photons relating to , 46 , 47f , 208 plain fi lm modalities of , 479f procedure of, in radiographic report , 268 protocol of, CBCT and , 233
fi eld of view , 233 , 234f scan time and number of projections , 233 ,
234f scanning trajectory , 233 voxel size , 233
radionuclide , 218 , 221f real-time , 222 techniques of, for dental implants. See Dental
implants. Imaging stents, for dental implants , 601f , 605 , 605f Impaction , 299 Implant site assessment , 237 , 237f , 238f Implant-prostheses composite , 608 Implants. See also Dental implants
CBCT and , 247 CT and , 247 radiographs and , 247
IMRT. See Intensity-modulated radiotherapy Incident photon , 13 , 13t Incisive canal cyst , 358 Incisive foramen , 158 , 159f , 160f Incisors , 135t Incremental scanners , 207 Indirect effects
free radicals and , 18 of radiation chemistry , 18
Indirect volume rendering , 229 , 232f Industrial and consumer products, human-origin
radiation and , 32 Infection(s) , 149
acute bacterial , 585 control of , 100 , 103 , 108b
AIDS and , 101 automatic fi lm processors and , 107 barrier-protected fi lm or disposable
container, use of , 105 , 106f barriers and , 104 , 105 contamination and , 100 disinfecting solution and , 107 disinfection and , 104 , 104f , 105f fi lm packets and , 106 , 107f gloves and , 104 hepatitis and , 103 , 104 nondisposable instruments, sterilizing of , 105 panoramic/cephalometric equipment and ,
105 PID and , 103 , 104 plastic wrap and , 104 , 104f , 105f processing equipment, preventing
contamination of , 106 , 107f radiographic procedures, gloves worn during ,
104 sensors and , 105 , 106f
tuberculosis and , 101 universal precautions, applying of , 103 x-ray machine, working surfaces, chair, and
apron, disinfecting and covering of , 104 , 104f , 105f
digital receptors and , 98 soft tissue, diagnostic imaging of , 336 , 337f ,
338f viral , 509
Infectious arthritis , 494 Inferior alveolar nerve canal (IAC) , 259
localization of , 238 , 240f mental foramen and, intraosseous lesions
relating to , 261f , 265 Inferior border, of mandible , 170 , 171f Infl ammation, signs of
heat , 325 pain , 325 redness , 325 swelling , 325
Infl ammatory diseases, involving paranasal sinuses , 518
periostitis , 518 radiographic features of , 509f , 518
Infl ammatory intrinsic diseases, of paranasal sinuses , 509
Infl ammatory lesions, of jaws. See Jaws, infl ammatory lesions of
Infl ammatory odontogenic disease , 508 Infl ammatory paradental cyst , 350 , 350f Infl ammatory pseudotumor , 517 Infl ammatory salivary gland disorders , 584 Inherent fi ltration , 11 Initial visit, dental radiographs relating to , 250 , 252t Injuries. See also Abrasions
toothbrush , 315 traumatic
to facial bones , 548 to teeth and facial structures , 542
Instruments fi lm-holding , 38f , 55 nondisposable, sterilizing of , 105 receptor-holding , 111 , 111f , 112 XCP fi lm-holding , 38f , 135 , 135f , 136f
Intensifying screens , 56 , 62 cleaning of , 102 composition of , 57 , 57f
base , 57 phosphor layer , 54f , 57 , 57f , 57t , 58f protective coat , 58
and fi lm or digital imaging , 37 function of , 56 panoramic radiography and , 182
Intensity-modulated radiotherapy (IMRT) , 23 Interactive analysis, CBCT relating to , 236 Interactive diagnostic software, for dental
implants , 605 , 606f Interarticular disk, TMJ and , 474 , 476f Interdental craters , 286 , 287f Intermaxillary suture , 157 , 157f Internal density and trabecular pattern of bone,
changes in , 289 , 289f Internal derangements, TMJ relating to , 486
clinical features of , 486 defi nition of , 486 , 486f disk
reduction and nonreduction of , 487f , 488 , 488f
replacement of , 487 , 487f
fi brous adhesions and effusion , 488f , 489 MRI and , 486 , 487 , 487f , 488f , 489 , 489f perforation and deformities , 489 , 489f radiographic features of , 480f , 486
Internal radiation , 32 Internal resorption , 316
clinical features of , 317 defi nition , 316 differential diagnosis and , 318 management of , 318 radiographic features of , 317 , 317f
Internal structure, of infl ammatory lesions , 325 International Commission on Radiological
Protection (ICRP) , 34 , 34t , 36 International Organization for Standardization ,
84 Interpolation , 210 Interpretation. See also Radiographic
interpretation; Salivary gland disorders, image interpretation of
of images , 40 of panoramic imaging , 183 , 183f , 184f , 185f in radiographic report , 268
Interproximal fi lm , 77 Interproximal radiographs , 50 Interstitial cyst , 511 Intra-alveolar carcinoma , 409 Intracellular structures, effects on , 19
chromosome aberrations , 19 , 20f , 21f DNA and , 19 , 20f nucleus , 19
Intramandibular carcinoma , 409 Intraoral fi lm, conventional, for radiologic
examination , 270 , 271f , 272f Intraoral images , 257 Intraoral imaging alternatives, clinical
comparisons of , 91t Intraoral radiographic examinations , 109 , 110f
periapical radiography , 109 quality criteria of , 109
Intraoral radiographs , 50 , 248t , 249 interproximal , 50 occlusal , 50 periapical , 49
Intraoral radiography for dental implants , 597 , 599f , 599t for salivary glands , 579 , 580f , 581f
Intraoral x-ray fi lm, views of , 53 , 55f bitewing , 54 , 55 , 56f occlusal , 55 , 55f , 77 periapical , 54 , 55f , 77
Intraosseous carcinoma, primary , 409 , 410 Intraosseous lesions, analysis of , 257 , 258f , 259f ,
267b self-test relating to , 268 step 1: localize the abnormality , 258
jaws, position in , 258f , 259 , 260f , 261f localized or generalized , 258 , 260f single or multifocal , 259 , 261f size , 259
step 2: assess the periphery and shape , 259 , 262f
ill-defi ned borders , 261 , 262f , 263f shape , 262 , 262f , 263f well-defi ned borders , 258f , 259f , 260 , 260f ,
261f , 262f step 3: analyze internal structure , 258f , 259f ,
262f , 263 , 264f , 265f
Infection(s) (Continued) Internal derangements, TMJ relating to (Continued)

INDEX 627
step 4: analyze effects of lesion on surround structures , 262f , 264
IAC and mental foramen , 261f , 265 outer cortical bone and periosteal reactions ,
260f , 262f , 265 , 266f surrounding bone density and trabecular
pattern , 259f , 265 teeth/lamina dura/periodontal membrane
space , 262f , 264 , 265f , 266f step 5: formulate radiographic interpretation ,
266 , 267b , 268f decision 1: normal or abnormal , 267 decision 2: developmental or acquired , 267 ,
268f decision 3: classifi cation , 267 decision 4: ways to proceed , 267 decision 5: radiographic report , 267
Intravascular thrombi , 532 Intrinsic diseases, of paranasal sinuses , 509
antrolith , 513b infl ammatory , 509 mucocele , 514 mucositis , 509 polyps , 513 retention pseudocyst , 511 sinusitis , 509
Intrinsic tumors , 500 , 501 Invagination , 304 , 506 Invasive fungal sinusitis , 517 Inverse square law , 12 , 12f Iodide , 53 Ionization , 4
electrons and , 4 Ionizing radiation
annual effective dose of , 33t human exposure to , 34t , 36
Irradiation dose rate relating to , 22 dose relating to , 22 oxygen relating to , 22
Isotropic voxel resolutions , 225
J
JA. See Juvenile arthritis Jaws
CCD relating to , 567 CS relating to , 564 diseases of
CBCT and , 247 CT and , 247 dental radiographs and , 247 dysplasias , 428 other lesions of , 440
face and. See Face and jaws, developmental disturbances of.
fi brous dysplasia relating to , 428 intraosseous lesions relating to , 258f , 259 , 260f ,
261f lesions of, PDL relating to , 295 osteoma relating to , 392 , 500 systemic diseases of
defi nition , 454 endocrine disorders , 454 metabolic , 461 PSS , 467 radiographic features of , 454 , 455t sickle cell anemia , 468 thalassemia , 469
Jaws, benign tumors of , 373 clinical features of , 366 CT of , 369f , 370f , 371f , 374f , 375 , 375f defi nition of , 366 hyperplasia , 366 , 367 nonodontogenic , 373 , 389 odontogenic , 373 odontogenic epithelial tumors , 373 radiographic examination of , 366 radiographic features of , 366
internal structure , 366 location , 366 periphery and shape , 366 surrounding structures relating to , 367 ,
367f Jaws, cysts and cystlike lesions of , 360
clinical features of , 343 nonodontogenic , 358 odontogenic , 343 radiographic features of , 343
internal structure , 343 location , 343 periphery , 343 shape , 343 surrounding structure relating to , 343
SBC , 361b Jaws, infl ammatory lesions of , 325
CT of , 330 , 332 , 335 , 336 , 339 general clinical features of , 325 general radiographic features of , 325
internal structure , 325 location , 325 osteomyelitis , 325 , 331 periapical infl ammatory lesions , 325 , 326 pericoronitis , 329 periphery , 325 surrounding structures relating to , 325
MRI of , 332 , 336 , 339 soft tissue infections, diagnostic imaging of ,
336 , 337f , 338f bisphosphonate-related osteonecrosis ,
341 bone, radiation-induced changes to , 336 osteoradionecrosis , 25 , 26 , 26f , 336
Jaws, malignant diseases of cancer survivor ’ dental radiology for , 425 carcinomas , 407 clinical features of , 405 defi nition of , 405 hematopoietic system , 419 metastatic tumors , 412 primary epithelial tumor , 409 radiographic examination of , 405 radiographic features of , 405
internal structure , 407 location , 405 , 406f periphery and shape , 406f , 407 surrounding structures relating to , 406f ,
407 sarcomas , 414
Joint capsule, fi brosarcoma of , 501 Joint effusion , 497 Joints. See DJD; TMJ Juvenile arthritis (JA) , 493
chronic , 493 clinical features of , 493 CT of , 494f defi nition of , 493 radiographic features of , 493 , 495f synonyms for , 493
Juvenile arthrosis , 483 , 564 children with , 483 clinical features of , 483 defi nition of , 483 differential diagnosis and , 484 radiographic features of , 483 , 484f synonyms for , 483 treatment of , 484
Juvenile chronic arthritis , 493 Juvenile ossifying fi broma , 440 Juvenile rheumatoid arthritis , 494f
K
K-edge absorption , 15 Keratocystic odontogenic tumor (KOTs) , 348 ,
351 basal cell nevus syndrome and , 354 clinical features of , 351 CT of , 352f , 353 defi nition of , 351 differential diagnosis and , 353 management of , 353 marsupialization , 343 radiographic features of , 351
internal structure , 351 , 352f location , 351 , 352f periphery and shape , 351 , 352f , 353f surrounding structures relating to , 351 , 352f ,
353f , 354f SBC and , 362 synonym for , 351
Kilovoltage (kVp) , 40 , 60 , 102 , 109 . See also Tube voltage
Kodak GBX-2 fi lter , 182 Kodak InSight fi lm , 53 , 54f , 61 Kodak Lanex , 57 Kodak T-Mat fi lm , 58f Kodak Ultra-Speed fi lm , 53 , 54f , 61 , 68f KOTs. See Keratocystic odontogenic tumor kVp. See Kilovoltage
L
Lactobacillus , 18 , 25 Lamina dura , 152 , 154f , 162
double , 154 hyperparathyroidism and , 454 , 456 intraosseous lesions relating to , 262f , 264 , 265f ,
266f as supporting structures , 152 , 154f ,
162 Langerhans ’ cell disease , 448 , 460 , 500 Langerhans ’ cell histiocytosis (LCH) , 292 , 293f ,
351 , 448b clinical features of , 448 defi nition for , 448 differential diagnosis and , 451 disorders of
malignant , 448 non-malignant , 448
management of , 452 radiographic features of , 450
internal structure , 450 location , 450 , 450f periphery and shape , 450 , 450f , 451f surrounding structure relating to , 450 , 451f ,
452f synonyms for , 448
Larmor procession frequency , 213
Intraosseous lesions, analysis of (Continued)
628 INDEX
Laryngeal cartilage calcifi cations , 533 clinical features of , 533 defi nition of , 533 differential diagnosis and , 534 management of , 534 radiographic features of , 533
internal structure , 534 location , 533 , 534f periphery and shape , 534
Latent bone cyst , 574 Latent images
formation of , 65 , 67f photons and , 65 sites of , 65
Latent period, of acute radiation syndrome , 27 Lateral and lateral-oblique cephalometric
radiography, for dental implants , 597 , 598 Lateral cephalometric projection , 191 Lateral facial dysplasia , 564 Lateral fossa , 159 , 160f Lateral mandibular occlusal projection , 146b Lateral maxillary occlusal projection , 143b Lateral periodontal cysts , 355
clinical features of , 355 defi nition of , 355 differential diagnosis and , 355 management of , 356 radiographic features of , 355
internal structure , 355 location , 355 , 356f periphery and shape , 355 surrounding structures relating to , 355
Lateral projections for extraoral radiographic examination , 201 ,
202f mandibular oblique , 191 , 200 skull , 191
central x-ray beam, position of , 191 image receptor and patient placement for ,
191 resultant image of , 191 , 193f , 194b , 195f
Latitude in CCD , 84 detector , 84 , 84f fi lm , 61 , 61f
LCH. See Langerhans ’ cell histiocytosis Le Fort fractures , 555
CT of , 555 , 556 , 558 , 559f Le Fort I (horizontal fracture) , 555
clinical features of , 555 defi nition of , 555 , 555f management of , 556 radiographic features of , 556 , 556f
Le Fort II (pyramidal fracture) , 556 clinical features of , 556 defi nition of , 556 , 556f management of , 557 radiographic features of , 556
Le Fort III (craniofacial disjunction) , 558 clinical features of , 558 defi nition of , 558 , 558f management of , 558 radiographic features of , 558 , 559f
of maxilla , 186 Lead collimators , 175 , 176f , 177f Lead, disposing of , 75 Leaded aprons and collars , 39 , 39f , 103 Leong ’ s premolar , 306 Leptons , 2 , 3t
Lesion(s). See also Bone(s); Intraosseous lesions, analysis of; specifi c Jaws entries; specifi c Salivary gland entries
acute , 325 carious , 270 chronic , 325 , 326 fi bro-osseous , 428 giant cell , 442 , 500 lymphoepithelial, benign , 587 on occlusal surfaces , 276 on proximal surfaces , 272 radiographic detection of , 272 radiolucent , 272
LET. See Linear energy transfer Letterer-Siwe disease , 428 , 448 , 449 Leukemia , 29 , 424
clinical features of , 424 defi nition of , 424 differential diagnosis and , 424 management of , 425 radiation-induced, solid tumors and,
comparison of , 29t radiographic features of , 424
internal structure , 424 location , 424 periphery and shape , 424 , 424f surrounding structures relating to , 424 , 425f
synonyms for , 424 Life span shortening, radiation relating to , 28 Light fl uorescence (QLF) , 280 Light spots , 74b , 76f Lightproof darkroom , 69 Line pair , 83 Linear energy transfer (LET) , 4 , 16 , 22 Lingual foramen , 166 , 167f Lingual mandibular bone depression , 574 Lingual or buccal cortical plate loss , 287 , 287f Lingual salivary gland depression , 574
clinical features of , 574 CT of , 574 , 576f defi nition of , 574 differential diagnosis and , 574 management of , 574 radiographic features of , 574 , 575f , 576f synonyms for , 574
Lingual surfaces, lesions on , 277 , 277f Liquid , 2 Lithium, atomic structure of , 3f Local irritating factors, periodontal disease and ,
291 , 292f Localization
of IAC , 240f object , 50
Localize abnormality, intraosseous lesions relating to , 258
Localized myositis ossifi cans , 537 clinical features of , 537 defi nition of , 537 differential diagnosis and , 538 management of , 538 radiographic features of , 537
internal structure , 538 location , 537 , 538f periphery and shape , 538
synonyms for , 537 Long gray scale of contrast , 59 Longitudinal magnetic vector , 213 , 214f Lossless methods, of compression , 90 Low contrast , 59
Low patient radiation dose, CBCT relating to , 236 Low-grade mucoepidermoid carcinoma , 592 Luxation , 542
clinical features of , 542 defi nition of , 542 management of , 543 radiographic features of , 543 , 543f
Lymph nodes, calcifi ed , 526 Lymphangiectatic cyst , 511 Lymphoblastic leukemia, acute , 424 Lymphocytic leukemia, chronic , 424 Lymphoepithelial lesion, benign , 587 Lymphomas
African jaw , 423 Burkitt ’ s , 423 histiocytic , 448 malignant , 421 non-Hodgkin ’ s , 421 primary, of salivary glands , 593
Lymphomatosum, papillary cystadenoma , 590 Lymphomatous adenoma , 590 Lymphosarcoma , 421
M
m Rays , 4 , 5 mA , 103 , 109 Macrodontia , 299
clinical features of , 299 defi nition of , 299 , 299f differential diagnosis and , 299 management of , 299 radiographic features of , 299
Magnetic resonance imaging (MRI) , 184 , 207 , 212 of ameloblastoma , 376 , 377 applications of , 218 , 219f , 220f of chondrocalcinosis , 496 of dermoid cysts , 361 of desmoplastic fi broma, of bone , 403 gadolinium enhancement of , 218 , 220f of hemangioma , 591 of internal derangements , 486 , 487 , 487f , 488f ,
489 , 489f of lesions
cystic , 377 , 382 , 589f jaw , 332 , 336 , 339
magnetic resonance images and , 217 magnetic resonance signal and , 215 , 215f of odontogenic myxoma , 387 of paranasal sinuses , 506 , 509 precession and , 213 , 213f protons and , 212 , 212f , 213f RF pulses sequences and , 215 scanner gradients and , 216 of sialadenitis
autoimmune , 587 bacterial , 586
of synovial chondromatosis , 496 T1 and T2 relaxation and , 215 , 215t , 217 tissue contrast and , 216 of TMJ , 478 , 480 , 480f of tumors
malignant, of salivary glands , 592 Warthin , 590 , 591f
Magnetic resonance signal, MRI and , 215 , 215f Magnifi cation. See Image shape distortion Malignancies
of hematopoietic system , 419 secondary , 412

INDEX 629
Malignant ameloblastoma and ameloblastic carcinoma , 411
clinical features of , 411 defi nition of , 411 differential diagnosis and , 412 management of , 412 radiographic features of , 411
internal structure , 412 location , 411 periphery and shape , 411 surrounding structures relating to , 412
Malignant and benign odontogenic neoplasms , 508
Malignant and metastatic tumors, of salivary glands , 593
acinic cell carcinoma , 593 adenocarcinoma , 593 adenoid cystic carcinomas , 593 primary lymphoma , 593 radiographic features of , 594 , 594f squamous cell carcinoma , 593
Malignant diseases, of jaws. See Jaws, malignant diseases of
Malignant disorders, of LCH , 448 Malignant lymphoma , 421 Malignant neoplasia , 333 Malignant neoplasms, paranasal sinuses relating
to , 515 pseudotumor , 517 squamous cell carcinoma , 515
Malignant pleomorphic adenoma , 592 Malignant tumors
of salivary glands , 592 CT of , 592 , 593f , 594f MRI of , 592
of salivary glands, mixed , 592 clinical features of , 593 defi nition of , 592 radiographic features of , 593 synonyms for , 592
TMJ and , 501b clinical features of , 501 CT of , 501 , 501f , 502f differential diagnosis and , 501 radiographic features of , 501 , 502f treatment of , 502
Malocclusion , 299 dental, radiographs relating to , 245 , 246f
Mandible , 165 anatomic structure of. See Anatomic structures. anterior , 156 CBCT of , 604f coronoid process , 170 , 172f , 184 CT of , 184 cysts of , 500 external oblique ridge , 169 , 171f genial tubercles , 165 , 166f ghost shadows of , 169 , 184 image layer and , 170 , 177 , 178f inferior border of , 170 , 171f lingual foramen , 166 , 167f mandibular canal , 168 , 169f , 170f mental foramen , 166 , 167f , 168f mental fossa , 166 , 167f mental ridge , 166 , 167f mylohyoid ridge , 169 , 171f nutrient canals , 168 , 170f submandibular gland fossa , 169 , 171f , 187f symphysis , 165 , 166f
Mandibular anterior occlusal projection , 144b , 148 Mandibular anterior periapical projection , 148 Mandibular body protection , 200b Mandibular bone depression, lingual , 574 Mandibular canal , 168 , 169f , 170f Mandibular canine projection , 127b Mandibular carcinoma, central , 409 Mandibular centrolateral projection , 125b Mandibular condylar , 175 Mandibular dentition and supporting alveolus ,
184 Mandibular distal oblique molar projection , 133b Mandibular fossa, TMJ and , 474 , 474f , 475f Mandibular fractures , 541 , 548
body , 548 clinical features of , 548 defi nition of , 548 differential diagnosis and , 549 favorable , 548 management of , 549 radiographic features of , 548 , 549f , 550f unfavorable , 548
condyle , 549b clinical features of , 550 defi nition of , 549 , 550f , 551f management of , 551 radiographic features of , 550 , 551f , 552f
CT of , 541 , 548 , 549f , 550 , 551f , 552f Mandibular infected buccal cyst , 350 Mandibular molar projection , 131b
deciduous , 148 Mandibular oblique lateral projections , 191 , 200
central x-ray beam, position of , 200 image receptor and patient placement for , 200 resultant image of , 200 , 200f
Mandibular occlusal projection anterior , 144b , 148 cross-sectional , 145b lateral , 146b
Mandibular premolar projection , 129b Mandibular ramal area , 184 Mandibular ramus projection , 200
central x-ray beam, position of , 200 image receptor and patient placement for , 200 resultant image for , 200 , 201f
Mandibular torus , 368 Mandibulofacial dysostosis , 567 Manual processing procedures , 71 , 71f Manual processing tanks , 69 , 71f Marble bone disease , 465 Marrow space , 574 Marsupialization
KOTs and , 353 radicular cyst and , 345 residual cyst and , 346
Matter composition of , 2 states of
gas , 2 liquid , 2 solid , 2
x-rays ’ interactions with , 12 Maxilla , 157
anterior nasal spine , 157 , 157f CBCT for , 603f cortical boundary of , 186 cortical outline of , 186 incisive foramen , 158 , 159f , 160f intermaxillary suture , 157 , 157f
lateral fossa , 159 , 160f LeFort fractures of , 186 maxillary sinus , 161 , 162f , 163f nasal aperture , 157 , 158f , 159f nasolabial fold , 164 , 165f nasolacrimal canal , 161 , 161f nose , 159 , 161f pterygoid plates , 165 , 165f superior foramina of nasopalatine canal , 159 ,
160f zygomatic process and zygomatic bone , 164 ,
164f , 165f Maxillary anterior occlusal projection , 141b ,
147 Maxillary anterior periapical projection , 148 Maxillary canine projection , 117b Maxillary central incisor projection , 113b Maxillary dentition and supporting alveolus ,
186 Maxillary distal oblique molar projection ,
123b Maxillary hypoplasia , 564 Maxillary lateral projection , 115b Maxillary molar periapical projection, deciduous ,
148 Maxillary molar projection , 121b Maxillary occlusal projection
anterior , 141b , 147 cross-sectional , 142b lateral , 143b
Maxillary premolar projection , 119b Maxillary sinuses , 161 , 162f , 163f , 186 , 188
diseases associated with , 507 applied diagnostic imaging relating to , 508 clinical features of , 508 defi nition of , 508
hypoplasia of , 506 as paranasal sinus , 506 , 507f , 508f retention cyst of , 511 trauma relating to , 508
Maxillary sinusitis acute , 509 , 511 chronic , 510 , 511
Maxillary/midfacial fractures , 552 Maxillofacial complex, conditions of , 238 , 241f ,
242f Maxillofacial fractures , 541 Maximum intensity projection , 232f McCune-Albright syndrome , 428 MDCT. See Multidetector helical scanners Measurement
image analysis relating to , 89 , 89f units of, radiation exposure relating to , 16
Mechanical geometry, of CT , 208f Mechanism , 72 , 73f Median anterior maxillary cysts , 358 Median mandibular and globulomaxillary cysts ,
361 Median palatine cysts , 358 , 361 Median suture. See Intermaxillary suture Medical diagnosis and treatment, of human-origin
radiation , 32 Mediterranean anemia , 469 Meniscus. See Interarticular disk, TMJ and Mental disabilities, patients with , 149 Mental foramen , 166 , 167f , 168f
IAC and , 261f , 265 Mental fossa , 166 , 167f
Maxilla (Continued)
630 INDEX
Mental ridge , 166 , 167f Mercator projection , 183 Mesenchymal tumors , 385
benign cementoblastoma , 366 , 387 central odontogenic fi broma , 387 odontogenic myxoma , 385b , 444
Mesiodens , 295 Mesodermal tumors , 392
arteriovenous fi stula , 398 central hemangioma , 395 desmoplastic fi broma, of bone , 402 Gardner ’ s syndrome , 295 , 393 osteoblastoma , 366 , 398 , 500 osteoid osteoma , 399 osteoma , 392
Mesothelial cyst , 511 Metabolic bone diseases, of jaws , 461
hypophosphatasia , 455t , 463 hypophosphatemia , 455t , 464 osteopetrosis , 465 osteoporosis , 455t , 461 renal osteodystrophy , 455t , 463 rickets and osteomalacia , 455t , 462
Metal artifacts , 210 Metastatic calcifi cation , 526 , 535 Metastatic lesions, of salivary glands , 593 Metastatic tumors , 412
clinical features of , 412 CT of , 413f defi nition of , 412 differential diagnosis and , 412 management of , 413 radiographic features of , 412
internal structure , 412 , 414f location , 412 , 413f periphery and shape , 412 , 413f supporting structures relating to , 412 , 413f ,
414f of salivary glands , 593 synonym for , 412
Microdents , 299 , 300 Microdontia , 299b
clinical features of , 299 , 300f defi nition of , 299 differential diagnosis and , 300 management of , 300 radiographic features of , 300
Microfl ora, diet, tooth, dental caries relating to , 270
Microsomia craniofacial , 564 hemifacial , 564
Midfacial region, anatomic structures of , 186 , 187f , 188f
Midfacial/maxillary fractures , 552 CT of , 553 , 553f defi nition of , 552 orbital blow-out , 552 zygomatic , 554
Mikulicz disease , 587 Milliampere-seconds (mAs) , 40 Mineral loss, dental caries relating to , 270 Missing teeth , 295b
clinical features of , 298 , 304f defi nition of , 298 differential diagnosis and , 298 , 299f management of , 298 radiographic features of , 298 synonyms for , 295
Mixed dentition (7 to 12 years) , 148 , 149f canine periapical projection , 148 deciduous and permanent molar periapical
projection , 148 mandibular anterior periapical projection , 148 maxillary anterior periapical projection , 148 posterior bitewing projection , 148
Mixed tumors , 378 . See also Salivary glands, tumors of
adenomatoid odontogenic , 383 ameloblastic fi broma , 380 ameloblastic fi bro-odontoma , 382 carcinoma ex , 592 odontogenic , 380 odontoma , 378
Mobile radiography , 148 , 149f Molar bitewing projection , 139b Molars , 135t
roots of , 162 Monckeberg ’ s medial calcinosis , 530
clinical features of , 530 defi nition of , 530 differential diagnosis and , 530 management of , 530 radiographic features of , 530
internal structure , 530 location , 530 periphery and shape , 530 , 530f
Monitoring healing, of fractures , 558 Monitoring/detection of disease , 244 Monostotic fi brous dysplasia , 428 Morphology, of teeth. See Altered morphology,
of teeth Motion blurring , 63 Mount fi lms on hangers , 71 , 71f Mounting radiographs , 77 , 77f MPR. See Multiplanar reformation MRI. See Magnetic resonance imaging Mucocele , 514
clinical features of , 514 CT of , 514f defi nition of , 514 differential diagnosis and , 514 management of , 514 radiographic features of , 514
internal structure , 514 , 514f location , 514 periphery and shape , 514 surrounding structures relating to , 514 , 514f
synonyms for , 514 Mucoepidermoid carcinoma , 411 , 592
central , 411 clinical features of , 592 defi nition of , 592 high-grade , 592 low-grade , 592 radiographic features of , 592 , 594f
Mucopyocele , 514 Mucormycosis , 517 Mucosal cysts , 511 Mucositis , 509
clinical features of , 509 defi nition of , 509 radiographic features of , 509 , 509f synonym for , 509
Mucous retention cyst , 511 Mucous retention pseudocyst , 511 Multidetector helical scanners (MDCT) , 207 , 209 ,
210
Multilocular ameloblastoma , 374f Multiplanar reformation (MPR) , 229 , 231f Multiplanar reformatted imaging , 210 , 211f Multiple fi brous dysplasia, jaw relating to , 428 Multiple myeloma , 419 , 464
clinical features of , 419 defi nition of , 419 differential diagnosis and , 420 management of , 421 radiographic features of , 419
internal structure , 420 location , 419 , 420f periphery and shape , 419 , 421f surrounding structures relating to , 420
synonyms for , 419 Multirooted teeth, furcations in , 287 , 288f Musculature, radiation damage to , 26 Myeloma , 419
endothelial , 417 multiple , 419 , 464 plasma cell , 419
Mylohyoid ridge , 169 , 171f Myoepithelial sialadenitis , 587 Myositis ossifi cans , 537
localized , 537 posttraumatic , 537 progressive , 538
Myositis, solitary , 537 Myxedema , 460 Myxofi broma , 385 Myxoma , 385
odontogenic , 385 , 444
N
Nasal aperture , 157 , 158f , 159f Nasal cartilage and nasal decorations , 184 Nasal cavity. See also Nasal aperture
conchae and , 186 Nasal fossa , 162 , 162f , 175 Nasoalveolar cyst , 360 Nasolabial cysts , 360
clinical features of , 360 CT of , 360 , 360f defi nition of , 360 differential diagnosis and , 360 management of , 360 radiographic features of , 360
internal structure , 360 location , 360 , 360f periphery and shape , 360 surrounding structures relating to , 360 ,
360f synonym for , 360
Nasolabial fold , 164 , 165f Nasolacrimal canal , 161 , 161f Nasopalatine canal
cyst of , 358 superior foramina of , 159 , 160f
Nasopalatine duct cysts , 358 clinical features of , 358 CT of , 359f defi nition of , 358 differential diagnosis and , 359 management of , 360 radiographic features of , 358
internal structure , 359 location , 358 , 358f , 359f periphery and shape , 358
INDEX 631
surrounding structure relating to , 359 , 359f synonyms for , 358
Nasopharynx, posterior wall of , 184 National Council on Radiation Protection and
Measurements (NCRP) , 34 , 34t , 39 , 41 National Electrical Manufacturers Association , 90 Natural-origin radiation , 32 , 33f , 33t
cosmic sources , 32 terrestrial sources , 32
external , 32 other internal , 32 radon , 32
NCRP. See National Council on Radiation Protection and Measurements
Neonatal fractures, TMJ and , 499 , 499f differential diagnosis and , 499 treatment of , 499
Neoplasms, odontogenic, malignant and benign , 508
Neoplasms, paranasal sinuses relating to , 514 benign , 515
osteoma , 515 papilloma , 515
malignant , 515 pseudotumor , 517 squamous cell carcinoma , 515
Nervous system cancer , 29 Neural origin, benign tumors of , 389 Neurilemmoma , 389
clinical features of , 389 defi nition of , 389 differential diagnosis and , 390 radiographic features of , 389
internal structure , 390 location , 389 , 390f periphery , 390 surrounding structures relating to , 390 , 390f
synonyms for , 389 treatment for , 390
Neurinoma , 391 Neurofi broma , 391
clinical features of , 391 defi nition of , 391 differential diagnosis and , 391 radiographic features of , 391
internal structure , 391 location , 391 periphery , 391 surrounding structures relating to , 391 , 391f
synonyms for , 391 treatment for , 391
Neurofi bromatosis , 391 clinical features of , 391 CT of , 392 , 392f defi nition of , 391 , 392f radiographic features of , 392 synonyms for , 391 treatment for , 392
Neuroma , 390b amputation , 390 clinical features of , 390 defi nition of , 390 differential diagnosis and , 390 radiographic features of , 390
internal structure , 390 location , 390 periphery , 390 surrounding structures relating to , 390
synonyms for , 390 traumatic , 390 treatment for , 390
Neutral silver atoms , 65 Neutrons
atomic structure and , 2 radioactivity relating to , 4
Nevoid basal cell carcinoma syndrome , 354 Nondisposable instruments, sterilizing of , 105 Non-Hodgkin ’ s lymphoma , 421
clinical features of , 421 defi nition of , 421 differential diagnosis and , 421 management of , 421 radiographic features of , 421
internal structure , 421 location , 421 periphery and shape , 421 , 422f surrounding structures relating to , 421 , 423f
synonyms for , 421 Nonionizating radiations , 4 Non-malignant disorders, of LCH , 448 Nonoccupational dose limits, of radiation , 34t Nonodontogenic cysts , 358
dermoid , 360 former , 361 nasolabial , 360 nasopalatine duct , 358
Nonodontogenic tumors , 373 , 389 benign, of neural origin , 389 mesodermal , 392
Nonsteroidal anti-infl ammatory drugs (NSAIDS) , 334 , 336
Nonuniform image density , 92b , 93f Normal anatomic structure, absence of , 183 Nose , 159 , 161f NSAIDS. See Nonsteroidal anti-infl ammatory
drugs Nuclear medicine , 218 , 221f , 583
applications of , 220 γ -scintillation camera , 218 , 221f PET , 218 , 221 , 221f , 222f , 583 radionuclides , 218 , 221f SPECT , 218 , 221f
Nuclear power, human-origin radiation relating to , 34
Nucleus atomic structure and , 2 hydrogen , 212 , 213 , 213f Intracellular structures relating to , 19
Nutrient canals , 168 , 170f
O
Object localization , 50 tube shift technique , 50 , 50f , 51f two fi lms projected at right angles technique ,
50 , 50f , 51 , 51f Occlusal fi lm , 55 , 55f Occlusal plane, panoramic image relating to , 181 ,
181f Occlusal radiographs , 50 Occlusal radiography , 147
CCD and , 147 CMOS and , 147
Occlusal surfaces, lesions on , 276 cavitation and treatment considerations , 276 ,
277f
false interpretations , 275f , 276 radiographic appearance, typical , 276 , 277f
Occlusal trauma, periodontal disease and , 291 Occlusal view, intraoral x-ray fi lm relating to , 55 ,
55f , 77 Occult disease, radiographs and , 246 Occupational dose limits, of radiation , 34 , 34t Oculoauriculovertebral dysplasia , 564 Odontoblasts , 320 Odontoclasts , 318 Odontogenesis imperfecta , 311 Odontogenic carcinoma, primary , 409 Odontogenic cysts , 343 , 508 . See also
Sialo-odontogenic cyst basal cell nevus syndrome , 354b BBC , 350 benign. See Benign cysts, odontogenic. calcifying epithelial , 356 carcinoma ex , 410 CCOT , 356 CT of , 519 , 520f dentigerous , 346 glandular , 356 KOTs , 348 , 351 lateral periodontal , 355 radicular , 343b residual , 346b
Odontogenic epithelial tumors , 373 ameloblastoma , 366 , 373 CEOT , 377b
Odontogenic fi broma , 387 central. See Central odontogenic fi broma.
Odontogenic keratocyst , 351 Odontogenic myxoma , 385 , 444
additional imaging for , 387 , 388f clinical features of , 385 CT of , 386f , 387 defi nition of , 385 differential diagnosis and , 386f , 387 MRI of , 387 radiographic features of , 386
internal structure , 386 , 386f , 387f location , 386 periphery , 386 surrounding structures relating to , 386
synonyms for , 385 treatment for , 387
Odontogenic tumors , 373 adenomatoid , 383 benign , 519b , 519f CCOTs , 356 CEOTs , 377 epithelial , 373 KOTs , 348 , 351 mixed , 380
Odontoma , 366 , 378 calcifi ed mixed , 378 clinical features of , 378 , 379f complex , 378 complex composite , 378 compound , 378 compound composite , 378 cystic , 378 defi nition of , 378 differential diagnosis and , 380 epithelial , 373 radiographic features of , 378
internal structure , 378 , 379f , 380f , 381f
Nasopalatine duct cysts (Continued) Neuroma (Continued) Occlusal surfaces, lesions on (Continued)
632 INDEX
location , 378 periphery , 378 surrounding structures relating to , 380
soft , 380 soft mixed , 380 synonyms for , 378 treatment for , 380
Odontoma hamartoma , 378 Oligodontia , 295 Open contacts, periodontal disease and , 291 , 291f Operation, of automatic processor , 73 Operative treatment, for dental caries , 274 Operculitis , 329 Oral cavity, radiotherapy in , 23 Oral mucous membrane , 23 Oral squamous cell carcinoma , 409 Oral tissues, radiation ’ s effects on , 23 , 23f Orbital blow-out fractures , 552
clinical features of , 552 defi nition of , 552 management of , 553 radiographic features of , 553 , 553f
Orbitals, electron , 2 , 3f Organs
cancer of , 29 deterministic effects on , 20 radiation-induced cancer relating to , 29b
Orthodontic appliances , 171 , 174f Orthodontic evaluation, CBCT for , 246 Orthodontics and three-dimensional
cephalometry , 237 , 239f Orthophos XG-Plus , 179 , 180f Orthoralix 8500 , 179 , 180f Osseous deformities, in furcations of multirooted
teeth , 287 , 288f Osseous structures , 473 , 477
conventional tomography , 477 , 487f CT , 475f , 478 panoramic projection , 477 plain fi lm imaging modalities , 477 , 479f SMV and , 477 , 479f
Ossifi cation calcifi cation and, of soft tissue. See Soft
tissue(s). heterotopic , 526
Ossifi cation, of stylohyoid ligament , 535 clinical features of , 535 defi nition of , 535 differential diagnosis and , 536 management of , 536 radiographic features of , 536
internal structure , 536 location , 536 shape , 536 , 536f
Ossifying fi broma , 440 , 441 Osteitis
rarefying , 326 , 518 sclerosing , 326 , 518
Osteitis deformans , 447 Osteoarthritis , 491f Osteoblastoma , 366 , 398 , 500
clinical features of , 398 defi nition of , 398 differential diagnosis and , 398 radiographic features of , 398
internal structure , 398 location , 398 periphery , 398 , 400f surrounding structures relating to , 398
synonyms for , 398 treatment for , 399
Osteoblasts , 454 Osteochondromas , 500 , 501f Osteochondromatosis , 496 Osteoclasts , 454 Osteocytes , 454 Osteogenesis imperfecta , 310 Osteogenic sarcoma , 414 , 441 , 501 Osteoid osteoma , 399b
clinical features of , 401 defi nition of , 399 differential diagnosis and , 401 giant , 398 radiographic features of , 401
internal structure , 401 location , 401 periphery , 401 , 401f surrounding structures relating to , 401
treatment for , 401 Osteoma , 392
osteoid , 399 Osteoma cutis , 536
clinical features of , 536 defi nition of , 536 differential diagnosis and , 537 management of , 537 radiographic features of , 537
internal structure , 537 location , 537 , 537f periphery and shape , 537
Osteoma, jaw relating to , 392 , 500 clinical features of , 393 defi nition of , 392 , 393f differential diagnosis and , 393 radiographic features of , 393
internal structure , 393 location , 393 , 394f periphery , 393 surrounding structures relating to , 393
treatment for , 393 Osteoma, paranasal sinuses relating to , 515
clinical features of , 515 CT of , 516f defi nition of , 515 differential diagnosis and , 515 radiographic features of , 515
internal structure , 515 location , 515 periphery and shape , 515 , 516f
Osteomalacia , 455t , 462 clinical features of , 462 defi nition of , 462 radiographic changes, associated with teeth , 463 radiographic features , 462
general , 462 of jaws , 462
Osteomyelitis , 325 , 331 . See also CRMO acute , 331 acute phase of , 331
clinical features of , 332 defi nition of , 331 differential diagnosis and , 333 internal structure of , 332 , 332f location of , 332 management of , 334 periphery of , 332 radiographic features of , 332 radiologic examination relating to , 331f , 332
surrounding structures relating to , 333 , 333f , 334f
synonyms for , 331 chronic phase of , 331 , 334
defi nition of , 334 differential diagnosis and , 335 internal structure of , 335 , 335f , 336f location of , 335 management of , 336 periphery of , 335 radiographic features of , 335 , 335f , 336f radiologic examination relating to , 332f , 335 surrounding structures relating to , 335 , 336f synonyms for , 334
defi nition of , 331 Garr é ’ s , 331 Garr é ’ s chronic nonsuppurative sclerosing , 334 pyogenic , 331 subacute suppurative , 331
Osteonecrosis, bisphosphonate-related , 341 Osteopenia , 492 , 493 Osteopetrosis , 465
clinical features of , 465 defi nition of , 465 differential diagnosis and , 466 radiographic features , 465
associated with teeth , 466 general , 465 , 466f of jaws , 466 , 467f
synonyms for , 465 treatment for , 466
Osteoporosis , 455t , 461 clinical features of , 461 defi nition of , 461 radiographic features of , 461 , 462f treatment for , 463 vitamin D and , 461
Osteoradionecrosis , 25 , 26 , 26f , 336 clinical features of , 338 defi nition of , 336 differential diagnosis and , 339 internal structure of , 339 location of , 339 management of , 340 periphery of , 339 radiographic features of , 338 , 338f , 339f radiologic examination relating to , 338 surrounding structures relating to , 339 , 340f
Osteosarcoma , 414 clinical features of , 414 defi nition of , 414 differential diagnosis and , 415 management of , 415 radiographic features of , 414
internal structure , 414 location , 414 periphery and shape , 406f , 414 , 415f surrounding structures relating to , 414 , 416f
synonym for , 414 Outer cortical bone and periosteal reactions,
intraosseous lesions relating to , 260f , 262f , 265 , 266f
Oxygen, irradiation relating to , 22
P
Paget ’ s disease , 322 , 335 , 414 , 439 , 447 clinical features of , 447 CT of , 448f
Osteomyelitis (Continued)Odontoma (Continued) Osteoblastoma (Continued)
INDEX 633
defi nition of , 447 differential diagnosis and , 448 management of , 448 radiographic features of , 447
internal structure , 447 , 448f , 449f location , 447 , 448f surrounding structures relating to , 447 , 449f
synonym for , 447 Pain
infl ammation relating to , 325 of TMJ , 219f
Palatal roots , 162 Palatine torus , 367 Panoramic and cephalometric equipment,
infection control and , 105 Panoramic extraoral projection, in dentistry , 56 Panoramic fi lm darkroom techniques , 182 Panoramic imaging , 175 , 176f
anteroposterior position radiograph and , 181 mandible , 184 , 185f , 186f CCD and , 182 , 182f disadvantage of , 175 image receptors and , 182 interpretation of , 183 , 183f , 184f , 185f panoramic fi lm darkroom techniques , 182 panoramic image formation, principles of , 175 ,
176f , 177f patient positioning and head alignment during ,
180 PSP relating to , 175 , 182
Panoramic machines , 179 computer-controlled multimodality , 179 direct digital acquisition , 182 Orthophos XG-Plus , 179 , 180f Orthoralix 8500 , 179 , 180f Proline XC , 179 , 180f
Panoramic projection , 477 Panoramic radiographs , 249 Panoramic radiography
for dental implants , 597 , 598 , 599t , 600f intensifying screens and , 182
Pantomography. See Panoramic imaging Paper printers , 85 , 86f Papillary cystadenoma lymphomatosum , 590 Papilloma , 515
clinical features of , 515 defi nition of , 515 epithelial , 515 radiographic features of , 515
internal structure , 515 location , 515 surrounding structures relating to , 515
Papillon-Lef è vre , 290 Paradental cysts , 350 , 350f Parallax , 62 , 63f Paralleling and bisecting-angle techniques , 48 , 49f Paralleling technique, of periapical radiography ,
109 , 111 , 111f mandibular
canine projection , 127b centrolateral projection , 125b distal oblique molar projection , 133b molar projection , 131b premolar projection , 129b
maxillary canine projection , 117b central incisor projection , 113b distal oblique molar projection , 123b lateral projection , 115b
molar projection , 121b premolar projection , 119b
receptor-holding instruments , 111 , 111f tube head, angulation of , 111 , 112f
Paranasal sinuses benign neoplasms relating to , 515 CT of , 248 , 506 , 509 diseases associated with , 507 ethmoid air cells relating to , 506 , 508f , 552 extrinsic diseases involving , 518 frontal , 506 , 508f function of , 514f intrinsic diseases of , 509 maxillary , 506 , 507f , 508f MRI of , 506 , 509 neoplasms relating to , 514 normal development and variations of , 506 radiographs and , 248 sphenoid , 506 Waters projection relating to , 509 , 510 , 510f ,
516 , 517f , 523 zygomycosis of , 517
Parateeth , 295 Parathyroid hormone (PTH) , 454
hypoparathyroidism and pseudohypoparathyroidism relating to , 457
renal osteodystrophy and , 463 , 464 Parotid area, enlargements of , 578
bilateral , 578 , 579 differential diagnosis of , 578 unilateral , 578
Parotid gland , 584f , 586f , 587f , 588f , 589f Parotid sialoliths , 579 Parotitis , 585 Partial images , 74b , 76f Partial volume artifacts , 210 Partial volume averaging , 235 Particles
beta , 4 fundamental , 2 , 3t
Particulate radiation , 4 , 18 Patient(s)
with disabilities mental , 149 physical , 150
edentulous , 151 examination of, dental radiographs relating to ,
250 exposure and dose of , 35 , 35t general information of , 268 low radiation dose of, CBCT relating to , 236 management of , 147 placement of, for extraoral radiographic
examinations. See Image receptor. positioning and head alignment of, during
panoramic imaging , 180 anteroposterior position radiograph and ,
181 children and , 180 chin and occlusal plane relating to , 181 , 181f dimensional aberrations and , 178f , 179f , 181 proper neck extension relating to , 182 , 182f
positioning of , 112 x-ray generation and , 225
preparation of, CBCT and , 233 selection criteria of
CBCT and , 229 radiation exposure relating to , 36
Patient-related artifacts , 235 PCD. See Periapical cemental dysplasia PDL. See Periodontal ligament space Penny test, for fogging , 102 , 102f Perforation and deformities, TMJ and , 489 , 489f Periapical abscess , 326 Periapical and bitewing projections , 110b Periapical cemental dysplasia (PCD) , 328 , 432
clinical features of , 433 COF v. , 441 CT of , 434f defi nition of , 432 differential diagnosis and , 434 FOD v. , 437 management of , 437 radiographic features of , 433
internal structure , 433 , 434f , 436f , 437f location , 433 , 434f , 435f periphery and shape , 433 , 436f surrounding structures relating to , 434 , 434f
synonyms for , 432 Periapical cyst , 343 Periapical disease , 167 , 168f Periapical fi bro-osteoma , 432 Periapical fi brous dysplasia , 432 Periapical fi lms , 54 , 55f , 77 Periapical granuloma , 326 Periapical idiopathic osteosclerosis , 370 Periapical infl ammatory lesions , 325 , 326
clinical features of , 326 defi nition of , 326 , 326f differential diagnosis and , 328 , 329f , 330f internal structure of , 327 , 327f , 328f location of , 327 management of , 329 periphery of , 327 , 327f , 328f radiographic features of , 326 , 327f surrounding structures relating to , 327 , 329f synonyms for , 326
Periapical osteofi brosis , 432 Periapical projections , 110b . See also Mixed
dentition; Primary dentition Periapical radiographs , 49 Periapical radiography , 109
bisecting-angle technique , 109 , 111 , 112f bitewing examinations , 135 CCD and , 109 , 111 , 112 CMOS and , 109 , 111 , 112 exposure, steps for making of , 120 paralleling technique , 109 , 111 , 111f
Periapical views, of intraoral x-ray fi lm , 54 , 55f , 77 Pericoronitis , 329
clinical features of , 329 defi nition of , 329 differential diagnosis and , 331 internal structure of , 330 , 331f location of , 330 management of , 331 periphery of , 330 radiographic features of , 330 surrounding structures relating to , 330 synonym for , 329
Peridens , 295 , 297f Periodontal abscess , 289 , 290f Periodontal bone loss, patterns of , 289
aggressive periodontitis , 289 periodontal abscess , 289 , 290f
Periodontal cysts apical , 343 lateral , 355
Paget’s disease (Continued) Paralleling technique, of periapical radiography (Continued)

634 INDEX
Periodontal disease , 270 , 282 , 518 AIDS and , 293 assessment of , 282 , 282b dental conditions associated with , 291 general radiographic features of , 284 gingival , 282 local irritating factors and , 291 , 292f normal anatomy and , 284 , 284f occlusal trauma and , 291 open contacts and , 291f periodontal bone loss, patterns of , 289 periodontal therapy, evaluation of , 291 , 292f periodontitis , 282 , 285 radiographs and , 245 , 282 , 283 , 283b systemic disease and , 293 technical procedures for , 283 tooth mobility and , 291
Periodontal ligament , 153 , 154f Periodontal ligament space (PDL) , 155 , 155f , 168 ,
284 dental abnormalities relating to , 301 , 303 , 305 ,
315 , 322 jaw lesions relating to , 295 periodontal disease relating to , 284 , 286 , 287 ,
291 Periodontal membrane space, intraosseous lesions
relating to , 262f , 264 , 265f , 266f Periodontal therapy, evaluation of , 291 , 292f
differential diagnosis relating to , 292 , 293f Periodontitis , 282 , 285. See also Aggressive
periodontitis apical
acute , 326 chronic , 326
Periosteal dental implants , 598f Periosteal reactions and outer cortical bone,
intraosseous lesions relating to , 260f , 262f , 265 , 266f
Periostitis , 518 defi nition of , 518 , 518f proliferative , 331 , 333 , 334f radiographic features of , 519
Periostitis ossifi cans , 331 Peripheral eggshell effect , 51 , 52f Periphery, of infl ammatory lesions , 325 Permanent molar periapical projection , 148 Personnel protection, radiation exposure relating
to , 41 , 41f , 42f PET. See Positron emission tomography “ Petrifi ed man ” condition , 538 Pharyngeal airway , 184 Phenidone , 67 , 68 Phleboliths , 532
clinical features of , 532 defi nition of , 532 differential diagnosis and , 533 radiographic features of , 533 , 585 , 591
internal structure , 533 , 534f location , 533 periphery and shape , 533
Phosphor layer, of intensifying screens , 54f , 57 , 57f , 57t , 58f
Photoelectric absorption scattering , 13 , 13f , 13t , 14f
Photoelectric interactions , 65 Photons , 2 , 4 , 5 , 5f
Bremsstrahlung radiation and , 9 , 9f , 10f characteristic radiation and , 10 , 10f imaging relating to , 46 , 47f , 208
incident , 13 , 13t latent image and , 65 spectrum of , 10 , 10f , 11f x-ray , 65
Photostimulable phosphor (PSP) , 81 , 82f clinical considerations relating to , 91 , 98 detector sensitivity and , 84 digital imaging and , 272 panoramic imaging relating to , 175 , 182 plate scans
heat relating to , 98 rotating , 83 stationary , 83
resolution in , 84 Physical disabilities, patients with , 150 PID. See Position-indicating device Pindborg tumor , 377 Pitch, helical scanners relating to , 207 Pituitary gland , 458 Pixel , 78 , 208 Plain fi lm imaging modalities , 477 , 479f Plain fi lm radiography, for salivary glands , 579 Plasma cell granuloma , 517 Plasma cell myeloma , 419 Plasmacytoma , 419 Plastic wrap, infection control and , 104 , 104f , 105f Plate scans
heat relating to , 98 rotating , 83 stationary , 83
Pleomorphic adenoma , 590 , 591f Point of entry
anterior mandibular occlusal projection , 144b , 148 maxillary occlusal projection , 141b , 147
cross-sectional mandibular occlusal projection , 145b maxillary occlusal projection , 142b
lateral mandibular occlusal projection , 146b maxillary occlusal projection , 143b
mandibular canine projection , 127b centrolateral projection , 125b distal oblique molar projection , 133b molar projection , 131b premolar projection , 129b
maxillary canine projection , 117b central incisor projection , 113b distal oblique molar projection , 123b lateral projection , 115b molar projection , 121b premolar projection , 119b
premolar bitewing projection , 137b Polyps , 513
antral , 513 clinical features of , 513 defi nition of , 513 radiographic features of , 513
Poor soft tissue contrast, CBCT relating to , 236 Porcelain, as restorative material , 171 , 173f Position-and-distance rule , 36 , 41f Position-indicating device (PID)
dental exposure and , 37 , 38 , 38f , 39 infection control and , 103 , 104
Positioning and head alignment, of patient, during panoramic imaging , 180
Positron emission tomography (PET) , 218 , 221 , 221f , 222f , 583
Posterior attachment (retrodiskal tissues), TMJ and , 475
Posterior bitewing projection , 148 Posterior wall, of nasopharynx , 184 Posteroanterior projection , 203 , 204f Posteroanterior skull fi lm , 183 Posteroanterior skull projection , 197
central x-ray beam, position of , 197 image receptor and patient placement for , 197 resultant image of , 197 , 198f
Posttraumatic myositis ossifi cans , 537 Potassium bromide , 67 Precession, MRI and , 213 , 213f Precessional or Larmor frequency , 213 Pregnancy, radiographic examinations and , 251 Premature craniosynostosis , 563 , 564 Premolar(s) , 135t
Leong ’ s , 306 Premolar projection
bitewing , 137b mandibular , 129b maxillary , 119b
Preoperative planning, for dental implants , 602 Preorbital edema , 552 Preservative , 67 , 68 Primary carcinomas
intra-alveolar epidermoid , 409 intraosseous , 409 , 410 odontogenic , 409
Primary dentition (3 to 6 years) , 147 , 148f bitewing projection , 148 deciduous mandibular molar projection , 148 deciduous maxillary molar periapical
projection , 148 mandibular anterior occlusal projection , 144b ,
148 maxillary anterior occlusal projection , 141b , 147
Primary epithelial tumor, of jaw , 409 Primary hyperparathyroidism , 454 Primary lymphoma, of salivary glands , 593 Primordial cysts , 351 , 361 Principles, of radiation protection
dose limitation , 42 justifi cation , 41 optimization , 42
Printers fi lm , 85 paper , 85 , 86f
Processing of digital image receptor. See Digital image
receptor exposure, processing, and handling.
handling and, of digital image receptor exposure , 92b
image , 86 manual procedures for , 71 , 71f system of, make step-wedge test of , 100 , 101f of tanks, manual , 69 , 71f
Processing equipment cleaning of , 101 preventing contamination of , 106 , 107f
Processing fi lm , 40 , 60 Processing solutions , 65
developer replenisher , 65 , 68 , 73 developing , 65 fi xing , 68 , 68f replacing of , 101
Photons (Continued)
INDEX 635
replenishment of , 71 , 74 , 100 rinsing , 68 temperature taken of , 100 washing , 68
Processor, automatic, operation of , 73 Prodromal period, of acute radiation syndrome ,
26 Progressive bone cavity , 361 Progressive myositis ossifi cans , 538
clinical features of , 538 defi nition of , 538 differential diagnosis and , 538 management of , 538 progressive , 538 radiographic features of , 538 , 539f
Progressive systemic sclerosis (PSS) , 467 clinical features of , 467 defi nition of , 467 PDL and , 467 , 468 radiographic changes, associated with teeth ,
467 , 468f radiographic features, of jaws , 467 , 467f synonym for , 467
Projection(s). See specifi c entries Projection data , 225 Projection geometry , 46 , 175
image shape distortion (magnifi cation) , 46 , 48f image sharpness and resolution , 46 , 47f image size distortion , 46 object localization , 50 paralleling and bisecting-angle techniques , 48 ,
49f peripheral eggshell effect , 51 , 52f
Proliferative periostitis , 331 , 333 , 334f Proline XC , 179 , 180f Proper neck extension, during panoramic
imaging , 182 , 182f Protective coat, of intensifying screens , 58 Protons
atomic structure and , 2 density of , 215 MRI of , 212 , 212f , 213f
Proximal surfaces, lesions on , 272 with or without clinical cavitation , 274 false interpretations , 273 , 273f , 275f , 276f radiographic appearance, typical , 272 , 272f ,
273f , 274f treatment considerations , 274 , 276f
Proximal tooth surface , 270 Pseudocyst , 511
antral , 512f retention , 511
Pseudogout , 496 Pseudohypoparathyroidism and
hypoparathyroidism , 455t , 457 Pseudotumor , 517b
clinical features of , 518 defi nition of , 517 differential diagnosis and , 518 fi broinfl ammatory , 517 infl ammatory , 517 management of , 518 radiographic features of , 518 synonyms for , 517
Psoriatic arthritis and ankylosing spondylitis, TMJ and , 494
PSP. See Photostimulable phosphor PSS. See Progressive systemic sclerosis
Pterygoid plates , 165 , 165f Pterygomaxillary fi ssure , 186 , 188f PTH. See Parathyroid hormone Pulp , 152 , 153f Pulp canal , 152 Pulp chamber , 152 Pulp stones , 320
clinical features of , 320 defi nition , 320 differential diagnosis and , 320 management of , 320 radiographic features of , 320 , 321f
Pulpal necrosis , 307 Pulpal sclerosis , 321b
clinical features of , 321 defi nition , 321 differential diagnosis and , 321 management of , 322 radiographic features of , 321 , 321f
Pyocele , 514 Pyogenic osteomyelitis , 331 Pyramidal fractures. See Le Fort fractures
Q
QLF. See Light fl uorescence Quality
beam , 10 of diagnostic images , 256 image , 63
Quality assurance radiation exposure relating to , 41 radiographic. See Radiographic quality
assurance. Quality criteria, of intraoral radiographic
examinations , 109 Quantization , 78 Quantum Mechanical Model , 2 Quantum mottle , 62 Quantum theory , 4 , 5 Quarks , 2 , 3f , 3t
R
RA. See Rheumatoid arthritis Radiation. See also Dose; Ionizing radiation;
Patient(s) Bremsstrahlung , 9 , 9f , 10f characteristic , 10 , 10f dosimetry relating to , 15 , 16t exposure to, examination relating to
fi lm and digital imaging , 37 , 37f fi lm and fi lm sensors , 39 fi lm processing , 40 , 60 fi ltration , 38 images, interpretation of , 40 intensifying screens and fi lm or digital
imaging , 37 kilovoltage (kVp) , 40 leaded aprons and collars , 39 , 39f milliampere-seconds (mAs) , 40 rectangular collimation , 37 , 38f , 39f source-to-skin distance , 37 , 38f
exposure to, measurement units of , 16 absorbed dose , 16 effective dose , 16 equivalent dose , 16 exposure , 16 radioactivity , 16
exposure to, personnel protection relating to , 41 , 41f , 42f
exposure to, sources of , 32 human-origin , 32 , 33f , 34t natural-origin , 32 , 33f , 33t
heritable effects of , 30 nature of , 4
electromagnetic , 4 , 4f particulate , 4 , 18
nonionizating , 4 occupational dose limits of , 34 , 34t reduction of dental exposure to , 36 scattered , 61 Si system as measurement of , 16 stochastic effects of , 19 , 19t
carcinogenesis , 28 , 28t , 29b , 29t heritable , 30
whole-body , 34 , 26 Radiation caries , 24 , 26f , 278 Radiation chemistry , 18
direct effect of , 18 DNA, changes in , 19 indirect effects of , 18 radiolysis of water , 18
Radiation, effects of on embryos and fetuses , 28
cataracts , 28 growth and development , 28 late , 28 life span shortening , 28
on oral tissues , 23 , 23f bone , 25 musculature , 26 oral mucous membrane , 23 radiation caries , 24 , 26f , 278 salivary glands , 23 , 24f taste buds , 23 teeth , 24 , 25f
Radiation genetics, basic principles of , 30b Radiation protection. See Principles, of radiation
protection Radiation syndrome, acute , 26 , 27t Radiation therapy
dental radiographs relating to , 251 periodontal disease and , 293
Radiation-induced cancer , 35 organs ’ susceptibility to , 29b
Radiation-induced changes, to bone , 336 Radiation-induced leukemias and solid tumors,
comparison of , 29t Radicular cysts , 343
clinical features of , 343 collapse of , 345 , 345f CT of , 344f , 345f defi nition of , 343 differential diagnosis and , 344 , 344f , 345f management of , 345 , 346f marsupialization and , 345 radiographic features of , 343
internal structure , 344 location , 343 , 344f periphery and shape , 344 , 344f surrounding structures relating to , 344 , 344f ,
345f synonyms for , 343
Radioactivity , 4 measurement of , 16 neutrons relating to , 4
Processing solutions (Continued) Radiation (Continued)
636 INDEX
Radiobiology , 18 Radiofrequency (RF) pulse , 215 , 216f
magnetic resonance signal and , 215 MRI and , 215 T1 and T2 relaxation and , 215 , 215t , 217
Radiographic abnormalities, of TMJ , 480 developmental , 480 soft tissue , 486
Radiographic anatomy normal , 152
restorative materials , 171 supporting structures , 152 teeth , 152 , 153f
of TMJ , 473 Radiographic assessment, of periodontal
conditions , 283b Radiographic blurring , 62 , 74b , 76f
geometric , 63 image receptor , 57f , 62 , 63f motion , 63
Radiographic contrast , 59 , 59f fi lm contrast , 58f , 60 , 60f scattered radiation , 61 subject contrast , 59 , 60f
Radiographic density , 58 , 58f exposure , 58 subject density , 59 subject thickness , 58 , 59f
Radiographic detection, of lesions , 272 on buccal and lingual surfaces , 277 , 277f dental restorations associated with , 277 , 279f on occlusal surfaces , 276 on proximal surfaces , 272 of rampant caries , 272f , 276 on root surfaces , 277 , 278f therapy after , 278 , 280f
Radiographic examinations , 248 , 248t of children , 147
coverage of , 147 mixed dentition (7 to 12 years) , 148 , 149f patient management , 147 primary dentition (3 to 6 years) , 147 , 148f
extraoral , 191 gag refl ex and , 150 intraoral , 249 of jaws
for benign tumors , 366 for malignant diseases , 405
pregnancy and , 251 systematic , 257
Radiographic infection control, key steps in , 108b Radiographic interpretation
clinical examination and , 256 formulation of , 266 , 267b , 268f image analysis and , 257 intraosseous lesions relating to , 266 , 267b , 268f principles of , 256
Radiographic joint space , 475 Radiographic mottle , 62 Radiographic noise , 62 Radiographic procedures, gloves worn during , 104 Radiographic quality assurance , 100
daily tasks for , 100 processing solutions, check temperature of ,
100 processing solutions, replenishment of , 71 ,
74 , 100 processing system, make step-wedge test of ,
100 , 101f
radiographs, reference fi lm compared to , 100 , 101f
retake log, fi ndings entered in , 100 monthly tasks for , 102
darkroom safelighting, checking of , 102 exposure charts, checking of , 102 , 102f fi lm stock, rotating of , 102 intensifying screens, cleaning of , 102 leaded aprons and collars, checking of ,
103 schedule of procedures for , 101b weekly tasks for , 101
processing equipment, cleaning of , 101 processing solutions, replacing of , 101 retake log, review of , 102 viewboxes, cleaning of , 102
yearly tasks for , 103 x-ray machine, calibration of , 103 , 103f
Radiographic recognition, of disease , 152 Radiographic report , 267
clinical information in , 268 fi ndings in , 268 imaging procedure in , 268 interpretation in , 268 patient and general information in , 268
Radiographic speed , 61 , 61f , 61t Radiographic techniques, for endodontics ,
150 Radiographic wastes, management of , 75 Radiographs. See also Dental radiographs;
Extraoral radiographs; Intraoral radiographs conventional , 46 dental anomalies and , 245 duplication of , 77 faulty, causes of , 74b , 75
blurring , 74b , 76f dark , 74b , 75f dark spots or lines , 74b , 76f fi lm fog , 74b , 76f fi lm packets reversed in mouth , 74b ,
75f insuffi cient contrast , 74b , 76f light , 74b , 75f light spots , 74b , 76f partial images , 74b , 76f
full-mouth set of , 109 , 110b , 110f interproximal , 50 intraoral , 50 mounting of , 77 , 77f occlusal , 50 panoramic , 249 periapical , 49 periodontal disease and , 245
contributions of , 282 , 283b limitations of , 283
reference fi lm compared to , 100 , 101f Radiography. See also Dental implants; DSR;
Salivary gland disease dental , 35 , 36 dose and risk in , 34
dose limits , 34 , 34t patient exposure and dose , 35 , 35t risk estimates , 35 , 35t
extraoral , 257 mobile , 148 , 149f occlusal , 147 panoramic. See Panoramic radiography. periapical , 109
Radiologic examination, for detection of dental caries , 270 , 271f , 272
with conventional intraoral fi lm , 270 , 271f , 272f
with digital imaging , 270 , 271f , 272 , 272f Radiology. See also Applied radiology
computed , 78 dental, for cancer survivor , 425
Radiolucent , 59 , 171 Radiolucent lesion , 272 Radiolucent presentations , 326 Radiolysis, of water , 18 Radionuclide imaging , 218 , 221f Radionuclide-labeled tracers , 218 Radionuclides , 218 , 221f Radiopaque , 59 , 171 , 172f Radiopaque presentations , 326 Radiosensitivity and cell type , 20 , 22t Radiotherapy, in oral cavity , 23
radiation effect, on oral tissues , 23 , 23f rationale for , 23
Radon , 32 Rampant caries , 272f , 276 Ramus , 184 . See also Mandibular ramus
projection Rapid prototyping (RP) , 238 , 242f Rapid-processing chemicals , 72 Rarefying osteitis , 326 , 518 Ray sum or ray casting , 229 , 231f Real-time imaging , 222 Receptor(s). See also Digital image receptor
exposure, processing, and handling; Digital image receptors
bitewing horizontal , 135 vertical , 136 , 136f
defi nition of , 109 image , 109
Receptor-holding instruments , 111 , 111f , 112 Reconstruction stage, of reconstruction process ,
229 Recovery, of cell , 20 Rectangular collimation , 37 , 38f , 39f Recurrent ameloblastoma , 375 , 377f Recurrent caries , 277 Redness, infl ammation relating to , 325 Reference fi lm, radiographs compared to , 100 ,
101f Reformatted CBCT and MDCT, for dental
implants , 597 , 599t , 600 , 603f , 604f , 605 , 607 , 607f , 608f , 610f
Regional odontodysplasia , 311 clinical features of , 311 defi nition of , 311 differential diagnosis and , 311 management of , 311 radiographic features of , 311 , 312f synonyms for , 311
Relaxation time T1 , 215 , 215t , 217 T2 , 215 , 215t , 217
Remodeling, TMJ relating to , 489 arthritic conditions and , 489
DJD , 490 JA , 493 RA , 491
clinical features of , 489 defi nition of , 489 differential diagnosis and , 490
Radiographic quality assurance (Continued)
INDEX 637
radiographic features of , 483f , 490 treatment of , 490
Renal failure, chronic , 463 Renal osteodystrophy , 455t , 463
brown tumors and , 456 , 463 children with , 463 clinical features of , 463 defi nition of , 463 PTH and , 463 , 464 radiographic changes, associated with teeth , 464 radiographic features of , 463
general , 463 , 464f of jaws , 464
synonym for , 463 vitamin D and , 463
Renal rickets , 463 Repetition time (TR) , 215 Replenisher, developer , 65 , 68 , 73 Replenishment, of processing solutions , 71 , 74 , 100 Residual caries , 277 Residual cysts , 346
clinical features of , 346 CT of , 348f defi nition of , 346 differential diagnosis and , 346 management of , 346 marsupialization and , 346 radiographic features of , 346
internal structure of , 346 location , 346 , 346f periphery and shape of , 346 surrounding structures relating to , 346
Resolutions contrast , 83 , 83f image sharpness and , 46 , 47f isotropic voxel , 225 in PSP , 84 spatial , 46 , 83 , 84f submillimeter, CBCT relating to , 236
Resonance. See Magnetic resonance imaging Resorption
bone , 339 erosion relating to , 316 external , 318 internal , 316
Resource Conservation and Recovery Act, of 1976 , 75
Restorations dental , 277 , 279f image , 86
Restorative materials , 171 calcium hydroxide base , 171 , 172f composites , 171 , 174f gold , 171 , 172f gutta-percha , 171 , 172f , 287f porcelain , 171 , 173f silicates , 171 , 173f silver amalgam , 171 , 172f silver points , 171 , 173f stainless steel crowns , 171 , 174f stainless steel pins , 171 , 172f
Restrainer , 67 Retake log , 100 , 102 Retention cyst, of maxillary sinus , 511 Retention pseudocyst , 511
clinical features of , 511 CT of , 512f defi nition of , 511
differential diagnosis and , 512 management of , 513 mucous , 511 radiographic features of , 512
internal structure , 512 , 512f location , 512 , 512f periphery and shape , 512 surrounding structures relating to , 512
serous nonsecretory , 511 synonyms for , 511
Reverse-Towne projection , 191 , 197 , 204 , 205f central x-ray beam, position of , 197 image receptor and patient placement for , 197 resultant image of , 197 , 199f
Rheumatoid arthritis (RA) , 491 CBCT of , 492f clinical features of , 492 defi nition of , 491 differential diagnosis and , 493 juvenile , 493 radiographic features of , 492 , 493f , 494f treatment for , 493
Rhinolith/antrolith , 534 clinical features of , 534 defi nition of , 534 differential diagnosis and , 535 management of , 535 radiographic features of , 535
internal structure , 535 location , 534f , 535 , 535f periphery and shape , 535
Rhinoliths , 514 Rhizopus sinusitis , 517 Rickets , 455t , 462
children with , 462 clinical features of , 462 defi nition of , 462 hypophosphatemic , 464 radiographic changes, associated with teeth ,
462 , 462f radiographic features of , 462
general , 462 of jaws , 462
vitamin D and , 462 vitamin D-resistant , 464
Rinse , 71 Rinsing , 68 Rollers , 72 , 73f Root canal , 152 , 153f Roots
buccal , 162 of molars , 162 palatal , 162 surfaces of, lesions on , 277 , 278f vertical fractures of , 545
Rotating anodes , 6 , 7f , 208 Rotating, of fi lm stock , 102 Rotating plate scans , 83 Round cell carcinoma , 417 RP. See Rapid prototyping
S
Safelighting darkroom , 69 , 70f Salivary enlargements, differential diagnosis of ,
578 parotid area , 578 , 579b submandibular area , 578 , 579b
Salivary gland(s) cancer of , 29 metastatic lesions of , 593 radiation damage to , 23 , 24f
Salivary gland defect, developmental , 574 Salivary gland depression, lingual , 574 Salivary gland disease
applied diagnostic imaging of , 578 algorithm for , 579 conventional sialography , 579 , 580 , 582f , 585 ,
587 , 588f CT , 579 , 580f , 581 , 583f extraoral radiography , 580 , 581f intraoral radiography , 579 , 580f , 581f MRI , 579 , 582 , 583f plain fi lm radiography , 579 scintigraphy , 583 , 584f US , 579 , 583 , 584f
clinical signs and symptoms of , 578 defi nition of , 578
Salivary gland disorders, image interpretation of , 584
noninfl ammatory , 587 cystic lesions , 589 sialadenosis , 587
obstructive and infl ammatory , 584 autoimmune sialadenitis , 587 bacterial sialadenitis , 585 sialodochitis , 586 sialolithiasis , 596
Salivary glands, tumors of benign , 589b
CT of , 590 , 591 , 591f hemangioma , 591 mixed , 590 radiographic features of , 590 treatment for , 590 Warthin , 590
malignant , 592 CT of , 592 , 593f , 594f mixed , 592b MRI of , 592 mucoepidermoid carcinoma , 592
other malignant and metastatic , 593 radiographic features of , 592 , 593f , 594f treatment of , 592
Salivary stones. See Sialolith Sampling , 78 SAPHO syndrome , 334 Sarcomas , 414
chondrogenic , 416 chondrosarcoma , 416 , 501 , 502f CT of , 415f , 417f , 418f Ewing ’ s , 417 fi brosarcoma , 418 lymphosarcoma , 421 osteogenic , 414 osteosarcoma , 414 synovial , 501
SBC. See Simple bone cyst Scan factors, x-ray generation and , 227 Scan time and number of projections , 233 , 234f Scan volume , 226
x-ray generation and , 226 Scanner gradients , MRI and , 216 Scanner-related artifacts , 235 , 235f Scanners
cone-beam , 225 CT and , 207 , 208f
Remodeling, TMJ relating to (Continued) Retention pseudocyst (Continued)

638 INDEX
helical. See Helical scanners. incremental , 207
Scanning, high-speed, CBCT relating to , 236 Scanning trajectory , 233 Scattered radiation , 61 Scattering
coherent , 13 , 13f , 13t Compton , 12 , 13f , 13t , 14 photoelectric absorption , 13 , 13f , 13t
Schwann cells , 389 , 391 Schwannoma , 389 Scintigraphy, for salivary glands , 583 , 584f Scleroderma , 467 Sclerosing cementoma , 432 Sclerosing osteitis , 326 , 518 Sclerotic cortical margins , 375 , 377f Screen fi lm , 53 , 56 , 56f
general types of , 56 Screen structure mottle , 62 Screens, intensifying. See Intensifying screens Secondary caries , 277 Secondary dentin , 318
clinical features of , 320 defi nition , 318 differential diagnosis and , 320 management of , 320 radiographic features of , 320 , 320f
Secondary hyperparathyroidism , 454 Secondary malignancy , 412 Segmental odontomaxillary dysplasia (SOD) , 573
clinical features of , 573 defi nition of , 573 differential diagnosis and , 574 radiographic features of , 573 , 573f synonym for , 573
Selective diagnostic imaging, for dental implants , 599t , 607 , 607f
Self-rectifi ed or half-wave rectifi ed , 8 Sensitivity sites , 65 Sensitometer , 100 Sensors
fi lm , 39 infection control and , 105 , 106f
Septa , 163 , 163f , 164 Septic arthritis , 494
clinical features of , 494 defi nition of , 494 differential diagnosis and , 494 radiographic features of , 494 , 495f synonym for , 494 treatment of , 496
Sequestra , 332 , 332f Serous nonsecretory retention pseudocyst , 511 Set timer , 71 Sharpness , 46 , 57 , 62 Short gray scale of contrast , 59 SI system, of radiation measurement , 16 Sialadenitis , 578
autoimmune , 587 bacterial , 585 ductal , 586 myoepithelial , 587
Sialadenosis , 587 clinical features of , 589 defi nition of , 587 radiographic features of , 589 synonym for , 587 treatment for , 589
Sialectases, cavitary , 587 , 592 Sialectasia , 587 Sialodochitis , 586
clinical features of , 587 , 587f defi nition of , 586 synonym for , 586 treatment of , 587
Sialography. See Conventional sialography Sialolith , 530
applied radiology for , 531 , 533f , 579 , 580 clinical features of , 531 CT of , 531f defi nition of , 530 differential diagnosis and , 532 management of , 532 parotid , 579 radiographic features of , 531
internal structure , 531 , 533f location , 531 periphery and shape , 531 , 532f
Sialolithiasis , 596 clinical features of , 584 defi nition of , 584 radiographic features of , 580f , 585 , 585f , 586f ,
587f synonyms for , 584 treatment for , 585
Sialo-odontogenic cyst , 356 Sialosis , 587 Sicca syndrome , 587 Sickle cell anemia , 468
clinical features of , 468 defi nition of , 468 radiographic features of , 468
general , 468 , 469f of jaws , 469
Silicates, as restorative materials , 171 , 173f Silicon, in CCDs , 79 Silver amalgam, as restorative materials , 171 ,
172f Silver atoms , 65
neutral , 65 Silver bromide crystal , 65 , 66f , 67 Silver, disposing of , 75 Silver halide crystals, fi xing solution and , 68 Silver halide grains , 53 , 54f , 56 , 62 , 65 Silver points, restorative materials and , 171 , 173f SIMPlant , 606f Simple bone cyst (SBC) , 361
clinical features of , 361 CT of , 363f defi nition of , 361 differential diagnosis and , 362 , 363f management of , 364 radiographic features of , 361
internal structure , 362 , 362f location , 361 periphery and shape , 361 , 362f surrounding structures relating to , 362 , 362f ,
363f synonyms for , 361
Simple odontogenic fi broma , 387 Single photon emission computed tomography
(SPECT) , 218 , 221f , 335 Sinonasal fungal disease , 517 Sinus mucosa, thickened , 509 Sinuses. See also Maxillary sinuses; Paranasal
sinuses benign mucosal cyst of , 511
Sinusitis , 509 . See also Maxillary sinusitis clinical features of , 509 CT of , 510 , 510f , 511f defi nition of , 509 invasive fungal , 517 management of , 511 radiographic features of , 510 , 510f , 511f Rhizopus, 517
Size and cost, of CBCT , 236 Sj ö gren ’ s syndrome , 222 , 587 Slow scan direction , 83 SMV. See Submentovertex projection SOD. See Segmental odontomaxillary dysplasia Soft mixed odontoma , 380 Soft odontoma , 380 Soft palate and uvula , 184 Soft tissue(s)
abnormalities of, TMJ relating to , 486 internal derangements , 486
anatomic structures of , 186f , 187f , 188f , 189 calcifi cation and ossifi cation of
arterial , 530 clinical features of , 526 dystrophic , 526 , 526b heterotopic bone , 535 idiopathic , 526 , 530 metastatic , 526 , 535 myositis ossifi cans , 537 radiographic features of , 526
infections of, diagnostic imaging of , 336 , 337f , 338f mineralization of , 526 opacities of , 526 poor contrast of, CBCT relating to , 236 squamous cell carcinoma in , 407 structures of , 478
MRI and , 478 , 480 , 480f Solid, as state of matter , 2 Solid tumors and radiation-induced leukemias,
comparison of , 29t Solid-state detectors , 78 , 79 , 208
charge-coupled device , 79 , 80 , 80f , 81f CMOS , 80 , 82f , 84 , 98 digital imaging and , 272 fl at panel , 80
Solitary bone cyst , 361 Solitary fi brous dysplasia, jaw relating to , 428 Solitary myositis , 537 Solutions
changing , 72 developing , 65 fi xing , 68 , 68f processing , 65 stirring of , 71
Source-to-object distance , 37 Source-to-skin distance , 37 , 38f Spatial resolution , 46 , 83 , 84f Specifi c dental applications, of CBCT , 237 SPECT. See Single photon emission computed
tomography Spectrum, of photons , 10 , 10f , 11f Sphenoid sinuses , 506 Spin density , 215 Spin-lattice relaxation time. See T1 relaxation time Spin-spin relaxation time. See T2 relaxation time Squamous cell carcinoma
of alveolar process , 292 , 293f central , 409 oral , 409 of salivary glands , 593
Scanners (Continued)

INDEX 639
Squamous cell carcinoma, in bone , 409 clinical features of , 409 defi nition of , 409 differential diagnosis and , 410 management of , 410 radiographic features of , 409
internal structure , 410 location , 409 , 409f periphery and shape , 410 surrounding structures relating to , 410
synonyms for , 409 Squamous cell carcinoma, in cyst , 410
clinical features of , 410 defi nition of , 410 differential diagnosis and , 410 management of , 410 radiographic features of , 410
internal structure , 410 location , 410 , 410f periphery and shape , 410 surrounding structures relating to , 410
synonyms for , 410 Squamous cell carcinoma, in soft tissue , 407
clinical features of , 407 defi nition of , 407 differential diagnosis and , 409 , 409f management of , 409 radiographic features of , 407
internal structure , 407 location , 407 periphery and shape , 407 , 408f surrounding structures relating to , 407
synonym for , 407 Squamous cell carcinoma, paranasal sinuses
relating to , 515 additional imaging of , 517 , 517f , 518f clinical features of , 515 CT of , 518f defi nition of , 515 differential diagnosis and , 517 management of , 517 radiographic features of , 516
internal structure , 516 location , 516 surrounding structures relating to , 516
Stafne bone cyst , 574 Stafne defect , 574 Stainless steel crowns, as restorative materials , 171 ,
174f Stainless steel pins, restorative materials and , 171 ,
172f Standard Model , 2 Static bone cavity , 574 Stationary plate scans , 83 Stent
diagnostic , 237 , 238f imaging, for dental implants , 601f , 605 , 605f
Step-wedge test, of processing system , 100 , 101f Sterilization, of nondisposable instruments , 105 Still ’ s disease , 493 Stochastic effects, of radiation , 19 , 19t
carcinogenesis , 28 , 28t , 29b , 29t heritable , 30
Streptococcus mutans, 24 , 25 , 270 Stylohyoid ligament, ossifi cation of , 535 Subacute suppurative osteomyelitis , 331 Subject contrast , 59 , 60f Subject density , 59 Subject thickness , 58 , 59f
Submandibular area, salivary enlargements of , 578
bilateral , 578 , 579b unilateral , 578 , 579b
Submandibular gland fossa , 169 , 171f , 187f Submandibulitis , 585 Submentovertex (base) projection (SMV) , 193 ,
201 , 202f central x-ray beam, position of , 193 image receptor and patient placement for ,
193 osseous structures and , 193 , 477 , 479f resultant image , 193 , 196f
Submillimeter resolution, CBCT relating to , 236 Subperiosteal implant , 598f Subtraction images , 89 Superimpositions and ghost images, anatomic
structures relating to , 186f , 189 Superior foramina of nasopalatine canal , 159 ,
160f Supernumerary teeth , 295 , 300
clinical features of , 295 , 296f , 297f , 298f defi nition of , 295 differential diagnosis and , 295 management of , 295 radiograph features of , 295 , 298f synonyms for , 295
Supplemental teeth , 295 Supporting alveolus
mandibular dentition and , 184 maxillary dentition and , 186
Supporting structures , 152 alveolar crest , 154 , 155f cancellous bone , 155 , 325 lamina dura , 152 , 154f , 162 mandible , 165 maxilla , 157 PDL , 155 , 155f
Swelling, infl ammation relating to , 325 Symphysis , 165 , 166f Syndromic craniosynostosis , 563 Synodontia , 300 Synovial chondromatosis , 496
clinical features of , 496 CT of , 496 , 497f defi nition of , 496 differential diagnosis and , 496 MRI of , 496 radiographic features of , 496 , 497f synonyms for , 496 treatment of , 496
Synovial chondrometaplasia , 496 Synovial sarcoma , 501 Syphilis. See Congenital syphilis Systematic radiographic examination , 257 Systemic disease, periodontal disease relating to ,
293 AIDS , 293 diabetes mellitus , 293 radiation therapy , 293
Systemic diseases, of jaws. See Jaws Systems compatibility , 90
T
T1 relaxation time , 215 , 215t , 217 T1-weighted image , 216 , 217f , 590 , 591 , 592 T2 relaxation time , 215 , 215t , 217 T2-weighted image , 216 , 217f , 590 , 591 , 592
Talon cusp , 312 clinical features of , 312 defi nition of , 312 differential diagnosis and , 312 management of , 313 radiographic features of , 312 , 313f
Taste buds, radiation relating to , 23 Taurodontism , 302
clinical features of , 303 defi nition of , 302 differential diagnosis and , 303 management of , 303 radiographic features of , 303 , 303f
TCS. See Treacher Collins syndrome Technical procedures, for periodontal disease ,
283 fi lm placement and beam alignment , 283 special considerations and techniques , 284
Teeth , 152 , 153f. See also Altered morphology, of teeth; Missing teeth; Supernumerary teeth; Transposition, of teeth
apex , 152 , 154 associated structures and, hyperparathyroidism
relating to , 458f CCD relating to , 571f cementum , 152 dentin , 152 enamel cap , 152 eruption of , 300 ghost , 311 hyperpituitarism relating to , 460 hypophosphatasia relating to , 463 , 463f , 464 ,
465f lamina dura, periodontal membrane space, and
intraosseous lesions relating to , 262f , 264 , 265f , 266f
multirooted, osseous deformities, in furcations of , 287 , 288f
number of , 295 osteomalacia relating to , 463 osteopetrosis relating to , 466 PSS relating to , 467 , 468f pulp , 152 , 153f pulp canal , 152 pulp chamber , 152 radiation relating to , 24 , 25f renal osteodystrophy relating to , 464 rickets relating to , 462 , 462f root canal , 152 , 153f size of , 298 supplemental , 295 trauma to , 152
Teeth and facial structures, trauma to applied radiology for , 541 CT of , 541 , 548 fractures , 544
of alveolar processes , 552b combination crown and root , 548 dental crown , 544 dental root , 545 Le Fort , 555 mandibular , 541 , 548 maxillofacial , 541 midfacial/maxillary , 552 monitoring healing of , 558 radiographic signs of , 541 vertical root , 545
injuries , 542 avulsion , 543
640 INDEX
concussion , 542 facial bones , 548 luxation , 542
Waters projection relating to , 541 , 554f Temperature, of processing solutions , 100 Temporomandibular joint (TMJ)
anatomy of , 476f arthrography relating to , 478 articular loose bodies , 496 CBCT relating to , 477 , 477f , 478 clinical features of , 473 diagnostic imaging of , 476
application of , 473 osseous structures , 473 , 477 soft tissue structures , 478
fracture, CT of , 498 MRI relating to , 478 , 480 , 480f pain of , 219f
panoramic imaging and , 175 , 176 , 179 , 184 , 188
anatomic structures and , 184 , 186 CBCT and , 238 , 240f radiographs and , 247
psoriatic arthritis and ankylosing spondylitis , 494
septic arthritis , 494 radiographic abnormalities of , 480
developmental , 480 soft tissue , 486
radiographic anatomy of , 473 bony relationships , 475 , 476f condylar movement , 476 , 477f condyle , 473 , 474f interarticular disk , 474 , 476f mandibular fossa , 474 , 474f , 475f posterior attachment (retrodiskal tissues) ,
475 remodeling and arthritic conditions relating to ,
489 trauma relating to , 496
ankylosis , 500 dislocation , 498 effusion , 496 fracture , 498 malignant tumors , 501 neonatal fractures , 499 , 499f
tumors of , 500 benign , 500b malignant , 501
Teratoma , 360 Terrestrial sources, of radiation , 32 TFT. See Thin fi lm transistor TFT LCD , 85 Thalassemia , 469
clinical features of , 469 defi nition of , 469 radiographic appearance, of jaws , 470 ,
470f radiographic features of , 470 , 470f synonyms for , 469
Thermometer , 69 Thickened sinus mucosa , 509 Thin fi lm transistor (TFT) , 80 , 85 Thin fi lm transistor display , 85 Three-dimensional cephalometry, orthodontics
and , 237 , 239f Three-dimensional reformatting , 210 , 211 ,
211f
Three-dimensional volume rendering , 229 direct , 229 , 232f indirect , 229 , 232f
Thyroid cancer , 29 Thyrotoxicosis , 460 Timer
darkroom equipment , 69 on X-ray machine , 8
Tissue contrast, MRI and contrast agents , 216 , 217f T1-weighted image , 216 , 217f T2-weighted image , 216 , 217f
Tissues hyperechoic , 222 hypoechoic , 222 oral, radiation ’ s effects on , 23 , 23f organs and, deterministic effects on , 20 soft, anatomic structures of , 186f , 187f , 188f ,
189 Tomographic layer , 222 Tomographic movement , 223 , 223f , 224f Tomography. See also CBCT; CT; PET; SPECT
conventional , 222 , 223f Tongue, dorsum and decorations of , 184 Tonsil concretions , 528 Tonsillar calculi , 528 Tonsilloliths , 528 Tonsils, dystrophic calcifi cation in , 526 , 528 Tools, diagnostic, for dental caries , 280 Tooth
microfl ora, diet, dental caries relating to , 270 mobility of, periodontal disease and , 291
Toothbrush abrasion , 315 Toothbrush injury , 315
clinical features of , 315 radiographic features of , 316
Torus mandibularis , 368 clinical features of , 369 defi nition of , 368 radiographic features of , 369
internal structure , 369 , 370f location , 369 periphery , 369 , 370f
synonym for , 368 treatment for , 369
Torus palatinus , 367 clinical features of , 368 , 368f defi nition of , 368 radiographic features of , 368
internal structure , 368 location , 368 , 368f periphery and shape , 368 , 369f
synonym for , 367 treatment for , 368
Total fi ltration , 11 Towne projection , 541 TR. See Repetition time Trabeculae , 155 , 156 Trabecular pattern , 156f , 169
bone density and , 259f , 265 of bone, internal density and , 289 , 289f
Trabeculation , 184 Tracheal cartilage , 533 , 534 Transcranial projections , 477 , 479f Transformer. See also Autotransformer
fi lament of , 7 high-voltage , 7
Transorbital projections , 477 , 479f Transpharyngeal projections , 477 , 479f
Transposition, of teeth , 300 clinical features of , 300 defi nition of , 300 differential diagnosis and , 300 management of , 300 radiographic features of , 300 , 300f
Transverse magnetic vector , 213 , 214f , 215 , 215f Trauma , 149
CBCT and , 248 CT and , 248 dental radiographs and , 248 maxillary sinus relating to , 508 occlusal, periodontal disease and , 291 to teeth , 152 TMJ relating to , 496
Traumatic bone cyst , 361 Traumatic injuries
to facial bones , 548 to teeth and facial structures , 542
Traumatic neuroma , 390 Treacher Collins syndrome (TCS) , 567
clinical features of , 567 , 568f CT of , 568f defi nition of , 567 differential diagnosis and , 567 management of , 567 radiographic features of , 567 , 568f synonym for , 567
Trisomy 21 syndrome , 303 Triticeous cartilage , 533 , 534 True cementoma , 387 Tube current (mA) , 7 , 10 Tube head, angulation of
bisecting-angle technique , 135 horizontal , 135 vertical , 109 , 135t
paralleling technique , 111 , 112f Tube head stability , 103 Tube rating and duty cycle , 9 Tube rating chart , 9 Tube shift technique , 50 , 50f , 51f Tube voltage (kVp) , 7 , 8f , 10 , 11f Tuberculosis, infection control and , 101 Tumors. See also Brown tumors; Pseudotumor
ameloblastic adenomatoid , 383 benign , 373 carcinoma ex mixed , 592 extrinsic , 500 , 501 giant cell , 442 intrinsic , 500 , 501 of jaws
benign. See Jaws, benign tumors of. malignant. See Jaws, malignant diseases of. primary epithelial , 409
mesenchymal , 385 mesodermal , 392 metastatic , 412 mixed , 378 nonodontogenic , 373 , 389 odontogenic , 373
adenomatoid , 383 epithelial , 373 mixed , 380
Pindborg , 377 of salivary glands. See Salivary glands, tumors
of. solid, radiation-induced leukemias and,
comparison of , 29t TMJ and , 500
Teeth and facial structures, trauma to (Continued)

INDEX 641
benign , 500b malignant , 501
Warthin , 590 Tungsten target , 6 Turner ’ s hypoplasia , 313
clinical features of , 313 defi nition of , 313 differential diagnosis and , 314 management of , 314 radiographic features of , 314 , 314f synonym for , 313
Turner ’ s tooth , 313 Twinning , 301 Two fi lms projected at right angles technique , 50 ,
50f , 51 , 51f Two-dimensional projections, CBCT and , 239f Type I diabetes mellitus , 460 Type II diabetes mellitus , 484
U
Ultrasonography (US) , 221 , 223f for salivary gland disease , 579 , 583 , 584f
Ultrasound, Doppler , 222 , 223f Unattenuated x-ray beam , 78 Uncomplicated dental crown fractures , 544 Undersampling , 235 Unexposed crystals , 65 Unicameral bone cyst , 361 Unicystic ameloblastoma , 377f Unilateral enlargements
of parotid area , 578 , 579b of submandibular area , 578 , 579
Unilateral hypertrichosis , 573 Universal precautions, of infection control,
applying of , 103 US. See Ultrasonography
V
Vascular nevus , 591 Vertebrae, cervical , 184 Vertical angulation, of tube head , 109 , 135t Vertical bitewing receptors , 136 , 136f Vertical bone defects , 286 , 286f , 287f Vertical root fractures , 545
clinical features of , 546 defi nition of , 545 management of , 548 radiographic features of , 546 , 547f
Viewboxes, cleaning of , 102 Viral infections , 509
Vitamin D hyperparathyroidism and , 454 hypoparathyroidism and
pseudohypoparathyroidism and , 458 osteoporosis and , 461 renal osteodystrophy and , 463 rickets and , 462
Vitamin D-resistant rickets , 464 Volumetric surface rendering , 232f von Recklinghausen disease , 391 Voxel size , 233
image detection system and , 227 Voxels , 208 , 209f
W
Warthin tumor , 590 clinical features of , 590 , 592f defi nition of , 590 MRI of , 590 , 591f radiographic features of , 584f , 590 synonym for , 590
Wash and dry fi lm , 71 Washing , 68 Water, radiolysis of , 18 Waters projection , 203f
central x-ray beam, position of , 194 extraoral radiographic examinations relating to ,
191 image receptor relating to , 194
and patient placement , 194 paranasal sinuses relating to , 509 , 510 , 510f , 516 ,
517f , 523 resultant image of , 194 , 197f teeth and facial structures relating to , 541 , 554f
Whole-body radiation , 34 deterministic effects of , 26
Wide-latitude fi lm , 61 , 62 Working surfaces, disinfecting and covering of ,
104 , 104f , 105f World Health Organization , 350 , 351 , 356 , 373
X
X rays , 4 , 5 matter ’ s interactions with , 12
beam attenuation , 14 coherent scattering , 13 , 13f , 13t Compton scattering , 12 , 13f , 13t , 14 photoelectric absorption , 13 , 13f , 13t , 14f
production of , 9 Bremsstrahlung radiation , 9 , 9f , 10f characteristic radiation , 10 , 10f
XCP fi lm-holding instrument , 38f , 135 , 135f , 136f
X-ray beam , 37 , 38 central. See Central x-ray beam. dental. See Dental x-ray beam. factors in controlling of , 10
collimation , 12 , 12f exposure time , 10 , 11f fi ltration , 11 , 11f inverse square law , 12 , 12f tube current (mA) , 10 tube voltage (kVp) , 10 , 11f
unattenuated , 78 X-ray fi lm , 53
composition , 53 , 54f , 54t base , 53 emulsion , 53 , 54f
intraoral , 53 , 55f screen fi lm , 53 , 56 , 56f
X-ray generation , 225 patient positioning and , 225 scan factors and , 227 scan volume and , 226 x-ray generator and , 226
X-ray generator, x-ray generation and , 226
X-ray machine , 5 , 5f calibration of , 103f disinfecting and covering of , 104 , 104f ,
105f power supply of , 7
timer , 8 tube current (mA) , 7 tube rating and duty cycle , 9 tube voltage (kVp) , 7 , 8f
X-ray output , 103 , 103f X-ray photons , 65 X-ray tubes
components of , 2 , 6 , 6f , 7f CT and , 7f , 208
Z
Zygomatic complex , 186 , 188 Zygomatic fractures , 554
clinical features of , 554 CT of , 554 , 554f defi nition of , 554 management of , 555 radiographic features of , 554 , 554f
Zygomatic process and zygomatic bone , 164 , 164f , 165f
Zygomycosis, of paranasal sinuses , 517
Tumors (Continued)