Oral controlled drug delivery systems, optimization of release ...
160
HAL Id: tel-01981770 https://tel.archives-ouvertes.fr/tel-01981770 Submitted on 15 Jan 2019 HAL is a multi-disciplinary open access archive for the deposit and dissemination of sci- entific research documents, whether they are pub- lished or not. The documents may come from teaching and research institutions in France or abroad, or from public or private research centers. L’archive ouverte pluridisciplinaire HAL, est destinée au dépôt et à la diffusion de documents scientifiques de niveau recherche, publiés ou non, émanant des établissements d’enseignement et de recherche français ou étrangers, des laboratoires publics ou privés. Oral controlled drug delivery systems, optimization of release patterns and elucidation of release mechanisms Carine Velghe To cite this version: Carine Velghe. Oral controlled drug delivery systems, optimization of release patterns and elucidation of release mechanisms. Human health and pathology. Université du Droit et de la Santé - Lille II, 2013. English. NNT : 2013LIL2S048. tel-01981770
-
Upload
khangminh22 -
Category
Documents
-
view
0 -
download
0
Transcript of Oral controlled drug delivery systems, optimization of release ...

HAL Id: tel-01981770https://tel.archives-ouvertes.fr/tel-01981770
Submitted on 15 Jan 2019
HAL is a multi-disciplinary open accessarchive for the deposit and dissemination of sci-entific research documents, whether they are pub-lished or not. The documents may come fromteaching and research institutions in France orabroad, or from public or private research centers.
L’archive ouverte pluridisciplinaire HAL, estdestinée au dépôt et à la diffusion de documentsscientifiques de niveau recherche, publiés ou non,émanant des établissements d’enseignement et derecherche français ou étrangers, des laboratoirespublics ou privés.
Oral controlled drug delivery systems, optimization ofrelease patterns and elucidation of release mechanisms
Carine Velghe
To cite this version:Carine Velghe. Oral controlled drug delivery systems, optimization of release patterns and elucidationof release mechanisms. Human health and pathology. Université du Droit et de la Santé - Lille II,2013. English. �NNT : 2013LIL2S048�. �tel-01981770�

I
UNIVERSITE LILLE NORD DE FRANCE FACULTE DES SCIENCES PHARMACEUTIQUES ET BIOLOGIQUES
Ecole Doctorale Biologie-Santé
ORAL CONTROLLED DRUG DELIVERY SYSTEMS: OPTIMIZATION OF RELEASE PATTERNS AND ELUCIDATION OF
RELEASE MECHANISMS
---
SYSTEMES ORAUX A LIBERATION CONTROLEE: OPTIMISATION DES CINETIQUES DE LIBERATION ET ELUCIDATION
DES MECANISMES IMPLIQUES
THESE Pour l’obtention du grade de
DOCTEUR EN SCIENCES PHARMACEUTIQUES
Soutenue publiquement le 11 Décembre 2013 à Lille
Par Carine Velghe
Dirigée par Juergen SIEPMANN Laboratoire INSERM U1008, Médicaments et Biomatériaux à Libération
Contrôlée
JURY : Pr Juergen SIEPMANN Directeur de thèse Pr Chris VERVAET Rapporteur Pr Thomas DE BEER Rapporteur Pr Elisabeth Delcourt-Debruyne Examinatrice MCF-HDR Aurélie MALZERT-FREON Examinatrice

II
REMERCIEMENTS
Ces premières pages sont dédiées à toutes les personnes qui de près ou de loin ont participé à cette aventure. Il sera fortement probable que j’en oublie, je pense que vous me connaissez suffisamment pour ne pas en tenir compte. J’aimerais tout d’abord adresser mes remerciements à mon directeur de thèse, Juergen Siepmann, qui a été à l’initiative de ce projet, pour l’aide, l’enthousiasme et les encouragements dont il a fait preuve à l’égard de ce travail. Pour la confiance qu’il m’a apporté, pour la joie d’avoir pu réaliser différents projets, appréhender différentes techniques, pour l’autonomie qu’il m’a permis d’acquérir au long de ces trois ans, et pour le soutien qu’il m’accorde encore aujourd’hui. J’adresse ma grande reconnaissance aux membres du jury : Thomas De Beer et Chris Vervaet, en tant que rapporteurs, et Elisabeth Delcourt-Bebruyne et Aurélie Malzert-Fréon en tant qu’examinatrices. Merci d’avoir accepté de lire et d’évaluer ce travail. J’espère que la lecture de ce manuscript vous enthousiasmera autant que j’ai eu de plaisir à la rédiger. Mes remerciements se tournent également vers Bruno Leclercq FMC et l’ensemble de l’équipe de Gattefossé qui m’ont fait confiance pour la réalisation de ce projet. J’aimerai maintenant remercier Melle Gayot pour m’avoir accueillie au sein de son laboratoire, et Marie Pierre Flament pour sa bonne humeur quotidienne. Merci à Florence Siepmann qui a toujours cherché à déchiffrer mes mails qui même pour moi me semble une énigme, pour avoir su à chaque fois m’écouter et me rassurer, qui m’a grandement aidé par la relecture de ce travail, un grand merci. Merci à Youness et Susi pour le partage de vos connaissances aussi bien sur le coater que sur la galénique même. Je tiens également à remercier chaleureusement Nicolas Blanchemain et Mr Hildebrandt, qui ont été les pionniers dans mon aventure. Pour l’aide apportée, pour les conseils avisés dont je profite encore. Mais également l’ensemble du Groupe de Recherche sur les Biomatériaux et personnes ayant de près comme de loin un rapport avec ces membres, notamment Mariam, Guillaume, Claudia, Mickael pour les partages que l’on a pu avoir ensemble. Sans oublier Cherry et Monique qui fut pour moi bien plus que la secrétaire du laboratoire. Concernant l’unité de pharmacotechnie industrielle : Céline qui m’a transmis son savoir sur les microparticules mais surtout qui m’a apportée la confiance qui m’a permis de croire en mon avenir au sein de la galénique. Steffie pour m’avoir transmis son savoir sur les implants lipidiques. Ainsi qu’Yvonne qui par sa présence m’a permis de prendre le relais sur le projet que l’on a eu en commun. Merci d’avoir été toujours à ma disposition et de m’avoir transmis ton savoir.

III
Et enfin Huong, pour être toujours souriante et pour m’aider à me dépatouiller dans les calculs. A celles avec qui j’ai partagé l’enthousiasme du début de thèse, la longueur du mi-parcours et le soulagement de l’arrivée. Phuong qui grâce à son calme et son enthousiasme a réussi à me montrer la voie à suivre, et à Emilie, ma partenaire de jeux, avec qui j’ai traversé pas mal de choses et il semble bien que cela ne s’arrêtera pas ici, ça y ai on y est arrivé ensemble à devenir « l’élite d’aujourd’hui ». Maria et Hanane dont j‘ai appris à connaitre les différentes facettes lors du PSSRC de Lisbonne, et du congrès à Pise et avec qui je partage de bons moments au Ru les midis. Pour conclure avec Susana et Bérengère, avec qui j’ai partagé les joies des pellets et de l’enrobage et de bonnes tranches de fou rire. Julie qui est arrivée plus tardivement mais qui dès le début a réussi le baptême du coater, bienvenue dans le groupe ! Merci à l’ensemble des stagiaires et personnes rencontrées pendant ma thèse, que j’ai côtoyé de près ou de loin, et dont certains sont devenus des amis. Merci à Muriel, Merci à Hugues pour le soutien technique qu’il m’a apporté. Bref, merci à tous pour l'accueil et les conditions de travail privilégiées qui m’ont été offertes. Pour toutes les pauses café que l’on a partagées ensemble, mais aussi pour les kilos accumulés par les gâteaux apportés pendant cette pause. Je tiens également à exprimer ma gratitude à l’ensemble du laboratoire de biopharmacie, notamment à Mr Odou et Decaudin tous deux PU-PH et Mme Christine Barthelemy MCU de cette unité, merci de m’avoir fait confiance et de m’avoir accepté au sein de votre équipe. A Damien, Nicolas, Marie André, Maryline et Stéphanie, qui m’ont accueillie chaleureusement et qui m’ont transmis leurs savoirs avant et pendant les TPs. Merci à l’équipe de Marc Descamps pour leur aide dans l’analyse de la DSC, et à Ahmed Addad pour sa disponibilité et son aide au niveau du MEB. Mais également à Alexis et Aurélien pour leur patience dans les explications de physique, pour un esprit comme le mien ce n’était pas gagné ! A présent il est temps de passer à ceux qui me supportent depuis tant d’années, Saminou avec qui j’en aurai passé des TPs et des aventures, Marie, Clément, Peggy et j’en passe. Les filles de l’asso, avec qui je partage de plus en plus de moment toujours agréables. Une énorme pensée à ma grosse, ma Wawa, sans qui tout cela n’aurait sûrement jamais eu lieu. Elle qui m’a poussée à la suivre dans l’aventure de la thèse. Cela fait plus de 10 ans que l’on se connait et je m’étonne encore à suivre tes conseils si PEU avisés. Tu es pour moi l’une des personnes marquantes de ma vie. On s’approche de la fin avec Maman et Papa qui ont su supporter mon sale caractère pendant toutes ces années (et qui le subisse encore) et qui m’ont montré avec plus ou moins de réussite un soutien bien veillant. A l’avenir Papa tu pourras vraiment m’appeler Docteur

IV
Velghe^^. A Laura, qui depuis tout ce temps est ma grande confidente, on en a fait du chemin depuis le tour ou tu es allée voir Mickey. Allez mon bof préféré fais pas la gueule tu as aussi ta place ici . Le plus important des mots, reviens à mon Nam dont je ne serais me passer à l’heure actuelle. Tu supportes mes crises, tu effaces mes doutes, tu sais me retenir dans mes extravagances. Tu m’apportes par ton calme et ton amour, un soutien inconditionnel. J’espère un jour te renvoyer la balle.

V
Table of content 1. Introduction (English) ............................................................................................................. 1
1.1. General ............................................................................................................................ 2
1.2. Purposes of this work ...................................................................................................... 5
1.3. Mathematical modeling of drug release and the advantages of lipid matrix formers ... 6
1.4. Application of terahertz pulsed imaging for film coating characterization (from Haaser
et al., 2013) ............................................................................................................................... 12
1.5. Ethanol-resistant polymeric film coatings .................................................................... 17
2.Introduction (Français) .......................................................................................................... 25
2.1 Généralité ........................................................................................................................... 26
2.2. Objectifs de la thèse .......................................................................................................... 29
2.3. Modèle mathématique de libération de principe actif et avantages des matrices
lipidiques .................................................................................................................................. 30
2.4. Imagerie terahertz pulsee pour la caracterisation de film d’enrobage ........................ 36
2.5. Ethanol-resistant polymeric film coatings .................................................................... 40
3. References ............................................................................................................................ 48
4. In-silico simulation of niacin release from lipid tablets: ...................................................... 64
Theoretical predictions and independent experiments .......................................................... 64
4.1. Materials and methods ..................................................................................................... 65
4.1.1. Materials..................................................................................................................... 65
4.1.2. Tablet preparation ..................................................................................................... 65
4.1.3. Tablet characterization .............................................................................................. 66
4.1.4. Equilibrium solubility measurements ........................................................................ 66
4.2. Results and discussion ....................................................................................................... 67
4.2.1. Model development ................................................................................................... 67
4.2.2. Model fittings to experimental results ....................................................................... 74

VI
4.2 3. Deeper insight into vitamin release mechanisms ...................................................... 76
4.2.4. Model predictions and independent experiments .................................................... 81
4.3. Conclusion ......................................................................................................................... 85
5. Investigation of the viscosity grade of guar gum in polymer blends to overcome ethanol
sensitivity of ethylcellulose-based coated pellets. .................................................................. 86
5.1. Materials and Methods ..................................................................................................... 87
5.1.1. Materials..................................................................................................................... 87
5.1.2. Preparation and characterization of thin polymeric films ......................................... 87
5.1.3. Pellet coating .............................................................................................................. 88
5.1.4. Drug release measurements ...................................................................................... 88
5.1.5. SEM studies ................................................................................................................ 89
5.2. Results and discussion ....................................................................................................... 90
5.2.1. Ethylcellulose/guar gum ratio .................................................................................... 90
5.2.2. Guar gum concentration in the total dispersion ........................................................ 95
5.2.3. Coating level ............................................................................................................... 97
5.2.4. Storage stability ........................................................................................................ 100
5.2.5. Guar gum viscosity ................................................................................................... 102
5.3. Conclusion ....................................................................................................................... 105
6. Elucidation of the underlying drug release mechanism of ethanol resistant
coated pellets ......................................................................................................................... 106
6.1. Materials and methods ................................................................................................... 107
6.1.1. Materials................................................................................................................... 107
6.1.2. Preparation and characterization of thin polymeric films ....................................... 107
6.1.3. Pellet coating ............................................................................................................ 109
6.1.4. Drug release measurements .................................................................................... 109
6.1.5. SEM studies .............................................................................................................. 110

VII
6.1.6 Diffusion cell studies ................................................................................................. 110
6.1.7. Determination of the drug solubility and of the partition coefficient of the drug .. 110
6.2. Results and discussion ..................................................................................................... 111
6.2.1. Drug release from single pellets ............................................................................... 111
6.2.2. Impact of the osmolality of the release medium ..................................................... 113
6.2.3. Morphology and mechanical properties of the film coatings .................................. 115
6.2.4. Drug mobility within the film coatings ..................................................................... 119
6.2.5. Mathematical modeling of drug release .................................................................. 122
6.2.6. Intermediate ethanol concentrations ...................................................................... 128
6. 4. Conclusion ...................................................................................................................... 128
7. Effects of film coating thickness on in-vitro drug release about sustained-release coated
pellets: Using terahertz pulsed imaging ................................................................................. 130
7.1. Materials and Methods ................................................................................................... 131
7.1 1. Materials ................................................................................................................... 131
7.1 2. Preparation of the Pellets ........................................................................................ 131
7.1.3. Terahertz Pulsed Imaging (TPI) ................................................................................ 132
7.1.4. Dissolution Testing ................................................................................................... 133
7.1.5. Scanning Electron Microscopy (SEM) ....................................................................... 134
7.2. Results and discussion ..................................................................................................... 134
7.3. Conclusion ....................................................................................................................... 140
8. Summary............................................................................................................................. 142
9. Résumé ............................................................................................................................... 146

Chapter 1 : Introduction
1
1. Introduction (English)

Chapter 1 : Introduction
2
1.1. General
Controlled drug delivery systems are frequently used in order to optimize the
therapeutic effects of drug treatments. Importantly, drug levels below the minimal effective
concentration at the site of action lead to failure of the medical treatment, whereas toxic
drug levels can cause serious side-effects, potentially resulting in the termination of the
treatment. Thus, it is of great practical importance to maintain the drug concentration within
its therapeutic range, also called therapeutic window.
This can either be achieved by lowering the administered dose and shortening the
time intervals between the administrations, or by using time-controlled drug delivery
systems. Most often, increasing the application frequence to stay within the therapeutic
range of the drug is not suitable, because of the reduced compliance of the patient, or
simply for practical reasons (e.g., lack of administrations during the night). Hence, it can be
highly desirable to develop controlled drug delivery systems, releasing the drug at
predetermined rates to achieve optimal drug levels at the site of action. This is especially
true for highly potent drugs with narrow therapeutic ranges, e.g., anticancer drugs.
Comprehensive reviews of the developed strategies and investigated devices are given by
Tanquary and Lacey (1974), Baker (1987), Fan and Singh (1989), and Siepmann and
Siepmann (2012).
For example, matrix tablets can be used to release a drug in a pre-programmed
manner. Several mechanisms such as dissolution, diffusion, erosion or osmotic effects can
act to control the release rate. The determination of drug release mechanisms is important
to apprehend the different ways to optimize the drug delivery system (DDS).
A major advantage of matrix systems is often the relative ease of preparation and
low production cost. Another strong point is the wide range of drug release profiles that can
be achieved by varying the matrix former, e.g. polymer composition: hydrophobic,
hydrophilic, biodegradable, mineral or lipid matrix, or drug loading. Other industrial
processes such as coating can allow achieving a large range of drug release profiles.
Coating is a process frequently used to taste masking, in the protection of the drug
against exterior condition, and to ensure controlled drug delivery from pellets in example. In

Chapter 1 : Introduction
3
a batch of coated pellets, some pellets may be in bad conformation or not coated regularly
and as a consequence exhibit non desired release kinetics. So drug release profiles don’t
have to be in good correlation with excepted kinetics. In the case of multiparticulates device
only a fraction of the sub-units may presents this defect and thus, the drug release profiles
of the entire population are less impacted by failed system.
Food and Drug Administration (FDA) initiated since several years, the concept of
Process Analytical Technology (PAT) as a tool to analyze and control pharmaceutical process.
The aims are to assure a better comprehension of fabrication and an optimization of galenic
forms to obtain a high quality final product. In the case of coated multiparticulates forms, it’s
important to calculate the mass gain on the systems surface. Terahertz technology is
accepted as new tool to determine the coating thickness on high size pellets and tablets
surfaces’ (Ho, 2008 and 2009).
One of the major concerns with single coated unit is “dose dumping”. Upon contact
with the release media, water diffuses in the device and can generate a hydrostatic pressure.
Depending on the polymer properties and film coating properties and stability, this
generated hydrostatic pressure can lead to crack formation, causing a failure of the system.
With the use of matrix for sustained release, the content of drug can be relatively high. But,
in the case of default in the coating for example, the entire drug dose can be released in a
short time period. In the worst case, fatal side effects can happen. A solution is given by
dividing the drug dose into multiple units. Attention has to be taken not only in product
quality but also in external factor. Since several years the impact of gastric and intestinal
content dependant of food intake is became a parameter non-negligible in the development
of new formulations. More recently, the FDA reported the consummation of alcohol
beverage in close time with DDS led to failure of the device and total drug release in short
time. In these cases, dose dumping is observed for all types of drug delivery systems sensible
to ethanol medium.

Chapter 1 : Introduction
4
With respect to the major rate controlling mechanism, controlled drug delivery
systems can be classified as follows:
1) Diffusion controlled devices
2) Swelling controlled devices
3) Erosion controlled devices
4) Osmotic controlled devices
5) Others (e.g., magnetic and/or electrostatic effects)
with diffusion, swelling and erosion being the most important features of the commercially
available products. However, very often the entire process of drug release is not only
determined by a single mechanism, but results from a combination of several different
mechanisms.
Despite the steadily growing importance of time-controlled drug delivery sytems,
major challenges remain to be addressed, as explained in more detail in the following.

Chapter 1 : Introduction
5
1.2. Purposes of this work
The major purposes of this PhD thesis were:
(i) to decrease the ethanol resistance of polymer coated controlled release dosage
forms
(ii) to improve the characterization of controlled release polymeric film coatings
(iii) to better understand the mechnaisms controlling drug release from lipid-based
matrix tablets
Various drugs niacin, theophylline and metoprolol succinate were used as highly soluble
drugs
For lipid matrix: glyceryl behenate called Compritol 888 ATO.
For coating ethanol resistant: Aquacoat ECD 30: a dispersion of ethylcellulose as
hydrophobic polymer and guar guam as pore former. This system was plasticized by
Dibutylsebacate plasticizer.
For coating to characterize coating thickness: a dispersion of polyvinyl acetate : Kollicoat SR
30D, and PVA-PEG graft copolymer: Kollicoat IR plasticized by Triethyl Citrate.

Chapter 1 : Introduction
6
1.3. Mathematical modeling of drug release and the advantages of
lipid matrix formers
Mathematical modeling of mass transport in controlled drug delivery systems can be
highly beneficial: On the one hand side, the underlying drug release mechanisms can be
elucidated, on the other hand side, time-consuming and cost-intensive series of trial-and-
error experiments can be replaced by rapid in-silico simulations (Siepmann, 2006-2012a-
2013a ; Peppas, 2013). Compared to other scientific domains, such computer-assisted device
design is yet rarely applied in pharmaceutics.
A mechanistically realistic mathematical theory should always be based on a
thorough physico-chemical characterization of the dosage form before and after exposure to
the release medium. Based on this knowledge, appropriate model assumptions should be
defined. Ideally, only the dominant mass transport phenomena should be included, whereas
processes which have only a minor impact, should be neglected in order to keep the model
straightforward and simple to use. Examples for mass transport phenomena, which might
play a role in oral controlled drug delivery systems include water penetration into the system
(Hariharan, 1993), drug particle dissolution (Siepmann, 2013b), drug diffusion through
water-filled channels and/or polymeric networks (Siepmann, 2012 ; Grassi, 1999-2003 ;
Frenning, 2011 ; Yin, 2011), polymer swelling, degradation and/or dissolution (Brazel, 2000 ;
Borgquist, 2006 ; Sackett, 2011 ; Kaunisto, 2011), time-and position-dependent changes in
the mobility of water and drug within the dosage form (Mallapragada, 1997), and system
disintegration. In certain cases, only one of these phenomena might be dominant and the
mathematical description of the delivery system might be straightforward (Siepmann, 2010).
However, in other cases a multitude of processes might be decisive at the same time and an
accurate mathematical treatment is complex (Siepmann, 2012b). Due to the large variety of
controlled release dosage forms it can also not be expected that one single model could be
valid for all types of systems. Instead, on a case-by-case basis, the validity of a model must
be evaluated for each type of systems.
Some reports are available on lipid controlled drug delivery systems (Zaky, 2010 ;
Siepmann, 2011), in which a drug is embedded within a lipid matrix former. In particular for

Chapter 1 : Introduction
7
lipid implants different mathematical theories have been described so far (Siepmann, 2011 ;
Guse, 2006). However, these models: (i) were either developed for relatively complex
systems, in which for instance protein precipitation due to the presence of co-dissolved
polyethylene glycol is of importance (Herrmann, 2007a ; Herrmann, 2007b ; Siepmann,
2008), or (ii) take only one single mass transport phenomenon into account, e.g. diffusion
(Kreye, 2011a-2011b-2011c-2011d ; Gueres, 2012). Yet, there is a lack of appropriate,
mechanistically realistic mathematical theories quantifying mass transport in lipid tablets
and allowing for the prediction of the impact of key formulation and processing parameters,
such as the initial drug loading, tablet height and tablet radius as well as the manufacturing
procedure of the systems on the resulting drug release kinetics.
Lipids have recently been proposed as alternative material for the preparation of
controlled drug delivery systems (Kreye et al., 2008, 2011a, 2011b; Maschke et al., 2004;
Vogelhuber et al., 2003). The development of new drug delivery systems with these later can
be explain by a broad spectrum of excipient type due to differences in fatty acid chain
length, esterification or as lipid blends. They offer several advantages: being physiological
substances, lipids show good biocompatibility, and they might be less expensive than
polymeric materials. Being water-insoluble and non-swellable, lipid materials have major
applications in sustained-release systems, especially for systems containing high loadings of
freely water-soluble drugs. Drug release is also dependant of the diffusion coefficient and
due to the degradation of the matrix induces by the lipases or an erosion of the device.
Glyceryl behenate is a lipid material, which was originally introduced as a lubricant
for tablets (Jannin et al, 2003), and recently as a sustained-released excipient as matrix
former (Obaidat, 2001). Several types of device are investigated with this polymer such as:
tablets, suspension, beads, implants and microcapsules.
However, the production process with lipid powder is challenging due to poor
flowability of the dry powder which can cause tablet size variability and potential de-mixing.
Compritol 888 ATO is characterized by a low melting point, and is therefore used as a matrix
former for sustained-release dosage forms (Barthelemy et al., 1999; Faham et al., 2000 ;
Mirghani et al., 2000).
Impact of the technique for preparation of sustained lipophilic matrices is shown by
several authors (Abd El-halim et al., 2010; Li et al., 2006). Tablets obtained by heat
Chapter 1 : Introduction
8
treatment show a lower drug release rate than classical methods due to higher matrix
tortuosity and lower porosity (Jagdale et al., 2002; Zhang et al., 2003). An advantage of the
lipophilic matrix is the wide range of materials with broad spectrum of melt temperature.
Hot melt extrusion can be defined as a process to form extrudats, by forcing apowder
through an orifice or die under controlled conditions: temperature, mixing… Against to
classical extrusion, the use of heating leads to modification in drug release profiles with the
same powder composition, because of a more intense embedding of the drug particle by the
matrix former (Chokshi, 2004 ; Breitenbahc, 2002 ; Repka, 2007)(figure 1).
The composition of extruder is one of the parameters which shows an impact on the
quality and drug release profiles obtained. An increasing in kneading elements leads a higher
torque value and can show an impact on the extrudats densities which imply a modification
in drug release and quality of the product (Reitz, 2013; Vercruysse, 2012).
Other two crucial parameters are the Residence Time Distribution (RTD) and the
temperature of extrusion (Verhoeven, 2008). These both affect the quality and
characterization of the product. Gao et al. in 2012 elucidated the influence of the RTD on the
drug and formulation properties. A high time of residence can lead a thermal degradation of
the drug, but can be favorable in the case of DDS due to a slow dissolution of the drug in the
blend. The impact of RTD is relevant with the involved kinetics formulation as well as the
drug decomposition. This parameter is directly influenced by the screw speed and the
powder feed rate.
The temperature affects the resulting drug release kinetics. An increasing in
temperature increases the tortuosity and results in less porous systems and thus, decreases
the release rate. So it’s necessary to have a full understanding of the physical state of the
drug in the extrudates formulations. A thermoanalytical technique, Differential Scanning
Calorimetry (DSC), is a perfect tool to study the behavior of API or polymer to temperature
variations (Qi et al., 2007) based on the Tg of amorphous samples and Tm of crystalline
samples. Before HME process, several authors used hot stage microscopy to determin the
HME temperature to work (determination of the temperature where the drug becomes to
dissolve in the polymere, i.e.) (Agrawal et al., 2013). Several PAT are used to characterize
these systems in line. Saerens and al in two differentes publications show the potential for

Chapter 1 : Introduction
9
NIR and Raman spectroscopy to characterize polymer-drug interaction inside extrudates,
and determine the solid state of the drug too (Saerens et al., 2011 ; 2012).
Figure 1 : Schematic hot melt extrusion process to obtain solid dispersion.
For lipid, major phenomena in drug release about matrices are the diffusion of the drug
through the network (Guse, 2006). Several authors worked on different devices (Kreye,
2011a – Siepmann, 2008a). In practice drug release is not linear but becomes progressively
slower with time. The drug release profiles can be illustrated as figure 1.
Figure 2 : Representation of matrix tablet obtained by direct compression and the
impact of drug loading on drug release kinetics.
drug
Media dissolution penetration
Drug dissolution exit
Dru
g l
evel
in t
he
blo
od
Time
10 %
10 %
60 %60 %
drug
Media dissolution penetration
Drug dissolution exit
drug
Media dissolution penetration
Drug dissolution exit
Dru
g l
evel
in t
he
blo
od
Time
10 %
10 %
60 %60 %

Chapter 1 : Introduction
10
Certain authors explain drug release as follows:
- Phase 1: Relatively fast drug release obtain upon contact of matrix into medium
dissolution which causes drug release from drug in surface and superficial layer.
- Phase 2: with time, drug in the superficial layer is leach out and new porous network
is created. The dissolution medium diffuses through the empty porous network and
dissolves the drug deeper. The dissolved drug has to travel through more tortuous
network to reach the external dissolution medium. This phase characteristic by lower
drug release is explained by an increasing in distance inside the matrix tablet.
The phenomenon of diffusion is based on the drug transport through polymeric
network. Drug release profiles can be modified by variation in drug content or change in the
size structure. The increasing in drug content increases the number of pathways by
dissolution/diffusion of the drug, so higher drug release kinetics can be observed.
Certain authors use the percolation theory to explain drug release, e.g. the
Leuenberger team. At low drug loading levels, clusters of drugs are completely surrounded
by the polymer and the non-degradability of this latter lead to an inaccessibility of the drug
to the release medium. So an incomplete drug release is observed (figure 3). With an
increasing of drug content level, the connection between drug particles is more important
and the dissolution of drug creates a network through which the drug can be released
(Caraballo, 1996). This limit, where cluster of drug are embedded and cannot be release, is
given by percolation threshold.
Figure 3: Representation of matrix tablet obtained by hot melt extrusion/direct compression
and the impact of drug loading on drug release kinetics.
drug
Media dissolution penetration
Drug dissolution exit
Dru
g l
evel
in t
he
blo
od
Time
10 %
10 %
60 %60 %
drug
Media dissolution penetration
Drug dissolution exit
Dru
g l
evel
in t
he
blo
od
Time
10 %
10 %
60 %60 %

Chapter 1 : Introduction
11
The aims of this work were to: (i) identify such a mathematical theory for glyceryl
dibehenate-based tablets prepared either by direct compression or via hot-melt
extrusion/grinding/compression, (ii) use this theory to better understand the relative
importance of the involved mass transport processes, (iii) use this theory to quantitatively
predict the impact of the tablet design (namely, of the composition, dimensions and type of
preparation method) on the resulting release kinetics, and (iv) to evaluate the validity of
these model predictions using several sets of independent experimental results. The vitamin
niacin was used as “model drug”.

Chapter 1 : Introduction
12
1.4. Application of terahertz pulsed imaging for film coating
characterization (from Haaser et al., 2013)
Multiparticulate dosage forms are desirable drug delivery systems owing to a number
of advantages over single unit dosage forms, such as better control of the gastric transit time
and associated drug absorption, and a lower susceptibility to dose dumping (Bechgaard and
Nielsen, 1978). Frequently, the particles are coated to modify drug release kinetics. Thus, the
product performance directly correlates with critical film coating quality attributes, including
the coating thickness and uniformity (Haddish-Berhane et al., 2006).
Routinely, indirect monitoring methods such as the product weight-gain and the
amount of coating polymer applied are used to infer the pellet film coating thickness (and
thus the coating quality) (Ringqvist et al., 2003). For complex systems, e.g. drug-layered
sugar starter cores coated with a sustained-release coating, the non-specific character of the
weight-gain measurements as well as the fact that coating thickness uniformity can be
related to the drug layer surface morphology, render weight-gain as a sole indication of the
coating quality insufficient (Ho et al., 2008; Ho et al., 2010).
First point with multiple-unit system is the elucidation of properties of each subunit
separately. An idea of release characteristic can be applied by the studies of variation in
kinetics between subunits. Thus, a number of studies using mechanical analysis, e.g. in vitro
drug release testing, have been used to obtain more insight into pellet coating structures
and their effects on drug release (Siepmann et al., 2007; Siepmann et al., 2008; Muschert et
al., 2009). Those mechanistic methods provide deeper understanding of the drug release
mechanism from the coated dosage form. But there is still a lack of detailed information on
critical film coating quality attributes such as coating thickness, uniformity and morphology.
Information on the coating thickness, uniformity and morphology may be obtained with
other analytical techniques including scanning electron microscopy (SEM)(Heinicke and
Schwartz, 2007), fluorescence microscopy (Andersson et al., 2000), atomic force microscopy
(AFM)(Ringqvist et al., 2003), optical coherence tomography (OCT)(Zhong et al., 2011),
confocal Raman microimaging (Ringqvist et al., 2003), energy dispersive X-ray imaging
(EDX)(Ensslin et al., 2008), nuclear magnetic resonance spectroscopy (NMR)(Ensslin et al.,
2008), electron paramagnetic resonance spectroscopy (EPR)(Ensslin et al., 2009) and

Chapter 1 : Introduction
13
confocal laser scanning microscopy (CLSM)(Depypere et al., 2009).Cahyadi et al. in 2010
make an interesting comparison between some non-destructive techniques used to
characterise the coating thickness. Direct observation in Direct Optical Microscopy seems
the best technique, with SEM observations, to be the model references to validate others
analytical techniques. However, both need time and money consuming, and destruction of
the sample. Second technique which allows rapid and on-line characterisation is using the
micrometer to measure the difference between the thickness coated and non coated pellets
(Römer et al., 2008), but it’s again time-consuming technique. Based on these observations
Cahyadi and al., supposed Raman spectroscopy seems to be the best method for
characterisation. Problems with this technique is the interpretation of signals which needs
some calculations. In-line NIR (Near Infra Red) can be used to detect quantitative film
coating too (Andersson et al.,2000 ; Lee et al., 2011 ; Moes et al., 2008). Cogdill et al., in
2007 compare NIR with Terahertz technology and bienque this last shows a problem of
sensitivity, Terahertz technology seems to be the directe technique to characterise coating
thickness. Indeed, like Raman spectroscopy, lots of noise are read in the diffractograms for
NIR interpretation and a bad estimation of the results are observed. Recently, Möltgen
combined NIR with science based calibration to determine noise in the diffractograms and
by calculation with this value, coating thickness can be approximate on-line (Möltgen et al.,
2013).
Scanning electron microscopy (SEM) is a widely used and complete technique for
pellets characterization. Characterization of the surface and cross section of coated pellets
give valuable information on the layer thickness, structure and the eventual presence of
pores or defects. Surface pellets’ observations after release in dissolution medium; allow an
understanding of solvent effect and mass transport due to the leaching out of soluble
polymer in this medium. Studies of pellet surface and presence of cracks at the end of
release indicate a mechanical failure of the coating. To testify the acts of these mechanisms
other studies have been performed such as diffusion cell studies to calculate the
permeability of the coating; diffusion coefficient of the drug or determination of the
partition coefficient (Marucci, 2007). Diffusion cells experiments performed under different
media temperature can approach the polymer state in the polymeric membrane and explain
the change in drug release due to the impact of Tg. During swelling, mass accumulation
Chapter 1 : Introduction
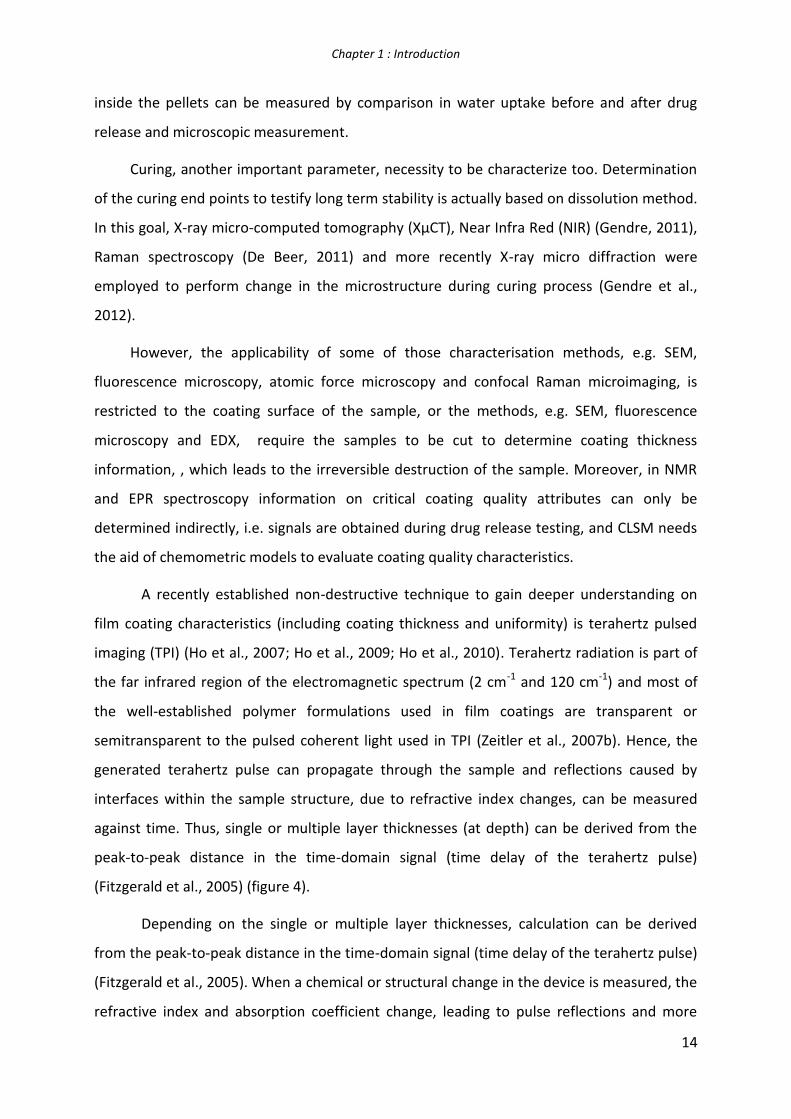
14
inside the pellets can be measured by comparison in water uptake before and after drug
release and microscopic measurement.
Curing, another important parameter, necessity to be characterize too. Determination
of the curing end points to testify long term stability is actually based on dissolution method.
In this goal, X-ray micro-computed tomography (XµCT), Near Infra Red (NIR) (Gendre, 2011),
Raman spectroscopy (De Beer, 2011) and more recently X-ray micro diffraction were
employed to perform change in the microstructure during curing process (Gendre et al.,
2012).
However, the applicability of some of those characterisation methods, e.g. SEM,
fluorescence microscopy, atomic force microscopy and confocal Raman microimaging, is
restricted to the coating surface of the sample, or the methods, e.g. SEM, fluorescence
microscopy and EDX, require the samples to be cut to determine coating thickness
information, , which leads to the irreversible destruction of the sample. Moreover, in NMR
and EPR spectroscopy information on critical coating quality attributes can only be
determined indirectly, i.e. signals are obtained during drug release testing, and CLSM needs
the aid of chemometric models to evaluate coating quality characteristics.
A recently established non-destructive technique to gain deeper understanding on
film coating characteristics (including coating thickness and uniformity) is terahertz pulsed
imaging (TPI) (Ho et al., 2007; Ho et al., 2009; Ho et al., 2010). Terahertz radiation is part of
the far infrared region of the electromagnetic spectrum (2 cm-1 and 120 cm-1) and most of
the well-established polymer formulations used in film coatings are transparent or
semitransparent to the pulsed coherent light used in TPI (Zeitler et al., 2007b). Hence, the
generated terahertz pulse can propagate through the sample and reflections caused by
interfaces within the sample structure, due to refractive index changes, can be measured
against time. Thus, single or multiple layer thicknesses (at depth) can be derived from the
peak-to-peak distance in the time-domain signal (time delay of the terahertz pulse)
(Fitzgerald et al., 2005) (figure 4).
Depending on the single or multiple layer thicknesses, calculation can be derived
from the peak-to-peak distance in the time-domain signal (time delay of the terahertz pulse)
(Fitzgerald et al., 2005). When a chemical or structural change in the device is measured, the
refractive index and absorption coefficient change, leading to pulse reflections and more

Chapter 1 : Introduction
15
GaAs
emitter
Sample
Laser
Optical
delay
Signal split
1: air
interface air/pellet
2: thickness polymer coating
interface coating polymer/API
3: thickness drug layer
interface coating PA/core
4: core pellet
1 2 3 4
rotation
Sample
Laser
Optical
delay
Signal split
1: air
interface air/pellet
2: thickness polymer coating
interface coating polymer/API
3: thickness drug layer
interface coating PA/core
4: core pellet
1 2 3 4
rotation
Laser
Optical
delay
Optical
delay
Signal split
1: air
interface air/pellet
2: thickness polymer coating
interface coating polymer/API
3: thickness drug layer
interface coating PA/core
4: core pellet
1 2 3 4
rotation
GaAs
receptor
GaAs
emitter
GaAs
emitter
Sample
Laser
Optical
delay
Signal split
1: air
interface air/pellet
2: thickness polymer coating
interface coating polymer/API
3: thickness drug layer
interface coating PA/core
4: core pellet
1 2 3 4
rotation
Sample
Laser
Optical
delay
Signal split
1: air
interface air/pellet
2: thickness polymer coating
interface coating polymer/API
3: thickness drug layer
interface coating PA/core
4: core pellet
1 2 3 4
rotation
Laser
Optical
delay
Optical
delay
Signal split
1: air
interface air/pellet
2: thickness polymer coating
interface coating polymer/API
3: thickness drug layer
interface coating PA/core
4: core pellet
1 2 3 4
rotation
GaAs
receptor
GaAs
emitter
Sample
Laser
Optical
delay
Signal split
1: air
interface air/pellet
2: thickness polymer coating
interface coating polymer/API
3: thickness drug layer
interface coating PA/core
4: core pellet
1 2 3 4
rotation
Sample
Laser
Optical
delay
Signal split
1: air
interface air/pellet
2: thickness polymer coating
interface coating polymer/API
3: thickness drug layer
interface coating PA/core
4: core pellet
1 2 3 4
rotation
Laser
Optical
delay
Optical
delay
Signal split
1: air
interface air/pellet
2: thickness polymer coating
interface coating polymer/API
3: thickness drug layer
interface coating PA/core
4: core pellet
1 2 3 4
rotation
GaAs
receptor
GaAs
emitter
signals in the terahertz waveform First change in index refraction is related to the interface
between coating surface and environment media. A part of the signal is reflected and a
decrease of the peak is observed during the penetration depth of the remaining terahertz
pulse. The following signal correspond to a change in device nature, in this case different
polymer coated, and the time delay between the both signals characterize the layer
thickness between each layer composition. Coating thickness was derived directly using the
time-of-flight equation:
2 d(coating)= ∆t c/n,
Where d(coating) is the coating thickness, ∆t is the time delay between the terahertz
reflections, c is the speed of light and n the refractive index of the coating matrix (Ho et al.,
2007).
Figure 4: Schematic presentation of the terahertz pulsed imaging system to examine film
coatings of solid oral dosage form. Terahertz pulse reflections occur at each interface
whenever there is a change in the refractive index (Schema adapted from Shen, 2011).
Spencer et al, in 2008, correlated the TPI, coating thickness and the Mean Dissolution Time
(MDT). The drug polymer layer on the pellet surface is measured and mapped into 3D
model. In other study the use of TPI for sustained release of coated pellets of 6mm diameter
is described. The influence of pellets preparation: starter core, drug layer, film coating and
curing is analyzed. The results show a relation between size and density of layer thickness
with in vitro drug release (Ho et al, 2009b). Results are confirmed by SEM observation.

Chapter 1 : Introduction
16
This technology is a new good PAT for on-line study and quality by design (QbD).
Several default types are related for coated forms; uniformity of coating, shape of coated
pellets (function or not of the initial shape of the core), presence of cracks which influence
drug release kinetics. An investigation of Haddish in 2006 correlate the irregular shape or
default pellets with variation in drug release pattern.
For biconvex tablets, a difference in coating uniformity is observed: top and bottom
surface have a coating surface more important than the tablet central domain (Ho, 2009a).
The region of the smallest coating thickness is reported as an important factor influencing
drug release. The consequence is an undesired large range of release pattern, and in worst
case dose dumping. An index to determine crack initiation by TPI is given by Momose in
2012. This index is dependant of the density of layer coating. Coating uniformity has been
shown to affect drug release behaviour from coated dosage forms (Ho et al., 2008; Ho et al.,
2010). Although most analyses of film coatings using TPI have involved tablets, recently, TPI
has also been shown suitable for the analysis of coating and internal drug layer thicknesses
and uniformities in large sustained-release coated pellets (6 mm in diameter) (Ho et al.,
2010).
Importantly, not only the average coating thickness, but also the critical coating
quality attribute coating uniformity, can be accessed by TPI.
New parameter has been elucidated by Ho et al. in 2008, TEFPS (Terahertz Electric
Field Peak Strength) which can be obtain by extraction from the obtained signal. This
parameter is in correlation with physico-chemical properties of the film coating and solid
dosage form under investigation (Shen and taday, 2008). It is exprimed in percentage and
determined from the reflected signal on the coated surface by calculation of the
normalization to amplitude with the impulsion reference (Ho et al., 2008).TEFPS provides
information on the degree of the surface roughness and relative density of the film coating.
Indeed, TEFPS was determined for each pixel and an average value over the sampled area.
In this study, TPI was employed for the first time to analyse film coating and internal
drug layer thicknesses and uniformity in standard size pellets (1 mm in diameter).
Furthermore, the effect of coating characteristics on the subsequent drug release behaviour
of the pellets was investigated.

Chapter 1 : Introduction
17
1.5. Ethanol-resistant polymeric film coatings
In a multiparticulate drug delivery system, the dosage of the drug is divided among
several discrete delivery entities, in contrast to a classical single-unit dosage form. in case of
failure of coated systems, the consequences are much more limited if only a few subunits
fail compared to single unit dosage forms which are more prone to dose dumping.
Multiparticulates take higher importance than single unit matrix tablets in the development
of drug delivery systems, especially pellets. One advantages over single units are gastric
emptying time is less variability and higher reproductibility in GI tract, minimization of inter
and intra subject variability of plasma profile (Varum, 2010-2013).
Controlled drug delivery systems generally contain higher drug doses than immediate
release dosage forms, since the drug is intended to enter the human body at a pre-
programmed rate over a prolonged period of time. If the release rate controlling mechanism
is based on barrier functions of substances, which are insoluble in water, but soluble in
ethanol, the co-consumption of alcoholic beverages can lead to “dose dumping”:
“Unintended, rapid drug release in a short period of time of the entire amount or a
significant fraction of the drug contained in a modified release dosage form” (Meyer and
Hussain, 2005; Varum et al., in press). The consequences can be severe, because: (i) toxic
drug concentrations might be achieved, with eventually fatal side effects, and (ii) the
therapeutic effect is no more guaranteed during the envisaged time period. This is
particularly true for highly potent drugs with narrow therapeutic windows, such as many
opioid drugs.
Impact of food and ethanol beverages on gastric functions
Since several years, the quality of process and device show more and more
development. Physiological processes are a parameter to identify relevant in vitro
dissolution testing. Oral digestion should be estimated and has to be taken into account for
in-vitro drug release profiles. Physiological differences in saliva secretion, gastric emptying,
pH value (Singer et al., 1987 ; Van Aken et al., 2007), GIT motility and fast or fed state will be
revealed in dissolution kinetics. For example, in 2006, the FDA recommend for all new orally
drug products to make food effect bioavailability studies.

Chapter 1 : Introduction
18
The bioavailabity of drug from tablets is sometimes lower after administration in
close time with food due the impact on small intestinal transit (Fadda, 2008). Indeed, Freire
et al., (2011) show the importance of a multitude of factors which influence the gastro-
intestinal transit. But several studies show the importance of the tablet composition too. For
immediate or extended drug release tablet, the composition has an impact on the drug
release profiles obtain after administration of food. The rate of drug absorption is often
slower, sometimes “dose dumping” and nothing effect in several cases (Abrahamsson et al.,
2004; Schug et al., 2002). Drug absorption rate for DDS might also be regulated by the gastric
emptying which influence the residence time of the DDS in the stomach especially with
larger particles such as tablet. Because of their large size, tablets are also retained in the
stomach where they might be ground and hydrated in a sufficient state to pass the pyloric
sphincter, whereas small particles such as pellets can pass through this barrier (Meyer et al.,
1981).So, an increasing time in the stomach leads to an increasing exposition to the gastric
fluid which might affect the dissolution time. A study about the absorption of caffeine from
enteric coated pellets in the intestine shows a correlation with the time delay in drug release
and the gastric emptying rate. An increasing concentration due to retention in the stomach
gastric can lead to a dose dumping of the drug (Weitschies et al., 2005).
It is well known that ethanol and alcohol beverages have several impacts on gastric
functions and the major might be the inhibition of gastric emptying (Franke et al., 2004-
2005). Park and al, in several studies, make a distinction between ethanol/alcoholic
beverages composition and impact on gastric emptying. First study in 2004 has shown that
the gastric emptying rate of pure ethanol solution is significantly slower than that of water.
In 2005, they have shown for different types of alcohol beverages (beer or red wine, based
on different ethanol and caloric content) diverging effects on gastric emptying of solid meals.
These effects can’t be assigned on the difference in ethanol or caloric content, but suggest
the role of other non-alcoholic ingredients. Lennernas et al., (2009) go deeper in the
observation: the inhibition of gastric emptying can be related to the caloric content of the
beverage, but it’s independent of the caloric content of meal consumed in the same time.
Another impact of ethanol on biological function is the increasing of permeability of the
intestinal mucosa (Lavo et al., 1992).

Chapter 1 : Introduction
19
Impact of ethanol beverages on drug release devices
Indeed, dose dumping may be due to the delay of gastric emptying but also in the
case of an accidental or intentional change in the release rate of the device. Many
formulations for multiparticulates devices are based on polymeric coating. However, major
polymers are soluble in organic solvents like ethanol. So an exposition of the device to high
ethanol concentration leads to a premature dissolution of the polymeric coating
(Weathermon et al., 1999).. A combination of higher permeability of the drug and higher
dissolution of devices upon ethanol contact result in a higher Cmax and in the worst case
dose dumping. Because the resulting side effects caused by dose dumping of opioid drug,
the marketing of the Palladone was suspended (FDA Alert, July 2005).
One attempt to reduce the risk of dose dumping is to add warning labels on the drug
product. However, it has been reported that heavy drinkers suffering from chronic low back
pain did not reduce their opiate use, despite such warnings about concomitant use of
alcohol and opiates (Booker et al., 2003). Furthermore, the Behavioral Risk Factor
Surveillance System reported that 1 of 3 drinkers in the U.S. are “binge drinking”: They
consume 4/5 drinks (women/men) in a short period of time (Serdula et al., 2004). Thus,
controlled drug delivery systems might be exposed to high ethanol concentrations in the
stomach in practice. In 2009, Lennernaes published a very interesting review article on
ethanol vulnerable formulations, pointing out the risk of dosage form failure due to the co-
consumption of ethanol. Both, reservoir devices as well as matrix systems might be affected.
The oral controlled drug release product “Palladone” is an example for a system, which
exhibits a risk of dose dumping when alcoholic beverages are co-administered. The drug is
hydromorphone HCl in this case, the release of which is controlled from pellets comprising
ethylcellulose, ammonia methacrylate copolymer type B and stearyl alcohol (Fadda et al.,
2008). The pellets are administered once daily in capsules. A clinical trial with healthy
subjects revealed that the co-administration of 240 mL of 40 % alcohol together with a 12-
mg Palladone capsule resulted in an average peak hydromorphone concentration, which was
about 6 times greater than when the capsules were taken with water (HMP1013). One
subject even showed a 16-fold increase in the maximal plasma concentration. As this opioid
drug is highly potent and its side effects are severe, the manufacturers decided to suspend

Chapter 1 : Introduction
20
marketing this product. The ethanol sensitivity of Palladone SR capsules was also
demonstrated in vitro (Walden et al., 2007).
Fadda et al. (2008) compared 3 commercially available controlled drug delivery
products containing 5-aminosalicylic acid: Pentasa, Asacol, Salofalk. They showed that the
addition of up to 40 % ethanol to the release medium significantly affected the resulting
drug release profiles. Interestingly, the observed changes strongly depended on the type of
formulation. In 2010, Smith et al. reported on in vitro studies, which were conducted with 27
oral modified release products. Different types of drugs were considered, including opioids,
calcium channel blockers, antidepressants, and antiarrhythmics. Importantly, 9 of 10 capsule
formulations and 2 of 17 tablet formulations showed accelerated drug release in media
containing 40 % ethanol. Also, Traynor et al. (2008) studied the impact of the addition of
high amounts of ethanol to the release medium on drug release. They showed that the
release rate of tramadol from the 24 h controlled release formulation “T-long” significantly
increased. In the case of hydroxypropyl methylcellulose (HPMC) matrix formulations, Levina
et al. (2007) reported only moderate effects of ethanol on drug release in vitro. In contrast,
Roberts et al. (2007) showed a significantly increased aspirin release rate from HPMC matrix
tablets in the presence of high ethanol concentrations. This might at least partially be
explained by slower tablet swelling and increased drug solubility. Furthermore, Roth et al.
(2009) reported that verapamil release from controlled release matrix systems was
significantly faster upon addition of 40 % ethanol to the release medium. Another very
interesting study on the potential impact of ethanol in the release medium on the
performance of polymeric controlled drug delivery systems was published by Larsson et al.
(2010). They prepared free films based on ethylcellulose and hydroxypropyl cellulose (HPC)
by spraying organic polymer solutions and studied the water permeability of the systems in
the presence and absence of ethanol. Importantly, the water permeability of films with low
HPC contents increased with increasing ethanol concentration, whereas the water
permeability of films with high HPC contents decreased with increasing ethanol
concentration. The increase in water permeability at low HPC contents is likely due to more
pronounced ethylcellulose swelling in the presence of ethanol. The decrease in water
permeability at high HPC contents was explained as follows: In these systems a continuous
HPC network is formed, through which water can be relatively rapidly transported. Adding

Chapter 1 : Introduction
21
ethanol to the release medium leads to more important ethylcellulose swelling, which
probably at least partially closes the “HPC pores”. These various in vitro and in vivo examples
clearly demonstrate that the consumption of alcoholic beverages can be very dangerous for
patients treated with highly potent drugs in the form of oral controlled delivery systems.
There is a clear need to reduce this risk.
Blend coating polymer to ethanol-insensitivity of sustained oral devices
Recently, a novel type of polymeric film coatings has been proposed providing
ethanol-resistant drug release from coated dosage forms: blends of ethylcellulose and guar
gum (Rosiaux et al., 2013). The use of polymer blends can indeed offer major benefits
compared to the use of single polymers (Lecomte et al., 2003, 2004a,b, 2005a,b; Siepmann
et al., 2007a,b). In the present case, the presence of ethanol insoluble guar gum avoids the
undesired dissolution of ethylcellulose in ethanol-rich media. Vice-versa, the presence of
water insoluble ethylcellulose avoids the undesired dissolution of guar gum in water.
Ethylcellulose is a hydrophobic coating material often used for controlled release,
taste masking and moisture protection applications. It is generally used due to its non toxic,
non allergenic and non irritant properties. Ethylcellulose can be applied from organic
solutions but to avoid the use of solvent like methanol, dichloromethane or ethanol for
example, aqueous dispersion of ethylcellulose have been marketed. Due to the fact
ethylcellulose is soluble in ethanol, this one make a good candidates to develop a new DDS
resistant to alcohol beverages.
Polysaccharide based formulations are good candidates for coating DDS.
Polysaccharides might be not expensive and show a broad range in structure and a large
variety of properties. (Hovgaard and Brondsted, 1996). Moreover, they might be highly
stable, safe, non-toxic, and biodegradable and are hydrophilic. Due to this hydrophilic
property, polysaccharides can often form a gel by swelling upon exposure to the dissolution
medium and might become highly soluble, leading to a rapid drug delivery (Milojevic et al.,
1996). To control this solubility characteristic and limit drug release, hydrophobic polymers
can be added. A family of polysaccharides naturally occurring in plant: comprising guar gum
show good properties in coated technologies. It might be used like a pore former, for colon
targeting (Krishnaiah et al, 1998; Prabaharan, 2011), and in our case its insolubility in ethanol
makes it a good candidate to achieve ethanol insensitive coatings.
Chapter 1 : Introduction
22
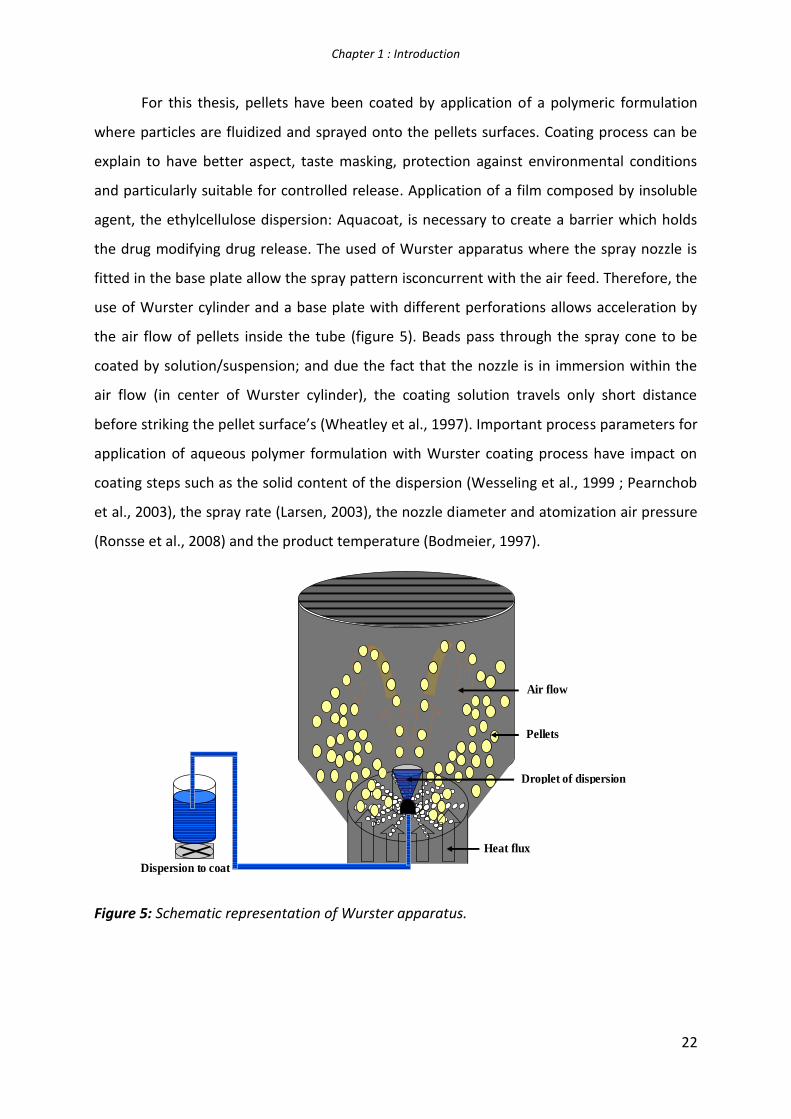
Dispersion to coat
Heat flux
Droplet of dispersion
Pellets
Air flow
For this thesis, pellets have been coated by application of a polymeric formulation
where particles are fluidized and sprayed onto the pellets surfaces. Coating process can be
explain to have better aspect, taste masking, protection against environmental conditions
and particularly suitable for controlled release. Application of a film composed by insoluble
agent, the ethylcellulose dispersion: Aquacoat, is necessary to create a barrier which holds
the drug modifying drug release. The used of Wurster apparatus where the spray nozzle is
fitted in the base plate allow the spray pattern isconcurrent with the air feed. Therefore, the
use of Wurster cylinder and a base plate with different perforations allows acceleration by
the air flow of pellets inside the tube (figure 5). Beads pass through the spray cone to be
coated by solution/suspension; and due the fact that the nozzle is in immersion within the
air flow (in center of Wurster cylinder), the coating solution travels only short distance
before striking the pellet surface’s (Wheatley et al., 1997). Important process parameters for
application of aqueous polymer formulation with Wurster coating process have impact on
coating steps such as the solid content of the dispersion (Wesseling et al., 1999 ; Pearnchob
et al., 2003), the spray rate (Larsen, 2003), the nozzle diameter and atomization air pressure
(Ronsse et al., 2008) and the product temperature (Bodmeier, 1997).
Figure 5: Schematic representation of Wurster apparatus.

Chapter 1 : Introduction
23
To keep a good conformation and activity of the device, drug release profiles (time
and concentration) should not be influence by intrinsic or extrinsic factors. So, a challenge
after bioavailability studies of the drug upon meal or alcohol substance is to have insensitive
device. Blends of polymers with different properties are interesting substances to coat solid
dosage forms. A variation between polymers blend ratios allow a coating with broad
physico-chemical properties and controlled drug release (Lecomte et al, 2003; Siepmann et
al, 2008d).
Polymer blends have been used to have specific application in several conditions:
- pH resistance (Siepmann et al., 2008b, 2008d) ;
- colon targeting (Karrout et al., 2009) ;
- improve the storage stability (Siepmann et al., 2008c).
In this work, coated pellets have been studied as ethanol resistant drug delivery
systems. Interestingly, theophylline release from pellets coated with blends of the aqueous
ethylcellulose dispersion Aquacoat® ECD 30 and guar gum was shown to be virtually
unaffected by the addition of 40 % ethanol to the release medium.
However, so far it is unclear what the crucial formulation parameters of these novel
ethylcellulose:guar gum film coatings are. The aim of this work was to identify them.
Specifically, the minimum amount of guar gum to be added in order to avoid ethylcellulose
dissolution in ethanol-rich media was to be determined as well as the critical guar gum
viscosity, required to provide ethanol-resistance. Also, the impact of the degree of coating
dispersion dilution on the system’s performance was to be studied.
Furthermore, different types of mass transport mechanisms can be involved in the
control of drug release from coated dosage forms (Lecomte et al., 2005a,b; Siepmann et al.,
2005, 2006), such as water penetration into the system, polymer swelling, drug dissolution,
drug diffusion through the polymeric network and/or through water-filled pores/cracks,
polymer dissolution, limited drug solubility and so on, to mention just a few (Marucci et al.,
2011; Kaunisto et al., 2011). Appropriate mathematical equations can be used to
quantitatively describe these physico-chemical phenomena (Muschert et al., 2009a,b;
Siepmann and Siepmann, in press). Fitting such models to sets of experimentally determined
drug release kinetics and other key features of the dosage form (e.g. water uptake behavior

Chapter 1 : Introduction
24
and changes in the mechanical strength upon exposure to aqueous media) can allow
determination of system-specific parameters, such as the apparent diffusion coefficient of
the drug within the film coating. Knowing these values, the importance of the involved mass
transport phenomena in the respective type of drug delivery system can be estimated and
the dominant release mechanism can be identified. In addition, mechanistically realistic
mathematical theories allow for the quantitative prediction of the effects of the device
design (e.g. composition, geometry and dimensions) on the resulting drug release kinetics
(Siepmann and Peppas, 2001; Siepmann and Goepferich, 2001; Borgquist et al., 2004;
Marucci et al., 2008).
The aim of this PhD thesis was also to elucidate the mass transport mechanisms
controlling drug release from pellets coated with the novel ethanol-resistant polymeric film
coatings. Being multiple unit dosage forms, pellets provide an additional advantage for this
type of applications: In case accidental film damage and dose dumping would occur in a
pellet, the overall release from the ensemble of pellets would hardly be affected. Based on a
comprehensive experimental characterization of the devices before and after exposure to
different release media, appropriate mathematical equations were to be identified and a
mathematical model to be developed allowing for facilitated drug product optimization: In
silico simulations should be able to predict the effects of formulation parameters on the
resulting drug release kinetics.

Chapter 2 : Introduction (Français)
25
2.Introduction (Français)

Chapter 2 : Introduction (Français)
26
2.1 Généralité
Les systèmes à libération contrôlée de principes actifs sont fréquemment utilisés
pour optimiser les effets thérapeutiques lors de traitements médicamenteux. Une
concentration de principe actif inférieure à la concentration minimale effective montre un
défaut du traitement au niveau du site d’action, tandis qu’un niveau trop élevé dépassant le
seuil de toxicité pourra occasionner de sérieux effets secondaires néfastes, pouvant
entrainer l’arrêt du traitement. Ainsi, il est d’un grand intérêt de maintenir une
concentration en principe actif à l’intérieur de l’intervalle thérapeutique, également appelée
fenêtre thérapeutique.
Pour une délivrance sur une longue période, la concentration efficace doit donc être
maintenue par administrations répétées de doses précises, à intervalles de temps régulier.
Néanmoins, ces administrations successives comme moyen de maintien d’une concentration
efficace ne sont pas une solution. A long terme, un problème d’observance chez le patient
peut apparaître ou encore un non-suivi du traitement thérapeutique (lors d’administrations
de nuit par exemple). L’objectif est donc de trouver pour chaque molécule et chaque
pathologie, la forme galénique la mieux adaptée, par l’étude des différentes formes
galéniques, de l’état physique du principe actif, des différents excipients et des procédés de
fabrication. Ainsi, le dispositif obtenu sera au maximum de son utilité comme traitement
avec une délivrance optimale de la quantité de principe actif sur le lieu d’action, mais aussi
un traitement optimal pour le patient (Nicoli et Colombo, 2001). Cela est encore plus vrai
pour des molécules hautement actives avec une fenêtre thérapeutique restreintes comme
c’est le cas des molécules anti-cancéreuses. De nombreuses revues sur le développement
des stratégies et nouveaux systèmes à libérations sont données par Tanquary and Lacey
(1974), Baker (1987), Fan and Singh (1989), and Siepmann and Siepmann (2012).
Les systèmes matriciels permettent une délivrance du principe actif de manière continue.
Plusieurs mécanismes comme la dissolution, l’érosion ou les effets osmotiques entrent en
ligne de compte pour contrôler les taux de libération. Il est d’une grande importance de
déterminer les mécanismes intervenant dans la libération du principe actif afin
d’appréhender les différents moyens à mettre en œuvre pour optimiser le Système de
Délivrance du Médicament (SDM).

Chapter 2 : Introduction (Français)
27
L’avantage principal des systèmes matriciels est lié à leur facilité de préparation ainsi
que leurs faibles coûts de production. Un autre point fort est lié à la haute variabilité des
cinétiques de libération qui peuvent être observées par variation de la composition
polymérique : hydrophobe, hydrophile, biodégradable, minéral ou lipidique, mais encore
selon le taux de chargement initial. Des processus industriels comme l’enrobage permettent
d’élargir encore l’éventail des profils obtenus.
L’enrobage est une technique fréquemment utilisée dans le masquage de goût, dans
la protection du principe actif contre les conditions extérieures mais aussi pour permettre à
des systèmes d’avoir des cinétiques de libération prolongée. Dans le cas des systèmes
multiparticulaires, au sein d’un même lot de granules certaines unités peuvent être de
mauvaises conformations (asymétrie du noyau par exemple) ou enrobées de manière
irrégulière. Les profils de libération obtenus ne devraient pas, alors, être en adéquation avec
ceux escomptés. Le fait d’avoir repartitionné le principe actif sur plusieurs sous-unités
permet d’avoir non seulement une seule fraction qui se retrouve défectueuse, mais aussi un
profil de libération de la population entière qui se retrouve moins impacté par la défaillance
du système.
Le choix de la forme galénique est donc dépendante des profils de libération
souhaités mais aussi des risques encourus lors d’une défaillance possible du système. Ainsi,
on comprend l’importance que porte la FDA (Food and Drug Administration) dans la
démarche PAT (Process Analytical Technology). Cette approche a pour but d’avoir une
meilleure compréhension des procédés de fabrication et une optimisation des formes
galéniques afin d’assurer un produit final de haute qualité. Cette démarche se définit par
l’utilisation d’outils analytiques permettant un contrôle du produit. Le développement de
nouvelles technologies pour assurer le contrôle au cœur même de la manipulation et en
temps réel est donc primordial. Par exemple, la technologie terahertz a été acceptée comme
nouvel outil dans la détermination de l’épaisseur pour des granules de grandes tailles (Ho,
2008 et 2009).
Depuis plusieurs années des études de plus en plus poussées ont montrées les
fluctuations qu’occasionne le contenu gastrique et intestinal sur les profils de libération des
systèmes médicamenteux. Plus récemment la FDA a reporté les dramatiques conséquences
de l’absorption concomitante d’alcool et de systèmes réservoir à libération contrôlée.

Chapter 2 : Introduction (Français)
28
L’emploi des formes à libération prolongée implique un contenu en principe actif
relativement plus important que dans les formes conventionnelles. En cas de survenue d’un
défaut, la totalité de la molécule active se retrouvé disséminée sur une courte période. C’est
le phénomène de « dose dumping ». Ce pic de concentration est à l’origine d’effets
secondaires néfastes, voire létal dans le pire des scénarios. L’utilisation des formes
multiparticulaires peut sembler une solution par la division de la quantité initiale de principe
actif en plusieurs fractions et non plus en une seule, évitant ainsi une libération totale et
massive du contenu. Toutefois dans le cas d’intervention d’une source externe ayant un
impact négatif, comme par exemple la présence d’éthanol, la division en plusieurs sous
particules de la molécule active ne peut être efficace, chaque fraction étant susceptible de
subir le phénomène de « dose dumping ».
Selon les mécanismes de libération contrôlant la fuite du principe actif, les systèmes
à libération contrôlés peuvent être classifiés comme tel :
1) Systèmes contrôlés par diffusion
2) Systèmes contrôlés par gonflement
3) Systèmes contrôlés par érosion
4) Systèmes contrôlés osmotiquement
5) Autres (i.e., effets magnétiques et/ou électrostatiques).
Les phénomènes de diffusion, de gonflement ou d’érosion sont les mécanismes les plus
retrouvés au niveau des produits commercialisés. Toutefois, il est rare lors de l’élucidation
des mécanismes impliqués Durant les phénomènes de libération de n’avoir qu’un seul
mécanisme. La majorité des cas impliquent, en effet, une combinaison de plusieurs
mécanismes.
Bien que l’importance accordée aux systèmes à libération contrôlée est croissante, le
challenge reste néanmoins d‘actualité comme expliqué plus en détail dans les paragraphes
suivants.

Chapter 2 : Introduction (Français)
29
2.2. Objectifs de la thèse
Les buts majeurs de cette thèse ont été:
(i) De mieux comprendre les mécanismes impliqués dans des comprimés matriciels à
base de lipides.
(ii) La diminution de l’éthanol résistance des formes à libération contrôlée enrobés
par des films polymériques
(iii) D’augmenter la caractérisation de ces systèmes polymériques d’enrobages.

Chapter 2 : Introduction (Français)
30
2.3. Modèle mathématique de libération de principe actif et avantages
des matrices lipidiques
Les modèles mathématiques impliqués dans les transports de masses pour les systèmes à
libération contrôlée sont hautement bénéfiques: D’un côté les mécanismes de libération
peuvent être élucidés, et d’un autre côté la perte de temps et d’argent lié à la mise en place
des séries expérimentales pour arriver au but peuvent être remplacés par des simulations in-
silico rapides (Siepmann, 2006-2012a-2013a ; Peppas, 2013). Comparé aux autres domaines
scientifiques, ces modèles sont rarement appliqués dans le domaine pharmaceutique.
Un modèle mathématique mécanistique et réaliste doit toujours être basé sur des
caractérisations physico-chimiques de la forme galénique avant et après exposition au milieu
de dissolution. Basés sur ces connaissances, des prédictions de modèles mathématiques
peuvent être définis. Idéalement, seulement les phénomènes dominant durant le transport
de masse devront être inclus, tandis que les procédés qui ont un impact mineur sur les
phénomènes de libération devront être négligés dans l’optique de garder un modèle direct
et simple d’utilisation. Plusieurs phénomènes pour le transport de masse, jouant un rôle
crucial dans les formes orales à libération contrôlée inclus la pénétration de l’eau dans le
système (Hariharan, 1993), la dissolution des particules actives (Siepmann, 2013b), la
diffusion des particules actives via les canaux occupés par l’eau et/ou les réseaux
polymériques (Siepmann, 2012 ; Grassi, 1999-2003 ; Frenning, 2011 ; Yin, 2011), les
phénomènes de gonflement, dégradation et/ou dissolution impactant le polymère (Brazel,
2000 ; Borgquist, 2006 ; Sackett, 2011 ; Kaunisto, 2011), les changements de mobilité des
molécules d’eau et de principe actif au sein du système, en fonction du temps et de la
localisation (Mallapragada, 1997), et la désintégration du système. Dans certains cas
seulement un de ces phénomènes va être dominant et la description d’un modèle
mathématique sera directe et simple (Siepmann, 2010). Toutefois, dans d’autres cas une
multitude de procédés seront décisifs dans le même temps et le traitement mathématique
s’en trouvera beaucoup plus complexe (Siepmann, 2012b). Due à la large variété des formes
à libération contrôlée, il est inutile d’espérer d’avoir un seul modèle mathématique qui
serait valide pour l’ensemble des systèmes. Ainsi, sur la base du cas par cas, la validité d’un
modèle devra être évaluée pour chaque type de systèmes.

Chapter 2 : Introduction (Français)
31
Les lipides offrent une alternative aux polymères hydrophobiques et dégradables dont les
produits de dégradation entraine une série d’effets secondaires néfastes pour la préparation
de système à visée contrôlée (Kreye et al., 2008, 2011a, 2011b; Maschke et al., 2004;
Vogelhuber et al., 2003). Le développement de nouvelles formes galéniques à partir des
lipides est expliqué par le large spectre des types d’excipients qui peuvent être obtenus par
variation de la longueur de la chaine d’acides gras, par des procédés d’estérifications qui
peuvent y être rattachés ou encore par l’utilisation d’un mélange de lipides induisant de
nouvelles cinétiques de libération. La libération à partir de ce type de matrice est gouvernée
par le type d’acide gras composant la matrice ainsi que par la composition enzymatique des
liquides digestifs. Les différents types de lipides retrouvés dans la littérature sont les acides
et alcools gras initialement utilisés comme produits de lubrification. Leurs avantages sont
multiples : en plus d’être des substances physiologiques, ils montrent une bonne
biocompatibilité et sont moins chers que les excipients polymériques classiques. Du fait de
leur insolubilité dans l’eau, de leur caractères non gonflant, les lipides sont largement
applicables pour des systèmes à libération prolongée, cela est d’autant plus vrai pour les
systèmes à haut chargement en principes actifs hautement solubles. La libération sera
également dépendante des coefficients de diffusion de la molécule active par rapport à la
matrice et de la dégradation de cette matrice induite par les lipases ou par l’érosion.
Le glyceryl behenate est un matériel lipidique qui a été introduit pour la première fois
en tant que lubrifiant pour comprimés (Jannin et al, 2003), et plus récemment comme
excipient à libération prolongée (Obaidat, 2001). Plusieurs types de systèmes sont alors
obtenus comme par exemple les comprimés, les suspensions, les granules, les implants ou
encore les microcapsules.
Toutefois, les procédés de fabrication avec les lipides sous forme de poudre est un
véritable challenge au vue de leur faible fluidité qui peut causer des variations de taille et
potentiellement de dé-mélange. Compritol 888 ATO est caractérisé par un faible point de
fusion (74 °C) d’où son utilisation autant en tant que poudre que par des procédés
thermiques (Barthelemy et al., 1999; Faham et al., 2000 ; Mirghani et al., 2000).
L’impact de la technique de préparation des matrices lipophiles à libération
prolongée est montré par plusieurs auteurs (Abd El-halim et al., 2010; Li et al., 2006). Les
comprimés obtenus par un traitement thermique montrent un faible taux de libération

Chapter 2 : Introduction (Français)
32
comparé à ceux issus de méthodes classiques, ceci étant lié à l’augmentation de la tortuosité
matricielle et la faible porosité (Jagdale et al., 2002; Zhang et al., 2003). Un avantage pour les
formes matricielles est, comme dis plus haut, la haute variété de matériels montrant un
large spectre au niveau des températures de fusion. Une technique thermodynamique, la
Calorimétrie différentielle à balayage (DSC), est un outil parfait dans l’étude du
comportement du principe actif ou du polymère aux variations de température.
L’extrusion en phase chauffante (HME) peut être définie comme un procédé pour
former des extrudats, en forçant une poudre à passer par un orifice qui lui donnera sa
forme, et cela sous différentes conditions : température, mélange… L’avantage des systèmes
double vis est grand, il permet un meilleur mélange mais surtout un emprisonnement plus
intense des particules actives au sein d’une matrice. Un extrudeur est typiquement constitué
d’un fourreau renfermant des vis, une unité contrôlant la rotation des vis, un système de
chauffage/refroidissement et un orifice de sortie (figure 6). De la zone de remplissage à la
sortie, 4 étapes sont décrites : le remplissage ; la fusion et plastification ; le transport et
mélange ; la mise en forme.
La composition au sein de l’extrudeur est un paramètre clé pour la formulation. Une
augmentation du nombre d’éléments de cisaillement entraine une augmentation de la
densité des extrudats, impactant alors la qualité du produit et les cinétiques de libération
(Vercruysse, 2012). Deux autres paramètres cruciaux sont la température et le temps de
résidence de la poudre au sein de l’appareillage (Verhoeven, 2008). Il est montré qu’une
augmentation de la température augmente la tortuosité, donnant un système moins poreux,
donc une diminution des cinétiques de libération. L’avantage des polymères lipidiques
contrairement aux autres excipients est de montrer une faible température de fusion,
appréciable pour des manipulations d’extrusion en phase chauffante à faible température
(principe actif thermosensible).
Une exposition trop longue d’un principe actif thermosensible entrainera la
dégradation de ce dernier. Il est important d’effectuer un temps de passage rapide pour
éviter la décomposition du principe actif, mais suffisamment long pour permettre un bon
mélange des produits ainsi qu’une dissolution du principe actif dans le polymère pour
permettre la rétention du principe actif. Cette valeur de temps de résidence est directement
liée à la vitesse de rotation des vis, ainsi qu’au taux d’alimentation.

Chapter 2 : Introduction (Français)
33
Figure 6 : Schéma du procédé d’extrusion en phase chauffante.
Pour les lipides, le phénomène majeur dans la libération du principe actif est la diffusion via
un réseau poreux (Guse, 2006). Plusieurs auteurs ont travaillés sur ces systèmes (Kreye,
2011a – Siepmann, 2008a). En pratique, il est observé une libération non linéaire de la
molécule, qui devient progressivement plus lente avec le temps. Les profils de libération
sont illustrés comme ci-dessous.
Figure 7 : Représentation de comprimés matriciels obtenus par compression directe et
impact du taux de chargement sur les cinétiques de libération.
drug
Media dissolution penetration
Drug dissolution exit
Dru
g l
evel
in t
he
blo
od
Time
10 %
10 %
60 %60 %
drug
Media dissolution penetration
Drug dissolution exit
drug
Media dissolution penetration
Drug dissolution exit
Dru
g l
evel
in t
he
blo
od
Time
10 %
10 %
60 %60 %

Chapter 2 : Introduction (Français)
34
Certains auteurs expliquent la libération comme telle:
- Phase 1: Une relative rapide libération de PA obtenue après contact de la matrice au
milieu de dissolution qui cause une fuite du PA de la surface et des couches
superficielles.
- Phase 2: Avec le temps, le PA des couches superficielles est libéré et un nouveau
réseau poreux est créé. Le milieu de dissolution diffuse alors via le réseau poreux et
dissous le PA plus profondément. Le PA dissous va alors voyager au sein du même
réseau poreux vide et ainsi être libéré au sein du milieu de dissolution externe. Cette
phase caractérisée par une faible cinétique de libération est expliquée par une
augmentation de la distance au sein du comprimé.
Ce phénomène de libération est expliqué par la théorie de la percolation. Ainsi une
variation du contenu en PA ou un changement de la taille du système induira un
changement des profils de libération par modification du nombre de voies de diffusion. Une
plus forte teneur en PA entrainera dès lors une augmentation des voies de diffusion par
dissolution/diffusion du PA, et donc les cinétiques de libération seront plus rapides.
Certains auteurs utilisent la théorie de percolation pour expliquer les cinétiques de
libération, c’est notamment le cas de l’équipe de Leuenberger. Un raté dans la théorie de
percolation est observé dans le cas des dispersions solides où la molécule active est
emprisonnée au sein d’un polymère insoluble dans l’eau, mais peut être expliqué. A un faible
taux de chargement, des groupes de PA sont complétements entourés par le polymère et la
non dégradation de ce dernier entraine une inaccessibilité du PA au milieu de dissolution.
Une libération incomplète est alors observée (figure 2.4). Une augmentation du contenu en
PA occasionne une connexion plus importante entre les particules de PA, créant un réseau
dans lequel le PA peut être libéré (Caraballo, 1996). Cette limite où le groupement de PA est
emprisonné et ne peut être libéré est nommé “percolation threshold”.

Chapter 2 : Introduction (Français)
35
Figure 8: Représentation de comprimés matriciels obtenus par extrusion en phase
chauffante/broyage/compression directe et l’impact du taux de chargement initial sur les
cinétiques de libération.
Les buts de ce travail ont été de :
(i) Identifier une théorie concernant un modèle mathématique pour des comprimés
de glyceryl dibehanate préparés par compression directe ou par une série
d’extrusion en phase chauffante/broyage/compression directe,
(ii) Utiliser cette théorie pour mieux comprendre l’importance des procédés
impliqués dans le phénomène de transport de masse,
(iii) Utiliser cette théorie pour prédire quantitativement l’impact de la forme du
comprimé (notamment la composition, la dimension et la méthode de
préparation) sur les cinétiques de libération résultantes,
(iv) Evaluer la validité de ce modèle sur différents lots expérimentaux. La niacine,
vitamine B3, est utilisée comme PA modèle.

Chapter 2 : Introduction (Français)
36
2.4. Imagerie terahertz pulsee pour la caracterisation de film
d’enrobage
(from Haaser et al., 2013)
Les formes multiparticulaires montrent une multitude d’avantages par rapport aux
formes uniques, comme un meilleur contrôle du temps de transit gastrique et une faible
susceptibilité au phénomène de dose dumping (Bechgaard and Nielsen, 1978).
Fréquemment les minigranules sont enrobées pour modifier les cinétiques de libération.
Alors, les performances du produit seront directement corrélées avec les attributs de qualité
du film d’enrobage, incluant l’épaisseur et l’uniformité (Haddish-Berhane et al., 2006).
La détermination des modèles mathématiques est liée à la connaissance de chacune
des phases impliquées dans le profil de libération (Ringqvist et al., 2003). La technique la
plus ancienne mais néanmoins toujours d’actualité reste le calcul de la prise en masse par
mesure de la quantité de produits pulvérisés dans le cas des formes enrobées. Toutefois
cette technique, qui ne permet qu’une approximation de la masse gagnée liée à la perte de
produits durant la technique d’enrobage, semble de plus en plus désuète (Ho et al., 2008; Ho
et al., 2010).
Dans le cas d’études de libérations à partir de sous unités, il est préférable d’élucider
les propriétés des sous unités séparément afin d’étudier les variabilités entre chaque
individus. Un grand nombre d’études utilisant des analyses mécaniques, par exemple des
tests de libération in-vitro, sont utilisées pour obtenir plus d’informations sur les structures
des films d’enrobages appliqués sur les mini granules et leurs effets sur les cinétiques de
libération (Siepmann et al., 2007; Siepmann et al., 2008; Muschert et al., 2009). Ces
méthodes permettent alors de comprendre plus profondément les mécanismes de libération
à partir de formes enrobées, mais ne sont pas forcément utiles pour donner en détails des
informations sur la qualité des films attribuée à l’épaisseur, l’uniformité et la morphologie du
film. Ces informations peuvent être obtenues par d’autres techniques analytiques comme la
Microscopie Electronique à balayage (MEB)(Heinicke and Schwartz, 2007), microscopie à
fluoresence (Andersson et al., 2000), microscopie à force atomique (AFM)(Ringqvist et al.,
2003), Imagerie Raman (Ringqvist et al., 2003), imagerie rayon X à énergie dispersive

Chapter 2 : Introduction (Français)
37
(EDX)(Ensslin et al., 2008), spectroscopie à résonance magnétique nucléaire (NMR)(Ensslin
et al., 2008), spectroscopie à résonance paramagnétique nucléaire (EPR)(Ensslin et al., 2009)
et la microscopie à laser confocal à balayage (CLSM)(Depypere et al., 2009).
Toutefois, la plupart de ces méthodes de sont restreintes à l’enrobage de surface, ou
encore certaines méthodes comme la MEB, la microscopie à fluorescence ou EDX requièrent
la coupure de l’échantillon pour déterminer les informations sur l’épaisseur de l’enrobage.
Enfin, les techniques de spectroscopie RMN et EPR permettant d’attribuer des informations
sur la qualité de l’enrobage ne peuvent donner des résultats directement, mais nécessitent
l’aide de modèles chimiométrique.
Des observations de l’échantillon par comparaison avant et après contact avec le
milieu de libération permettent de comprendre l’effet du milieu et donc les mécanismes de
transport dus à une dissolution des polymères solubles. La présence en surface de cracks à la
fin de la libération permet de même d’attester de l’existence d’une rupture de la résistance
mécanique du film polymérique. Pour attester de ces mécanismes des études telles que les
cellules de diffusion pour calculer la perméabilité des films, le calcul des coefficients de
diffusion ou encore le coefficient de partition peuvent être utilisées (Marucci, 2007). Les
phénomènes de gonflement quant à eux peuvent être expliqués par une accumulation de
solvants impliquant les pompes osmotiques. Une accumulation de milieu au sein de la
minigranule peut être mesurée par la prise en eau avant et après libération du PA et de
mesures microscopiques.
Récemment, la technologie d’Imagerie Pulsée Terahertz a été introduite en tant que
nouvel outil pour déterminer l’épaisseur de l’enrobage appliqué à des comprimés et
granules de grandes tailles, mais aussi une nouveauté avec la création d’un indice pour
définir l’homogénéité de produits appliqués à la surface (Ho et al., 2007; Ho et al., 2009; Ho
et al., 2010) Les radiations terahertz font parties de la région de l’infrarouge lointain du
spectre électromagnétique (2 cm-1 and 120 cm-1) et il est bien établi que les formulations à
base de polymères utilisées pour l’enrobage sont transparentes ou semi-transparentes à la
lumière utilisée par le TPI (Zeitler et al., 2007b). L’obtention des images est liée à une
pénétration des ondes terahertz à la surface de la minigranule qui permet par une
combinaison des images d’obtenir une résolution en 3D. Après pénétration à la surface de
l’échantillon, tout changement structural ou chimique est mesuré par un changement dans

Chapter 2 : Introduction (Français)
38
GaAs
emitter
Sample
Laser
Optical
delay
Signal split
1: air
interface air/pellet
2: thickness polymer coating
interface coating polymer/API
3: thickness drug layer
interface coating PA/core
4: core pellet
1 2 3 4
rotation
Sample
Laser
Optical
delay
Signal split
1: air
interface air/pellet
2: thickness polymer coating
interface coating polymer/API
3: thickness drug layer
interface coating PA/core
4: core pellet
1 2 3 4
rotation
Laser
Optical
delay
Optical
delay
Signal split
1: air
interface air/pellet
2: thickness polymer coating
interface coating polymer/API
3: thickness drug layer
interface coating PA/core
4: core pellet
1 2 3 4
rotation
GaAs
receptor
GaAs
emitter
GaAs
emitter
Sample
Laser
Optical
delay
Signal split
1: air
interface air/pellet
2: thickness polymer coating
interface coating polymer/API
3: thickness drug layer
interface coating PA/core
4: core pellet
1 2 3 4
rotation
Sample
Laser
Optical
delay
Signal split
1: air
interface air/pellet
2: thickness polymer coating
interface coating polymer/API
3: thickness drug layer
interface coating PA/core
4: core pellet
1 2 3 4
rotation
Laser
Optical
delay
Optical
delay
Signal split
1: air
interface air/pellet
2: thickness polymer coating
interface coating polymer/API
3: thickness drug layer
interface coating PA/core
4: core pellet
1 2 3 4
rotation
GaAs
receptor
GaAs
emitter
Sample
Laser
Optical
delay
Signal split
1: air
interface air/pellet
2: thickness polymer coating
interface coating polymer/API
3: thickness drug layer
interface coating PA/core
4: core pellet
1 2 3 4
rotation
Sample
Laser
Optical
delay
Signal split
1: air
interface air/pellet
2: thickness polymer coating
interface coating polymer/API
3: thickness drug layer
interface coating PA/core
4: core pellet
1 2 3 4
rotation
Laser
Optical
delay
Optical
delay
Signal split
1: air
interface air/pellet
2: thickness polymer coating
interface coating polymer/API
3: thickness drug layer
interface coating PA/core
4: core pellet
1 2 3 4
rotation
GaAs
receptor
GaAs
emitter
l’indice de réfraction, entrainant une modification dans les pics obtenus. Le calcul du temps
parcouru par l’onde entre les différentes couches permet alors de calculer l’épaisseur de la
couche traversée (Fitzgerald et al., 2005).
Les calculs sont obtenus par dérivation de la distance entre plusieurs pics observés, à
savoir que pour des systèmes multicouches, plusieurs pics représenteront les différentes
interfaces au sein du système (Fitzgerald et al., 2005). Quand un changement structural ou
chimique est mesuré dans le système, une réfraction des signaux est obtenue et la présence
de plusieurs signaux dans la longueur d’onde des terahertz est observée. Le premier
changement mesuré est donc rattaché à l’interface entre l’enrobage de surface et le milieu
environnant. Le signal suivant correspond au changement de nature du système, dans le cas
de différent polymère d’enrobage, et le temps de délai entre les deux signaux sert à
caractériser l’épaisseur de la couche d’enrobage. Pour ce faire, il suffit d’appliquer la formule
suivante:
2 d(coating)= ∆t c/n,
où d(coating) est l’épaisseur de la couche d’enrobage, ∆t est le temps de délai entre les
réflexions Terahertz, c est la vitesse de la lumière et n l’indice de réfraction du polymère
d’enrobage (Ho et al., 2007).
Figure 9: Représentation schématique du système TPI pour examiner des films d’enrobage
appliqués à des systèmes oraux. Les signaux terahertz réfléchis montrent un changement
d’interface lies à un changement dans l’indice de réfraction (Schéma adapté de Shen, 2011).
Chapter 2 : Introduction (Français)
39
Spencer et al, en 2008, corrèlent les données de terahertz, l’épaisseur de l’enrobage et le
temps moyen de dissolution (MDT). La couche active et polymérique déposée à la surface de
la minigranule est mesurée et construite en modèle 3D. Dans une autre étude, l’utilisation
de la technique Terahertz sur des minigranules enrobées de taille de 6 mm de diamètre a été
décrite. L’influence de la méthode de préparation des noyaux, la couche de principe actif, le
film d’enrobage et la méthode de mûrissement ont été analysées. Les résultats montrent
une relation entre la taille et la densité de l’épaisseur de la couche polymérique avec les
profils de libération in-vitro (Ho et al, 2009b). Ces résultats étant toujours confirmés par les
analyses au MEB..
Cette technique est un bon outil pour l’analyse en ligne et le design de la qualité.
Plusieurs types de défauts sont recensés pour les formes enrobées; l’uniformité de surface,
la forme des noyaux d’origines, la présence de défauts de surface qui influencent les
cinétiques de libération. Une étude en 2006 d’Haddish a permis de corréler les formes
irrégulières des minigranules aux variations des profils de libération.
Un nouveau parapmètre le TEFPS (Terahertz Electric Field Peak Strength) a été mis au
point par l’équipe de Ho en 2008. Ce paramètre est obtenu par extraction du signal obtenu
avec le signal de référence émis. Il permet de prédire la relative densité de surface de
l’enrobage mais aussi de son homogénéité (Shen and taday, 2008 ; Ho et al., 2008).
Dans cette partie, la technologie terahertz a été employée pour la première fois pour
analyser l’épaisseur de l’enrobage de film et d’une couche active interne, ainsi que leur
uniformité, cela appliqués à des minigranules de taille standard (1 mm de diamètre). De
plus, les caractéristiques de l’impact de l’enrobage sur les profils de libération ont été
investiguées.

Chapter 2 : Introduction (Français)
40
2.5. Ethanol-resistant polymeric film coatings
Dans les systèmes multiparticulaires, la quantité de la molécule active est divisée au sein de
plusieurs entités, contrairement aux formes classiques unidoses. Dans le cas d’un défaut
d’enrobage, les conséquences sont plus limitées avec seulement une fraction des sous unités
impactées contrairement aux unidoses qui sont fortement sensibles au phénomène de
« dose dumping ». Les formes multiparticulaires prennent de ce fait une plus grande
importance, spécialement les minigranules. L’un des nombreux avantages des formes
multiparticulaires est le temps de vidange gastrique qui est moins variable ici et une plus
haute reproductibilité dans le tractus gastro intestinal (GIT), ainsi qu’une minimisation des
variabilités inter et intra individus sur les profils plasmatiques (Varum, 2010).
Les systèmes à libération contrôlée contiennent généralement une concentration plus
importante en PA que pour les formes conventionnelles, cela pour permettre au PA de se
délivrer au niveau du corps humain à un taux préprogrammer sur un laps de temps
prolongé. Si le mécanisme de contrôle de libération est basé sur les fonctions de la barrière
polymérique, qui est insensible à l’eau mais soluble à l’éthanol, alors la consommation
concomitante avec des substances alcoolisées pourra entrainer un « dose dumping », à
savoir : « une libération de PA rapide et inattendue sur une courte période, de la totalité ou
d’une fraction signifiante du contenu en PA issue de formes à libération modifiées » (Meyer
and Hussain, 2005; Varum et al., in press). Les conséquences peuvent être sévères: (i) des
concentrations toxiques de PA peuvent être atteintes, avec éventuellement des effets
secondaires fatals, et (ii) un effet thérapeutique qui n’est plus garanti durant la période
envisagée. Cela est particulièrement vrai pour des PA hautement actif avec une fenêtre
thérapeutique étroite, comme beaucoup de PA à base d’opioïde.
IMPACT DE L’ALIMENTATION ET DE L’ALCOOL SUR LES FONCTIONS BIOLOGIQUES
GASTRIQUES
Depuis plusieurs années, la qualité des systèmes et des procédés de fabrication se
développe de plus en plus. La digestion orale peut être estimée et prise en considération
pour les profils de libération in-vitro. Des différences physiologiques dans la sécrétion

Chapter 2 : Introduction (Français)
41
salivaire, la vidange gastrique, les valeurs de pH (Van Aken et al., 2007), la mobilité GIT et
l’état à jeun ou après repas va être relevant dans les cinétiques de dissolution. D’où le fait
qu’en 2006, la FDA recommande pour tous nouveaux produits basés sur des PA de faire des
études sur l’impact de l’alimentation sur les cinétiques de libération.
La biodisponibilité du PA à partir de comprimés est très souvent plus lente après
l’administration dans un temps proche avec la prise alimentaire. Cela étant lié à l’impact du
bol alimentaire sur le transit intestinal (Fadda, 2008 ; Park and al., 2004). En effet, Freire et
al., (2011) montre l’importance d’une multitude de facteurs qui influence ce transit. Mais
plusieurs études montrent également l’importance de la composition des comprimés. Il est à
noter que l’absorption est généralement diminuée, mais parfois on observe un « dose
dumping » et dans de rares cas aucun effet (Abrahamsson et al., 2004; Schug et al., 2002). Le
taux d’absorption du PA pour les SDM est principalement régulé par la vidange gastrique qui
influence le temps de résidence des SDM dans l’estomac, spécialement pour les particules
de hautes tailles comme les comprimés. Les comprimés sont retenus de par leur grande
taille au niveau de l’estomac où ils seront broyés et hydratés dans un état suffisant pour
passer le sphincter pylorique, tandis que les petites particules comme les minigranules
peuvent passer directement cette barrière (Meyer et al., 1981).Une augmentation du temps
de rétention dans l’estomac entraine une exposition prolongée au fluide gastrique qui
prolonge le temps de dissolution. Une étude à propos de l’absorption dans l’estomac, de la
caféine venant de minigranules enrobées, montre une corrélation entre le délai dans la
libération et le taux de vidange gastrique. Une augmentation de la rétention du système au
niveau de l’estomac pourra entrainer le phénomène de « dose dumping » du PA (Weitschies
et al., 2005).
Il est en plus connu l’inhibition que vont pouvoir entrainer l’éthanol ou les solutions
alcoolisées sur la vidange gastrique (Franke et al., 2005). Park and al, dans plusieurs études,
font la distinction entre l’éthanol et la composition des substances alcoolisées et leurs
impacts sur la vidange gastrique. En 2005 ils ont montré que pour différents types de
solutions alcoolisées (bière ou vin rouge montrant des différences au niveau du contenu en
éthanol et calorique) une divergence sur le temps de vidange gastrique est observée. De là,
l’hypothèse d’un autre ingrédient non-alcoolique impliqué ici est posée. Un autre impact lié

Chapter 2 : Introduction (Français)
42
à l’alcool est une augmentation de la perméabilité sur la muqueuse intestinale (Lavo et al.,
1992).
IMPACT DE L’ETHANOL SUR LES SDM
En effet, le « dose dumping » peut être due au délai de la vidange gastrique mais aussi
dans le cas d’un accident ou changement intentionnel dans les libérations du système. Les
systèmes multiparticulaires sont généralement basés sur l’enrobage polymérique. Toutefois,
la majorité des polymères étant soluble dans l’éthanol, une dissolution prématurée en cas
de contact avec de fortes concentrations en éthanol. Une combinaison de l’augmentation de
la perméabilité ainsi qu’une augmentation de la dissolution du système sous contact de
l’éthanol induit une plus haute valeur de Cmax et dans le pire des cas un dose dumping. Ce
phénomène a été à l’origine de la suspension du Palladone en 2005 par la FDA, qui entrainait
des effets secondaires néfastes dû à un « dose dumping » de PA opiacé (FDA Alert, July
2005).
Une idée pour réduire le risque de dose dumping est d’apposer un signal
d’avertissement sur le produit pharmaceutique. Toutefois, il est reporté que des personnes
sous emprise d’alcool souffrant de douleur chronique (low back pain) ne peuvent réduire
leurs utilisations de dérivés opiacés, et donc ne respectent en rien les avertissements
concernant la prise concomitante d’alcool et d’opiacés (Booker et al., 2003). De plus, le
Système de Surveillance sur les Facteurs de Risques Comportementaux reportent qu’un
buveurs sur 3 aux USA est un alcoolique compulsif: Ils consomment 4 ou 5 boissons (femme
ou homme respectivement) sur une courte période (Serdula et al., 2004). Alors, les systèmes
à libération contrôlée seront en pratique exposés à de fortes concentrations d’éthanol dans
l’estomac. En 2009, Lennernaes a publié une revue très intéressante sur les formulations
vulnérables à l’éthanol, pointant le risque de défaut des formes galéniques due à la co-
consommation d’alcool. Les réservoirs aussi bien que les systèmes matriciels peuvent être
affectés. Le produit oral à libération contrôlée « Palladone » en est un bon exemple, qui
montre le risque de dose dumping quand les boissons alcoolisées sont administrées en
concomitance. Le principe actif est l’hydromorphone HCl dans ce cas, la libération est issue
de minigranules enrobées par un film d’éthylcellyulose, ammonium methacrylate
copolymère type B et alcool stéarique (Fadda et al., 2008). Les minigranules sont

Chapter 2 : Introduction (Français)
43
administrées par une capsule à prise journalière. Une étude clinique avec des sujets sains
révèle que la co-administration de 240 mL de 40 % d’alcool avec une capsule de Palladone
de 12-mg résulte en un pic moyen d’hydromorphone , qui est 6 fois plus important que pour
les capsules prises avec de l’eau (HMP1013). Un sujet a même montré une augmentation de
la concentration plasmatique maximale 16 fois plus importante. Comme les opiacés sont
hautement actifs avec de sévères effets secondaires, les fabricants ont décidés de suspendre
la production industrielle. La sensibilité à l’éthanol des capsules de Palladone SR a alors été
montré in vitro (Walden et al., 2007).
Fadda et al. (2008) ont comparés 3 formes commerciales à libération contrôlée,
disponibles sur le marché contenant de l’acide 5-aminosalicylique : Pentasa, Asacol, Salofalk.
Ils ont montré que l’addition d’un maximum de 40% d’éthanol au milieu de libération affecte
significativement les profils de libération. Il est a noté que les modifications observées sont
très variables selon le type de formulation. En 2010, Smith et al. ont reporté des études in
vitro qui ont été conduites sur 27 produits oraux à libération modifiée. Différents types de
PA ont ainsi été étudiées, incluant les opiacés, des canaux calciques bloquant, des
antidépresseurs et anti arithmétiques. A noter que 9 des 10 capsules testées et 2 des 17
comprimés ont montré une accélération des cinétiques de libération dans des milieux
contenant 40% d’éthanol. Aussi, Traynor et al. (2008) ont étudiés l’impact de l’addition de
hautes quantités d’alcool au milieu de libération. Ils ont montrés que le taux de tramadol
pour des formulations contrôlées sur 24 heures est significativement augmenté. Dans le cas
de formulations à base d’hydroxypropyl methylcellulose (HPMC), Levina et al. (2007)
reportent seulement des effets modérés de l’éthanol sur les libérations in-vitro. Une étude
de Roberts et al. (2007) a montré une augmentation significative des taux d’aspirine libéré à
partir de comprimés d’HPMC en présence de hautes concentrations d’éthanol. Cela peut
être partiellement expliqué par le faible gonflement de la matrice et une augmentation de la
solubilité du PA. Autre constat qu’est celui de Roth et al. (2009) qui ont reporté que la
libération de Vérapamil à partir de systèmes matriciels est significativement plus rapide en
présence de 40% d’éthanol au milieu de libération. Une autre étude très intéressante sur le
potentiel impact de l’éthanol contenu dans le milieu de libération sur les performances des
libérations de PA retenues par des films polymériques a été montrée par Larsson et al.
(2010). Ils ont préparés des films à base d’éthylcellulose et d’hydroxypropyl cellulose (HPC)

Chapter 2 : Introduction (Français)
44
par pulvérisation de solutions organiques polymériques et étudiés la perméabilité à l’eau du
système en présence et absence d’éthanol. La perméabilité à l’eau des films avec un faible
contenu en HPC augmente avec une augmentation de la concentration d’éthanol, alors que
la perméabilité avec un fort contenu en HPC diminue avec une augmentation de la
concentration en alcool. L’augmentation de la perméabilité pour les formules à faible
contenu en HPC est certainement due à un gonflement plus prononcé de l’éthylcellulose en
présence d’éthanol. La diminution de la perméabilité pour les forts contenus en HPC peut
être expliquée comme suit: un réseau continu d’HPC est formé, via lequel l’eau peut
relativement être transportée. L’addition d’éthanol dans le milieu de libération entraine un
gonflement de l’ethylcellulose plus important, qui peut probablement fermé partiellement
les pores d’HPC. Ces différents exemples in vitro et in vivo démontrent clairement que la
consommation de substances alcoolisées peut être dangereuse pour les patients traités avec
un principe actif à haute activité compris dans les systèmes oraux à libération contrôlée. De
ce fait, il est évident que la diminution de ces risques est nécessaire.
MELANGE DE POLYMERES D’ENROBAGE POUR LA RESISTANCE A
L’ETHANOL DE SYSTEMES ORAUX A LIBERATION PROLONGEE
Des études précédentes établies au sein du laboratoire ont portées sur la formulation de
films polymériques insensibles à la présence d’éthanol (Rosiaux, 2013). Ce procédé portait
sur des films d’enrobages permettant d’éviter les ruptures du système même sous de fortes
concentrations d’éthanol. Les dispersions aqueuses d’éthylcellulose, sont régulièrement
utilisées pour des libérations contrôlées et soutenues. Le problème étant sa solubilité à
l’éthanol entrainant les effets indésirables de « dose dumping » lors de la prise concomitante
avec des boissons alcoolisées. L’ajout d’une fraction de gomme guar, polymère hydrophile et
résistant à l’éthanol permet alors d’augmenter les cinétiques de libérations qui seront trop
soutenue dans des milieux dépourvus d’éthanol, mais aussi de résister aux effets de « dose-
dumping » dans des milieux riches en éthanol. Il est alors important de savoir comment ce
mélange agit pour avoir cette fonction.
L’éthylcellulose est un matériel d’enrobage hydrophobique généralement utilisé pour
le masquage de gout, une protection contre l’humidité et surtout pour permettre de réguler

Chapter 2 : Introduction (Français)
45
les cinétiques de libération. C’est un polymère non toxique, non allergisant et aux propriétés
non irritantes Ce polymère peut être appliqué à partir d’une solution organiques mais aussi
pour éviter l’utilisation de solvant comme le méthanol, dichlorométhane ou encore
l’éthanol, des dispersions aqueuses d’éthylcellulose ont été formulées. L’éthylcellulose étant
soluble dans l’éthanol, cela fait de lui un bon candidat pour la formulation de nouveaux SDM
résistants à l’éthanol.
Les polysaccharides sont également de bons candidats pour les formes à libération
prolongées d’enrobage. Ces excipients sont peu chers et montrent une large variété de
structures et de propriétés (Hovgaard and Brondsted, 1996). De plus, ils sont hautement
stables, non toxiques, biodégradables et hydrophiles. Cette propriété d’hydrophilie fait que
les polysaccharides formeront un gel par gonflement sous exposition au milieu de
dissolution et deviendront plus hautement solubles entrainant une rapide libération de PA
(Milojevic et al., 1996). Pour contrôler les caractéristiques de solubilité et limiter la libération
du PA, des polymères hydrophobiques peuvent être ajoutés. Une famille de polysaccharides
naturels comprend des gommes guar avec de bonnes propriétés pour l’enrobage. Il peut
être utilisé comme “pore former”, pour des libérations à visées coliques (Krishnaiah et al,
1998; Prabaharan, 2011), et dans notre cas vu son insolubilité dans l’éthanol, la gomme guar
semble une bonne candidate pour obtenir des enrobages résistants à l’éthanol.
Dans le cadre de cette thèse, les minigranules ont été enrobées par une dispersion de
polymère. L’utilisation de l’enrobeur de type Wurster où la dispersion à enrober est
pulvérisée par une buse placée au centre de la plaque du bas permet un meilleur enrobage
que les autres systèmes. Le flux de pulvérisation est alors dans le même sens que l’air
d’alimentation. L’utilisation du cylindre du Wurster ainsi que la surface plane présentant
différentes perforations permet un mouvement d’accélération des granules via le flux d’air
dans le tube. Les granules passent alors dans le cône de pulvérisation pour être enrobées par
la solution/suspension. Du fait de la position de la buse au sein du flux d’air, la solution
d’enrobage n’a qu’une courte distance à effectuer avant d’arriver à la surface des granules
(Wheatley et al., 1997). Plusieurs théories ont été établies concernant la formation de fin
films polymériques. Dans l’optique de rester centrer sur notre étude, seulement le cas des
films issus de dispersions aqueuses seront mentionnés ici. L’enrobage ayant lieu à une
température donnée l’évaporation de l’eau permet le rapprochement des particules. Une
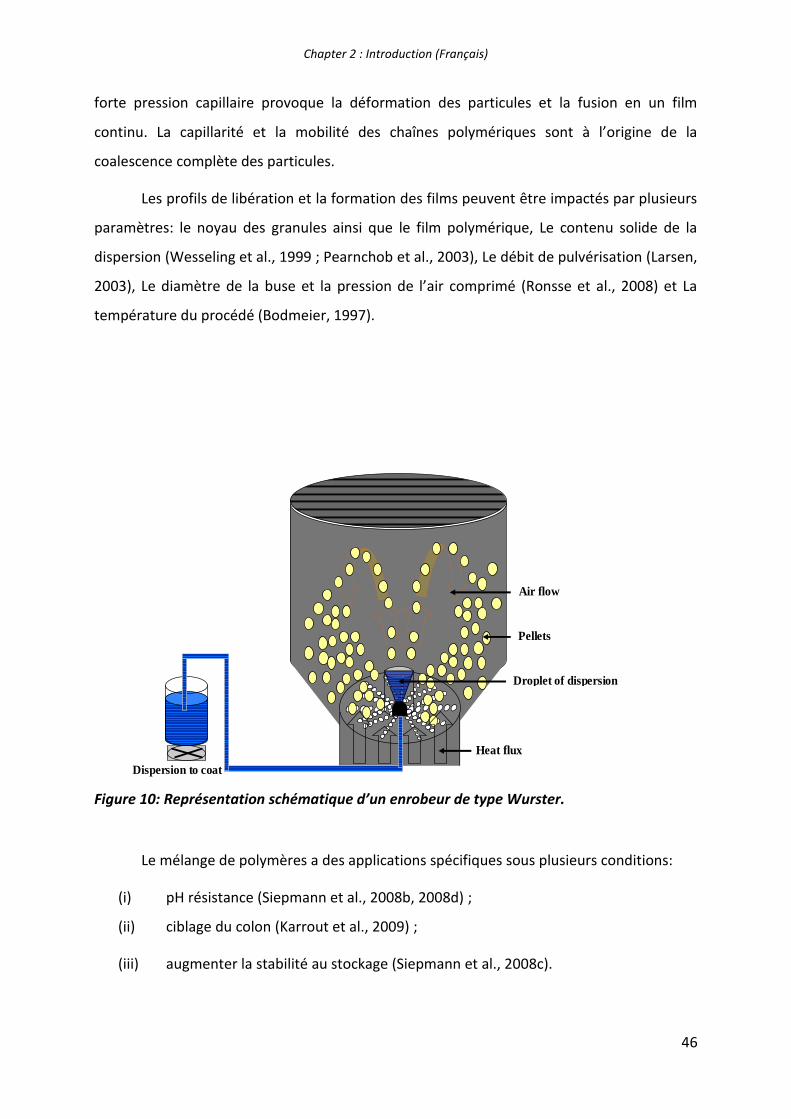
Chapter 2 : Introduction (Français)
46
Dispersion to coat
Heat flux
Droplet of dispersion
Pellets
Air flow
forte pression capillaire provoque la déformation des particules et la fusion en un film
continu. La capillarité et la mobilité des chaînes polymériques sont à l’origine de la
coalescence complète des particules.
Les profils de libération et la formation des films peuvent être impactés par plusieurs
paramètres: le noyau des granules ainsi que le film polymérique, Le contenu solide de la
dispersion (Wesseling et al., 1999 ; Pearnchob et al., 2003), Le débit de pulvérisation (Larsen,
2003), Le diamètre de la buse et la pression de l’air comprimé (Ronsse et al., 2008) et La
température du procédé (Bodmeier, 1997).
Figure 10: Représentation schématique d’un enrobeur de type Wurster.
Le mélange de polymères a des applications spécifiques sous plusieurs conditions:
(i) pH résistance (Siepmann et al., 2008b, 2008d) ;
(ii) ciblage du colon (Karrout et al., 2009) ;
(iii) augmenter la stabilité au stockage (Siepmann et al., 2008c).

Chapter 2 : Introduction (Français)
47
Le but de cette thèse a alors été d’élucider les mécanismes de transport de masse
contrôlant la libération à partir de minigranules enrobées avec le nouveau film polymérique
résistant à l’éthanol (Lecomte et al., 2005a,b; Siepmann et al., 2005, 2006). Le fait d’avoir
fractionnée la dose de PA en plusieurs sous-unités est un grand avantage pour ce type
d’application : en cas de dommage accidentel du film seulement la minigranule concernée se
retrouvera en état de « dose dumping », la totalité des profils de libération provenant de
l’ensemble des minigranules devraient alors être moins impactée. Basée sur des
caractérisations expérimentales compréhensive du système avant et après exposition à
différent milieu de libération, ainsi que sur des caractérisations de la forme (par exemple des
mesures de prise en eau ou des changements dans la résistance après mise en contact avec
le milieu), la détermination d’un système spécifique peut être faites avec le coefficient de
diffusion apparent du principe actif au travers du film d’enrobage (Siepmann and Peppas,
2001; Siepmann and Goepferich, 2001; Borgquist et al., 2004; Marucci et al., 2008).
Des équations mathématiques appropriées seront développées pour permettre le
développement d’un modèle mathématique pour faciliter l’optimisation des produits à base
de PA : Des simulations In silico devraient être capables de prédire les effets des paramètres
de formulation sur les cinétiques de libération.
.

Chapter 3 : References
48
3. References
Abd El-Halim S., Amin M., El-Gazayerly O., Abd El-Gawad N. Comparative study on the
different techniques for the preparation of sustained-release hydrophobic matrices of a
highly water-soluble drug. Drug Discoveries & Therapeutics. 2010; 4:484-492.
Abrahamsson B., Albery T., Eriksson A., Gustafsson I., Sjöberg M. Food effects on tablet
disintegration. European Journal of Pharmaceutical Sciences. 2004; 22:165–172.
Andersson M., Holmquist B., Lindquist J., Nilsson O., Wahlund K.G. Analysis of film coating
thickness and surface area of pharmaceutical pellets using fluorescence microscopy and
image analysis. Journal of Pharmaceutical and Biomedical Analysis. 2000; 22:325-339.
Baker, R. (Ed.), Controlled release of biologically active agents, John Wiley & Sons, New York,
1987.
Barthelemy P., Laforêt J., Farah N., Joachim J. Compritol® 888 ATO: an innovative hot-melt
coating agent for prolonged-release drug formulations. European Journal of Pharmaceutics
and Biopharmaceutics. 1999; 47:87–90.
Bechgaard H., Nielsen G.H. Controlled-release multiple-units and single-unit doses -
Literature review. Drug Development and Industrial Pharmacy. 1978; 4:53-67.
Bodmeier R., Guo X., Paeratakul O., Process and formulation facotrs affecting the drug
release from pellets coated with the ethylcellulose-pseudolatex Aquacoat. Aqueous
polymeric coatings for pharmaceutical dosage forms. J.W. Mc Ginity, Editor. 1997; Marcel
Dekker: New York.
Booker E.A., Haig A.J., Geisser M.E., Yamakawa, K. Alcohol use self report in chronic back
pain--relationships to psychosocial factors, function performance, and medication use.
Disabil. Rehabil. 2003; 25: 1271-1277.

Chapter 3 : References
49
Borgquist P., Zackrisson G., Nilsson B. Axelsson, A. Simulation and parametric study of a film-
coated controlled-release pharmaceutical. Journal Controlled Release. 2002; 80: 229-245,.
Borgquist P., Nevsten P., Nilsson B., Wallenberg L.R., Axelsson, A. Simulation of the release
from a multiparticulate system validated by single pellet and dose release experiments.
Journal of Controlled Release. 2004; 97: 453-465.
Borgquist P., Körner A., Piculell L., Larsson A., Axelsson A. A model for the drug release from
a polymer matrix tablet—effects of swelling and dissolution. Journal of Controlled Release.
2006; 113:216-225.
Brazel C.S., Peppas N.A. Modeling of drug release from Swellable polymers, European
Journal of Pharmaceutics and Biopharmaceutics. 2000; 49:47-58.
Cahyadi C., Karande A.D., Chan L.W., Heng P.W.S. Comparative study of non-destructive
methods to quantify thickness of tablet coatings. International Journal of Pharmaceutics.
2010;398:39–49.
Caraballo I., Millán M., Rabasco A.M., Leuenberger H. Zero-order release periods in inert
matrices. Influence of the distance to the percolation threshold. Pharmaceutica Acta
Helvetiae. 1996; 71:335–339.
Cogdill R.P., Forcht R.N., Shen Y., Taday P.F., Creekmore J.R.,Anderson C.A., Drennen J.K.
Comparison of terahertz pulse imaging and near-infrared spectroscopy for rapid, non-
destructive analysis of tablet coating thickness and uniformity. Journal Pharmaceutics.
Innovation. 2007; 2:29–36.
Cole G., in: Cole G., Hogan J., Aulton M.E. (Eds.). Pharmaceutical Coating Technology. Taylor
& Francis Ltd., Philadelphia. 1995:1-5.
Crank J., 1975. The Mathematics of Diffusion, Clarendon Press, Oxford.

Chapter 3 : References
50
De Beer T., Burggraeve A., Fonteyne M., Saerens L., Remon J.P., Vervaet C. Near infrared and
Raman spectroscopy for the in-process monitoring of pharmaceutical production processes.
International Journal of Pharmaceutics. 2011; 417:32–47.
Depypere F., Van Oostveldt P., Pieters, J.G., Dewettinck, K. Quantification of microparticle
coating quality by confocal laser scanning microscopy (CLSM). European Journal of
Pharmaceutics and Biopharmaceutics. 2009; 73:179-186.
Ensslin S., Moll K.P., Paulus K., Mader K. New insight into modified release pellets - Internal
structure and drug release mechanism. Journal Controlled Release. 2008; 128:149-156.
Ensslin, S., Moll, K.P., Metz, H., Otz, M., Mader, K. Modulating pH-independent release from
coated pellets: effect of coating composition on solubilization processes and drug release.
European Journal of Pharmaceutics and Biopharmaceutics. 2009; 72:111-118.
Fadda H.M., Mohamed M.A.M., Basit,A.W. Impairment of the in vitro release behaviour of
oral modified release preparations in the presence of alcohol. International Journal of
Pharmaceutics. 2008; 360: 171-176.
Faham A., Prinderre P., Farah N., Eichler K.D., Kalantzis G., Joachim J. Hot-Melt Coating
Technology. I. Influence of Compritol® 888 Ato and Granule Size on Theophylline Release.
Die Pharmazie. 2000; 26:167-176.
Fan, L.T., Singh, S.K. (Eds.), Controlled release. A quantitative treatment, Springer-Verlag,
Berlin, 1989.
http://www.fda.gov/ohrms/dockets/ac/05/briefing/2005-4187B1_01_08-Alcohol-
Induced.pdf
Fitzgerald A.J., Cole B.E., Taday P.F. Nondestructive analysis of tablet coating thicknesses
using terahertz pulsed imaging. Journal of Pharmaceutical Sciences. 2005; 94:177-183.

Chapter 3 : References
51
Franke A, Luebke N, Links M, Harder H, Teyssen S, Singer MV. Effect of ethanol and some
alcoholic beverages on gastric emptying of solid meals in men. Gastroenterology.
2003;124:A575–A576.
Frenning G. Modelling drug release from inert matrix systems: From moving-boundary to
continuous-field descriptions. International Journal of Pharmaceutics. 2011; 418:88-99.
Gao Y., Muzzio F.J., Ierapetritou M.G. A review of the Residence Time Distribution (RTD)
applications in solid unit operations. Powder Technology. 2012; 228:416–423.
Grassi M., Colombo I. Mathematical modelling of drug permeation through a swollen
membrane, Journal of Controlled Release. 1999; 59:343-359.
Gendre C., Genty M., Boiret M. et al. Development of a Process Analytical Technology (PAT)
for in-line monitoring of film thickness and mass of coating materials during a pan coating
operation. European Journal of Pharmaceutical Sciences. 2011; 43:244–250.
Gendre C., Genty M., Silva J.C. et al. Comprehensive study of dynamic curing effect on tablet
coating structure. European Journal of Pharmaceutics and Biopharmaceutics. 2012; 81:657–
665.
Grassi M., Voinovich D., Franceschinis E., Perissutti B., Filipovic-Grcic J. Theoretical and
experimental study on theophylline release from stearic acid cylindrical delivery systems.
Journal of Controlled Release. 2003; 92:275-289.
Gueres S., Siepmann F., Siepmann J., Kleinebudde P. Drug release from extruded solid lipid
matrices: Theoretical predictions and independent experiments. European Journal of
Pharmaceutics and Biopharmaceutics. 2012; 80:122-129.
Guse C., Koennings S., Kreye F., Siepmann F., Goepferich A., Siepmann J. Drug release from
lipid-based implants: Elucidation of the underlying mass transport mechanisms. International
Journal of Pharmaceutics. 2006; 314:137-144.

Chapter 3 : References
52
Haddish-Berhane N., Jeong S.H., Haghighi K., Park K. Modeling film-coat non-uniformity in
polymer coated pellets: A stochastic approach. International Journal of Pharmaceutics. 2006;
323:64–71.
Hariharan D., Peppas N.A. Modelling of water transport and solute release in physiologically
sensitive gels, Journal of Controlled Release. 1993; 23:123-135.
Herrmann S., Winter G., Mohl S., Siepmann F., Siepmann J. Mechanisms controlling protein
release from lipidic implants: Effects of PEG addition. Journal of Controlled Release. 2007a;
118:161-168.
Herrmann S., Mohl S., Siepmann F., Siepmann J., Winter G. New insight into the role of
polyethylene glycol acting as protein release modifier in lipidic implants. Pharmaceutical
Research. 2007b; 24:1527-1537.
HMP1013. A randomised, open-label, single dose, 4 way crossover study of the effects of
varying doses of ethanol on the pharmacokinetic characteristics of 12 mg hydromorphone
hydrochloride extended release capsules (Palladone™) in two groups (fed and fasted) of
healthy volunteers. Data in house, Purdue Pharma (US).
Haddish-Berhane N., Jeong S.H., Haghighi K., Park, K. Modeling film-coat non-uniformity in
polymer coated pellets: a stochastic approach. International Journal of Pharmaceutics. 2006;
323:64-71.
Heinicke G., Schwartz J.B. Ammonio polymethacrylate-coated diltiazem: Drug release from
single pellets, media dependence, and swelling behavior. Pharmaceutical Development and
Technology. 2007; 12:285-296.
Ho L., Müller R., Römer M., Gordon K.C., Heinämäki J., Kleinebudde P., Pepper M., Rades T.,
Shen Y.C., Strachan C.J., Taday P.F., Zeitler J.A. Analysis of sustained-release tablet film coats
using terahertz pulsed imaging. Journal Controlled Release. 2007;119:253-261.

Chapter 3 : References
53
Ho L., Müller R., Gordon K.C., Kleinebudde P., Pepper M., Rades T., Shen Y.C., Taday P.F.,
Zeitler J.A. Applications of terahertz pulsed imaging to sustained-release tablet film coating
quality assessment and dissolution performance. Journal Controlled Release. 2008; 127:79-
87.
Ho L., Müller R., Gordon K.C., et al. Terahertz pulsed imaging as an analytical tool for
sustained-release tablet film coating. European Journal of Pharmaceutics and
Biopharmaceutics. 2009a; 71:117–123.
Ho L., Cuppok Y., Muschert S., Gordon K.C., Pepper M., Shen Y., Siepmann F., Siepmann J.,
Taday P.F., Rades T., Effects of film coating thickness and drug layer uniformity on in vitro
drug release from sustained-release coated pellets: a case study using terahertz pulsed
imaging. International Journal of Pharmaceutics. 2009b; 382:151-159.
Ho L., Müller R., Krüger C., Gordon K.C., Kleinebudde P., Pepper M., Rades T., Shen Y.C.,
Taday P.F., Zeitler J.A. Investigating Dissolution Performance Critical Areas on Coated
Tablets: A Case Study Using Terahertz Pulsed Imaging. Journal of Pharmaceutical Sciences.
2010; 99:392-402.
Hovgaard L., Bronsted H. Current applications of polysaccharides in colon targeting. Critical
review in Therapeutic Drug Carrier System. 1996; 13:185-223.
Jannin V., Bérard V., N’Diaye A., Andrès C., Pourcelot Y. Comparative study of the lubricant
performance of Compritol® 888 ATO either used by blending or by hot melt coating.
International Journal of Pharmaceutics. 2003; 262:39–45.
Karrout Y., Neut C., Wils D, et al. Novel polymeric film coatings for colon targeting: Drug
release from coated pellets. European Journal of Pharmaceutical Sciences. 2009; 37:427–
433.
Kaunisto E., Marucci M., Borgquist P., Axelsson A. Mechanistic modelling of drug release
from polymer-coated and swelling and dissolving polymer matrix systems. International
Journal of Pharmaceutics. 2011; 418:54-77.

Chapter 3 : References
54
Kreye F., Siepmann F., Siepmann J. Lipid implants as drug delivery systems. Expert Opinion
Drug Delivery. 2008; 3:291-307.
Kreye F., Siepmann F., Siepmann J. Drug release mechanisms of compressed lipid implants.
International Journal of Pharmaceutics. 2011a; 404:27-35.
Kreye F., Siepmann F., Zimmer A., Willart J.F., Descamps M., Siepmann J. Controlled release
implants based on cast lipid blends, Eur. J. Pharm. Sci. 2011b; 43:78-83.
Kreye F., Siepmann F., Willart J.F., Descamps M., Siepmann J. Drug release mechanisms of
cast lipid implants. European Journal of Pharmaceutics and Biopharmaceutics. 2011c;
78:394-400.
Kreye F., Siepmann F., Zimmer A., Willart J.F., Descamps M., Siepmann J. Cast lipid implants
for controlled drug delivery: Importance of the tempering conditions. J. Pharm. Sci. 2011d;
100:3471-3481.
Krishnaiah Y.S., Satyanarayana S., Rama Prasad Y., Narasimha Rao S. Evaluation of guar gum
as a compression coat for drug targeting to colon. International Journal of Pharmaceutics.
1998; 171:137–146.
Kucera S., Felton L., McGinity J. Physical Aging in Pharmaceutical Polymers and the Effect on
Solid Oral Dosage Form Stability. International Journal of Pharmaceutics., in press.
Larsson M., Hjaertstam J., Berndtsson J., Stading M., Larsson A. Effect of ethanol on the
water permeability of controlled release films composed of ethyl cellulose and
hydroxypropyl cellulose. European Journal of Pharmaceutics and Biopharmaceutics. 2010;
76: 428-432.
Lavö B, Colombel JF, Knutsson L, Hällgren R. Acute exposure of small intestine to ethanol
induces mucosal leakage and prostaglandin E2 synthesis. Gastroenterology. 1992;102:468-
73.1.

Chapter 3 : References
55
Lecomte F., Siepmann J., Walther M., MacRae R.J., Bodmeier R. Blends of enteric and GIT-
insoluble polymers used for film coating: Physicochemical characterization and drug release
patterns. Journal of Controlled Release. 2003; 89: 457-471.
Lecomte F., Siepmann J., Walther M., MacRae R.J., Bodmeier, R. Polymer blends used for the
coating of multiparticulates: Comparison of aqueous and organic coating techniques.
Pharaceutical Research. 2004a; 21: 882-890.
Lecomte F., Siepmann J., Walther M., MacRae R.J., Bodmeier, R. Polymer blends used for the
aqueous coating of solid dosage forms: Importance of the type of plasticizer. Journal
Controlled Release. 2004b; 99:1-13.
Lecomte F., Siepmann J., Walther M., MacRae R.J. Bodmeier R. pH-sensitive polymer blends
used as coating materials to control drug release from spherical beads: Elucidation of the
underlying mass transport mechanisms. Pharaceutical Research. 2005a; 22:1129-1141.
Lecomte F., Siepmann J., Walther M., MacRae R.J., Bodmeier R. pH-sensitive polymer blends
used as coating materials to control drug release from spherical beads: Importance of the
type of core. Biomacromolecules 2005b; 6: 2074-2083.
Lee M.J., Seo D.Y., Lee H.E., et al. In line NIR quantification of film thickness on
pharmaceutical pellets during a fluid bed coating process. International Journal of
Pharmaceutics. 2011;403:66–72.
Lennernaes H. Ethanol-drug absorption interaction: Potential for a significant effect on the
plasma pharmacokinetics of ethanol vulnerable formulations. Mol. Pharm. 2009; 6: 1429-
1440.
Levina M., Vuong H., Rajabi-Siahboomi A.R. The influence of hydro-alcoholic media on
hypromellose matrix systems. Drug Development and Industrial Pharmacy. 2007; 33:1125–
1134.

Chapter 3 : References
56
Mallapragada S.K., Peppas N.A. Crystal dissolution-controlled release systems: I. Physical
characteristics and modeling analysis. Journal of Controlled Release. 1997; 45:87-94.
Maroni A., Zema L., Loreti G., Palugan L., Gazzaniga A. Film coatings for oral pulsatile release.
International Journal of Pharmaceutics., in press.
Marucci M., Ragnarsson G., Nyman U., Axelsson A. Mechanistic model for drug release
during the lag phase from pellets coated with a semi-permeable membrane. Journal
Controlled Release. 2008; 127: 31–40.
Marucci M., Ragnarsson G., Nilsson B., Axelsson A. Osmotic pumping release from ethyl–
hydroxypropyl–cellulose-coated pellets: A new mechanistic model. Journal Controlled
Release. 2010; 142: 53-60.
Marucci M., Ragnarsson G., von Corswant C., Welinder A., Jarke A., Iselau F., Axelsson A.
Polymer leaching from film coating: Effects on the coating transport properties. International
Journal of Pharmaceutics. 2011; 411: 43-48.
Maschke A., Lucke A., Vogelhuber W., Fischbach C., Appel B., Blunk T., Göpferich A. Lipids:
An Alternative Material for Protein and Peptide Release. Carrier Based drug Delivery. 2004;
13:176-196.
Maurer L., Leuenberger H. Terahertz pulsed imaging and near infrared imaging to monitor
the coating process of pharmaceutical tablets. International Journal of Pharmaceutics.
2009;370:8–16.
McConnell EL, Fadda HM, Basit AW. Gut instincts: Explorations in intestinal physiology and
drug delivery. International Journal of Pharmaceutics. 2008;364:213–226.
Meyer R.J., Hussain A.S. Awareness Topic: Mitigating the risks of ethanol induced dose
dumping from oral sustained/controlled release dosage forms. FDA’s ACPS Meeting, October
2005.

Chapter 3 : References
57
Milojevic S., Newton J.M., Cummings J.H., et al. Amylose as a coating for drug delivery to the
colon: Preparation and in vitro evaluation using glucose pellets. Journal of Controlled
Release. 1996; 38:85–94.
Müller J, Brock D, Knop K, Axel Zeitler J, Kleinebudde P. Prediction of dissolution time and
coating thickness of sustained release formulations using Raman spectroscopy and terahertz
pulsed imaging. European Journal of Pharmaceutics and Biopharmaceutics. 2012;80:690–
697.
Muschert S., Siepmann F., Leclercq B., Carlin B., Siepmann J. Drug release mechanisms from
ethylcellulose:PVA-PEG graft copolymer coated pellets. European Journal of Pharmaceutics
and Biopharmaceutics. 2009a; 72: 130-137.
Muschert S., Siepmann F., Cuppok Y., Leclercq B., Carlin B., Siepmann, J. Improved long term
stability of aqueous ethylcellulose film coatings: Importance of the type of drug and starter
core. International Journal of Pharmaceutics. 2009; 368:138-145.
Muschert S., Siepmann F., Leclercq B., Carlin B., Siepmann J. Prediction of drug release from
ethylcellulose coated pellets. Journal of Controlled Release. 2009b; 135: 71-79.
Moes J.J., Ruijken M.M., Gout E., Frijlink H.W., Ugwoke M.I. Application of process analytical
technology in tablet process development using NIR spectroscopy: Blend uniformity, content
uniformity and coating thickness measurements. International Journal of Pharmaceutics.
2008;357:108–118.
Möltgen C.V., Herdling T., Reich G. A novel multivariate approach using science-based
calibration for direct coating thickness determination in real-time NIR process monitoring.
European Journal of Pharmaceutics and Biopharmaceutics. (2013).
Obaidat A.A., Obaidat R.M. Controlled release of tramadol hydrochloride from matrices
prepared using glyceryl behenate. European Journal of Pharmaceutics and
Biopharmaceutics. 2001; 52:231–235.

Chapter 3 : References
58
Pearnchob N., Bodmeier R. Dry polymer powder coating and comparison with conventional
liquid-based coatings for Eudragit® RS, ethylcellulose and shellac. European Journal of
PPharmaceutics and Biopharmaceutics. 2003; 56:363–369.
Peppas N.A. Historical perspective on advanced drug delivery: How engineering design and
mathematical modeling helped the field mature. Adv Drug del rev. 2013; 65:5-9.
Prabaharan M. Prospective of guar gum and its derivatives as controlled drug delivery
systems. International Journal of Biological Macromolecules. 2011; 49:117–124.
Reitz E., Podhaisky H., Ely D., Thommes M. Residence time modeling of hot melt extrusion
processes. European Journal of Pharmaceutics and Biopharmaceutics. 2013. In Press,
Corrected Proof.
Ringqvist A., Taylor L.S., Ekelund K., Ragnarsson G., Engstrom S., Axelsson, A. Atomic force
microscopy analysis and confocal Raman microimaging of coated pellets. International
Journal of Pharmaceutics. 2003;267:35-47.
Roberts M., Cespi M., Ford J.L., Dyas A.M., Downing J., Martini L.G., Crowley P.J. Influence of
ethanol on aspirin release from hypromellose matrices. International Journal of
Pharmaceutics. 2007; 332: 31-37.
Römer M., Heinämäki J., Strachan C., Sandler N., Yliruusi J.Prediction of tablet film-coating
thickness using a rotating plate coating system and NIR spectroscopy. AAPS PharmSciTech.
2008; 9:1047–1053
Ronsse F., Pieters J.G., Dewettinck K. Modelling side-effect spray drying in top-spray fluidised
bed coating processes. Journal of Food Engineering. 2008; 86:529–541.
Rosiaux Y., Muschert S., Chokshi R., Leclercq B., Siepmann F., Siepmann J. Ethanol-resistant
polymeric film coatings for controlled drug delivery. Journal of Controlled Release. 2013;
169:1–9.

Chapter 3 : References
59
Roth W., Setnik B., Zietsch M., Burst A., Breitenbach J., Sellers E., Brennan D. Ethanol effects
on drug release from Verapamil Meltrex, an innovative melt extruded formulation.
International Journal of Pharmaceutics. 2009; 368:72-75.
Sackett C.K., Narasimhan B. Mathematical modeling of polymer erosion: Consequences for
drug delivery. International Journal of Pharmaceutics. 2011; 418:104-114.
Saerens L., Dierickx L., Lenain B., Vervaet C., Remon J.P., Beer T.D.. Raman spectroscopy for
the in-line polymer–drug quantification and solid state characterization during a
pharmaceutical hot-melt extrusion process. European Journal of Pharmaceutics and
Biopharmaceutics. 2011;77:158–163.
Saerens L., Dierickx L., Quinten T., et al. In-line NIR spectroscopy for the understanding of
polymer–drug interaction during pharmaceutical hot-melt extrusion. European Journal of
Pharmaceutics and Biopharmaceutics. 2012;81:230–237.
Schug B.S., Brendel E., Wolf D., Wonnemann M., Wargenau M., Blume H.H. Formulation-
dependent food effects demonstrated for nifedipine modified-release preparations
marketed in the European Union. European Journal of Pharmaceutical Sciences. 2002;
15:279–285.
Serdula M.K., Brewer R.D., Gillespie C., Denny C.H., Mokdad A. Trends in alcohol use and
binge drinking, 1985-1999 results of a multi-state survey. Am. J. Prev. Med. 2004; 26:294-
298.
Shen Y.C., Taday P.F., Pepper M. Elimination of scattering effects in spectral measurement of
granulated materials using terahertz pulsed spectroscopy. Applied Physics Letters. 2008;92.
Siepmann J., Goepferich A. Mathematical modeling of bioerodible, polymeric drug delivery
systems. Advanced Drug Delivery Reviews. 2001; 48:229-247.
Siepmann J., Peppas N.A. Modeling of drug release from delivery systems based on
hydroxypropyl methylcellulose (HPMC). Advanced Drug Delivery Reviews. 2001; 48:139-157.

Chapter 3 : References
60
Siepmann F., Siepmann J., Walther M., MacRae R.J., Bodmeier R. Blends of aqueous polymer
dispersions used for pellet coating: Importance of the particle size. Journal Controlled
Release. 2005; 105: 226-239.
Siepmann J., Siepmann F., Florence A.T. Local controlled drug delivery to the brain:
Mathematical modeling of the underlying mass transport mechanisms. International Journal
of Pharmaceutics. 2006; 314:101-119.
Siepmann F., Siepmann J., Walther M., MacRae R.J., Bodmeier R. Polymer blends for
controlled release coatings. Journal Controlled Release. 2007a; 125:1-15.
Siepmann F., Hoffmann A., Leclercq B., Carlin B., Siepmann J. How to adjust desired drug
release patterns from ethylcellulose-coated dosage forms. Journal Controlled Release.
2007b; 119:182-189.
Siepmann F., Herrmann S., Winter G., Siepmann J. A novel mathematical model quantifying
drug release from lipid implants. Journal of Controlled Release. 2008; 128:233-240.
Siepmann F., Muschert S., Leclercq B., Carlin, B., Siepmann J. How to improve the storage
stability of aqueous polymeric film coatings. Journal Controlled Release. 2008; 126:26-33.
Siepmann J., Siepmann F. Mathematical modeling of drug delivery. International Journal of
Pharmaceutics. 2008; 364: 328-343.
Siepmann F., Eckart K., Maschke A., Kolter K., Siepmann J. Modeling drug release from
PVAc/PVP matrix tablets. Journal of Controlled Release. 2010; 141:216-222.
Siepmann J., Siepmann F. Mathematical modeling of drug release from lipid dosage forms.
International Journal of Pharmaceutics. 2011; 418:42-53.
Siepmann, J; Siepmann, F. Modeling of diffusion controlled drug delivery. Journal of
Controlled Release. 2012a;161, 351-362.

Chapter 3 : References
61
Siepmann J., Siepmann F. Modeling of diffusion controlled drug delivery. Journal Controlled
Release. 2012b; 61:351-362.
Siepmann J., Peppas N.A. Modeling of drug release from delivery systems based on
hydroxypropyl methylcellulose (HPMC), Adv. Drug Del. Rev. 2012b; 64:163-174.
Siepmann J. In-silico simulations of advanced drug delivery systems: What will the future
offer? International Journal of Pharmaceutics. 2013a; 454:512-516.
Siepmann J., Siepmann F. Mathematical modeling of drug dissolution, International Journal
of Pharmaceutics. 2013b; 453:12-24.
Siepmann J., Siepmann F. Mathematical modeling of drug dissolution. International Journal
of Pharmaceutics., in press.
Singer M.V., Leffmann C., Eysselein V.E., Calden H., Goebell H. Action of ethanol and some
alcoholic beverages on gastric acid secretion and release of gastrin in humans.
Gastroenterology. 1987; 93:1247-1254.
Smith G.D. Numerical Solution of Partial Differential Equations: Finite Difference Methods,
Clarendon Press, Oxford, 1985.
Smith A.P., Moore T.W., Westenberger B.J., Doub W.H. In vitro dissolution of oral modified-
release tablets and capsules in ethanolic media. International Journal of Pharmaceutics.
2010; 398:93-96.
Tanquary, A.C., Lacey, R.E. (Eds.), Controlled release of biologically active agents, Plenum
Press, New York, 1974.
Traynor M.J., Brown M.B., Pannala A., Beck P., Maetin G.P. Influence of alcohol on the
release of tramadol from 24-h controlled-release formulations during in vitro dissolution
experiments. Drug Development and Industrial Pharmacy. 2008; 34:885-889.

Chapter 3 : References
62
Van Aken G.A., Vingerhoeds M.H., de Hoog EHA. Food colloids under oral conditions. Current
Opinion in Colloid & Interface Science. 2007; 12:251–262.
Varum FJO, Merchant HA, Basit AW. Oral modified-release formulations in motion: The
relationship between gastrointestinal transit and drug absorption. International Journal of
Pharmaceutics. 2010;395:26–36.
1. Varum F.J.O., Hatton G.B., Basit A. Food, physiology and drug delivery. International Journal
of Pharmaceutics., in press.
Vercruysse J., Córdoba Díaz D., Peeters E., et al. Continuous twin screw granulation:
Influence of process variables on granule and tablet quality. European Journal of
Pharmaceutics and Biopharmaceutics. 2012; 82:205–211.
Verhoeven E., De Beer T.R.M., Van den Mooter G., Remon J.P., Vervaet C. Influence of
formulation and process parameters on the release characteristics of ethylcellulose
sustained-release mini-matrices produced by hot-melt extrusion. European Journal of
Pharmaceutics and Biopharmaceutics. 2008; 69:312–319.
Vogelhuber W., Magni E., Gazzaniga A., Göpferich A. Monolithic glyceryl trimyristate
matrices for parenteral drug release applications. European Journal of Pharmaceutics and
Biopharmaceutics. 2003; 55:133–138.
Walden M., Nicholls F.A., Smith K.J. The effect of ethanol on the release of opioids from oral
prolonged-release preparations. Drug Development and Industrial Pharmacy. 2007; 33:1101-
1111.
Weitschies W., Wedemeyer R-S, Kosch O., et al. Impact of the intragastric location of
extended release tablets on food interactions. Journal of Controlled Release. 2005; 108:375–
385.

Chapter 3 : References
63
Wesseling M., Bodmeier R. Drug release from beads coated with an aqueous colloidal
ethylcellulose dispersion, Aquacoat®, or an organic ethylcellulose solution. European Journal
of Pharmaceutics and Biopharmaceutics. 1999; 47:33–38.
Wheatley T.A., Steuernagel C.R., Latex emulsion for controlled drug delivery. Aqueous
polymeric coatings for pharmaceutical dosage forms. J.W. Mc Ginity, Editor. 1997; Marcel
Dekker: New York.
Yin C., Li X. Anomalous diffusion of drug release from a slab matrix: Fractional diffusion
models, International Journal of Pharmaceutics. 2011; 418:78-87.
Zaky A., Elbakry A., Ehmer A., Breunig M., Goepferich A. The mechanism of protein release
from triglyceride microspheres. Journal of Controlled Release. 2010; 147:202-210.
Zeitler J.A., Shen Y., Baker C., Taday P.F., Pepper M., Rades T. Analysis of coating structures
and interfaces in solid oral dosage forms by three dimensional terahertz pulsed imaging.
Journal of Pharmaceutical Sciences. 2007a; 96:330-340.
Zeitler J.A., Taday P.F., Newnham D.A., Pepper M., Gordon K.C., Rades, T. Terahertz pulsed
spectroscopy and imaging in the pharmaceutical setting-a review. Journal of Pharmacy and
Pharmacology. 2007b; 59, 209-223.
Zhong S., Shen Y.C., Ho L., et al. Non-destructive quantification of pharmaceutical tablet
coatings using terahertz pulsed imaging and optical coherence tomography. Optics and
Lasers in Engineering. 2011;49:361–365.

Chapter 4 : In-silico simulation of niacin release from lipid tablets
64
4. In-silico simulation of niacin release from lipid
tablets:
Theoretical predictions and independent
experiments

Chapter 4 : In-silico simulation of niacin release from lipid tablets
65
4.1. Materials and methods
4.1.1. Materials
Niacin (Sigma-Aldrich, Steinheim, Germany); glyceryl dibehenate (Compritol® 888;
Gattefosse, Saint Priest, France); lactose (monohydrate, Flowlac 100; Meggle, Wasserburg,
Germany); magnesium stearate (Fagron, Waregem, Belgium).
4.1.2. Tablet preparation
Direct Compression: Niacin, lactose and glyceryl dibehenate powders were sieved (0.71 mm)
and blended: 10 min manually using a pestle and mortar, followed by 15 min with a turbula
mixer at 64 rpm (Bachoven, Basle, Switzerland). Magnesium stearate was added and the
powders were further blended in the turbula mixer for 2 min. The percentages of lactose
and magnesium stearate were kept constant in all formulations: 12.4 and 0.5 % (w:w),
respectively. The niacin:lipid ratios were varied as indicated. The blends were compressed
on a single punch tableting machine (EK 0, Korsch, Berlin, Germany), equipped with flat-
faced punches. The tablet diameter and height were varied as indicated. The tablet weight
(500 mg) and hardness (60 N, Dr. Schleuniger Pharmatron, Solothurm, Switzerland) were
kept constant.
Hot-melt extrusion/grinding/compression: Niacin and glyceryl dibehenate powders were
sieved (0.71 mm) and blended: 10 min manually using a pestle and mortar, followed by
15 min with a turbula mixer at 64 rpm (Bachoven). The blend ratio was varied as indicated.
The mixtures were hot-melt extruded using a Leistritz “Nano 16” apparatus (Leistritz,
Nuremberg, Germany), equipped with a co-rotating twin screw (diameter = 16 mm,
5 heating zones, kneading elements in zones 2 and 3, diameter of the die orifice = 1 mm).
The screw speed and feeding rate were kept constant at 50 rpm and 5 mL/min, respectively.
The feeding zone (zone 1) was kept at room temperature. The temperature of zones 2 to 5
was: 60, 60, 60, and 65°C, respectively (the melting point of the lipid being equal to 70 °C).
The extrudates were air-cooled and manually ground using a pestle and mortar for 10 min.

Chapter 4 : In-silico simulation of niacin release from lipid tablets
66
The obtained powder was sieved (0.71 mm) and blended with sieved lactose (0.71 mm). The
mixture was blended manually using a pestle and mortar for 10 min, followed by 15 min in a
turbula mixer (64 rpm, Bachoven). Magnesium stearate was added, and mixing was
continued for 2 min. The percentages of lactose and magnesium stearate were kept constant
in all formulations: 12.4 and 0.5 % (w:w), respectively. The obtained powder blend was
compressed using a single punch tableting machine (EK 0), as described above.
4.1.3. Tablet characterization
In vitro niacin release from the lipid tablets was measured using the USP 35 paddle
apparatus (900 mL, 0.1 N HCl; 37 °C; 100 rpm; n=6) (Sotax, Basle, Switzerland). At
predetermined time points, 3 mL samples were withdrawn (not replaced), filtered (0.45 µm)
and analyzed UV-spectrophotometrically (=261.0 nm; Shimadzu UV-1650PC, Shimadzu
France, Champs-sur-Marne, France). The tablet dimensions (diameter and height) and
potential dynamic changes thereof upon exposure to the release medium were measured
using a thickness gauge (samples were treated as for the in vitro vitamin release
measurements). The tablet morphology was observed with an optical image analysis system
(Nikon SMZ-U; Nikon, Tokyo, Japan), equipped with a Zeiss camera (AxioCam ICc 1, Zeiss,
Jena, Germany) before and after exposure to the release medium (under the same
conditions as described above).
4.1.4. Equilibrium solubility measurements
The equilibrium solubility of niacin powder (as received) was determined in agitated flasks in
0.1 M HCl. Excess amounts of niacin were exposed to 100 mL medium at 37°C under
horizontal shaking (80 rpm, GFL 3033; Gesellschaft fuer Labortechnik, Burgwedel, Germany).
Every 24 h, samples were withdrawn, filtered and analyzed by UV-spectroscopy for their
vitamin content (as described above) until equilibrium was reached. Each experiment was
conducted in triplicate.

Chapter 4 : In-silico simulation of niacin release from lipid tablets
67
4.2. Results and discussion
4.2.1. Model development
A mechanistically realistic mathematical model should be based on a thorough physico-
chemical characterization of the respective dosage form before and after exposure to the
release medium. Crucial features to be studied include potential changes in the system’s
geometry and size (e.g. due to device disintegration and/or dissolution), limited
drug/vitamin solubility effects (within the dosage form and/or the surrounding bulk fluid) as
well as time- and/or position-dependent changes in the conditions for mass transport (e.g.
due to excipient swelling). Figure 11 shows macroscopic pictures of glyceryl dibehenate-
based tablets loaded with 30 % niacin before and after 24 h exposure to 0.1 N HCl at 37 °C.
The tablets on the left hand side were prepared by direct compression, the tablets on the
right hand side by hot-melt extrusion/grinding/compression. These pictures are
representative for all other investigated formulations (data not shown). Clearly, the tablets
remained intact during the observation period and did not swell. Upon exposure to the
release medium the systems became more and more porous.

Chapter 4 : In-silico simulation of niacin release from lipid tablets
68
Figure 11: Macroscopic pictures of niacin-loaded, glyceryl dibehenate-based tablets prepared
by direct compression or hot-melt extrusion/grinding/compression before and after 24 h
exposure to the release medium (30 % initial vitamin loading).
The fact that the size and geometry of the tablets did not change during vitamin release is
very important information, allowing for a significant simplification of the mathematical
description of mass transport: The lengths of the pathways to be overcome remain
unaltered during vitamin release, and various symmetries can be considered. The symbols in
Figures 12 and 13 illustrate the experimentally determined niacin release kinetics from
glyceryl dibehenate-based tablets prepared by direct compression (figure 12) or hot-melt
extrusion/grinding/compression (figure 13). The diagrams on the left hand side show the
relative vitamin release rates, the diagrams on the right hand side the respective absolute
niacin release rates. Clearly, the slope of the release curves continuously decreases with
time (vitamin release slows down), irrespective of the type of preparation method.
Comparing figures 12 and 13, it becomes evident that niacin release from tablets prepared
by hot-melt extrusion/grinding/compression was much slower than from tablets of identical
composition, but prepared by direct compression, irrespective of the initial vitamin loading
(note the different scaling of the x-axes). For both types of preparation methods the relative
direct compression hot-melt extrusion/
grinding/compression
t = 0
t= 24 h

Chapter 4 : In-silico simulation of niacin release from lipid tablets
69
and absolute release rate increased with increasing initial niacin content (figures 12 and 13).
The solubility of niacin in the release medium at 37 °C was determined to be equal to
32.3 mg/mL, perfect sink conditions were maintained throughout all release experiments
Figure 12: Effects of the initial niacin loading (indicated in the diagrams) on vitamin release
from glyceryl dibehenate-based tablets prepared by direct compression on the resulting: (a)
relative vitamin release rates, and (b) absolute vitamin release rates. The symbols represent
the experimental results, the curves the fitted theory (Eqs. 1-6).
a)
b)

Chapter 4 : In-silico simulation of niacin release from lipid tablets
70
Figure 13: Effects of the initial niacin loading (indicated in the diagrams) on vitamin release
from glyceryl dibehenate-based tablets prepared by hot-melt
extrusion/grinding/compression on the resulting: (a) relative vitamin release rates, and (b)
absolute vitamin release rates. The symbols represent the experimental results, the curves
the fitted theory (Eqs. 1-6).
a)
b)

Chapter 4 : In-silico simulation of niacin release from lipid tablets
71
Based on these experimental results, the following model assumptions were defined:
The tablets are cylindrical in shape, mass transport takes place in axial and radial
direction.
The tablet dimensions remain unaltered during vitamin release (stationary boundary
conditions).
Niacin dissolved in the bulk fluid does not hinder the release of vitamin remaining in
the lipid tablets.
The diffusion of niacin within the lipid tablets (through water-filled pores) is the
dominant mass transport step, and this process is affected by the limited solubility of
the vitamin in the low amounts of water present within the tablets. The rational for
this hypothesis is as follows: Upon exposure to the bulk fluid, three phenomena
occur in a sequence: (1) The release medium penetrates into the system. (2) The
vitamin particles dissolve in this liquid. (3) Dissolved niacin diffuses out of the lipid
matrices, through water-filled channels and pores (since the lipid is in a crystalline
state, vitamin diffusion through glyceryl dibehenate plates is highly unlikely). The
process of vitamin dissolution (Siepmann, 2013) can be expected to be rapid
compared to the two diffusional mass transport steps. In this study, the diffusion of
the vitamin through the pores within the lipid matrix is assumed to be slower than
water penetration into the system. Since the three processes occur in a sequence,
and since niacin diffusion is considered to be the slowest mass transport step, the
overall mass transport rate can be approximated by the diffusion rate of dissolved
niacin through the porous lipid matrix (Siepmann, 2012). Importantly, the amount of
water penetrating into the lipid matrix is very limited and the investigated niacin
loadings are relatively high. Thus, not all of the vitamin can be expected to be
immediately available for diffusion: Dissolved and non-dissolved niacin are
considered to co-exist in the tablets.
The mass transfer resistance due to the existence of a liquid, unstirred boundary
layer surrounding the tablets is considered negligible compared to the mass
transport resistance within the tablets.
The vitamin and lipid powders are initially homogeneously distributed throughout

Chapter 4 : In-silico simulation of niacin release from lipid tablets
72
the tablets.
Based on these assumptions, a solution of Fick’s second law of diffusion can be derived,
considering the given initial and boundary conditions (this means the conditions given
before exposure to the release medium and the conditions given at the edges of the tablets
during niacin release). Since limited vitamin solubility within the matrix is considered (co-
existence of dissolved and non-dissolved niacin), the model could not be solved analytically,
but was solved numerically. For details, the reader is referred to the literature (Crank, 1975 ;
Smith, 1985), and only the key equations are briefly described in the following.
Fick’s law considering axial and radial diffusion in cylinders can be written as (Crank, 1975):
z
cDr
zθ
c
r
D
θr
cDr
rr
1
t
c (1)
where c is the concentration of dissolved niacin, which is dependent on time and position
within the cylinder; t represents time; r, z denote the radial and axial coordinates and the
angle perpendicular to the r-z-plane; D is the apparent diffusion coefficient of the vitamin
within the tablet. The center of the cylinder is located at r = 0, z = 0 and = 0. The tablet
radius is R, the tablet half-height is Z. To reduce the calculation time, several system
symmetries were considered, namely the symmetry at the z = 0 plane and the rotational
symmetry of the tablets around the z-axis. Thus, it is sufficient to calculate the mass
transport in only one quarter of a vertical cross-section of the tablets going through the
center: Upon rotation around the z-axis, the mass transport in half of the cylinder can be
calculated and due to the z = 0 symmetry plane, vitamin diffusion in the entire tablet can be
calculated.
The initial condition expresses the fact that the niacin concentration within the tablets is
homogeneous throughout the system and equal to its initial concentration, cini:
t=0 c= cini 0 r R 0 z Z (2)

Chapter 4 : In-silico simulation of niacin release from lipid tablets
73
The perfect sink boundary conditions read as follows:
t>0 c=0 0 r R z = Z (3)
t>0 c=0 0 z Z r = R (4)
Due to the symmetries at z = 0 and r = 0, there are no concentration gradients at z = 0 for 0
r R, and at r = 0 for 0 z Z:
t>0 0z
c
0 r R z=0 (5)
t>0 0r
c
0 z Z r=0 (6)
In order to calculate the niacin concentration at each time point and every position in the
tablets, the above described 2-dimensional rectangle was divided into small pixels,
introducing I and J space intervals, r and z, and generating a grid of (I+1)x(J+1) grid points.
The release time was divided into g time intervals t (for most of the simulations I= J= 50
and g= 500,000 were chosen). At t = 0 (before exposure to the release medium), the niacin
concentration was known from the initial vitamin loading and the system’s dimensions.
Using Eqs. 1-6, the concentration profiles of niacin at a new time step (t= 0+t) was
calculated, based on the concentration profiles at the previous time step (t= 0): The
concentration at a certain inner grid point (ixr, jxz) at a new time step (t= t0+t) was
calculated from its concentrations at the same grid point (ixr, jxz) and the four direct
neighbors [(i-1)xr, jxz; ixr, (j-1)xz; ixr, (j+1)xz; (i+1)xr, jxz] at the previous time
step (t= 0). The respective concentrations at outer grid points (i= 0 v i= I v j= 0 v j= J) at a new
time step (t= 0+t) were calculated using the boundary conditions (Eqs. 3-6). As the initial
niacin concentration was known, the concentration profiles at t= 0+t, t= 0+2t,
t= 0+3t,..., t= 0+gt could be calculated sequentially. Importantly, at each time point the
vitamin concentration at a given position is compared to the niacin solubility: If the latter is
exceeded, the excess amount of vitamin is considered to be non-dissolved and not available
for diffusion. If the vitamin concentration is equal to or below niacin solubility, all of the
niacin is considered to be available for diffusion at this position and this time point. The
determined apparent diffusion coefficients are time- and position-averaged parameters. For
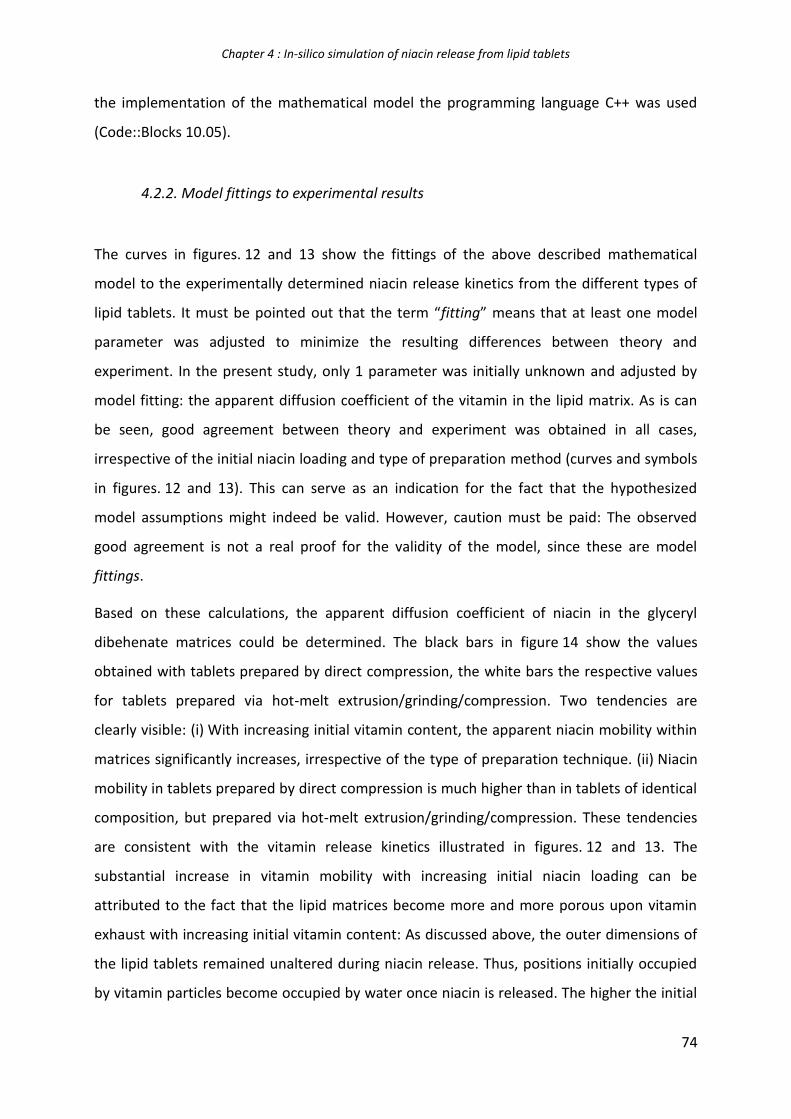
Chapter 4 : In-silico simulation of niacin release from lipid tablets
74
the implementation of the mathematical model the programming language C++ was used
(Code::Blocks 10.05).
4.2.2. Model fittings to experimental results
The curves in figures. 12 and 13 show the fittings of the above described mathematical
model to the experimentally determined niacin release kinetics from the different types of
lipid tablets. It must be pointed out that the term “fitting” means that at least one model
parameter was adjusted to minimize the resulting differences between theory and
experiment. In the present study, only 1 parameter was initially unknown and adjusted by
model fitting: the apparent diffusion coefficient of the vitamin in the lipid matrix. As is can
be seen, good agreement between theory and experiment was obtained in all cases,
irrespective of the initial niacin loading and type of preparation method (curves and symbols
in figures. 12 and 13). This can serve as an indication for the fact that the hypothesized
model assumptions might indeed be valid. However, caution must be paid: The observed
good agreement is not a real proof for the validity of the model, since these are model
fittings.
Based on these calculations, the apparent diffusion coefficient of niacin in the glyceryl
dibehenate matrices could be determined. The black bars in figure 14 show the values
obtained with tablets prepared by direct compression, the white bars the respective values
for tablets prepared via hot-melt extrusion/grinding/compression. Two tendencies are
clearly visible: (i) With increasing initial vitamin content, the apparent niacin mobility within
matrices significantly increases, irrespective of the type of preparation technique. (ii) Niacin
mobility in tablets prepared by direct compression is much higher than in tablets of identical
composition, but prepared via hot-melt extrusion/grinding/compression. These tendencies
are consistent with the vitamin release kinetics illustrated in figures. 12 and 13. The
substantial increase in vitamin mobility with increasing initial niacin loading can be
attributed to the fact that the lipid matrices become more and more porous upon vitamin
exhaust with increasing initial vitamin content: As discussed above, the outer dimensions of
the lipid tablets remained unaltered during niacin release. Thus, positions initially occupied
by vitamin particles become occupied by water once niacin is released. The higher the initial

Chapter 4 : In-silico simulation of niacin release from lipid tablets
75
vitamin content, the higher the resulting porosity. Consequently, the vitamin mobility in the
lipid matrices increases with increasing initial niacin loading. Note that the D values are time-
and position-averaged parameters. Importantly, the following quantitative empirical
relationships could be established between the apparent niacin diffusivity in the lipid tablets
and the initial vitamin content:
In the case of tablets prepared by direct compression:
(7)
In the case of tablets prepared via hot-melt extrusion/grinding/compression:
(8)
These equations allow calculating the vitamin diffusivities for arbitrary initial niacin loadings for both types of preparation techniques.
Figure 14: Dependence of the apparent niacin diffusion coefficient in glyceryl dibehenate-
based tablets on the type of preparation technique and initial vitamin content.
direct compression
hot-melt extrusion/grinding/compression

Chapter 4 : In-silico simulation of niacin release from lipid tablets
76
The fact that vitamin mobility is much higher in lipid tablets prepared by direct compression
than in tablets prepared via hot-melt extrusion/grinding/compression can be explained as
follows: During hot-melt extrusion a much more intense embedding of the niacin particles
with lipid mass can be expected, since the temperature is elevated, high shear forces are
acting and the vitamin and lipid are intensively mixed. Consequently, the geometry and size
of the pores through which the niacin has to diffuse (once dissolved) is likely to be
substantially different (e.g., increased tortuosity and length of the pathways to be
overcome).
4.2 3. Deeper insight into vitamin release mechanisms
Based on these observations and calculations, the relative importance of “niacin diffusion
through the porous lipid matrix” versus “limited niacin solubility within the tablets” can be
estimated. Knowing the apparent diffusion coefficient of the vitamin in the tablets, Eqs. 1-6
can be used to calculate the resulting niacin concentration distance profiles within the
systems at any time point. The scheme in figure 15 illustrates the view points used for the
presentation of such concentration distance profiles shown in figure 16. A cross-section is
made through the center of a cylindrical tablet, perpendicular to the circular surfaces. The
diagrams in figure 16 show the 3-dimensional total niacin concentration distance profiles
calculated after 6, 12 and 24 h exposure to the release medium. The view point for these
diagrams is illustrated by the solid eye in figure 5. Tablets prepared by direct compression
are shown on the left hand side, tablets prepared via hot-melt
extrusion/grinding/compression are illustrated on the right hand side. The total vitamin
concentration is plotted in mg/mL on the vertical axes, the radial and axial positions are
plotted on the other two axes, as indicated in figure 15. The total vitamin concentration at a
specific position is the sum of the concentration of dissolved niacin (being available for
diffusion) and non-dissolved niacin (not being available for diffusion). At the top of each
diagram, a 2-dimensional projection of the 3-dimensional concentration distance profiles is
given. The view point for these projections is illustrated by the dotted eye in figure 15.

Chapter 4 : In-silico simulation of niacin release from lipid tablets
77
Figure 15: Schematic representation of the viewpoints used in Figure 6 to illustrate the time-
dependent changes in the niacin concentration distance profiles within the glyceryl
dibehenate-based tablets upon exposure to the release medium. The solid eye shows the
viewpoint for the 3-dimensional concentration distance profiles, the dotted eye the viewpoint
for the 2-dimensional projections shown at the top of each diagram in figure 16.
Clearly, extremely steep concentration gradients exist within the tablets, irrespective of the
selected time point and type of preparation technique. Zooms on the lower concentration
ranges of these diagrams are shown in figure 17. The solubility of niacin in the release
medium was determined to be 32.3 mg/mL.

Chapter 4 : In-silico simulation of niacin release from lipid tablets
78
Figure 16: Dynamic changes in the total niacin concentration distance profiles within glyceryl
dibehenate-based tablets prepared by direct compression (left hand side) or hot-melt
extrusion/grinding/compression (right hand side) upon exposure to the release medium. The
initial vitamin content was 30 %. The view points are schematically illustrated in figure 15. At
the top of each diagram, a 2-dimensional projection of the respective concentration profile is
shown. The color scales are given on the right hand side. The exposure times to the release
medium are indicated on the left hand side. Zooms on lower vitamin concentrations are
shown in figure 17.
direct compression
hot-melt extrusion/grinding/compression
6 h
12 h
24 h

Chapter 4 : In-silico simulation of niacin release from lipid tablets
79
Looking at figures 16 and 17 it becomes obvious that the limited amount of water available
in the lipid tablets can only dissolve a small part of the vitamin present in the system. Most
of the niacin is not dissolved and not available for diffusion. The front separating the zone of
the tablet containing both, dissolved and non-dissolved vitamin, from the zone of the tablet
containing only dissolved niacin can be called “dissolution front”. This front steadily moves
inwards, towards the center of the tablets. Importantly, net diffusional mass transport of
niacin in the tablets only takes place between this dissolution front and the edges of the
tablets. Within the saturated center, the concentration of dissolved niacin is always equal to
the solubility of the vitamin. Thus, there is no concentration gradient of dissolved vitamin
and, hence, no net mass flux. The concentration gradients of dissolved niacin illustrated in
figure 17 clearly show that with time the driving forces for niacin release decrease: The
lengths of the diffusion pathways monotonically increase, while the concentration difference
remains unaltered (saturated solution versus perfect sink). This is consistent with the
observed monotonically decreasing niacin release rates shown in figures 12 and 13.
Comparing the left and right hand sides of figures. 16 and 17, it becomes obvious that the
dissolution front movement is much more rapid in tablets prepared by direct compression
than in tablets prepared via hot-melt extrusion/grinding/compression. This is due to the
much higher niacin mobility in these systems, as discussed above (see also figure. 14).
Interestingly, close to the center of the tablets a large excess of niacin still exists at late time
points, when vitamin release is almost complete. In contrast, most of the niacin is released
from the surface-near regions of the system. Note that figures 16 and 17 only show a few
examples of concentration distance profiles in tablets with an initial vitamin loading of 30 %,
but the tendencies are similar in all other systems. With increasing initial vitamin loading,
the rate at which the dissolution front moves towards the center of the tablet increases,
irrespective of the type of preparation technique.

Chapter 4 : In-silico simulation of niacin release from lipid tablets
80
direct compression
hot-melt extrusion/grinding/compression
6 h
12 h
24 h
Figure 17: Zooms on the lower niacin concentrations of the diagrams shown in figure 16.
A major key message from these in-silico simulations is that limited vitamin solubility is of
utmost importance in the investigated systems (in addition to niacin diffusion through
water-filled pores in the lipid matrix), and net vitamin transport does not occur all over the
tablets at the same time, but is restricted to specific, well-defined regions during major parts
of the release period.

Chapter 4 : In-silico simulation of niacin release from lipid tablets
81
4.2.4. Model predictions and independent experiments
As pointed out above, obtaining good agreement between a mathematical theory and
experimental results when fitting the model to the experimental data, is not a real proof for
the validity of the theory. A much more reliable evaluation of the validity of a mathematical
theory is based on the comparison of quantitative model predictions (e.g., concerning the
impact of a formulation or processing parameter on the resulting system properties) with
independent experiments (experiments, which were only performed after the in-silico
simulations were made). In these cases, deviations between theory and experiment are not
minimized by a fitting procedure. Also, in practice this type of in-silico simulations
(quantitative predictions of the impact of formulation and processing parameters) is highly
valuable, allowing for the substitution of time-intensive and costly series of experimental
studies by rapid computer calculations.
The dashed curves in figure 8 show the theoretically predicted release kinetics of niacin from
glyceryl dibehenate-based tablets initially containing 40 % vitamin, with a diameter of
11.3 mm and a height of 4.6 mm. Eqs. 1-6 were used for these calculations, the D values
were estimated from Eqs. 7-8. As expected, the theory predicts a much higher vitamin
release rate from tablets prepared by direct compression compared to systems prepared via
hot-melt extrusion/grinding/compression (for the reasons discussed above) as well as
monotonically decreasing release rates, irrespective of the type of preparation technique. To
evaluate the validity of these predictions, the respective tablets were prepared in a second
step and niacin release was measured experimentally (only after the predictions were
made). These independent experimental results are shown as symbols in figure 18.
Importantly, good agreement was obtained between the theoretical predictions and the
independent experiments, irrespective of the type of preparation technique. This indicates
that: (i) the theory is likely to be valid for the investigated lipid tablets, and (ii) in-silico
simulations can help saving time and reducing costs during product development.

Chapter 4 : In-silico simulation of niacin release from lipid tablets
82
Figure 18: Theoretical predictions (dashed curves) and independent experiments (symbols):
Impact of the tablet composition and type of manufacturing procedure on niacin release
from glyceryl dibehenate-based tablets with an initial loading of 40 %, prepared by direct
compression (upper curve) or hot-melt extrusion/grinding/compression (lower curve). The
tablet diameter was 11.3 mm, the tablet height 4.6 mm.
Further examples for quantitative model predictions and independent experiments are
illustrated in figure 19: The dashed curves in the diagram on the left hand side represent the
theoretically predicted impact of varying the tablet height of glyceryl dibehenate-based
tablets from 2.5 to 7.5 mm, while keeping the tablet diameter constant at 11.3 mm. The
initial vitamin loading was 35 %, the tablets were prepared by direct compression in these
cases. Again, Eqs. 1-6 were used for the in-silico simulations and Eq. 7 for the estimation of
the apparent niacin diffusion coefficient. Clearly, the model predicts decreasing relative
vitamin release rates with increasing tablet height, which can be attributed to the decreasing
surface area:volume ratio. Importantly, independent experiments confirmed all model
predictions (symbols versus dashed curves in figure 19a). The theoretically predicted impact
of varying the diameter of glyceryl dibehenate-based tablets from 7.0 to 16.0 mm is
illustrated by the dashed curves in figure 19b. In these cases, the tablet height was constant
(5 mm), the initial vitamin loading was 25 %, and the systems were prepared by direct

Chapter 4 : In-silico simulation of niacin release from lipid tablets
83
compression. Again, a decrease in the relative release rate is predicted with increasing
system dimension (due to the decreasing surface area:volume ratio). Interestingly, the
expected decrease in the relative release rate is less pronounced compared to the decrease
upon varying the tablet height shown in figure 19a. This can be explained by the less
pronounced reduction in the surface area:volume ratio of the tablets in these cases: by 33 %
in figure 19b compared to 46 % in figure 19a. Importantly, these predicted moderate effects
on the resulting vitamin release rates were again confirmed by independent experiments
(symbols in figure 19b). This further confirms the validity of the presented mathematical
model and demonstrates its practical usefulness.

Chapter 4 : In-silico simulation of niacin release from lipid tablets
84
Figure 19: Theoretical predictions (dashed curves) and independent experiments (symbols):
Impact of the tablet dimensions and composition on niacin release from glyceryl dibehenate-
based tablets with: a) a height of 2.5, 5.0 or 7.5 mm, a constant diameter of 11.3 mm, and an
initial vitamin loading of 35 %, and b) a diameter of 7.0, 11.3 or 16.0 mm, a constant height
of 5 mm and an initial vitamin loading of 25 %. The tablets were prepared by direct
compression.
Chapter 4 : In-silico simulation of niacin release from lipid tablets
85
4.3. Conclusion
In-silico simulations of lipid tablets using mechanistically realistic mathematical theories can
help understanding how vitamin release is controlled and can very much facilitate the
optimization of this type of advanced delivery systems.

Chapter 5 : Viscosity grade of guar gum for ethanol resistant coated pellets
86
5. Investigation of the viscosity grade of guar gum in polymer blends to overcome ethanol
sensitivity of ethylcellulose-based coated pellets.

Chapter 5 : Viscosity grade of guar gum for ethanol resistant coated pellets
87
5.1. Materials and Methods
5.1.1. Materials
Theophylline matrix pellets (70 % drug content, diameter: 0.71-1.25 mm; FMC BioPolymer,
Philadelphia, PA, USA); Ethylcellulose Aqueous Dispersion NF (Aquacoat® ECD 30; FMC
BioPolymer); dibutyl sebacate (DBS; Morflex, Greensboro, NC, USA); ethanol (Fisher Bioblock
Scientific, Illkirch, France); low viscosity guar gum (low guar gum, apparent viscosity of a 1
% aqueous guar gum solution = 52 cPs; TIC Pretested Gum Guar TICOLV FCC Powder; TIC
Gums); medium viscosity guar gum (medium guar gum, apparent viscosity of a 1 %
aqueous guar gum solution = 320 cPs; Polygum 240/80; Polygal Trading, Maerstetten,
Switzerland). The apparent viscosities were measured using an AR2000Ex rheometer (TA
Instruments, New Castle, DE, USA) at a shear rate of 50 s-1 in a 1 % aqueous guar gum
solution measured rotationally at 20 °C after 1 min equilibration using a 6 cm acrylic cone
(1°), wherein the shear was ramped up linearly from 1 to 50 s-1 in 25 steps over 29 s.
5.1.2. Preparation and characterization of thin polymeric films
Aquacoat® ECD 30 was plasticized for 1 d with 25 % DBS (w/w; based on the ethylcellulose
mass). Guar gum (medium guar gum in all cases) was dissolved in purified water at 65 °C
(0.7 % or 1 % w/w, as indicated; 100 % reference value = total coating formulation; 2 h
stirring) and cooled down to room temperature. The two liquids were blended and stirred
for 30 min prior to use. Films were prepared by casting Aquacoat® ECD 30:guar gum blends
onto Teflon plates and subsequent controlled drying for 24 h at 60 °C.
The dry mass loss kinetics and changes in the (water + ethanol) content of the films upon
exposure to the release media were determined as follows: Pieces of 5 cm 5 cm were
placed into 100 mL plastic flasks filled with 100 mL pre-heated 0.1 M HCl:ethanol 60:40
(V/V), followed by horizontal shaking (37 °C, 80 rpm; GFL 3033, Gesellschaft fuer
Labortechnik, Burgwedel, Germany). At pre-determined time points, samples were
withdrawn, accurately weighed [wet mass (t)] and dried to constant mass at 60°C [dry mass

Chapter 5 : Viscosity grade of guar gum for ethanol resistant coated pellets
88
(t)]. The (water + ethanol) content (%) and dry film mass (%) at time t were calculated as
follows:
%100)t(masswet
)t(massdry)t(masswet)t((%)content)ethanolwater(
(1)
%100)0t(massdry
)t(massdry)t((%)massfilmdry
(2)
5.1.3. Pellet coating
Theophylline matrix cores were coated with Aquacoat® ECD 30:guar gum 85:15 blends (if not
otherwise stated). Aquacoat® ECD 30 was plasticized for 1 d with 25 % DBS (w/w; based on
the ethylcellulose mass). Guar gum (medium guar gum, if not otherwise stated) was
dissolved in purified water at 65 °C (0.7 % or 1 % w/w, as indicated; 100 % reference value =
total coating formulation; 2 h stirring) and cooled down to room temperature. The two
liquids were blended and stirred for 30 min prior to use. The coating dispersions were
sprayed onto theophylline pellets using a fluidized bed coater (Strea 1, Wurster insert; Niro;
Aeromatic-Fielder, Bubendorf, Switzerland). The process parameters were as follows: inlet
temperature = 38 °C, product temperature = 38 ± 2 °C, spray rate = 2g/min, atomization
pressure = 1.2 bar, nozzle diameter = 1.2 mm. After coating the pellets were further fluidized
for 10 min and subsequently cured for 24 h at 60 °C in an oven.
5.1.4. Drug release measurements
Theophylline release from coated pellets was measured in 0.1 M HCl or 0.1 M HCl: ethanol
60:40 (V/V), followed by phosphate buffer pH 7.4 (USP 36) using the USP 36 paddle
apparatus (Sotax, Basel, Switzerland) (900 mL, complete medium change after 2 h; 37 °C,
100 rpm, n = 3). At pre-determined time points, 3 mL samples were withdrawn and analyzed
UV-spectrophotometrically [ = 270.4 nm in 0.1 N HCl, = 272.2 nm in 0.1 M HCl:ethanol
60:40 (V/V) and phosphate buffer pH 7.4] (UV 1650 PC, Shimadzu, Champs-sur-Marne,

Chapter 5 : Viscosity grade of guar gum for ethanol resistant coated pellets
89
France). If indicated, the pellets were stored in open glass vials (no packing material) at
ambient conditions (25 °C and 60 % relative humidity) or stress conditions (40 °C and 75 %
relative humidity) prior to the measurements.
5.1.5. SEM studies
The morphology of coated pellets was characterized using a cold field emission high
resolution scanning electron microscope (S-4700 Field Emission Gun; Hitachi, Hitachi High-
Technologies Europe, Krefeld, Germany). Samples were covered under vacuum with a
carbon layer.

Chapter 5 : Viscosity grade of guar gum for ethanol resistant coated pellets
90
5.2. Results and discussion
5.2.1. Ethylcellulose/guar gum ratio
Recently, ethanol-resistant drug release was reported from ethylcellulose:guar gum coated
pellets (Rosiaux et al., submitted). The blend ratio in that study was 85:15 or 90:10,
respectively. The presence of the ethanol insoluble guar gum effectively avoided undesired
ethylcellulose dissolution in ethanol-rich media. However, so far it is unclear what the
minimal guar gum content in the film coating is, required to provide ethanol-resistant drug
release kinetics.
In the present study, ethylcellulose was blended in various ratios with medium µ guar gum
and used to coat theophylline matrix cores. Figure 20 shows the resulting drug release
kinetics in: 0.1 M HCl for 2 h, followed by phosphate buffer pH 7.4 for 6 h (open symbols); or
0.1 M HCl:ethanol 60:40 for 2 h, followed by phosphate buffer pH 7.4 for 6 h (filled symbols).
Firstly, the drug release rate generally increased with increasing guar gum content,
irrespective of the type of release medium. This can be attributed to the higher permeability
of guar gum compared to ethylcellulose for the drug. Secondly, it can be seen that at low to
very low guar gum contents, the difference in drug release observed between ethanol-
containing and ethanol-free release media increased. This is likely due to the fact that too
small amounts of guar gum are not able to effectively prevent undesired ethylcellulose
dissolution in ethanol-rich media. Consequently, the permeability of the film coating
increases and drug release is accelerated in the presence of 40 % ethanol. The term
“ethanol-resistant” drug release might be defined as follows: A solid dosage form is called
“ethanol-resistant” (or “not sensitive to ethanol”), if the in vitro drug release data in 0.1 M
HCl is compared with and without 40% ethanol for 2 h at 37 °C and the difference
throughout the 2 h period in release profiles between the ethanol-free media and ethanol-
containing media is: i) < 15 %, when less than 20% of the drug is released in the ethanol-free
media, or ii) < 30 % when more than 20 % of the drug is released in ethanol-free media.
According to this definition all pellets coated with ethylcellulose:guar gum blends containing
more than 5 % guar gum exhibited ethanol-resistant drug release (Figure 20).

Chapter 5 : Viscosity grade of guar gum for ethanol resistant coated pellets
91
Figure 20. Impact of the ethylcellulose:guar gum blend ratio (indicated in the diagrams) on
the sensitivity of drug release to ethanol: Theophylline release from pellets (15 % coating
level) in 0.1 M HCl for 2 h, followed by phosphate buffer pH 7.4 (open symbols) or 0.1 M
HCl:ethanol 60:40 for 2 h, followed by phosphate buffer pH 7.4 (filled symbols).
0
25
50
75
100
0 2 4 6 8
time, h
dru
g r
ele
as
ed
, %
0.1 M HCl:ethanol 60:40
0.1 M HCl
0
25
50
75
100
0 2 4 6 8
time, h
dru
g r
ele
as
ed
, %
0.1 M HCl:ethanol 60:40
0.1 M HCl
0
25
50
75
100
0 2 4 6 8
time, h
dru
g r
ele
as
ed
, %
0.1 M HCl:ethanol 60:40
0.1 M HCl
0
25
50
75
100
0 2 4 6 8
time, h
dru
g r
ele
as
ed
, %
0.1 M HCl:ethanol 60:40
0.1 M HCl
0
25
50
75
100
0 2 4 6 8
time, h
dru
g r
ele
as
ed
, %
0.1 M HCl:ethanol 60:40
0.1 M HCl
0
25
50
75
100
0 2 4 6 8
time, h
dru
g r
ele
as
ed
, %
0.1 M HCl:ethanol 60:40
0.1 M HCl
93:7 90:10
95:5 97:3
85:15 70:30

Chapter 5 : Viscosity grade of guar gum for ethanol resistant coated pellets
92
These findings are consistent with the experimentally measured dry mass loss kinetics of
thin, free films of identical composition as the investigated film coatings. Film pieces of 5 cm
x 5 cm were exposured to 0.1 M HCl:ethanol 60:40 (in horizontally shaken flasks at 80 rpm
and 37 °C). As it can be seen in Figure 21a, the dry mass loss of the systems containing 7, 10
or 15 % guar gum (referred to the total polymer mass) was very similar: The presence of the
guar gum effectively prevented undesired ethylcellulose dissolution even at high ethanol
contents of the release medium in all cases. Figure 21b shows the experimentally measured
(water + ethanol) contents of these films upon exposure to 0.1 M HCl:ethanol 60:40 at 37 °C.
As it can be seen, there is a slight increase in the liquid uptake of the films with increasing
guar gum content. This is probably due to a higher uptake of water by the more hydrophilic
guar gum compared to ethylcellulose. The observed tendency is also consistent with the
above discussed effects on drug release (irrespective of the presence/absence of ethanol in
the bulk fluid): The release rate generally increased with increasing guar gum content, which
can at least partially be attributed to increased water uptake, resulting in higher
macromolecular mobility and, thus, higher permeability of the film for the drug.

Chapter 5 : Viscosity grade of guar gum for ethanol resistant coated pellets
93
0
25
50
75
100
0 0.5 1 1.5 2
time, h
dry
film
ma
ss
, %
93:7
90:10
85:15
0
25
50
75
100
0 0.5 1 1.5 2
time, h
(wa
ter
+ e
tha
no
l) c
on
ten
t, %
85:15
90:10
93:7
Figure 21: Effects of the ethylcellulose:guar gum blend ratio (indicated in the diagrams) on
changes in the: a) dry mass, and b) (water + ethanol) content of thin, free films upon
exposure to 0.1 M HCl:ethanol 60:40.
a)
b)
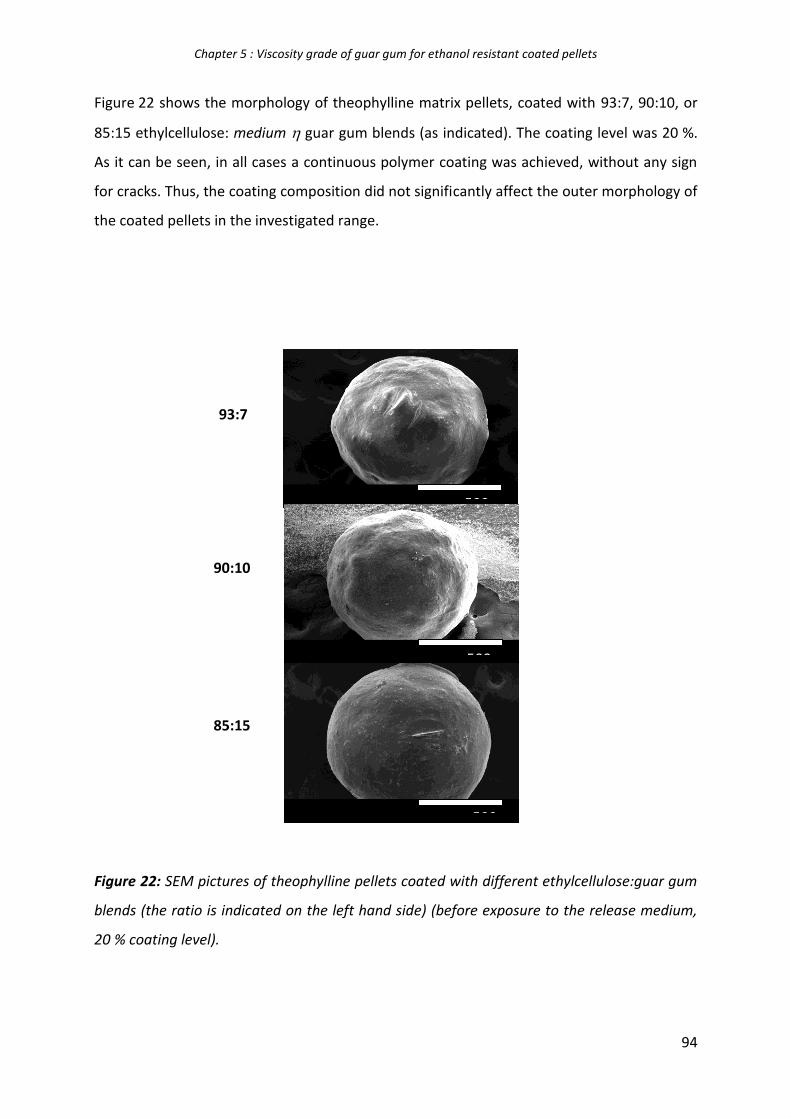
Chapter 5 : Viscosity grade of guar gum for ethanol resistant coated pellets
94
Figure 22 shows the morphology of theophylline matrix pellets, coated with 93:7, 90:10, or
85:15 ethylcellulose: medium guar gum blends (as indicated). The coating level was 20 %.
As it can be seen, in all cases a continuous polymer coating was achieved, without any sign
for cracks. Thus, the coating composition did not significantly affect the outer morphology of
the coated pellets in the investigated range.
Figure 22: SEM pictures of theophylline pellets coated with different ethylcellulose:guar gum
blends (the ratio is indicated on the left hand side) (before exposure to the release medium,
20 % coating level).
500µm
500µm
500µm
85:15
93:7
90:10
Chapter 5 : Viscosity grade of guar gum for ethanol resistant coated pellets
95
5.2.2. Guar gum concentration in the total dispersion
From a processing point of view the viscosity of the coating formulation, which is sprayed
onto the pellets, is of major importance. If the viscosity is too high, extensive sticking can
result. In contrast, too low viscosities can lead to very long processing times. However, so far
it is unknown whether the concentration of the guar gum in the coating formulation
(affecting the latter’s viscosity) does or does not impact the ethanol-resistance of the coated
pellets. In this study, two guar gum concentrations in the final coating dispersion were
compared: 0.7 and 1 % (w/w). The 100 % reference value is the total mass of the coating
dispersion. Figure 23 shows the experimentally measured drug release kinetics from
theophylline loaded pellets coated with 90:10 (top raw), or 85:15 (bottom raw)
ethylcellulose:guar gum blends. In the left column, the guar gum concentration was 0.7 %, in
the right column 1 %. The open symbols indicate drug release in 0.1 M HCl for 2 h, followed
by phosphate buffer pH 7.4 for 6 h. The filled symbols show drug release in 0.1 M
HCl:ethanol 60:40 for 2 h, followed by phosphate buffer pH 7.4 for 6 h. Clearly, ethanol-
resistance was not affected by the investigated guar gum concentration in the coating
formulation: In all cases, the difference in theophylline release in media free of ethanol
versus media containing 40 % ethanol was only minor. Comparing the release profiles on the
left and on the right hand side, it can be seen that an increase in the guar gum concentration
in the coating dispersion (from 0.7 to 1 %) led to a slight decrease in the resulting
theophylline release rate, irrespective of the ethylcellulose:guar gum blend ratio. This slight
effect might be attributable to a somewhat denser polymer network structure, resulting
from a higher polymer concentration in the liquid deposited on the pellets’ surface during
coating.

Chapter 5 : Viscosity grade of guar gum for ethanol resistant coated pellets
96
Figure 23: Impact of the guar gum dilution (left versus right column) on theophylline release
from pellets coated with different ethylcellulose:guar gum blends (as indicated on the left
hand side) (coating level: 20 % w/w). Release medium: 0.1 M HCl for 2 h, followed by
phosphate buffer pH 7.4 (open symbols); or 0.1 M HCl:ethanol 60:40 for 2 h, followed by
phosphate buffer pH 7.4 (filled symbols).
0
25
50
75
100
0 2 4 6 8
time, h
dru
g r
ele
as
ed
, %
0.1 M HCl:ethanol 60:40
0.1 M HCl
0
25
50
75
100
0 2 4 6 8
time, h
dru
g r
ele
as
ed
, %
0.1 M HCl:ethanol 60:40
0.1 M HCl
0
25
50
75
100
0 2 4 6 8
time, h
dru
g r
ele
as
ed
, %
0.1 M HCl:ethanol 60:40
0.1 M HCl
0
25
50
75
100
0 2 4 6 8
time, h
dru
g r
ele
as
ed
, %
0.1 M HCl:ethanol 60:40
0.1 M HCl
0.7 % guar gum in total dispersion
1 % guar gum in total dispersion
90:10
85:15
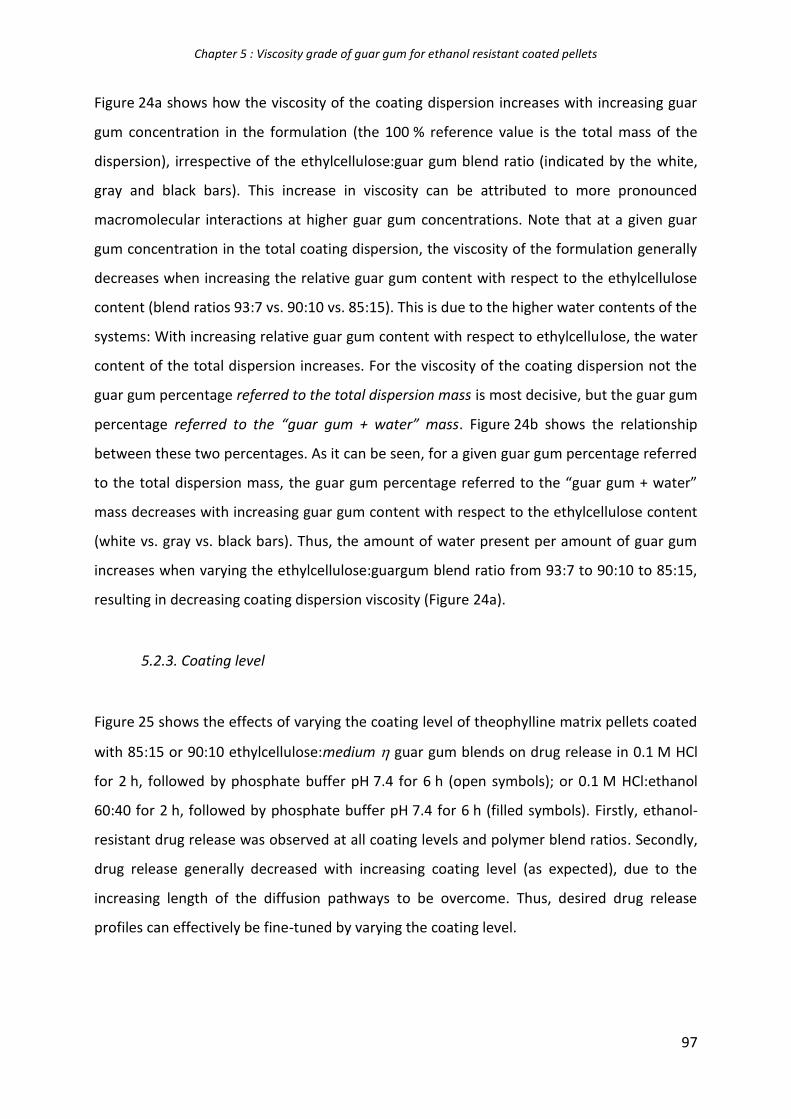
Chapter 5 : Viscosity grade of guar gum for ethanol resistant coated pellets
97
Figure 24a shows how the viscosity of the coating dispersion increases with increasing guar
gum concentration in the formulation (the 100 % reference value is the total mass of the
dispersion), irrespective of the ethylcellulose:guar gum blend ratio (indicated by the white,
gray and black bars). This increase in viscosity can be attributed to more pronounced
macromolecular interactions at higher guar gum concentrations. Note that at a given guar
gum concentration in the total coating dispersion, the viscosity of the formulation generally
decreases when increasing the relative guar gum content with respect to the ethylcellulose
content (blend ratios 93:7 vs. 90:10 vs. 85:15). This is due to the higher water contents of the
systems: With increasing relative guar gum content with respect to ethylcellulose, the water
content of the total dispersion increases. For the viscosity of the coating dispersion not the
guar gum percentage referred to the total dispersion mass is most decisive, but the guar gum
percentage referred to the “guar gum + water” mass. Figure 24b shows the relationship
between these two percentages. As it can be seen, for a given guar gum percentage referred
to the total dispersion mass, the guar gum percentage referred to the “guar gum + water”
mass decreases with increasing guar gum content with respect to the ethylcellulose content
(white vs. gray vs. black bars). Thus, the amount of water present per amount of guar gum
increases when varying the ethylcellulose:guargum blend ratio from 93:7 to 90:10 to 85:15,
resulting in decreasing coating dispersion viscosity (Figure 24a).
5.2.3. Coating level
Figure 25 shows the effects of varying the coating level of theophylline matrix pellets coated
with 85:15 or 90:10 ethylcellulose:medium guar gum blends on drug release in 0.1 M HCl
for 2 h, followed by phosphate buffer pH 7.4 for 6 h (open symbols); or 0.1 M HCl:ethanol
60:40 for 2 h, followed by phosphate buffer pH 7.4 for 6 h (filled symbols). Firstly, ethanol-
resistant drug release was observed at all coating levels and polymer blend ratios. Secondly,
drug release generally decreased with increasing coating level (as expected), due to the
increasing length of the diffusion pathways to be overcome. Thus, desired drug release
profiles can effectively be fine-tuned by varying the coating level.

Chapter 5 : Viscosity grade of guar gum for ethanol resistant coated pellets
98
Figure 24. Effects of the degree of dilution of the coating dispersion: a) dependence of the
viscosity of the applied formulation on the guar gum concentration in the dispersion (100 %
being the total dispersion mass), and b) relationship between the “percentage of guar gum,
100 % being the guar gum + water mass” and the “percentage of guar gum, 100 % being the
total dispersion mass”. The white, gray and black bars refer to ethylcellulose:guar gum 93:7,
90:10 and 85:15 (w:w) blends, respectively.
0.0
0.5
1.0
1.5
0.5 0.6 0.7 1
% g
ua
r g
um
(1
00
% =
gu
ar
gu
m +
wa
ter)
93:7
90:10
85:15
% guar gum (100 % = total dispersion)
b)
0
70
140
210
280
350
0.5 0.6 0.7 1
vis
co
sit
y, c
P
93:7
90:10
85:15
a)
% guar gum (100 % = total dispersion)

Chapter 5 : Viscosity grade of guar gum for ethanol resistant coated pellets
99
Figure 25: Impact of the coating level (indicated in the diagrams) on theophylline release
from pellets coated with: a) ethylcellulose:guar gum 85:15 (0.7 % guar gum in total
dispersion), or b) 93:7 (1 % guar gum in total dispersion) in 0.1 M HCl for 2 h, followed by
phosphate buffer pH 7.4 (open symbols); or 0.1 M HCl:ethanol 60:40 for 2 h, followed by
phosphate buffer pH 7.4 (filled symbols).
a)
b)
93:7
85:15
0
25
50
75
100
0 2 4 6 8
time, h
dru
g r
ele
as
ed
, %
10 % coating level
15 % coating level
20 % coating level
0
25
50
75
100
0 2 4 6 8
time, h
dru
g r
ele
as
ed
, %
10 % cl
15 % cl
20 % cl

Chapter 5 : Viscosity grade of guar gum for ethanol resistant coated pellets
100
5.2.4. Storage stability
When using polymeric film coatings for controlled drug delivery, stability during long term
storage is of outmost importance (Siepmann et al., 2008). Potential changes in the inner film
structure might lead to changes in the resulting drug release rates (Kucera et al., in press).
Importantly, the investigated film coatings based on ethylcellulose:guar gum blends were all
long term stable without packaging material (“open storage” in glass vials), irrespective of
the investigated polymer blend ratio, coating level, percentage of guar gum in the final
coating dispersion and storage conditions: ambient (25 °C and 60 % relative humidity) or
stress conditions (40 °C and 75 % relative humidity). Figures 26a and 26b just show a few
examples: The solid curves in figure 26a illustrate theophylline release from 93:7 pellets
coated with ethylcellulose:guar gum blends (20 % coating level) before storage, the dotted
curves show the respective release profiles after 6 months open storage under ambient
conditions. The release medium was 0.1 M HCl for the first 2 h, followed by phosphate
buffer pH 7.4 for the subsequent 6 h in this case. The solid curves in figure 26b illustrate drug
release from pellets coated with 15 or 20 % 85:15 ethylcellulose:guar gum blends before
storage. The dotted curves show drug release from these systems after 6 months open
storage under stress conditions. Here, the release medium was 0.1 M HCl:ethanol 60:40 for
the first 2 h, followed by phosphate buffer pH 7.4 for the subsequent 6 h. As it can be seen,
in all cases the solid and dotted curves are very similar, indicating good storage stability.

Chapter 5 : Viscosity grade of guar gum for ethanol resistant coated pellets
101
Figure 26: Storage stability (examples) of theophylline pellets coated with
ethylcellulose:guar gum blends: a) 93:7 blend ratio, 20 % coating level, before and after
6 months open storage under ambient conditions (25 °C and 60 % relative humidity), 2 h
exposure to 0.1 M HCl, followed by phosphate buffer pH 7.4; b) 85:15 blend ratio, 15 or 20 %
coating level (as indicated), before and after 6 months open storage under stress conditions
(40 °C and 75 % relative humidity), 2 h exposure to 0.1 M HCl:ethanol 60:40, followed by
phosphate buffer pH 7.4. The solid curves show drug release before storage, the dotted
curves after storage.
0
25
50
75
100
0 2 4 6 8
time, h
dru
g r
ele
as
ed
, %
20% coating level
25 °C/60 % RH
a) without ethanol
b)
0
25
50
75
100
0 2 4 6 8
time, h
dru
g r
ele
as
ed
, %
15% coating level
20% coating level
40 °C/75 % RH
with ethanol

Chapter 5 : Viscosity grade of guar gum for ethanol resistant coated pellets
102
5.2.5. Guar gum viscosity
It has recently been reported that blends of ethylcellulose with very low or low guar gum
were not able to provide ethanol-resistant drug release from coated pellets (Rosiaux et al.,
submitted). In contrast, blends of ethylcellulose with medium or high guar gum provided
ethanol-resistant theophylline from coated pellets. So far, it was unknown what the critical
guar gum viscosity might be, required to provide ethanol-resistant drug release. This is why
various blends of low and medium guar gum were prepared, exhibiting viscosities ranging
from 149 to 304 cP (Table 1). Ethylcellulose was mixed with these guar gum blends at a ratio
of 90:10. Theophylline matrix cores were coated with these blends (coating level = 20 %) and
drug release was measured in 0.1 M HCl for 2 h, followed by phosphate buffer pH 7.4 for 6 h
(open symbols); or 0.1 M HCl:ethanol 60:40 for 2 h, followed by phosphate buffer pH 7.4 for
6 h (filled symbols). Figure 27 shows some examples of the observed drug release profiles,
Table 1 indicates the amounts of drug released after 2 h exposure to 0.1 M HCl and the
differences to the amounts of drug released after 2 h exposure to 0.1 M HCl:ethanol 60:40.
As it can be seen, the previously reported trend has been confirmed: With decreasing guar
gum viscosity the ethanol sensitivity increases. According to the above mentioned definition,
the guar gum viscosity must be equal to or greater than 151.0 cP. The decrease in ethanol-
resistance with decreasing guar gum viscosity can probably at least partially be attributed
the lower polymer molecular weight of the guar gum, resulting in an decreased degree of
polymer-polymer chain entanglement: The shorter the guar gum chains, the less intensively
they are entangled with each other and with the ethylcellulose molecules present in the film
coating. Thus, the dissolution of the ethylcellulose in ethanol-containing media is less
effectively hindered.

Chapter 5 : Viscosity grade of guar gum for ethanol resistant coated pellets
103
Table 1: Impact of the guar gum viscosity on the ethanol-resistance of theophylline pellets
coated with 20 % 90:10 ethylcellulose:guar gum blends.
SD = standard deviation
Blend ratio (w:w)
medium low guar gum
Viscosity
SD of the guar gum blend (n = 3) (cP)
Drug release in 0.1 N HCl after 2 h (%)
Difference in drug release after 2 h exposure to “0.1 N HCl” versus “0.1 M HCl:ethanol 60:40” (%)
Ethanol sensitivity
90:10 303.5 2.1 52.9 5.9 No
80:20 276.0 1.4 63.6 5.3 No
75:25 260.0 7.2 49.8 8.8 No
70:30 234.0 7.6 48.1 4.9 No
50:50 173.6 3.1 40.1 14.3 No
47.5:52.5 160.0 6.2 51.4 15.1 No
45:55 151.0 2.7 45.6 25.1 No
40:60 148.5 2.1 37.9 42.1 Yes

Chapter 5 : Viscosity grade of guar gum for ethanol resistant coated pellets
104
0
25
50
75
100
0 2 4 6 8
time, h
dru
g r
ele
as
ed
, %
0.1 M HCl:ethanol 60:40
0.1 M HCl
0
25
50
75
100
0 2 4 6 8
time, h
dru
g r
ele
as
ed
, %
0.1 M HCl:ethanol 60:40
0.1 M HCl
0
25
50
75
100
0 2 4 6 8
time, h
dru
g r
ele
as
ed
, %
0.1 M HCl:ethanol 60:40
0.1 M HCl
0
25
50
75
100
0 2 4 6 8
time, h
dru
g r
ele
as
ed
, %
0.1 M HCl:ethanol 60:40
0.1 M HCl
0
25
50
75
100
0 2 4 6 8
time, h
dru
g r
ele
as
ed
, %
0.1 M HCl:ethanol 60:40
0.1 M HCl
0
25
50
75
100
0 2 4 6 8
time, h
dru
g r
ele
as
ed
, %
0.1 M HCl:ethanol 60:40
0.1 M HCl
Figure 27: Importance of the apparent viscosity of the guar gum (indicated in the diagrams)
used in 90:10 ethylcellulose:guar gum blends on theophylline release from coated pellets in
0.1 M HCl for 2 h, followed by phosphate buffer pH 7.4 (open symbols); or 0.1 M HCl:ethanol
60:40 for 2 h, followed by phosphate buffer pH 7.4 (filled symbols) (20 % coating level).
304 cP 276 cP
260 cP 234 cP
174 cP 149 cP

Chapter 5 : Viscosity grade of guar gum for ethanol resistant coated pellets
105
5.3. Conclusion
Appropriate blends of ethylcellulose and guar gum offer a great potential as controlled
release film coatings providing ethanol-resistant drug release. The risk of dose dumping due
to co-consumption of alcoholic beverages is likely to be effectively minimized. Important
formulation parameters to be considered during product development include: (i) the
amount of guar gum incorporated in the film coating (a minimum quantity being required to
avoid undesired ethylcellulose dissolution in ethanol-rich media), and (ii) the guar gum
viscosity (a minimum viscosity being required to assure sufficient polymer-polymer chain
entanglement).

Chapter 6 : Elucidation of the underlying mechanisms of ethanol resistant coated pellets
106
6. Elucidation of the underlying drug release mechanism of ethanol resistant coated pellets

Chapter 6 : Elucidation of the underlying mechanisms of ethanol resistant coated pellets
107
6.1. Materials and methods
6.1.1. Materials
Theophylline matrix pellets (70 % drug content, diameter: 0.71-1.25 mm; FMC BioPolymer,
Philadelphia, PA, USA); Ethylcellulose Aqueous Dispersion NF (Aquacoat® ECD 30; FMC
BioPolymer); dibutyl sebacate (DBS; Morflex, Greensboro, NC, USA); ethanol (Fisher Bioblock
Scientific, Illkirch, France); medium viscosity guar gum (medium guar gum, apparent
viscosity of a 1 % aqueous guar gum solution = 320 cPs; Polygum 240/80; Polygal Trading,
Maerstetten, Switzerland); high viscosity guar gum (high guar gum, apparent viscosity of a
1 % aqueous guar gum solution in the range of 575-625 cPs; Guar HV 225; Alland & Robert,
Port-Mort France, France). The apparent viscosities were measured using an AR2000Ex
rheometer (TA Instruments, New Castle, DE, USA) at a shear rate of 50 s-1 in a 1 % aqueous
guar gum solution measured rotationally at 20 °C after 1 min equilibration using a 6 cm
acrylic cone (1°), wherein the shear was ramped up linearly from 1 to 50 s-1 in 25 steps over
29 s.
6.1.2. Preparation and characterization of thin polymeric films
Aquacoat® ECD 30 was plasticized for 1 d with 25 % DBS (w/w; based on the ethylcellulose
mass). Guar gum was dissolved in purified water at 65 °C (2 h stirring) and cooled down to
room temperature. The two liquids were blended and stirred for 30 min prior to use. Films
were prepared by spraying (0.8 mm spray nozzle) or casting (as indicated)
Aquacoat® ECD 30:guar gum blends onto Teflon plates and subsequent controlled drying for
24 h at 60 °C.
The (water + ethanol) uptake and dry mass loss kinetics of the films were determined as
follows: Pieces of 5 cm 5 cm were placed into 100 mL plastic flasks filled with 100 mL pre-
heated release medium, followed by horizontal shaking (37 °C, 80 rpm; GFL 3033,
Gesellschaft fuer Labortechnik, Burgwedel, Germany). At pre-determined time points,
samples were withdrawn, accurately weighed [wet mass (t)] and dried to constant mass at
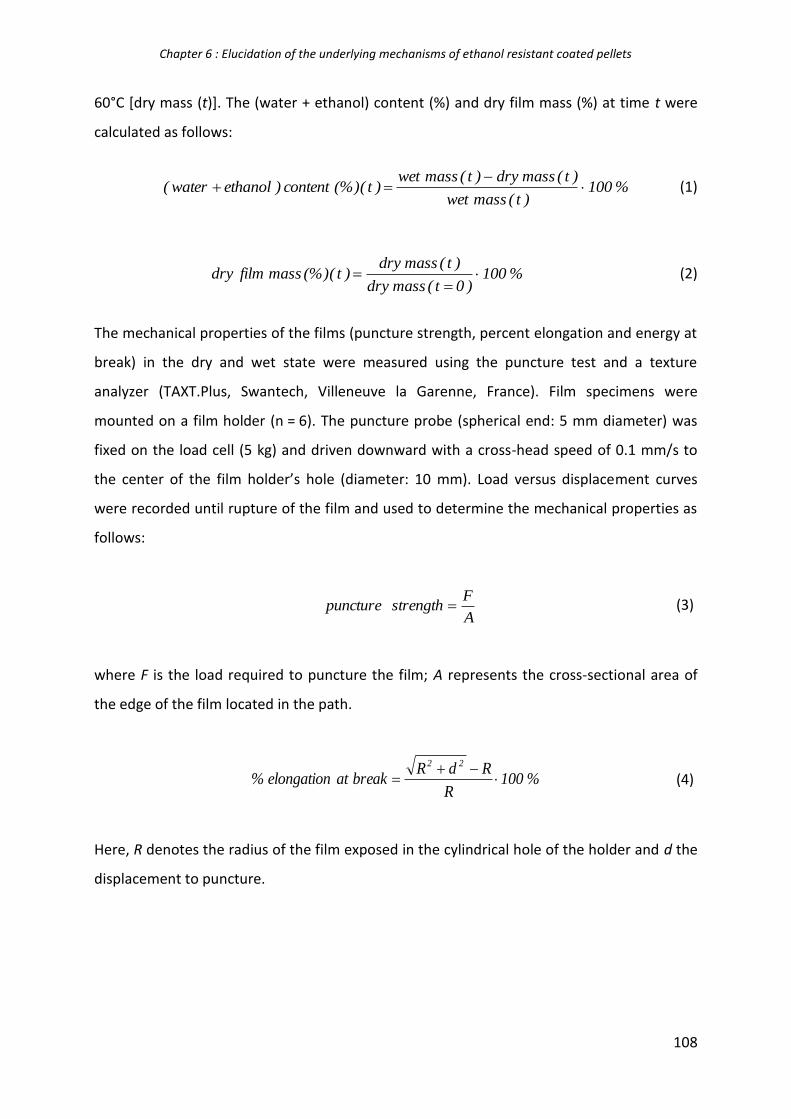
Chapter 6 : Elucidation of the underlying mechanisms of ethanol resistant coated pellets
108
60°C [dry mass (t)]. The (water + ethanol) content (%) and dry film mass (%) at time t were
calculated as follows:
%100)t(masswet
)t(massdry)t(masswet)t((%)content)ethanolwater(
(1)
%100)0t(massdry
)t(massdry)t((%)massfilmdry
(2)
The mechanical properties of the films (puncture strength, percent elongation and energy at
break) in the dry and wet state were measured using the puncture test and a texture
analyzer (TAXT.Plus, Swantech, Villeneuve la Garenne, France). Film specimens were
mounted on a film holder (n = 6). The puncture probe (spherical end: 5 mm diameter) was
fixed on the load cell (5 kg) and driven downward with a cross-head speed of 0.1 mm/s to
the center of the film holder’s hole (diameter: 10 mm). Load versus displacement curves
were recorded until rupture of the film and used to determine the mechanical properties as
follows:
A
Fstrengthpuncture (3)
where F is the load required to puncture the film; A represents the cross-sectional area of
the edge of the film located in the path.
%100R
RdRbreakatelongation%
22
(4)
Here, R denotes the radius of the film exposed in the cylindrical hole of the holder and d the
displacement to puncture.

Chapter 6 : Elucidation of the underlying mechanisms of ethanol resistant coated pellets
109
V
AUCvolumeunitperbreakatenergy (5)
where AUC is the area under the load versus displacement curve and V the volume of the
film located in the die cavity of the film holder (the energy at break is normalized to the
film’s volume).
6.1.3. Pellet coating
Theophylline matrix cores were coated with Aquacoat® ECD 30:guar gum 85:15 or 93:7
blends (as indicated). Aquacoat® ECD 30 was plasticized for 1 d with 25 % DBS (w/w; based
on the ethylcellulose mass). Guar gum (medium guar gum, if not otherwise stated) was
dissolved in purified water at 65 °C (0.7 % or 1 % w/w, as indicated; 100 % reference value =
total coating formulation; 2 h stirring) and cooled down to room temperature. The two
liquids were blended and stirred for 30 min prior to use. The coating dispersions were
sprayed onto theophylline pellets using a fluidized bed coater (Strea 1, Wurster insert; Niro;
Aeromatic-Fielder, Bubendorf, Switzerland). The process parameters were as follows: inlet
temperature = 38 °C, product temperature = 38 ± 2 °C, spray rate = 2g/min, atomization
pressure = 1.2 bar, nozzle diameter = 1.2 mm. After coating the pellets were further fluidized
for 10 min and subsequently cured for 24 h at 60 °C in an oven.
6.1.4. Drug release measurements
From ensembles of pellets: Theophylline release from coated pellets was measured in 0.1 M
HCl or 0.1 M HCl: ethanol blends (optionally containing different amounts of NaCl), followed
by phosphate buffer pH 7.4 (USP 36) using the USP 36 paddle apparatus (Sotax, Basel,
Switzerland) (900 mL, complete medium change after 2 h; 37 °C, 100 rpm, n = 3). At pre-
determined time points, 3 mL samples were withdrawn and analyzed UV-
spectrophotometrically [ = 270.4 nm in 0.1 N HCl, = 272.2 nm in 0.1 M HCl:ethanol blends
and phosphate buffer pH 7.4] (UV 1650 PC, Shimadzu, Champs-sur-Marne, France).

Chapter 6 : Elucidation of the underlying mechanisms of ethanol resistant coated pellets
110
From single pellets: Single pellets were placed into 100 mL plastic flasks filled with 100 mL
pre-heated release medium (0.1 M HCl or 0.1 M HCl:ethanol 60:40 for 2 h, followed by
phosphate buffer pH 7.4). The flasks were horizontally shaken at 37 °C and 80 rpm (GFL
3033). At pre-determined time points, 3 mL samples were withdrawn and analyzed UV-
spectrophotometrically as described above.
6.1.5. SEM studies
The morphology of coated pellets was characterized using a cold field emission high
resolution scanning electron microscope (S-4700 Field Emission Gun; Hitachi, Hitachi High-
Technologies Europe, Krefeld, Germany). Samples were covered under vacuum with a
carbon layer.
6.1.6 Diffusion cell studies
Drug permeation through thin, drug-free (sprayed) polymeric films was measured using
vertical diffusion cells, which were placed in a horizontal shaker (37 °C, 80 rpm; GFL 3033).
The film surface exposed to the medium was 1.8 cm². The donor compartment (at the top)
was filled with an excess of dry theophylline powder (as received). The acceptor
compartment (at the bottom) was filled with 350 mL 0.1 M HCl or 0.1 M HCl:ethanol 60:40.
At pre-determined time intervals, 3 mL samples were withdrawn and analysed UV-
spectrophotometrically as described above. All experiments were conducted in triplicate.
6.1.7. Determination of the drug solubility and of the partition coefficient of the drug
Excess amounts of theophylline powder were exposed to 0.1 M HCl or 0.1 M HCl:ethanol
60:40 in flasks in a horizontal shaker (80 rpm, 37 °C). At pre-determined time intervals,
samples were withdrawn, filtered and analysed for their drug content (as described above)
until equilibrium was reached.
Thin, initially drug free (cast) films were exposed to saturated theophylline solutions in 0.1 M
HCl or 0.1 M HCl:ethanol 60:40 containing excess amounts of non-dissolved drug in flasks in

Chapter 6 : Elucidation of the underlying mechanisms of ethanol resistant coated pellets
111
a horizontal shaker (80 rpm, 37 °C). At pre-determined time intervals, film samples were
withdrawn, surface water removed and the films analyzed for their drug content. The latter
was determined UV-spectrophotometrically upon film dissolution in ethanol. The partition
coefficient was calculated from the plateau concentrations reached in the films and in the
aqueous phase at equilibrium. All experiments were conducted in triplicate.
6.2. Results and discussion
6.2.1. Drug release from single pellets
When elucidating the drug release mechanisms from multiple dosage forms, it is decisive to
first of all clarify whether the single units release in a similar way, or whether the release
profile observed with ensembles of multiple units is the sum of very different individual
release profiles (Borgquist et al., 2002). For instance, in an extreme case, zero order release
kinetics observed from an ensemble of hundreds of pellets might result from pulsatile drug
release from individual pellets with highly variable lag-times, evenly distributed within the
observation period.
Figure 28 shows the experimentally measured theophylline release kinetics from single
pellets coated with 20 % (w/w) 85:15 ethylcellulose:guar gum. The release medium was
either 0.1 M HCl for 2 h (Figure 28a), or 0.1 M HCl:ethanol 60:40 for 2 h (Figure 28b), in both
cases followed by 6 h phosphate buffer pH 7.4. The thick curves indicate the respective
mean values, the error bars standard deviations. Clearly, the investigated single pellets
behave similarly, irrespective of the type of release medium: About zero order release
kinetics are observed in all cases. Thus, the underlying drug release mechanism seems to be
the same for all single units. Slight variations in the film coatings’ thickness are likely to be
responsible for the observed differences in the individual release profiles (Ho et al., 2009).
Importantly, the presence or absence of 40 % ethanol in the release medium does not seem
to affect the underlying drug release mechanism.

Chapter 6 : Elucidation of the underlying mechanisms of ethanol resistant coated pellets
112
0
25
50
75
100
0 2 4 6 8
time, h
dru
g r
ele
as
ed
, %
sample 1
sample 2
sample 3
sample 4
sample 5
sample 6
mean
0
25
50
75
100
0 2 4 6 8
time, h
dru
g r
ele
as
ed
, %
sample 1
sample 2
sample 3
sample 4
sample 5
sample 6
mean
Figure 28: Theophylline release from single pellets coated with 20 % (w/w)
ethylcellulose:guar gum 85:15 in: a) 0.1 M HCl for 2 h, followed by phosphate buffer pH 7.4,
or b) 0.1 M HCl:ethanol 60:40 for 2 h, followed by phosphate buffer pH 7.4. The thick curves
show the respective mean values, error bars indicate standard deviations. The guar gum
concentration in the total dispersion was 0.7% w/w.
0.1 M HCl
a)
0.1 M HCl: ethanol 60:40
Phosphate buffer pH 7.4
Phosphate buffer pH 7.4 b)

Chapter 6 : Elucidation of the underlying mechanisms of ethanol resistant coated pellets
113
6.2.2. Impact of the osmolality of the release medium
Drug release from coated pharmaceutical dosage forms might be strongly affected by the
osmolality of the release medium. In certain cases, osmotic effects play a major role for the
control of drug release (Marucci et al., 2010). Importantly, considerable variations in the
osmolality of the release medium did not significantly affect the resulting drug release
kinetics, irrespective of the ethylcellulose:guar gum blend ratio and the presence/absence of
ethanol in the release medium. Figures 29a and 29b show for example the experimentally
measured release of theophylline from pellets coated with 20 % w/w ethylcellulose:guar
gum 85:15 in 0.1 M HCl or 0.1 M HCl:ethanol 60:40 containing 0-5 % NaCl for 2 h, followed in
both cases by phosphate buffer pH 7.4 for 6 h. As it can be seen, there was only a limited
impact on drug release, despite the important variations in the osmolality of the surrounding
bulk fluid. Also, no general tendency was visible for any release medium. Based on these
results, osmotic pumping as the dominant release mechanism can be excluded.

Chapter 6 : Elucidation of the underlying mechanisms of ethanol resistant coated pellets
114
0
25
50
75
100
0 2 4 6 8
time, h
dru
g r
ele
as
ed
, %
0 % NaCl
1 %
2 %3 %
4 %
5 %
0
25
50
75
100
0 2 4 6 8
time, h
dru
g r
ele
as
ed
, %
0 % NaCl
1 %
2 %
3 %
4 %
5 %
Figure 28: Impact of the osmolality of the bulk fluid: Theophylline release from pellets
coated with 20 % w/w ethylcellulose:guar gum 85:15 in: a) 0.1 M HCl containing different
amounts of NaCl for 2 h, followed by phosphate buffer pH 7.4, or b) 0.1 M HCl:ethanol 60:40
containing different amounts of NaCl for 2 h, followed by phosphate buffer pH 7.4. The guar
gum concentration in the total dispersion was 0.7% w/w.
a)
b)
Phosphate buffer pH 7.4
Phosphate buffer pH 7.4

Chapter 6 : Elucidation of the underlying mechanisms of ethanol resistant coated pellets
115
6.2.3. Morphology and mechanical properties of the film coatings
Drug release from polymer coated solid dosage forms can either occur through the
continuous macromolecular network, or through water-filled cracks or pores (potentially
created upon water penetration into the system) (Maroni et al., in press). Often, drug
transport through water-filled pores/cracks is much faster than drug transport through a
continuous polymeric network (Siepmann and Siepmann, 2008). In order to know whether
water-filled channels exist in the investigated ethylcellulose:guar gum coated pellets, the
latters’ morphology was studied using Scanning Electron Microscopy before and after
exposure to 0.1 M HCl, or 0.1 M HCl:ethanol 60:40 for 2 h. As it can be seen in figure 30, no
signs for the presence of pores or cracks are visible before exposure to the release media.
The same was true after 2 h contact with the bulk fluids, irrespective of the presence of high
ethanol concentrations (data not shown). However, it must be pointed out that the pellets
had to be dried after exposure to the release media and that eventually created
pores/cracks were closed during this drying step. In addition, nanosized pores would not
necessarily be visible (e.g., being hidden by the carbon layer or due to the limited
resolution). Thus, caution has to be paid when drawing conclusions from this type of
measurements. Nevertheless, the absence of visible macro-sized pores under the given
conditions is interesting information. In other studies on different polymeric film coatings
such pores could clearly be seen in SEM pictures (Lecomte, 2005a).

Chapter 6 : Elucidation of the underlying mechanisms of ethanol resistant coated pellets
116
Figure 30: SEM picture of the surface of a pellet coated with 20 % w/w
ethylcellulose:guar gum 85:15 before exposure to the release medium. The guar gum
concentration in the total dispersion was 0.7% w/w.
Obviously, the mechanical strength of the polymeric film coatings is decisive for the
potential creation of cracks upon water penetration into the systems. Water entering the
pellet core builds up a hydrostatic pressure, which acts against the macromolecular
membrane. If the latter is fragile, the onset of crack formation is likely after a system-specific
lag-time. In contrast, if the film coating is mechanically sufficiently stable and withstands the
generated hydrostatic pressure, drug release might be controlled by diffusion through the
intact polymeric network. Table 2 shows the puncture strength, percent elongation at break
and energy required to break thin, free films based on different ethylcellulose:guar gum
blends in the dry state (before exposure to the release medium). As it can be seen, the
mechanical stability of the films increases with increasing guar gum content. This might at
least partially be attributable to the fact that an aqueous dispersion of ethylcellulose
nanoparticles and an aqueous solution of guar gum were used for film preparation (as this is
the case for the film coatings). Thus, the underlying film formation mechanism is
fundamentally different for the two polymers and a much higher degree of polymer-polymer
chain entanglement can be expected in the case of guar gum (Lecomte et al., 2004a).

Chapter 6 : Elucidation of the underlying mechanisms of ethanol resistant coated pellets
117
Table 2: Impact of the ethylcellulose:guar gum blend ratio (w/w) on the mechanical
properties (puncture strength, percent elongation at break and energy at break) of free (cast)
films in the dry state (mean values +/- standard deviation).
Ethylcellulose:guar gum blend ratio
100:0 93:7 90:10 85:15 0:100
Puncture strength, MPa 0.2 0.0 0.4 0.0 0.5 0.0 0.6 0.1 11.6 4.4
Elongation at break, % 1.1 0.2 1.2 0.2 1.1 0.1 0.8 0.1 0.6 0.3
Energy at break, J/m3 11 0.2 18 0.2 19 2 22 5 323 185
However, it is well known that the composition of polymeric film coatings can significantly
change upon exposure to the release medium (Lecomte et al., 2004b). For instance, water
penetrating into the film coating can act as a plasticizer for a polymeric component. On the
other hand, water soluble film compounds (e.g. guar gum) might at least partially leach out
of the film into the bulk fluid. Also, plasticizers (such as dibutyl sebacate) might be partially
lost into the surrounding medium. Due to these changes in the film coatings’ composition,
the latters’ mechanical properties might be significantly altered. Figure 31 shows the
dynamic changes in the puncture strength, percent elongation at break and energy required
to break thin films based on 93:7, 90:10, or 85:15 ethylcellulose blends upon exposure to
0.1 M HCl:ethanol 60:40 (37 °C) for different time periods. As it can be seen, the mechanical
stability of the systems: (i) decreases with time in the case of 85:15 ethylcellulose:guar gum
blends, (ii) generally only slightly, and more or less arbitrarily varies with time in the case of
the other two blends. In most cases, the energy required to break the films increases with
increasing guar gum content, irrespective of the exposure time to the release medium (for
the reasons discussed above).

Chapter 6 : Elucidation of the underlying mechanisms of ethanol resistant coated pellets
118
0
0.1
0.2
0.3
0.4
0.5
30min 1h 2h
pu
nc
ture
str
en
tgh
, M
Pa
93:7
90:10
85:15
0
10
20
30
40
50
30min 1h 2h
elo
ng
ati
on
at
bre
ak
, %
93:7
90:10
85:15
0
0.05
0.1
0.15
30min 1h 2h
en
erg
y a
t b
rea
k, M
J/m
3
93:7
90:10
85:15
Figure 31: Dynamic changes in the mechanical properties of free ethylcellulose:guar gum
(cast) films upon exposure to 0.1 M HCl:ethanol 60:40 (37 °C) for different time periods. The
ethylcellulose:guar gum blend ratio (w/w) is indicated in the diagrams. The guar gum
concentration in the total dispersion was 0.7% w/w.

Chapter 6 : Elucidation of the underlying mechanisms of ethanol resistant coated pellets
119
6.2.4. Drug mobility within the film coatings
Based on the experimentally observed drug release kinetics from single pellets, the very
limited impact of changes in the osmolality of the release medium on drug release, the
morphology of the pellets’ surface before and after exposure to the release medium as well
as the mechanical properties of the polymeric films and dynamic changes thereof upon
contact with the bulk fluids, one hypothesis can be that drug release is eventually controlled
primarily by diffusion through the intact polymeric film coatings. In order to evaluate the
validity of this assumption, the apparent diffusion coefficient of theophylline in thin, free
films of identical composition as the investigated film coatings was experimentally
determined using vertical diffusion cells. Knowing these values and using an appropriate
solution of Fick’s law of diffusion the resulting drug release kinetics from coated pellets can
be quantitatively predicted (based on the hypothesis of purely diffusion controlled drug
release). Comparison of these theoretical predictions with independent experimental results
should allow evaluating the validity of the hypothesized release mechanism.

Chapter 6 : Elucidation of the underlying mechanisms of ethanol resistant coated pellets
120
Figure 32: Drug permeation through sprayed thin ethylcellulose:guar gum 85:15 films
(measured in vertical diffusion cells): The donor compartment initially contained dry
theophylline powder, the acceptor compartment pre-heated (37 °C) 0.1 M HCl or 0.1 M
HCl:ethanol 60:40 (as indicated). The symbols represent the experimentally measured results,
the curves the fitted theory (Eq. 6). Note that “time/thickness²” is plotted on the x-axis, and
“drug permeated/thickness” is plotted on the y-axis to account for slight variations in the film
thickness from sample to sample. This type of normalization is possible, according to Eq. 6.
The guar gum concentration in the total dispersion was 0.7% w/w.
The symbols in Figure 32 show the experimentally measured permeation of theophylline
through thin ethylcellulose:guar gum 85:15 films. Vertical diffusion cells were used, the films
were initially drug-free, the donor compartment contained theophylline powder, the
acceptor compartment either 0.1 M HCl (filled symbols), or 0.1 M HCl:ethanol 60:40 (open
symbols) (37 °C), in order to mimic the conditions in initially dry pellets exposed to the
release medium. Importantly, about straight lines were observed right from the beginning.
Thus, water penetration into and through the films was rapid compared to drug diffusion
through the polymeric barrier: Very soon, a steady-state was established, with a saturated

Chapter 6 : Elucidation of the underlying mechanisms of ethanol resistant coated pellets
121
drug solution in the donor compartment and perfect sink conditions in the acceptor
compartment. Hence, also the dissolution of the theophylline particles was much more rapid
than the subsequent diffusion through the thin films. The thickness of the latter was in the
range of 17 to 23 µm (thus, in a similar range as the film coatings of the investigated pellets).
Furthermore, no major difference was observed when using 0.1 M HCl versus 0.1 M
HCl:ethanol 60:40 as bulk fluids. Hence, the mobility of the drug in the film coatings does not
seem to be affected by the presence/absence of high ethanol concentrations to a
noteworthy extent. Fitting the following solution of Fick’s law of diffusion to the
experimentally determined drug permeation kinetics allowed determining the apparent
diffusion coefficient of the drug in these polymeric films (Crank, 1975):
1n2
22
2
n
22stL4
tnDexp
n
12
6
1
L4
tDcKLA2M
(6)
where Mt is the cumulative absolute amount of drug in the acceptor compartment at time t;
A denotes the surface area of the film available for diffusion, L the half-thickness of the film,
and cs the solubility of the drug in the medium; K is the partition coefficient of the drug
between the film and the bulk fluid. The solubility of theophylline in 0.1 M HCl and 0.1 M
HCl:ethanol 60:40 at 37 °C was experimentally measured and found to be equal to 12.7 +/-
0.5 and 30.2 +/- 1.0 mg/mL, respectively. The partition coefficient, K, of this drug between
the investigated ethylcellulose:guar gum films and 0.1 M HCl or 0.1 M HCl:ethanol 60:40 was
determined to be equal to 1.8 and 0.5 (for both polymer:polymer blend ratios: 85:15 and
93:7).
As it can be seen in Figure 32, good agreement was obtained when fitting Eq. 6 (curves) to
the experimentally determined drug permeation kinetics through the polymeric films
(symbols). Based on these calculations, the following apparent diffusion coefficients of
theophylline in ethylcellulose:guar gum 85:15 based films could be determined: D = 3.2 +/-
0.5 and 5.0 +/- 0.4 x 10⁻⁸ cm²/s upon exposure to 0.1 M HCl and 0.1 M HCl:ethanol 60:40,
respectively. In the case of ethylcellulose:guar gum 93:7 blends, the D values were equal to
2.1 +/- 0.4 and 2.6 +/- 0.7 x 10⁻⁸ cm²/s, respectively. Thus, the presence of 40 % ethanol in

Chapter 6 : Elucidation of the underlying mechanisms of ethanol resistant coated pellets
122
the bulk fluid had only a limited impact on drug mobility within the polymeric films. As
expected, the theophylline mobility increased with increasing guar gum content, which can
probably be attributed to increased water uptake of the films (guar gum being more
hydrophilic than ethylcellulose) and/or partial leaching of this compound into the bulk fluid
(leading to less dense polymeric networks).
6.2.5. Mathematical modeling of drug release
Based on this knowledge and on the hypothesis that theophylline release is predominantly
controlled by drug diffusion through the intact polymeric film coatings (no crack formation),
the following solution of Fick’s second law of diffusion can be used to quantitatively predict
the resulting drug release kinetics from coated pellets (Siepmann and Siepmann, 2012):
tR-R
RR cKDπ4=M
io
ios
t
(7)
where Mt denotes the cumulative amount of drug released at time t; D is the apparent
diffusion coefficient of the drug within the film coating; K is the partition coefficient of the
drug between the film coating and the bulk fluid; cs is the solubility of the drug in the core,
and Ri and Ro are the inner and outer radii of the device.
Knowing the values on the right hand side of Eq. 7, the resulting drug release kinetics could
be quantitatively predicted for arbitrary coating levels. The straight lines in Figure 6 show
some examples: The dashed lines illustrate the theoretically predicted theophylline release
kinetics in 0.1 M HCl from pellets coated with 10, 15, or 20 % ethylcellulose:guar gum 85:15
(as indicated). The solid lines illustrate the respective release kinetics in 0.1 M HCl:ethanol
60:40. As it can be seen, very similar theophylline release rates are expected in the presence
and absence of ethanol in the release medium. Thus, the slightly increased apparent
diffusion coefficient of the drug and the increased drug solubility in the presence of 40 %
ethanol is compensated by the decreased partition coefficient between the film coating and
the bulk fluid. In order to evaluate the validity of these theoretical predictions, the
respective pellets were prepared in reality (only after the predictions were made) and the

Chapter 6 : Elucidation of the underlying mechanisms of ethanol resistant coated pellets
123
resulting drug release kinetics were measured experimentally. Looking at Figure 33, it can
clearly be seen that the theoretical predictions (lines) and independent experiments
(symbols) were in good agreement in all cases: irrespective of the presence/absence of
ethanol in the release medium and of the coating level.

Chapter 6 : Elucidation of the underlying mechanisms of ethanol resistant coated pellets
124
Figure 33: Theoretical prediction (straight lines, Eq. 7) and independent experimental
verification (symbols): Theophylline release from pellets coated with 10, 15 or 20 %
ethylcellulose:guar gum 85:15 in 0.1 M HCl, or 0.1 M HCl:ethanol 60:40 (as indicated). The
guar gum concentration in the total dispersion was 0.7% w/w.
10 %
15 %
20 %

Chapter 6 : Elucidation of the underlying mechanisms of ethanol resistant coated pellets
125
Thus, theophylline diffusion through the intact polymeric film coatings seems to be indeed
the dominant mass transport mechanism controlling drug release from these dosage forms.
Figure 34 shows that this was also true for 93:7 ethylcellulose:guar gum blends. The dashed
and solid lines show the theoretically predicted theophylline release kinetics from pellets
(coating level = 15 %) in 0.1 M HCl or 0.1 M HCl:ethanol 60:40, respectively. The symbols
illustrate the independent experimental results. The observed good agreement further
confirms the hypothesized drug release mechanism. These examples also demonstrate the
great practical benefit of this type of mathematical modeling: In silico simulations offer the
possibility to replace time-consuming and cost-intensive series of trial-and-error
experiments during product optimization. The film composition and coating level required to
achieve a specific, desired drug release profile can be theoretically predicted.
Figure 34: Theoretical prediction (straight lines, Eq. 7) and independent experimental
verification (symbols): Theophylline release from pellets coated with 15 % ethylcellulose:guar
gum 93:7 in 0.1 M HCl, or 0.1 M HCl:ethanol 60:40 (as indicated).

Chapter 6 : Elucidation of the underlying mechanisms of ethanol resistant coated pellets
126
0
25
50
75
100
0 2 4 6 8
time, h
dru
g r
ele
as
ed
, %
0.1 M HCl:ethanol 95:5
0,1 M HCl:ethanol 90:10
0.1 M HCl:ethanol 100:0
0.1 M HCl:ethanol 80:20
0.1 M HCl:ethanol 60:40
Figure 35: Impact of intermediate ethanol concentrations in the release medium:
Theophylline release from pellets coated with 20 %: a) 93:7 ethylcellulose:medium guar
gum (guar gum concentration in the total dispersion = 1.0% w/w), or b) 85:15
ethylcellulose:high guar gum (guar gum concentration in the total dispersion = 0.7% w/w).
The release medium was a 100:0, 95:5, 90:10, 80:20, or 60:40 blend of 0.1 M HCl and ethanol
(V/V) (as indicated) for the first 2 h, followed by phosphate buffer pH 7.4 for the subsequent
6 h.
a)
b)
0
25
50
75
100
0 2 4 6 8
time, h
dru
g r
elea
sed
, %
5% EtOH
20% EtOH
40% EtOH
0% EtOH
0
25
50
75
100
0 2 4 6 8
time, h
dru
g r
elea
sed
, %
0.1 M HCl:ethanol 95:5
0.1 M HCl:ethanol 80:20
0.1 M HCl:ethanol 60:40
0.1 M HCl:ethanol 100:0
Phosphate buffer pH 7.4
Phosphate buffer pH 7.4

Chapter 6 : Elucidation of the underlying mechanisms of ethanol resistant coated pellets
127
0
25
50
75
100
0 0.5 1 1.5 2
time, h
(wa
ter
+ e
tha
no
l) c
on
ten
t, %
0,1N HCl:ethanol 95:5
0,1N HCl:ethanol 100:0
0,1N HCl:ethanol 80:20
0
25
50
75
100
0 0.5 1 1.5 2
time, h
dry
film
ma
ss
, %
0,1N HCl:ethanol 95:5
0,1N HCl:ethanol 100:0
0,1N HCl:ethanol 80:20
Figure 36: Impact of intermediate ethanol concentrations in the release medium on
changes in the: a) (water + ethanol) content, and b) dry mass of thin, free (cast) 93:7
ethylcellulose:guar gum films upon exposure to a 100:0, 95:5, or 80:20 blend of 0.1 M HCl
and ethanol (V/V) (as indicated).
b)
a)
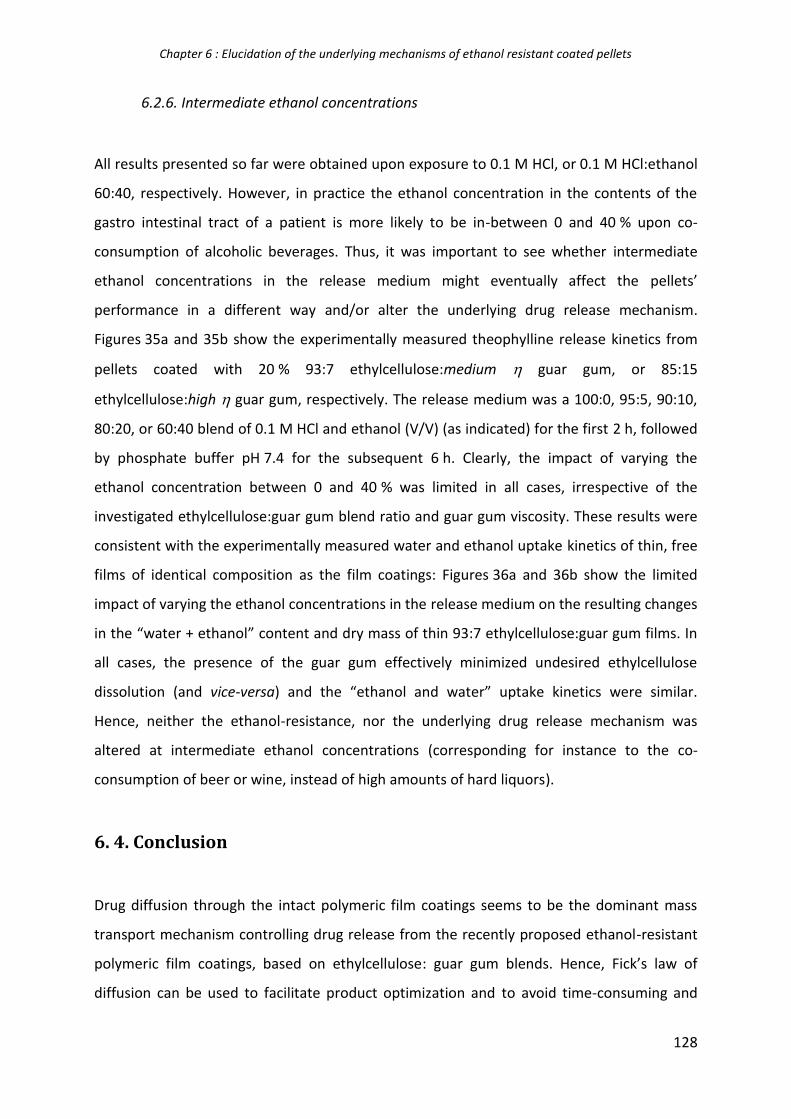
Chapter 6 : Elucidation of the underlying mechanisms of ethanol resistant coated pellets
128
6.2.6. Intermediate ethanol concentrations
All results presented so far were obtained upon exposure to 0.1 M HCl, or 0.1 M HCl:ethanol
60:40, respectively. However, in practice the ethanol concentration in the contents of the
gastro intestinal tract of a patient is more likely to be in-between 0 and 40 % upon co-
consumption of alcoholic beverages. Thus, it was important to see whether intermediate
ethanol concentrations in the release medium might eventually affect the pellets’
performance in a different way and/or alter the underlying drug release mechanism.
Figures 35a and 35b show the experimentally measured theophylline release kinetics from
pellets coated with 20 % 93:7 ethylcellulose:medium guar gum, or 85:15
ethylcellulose:high guar gum, respectively. The release medium was a 100:0, 95:5, 90:10,
80:20, or 60:40 blend of 0.1 M HCl and ethanol (V/V) (as indicated) for the first 2 h, followed
by phosphate buffer pH 7.4 for the subsequent 6 h. Clearly, the impact of varying the
ethanol concentration between 0 and 40 % was limited in all cases, irrespective of the
investigated ethylcellulose:guar gum blend ratio and guar gum viscosity. These results were
consistent with the experimentally measured water and ethanol uptake kinetics of thin, free
films of identical composition as the film coatings: Figures 36a and 36b show the limited
impact of varying the ethanol concentrations in the release medium on the resulting changes
in the “water + ethanol” content and dry mass of thin 93:7 ethylcellulose:guar gum films. In
all cases, the presence of the guar gum effectively minimized undesired ethylcellulose
dissolution (and vice-versa) and the “ethanol and water” uptake kinetics were similar.
Hence, neither the ethanol-resistance, nor the underlying drug release mechanism was
altered at intermediate ethanol concentrations (corresponding for instance to the co-
consumption of beer or wine, instead of high amounts of hard liquors).
6. 4. Conclusion
Drug diffusion through the intact polymeric film coatings seems to be the dominant mass
transport mechanism controlling drug release from the recently proposed ethanol-resistant
polymeric film coatings, based on ethylcellulose: guar gum blends. Hence, Fick’s law of
diffusion can be used to facilitate product optimization and to avoid time-consuming and

Chapter 6 : Elucidation of the underlying mechanisms of ethanol resistant coated pellets
129
cost-intensive series of trial-and-error experiments. Depending of the type of drug,
eventually also other phenomena might have to be taken into account.

Chapter 7 : TPI as a new PAT for coated pellets
130
7. Effects of film coating thickness on in-vitro drug release about sustained-release coated
pellets: Using terahertz pulsed imaging

Chapter 7 : TPI as a new PAT for coated pellets
131
7.1. Materials and Methods
7.1 1. Materials
The following materials were used: metoprolol succinate (Salutas Pharma GMBH, Germany);
nonpareil sugar starter cores (diameter 710-850 µm, NP Pharma SR, France); polyvinyl
acetate (Kollicoat SR 30 D; BASF, Germany), poly(vinyl alcohol)-poly(ethylene glycol graft
copolymer (Kollicoat IR; BASF, Germany); hydroxypropyl methylcellulose (HPMC, Methocel
E5; Colorcon, United Kingdom); triethyl citrate (TEC; Morflex, USA); and talc (Luzenca Val
Chisone, Italy).
7.1 2. Preparation of the Pellets
Pellets were prepared by layering an aqueous drug-binder solution (20% metoprolol
succinate, 1% HPMC) onto sugar starter cores (diameter = 710–850 μm; Boire, France) until a
10% (w/w) drug load using a fluidized bed coater equipped with a Wurster insert (Strea 1;
Aeromatic-Fielder, Switzerland). A spray rate of 2–3 g/min, a spray nozzle of 1.2 mm
diameter and an atomisation pressure of 1.2 bar was used to apply the drug-binder solution.
The inlet temperature was 40 ± 2 °C and the product temperature 38 ± 2 °C. The method
used to apply the drug layer onto the sugar starter cores resulted in a visually smooth
surface.
Kollicoat® IR (polyvinyl alcohol–polyethylene glycol graft copolymer) was dissolved in purified
water and blended with plasticised Kollicoat® SR 30 D (an aqueous polyvinyl acetate
dispersion) (overnight stirring with 5% triethyl citrate, w/w based on the polymer content)
30 min prior to the coating process. The polymer:polymer blend ratio was 25:75 (w/w
referring to the dry mass). Talcum (1.5%) was added (w/w; based on the total solids content)
and the dispersion was gently stirred throughout the coating process. The process
parameters were as follows: inlet temperature 38 ± 2 °C, product temperature 35 ± 2 °C,
spray rate 2–3 g/min, atomisation pressure 1.2 bar, nozzle diameter 1.2 mm. After coating,
the pellets were further fluidised for 10 min and subsequently cured in an oven for 24 h at
60 °C. The metoprolol succinate loaded cores were coated until a coating thickness of

Chapter 7 : TPI as a new PAT for coated pellets
132
approximately 40, 60 and 100 μm (estimated based on weight-gain) was achieved. The
overall minimum, maximum and the average diameter (measured in x and ydirections for
each pellet) from 10 pellets of each batch were determined using an electronic calliper (TESA
Technology, Switzerland). The results were as follows: 830 μm, 1250 μm and 969 (±95) μm
for batch I; 940 μm, 1160 μm and 1043 (±58) μm for batch II; and 990 μm, 1390 μm and
1144 (±104) μm for batch III.
7.1.3. Terahertz Pulsed Imaging (TPI)
A total of ten pellets in each batch were imaged individually using a TPS Spectra3000
(TeraView Ltd, Cambridge, UK) in reflection mode. The single pellets were fixed on a glass
slide and the terahertz incident beam was manually focussed on the highest point of the
pellet surface by moving the x-y stage. The instrument set-up involved mapping a 1.2 x 1.2
mm area with a step-size (point-to-point mode) of 0.05 mm, and an axial penetration depth
of 1.5 mm. The resulting spatial resolution with this analytical technique lies between 30-40
µm in the lateral direction and 200 µm in the axial direction (Zeitler et al., 2007a; Zeitler et
al., 2007b). Data analysis was carried out using TPIView TVL imaging software version 3.0.5.
The following equation was used to directly derive the CT from the terahertz waveform:
2dcoat = Δtc/n
where dcoat is the thickness of the coating, Δt is the time difference between the reflection of
the terahertz pulse off the coating surface and the reflection from the interface of the
coating and the drug layer; c is the speed of light; and n is the refractive index of the coating
material (Ho et al., 2007). The refractive index (RI) used to calculate the CT was 1.5 (Ho et al.,
2009) and the RI used to obtain the drug layer thickness was 1.81. The method of RI
determination using terahertz pulsed spectroscopy in transmission mode has been
previously described (Ho et al., 2007). In brief, the coating excipients and the drug were
diluted with high density polyethylene at 5%, 10 % and 20% (w/w) concentrations and
compressed into 13 mm diameter pellets under 2-ton pressure. Dilution was carried out to
avoid signal saturation. Three pellets for every concentration were prepared and the RI
spectra were generated using the TPS Spectra3000 (TeraView Ltd) in transmission mode. The

Chapter 7 : TPI as a new PAT for coated pellets
133
RI used for TPI was the average of the spectral RI over the bandwidth of the terahertz pulsed
imaging system (Ho et al., 2007).
Due to the size and spherical nature of the pellets and the experimental set-up, the impact
of pellet curvature on the observed thickness had to be considered and its effect minimised.
The detected TPI parameter, terahertz electric field peak strength (TEFPS), measures the
intensity of the reflected terahertz pulse from the surface of a sample normalised to the
initial terahertz pulse intensity and is presented in % (Ho et al., 2008). It is a function of angle
of incidence of the terahertz pulse with respect to the pellet surface, with it being a
maximum when the pulse propagates in a direction normal to the pellet surface. However,
due to the size of the pellets used in this study and the manual imaging set-up, the pellet
curvature leads to the edges of the visible region being out of focus of the terahertz pulse
and some terahertz radiation is also scattered away from the detector. This leads to
significant signal loss towards the edges of the visible surface area of the pellets similar to
the signal loss identified in a previous study on biconvex tablets (Ho et al., 2010), where the
authors showed that the curvature of the centre band of a tablet can cause a signal loss that
is reflected in the TEFPS values derived from the TPI maps. In addition, signal scattering and
therefore signal loss was also demonstrated in another study on granulated materials in a
size range comparable to the wavelength of the terahertz radiation (83 μm to 5 mm, Shen et
al., 2008). A decrease in TEFPS due to pellet curvature with the current measurement set-up
is associated with an increased risk of incorrect layer thickness results. Thus, the TEFPS
values (minimum two thirds (3.0%) of the highest intensity (4.5%) of the reflected terahertz
signal) were used to determine a circular area (0.13 mm2) in the TPI maps, where the
average thickness values could be accurately determined.
7.1.4. Dissolution Testing
Drug release measurements were carried out on the same pellets after TPI investigation.
Pellets were placed individually into 2 mL Eppendorf-tubes filled with 1.5 mL phosphate
buffer pH 7.4 for 8 h. The tubes were agitated in a horizontal shaker (80 rpm; GFL 3033,
Gesellschaft für Labortechnik, Germany). At pre-determined time points (0, 0.5, 1, 2, 3, 4, 5,
6, 7, 8 h) the medium was completely removed and replaced. Analysis of the dissolution

Chapter 7 : TPI as a new PAT for coated pellets
134
medium was carried out using a UV-visible spectrophotometer (UV-1650, Shimadzu, France)
at a detection wavelength of 222 nm. The average drug release of ten pellets was calculated
and one-way analysis of variance (ANOVA) was used to compare drug release of the three
batches at every time point of dissolution.
7.1.5. Scanning Electron Microscopy (SEM)
The TPI results obtained were compared with scanning electron microscopy (SEM) images
(Hitachi S-3400, Hitachi High Technologies America, Inc., USA) of one pellet from each group.
Images were taken of a cross-section and coating surface of the pellets at magnifications of
70 and 300 .
7.2. Results and discussion
The film coated pellets prepared in this study consisted of a sugar starter core coated with a
drug layer (10 % (w/w)) and then different amounts of sustained release coating. The
approximate coating thickness for the different coating amounts as estimated by the weight
gain was 40 µm (batch I), 60 µm (batch II) and 100 µm (batch III). SEM micrographs taken of
the surface of a pellet from every batch confirmed a smooth coating surface for all batches
(see Figure 4.1 for an example). Prior to TPI investigations, 10 pellets were randomly chosen
from every batch and the mean size was determined.
Using a pellet from batch II as an example, Figure 37 shows the 2D TEFPS map with the
respective SEM image in which circles indicate the analysed area. The SEM image (figure
37b) revealed the surface of the pellets and hence the investigated area within the white
circle was reasonably smooth in the entire visible area.

Chapter 7 : TPI as a new PAT for coated pellets
135
Figure 37. TEFPS map of a pellet from batch II is shown in image (A). The black circle
indicates the pixels (measurement points) used for the calculation of the coating and drug
layer thickness. The colour scale is in % reflected terahertz (THz) pulse intensity. The SEM
micrograph (B) with the white circle also indicates the same area on the surface of a pellet
from batch II.
At every pixel within the defined area a TPI waveform was recorded and interfaces between
layers were resolved, providing information on the inner structure of the pellets. The
interfaces between film coating and drug layer, and between drug layer and starter core
were detected and visualised in the corresponding virtual cross-sectional images (images in
the z direction; terahertz B-scans). A TPI B-scan together with a representative terahertz
waveform of a pellet from every batch is shown in Figure 38. In the cross-sectional images
(Figure 38a-c), the large red band located at a depth of 0 mm corresponds to the air/coating
interface, followed progressively further to the right by a yellow/light blue band
representing the coating/drug layer interface and a light blue band indicating the drug
layer/core interface. The interface reflections are also visible in the waveforms as maxima of
different intensities from left to right (Figure 38d-e).

Chapter 7 : TPI as a new PAT for coated pellets
136
Figure 38: Terahertz cross-sections in the depth direction (B-scan) of a pellet from batch I (A),
batch II (B) and batch III (C) with the respective terahertz waveforms (D, E and F). From the
left in the cross-sections, the red band represents the air/coating interface, the yellow/light
blue band the coating/drug layer interface (indicated by two blacklines), followed by a light
blue band representing the drug layer/sugar core interface (indicated by two black lines). The
first intensive positive maximum in the terahertz waveforms (D, E and F) relates to the
air/coating interface, whilst the two black arrows indicate the maxima in the terahertz
waveform corresponding to a signal reflection at the coating/drug layer and the drug
layer/sugar core, respectively. The colour scale bar is the intensity of the terahertz signal in
a.u.
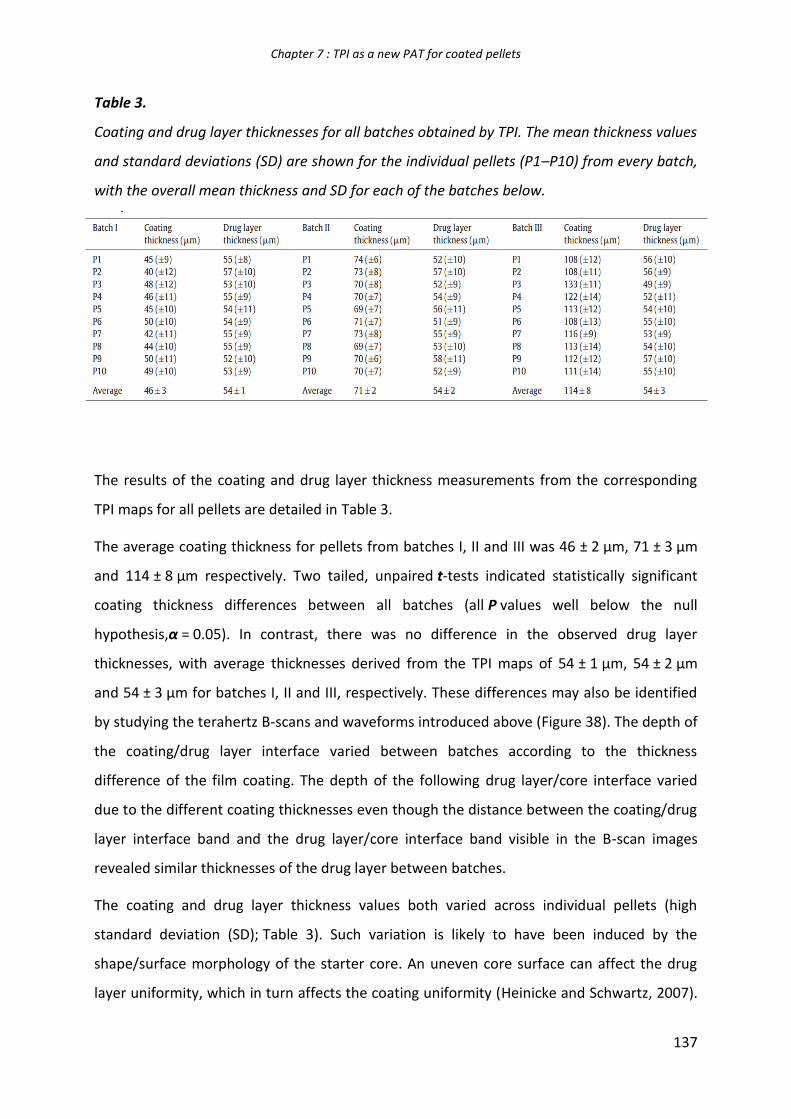
Chapter 7 : TPI as a new PAT for coated pellets
137
Table 3.
Coating and drug layer thicknesses for all batches obtained by TPI. The mean thickness values
and standard deviations (SD) are shown for the individual pellets (P1–P10) from every batch,
with the overall mean thickness and SD for each of the batches below.
The results of the coating and drug layer thickness measurements from the corresponding
TPI maps for all pellets are detailed in Table 3.
The average coating thickness for pellets from batches I, II and III was 46 ± 2 μm, 71 ± 3 μm
and 114 ± 8 μm respectively. Two tailed, unpaired t-tests indicated statistically significant
coating thickness differences between all batches (all P values well below the null
hypothesis,α = 0.05). In contrast, there was no difference in the observed drug layer
thicknesses, with average thicknesses derived from the TPI maps of 54 ± 1 μm, 54 ± 2 μm
and 54 ± 3 μm for batches I, II and III, respectively. These differences may also be identified
by studying the terahertz B-scans and waveforms introduced above (Figure 38). The depth of
the coating/drug layer interface varied between batches according to the thickness
difference of the film coating. The depth of the following drug layer/core interface varied
due to the different coating thicknesses even though the distance between the coating/drug
layer interface band and the drug layer/core interface band visible in the B-scan images
revealed similar thicknesses of the drug layer between batches.
The coating and drug layer thickness values both varied across individual pellets (high
standard deviation (SD); Table 3). Such variation is likely to have been induced by the
shape/surface morphology of the starter core. An uneven core surface can affect the drug
layer uniformity, which in turn affects the coating uniformity (Heinicke and Schwartz, 2007).

Chapter 7 : TPI as a new PAT for coated pellets
138
Previously, it has been shown with TPI that the coating surface morphology and coating
thickness is affected by the drug layer uniformity in large pellets (Ho et al., 2009). Layer
thickness 2D maps constructed of the coating and drug layer thickness demonstrate the
intra-pellet variations as well as the overall differences between batches (Figure 39). As
mentioned previously, the waveforms recorded outside the circles may not be accurate and
therefore measurement points outside the earlier defined circular area shown in the 2D
maps were excluded from coating and drug layer thickness determination.
Figure39: Coating (top) and drug layer (bottom) thickness, 2D maps of a pellet from batch I
(A and D), Batch II (B and E) and batch III (C and F). The black circles indicate the areas used
for coating and drug layer thickness calculation. Dark blue pixels shown in the CT 2D maps
correlate with measurement failure and do not comprise a signal related to the coating/drug
layer interface thus, they were excluded from the CT and DLT calculation. The colour scale
bars are in µm.
Further indication for intra-pellet thickness differences and indication of variation of the
starter core shape was obtained with SEM imaging of pellet cross-sections (Figure 40). The
film coating was clearly visible in the micrographs, directly followed by the drug layer and
the starter core. Although the drug layer/core interface was more difficult to identify using
SEM, TPI investigation readily determined the interface. Nonetheless, the variation of the
core shape can be seen in the SEM images hence, coating and drug layer thickness
inconsistencies across individual pellets can be explained by irregular coating owing to the
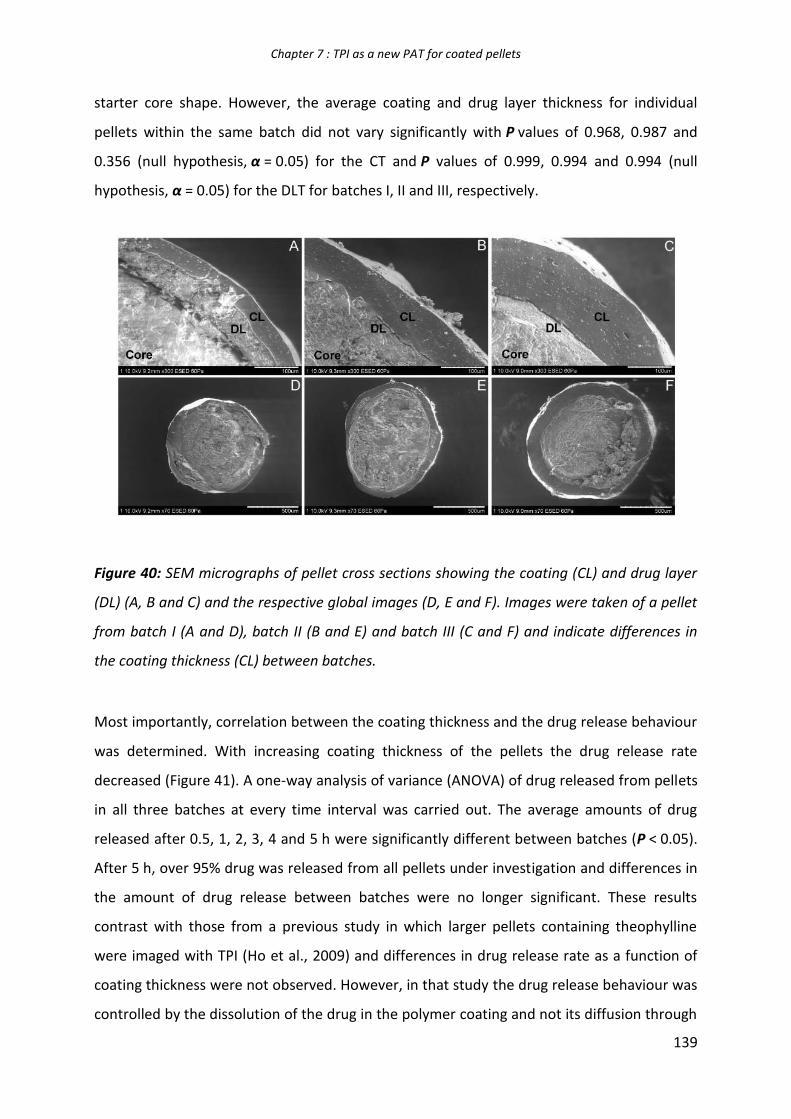
Chapter 7 : TPI as a new PAT for coated pellets
139
starter core shape. However, the average coating and drug layer thickness for individual
pellets within the same batch did not vary significantly with P values of 0.968, 0.987 and
0.356 (null hypothesis, α = 0.05) for the CT and P values of 0.999, 0.994 and 0.994 (null
hypothesis, α = 0.05) for the DLT for batches I, II and III, respectively.
Figure 40: SEM micrographs of pellet cross sections showing the coating (CL) and drug layer
(DL) (A, B and C) and the respective global images (D, E and F). Images were taken of a pellet
from batch I (A and D), batch II (B and E) and batch III (C and F) and indicate differences in
the coating thickness (CL) between batches.
Most importantly, correlation between the coating thickness and the drug release behaviour
was determined. With increasing coating thickness of the pellets the drug release rate
decreased (Figure 41). A one-way analysis of variance (ANOVA) of drug released from pellets
in all three batches at every time interval was carried out. The average amounts of drug
released after 0.5, 1, 2, 3, 4 and 5 h were significantly different between batches (P < 0.05).
After 5 h, over 95% drug was released from all pellets under investigation and differences in
the amount of drug release between batches were no longer significant. These results
contrast with those from a previous study in which larger pellets containing theophylline
were imaged with TPI (Ho et al., 2009) and differences in drug release rate as a function of
coating thickness were not observed. However, in that study the drug release behaviour was
controlled by the dissolution of the drug in the polymer coating and not its diffusion through

Chapter 7 : TPI as a new PAT for coated pellets
140
the coating. In the present study, the drug release was diffusion-controlled since the drug
release behaviour is directly related to coating thickness.
Figure 41. Average drug release profiles of 10 pellets from each batch. One-way ANOVA
revealed that the drug release rate at 0.5, 1, 2, 3, 4 and 5 was statistically different between
the batches.
7.3. Conclusion
TPI investigations were successfully carried out to image layers in standard size pellets for
the first time. Despite the high curvature of the pellets due to their small size it was possible
to analyse the drug and film coating layer thicknesses across individual pellets non-
destructively. TEFPS values were used to determine a circular area in the TPI maps in which
the pellet surface curvature did not adversely affect the accuracy of the coating thickness
results. The coating and drug layer thickness across individual pellets was not uniform, but
the mean coating and drug layer thickness was not significantly different between pellets
within the same batch. Coating thickness differences were observed between batches (with
different amounts of coating applied), whilst the thickness of the drug layer between
batches was the same. These results were supported by SEM analysis. Moreover, the

Chapter 7 : TPI as a new PAT for coated pellets
141
thickness differences of the film coating between batches were correlated to the subsequent
drug release behaviour of the pellets. Overall, the technique showed potential to non-
invasively evaluate film coating characteristics of standard size pellets. A future fully
automated measurement set-up may enable investigation of a larger number of standard
sized-pellets.

Chapter 8 :Summary
142
8. Summary

Chapter 8 :Summary
143
In this PhD thesis, advanced drug delivery systems for time-controlled oral drug
delivery have been investigated. Both, matrix as well as coated dosage forms have been
prepared, thoroughly characterized and the underlying drug release mechanisms have been
elucidated. In particular, lipid based matrix tablets, novel ethanol resistant polymeric film
coatings and an advanced characterization method for film coatings have been addressed, as
briefly described in the following.
A mechanistically realistic mathematical model is presented allowing for the
quantification of niacin release from lipid tablets, based on glyceryl dibehenate. The systems
were prepared either by direct compression or via hot-melt extrusion/grinding/compression.
The model assumptions are based on a thorough physico-chemical characterization of the
tablets before and after exposure to the release medium. Importantly, the model allows for
the first time for the quantitative prediction of the effects of the composition, dimensions
and type of preparation method of the tablets on the resulting niacin release kinetics. These
quantitative theoretical model predictions were confirmed by several sets of independent
experimental results. Furthermore, in-silico simulations revealed the fundamental
importance of limited niacin solubility within the lipid tablets: During major parts of the
release periods, very steep concentration gradients exist and net vitamin flux is restricted to
specific regions within the tablets.
Furthermore, recently reported ethylcellulose:guar gum blends have been studied to
provide ethanol-resistant drug release kinetics from coated dosage forms: Theophylline
release from pellets coated with the aqueous ethylcellulose dispersion Aquacoat® ECD 30
containing guar gum was virtually unaffected by the addition of 40 % ethanol to the release
medium. This is because the ethanol insoluble guar gum effectively avoids undesired
ethylcellulose dissolution in ethanol-rich bulk fluids. However, the importance of crucial
formulation parameters, including the minimum amount of guar gum to be incorporated and
the minimum required guar gum viscosity, was not yet clear. The aim of this thesis was to
identify the most important film coating properties, determining whether or not the
resulting drug release kinetics is ethanol-resistant. Theophylline matrix cores were coated
with various Aquacoat® ECD 30:guar gum blends, varying the polymer blend ratio, guar gum
viscosity and degree of dilution of the final coating dispersion. Importantly, it was found that
more than 5 % guar gum (referred to the total polymer content) must be incorporated in the

Chapter 8 :Summary
144
film coating and that the apparent viscosity of a 1% aqueous guar gum solution must be
greater than 150 cP to provide ethanol-resistance. In contrast, the investigated degree of
coating dispersion dilution was not found to be decisive for the ethanol sensitivity.
Furthermore, all investigated formulations were long term stable, even upon open storage
under stress conditions for 6 months. To elucidate the mass transport mechanisms
controlling drug release from these systems, drug release from single pellets and ensembles
of pellets was measured in various release media. Changes in the systems’ morphology,
composition and mechanical properties were monitored using SEM, gravimetrical analysis
and a texture analyzer. Based on the obtained experimental results a mechanistically
realistic mathematical model was identified and used to quantitatively predict drug release
from coated pellets in ethanol-free and ethanol-containing bulk fluids. Drug diffusion though
the intact polymeric film coatings was found to be likely the dominant mass transport
mechanism in the investigated systems, irrespective of the ethanol content in the
surrounding environment. An appropriate solution of Fick’s law could be used to
quantitatively predict theophylline release from pellets coated with different
ethylcellulose:guar gum blends at different coating levels. Importantly, independent
experiments confirmed the theoretical predictions. In silico simulations can help facilitating
the optimization of the novel ethanol-resistant polymeric film coatings, avoiding time-
consuming and cost-intensive series of trial-and-error experiments. The presence/absence of
ethanol does not affect the underlying drug release mechanisms.
In addition, terahertz pulsed imaging (TPI) was employed to explore its suitability for
detecting differences in the film coating thickness and drug layer uniformity of multilayered,
sustained-release coated, standard size pellets (approximately 1 mm in diameter). Pellets
consisting of a sugar starter core and a metoprolol succinate layer were coated with a
Kollicoat® SR:Kollicoat® IR polymer blend for different times giving three groups of pellets
(batches I, II and III), each with a different coating thickness according to weight gain. Ten
pellets from each batch were mapped individually to evaluate the coating thickness (CT) and
drug layer thickness (DLT) between batches, between pellets within each batch, and across
individual pellets (uniformity). From the terahertz waveform the terahertz electric field peak
strength (TEFPS) was used to define a circular area (approximately 0.4 mm2) in the TPI maps,
where no signal distortion was found due to pellet curvature in the measurement setup

Chapter 8 :Summary
145
used. The average CTs were 46 µm, 71 µm and 114 µm, for batches I, II and III respectively,
whilst no DLT difference between batches was observed. No statistically significant
differences in the average CT and DLT within batches (between pellets) but high thickness
variability across individual pellets was observed. These results were confirmed by scanning
electron microscopy (SEM). The CT results correlated with the subsequent drug release
behaviour. The fastest drug release was obtained from batch I with the lowest CT and the
slowest from batch III with the highest CT. In conclusion, TPI is suitable for detailed, non-
destructive evaluation of film coating and drug layer thicknesses in multilayered standard
size pellets.

Chapter 9 :Résumé
146
9. Résumé

Chapter 9 :Résumé
147
Dans cette thèse, les avancées concernant les systèmes oraux à libération contrôlée
de principe actif ont été appréhendées. Aussi bien les systèmes matriciels que les formes
enrobées ont été préparés, caractérisés et les mécanismes impliquant les phénomènes de
libération du principe actif ont été élucidés. C’est le cas pour des comprimés à base de lipide,
ainsi que d’un nouveau type de film d’enrobage montrant une résistance à l’éthanol et
finalement une nouvelle méthode de caractérisation pour des enrobages polymériques a été
mise au point, comme décrit brièvement ci-dessous.
Un modèle mathématique mécanique réaliste permettant de quantifier la libération de
vitamines à partir de matrice lipidique, le glyceryl behenate a été élucidé. Deux techniques
différentes de formulation : la compression directe et une suite d’extrusion en phase chauffante/
broyage/ compression directe ont permis la préparation de comprimés à base de Compritol 888.
L’acide nicotinique a été utilisé comme principe actif modèle hautement soluble dans le milieu
environnant. Un modèle théorique a été appliqué après l’observation des comprimés avant et
après mise en contact avec le milieu de libération. La base de la production de comprimés, est
d’une concentration identique en lactose et stéarate magnésium pour chaque lot et un taux
variable en principe actif de 10 à 50%. Les profils de libération ont montré l’influence du taux
de principe actif sur les cinétiques obtenues lié à un épuisement graduel de la vitamine et à
une augmentation des chemins de diffusion. Les observations de Guse en 2006 montrent
que les mécanismes impliqués lors de la libération à partir de la matrice lipidique sont liés au
phénomène de diffusion. Par application d’un modèle mathématique basé sur la diffusion
comme mécanisme de libération et sur la solubilité du principe actif, il est possible de
prédire l’impact des paramètres de formulation et de fabrication sur les cinétiques de
libération. Par fitting des résultats expérimentaux il est possible de déterminer le coefficient
de diffusion noté D, représentant la mobilité du PA au sein de la porosité du comprimé.
Connaissant ce coefficient de diffusion il est alors possible de prédire les cinétiques de
libération, et ce pour des comprimés à taux de chargement variable, de tailles différentes et
dépendamment de la méthode de préparation (figures 42 et 43).

Chapter 9 :Résumé
148
Figure 42 : Cinétiques de libération dans l’HCl 0.1N pour les comprimés obtenus par
compression directe (taux de chargement de 10 à 50 %) Les symboles représentent les
données expérimentales et les lignes pleines les théories prédites.
Figure 43 : Cinétiques de libération dans l’HCl 0.1N pour des comprimés obtenus par
compression/broyage/compression directe (taux de chargement de 10 à 50 %). Les symboles
représentent les données expérimentales et les lignes pleines les théories prédites.

Chapter 9 :Résumé
149
Il a été récemment introduit qu’un mélange d’éthylcellulose: gomme guar
permettrait une éthanol résistance. Des minigranules de théophylline enrobées par une
dispersion d’éthylcellulose Aquacoat ECD 30 contenant une fraction de gomme guar ont
montrées des libérations inchangées en contact d’un milieu avec une concentration d’alcool
atteignant les 40% en volume les protégeant de tout contact avec l’éthanol présent dans le
milieu de dissolution. Toutefois l’importance cruciale des paramètres de formulation,
notamment la quantité minimale de gomme guar à ajouter et la viscosité minimale requise
n’est pas claire. Il a donc été d’utilité de caractériser ce mélange dans le but d’avoir une
concentration et une viscosité minimale de gomme guar pour éviter les effets de « collage »
de ce dernier lors des processus d’enrobage, tout en permettant une concentration en
gomme guar suffisante pour les profils souhaités mais surtout pour conserver l’éthanol
résistance.
Des minigranules de théophylline ont ainsi été enrobées par plusieurs mélanges de
type Aquacoat ECD 30 : gomme guar, variant tant au niveau du ratio du mélange, qu’au
niveau de la viscosité et du degré de dilution dans la dispersion d’enrobage finale. Il a été
trouvé que plus de 5% de gomme guar (par rapport au contenu polymérique total) doit être
incorporé dans le film d’enrobage et une viscosité apparente pour une solution de gomme
guar à 1% doit être supérieure à 150 cPs pour induire une éthanol résistance. A fortiori, les
investigations concernant la dilution de la dispersion à enrober n’ont pas montrées
d’influence sur le sensitivité à l’éthanol. L’ensemble des formulations ont montré une longue
stabilité, cela même dans des conditions de stockage sous stress pendant 6 mois.

Chapter 9 :Résumé
150
Figure 44 : Importance de la viscosité apparente de la gomme guar (234 cP: éthanol
résistante vs 149 cP éthanol sensible) utilisée pour des enrobages de type 90 :10
éthylcellulose/gomme guar sur les profils de libération de théophylline des minigranules dans
un milieu HCl 0.1N avec ou sans éthanol durant les deux premières heures suivi par le tampon
phosphate pH 7.4 (20 % degré d’enrobage).
Pour élucider les mécanismes de transport de masses contrôlant les profils de
libération à partir de ces systèmes, une libération à partir d’une minigranule ou d’un
ensemble de minigranules a été mesuré dans différents milieux de libération. Des
changements dans la morphologie des systèmes, dans la composition et dans les propriétés
mécaniques ont été mesurés par l’utilisation de la MEB, des analyses gravimétrique et d’un
analyseur de texture. Basé sur ces observations expérimentales, un modèle mathématique
mécanistique et réalistique a été identifié et utilisé pour prédire quantitativement la
libération de principe actif à partir de minigranules enrobées dans un milieu enrichi en
éthanol et dans un milieu dépourvu en éthanol. Les phénomènes de diffusion au travers du
film d’enrobage intact a été prouvé être le mécanisme de transport de masse dominant dans
le système étudié, indépendamment de la présence d’éthanol dans le milieu environnant.
Une solution issue des lois de Fick pourra être utilisé pour prédire quantitativement la
libération de théophylline à partir de minigranules enrobées avec différents niveaux
d’enrobage pour une gamme de mélange éthylcellulose :gomme guar variable. Les données
expérimentales indépendantes confirment les prédictions théoriques. Les simulations In-

Chapter 9 :Résumé
151
silico peuvent alors aider dans l’optimisation des films d’enrobages résistants à l’éthanol,
éviter une consommation de temps et d’argent susceptibles d’intervenir par l’inutilité de
formulations inadaptées.
L’investigation de l’impact des paramètres de formulation, à savoir l’influence du
niveau d’enrobage sur les cinétiques de libérations et d’une autre part la détermination d’un
indice permettant de déterminer l’homogénéité de répartition de l’enrobage à la surface des
minigranules (TEFPS) a été mise au point. Dans ce but, des noyaux de sucrose sont
préalablement enrobés d’une couche de principe actif le succinate de métoprolol, suivi
d’une deuxième enrobage polymérique composé d’un mélange 75 :25 de Kollicoat
SR :Kollicoat IR pulverisé sur différents temps pour obtenir trois lots de minigranules, avec
chacun une épaisseur d’enrobage différente en accord avec la prise en poids. 10
minigranules venant de chaque lot sont alors visualisées par Sprectroscopie à Balayage afin
de visualiser la morphologie des minigranules, et sur des coupes déterminer la taille de 1)
l’enrobage de principe actif (DLT), 2) l’enrobage polymérique (CT). La même observation par
l’imagerie Terahertz a permis l’évaluation de la CT et DLT au sein d’un même lot et entre les
minigranules issues d’un même lot pour attester de l’uniformité. A partir des longueurs
d’ondes terahertz, le TEFPS (terahertz electric field peak strength) est utilisé pour définir une
aire circulaire (approximativement 0,4 mm2) dans la carte de TPI. Aucune distorsion du signal
n’a été rencontrée due à la haute courbure de la minigranule dans l’équipement de mesure
utilisé.
La moyenne pour l’épaisseur de la couche polymérique est de 46 µm, 71 µm and 114
µm, pour les lots I, II and III respectivement, alors qu’aucune différence dans l’épaisseur de
la couche de principe actif n’a été recensée. Au sein d’un même lot, aucune différence
significative dans l’épaisseur de la CT et DLT n’a été mesurée, mais une haute variabilité dans
l’épaisseur entre chaque individu a été observée. Les mesures de la taille du film
polymérique pour les différents lots ont été corrélés avec les comportements de libération.
Une rapide libération du principe actif a été obtenue pour le lot 1 avec une faible épaisseur
de CT et une plus haute retenue avec l’épaisseur la plus importante. Pour conclure, TPI est
une technique efficace dans l’évaluation non destructive de film d’enrobage et de couche de
principe actif dans des systèmes multicouches de tailles standard.

Chapter 9 :Résumé
152
Figure 45 : Corrélation entre les données obtenues par TPI : épaisseur et homogénéité de
l’enrobage de surface et celles obtenues par dissolution classique : profils de libération.