Allosteric regulation alters carrier domain translocation in ...
Upload
khangminh22Category
view
2download
0
Prior Low- or High-Intensity Exercise Alters Pacing Strategy, Energy System Contribution and Performance during a 4-km Cycling Time Trial
This is the Published version of the following publication
Correia-Oliveira, CR, Santos, RA, Silva-Cavalcante, MD, Bertuzzi, R, Kiss, MAPD, Bishop, David and Lima-Silva, Adriano E (2014) Prior Low- or High-Intensity Exercise Alters Pacing Strategy, Energy System Contribution and Performance during a 4-km Cycling Time Trial. PLoS ONE, 9 (10). ISSN 1932-6203
The publisher’s official version can be found at http://journals.plos.org/plosone/article?id=10.1371/journal.pone.0110320Note that access to this version may require subscription.
Downloaded from VU Research Repository https://vuir.vu.edu.au/28825/
Prior Low- or High-Intensity Exercise Alters PacingStrategy, Energy System Contribution and Performanceduring a 4-km Cycling Time TrialCarlos Rafaell Correia-Oliveira1,2, Ralmony Alcantara Santos1,3, Marcos David Silva-Cavalcante1,2,
Romulo Bertuzzi2, Maria Augusta Peduti Dal’Molin Kiss2, David John Bishop4, Adriano Eduardo Lima-
Silva1*
1 Sports Science Research Group, Department of Physical Education and Sports Science, CAV, Federal University of Pernambuco, Vitoria de Santo Antao, Pernambuco,
Brazil, 2 Endurance Performance Research Group, School of Physical Education and Sport, University of Sao Paulo, Sao Paulo, Sao Paulo, Brazil, 3Nephrology Division,
Department of Medicine, Federal University of Sao Paulo, Sao Paulo, Sao Paulo, Brazil, 4 Institute of Sport, Exercise and Active Living, College of Sport and Exercise Science,
Victoria University, Melbourne, Victoria, Australia
Abstract
We analyzed the influence of prior exercise designed to reduce predominantly muscle glycogen in either type I or II fiberson pacing and performance during a 4-km cycling time trial (TT). After preliminary and familiarization trials, in a randomized,repeated-measures crossover design, ten amateur cyclists performed: 1) an exercise designed to reduce glycogen of type Imuscle fibers, followed by a 4-km TT (EX-FIB I); 2) an exercise designed to reduce glycogen of type II muscle fibers, followedby a 4-km TT (EX-FIB II) and; 3) a 4-km TT, without the prior exercise (CONT). The muscle-glycogen-reducing exercise in bothEX-FIB I and EX-FIB II was performed in the evening, ,12 h before the 4-km TT. Performance time was increased and poweroutput (PO) was reduced in EX-FIB I (432.868.3 s and 204.9610.9 W) and EX-FIB II (428.766.7 s and 207.569.1 W)compared to CONT (420.866.4 s and 218.469.3 W; P,0.01), without a difference between EX-FIB I and EX-FIB II (P.0.05).The PO was lower in EX-FIB I than in CONT at the beginning and middle of the trial (P,0.05). The mean aerobic contributionduring EX-FIB I was also significantly lower than in CONT (P,0.05), but there was no difference between CONT and EX-FIB IIor between EX-FIB I and EX-FIB II (P.0.05). The integrated electromyography was unchanged between conditions (P.0.05).Performance may have been impaired in EX-FIB I due a more conservative pacing at the beginning and middle, which wasassociated with a reduced aerobic contribution. In turn, the PO profile adopted in EX-FIB II was also reduced throughout thetrial, but the impairment in performance may be attributed to a reduced glycolytic contribution (i.e. reduced lactateaccumulation).
Citation: Correia-Oliveira CR, Santos RA, Silva-Cavalcante MD, Bertuzzi R, Kiss MAPD, et al. (2014) Prior Low- or High-Intensity Exercise Alters Pacing Strategy,Energy System Contribution and Performance during a 4-km Cycling Time Trial. PLoS ONE 9(10): e110320. doi:10.1371/journal.pone.0110320
Editor: Andrea Macaluso, University of Rome Foro Italico, Italy
Received February 19, 2014; Accepted September 20, 2014; Published October 20, 2014
Copyright: � 2014 Correia-Oliveira et al. This is an open-access article distributed under the terms of the Creative Commons Attribution License, which permitsunrestricted use, distribution, and reproduction in any medium, provided the original author and source are credited.
Funding: The authors have no support or funding to report.
Competing Interests: The authors have declared that no competing interests exist.
* Email: [email protected]
Introduction
To date, the effects of reduced endogenous carbohydrate
(CHO) stores on performance during a time trial (TT) has received
limited attention [1–4]. A study by Rauch et al. [1] reported that
three days on a high-CHO diet resulted in an increase in the mean
power output (PO) during a 60-min cycling TT compared to a
control-CHO diet. This increase in PO occurred as early as the
first minute of exercise. Despite significantly different starting
muscle glycogen values and TT performances, it is interesting to
note that the CHO-loaded condition enabled the participants to
finish the trial with the same critical low muscle glycogen level as
the control-CHO condition [1]. Recently, a reduction in overall
performance (,11%) was observed during a middle-distance
cycling TT (200 kJ, ,12 min) carried out after a validated
protocol designed to lower muscle glycogen content, when
compared to a control condition [3]. This reduction in perfor-
mance was accompanied by a shorter fast-start, followed by a less
pronounced increase in PO during the last part of the trial. The
authors attributed the impaired PO at the end to a reduced
glycogenolytic activity. Indeed, the final sprint seems to occur as a
result of the spared muscle glycogen and anaerobic capacity in the
earlier stages of a TT, accompanied by a consequent increase in
the anaerobic energy expenditure at the end of the trial [3,5,6].
Together, these results suggest that pacing during a cycling TT is
affected by pre-exercise muscle glycogen availability.
While it seems clear that pre-exercise muscle glycogen
availability affects the pacing strategy, it is not known if fiber-
selective glycogen depletion will have different effects on pacing
strategy. Due to the high-intensity at the beginning of a middle-
distance cycling TT [7], type II fibers may have a greater
contribution initially [8–10]. However, since type II fibers are
quickly fatigable, a decline in PO after a fast start may be
associated with a reduced contribution from type II fibers [11],
preserving the limited anaerobic energy reserve of type II fibers to
support the increase in PO in the last part of the trial [5]. These
specific changes in muscle fiber recruitment pattern during a
typical middle-distance TT have not been investigated, probably
PLOS ONE | www.plosone.org 1 October 2014 | Volume 9 | Issue 10 | e110320
due to limitations of the gold-standard muscle biopsy technique.
Since this technique can increase variability and interfere directly
with athletes’ pacing strategy and performance, the utilization of
more practical and applied protocols has been recommended [12].
An interesting and practical manner to test the effects of fiber-
selective glycogen depletion on pacing strategy would be to use
validated protocols to reduce selectively the muscle glycogen
content of type I or II fibers [8–10], and to verify if this affects
pacing strategy and performance during a cycling TT. It has been
shown that prolonged exercise lasting ,3 h predominantly
reduces the muscle glycogen stores from type I fibers [8,10],
while high-intensity, intermittent exercise reduces the muscle
glycogen from type II fibers [9,10]. Furthermore, the results would
have important practical implications since many athletes partic-
ipate in multi-stage races in which they perform a middle-distance
TT a few hours after either prolonged or short cycling races.
Therefore, the aim of this study was to analyze the influence of
prior selective muscle glycogen-lowering exercise, designed to
predominantly reduce the muscle glycogen content of either type I
or II fibers, on pacing strategy and performance during a 4-km
cycling TT. We hypothesized that the exercise protocol designed
to predominantly lower the muscle glycogen content of type I
fibers would impair PO during the midpoint of the TT, while the
exercise protocol designed to predominantly lower the muscle
glycogen content of type II fibers would impair PO at the
beginning and during the last part of the TT. In order to provide
some insights about muscle recruitment [13], we also measured
the muscle EMG signal throughout the TT.
Methods
Ethics StatementThis study was approved by the Ethics Committee of the
Federal University of Alagoas.
ParticipantsTen amateur, competitive cyclists [age 3362 years, mass
74.463.3 kg, height 173.762.4 m, body fat 12.361.6%, peak
oxygen uptake (VO2peak) 4.160.1 L?min21
(55.362.6 mL?kg21?min21), peak PO (PPO) 253.568.6 W] took
part in this study. The athletes trained regularly (4–5 days per
week) for more than 60 minutes per day and cycled more than
200 km per week. The sample size required was estimated, using
mean power output (i.e. performance) as the main outcome, from
the equation n= 8e2/d2, as suggested by Hopkins [14], where n, e,and d denote predicted sample size, coefficient of variation, and
the magnitude of the treatment effect, respectively. Coefficient of
variation was assumed to be 1.9% [15] and a detection of a very
conservative 2% difference as statistically significant would require
at least 7 participants. All study procedures, as well as protocol,
benefits, and risks were explained before the commencement of
the trials, and participants gave their written informed consent.
Experimental DesignParticipants reported to the laboratory on seven different
occasions. During the first visit, participants answered a question-
naire on readiness for physical activity (PAR-Q), and underwent
anthropometric measures [16] and an incremental test to establish
their VO2peak and PPO [17]. At the second visit, participants
performed a 4-km cycling familiarization trial. The subsequent
visits (visits 3 to 7) were performed in a randomized and repeated-
measures crossover design. In the evening before the main trial
(,7PM), participants performed either an exercise protocol
designed to predominantly reduce muscle glycogen content in
type I fibers (EX-FIB I) [10], or type II fibers (EX-FIB II) [10], or
no exercise (CONT). Participants then followed a standardized
diet and performed in the next morning (,7 AM) a 4-km TT. A
1-week interval was applied between the experimental sessions to
wash out any residual effect of fatigue. The tests were performed at
the same time of the morning to minimize circadian variation [18].
Participants performed all tests (incremental and TTs) on a
provided racing bike attached to a stationary cyclosimulator
(Trainer Flow Ergo T1680, Tacx, Wassenaar, Netherlands).
Before each trial, the cyclosimulator was calibrated in accordance
with the manufacturer’s recommendations. To date, the reliability
and accuracy of the specific cyclosimulator model used in the
present study has not been reported, although this has previously
been provided in a similar cyclosimulator from the same
manufacturer [19]. Participants were asked to refrain from
vigorous physical activity, alcohol, tobacco, and caffeine for
24 hours before each experimental session. Subjects were blinded
to the objectives of this study until all tests had been performed.
Incremental testThe seat was adjusted vertically and horizontally for each
participant and cycling shoes were used to secure the feet to the
pedals. The seat position was recorded and replicated during all
subsequent experimental trials. Participants performed an incre-
mental test starting with a 3-min warm-up at 100 W. After the
warm up, 30 W increments were applied every minute until the
participant could no longer maintain the required pedal frequency
between 80–90 rev?min21. Measures of VO2, carbon dioxide
production, and ventilation were continuously sampled through-
out the test and averaged over 30-s intervals using an on-line
breath-by-breath gas analyzer (Quark CPET, Cosmed, Rome,
Italy). VO2peak was defined as the average VO2 during the last
30 s of the test. PPO was determined as the highest PO achieved
during the last completed 60-s stage. When participants were not
able to complete the last stage, the PPO was calculated from the
following equation:
PPO~POc z t=60| 30ð Þ ð1Þ
where POc is the PO in watts of the last completed stage
performed by the participant, t is the time (in seconds) sustained
during the last incomplete stage, and 30 corresponds to the
increments in PO in watts at each stage.
Familiarization trialThe gear ratio was standardized at the beginning of the TT (i.e.,
53616), but participants were free to adjust the gear and pedal
frequency once the TT had started. The participants were
instructed to perform the TT in the shortest possible time and
to remain seated throughout test. During the 48 h before the trial,
the athletes were instructed to record all foods consumed (type,
amount and time). These registers were later used to standardize
the diet before the experimental trials. The validity of the diet
register has been described in previous studies [20].
Exercise protocols to reduce muscle glycogen contentFor the three conditions, participants were asked to replicate
exactly the diets recorded before the familiarization session during
the morning and afternoon of the muscle-glycogen-reducing
exercise day (total energy intake ,2400 kcal, 60% CHO, 20%
protein, and 20% fat). Participants arrived at the laboratory in the
evening (between 6:00 and 8:00 PM), at least two hours after their
last meal. Then, they either cycled at an intensity corresponding to
CHO-Lowering Exercise and Pacing Strategy
PLOS ONE | www.plosone.org 2 October 2014 | Volume 9 | Issue 10 | e110320
30% of their PPO (75.962.6 W) for 3 h or performed 10 sets of
1 min at a PO corresponding to 120% of their PPO
(303.8610.3 W), interspersed with 5-min rest periods. These
protocols were designed to reduce predominantly the muscle
glycogen stores from either type I fibers (evening before EX-FIB I
trial) [8,10] or type II fibers (evening before EX-FIB II trial)
[9,10], respectively. These protocols were validated by Carter
et al. [10] using biopsies of the vastus lateralis muscle. They
showed that after an exercise at 30% PPO for 3 h, approximately
94% of type I fibers had their muscle glycogen depleted, while just
30 and 4% of the type IIa and IIx fibers, respectively, were
depleted. On the other hand, after an exercise at 120% PPO,
approximately 99% of type II fibers (type IIa and IIx) were
depleted, while only 15% of the type I fibers had their muscle
glycogen reduced. These results have also been corroborated by
others [8,9].
Following the muscle-glycogen-reducing protocols
(,10:00 PM), the participants were instructed to consume a
low-CHO dinner (total energy ,480 kcal, 13% CHO, 26%
protein, and 61% fat) provided by the investigators and instructed
to not consume any other additional food. For the control trial,
participants were asked to consume a normal-CHO dinner (total
energy intake ,480 kcal, 67% CHO, 13% protein, and 20% fat),
but no exercise was carried out in the prior evening.
Experimental trialsExperimental tests were performed the next morning (between
8:00 and 10:00 AM) in a stable laboratory environment (22.961.1
uC and 44.962.9% relative humidity). Two hours before the trials,
participants consumed a standardized breakfast, either with,67%
CHO, 13% protein, and 20% fat (,680 kcal) for the CONT
condition (equal to amount usually consumed as registered in the
recall), or containing a low CHO content (,680 kcal, 13% CHO,
26% protein, and 61% fat) for both EX-FIB I and EX-FIB II
conditions. A reduced CHO breakfast was administered during
EX-FIB I and EX-FIB II conditions to guarantee that muscle
glycogen would not have been replenished [21]. Maximal
voluntary contractions were carried out immediately before each
TT. Thereafter, the participants performed a 5-min warm-up at
100 W followed by a 5-min recovery. Then, a 4-km cycling TT
was completed as fast as possible. Feedback about elapsed distance
was given every 200 m, but participants were not informed about
PO, velocity or cadence.
MeasurementsVO2, carbon dioxide production, ventilation, and respiratory
exchange ratio (RER) were measured breath-by-breath during all
experimental trials. Participants used a mask with ventilation and
gas exchange responses measured via a computerized system
(Quark CPET, Cosmed, Rome, Italy). The gas analyzer was
calibrated according to the manufacturer’s specifications before
each test (Quark CPET instruction manual) using room air and a
standard gas mixture (16% oxygen and 5% carbon dioxide). The
ventilometer was calibrated with a 3-L syringe. The PO was
measured every 1 second (Tacx Trainer software 3.0, Wassenaar,
Netherlands).
25 mL of blood were drawn from the ear lobe at rest,
immediately before (Pre-TT), and 1 min after the TT (Post-TT).
The blood samples were transferred into micro-tubes containing
sodium fluoride (1%) and then centrifuged at 3000 rpm at 5uC for
10 minutes. Plasma lactate concentrations [La] were measured
through enzymatic colorimetric reactions in a spectrophotometer
(546 nm wavelength, model Q798U2V5, Quimis, Sao Paulo,
Brazil).
To obtain the EMG signal, the skin of the vastus lateralis muscle
of the right leg was shaved, abraded, and cleansed with isopropyl
alcohol. Then, bipolar surface silver-silver chloride electrodes (Hal,
Sao Paulo, Brazil), at a 20-mm interelectrode distance, were
placed over the muscle belly and aligned to the muscle fiber
direction. Before the TT, four 5-s submaximal isometric contrac-
tions of the knee (50%, 60%, 70% and 80% of the participant’s
subjective maximum) were performed as a warm-up [22].
Thereafter, the maximal voluntary contraction and corresponding
EMG signal were obtained. Participants carried out three 5-s
isometric maximal voluntary contractions of the knee extensors of
both legs at an angle of 60u (full knee extension being the 0u), witha 1-min rest between them [23]. Participants were verbally
encouraged during each maximal voluntary contraction. The peak
force during the three contractions was measured by a load cell
(EMG System Brazil, Sao Paulo, Brazil). The EMG signal of
vastus lateralis muscle during each maximal voluntary contraction,
as well as during each TT (every 200 m), was captured during 5-s
intervals with a sampling frequency of 2000 Hz (Four-channel
electromyograph, model 410C, EMG System Brazil, Sao Paulo,
Brazil). Raw EMG signals were full-wave rectified and, to remove
external interference noise and movement artifacts, filtered with a
second-order, Butterworth, band-pass filter with cut-off frequen-
cies set at 10 and 400 Hz. The integrated EMG (iEMG) was
normalized by dividing the value obtained during the TT (at each
200 m) by the iEMG obtained during the highest maximal
voluntary contraction [22,23]. The procedures were performed
using MATLAB 7.5 software (Mathworks Inc., Natick, US).
CalculationsThe PO corresponding to aerobic and anaerobic contribution
(Paer and Pan, respectively) were estimated from calculations using
the metabolic power and gross mechanical efficiency, in accor-
dance with Hettinga et al. [24]. First, the Pmet was calculated from
the following equation [25]:
Metabolic power Wð Þ
~VO2 L:min{1� �
: 4940 :RERz 16,040ð Þ = 60ð Þð2Þ
where VO2 is the oxygen uptake in L?min21 and RER is the
respiratory exchange ratio. During the warm-up for each
experimental trial, the gross mechanical efficiency was determined
using the following equation:
Grossmechanical efficiency
~POwarm{up =metabolic powerð3Þ
where POwarm-up is the PO in the warm-up (i.e., 100 W). As gross
mechanical efficiency was not different across the conditions, the
values were averaged for subsequent analyses. The Paer during the
TT was calculated by the equation:
Paer ~metabolic power : grossmechanical efficiency ð4Þ
where Paer is the aerobic mechanical power output. An RER equal
to 1.00 was assumed during the TT to calculate Pmet [24]. The Panwas calculated from the following equation:
Pan ~PO{Paer ð5Þ
CHO-Lowering Exercise and Pacing Strategy
PLOS ONE | www.plosone.org 3 October 2014 | Volume 9 | Issue 10 | e110320
where Pan is the anaerobic mechanical power output, PO is the
power output and Paer is the aerobic power output.
Statistical analysisData distribution was verified by Shapiro-Wilk’s test. Means of
the performance time, PO, Paer, Pan, iEMG, and maximal
voluntary contraction were compared between experimental
conditions using repeated-measures ANOVA. When a significant
effect was found, the main effect was analyzed using the least
significant difference test for pairwise comparisons. A linear mixed
model with Bonferroni correction was used to verify the effects of
condition and distance on dependent variables (PO, Paer, Pan,
iEMG and [La]). To allow magnitude-based inferences about
practical effects of prior low or high-intensity exercises on 4-km
cycling time-trial performance, the uncertainty in the effects were
expressed as likelihoods that the true value of the effects represent
substantial changes (harmful, trivial or beneficial) [26]. The
smallest standardized change was assumed to be 0.20. Data are
expressed as means and standard error of the mean (mean 6
SEM). All analyses were carried out in SPSS (13.0) software and
the statistical significance was accepted at p,0.05.
Results
Maximal voluntary contractionThe maximal voluntary contraction carried out immediately
before each TT was not significantly different between the three
experimental conditions (CONT: 1332.5680.1, EX-FIB I:
1265.5674.2 and EX-FIB II: 1305.1659.1 N; P.0.05), indicating
that there was no influence (residual effect of muscle fatigue) from
the exercise protocol performed in the evening before the TT.
Time trial performance, and mean PO, Paer, Pan and iEMGThe means for performance time, PO, Paer, Pan, and iEMG are
shown in Table 1. The time to complete the TT was significantly
slower in EX-FIB I (P= 0.001) and EX-FIB II (P = 0.004) than in
CONT, but there was no difference between EX-FIB I and EX-
FIB II (P = 0.344). Using magnitude-based inferences, the prior
low- and high-intensity exercise revealed a 98.5 and 92.6% chance
that the true value of the effect statistic is ‘very likely’ and ‘likely’
harmful to performance, respectively. Similarly, mean PO was
lower in EX-FIB I (P= 0.001) and EX-FIB II (P = 0.025) than in
CONT, but there was no difference between EX-FIB I and EX-
FIB II (P = 0.705). Likewise, the corresponding qualitative
inferences were 98.3 and 86.2% ‘very likely’ and ‘likely’ harmful
to performance, respectively. The mean Paer in the EX-FIB I was
significantly lower than in the CONT (P,0.05), but there was no
difference between CONT and EX-FIB II or between EX-FIB I
and EX-FIB II (P.0.05). Mean Pan and iEMG were similar for all
conditions (P.0.05).
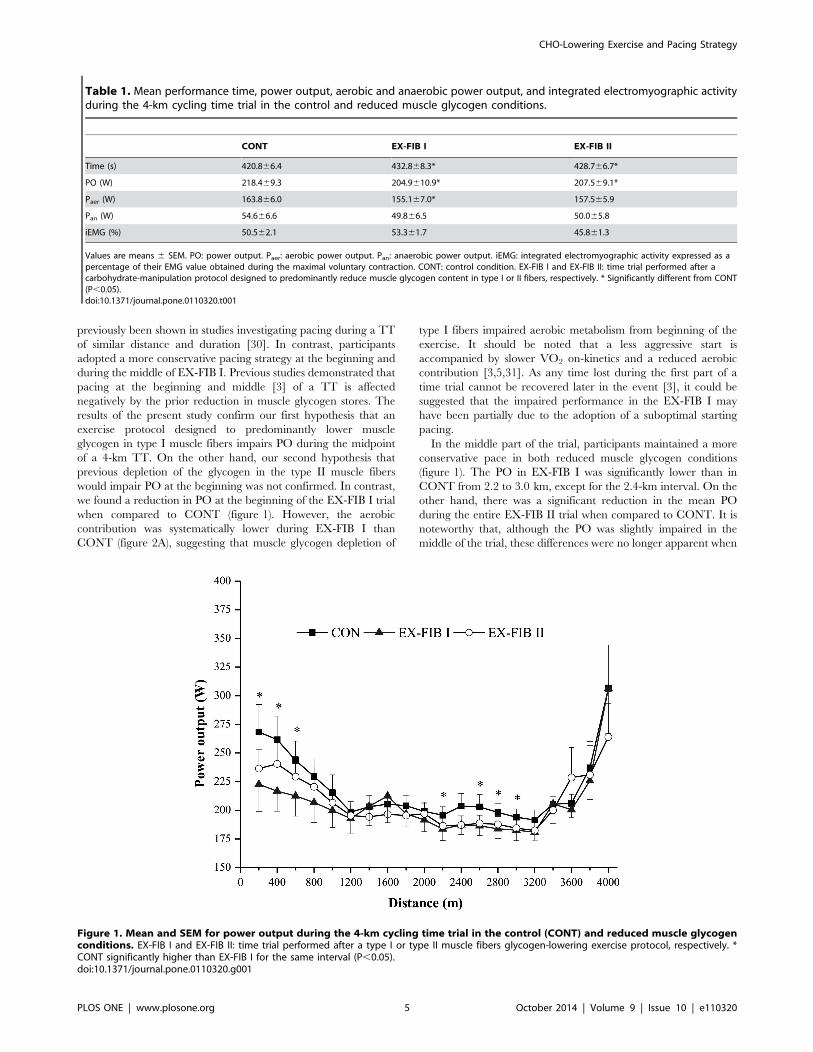
Pacing strategyThere were significant main effects for condition (P,0.05),
distance (P,0.05), and interaction effects (P,0.05) for PO
(figure 1). In the EX-FIB I condition, participants adopted a
more conservative pacing strategy at the beginning and middle of
the trial, when compared with CONT (P,0.05). The PO during
the first 400 m and last 200 m was significantly higher than several
points in the middle of the TT for CONT, but remained relatively
stable up to 3.8 km in both EX-FIB I and EX-FIB II (P.0.05),
when there was a significant increase in the last 200 m (figure 1).
The results concerning the Paer and Pan every 200 m are shown
in Figures 2A and 2B, respectively. Main effects for condition and
distance were found for Paer (P,0.05), but there was no significant
interaction (P.0.05). In all conditions, the Paer increased
exponentially and stabilized after the first 800 m (P,0.05), but
was systematically lower during EX-FIB I than in the control (P,
0.05).
There was also a main effect for Pan only for distance (P,0.05),
but no condition (P.0.05) or interaction effect (P.0.05). In
general, the Pan in the first 600 m and last 200 m was higher than
the other intervals for all conditions (P,0.05; figure 2B).
iEMG and Plasma lactateThere was no main effect for condition or distance, or an
interaction effect, for iEMG (P.0.05; figure 3). A main effect for
condition (P,0.05) and time (P,0.05), and an interaction effect
(P,0.05), was observed for [La] (Table 2). The [La] increased
significantly with exercise in all three conditions, but the increase
was less pronounced in EX-FIB II than in CONT (P,0.05). There
were no differences between CONT and EX-FIB I or between
EX-FIB II and EX-FIB I (P.0.05).
Discussion
The aim of this study was to analyze the influence of two
different exercise protocols, designed to predominantly reduce
muscle glycogen levels in either type I or type II fibers, on pacing
and performance during a 4-km cycling TT. We had hypothesized
that an exercise protocol designed to reduce muscle glycogen in
type II fibers would impair PO at the beginning and last part of the
TT, while an exercise protocol designed to reduce muscle
glycogen of type I fibers would impair PO in the midpoint of
the TT. The main findings of the present study were that both
prior muscle-glycogen-reducing exercise protocols altered pacing
strategy and energy system contributions during a 4-km cycling
TT. As a consequence, overall performance was impaired after
both exercise protocols. These results might be attributed to a
more conservative PO distribution pattern adopted by the athletes
in the reduced muscle glycogen conditions. A decrease in PO at
the beginning and middle of the trial was observed in EX-FIB I,
accompanied by a reduced Paer throughout the trial. On the other
hand, PO mean and plasma [La] accumulation were decreased in
EX-FIB II. The iEMG remained unchanged throughout the TT
in all three conditions.
A lower mean PO and a longer time to completion of the TT
was observed in EX-FIB I and EX-FIB II compared with CONT.
Qualitative inferences indicated that these changes were ‘very
likely’ harmful and ‘likely’ when EX-FIB I and EX-FIB II were
compared to CON, respectively, suggesting that the impairments
in performance were meaningful. Using time-to-exhaustion tests, it
has previously been reported that performance during high-
intensity exercise (80–90% of VO2peak; 10–20 min) and supra
VO2peak exercise (115% of VO2peak; ,3 min) is impaired if
athletes start the trial after a muscle-glycogen-lowering exercise
protocol [27–29]. Likewise, the results of the present study are also
in accordance with earlier studies showing a reduction in
performance when participants performed a cycling TT after an
exercise protocol designed to reduce concomitantly the muscle
glycogen content of both type I and II muscle fibers [2–4].
However, to the best of our knowledge, this is the first study to
investigate these effects during a TT carried out after validated
exercise protocols designed to reduce selectively glycogen content
in specific muscle fibers (type I or II fibers).
The PO-versus-distance curve in CONT showed a classic initial
fast start, followed by a gradual decline in PO until completion of
approximately 80% (3.2 km) of the TT, when the PO increased
again in the last part, i.e. a U-shaped curve. This pacing model has
CHO-Lowering Exercise and Pacing Strategy
PLOS ONE | www.plosone.org 4 October 2014 | Volume 9 | Issue 10 | e110320
previously been shown in studies investigating pacing during a TT
of similar distance and duration [30]. In contrast, participants
adopted a more conservative pacing strategy at the beginning and
during the middle of EX-FIB I. Previous studies demonstrated that
pacing at the beginning and middle [3] of a TT is affected
negatively by the prior reduction in muscle glycogen stores. The
results of the present study confirm our first hypothesis that an
exercise protocol designed to predominantly lower muscle
glycogen in type I muscle fibers impairs PO during the midpoint
of a 4-km TT. On the other hand, our second hypothesis that
previous depletion of the glycogen in the type II muscle fibers
would impair PO at the beginning was not confirmed. In contrast,
we found a reduction in PO at the beginning of the EX-FIB I trial
when compared to CONT (figure 1). However, the aerobic
contribution was systematically lower during EX-FIB I than
CONT (figure 2A), suggesting that muscle glycogen depletion of
type I fibers impaired aerobic metabolism from beginning of the
exercise. It should be noted that a less aggressive start is
accompanied by slower VO2 on-kinetics and a reduced aerobic
contribution [3,5,31]. As any time lost during the first part of a
time trial cannot be recovered later in the event [3], it could be
suggested that the impaired performance in the EX-FIB I may
have been partially due to the adoption of a suboptimal starting
pacing.
In the middle part of the trial, participants maintained a more
conservative pace in both reduced muscle glycogen conditions
(figure 1). The PO in EX-FIB I was significantly lower than in
CONT from 2.2 to 3.0 km, except for the 2.4-km interval. On the
other hand, there was a significant reduction in the mean PO
during the entire EX-FIB II trial when compared to CONT. It is
noteworthy that, although the PO was slightly impaired in the
middle of the trial, these differences were no longer apparent when
Table 1. Mean performance time, power output, aerobic and anaerobic power output, and integrated electromyographic activityduring the 4-km cycling time trial in the control and reduced muscle glycogen conditions.
CONT EX-FIB I EX-FIB II
Time (s) 420.866.4 432.868.3* 428.766.7*
PO (W) 218.469.3 204.9610.9* 207.569.1*
Paer (W) 163.866.0 155.167.0* 157.565.9
Pan (W) 54.666.6 49.866.5 50.065.8
iEMG (%) 50.562.1 53.361.7 45.861.3
Values are means 6 SEM. PO: power output. Paer: aerobic power output. Pan: anaerobic power output. iEMG: integrated electromyographic activity expressed as apercentage of their EMG value obtained during the maximal voluntary contraction. CONT: control condition. EX-FIB I and EX-FIB II: time trial performed after acarbohydrate-manipulation protocol designed to predominantly reduce muscle glycogen content in type I or II fibers, respectively. * Significantly different from CONT(P,0.05).doi:10.1371/journal.pone.0110320.t001
Figure 1. Mean and SEM for power output during the 4-km cycling time trial in the control (CONT) and reduced muscle glycogenconditions. EX-FIB I and EX-FIB II: time trial performed after a type I or type II muscle fibers glycogen-lowering exercise protocol, respectively. *CONT significantly higher than EX-FIB I for the same interval (P,0.05).doi:10.1371/journal.pone.0110320.g001
CHO-Lowering Exercise and Pacing Strategy
PLOS ONE | www.plosone.org 5 October 2014 | Volume 9 | Issue 10 | e110320

separated into Paer and Pan for EX-FIB II, but Paer was
systematically reduced during EX-FIB I (figures 2A and 2B).
The Post-TT [La] was significantly lower in EX-FIB II than in
the CONT condition. An interaction effect indicates that the
increase in [La] with exercise was less pronounced during EX-FIB
II than during the CONT or EX-FIB I. A previous study has
suggested that an exercise protocol designed to reduce glycogen
from both type I and II muscle fibers reduces the anaerobic
capacity by close to 20% during a single high-intensity (175 to
400 W) square-wave exercise [32]. In the present study, a
significant reduction in plasma [La] accumulation during EX-
FIB II suggests that selective muscle glycogen depletion of type II
muscle fibers may produce a slightly reduce glycolysis during the
exercise. However, overall Pan was not affected (,9% of
reduction, not significant), suggesting that selective muscle
glycogen depletion may not produce a reduction in the anaerobic
Figure 2. Mean and SEM for aerobic (A) and anaerobic (B) contribution during the 4-km cycling time trial in control (CONT) andreduced muscle glycogen conditions. EX-FIB I and EX-FIB II: time trial performed after a type I or type II muscle fibers glycogen-lowering exerciseprotocol, respectively. (A) * Significantly main effect of condition (P,0.05).doi:10.1371/journal.pone.0110320.g002
CHO-Lowering Exercise and Pacing Strategy
PLOS ONE | www.plosone.org 6 October 2014 | Volume 9 | Issue 10 | e110320
metabolism of the same magnitude as when both types of fibers are
depleted concomitantly [32].
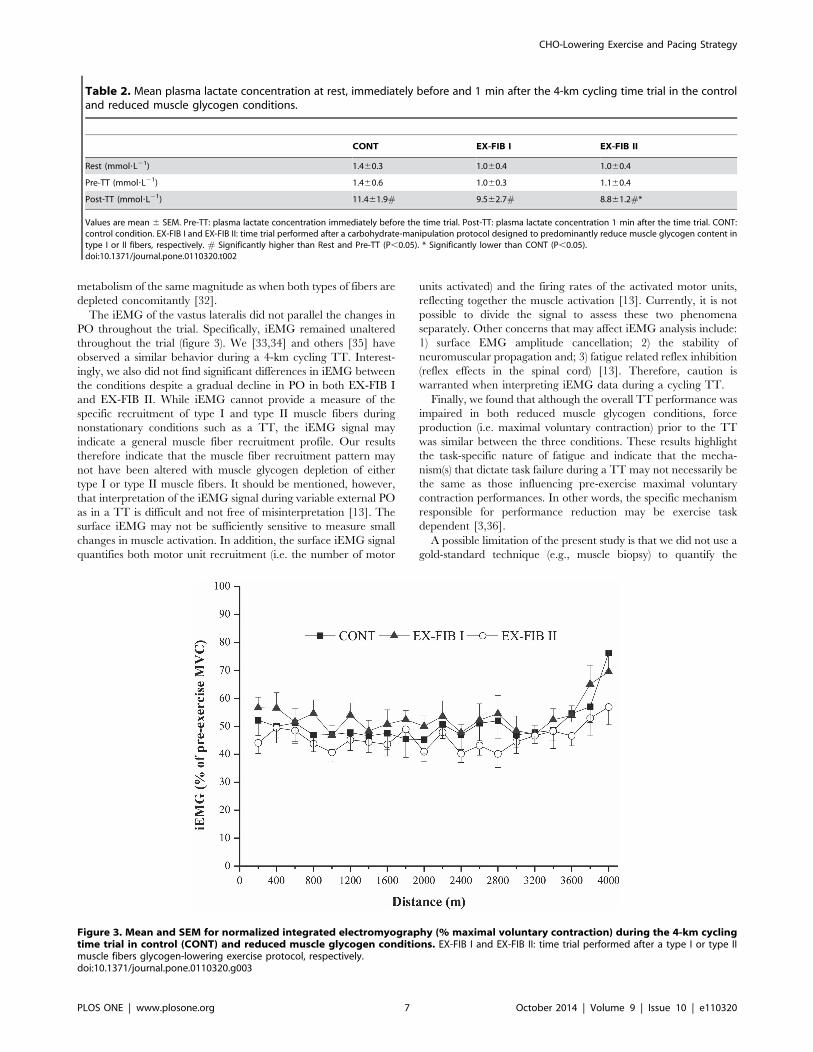
The iEMG of the vastus lateralis did not parallel the changes in
PO throughout the trial. Specifically, iEMG remained unaltered
throughout the trial (figure 3). We [33,34] and others [35] have
observed a similar behavior during a 4-km cycling TT. Interest-
ingly, we also did not find significant differences in iEMG between
the conditions despite a gradual decline in PO in both EX-FIB I
and EX-FIB II. While iEMG cannot provide a measure of the
specific recruitment of type I and type II muscle fibers during
nonstationary conditions such as a TT, the iEMG signal may
indicate a general muscle fiber recruitment profile. Our results
therefore indicate that the muscle fiber recruitment pattern may
not have been altered with muscle glycogen depletion of either
type I or type II muscle fibers. It should be mentioned, however,
that interpretation of the iEMG signal during variable external PO
as in a TT is difficult and not free of misinterpretation [13]. The
surface iEMG may not be sufficiently sensitive to measure small
changes in muscle activation. In addition, the surface iEMG signal
quantifies both motor unit recruitment (i.e. the number of motor
units activated) and the firing rates of the activated motor units,
reflecting together the muscle activation [13]. Currently, it is not
possible to divide the signal to assess these two phenomena
separately. Other concerns that may affect iEMG analysis include:
1) surface EMG amplitude cancellation; 2) the stability of
neuromuscular propagation and; 3) fatigue related reflex inhibition
(reflex effects in the spinal cord) [13]. Therefore, caution is
warranted when interpreting iEMG data during a cycling TT.
Finally, we found that although the overall TT performance was
impaired in both reduced muscle glycogen conditions, force
production (i.e. maximal voluntary contraction) prior to the TT
was similar between the three conditions. These results highlight
the task-specific nature of fatigue and indicate that the mecha-
nism(s) that dictate task failure during a TT may not necessarily be
the same as those influencing pre-exercise maximal voluntary
contraction performances. In other words, the specific mechanism
responsible for performance reduction may be exercise task
dependent [3,36].
A possible limitation of the present study is that we did not use a
gold-standard technique (e.g., muscle biopsy) to quantify the
Table 2. Mean plasma lactate concentration at rest, immediately before and 1 min after the 4-km cycling time trial in the controland reduced muscle glycogen conditions.
CONT EX-FIB I EX-FIB II
Rest (mmol?L21) 1.460.3 1.060.4 1.060.4
Pre-TT (mmol?L21) 1.460.6 1.060.3 1.160.4
Post-TT (mmol?L21) 11.461.9# 9.562.7# 8.861.2#*
Values are mean 6 SEM. Pre-TT: plasma lactate concentration immediately before the time trial. Post-TT: plasma lactate concentration 1 min after the time trial. CONT:control condition. EX-FIB I and EX-FIB II: time trial performed after a carbohydrate-manipulation protocol designed to predominantly reduce muscle glycogen content intype I or II fibers, respectively. # Significantly higher than Rest and Pre-TT (P,0.05). * Significantly lower than CONT (P,0.05).doi:10.1371/journal.pone.0110320.t002
Figure 3. Mean and SEM for normalized integrated electromyography (% maximal voluntary contraction) during the 4-km cyclingtime trial in control (CONT) and reduced muscle glycogen conditions. EX-FIB I and EX-FIB II: time trial performed after a type I or type IImuscle fibers glycogen-lowering exercise protocol, respectively.doi:10.1371/journal.pone.0110320.g003
CHO-Lowering Exercise and Pacing Strategy
PLOS ONE | www.plosone.org 7 October 2014 | Volume 9 | Issue 10 | e110320
muscle glycogen content. However, the muscle biopsy technique is
invasive and could have interfered directly with the athletes’
pacing and overall performance. Furthermore, the effectiveness of
the selective muscle glycogen-lowering exercises used in this study
is well established [8–10]. Gollnick et al. [8] found a reduced
muscle glycogen content in almost all type I fibers after 3 hours of
a constant-load exercise at 30% PPO. On the other hand, in the
protocol (10 sets of 1 min at 120% PPO) used by Thomson et al.
[9], almost all type II fibers had their muscle glycogen content
discernibly reduced. Later, Carter et al. [10] applied these two
validated protocols in their study and found that approximately
94% of type I fibers had their muscle glycogen depleted after the
prolonged-exercise protocol, whereas approximately 99% of type
II fibers had their muscle glycogen depleted after the high-intensity
protocol. An additional potential limitation is that the time for
recovery of muscle glycogen stores in type I and type II muscle
fibers may have been different. However, because we used a short
recovery period between the glycogen-depleting protocol and the
main TT (,12 h), and there were only two intervening meals, one
of them two hours before the TT, a significant muscle glycogen
replenishment is unlikely. Despite the total work during the
glycogen-depleting task differing between the trials, no significant
difference was found between pre-exercise maximal voluntary
contractions, suggesting no influence of the muscle glycogen
depletion protocol on pre-exercise neuromuscular fatigue. Taken
together, although we did not directly measure muscle glycogen
content, the results of these previous studies provide sufficient
evidence for the validity of these protocols for use in applied
research.
Conclusion
The results of the present study suggest that prior, prolonged,
low-intensity exercise (designed to reduce glycogen of type I
muscle fibers) was associated with impairment in PO at the
beginning and middle of a 4-km TT, and this was accompanied by
a reduction in the aerobic contribution. On the other hand, the
prior, short, high-intensity exercise (designed to reduce glycogen of
type II muscle fibers) impaired the PO and reduced the plasma
[La] accumulation. Irrespective of the inclusion of either a prior
prolonged, low-intensity exercise or short, high-intensity exercise,
an impairment in overall performance of a middle-distance cycling
TT was evident, but the pacing adopted, as well as energy system
alterations, occurred in a specific way. To the best of our
knowledge, this is the first study demonstrating that the
distribution of energy expenditure during a middle-distance
cycling TT is dependent of the intensity and duration of the
exercise carried out in the evening before.
Acknowledgments
Carlos Rafaell Correia-Oliveira Oliveira is grateful to Foundation of Aids
to Scientific Research of the State of Alagoas (FAPEAL) for his Masters
scholarship. The authors thank all of the cyclists who took part in this
study.
Author Contributions
Conceived and designed the experiments: CRC RAS MDS AEL.
Performed the experiments: CRC RAS MDS. Analyzed the data: CRC
RAS MDS RB MAPDMK DJB AEL. Contributed reagents/materials/
analysis tools: CRC RAS MDS RB MAPDMK DJB AEL. Wrote the
paper: CRC RAS MDS RB DJB AEL.
References
1. Rauch HG, St Clair Gibson A, Lambert EV, Noakes TD (2005) A signaling role
for muscle glycogen in the regulation of pace during pro-longed exercise.Br J Sports Med 39: 34–38.
2. Johnson NA, Stannard SR, Chapman PG, Thompson MW (2006) Effect of
altered pre-exercise carbohydrate availability on selection and perception ofeffort during prolonged cycling. Eur J Appl Physiol 98: 62–70.
3. Lima-Silva AE, Correia-Oliveira CR, Tenorio L, Melo AA, Bertuzzi R, et al.(2013) Prior exercise reduces fast-start duration and end-spurt magnitude during
cycling time-trial. Int J Sports Med 34: 736–741.
4. Correia-Oliveira CR, Bertuzzi R, Dal’molin Kiss MA, Lima-Silva AE (2013)
Strategies of dietary carbohydrate manipulation and their effects on perfor-mance in cycling time trials. Sports Med 43: 707–719.
5. Jones AM, Wilkerson DP, Vanhatalo A, Burnley M (2008) Influence of pacingstrategy on O2 uptake and exercise tolerance. Scand J Med Sci Sports 18: 615–
626.
6. Corbett J, Barwood MJ, Parkhouse K (2009) Effect of task familiarisation on
distribution of energy during a 2000 m cycling time trial. Br J Sports Med 43:
770–774.
7. Foster C, de Koning JJ, Hettinga F, Lampen J, Dodge C, et al. (2004) Effect of
competitive distance on energy expenditure during simulated competition.Int J Sports Med 25: 198–204.
8. Gollnick PD, Piehl K, Saltin B (1974) Selective glycogen depletion pattern inhuman muscle fibres after exercise of varying intensity and at varying pedalling
rates. J Physiol 241: 45–57.
9. Thomson JA, Green HJ, Houston ME (1979) Muscle glycogen depletion
patterns in fast twitch fibre subgroups of man during submaximal and
supramaximal exercise. Pflugers Arch 379: 105–108.
10. Carter H, Pringle JS, Boobis L, Jones AM, Doust JH (2004) Muscle glycogen
depletion alters oxygen uptake kinetics during heavy exercise. Med Sci SportsExerc 36: 965–972.
11. Pringle JS, Doust JH, Carter H (2003) Oxygen uptake kinetics during moderate,heavy and severe intensity submaximal exercise in humans: the influence of
muscle fibre type and capillarisation. Eur J Appl Physiol 89: 289–300.
12. Jeukendrup A, Brouns F, Wagenmakers AJ, Saris WH (1997) Carbohydrate-
electrolyte feedings improve 1 h time trial cycling performance. Int J SportsMed 18: 125–129.
13. Weir JP, Beck TW, Cramer JT, Housh TJ (2006) Is fatigue all in your head? A
critical review of the central governor model. Br J Sports Med 40: 573–586.
14. Hopkins WG (2000) Measures of reliability in sports medicine and science.
Sports Med 30: 1–15.
15. Stone MR, Thomas K, Wilkinson M, St Clair Gibson, Thompson KG (2011)
Consistency of perceptual and metabolic responses to a laboratory-based
simulated 4,000-m cycling time trial. Eur J Appl Physiol 111: 1807–1813.
16. Jackson AS, Pollock ML (1978) Generalized equations for predicting body
density of men. Br J Nut 40: 497–504.
17. Bentley DJ, Newell J, Bishop DJ (2007) Incremental exercise test design and
analysis: implications for performance diagnostics in endurance athletes. Sports
Med 37: 575–586.
18. Racinais S, Perrey S, Denis R, Bishop DJ (2010) Maximal power, but not
fatigability, is greater during repeated sprints performed in the afternoon.
Chronobiol Int 27: 855–64.
19. Peiffer JJ, Losco B (2011) Reliability/Validity of the fortius trainer. Int J Sports
Med 32: 353–356.
20. Magkos F, Yannakoulia M (2003) Methodology of dietary assessment in athletes:
concepts and pitfalls. Curr Opin Clin Nutr Metab Care 6: 539–549.
21. Bergstrom J, Hermansen L, Hultman E, Saltin B (1967) Diet, muscle glycogen
and physical performance. Acta Physiol Scand 71: 140–150.
22. Albertus-Kajee Y, Tucker R, Derman W, Lamberts RP, Lambert MI (2011)
Alternative methods of normalising EMG during running. J Electromyogr
Kinesiol 21: 579–586.
23. Ansley L, Schabort E, St Clair Gibson A, Lambert MI, Noakes TD (2004)
Regulation of pacing strategies during successive 4-km time trials. Med Sci
Sports Exerc 36: 1819–1825.
24. Hettinga FJ, De Koning JJ, Meijer E, Teunissen L, Foster C (2007) Effect of
pacing strategy on energy expenditure during a 1500-m cycling time trial. Med
Sci Sports Exerc 39: 2212–2218.
25. Garby L, Astrup A (1987) The relationship between the respiratory quotient and
the energy equivalent of oxygen during simultaneous glucose and lipid oxidation
and lipogenesis. Acta Physiol Scand 129: 443–444.
26. Hopkins W (2007) A spreadsheet for deriving a confidence interval, mechanistic
infer-ence and clinical inference from a P value. Sportscience 11: 16–20.
27. Lima-Silva AE, De-Oliveira FR, Nakamura FY, Gevaerd MS (2009) Effect of
carbohydrate availability on time to exhaustion in exercise performed at two
different intensities. Braz J Med Biol Res 42: 404–412.
28. Lima-Silva AE, Pires FO, Bertuzzi RC, Lira FS, Casarini D, et al. (2011) Low
carbohydrate diet affects the oxygen uptake on-kinetics and rating of perceived
exertion in high intensity exercise. Psychophysiology 48: 277–284.
29. Lima-Silva AE, Pires FO, Bertuzzi R, Silva-Cavalcante MD, Oliveira RS, et al.
(2013) Effects of a low- or a high-carbohydrate diet on performance, energy
CHO-Lowering Exercise and Pacing Strategy
PLOS ONE | www.plosone.org 8 October 2014 | Volume 9 | Issue 10 | e110320
system contribution and metabolic responses during supramaximal exercise.
Appl Physiol Nutr Metab 38: 928–934.30. Abbiss CR, Laursen PB (2008) Describing and understanding pacing strategies
during athletic competition. Sports Med 38: 239–252.
31. Bishop DJ, Bonetti D, Dawson BT (2002) The influence of pacing strategy onVO2 and supramaximal kayak performance. Med Sci Sports Exerc 34: 1041–
1047.32. Miura A, Sato H, Sato H, Whipp BJ, Fukuba Y (2000) The effect of glycogen
depletion on the curvature constant parameter of the power-duration curve for
cycle ergometry. Ergonomics 43: 133–141.33. Silva-Cavalcante MD, Correia-Oliveira CR, Santos RA, Lopes-Silva JP, Lima
HM, et al. (2013) Caffeine increases anaerobic work and restores cycling
performance following a protocol designed to lower endogenous carbohydrate
availability. PLoS One 8: e72025.
34. Santos R de A, Kiss MA, Silva-Cavalcante MD, Correia-Oliveira CR, Bertuzzi
R, et al. (2013) Caffeine alters anaerobic distribution and pacing during a 4000-
m cycling time trial. PLoS One 8: e75399.
35. Hettinga FJ, De Koning JJ, Broersen FT, Van Geffen P, Foster C (2006) Pacing
strategy and the occurrence of fatigue in 4000-m cycling time trials. Med Sci
Sports Exerc 38: 1484–1491.
36. Abbiss CR, Peiffer JJ, Peake JM, Nosaka K, Suzuki K, et al. (2008) Effect of
carbohydrate ingestion and ambient temperature on muscle fatigue development
in endurance-trained male cyclists. J Appl Physiol 104: 1021–1028.
CHO-Lowering Exercise and Pacing Strategy
PLOS ONE | www.plosone.org 9 October 2014 | Volume 9 | Issue 10 | e110320
Copyright © 2022 FDOKUMEN