Oil and stock market volatility: A multivariate stochastic volatility perspective
Upload
bournemouthCategory
view
2download
0
1
Option Listing, Returns and Volatility: Evidence from Greece
George Filisa,*
, Christos Floros b
and Bruno Eeckels c
a Portsmouth Business School, University of Portsmouth, Portland Street,
Portsmouth, PO1 3DE, UK
b Portsmouth Business School, University of Portsmouth, Portland Street,
Portsmouth, PO1 3DE, UK
c Bournemouth University, Institute of Business and Law, Fern Barrow, Talbot
Campus, Poole, Dorset, BH12 5BB, Bournemouth, UK
Abstract This paper examines the effect of the first introduction of Greek stock options (Greek
Telecommunication Organisation, Intracom, National Bank of Greece and Alpha
Bank) on stock prices and volatility for the period 1999-2002. We examine the
asymmetric information hypothesis using a standard event study methodology and
asymmetric GARCH-type models. Event study results indicate that abnormal returns
existed in the pre-listing period, but tend to disappear in the post-listing period.
Asymmetric Component TGARCH models with GED show that the introduction of
stock options has led to increased volatility (positive effect) for Greek
Telecommunication Organisation, Intracom and National Bank of Greece only (Alpha
Bank shows a positive but insignificant effect). We argue that our results provide
support to the asymmetric information hypothesis, suggesting that the Greek market
has become more efficient after the introduction of stock options.
Keywords: Stock options, returns, volatility, asymmetric component GARCH,
Greece
JEL codes: G15; C32.
* Corresponding author. Email: [email protected]
2
I. Introduction
Derivative markets stabilise spot markets as well as benefit market welfare, by
facilitating risk management, asset allocation and price discovery (Dawson and
Staikouras, 2009). The effects of option listings on return and volatility characteristics
of underlying stocks have been extensively examined but the results of the studies are
conflicting. Different factors, such as the maturity of a stock exchange or the trading
rules and regulations seem to play an important role in the nature of the listing effects.
According to the asymmetric information hypothesis, options may generate a certain
level of impact of the underlying asset prices when the market is incomplete or
exhibits information asymmetry (see Ross, 1976; Stein, 1987; Antoniou and Holmes,
1995). The impact of stock option introduction is expected to be greater to the more
incomplete markets and to those markets that exhibit higher information asymmetry
(Ross, 1976; Stein, 1987). Thus, one would expect the introduction of stock options to
have no effect on the underlying assets if financial markets are complete and
frictionless (Chen and Chang, 2008; Detemple and Jorion, 1990; Grossman, 1988).
Grossman (1988) also explains that listing an option contract increases the underlying
stock’s liquidity, and that the new information arriving from the option market may
serve to stabilise stock market prices. In addition, several authors show that stock
options provide information to the underlying market which makes the prices in the
spot market react more sensitively according to new information due to lower
transaction costs (see Bae et al, 2004; Ross, 1976), thus turning stock markets in
being more efficient. Calado et al. (2005) argue that the introduction of the options
may improve the welfare of previously restricted traders and be associated with a
price effect (see Figlewski and Webb, 1993; Detemple and Selden, 1991;
Bessembinder and Seguin, 1992). Furthermore, Ross (1976) shows that options
3
trading can provide another conduit, where the information is disseminated through
the financial market and affects the set of opportunities faced by investors (see also
Chen and Chang, 2008). According to Harris (1989), an increase in well-informed
speculative trade (i) decreases volatility due to order flow imbalances, and (ii)
increases volatility due to new fundamental information (see also Calado et al., 2005).
In addition, Kumar et al. (1998) report that the introduction of stock options improves
the market quality of the underlying securities by decreasing volatility and the bid-ask
spread, increasing the quoted depth and the trading volume.
In short, due to the asymmetric information hypothesis, when options are introduced
in the market, informed traders will be willing to transfer their funds to the option
market from the spot market. Thus, the option listing is expected to have an effect in
the spot prices (Detemple and Jorion, 1990).
The scope of this study is to examine the effects of stock option1 listing using data
from Greece, an important European emerging market. Although a number of studies
have concentrated on mature markets (U.S, Europe, Japan), this is the first empirical
investigation on the effect of stock options trading on the Greek spot market. Hence, it
is important to study stock option listing effects in emerging spot markets as the
conclusions can be compared with those related to other emerging/mature spot
markets. Further, Greece is the only country in the region of South-East Europe that
has a standardised derivative market, and therefore, this study creates the necessary
background for future research in other similar emerging spot markets from the same
region and elsewhere. In this paper we are solely interested in the first stock option
introduction, the reason being that the uncertainty of such event in a market with no
prior experience of stock option introduction could create significant pricing and
1 Stock options are contracts that grant the holder the right to buy or sell a specific stock at a specific price before the contract expires. Holders of individual stocks can hedge their risk by trading stock options (for more details see Chen and Chang, 2008).
4
volatility effects to the underlying stocks. In addition, it is important for small markets
to be studied as they are usually relatively inefficient. Finally, according to Sahlstrom
(2001, p.21) “evidence from small markets is important, because the benefit of
derivative markets may be greater in relatively inefficient markets”. Such evidence
allows the researchers to evaluate the benefits or drawbacks of derivatives
introduction in various market environments (Sahlstrom, 2001).
This paper examines the behaviour of four stocks, namely National Bank of Greece,
Intracom, Alpha Bank and Greek Telecommunication Organisation, in terms of price
changes and volatility. We employ two different methods, namely an event study
methodology used by Kabir (2000), and an AGARCH methodology which looks at
the market’s reaction to the arrival of different news. The research is primarily
motivated by the lack of similar studies (and the use of the above two methodologies)
to empirically explain the behaviour of European emerging markets.
The paper is organized as follows. In Section 2, the review of literature is presented,
while Section 3 presents the data used. In Section 4, methodology is described and the
findings are interpreted, while conclusions are given in Section 5.
II. Literature Review
There is a broad literature on the impacts of option introduction on the behaviour of
the underlying stocks. Detemple and Jorion (1990) examine the effects of the
introduction of 300 stock options for the period 1973-1986 in the American market.
They find significant stock price increases following option listings for the period
between 1973 and 1982, but no significant effect for the period 1982 to 1986. They
argue that the introduction of stock index options in 1982 may have completed the
market. Conrad (1989) examines the American market for the period 1974 to 1980,
5
and observes that option introductions cause an increase in underlying prices and that
the price increases are positively related to the options market activity.
Sorescu (2000) studies the effects of option introductions for the American market
using a larger sample of 2051 listing events for the period from 1973 to 1995. He
finds positive abnormal return for options listed during 1973 to 1980, and negative
abnormal return for options listed in 1981 and later. Sorescu (2000) argues that the
option effect for the period 1973 to 1995 can be described by a two-regime switching
means with optimal switch date occurring in 1981. To explain this finding, he uses the
argument developed by Detemple and Jorion (1990) on market completion due to the
introduction of index options, and he also stresses the importance of the
implementation of regulatory changes in 1981. Furthermore, Danielsen and Sorescu
(2001) reach to a very interesting conclusion. They argue that non-optioned stocks
tend to be overvalued on average, while option listing lowers the costs of shorting,
and thus causes prices to decline.
Ho and Liu (1997) examine the American option market for the period 1983 to 1990
and observe significant stock prices reversal surrounding option introductions.
Specifically, they find positive cumulative excess returns beginning 100 days prior to
the option introduction and, starting three days before option introduction, negative
excess returns which continue at least 100 days after the introduction day. On the
other hand, Kabir (2000), examining the Dutch market for the period 1978-1993,
finds significant decline in stock prices following the introduction of stock options. St.
Pierre (1998), on the other hand, uses a EGARCH model to characterize the return
generating process of the underlying securities, and shows that the stock conditional
returns distribution is unaffected by option introduction for the period 1973 to 1990.
Further, Mayhew and Mihov (2000) report evidence of negative price effect around

6
the listing period, but not significant, and an increase in volatility after the listing
period on some selected stocks. Evidence from other international markets (Stucki
and Wasserfallen, 1994; Faff and Hillier, 2004) concludes that stock prices tend to
increase around option listing period. Recently, Liu (2009) shows that the listing of
the S&P 100 options results in lower volatility but no price change for the underlying
stocks. According to Liu (2009, p.1045), “it is the informed and speculative portfolio
traders that have migrated from the underlying market to the newly created index
options market when it becomes available”.
The findings of the literature regarding the effects on the underlying volatility also
provide mixed evidence. Kabir (2000) reports no significant effect on the volatility on
the underlying stocks. On the other hand, Conrad (1989) and Sahlstrom (2001) find
lower volatility for the underlying after option listing. Sahlstrom (2001) reports a
decrease in the stock bid-ask spreads in the Finnish market.
Using a sign and sized conditional ARCH model (SSC-GARCH), Becchetti and
Caggese (2000) research the effect of index option introduction for six European
stock markets. They find that the introduction of index option significantly reduces
the impact of negative shocks on conditional volatility of optioned index in five out of
six countries but has no significant impact on relative unconditional volatility in four
out of six countries. St. Pierre (1998), using a function-noise model, shows that option
introduction has no effect on the conditional volatility of the underlying. Mazouz
(2004), using a GARCH (1,1) methodology, reaches the same conclusion. Other
studies on option listing effect on volatility include Freund et al (1994), Bollen
(1998), Skinner (1989) and Cao (1999). Calado et al. (2005) analyse the volatility
effect of the initial exchange-listing of options on the Portuguese stock market using
an OLS regression. They report that the hypothesis that the listing of derivatives has

7
no effect on the total risk of the underlying stocks cannot be rejected. Recently, Chen
and Chang (2008) explain the impact of listing options on the abnormal return and
volatility of the underlying securities in Taiwan. The empirical results show that there
is a short-term positive impact on the underlying stock prices around the time when
the stock options are listed. In particular, they find that there is a weak impact
regarding both the AAR and CAR due to that fact that investors in Taiwan are used to
employing warrants to speculate or hedge. Further, they show that the variance of the
underlying securities, estimated by a GARCH(1,1) model, decreases significantly
over the 10 days after the stock options are introduced, which improves the efficiency
of the market (see also Detemple and Jorion, 1990).
Apart from studies related to stock option listing effect, there is an extensive literature
on the futures listing effects on stock price and volatility. These include, among
others, papers by Floros and Vougas (2006), Ryoo and Smith (2004), Bae et al.
(2004), Bologna and Cavallo (2002), Chang et al. (1999), Antoniou and Holmes
(1995), Harris (1989) and Aggarwal (1988). Results from these studies are also
ambiguous in terms of futures listing effects on stock or index prices and volatilities.
Overall, the literature is not providing strong evidence to allow the support of
Detemple and Jorion’s (1990) argument, which suggests that a positive abnormal
return in spot prices should be expected around the option listing period, due to the
efficiency enhancement that the listing offers to the underlying market. According to
the asymmetric information hypothesis, option listing period should be characterised
by higher abnormal returns in the post-listing period, which in the long run fade away
and by lower volatility in the post-listing period. In the next sections, we describe the
data and methodology used to examine whether the first option listing in the Greek
stock market provides support to the asymmetric information hypothesis.

8
III. Data Description
We use daily prices of the Athens General Index and the four optioned stocks: Greek
Telecommunication Organisation (GTO), National Bank of Greece (NBG), Alpha
Bank (AB) and Intracom (INTRA). The sample covers the period December 1999 to
February 2002 and includes 521 trading days. Closing prices were obtained from
Datastream. The option listing took place the same day (January 7, 2001) for the four
listed firms. The Athens Derivatives Exchange (ADEX) began option contract trading
on the high capitalization index (FTSE/ASE 20) of the Athens Stock Exchange
(ASE), in September 2000. In January 2001, it was the first introduction of stock
option in four listed firms from the high capitalization index, namely National Bank
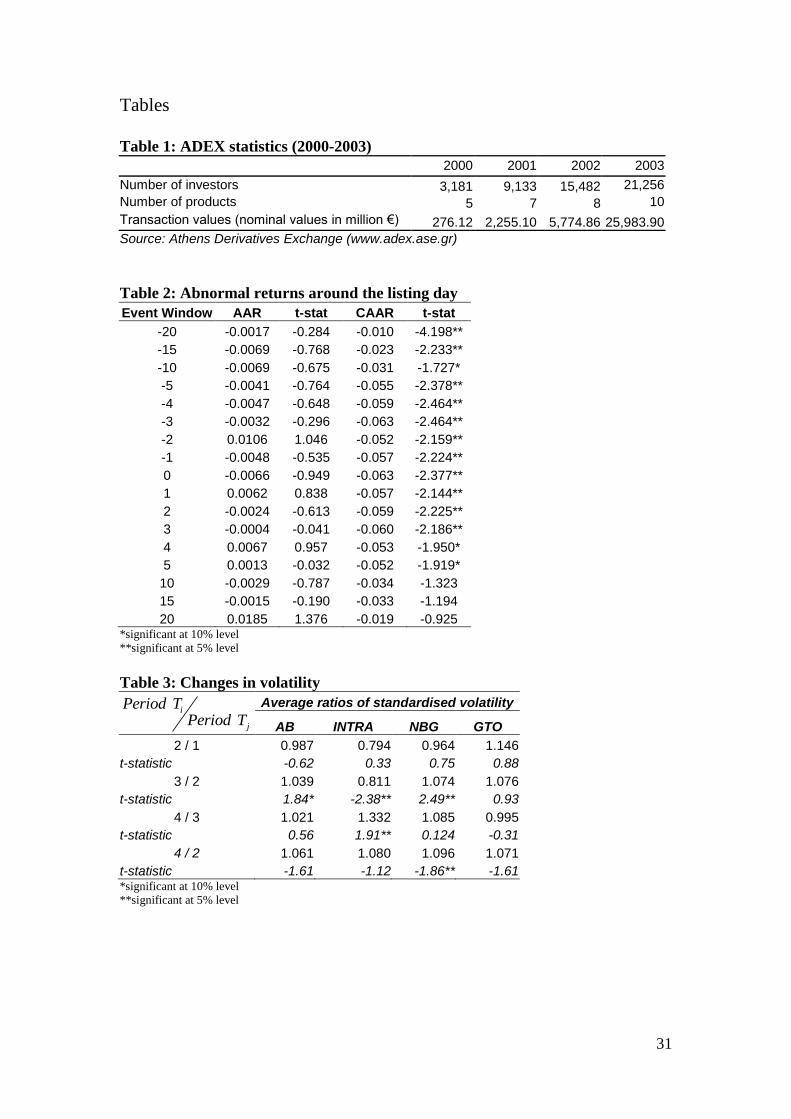
of Greece, Intracom, Alpha Bank and Greek Telecommunication Organisation. Table
1 shows some facts regarding the first four years of ADEX operations. The market
shows a significant increase from one year to the next (2000-2003) and a huge
increase in the transaction values of the market and in the number of investors.
[TABLE 1 HERE]
However, it is clear that the market is very new as it only trades 10 derivative
products and the number of investors and the transaction values are very small
compared to the traditional derivative exchanges such as the CBOE and LIFFE
(statistics for CBOE and LIFFE are not reported here, but are available upon request).
Furthermore, by the time ADEX started to trade options in 2000, the ASE was an
emerging market. As it became a mature market in 2001, it is clear that there could be
some important implications in the underlying and the derivative market. Hence, a
study in the stock option listing effects on price and volatility for Greece is of a
significant importance.

9
IV. Methodology and Results
Effect on Stock Returns
We test the option listing effect on stock returns using a standard event, which can be
found in Kabir (2000). The event window will consist of a period of 20 trading days
around the listing period (-20…0…+20). We argue that 20 trading days are able to
capture the option listing effect around the listing period as it covers a period of
around one calendar month (assuming 20 trading days per month). We use the Market
Model, based on the Capital Asset Pricing Model, in order to estimate the excess daily
returns of the stock, as follows:
it i i mt itR a b R e (1)
We estimate the parameters of the regression equation (1), using 120 trading days
prior the event window (-140, -21). Based on equation 1, the expected stock return
should be as follows:
( ) ( )it i i mtE R a b E R (2)
So, any excess or abnormal return should be calculated by the difference of the actual
return minus the expected return.
ˆˆit it i i mtAR R a b R (3)
Then, we estimate the average abnormal returns (AARt) and the cumulative average
abnormal returns (CAARt) using the following equations:
1
1 N
t it
i
AAR ARN
(4)
where, 1,2,...,i N and 20, 19,...,0,..., 19, 20t

10
1s k
k t
t s
CAAR AAR
(5)
where, 2 41k and , 20, 19,...,0,..., 19, 20t s
We calculate the AARt and CAARt over the event window period (-20, +20). In order
to perform a significance test on the abnormal returns, we standardise first the
abnormal returns, using:
( )
itit
i
ARSAR
s AR (6)
where ( )is AR is the standard deviation of the abnormal returns of stock i in the
estimation period.
We also standardize the CAARt using the following formula:
1 1s k
ik it
t s
SCAR SARk
(7)
The final step is to calculate the t-statistics for the sample. The t-statistics for
standardise abnormal returns and standardised cumulative abnormal returns are
calculated as follows:
1
1N
it
t
t SAR SARN
(8)
1
1N
ik
i
t SCAR SCARN
(9)
Table 2 reports the results of the average abnormal returns and the cumulative average
abnormal returns along with their t-statistics, for the even window period. We can
observe that the cumulative average abnormal returns are negative and they are
significant throughout the pre-listing period.
[TABLE 2 HERE]
11
The overall cumulative abnormal negative returns are 0.57% until the day of the
announcement. The significance of the CAAR could be due to the effect of the
announcement (the announcement of the listing took place on the 7th
of January
2001). So, it could be argued that investors took a sell position regarding the four
stocks in order to assess the effect of the option listing. This can also be supported by
the findings during the post-listing period. After the first 5 days of the post-listing
period we can observe insignificant cumulative abnormal returns (either positive or
negative).
Furthermore, the day of the listing did not produce any significant results, as the
abnormal return on that day was -0.66% percent, yet it was not significant.
Overall, we observe that the option listing in the emerging market of Greece caused
significant negative cumulative abnormal returns in the pre-listing period (-20 days to
-1 day), which continued until 5 days after the introduction of the options. Our
research does not support the evidence of post-listing abnormal returns (positive or
negative), as none of the abnormal returns were significant. However, this is in line
with Liu (2009) and Danielsen and Sorescu (2001) for mature markets; although, due
to the special characteristics of emerging markets (incomplete markets), we would
expect the Greek stocks to exhibit a post-listing significant price change (Ross, 1976;
Stein, 1987; Antoniou and Holmes, 1995; Chen and Chang, 2008). Note that, the
majority of the studies in mature markets exhibit a significant post-listing increase or
decrease in the share prices (see Faff and Hillier, 2004; Detemple and Jorion, 1990).
Our findings support the asymmetric information hypothesis, as the pre-listing
cumulative negative abnormal returns were eliminated in the post listing period. The
elimination of these negative returns can be attributed to the new information that was
transmitted from the option market to the stock market.

12
Effect on Stock Volatility
Using the same data, we use a different methodology to examine any effects of option
listing on volatility. We divide our observations into four periods, as follows:
Period T1: from -260 to -141
Period T2: from -140 to -21
Period T3: from 21 to 140
Period T4: from 141 to 260
The reason for having four periods to examine the stock price volatility is merely
because we want to examine the option listing effect to both long- and short-run (i.e.
using the period T3 we can examine the short run effects in volatility, while using the
period T4 we examine the long-run effects).
We measure volatility for each period independently and for each stock, using the
following formula:
1202
1( ) 252120 1
it i
ti T
R R
R
(10)
where 1,2,...,i N , 1,2,...,125t and 1,2,3 and 4T period . We multiply by 252
(average trading days per year) in order to annualize volatility. We follow the same
method to calculate volatility for the General Index. Then, we standardize the
volatility calculation for each stock by:
,
i Ti T
m T
RSTR
R
(11)
In order to assess the significant difference between volatilities over the four periods,
a standard paired sample t-test is used.

13
Having concluded on the effect of option listing on stock returns, we should assess the
effect on stock volatility. Table 3 reports the results for the four firms individually.
[TABLE 3 HERE]
From the above table, we can observe that in the three out of the four cases (AB,
INTRA and NBG) there was a drop in volatility in period 2 compared to period 1.
Furthermore, we can observe that three firms (AB, NBG and GTO) exhibited higher
volatility in the post-listing period compared to the pre-listing period. The most
important finding is that, for the majority of the firms, the difference in volatility
between period 3 and 2 was significant. This indicates that stock showed a significant
higher volatility in the third period (post-listing period, day 21 to day 140). However,
in the volatility comparison between period 3 and 4 we can notice that for the
majority of the firms there is an insignificant change, showing the increase that was
observed from period 2 to period 3 did not persist in period 4.
The final comparison will be between the periods 2 and 4. In order to assess whether
the change that was observed from period 2 to period 3 still remains, we need to
examine whether the change between period 4 and 2 is significant. From the empirical
results, we notice that the change in volatility is not significant for all firms.
So, overall we conclude that there is an effect from the option listing on stock
volatility (increase in volatility) in the early post-listing period (period 3). This could
be due to the lack of confidence of the Greek investors to the new product as there
was no previous trading experience from the Greek investors. However, higher
volatility in the early post-listing period should not necessarily be interpreted as a
negative effect. Such volatility behaviour could also be justified by the amount of new
information that arrives to the spot market from the newly introduced option market,
14
thus not necessarily due to destabilisation effects (Edwards, 1988). Past research in
mature markets finds evidence of volatility decrease in the post-listing period
(Becchetti and Caggese, 2000; Sahlstrom, 2001; Conrad, 1989). Research in emerging
markets mainly exhibits that stock option listing results to either a reduction in
volatility (Calado et al., 2005) or no effect (Chen and Chang, 2008). Overall, we
argue that our results provide support to the asymmetric information hypothesis, as
we observe a reduction in the stock return volatility during the long run post-listing
period (an exception is the early post-listing period, which shows higher volatility).
Thus, we suggest that there was an improvement of the ASE efficiency, which can be
attributed to the stock option introduction; a finding which is in line with Detemple
and Jorion (1990), who argued that a volatility decrease in the post-listing period
suggests an increase in market efficiency.
Application of GARCH Models
Financial markets appear to be affected by the accumulation of information as
reflected in the prices. Cox (1976) shows that derivative trading has an impact on
price expectations by altering the flow of information into the market2. The present
study offers a new perspective on the issue of the impact of asymmetries on spot
volatility.
Many studies analyse the impact of derivatives trading (e.g. futures effect) using time
series models (the standard GARCH(1,1) model or the GJR model) which test for the
presence of heteroskedasticity and asymmetries (see Floros and Vougas, 2006).
In the literature, a large number of specifications of GARCH models have been
considered to describe the characteristics of financial markets. The simple
2 Cox (1976) defines information content as knowledge regarding random disturbances having an impact on demand in the real economy (see also Dawson and Staikouras, 2009)
15
GARCH(p,q) model, developed by Engle (1982) and extended by Bollerslev (1986)
and Nelson (1991), captures better the tendency of returns to exhibit volatility
clustering, incorporating heteroskedasticity into the estimation procedure (Floros and
Vougas, 2006; Xekalaki and Degiannakis, 2010). However, this specification fails to
measure the impact of negative or positive innovations on conditional volatility.
Furthermore, asymmetric GARCH models introduced to capture asymmetry of data in
where good news and bad news have different predictability for future volatility. In
particular, the Threshold GARCH model (TGARCH) or GJR was introduced by
Zakoian (1994) and Glosten, Jaganathan and Runkle (1993). The specification for the
conditional variance is given by
q
i
p
j
jtjttitit da1 1
2
1
2
1
22 (12)
where 1td if 0t and 0td otherwise.
In GJR, good news ( 0t ) and bad news ( 0t ) have differential effects on the
conditional variance; good news has an impact of a , while bad news has an impact of
a . If 0 then the leverage effect exists and bad news increases volatility, while
if 0 the news impact is asymmetric.
An alternative specification for the conditional volatility process is component
GARCH or CGARCH. Engle and Lee (1993) proposed the CGARCH model in order
to investigate long- and short-run movements of volatility. The conditional variance in
the CGARCH(1,1) model is given by (12.1):
(12.3) )()(
(12.2) )()(
(12.1) )()(
2
1
2
111
1
2
11
2
1
2
2
1
2
1
2
tttt
tttttt
ttt
qqaq
a
16
The component model shows mean reversion to (constant over time), while it
allows mean reversion to a varying level tq , see (12.2) and (12.3). In equations (12.2)
and (12.3), t is volatility and tq is the time varying long run volatility. Equation
(12.2) describes the transitory component, tt q2 , while equation (12.3) describes
the long run component tq , see Floros (2007) and Xekalaki and Degiannakis (2010)
for more details.
Moreover, because of the existence of leverage effect in financial data, Engle and Lee
(1993) considered combining the CGARCH model with TGARCH to allow shocks to
affect the volatility components asymmetrically.
In this study, we analyse the effect of stock options trading on stock price volatility
using a combination of Threshold GARCH and Component GARCH model. In other
words, an extension of CGARCH model, namely the AGARCH or asymmetric
Component GARCH is used. The AGARCH model combines the component model
with the asymmetric TARCH model presented above with asymmetric effects in the
transitory equation. The model is given by:
)()()(
)()(
221
2
1211
2
111
2
1
2
11
2
1
2
11
tttttttttt
ttttt
ttt
zqdqqq
zqq
xR
(13)
where tz1 and tz2 are the exogenous variables and d is the dummy variable indicating
negative shocks. 01 implies transitory leverage effects in the conditional
variance. An additional dummy variable, called Dummy, is added into the conditional
volatility of AGARCH model (as presented in equation 13). The Dummy variable
takes value zero for the pre-options period and one for the post-options period. It
allows us to determine whether stock options prices are related to any change in the
spot volatility. When the coefficient of the Dummy variable is positive (negative) then
17
there is a positive (negative) effect of stock options trading on volatility. According to
Floros and Vougas (2006), assuming that markets are efficient, then the ARCH
parameter can be viewed as ‘news’ coefficient, while the GARCH parameter can be
viewed as ‘old news’ and the persistence coefficient. According to Butterworth
(2000), an increase (decrease) in ARCH suggests that news is reflected in prices more
rapidly (slow), while a reduction in GARCH suggests that old news has a less
persistent effect on prices changes, see Floros and Vougas (2006). An increase in
GARCH suggests greater persistence, while when the sum of ARCH and GARCH
coefficients approaches unity then volatility shocks are persistent.
Other specifications of the GARCH and TGARCH, not reported here, include the
exponential GARCH (EGARCH) and power GARCH (PGARCH). TGARCH,
EGARCH and PGARCH models capture volatility asymmetry, but the Akaike
Information Criterion (AIC) and the Schwarz information criterion in this study select
the simple AGARCH (1,1), which is estimated using the Marquardt algorithm with
the HCC option3.. Due to the fact that the conditional distribution of errors (residuals)
is non-normal, other than normal distributional assumptions should be used to capture
for fat tails in time series (e.g. Student t, GED, GT). In this paper, we consider the
generalised error distribution or GED suggested by Nelson (1991), which allows for
both skewness and leptokurtosis (see Lee and Tse, 1991; Johnson et al., 1995;
Xekalaki and Degiannakis, 2010). In Table 4, selected AGARCH models with a
Dummy variable in the conditional variance equation are reported4. There is a positive
effect of stock options trading on stock market volatility. The effect is statistically
significant (Dummy variable is positive), and therefore, there is an increase in
3 To estimate AGARCH models, an iterative procedure is used upon the method of Marquardt algorithm, and Heteroskedasticity Consistent Covariance (HCC) option is used to compute quasi maximum likelyhood (QML) covariances and standard errors
using the methods described by Bollerslev and Wolldridge (1992). 4 Results from TGARCH, EGARCH and PGARCH are qualitatively similar to ACARCH results and they are available upon request.

18
volatility associated with the stock options introduction. This is not true for Alpha
Bank, where the Dummy variable is positive but not significant. Further, for all cases,
the sum of ARCH and GARCH coefficients is very close to one (in absolute terms),
indicating that volatility shocks are quite persistent. A large sum of the coefficients in
the conditional variance equations implies that a large positive or a large negative
return will lead future forecasts of the variance to be high. The coefficient of the
lagged squared returns is always positive and statistically significant for AB and
INTRA, while it is insignificant for NBG and GTO. Therefore, strong ARCH effects
are apparent for AB and INTRA stocks. Also, the coefficient of lagged conditional
variance is significantly positive and less than one for AB and INTRA, indicating that
the positive impact of ‘old’ news on volatility is significant. The magnitude of the
coefficient 2 is especially high for INTRA, indicating a long memory in the
variance. . Note that the coefficient 2 is negatively significant for GTO and NBG,
which implies a negative impact of news on volatility. Furthermore, the coefficient 1
implies significant transitory leverage effects in the conditional variance for INTRA
only.
[TABLE 4 HERE]
The next step is to examine and compare the values of ARCH and GARCH terms as
well as the volatility (conditional variances) parameters for the pre-stock options and
the post-stock options periods. The estimation results of GARCH models (pre- and
post-periods)5 suggest an increase in GARCH indicating a greater persistence effect
of old news on prices changes of GTO, AB and NBG (this is not applied to INTRA).
5 The results from the GARCH models using pre- and post samples are available upon request.

19
Furthermore, the results show a decrease in ARCH for all stocks suggesting that news
is reflected in prices more slowly.
Descriptive statistics of conditional variances from the AGARCH(1,1) models, are
presented in Table 5. It is clear that the variances are much higher in the post-stock
options periods than in the pre-stock options periods (for all cases). In other words,
we find higher market volatility after stock options introduction in the Greek stock
market. This is in line with our previous findings.
[TABLE 5 HERE]
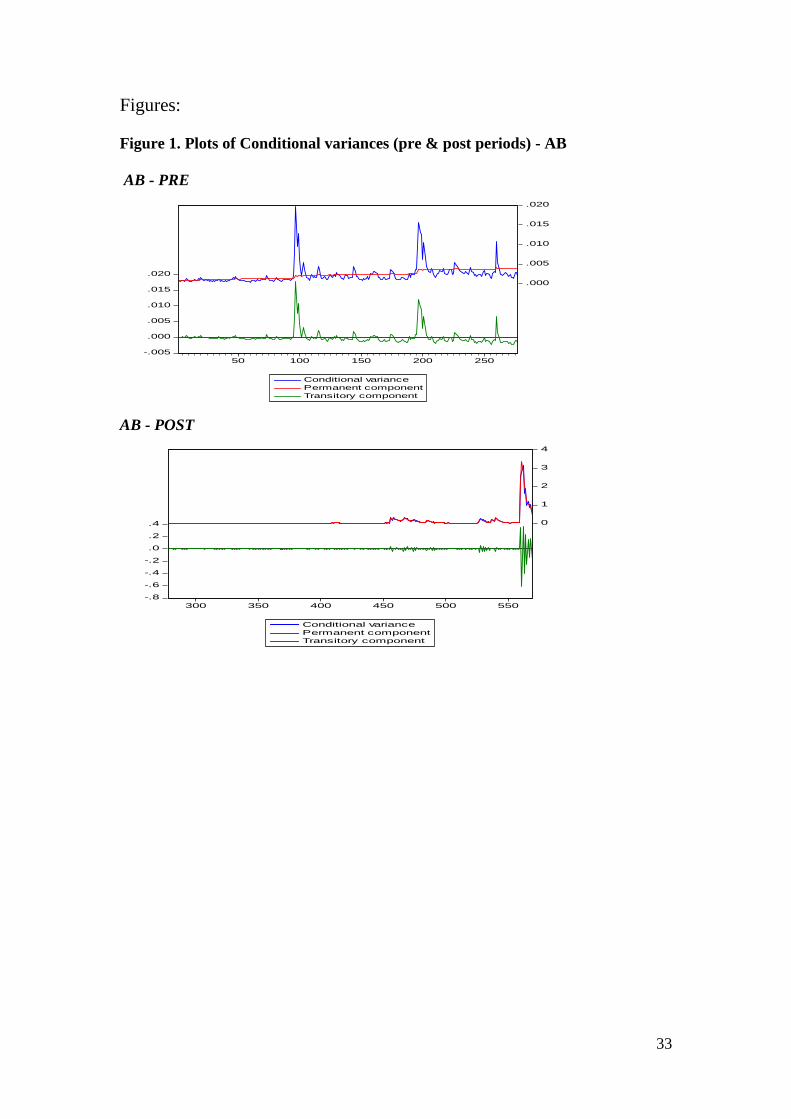
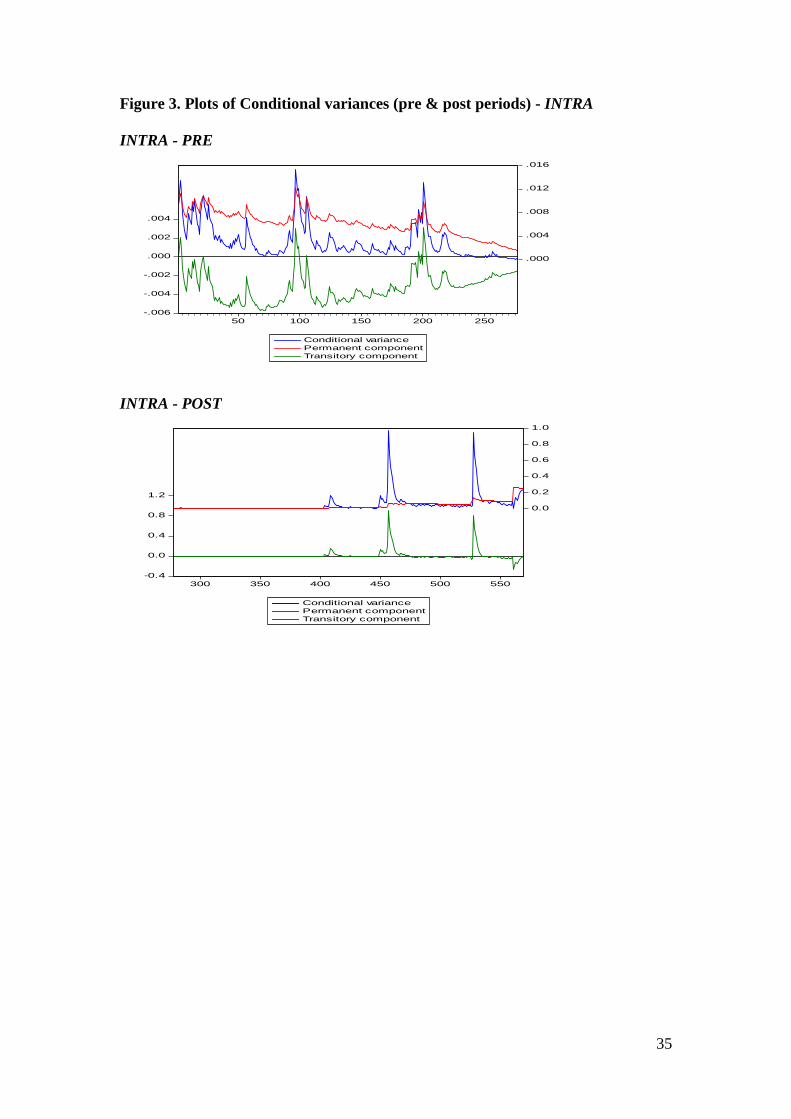
Finally, Figures 1-4 present the conditional variances for all cases before and after the
introduction of stock options trading in Greece. The results confirm that the
introduction of stock options has led to increased volatility (hence, positive effect) for
all four stocks (we again find that there is not a significant increase for AB).
[FIGURE 1 HERE]
[FIGURE 2 HERE]
[FIGURE 3 HERE]
[FIGURE 4 HERE]
AGARCH modelling reaches the same conclusion with the event study methodology,
which strengthens the robustness of our results.
V. Conclusion
Given that spot and derivatives markets are linked by arbitrage operations, then
derivatives markets would convey information to the cash market (Dawson and
Staikouras, 2009). Researchers show that the price of an underlying asset may become
more volatile after derivative introduction because increased speculators and
20
uninformed traders bring imperfect information into the derivative market (Chang and
Liao, 2010). Further, Ma and Rao (1988) argue that the volatility of underlying assets
declines if the derivative market generates a migration of noisy traders from the
underlying asset market (or enhances the information efficiency by hedging), see also
Chao and Liao (2010, p. 1388).
The listing of stock options can provide additional information to the underlying
market. Hence, the prices in the spot market may react more sensitively due to new
information, lower transaction costs, highly-leveraged properties and an absence of
short selling constraints in relation to the options (Chen and Chang, 2008). According
to Ho et al. (1995), after stock options are listed, investors absorb the new
information, while Kumar et al. (1998) report that the introduction of stock options
improves the market quality of the underlying securities by decreasing volatility and
the bid-ask spread, increasing the quoted depth and the trading volume. Furthermore,
Bansal et al. (1989) show that the introduction of stock options does not change the
systematic risk of the underlying securities.
Past empirical studies provide mixed results when they test the option listing effect on
price returns and volatility (Liu, 2009; Chen and Chang, 2008; Calado et al., 2005). In
this paper, we examine the effects of option listing on stock returns and volatility for
the Greek market. Our study further contributes to the research as it uses data from an
emerging market and is also the first to focus on the Greek option market, ADEX. We
investigate this issue using two empirical methods: an event study methodology and
AGARCH models. The research is primarily motivated by the lack of similar studies
(and the use of two different methodologies) on European emerging markets.
Our results indicate strong evidence that option listings exercise influence on stock
returns and volatility. In particular, our findings support the asymmetric information

21
hypothesis, as the pre-listing cumulative negative abnormal returns were eliminated in
the post-listing period. The elimination of these negative returns can be attributed to
the new information that was transmitted from the option market to the stock market.
In addition, there is some effect on volatility in the post-listing period, where stock
volatility increased in the short-term. A possible explanation of this increase in
volatility may be the uncertainty of the investors facing for the first time Greek stock
options. According to Calado et al. (2005. p. 913), “an increase in volatility would
constitute a good reason to pressure to further regulate derivatives trading in
general”. On the other hand, such volatility behaviour could also be justified by the
amount of new information that arrives to the Greek spot market from the newly
introduced option market, thus not necessarily due to destabilisation effects (Edwards,
1988); an explanation which is consistent with the asymmetric information
hypothesis. Under AGARCH methodology, we confirm the findings of the event
study methodology. In particular, we find that three firms (GTO, NBG and INTRA)
exhibited significant higher volatility in the post-listing period compared to the pre-
listing period (AB also exhibited a higher volatility in the post-listing period but it
was not significant). The estimation results of AGARCH models (pre- and post-
periods) indicate a greater persistence effect of old news on prices changes of GTO,
AB and NBG. Further, we find that news is reflected in prices more slowly for all
stocks.
These results do not support the majority of previous findings in terms of option
listing effects on stock prices in emerging and mature stock markets, as most studies
have identified increased post-listing stock returns (see, inter alia, Conrad, 1989 –
US: CBOE and AOE; Detemple and Jorion, 1990 – US: S&P500; Sorescu, 2000 –
22
US: CBOE, AMEX, NYSE; Chen and Chang, 2008 – Taiwan: TAIFEX). However,
our results are in line with Liu (2009 – US: S&P100).
In terms of option listing effects on stock return volatility our study provides support
to the majority of the previous studies in both mature and emerging stock markets; i.e.
a decrease in stock return volatility in the post-listing period (see, inter alia, Conrad,
1989– US: CBOE and AOE; Detemple and Jorion, 1990– US: S&P500; Becchetti and
Caggese, 2000 – UK, The Netherlands, Switzerland, Austria, Germany and France:
Euronext, Eurex and ATX; Sahlstrom, 2001 – Finland: HEX; Calado et al., 2005 –
Portugal: Euronext).
Overall, we argue that our results provide support to the asymmetric information
hypothesis, suggesting that the Greek stock market has become more efficient in the
post-listing period and that information from ADEX to ASE can be disseminated due
to investors’ behaviour after the introduction of stock options. Hence, the Greek stock
market reacts more sensitively according to the new information due to lower
transaction costs (see, Bae et al., 2004). This should be helpful to accurately value
options and other derivatives products. Moreover, our findings help investors,
financial managers and modelers dealing with options markets understand the changes
in the Greek capital market. Future research needs to investigate the persistence of
options effect in the longer run as well as explore the relationships among price,
volatility, market depth and trading volume using modern quantitative methods.
23
References
Aggarwal, R. (1988) Stock Index Futures and Cash Market Volatility, Review of
Futures Markets, 7, 290–299.
Antoniou, A. and Holmes, P. (1995) Futures Trading, Information and Spot Price
Volatility: Evidence for the FTSE 100 Stock Index Futures Contract using GARCH,
Journal of Banking & Finance, 19, 117–129.
Bae, S. C., Kwon, T. H. and Park, J. W. (2004) Futures Trading, Spot Market
Volatility, and Market Efficiency: the Case of the Korean Index Futures Markets,
Journal of Futures Markets, 24, 1195–1228.
Bansal, V. K., Pruitt, S. and Wei, K. C. J. (1989) An empirical reexamination of the
impact of CBOE option initiation on the volatility and trading volume of the
underlying equities: 1973-1986, Finance Review, 24, 19-29.
Bechetti, L. and Caggese, A. (2000) Effects of index option introduction on stock
index volatility: a procedure for empirical testing based on SSC-GARCH models,
Applied Financial Economics, 10, 323-341.
Bessembinder, H. and Seguin, P. J. (1992) Futures-trading activity and stock price
volatility, Journal of Finance, XLVII, 2015-34.
Bollen, N. P. B. (1998) A Note on the Impact of Options on Stock Return Volatility,
Journal of Banking and Finance, 22, 1181-1191.
24
Bollerslev, T. (1986) Generalised autoregressive conditional heteroscedasticity,
Journal of Econometrics, 31, 307-27.
Bollerslev, T. and Wooldridge, J. (1992) Quasi-maximum likelihood estimation and
inference in dynamic models with time-varying covariances, Econometric Reviews,
11, 143-172.
Bologna, P. and Cavallo, L. (2002) Does the Introduction of Stock Index Futures
Effectively Reduce Stock Market Volatility? Is the ‘Futures Effect’ Immediate?
Evidence from the Italian Stock Exchange using GARCH, Applied Financial
Economics, 12, 183–192.
Butterworth, D. (2000) The impact of futures trading on underlying stock index
volatility: the case of the FTSE Mid 250 contract, Applied Economics Letters, 7, 439-
444.
Calado, J. P. T., Garcia, M. T. M. and Pereira, S. E. T. M. (2005) An empirical
analysis of the effects of options and futures listing on the underlying stocks’ return
volatility: the Portuguese case, Applied Financial Economics, 15, 907-13.
Cao, H. H. (1999) The Effect of Derivative Assets on Information on Information
Acquisition and Price Behavior in a Rational Expectations Equilibrium, Review of
Financial Studies, 12, 131-163.

25
Chang, E. C., Cheng, J. and Pinegar, J. M. (1999) Does Futures Trading Increase
Stock Market Volatility? The Case of the Nikkei Stock Index Futures Markets,
Journal of Banking and Finance, 23, 727–753.
Chang, J. J. and Liao, S. L. (2010) Warrant introduction effects on stock return
processes, Applied Financial Economics, 20, 1377-1395.
Chen, D. H. and Chang, P. H. (2008) The impact of listing stock options on the
underlying securities: the case of Taiwan, Applied Financial Economics, 18, 1161-
1172.
Conrad, J. (1989) The price effect of option introduction, The Journal of Finance, 44,
487-498.
Danielsen, B. R. and Sorescu, M. S. (2001) Why Do Option Introductions Depress
Stock Prices? A Study of Diminishing Short Sale Constraints, Journal of Financial
and Quantitative Analysis, 36, 451-484.
Dawson, P. and Staikouras, S. K. (2009) The impact of volatility derivatives on
S&P500 volatility, The Journal of Futures Markets, 29(12), 1190-1213.
Detemple, J. and Jorion, P. (1990) Option listing and stock returns: An empirical
analysis, Journal of Banking and Finance, 14, 781-801.
26
Detemple, J. and Selden, L. (1991) A general equilibrium analysis of option and stock
market interactions, International Economic Review, 32, 279-303.
Edwards, E. R. (1988) Does futures trading increase stock market volatility?,
Financial Analysts Journal, 44, 63-69.
Engle, R. F. (1982) Autoregressive conditional heteroscedasticity with estimates of
the variance of UK inflation, Econometrica, 50, 987-1008.
Engle, R. F. and Lee, G. G. J. (1993) A permanent and transitory component model of
stock return volatility. Discussion paper 9244, Department of Economics, University
of California, San Diego.
Faff, R. and Hillier, D. (2004) Complete markets, Informed trading and Equity option
introductions, Journal of Banking and Finance, 29, 1359-1384.
Figlewski, S. and Webb, G. P. (1993) Options, short sales, and market completeness,
Journal of Finance, XLVII, 761-77.
Floros, C. (2007) The use of GARCH models for the calculation of minimum capital
risk requirements: International evidence, International Journal of Managerial
Finance, 3(4), 360-371.
27
Floros, C. and Vougas, V. D. (2006) Index futures trading, information and stock
market volatility: The case of Greece, Derivatives Use, Trading & Regulation, 12,
146-166.
Freund, S., McCann, P. D. and Webb, P. G. (1994) A Regression Analysis of the
Effects of Option Introduction on Stock Variances, Journal of Derivatives, 1, 25-38.
Glosten, L. R., Jaganathan, R., and Runkle, D. (1993) On the relation between the
expected value and the volatility of the normal excess return on stocks, Journal of
Finance, 48, 1779-1801.
Grossman, D. J. (1988) An analysis of the implications for stock and futures price
volatility of program trading and dynamic hedging strategies, Journal of Business, 61,
275-98.
Harris, L. (1989) S&P500 Cash Stock Price Volatilities, Journal of Finance, 44,
1155–1175.
Ho, L. C., Hassell, J. M. and Swidler, S. (1995) An empirical examination of the
dispersion and accuracy of analyst forecasts surrounding option listing, Review of
Financial Economics, 4, 171-85.
Ho, L. C. J. and Liu, C. S. (1997) A reexamination of price behavior surrounding
option introduction, Quarterly Journal of Business and Economics, 36, 39-50.

28
Johnson, N.L., Kotz, S. and Balakrishnan, N. (1995) Continuous univariate
distributions, Vol. 2, 2nd
edition, New York: John Wiley & Sons Inc.
Kabir, R. (2000) The price and volatility effects of stock option introduction: a
reexamination, Research in Banking and Finance, 1, 261-279.
Kumar, R., Sarin, A. and Shastri, K. (1998) The impact of options trading on the
market quality of the underlying security: an empirical analysis, Journal of Finance,
53, 717-32.
Lee, T. K. Y. and Tse, Y. K. (1991) Term structure of interest rates in the Singapore
Asian dollar market, Journal of Applied Econometrics, 6, 143-152.
Liu, S. (2009) The impacts of index options on the underlying stocks: the case of the
S&P 100, The Quarterly Review of Economics and Finance, 49, 1034-1046.
Ma, C. K. and Rao, R. P. (1988) Information asymmetry and options trading, The
Financial Review, 23, 39-51.
Mayhew, S. and Mihov, V. (2000) Another Look at Option Listing Effects,
EconWPA, Finance Series 0004002, Available from:
http://129.3.20.41/eps/fin/papers/0004/0004002.pdf [accessed by 12 July 2009]
29
Mazouz, K. (2004) The effect of CBOE option listing on the volatility of NYSE
traded stocks: a time-varying variance approach, Journal of Empirical Finance, 11,
695–708.
Nelson, D. (1991) Conditional heteroskedasticity in asset returns: A new approach,
Econometrica, 59, 347-370.
Ross, S. (1976) Options and efficiency, Quarterly Journal of Economics, 90, 75-89.
Ryoo, H. J. and Smith, G. (2004) The Impact of Stock Index Futures on the Korean
Stock Market, Applied Financial Economics, 14, 243–251.
Sahlstrom, P. (2001) Impact of stock option listings on return and risk characteristics
in Finland, International Review of Financial Analysis, 10, 19-36.
Skinner, D. J. (1989) Options Markets and Stock Return Volatility, Journal of
Financial Economics, 23, 61-78.
Sorescu, S. (2000) The effect of options on stock prices: 1973 to 1995, The Journal of
Finance, 55,487-514.
St. Pierre, E. (1998) The impact of option introduction on the conditional return of
underlying securities, The Financial Review, 33, 105-118.
Stein, J. C. (1987) Informational externalities and welfare-reducing speculation,
Journal of Political Economy, 95, 1123-45.

30
Stucki, T. and Wasserfallen, W. (1994) Stock and Option Markets, The Swiss
Evidence, Journal of Banking and Finance, 18, 881-893.
Xekalaki, E. and Degiannakis, S. (2010) ARCH Models for Financial Applications.
John Wiley & Sons, New York.
Zakoian, J. M. (1994) Threshold heteroscedastic models, Journal of Economic
Dynamics and Control, 18, 931-955.
31
Tables
Table 1: ADEX statistics (2000-2003)
2000 2001 2002 2003
Number of investors 3,181 9,133 15,482 21,256
Number of products 5 7 8 10
Transaction values (nominal values in million €) 276.12 2,255.10 5,774.86 25,983.90
Source: Athens Derivatives Exchange (www.adex.ase.gr)
Table 2: Abnormal returns around the listing day
Event Window AAR t-stat CAAR t-stat
-20 -0.0017 -0.284 -0.010 -4.198**
-15 -0.0069 -0.768 -0.023 -2.233**
-10 -0.0069 -0.675 -0.031 -1.727*
-5 -0.0041 -0.764 -0.055 -2.378**
-4 -0.0047 -0.648 -0.059 -2.464**
-3 -0.0032 -0.296 -0.063 -2.464**
-2 0.0106 1.046 -0.052 -2.159**
-1 -0.0048 -0.535 -0.057 -2.224**
0 -0.0066 -0.949 -0.063 -2.377**
1 0.0062 0.838 -0.057 -2.144**
2 -0.0024 -0.613 -0.059 -2.225**
3 -0.0004 -0.041 -0.060 -2.186**
4 0.0067 0.957 -0.053 -1.950*
5 0.0013 -0.032 -0.052 -1.919*
10 -0.0029 -0.787 -0.034 -1.323
15 -0.0015 -0.190 -0.033 -1.194
20 0.0185 1.376 -0.019 -0.925 *significant at 10% level
**significant at 5% level
Table 3: Changes in volatility
i
j
Period TPeriod T
Average ratios of standardised volatility
AB INTRA NBG GTO
2 / 1 0.987 0.794 0.964 1.146
t-statistic -0.62 0.33 0.75 0.88
3 / 2 1.039 0.811 1.074 1.076
t-statistic 1.84* -2.38** 2.49** 0.93
4 / 3 1.021 1.332 1.085 0.995
t-statistic 0.56 1.91** 0.124 -0.31
4 / 2 1.061 1.080 1.096 1.071
t-statistic -1.61 -1.12 -1.86** -1.61 *significant at 10% level
**significant at 5% level
32
Table 4: Estimation Results of AGARCH Models (Variance Equation)
STOCKS ω α γ 1 2 Dummy
∞
AB 0.3686
(1.0624)
0.9999
(16333.7)*
0.0658
(1.3404)
0.3570
(3.9646)*
-0.1546
(-1.673)**
0.5279
(4.1049)*
6.53E-05
(0.9735)
GTO 0.0056
(0.7473)
0.9685
(22.652)*
0.4189
(5.829)*
-0.0409
(-1.1947)
0.0767
(1.5022)
-0.6947
(-5.3425)*
0.0025
(3.0360)*
INTRA 0.0039
(4.8422)*
0.5261
(3.0489)*
0.0978
(2.158)*
0.0735
(5.409)*
0.2373
(5.7926)*
0.7003
(23.6647)*
0.0402
(2.3902)*
NBG 12.4503
(0.1427)
0.9999
(2596.59)*
0.3677
(5.718)*
0.1052
(1.4724)
-0.1455
(-1.4920)
-0.7803
(-6.1160)*
0.0027
(2.5360)* *significant at 5% level
** significant at 10% level
∞ The dummy variable takes value zero for the pre-options period and one for the post-options period.
Table 5: Conditional variances (Pre & Post periods)
STOCKS Mean Max Min Std. Dev
AB-PRE 0.002268 0.019794 0.000445 0.002317
AB-POST 0.093640 3.139681 0.001721 0.341700
GTO-PRE 0.005858 0.094563 0.000219 0.013192
GTO-POST 0.134238 4.210094 0.000269 0.360741
INTRA-PRE 0.003003 0.015278 7.24E-05 0.002848
INTRA-POST 0.055105 0.970586 0.000517 0.113509
NBG-PRE 0.004963 0.055218 0.000298 0.006439
NBG-POST 0.086014 1.872586 0.006108 0.271731
33
Figures:
Figure 1. Plots of Conditional variances (pre & post periods) - AB
AB - PRE
-.005
.000
.005
.010
.015
.020
.000
.005
.010
.015
.020
50 100 150 200 250
Conditional variance
Permanent component
Transitory component
AB - POST
-.8
-.6
-.4
-.2
.0
.2
.4 0
1
2
3
4
300 350 400 450 500 550
Conditional variance
Permanent component
Transitory component

34
Figure 2. Plots of Conditional variances (pre & post periods) - GTO
GTO - PRE
-.02
.00
.02
.04
.06
.00
.02
.04
.06
.08
.10
50 100 150 200 250
Conditional variance
Permanent component
Transitory component
GTO - POST
-1.5
-1.0
-0.5
0.0
0.5
1.0
1.5
0
1
2
3
4
5
300 350 400 450 500 550
Conditional variance
Permanent component
Transitory component
35
Figure 3. Plots of Conditional variances (pre & post periods) - INTRA
INTRA - PRE
-.006
-.004
-.002
.000
.002
.004
.000
.004
.008
.012
.016
50 100 150 200 250
Conditional variance
Permanent component
Transitory component
INTRA - POST
-0.4
0.0
0.4
0.8
1.2
0.0
0.2
0.4
0.6
0.8
1.0
300 350 400 450 500 550
Conditional variance
Permanent component
Transitory component

36
Figure 4. Plots of Conditional variances (pre & post periods) - NBG
NBG - PRE
-.02
.00
.02
.04
.06
-.02
.00
.02
.04
.06
50 100 150 200 250
Conditional variance
Permanent component
Transitory component
NBG - POST
-2.0
-1.5
-1.0
-0.5
0.0
0.5
1.0
-1
0
1
2
3
4
300 350 400 450 500 550
Conditional variance
Permanent component
Transitory component
Copyright © 2022 FDOKUMEN