
The fish‐kill of 2008 and clean‐up operations in the Vaal River Barrage November 2008‐April 2009

___________________________
* Corresponding author. Address: Hydro-environmental Research Centre, School of Engineering, Cardiff University, Cardiff CF24 3AA, UK. Tel.:+44 (0) 29 2087 6814. E-mail address: [email protected].
Optimization Modelling of the Impacts of a Severn Barrage for a 1
Two-way Generation Scheme Using a Continental Shelf Model 2
Juntao Zhou*, Shunqi Pan & Roger A. Falconer 3 Hydro-environmental Research Centre, School of Engineering, 4
Cardiff University, Cardiff CF24 3AA, UK 5
6
Abstract 7
The Severn Estuary has the world’s second largest tide range and a barrage across the estuary, located just seawards of 8
Cardiff in Wales and Weston in the South West England, has been proposed for over half a century, with the objective 9
of extracting large amounts of tidal energy. A Severn Barrage, as previously proposed by the Severn Tidal Power Group 10
(STPG), would be the largest renewable energy project for tidal power generation in the world, if built as proposed, and 11
would generate approximately 5% of the UK's electricity needs. However, concerns have been raised over the 12
environmental impacts of such a barrage, including potential increase in flood risk, loss of intertidal habitats etc. In 13
addressing the challenges of maximising the energy output and minimising the environmental impacts of such a barrage, 14
this research study has focused on using a Continental Shelf model, based on the modified Environmental Fluid 15
Dynamics Code (EFDC) with a barrage operation module (EFDC_B), to investigate both the far and near field 16
hydrodynamic impacts of a barrage for different operating scenarios. Three scenarios have been considered to simulate 17
the Severn Barrage, operating via two-way generation and using different combinations of turbines and sluices. The 18
first scenario consisted of 216 turbines and 166 sluices installed along the barrage; the second consisted of 382 turbines 19
with no sluices; and the third consisted of 764 turbines and no sluices. The specification of the sluice gates and turbines 20
are the same for all scenarios. The model results indicate that the third scenario has the best mitigating effects for the 21
far-field and near-field flood risks caused by a barrage and produces the most similar results of minimum water depth 22
and maximum velocity distributions to those obtained from simulating the natural conditions of the estuary, i.e. the 23
current conditions. The results also show that the flow patterns around the barrage are closest to those for the existing 24
natural conditions with minimal slight changes in the estuary. Thus, the results clearly indicate that the environmental 25
impacts of a Severn Barrage can be minimised if the barrage is operated for two-way generation and under the third 26
scenario. Although it appears that the energy output for the third scenario is less than that obtained for the other two 27
scenarios, if very low head (VLH) turbines are used, then the third scenario could generate more energy as more 28
turbines could be cited along the barrage structure. Therefore, the study shows that a Severn Barrage, operating in two-29
way generation and with 764 turbines (ideally VLH turbines), would be the best option to meet the needs of maximising 30
the energy output, but having a minimal impact on environmental changes in the estuary and far-field. 31
Key words: Severn Barrage, EFDC_B model, two-way generation, Continental Shelf model, renewable energy 32
1. Introduction 33
With the rapid developments in the global economy and the predicted growth in the world’s population, there has been, 34
and will continue to be, a growing global demand for more energy. Tidal energy has much to offer in terms of predicted35
2
low carbon power, and with the added advantage over wind and solar in that it is predictable. In the UK there are a 1
number of potential sites ideally suited to tidal power generation, with the Severn Estuary being particularly attractive. 2
This estuary has the second largest tidal range in the world (over 14 m during spring tides), and with a barrage sited 3
from just seawards of Cardiff in Wales to Weston in South West England, the impoundment plan surface area would be 4
approximately 500 km2. However, the impacts of such a Severn Barrage on the hydro-environment in the Bristol 5
Channel and the Severn Estuary has always been claimed to be very significant, and the site has been extensively 6
studied over the past 30 years, particularly using numerical models. Owen [1] and Stephens [2] used 3D regular grid 7
numerical models to predict the tidal levels and currents in the Bristol Channel, with a horizontal grid size of over 1 km. 8
According to the observed current data from 1975 to 1977, Uncles and Jordan [3] derived co-phase and co-amplitude 9
lines for the M2 tide and obtained estimates of the associated tidal energy fluxes through selected cross-sections. Evans 10
et al. [4] investigated the effect of a barrage on some water quality parameters in the estuary using a depth-averaged 2D 11
hydrodynamic model. Amin and Flather [5] dynamically linked a 2D numerical model of the Bristol Channel to a 1D 12
model of the River Severn and compared the numerical model predicted water levels with the corresponding values 13
predicted based on a harmonic analysis. More recently, Xia et al. [6-8] deployed a 2D finite volume numerical model to 14
investigate the impact of different tidal renewable energy schemes on the hydrodynamic processes, and Ahmadian et al. 15
[9] used the DIVAST model to investigate the impacts of the Severn Barrage on the hydrodynamics and the 16
corresponding transport processes of suspended sediments and faecal bacteria in the Bristol Channel and Severn Estuary. 17
Likewise, the impacts of a tidal barrage on the hydrodynamic and salinity transport processes were predicted by Zhou et 18
al. [10] using the EFDC_B model. 19
In most, if not all, of the studies cited above the research interests mainly focused on the near-field impacts from the 20
Severn Barrage, and particularly in the Bristol Channel and Severn Estuary. However, due to the large tidal range in the 21
Severn Estuary and the large water body enclosed by the barrage, the impacts of the barrage on the near-field and far-22
field hydrodynamics are equally important, particularly for environmental impact and flood risk assessments. Therefore, 23
a Continental Shelf (CS) model based on the EFDC_B model has been used by Zhou et al. [11] to investigate the effects 24
of the open boundary conditions on the near-field and far-field hydrodynamics in the Irish Sea and the Bristol Channel. 25
In the CS model, the computational domain was extended to beyond the Continental Shelf, which includes a sufficiently 26
large water body enclosed within the computational domain. Hence, with the large size of the computational domain 27
and the deep water depth (over 5,000m) at the open boundaries, the key issues and concerns of numerical wave 28
reflection caused by modelling a tidal barrage have been thoroughly investigated, with all aspects of the influence of 29
the open boundary conditions and the influence that a barrage might have on these boundaries being considered. At the 30
time of this study the location of different far-field boundary conditions were investigated, with the predicted results 31
indicating that the open boundary conditions had noticeable impacts on the far-field hydrodynamics, especially in the 32
Irish Sea. The results showed that in modelling the effects of a barrage accurately, it was necessary to take the open 33
boundary out to the Continental Shelf and the CS model has been subsequently used to investigate the near-field and 34
far-field impacts of the Severn Barrage on the domain water body. 35
Usually a tidal power barrage can be designed to operate under the modes of ebb generation only, flood generation only 36
or two-way generation. Each operating mode has its own advantages and disadvantages as indicated in Xia et al. [7], 37
Severn Barrage Committee report [12] and Severn Tidal Power Group studies [13]. Xia et al. [7] investigated the 38
impacts of different barrage operating modes on the tidal power outputs and the associated extent of flood inundation 39
along the Severn Estuary. The model results indicated that flood generation would produce the least electrical energy 40

3
and cause the largest reduction in the maximum water levels upstream of the barrage. For the three operating modes it 1
was also shown that ebb generation would influence significantly the distribution of the minimum water levels in the 2
enclosed basin, which could cause an adverse impact on the ecological system and hydro-environmental impact of the 3
local mudflats. Although two-way generation requires the installation of more complex turbines, owing to issues 4
related to the machine efficiency of bi-directional energy generation, this mode of operation has a number of advantages, 5
including: a). there are two periods of generation per tidal cycle instead of one, and thus the energy generated is much 6
easier to be absorbed into the local grid; b). the scheme can minimize the loss of intertidal zones, as compared with the 7
loss under the mode of ebb generation only; and c). only a lower installed capacity is required to produce an equivalent 8
energy output to that obtained for the mode of ebb generation only. It is also noted that modern turbine technology has 9
already overcome some of these problems; for example, the Rolls-Royce and Atkins turbines have overcome many of 10
the challenges in the outline design of a very-low head (VLH) dual generation turbine for possible development in the 11
Severn Barrage project, as indicated in the Severn Embryonic Technologies Scheme (SETS) Report [14]. The VLH 12
turbine is a turbine that allows utilizing very low head sites with less environmental impact. The VLH turbine is able to 13
operate with low heads from typically 1.5 to 3m, aided by the inclusion of variable speed generation and high efficiency 14
runner performances. VLH turbines can achieve more energy yield and high performance, compared to the more 15
traditional turbine. Furthermore, a new scheme for the barrage, proposed by the Hafren Power, with 1,026 VLH 16
turbines and no sluices, has been put forward with the operating scheme being based on two-way generation [14]. 17
Therefore, the present study was undertaken to investigate the near-field and far-field impacts of the barrage under 18
different operational scenarios, using the CS domain EFDC_B model, wherein the effects of open boundary conditions 19
can be minimised [11]. 20
2. Description of the Severn Barrage and its operating scheme 21
Further to the previous study on the near and far-field hydrodynamic impacts of the Severn Barrage for the ebb only 22
generation mode [11], and combining with the advantages of two-way generation, as outlined above, this study focuses 23
on the two-way generation scheme with three different designs in terms of the number of turbines and sluices, so that 24
the near and far-field hydrodynamics arising from the barrage can be examined in detail, together with predicting the 25
power generation potential of each design. 26
The Severn Barrage proposed by the STPG [13] was to be 16 km long, from Cardiff in Wales to Weston-super-Mare in 27
England. With its original design for ebb generation only, the barrage would include: 216 bulb turbine generators, 166 28
sluices, large ship locks, possibly a public road and separate small boat locks. Each bulb turbine generator was to be 9 29
m in diameter and the mean flow-through area for each turbine was 63.6 m2. The installed capacity of each turbine was 30
40 MW, so the total installed capacity for all 216 turbines along the barrage line was 8,640 MW. For ebb generation 31
only, the basin was filled during the flood phase of the tides, through the sluices and turbines, with power being 32
generated during the ebb phase by discharging the water through the turbines only, while the sluice gates remained 33
closed. 34
For two-way generation, which forms the basis of this study, there are usually six stages of operation, including: filling, 35
holding I, ebb generation, releasing, holding II and flood generation, respectively. When the barrage is at the filling 36
stage, the sea water flows through the sluices and turbines, raising the water level upstream of the barrage until high 37
water level is reached. The sluice gates and the bulb turbines are then closed. During the holding I stage, both the 38

4
turbines and sluice gates are kept closed until there is a sufficient head difference (i.e. the starting head), created 1
between the upstream and downstream sides of the barrage due to the ebbing tides. The turbines are then opened and 2
flow is permitted through the barrage, generating power until the head difference is lower than the minimum water head 3
required for turbine operation. At the end of the ebb generating stage, the release stage commences, i.e. the sluices are 4
opened in order to draw down the water level in the basin by allowing enough water to flow from the basin to the sea. 5
After low tide and at the time, when the sea and basin levels are equal, all sluices and turbines are closed for the holding 6
II stage. During this mode of operation the basin level remains low until the optimum difference in levels is reached for 7
flood generation. This cycle will then repeat for each tide. In this study, the turbines and sluices are identical to those 8
used in the STPG studies, with the turbine characteristics being implemented in the model, but with three different 9
designs being considered in terms of different turbine and sluice gate configurations. 10
3. Model Description 11
In this study, the computer model used is based on the EFDC model, with the implementation of the barrage module to 12
represent the operation of a barrage, referred to as the EFDC_B model. The development and implementation of the 13
barrage module is detailed in Zhou et al. [10, 11]. In this section, a general description of the EFDC_B model is briefly 14
given here for the sake of completeness. 15
The EFDC model [15] is a general purpose numerical model for simulating three-dimensional hydrodynamic, solute, 16
and bio-geochemical processes in surface water systems, including: rivers, lakes, estuaries, reservoirs, wetlands and 17
near-shore to shelf-scale coastal regions. The EFDC model can predict water levels and velocity components, salinity 18
and temperature distributions and also the processes of cohesive and non-cohesive sediment transport, near field and far 19
field discharge dilutions from multiple sources, eutrophication, the transport and fate of toxic contaminants in the water 20
and sediment phases, and the transport and fate of various life stages of finfish and shellfish. The EFDC model also 21
simulates drying and wetting in shallow areas, using a mass conservative scheme. Various flow control structures, such 22
as weirs, spillways and culverts, can also be simulated in the model. The EFDC model is public domain software, and 23
has been extensively tested and applied to more than 100 modelling studies worldwide. The model has been 24
successfully applied to reservoirs and lakes [16] and to bays and estuaries [17] to study the hydrodynamic processes and 25
water quality characteristics [18], tidal intrusion and sediment transport and its impact on the fate of faecal bacteria [19]. 26
There are two main types of devices normally used in a tidal barrage, connecting the conditions upstream and 27
downstream of the structure, i.e. sluice gates and turbines. The numerical representation of a sluice gate is generally 28
similar to the procedure that occurs in reality. When the sluice gates need to be closed, then the current velocities 29
through the computational cells representing the sluice gates are set to decrease gradually to zero. Likewise, when the 30
sluice gates need opening, the velocities are set to increase gradually, in a half sinusoidal form, to their peak velocity. 31
Hydraulic structures have also been adopted to represent the discharge through bulb turbines. The upstream and 32
downstream flow conditions of the hydraulic structure have been linked dynamically using a Q-H relationship, 33
generally acquired from field or experimental data. In the absence of a Q-H relationship the discharge Q through a 34
turbine has been obtained by linking Q with the head difference between the upstream and downstream water levels as 35
given by: 36
gHACQ d 2 (1) 37

5
where Cd is the discharge coefficient of a turbine; A is the mean flow-through area of the turbine and H is the water 1
level difference across the turbine. 2
The formula for computing the power P generated across a barrage was expressed as: 3
gQHP (2) 4
where is the specific density of sea water; and Q is the discharge across the bulb turbines; is the efficiency 5
coefficient of the bulb turbines and g is gravitational acceleration. The performance of a turbine is often defined through 6
a hill chart, relating specific discharge, energy output and corresponding water head. From the chart, the potential 7
maximum energy output curve can be obtained, which is followed as closely as possible so as to extract the best 8
performance from a turbine [7, 20]. Due to the commercially sensitive nature for the performance of turbines, it is often 9
difficult to obtain detailed hill charts for particular turbines, e.g. as for the VLH turbines mentioned in the introduction. 10
In this study the curves adopted were therefore based on the simplified relationship between the water head, discharge 11
and potential maximum power, as proposed by Goldwag and Potts [21]. With the chart, the power output P and 12
corresponding discharge Q can be determined directly instead of using Eqs. (1) and (2) if the water head H is known. 13
The other hydraulic structures, such as the ship locks, sub-stations and embankments along the barrage, have all been 14
treated as being insignificant in terms of their impact on the hydrodynamics, and have all been treated as wall 15
boundaries in the current model studies. Due to the original instant opening and closing of the bulb turbines and the 16
sluice gates, some numerical oscillations in the water elevations were observed when the barrage was in operation. To 17
remove these numerical oscillations, a ramp function was introduced to change the flow volume through the bulb 18
turbines and sluice gates during the opening and closing of the turbines and sluice gates, as would occur in reality. 19
Assuming that it takes a time period of T, required to open the turbine valves (or sluice gates), the ramp function was 20
expressed in a half sinusoidal form as: TtTtf 0,2/sin , where T was set to typically 10 minutes in the 21
current study (based on typical opening times cited in commercial literature), and t is real time. When the turbine valves 22
(or sluice gates) start to open, then t=0 and f=0, and when they are fully opened, then t=T and f=1. Likewise, when 23
these hydraulic structures need closing, the ramp function is changed into a half cosine function giving: 24
TtTtf 0,2/cos . Based on the different operational procedures of the barrage and the head differences 25
downstream and upstream of the barrage, these can be used to decide what time to open or close the turbine valves and 26
sluice gates, and then the flow volume through the bulb turbines and sluice gates is gradually increased or decreased by 27
multiplying the discharges by the ramp function. 28
4. Model setup and validation 29
Following the work of Zhou et al. [11], the CS model has been set up to assess the tidal power output and investigate 30
the near and far-field hydro-environmental impact of the Severn Barrage, for different design scenarios and with a 31
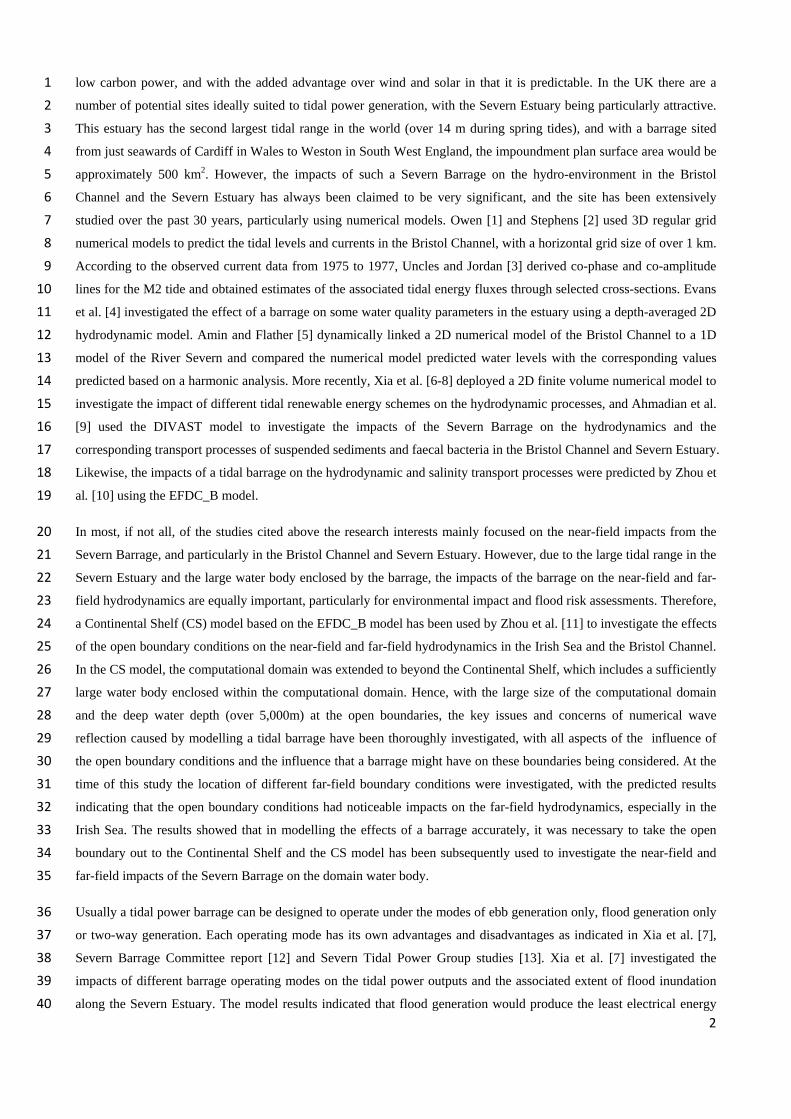
minimal effect of the open boundaries. The CS model was centred around the Severn Estuary, with the open boundaries 32
being extended beyond the edge of the continental shelf, as shown in Fig. 1 and with the site of the Severn Barrage 33
denoted as a red line. 34
Briefly, the boundaries of the CS model were: the southern boundary, which was located between point (45N, 12W) and 35
point (45N, 1.3W), the western boundary, located between points (45N, 12W) and (56.5N, 11W), via points (48N, 14W) 36

6
and (52N, 16W), the eastern boundary, located between points (48.87N, 3.5W) and (50.25N, 3.5W) and the northern 1
boundary, located between points (56.5N, 11W) and (56.73N, 6.24W). The computational domain covered a total plan 2
surface area of 846,800 km2 at mean tidal level, and was represented by 258, 824 cells. The eastern and northern 3
boundaries were mainly the land boundary of the west coastline of the UK and part of the English Channel. In this 4
model there are significant changes in the bathymetry throughout the entire domain, with the bed level varying from 5
more than 5,000 m below Ordnance Datum at the westernmost boundaries, beyond the Continental Shelf, to 5 m above 6
Ordnance Datum, around the easternmost landward boundary close to Gloucester, resulting in significant changes in the 7
water depth. The water depth in the Irish Sea area ranges from between 50 m to 100 m, and the depth varies generally 8
from 60 m to less than 10 m between the seaward end of the Bristol Channel and the Severn Estuary. These depth 9
variations exhibit steep gradients of the seabed levels. 10
For accurate simulations of the barrage operating scheme and the complex flow patterns around the barrage, the grid 11
was locally refined in the region surrounding the barrage. In the surrounding area of the barrage it was necessary to 12
refine the grid size, with a typical cell size of 100 m, which increased up to 1,000 m at the offshore boundaries. From 13
the earlier sensitivity analysis, a time step of 5 s was set for simulations, both with and without the barrage, and with 14
about 20 hours of CPU time required on a desktop PC. For all numerical simulations, the water levels along all the 15
offshore open boundaries were specified as water elevations extracted from the MIKE21 global model, DHI software 16
[22]. In the EFDC model, the bed friction is specified through a log-law roughness height, which was set to 0.008m in 17
this study, based on model calibration. 18
Four scenarios in total, referred to as S0-S3, were considered in this study as listed in Table 1. S0 represented the 19
current conditions without a barrage and any installations. S1 represented the original STPG scheme [13]. S2 and S3 20
represented the modified STPG schemes with 382 and 764 bulb turbines respectively. The power generation operation 21
for schemes S1, S2 and S3 was assumed to be two-way generation. The computations were carried out over a period of 22
14 days, from 1st to 14th March 2005, representing a neap-spring tidal cycle. This was particularly important for 23
studying the flooding impacts of the barrage, with extreme high water levels being included. 24
Table 1 Model Scenarios Simulated 25
Scenario With Barrage No. of Turbines No. of Sluices
S0 No 0 0
S1 Yes 216 166
S2 Yes 382 0
S3 Yes 764 0
26
The model calibration was carried out by comparing the computed and the observed tidal levels at 6 tidal stations within 27
the computational domain, including: Newport in the Severn Estuary, Hinkley Point in the Bristol Channel, Llandudno 28
and Workington in the Irish Sea and Newlyn and Milford Haven in the Celtic Sea. Fig. 2 shows typical comparisons of 29
the tidal levels between 6th and 13th March 2005, at all six locations, with the computed water levels being predicted 30
from the CS model and the measurements obtained from UK tide gauge network [23]. A comparison of the results 31
shows good agreement for both magnitudes and phases at all of the sites. However, close examination of the water level 32
comparisons at the stations at Llandudno and Workington reveal that the CS model under-predict the peak tidal levels at 33

7
these sites by approximately 30cm to 50cm during large spring tides, possibly due to the complex geometry surrounding 1
these locations. However, these discrepancies only occur when the tidal range is more than 8 m. Also at Newport the 2
tidal phase difference can be as much as 25 min, which may be due to the difference in the measured location and that 3
where the model results were taken. 4
The computed tidal currents have been validated against the tidal stream data given in the Admiralty Charts 1121, 1123 5
and 2649. Again, six locations throughout the computational domain were selected for model validation, as also shown 6
in Fig. 1 (indicated by circles). The tidal stream was reconstructed for 6 hours at either side of high water slack tide. Fig. 7
3 shows comparisons of the computed tidal current speeds and directions from the CS model against the tidal stream 8
reconstructed from the Admiralty Charts. Once again the comparisons show good agreement between the model 9
predictions and the chart data, except for some noticeable differences in the flow direction observed at Locations B and 10
Q. 11
The differences between the predicted and field data were calculated and the corresponding RMS values for tidal levels 12
and currents are listed in Tables 2 and 3, respectively. In general, the predicted water levels and tidal currents agree well 13
with the field measurements, showing that the CS model provides reliable hydrodynamic predictions under the current 14
natural conditions, with the boundary conditions from the DHI software [22] being adequate for the model. 15
Table 2 RMS values for the differences between the predicted and measured tidal elevations (units: m) 16
Location Newport Hinkley Point Milford Newlyn Llandudno Workington
RMS 0.3654 0.3446 0.2182 0.1655 0.2317 0.3566
17
Table 3 RMS values for the difference between the predicted and measured current speeds (units: m/s) 18
Location Site B Site F Site Q Site W Site Y Site P
RMS 0.1512 0.1193 0.1492 0.2270 0.2342 0.3306
19
5. Model Results 20
Following calibration and validation of the model against historical water level and tidal current data, the research then 21
focused on examining the impacts of a barrage, mainly in terms of the maximum and minimum water levels, and the 22
maximum tidal currents. These comparisons were then used to try and obtain an optimized option for the barrage 23
operation. The difference in the maximum tidal levels was calculated by subtracting the maximum tidal levels of the 24
case without a barrage from the case with a barrage. Based on the work of Xia et al. [7], the starting head and minimum 25
head for the bulb turbine were set to 4 m and 2 m respectively and the same values were used in this study for all of the 26
scenarios considered with a barrage. It should be borne in mind that the model predictions depend on the specified 27
values of the input parameters, such as the water level boundary conditions, the starting head and minimum head for the 28
bulb turbines and the adopted curves for the turbine performance. These model predictions could have some differences 29
from the previous results in STPG [13] and Xia et al. [6-8], and the aim of this research was to numerically optimize the 30
impacts of the Severn Barrage operated for two-way generation, and for different numbers of turbines and sluices. 31

8
5.1 Predicted maximum water levels 1
With the two-way generation mode, during the flood generation stage, the downstream water enters the upstream basin 2
only through the turbines. If the number of the turbines is small, then a large portion of the flood flow will be stopped 3
before the barrage, resulting in a rise in the maximum water levels and a slight increased risk of flooding in the area 4
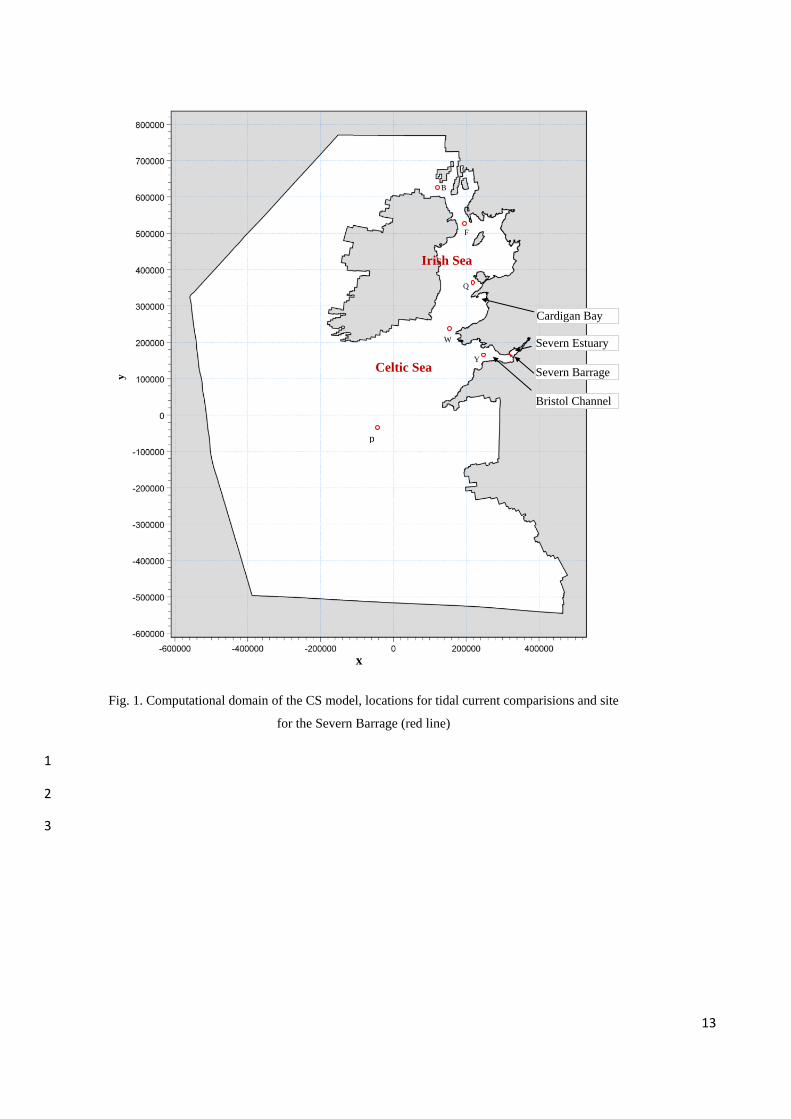
immediately downstream of the barrage. This can be seen from Fig. 4 where the maximum water level increases in the 5
range from 0.5m to 0.8m, from just downstream of the barrage to the middle of the Bristol Channel along the South 6
Wales Coast. The rise in the water level then drops from 0.7m to 0.1m from the middle of Bristol Channel to the outer 7
Bristol Channel. There is also an increase in the maximum water level over much of the northern area of the Irish Sea, 8
with the rise being between 0.06m and 0.09m, i.e. from a 1.86% to 2.78% rise relative to the maximum water level 9
without a barrage, and with a corresponding increase towards the northern part of Cardigan Bay of around 0.07m. On 10
the other hand, the reductions in the maximum water level upstream of the barrage are about 5.7m. Therefore, for 11
scenario S1, it can be seen that the impact of the barrage operation on both the far-field (i.e. particularly the Irish Sea 12
and the outer region of the Bristol Channel) and near-field (i.e. just downstream and upstream of the barrage) are 13
significant, which will consequently impact on the hydro-environment and ecological systems in the Bristol Channel 14
and Severn Estuary. 15
For scenario S2 with 382 bulb turbines only, i.e. replacing the 166 sluice gates in S1 with the same number of bulb 16
turbines, the results as shown in Fig. 5 indicate that by increasing number the turbine allows more water from 17
downstream of the barrage to enter the basin. This results in a clear reduction in the increase in the maximum water 18
level downstream of the barrage, and also a reduction in the decrease in the maximum water level upstream of the 19
barrage, as expected. In comparing Figs. 4 and 5 the results clearly show that the increments in the maximum water 20
level in the Bristol Channel and the Irish Sea have been reduced significantly for this scheme. Between the downstream 21
of the barrage and the middle of the Bristol Channel, the maximum water level increases from 0.1m to 0.4m, with the 22
increase reducing from 0.4m to 0.1m from the middle to the mouth of the Bristol Channel. On the other hand, the 23
reductions in the maximum water level upstream of the barrage are about 2.8m. 24
From the results for scenario S2, it can be concluded that if sufficient turbines are deployed along the barrage line, then 25
the impacts of the barrage on the flow through the barrage will be minimized to a great extent, making tidal flow in the 26
vicinity of the barrage to revert to closer to the natural conditions without the barrage. To this end, Scenario S3 was set 27
up with 764 bulb turbines and no sluices. From Fig. 6, it can be seen that the differences in the maximum water level 28
vary from -0.25m to 0.2m in the regions between the downstream of the barrage and the middle of the Bristol Channel, 29
and they then reduce from 0.2m to 0.06m in the region between the middle and the mouth of the Bristol Channel. 30
Meanwhile, the maximum water level upstream of the barrage is reduced by around 1.2m. In comparing Figs. 4 and 5, 31
with Fig. 6, the results show a significant reduction in flood risk downstream of the barrage and significant 32
improvements in the hydro-environmental impacts on the loss of inter-tidal habitats upstream of the barrage. 33
5.2 Predicted minimum water depths 34
From the comparisons of the predicted maximum water levels, it can be seen that the main impacts of the barrage 35
primarily occur in the Bristol Channel and Severn Estuary, more attention will therefore be focused on comparisons in 36
these water bodies in the following sections. Because of the relatively high bed elevation upstream of the barrage, the 37
minimum water depth is significantly affected in these regions by the different operating scheme of the Severn Barrage, 38

9
which further affects the variations in the intertidal zone areas. Fig. 7 shows a comparison of the minimum water depths 1
for the four scenarios, where it can be seen that there are no noticeable variations in the water levels in the outer region 2
of the Bristol Channel and downstream of the barrage. Likewise, only slight changes in the minimum water depths are 3
observed in the regions upstream of the barrage. While a large portion of the Woodspring Bay and the outer regions 4
close to Cardiff (see Fig. 7) would be partially submerged for S1. However, these situations are improved slightly for 5
S2 and further improved for S3. These investigations further confirm that using the mode of two-way generation offers 6
more opportunity to minimize the loss of the intertidal zones. 7
5.3 Predicted maximum tidal currents 8
The magnitude of tidal currents can significantly affect the transport processes of suspended sediments and the 9
corresponding bacterial levels in turbid waters. Therefore, predicting changes in the maximum tidal currents for 10
different scenarios can make a significant contribution to understanding the variation in the likely impact of the 11
sediment concentrations on water quality. The maximum tidal currents will be reduced to varying degrees, depending 12
on the operation of the barrage, in the Bristol Channel and Severn Estuary, with a comparison of the maximum tidal 13
currents for the four scenarios being shown in Fig. 8 (a) - (d). It can be seen that in the outer region of the Bristol 14
Channel the four scenarios have very similar results in terms of the maximum velocity distribution, but in the middle of 15
the Bristol Channel there is a big differences between the scenarios. For example, the maximum velocity in the middle 16
of the Bristol Channel was predicted to reduce from 2.41 m/s for S0 to 1.75 m/s for S1, to 1.88 m/s for S2 and to 2.12 17
m/s for S3. Likewise, the maximum velocities were predicted to reduce greatly in the regions upstream of the barrage 18
for S1 and S2, while they were predicted to change slightly in the regions upstream of the barrage for S3. For instance, 19
the predicted maximum velocities close to Avonmouth were 2.29, 0.91, 1.43 and 2.06 m/s for the four scenarios 20
respectively. Hence the maximum velocities in the middle of the Bristol Channel and most regions in the Severn 21
Estuary have been reduced to a varying extent for the different scenarios. Through the comparisons, it can be concluded 22
that S3 can produce the most similar maximum velocity distributions to those in S0 under the natural conditions. 23
5.4 Predicted time series of water level of both sides of the barrage 24
In order to examine the impact more closely, a time series of the water levels at both upstream and downstream of the 25
barrage for the different scenarios is shown in Fig. 9, with the reference water level in S0 also being included. For S1 26
(see Fig. 9a), the maximum and minimum water levels downstream of the barrage were 6.9m and -5m respectively, and 27
the maximum and minimum water levels upstream of the barrage were 2.3 m and -2.9 m respectively. Hence the tidal 28
range varied from 11.9 m to 5.2 m from downstream to upstream of the barrage, which indicated that the tidal range 29
was influenced significantly by more than a half reduction in magnitude due to the barrage. 30
For S2 (see Fig. 9b), with 166 more turbines installed in the barrage compared with S1, more water flows through the 31
turbines into the basin, with more power generated and also increasing the water level upstream. The tidal range 32
downstream of the barrage was 11.5 m with the maximum and minimum water levels being 6.4 m and -5.1 m 33
respectively. The predicted tidal range upstream was 7.1 m, with the maximum and minimum water level being 3.3 m 34
and -3.8 m respectively. Compared with S1, the tidal range upstream was increased by 1.9 m from 5.2 m to 7.1 m. 35
For S3 (see Fig. 9c), with 764 turbines installed in the barrage, the improvements in water levels on both sides of the 36
barrage are more obvious compared to S2. The tidal range downstream was 11.8 m with the maximum and minimum 37

10
water levels being 6.4 m and -5.4 m respectively and the tidal range upstream being 10.33 m, with the maximum and 1
minimum water levels being 5.16 m and -5.17m respectively. It can be seen that the tidal range upstream had a 2
significant improvement with an increment of 3.23 m compared to S2, which made the flow characteristics much closer 3
to the natural case, but with some slight changes. However, due to improvements in the tidal range upstream, the 4
maximum water heads across the barrage are significantly reduced. Hence the power outputs are reduced to some extent 5
if still using the bulb turbines to generate the power. However, if the VLH turbines are deployed in the barrage, then the 6
problem of energy output reduction will be much reduced. 7
5.5 Predicted maximum power output 8
Fig. 9 shows the predicted maximum power output curves for mean high water spring tides for the different scenarios. 9
For S1 (see Fig. 9a), the total processes for power generation lasted about 8.5 hours for flood and ebb generations with 10
the maximum water heads being 6.3m and 4.25m, respectively, and with the corresponding maximum power outputs 11
being about 7.78GW and 4.43GW respectively. The total amount of power generated over a mean high water spring 12
tidal cycle was 73.2 GWh for S1. 13
The results for S2 are shown in Fig. 9b, with more turbines installed in the barrage, water will flow through the barrage 14
much quicker. Hence the total time for power generation was predicted to be 7.7 hours, with the maximum water heads 15
being 4.9 m and 3.4 m for flood and ebb generation respectively, and with the corresponding maximum power outputs 16
being 9.35 GW and 5.3 GW respectively. The total amount of power generated over a mean high water spring tidal 17
cycle was 86 GWh. 18
Fig. 9c shows the predicted results for flood and ebb generation for S3, with the maximum water heads being 2.5 m and 19
2.2 m respectively. The maximum power outputs were 5.56 GW and 4.62 GW respectively. The total time for power 20
generation for S3 was predicted to be 5.2 h for both flood and ebb generation. The total amount of power generated over 21
a mean high water spring tidal cycle was 43.8 GWh. 22
6. Conclusions 23
In this paper, the impact of a Severn Barrage operated by two-way generation, with an optimized number of turbines 24
and sluices, has been studied, using the Continental Shelf (CS) model, which is based on using the refined EFDC_B 25
model. The CS model was first validated and calibrated against recorded field data for water levels and current speeds. 26
Comparisons of the predicted and measured water levels and current speeds indicated that the CS model was set up 27
satisfactorily for simulating the hydrodynamics in the Irish Sea, the Bristol Channel and the Severn Estuary for the 28
natural tidal conditions without a barrage. 29
Following model validation, three scenarios were set up with the inclusion of a barrage, and with three designs for the 30
barrage operation, including: with 216 turbines and 166 sluices in S1, 382 turbines with no sluices in S2, and 764 31
turbines with no sluice in S3. The model-predicted results indicate that: 32
(1) In terms of the impacts on the maximum water level for the different designs, S3 provides the best case scenario in 33
mitigating the far-field and near-field flooding risks caused by a Severn Barrage. The maximum water level 34
increase was predicted to be only 0.2 m in the middle of Bristol Channel; S1 was predicted to be the worst case 35
scenario, with the maximum water level increased by 0.8 m in the middle of the Bristol Channel and even in the 36

11
most northern part of the Irish Sea, the maximum water level was increased by between 0.06m and 0.09 m. S2 was 1
predicted to give intermediate changes with the maximum water level being increased by 0.4 m in the middle of 2
Bristol Channel and very little far-field flood risk in the Irish Sea. 3
4
(2) In terms of the minimum water depth and maximum velocity distributions in the Bristol Channel and Severn 5
Estuary, S3 was predicted to produce the most similar results to those under the natural conditions (S0). 6
7
(3) In terms of the impacts on the time series of water levels, S3 was predicted to have closest tidal curve to the 8
original around the barrage, but with a reduced tidal range upstream and with the tidal ranges being changed from 9
11.8 m to 10.33 m from downstream to upstream of the barrage. However, the tidal ranges varied from 11.9 m to 10
5.2 m from downstream to upstream of the barrage for S1, and for S2 the tidal range reduced from 11.5 m 11
downstream to 7.1 m upstream of the barrage. 12
13
(4) In terms of the impacts on the energy outputs, S2 was predicted to provide the most energy output based on the 14
same turbines deployed in the three scenarios and on the same starting head and minimum head for the bulb 15
turbines. However, if VLH turbines were to be used, then S3 would provide the most energy output, with the 16
maximum number of turbines optimized for scenario S3 and with this case leading to the maximum energy output 17
and the minimal hydro-environmental impact associated with the Severn Barrage. 18
ACKNOWLEGEMNTS 19
This work was undertaken as part of the Low Carbon Research Institute Marine Consortium (www.lcri.org.uk) under 20
grant number: 50194. The authors wish to acknowledge the financial support of the Welsh Government, the Higher 21
Education Funding Council for Wales, the Welsh European Funding Office and the European Regional Development 22
Fund Convergence Programme. 23
REFERENCES 24
[1] Owen. A. The Tidal regime of the Bristol Channel: a numerical modelling approach, Geophysical Journal of the 25
Royal Astronomical Society 1980; vol. 62, no. 1, pp. 59-75. 26
[2] Stephens CV. A three-dimensional model for tides and salinity in the Bristol Channel. Continental Shelf Research 27
1986; 6(4): 531-560. 28
[3] Uncles RJ, Jordan MB. Measurements of tidal currents and estimated energy fluxes in the Bristol Channel. In: 29
Beven KJ, editor. Mixing and transport in the environment. Chichester, UK: John Wiley 1984; p. 221-245. 30
[4] Evans, G.P., Mollowney, B.M., Spoel, N.C. Two-dimensional Modelling of the Bristol Channel, UK. In: Spaulding, 31
M.L. (Ed.), Proceedings of the Conference on Estuarine and Coastal Modeling 1990; pp. 331–340. 32
[5] Amin M, Flather RA. Investigation into the possibilities of using Bristol Channel models for tidal predictions. In: 33
Spaulding ML, Cheng RT, editors. Proceedings of the 4th international conference on estuarine and coastal 34
modeling; 1995, p. 41-52. 35
[6] Xia, J., Falconer, RA., Lin, B. Impact of different tidal renewable energy projects on the hydrodynamic processes 36
in the Severn Estuary, UK, Ocean Modelling 2010; 86-104. 37

12
[7] Xia, J., Falconer, RA., Lin, B. Impact of different operating modes for a Severn Barrage on the tidal power and 1
flood inundation in the Severn Estuary, Applied Energy 2010; 87 (7) 2374-2391. 2
[8] Xia, J., Falconer, RA., Lin, B. Hydrodynamic impact of a tidal barrage in the Severn Estuary, UK, Renewable 3
Energy 2010; 35 (7) 1455-1468. 4
[9] Ahmadian, R., Falconer, RA., Lin, B., Hydro-environmental modeling of the proposed Severn barrage, Proc. Inst. 5
Civ. Eng., Energy 2010; 163(3), 107-117. 6
[10] Zhou, J., Falconer, R. A. and Lin B. Refinements to the EFDC model for predicting the hydro-environmental 7
impacts of a barrage across the Severn Estuary. Renewable Energy 2014; 62, pp. 490-505. 8
[11] Zhou, J., Pan S. and Falconer, R. A. Effects of open boundary location on the far-field hydrodynamic impact of a 9
Severn Barrage. Ocean Modelling 2014; 73, pp 19-29. 10
[12] Severn Barrage Committee (SBC). Tidal power from the Severn Estuary (vol. II). Her majesty's Stationery Office, 11
energy paper number 46, London; 1981, p.459. 12
[13] Severn Tidal Power Group (STPG). The Severn barrage project: general report, energy paper No. 57. London: Her 13
Majesty’s Stationery Office (HMSO); 1989. 14
[14] Severn Embryonic Technologies Scheme (SETS), Concept Design of a Very-Low Head dual Generation, tidal 15
scheme for the Severn Barrage. Volume 1: Summary report; 2010, DNS 159636, Issue 1. 16
[15] Hamrick, J. M. A three-dimensional environmental fluid dynamics computer code: Theoretical and computational 17
aspects. The College of William and Mary, Virginia Institute of Marine Science, Special Report 317; 1992, p. 63. 18
[16] Khangaonkar, T., Z. Yang, C. DeGasperi, and K.Marshall. Modeling Hydrothermal Response of a Reservoir to 19
Modifications at a High Head Dam. Water International 2005; Volume 30, Number 3, 378-388. 20
[17] Yang, Z., and J. M. Hamrick. Variational inverse parameter estimation in a cohesive sediment transport model: an 21
adjoint approach. Journal of Geophysical Research 2003; 108(C2), 3055. 22
[18] Zou, R., Carter, S., Shoemaker, L., Parker, A., Henry, T. An integrated hydrodynamic and water quality modeling 23
system to support nutrient TMDL development for Wissahickon Creek. Journal of Environmental Engineering 24
2006; 132, 555-566. 25
[19] Bai, S., and W.S. Lung. Modeling sediment impact on the transport of fecal bacteria. Water Research 2005; 39, 26
5232-5240. 27
[20] Baker, AC. Tidal Power. London: The Institute of Engineering and Technology; 2006, p. 250. 28
[21] Goldwag, E., Potts, R. Energy Production. In: Developments in Tidal Energy, Proceedings of the Third Conference 29
on Tidal Power, The Institution of Civil Engineers. London: Thomas Telford; 1989, p. 75-92. 30
[22] DHI software, Mike 21 toolbox user guide; 2007, p 115-119. 31
[23] UK tide gauge network, 2013. Available from: < https://www.bodc.ac.uk/data/ online_delivery/ntslf/> (accessed 20 32
Aug 2013). 33
34
13
Fig. 1. Computational domain of the CS model, locations for tidal current comparisions and site
for the Severn Barrage (red line)
1
2
3
Y
p
Irish Sea
W
Q
Celtic Sea
F
B
Severn Barrage
Cardigan Bay
Severn Estuary
Bristol Channel
x
y
14
Fig. 4. Differences in predicted maximum water level between Scenarios S0 and S1
1
2
3
x
y

15
1
Fig. 5. Differences in predicted maximum water level between Scenarios S0 and S2 2
3
4
x
y

16
1
Fig. 6. Differences in predicted maximum water level between Scenarios S0 and S3 2
3
4
5
x
y

17
1
2
3
Fig. 9. Predicted water levels and power curves for Scenarios S1, S2 and S3 4
5
6
7
0 2 4 6 8 10 12 14 16 18 20 22 24
-4
-2
0
2
4
6
8
Wat
er L
evel
(m
)
Time (hour)
2
4
6
8
10
Pow
er O
utpu
t (G
W)
Powergeneration
Powergeneration
21.3Gwh 21.3Gwh15.3Gwh 15.3Gwh
Water level downstreamof the barrage
Water level upstreamof the barrage
Water level without the barrage(a)
0 2 4 6 8 10 12 14 16 18 20 22 24
-4
-2
0
2
4
6
8
Wat
er L
evel
(m
)
Time (hour)
2
4
6
8
10
Pow
er O
utpu
t (G
W)
Power generation
Power generation
26.3 Gwh 26.3 Gwh16.7 Gwh 16.7 Gwh
Water level downstreamof the barrage
Water level upstreamof the barrage
Water level without the barrage(b)
0 2 4 6 8 10 12 14 16 18 20 22 24
-4
-2
0
2
4
6
8
Wat
er L
evel
(m
)
Time (hour)
2
4
6
8
10
Pow
er O
utpu
t (G
W)
Power generation
Power generation
14.4 Gwh7.5Gwh 7.5Gwh
Water level without the barrage
Water level downstreamof the barrage
Water level upstreamof the barrage
14.4 Gwh
(c)
Copyright © 2022 FDOKUMEN