MEG/EEG source reconstruction based on Gabor thresholding in the source space

ww
w.jprr.o
rg
Journal of Pattern Recognition Research 1 (2010) 69-94
Received March 23, 2009. Revised February 10, 2010. Accepted July 23, 2010.
Optimal Parameter Selection Technique for a Neural
Network Based Local Thresholding Method
Mohammed J. Islam [email protected]
Majid Ahmadi [email protected]
Maher A. Sid-Ahmed [email protected]
Electrical and Computer Engineering, University of Windsor,
401 Sunset Avenue, Windsor, ON N9B 3P4, Canada
Yasser M. Alginahi [email protected]
College of Computer Science and Engineering, Taibah University,
P.O. Box 30002, Madinah Munawarah, The Kingdom of Saudi Arabia
AbstractThresholding of a given image into binary image is a necessary step for most image analysisand recognition techniques. In document recognition application, success of OCR mostlydepends on the quality of the thresholded image. Non-uniform illumination, low contrastand complex background make it challenging in this application. In this paper, selection ofoptimal parameters for Neural Network (NN) based local thresholding approach for greyscale composite document image with non-uniform background is proposed. NN-basedlocal image thresholding technique uses 8 statistical and textural image features to obtaina feature vector for each pixel from a window of size (2n + 1)x(2n + 1), where n ≥ 1.An exhaustive search was conducted on these features and found pixel value, mean andentropy are the optimal features at window size 3x3. To validate these 3 features somenon-uniform watermarked document images with known binary document images calledbase documents are used. Characters were extracted from these watermarked documentsusing the proposed 3 features. The difference between the thresholded document andbase document is the noise. A quantitative measure Peak-Signal-to-Noise ratio (PSNR) isused to measure the noise. In case of unknown base document characters were extractedthrough the proposed 3 features and used in a commercial OCR to obtain the characterrecognition rate. The average recognition rate 99.25% and PSNR shows that the proposed3 features are the optimal compare to the NN-based thresholding technique with differentparameters presented in the literature.
Keywords: Image Features, Image Segmentation, Neural Network, OCR
1. Introduction
Giant steps have been taken in the last two decades, both in terms of technological sup-ports and in software products to provide computerized Document Analysis System (DAS).Optical character recognition (OCR) contributes to this progress by providing techniquesto convert large volumes of text to readable file automatically. There are so many papersand patents claiming recognition rates as high as 99.99%, this gives the impression thatOCR problems seem to have been solved. However, the failure of some real applicationsshows that performance problems subsist on composite and degraded paper documents withnon-uniform background. Non-uniform background is caused by watermarks and complexpatterns used in printing security documents. Transforming composite documents with non-uniform background into electronic format in a form suitable for efficient storage, retrievaland interpretation continues to be a challenging problem [5, 11, 12].
Thresholding is a popular tool for image segmentation that tries to identify and extractthe object from its background on which it is superimposed. In general, performance of
c© 2010 JPRR. All rights reserved. Permissions to make digital or hard copies of all or partof this work for personal or classroom use is granted without fee provided that copies are notmade or distributed for profit or commercial advantage and that copies bear this notice andthe full citation on the first page. To copy otherwise, or to republish, requires a fee and/orspecial permission from JPRR.

Mohammed J. Islam et.al.
the image thresholding technique depends on the type of document, image illumination,contrast and the complexity of the image background. There are many thresholding schemespublished in the literature and selecting an appropriate one can be a difficult task. NN-based local thresholding method is considered to be one of the best solutions in documentrecognition application.
Trier and Jain [1] present a comparison of 4 global and 11 local thresholding techniques. InSahoo et. al. [3] 20 global thresholding techniques were compared. Sezgin and Sankur [10]conducted an exhaustive survey on 40 bi-level thresholding techniques. From the techniquesused in these above mentioned literatures, Niblack [2] local adaptive method and Otsu [4]method were found to be the best candidate in thresholding scheme.
Very few researchers have investigated the use of NN in thresholding of grey level im-ages. This is because of computational cost of the NN-based thresholding which makes itunsuitable for online applications. Koker and Sari [8] used NN to automatically select aglobal threshold value for an industrial vision system based on the histogram of the image.In this method the histogram of the supervised training data (256 levels) is used as inputand global threshold value that is determined by visually inspecting the histogram of thetraining image is used as target value. Using this procedure the training data is preparedfor the application in different illumination environment. In training phase, the producedoutput is compared to the target output, calculates the errors, adjust the synaptic weightsof the NN until an acceptable weight is achieved to minimize the error between producedand target outputs. Adnan Khashman [13] used a supervised neural network for documentimage binarization where local threshold values are used to train the network in order toobtain the optimum global threshold values. 86% recgnition rate is obtained based on visualinspection for degraded non-uniform historical document images.
Alginahi et. al. [5, 12] developed NN-based technique for thresholding composite digitizeddocuments with complex background. This method uses 8 statistical and textural features ofan image for each pixel at a window size 5x5. A modified NN-based thresholding techniquewas developed by Alginahi [11] very recently where the author claimed 5 parameters atwindow size 3x3 provides the best results. But the author did not present any justificationin support of the claim. The main aim of this paper is to conduct an exhaustive search onthese 8 features and find the optimal parameters at optimal window size.
A handful of binarization performance criteria [14] have been proposed, based on OCRperformance criteria which is one of the most acceptable method. Therefore, the optimalityis measured quantitatively by PSNR for known base documents and recognition rate forunknown base documents. To test the performance of the optimal parameters in NN-basedthresholding techniques a comparative study is carried out. In our experimentation, Otsu’sglobal thresholding [4], Niblack [2], HMM [15] and Kittler[16] were utilized as benchmark forthis comparison. To validate the optimal parameters, thresholded image using the proposedtechnique will be compared to the Niblack [2] and Otsu [4] techniques in terms of yieldingthe character recognition rate.
The remainder of this paper is organized as follows: In Section 2, statistical texturefeatures are defined. NN-based thresholding technique and it’s observation, criticisms andobjectives are discussed in Sections 3 and 4 respectively. Finally, experimental results arediscussed in Section 5 and Section 6 concludes the paper.
70

Optimal Parameter Selection for a Neural Network Based Local Thresholding
2. Statistical Texture Features
Statistical features are extracted for each centered pixel in a window of size (2n+1)x(2n+1),where n ≥ 1. This window can be randomly placed at different locations by the user inthe area of the image in which features need to be extracted . The extracted features arethen used in neural classifier to train it for the recognition of a particular area in images ofsimilar nature. The NN-based thresholding technique takes advantage of the image texturalcharacteristics by considering the statistical descriptors in a neighborhood of pixels. Thestatistical and textural features are useful in characterizing the set of neighborhood valuesof pixels, which are related to its moments. These features are pixel value, mean, stan-dard deviation, smoothness, entropy, skewness, kurtosis and uniformity. Theseare adapted from [5, 6, 11, 12].
1. Pixel ValueThe center pixel, p(i, j) in a window of size (2n+1)x(2n+1), where n ≥ 1, was takenas the first feature.
2. MeanThe mean, µij of the pixel values in the defined window, estimates the value aroundthe pixel in which central clustering occurs.
µij =1
(2n + 1)2
i+n∑
x=i−n
j+n∑
y=j−n
p(x, y) (1)
3. Standard DeviationThe standard deviation, σij is the estimate of the mean square deviation of grey pixelvalue p(x, y) from its mean value µij. Standard deviation describes the dispersionwithin a local region. The standard deviation is defined as:
σij =1
(2n + 1)
√
√
√
√
i+n∑
x=i−n
j+n∑
y=j−n
(p(x, y) − µij)2 (2)
4. SmoothnessRelative smoothness, Rij is a measure of grey level contrast that can be used toestablish descriptors of relative smoothness.
Rij = 1 −1
1 + σ2ij
(3)
5. EntropyEntropy, hij can also be used to describe the distribution variation in a region. Overallentropy of neighborhood pixels in the window can be calculated as:
hij = −
L−1∑
k=0
Prk(log2Prk) (4)
Where Prk is the probability of the k-th grey level in the range [0 1], which can becalculated as Zk/(2n + 1)2, Zk is the total number of pixels with the k-th grey leveland L is the total number of grey levels in the window.
71

Mohammed J. Islam et.al.
6. SkewnessSkewness, Sij characterizes the degree of asymmetry of a pixel distribution in thespecified window around its mean. Skewness is a pure number that characterizes onlythe shape of the distribution.
Sij =1
(2n + 1)2
i+n∑
x=i−n
j+n∑
y=j−n
[
p(x, y) − µij
σij
]3
(5)
7. KurtosisKurtosis, Kij measures the peakness or flatness of a distribution relative to a normaldistribution. The conventional definition of kurtosis is:
Kij =
1
(2n + 1)2
i+n∑
x=i−n
j+n∑
y=j−n
[
p(x, y) − µij
σij
]4
− 3 (6)
The last term (−3) makes the value zero for a normal distribution.
8. UniformityUniformity, Uij is a texture measure based on histogram and is defined as:
Uij =
L−1∑
k=0
Pr2k (7)
U is maximum for which all grey levels are equal. Before computing any of the texturefeatures described above, the pixel values of the image were normalized by dividingeach pixel by 255 in order to achieve computational consistency.
3. NN-based Thresholding
The statistical textural features are useful in characterizing the set of neighborhood valuesof pixels. Alginahi [5, 11, 12] utilized these features value in preparing data for training aMulti-Layer Perceptron (MLP) NN which are obtained from window of size (2n+1)x(2n+1),taken from various parts of one image and repeated over many images. Figure 1 shows asample screen capture of the training data preparation. The first step to prepare data fortraining is to load an image then a point or pixel in the image is selected. It is supervisedtraining data preparation method. Therefore, the user knows about the selected pixelwhether it is background or foreground. Accordingly, the user clicks on the object orbackground buttons in order to calculate the feature vector of that point. The process isrepeated for different random points in the same image and different images with complexbackgrounds to get a wide variety of features. The 8 features and their corresponding targetvalue (for background=1 and foreground=0) are stored in a file and then used as inputs tothe NN to train the network to produce the weights needed for testing the classifier.
4. Observations, Criticism and Objectives
The NN-based image thresholding algorithm proposed by Alginahi uses 8 features in thepaper [5, 12] at window size 5x5 and 5 features in the paper [11] at window size 3x3 as aninput to the NN. But increase in features results in more computational cost. Furthermore,larger window size also increases the computational cost hence slower the feature extraction
72

Optimal Parameter Selection for a Neural Network Based Local Thresholding
Fig. 1: Sample Training Data Preparation
process. In this paper, we are questioning the validity of the number of features and windowsize used in the method [12, 11], whether these 8 or 5 features with the window size of 5x5or 3x3 are optimal in terms of yielding the best recognition rate and providing the bestPSNR. Therefore, the main objective of this research is to conduct an exhaustive searchto find and validate the optimal window size and the optimal feature combination among8 features that provide the best recognition rate and PSNR when it is compared to othersimilar techniques.
4.1 Testing Setup
The main objective of this paper is to find the optimal window size and the optimal com-bination of features in terms of yielding the best recognition rate and best PSNR. To fulfillthese objectives, rigorous methodological steps are followed. First of all, 8 features arelabeled as 1, 2, 3, 4, 5, 6, 7 and 8 (see Section 2). Total 255 subsets are possible withoutrepetition from this set of 8 features that are determined using the well known mathematicalexpression shown in equation 8.
nCr =n!
r!(n − r)!(8)
For example, if we consider 7 features out of 8 features, 8 subsets are possible.
73
Mohammed J. Islam et.al.
DocumentImage
ExpectedCharacters
(EC)
RecognizedCharacters
(RC)
NN-basedThresholding
Weights-255Combinations
CommercialOCR (ABBYY)
Error Rate={(EC-RC)/
EC}*100
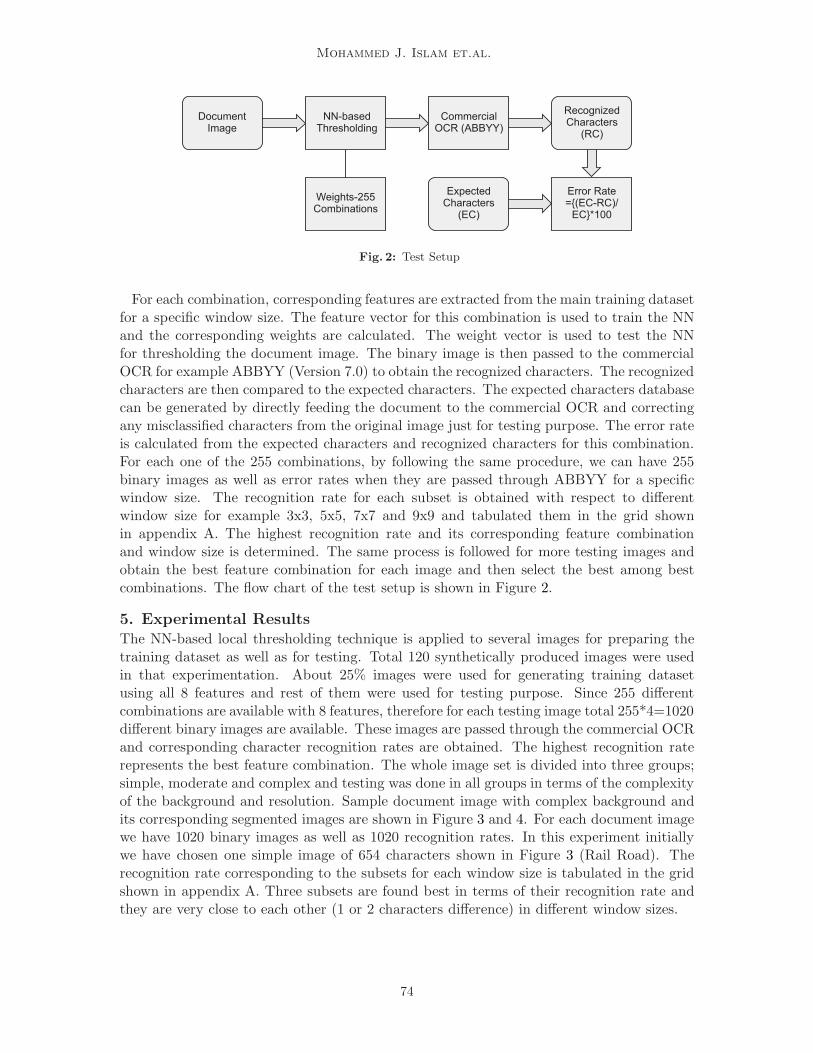
Fig. 2: Test Setup
For each combination, corresponding features are extracted from the main training datasetfor a specific window size. The feature vector for this combination is used to train the NNand the corresponding weights are calculated. The weight vector is used to test the NNfor thresholding the document image. The binary image is then passed to the commercialOCR for example ABBYY (Version 7.0) to obtain the recognized characters. The recognizedcharacters are then compared to the expected characters. The expected characters databasecan be generated by directly feeding the document to the commercial OCR and correctingany misclassified characters from the original image just for testing purpose. The error rateis calculated from the expected characters and recognized characters for this combination.For each one of the 255 combinations, by following the same procedure, we can have 255binary images as well as error rates when they are passed through ABBYY for a specificwindow size. The recognition rate for each subset is obtained with respect to differentwindow size for example 3x3, 5x5, 7x7 and 9x9 and tabulated them in the grid shownin appendix A. The highest recognition rate and its corresponding feature combinationand window size is determined. The same process is followed for more testing images andobtain the best feature combination for each image and then select the best among bestcombinations. The flow chart of the test setup is shown in Figure 2.
5. Experimental Results
The NN-based local thresholding technique is applied to several images for preparing thetraining dataset as well as for testing. Total 120 synthetically produced images were usedin that experimentation. About 25% images were used for generating training datasetusing all 8 features and rest of them were used for testing purpose. Since 255 differentcombinations are available with 8 features, therefore for each testing image total 255*4=1020different binary images are available. These images are passed through the commercial OCRand corresponding character recognition rates are obtained. The highest recognition raterepresents the best feature combination. The whole image set is divided into three groups;simple, moderate and complex and testing was done in all groups in terms of the complexityof the background and resolution. Sample document image with complex background andits corresponding segmented images are shown in Figure 3 and 4. For each document imagewe have 1020 binary images as well as 1020 recognition rates. In this experiment initiallywe have chosen one simple image of 654 characters shown in Figure 3 (Rail Road). Therecognition rate corresponding to the subsets for each window size is tabulated in the gridshown in appendix A. Three subsets are found best in terms of their recognition rate andthey are very close to each other (1 or 2 characters difference) in different window sizes.
74

Optimal Parameter Selection for a Neural Network Based Local Thresholding
Fig. 3: Sample Document Image
Fig. 4: Sample Thresholded Image
The original image is then passed through the commercial OCR ABBYY and the recogni-tion rate is compared with the results obtained from the binary images using best 3 subsets.The same process is repeated for 2 more images and results are tabulated in Table 1. Al-though we have obtained the recognition rate for window sizes 3x3, 5x5, 7x7 and 9x9, forcomparison purpose we have shown the sample output in Table 1 only for window size 5x5,because our work is based on the paper [12] that describes the NN-based thresholding tech-niques and found 98% correct recognition rate at window size 5x5. Therefore, our intentionis to show how our method performs for the same window size.
75

Mohammed J. Islam et.al.
Table 1: Comparative Statement of Recognition Rates (%) - Using Binary and Original Image
ImageBinary Image - Features Subset Original Image{1, 2, 5} {1, 2, 6} {1, 5, 6} ABBYY (7.0)
Health 99.79 99.79 99.58 99.37Rail 99.85 99.54 99.54 99.24Arnold 99.51 99.01 96.30 96.79
Average 99.72 99.45 98.07 98.47
It is observed from Table 1 that feature subsets {1, 2, 5}, {1, 2, 6} and {1, 5, 6} providesthe best results and these recognition rates are comparable to different window sizes. Thenfrom these three combinations, two combinations {1, 2, 5} and {1, 2, 6} are picked basedon their average recognition rate and we follow the same procedure for more images. Theresults are shown in Table 2 for window size 5x5.
Table 2: Comparative Statement of Recognition Rates (%) - Features Combination
ImageFeatures Subset
{1, 2, 5} {1, 2, 6}
Niagara 100 99.41Chretien 99.77 99.53George 99.52 99.28Volcano 100 99.71Cats 99.66 99.66
Average 99.79 99.52
Considering all types of images and their corresponding recognition rate the combinationof three selected features ”pixel value (1), mean (2) and entropy (5)” was found to bethe best combination with recognition rate of 99.79%. The same process is applied to moretesting images for different window sizes using the best feature subset. For each windowsize the binary image is generated and is saved in a bit-map (BMP) file. The thresholdingtime is also recorded and is shown in Table 3 for sample images.
The computational time for processing one pixel centered on the different window size isshown in Table 5.
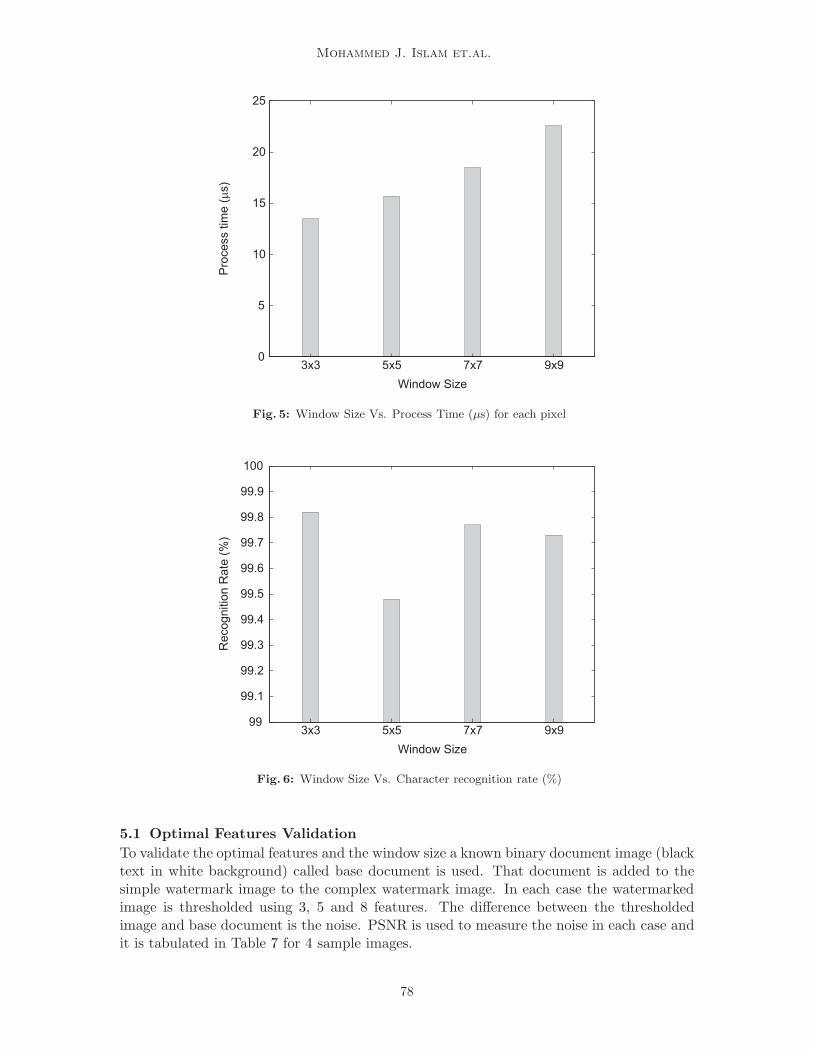
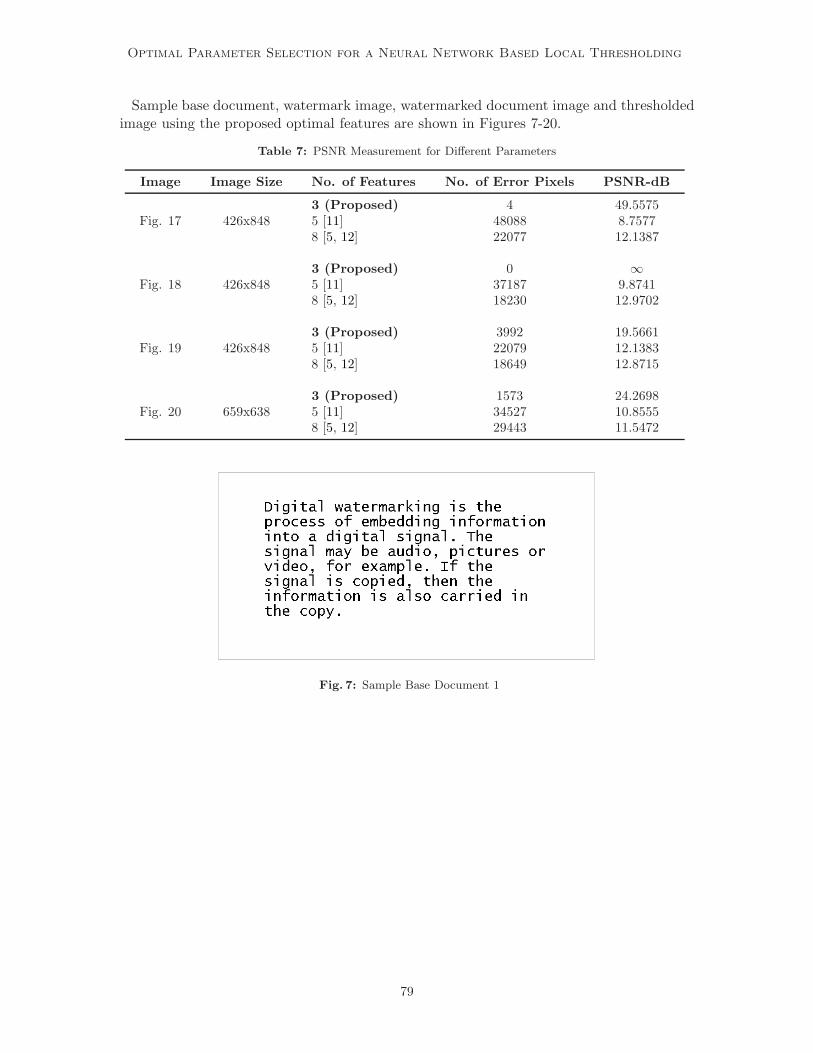
The processing time includes feature extraction, NN testing and finally classification ofthe pixel into object or background. The processing time for each pixel and characterrecognition rate with respect to different window size is shown in Figure 5 and 6 respectively.
From Tables 4, 5 and Figures 5 and 6, it is observed that window size does not play asignificant role especially in character recognition rate. However, increase in window sizeresults in higher computational costs hence slower the segmentation process. Therefore,comparing the computation costs and recognition rate, window size 3x3 is found to bethe optimal in this application using NN-based local thresholding approach. This researchindicated that 3 features used (Pixel value, Mean and Entropy) outperforms the 8 featuresutilized by Alginahi [5, 12] and 5 features utilized by the same author [11]. The processingtime for 3, 5 and 8 features is tabulated in Table 6 for an image of size 689x723 at windowsize 3x3.
76

Optimal Parameter Selection for a Neural Network Based Local Thresholding
Table 3: Thresholding Time (Sec)
Image Image SizeWindow Size
3x3 5x5 7x7 9x9
Arnold 689x723 6.66 7.66 9.11 11.15Health 543x759 5.60 6.57 7.77 9.44Rail 529x1191 8.38 9.91 11.62 14.10Cat 463x877 5.58 6.35 7.64 9.14George 693x712 7.01 8.00 9.47 11.37Volcano 492x886 5.96 6.85 8.25 9.84Niagara 723x845 7.32 9.92 11.45 15.13Chretien 499x726 5.59 6.32 7.46 9.36Health 479x660 5.13 5.51 6.29 7.52Mercury 538x799 6.43 7.94 8.19 10.33Urban 680x966 10.11 11.08 12.42 15.73Insect 869x1084 14.40 16.02 18.21 22.43
Table 4: Window Size Vs. Correct Recognition Rate (%)
Image Total CharsWindow Size - Misclassification3x3 5x5 7x7 9x9
Arnold 405 0 3 1 3Health 476 2 2 2 0Rail 654 0 1 1 2Cat 585 0 1 1 1George 414 0 1 1 1Volcano 384 0 1 0 0Niagara 339 1 0 0 0Chretien 426 3 0 1 0Health 383 0 0 0 0Mercury 301 0 0 0 0Urban 692 0 0 0 0Insect 487 4 20 6 8
Total 5546 10 29 13 15
Correct (%) 100 99.82 99.48 99.77 99.73
Table 5: Window Size Vs. Process Time for each pixel
Window Size Process Time (µs)
3x3 13.55x5 15.77x7 18.59x9 22.6
Table 6: Number of Features Vs. Process Time (Sec)
No. of Features Process Time (Sec)
3 (Proposed) 6.605 (Alginahi [11]) 8.478 (Alginahi [5, 12]) 9.03
77
Mohammed J. Islam et.al.
3x3 5x5 7x7 9x90
5
10
15
20
25
Window Size
Pro
ce
ss t
ime
(s)
m
Fig. 5: Window Size Vs. Process Time (µs) for each pixel
3x3 5x5 7x7 9x999
99.1
99.2
99.3
99.4
99.5
99.6
99.7
99.8
99.9
100
Window Size
Re
co
gn
itio
n R
ate
(%
)
Fig. 6: Window Size Vs. Character recognition rate (%)
5.1 Optimal Features Validation
To validate the optimal features and the window size a known binary document image (blacktext in white background) called base document is used. That document is added to thesimple watermark image to the complex watermark image. In each case the watermarkedimage is thresholded using 3, 5 and 8 features. The difference between the thresholdedimage and base document is the noise. PSNR is used to measure the noise in each case andit is tabulated in Table 7 for 4 sample images.
78
Optimal Parameter Selection for a Neural Network Based Local Thresholding
Sample base document, watermark image, watermarked document image and thresholdedimage using the proposed optimal features are shown in Figures 7-20.
Table 7: PSNR Measurement for Different Parameters
Image Image Size No. of Features No. of Error Pixels PSNR-dB
3 (Proposed) 4 49.5575Fig. 17 426x848 5 [11] 48088 8.7577
8 [5, 12] 22077 12.1387
3 (Proposed) 0 ∞Fig. 18 426x848 5 [11] 37187 9.8741
8 [5, 12] 18230 12.9702
3 (Proposed) 3992 19.5661Fig. 19 426x848 5 [11] 22079 12.1383
8 [5, 12] 18649 12.8715
3 (Proposed) 1573 24.2698Fig. 20 659x638 5 [11] 34527 10.8555
8 [5, 12] 29443 11.5472
Fig. 7: Sample Base Document 1
79

Mohammed J. Islam et.al.
Fig. 8: Sample Base Document 2
80

Optimal Parameter Selection for a Neural Network Based Local Thresholding
Fig. 9: Sample Watermark 1
Fig. 10: Sample Watermark 2
Fig. 11: Sample Watermark 3
81
Mohammed J. Islam et.al.
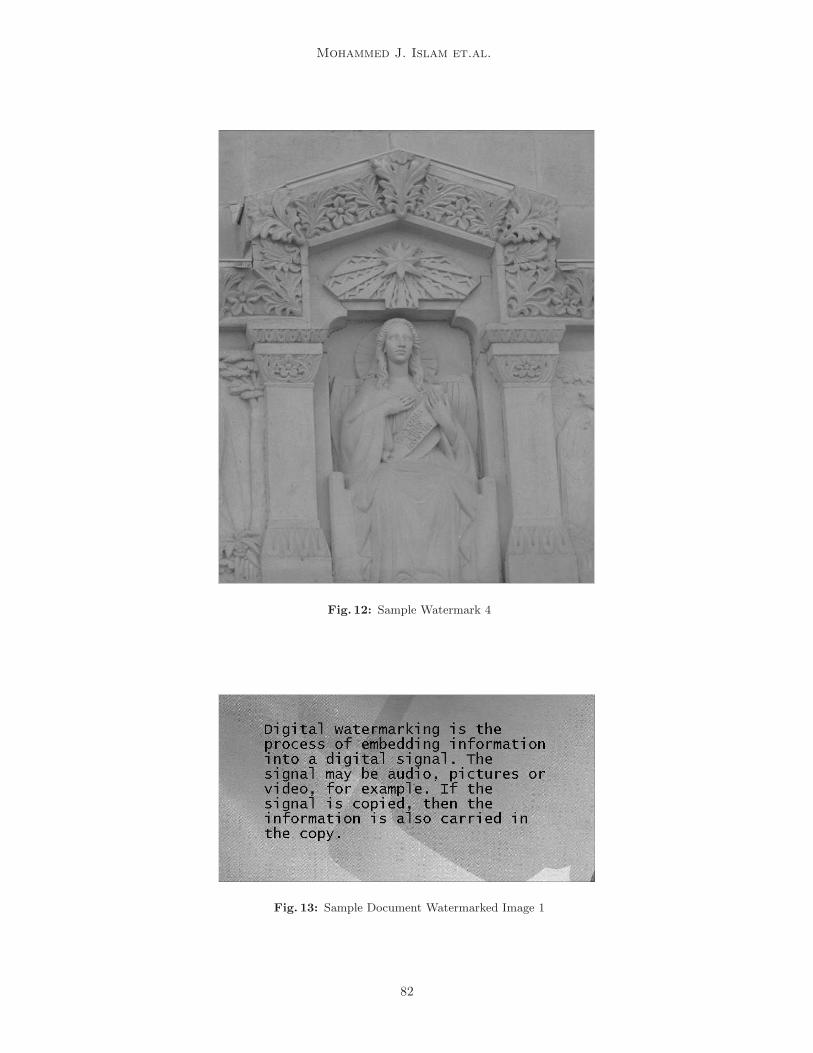
Fig. 12: Sample Watermark 4
Fig. 13: Sample Document Watermarked Image 1
82

Optimal Parameter Selection for a Neural Network Based Local Thresholding
Fig. 14: Sample Document Watermarked Image 2
Fig. 15: Sample Document Watermarked Image 3
83

Mohammed J. Islam et.al.
Fig. 16: Sample Document Watermarked Image 4
Fig. 17: Thresholded Image 1 Using Proposed 3 Features
84

Optimal Parameter Selection for a Neural Network Based Local Thresholding
Fig. 18: Thresholded Image 2 Using Proposed 3 Features
Fig. 19: Thresholded Image 3 Using Proposed 3 Features
85

Mohammed J. Islam et.al.
Fig. 20: Thresholded Image 4 Using Proposed 3 Features
Fig. 21: OCR output: From Binary Image (Proposed) vs. Expected
Using the window size 3x3 and the optimal feature combination the binary image is passedthrough ABBYY and sample OCR output and the expected output is shown in Figure 21.
To validate the performance of the proposed combination the output from the originalimage is compared to the expected output that is shown in Figure 22. The output ofthe proposed NN-based thresholding technique using 3 best features at window size 3x3 iscompared to Otsu [4] and Niblack [2] method and their outputs are shown in Figures 23,24 and Table 8 for a document image of 405 characters (Fig. 3 - Arnold).
86

Optimal Parameter Selection for a Neural Network Based Local Thresholding
Fig. 22: OCR output: From Original Image vs. Expected
Fig. 23: OCR output: From Binary Image (Using Otsu [4])
Fig. 24: OCR output: From Binary Image (Using Niblack [2])
87

Mohammed J. Islam et.al.
Table 8: Recognition Rate Comparison- Proposed, Niblack [2] and Otsu [4]- (Fig. 3- Arnold)
Techniques Misclassification (chars) Correct Recognition Rate (%)
Proposed 0 100Niblack 11 97Otsu 59 85
Using these three features (Pixel value, Mean and Entropy) and window size 3x3, segmen-tation is performed for simple, moderate and complex images. Another sample segmentedimage using proposed features is compared with hidden Markov model (HMM) [15]-basedbinarization, Otsu [4] and Kittler [16] method that is shown in Figure 25.
Fig. 25: Segmentation Performance Comparison: Proposed, HMM[15], Kittler [16] and Otsu [4]
From this figure it is obvious that Kittler [16] and HMM [15] based segmentation hasalmost identical performance. But the proposed one is better than that.
88

Optimal Parameter Selection for a Neural Network Based Local Thresholding
Then the segmented image is passed through the ABBYY commercial OCR to obtain theoverall simulation results for around 15000 characters. The simulation result is shown inTable 9.
Table 9: Performance of the Proposed Features (Pixel, Mean, Entropy)
Technique Tested Chars Recognition Rate (%)
Proposed, 3 features 15000 99.25ABBYY [5] - Original Image 14600 96Alginahi [5], 8 features 14600 98Alginahi [11], 5 features Not Mentioned 98.3
6. Conclusions
An exhaustive search was conducted to develop an efficient thresholding technique basedon the work reported in [5, 11, 12]. In this paper, a method is devised to find the optimalparameters and optimal window size in NN-based thresholding technique to segment thenon-uniform and composite document images. Three features pixel value, mean and en-tropy and window size 3x3 are found to be optimal in this technique in terms of PSNR,computational costs and correct recognition rate. To measure the performance of the pro-posed method, the segmented image obtained by the optimal features was compared withHMM [15], Otsu[4], Niblack[2] and Kittler[16]- based segmented image. For known basedocuments and watermark images, the noise is measured in terms of PSNR from the seg-mented image obtained using proposed 3 optimal features, 5 features [11] and 8 features[12] and is compared. The result shows the proposed method outperforms the referencemethods. Then the optimal features were used to segment the same set of document imagefiles used in [5] and applied to a commercial OCR ABBYY and 99.25% recognition rateis achieved for around 15000 characters. Our quantitative study shows that recognitionrate obtained using the proposed method is much higher than the methods found in theliterature.
Acknowledgments
This research has been financially supported by Ontario Student Assistance Programthrough Ontario Graduate Scholarship (OGS) and Research Center for Integrated Microsys-tems (RCIM) of University of Windsor. The financial support of these organizations isgreatly acknowledged with appreciation.
89

Mohammed J. Islam et.al.
References
[1] O.D Trier and A.K. Jain, Goal-directed evaluation of binarization methods. IEEE Trans. onPattern Recognition And Machine Intelligence, Vol. 17, No. 12, pp. 1191-1201, 1995.
[2] W. Niblack, An introduction to Digital Image Processing. Prentice Hall,Eaglewood Cliffs, NJ,1986.
[3] P.K. Sahoo, S. Soltani, A.K.C. Wong, A Survey of thresholding techniques. Computer vision,Graphics and image Processing, Vol. 41, pp. 233-260, 1988.
[4] N. Otsu, A Threshold Selection Method From Gray Level Histograms. IEEE Trans. On Systems,Man and Cybernetics, Vol. 9, pp. 62-66, 1979.
[5] Y. Alginahi, Computer Analysis of Composite Documents with Non-uniform Background. PhDThesis, Electrical and Computer Engineering, University of Windsor,Windsor, ON, 2004.
[6] M.A. Sid-Ahmed, Image Processing Theory, Algorithms and Architectures. McGraw-Hill, NewYork, 1995.
[7] R.C. Gonzalez, and R.E. Woods, Digital Image Processing. Prentice-Hall, New Jersy, 2002.
[8] R. Koker and Y. Sari, Neural Network Based Automatic Threshold Selection for an Industrial
Vision System. Proc. Int. Conf. on Signal Processing, pp. 523-525, 2003.
[9] N. Papamarkos, A Technique for Fuzzy Document Binarization. Proc. Of the ACM Symposiumon Document Engineering, pp. 152-156, 2001.
[10] M. Sezgin and B. Sankur, Survey over image thresholding techniques and quantitative perfor-
mance evaluation. Journal of Electronic Imaging, Vol. 13, No. 1, 2004.
[11] Y. Alginahi, Thresholding and character recognition in security documents with watermarked
background. Proc. Int. Conf. on Digital Image Computing: Techniques and Applications(DICTA’08), pp. 220-225, 2008.
[12] Y. Alginahi, M.A. Sid-Ahmed and M. Ahmadi, Local thresholding of composite documents using
Multi-layer Perceptron Neural Network. The 47-th IEEE International Midwest Symposium onCircuits and Systems, pp. I209- I212, 2004.
[13] A. Khashman, B. Sekeroglu, Document image binarization using a supervised neural network.
International Journal of Neural Systems, Vol 18, No 5, pp. 405-418, 2008.
[14] Y.J. Zhang, A survey on evaluation methods for image segmentation. Pattern Recognition Vol29, pp. 13351346, 1996.
[15] S. Huang, M. Ahmadi, M.A. Sid-Ahmed, A hidden Markov model-based character extraction
method. Pattern Recognition, Vol 41, pp. 2890-2900, 2008.
[16] J. Kittler, J. Illingworth, Minimum error thresholding. Pattern Recognition, Vol 19, pp. 41-47,1986.
90

Optimal Parameter Selection for a Neural Network Based Local Thresholding
Appendix A. Recognition Rate- Grid-based Method
This table represents the recognition rate of a sample document image (figure 3- Rail Road)using a commercial OCR ABBYY 7.0. For 8 features 255 different subsets are available.Each subset is used to obtain the binary image at window size 3x3, 5x5, 7x7 and 9x9.The binary image is then passed through the commercial OCR ABBYY 7.0 and the ob-tained recognition rate is tabulated in the following Tables 10, 11 and 12. Therefore, total255*4=1020 binary images as well as 1020 recognition rates are available for one documentimage.
91

Mohammed J. Islam et.al.
Table 10: Recognition rate in various window size (%)
Features Recognition Rate Features Recognition RateSubset 3x3 5x5 7x7 9x9 Subset 3x3 5x5 7x7 9x9
{1} 0 0 0 0 {1,4,5} 98.32 99.24 98.93 98.32{2} 0 0 0 0 {1,4,6} 74.01 77.06 78.59 77.83{3} 0 0 0 0 {1,4,7} 76.03 75.54 74.01 74.47{4} 0 0 0 0 {1,4,8} 74.47 74.01 73.24 72.48{5} 0 0 0 0 {1,5,6} 99.24 99.54 99.08 98.93{6} 0 0 0 0 {1,5,7} 98.32 98.47 98.01 96.79{7} 0 0 0 0 {1,5,8} 94.95 95.41 94.65 94.8{8} 0 0 0 0 {1,6,7} 82.42 84.71 83.94 81.65{1,2} 98.93 99.24 99.39 98.47 {1,6,8} 83.18 81.65 79.36 78.59{1,3} 95.72 95.11 95.87 95.26 {1,7,8} 84.71 83.94 82.42 81.65{1,4} 95.26 94.65 94.95 94.5 {2,3,4} 93.88 89.3 87.77 87{1,5} 98.78 99.08 99.24 98.93 {2,3,5} 75.54 77.06 76.3 75.54{1,6} 98.93 99.08 98.62 98.47 {2,3,6} 89.3 90.83 92.35 91.59{1,7} 94.8 94.04 95.11 95.26 {2,3,7} 83.18 84.71 82.42 81.65{1,8} 92.35 93.88 94.5 94.04 {2,3,8} 87.77 89.3 90.06 86.24{2,3} 95.11 95.87 94.8 94.65 {2,4,5} 85.47 87.77 83.94 81.65{2,4} 94.5 95.41 95.26 95.11 {2,4,6} 86.24 84.74 87.47 85.62{2,5} 0 0 0 0 {2,4,7} 83.18 81.65 80.12 82.42{2,6} 0 0 0 0 {2,4,8} 77.83 77.06 75.54 74.01{2,7} 91.59 92.35 94.04 93.88 {2,5,6} 0 0 0 0{2,8} 80.12 81.65 83.94 82.42 {2,5,7} 91.59 92.35 93.88 90.06{3,4} 90.06 89.3 84.71 88.53 {2,5,8} 90.83 89.3 90.06 88.53{3,5} 85.47 84.71 86.24 83.18 {2,6,7} 94.04 93.88 95.11 91.59{3,6} 84.71 86.24 83.94 85.47 {2,6,8} 91.59 90.83 91.13 92.05{3,7} 86.24 87 87.77 85.47 {2,7,8} 77.83 77.06 76.30 77.22{3,8} 82.42 87.77 83.94 85.47 {3,4,5} 75.54 74.01 72.48 73.24{4,5} 61.77 69.42 64.07 66.36 {3,4,6} 77.06 75.54 76.30 76.76{4,6} 62.54 69.36 69.42 67.13 {3,4,7} 89.60 89.3 89.14 88.99{4,7} 65.6 67.89 68.65 67.13 {3,4,8} 83.18 81.65 83.94 83.18{4,8} 70.18 68.65 66.36 69.42 {3,5,6} 64.83 66.36 65.60 63.30{5,6} 0 0 0 0 {3,5,7} 69.42 69.89 70.18 70.03{5,7} 83.18 84.71 88.53 85.47 {3,5,8} 77.22 77.06 76.30 75.23{5,8} 83.94 81.65 82.42 83.18 {3,6,7} 74.77 74.01 74.31 75.23{6,7} 88.53 86.24 85.47 84.71 {3,6,8} 71.71 72.48 74.01 73.70{6,8} 71.71 77.06 75.54 74.77 {3,7,8} 72.48 70.95 72.17 71.25{7,8} 77.83 75.54 77.06 76.3 {4,5,6} 70.95 69.42 68.81 69.11{1,2,3} 96.79 95.41 96.64 95.87 {4,5,7} 85.02 84.71 83.94 85.47{1,2,4} 96.18 94.95 95.87 95.41 {4,5,8} 78.59 77.06 77.83 77.06{1,2,5} 100 99.85 99.85 99.69 {4,6,7} 72.48 70.95 71.71 72.17{1,2,6} 99.24 99.54 99.08 98.01 {4,6,8} 74.16 72.48 72.17 72.78{1,2,7} 96.18 95.11 95.72 93.88 {4,7,8} 69.11 69.42 68.65 70.18{1,2,8} 95.41 95.26 96.18 95.72 {5,6,7} 85.32 84.71 85.47 85.02{1,3,4} 96.02 94.95 96.18 95.87 {5,6,8} 76.30 77.06 78.29 75.54{1,3,5} 95.57 96.18 96.02 96.18 {5,7,8} 72.17 72.48 73.24 70.95{1,3,6} 94.34 93.88 92.35 90.83 {6,7,8} 69.72 69.42 71.71 68.65{1,3,7} 94.19 92.35 91.59 90.83 {1,2,3,4} 94.50 93.88 94.19 93.12{1,3,8} 80.12 84.71 83.94 82.42 {1,2,3,5} 93.12 92.35 92.66 91.59
92
Optimal Parameter Selection for a Neural Network Based Local Thresholding
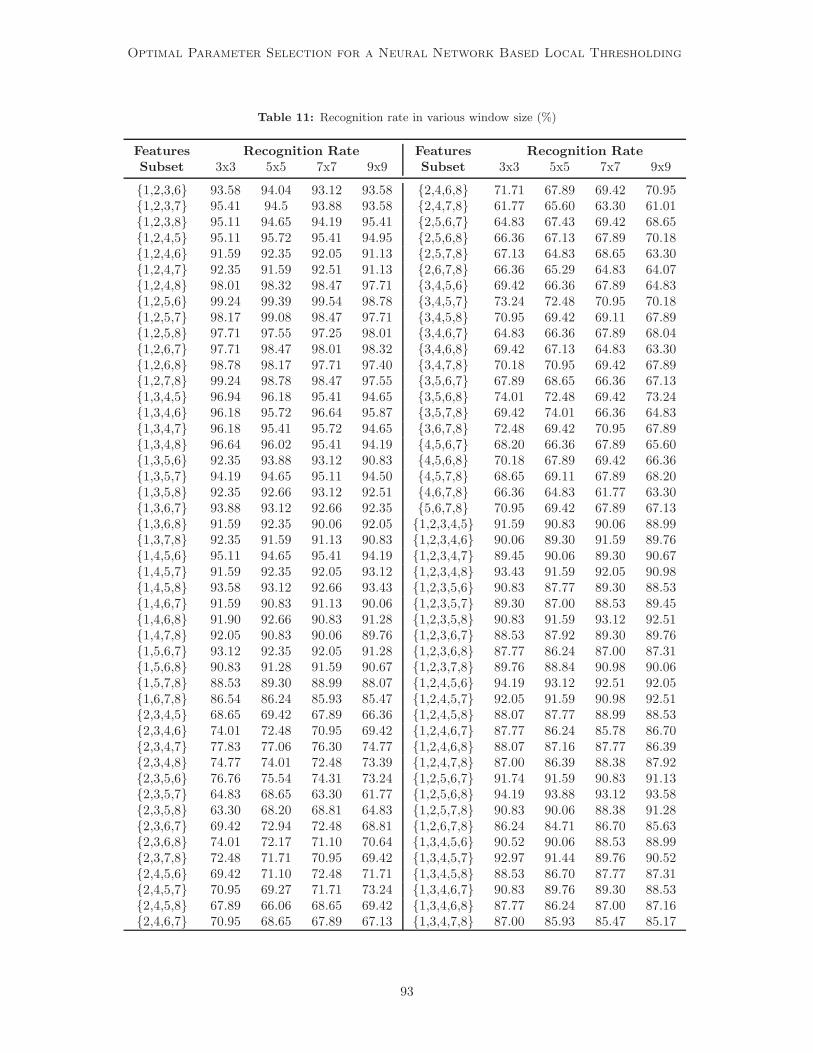
Table 11: Recognition rate in various window size (%)
Features Recognition Rate Features Recognition RateSubset 3x3 5x5 7x7 9x9 Subset 3x3 5x5 7x7 9x9
{1,2,3,6} 93.58 94.04 93.12 93.58 {2,4,6,8} 71.71 67.89 69.42 70.95{1,2,3,7} 95.41 94.5 93.88 93.58 {2,4,7,8} 61.77 65.60 63.30 61.01{1,2,3,8} 95.11 94.65 94.19 95.41 {2,5,6,7} 64.83 67.43 69.42 68.65{1,2,4,5} 95.11 95.72 95.41 94.95 {2,5,6,8} 66.36 67.13 67.89 70.18{1,2,4,6} 91.59 92.35 92.05 91.13 {2,5,7,8} 67.13 64.83 68.65 63.30{1,2,4,7} 92.35 91.59 92.51 91.13 {2,6,7,8} 66.36 65.29 64.83 64.07{1,2,4,8} 98.01 98.32 98.47 97.71 {3,4,5,6} 69.42 66.36 67.89 64.83{1,2,5,6} 99.24 99.39 99.54 98.78 {3,4,5,7} 73.24 72.48 70.95 70.18{1,2,5,7} 98.17 99.08 98.47 97.71 {3,4,5,8} 70.95 69.42 69.11 67.89{1,2,5,8} 97.71 97.55 97.25 98.01 {3,4,6,7} 64.83 66.36 67.89 68.04{1,2,6,7} 97.71 98.47 98.01 98.32 {3,4,6,8} 69.42 67.13 64.83 63.30{1,2,6,8} 98.78 98.17 97.71 97.40 {3,4,7,8} 70.18 70.95 69.42 67.89{1,2,7,8} 99.24 98.78 98.47 97.55 {3,5,6,7} 67.89 68.65 66.36 67.13{1,3,4,5} 96.94 96.18 95.41 94.65 {3,5,6,8} 74.01 72.48 69.42 73.24{1,3,4,6} 96.18 95.72 96.64 95.87 {3,5,7,8} 69.42 74.01 66.36 64.83{1,3,4,7} 96.18 95.41 95.72 94.65 {3,6,7,8} 72.48 69.42 70.95 67.89{1,3,4,8} 96.64 96.02 95.41 94.19 {4,5,6,7} 68.20 66.36 67.89 65.60{1,3,5,6} 92.35 93.88 93.12 90.83 {4,5,6,8} 70.18 67.89 69.42 66.36{1,3,5,7} 94.19 94.65 95.11 94.50 {4,5,7,8} 68.65 69.11 67.89 68.20{1,3,5,8} 92.35 92.66 93.12 92.51 {4,6,7,8} 66.36 64.83 61.77 63.30{1,3,6,7} 93.88 93.12 92.66 92.35 {5,6,7,8} 70.95 69.42 67.89 67.13{1,3,6,8} 91.59 92.35 90.06 92.05 {1,2,3,4,5} 91.59 90.83 90.06 88.99{1,3,7,8} 92.35 91.59 91.13 90.83 {1,2,3,4,6} 90.06 89.30 91.59 89.76{1,4,5,6} 95.11 94.65 95.41 94.19 {1,2,3,4,7} 89.45 90.06 89.30 90.67{1,4,5,7} 91.59 92.35 92.05 93.12 {1,2,3,4,8} 93.43 91.59 92.05 90.98{1,4,5,8} 93.58 93.12 92.66 93.43 {1,2,3,5,6} 90.83 87.77 89.30 88.53{1,4,6,7} 91.59 90.83 91.13 90.06 {1,2,3,5,7} 89.30 87.00 88.53 89.45{1,4,6,8} 91.90 92.66 90.83 91.28 {1,2,3,5,8} 90.83 91.59 93.12 92.51{1,4,7,8} 92.05 90.83 90.06 89.76 {1,2,3,6,7} 88.53 87.92 89.30 89.76{1,5,6,7} 93.12 92.35 92.05 91.28 {1,2,3,6,8} 87.77 86.24 87.00 87.31{1,5,6,8} 90.83 91.28 91.59 90.67 {1,2,3,7,8} 89.76 88.84 90.98 90.06{1,5,7,8} 88.53 89.30 88.99 88.07 {1,2,4,5,6} 94.19 93.12 92.51 92.05{1,6,7,8} 86.54 86.24 85.93 85.47 {1,2,4,5,7} 92.05 91.59 90.98 92.51{2,3,4,5} 68.65 69.42 67.89 66.36 {1,2,4,5,8} 88.07 87.77 88.99 88.53{2,3,4,6} 74.01 72.48 70.95 69.42 {1,2,4,6,7} 87.77 86.24 85.78 86.70{2,3,4,7} 77.83 77.06 76.30 74.77 {1,2,4,6,8} 88.07 87.16 87.77 86.39{2,3,4,8} 74.77 74.01 72.48 73.39 {1,2,4,7,8} 87.00 86.39 88.38 87.92{2,3,5,6} 76.76 75.54 74.31 73.24 {1,2,5,6,7} 91.74 91.59 90.83 91.13{2,3,5,7} 64.83 68.65 63.30 61.77 {1,2,5,6,8} 94.19 93.88 93.12 93.58{2,3,5,8} 63.30 68.20 68.81 64.83 {1,2,5,7,8} 90.83 90.06 88.38 91.28{2,3,6,7} 69.42 72.94 72.48 68.81 {1,2,6,7,8} 86.24 84.71 86.70 85.63{2,3,6,8} 74.01 72.17 71.10 70.64 {1,3,4,5,6} 90.52 90.06 88.53 88.99{2,3,7,8} 72.48 71.71 70.95 69.42 {1,3,4,5,7} 92.97 91.44 89.76 90.52{2,4,5,6} 69.42 71.10 72.48 71.71 {1,3,4,5,8} 88.53 86.70 87.77 87.31{2,4,5,7} 70.95 69.27 71.71 73.24 {1,3,4,6,7} 90.83 89.76 89.30 88.53{2,4,5,8} 67.89 66.06 68.65 69.42 {1,3,4,6,8} 87.77 86.24 87.00 87.16{2,4,6,7} 70.95 68.65 67.89 67.13 {1,3,4,7,8} 87.00 85.93 85.47 85.17
93

Mohammed J. Islam et.al.
Table 12: Recognition rate in various window size (%)
Features Recognition Rate Features Recognition RateSubset 3x3 5x5 7x7 9x9 Subset 3x3 5x5 7x7 9x9
{1,3,5,6,8} 88.53 87.46 88.38 87.46 {1,2,3,4,6,8} 73.24 71.41 72.94 72.17{1,3,5,7,8} 90.06 88.84 87.92 87.46 {1,2,3,4,7,8} 76.15 75.54 74.46 73.24{1,3,6,7,8} 92.51 91.13 90.06 90.52 {1,2,3,5,6,7} 80.12 77.06 75.54 73.70{1,4,5,6,7} 86.39 84.71 85.78 85.47 {1,2,3,5,6,8} 74.77 74.01 73.39 72.32{1,4,5,6,8} 89.76 88.23 88.53 88.99 {1,2,3,5,7,8} 75.54 76.15 74.01 74.77{1,4,5,7,8} 87.00 86.24 84.71 85.47 {1,2,3,6,7,8} 81.65 78.29 80.12 79.20{1,4,6,7,8} 90.98 89.60 90.52 90.06 {1,2,4,5,6,7} 72.78 71.41 70.18 73.09{1,5,6,7,8} 85.78 85.47 86.24 84.86 {1,2,4,5,6,8} 68.65 70.95 70.03 71.41{2,3,4,5,6} 74.01 77.06 72.48 74.01 {1,2,4,5,7,8} 74.77 73.55 74.16 75.69{2,3,4,5,7} 75.23 74.01 73.24 72.48 {1,2,4,6,7,8} 76.15 74.92 74.01 73.85{2,3,4,5,8} 77.83 77.06 75.23 73.70 {1,2,5,6,7,8} 80.28 78.75 78.29 79.36{2,3,4,6,7} 74.01 75.54 72.48 76.15 {1,3,4,5,6,7} 77.83 77.06 76.30 76.61{2,3,4,6,8} 72.48 70.95 71.41 70.18 {1,3,4,5,6,8} 69.42 70.95 68.65 67.89{2,3,4,7,8} 67.89 69.42 70.18 70.80 {1,3,4,5,7,8} 68.35 69.42 68.04 67.13{2,3,5,6,7} 74.01 71.71 69.42 68.81 {1,3,4,6,7,8} 66.36 68.96 67.89 68.65{2,3,5,6,8} 71.41 72.17 72.48 69.72 {1,3,5,6,7,8} 67.89 70.03 70.34 71.41{2,3,5,7,8} 75.54 73.24 71.56 72.94 {1,4,5,6,7,8} 72.78 72.02 74.46 70.64{2,3,6,7,8} 66.36 69.27 68.04 70.34 {2,3,4,5,6,7} 64.83 66.36 67.89 68.65{2,4,5,6,7} 68.65 66.36 70.95 70.64 {2,3,4,5,6,8} 70.03 67.89 68.65 67.13{2,4,5,6,8} 64.83 67.89 64.07 67.13 {2,3,4,5,7,8} 77.83 76.15 74.77 77.22{2,4,5,7,8} 72.48 70.18 71.25 69.57 {2,3,4,6,7,8} 73.55 74.46 73.09 72.17{2,4,6,7,8} 70.64 69.42 67.89 66.06 {2,3,5,6,7,8} 72.78 72.02 71.10 70.64{2,5,6,7,8} 74.77 71.71 71.41 70.18 {2,4,5,6,7,8} 67.89 69.42 66.06 67.58{3,4,5,6,7} 70.95 69.42 71.41 70.18 {3,4,5,6,7,8} 71.71 74.16 73.39 71.41{3,4,5,6,8} 64.83 67.89 66.36 68.65 {1.2.3.4.5.6.7} 90.83 90.06 90.52 88.84{3,4,5,7,8} 77.06 74.16 75.69 72.63 {1,2,3,4,5,6,8} 87.46 86.24 86.70 85.93{3,4,6,7,8} 74.77 72.94 74.01 72.78 {1,2.3.4.5.7.8} 93.12 92.35 91.44 90.98{3,5,6,7,8} 71.41 69.72 67.89 66.36 {1,2,3,4,6,7,8} 92.66 91.59 90.67 90.52{4,5,6,7,8} 64.83 67.89 66.36 68.35 {1,2,3,5,6,7,8} 87.46 86.70 85.78 85.47{1,2,3,4,5,6} 80.12 77.06 75.54 74.77 {1,2,4,5,6,7,8} 88.99 88.38 87.92 87.00{1,2,3,4,5,7} 74.77 74.01 72.48 70.95 {1,3,4,5,6,7,8} 90.21 88.99 87.46 86.09{1,2,3,4,5,8} 76.30 74.77 73.09 72.48 {2,3,4,5,6,7,8} 69.42 70.95 66.36 69.88
{1,2,3,4,5,6,7,8} 90.06 88.53 86.70 89.45
94
Copyright © 2022 FDOKUMEN