
Optimal design of a reliable hydrogen-based stand-alone wind/PV generation system
11
Optimal design of a reliable hydrogen-based stand-alone wind/PV generating system, considering component outages A. Kashefi Kaviani * , G.H. Riahy, SH.M. Kouhsari Renewable Energy Research Laboratory, Department of Electrical Engineering, Amirkabir University of Technology (Tehran Polytechnic), 424 Hafez Ave., Tehran, Iran article info Article history: Received 15 July 2008 Accepted 17 March 2009 Available online 17 April 2009 Keywords: Hybrid PV/WG systems Hydrogen-based storage system Forced outage rate Optimal design Particle swarm optimization Reliability abstract A hybrid wind/photovoltaic/fuel cell generation system is designed to supply power demand. The aim of this design is minimization of annualized cost of the hybrid system over its 20 years of operation. Optimization problem is subject to reliable supply of the demand. Three major components of the system, i.e. wind turbine generators, photovoltaic arrays, and DC/AC converter, may be subject to failure. Also, solar radiation, wind speed, and load data are assumed entirely deterministic. System costs involve investments, replacement, and operation and maintenance as well as loss of load costs. Prices are all empirical and components are commercially available. An advanced variation of Particle Swarm Opti- mization algorithm is used to solve the optimization problem. Results reveal the impact of component outages on the reliability and cost of the system, so they are directly dependent on components’ reliabilities, i.e. outages result in need for a larger generating system for supplying the load with the acceptable reliability. Additionally, it is observed that the inverter’s reliability is an upper limit for the system’s reliability. Moreover, an approximate method for reliability evaluation of the hybrid system is proposed which considerably reduces the time and computations. Ó 2009 Elsevier Ltd. All rights reserved. 1. Introduction Renewable energy resources have enormous potential and can meet the present world energy demand. They can enhance diver- sity in energy supply markets, secure long-term sustainable energy supply, and reduce local and global atmospheric emissions [1]. Photovoltaic (PV) and Wind Generation (WG) units are the most promising technologies for supplying load in remote and rural regions [2]. A drawback, common to these units, is unpredictable nature of solar and wind energy sources. Additionally, the varia- tions of these sources may not match with the time distribution of demand [3]. These drawbacks result in serious reliability concerns in both design and operation of PV and WG systems. Over sizing is an approach to overcome reliability problem, however, it may be costly. As another approach, hybrid PV/WG systems efficiently combine complementary characteristics of solar and wind sources to enhance the system’s reliability and reduce its costs [4]. Block diagram of a hybrid PV/WG system is depicted in Fig. 1 . Generating units are connected to a common DC bus and a combi- nation of a Fuel Cell (FC) stack, an electrolyzer, and a hydrogen storage tank is used as the Energy Storage System (ESS). Hydrogen as a suitable storage medium in renewable energy systems has been subject of many recent studies [5–7]. This system performs both long-term and short-term storage duties and, sometimes, a super capacitor may enhance system’s dynamic response for very short-term purposes [8]. A diesel generator can perform storage task with a lower investment cost. However, atmospheric emissions and need for fuel are its major disadvantages. In contrast, hydrogen-based storage is emission-free and they do not need any fuel supply. Moreover, regarding ever-increasing fuel price and extreme reductions in FC costs, it is expected that hydrogen-based systems will be economical choices for future applications [9]. Also, in hybrid PV/WG/diesel systems, it is not possible to store surplus solar and wind energy during the good seasons. In contrary, in proposed hydrogen-based storage system, electrolyzer converts the excess energy into chemical form, i.e. produces hydrogen, and stores in the hydrogen tank. When the wind speed or solar radia- tion decreases or a peak demand occurs, the hydrogen can be delivered to the load through the FC [10]. In addition, with acces- sibility of hydrogen sources, e.g. when a hydrogen network is available; the FC system can independently supply the load with a high reliability [11]. Because of intermittent characteristic of wind speed and solar radiation, most important challenge in design of such systems is reliable supply of demand under varying weather conditions, * Corresponding author. Tel.: þ1 786 343 3802. E-mail address: alikashefi[email protected] (A. Kashefi Kaviani). Contents lists available at ScienceDirect Renewable Energy journal homepage: www.elsevier.com/locate/renene 0960-1481/$ – see front matter Ó 2009 Elsevier Ltd. All rights reserved. doi:10.1016/j.renene.2009.03.020 Renewable Energy 34 (2009) 2380–2390
Transcript of Optimal design of a reliable hydrogen-based stand-alone wind/PV generation system

lable at ScienceDirect
Renewable Energy 34 (2009) 2380–2390
Contents lists avai
Renewable Energy
journal homepage: www.elsevier .com/locate/renene
Optimal design of a reliable hydrogen-based stand-alonewind/PV generating system, considering component outages
A. Kashefi Kaviani*, G.H. Riahy, SH.M. KouhsariRenewable Energy Research Laboratory, Department of Electrical Engineering, Amirkabir University of Technology (Tehran Polytechnic), 424 Hafez Ave., Tehran, Iran
a r t i c l e i n f o
Article history:Received 15 July 2008Accepted 17 March 2009Available online 17 April 2009
Keywords:Hybrid PV/WG systemsHydrogen-based storage systemForced outage rateOptimal designParticle swarm optimizationReliability
* Corresponding author. Tel.: þ1 786 343 3802.E-mail address: [email protected] (A. Kash
0960-1481/$ – see front matter � 2009 Elsevier Ltd.doi:10.1016/j.renene.2009.03.020
a b s t r a c t
A hybrid wind/photovoltaic/fuel cell generation system is designed to supply power demand. The aim ofthis design is minimization of annualized cost of the hybrid system over its 20 years of operation.Optimization problem is subject to reliable supply of the demand. Three major components of thesystem, i.e. wind turbine generators, photovoltaic arrays, and DC/AC converter, may be subject to failure.Also, solar radiation, wind speed, and load data are assumed entirely deterministic. System costs involveinvestments, replacement, and operation and maintenance as well as loss of load costs. Prices are allempirical and components are commercially available. An advanced variation of Particle Swarm Opti-mization algorithm is used to solve the optimization problem.Results reveal the impact of component outages on the reliability and cost of the system, so they aredirectly dependent on components’ reliabilities, i.e. outages result in need for a larger generating systemfor supplying the load with the acceptable reliability. Additionally, it is observed that the inverter’sreliability is an upper limit for the system’s reliability. Moreover, an approximate method for reliabilityevaluation of the hybrid system is proposed which considerably reduces the time and computations.
� 2009 Elsevier Ltd. All rights reserved.
1. Introduction
Renewable energy resources have enormous potential and canmeet the present world energy demand. They can enhance diver-sity in energy supply markets, secure long-term sustainable energysupply, and reduce local and global atmospheric emissions [1].Photovoltaic (PV) and Wind Generation (WG) units are the mostpromising technologies for supplying load in remote and ruralregions [2]. A drawback, common to these units, is unpredictablenature of solar and wind energy sources. Additionally, the varia-tions of these sources may not match with the time distribution ofdemand [3]. These drawbacks result in serious reliability concernsin both design and operation of PV and WG systems. Over sizing isan approach to overcome reliability problem, however, it may becostly. As another approach, hybrid PV/WG systems efficientlycombine complementary characteristics of solar and wind sourcesto enhance the system’s reliability and reduce its costs [4].
Block diagram of a hybrid PV/WG system is depicted in Fig. 1.Generating units are connected to a common DC bus and a combi-nation of a Fuel Cell (FC) stack, an electrolyzer, and a hydrogenstorage tank is used as the Energy Storage System (ESS). Hydrogen
efi Kaviani).
All rights reserved.
as a suitable storage medium in renewable energy systems hasbeen subject of many recent studies [5–7]. This system performsboth long-term and short-term storage duties and, sometimes,a super capacitor may enhance system’s dynamic response for veryshort-term purposes [8].
A diesel generator can perform storage task with a lowerinvestment cost. However, atmospheric emissions and need for fuelare its major disadvantages. In contrast, hydrogen-based storage isemission-free and they do not need any fuel supply. Moreover,regarding ever-increasing fuel price and extreme reductions in FCcosts, it is expected that hydrogen-based systems will beeconomical choices for future applications [9].
Also, in hybrid PV/WG/diesel systems, it is not possible to storesurplus solar and wind energy during the good seasons. In contrary,in proposed hydrogen-based storage system, electrolyzer convertsthe excess energy into chemical form, i.e. produces hydrogen, andstores in the hydrogen tank. When the wind speed or solar radia-tion decreases or a peak demand occurs, the hydrogen can bedelivered to the load through the FC [10]. In addition, with acces-sibility of hydrogen sources, e.g. when a hydrogen network isavailable; the FC system can independently supply the load witha high reliability [11].
Because of intermittent characteristic of wind speed and solarradiation, most important challenge in design of such systems isreliable supply of demand under varying weather conditions,

Fig. 1. Block diagram of a hybrid wind/photovoltaic generation unit with hydrogen-based ESS.
A. Kashefi Kaviani et al. / Renewable Energy 34 (2009) 2380–2390 2381
considering operation and investment costs of the components.Hence, the goal is optimal design of a hybrid system for reliable andeconomical supply of the load [7]. In this way, literature offersa variety of methods for optimal designing of hybrid PV/WGgenerating systems [1–4,7,12–16].
Nonlinear programming is used in [13] to find the optimal sizeand location of grid-connected wind turbines based on simulationof various scenarios. In [12], a simple iterative search algorithm isproposed for optimal sizing of a hybrid PV/WG/battery system. In[2] and [14] Genetic Algorithm (GA) finds optimal sizes of thehybrid system components. In some later works, PSO is successfullyimplemented for optimal sizing of hybrid stand-alone powersystems, assuming continuous and reliable supply of the load [7,16].GA and PSO are used in [3] and [15] to find optimal size of a wind/PV/battery power system subject to reliability index of Loss ofPower Supply Probability (LPSP). However, they do not consider theoutage probabilities of system components such as wind turbinesand PV arrays. In fact, literature on optimal designing of hybridpower systems, does not consider reliability issues in depth. Forinstance, some very given phenomena that may extremely impactsystem’s reliability and cost, such as failures and outages ofgenerating units are usually ignored. However, reliability assess-ment is relevant for any engineering system [17]. In renewablestudies, for either stand-alone or grid-connected application, reli-ability of different combination of renewable systems withdifferent configuration, component specifications, load profile, andavailable renewable sources, can be solely evaluated.
In this way, [18] studies the impacts of uncertainties in oper-ating parameters and reliability of a Proton Exchange MembraneFuel Cell (PEMFC) and concludes that, uncertainty and reliabilitymust be considered in designing stage of any robust and applicablesystem. Finally, it suggests that a stochastic modeling frameworkshould be interfaced with a numerical optimization scheme toprovide a robust design tool for stochastic optimization underuncertainty.
This suggestion was a great motivation to consider the impact ofcomponent reliabilities, on economical design of stand-alonerenewable systems. Therefore, in [4], as the first step towarddesigning of an economical, robust, and reliable wind/PV hybridpower system, we took the outage probabilities of PV arrays andWGs into considerations. But, further studies revealed that theavailability of DC/AC converter, as the only single cut-set [17] inreliability diagram of the hybrid system, has an extreme influenceover the system’s reliability. Thus, current paper investigates theproblem more carefully. In this way, a novel variation of Particle
Swarm Optimization (PSO) algorithm is exploited to minimize costsof the system over its 20 years of operation, subject to reliabilityconstraint. Wind speed and solar radiation data are available forArdebil province in North West of Iran (latitude: 38�170, longitude:48�150, altitude: 1345 m), and system costs include AnnualizedCosts (AC) of investment, replacement, and operation and main-tenance, as well as costumers’ dissatisfaction costs. Finally, anapproximate method for reliability evaluations of the hybridsystem is proposed. Results indicate that the approximate methodprovides acceptable accuracy, although significantly reducesproblem complexity and, consequently, needed time and compu-tation intensity.
Next section briefly describes the hybrid system model. Reli-ability/cost assessment and the proposed approximate method aredemonstrated in Section 3. Problem statement and PSO algorithmare discussed in Sections 4 and 5, respectively. Simulation resultsare summarized in Section 6. Finally, Section 7 is devoted toconclusion.
2. PV/WG/FC system modeling
As it can be seen in Fig. 1, the system consists of 6 majorcomponents as well as a DC and an AC Busbars. These componentsinvolve wind turbine generators, PV arrays, electrolyzer, hydrogenstorage tank, FC, and DC/AC converter (inverter). Componentmodels, used in this study, are summarized in the followingsections.
2.1. Photovoltaic array
The output power of each PV array, with respect to the solarradiation power, can be calculated through Eq. (1).
PPV ¼G
1000� PPV;rated � hMPPT (1)
where, G is perpendicular radiation at array’s surface (W/m2),PPV,rated is rated power of each PV array at G¼ 1000 W/m2, andhMPPT is the efficiency of PV’s DC/DC converter and MaximumPower Point Tracking System (MPPT). PV systems are usuallyequipped with MPPT systems to maximize the power output,therefore it is reasonable to believe that the PV array working statesstay around the maximum power point [3]. Using these systems,usually leads to about 30% increase in the average amount of theextracted energy from PV arrays and, as a result, it is economically

A. Kashefi Kaviani et al. / Renewable Energy 34 (2009) 2380–23902382
reasonable to incorporate them into hybrid systems [2]. Thus, incurrent study it is assumed that PV arrays are equipped with 95%efficient MPPT systems which provide a 48 V DC at DC bus side. Itshould be noted that, temperature effects are neglected here.
2.2. Wind turbine generator
The output power of each WG unit versus wind speed is, always,given by manufacturer and usually describes the real powertransferred from WG to DC bus. In this study, Bergey Wind Power’sBWC Excel-R/48 [9] is considered. It has a rated capacity of 7.5 kWand provides 48 V DC at the output. Here, the power curve versuswind speed is approximated by the following equation (see Fig. 2).
PWG ¼
0; vW � vcut in; vW � vcut out
PWG;max ��
vW�vcut invrated�vcut in
�m; vcut in � vW � vrated
PWG;max þPfurl�PWG;max
vcut out�vrated� ðvW � vratedÞ; vrated � vW � vcut out
8>><>>: (2)
where, PWG, max and Pfurl are WG’s output power at rated and cut outspeeds, respectively. In this study, the exponent m is equal to 3.Also, in above equation, vW refers to wind speed at the height ofWG’s hub. Measured data at any height can be converted toinstallation height through exponent law [2]:
vW ¼ vmeasureW �
�hhub
hmeasure
�a
(3)
where, a is the exponent law coefficient. This value varies from lessthan 0.10 for very flat land, water or ice to more than 0.25 forheavily forested landscapes. The one-seventh power law (0.14) isa good reference number for relatively flat surfaces such as openterrain of grasslands away from tall trees or buildings [3].
2.3. Generated power by renewable units
By adding output powers of WG and PV, injected power to theDC bus, generated by renewable sources, is calculated as:
Pren
�nfail
WG;nfailPV
�¼�
NWG � nfailWG
�� PWG þ
�NPV � nfail
PV
�� PPV
(4)
where, NWG, NPV, nWGfail and nPV
fail are numbers of installed and failedWG turbines and PV arrays, respectively. The availability andunavailability of system components significantly affect reliabilityof the system. Components may be unavailable because of sched-uled (like maintenance program), or forced (like componentfailure) outages [19].
Generated power by renewable sources flows through twostreams. First stream goes to the inverter to supply the load (Pre-
n�inv), and the second one delivers the surplus power to the elec-trolyzer for hydrogen production (Pren�el).
Fig. 2. Power output characteristic of BWC Excel-R/48 versus wind speed [9].
2.4. Electrolyzer
Electrolyzer works through simple water electrolysis: a directcurrent is passed between two electrodes submerged in water,which thereby decomposes into hydrogen and oxygen. Thehydrogen can then be collected from the anode. Most electro-lyzers produce hydrogen at a pressure around 30 bars [20]. On theother hand, the reactant pressures within a Proton ExchangeMembrane FC (PEMFC) are around 1.2 bar (a bit higher thanatmosphere pressure) [21]. As a result, in most studies, electro-lyzer’s output is directly injected to a hydrogen tank [8,9,16,21,22].However, in some cases, for raising the density of stored energy,a compressor may pressurize electrolyzer’s output up to 200 bar
[20]. Also, in another study, for reducing the compressor’s energyconsumption, two hydrogen tanks are used [10]. In this configu-ration, electrolyzer’s output is directly injected to a low-pressuretank and when this tank is fully charged, compressors pump thehydrogen into a second high-pressure tank. Thus, compressordoes not work continuously and, as a result, it consumes loweramount of energy.
In this paper, the electrolyzer is directly connected to thehydrogen tank, however, the developed software is flexible tohandle the compressor model. Transferred power from electrolyzerto hydrogen tank can be defined as follows:
Pel�tank ¼ Pren�el � hel (5)
where, hel is electrolyzer’s efficiency which is assumed to beconstant for whole operational range [9].
2.5. Hydrogen tank
The energy of hydrogen stored in the tank at time step t isobtained by the following equation:
EtankðtÞ ¼ Etankðt � 1Þ þ
Pel�tankðtÞ �Ptank�FCðtÞ
hstorage
!� Dt (6)
where, Ptank�FC is the transferred power from the hydrogen tank tothe FC. Storage efficiency (hstorage) may present losses resulted fromleakage or pumping, and assumed to be equal to 95% for all workingstates [23]. The mass of stored hydrogen, at any time step t, iscalculated as follows:
mtankðtÞ ¼EtankðtÞHHVH2
(7)
where, the Higher Heating Value (HHV) of hydrogen is equal to39.7 kWh/kg [24]. It is worth to note that there are lower and upperlimits for amount of the stored hydrogen. It is not possible that themass of stored hydrogen exceeds the rated capacity of the tank. Onthe other hand, because of some problems, e.g. hydrogen pressuredrop, a small fraction of the hydrogen (here, 5%) may not beextracted. This fraction is the lower limit of the stored energy.Therefore,
Etank;min � EtankðtÞ � Etank;max (8)

Fig. 3. Steady-state reliability variation of a proton exchange membrane fuel cellversus operation years (the solid line: first 5 years, the dashed line: second 5 yearswith battery replacement) [11].
Fig. 5. Search concept of particle swarm optimization.
900
1000Vertical component
Horizontal component
A. Kashefi Kaviani et al. / Renewable Energy 34 (2009) 2380–2390 2383
2.6. Fuel cell
Fuel cells are electrochemical devices that convert the chemicalenergy of a reaction directly into electrical energy. PEM fuel cell hasreliable performance under intermittent supply and is commer-cially available at large industrial scale capacities. This kind of fuelcell is suitable for large-scale stationary generation and has fastdynamic response with a power release response time of only 1–3 s[20]. Its output power can be defined as a function of its input andefficiency (hFC), which is assumed to be constant (here, 50%) [9].
PFC�inv ¼ Ptank�FC � hFC (9)
2.7. DC/AC converter (inverter)
Finally, an inverter converts electrical power from DC into ACform at the desired frequency of the load. The inverter’s losses canbe presented by inverter’s efficiency (hinv). The efficiency is roughlysupposed to be constant for whole the inverter’s working range(here, 90%) [9].
Pinv�load ¼ ðPFC�inv þ Pren�invÞ � hinv (10)
0
5
10
15
050
100150
2000
0.02
0.04
0.06
0.08
# o
f fa
iled W
ind T
urb
# of failed PV arrays
pro
bab
ility
Fig. 4. Probability distribution function of failures of WGs and PV arrays.
2.8. Operation strategy
Strategy of system operation is according to the following rules.If Pren(t)¼ Pload(t)/hinv, then whole power generated by the
renewable sources is injected to the load through inverter.If Pren(t)> Pload(t)/hinv, then the surplus power is delivered to the
electrolyzer. If the injected power exceeds electrolyzer’s ratedpower, then the excess energy will circulate in a dump resistor.
If Pren(t)< Pload(t)/hinv, then the shortage of power is supplied byfuel cell. If the shortage of power exceeds fuel cell’s rated power orthe stored hydrogen cannot afford that, some fraction of the loadmust be shed. This fact leads to loss of load.
Under all above conditions, component limits are consideredand Eqs. (1)–(10) govern the system.
3. Reliability/cost assessments
System is simulated over a year with 1-h time steps and reli-ability/cost assessment studies are carried out. Then, usingeconomic factors, results are expanded to the 20-year period ofsystem’s lifetime. Load growth and uncertainty in load, solar radi-ation and wind speed data are neglected.
0 1000 2000 3000 4000 5000 6000 7000 80000
100
200
300
400
500
600
700
800
Time (hr)
So
lar rad
iatio
n (W
/m
2)
Fig. 6. Hourly vertical horizontal solar radiation during a year.

0 1000 2000 3000 4000 5000 6000 7000 80000
5
10
15
20
25
Time (hr)
Win
d sp
eed
at 15 m
eters (m
/s)
Fig. 7. Hourly wind speed during a year (at a height of 15 m).
Table 1Components’ specifications [2,9,26,28,29].
Component Capitalcost(US$/unit)
Replacementcost (US$/unit)
O&M(US$/unit-yr)
Lifetime(yr)
Efficiency(%)
Availability(%)
Unit
WG 19,400 15,000 75 20 - 96 7.5 kWPV array 7000 6000 20 20 - 96 1 kWElectrolyzer 2000 1500 25 20 75 100 1 kWHydrogen
tank1300 1200 15 20 95 100 1 kg
Fuel cell 3000 2500 175 5 50 100 1 kWInverter 800 750 8 15 90 99.89 1 kW
A. Kashefi Kaviani et al. / Renewable Energy 34 (2009) 2380–23902384
3.1. Reliability indices
Several reliability indices are introduced in literature[15,19,20,25,26]. Loss of Load Expected (LOLE), Loss of EnergyExpected (LOEE) or Expected Energy not Supplied (EENS), Loss ofPower Supply Probability (LPSP), and Equivalent Loss Factor (ELF)are some of the most common used indices in the reliability eval-uation of generating systems. From these, LOLE is a loss of loadindex, whereas others belong to category of loss of energy indices.These indices are defined in the following sections.
3.1.1. Loss of load expected
LOLE ¼XH
h¼1
E½LOLðhÞ� (11)
where, E[LOL(h)] is the expected value (mathematical expectation)of loss of load at hth time step defined by:
0 1000 2000 3000 4000 5000 6000 7000 800015
20
25
30
35
40
45
50
Time (hr)
IE
EE
R
TS
lo
ad
p
ro
file (kW
)
Fig. 8. Hourly IEEE RTS load profile.
E½LOL� ¼Xs˛S
TðsÞ � f ðsÞ (12)
f(s), in above equation, is the probability of encountering states, and T(s) is the loss of load duration (h), given that occurring state sand S is set of all the possible states.
3.1.2. Loss of energy expected (expected energy not supplied)
LOEE ¼ EENS ¼XH
h¼1
E½LOEðhÞ� (13)
where, E[LOE(h)] is the expected value of loss of energy, or energynot supplied, at time step h defined by:
E½LOE� ¼Xs˛S
QðsÞ � f ðsÞ (14)
Here, Q(s) is the amount of loss of energy (kWh) when systemencounters state s.
3.1.3. Loss of power supply probability
LPSP ¼ LOEEPHh¼1 DðhÞ
(15)
where, D(h) is the load demand (kWh) at time step h.
3.1.4. Equivalent loss factor
ELF ¼ 1H
XH
h¼1
E½QðhÞ�DðhÞ (16)
In all above equations, H is the number of time steps in whichsystem’s reliability is evaluated (here, H¼ 8760). The ELF is the ratioof the effective forced outage hours to the total number of hours. Infact, it contains information about both the numbers and magni-tudes of the outages [20]. Therefore, ELF is chosen as the mainreliability index of this study. However, the developed softwarecalculates all above indices. In developed countries, electricitysuppliers aim at ELF< 0.0001. On the other hand, in rural areas andstand-alone applications (like this study), ELF< 0.01 is acceptable[20].
Table 2Optimal combination in the base case.
NWG NPV Pel (kW) Mtank (kg) PFC (kW) Pinv (kW) qPV (degree)
8 224 119.44 144.19 43.431 46.725 34.129
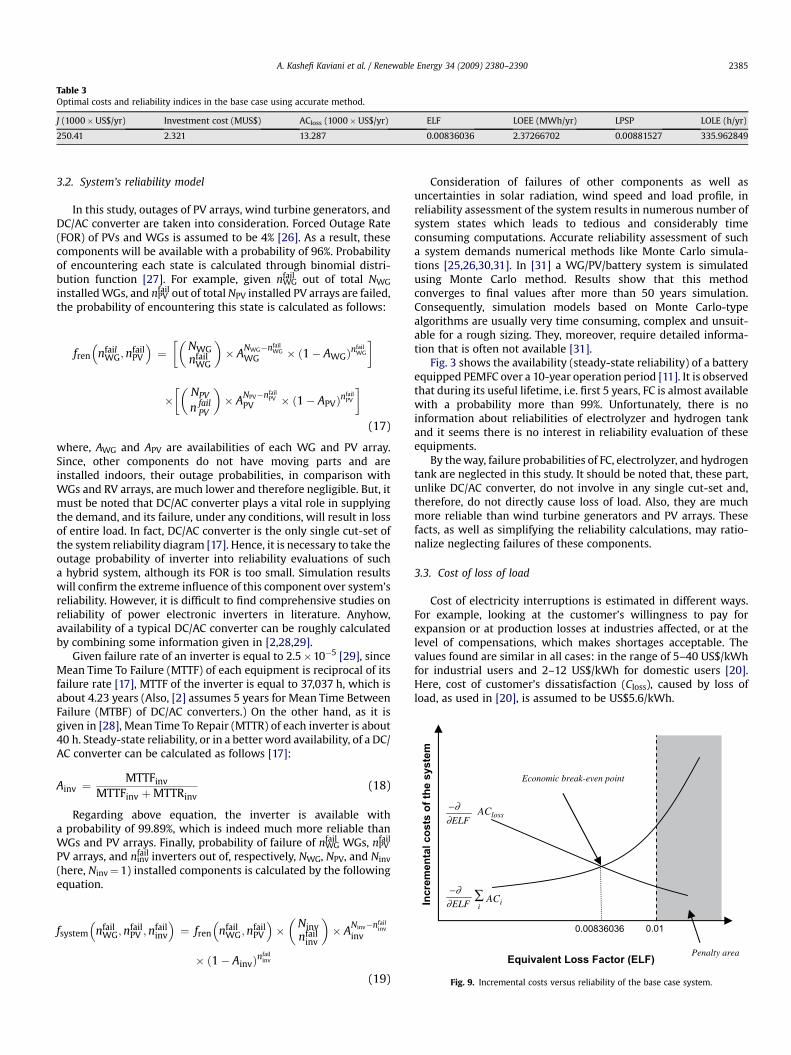
Table 3Optimal costs and reliability indices in the base case using accurate method.
J (1000�US$/yr) Investment cost (MUS$) ACloss (1000�US$/yr) ELF LOEE (MWh/yr) LPSP LOLE (h/yr)
250.41 2.321 13.287 0.00836036 2.37266702 0.00881527 335.962849
0.01
Equivalent Loss Factor (ELF)
In
crem
en
tal co
sts o
f th
e system
0.00836036
ELF iACi
AClossELF
Penalty area
Economic break-even point
∂
∂
–∂
–∂
Fig. 9. Incremental costs versus reliability of the base case system.
A. Kashefi Kaviani et al. / Renewable Energy 34 (2009) 2380–2390 2385
3.2. System’s reliability model
In this study, outages of PV arrays, wind turbine generators, andDC/AC converter are taken into consideration. Forced Outage Rate(FOR) of PVs and WGs is assumed to be 4% [26]. As a result, thesecomponents will be available with a probability of 96%. Probabilityof encountering each state is calculated through binomial distri-bution function [27]. For example, given nWG
fail out of total NWG
installed WGs, and nPVfail out of total NPV installed PV arrays are failed,
the probability of encountering this state is calculated as follows:
fren
�nfail
WG;nfailPV
�¼��
NWGnfail
WG
�� A
NWG�nfailWG
WG � ð1� AWGÞnfailWG
�
���
NPV
n failPV
�� A
NPV�nfailPV
PV � ð1� APVÞnfailPV
�(17)
where, AWG and APV are availabilities of each WG and PV array.Since, other components do not have moving parts and areinstalled indoors, their outage probabilities, in comparison withWGs and RV arrays, are much lower and therefore negligible. But, itmust be noted that DC/AC converter plays a vital role in supplyingthe demand, and its failure, under any conditions, will result in lossof entire load. In fact, DC/AC converter is the only single cut-set ofthe system reliability diagram [17]. Hence, it is necessary to take theoutage probability of inverter into reliability evaluations of sucha hybrid system, although its FOR is too small. Simulation resultswill confirm the extreme influence of this component over system’sreliability. However, it is difficult to find comprehensive studies onreliability of power electronic inverters in literature. Anyhow,availability of a typical DC/AC converter can be roughly calculatedby combining some information given in [2,28,29].
Given failure rate of an inverter is equal to 2.5�10�5 [29], sinceMean Time To Failure (MTTF) of each equipment is reciprocal of itsfailure rate [17], MTTF of the inverter is equal to 37,037 h, which isabout 4.23 years (Also, [2] assumes 5 years for Mean Time BetweenFailure (MTBF) of DC/AC converters.) On the other hand, as it isgiven in [28], Mean Time To Repair (MTTR) of each inverter is about40 h. Steady-state reliability, or in a better word availability, of a DC/AC converter can be calculated as follows [17]:
Ainv ¼MTTFinv
MTTFinv þMTTRinv(18)
Regarding above equation, the inverter is available witha probability of 99.89%, which is indeed much more reliable thanWGs and PV arrays. Finally, probability of failure of nWG
fail WGs, nPVfail
PV arrays, and ninvfail inverters out of, respectively, NWG, NPV, and Ninv
(here, Ninv¼ 1) installed components is calculated by the followingequation.
fsystem
�nfail
WG;nfailPV ;n
failinv
�¼ fren
�nfail
WG;nfailPV
���
Ninvnfail
inv
�� A
Ninv�nfailinv
inv
� ð1� AinvÞnfailinv
(19)
Consideration of failures of other components as well asuncertainties in solar radiation, wind speed and load profile, inreliability assessment of the system results in numerous number ofsystem states which leads to tedious and considerably timeconsuming computations. Accurate reliability assessment of sucha system demands numerical methods like Monte Carlo simula-tions [25,26,30,31]. In [31] a WG/PV/battery system is simulatedusing Monte Carlo method. Results show that this methodconverges to final values after more than 50 years simulation.Consequently, simulation models based on Monte Carlo-typealgorithms are usually very time consuming, complex and unsuit-able for a rough sizing. They, moreover, require detailed informa-tion that is often not available [31].
Fig. 3 shows the availability (steady-state reliability) of a batteryequipped PEMFC over a 10-year operation period [11]. It is observedthat during its useful lifetime, i.e. first 5 years, FC is almost availablewith a probability more than 99%. Unfortunately, there is noinformation about reliabilities of electrolyzer and hydrogen tankand it seems there is no interest in reliability evaluation of theseequipments.
By the way, failure probabilities of FC, electrolyzer, and hydrogentank are neglected in this study. It should be noted that, these part,unlike DC/AC converter, do not involve in any single cut-set and,therefore, do not directly cause loss of load. Also, they are muchmore reliable than wind turbine generators and PV arrays. Thesefacts, as well as simplifying the reliability calculations, may ratio-nalize neglecting failures of these components.
3.3. Cost of loss of load
Cost of electricity interruptions is estimated in different ways.For example, looking at the customer’s willingness to pay forexpansion or at production losses at industries affected, or at thelevel of compensations, which makes shortages acceptable. Thevalues found are similar in all cases: in the range of 5–40 US$/kWhfor industrial users and 2–12 US$/kWh for domestic users [20].Here, cost of customer’s dissatisfaction (Closs), caused by loss ofload, as used in [20], is assumed to be US$5.6/kWh.

Table 4Optimal costs and reliability indices in the base case using approximate method.
J (1000�US$/yr) Investment cost (MUS$) ACloss (1000�US$/yr) ELF LOEE (MWh/yr) LPSP LOLE (h/yr)
Approximate value 250.30 2.321 13.178 0.00828030 2.35313214 0.00874269 333.279600Error �0.10999999 0 �0.109000 �0.00008006 �0.01953488 �0.00007258 �2.6832489Percentage error �0.0439 0 �0.8233 �0.9576 �0.8233 �0.8233 �0.7987
350
400
450
500
alu
e (1000xU
S$/yr)
A. Kashefi Kaviani et al. / Renewable Energy 34 (2009) 2380–23902386
3.4. Approximate method
For reliability assessments, all possible states of the system mustbe enumerated. Then reliability indices can be calculated accordingto the probability of encountering each state and the resultedamount of loss of load in that state. As mentioned in previoussections, goal of this study is to design a reliable hybrid system withminimum cost, using PSO algorithm. Generally, artificial algorithmsare population-based and demand a number of simulations. Forinstance, in this study a swarm consisting of 70 particles searchesthe solution spaces through 200 iterations, that means during eachiteration, the system must be simulated for 70 years. Thus, systemmust be simulated for 70� 200� 8760¼122,640,000 h. Now,given that the system is composed of 199 PV arrays and 14 WGs,therefore each time step must be enumerated to2�15� 200¼ 6000 states. This example clearly illustrates thatoptimal design of such a reliable hybrid system is very complex andcomputationally intensive. Hence, in such studies, any effort toreduce the complexity and computation time is well worth.
Failure Probability Distribution Function (PDF) of 14 WGs(FOR¼ 4%) and 199 PV arrays (FOR¼ 4%) is shown in Fig. 4 (It isobserved that this function is nonzero only in a small area.) Inapproximate method it is proposed that all the possible states foroutages of WGs and PV arrays to be modeled with an equivalentstate. Probability of encountering the equivalent state is 100% andthe generated power by renewable sources in this state is equal tothe expected value of generated power in all the possible states, i.e.
Peqren ¼ E½Pren� ¼
Xs˛S
PrenðsÞ � frenðsÞ (20)
Substituting Eqs. (4) and (17) in above equations yields:
Peqren ¼
XNWG
nfailWG ¼0
XNPV
nfailPV ¼0
nPren
�nfail
WG;nfailPV
�� fren
�nfail
WG;nfailPV
�o(21)
Ultimately, and without much trouble, it can be proved that:
Peqren ¼ NWG � PWG � AWG þ NPV � PPV � APV (22)
However, above equation could be logically anticipated. Results,presented in the following section, will validate the acceptability ofthe proposed approximate method. In fact, and in spite of signifi-cant reduction in amount of computations and therefore compu-tation time, the approximate method is satisfactorily accurate inreliability evaluations. For instance, using this method, number ofall possible states for outages of 14 WGs and 199 PV arrays at eachtime step, reduces from 6000 to only 2 states.
0 20 40 60 80 100 120 140 160 180 200250
300
Iteration number
Fitn
ess v
Fig. 10. Convergence of the optimization algorithm.
4. Problem statement
Goal of this paper is optimal design of a hydrogen-based hybridWG/PV system. Optimization variables are number of wind turbinegenerators, number and installation angle of photovoltaic arrays,and capacities of electrolyzer, hydrogen tank, fuel cell, and DC/ACconverter. System costs consist of annualized cost of investment,replacement, and operation and maintenance of components, as
well as costs of load interruptions during 20 years of operation. Theproblem is subject to maximum allowable ELF reliability index.Besides, system simulation is subject to some other constraints, likecomponents’ maximum and minimum power and energy, whichare described in previous sections.
The Annualized Cost (AC) of component i is defined as [3,16]:
ACi ¼ Ni � f½CCi þ RCi � Kiðir; Li; yiÞ� � CRFðir;RÞ þ O&MCig(23)
where, N may be number (unit) or capacity (kW or kg), CC is capitalcost (US$/unit), RC is cost of each replacement (US$/unit), andO&MC is annual operation and maintenance cost (US$/unit-yr) ofthe component, and R is the useful lifetime of the project (here, 20years). ir is the real interest rate (here, 6%) which is a function ofnominal interest rate (irnominal) and annual inflation rate (fr),defined by [14]:
ir ¼ irnominal � fr1þ fr
(24)
Also, CRF and K are capital recovery factor [3] and singlepayment present worth [14], respectively, which are defined asfollows:
CRFðir;RÞ ¼ ir� ð1þ irÞR
ð1þ irÞR�1(25)
Kiðir; Li; yiÞ ¼Xyi
n¼1
1
ð1þ irÞn�Li(26)
where, L and y are useful lifetime and number of replacements ofthe component during useful lifetime of the project, respectively.Number of replacements of each component is a simple function ofuseful lifetimes of the component and the project [2].
0 1000 2000 3000 4000 5000 6000 7000 80000
1000
2000
3000
4000
5000
6000
Time (hour)
Etan
k(h
Wk)
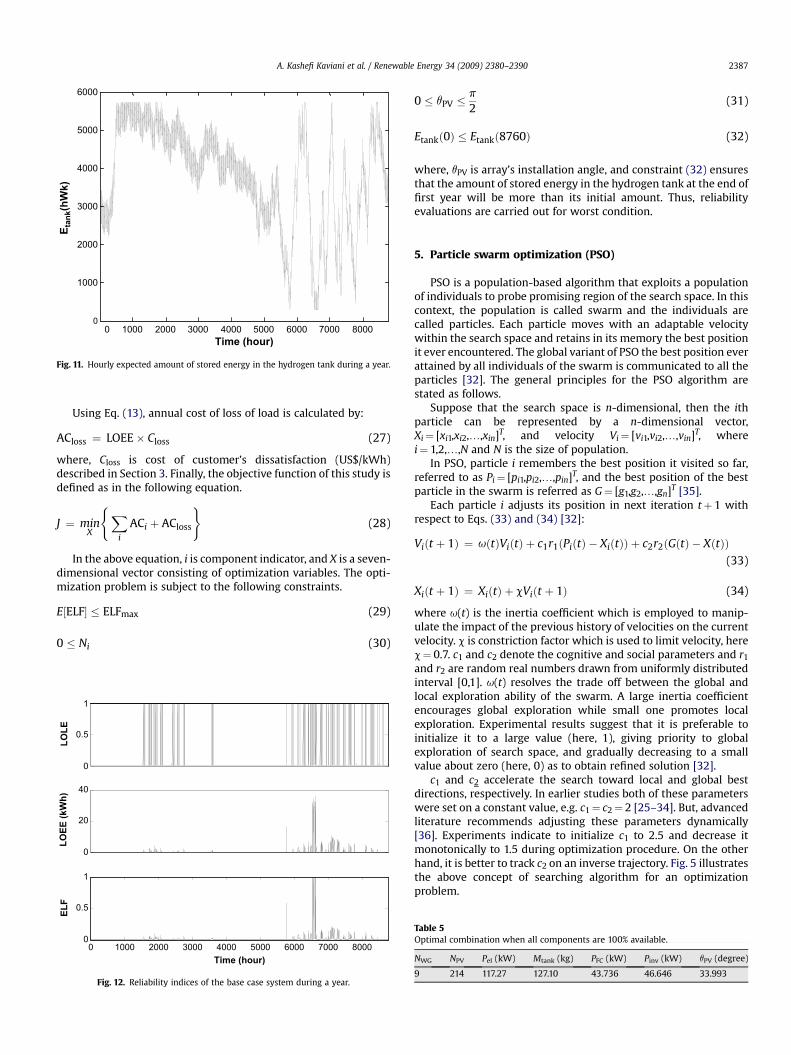
Fig. 11. Hourly expected amount of stored energy in the hydrogen tank during a year.
A. Kashefi Kaviani et al. / Renewable Energy 34 (2009) 2380–2390 2387
Using Eq. (13), annual cost of loss of load is calculated by:
ACloss ¼ LOEE� Closs (27)
where, Closs is cost of customer’s dissatisfaction (US$/kWh)described in Section 3. Finally, the objective function of this study isdefined as in the following equation.
J ¼ minX
(Xi
ACi þ ACloss
)(28)
In the above equation, i is component indicator, and X is a seven-dimensional vector consisting of optimization variables. The opti-mization problem is subject to the following constraints.
E½ELF� � ELFmax (29)
0 � Ni (30)
0
0.5
1
LO
LE
0
20
40
LO
EE
(kW
h)
0 1000 2000 3000 4000 5000 6000 7000 80000
0.5
1
EL
F
Time (hour)
Fig. 12. Reliability indices of the base case system during a year.
0 � qPV �p
2(31)
Etankð0Þ � Etankð8760Þ (32)
where, qPV is array’s installation angle, and constraint (32) ensuresthat the amount of stored energy in the hydrogen tank at the end offirst year will be more than its initial amount. Thus, reliabilityevaluations are carried out for worst condition.
5. Particle swarm optimization (PSO)
PSO is a population-based algorithm that exploits a populationof individuals to probe promising region of the search space. In thiscontext, the population is called swarm and the individuals arecalled particles. Each particle moves with an adaptable velocitywithin the search space and retains in its memory the best positionit ever encountered. The global variant of PSO the best position everattained by all individuals of the swarm is communicated to all theparticles [32]. The general principles for the PSO algorithm arestated as follows.
Suppose that the search space is n-dimensional, then the ithparticle can be represented by a n-dimensional vector,Xi¼ [xi1,xi2,.,xin]T, and velocity Vi¼ [vi1,vi2,.,vin]T, wherei¼ 1,2,.,N and N is the size of population.
In PSO, particle i remembers the best position it visited so far,referred to as Pi¼ [pi1,pi2,.,pin]T, and the best position of the bestparticle in the swarm is referred as G¼ [g1,g2,.,gn]T [35].
Each particle i adjusts its position in next iteration tþ 1 withrespect to Eqs. (33) and (34) [32]:
Viðt þ 1Þ ¼ uðtÞViðtÞ þ c1r1ðPiðtÞ � XiðtÞÞ þ c2r2ðGðtÞ � XðtÞÞ(33)
Xiðt þ 1Þ ¼ XiðtÞ þ cViðt þ 1Þ (34)
where u(t) is the inertia coefficient which is employed to manip-ulate the impact of the previous history of velocities on the currentvelocity. c is constriction factor which is used to limit velocity, herec¼ 0.7. c1 and c2 denote the cognitive and social parameters and r1
and r2 are random real numbers drawn from uniformly distributedinterval [0,1]. u(t) resolves the trade off between the global andlocal exploration ability of the swarm. A large inertia coefficientencourages global exploration while small one promotes localexploration. Experimental results suggest that it is preferable toinitialize it to a large value (here, 1), giving priority to globalexploration of search space, and gradually decreasing to a smallvalue about zero (here, 0) as to obtain refined solution [32].
c1 and c2 accelerate the search toward local and global bestdirections, respectively. In earlier studies both of these parameterswere set on a constant value, e.g. c1¼ c2¼ 2 [25–34]. But, advancedliterature recommends adjusting these parameters dynamically[36]. Experiments indicate to initialize c1 to 2.5 and decrease itmonotonically to 1.5 during optimization procedure. On the otherhand, it is better to track c2 on an inverse trajectory. Fig. 5 illustratesthe above concept of searching algorithm for an optimizationproblem.
Table 5Optimal combination when all components are 100% available.
NWG NPV Pel (kW) Mtank (kg) PFC (kW) Pinv (kW) qPV (degree)
9 214 117.27 127.10 43.736 46.646 33.993

Table 6Optimal costs and reliability indices when all components are 100% available.
J (1000�US$/yr) Investment cost (MUS$) ACloss (1000�US$/yr) ELF LOEE (MWh/yr) LPSP LOLE (h/yr)
242.648 2.2477 12.335 0.007885021 2202.768714 0.008184039 303
A. Kashefi Kaviani et al. / Renewable Energy 34 (2009) 2380–23902388
In order to prevent premature convergence to suboptimalsolutions, Raymond R. Tan augmented a binary PSO with a GA-based mutation operator and achieved significant improvement inthe rate of successful convergence [37]. Therefore, in current studywe incorporated mutation operator into our continuous-space PSOalgorithm. This mutation operator reinitiates the value of eachcontinuous variable into its feasible range by a predefined proba-bility (e.g. 5%).
In this study, number of population is set to 70, and for preventingexplosion of swarm, maximum allowable velocity along eachdimension is set to half of its feasible range. Results show that, in thisapplication, for different number of switching angles, algorithmconverges within 100–150 iterations. Hence, in a conservativemanner, the number of iterations is set to 200. Also, for enhancingthe PSO’s ability in escaping from local minima, a mutation operatoris incorporated into the algorithm. Results indicate that it is better toutilize this operator in discrete iteration intervals with differentprobabilities. In this study, mutation probabilities for iterationintervals of [30,90] and [110, 170] are 1% and 3%, respectively. Otheriteration intervals are not influenced by mutation.
6. Results
Software is developed in MATLAB programming environment.To perform the reliability/cost assessments, it is necessary tosimulate the systems through a year with 1-h time steps. Theavailable data consist of hourly averages of wind speed, recorded ata height of 40 m, and vertical and horizontal solar radiation in oneof the northeastern provinces of Iran, i.e. Ardebil (latitude: 38�170,longitude: 48�150, altitude: 1345 m). The load data are for IEEEReliability Test System (IEEE RTS) [19], with a peak of 50 kW. UsingEq. (3), wind speed data at 15 m (WGs’ installation height) arecalculated. These data are shown in Figs. 6–8. Origin of horizontalaxis is first hour of the first day of solar year, i.e. March 21.
Specifications of components of the hybrid system aresummarized in Table 1 [2,9,26,28,29]. It is worth to mention that, inthe following simulations it is assumed that, initial amount of thehydrogen stored in the tank, i.e. Etank(t� 1) for t¼ 1 in Eq. (6), isequal to half of its rated capacity. Also, for other time step (t> 1),initial amount of stored hydrogen is the expected value of storedhydrogen at the end of previous time step. Also, capital cost ofhydrogen tank includes the cost of initial amount of hydrogenwhich is US$1.8/kg [23].
able 7ptimal combination when Ainv¼ 1 and ELFmax¼ 0.0001.
WG NPV Pel (kW) Mtank (kg) PFC (kW) Pinv (kW) qPV (degree)
3 212 111.86964 224.83447 50.81994 47.93784 34.68634
6.1. Base case
Software is run for the base case on a Pentium IV, 3.2 GHz CPUand 512 MB of RAM. For saving the computation time, states withnegligible probabilities (here, 10�16) are not enumerated. Forinstance, by applying this approach to a system consisting of 14WGs and 199 PV arrays with availabilities of 96%, number ofenumerated states reduces from 15� 200¼ 6000 to 252 and, asa consequence, about half of the computation time is saved. Itshould be noted that, this approach is not effective for smallsystems, because the number of low probable states is notconsiderable. For example in case of 3 WGs and 5 PV arrays, there isno state less probable than 10�16. By the way, it takes about 40 hthat the software finds the optimal combination.
PSO is an inherent unconstrained optimization algorithm,therefore, objective function and constraints should be integratedinto a proper fitness function. Also, since the software limits thevariables to their bounds, constraints (30) and (31) are neverviolated. Thus, fitness function can be defined as a summation ofobjective function (28) and two penalty terms associated withinequality constraints (29) and (32). In this study, the excess amountof each violated inequality constraint is multiplied by 1010 and, then,will be added to the objective function (28). Obtained results, for thisfitness function definition, are shown in Tables 2 and 3. It is observedin Table 3 that reliability inequality constraint, i.e. Eq. (29), is notactivated in the base case. In fact, because of high loss of load costs(i.e. cost of customer’s dissatisfaction), designing a reliable and,therefore, expensive systems is economically reasonable. In otherwords, given the base case conditions, ELF¼ 0.00836036 is thesystem’s economic break-even point (see Fig. 9).
For comparing accurate method with approximate method, theapproximate method is applied to the problem. In this case, opti-mization process is terminated in about 9 h which is considerablyless than 40 h. Results are presented in Table 4. Since, the deferencebetween approximate and accurate method is only in reliabilitycalculations, both of them result in same investment, replacement,and operation and maintenance costs. Also, Table 4 indicates thatthe approximate reliability indices are acceptably close to actualindices provided by the accurate method. It is observed that, themagnitudes of the percentage errors are always below 1%. Addi-tionally, negative percentage errors are evidences that theapproximate method estimates reliability of the base case systemsomehow optimistically. In fact, experiments on other cases indi-cate that the approximate method always yields a slight bettercosts and reliability indices than accurate method. It might bea subject of future studies to find an approach to estimate theapproximation errors.
Convergence curves of the PSO algorithm, for 5 independentruns, are depicted in Fig. 10. It can be seen that, the algorithmconverges to the optimal fitness value after, more or less, 100 iter-ations. So, 200 iterations can be considered as a fair terminationcriterion. Moreover, it is observed that the algorithm, for all theruns, almost converges to the same optimal value (globaloptimum). It is noteworthy that same fitness value does notnecessarily mean same optimal combination. In fact, some farpoints in the solution space may have close fitness values in theobjective domain.
Since reliable supply of the load at each time step, stronglydepends on the amount of the stored energy, the hourly expectedamount of stored energy in the hydrogen tank, during the year, isshown in Fig. 11. It is evident that loss of load is mostly probable atthe hours that stored mass of hydrogen reaches to its minimumallowable limit. Also, amount of the hourly demand, in addition tothe conditions of the stored energy, is another important factor inreliability assessment of the system. This fact is illustrated in Fig. 12,where the hourly reliability indices of the base case system arepresented. This figure confirms that LOLE cannot be a suitable indexfor reliability evaluations of such a hybrid system. In fact, this index
TO
N
1

Table 8Optimal costs and reliability indices when Ainv¼ 1 and ELFmax¼ 0.0001.
J (1000�US$/yr) Investment cost (MUS$) ACloss (1000�US$/yr) ELF LOEE (MWh/yr) LPSP LOLE (h/yr)
Accurate value 253.74 2.4609 0.236366 0.00009980 42.2082046 0.00015681 30.1067263Approximate value 253.739 2.4609 0.236180 0.00009965 42.1750442 0.00015669 30Error (%) 0.0004 0 �0.0785 �0.1513 �0.0785 �0.0785 �0.3545Percentage error 0.001 0 �0.000186 �0.00000015 �0.03316040 �0.00000012 �0.106726
A. Kashefi Kaviani et al. / Renewable Energy 34 (2009) 2380–2390 2389
only calculates the loss of load probability, regardless of the amountof load which is not supplied. In contrary, LOEE and ELF can beconsidered as useful indices in reliability evaluations of energy-based generating systems*.
The annual energy generated by WGs and PV arrays, in the basecase, is about 543 MWh and the total annual demanded andsupplied load are 269.15 and 266.8 MWh, respectively, that means,the optimal designed system is about 49.13% efficient. However,this system is not highly efficient, it is satisfactory with respect toefficiencies of the conventional power plants. Besides, about 3.23%of generated energy is wasted in dummy load (see Section 2.7).Also, the efficiency of energy storage system (ESS) is 35.625%, i.e.product of electrolyzer, hydrogen tank, and fuel cell efficiencies,which is much less than lead–acid batteries round-trip efficiency inshort-term applications (90%) [3]. On the other hand, hydrogen-based ESSs are much more robust and flexible than lead–acidbatteries, especially in long-term applications. As a matter of fact,before making any comparison between these two ESSs,a comprehensive study over project’s lifetime is necessary.
6.2. 100% available components
As it is mentioned in Section 1, literature on optimal sizingstudies, has not taken the outage probabilities of system compo-nents into account and all the components are usually considered100% available. To understand the impact of components’ outageprobabilities on the system’s costs and reliability, optimal combi-nation of the base case system, neglecting components’ outageprobabilities, is calculated. As it can be seen in Tables 5 and 6,comparing to the base case, in this case a smaller system can supplythe load with lower costs and higher reliability. In fact, as a conse-quence of failure probabilities of WGs, PV arrays, and DC/ACconverter, annual cost of the system increases from 242,648 toUS$250,410/yr, which is about 3.2% of system costs. Additionally,components’ outage probability results in an increase aboutUS$73,300 in investment cost of the system that might be consid-erable. Besides, it can be observed that failure probabilities causedeterioration in system’s reliability, i.e. ELF index increases from0.007885021 to 0.00836036.
Also, since in this case all the components are assumed 100%available, both accurate and approximate methods provide sameresults. In fact, at each time step, system can work only in onefeasible state.
6.3. Impact of DC/AC converter on the system’s reliability
To have a better sense of the impact of inverter on the system’sreliability, in this section the optimization problem is subject toreliability constraint of ELF< 0.0001, i.e. reliability constraint in
* This is indeed in accordance with Dr. Billinton’s and Dr. Allan’s prediction offuture energy-based power systems in [19]: ‘‘Although the ‘loss of energy’ approachhas perhaps more physical significance than the ‘loss of load’ approach, it is not asflexible in overall application and has not been used as extensively. It is importantto appreciate, however, that future electric power systems may be energy limitedrather than power or capacity limited and therefore future indices may be energybased rather than focused on power or capacity’’.
developed countries [20]. The program is run and an optimal fitnessvalue of MUS$8.9782/yr is obtained. Actually, this huge fitnessvalue is resulted from the heavy penalty term of fitness functionassigned to reliability inequality constraint. Taking a closer look atthe result reveals that the ELF of the system never can fall below0.0011, i.e. forced outage rate of DC/AC converter. This fact, directlyresults from the vital role of the inverter, as the only single cut-set,in reliability diagram of the hybrid system.
Given Psupply, Ainv, and Aothers are, respectively, probability ofsupplying the load, availability of the inverter, and availability of allother components as well as energy resources, the upper limit ofthe probability of supplying the load will be:
Psupply ¼ Aothers � Ainv0 limAothers/1
�Psupply
�¼ Ainv (35)
Usually, there are two remedies for improving the reliabilitylimit of such a hybrid system. The first, using a more reliable (moreavailable) inverter, and the second, using two or more inverters inparallel. For example, in case of using a 100% available inverter, thesoftware yields Tables 7 and 8.
7. Conclusion
The main goal for designing hybrid wind–solar generatingsystems is reliable supply of the load, under varying weatherconditions, with minimum cost. In this paper, a hybrid WG/PV/FCgenerating system is designed for a 20-year period of operation. Ahydrogen tank is employed as the energy storage system. Optimalcombination of components is achieved by a novel variation ofParticle Swarm Optimization (PSO), which acceptably converges tothe global, or near to the global, optimum combination. The opti-mization problem is subject to reliability constraint. Results indi-cate that costs of the system, directly, depend on its components’reliabilities.
In this paper, the outage probabilities of three major compo-nents of the hybrid system, i.e. wind turbine generator, photovol-taic array and DC/AC converter are taken into consideration.Comprehensive reliability/cost assessment of such a system,considering failures of other components as well as uncertainty inwind speed, solar radiation, and load data, demands computa-tionally intensive and time consuming algorithms like Monte Carlosimulations which is beyond the aspects of this paper and may besubject of future studies.
Versatile software, developed in MATLAB programming envi-ronment, carries out all these huge computations, including yearlysimulation of the system with 1-h time steps, accurate andapproximate evaluations of reliability indices, and optimizationalgorithm. The software is capable of integrating any componentmodel and, therefore, quite flexible to be implemented to anyapplication. It is just needed to input the wind speed, solar radia-tion, and load demand data, as well as specifications of the systemcomponents and run the software.
Results of a case study, based on the empirical data, testify thatcomponent outages can extremely impact system’s reliability andeconomy. For instance, comparing Tables 2 and 5 clearly illustratesthat component failures result in need for a larger generating

A. Kashefi Kaviani et al. / Renewable Energy 34 (2009) 2380–23902390
system to supply the load with the acceptable reliability. Therefore,outages should be carefully considered in designing stage of anyrenewable generating system. Moreover, this study reveals thesignificant impact of DC/AC converter, as the only single cut-set inthe reliability diagram of the hybrid system. It is observed that theinverter’s reliability is an upper limit for the system’s reliability.
Also, an approximate method for reliability evaluation of thehybrid system is proposed which considerably reduces the timeand computations. Since, the accurate method is almost timeconsuming, the approximate method may be useful in roughcalculations like initial design or sensitivity analysis.
Finally, optimal design of grid-connected renewable generatingsystems could be an interesting, and also challenging, subject forfuture studies. It should be noted that, designing stand-alone powersystems is, in some ways, different from public grid renewablesystems. For instance, in grid-connected systems, it may not beeconomically reasonable to employ energy storage systems, becausethe grid can play the role of an energy buffer, which can respond tothe power fluctuations with lower costs either than hydrogen-basedenergy storage systems or than batteries. Additionally, reliability inthese systems is considerably related to the reliability, or in a betterword availability, of the grid rather than the components.
Acknowledgements
The authors wish to thank Mr. Kanan and Dr. Moradi fromRenewable Energy Organization of Iran (SUNA) for providing thesolar radiation data.
References
[1] Mellit A, Kalogirou SA, Hontoria L, Shaari S. Artificial intelligence techniquesfor sizing photovoltaic systems: a review. Renewable Sustainable Energy Rev2008;. doi:10.1016/j.rser.2008.01.006.
[2] Koutroulis E, Kolokotsa D, Potirakis A, Kalaitzakis K. Methodology for optimalsizing of stand-alone photovoltaic/wind-generator systems using geneticalgorithms. Sol Energy 2006;80:1072–88.
[3] Yang H, Zhou W, Lu L, Fang Z. Optimal sizing method for stand-alone hybridsolar–wind system with LPSP technology by using genetic algorithm. SolEnergy 2008;82:354–67.
[4] Kashefi Kaviani A, Riahy GH, Kouhsari SHM. Optimal design of a reliablehydrogen-based stand-alone wind/PV generation system. In: Proceeding of11th international conference on optimization of electrical and electronicequipment (OPTIM’08), Brasov, Romania; May 22–24, 2008.
[5] Ghosh GC, Emonts B, Stolen D. Comparison of hydrogen storage with diesel-generator system in a PV–WEC hybrid system. Sol Energy 2003;75:187–98.
[6] Bak T, Nowotny J, Rekas M, Sorrell CC. Photo-electrochemical hydrogengeneration from water using solar energy: materials-related aspects. Int JHydrogen Energy 2002;27:991–1022.
[7] Kashefi Kaviani A, Baghaee HR, Riahy GH. Design and optimal sizing ofa photovoltaic/wind-generator system using particle swarm optimization. In:Proceedings of the 22nd power system conference (PSC), Tehran, Iran;December 19–21, 2007.
[8] Khan MJ, Iqbal MT. Dynamic modeling and simulation of a small wind-fuel cellhybrid energy system. Renewable Energy 2005;30:421–39.
[9] Khan MJ, Iqbal MT. Pre-feasibility study of stand-alone hybrid energy systemsfor applications in Newfoundland. Renewable Energy 2005;30:835–54.
[10] Mills A, Al-Hallaj S. Simulation of hydrogen-based hybrid systems usinghybrid2. Int J Hydrogen Energy 2004;29:991–9.
[11] Tanrioven M, Alam MS. Reliability modeling and analysis of stand-alone PEMfuel cell power plants. Renewable Energy 2006;31:915–33.
[12] Kellogg WD, Nehrir MH, Venkataraman G, Gerez V. Generation unit sizing andcost analysis for stand alone wind, photovoltaic and hybrid wind/PV systems.IEEE Trans Energy Convers March 1998;13(1):70–5.
[13] Roy S. Optimal planning of wind energy conversion systems over an energyscenario. IEEE Trans Energy Convers September 1997;12(No. 3).
[14] Shahirinia AH, Tafreshi SMM, Gastaj AH, Moghaddomjoo AR. Optimal sizing ofhybrid power system using genetic algorithm. In: International conference onfuture power systems 2005; 16–18 November 2005.
[15] Xu D, Kang L, Chang L, Cao B. Optimal sizing of standalone hybrid wind/PVpower systems using genetic algorithms. In: Canadian conference on electricaland computer engineering, 2005; 1–4 May 2005, p. 1722–1725.
[16] Hakimi SM, Tafreshi SM, Kashefi Kaviani A. Unit sizing of a stand-alone hybridpower system using particle swarm optimization (PSO). In: Proceeding of theinternational conference on automation and logistics, Jinan, China; August 2007.
[17] Billinton R, Allan RN. Reliability evaluation of engineering systems: conceptsand techniques. 2nd ed. New York: Plenum Press; 1992.
[18] Mawardi A, Ptchumani R. Effects of parameter uncertainty on the performancevariability of proton exchange membrane (PEM) fuel cells. J Power Sources2006;160:232–45.
[19] Billinton R, Allan RN. Reliability evaluation of power systems. New York:Plenum Press; 1984.
[20] Garcia RS, Weisser D. A wind–diesel system with hydrogen storage: jointoptimization of design and dispatch. Renewable Energy 2006;31:2296–320.
[21] El-Shatter TF, Eskander MN, El-Hagry MT. Energy flow and management ofa hybrid wind/PV/fuel cell generation system. Energy Convers Manage2006;47:1264–80.
[22] Nelson DB, Nehrir MH, Wang C. Unit sizing and cost analysis of stand-alonehybrid wind/PV/fuel cell power generation system. Renewable Energy2006;31:1641–56.
[23] El-Sharkh MY, Tanrioven M, Rahman A, Alam MS. Cost related sensitivityanalysis for optimal operation of a grid-parallel PEM fuel cell power plant. JPower Sources 2006;161:1198–207.
[24] Strunz K, Brock EK. Stochastic energy source access management: infra-structure-integrative modular plant for sustainable hydrogen-electric co-generation. Int J Hydrogen Energy 2006;31:1129–41.
[25] Bagen, Billinton R. Evaluation of different operating strategies in small stand-alone power systems. IEEE Trans Energy Convers September 2005;20(3):654–60.
[26] Karki R, Billinton R. Reliability/cost implications of PV and wind energyutilization in small isolated power systems. IEEE Trans Energy Convers Dec2001;16(4):368–73.
[27] Nomura S, Ohata Y, Hagita T, Tsutsui H, Tsuji-Iio S, Shimada R. Wind farmslinked by SMES systems. IEEE Trans Appl Supercond 2005:1951–4.
[28] Marchesoni M, Savio S. Reliability analysis of a fuel cell electric city car. In:IEEE 2005 European Conference on Power Electronics and Applications; 11–14September 2005, 10 pp.
[29] Khairil MK, Javanovic S. Reliability modeling of uninterruptible power supplysystems using fault tree analysis method. Eur Trans Electr Power 2007.
[30] Karki R, Billinton R. Cost-effective wind energy utilization for reliable powersupply. IEEE Trans Energy Convers June 2004;19:435–40.
[31] Tina G, Gagliano S, Raiti S. Hybrid solar/wind power system probabilisticmodeling for long-term performance assessment. Sol Energy 2006;80:578–88.
[32] Parasopoulos KE, Vrahatis MN. On the computation of all global minimizersthrough particle swarm optimization. IEEE Trans Evol Comput June2004;8(No. 3).
[33] Eberhart RC, Kennedy J. A new optimizer using particle swarm theory. In:Proceeding of sixth symposium on micro machine and human science,Nagoya, Japan; 1995, p. 34–44.
[34] Kennedy J, Eberhart RC. Particle swarm optimization. In: Proceeding of IEEEInternational Conference on Neural Networks, Perth, Australia, vol. IV; 1995. p.1942–1948.
[35] Jarboui B, Damak N, Siarry P, Rebai A. A combinatorial particle swarm opti-mization for solving multi-mode resource-constrained project schedulingproblems. Appl Math Comput 2008;195:299–308.
[36] Tripathi PK, Bandyopadhyay S, Pal SK. Multi-Objective particle swarm opti-mization with time variant inertia and acceleration coefficients. Inf Sci2007;177:5033–49.
[37] Tan RR. Hybrid evolutionary computation for the development of pollutionprevention and control strategies. J Clean Prod 2007;15:902–6.