Opportunistic Testing Versus Organized Prostate-specific Antigen Screening: Outcome After 18 Years...
7
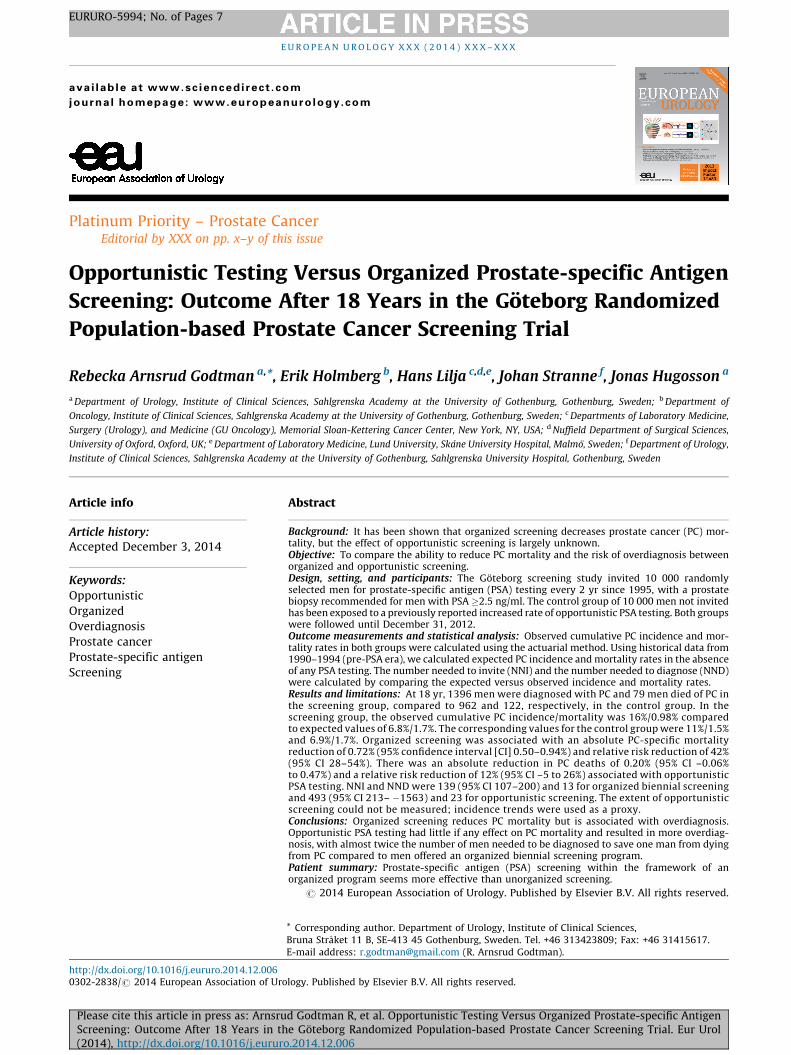
Platinum Priority – Prostate Cancer Editorial by XXX on pp. x–y of this issue Opportunistic Testing Versus Organized Prostate-specific Antigen Screening: Outcome After 18 Years in the Go ¨ teborg Randomized Population-based Prostate Cancer Screening Trial Rebecka Arnsrud Godtman a, *, Erik Holmberg b , Hans Lilja c,d,e , Johan Stranne f , Jonas Hugosson a a Department of Urology, Institute of Clinical Sciences, Sahlgrenska Academy at the University of Gothenburg, Gothenburg, Sweden; b Department of Oncology, Institute of Clinical Sciences, Sahlgrenska Academy at the University of Gothenburg, Gothenburg, Sweden; c Departments of Laboratory Medicine, Surgery (Urology), and Medicine (GU Oncology), Memorial Sloan-Kettering Cancer Center, New York, NY, USA; d Nuffield Department of Surgical Sciences, University of Oxford, Oxford, UK; e Department of Laboratory Medicine, Lund University, Ska ˚ne University Hospital, Malmo ¨, Sweden; f Department of Urology, Institute of Clinical Sciences, Sahlgrenska Academy at the University of Gothenburg, Sahlgrenska University Hospital, Gothenburg, Sweden E U R O P E A N U R O L O G Y X X X ( 2 0 1 4 ) X X X – X X X ava ilable at www.sciencedirect.com journa l homepage: www.europea nurology.com Article info Article history: Accepted December 3, 2014 Keywords: Opportunistic Organized Overdiagnosis Prostate cancer Prostate-specific antigen Screening Abstract Background: It has been shown that organized screening decreases prostate cancer (PC) mor- tality, but the effect of opportunistic screening is largely unknown. Objective: To compare the ability to reduce PC mortality and the risk of overdiagnosis between organized and opportunistic screening. Design, setting, and participants: The Go ¨ teborg screening study invited 10 000 randomly selected men for prostate-specific antigen (PSA) testing every 2 yr since 1995, with a prostate biopsy recommended for men with PSA 2.5 ng/ml. The control group of 10 000 men not invited has been exposed to a previously reported increased rate of opportunistic PSA testing. Both groups were followed until December 31, 2012. Outcome measurements and statistical analysis: Observed cumulative PC incidence and mor- tality rates in both groups were calculated using the actuarial method. Using historical data from 1990–1994 (pre-PSA era), we calculated expected PC incidence and mortality rates in the absence of any PSA testing. The number needed to invite (NNI) and the number needed to diagnose (NND) were calculated by comparing the expected versus observed incidence and mortality rates. Results and limitations: At 18 yr, 1396 men were diagnosed with PC and 79 men died of PC in the screening group, compared to 962 and 122, respectively, in the control group. In the screening group, the observed cumulative PC incidence/mortality was 16%/0.98% compared to expected values of 6.8%/1.7%. The corresponding values for the control group were 11%/1.5% and 6.9%/1.7%. Organized screening was associated with an absolute PC-specific mortality reduction of 0.72% (95% confidence interval [CI] 0.50–0.94%) and relative risk reduction of 42% (95% CI 28–54%). There was an absolute reduction in PC deaths of 0.20% (95% CI –0.06% to 0.47%) and a relative risk reduction of 12% (95% CI –5 to 26%) associated with opportunistic PSA testing. NNI and NND were 139 (95% CI 107–200) and 13 for organized biennial screening and 493 (95% CI 213– 1563) and 23 for opportunistic screening. The extent of opportunistic screening could not be measured; incidence trends were used as a proxy. Conclusions: Organized screening reduces PC mortality but is associated with overdiagnosis. Opportunistic PSA testing had little if any effect on PC mortality and resulted in more overdiag- nosis, with almost twice the number of men needed to be diagnosed to save one man from dying from PC compared to men offered an organized biennial screening program. Patient summary: Prostate-specific antigen (PSA) screening within the framework of an organized program seems more effective than unorganized screening. # 2014 European Association of Urology. Published by Elsevier B.V. All rights reserved. * Corresponding author. Department of Urology, Institute of Clinical Sciences, Bruna Stra ˚ ket 11 B, SE-413 45 Gothenburg, Sweden. Tel. +46 313423809; Fax: +46 31415617. E-mail address: [email protected] (R. Arnsrud Godtman). EURURO-5994; No. of Pages 7 Please cite this article in press as: Arnsrud Godtman R, et al. Opportunistic Testing Versus Organized Prostate-specific Antigen Screening: Outcome After 18 Years in the Go ¨ teborg Randomized Population-based Prostate Cancer Screening Trial. Eur Urol (2014), http://dx.doi.org/10.1016/j.eururo.2014.12.006 http://dx.doi.org/10.1016/j.eururo.2014.12.006 0302-2838/# 2014 European Association of Urology. Published by Elsevier B.V. All rights reserved.
-
Upload
independent -
Category
Documents
-
view
1 -
download
0
Transcript of Opportunistic Testing Versus Organized Prostate-specific Antigen Screening: Outcome After 18 Years...
EURURO-5994; No. of Pages 7
Platinum Priority – Prostate CancerEditorial by XXX on pp. x–y of this issue
Opportunistic Testing Versus Organized Prostate-specific Antigen
Screening: Outcome After 18 Years in the Goteborg Randomized
Population-based Prostate Cancer Screening Trial
Rebecka Arnsrud Godtman a,*, Erik Holmberg b, Hans Lilja c,d,e, Johan Stranne f, Jonas Hugosson a
a Department of Urology, Institute of Clinical Sciences, Sahlgrenska Academy at the University of Gothenburg, Gothenburg, Sweden; b Department of
Oncology, Institute of Clinical Sciences, Sahlgrenska Academy at the University of Gothenburg, Gothenburg, Sweden; c Departments of Laboratory Medicine,
Surgery (Urology), and Medicine (GU Oncology), Memorial Sloan-Kettering Cancer Center, New York, NY, USA; d Nuffield Department of Surgical Sciences,
University of Oxford, Oxford, UK; e Department of Laboratory Medicine, Lund University, Skane University Hospital, Malmo, Sweden; f Department of Urology,
Institute of Clinical Sciences, Sahlgrenska Academy at the University of Gothenburg, Sahlgrenska University Hospital, Gothenburg, Sweden
E U R O P E A N U R O L O G Y X X X ( 2 0 1 4 ) X X X – X X X
ava i lable at www.sc iencedirect .com
journa l homepage: www.europea nurology.com
Article info
Article history:Accepted December 3, 2014
Keywords:
Opportunistic
Organized
Overdiagnosis
Prostate cancer
Prostate-specific antigen
Screening
Abstract
Background: It has been shown that organized screening decreases prostate cancer (PC) mor-tality, but the effect of opportunistic screening is largely unknown.Objective: To compare the ability to reduce PC mortality and the risk of overdiagnosis betweenorganized and opportunistic screening.Design, setting, and participants: The Goteborg screening study invited 10 000 randomlyselected men for prostate-specific antigen (PSA) testing every 2 yr since 1995, with a prostatebiopsy recommended for men with PSA �2.5 ng/ml. The control group of 10 000 men not invitedhas been exposed to a previously reported increased rate of opportunistic PSA testing. Both groupswere followed until December 31, 2012.Outcome measurements and statistical analysis: Observed cumulative PC incidence and mor-tality rates in both groups were calculated using the actuarial method. Using historical data from1990–1994 (pre-PSA era), we calculated expected PC incidence and mortality rates in the absenceof any PSA testing. The number needed to invite (NNI) and the number needed to diagnose (NND)were calculated by comparing the expected versus observed incidence and mortality rates.Results and limitations: At 18 yr, 1396 men were diagnosed with PC and 79 men died of PC inthe screening group, compared to 962 and 122, respectively, in the control group. In thescreening group, the observed cumulative PC incidence/mortality was 16%/0.98% comparedto expected values of 6.8%/1.7%. The corresponding values for the control group were 11%/1.5%and 6.9%/1.7%. Organized screening was associated with an absolute PC-specific mortalityreduction of 0.72% (95% confidence interval [CI] 0.50–0.94%) and relative risk reduction of 42%(95% CI 28–54%). There was an absolute reduction in PC deaths of 0.20% (95% CI –0.06%to 0.47%) and a relative risk reduction of 12% (95% CI –5 to 26%) associated with opportunisticPSA testing. NNI and NND were 139 (95% CI 107–200) and 13 for organized biennial screeningand 493 (95% CI 213– �1563) and 23 for opportunistic screening. The extent of opportunisticscreening could not be measured; incidence trends were used as a proxy.Conclusions: Organized screening reduces PC mortality but is associated with overdiagnosis.Opportunistic PSA testing had little if any effect on PC mortality and resulted in more overdiag-nosis, with almost twice the number of men needed to be diagnosed to save one man from dyingfrom PC compared to men offered an organized biennial screening program.Patient summary: Prostate-specific antigen (PSA) screening within the framework of an
ms
As
organized program see
# 2014 European
* Corresponding author. DeBruna Straket 11 B, SE-413E-mail address: r.godtman@
Please cite this article in press as: Arnsrud Godtman R, et al. OppScreening: Outcome After 18 Years in the Goteborg Randomized(2014), http://dx.doi.org/10.1016/j.eururo.2014.12.006
http://dx.doi.org/10.1016/j.eururo.2014.12.0060302-2838/# 2014 European Association of Urology. Published by Elsevier
more effective than unorganized screening.
sociation of Urology. Published by Elsevier B.V. All rights reserved.
partment of Urology, Institute of Clinical Sciences, 45 Gothenburg, Sweden. Tel. +46 313423809; Fax: +46 31415617.
gmail.com (R. Arnsrud Godtman).
ortunistic Testing Versus Organized Prostate-specific Antigen Population-based Prostate Cancer Screening Trial. Eur Urol
B.V. All rights reserved.
E U R O P E A N U R O L O G Y X X X ( 2 0 1 4 ) X X X – X X X2
EURURO-5994; No. of Pages 7
1. Introduction
It has been shown that screening for prostate cancer (PC)
with prostate-specific antigen (PSA) testing reduces PC-
specific mortality but carries a high risk of overdiagnosis
[1,2]. In the European Randomized Study of Screening for
Prostate Cancer (ERSPC) at 13 yr of follow-up, 781 men
needed to be invited to screening and 27 men needed to be
diagnosed to prevent one PC death [2]. However, no country
has yet introduced a national PSA-based screening program,
so PSA measurements performed on asymptomatic men
with no prior PC diagnosis, aside from those enrolled in
organized screening trials, are taken as part of opportunistic
PSA testing.
Several studies on breast and cervical cancer screening
have indicated that opportunistic screening is less effective
and less cost-effective than an organized approach [3–5]
and the Council of the European Union has recommended
that screening for breast, cervical, and colorectal cancer
should be conducted in organized programs [6]. It is
currently unknown whether opportunistic PSA testing is as
effective as organized PSA screening in reducing PC
mortality, and whether there is a relationship between
organized screening versus opportunistic testing and the
risk of overdiagnosis. Despite the lack of evidence in support
of opportunistic screening, there is high uptake of this form
of PSA testing in many Western countries [7–10]. According
to a recent estimate, >50% of all Swedish men aged 55–69 yr
32 298 men in Göteboon December 31, 1994
20 000 men randomiz control group in a 1:1
50 men excluded before invita�on
28 men with preval ent PC
22 men who had emigrated or deceased
9950 men in the scree ning group, in vited eve ry 2 yr for a PSA test
1396 men diagnosed with PC 79 PC deaths
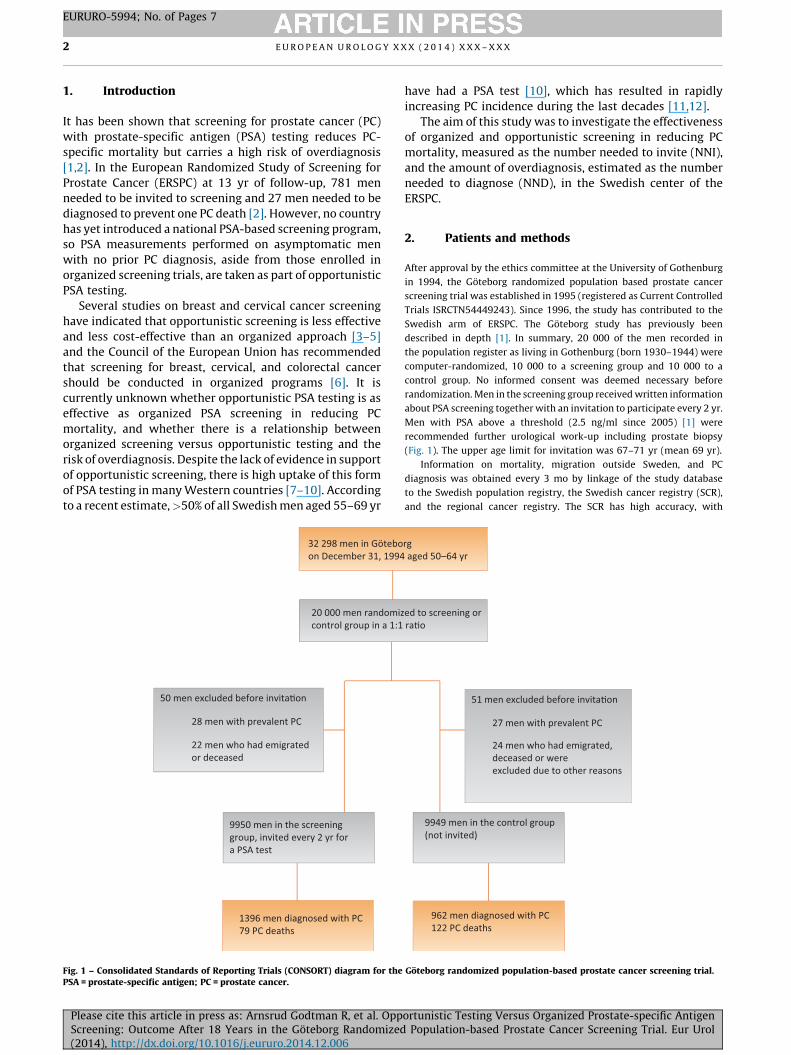
Fig. 1 – Consolidated Standards of Reporting Trials (CONSORT) diagram for thePSA = prostate-specific antigen; PC = prostate cancer.
Please cite this article in press as: Arnsrud Godtman R, et al. OppScreening: Outcome After 18 Years in the Goteborg Randomized(2014), http://dx.doi.org/10.1016/j.eururo.2014.12.006
have had a PSA test [10], which has resulted in rapidly
increasing PC incidence during the last decades [11,12].
The aim of this study was to investigate the effectiveness
of organized and opportunistic screening in reducing PC
mortality, measured as the number needed to invite (NNI),
and the amount of overdiagnosis, estimated as the number
needed to diagnose (NND), in the Swedish center of the
ERSPC.
2. Patients and methods
After approval by the ethics committee at the University of Gothenburg
in 1994, the Goteborg randomized population based prostate cancer
screening trial was established in 1995 (registered as Current Controlled
Trials ISRCTN54449243). Since 1996, the study has contributed to the
Swedish arm of ERSPC. The Goteborg study has previously been
described in depth [1]. In summary, 20 000 of the men recorded in
the population register as living in Gothenburg (born 1930–1944) were
computer-randomized, 10 000 to a screening group and 10 000 to a
control group. No informed consent was deemed necessary before
randomization. Men in the screening group received written information
about PSA screening together with an invitation to participate every 2 yr.
Men with PSA above a threshold (2.5 ng/ml since 2005) [1] were
recommended further urological work-up including prostate biopsy
(Fig. 1). The upper age limit for invitation was 67–71 yr (mean 69 yr).
Information on mortality, migration outside Sweden, and PC
diagnosis was obtained every 3 mo by linkage of the study database
to the Swedish population registry, the Swedish cancer registry (SCR),
and the regional cancer registry. The SCR has high accuracy, with
rg aged 50–64 yr
ed to screening or ra�o
51 men excluded before invita�on
27 men with prevalent PC
24 men who had emigrated, deceased or wereexcluded due to other reasons
9949 men in the control group (not invited)
962 men diagnosed with PC 122 PC deaths
Goteborg randomized population-based prostate cancer screening trial.
ortunistic Testing Versus Organized Prostate-specific Antigen Population-based Prostate Cancer Screening Trial. Eur Urol
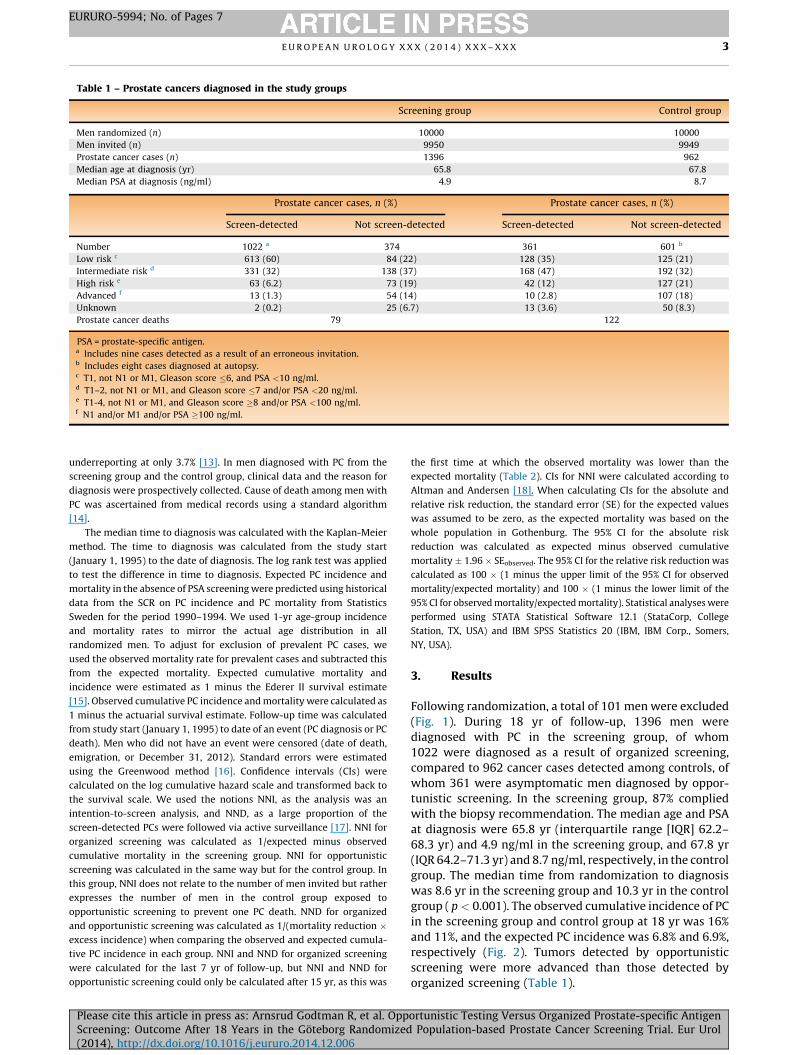
Table 1 – Prostate cancers diagnosed in the study groups
Screening group Control group
Men randomized (n) 10000 10000
Men invited (n) 9950 9949
Prostate cancer cases (n) 1396 962
Median age at diagnosis (yr) 65.8 67.8
Median PSA at diagnosis (ng/ml) 4.9 8.7
Prostate cancer cases, n (%) Prostate cancer cases, n (%)
Screen-detected Not screen-detected Screen-detected Not screen-detected
Number 1022 a 374 361 601 b
Low risk c 613 (60) 84 (22) 128 (35) 125 (21)
Intermediate risk d 331 (32) 138 (37) 168 (47) 192 (32)
High risk e 63 (6.2) 73 (19) 42 (12) 127 (21)
Advanced f 13 (1.3) 54 (14) 10 (2.8) 107 (18)
Unknown 2 (0.2) 25 (6.7) 13 (3.6) 50 (8.3)
Prostate cancer deaths 79 122
PSA = prostate-specific antigen.a Includes nine cases detected as a result of an erroneous invitation.b Includes eight cases diagnosed at autopsy.c T1, not N1 or M1, Gleason score �6, and PSA <10 ng/ml.d T1–2, not N1 or M1, and Gleason score �7 and/or PSA <20 ng/ml.e T1-4, not N1 or M1, and Gleason score �8 and/or PSA <100 ng/ml.f N1 and/or M1 and/or PSA �100 ng/ml.
E U R O P E A N U R O L O G Y X X X ( 2 0 1 4 ) X X X – X X X 3
EURURO-5994; No. of Pages 7
underreporting at only 3.7% [13]. In men diagnosed with PC from the
screening group and the control group, clinical data and the reason for
diagnosis were prospectively collected. Cause of death among men with
PC was ascertained from medical records using a standard algorithm
[14].
The median time to diagnosis was calculated with the Kaplan-Meier
method. The time to diagnosis was calculated from the study start
(January 1, 1995) to the date of diagnosis. The log rank test was applied
to test the difference in time to diagnosis. Expected PC incidence and
mortality in the absence of PSA screening were predicted using historical
data from the SCR on PC incidence and PC mortality from Statistics
Sweden for the period 1990–1994. We used 1-yr age-group incidence
and mortality rates to mirror the actual age distribution in all
randomized men. To adjust for exclusion of prevalent PC cases, we
used the observed mortality rate for prevalent cases and subtracted this
from the expected mortality. Expected cumulative mortality and
incidence were estimated as 1 minus the Ederer II survival estimate
[15]. Observed cumulative PC incidence and mortality were calculated as
1 minus the actuarial survival estimate. Follow-up time was calculated
from study start (January 1, 1995) to date of an event (PC diagnosis or PC
death). Men who did not have an event were censored (date of death,
emigration, or December 31, 2012). Standard errors were estimated
using the Greenwood method [16]. Confidence intervals (CIs) were
calculated on the log cumulative hazard scale and transformed back to
the survival scale. We used the notions NNI, as the analysis was an
intention-to-screen analysis, and NND, as a large proportion of the
screen-detected PCs were followed via active surveillance [17]. NNI for
organized screening was calculated as 1/expected minus observed
cumulative mortality in the screening group. NNI for opportunistic
screening was calculated in the same way but for the control group. In
this group, NNI does not relate to the number of men invited but rather
expresses the number of men in the control group exposed to
opportunistic screening to prevent one PC death. NND for organized
and opportunistic screening was calculated as 1/(mortality reduction �excess incidence) when comparing the observed and expected cumula-
tive PC incidence in each group. NNI and NND for organized screening
were calculated for the last 7 yr of follow-up, but NNI and NND for
opportunistic screening could only be calculated after 15 yr, as this was
Please cite this article in press as: Arnsrud Godtman R, et al. OppScreening: Outcome After 18 Years in the Goteborg Randomized(2014), http://dx.doi.org/10.1016/j.eururo.2014.12.006
the first time at which the observed mortality was lower than the
expected mortality (Table 2). CIs for NNI were calculated according to
Altman and Andersen [18]. When calculating CIs for the absolute and
relative risk reduction, the standard error (SE) for the expected values
was assumed to be zero, as the expected mortality was based on the
whole population in Gothenburg. The 95% CI for the absolute risk
reduction was calculated as expected minus observed cumulative
mortality � 1.96 � SEobserved. The 95% CI for the relative risk reduction was
calculated as 100 � (1 minus the upper limit of the 95% CI for observed
mortality/expected mortality) and 100 � (1 minus the lower limit of the
95% CI for observed mortality/expected mortality). Statistical analyses were
performed using STATA Statistical Software 12.1 (StataCorp, College
Station, TX, USA) and IBM SPSS Statistics 20 (IBM, IBM Corp., Somers,
NY, USA).
3. Results
Following randomization, a total of 101 men were excluded
(Fig. 1). During 18 yr of follow-up, 1396 men were
diagnosed with PC in the screening group, of whom
1022 were diagnosed as a result of organized screening,
compared to 962 cancer cases detected among controls, of
whom 361 were asymptomatic men diagnosed by oppor-
tunistic screening. In the screening group, 87% complied
with the biopsy recommendation. The median age and PSA
at diagnosis were 65.8 yr (interquartile range [IQR] 62.2–
68.3 yr) and 4.9 ng/ml in the screening group, and 67.8 yr
(IQR 64.2–71.3 yr) and 8.7 ng/ml, respectively, in the control
group. The median time from randomization to diagnosis
was 8.6 yr in the screening group and 10.3 yr in the control
group ( p < 0.001). The observed cumulative incidence of PC
in the screening group and control group at 18 yr was 16%
and 11%, and the expected PC incidence was 6.8% and 6.9%,
respectively (Fig. 2). Tumors detected by opportunistic
screening were more advanced than those detected by
organized screening (Table 1).
ortunistic Testing Versus Organized Prostate-specific Antigen Population-based Prostate Cancer Screening Trial. Eur Urol
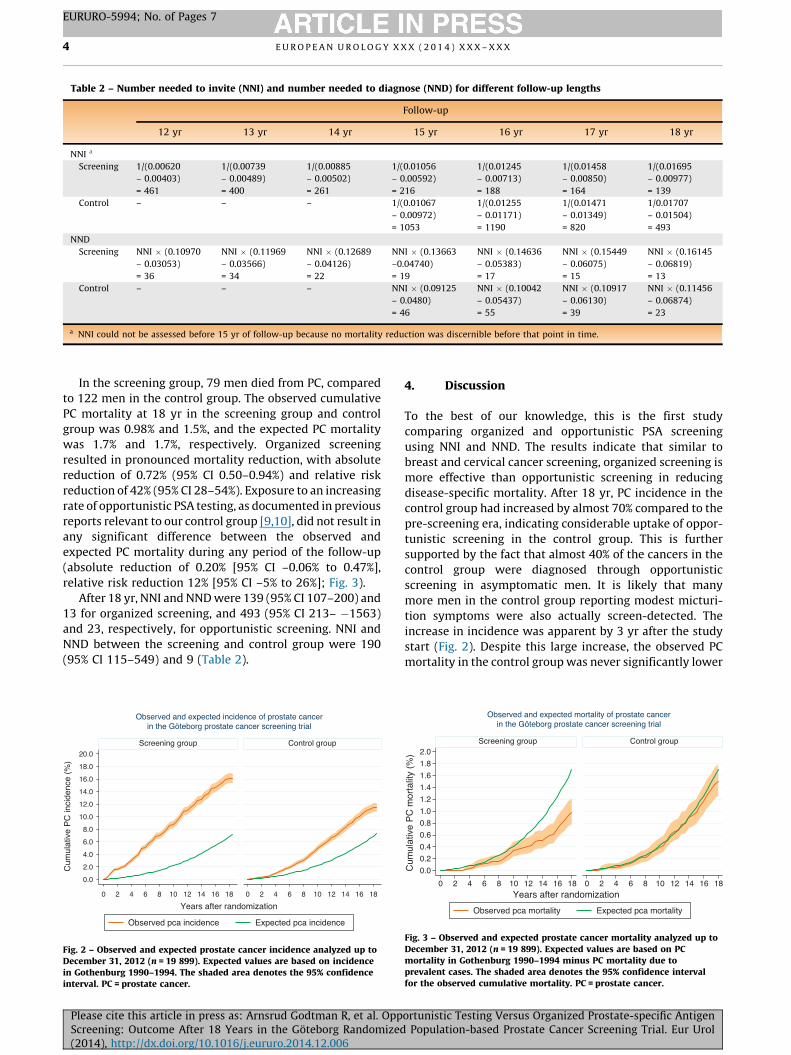
Table 2 – Number needed to invite (NNI) and number needed to diagnose (NND) for different follow-up lengths
Follow-up
12 yr 13 yr 14 yr 15 yr 16 yr 17 yr 18 yr
NNI a
Screening 1/(0.00620
– 0.00403)
= 461
1/(0.00739
– 0.00489)
= 400
1/(0.00885
– 0.00502)
= 261
1/(0.01056
– 0.00592)
= 216
1/(0.01245
– 0.00713)
= 188
1/(0.01458
– 0.00850)
= 164
1/(0.01695
– 0.00977)
= 139
Control – – – 1/(0.01067
– 0.00972)
= 1053
1/(0.01255
– 0.01171)
= 1190
1/(0.01471
– 0.01349)
= 820
1/0.01707
– 0.01504)
= 493
NND
Screening NNI � (0.10970
– 0.03053)
= 36
NNI � (0.11969
– 0.03566)
= 34
NNI � (0.12689
– 0.04126)
= 22
NNI � (0.13663
–0.04740)
= 19
NNI � (0.14636
– 0.05383)
= 17
NNI � (0.15449
– 0.06075)
= 15
NNI � (0.16145
– 0.06819)
= 13
Control – – – NNI � (0.09125
– 0.0480)
= 46
NNI � (0.10042
– 0.05437)
= 55
NNI � (0.10917
– 0.06130)
= 39
NNI � (0.11456
– 0.06874)
= 23
a NNI could not be assessed before 15 yr of follow-up because no mortality reduction was discernible before that point in time.
E U R O P E A N U R O L O G Y X X X ( 2 0 1 4 ) X X X – X X X4
EURURO-5994; No. of Pages 7
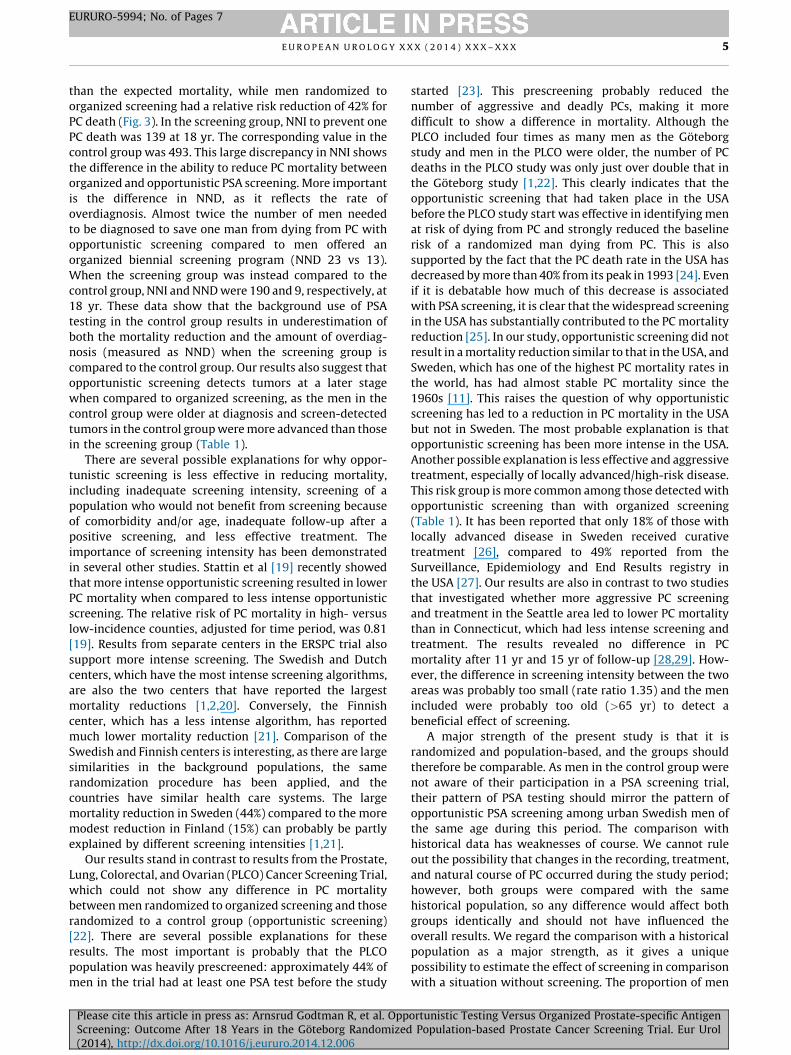
In the screening group, 79 men died from PC, compared
to 122 men in the control group. The observed cumulative
PC mortality at 18 yr in the screening group and control
group was 0.98% and 1.5%, and the expected PC mortality
was 1.7% and 1.7%, respectively. Organized screening
resulted in pronounced mortality reduction, with absolute
reduction of 0.72% (95% CI 0.50–0.94%) and relative risk
reduction of 42% (95% CI 28–54%). Exposure to an increasing
rate of opportunistic PSA testing, as documented in previous
reports relevant to our control group [9,10], did not result in
any significant difference between the observed and
expected PC mortality during any period of the follow-up
(absolute reduction of 0.20% [95% CI –0.06% to 0.47%],
relative risk reduction 12% [95% CI –5% to 26%]; Fig. 3).
After 18 yr, NNI and NND were 139 (95% CI 107–200) and
13 for organized screening, and 493 (95% CI 213– �1563)
and 23, respectively, for opportunistic screening. NNI and
NND between the screening and control group were 190
(95% CI 115–549) and 9 (Table 2).
0.0
2.0
4.0
6.0
8.0
10.0
12.0
14.0
16.0
18.0
20.0
0 2 4 6 8 10 12 14 16 18 0 2 4 6 8 10 12 14 16 18
Screening group Control group
Observed pca incidence Expected pca incidence
Cum
ulat
ive
PC
inci
denc
e (%
)
Years after randomization
Observed and expected incidence of prostate cancerin the Göteborg prostate cancer screening trial
Fig. 2 – Observed and expected prostate cancer incidence analyzed up toDecember 31, 2012 (n = 19 899). Expected values are based on incidencein Gothenburg 1990–1994. The shaded area denotes the 95% confidenceinterval. PC = prostate cancer.
Please cite this article in press as: Arnsrud Godtman R, et al. OppScreening: Outcome After 18 Years in the Goteborg Randomized(2014), http://dx.doi.org/10.1016/j.eururo.2014.12.006
4. Discussion
To the best of our knowledge, this is the first study
comparing organized and opportunistic PSA screening
using NNI and NND. The results indicate that similar to
breast and cervical cancer screening, organized screening is
more effective than opportunistic screening in reducing
disease-specific mortality. After 18 yr, PC incidence in the
control group had increased by almost 70% compared to the
pre-screening era, indicating considerable uptake of oppor-
tunistic screening in the control group. This is further
supported by the fact that almost 40% of the cancers in the
control group were diagnosed through opportunistic
screening in asymptomatic men. It is likely that many
more men in the control group reporting modest micturi-
tion symptoms were also actually screen-detected. The
increase in incidence was apparent by 3 yr after the study
start (Fig. 2). Despite this large increase, the observed PC
mortality in the control group was never significantly lower
0.0
0.2
0.4
0.6
0.8
1.0
1.2
1.4
1.6
1.8
2.0
0 2 4 6 8 10 12 14 16 18 0 2 4 6 8 10 12 14 16 18
Screening group Control group
Observed pca mortality Expected pca mortality
Cum
ulat
ive
PC
mor
talit
y (%
)
Years after randomization
Observed and expected mortality of prostate cancerin the Göteborg prostate cancer screening trial
Fig. 3 – Observed and expected prostate cancer mortality analyzed up toDecember 31, 2012 (n = 19 899). Expected values are based on PCmortality in Gothenburg 1990–1994 minus PC mortality due toprevalent cases. The shaded area denotes the 95% confidence intervalfor the observed cumulative mortality. PC = prostate cancer.
ortunistic Testing Versus Organized Prostate-specific Antigen Population-based Prostate Cancer Screening Trial. Eur Urol
E U R O P E A N U R O L O G Y X X X ( 2 0 1 4 ) X X X – X X X 5
EURURO-5994; No. of Pages 7
than the expected mortality, while men randomized to
organized screening had a relative risk reduction of 42% for
PC death (Fig. 3). In the screening group, NNI to prevent one
PC death was 139 at 18 yr. The corresponding value in the
control group was 493. This large discrepancy in NNI shows
the difference in the ability to reduce PC mortality between
organized and opportunistic PSA screening. More important
is the difference in NND, as it reflects the rate of
overdiagnosis. Almost twice the number of men needed
to be diagnosed to save one man from dying from PC with
opportunistic screening compared to men offered an
organized biennial screening program (NND 23 vs 13).
When the screening group was instead compared to the
control group, NNI and NND were 190 and 9, respectively, at
18 yr. These data show that the background use of PSA
testing in the control group results in underestimation of
both the mortality reduction and the amount of overdiag-
nosis (measured as NND) when the screening group is
compared to the control group. Our results also suggest that
opportunistic screening detects tumors at a later stage
when compared to organized screening, as the men in the
control group were older at diagnosis and screen-detected
tumors in the control group were more advanced than those
in the screening group (Table 1).
There are several possible explanations for why oppor-
tunistic screening is less effective in reducing mortality,
including inadequate screening intensity, screening of a
population who would not benefit from screening because
of comorbidity and/or age, inadequate follow-up after a
positive screening, and less effective treatment. The
importance of screening intensity has been demonstrated
in several other studies. Stattin et al [19] recently showed
that more intense opportunistic screening resulted in lower
PC mortality when compared to less intense opportunistic
screening. The relative risk of PC mortality in high- versus
low-incidence counties, adjusted for time period, was 0.81
[19]. Results from separate centers in the ERSPC trial also
support more intense screening. The Swedish and Dutch
centers, which have the most intense screening algorithms,
are also the two centers that have reported the largest
mortality reductions [1,2,20]. Conversely, the Finnish
center, which has a less intense algorithm, has reported
much lower mortality reduction [21]. Comparison of the
Swedish and Finnish centers is interesting, as there are large
similarities in the background populations, the same
randomization procedure has been applied, and the
countries have similar health care systems. The large
mortality reduction in Sweden (44%) compared to the more
modest reduction in Finland (15%) can probably be partly
explained by different screening intensities [1,21].
Our results stand in contrast to results from the Prostate,
Lung, Colorectal, and Ovarian (PLCO) Cancer Screening Trial,
which could not show any difference in PC mortality
between men randomized to organized screening and those
randomized to a control group (opportunistic screening)
[22]. There are several possible explanations for these
results. The most important is probably that the PLCO
population was heavily prescreened: approximately 44% of
men in the trial had at least one PSA test before the study
Please cite this article in press as: Arnsrud Godtman R, et al. OppScreening: Outcome After 18 Years in the Goteborg Randomized(2014), http://dx.doi.org/10.1016/j.eururo.2014.12.006
started [23]. This prescreening probably reduced the
number of aggressive and deadly PCs, making it more
difficult to show a difference in mortality. Although the
PLCO included four times as many men as the Goteborg
study and men in the PLCO were older, the number of PC
deaths in the PLCO study was only just over double that in
the Goteborg study [1,22]. This clearly indicates that the
opportunistic screening that had taken place in the USA
before the PLCO study start was effective in identifying men
at risk of dying from PC and strongly reduced the baseline
risk of a randomized man dying from PC. This is also
supported by the fact that the PC death rate in the USA has
decreased by more than 40% from its peak in 1993 [24]. Even
if it is debatable how much of this decrease is associated
with PSA screening, it is clear that the widespread screening
in the USA has substantially contributed to the PC mortality
reduction [25]. In our study, opportunistic screening did not
result in a mortality reduction similar to that in the USA, and
Sweden, which has one of the highest PC mortality rates in
the world, has had almost stable PC mortality since the
1960s [11]. This raises the question of why opportunistic
screening has led to a reduction in PC mortality in the USA
but not in Sweden. The most probable explanation is that
opportunistic screening has been more intense in the USA.
Another possible explanation is less effective and aggressive
treatment, especially of locally advanced/high-risk disease.
This risk group is more common among those detected with
opportunistic screening than with organized screening
(Table 1). It has been reported that only 18% of those with
locally advanced disease in Sweden received curative
treatment [26], compared to 49% reported from the
Surveillance, Epidemiology and End Results registry in
the USA [27]. Our results are also in contrast to two studies
that investigated whether more aggressive PC screening
and treatment in the Seattle area led to lower PC mortality
than in Connecticut, which had less intense screening and
treatment. The results revealed no difference in PC
mortality after 11 yr and 15 yr of follow-up [28,29]. How-
ever, the difference in screening intensity between the two
areas was probably too small (rate ratio 1.35) and the men
included were probably too old (>65 yr) to detect a
beneficial effect of screening.
A major strength of the present study is that it is
randomized and population-based, and the groups should
therefore be comparable. As men in the control group were
not aware of their participation in a PSA screening trial,
their pattern of PSA testing should mirror the pattern of
opportunistic PSA screening among urban Swedish men of
the same age during this period. The comparison with
historical data has weaknesses of course. We cannot rule
out the possibility that changes in the recording, treatment,
and natural course of PC occurred during the study period;
however, both groups were compared with the same
historical population, so any difference would affect both
groups identically and should not have influenced the
overall results. We regard the comparison with a historical
population as a major strength, as it gives a unique
possibility to estimate the effect of screening in comparison
with a situation without screening. The proportion of men
ortunistic Testing Versus Organized Prostate-specific Antigen Population-based Prostate Cancer Screening Trial. Eur Urol
E U R O P E A N U R O L O G Y X X X ( 2 0 1 4 ) X X X – X X X6
EURURO-5994; No. of Pages 7
who had taken a PSA test before the study start has been
estimated at only 3% [1], and the increase in PC incidence,
indicating a rise in PSA screening in Sweden, started around
1997. The main limitation of the study is that we were
unable to directly measure the extent and pattern of
opportunistic screening and prostate biopsies in our control
group and instead used incidence trends. Incidence trends
have been used in other studies to estimate screening
intensity [10,19]. One of these studies reported that the
cumulative uptake of opportunistic PSA screening in Sweden
for men aged 55–69 yr increased from zero in 1997 to 56% in
2007 [10]. In the Swedish national prostate cancer register,
46% of all PCs in 2012 were diagnosed in asymptomatic men
at health check-ups, indicating that opportunistic screening
is common in Sweden [30]. In our study, compliance with
biopsy recommendation following a positive screening test
was high (87%) in the screening group. The corresponding
value for opportunistic screening in the control group is
unknown, but is likely to be much lower. In the Dutch center
of the ERSPC, only 7–8% of those with PSA �3.0 ng/ml in the
control arm underwent biopsy within 6 mo [31]. It could be
argued that the results regarding opportunistic screening are
only applicable to opportunistic screening performed in a
comparable way to that for our control group. However, the
incidence and mortality trends seen in Sweden are not
unique and resemble those seen in several other European
countries, such as Finland, Germany, and the Netherlands,
indicating that our results can be generalized [11]. There is no
universally agreed method for estimating overdiagnosis. In
the present paper, we used NND as an estimate. If
overdiagnosis had instead been estimated as the excess
incidence after introducing screening, it would have
appeared as if opportunistic screening were associated with
less overdiagnosis than organized screening. If reducing
overdiagnosis were only about minimizing the numbers of
men being diagnosed with PC, opportunistic screening would
seem to be a reasonable alternative. However, we believe that
it is important to relate excess incidence to the beneficial
effects of screening, and while organized screening effective-
ly reduced PC mortality, opportunistic screening had no or
only a very limited effect on PC mortality during 18 yr of
follow-up. Therefore, when excess incidence was related to
the mortality reduction and overdiagnosis estimated as NND,
opportunistic screening resulted in more overdiagnosis than
organized screening (NND 23 vs 13). Concerns have also been
raised about whether the difference in mortality between the
study arms could be attributable to different treatments
policies in the two arms. However, the absolute majority of
men in both arms of the Goteborg study were treated in the
same university hospital. Thus, even if such an effect cannot
be completely ruled out, it should have only a minor impact
on the outcome [1].
5. Conclusions
Our results indicate that organized intense screening
effectively reduces PC mortality but is associated with
considerable overdiagnosis; after 18 yr of follow-up, 13 men
must be diagnosed to prevent one PC death compared to a
Please cite this article in press as: Arnsrud Godtman R, et al. OppScreening: Outcome After 18 Years in the Goteborg Randomized(2014), http://dx.doi.org/10.1016/j.eururo.2014.12.006
situation with no PSA testing. Opportunistic PSA testing had
little if any effect on PC mortality, and was associated with
greater overdiagnosis in comparison to organized screen-
ing, as estimated by NND. If, after careful counseling, a man
chooses to participate in PSA screening, this should be in an
organized program at relevant intervals combined with
adequate follow-up. Our data suggest that opportunistic
PSA testing causes considerable harm and leads to little if
any benefit.
Author contributions: Rebecka Arnsrud Godtman had full access to all
the data in the study and takes responsibility for the integrity of the data
and the accuracy of the data analysis.
Study concept and design: Arnsrud Godtman, Stranne, Hugosson.
Acquisition of data: Arnsrud Godtman, Holmberg, Hugosson.
Analysis and interpretation of data: Arnsrud Godtman, Holmberg, Lilja,
Stranne, Hugosson.
Drafting of the manuscript: Arnsrud Godtman, Stranne, Hugosson.
Critical revision of the manuscript for important intellectual content:
Arnsrud Godtman, Holmberg, Lilja, Stranne, Hugosson.
Statistical analysis: Arnsrud Godtman, Holmberg.
Obtaining funding: Arnsrud Godtman, Lilja, Hugosson.
Administrative, technical, or material support: None.
Supervision: Hugosson.
Other (specify): None.
Financial disclosures: Rebecka Arnsrud Godtman certifies that all
conflicts of interest, including specific financial interests and hips and
affiliations relevant to the subject matter or materials discussed in the
manuscript (eg, employment/affiliation, grants or funding, consultan-
cies, honoraria, stock ownership or options, expert testimony, royalties,
or patents filed, received, or pending), are the following: Jonas Hugosson
has received lecture fees from GlaxoSmithKline and Abbot. Johan
Stranne has received lecture fees from Astellas and Abbot. Hand Lilja
holds patents for free PSA, hK2, and intact PSA assays and is named on a
patent application for a statistical method to detect prostate cancer. All
the other authors have no conflicts of interest.
Funding/Support and role of the sponsor: This work was supported by the
Swedish Cancer Society (contract numbers 11 0598 and 11 0624); the
Marta and Gustaf Agren Research Foundation; the Percy Falk Foundation
for Prostate and Breast Cancer Research; the National Cancer Institute
(R01CA160816 and P50-CA92629); the Sidney Kimmel Center for
Prostate and Urologic Cancers; David H. Koch through the Prostate
Cancer Foundation; the National Institute for Health Research (NIHR)
Oxford Biomedical Research Centre Program; and Foundation Federico
SA. The funding sources had no part in the study design, collection,
analysis, or interpretation of the data, the writing of the report, or the
decision to submit.
Acknowledgments: We thank Helen Ahlgren, data manager and study
secretary, and Maria Nyberg, study nurse, for their excellent contribu-
tions to data collection.
References
[1] Hugosson J, Carlsson S, Aus G, et al. Mortality results from the
Goteborg randomised population-based prostate-cancer screening
trial. Lancet Oncol 2010;11:725–32.
[2] Schroder FH, Hugosson J, Roobol MJ, et al. Screening and prostate
cancer mortality: results of the European Randomised Study of
Screening for Prostate Cancer (ERSPC) at 13 years of follow-up.
Lancet 2014;384:2027–35.
ortunistic Testing Versus Organized Prostate-specific Antigen Population-based Prostate Cancer Screening Trial. Eur Urol
E U R O P E A N U R O L O G Y X X X ( 2 0 1 4 ) X X X – X X X 7
EURURO-5994; No. of Pages 7
[3] Nieminen P, Kallio M, Anttila A, Hakama M. Organised vs. sponta-
neous Pap-smear screening for cervical cancer: a case-control
study. Int J Cancer 1999;83:55–8.
[4] Bihrmann K, Jensen A, Olsen AH, et al. Performance of systematic
and non-systematic (‘opportunistic’) screening mammography: a
comparative study from Denmark. J Med Screen 2008;15:23–6.
[5] de Gelder R, Bulliard JL, de Wolf C, et al. Cost-effectiveness of
opportunistic versus organised mammography screening in
Switzerland. Eur J Cancer 2009;45:127–38.
[6] Council of the European Union. Council recommendation of
2 December 2003 on cancer screening. Off J Eur Union
2003;L327:34–8.
[7] D’Ambrosio GG, Campo S, Cancian M, Pecchioli S, Mazzaglia G.
Opportunistic prostate-specific antigen screening in Italy: 6 years
of monitoring from the Italian general practice database. Eur J
Cancer Prev 2010;19:413–6.
[8] Andriole GL, Crawford ED, Grubb III RL, et al. Mortality results from
a randomized prostate-cancer screening trial. N Engl J Med
2009;360:1310–9.
[9] Nordstrom T, Aly M, Clements MS, Weibull CE, Adolfsson J, Gron-
berg H. Prostate-specific antigen (PSA) testing is prevalent and
increasing in Stockholm County, Sweden, despite no recommenda-
tions for PSA screening: results from a population-based study,
2003-2011. Eur Urol 2013;63:419–25.
[10] Jonsson H, Holmstrom B, Duffy SW, Stattin P. Uptake of prostate-
specific antigen testing for early prostate cancer detection in
Sweden. Int J Cancer 2011;129:1881–8.
[11] Bray F, Lortet-Tieulent J, Ferlay J, Forman D, Auvinen A. Prostate
cancer incidence and mortality trends in 37 European countries: an
overview. Eur J Cancer 2010;46:3040–52.
[12] Center MM, Jemal A, Lortet-Tieulent J, et al. International variation
in prostate cancer incidence and mortality rates. Eur Urol
2012;61:1079–92.
[13] Barlow L, Westergren K, Holmberg L, Talback M. The completeness
of the Swedish Cancer Register: a sample survey for year 1998. Acta
Oncol 2009;48:27–33.
[14] Godtman R, Holmberg E, Stranne J, Hugosson J. High accuracy of
Swedish death certificates in men participating in screening for
prostate cancer: a comparative study of official death certificates
with a cause of death committee using a standardized algorithm.
Scand J Urol Nephrol 2011;45:226–32.
[15] Ederer F, Axtell LM, Cutler SJ. The relative survival rate: a statistical
methodology. Natl Cancer Inst Monogr 1961;6:101–21.
[16] Greenwood M. The errors of sampling of the survivorship table
Reports on public health and medical subjects, Vol. 33. London: HM
Stationery Office; 1926.
[17] Godtman RA, Holmberg E, Khatami A, Stranne J, Hugosson J. Out-
come following active surveillance of men with screen-detected
Please cite this article in press as: Arnsrud Godtman R, et al. OppScreening: Outcome After 18 Years in the Goteborg Randomized(2014), http://dx.doi.org/10.1016/j.eururo.2014.12.006
prostate cancer. Results from the Goteborg randomised popula-
tion-based prostate cancer screening trial. Eur Urol 2013;63:101–7.
[18] Altman DG, Andersen PK. Calculating the number needed to treat
for trials where the outcome is time to an event. BMJ
1999;319:1492–5.
[19] Stattin P, Carlsson S, Holmstrom B, et al. Prostate cancer mortality
in areas with high and low prostate cancer incidence. J Natl Cancer
Inst 2014;106, dju007.
[20] Roobol MJ, Kranse R, Bangma CH, et al. Screening for prostate cancer:
results of the Rotterdam section of the European randomized study of
screening for prostate cancer. Eur Urol 2013;64: 530–9.
[21] Kilpelainen TP, Tammela TL, Malila N, et al. Prostate cancer mor-
tality in the Finnish randomized screening trial. J Natl Cancer Inst
2013;105:719–25.
[22] Andriole GL, Crawford ED, Grubb III RL, et al. Prostate cancer
screening in the randomized Prostate, Lung, Colorectal, and Ovarian
Cancer Screening Trial: mortality results after 13 years of follow-
up. J Natl Cancer Inst 2012;104:125–32.
[23] Grubb III RL, Pinsky PF, Greenlee RT, et al. Prostate cancer screening
in the Prostate, Lung, Colorectal and Ovarian cancer screening trial:
update on findings from the initial four rounds of screening in a
randomized trial. BJU Int 2008;102:1524–30.
[24] Siegel R, Naishadham D, Jemal A. Cancer statistics, 2013. CA Cancer J
Clin 2013;63:11–30.
[25] Etzioni R, Tsodikov A, Mariotto A, et al. Quantifying the role of PSA
screening in the US prostate cancer mortality decline. Cancer
Causes Control 2008;19:175–81.
[26] Akre O, Garmo H, Adolfsson J, Lambe M, Bratt O, Stattin P. Mortality
among men with locally advanced prostate cancer managed with
noncurative intent: a nationwide study in PCBaSe Sweden. Eur Urol
2011;60:554–63.
[27] Lowrance WT, Elkin EB, Yee DS, et al. Locally advanced prostate
cancer: a population-based study of treatment patterns. BJU Int
2012;109:1309–14.
[28] Lu-Yao G, Albertsen PC, Stanford JL, Stukel TA, Walker-Corkery ES,
Barry MJ. Natural experiment examining impact of aggressive
screening and treatment on prostate cancer mortality in two fixed
cohorts from Seattle area and Connecticut. BMJ 2002;325:740.
[29] Lu-Yao G, Albertsen PC, Stanford JL, Stukel TA, Walker-Corkery E,
Barry MJ. Screening, treatment, and prostate cancer mortality in the
Seattle area and Connecticut: fifteen-year follow-up. J Gen Intern
Med 2008;23:1809–14.
[30] Swedish National Prostate Cancer Register. Annual report 2012 (in
Swedish). http://npcr.se/wp-content/uploads/2013/04/20131121-
NPCR-Rapport-2012.pdf.
[31] Otto SJ, van der Cruijsen IW, Liem MK, et al. Effective PSA contami-
nation in the Rotterdam section of the European Randomized Study
of Screening for Prostate Cancer. Int J Cancer 2003;105:394–9.
ortunistic Testing Versus Organized Prostate-specific Antigen Population-based Prostate Cancer Screening Trial. Eur Urol