Online consumer behavior: Comparing Canadian and Chinese website visitors
29
1 Online Consumer Behavior: A Comparison between Canadian and Chinese Website Visitors Ebrahim Mazaheri, Department of Marketing, John Molson School of Business, Concordia University, 1455 de Maisonneuve West, Montréal, Québec, H3G 1M8 Canada Tel: 1-514 733-3704 Email: [email protected] Marie-Odile Richard, École des Hautes Études Commerciales, 3000, chemin de la Côte-Sainte-Catherine, Montréal, Québec, H3T 2A7 Canada Tel: 1-514 738-3520 Email: [email protected] Michel Laroche, Royal Bank Distinguished Professor, Department of Marketing, John Molson School of Business, Concordia University, 1455 de Maisonneuve West, Montréal, Québec, H3G 1M8 Canada Tel: 1-514 848-2424 ext. 2942 Fax: 1-514 848-4576 Email: [email protected] Received: May 2009 Accepted: July 2010 Acknowledgements: The authors gratefully acknowledge the financial support of the Social Sciences and Humanities Research Council of Canada.
-
Upload
independent -
Category
Documents
-
view
0 -
download
0
Transcript of Online consumer behavior: Comparing Canadian and Chinese website visitors
1
Online Consumer Behavior:
A Comparison between Canadian and Chinese Website Visitors
Ebrahim Mazaheri, Department of Marketing, John Molson School of Business, Concordia
University, 1455 de Maisonneuve West, Montréal, Québec, H3G 1M8 Canada
Tel: 1-514 733-3704
Email: [email protected]
Marie-Odile Richard, École des Hautes Études Commerciales,
3000, chemin de la Côte-Sainte-Catherine, Montréal, Québec, H3T 2A7 Canada
Tel: 1-514 738-3520
Email: [email protected]
Michel Laroche, Royal Bank Distinguished Professor, Department of Marketing,
John Molson School of Business, Concordia University, 1455 de Maisonneuve West, Montréal,
Québec, H3G 1M8 Canada
Tel: 1-514 848-2424 ext. 2942
Fax: 1-514 848-4576
Email: [email protected]
Received: May 2009
Accepted: July 2010
Acknowledgements: The authors gratefully acknowledge the financial support of the Social
Sciences and Humanities Research Council of Canada.
2
Online Consumer Behavior:
A Comparison between Canadian and Chinese Website Visitors
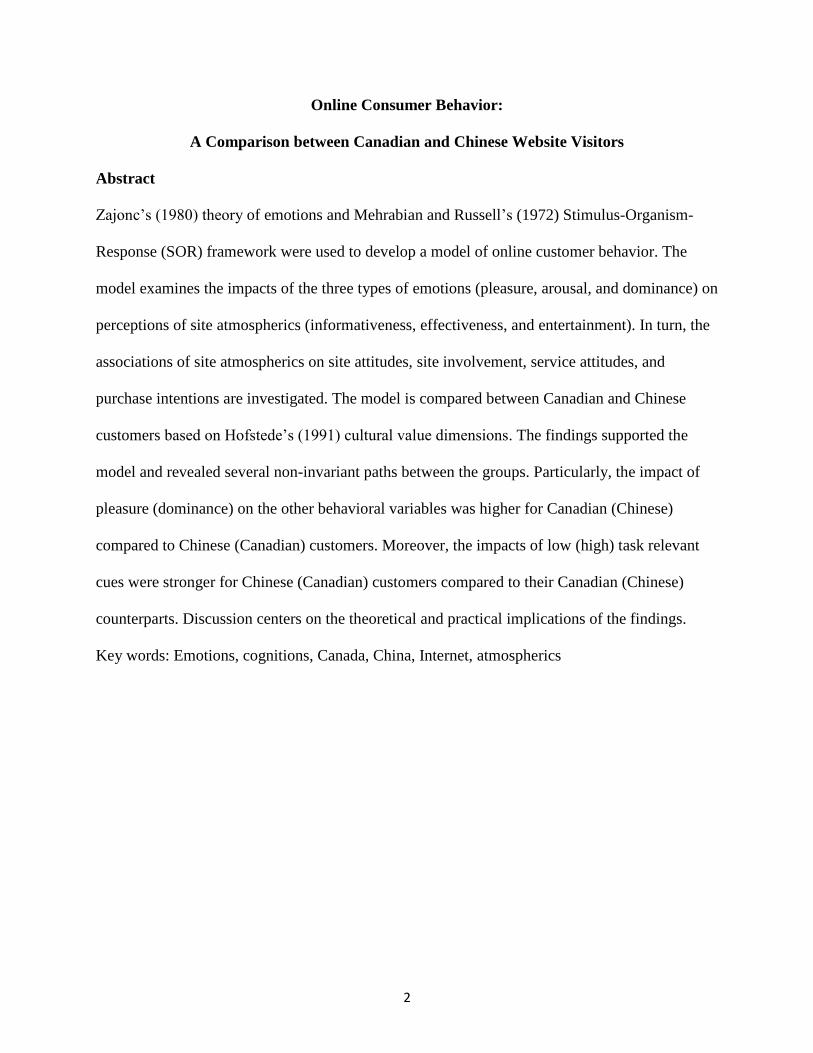
Abstract
Zajonc’s (1980) theory of emotions and Mehrabian and Russell’s (1972) Stimulus-Organism-
Response (SOR) framework were used to develop a model of online customer behavior. The
model examines the impacts of the three types of emotions (pleasure, arousal, and dominance) on
perceptions of site atmospherics (informativeness, effectiveness, and entertainment). In turn, the
associations of site atmospherics on site attitudes, site involvement, service attitudes, and
purchase intentions are investigated. The model is compared between Canadian and Chinese
customers based on Hofstede’s (1991) cultural value dimensions. The findings supported the
model and revealed several non-invariant paths between the groups. Particularly, the impact of
pleasure (dominance) on the other behavioral variables was higher for Canadian (Chinese)
compared to Chinese (Canadian) customers. Moreover, the impacts of low (high) task relevant
cues were stronger for Chinese (Canadian) customers compared to their Canadian (Chinese)
counterparts. Discussion centers on the theoretical and practical implications of the findings.
Key words: Emotions, cognitions, Canada, China, Internet, atmospherics
3
1. Introduction
Many experts elaborated on how the Internet has changed the buying environment
(Varadarajan and Yadav, 2002). The most important change is the greater availability of
information. Thanks to the Internet, customers are able to collect information on choice
alternatives, prices, details, and features of products like never before. Given that one’s purchase
decision is based on information obtained in the pre-purchase stage, it is very important for
marketers to investigate information search behavior (Bhatnagar and Ghose, 2004). Customers
surf a website if they perceive it as informative, useful and entertaining. Therefore, the most
important challenge for website designers is how to develop sites that customers perceive as
“informative” and “entertaining”.
Psychologists suggested that emotions are associated with customers’ information-
processing strategies. Forgas (1998) found that positive affect induced less systematic attention
to stimulus information and greater reliance on top-down inferences. On the other hand, negative
affect led customers to be more careful and systematic in processing information (Clore, Shwarz,
and Conway, 1994; Shwarz, 1990). Therefore, it is vital to investigate the impacts of emotions
on perceptions of site characteristics.
Consistent with the Mehrabian and Russell (1972) Stimulus-Organism-Response
framework (SOR)-used by Eroglu, Machleit, and Davis (2001) in online marketing-past studies
showed that website interfaces such as site background music, color, and text font impact
emotions (Davis, Wang, and Lindridge, 2008). Surprisingly, only few studies investigated the
influence of emotions on other variables. Thus, we try to fill this gap by proposing that aroused
emotions from the site initial exposure are associated with perceptions of site atmospherics
which in turn impact attitudes, involvement, and purchase intentions.
4
Our second goal was to compare the model between Chinese and Canadian cultures.
Given the wide reach of the Internet and the fact that culture impacts responses to store
atmospherics (Davice, Wang, and Lindridge, 2008), it is crucial to explore the role of culture in
reactions to online store atmospherics (Cole and O’Keefe, 2000, Chen and Tai, 2001).
The article is organized as follows. First, from the literature the model is developed. We
discuss the influences of the three types of emotions on perceptions of environmental cues. Then,
the impacts of these environmental cues on site attitudes, site involvement, service attitudes, and
purchase intentions are discussed. Next, we develop hypotheses on path invariances between the
two cultures, describe the data and empirical analyses used to test the model and hypotheses.
Finally, results, conclusions, discussions, limitations and future research directions are discussed.
2. Conceptual Framework
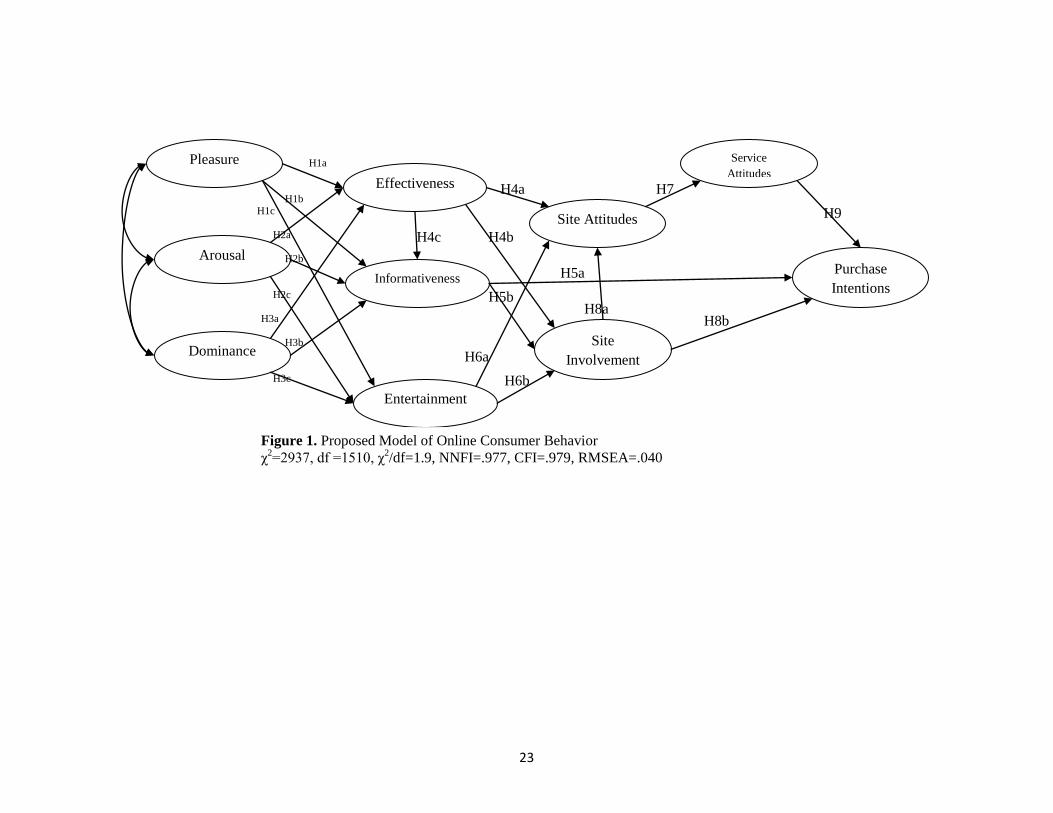
In this section, we introduce the model presented in Figure 1.
[Figure 1]
2.1 Site atmospherics and site interfaces
In retailing contexts, Baker (1987) and Baker et al. (1994) suggested that atmospherics
are more influential than other marketing inputs that are not present at the point of purchase. This
influence should be more important online as the environment is a small screen and customers
have control over “which web pages to browse, for how long, and how much information to
obtain” (Dholakia and Rego, 1998, p. 725).
Online studies focused on the role of site atmospherics on behavior (Eroglu, Machleit,
and Davis, 2003; Hausman and Siekpe, 2009; Richard, 2005). Hauman and Siekpe (2009) used
global search feature, humor, language options, gift services, and security indication to
manipulate the website environment. Mummalaneni (2005) used characteristics such as large-
5
small, roomy-cramped, colorful-drab, well organized-unorganized layout, and good-bad displays
to measure the site design. Eroglu, Machleit, and Davis (2003) used product photos, ordering
policy, customer feedback, text color, and employee photographs to manipulate high- and low-
task relevant cues. Finally, Richard (2005) measured navigational characteristics, site
informativeness, effectiveness, and entertainment as website atmospherics.
Thus, one can divide site environmental features into two categories. First, site features
that are manipulated (“interface features”), such as font, color, text size, background music, and
colors. Davis, Wang, and Lindridge (2008) found that background colors, animated icons, and
visual cues influenced pleasure and arousal. All these features were considered “stimuli” and
impacted emotions automatically and subconsciously (Eroglu, Machleit, and Davis, 2001).
Second, we have site characteristics that are measured and need to be evaluated, such as
site informativeness and effectiveness. Customers use cognitions to evaluate these characteristics
called “atmospherics” in our study. Eroglu, Machleit, and Davis (2001) and Richard (2005)
categorized the atmospherics into two groups: high- and low-task relevant cues. High-task
relevant cues are site descriptors on the screen which facilitate the shopping goal attainment and
low-task relevant cues are “relatively inconsequential to the completion of the shopping task”
(Eroglu, Machleit and Davis, 2001, p. 180).
We chose two high task-relevant cues (site informativeness and effectiveness of
information content) and one low task-relevant cue (site entertainment). Eighmey (1997) defined
the internet as an “infotainment” medium since information and entertainment are two essential
elements of websites. Informativeness is the ability of a website to make information available
(Hoffman and Novak, 1996). An entertaining website is fun, exciting, cool, and imaginative
(Chen and Wells, 1999). Although informativeness is an important characteristic, the way that
6
information is provided and the type of information are also important. Consistent with Richard
(2005), we used “effectiveness of information content” to reflect if the information is accurate,
up-to-date, complete, and relevant to visitors (Bell and Tang, 1998).
2.2. Emotions
Environmental psychologists found that consumers responded to dimensions of the
physical surroundings emotionally and cognitively (Mehrabian and Russell, 1974). Emotions
were recognized as important in human response to environmental settings and as a guide to
behavior (Hull and Harvey, 1989) and site interface features such as colors, lighting, or music
were found to impact emotions (Menon and Kahn, 2002; Morin, Dube, and Chebat, 2007;
Vrechopoulos et al., 2004).
Positive and negative affects were associated with customer information-processing
strategies (Clore, Schwarz, and Conway, 1994). Positive emotions were associated with heuristic
information-processing strategies and negative emotions with systematic elaboration of
information (Clore, Schwarz, and Conway, 1994). For Rapoport (1982) “people react to
environments globally and affectively before they analyze and evaluate them in more specific
terms” (p.14), and feelings are first aroused which provided a background for more specific
images (Rapoport, 1977).
As such, we propose that online customers’ emotions impact their perceptions of site
informativeness, effectiveness, and entertainment. Thus, depending on the emotional states that
arise at the initial exposure to the site, a customer may perceive differently the levels of site
atmospherics. This is consistent with Zajonc (1980) who proposed that “affect should not be
treated unalterably and invariably postcognitive” (p. 172). He argued that affective reactions are
independent of perceptual and cognitive operations and can influence responses. We propose that
7
customers’ emotions precede their perceptions of site atmospherics.
Mehrabian and Russell’s (1974) three types of emotions (PAD: pleasure, arousal, and
dominance) were designed to capture emotional responses to environmental stimuli (Richins,
1997). This is the most often used framework to measure emotions in this context. Pleasure is the
degree to which someone feels good, joyful, happy, or satisfied, and is an indicator of website
“likeability” (Poels and Dewitte, 2008). Arousal is the degree to which someone feels stimulated,
active, or alert and is an indicator of website “motivational power” (Poels and Dewitte, 2008).
Dominance is the degree to which someone feels controlling, influential, free or autonomous and
is an indicator of website “controlling power.”
Russell (1979) stated that pleasure and arousal can adequately represent the range of
emotions exhibited in response to environmental stimuli. However, in online contexts, customers
are in greater control of choosing and processing information; therefore, dominance becomes a
relevant emotional response (Eroglu, Machleit, & Davis, 2001) and is included in the model.
In this study, we used a “dimensional approach” and hypothesized that three emotional
dimensions are positively associated with perceptions of environmental cues, namely site
informativeness, effectiveness, and entertainment (H1a to H3c in Figure 1). Mehrabian and
Russell (1974) stated the three types may exhibit correlation. Therefore, we allow covariances
among them.
2.3 Attitudes, involvement, and purchase intentions
Eroglu, Machleit and Davis (2001) used Mehrabian and Russell’s (1974) Stimulus-
Organism-Response (SOR) framework in their conceptual model. They suggested that online
atmospherics influenced the responses of online shoppers through the intervening effects of
affective and cognitive states. In line with previous studies (Eroglu, Machleit and David, 2003;
8
Hausman and Siekpe, 2009; Richard and Chandra, 2005), we proposed that perceptions of
website atmospherics were positively associated with site attitudes and site involvement (H4a to
H6b in Figure 1). We did not hypothesize the association of site informativeness with site
attitudes as many studies did not find such relationship (Dholakia and Rego, 1998; Richard,
2005). We proposed that the informativeness of the website did not directly impact site attitudes.
Effectiveness of information content was the variable which impacted attitudes.
Moreover, we proposed that effectiveness of information positively impacted site
informativeness (H4c). In other words, if the information provided on the site is accurate, up-to-
date, and relevant, customers perceived the site as more informative. In addition, purchasing
decisions are directly impacted by the information used (Keaveney and Parthasarathy, 2001).
Therefore, the ability of a website to provide information influenced purchase intentions and we
expected a positive association between site informativeness and purchase intentions (H5a).
Following Chan and Li (2009) and Jee and Lee (2002), we assumed that websites
reflected the characteristics of traditional advertisements, as they are crafted in the same way an
ad is created. Websites can be seen as an important source of cues that form attitudes toward the
service providers before consumption. Thus, we proposed that site attitudes were positively
associated with service attitudes (H7).
In website navigational contexts, site involvement may be considered as situational
involvement and is comparable to message involvement in advertising (Richins and Bloch,
1986). Highly site-involved customers interact more with the website and try more interactive
functions (Yoo and Stout, 2001). These interactions make customers more familiar with the
website and are expected to increase their site attitudes and purchase intentions (H8a and H8b).
Finally, product attitudes are an important concept in marketing as its link to purchase
9
intentions was found (Oliver, 1986). Therefore, service attitudes and purchase intentions are
expected to be associated positively (H9).
3. Cross-cultural Comparisons
There are calls for more cross cultural comparisons of accepted models and theories.
Culture reflects the preferences and attitudes of people. It is known that “culture may provide
detailed prescriptions (norms) for specific classes of situations…” (Tse et al., 1988, p. 82). Thus,
culture is an obstacle for generalizing the findings; and replications of studies should be
considered in other cultures to observe similarities and differences. Most cross-cultural studies
reported differences across cultures (e.g. Aaker, 2000; Moon, Chadee and Tikoo, 2008;
Steenkamp, Hofstede, and Wendel, 1999; Takada and Jain, 1991). Particularly, culture was
reported as an influential element in responses to store atmospherics (Davis, Wang, and
Lindridge, 2008). Therefore, it is vital to test the model across cultures.
Hofstede (1991) defined culture as the “collective programming of the mind which
distinguishes the members of one group or category of people from those of another” (p. 4).
Most marketing studies adopted this framework in which national cultures are differentiated on
five dimensions: power distance, masculinity/femininity, long-term/short-term orientation,
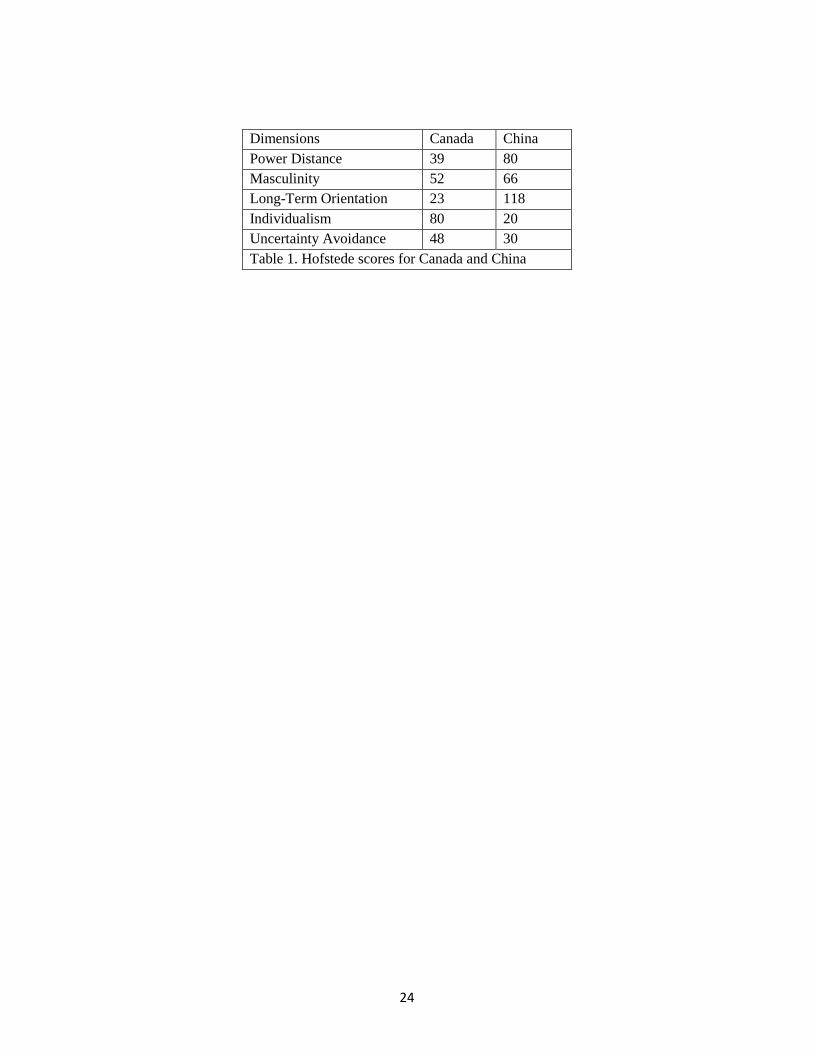
uncertainty avoidance, and individualism/collectivism. China and Canada obtained different
scores on almost all dimensions (see Table 1). We used four dimensions to hypothesize the
difference between these two cultures. Given that both countries falls in the middle of the
masculinity-femininity scale, we did not anticipate differences on this dimension.
[Table 1]
Individualism is the extent to which the members of a society pursue primarily their own
interests rather than that of others (Hofstede, 1991). In collectivist societies individuals look after
10
the interests of their group before themselves. Individualist customers are high on self reliance,
competitiveness, aggressive creativity, conformity, and insecurity (Hsu, 1983). Canada scored
high and China scored low on this dimension.
Many studies in psychology compared the role of emotions across cultures. In general,
emotional features are stronger in individualistic societies (e.g. Schimack et al., 2002). Hsu
(1983) used “low emotionality” as one characteristic of collectivism. Moreover, Triandis (1995)
stated that collectivism emphasizes social norms and duty defined by the group rather than
“pleasure” seeking. Steenkamp and Geyskens (2006) hypothesized that in individualistic
cultures, the effect of emotional experience is larger than in collectivistic cultures. They used two
dimensions of emotions (pleasure and arousal) and found support for “pleasure”. Based on
previous studies, we expected to find significant differences on the “pleasure” dimension:
H10: The impact of pleasure on (a) site effectiveness, (b) site informativeness, and (c)
site entertainment is stronger for Canadians compared to their Chinese counterparts.
Power Distance is the extent to which a society accepts unequal distribution of power
(Hofstede, 1991). Larger power distance implies a greater tolerance of disparity of distribution of
wealth and power in a society. China scored high on power distance; whereas, Canada scored
low. At work, the role of the manager in a high power distance culture is to initiate structure and
tell people what to do rather than ask for their views. Therefore, in high power distance societies
people are more task-oriented and less people-oriented (Hofstede, 1980). In the online context,
we hypothesized that dominance should be the most influential element for the customer in a
high power distance society. Thus, for task-oriented customers, feeling of “control” in doing the
task is more important compared to people-oriented customers. The task is to obtain the required
information from the website. Therefore, we hypothesize that:
H11: The impact of dominance on (a) site effectiveness, (b) site informativeness, and (c)
11
site entertainment is stronger for Chinese customers compared to their Canadian
counterparts.
Long-term orientation is the extent to which members of a society place great
significance on the values of thrift, persistence, and long term alliances (Hofstede, 1991).
Societies with short-term orientation value personal steadiness and stability, saving face, favors,
and gifts (Hofstede, 1991). For Hofstede (1991), China scored the highest in long-term
orientation and Canada’s score is among the lowest. Furrer, Liu, and Sudharshan (2000) found
that long term orientation was associated with responsive and reliable service. Thus, we expected
customer in long-term oriented societies to have higher expectations about the amount of
information and effectiveness of information provided in the website. In other words, the
influences of site informativeness and site effectiveness on other variables-site involvement, site
attitude, and purchase intentions-are expected to be stronger for Canadians than for Chinese.
In addition, Canada scored higher in uncertainty avoidance than China (Hofstede, 1991).
Uncertainty avoidance is the extent to which members of a society feel threatened by uncertain
or unknown situations (Hofstede, 1991). Customers in a high uncertainty avoidance culture tend
to avoid uncertain situations. People with low uncertainty avoidance have more tolerance for
risk. Canada marginally scored higher than China (see Table 1). Therefore, Canadians would
attempt more to minimize uncertainty. Seeking and collecting additional information is a strategy
to reduce the level of uncertainty and risk involved in purchasing decisions (Murray, 1991).
Therefore, the impacts of site informativeness and effectiveness of information content on site
attitudes, site involvement, and purchase intentions are expected to be higher for Canadians
compared to the Chinese.
Moreover, individuals from different cultures tend to focus on different types of cues
(Mattila, 1999). Individualism emphasizes more individual responses to context rather than
12
context and cues. Considering the nature of individualism and collectivism, Davis, Wan, and
Lindridge (2008) found that high task cues-the site descriptors on the screen which facilitate
shopping goal attainment-were more central to the decision-making process for individualistic
customers. Based on this discussion of the three cultural dimensions, we hypothesized that:
H12. The impact of site effectiveness on (a) site attitudes, (b) site involvement, and (c)
site informativeness is greater for Canadians than for the Chinese.
H13. The impact of site informativeness on (a) site involvement and (b) purchase
intention is greater for Canadians than for the Chinese.
The symbolic-subjective culture of collectivism is context sensitive; therefore,
collectivistic customers rated the low task cues-the site descriptors that are not consequential to
the completion of shopping task-as more helpful (Davis, Wan, and Lindridge, 2008). We
expected to find the impacts of site entertainment, a low task cue, on site attitudes and
involvement to be stronger for Chinese than for Canadians:
H14. The impact of site entertainment on (a) site attitudes and (b) site involvement is
greater for the Chinese than for Canadians.
Compared to Canada, China scored higher on “long-term orientation.” Long-term
oriented individuals emphasize persistence and long-term alliances (Tsikriktsis, 2002).
Moreover, collectivism is a high context culture and emphasizes causal reasoning and forming
perceptions about social contexts and situational constraints (Davis, Wan, and Lindridge, 2008).
As a result, the associations of site attitudes with service attitudes and site involvement with site
attitudes are expected to be higher for Chinese customers. Therefore, we hypothesized that:
H15. The impact of site attitudes on service attitudes is greater for Chinese than for
Canadians.
H16a. The impact of site involvement on site attitudes is greater for Chinese than for
Canadians.
Individualistic customers tend to make their decisions based on their own interests. In an
13
individualistic society, attitudes and behaviors are regulated by individual preferences (Triandis,
1989). On the other hand, attitudes and behaviors in a collectivist society are largely influenced
by society’s preferences (Triandis, 1989). Therefore, we argue that Canadians make their
purchasing decisions faster. If they like the service (higher attitudes) and are involved in the
website, the chance that they would purchase the product or service would be higher. For the
Chinese, purchasing decisions are more complex. They have to consider their group interests
beside their own. Therefore, we expected the impacts of service attitudes and site involvement on
purchase intentions to be greater for Canadians.
H16b. The impact of site involvement on purchase intentions is greater for Canadians
than for Chinese.
H17. The impact of service attitudes on purchase intentions is greater for Canadians than
for Chinese.
4. Methodology
For testing the hypotheses, we used real websites of service providers in 8 different industries:
hotels, online bookstores, dental services, banks, vacation destination, restaurants, financial
investments, and plastic surgery. We selected four websites for dental services, two for online
bookstores, four for restaurants, two for financial investments, four for hotels, four for plastic
surgery, three for vacation destinations and sites for banks.
Data were collected online using a computer lab in a Northeastern university. Subjects
were randomly assigned to one of the twenty five websites. They were exposed to a real website
of a service company and were asked to surf the site and collect information for at least 5
minutes. The duration of completing the survey was monitored and the subjects who visited the
site and completed the questionnaire in less than 15 minutes were eliminated. After the
eliminations, our sample consisted of 234 Chinese (54% female and 46% male) and 350
Canadians (58% female and 42% male) subjects. Most respondents were undergraduate students
14
(98.3% of Chinese and 98.9% of Canadians) between the ages of 18 and 24 (75% of Chinese and
80% of Canadians).
5. Measurement
The questionnaire contained several measures addressing the research questions. Most scales
were adapted from the literature. Mehrabian and Russell’s (1974) PAD scale for emotions was
used to measure pleasure, arousal, and dominance. Chen and Wells’ (1999) scales were used to
measure website entertainment (4 items) and informativeness (4 items). Effectiveness of
information content was measured by a 5-item scale adopted from Bell and Tang (1998).
Eighmey’s (1997) scale for attitudes was modified to a 5-item scale for website and service
attitudes. Website involvement was measured by a 6-item scale (Muehling, Stoltman, and
Grossbart, 1990). Finally, a 4-item scale for purchase intentions was adopted from Dodds (1991).
Five point Likert scales were employed to indicate the respondent’s levels of agreement or
disagreement with each statement.
6. Results
6.1. Test of Reliability and Confirmatory Factor Analysis (CFA)
Given the high number of variables, we first ran an exploratory factor analysis on all 42
items. The results of EFA demonstrated that all items, except two, had high primary loading
(higher than .60) and low cross loadings (lower than .35). Two items of arousal were eliminated
because of cross loadings. The Cronbach’s alphas for all constructs were in the acceptable range.
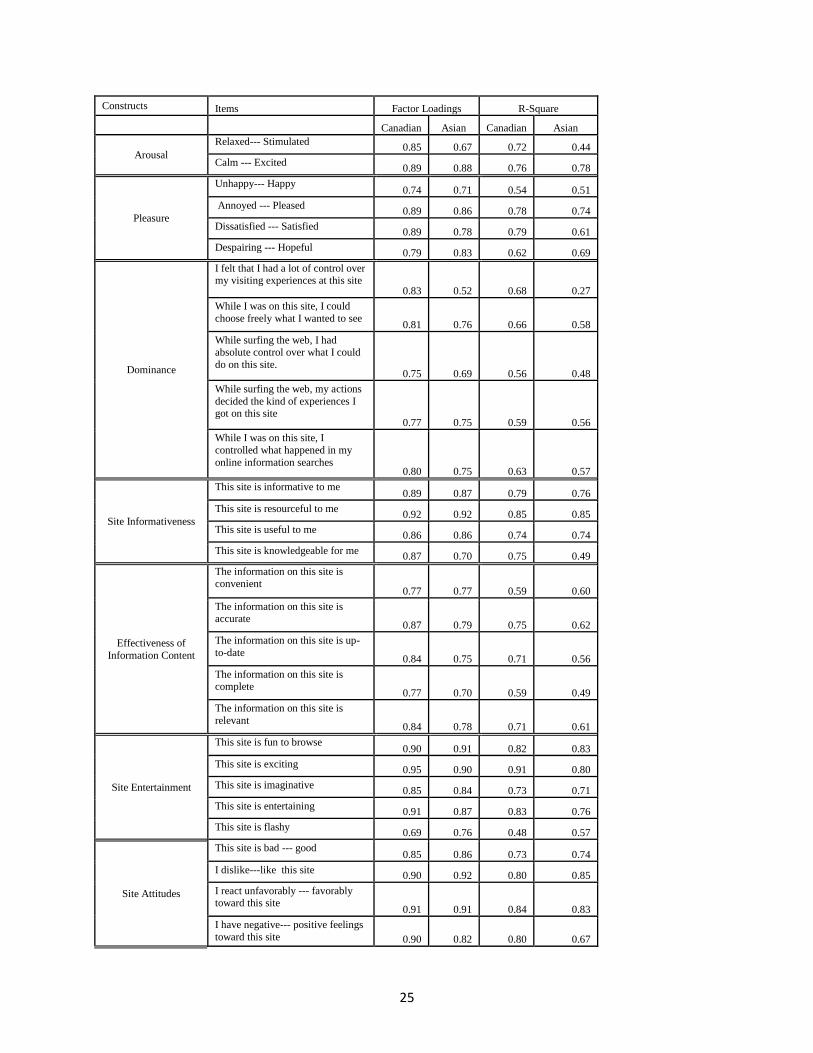
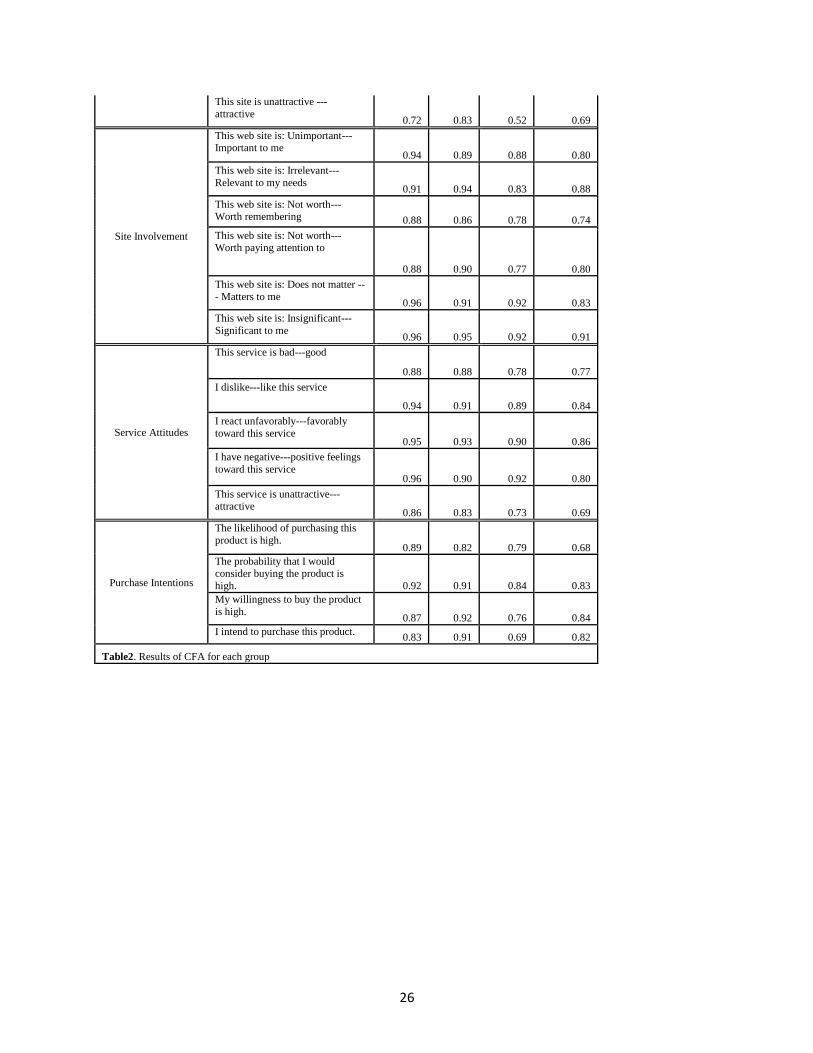
Then, we ran CFA by specifying the factor model including all 10 variables used for each
cultural group. The loadings and R-squared for all items were in the acceptable range (Table 2).
The results of the CFA demonstrated good measurement fit for both groups: the chi-square,
NNFI, CFI, and RMSEA have values of 1873(df=853), .976, .978, and .059 for the Canadian
15
sample and 1534(df=853), .975, .978, and .059 for the Chinese sample. Given the number of
analyzed items and factors, the model fit parameters are in the acceptable range (Baumgartner
and Homburg, 1996).
[Table 2 here]
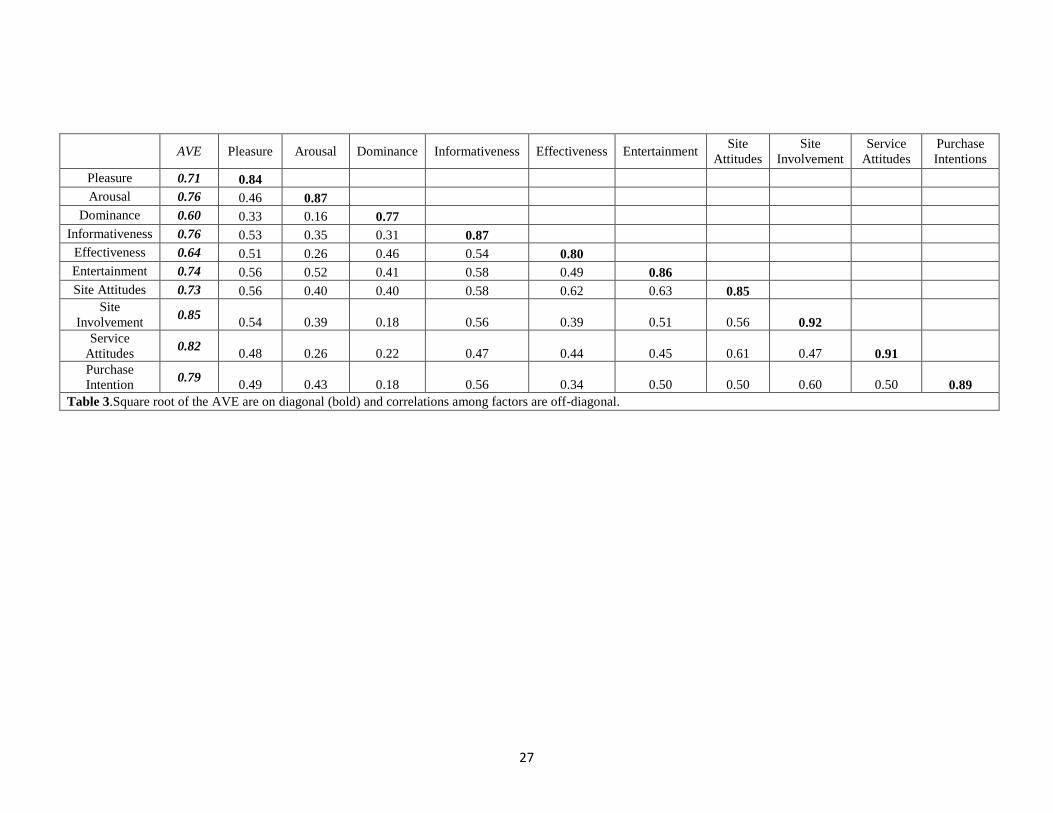
For convergent validity, the average variance explained (AVE) by each factor was
calculated (second column, Table 3). All factors had AVE higher than .50 demonstrating that a
construct share more variance with its indicators than with error variances (Fornell and Larker,
1981). For discriminant validity, the correlations between factors and square root of the AVE are
compared (Table 3). The square root of AVE for each factor was greater than the correlations
between that factor and all other factors, exhibiting appropriate discriminant validity (Fornell and
Larker, 1981).
[Table 3]
6.2. Tests of Hypotheses
To test the hypotheses, multiple-group analysis in EQS was employed. First we examined
the factor loading invariance across groups (Bollen, 1989). Bentler (1988) noted that without
factor loading invariance, it is difficult to argue that the factors are identical across different
groups. Steenkamp and Baumgartner (1998) also stated that metric invariance should be
established across groups before comparing the strengths of the path coefficients. As a result,
measurement level constraints were introduced before testing for causal path invariances (Byrne,
1994).
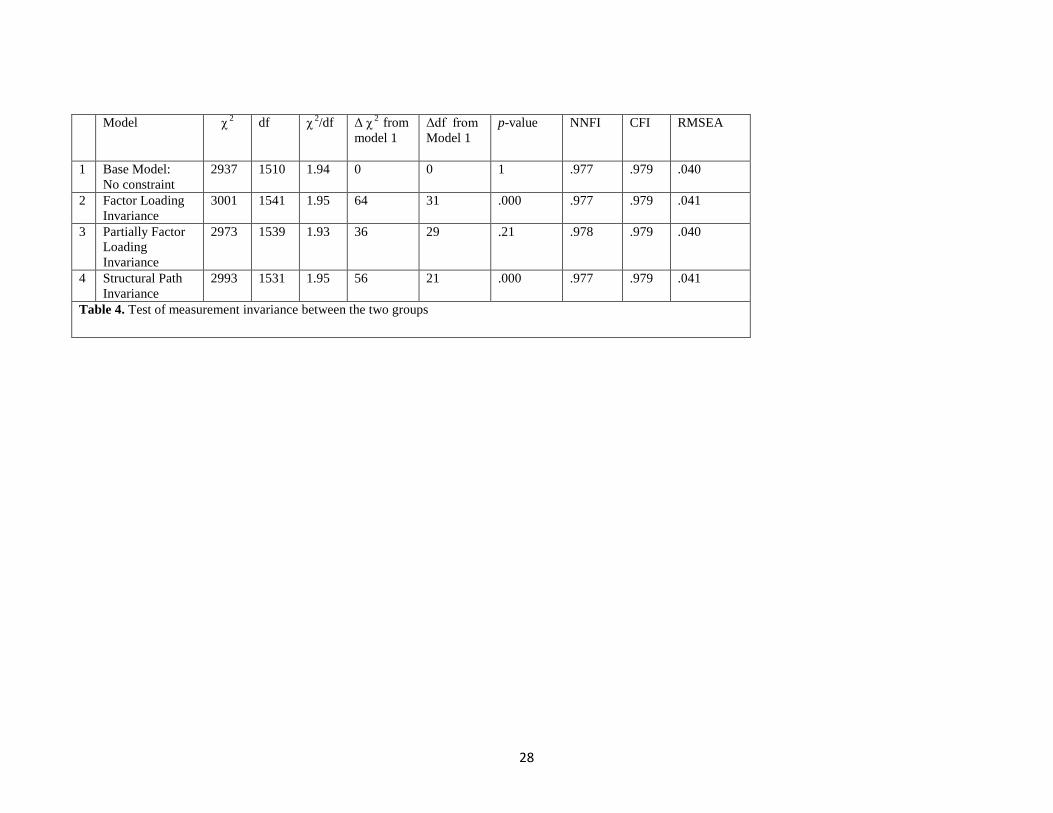
Table 4 summarizes the results. Fit parameters demonstrated a good fit for all models.
Model 1 was the least restrictive, and models 2 to 4 were nested in model 1. When we
constrained all the loadings, the model did not significantly improve. The multivariate LMχ2
16
statistics and related p-values revealed two non-invariant factor loadings: one items of
dominance and one item of site attitudes. Releasing these two constraints (Model 3) produced a
satisfactory measurement model that was invariant across the two groups. The Chi-square
difference between model 3 and the baseline model was 36 with 29 degree of freedom (p>.10).
Therefore, partial metric invariance was supported.
[Insert Table 4 here]
By constraining the paths to be invariant across the two groups, the model did not
improve (Model 4 in Table 4). Therefore, the paths are non-invariant. After testing the
measurement invariance across groups, the Lagrange test was used to find the differences
(Bentler, 2004). The multivariate test determines a simultaneous effect of several restrictions in
the model and was used to test the hypotheses. The null hypothesis for each constraint is that the
constraint is true in the population involved. Therefore, the low probability value of the Lagrange
test statistic indicates that the constraint is unreasonable. The results of the multivariate Lagrange
test are presented on Table 5. All hypotheses are directional.
[Table 5]
6.3. Results of multiple-group analyses
Results of multiple group analyses suggested that most paths (18/20) were significant in
at least one culture; however, the strengths of the paths were not invariant across the groups.
Contrary to our model, the impacts of site effectiveness on site involvement (H4b) and arousal
on site effectiveness (H2a) were not significant in either group. Also, the impact of dominance
on site informativeness (H3b) was not significant for the Chinese and was negative for
Canadians.
We found that the impacts of the three emotions vary between the cultures. In line with
17
our hypotheses (H10a, H10b, and H10c), pleasure had stronger impacts on customers’ site
informativeness, effectiveness, and entertainment for Canadians. Interestingly, contrary to our
hypothesis (H11a, H11b, and H11c), the influence of dominance on these variables was greater
for the Chinese. Consistent with previous studies, the impact of arousal on other variables was
invariant between cultures.
Moreover, the impacts of high task cues on customer behavior variables were greater for
Canadians than for the Chinese. In line with our hypotheses, the impacts of site effectiveness on
site attitudes, site informativeness on site involvement, and site informativeness on purchase
intentions were greater for the Canadians (.318, .577, and .150 respectively) compared to the
Chinese (.125, .401, .083 respectively) supporting H12a, H13a, and H13b.
On the other hand, the impacts of entertainment on site attitudes and site involvement
were found to be significantly higher for Chinese respondents (.577 and .444) compared to the
Canadians (.376 and .156) supporting H14a and H14b. Moreover, in line with hypothesis H15,
the impact of site attitudes on service attitudes was found to be stronger for the Chinese (.601)
compared to Canadians (.474).
The impacts of site involvement on site attitudes and purchase intentions and also service
attitudes on purchase intentions were invariant between the two cultures, failing to support H16a,
H16b, and H17.
7. Conclusion and discussion
The purpose of this study was to propose a model of online customer behavior in services
marketing and to compare all the relationships between Chinese and Canadian cultures. Most
paths (18/20) were significant in at least one group. Moreover, half of the 18 significant
structural paths were invariant between the cultures. Given that our Chinese respondents were
18
students in Canada, we expect to find even larger differences if we use mainland Chinese.
Our major theoretical contribution was to distinguish between two groups of website
features. The first group-website interfaces- can be considered as stimulus and influence
shoppers’ emotions at the initial exposure. The second group-site atmospherics-are influenced by
the three types of emotions.
The results of multiple-group analysis suggested that two types of emotions (pleasure and
dominance) influenced other behavioral variables differently in the two cultures. Living in an
individualistic society, pleasure was the most influential type of emotions for Canadian
customers. On the other hand, dominance was the key type of emotions for the more task-
oriented customers and its influences on the other cognitive and affective variables were stronger
for the Chinese than for Canadians. These findings suggest that website designers should use
different techniques to increase visitors’ feelings of pleasure and likeability of the website for
Canadian and feeling of control over the website for Chinese customers.
Consistent with our hypotheses, the impact of low task relevant cues on site attitudes and
site involvement were stronger for the Chinese who live in a long-term oriented, low uncertainty
avoidance, and collectivistic society. On the other hand, living in a short-term oriented, high
uncertainty avoidance, and individualistic society, Canadians rely more on the high task relevant
cues to form their site attitudes, being involved in the site, and making a purchase decision. It
could be interpreted that service providers should increase the hedonic aspects of the website for
the Chinese and the utilitarian aspects for Canadians.
Given the Chinese emphasis on persistence, long-term alliances and causal reasoning, the
association of site attitudes and service attitudes was found to be stronger for the Chinese
compared to Canadians. Therefore, increasing customers’ attitudes toward the website can be
19
considered as a competitive advantage for service providers who target the Chinese.
The findings suggested that the impacts of site involvement and service attitudes on
purchase intentions were not significantly different between the cultures. Based on the
individualism/collectivism dimension, we hypothesized these relationships to be stronger for
Canadians. However, in a society with high uncertainty avoidance, customers tend to create more
“formal rules” for their decisions (Moon, Chadee, and Tikoo, 2008). Even though, Canadians
make decisions based on self-interests, rules for the decision can be established. As a result, the
influence of site involvement and service attitudes on purchase intentions became invariant
between the groups.
Also, our findings did not support the influence of site effectiveness on site involvement.
For some services, effectiveness of information content may allow customers to obtain the
required information faster and more conveniently. In many cases, the faster they get their
information, the faster they leave the website and the lower is their level of involvement. The
wide range of services that we used might explain this contradictory finding. Future research
should explore the moderating impact of service type in this relationship.
8. Limitations and future research
To interpret the results, one should consider the limitations of this study. We used a wide
range of service websites. The only disadvantage is that we were not able to control for all
variables. For example, the type of service might have a moderating effect on the site
effectiveness and site involvement relationship. Future research should investigate the role of
service type on the impact of effectiveness of information content on site involvement.
Most respondents were students. Given their familiarity with internet technology, this
group uses the Internet the most. However, one should be cautious about generalizing these
20
findings to other segments of the population. Future research might investigate the possible
moderating impact of age and/or social status on online customer behavior.
The final limitation is choosing the Chinese sample. They were all students in Canada.
Using real customers from China may provide even greater differences.
References
Aaker JL. Accessibility or Diagnosticity? Disentangling the Influence of Culture on Persuasion
Processes and Attitudes. J Consum Res 2000;26(1):340-357.
Baker J, Parasuraman A, Grewal D, Voss GB. The influence of multiple store environment cues
on perceived merchandise values and patronage intentions. J Mark 2002;66(April):120-
141.
Baumgartner H, Homburg C. Applications of structural equation modeling in marketing and
consumer research: A review. Internat J Res Mark 1996;13(2):139-161.
Bell H, Tang NKH. The effectiveness of commercial internet web sites: A user's perspective.
Internet Res 1998;8(3):219-228.
Bentler PM. Theory and implementation of EQS: A structural equations program. Los Angeles,
CA: BMDP Statistical Software. 1998.
Bhatnagar A, Ghose S. Online information search termination patterns across product categories
and consumer demographics. J Retail 2004;80:221-228.
Bollen KA. Strucural equations with latent variables. New York: John Wiley. 1989.
Byrne BM. Structural equation modeling with EQS and EQS/Windows: Basic concepts,
applications, and programming. Newbury Park, CA: Sage. 1994.
Chan KW, Li SY. Understanding consumer-to-consumer interactions in virtual communities:
The salience of reciprocity. J Bus Res, in press.
Chan RYK, Tai S. How do in-store environmental cues influence Chinese shoppers? A study of
hypermarket customers in Hong Kong. J Internat Consum Mark 2001;13(1):73-104.
Chen Q, Wells WD. Attitude toward the site. J Advert Res 1999;39(5):27-38.
Clore GL, Schwarz N, Conway M. Affective causes and consequences of social information
processing. In Wyer RS, Srull TK, eds.: Handbook of Social Cognition, Erlbaum:
Hillsdale, NJ. 1994.
Cole M, O’Keefe RM. (2000). Conceptualising the dynamic of globalization and culture in
electronic commerce, J Global Inform Technol Manage 2000;3(4):4-17.
Davis L, Wang S, Lindridge A. Culture influences on emotional responses to on-line store
atmospheric cues. J Bus Res 2008;61:806-812.
Dholakia UM, Rego LL. What makes commercial Web pages popular? An empirical
investigation of Web page effectiveness. European J Mark 1998;32(7/8):724-736.
Dodds WB. In search of value: How price and store name information influence buyers' product
perceptions. J Services Mark 1991;5(3):27-36.
Eighmey J. Profiling user responses to commercial web sites. J Advert Res 1997;37(3):59-66.
Eroglu SA, Machleit KA, Davis LM. Atmospheric qualities of online retailing: A conceptual
model and implications. J Bus Res 2001;54(2):177-184.
21
Eroglu SA, Machleit KA, Davis LM. Empirical testing of a model of online store atmospherics
and shoppers responses. Psychol Mark 2003;20(2):139-150.
Forgas JP. On being happy and mistaken: Mood effects on the fundamental attribution error. J
Personal Soc Psychol 1998;75(2):318-331.
Furrer O, Liu BS, Sudharshan D. The relationships between culture and service quality
perceptions. J Serv Res, 2000;2(4):355-371.
Hausman AV, Siekpe JS. The effect of web interface features on consumer online purchase
intentions. J Bus Res, 2009;62:5-13.
Hoffman DL, Novak TP. Marketing in hypermedia computer-mediated environments:
Conceptual foundations. J Mark 1996;60(3):50-68.
Hofstede G. Culture’s consequences: International differences in work-related issues. Beverly
Hills, CA: Sage. 1980.
Hofstede G. Cultures and organizations: Software of the mind. New York: McGraw-Hill. 1991.
Hsu FLK. Exorcising the trouble makers: Magic, science, and culture. Westport, CT:
Greenwood. 1983.
Jee J, Lee WN. Antecedents and consequences of perceived interactivity: An exploratory study. J
Interact Advert 2002;3(1):1-16.
Keaveney SM, Parthasarathy M. Customer switching behavior in online services: An exploratory
study of the role of selected attitudinal, behavioral, and demographic factors. J Acad
Mark Sci, 2001;29(4):374-390.
Liang T, Lai H. Effects of store design on consumer purchases: An empirical study of on-line
bookstores. Inform Manage 2001;39, 431-444.
Mattila AS. The role of culture in the service evaluation process. J Serv Res 1999;1(3):250-261.
Mehrabian A, Russell JA. The basic emotional impact of environments. Percept Motor Skills,
1974;38:283-301.
Menon S, Kahn B. Cross-category effects of induced arousal and pleasure on the Internet
shopping experience. J Retail 2002;78:31-40.
Morin S, Dube L, Chebat JC. The role of pleasant music in servicescape: A test of the dual
model of environmental perception. J Retail 2007;83(1):115-130.
Moon J, Chadee D, Tikoo S. Culture, product type, and price influences on consumer purchase
intention to buy personalized products online. J Bus Res 2008;61:31-39.
Muehling DD, Stoltman JJ, Grossbart S. The impact of comparative advertising on levels of
message involvement. J Advert 1990;19(4):41-50.
Murray KB. A test of services marketing theory: Consumer information acquisition activities. J
Mark 1991;55(1), 10-25.
Oliver RL. (1986). A cognitive model of antecedents and consequences of satisfaction decisions.
J Mark Res 1986;17(4):460-469.
Poels K, Dewitte S. Getting a line on print ads: Pleasure and arousal reactions reveal an implicit
advertising mechanism. J Advert 2008;37(4):63-74.
Rapoport A. Human aspects of urban form. New York: Pergamon. 1977.
Rapoport A. (1982). The meaning of the built environment: A nonverbal communication
approach. Beverly Hills, CA: Sage. 1982.
Richard MO. Modeling the impact of internet atmospherics on surfer behavior. J Bus Res
22
2005;58(12):1632-1642.
Richard MO, Chandra R. A model of consumer web navigational behavior: Conceptual
development and application. J Bus Res 2005;58(8):1019-1029.
Richins ML. Measuring emotions in the consumption experience. J Consum Res 1997:24:127-
146.
Richins ML, Bloch PH. After the new wears off: The temporal context of product involvement, J
Consum Res 1986;13(2):280-285.
Rosen EE, Purinton E. Website design: Viewing the web as a cognitive landscape. J Bus Res
2004;57:787-794.
Russell JA. Affective space is bipolar. J Personal Soc Psychol 1979;37:345-356.
Russell JA, Ward LM, Pratt G. Affective quality attributed to environments: A factor analytic
study. Environ Beh, 1981;13(3):259-288.
Schimack U, Radharkishnan P, Oishi S, Dzokoto V, Ahadi S. Culture, personality, and
subjective well-being: Integrating process models of life satisfaction. J Personal Soc
Psychol 2002;82(4), 582-593.
Schwarz N. Feelings as information: Informational and motivational functions of affective states.
In Higgins ET, Sorrentino RM, eds. Handbook of motivation and cognition: Foundations
of social behavior. New York: Guilford. 1990:527-61.
Steenkamp JEM, Geyskens I. How country characteristics affect the perceived value of web
sites. J Mark 2006;70(July):136-150.
Steenkamp JEM, Baumgartner H. Assessing measurement invariance in cross-national
consumer research. J Consum Res 1998;25(1):78-107.
Steenkamp JEM, Hofstede FT, Wendel M. A cross-national investigation into the individual and
national cultural antecedents of consumer innovativeness. J Mark 1999;63(2):55-69.
Takada H, Jain D. (1991). Cross-national analysis of diffusion of consumer durable goods in
Pacific Rim countries. J Mark 1991;55(2):48-54.
Triandis HC. The self and social behavior in differing cultural contexts. Psychol Rev
1989;96(3):506-520.
Triandis HC. Individualism and collectivism. Boulder, CO: Westview. 1995.
Tsikriktsis N. Does culture influence website quality expectations? An empirical study. J Serv
Res 2002:5(2):101-112.
Tse DK, Lee K, Vertinsky I, Wehrung DA. (1988). Does culture matter? A cross-cultural study
of executives’ choice, decisiveness, and risk adjustment in international marketing. J
Mark 1988;52(Oct):81-95.
Varadarajan PR, Yadav MS. Marketing strategy and the Internet: An organizing framework. J
Acad Mark Sci 2002;30(4): 296-312.
Vrechopoulos AP, O’Keefe RM, Doukidis GI, Siomkos GJ. Virtual store layout: an experimental
comparison in the context of grocery retail. J Retail 2004;80:13-22.
Yoo CY, Stout PA. Factors affecting users' interactivity with the website and the consequences
of users' interactivity. In Taylor CR, Ed. Proceedings (pp. 53-61). Villanova, PA:
American Academy of Advertising. 2001.
Zajonc RB. Feeling and thinking: Preferences need no inferences. Am Psychol 1980;35(2):151-
175.
23
Pleasure
Arousal
Dominance
Informativeness
Effectiveness
Entertainment
Site Attitudes
Site
Involvement
Service
Attitudes
Purchase
Intentions
H1a
H1b H1c
H2a
H2b
H2c
H3a
H3b
H3c
H4a
H4b
H5a
H5b
H6a
H6b
H8b H8a
H7
H9
Figure 1. Proposed Model of Online Consumer Behavior
χ2=2937, df =1510, χ
2/df=1.9, NNFI=.977, CFI=.979, RMSEA=.040
H4c
24
Dimensions Canada China
Power Distance 39 80
Masculinity 52 66
Long-Term Orientation 23 118
Individualism 80 20
Uncertainty Avoidance 48 30
Table 1. Hofstede scores for Canada and China
25
Constructs Items Factor Loadings R-Square
Canadian Asian Canadian Asian
Arousal
Relaxed--- Stimulated 0.85 0.67 0.72 0.44
Calm --- Excited 0.89 0.88 0.76 0.78
Pleasure
Unhappy--- Happy 0.74 0.71 0.54 0.51
Annoyed --- Pleased 0.89 0.86 0.78 0.74
Dissatisfied --- Satisfied 0.89 0.78 0.79 0.61
Despairing --- Hopeful 0.79 0.83 0.62 0.69
Dominance
I felt that I had a lot of control over my visiting experiences at this site
0.83 0.52 0.68 0.27
While I was on this site, I could
choose freely what I wanted to see 0.81 0.76 0.66 0.58
While surfing the web, I had
absolute control over what I could
do on this site. 0.75 0.69 0.56 0.48
While surfing the web, my actions
decided the kind of experiences I got on this site
0.77 0.75 0.59 0.56
While I was on this site, I
controlled what happened in my
online information searches 0.80 0.75 0.63 0.57
Site Informativeness
This site is informative to me 0.89 0.87 0.79 0.76
This site is resourceful to me 0.92 0.92 0.85 0.85
This site is useful to me 0.86 0.86 0.74 0.74
This site is knowledgeable for me 0.87 0.70 0.75 0.49
Effectiveness of
Information Content
The information on this site is
convenient 0.77 0.77 0.59 0.60
The information on this site is accurate
0.87 0.79 0.75 0.62
The information on this site is up-
to-date 0.84 0.75 0.71 0.56
The information on this site is complete
0.77 0.70 0.59 0.49
The information on this site is
relevant 0.84 0.78 0.71 0.61
Site Entertainment
This site is fun to browse 0.90 0.91 0.82 0.83
This site is exciting 0.95 0.90 0.91 0.80
This site is imaginative 0.85 0.84 0.73 0.71
This site is entertaining 0.91 0.87 0.83 0.76
This site is flashy 0.69 0.76 0.48 0.57
Site Attitudes
This site is bad --- good 0.85 0.86 0.73 0.74
I dislike---like this site 0.90 0.92 0.80 0.85
I react unfavorably --- favorably toward this site
0.91 0.91 0.84 0.83
I have negative--- positive feelings
toward this site 0.90 0.82 0.80 0.67
26
This site is unattractive ---
attractive 0.72 0.83 0.52 0.69
Site Involvement
This web site is: Unimportant---Important to me
0.94 0.89 0.88 0.80
This web site is: Irrelevant---
Relevant to my needs 0.91 0.94 0.83 0.88
This web site is: Not worth---Worth remembering 0.88 0.86 0.78 0.74
This web site is: Not worth---Worth paying attention to
0.88 0.90 0.77 0.80
This web site is: Does not matter --
- Matters to me 0.96 0.91 0.92 0.83
This web site is: Insignificant---
Significant to me 0.96 0.95 0.92 0.91
Service Attitudes
This service is bad---good
0.88 0.88 0.78 0.77
I dislike---like this service
0.94 0.91 0.89 0.84
I react unfavorably---favorably
toward this service 0.95 0.93 0.90 0.86
I have negative---positive feelings
toward this service 0.96 0.90 0.92 0.80
This service is unattractive---attractive
0.86 0.83 0.73 0.69
Purchase Intentions
The likelihood of purchasing this
product is high. 0.89 0.82 0.79 0.68
The probability that I would
consider buying the product is
high. 0.92 0.91 0.84 0.83
My willingness to buy the product
is high. 0.87 0.92 0.76 0.84
I intend to purchase this product. 0.83 0.91 0.69 0.82
Table2. Results of CFA for each group
27
AVE Pleasure Arousal Dominance Informativeness Effectiveness Entertainment Site
Attitudes
Site
Involvement
Service
Attitudes
Purchase
Intentions
Pleasure 0.71 0.84
Arousal 0.76 0.46 0.87
Dominance 0.60 0.33 0.16 0.77
Informativeness 0.76 0.53 0.35 0.31 0.87
Effectiveness 0.64 0.51 0.26 0.46 0.54 0.80
Entertainment 0.74 0.56 0.52 0.41 0.58 0.49 0.86
Site Attitudes 0.73 0.56 0.40 0.40 0.58 0.62 0.63 0.85
Site
Involvement 0.85
0.54 0.39 0.18 0.56 0.39 0.51 0.56 0.92
Service
Attitudes 0.82
0.48 0.26 0.22 0.47 0.44 0.45 0.61 0.47 0.91
Purchase
Intention 0.79
0.49 0.43 0.18 0.56 0.34 0.50 0.50 0.60 0.50 0.89
Table 3.Square root of the AVE are on diagonal (bold) and correlations among factors are off-diagonal.
28
Model χ 2
df χ 2/df Δ χ
2 from
model 1
Δdf from
Model 1
p-value NNFI CFI RMSEA
1 Base Model:
No constraint
2937 1510 1.94 0 0 1 .977 .979 .040
2 Factor Loading
Invariance
3001 1541 1.95 64 31 .000 .977 .979
.041
3 Partially Factor
Loading
Invariance
2973 1539 1.93
36 29 .21 .978 .979
.040
4 Structural Path
Invariance
2993 1531 1.95 56 21 .000 .977 .979 .041
Table 4. Test of measurement invariance between the two groups

29
Conceptual
Model
Cultural
Comparison Hypothetical Path Chinese Canadian Path Differences:
χ2(p-value)
H1a H10a Pleasure→ Effectiveness .260*** .415*** 3.01 (.083) H1b H10b Pleasure→ Informativeness .200*** .261*** .638(.424) H1c H10c Pleasure→ Entertainment .387*** .460*** 2.66 (.100) H2a -- Arousal→ Effectiveness .047n.s. .022n.s. .087(.769) H2b -- Arousal→ Informativeness .148** .105* .444(.505) H2c -- Arousal→ Entertainment .266** .314*** .025(.870) H3a H11a Dominance→ Effectiveness .623*** .402*** 14.4(.000) H3b H11b Dominance→ Informativeness -.049n.s. -.124* .256(.613) H3c H11c Dominance→ Entertainment .249*** .210*** 1.93(.165) H4a H12a Effectiveness → Site Attitudes .125* .318*** 3.16(.076) H4b H12b Effectiveness → Site Involvement -.178n.s. -.021n.s. 1.83(.190) H4c H12c Effectiveness → Informativeness .679*** .534*** 2.07(.150) H5a H13a Informativeness → Site Involvement .401** .577*** 3.10 (.078) H5b H13b Informativeness → Purchase Intentions .083n.s. .150* 4.80(.030) H6a H14a Entertainment → Site Attitudes .577*** .376*** 5.22(.022) H6b H14b Entertainment → Site Involvement .444*** .156** 4.55(.033) H7 H15 Site Attitudes→ Service Attitudes .601*** .474*** 3.02(.082) H8a H16a Site Involvement → Site Attitudes .268*** .145** 2.51(.113) H8b H16b Site Involvement → Purchase Intentions .328*** .499*** 1.70(.192) H9 H17 Service Attitudes→ Purchase Intentions .352*** .229*** 2.16(.142)
Table 5 Results of the invariance tests of the model between the two groups
(***p<.001, ** p<.01, * p<.05)