On visualization techniques for solar data mining
28
On Visualization Techniques for Solar Data Mining Michael A. Schuh a,* , Juan M. Banda a , Tim Wylie a , Patrick McInerney a , Karthik Ganesan Pillai a , Rafal A. Angryk a,b a Dept. of Computer Science, Montana State University, Bozeman, MT, 59717 USA. b Dept. of Computer Science, Georgia State University, Atlanta, GA, 30302 USA. Abstract Large-scale data mining is often aided with graphic visualizations to facilitate a better understanding of the data and results. This is especially true for visual data and highly detailed data too complex to be easily understood in raw forms. In this work, we present several of our recent interdisciplinary works in data mining solar image repositories and discuss the over-arching need for effective visualizations of data, metadata, and results along the way. First, we explain the complex characteristics and overwhelming abundance of image data being produced by NASA’s Solar Dynamics Observatory (SDO). Then we discuss the wide scope of solar data mining and highlight visual results from work in data labeling, classification, and clustering. Lastly, we present an overview of the first-ever Content-Based Image Retrieval (CBIR) system for solar images, and conclude with a brief look at the direction of our future research. Keywords: solar images, visualization, data mining, CBIR 1. Introduction The abundance of rich data sources in our modern society fuels the need for practical and innovative large-scale data mining research and applications. Much of this work requires specialized data analysis, and it often requires exten- sive domain knowledge to contextualize the data and present the results. With * Corresponding author Email address: [email protected] (Michael A. Schuh) Preprint submitted to Journal of Astronomy and Computing February 2, 2015
Transcript of On visualization techniques for solar data mining

On Visualization Techniques for Solar Data Mining
Michael A. Schuha,∗, Juan M. Bandaa, Tim Wyliea, Patrick McInerneya,Karthik Ganesan Pillaia, Rafal A. Angryka,b
aDept. of Computer Science, Montana State University, Bozeman, MT, 59717 USA.bDept. of Computer Science, Georgia State University, Atlanta, GA, 30302 USA.
Abstract
Large-scale data mining is often aided with graphic visualizations to facilitate a
better understanding of the data and results. This is especially true for visual
data and highly detailed data too complex to be easily understood in raw forms.
In this work, we present several of our recent interdisciplinary works in data
mining solar image repositories and discuss the over-arching need for effective
visualizations of data, metadata, and results along the way. First, we explain
the complex characteristics and overwhelming abundance of image data being
produced by NASA’s Solar Dynamics Observatory (SDO). Then we discuss the
wide scope of solar data mining and highlight visual results from work in data
labeling, classification, and clustering. Lastly, we present an overview of the
first-ever Content-Based Image Retrieval (CBIR) system for solar images, and
conclude with a brief look at the direction of our future research.
Keywords: solar images, visualization, data mining, CBIR
1. Introduction
The abundance of rich data sources in our modern society fuels the need
for practical and innovative large-scale data mining research and applications.
Much of this work requires specialized data analysis, and it often requires exten-
sive domain knowledge to contextualize the data and present the results. With
∗Corresponding authorEmail address: [email protected] (Michael A. Schuh)
Preprint submitted to Journal of Astronomy and Computing February 2, 2015

data storage costs plunging and data collection opportunities soaring, it seems
common practice (and human nature) to maximize the quantity and quality of
data whenever possible. The solar physics community is no exception to this
trend, and NASA’s most advanced observational satellite to date, the Solar Dy-
namics Observatory (SDO), is currently capturing over 70,000 high-resolution
images of the sun (roughly 1.5TB of raw data) each and every day [1].
The need for large-scale data mining in solar physics is imperative, as the
sheer amount of data produced by the SDO can only be comprehensively pro-
cessed by automated methods. Traditionally, research in solar physics has been
guided by case studies of individual events or phenomena, but with the paradigm
shift from small to large-scale solar science taking root, there are many new chal-
lenges facing the field. Not only is solar image data highly complex, but so is
the SDO data repository, composed of a variety of asynchronous instrumen-
tation taking approximately eight 4096×4096 pixel images every ten seconds
for at least a span of five years [2]. Furthermore, within this data there exist
solar science-based events with wide ranges of definable and identifiable char-
acteristics, including highly dependent spatial and temporal attributes. Our
interdisciplinary research group of computer scientists and solar physicists at
Montana State University (MSU) has found that many of these challenges are
inspiring novel research across both fields, while facilitating excellent collabora-
tion opportunities in the pursuit of real world data mining solutions.
This paper presents, for the first time, a general overview of the wide variety
of data mining research and development conducted by the Data Mining Lab at
MSU, within the domain of solar physics. Specifically, our lab has been partially
funded by NASA to create a Content-Based Image Retrieval (CBIR) system for
solar imagery. This will be the first system of its kind in the field, and it is
primarily meant to facilitate the search of similar images of interest over the vast
image archives. While developing this real world system, we have faced many
interesting challenges and experiences from the unique aspects of solar data that
relate directly to new and important research questions in computer science,
data mining, and machine learning. To combat serious cases of information
2

overload from the data, metadata, and results, we have also had to develop
extensive visualization tools tailored to our specific data domain and research
applications. We present many different figures to showcase the importance of
these visualizations, and for supplemental information and visuals we direct the
reader to our website at http://dmlab.cs.montana.edu/solar/.
Section 2 begins with a brief overview of the SDO mission and our lab’s
sponsored involvement in the data analysis process. In Section 3 we highlight
several specific research projects, ongoing challenges, and the overall importance
of visualization. We then present our first fully operational CBIR system pro-
totype in Section 4 and discuss some of the capabilities it offers. Finally, we
conclude in Section 5 and summarize our current work and future directions.
2. SDO Data
2.1. The Solar Dynamics Observatory
The SDO is a 3-axis stabilized spacecraft in geo-synchronous orbit designed
to continuously capture full-disk images of the Sun. The purpose of the mission
is to gather knowledge about the mechanics of solar magnetic activity, from
the generation of the solar magnetic field, to the release of magnetic energy in
the solar wind, solar flares, coronal mass ejections (CMEs), and other events
[2]. Launched on February 11, 2010, the SDO mission is the first mission of
NASA’s Living With a Star (LWS) program, a long term project dedicated to
studying aspects of the Sun that significantly affect human life, with the goal
of eventually developing a scientific understanding sufficient for prediction [3].
The amount of solar data produced by the SDOmission is already larger than
all previous solar data archives combined [1]. It carries three independent in-
struments: the Extreme Ultraviolet Variability Experiment (EVE), which takes
measurements of the spectral distribution of extreme ultraviolet radiation prop-
agating from the sun [4], the Helioseismic and Magnetic Imager (HMI), which
captures the motion of the sun’s surface and measures the surface magnetic field
[5], and the Atmospheric Imaging Assembly (AIA), which captures full-disk im-
3

Figure 1: Visualizing layers of the Sun through various SDO data and metadata. Courtesy of
NASA/SDO and the AIA, EVE, and HMI science teams.
ages of the sun in ten separate electromagnetic wavelength bands across the
visual and ultra-violet spectrum, each selected to highlight specific elements of
known solar activity [6]. An example of how these various wavelengths represent
different layers of the Sun is shown in Figure 1, which also includes extrapolated
magnetic field lines on the rightmost slice.
Our work is primarily focused on the AIA images, as these are most ap-
plicable to a CBIR system and exhibit familiar “Sun-like” properties that hu-
man users of all levels of expertise can understand and identify. Each AIA
channel (centered on a specific wavelength or waveband) is uniquely (and arbi-
trarily) given a color-mapping from the grayscale data for easier visualization
and interpretation, especially when combined together like Figure 1. These
images are now the standard source for news and media outlets when report-
ing on current solar activity. All SDO (and NASA) data has an open-access
policy (http://data.nasa.gov/about/) and is available to the general pub-
4

lic through a variety of distribution channels. Several popular websites in-
clude http://sdo.gsfc.nasa.gov/data/ , http://www.solarmonitor.org/,
and http://www.helioviewer.org/, and data can even be accessed from smart
phones and desktop applications, such as the JHelioviewer software [7].
2.2. Feature Finding Team (FFT)
The issue of large-scale automated analysis was addressed by NASA, who
selected an international consortium of independent groups, named the SDO
Feature Finding Team (FFT), to produce a comprehensive set of automated
feature recognition modules [1]. As one of these modules, our group at MSU
is building a trainable module for use in our CBIR system for solar images.
All modules are provided with specialized access to the raw data pipeline for
near-real-time data analysis and event detection, which is greatly beneficial
but also challenging, as real-time constraints often impose limits on practical
effectiveness. Even though data is then made publicly accessible in a timely
fashion, because of the overall size, only a relatively small window of data is
held on disk for on-demand access, while long-term storage is achieved with
tape archives.
Metadata about solar events can be downloaded from the Heliophysics Event
Knowledgebase (HEK) [8]. The HEK is intended to be a cross-mission meta-
data repository of wide-ranging solar event reports and information. This
metadata can be downloaded manually through the official web interface at
http://www.lmsal.com/isolsearch, but after finding several limitations to-
wards large-scale event retrieval, we decided to develop our own software appli-
cation named QHEK (for “Query HEK”), available for free at http://dmlab.
cs.montana.edu/solar/qhek. The QHEK program uses the HEK’s web API
pagination feature to retrieve all the results for a given search period despite
the possibly lengthy duration of this period, while retaining all filter ability
available through the standard website interface. It also includes other benefi-
cial functionality, such as parsing the retrieved event data files and extracting
specific event attributes from the metadata. While most of the FFT modules
5

report event detections to the HEK, several produce much larger and extensive
metadata catalogs that are hosted separately in alternative formats, such as the
products of our trainable module, which are available through MSU.
Figure 2: An example of our parameter extraction process for a single image cell from a 16×16
grid-segmented image.
2.3. Image Parameters and Heatmap Plots
Our first obstacle towards a reliable CBIR system on this massive stream
of data was image parameter extraction. Since most solar phenomena typically
occupy relatively small regions of a full-disk AIA image, we first segment each
image by a static, data-agnostic 64×64 grid and then extract our image param-
eters from each individual image cell. Figure 2 shows an example of this process
(using a 16×16 grid on an H-α image) for a single cell and all ten extracted
image parameters, which are defined in Table 1. This results in 4,096 cells with
10 parameters each, or 40,960 total parameters (dimensions, attributes, etc.)
per image. In previous works, we evaluated a variety of possible numerical pa-
rameters extracted from the TRACE mission [9] images (prior to the SDO), and
the best ten were chosen based on their effective image representation as well
as efficient processing time [10, 11].
6

Figure 3: Heatmap plots of all ten image parameters for a single SDO AIA 94 A image, where
each plot is individually normalized from 0.0 (dark blue) to 1.0 (bright red). The original
image can be seen in the top row of Figure 7.
It is important to understand that the need to balance a high quality image
representation with computational and storage costs meant that additional and
more complex parameters were infeasible to use. However, with over 40,000
real-valued parameters per image, this is still an overwhelming amount of data
for a human to digest and conceptualize. Visualizing our image representations
as parameter “heatmap” plots proved a simple and effective way to gain an
immediate understanding of our data. An example heatmap plot of each pa-
rameter on the same SDO AIA 94 A image is shown in Figure 3, where each
image plot is now only 64×64 pixels (each pixel representing a single extracted
cell), and independently normalized from 0.0 (dark blue) to 1.0 (bright red).
Note for reference, the original solar image can be seen in the top of Figure 7.
We also created movies of these plots to empirically evaluate our parameters
ability to capture solar phenomena as they evolve over time – and they do so
with striking similarity to the real images, indicating we indeed have sensible
image representations. A sample of additional plots and movies are available
on our website (http://dmlab.cs.montana.edu/solar/).
7

3. Data Mining Results
Much like our parameter extraction, the efforts to empirically observe and
verify our data mining results are enhanced tremendously by visualizations.
While not all of our work is directly visual, such as high-dimensional indexing
techniques [13] to facilitate similarity search and spatiotemporal frequent pat-
tern mining [14] towards possible predictive abilities, almost all of it is related
to some sort of visualizable end result. In this section, we briefly highlight some
interesting aspects of our research that are aided directly through visualizations.
3.1. Supervised Classification
Before we can use any supervised machine learning techniques, we have to
have labeled data to train the learning algorithm. A data label categorizes a
data instance as a specific type (or class) of data, such as for example, indicating
that an area of a solar image contains an active region or coronal hole. Using
Table 1: Defining the MSU FFT image parameters, where L stands for the number of pixels
in the cell, zi is the i-th pixel value, m is the mean, and p(zi) is the grayscale histogram
representation of z at i. The fractal dimension is calculated based on the box-counting method
where N(e) is the number of boxes of side length e required to cover the image cell.
Label Name Equation
P1 Entropy E = −
∑
L−1i=0 p(zi) log2 p(zi)
P2 Mean m = 1L
∑
L−1i=0 zi
P3 Standard Deviation σ =√
1L
∑
L−1i=0 (zi −m)2
P4 Fractal Dimensionality D0 = lime→0logN(ǫ)
log 1
ǫ
P5 Skewness µ3 =∑
L−1i=0 (zi −m)3p(zi)
P6 Kurtosis µ4 =∑
L−1i=0 (zi −m)4p(zi)
P7 Uniformity U =∑
L−1i=0 p2(zi)
P8 Relative Smoothness R = 1− 11+σ2(z)
P9 Tamura Contrast *see Tamura [12]
P10 Tamura Directionality *see Tamura [12]
8

this set of labeled data instances, we can train an algorithm to classify non-
labeled instances. However, this is especially difficult in solar physics where no
ground truths are available, i.e., there does not exist an explicit 100% correct
list of every possible label for an image. Even the use of human-based labels
has shown to be difficult because of the inherent bias in each individual human
observer [15]. Therefore, the best we can do is utilize the data labels that do
exist, and then carefully oversee the training and testing process of classification
to ensure sensible and intended results. As we show next, this scrutinizing task
can be greatly aided with data label visualization.
During development of our module, prior to the SDO, we tested the effec-
tiveness of event-specific detection, thereby providing support not only for our
image representation quality, but also the independently produced event meta-
data used for supervised learning [16]. We trained several classifiers to identify
solar filaments, based on metadata created by another group of the SDO FFT,
the Advanced Automated Solar Filament Detection and Characterization Code
(AAFDCC) module [15]. Filament attributes reported by the AAFDCC, such
as the total length and orientation of each filament, were used to approximate
bounding boxes as data instance labels. These bounding boxes were then over-
layed on our fixed grid-based image cells, so that each individual image cell (data
instance) represented by its ten extracted image parameters could be given a
class label of filament or no-filament. Only after these labels are derived and
applied as our ground truth can supervised classification be performed. It also
enables supervised attribute evaluation, which we used to assess the general
importance of each of our image parameters for the classification tasks [11, 16].
The creation of these estimated bounding boxes followed well-known prob-
lems of producing noisy (or inaccurate) data labels [17]. In our case, sometimes
only a portion of an image cell shows the presence of a filament, or vice versa.
While such markings are perfectly useful for human experts, they cause inherent
challenges for machine learning algorithms. No matter which label is assigned
to a cell, it will more than likely be partially incorrect, and learning (training
and testing) will suffer. Therefore, we explored three different labeling methods
9

Figure 4: Three methods (from left-to-right) of derived data labels (top), where yellow cells
are labeled filaments, and the corresponding classification results (bottom), where green cells
indicate correct filament classification. Other colors explained in detail in text.
to assess the effects of this noise under different scenarios, shown in the top row
of Figure 4, where cells outlined in yellow are labeled as filaments, green are
non-filaments, and cells in blue are discarded from the dataset prior to training.
From left to right, the three labeling methods are based on the filaments’ center
locations (center), an estimated minimum bounding rectangle (MBR) roughly
containing most of the blob-shaped filament (est-MBR), and a combination of
the two which discards all cells in est-MBR that are not also center cells (sub-
MBR). Here we can clearly see how well our labels represent the actual filament
events in a single image, and we can already make hypotheses about the possible
effects of the different labeling methods.
The bottom of Figure 4 visualizes the classifier results, corresponding to the
above labeling method and the four possible outcomes of binary classification,
typically referred to as a confusion matrix or truth table. Here, cells are outlined
and color-coded as follows: 1) true positive, where the classifier and AAFDCC
module agreed on a filament label (in green), 2) false positive, where the classifier
labeled the cell a filament, but the AAFDCC module did not (in blue), and 3)
10

false negative, where the classifier did not label the cell as a filament, but the
AAFDCC module did (in red). The true negative cells – where the classifier and
AAFDCC module agreed the cell does not contain a filament – were ignored
here for a cleaner visualization.
With the help of these visualizations, we can quickly identify the strengths
and weaknesses of not only the trained classifiers, but also the inherently noisy
labeling methods based on bounding box regions. For example, in the est-MBR
column, notice that the large filament in the bottom of the image is actually clas-
sified better than the visualized confusion matrix (truth table) results indicate.
In other words, for this filament our classifier gets two cells “wrong” (shown in
blue) that are not labeled filament even though they clearly show presence of a
filament, and nine cells “wrong” (shown in red) that are labeled filament but do
not actually appear to contain one. These “errors” mean that our overall sta-
tistical accuracy, calculated from true positives and true negatives, is actually
lower than is clearly evident to a human observer.
The results of this work have led to new work (not yet ready for publication)
in more advanced classification and evaluation methods utilizing spatiotempo-
ral properties, which try to mitigate these specific errors. First, through actual
classification algorithms where we can incorporate spatial and temporal neigh-
borhoods to better predict the current cell, e.g., if all neighboring cells are
predicted as an event, then the likelihood the current cell also being that event
increases. Similarly, the cell is more likely to have the same label it previously
had, which helps smooth predictions over time. Second, through the modified
evaluation of said predictions based on the quality of labels. For example, this
can be applied either spatially, where misclassified cells near potentially noisy
labels are less erroneous than misclassifications in clearly unambiguous neigh-
borhood, or temporally, where a cell might be misclassified very shortly before
or after an actual event, which would be less severe than a misclassification
where no labels have changed for a long period of time.
11

(a) (b)
Figure 5: (a) An example of HEK metadata from six event types overlayed on an SDO AIA
image. (b) Clear bands of activity from active region and coronal hole events over time.
3.2. Data Labels from the HEK
While our previous label metadata was provided directly from an internal
module report, Figure 5(a) shows an example of six types of solar events reported
publicly to the HEK from fellow FFT modules, specifically: active regions (AR)
[18], coronal holes (CH) [18], filaments (FI) [15], flares (FL) [19], sigmoids (SG)
[1], and sunspots (SS) [1]. We color-code and overlay the events on the ap-
propriate SDO AIA images (by time and wavelength) and show the bounding
boxes, and when available the detailed event boundary outlines, referred to in
the community as “chain codes”. Here you can clearly see the variability in
characteristics of different types of events, such as size, shape, and location.
When these plots are viewed over time it especially highlights the differences
between event-specific reporting details, such as total event counts, evolution
and duration of event instances, and frequency of event reporting. An interest-
ing example of visualizing the event areas over time also empirically re-affirmed
the well-known (by solar science experts) bands of activity for active regions
and coronal holes, shown in Figure 5(b) where more event occurrences in the
same location results in a less transparent color.
12

The usefulness of large-scale datasets of solar images and events for the data
mining and machine learning communities cannot be overstated. By combining
the image parameters from our trainable module with the region-based event
labels from the HEK, we can create – for the first time in solar physics – a
standardized and ready-to-use solar image dataset for general image processing
research without requiring the necessary background knowledge and domain
expertise to properly prepare it. The first published version of this dataset
spans the first six months of 2012 and contains over 15,000 images and 24,000
events [20]. Follow up work to this has initiated the creation of event-specific
datasets of similar fashion over the entirety of the SDO mission [21].
One new and exciting use of these datasets is the discovery of spatiotemporal
frequent patterns. Given solar event instances as 2D polygonal regions that
continuously evolve in shape, size, and location over time, we can try to discover
patterns in the types of solar events that typically co-occur together in space
and time. Identifying spatiotemporal co-occurrence patterns on the Sun can help
us better understand the relationships between solar phenomena and contribute
real-world insights to the science of solar physics. By discovering and quantifying
patterns of events, such as the likelihood of common pre-cursors and lead-up
times, we can facilitate better modeling and forecasting of important space
weather events such as coronal mass ejections and solar flares, which impact
radiation in space and can reduce the safety of space and air travel, disrupt
worldwide communications and GPS, and damage power grids [22].
In Figure 6, we show an abstract example of event instances evolving over
time which correspond to specific types of events. For example, we can see that
event type e2 always occurs with event type e1, but not vice versa. Motivated by
this challenging task and the potential uses (well beyond solar data), we devel-
oped a novel framework for mining region-based spatiotemporal co-occurrence
patterns and rules [14, 23, 24]. In our framework, instances of event types are
modeled as 3D spatiotemporal objects, and we developed a set of measures to
assess the strength of spatiotemporal co-occurrence between instances of differ-
ent event types. Therefore, given a set of associated events, we can estimate
13

Figure 6: An abstract example of spatiotemporal events and possible patterns.
the likelihood of seeing another type of event in the near future. For example,
the likelihood of a solar flare occurring in a region of the Sun is higher if an
active region is present, and higher still if a sigmoid also exists. Furthermore,
to benchmark our algorithms we developed a synthetic dataset generator that
can be used to validate and verify the frequent pattern mining framework [25].
3.3. The Many Uses of Clustering
With the need to reduce our massive amounts of data for effective search and
retrieval without the use of data labels, we analyzed the practical effectiveness
of clustering algorithms on the image parameter values. With our clustering
approach we expect to be able to do two things. First, determine if we can find
clustered regions of interest (ROIs) that match sample event labels so we can
extrapolate this knowledge to new data and use it to prune away large amounts
of cells. Second, to be able to identify and track ROIs related to events that
are reported at a courser time granularity than our metadata. For example,
active regions and coronal holes are typically reported to the HEK every four
hours (with their exact locations), but the MSU trainable module runs at a
six minute cadence on the SDO AIA images. Therefore, it would be ideal to
maintain accurately tracked events in between specific event reports.
Given our ten extracted image parameters, we explored the use of k-means
clustering on each individual parameter and visualized the resulting clusters as
14
(a) (b)
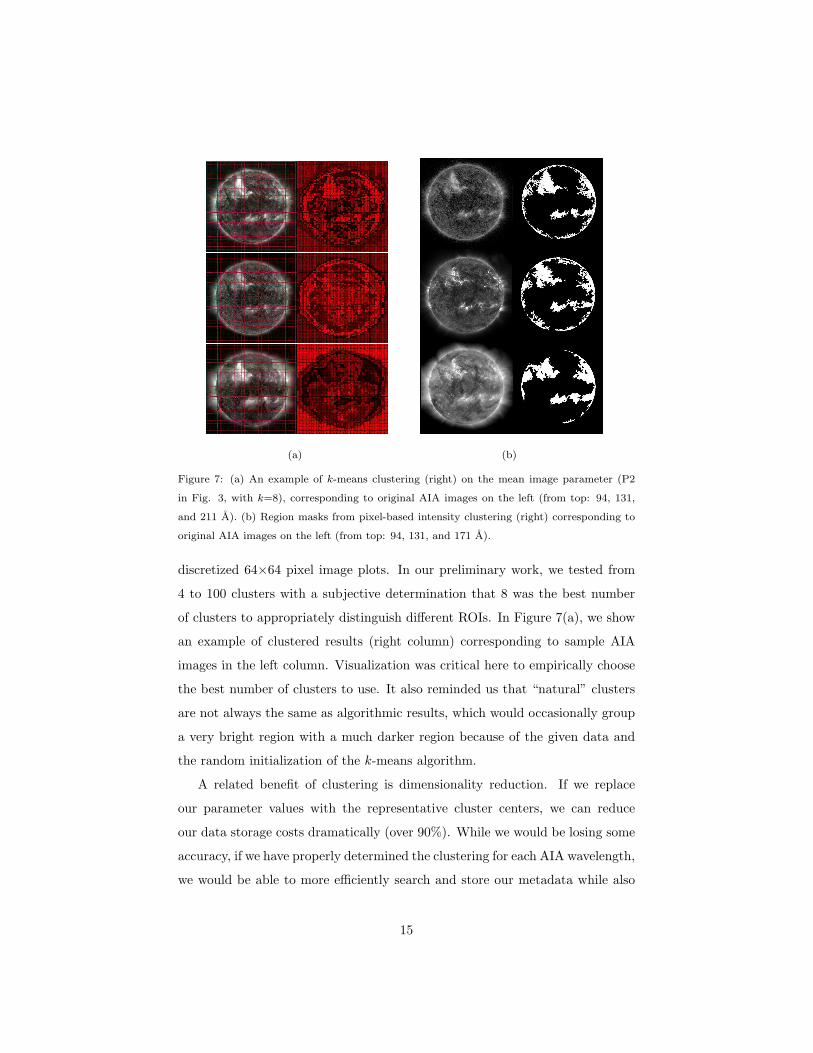
Figure 7: (a) An example of k-means clustering (right) on the mean image parameter (P2
in Fig. 3, with k=8), corresponding to original AIA images on the left (from top: 94, 131,
and 211 A). (b) Region masks from pixel-based intensity clustering (right) corresponding to
original AIA images on the left (from top: 94, 131, and 171 A).
discretized 64×64 pixel image plots. In our preliminary work, we tested from
4 to 100 clusters with a subjective determination that 8 was the best number
of clusters to appropriately distinguish different ROIs. In Figure 7(a), we show
an example of clustered results (right column) corresponding to sample AIA
images in the left column. Visualization was critical here to empirically choose
the best number of clusters to use. It also reminded us that “natural” clusters
are not always the same as algorithmic results, which would occasionally group
a very bright region with a much darker region because of the given data and
the random initialization of the k-means algorithm.
A related benefit of clustering is dimensionality reduction. If we replace
our parameter values with the representative cluster centers, we can reduce
our data storage costs dramatically (over 90%). While we would be losing some
accuracy, if we have properly determined the clustering for each AIA wavelength,
we would be able to more efficiently search and store our metadata while also
15

quickly discretizing all new incoming data. We could also perform much faster
region/image comparisons using simple logical operations.
Another clustering direction we explored was pixel-based intensity clustering
to identify ROIs for solar events (labeled from the HEK) that occur in predomi-
nantly brighter regions of the Sun. We employ an intensity-based seeded region
growing technique [26], where pixels of intensity greater than the 99.5th per-
centile for the image are selected as the ’seeds’ of the regions. The regions are
then grown by iteratively adding any pixels of intensity above the 80th percentile
of the image that are 8-way adjacent to the region, and terminating when no
new pixels are added. A radial filter is applied to the image, eliminating all
pixels that are not within a fixed distance of the image center (i.e., the Sun’s
radius). An example of this for several AIA channels is shown in Figure 7(b).
Figure 8: Intensity-based clusters from multiple passbands (94 A, 131 A, 171 A, and 211 A)
with outlined HEK events, where areas closer to white are covered by more masks.
This gives us a simple, but quite effective, way of capturing areas of the Sun
likely to contain “active” solar phenomena such as: active regions, sigmoids, and
flares. Over a three day test period from January 20-23, 2012, we compared the
reported event boundaries to the cells in the wavelength the event was reported,
16

and found over 95% of the reported area of flares, and over 99% of the reported
area of the other events captured by our mask. To visualize this technique and
empirically verify our statistical results, we display the overlapped intensity
regions for several SDO AIA wavelengths, where multiple overlapping masks
result in color closer to white. Then, by plotting the outlines of the HEK events
on such a masked image, we can easily see that the results of the algorithm
make practical sense [27] to the human observer, as shown in Figure 8.
One of the major reasons for our grid-based image representation is that
when the users query our CBIR system, they will most likely not be submitting a
full-sized SDO image, but rather a small section they are interested in querying.
When it comes to extrapolating the size of a region of a provided image to our
full-scale image representation, we have to be able to aggregate our cell values
in order to provide a better comparison between the query data and the image
data stored on our servers.
Figure 9: An example of parameter value scaling from a 64×64 to a 32×32 grid.
We explored the aggregation of our cell image parameters via various image
interpolation techniques (Bicubic interpolation, Bilinear interpolation, Lanczos
resampling, etc.) applied directly on our parameter values. Using these tech-
niques, we can interpolate down two “square sizes” without losing important
details of our data, i.e., going from a 64×64 grid down to a 32×32 grid and
for some uses all the way down to a 16×16 grid. We have also been able to
17

upscale data from a 32×32 grid to a 64×64 grid with few issues. An example of
down-scaled parameter plots is shown in Figure 9, along with the true parameter
values extracted from both grid sizes for visual comparison.
One of the biggest practical uses of this up-scaling and down-scaling is that
we can search for important regions/events in different sizes, allowing our CBIR
system to be more robust and capable of finding similarity at different scales,
not just basic one-to-one matches like most systems provide when using textural
image parameters.
4. Content-Based Image Retrieval
With the SDO image repository growing at a rate of over 70,000 images per
day and other solar physics tools like the HEK and Helioviewer only capable
of querying the repository for related (not similar) solar events, there exists
an intrinsic need for a system being able to query such a massive repository
for similar images (based on content), rather than similar events (based on
metadata characteristics). Being able to search through the SDO repository
using a particular image will provide users the ability to discover related events
by finding similar images that occur at different points in time, allowing for
a completely different way of searching through solar data and considerably
increasing the efficiency of finding visually similar solar events over time.
The purpose of CBIR systems is to analyze and retrieve images based on
similarity of their contents. In our case, the contents are described by the
64×64 grid of cells of image parameters explained previously. Historically, CBIR
systems have facilitated general purpose image retrieval tasks like Photobook
[28], Candid [29], Chabot [30], and QBIC [31] from IBM. These systems rely
on content extracted from images, such as shape, color, or texture to match
complete similar images. Newer developments in the CBIR field explore fuzzy-
matching [32], binning-strategies [33], boosting methods [34], as well as more
integrated tools [35]. All these systems focus on using complete-image similarity
as a basis for the retrieval, which translates to comparing the similarity of
complete full-disk SDO AIA images, and is therefore our starting point as well.
18

In order to provide solar scientists, computer scientists, student researchers,
other interested members of the community with the ability to query the entire
SDO image repository, we have developed the SDO CBIR system, the first-
ever of its kind for solar physics. Thanks to NASA’s freedom of information
policies, which dictate that all science products from the SDO mission (and
others) must be publicly available and accessible, we have put special emphasis
in providing access to all our back-end metadata in a variety of forms, from
the many visualizations described in this paper, to full access of our image
parameter metadata through a future API release. We also provide a bridge
linking to other solar science tools, facilitating easier access to other data and
metadata products over the same time frame being explored.
Science CBIR systems are very domain specific and have only a small subset
of researchers that use them. Take for example medical CBIR systems [36] used
for aiding in the detection of cancer and related tasks that are performed by a
very select group of individuals. We are presented with the unique opportunity
of creating a system that is targeted for use by both the science community
and a broader set of users with little to no science background. Our CBIR
system has been available for public use since the summer of 2013 [37], and
can be accessed at: http://cbsir.cs.montana.edu/sdocbir/. In the follow-
ing paragraphs we discuss several key points of development, which specifically
emphasize visualization, leading to the current state of our SDO CBIR system.
4.1. Similarity Plots
The first hurdle our system encountered was that because of such a fast
cadence of images, we have high-similarity between temporally adjacent images.
Returning the most similar image is an intrinsic characteristic of a properly
functioning CBIR system, but our domain-specific problem of too many similar
images makes this characteristic a less desired effect. In preliminary analyses,
we proposed some insights into mitigating this general issue within the system
[38], and a fully-fledged production system can also include simple date/time
search filters to supplement the underlying CBIR system mechanisms.
19

Figure 10: Four examples of whole-image similarity matrix plots over three days from Jan 20
- 23, 2012. Each has a unique combination of AIA passband, extracted image parameter, and
metric distance function: 94 A, P2, Euclidean (top-left); 131 A, P8, Chebyshev (top-right);
193 A, P8, cosine (bottom-left); and 171 A, P9, Chebyshev (bottom-right).
By visualizing full-disk (complete image) similarity plots of images over time,
such as the examples in Figure 10, we can get a clear idea of just how similar
temporal neighborhoods of images can be. These plots are created by taking a
time-series of images (in this case over 800 sequential images at our six minute
cadence), and comparing the distance (similarity) of each image representation
to every other image representation in a 2D matrix setup, where values are
normalized from 0.0 (dark blue) to 1.0 (bright red). Each plot uses images from
a single SDO AIA channel and similarity is calculated using a chosen distance
metric on a single image parameter for the entire image (4,096 values). A
quite interesting discovery while analyzing these plots is that we can actually
identify the occurrence of solar phenomena which greatly disrupt the otherwise
reasonably deterministic range of highly time-dependent similarity. In Figure
10, a large flare occurs near the end (right-side) of the specific time range shown.
20

4.2. User Interface
As the main component of our system, our retrieval mechanism is designed
to provide the top nine query results on the first screen, and provides tabs for
users to browse (or export) up to 25 additional pages of results. This provides
users with enough initial results to find relevant images for their query as well
as the ability to refine their results by re-querying using returned images. By
also supporting user accounts, we allow people to store their query sessions to
return later, as well as share specific “query states” with other users so they
can get back to the same query with the simple share of a web link. Figure 11
shows the results of an example query within our system.
Figure 11: The basic query interface for our SDO CBIR system.
Visualization is vital for researchers to truly understand the benefits of our
image parameters and applied CBIR system. Figure 3 showed how we are
representing the image “content” via statistical image parameters. Such vi-
sualizations are also available to users to fully observe how our system works
and what is matching the most on returned images. We have designed a web-
interface that is similar to other tools used by solar physicists in order to pro-
vide them with a familiar environment they can use anywhere with an Internet
connection. As a product of the ImageFARMER framework [39] (available at
http://www.imagefarmer.org/), the Web-UI plugin was developed in parallel
21

to this system. This web-based front-end allows the user to access dynamically
generated on-demand parameter histograms and heatmap plots from any image
in the system. Another visualization offered online and not yet discussed is a
straight-forward but quite helpful time-series plot for a given query region, time
interval, and image parameter, as shown in Figure 12. All these data products
are available in a convenient overlay using CSS and AJAX with a PHP/Python
backend allowing our web-based application to be user friendly, aesthetically
pleasing, and as powerful as a regular desktop application.
Figure 12: An example time-series plot overlay within the CBIR system.
4.3. Advances
Thus far our approaches have only begun to scratch the surface of what is
possible, and we are still bridging the gaps between the data mining, information
retrieval, and image processing communities of computer science and the data-
rich field of solar physics. As pioneering computer scientists, our current SDO
CBIR system is only the first (albeit major) step towards our future plans to
create a comprehensive solar CBIR system that will be able to search across
all available (and future) solar image repositories. This task will force us to
tackle difficult research problems with novel solutions surrounding user-defined
region-based querying over large-scale and disparate sources of solar image data.
Since the release of the first version of our CBIR system, we have continued
working on expanding its features and capabilities. Our primary objective is
22

the addition of region-based querying capabilities to the existing codebase, with
some preliminary results already published [40, 41] using our recently released
large-scale multi-event solar dataset [20, 21] previously mentioned. We have
also turned our focus to new Big Data technologies to scale our system over
longer time spans with more optimal retrieval performance as we proposed on
[42]. Finally, we are aiming at providing an all-purpose API for researchers to
access our CBIR system data products and results in the coming months.
5. Conclusion
This paper has presented an overview of some of our recent works in solar
physics data mining where an emphasis on visualization has dramatically aided
the understanding and presentation of data, metadata, and results. Our data
mining lab at Montana State University continues to advance interdisciplinary
work with solar physicists to provide useful tools for scientists and the public
at-large interested in solar data.
Through this work we have identified and begun investigating interesting
and practical research questions in many topics of data mining, such as: data
labeling, classification, clustering, frequent pattern mining, high-dimensional
indexing, similarity search, and content-based image retrieval. We are pleased
to play a pioneering role in large-scale data mining in solar physics and expect
many fellow computer scientists to join the efforts in the coming years.
Acknowledgements
This work was supported in part by two NASA Grant Awards: NNX09AB03G
and NNX11AM13A. A special thanks to members of the LMSAL and Har-
vard/CFA organizations for managing the SDO data pipeline, and to the other
SDO FFT members for guidance and patience while lending their solar physics
(and module) expertise when needed.
23

References
[1] P. Martens, G. Attrill, A. Davey, A. Engell, S. Farid, P. Grigis, et al., Com-
puter vision for the solar dynamics observatory (SDO), in: P. Chamberlin,
W. D. Pesnell, B. Thompson (Eds.), The Solar Dynamics Observatory,
Springer, 2012, pp. 79–113.
[2] W. Pesnell, B. Thompson, P. Chamberlin, The solar dynamics observatory
(SDO), Solar Physics 275 (2012) 3–15.
[3] G. L. Withbroe, Living With a Star, in: AAS/Solar Physics Division Meet-
ing #31, Vol. 32 of Bulletin of the American Astronomical Society, 2000,
p. 839.
[4] T. Woods, F. Eparvier, R. Hock, A. Jones, D. Woodraska, et al., Extreme
ultraviolet variability experiment (EVE) on the solar dynamics observatory
(SDO): Overview of science objectives, instrument design, data products,
and model developments, Solar Physics 275 (2012) 115–143.
[5] P. Scherrer, J. Schou, R. Bush, A. Kosovichev, R. Bogart, et al., The he-
lioseismic and magnetic imager (HMI) investigation for the solar dynamics
observatory (SDO), Solar Physics 275 (2012) 207–227.
[6] J. Lemen, A. Title, D. Akin, P. Boerner, C. Chou, et al., The atmospheric
imaging assembly (AIA) on the solar dynamics observatory (SDO), Solar
Physics 275 (2012) 17–40.
[7] D. Muller, B. Fleck, G. Dimitoglou, B. Caplins, D. Amadigwe, J. Ortiz,
B. Wamsler, A. Alexanderian, V. Hughitt, J. Ireland, JHelioviewer: Visu-
alizing large sets of solar images using JPEG 2000, Computing in Science
and Engineering 11 (5) (2009) 38–47.
[8] N. Hurlburt, M. Cheung, C. Schrijver, L. Chang, S. Freeland, S. Green,
C. Heck, A. Jaffey, A. Kobashi, D. Schiff, et al., Heliophysics event knowl-
edgebase for the solar dynamics observatory (SDO) and beyond, in: The
Solar Dynamics Observatory, Springer, 2012, pp. 67–78.
24

[9] B. Handy, L. Acton, C. Kankelborg, C. Wolfson, D. Akin, et al., The
transition region and coronal explorer, Solar Physics 187 (1999) 229–260.
[10] J. M. Banda, R. A. Angryk, An experimental evaluation of popular image
parameters for monochromatic solar image categorization, in: The 23rd
Florida Artificial Intelligence Research Society Conference (FLAIRS), 2010,
pp. 380–385.
[11] J. M. Banda, R. A. Angryk, Selection of image parameters as the first
step towards creating a CBIR system for the solar dynamics observatory,
in: International Conference on Digital Image Computing: Techniques and
Applications (DICTA), 2010, pp. 528–534.
[12] H. Tamura, S. Mori, T. Yamawaki, Texture features corresponding to visual
perception, IEEE Transactions on Systems, Man, and Cybernetics 8 (6)
(1978) 460–472.
[13] M. A. Schuh, T. Wylie, R. A. Angryk, Improving the performance of high-
dimensional knn retrieval through localized dataspace segmentation and
hybrid indexing, in: New Trends in Databases and Information Systems,
Springer International Publishing, 2014, pp. 344–357.
[14] K. G. Pillai, R. A. Angryk, J. M. Banda, M. A. Schuh, T. Wylie, Spatio-
temporal co-occurrence pattern mining in data sets with evolving regions,
in: Data Mining Workshops (ICDMW), 2012 IEEE 12th International Con-
ference on, IEEE, 2012, pp. 805–812.
[15] P. N. Bernasconi, D. M. Rust, D. Hakim, Advanced automated solar fila-
ment detection and characterization code: Description, performance, and
results, Solar Phys.228 (1-2) (2005) 97–117.
[16] M. Schuh, J. Banda, P. Bernasconi, R. Angryk, P. Martens, A comparative
evaluation of automated solar filament detection, Solar Physics 289 (7)
(2014) 2503–2524.
25

[17] S. Shekhar, S. Chawla, Spatial Databases: A Tour., Prentice Hall, New
Jersey, 2003.
[18] C. Verbeeck, V. Delouille, B. Mampaey, R. De Visscher, The SPoCA-suite:
Software for extraction, characterization, and tracking of active regions and
coronal holes on EUV images, Astronomy and Astrophysics 561 (2014) 29.
[19] H. I. Winter, Mining solar big data with the flare detective, in: Invited
Talk, Joint Statistical Meeting, American Statistical Association, 2014.
[20] M. Schuh, R. Angryk, K. Ganesan Pillai, J. Banda, P. Martens, A large
scale solar image dataset with labeled event regions, Proc. International
Conference on Image Processing (ICIP) (2013) 4349–4353.
[21] M. A. Schuh, R. A. Angryk, Massive labeled solar image data benchmarks
for automated feature recognition, in: 2014 IEEE International Conference
on Big Data (Big Data), IEEE, 2014, pp. 53–60.
[22] S. Langhof, T. Straume, Workshop report on space weather risks and soci-
ety, Report of a workshop sponsored by and held at NASA Ames Research
Center.
[23] K. G. Pillai, R. A. Angryk, J. Banda, T. Wylie, M. A. Schuh, Spatiotem-
poral co-occurrence rules, in: New Trends in Databases and Information
Systems, Springer International Publishing, 2014, pp. 27–35.
[24] K. G. Pillai, R. A. Angryk, B. Aydin, A filter-and-refine approach to mine
spatiotemporal co-occurrences, in: Proceedings of the 21st ACM SIGSPA-
TIAL International Conference on Advances in Geographic Information
Systems, ACM, 2013, pp. 114–123.
[25] B. Aydin, R. A. Angryk, K. Ganesan Pillai, ERMO-DG: Evolving region
moving object dataset generator, in: Proceedings of the 27th International
Florida Artificial Intelligence Research Society Conference (FLAIRS’14),
AAAI Press, 2014, pp. 321–326.
26

[26] R. Adams, L. Bischof, Seeded region growing, IEEE Transactions on Pat-
tern Analysis and Machine Intelligence 16 (1994) 641–647.
[27] A. Benkhalil, V. Zharkova, S. Zharkov, S. Ipson, Active region detection
and verification with the solar feature catalogue, Solar Physics 235 (2006)
87–106.
[28] A. Pentland, R. W. Picard, S. Sclaroff, Photobook: Content-based manipu-
lation of image databases, International Journal of Computer Vision 18 (3)
(1996) 233–254.
[29] V. E. Ogle, M. Stonebraker, Chabot: Retrieval from a relational database
of images, Computer 28 (9) (1995) 40–48.
[30] P. M. Kelly, T. M. Cannon, D. R. Hush, Query by image example: the
CANDID approach, SPIE Vol. 2420 Storage and Retrieval for Image and
Video Databases III (1995) 238–248.
[31] M. Flickner, H. Sawhney, W. Niblack, J. Ashley, Q. Huang, B. Dom,
M. Gorkani, J. Hafner, D. Lee, D. Petkovic, et al., Query by image and
video content: The QBIC system, Computer 28 (9) (1995) 23–32.
[32] J. A. Piedra-Fernandez, G. Ortega, J. Z. Wang, M. Canton-Garbın, Fuzzy
content-based image retrieval for oceanic remote sensing, Transactions on
Geoscience and Remote Sensing 52 (9) (2014) 5422–5431.
[33] A. Kamel, Y. B. Mahdi, K. F. Hussain, Computer science department,
faculty of computers and information, assiut university, assiut, egypt, in:
20th Int Conf on Image Processing (ICIP), IEEE, 2013, pp. 2597–2601.
[34] M. S. Kumar, Y. Kumaraswamy, A boosting frame work for improved
content based image retrieval, Indian Journal of Science and Technology
6 (4) (2013) 4312–4316.
[35] J. S. Hare, S. Samangooei, D. P. Dupplaw, OpenIMAJ and ImageTerrier:
Java libraries and tools for scalable multimedia analysis and indexing of
27

images, in: Proceedings of the 19th ACM international conference on Mul-
timedia, ACM, 2011, pp. 691–694.
[36] H. Muller, N. Michoux, D. Bandon, A. Geissbuhler, A review of content-
based image retrieval systems in medical applications - clinical benefits and
future directions, I. J. Medical Informatics 73 (1) (2004) 1–23.
[37] M. Schuh, J. Banda, R. Angryk, P. Martens, Introducing the first publicly
available content-based image-retrieval system for the solar dynamics ob-
servatory mission, in: AAS/SPD Meeting, Vol. 44 of Solar Physics Division
Meeting, 2013, p. #100.97.
[38] J. M. Banda, M. A. Schuh, T. Wylie, P. McInerney, R. A. Angryk, When
too similar is bad: A practical example of the solar dynamics observatory
content-based image-retrieval system, in: New Trends in Databases and
Information Systems, Springer International Publishing, 2014, pp. 87–95.
[39] J. M. Banda, R. A. Angryk, P. C. Martens, Image FARMER: Introducing a
data mining framework for the creation of large-scale content-based image
retrieval systems., International Journal of Computer Applications 79 (13)
(2013) 8–13.
[40] J. M. Banda, C. Liu, R. A. Angryk, Region-based querying using descriptor
signatures for solar physics, in: IEEE International Conference on Data
Mining Workshops (ICDMW 2013) Astroinformatics, 2013, pp. 1–7.
[41] J. M. Banda, R. A. Angryk, Large-scale region-based multimedia retrieval
for solar images, in: Artificial Intelligence and Soft Computing, Springer,
2014, pp. 649–661.
[42] J. M. Banda, M. A. Schuh, R. A. Angryk, K. G. Pillai, P. McInerney, Big
data new frontiers: Mining, search and management of massive repositories
of solar image data and solar events, in: New Trends in Databases and
Information Systems, Springer, 2014, pp. 151–158.
28