
On the resolution dependence of micromechanical contact models
13
Wear 262 (2007) 42–54 On the resolution dependence of micromechanical contact models Giorgio Zavarise ∗ , Mauro Borri-Brunetto, Marco Paggi Politecnico di Torino, Department of Structural and Geotechnical Engineering, Corso Duca degli Abruzzi 24, 10129 Torino, Italy Received 23 September 2005; received in revised form 13 March 2006; accepted 21 March 2006 Available online 19 May 2006 Abstract In this study we deal with the problem of normal contact between rough surfaces. A power spectral density of the asperity heights which obeys a power-law within a given range of wavelengths has been considered. Hence, the resolution dependence of the statistical parameters computed according to the random process theory, of the plasticity index and of the contact predictions provided by stochastic and fractal contact models is discussed and emphasized. It is demonstrated that the plasticity index diverges to infinity when the lower cut-off length of the system vanishes, whereas the slope of the real contact area versus normal load curve tends to zero. In this limit case stochastic and fractal approaches predict either a vanishing real contact area or an infinite normal pressure, regardless of the asperity deformation assumptions. On the other hand, when a non-zero lower cut-off length exists, finite contact predictions can be obtained by applying the contact models at that scale length. This possibility is numerically investigated and, comparing contact results of several models, it is shown that the plasticity index plays an important role for the characterization of the interface mechanical response. © 2006 Elsevier B.V. All rights reserved. Keywords: Contact mechanics; Stochastic contact models; Fractal contact models; Plasticity index; Functional filtering technique 1. Introduction The importance of the prediction of the real contact area has been clearly recognized since from the earliest studies on contact mechanics. Due to the roughness of real surfaces, the real con- tact area covers only a small fraction of the nominal one. Many surfaces involved in engineering applications show a roughness ranging from the milli- to the nano-scale. Hence, a proper de- scription of the real surface geometry can improve the prediction of the real contact area, as experimentally observed by Buzio et al. [1] for the study of contact problems at the nanometric scale. Starting from the 1960s, many contact models based on a statistical description of the contact geometry have been pro- posed. Among them, due to their diffusion, the Greenwood and Williamson’s elastic model (GW) [2], the Mikic’s elastic model (M) [3] and the Cooper, Mikic and Yovanovich’s plastic model (CMY) [4] have to be cited. More recent theories pointed out the fact that the statisti- cal parameters used in the stochastic contact models are scale- ∗ Corresponding author. Tel.: +39 011 564 4818; fax: +39 011 564 4899. E-mail address: [email protected] (G. Zavarise). dependent, being function of the profilometer resolution. As a result, contact predictions are in turn resolution-dependent. Borri-Brunetto et al. [5] with an elastic numerical analysis clearly demonstrated that, considering a rough surface with frac- tal properties, when more details of the surface are taken into account, what seemed to be a compact contact area breaks up progressively into clusters of smaller and smaller spots and the total predicted real contact area decreases. This suggests that, in the limit of a vanishing sampling interval, i.e. an infinite resolu- tion of the profilometer used for scanning the surface, the contact would consist in an infinite number of infinitesimal contact spots with a zero total area. More recently, similar results were also derived by Ciavarella et al. [6], Ciavarella and Demelio [7] and by Persson et al. [8]. The present study is undertaken to get some insight into the possibility to derive multi-scale contact predictions from the application of the classical stochastic contact models. In fact, the extension of the applicability of the contact models down to the nano-scale is certainly an open issue which re- quires a debate. Most of these models were in fact originally conceived and set up for the analysis of the normal contact problem at the micro-scale and the subsequent application to problems characterized by a lower sampling interval needs to be discussed. 0043-1648/$ – see front matter © 2006 Elsevier B.V. All rights reserved. doi:10.1016/j.wear.2006.03.044
Transcript of On the resolution dependence of micromechanical contact models

A
aadwenic©
K
1
bmtsrsoes
spW((
c
0d
Wear 262 (2007) 42–54
On the resolution dependence of micromechanical contact models
Giorgio Zavarise∗, Mauro Borri-Brunetto, Marco PaggiPolitecnico di Torino, Department of Structural and Geotechnical Engineering, Corso Duca degli Abruzzi 24, 10129 Torino, Italy
Received 23 September 2005; received in revised form 13 March 2006; accepted 21 March 2006Available online 19 May 2006
bstract
In this study we deal with the problem of normal contact between rough surfaces. A power spectral density of the asperity heights which obeyspower-law within a given range of wavelengths has been considered. Hence, the resolution dependence of the statistical parameters computed
ccording to the random process theory, of the plasticity index and of the contact predictions provided by stochastic and fractal contact models isiscussed and emphasized. It is demonstrated that the plasticity index diverges to infinity when the lower cut-off length of the system vanishes,hereas the slope of the real contact area versus normal load curve tends to zero. In this limit case stochastic and fractal approaches predict
ither a vanishing real contact area or an infinite normal pressure, regardless of the asperity deformation assumptions. On the other hand, when aon-zero lower cut-off length exists, finite contact predictions can be obtained by applying the contact models at that scale length. This possibilitys numerically investigated and, comparing contact results of several models, it is shown that the plasticity index plays an important role for the
haracterization of the interface mechanical response.2006 Elsevier B.V. All rights reserved.
els; P
dr
ctaptttwwdb
tt
eywords: Contact mechanics; Stochastic contact models; Fractal contact mod
. Introduction
The importance of the prediction of the real contact area haseen clearly recognized since from the earliest studies on contactechanics. Due to the roughness of real surfaces, the real con-
act area covers only a small fraction of the nominal one. Manyurfaces involved in engineering applications show a roughnessanging from the milli- to the nano-scale. Hence, a proper de-cription of the real surface geometry can improve the predictionf the real contact area, as experimentally observed by Buziot al. [1] for the study of contact problems at the nanometriccale.
Starting from the 1960s, many contact models based on atatistical description of the contact geometry have been pro-osed. Among them, due to their diffusion, the Greenwood andilliamson’s elastic model (GW) [2], the Mikic’s elastic model
M) [3] and the Cooper, Mikic and Yovanovich’s plastic model
CMY) [4] have to be cited.More recent theories pointed out the fact that the statisti-al parameters used in the stochastic contact models are scale-
∗ Corresponding author. Tel.: +39 011 564 4818; fax: +39 011 564 4899.E-mail address: [email protected] (G. Zavarise).
fdqcppd
043-1648/$ – see front matter © 2006 Elsevier B.V. All rights reserved.oi:10.1016/j.wear.2006.03.044
lasticity index; Functional filtering technique
ependent, being function of the profilometer resolution. As aesult, contact predictions are in turn resolution-dependent.
Borri-Brunetto et al. [5] with an elastic numerical analysislearly demonstrated that, considering a rough surface with frac-al properties, when more details of the surface are taken intoccount, what seemed to be a compact contact area breaks uprogressively into clusters of smaller and smaller spots and theotal predicted real contact area decreases. This suggests that, inhe limit of a vanishing sampling interval, i.e. an infinite resolu-ion of the profilometer used for scanning the surface, the contactould consist in an infinite number of infinitesimal contact spotsith a zero total area. More recently, similar results were alsoerived by Ciavarella et al. [6], Ciavarella and Demelio [7] andy Persson et al. [8].
The present study is undertaken to get some insight intohe possibility to derive multi-scale contact predictions fromhe application of the classical stochastic contact models. Inact, the extension of the applicability of the contact modelsown to the nano-scale is certainly an open issue which re-uires a debate. Most of these models were in fact originally
onceived and set up for the analysis of the normal contactroblem at the micro-scale and the subsequent application toroblems characterized by a lower sampling interval needs to beiscussed.
G. Zavarise et al. / Wear
Nomenclature
a contact spot mean radiusAn = L2 nominal contact areaAr real contact aread normal separationdv indentor diagonalD profile fractal dimensionE composite Young’s modulusHv Vickers hardnessm mean absolute slope of the profilemn nth moment of the power spectral density functionnp peaks linear densityns summits surface densityN number of contact spotspn = P/An apparent normal pressureP normal loads asperity base areascr critical size of the contact spotsL largest asperity contact area
Greek lettersα hardness exponentδ sampling interval or lower wavelength� fractal dimension of the contact domainρp peaks radius of curvatureρs summits radius of curvatureσ r.m.s. roughnessσm r.m.s. slopeσκ r.m.s. curvatureψGW Greenwood and Williamson’s plasticity indexψM Mikic’s plasticity indexψP plasticity index based on the Persson’s modelψSY Sridhar and Yovanovich’s plasticity indexωu upper frequency bound of the spectrum
thltdtcmpi
ssila
wo
nmtbii
cAtttsoatamdseppa
2p
it(
m
wuppu
ω
ItpSasi
ωl lower frequency bound of the spectrum
In this paper the study of the problem of normal contact be-ween rough surfaces having a power spectral density of asperityeights which obeys a power-law within a given range of wave-engths is proposed. Fractal surfaces produced by fracture areypical examples of these conditions [9]. Hence, the resolutionependence of the statistical parameters computed according tohe random process theory, of the plasticity index and of theontact predictions provided by stochastic and fractal contactodels are investigated. The study of the dependence of the
lasticity index on the resolution is unprecedented and is a keyssue of this work.
It is demonstrated that, when the lower cut-off length of theystem vanishes, anomalous contact behaviors are predicted bytochastic and fractal models: the plasticity index diverges to
nfinity, whereas the slope of the real contact area versus normaload curve tends to zero. The common trends obtained from thepplication of the stochastic and fractal models permit, in somett
262 (2007) 42–54 43
ay, to fill the gap between these two approaches that are veryften considered as mathematically incompatible.
Moreover, when a non-zero lower cut-off length exists, fi-ite contact predictions can be obtained by applying the contactodels at that resolution. This possibility is numerically inves-
igated and, from a direct comparison of the results providedy the contact models considered, it is shown that the plastic-ty index plays an important role for the characterization of thenterface mechanical response.
Finally, we remark that both elastic and plastic stochasticontact models are compared in this note. As demonstrated byrchard, according to fractal concepts [10] both elastic and plas-
ic deformation hypotheses can be independently used to explainhe mechanical response of an interface. The apparent inconsis-ency between these two approaches is due to the fact that thetochastic contact models provide a mesoscopical descriptionf the whole interface behavior, instead of a micromechanicalnalysis of each single asperity in contact. Any statistical con-act model, in fact, accumulates statistically the contribution ofll the contact points and the integration process tends to di-inish the deviations between the models. This may suggest a
ominance by the statistics rather than by the deformation as-umptions. Hence, the comparison among contact models withlastic or plastic deformation assumptions is proposed with therecise intent to show how large is the scatter in the contactredictions when models with completely different deformationssumptions are applied to the same problem.
. Resolution dependence of the statistical roughnessarameters
According to Nayak [11], the statistical parameters character-zing an isotropic random Gaussian surface can be expressed inerms of the moments, mn, of the power spectral density, (ω),PSD) of any profile extracted from the surface
n =∫ ωl
ωu
ωn(ω) dω (1)
here the integration limits ωu and ωl denote, respectively, thepper and lower surface frequency bounds of the spectrum. Thearameter n in Eq. (1) is a positive integer number. These high-ass and low-pass cut-offs can also be expressed in terms of thepper and lower wavelengths, L, and δ, [12]
u = 2π
L, ωl = 2π
δ(2)
n the sequel we shall assume, without any loss of generality,hat the lower cut-off length, δ, would correspond to the sam-ling interval of the profilometer used for scanning the surface.imilarly, the upper wavelength, L, will correspond to the char-cteristic size of the specimen. As a result, by considering aquare surface of side equal to L, the nominal contact area, An,s equal toL2. Furthermore, Sayles and Thomas [13] have shown
hat in a wide number of natural and man-made rough surfaceshe PSD obeys a power-law of the form(ω) = Kω−(5−2D), 1 < D < 2 (3)
4 Wear
wdE
m
Eω
t
Ctt
σ
Mscic
wFtsasa
(
(
stp
3p
tecbppot
PYh
E
ws
mprripm
3
iamtr[a
4 G. Zavarise et al. /
here D is the profile fractal dimension and K is a constantepending on the roughness amplitude. Hence, by introducingq. (3) into Eq. (1), we have
n = K
∫ ωl
ωu
ωn−(5−2D) dω (4)
q. (4) can be integrated for the first three non-zero moments. Ifl � ωu, i.e. δ � L, which is a condition usually satisfied, then
he following approximate expressions can be obtained [12]
m0 ∼= −K2D− 4
(2π
L
)2D−4
, m2 ∼= K
2D− 2
(2π
δ
)2D−2
,
m4 ∼= K
2D
(2π
δ
)2D
(5)
onsequently, the r.m.s. roughness, σ, the r.m.s. slope, σm, andhe r.m.s. curvature, σκ, of surface heights can be computed ashe square root of the above spectral moments
= √m0, σm = √
m2, σκ = √m4 (6)
oreover, the summits surface density, ns, the peak linear den-ity, np, the summits radius of curvature, ρs, the peaks radius ofurvature, ρp, and the mean absolute slope, m, can be expressedn terms of the spectral moments according to the random pro-ess theory [11]
ns = 2π
3√
3
m4
m2= 1
6π√
3
(D− 1
D
)1
δ2 ⇒ ns ∝ δ−2,
np = 1
2π
√m4
m2=√D− 1
D
1
δ⇒ np ∝ δ−1,
ρs = 3
8
√π
m4= 3
√2πD
8(2π)D√KδD ⇒ ρs ∝ δD,
ρp = 1√2πm4
=√
2D
(2π)D√
2πKδD ⇒ ρp ∝ δD,
m =√πm2/2 =
√π/2 δ1−D ⇒ m ∝ δ1−D (7)
here the dependencies on δ have been suitably evidenced.rom these equations it is possible to recognize that none of
he above statistical parameters is an intrinsic property of theurface. As a main consequence, as pointed out by Majumdarnd Bhushan [14], statistical parameters strongly depend on theampling length, δ. More precisely, the following dependenciesre found from Eqs. (6) and (7):
1) The height parameters, such as σ and similar statisticalparameters, depend on the higher cut-off length, L. Thisimplies that the surface profiles can be considered as non-stationary random processes, as also experimentally foundby Sayles and Thomas [15]. Furthermore, the relation-ship between m0 and L in Eq. (5) would imply that, inthe absence of a higher cut-off length, i.e. for an infinite
surface with L → ∞, the r.m.s. roughness would tend toinfinity.2) The spatial parameters ns, np, ρs, ρp and m depend on thelower cut-off length, i.e. on the sampling interval δ. In par-
a
rr
262 (2007) 42–54
ticular, for a vanishing lower cut-off length, i.e. for δ → 0,ns, np and m tend to infinity, whereas ρs and ρp tend to zero.
Since these statistical parameters are the main input of thetochastic contact models, in the next section we elucidate howhe above-mentioned resolution dependence may affect contactredictions.
. Resolution dependence of the contact predictionsrovided by stochastic contact models
Depending on elastic, plastic or elasto-plastic assumptions onhe mechanism of asperity deformation, stochastic contact mod-ls can be used to predict the number of contact spots, N, the realontact area, Ar, and the total load, P, for a given separation, d,etween the mean planes of the rough surfaces in contact. Theseredictions depend on both the mechanical and the geometricalarameters of rough surfaces. Typical functional dependenciesf the results provided by stochastic contact models can be writ-en as
N = N(d, σ, np, ns), Ar = Ar(d, σ),
P = P(d, σ, np, ns, ρp, ρs,m,E,Hv) (8)
arameters E and Hv denote, respectively, the compositeoung’s modulus of the materials in contact and the Vickersardness of the softer material
=(
1 − ν21
E1+ 1 − ν2
2
E2
)−1
, Hv = min (Hv,1, Hv,2)
(9)
here ν is the Poisson’s ratio and subscripts 1 and 2 refer, re-pectively, to contact surface 1 and 2.
Since all the statistical parameters involved in the above-entioned relations depend on the lower cut-off length, contact
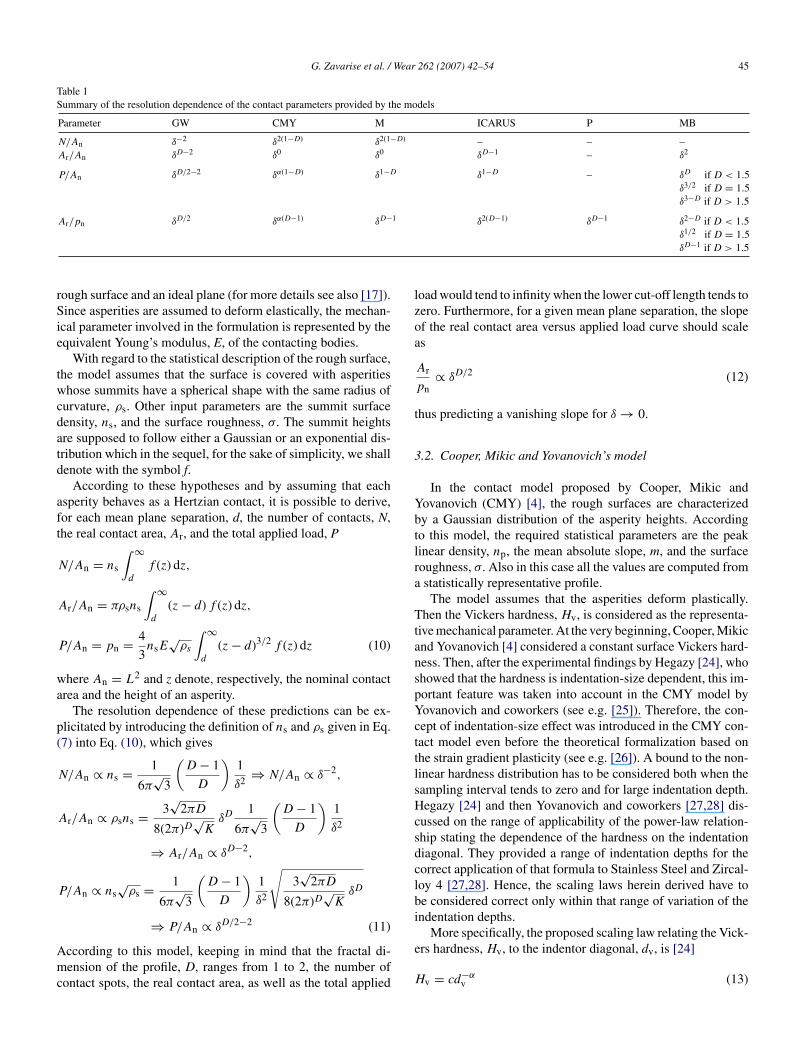
redictions provided by stochastic contact models are, in turn,esolution-dependent. Hence, in the next section we shall brieflyeview some of the best-known stochastic contact models, point-ng out the dependence of the contact predictions on the sam-ling interval, δ. These dependencies will be outlined for all theodels and are summarized in Table 1.
.1. Greenwood and Williamson’s model
The Greenwood and Williamson (GW) model [2] has beenntroduced in 1966 and it has been revised and analyzed by manyuthors, see e.g. [16–19]. Chang et al. [20] extended the GWodel by including a transition from the purely elastic regime
o the fully plastic one. Closed-form solutions to the formulaeeported in [20] were determined by Green [21]. Adams et al.22,23] extended the GW model including the effect of adhesionnd by considering the Weibull distribution of asperity heights
nd a non-constant radius of curvature for the asperity summits.The original GW model considers the contact between aough surface and a flat rigid plane. The contact between twoough surfaces is treated as the contact between an equivalent
G. Zavarise et al. / Wear 262 (2007) 42–54 45
Table 1Summary of the resolution dependence of the contact parameters provided by the models
Parameter GW CMY M ICARUS P MB
N/An δ−2 δ2(1−D) δ2(1−D) – – –Ar/An δD−2 δ0 δ0 δD−1 – δ2
P/An δD/2−2 δα(1−D) δ1−D δ1−D – δD if D < 1.5δ3/2 if D = 1.5δ3−D if D > 1.5
Ar/pn δD/2 δα(D−1) δD−1 δ2(D−1) δD−1 δ2−D if D < 1.5
rSie
twcdatd
aft
wa
p(
Amc
lzoa
t
3
Ybtlra
TtanspYcttlsHcsdclbi
ough surface and an ideal plane (for more details see also [17]).ince asperities are assumed to deform elastically, the mechan-
cal parameter involved in the formulation is represented by thequivalent Young’s modulus, E, of the contacting bodies.
With regard to the statistical description of the rough surface,he model assumes that the surface is covered with asperitieshose summits have a spherical shape with the same radius of
urvature, ρs. Other input parameters are the summit surfaceensity, ns, and the surface roughness, σ. The summit heightsre supposed to follow either a Gaussian or an exponential dis-ribution which in the sequel, for the sake of simplicity, we shallenote with the symbol f.
According to these hypotheses and by assuming that eachsperity behaves as a Hertzian contact, it is possible to derive,or each mean plane separation, d, the number of contacts, N,he real contact area, Ar, and the total applied load, P
N/An = ns
∫ ∞
d
f (z) dz,
Ar/An = πρsns
∫ ∞
d
(z− d) f (z) dz,
P/An = pn = 4
3nsE
√ρs
∫ ∞
d
(z− d)3/2 f (z) dz (10)
here An = L2 and z denote, respectively, the nominal contactrea and the height of an asperity.
The resolution dependence of these predictions can be ex-licitated by introducing the definition of ns and ρs given in Eq.7) into Eq. (10), which gives
N/An ∝ ns = 1
6π√
3
(D− 1
D
)1
δ2 ⇒ N/An ∝ δ−2,
Ar/An ∝ ρsns = 3√
2πD
8(2π)D√KδD
1
6π√
3
(D− 1
D
)1
δ2
⇒ Ar/An ∝ δD−2,
P/An ∝ ns√ρs = 1
6π√
3
(D− 1
D
)1
δ2
√3√
2πD
8(2π)D√KδD
D/2−2
⇒ P/An ∝ δ (11)ccording to this model, keeping in mind that the fractal di-ension of the profile, D, ranges from 1 to 2, the number of
ontact spots, the real contact area, as well as the total applied
e
H
δ1/2 if D = 1.5δD−1 if D > 1.5
oad would tend to infinity when the lower cut-off length tends toero. Furthermore, for a given mean plane separation, the slopef the real contact area versus applied load curve should scales
Ar
pn∝ δD/2 (12)
hus predicting a vanishing slope for δ → 0.
.2. Cooper, Mikic and Yovanovich’s model
In the contact model proposed by Cooper, Mikic andovanovich (CMY) [4], the rough surfaces are characterizedy a Gaussian distribution of the asperity heights. Accordingo this model, the required statistical parameters are the peakinear density, np, the mean absolute slope, m, and the surfaceoughness, σ. Also in this case all the values are computed fromstatistically representative profile.
The model assumes that the asperities deform plastically.hen the Vickers hardness, Hv, is considered as the representa-
ive mechanical parameter. At the very beginning, Cooper, Mikicnd Yovanovich [4] considered a constant surface Vickers hard-ess. Then, after the experimental findings by Hegazy [24], whohowed that the hardness is indentation-size dependent, this im-ortant feature was taken into account in the CMY model byovanovich and coworkers (see e.g. [25]). Therefore, the con-ept of indentation-size effect was introduced in the CMY con-act model even before the theoretical formalization based onhe strain gradient plasticity (see e.g. [26]). A bound to the non-inear hardness distribution has to be considered both when theampling interval tends to zero and for large indentation depth.egazy [24] and then Yovanovich and coworkers [27,28] dis-
ussed on the range of applicability of the power-law relation-hip stating the dependence of the hardness on the indentationiagonal. They provided a range of indentation depths for theorrect application of that formula to Stainless Steel and Zircal-oy 4 [27,28]. Hence, the scaling laws herein derived have toe considered correct only within that range of variation of thendentation depths.
More specifically, the proposed scaling law relating the Vick-rs hardness, Hv, to the indentor diagonal, dv, is [24]
v = cd−αv (13)
4 Wear
wai“(Tt
a
weec
wrctdaat
H
wad
P
aE
Atoictc
tc
t
3
fpmo
r
Idi
Atlafa
t
4p
c(mBdpr
4
soms
6 G. Zavarise et al. /
here c and α are empirical constants, with 0 < α < 1/2. Then,criterion of equivalence between the square contact area of the
ndentor and the circular one of a generic asperity, usually calledspot”, is proposed
dv/√
2)2 = π a2 ⇒ dv =
√2π a (14)
he contact spot mean radius, a, can also be statistically relatedo the mean planes distance, d. As shown in [4] we get
=√
8
π
σ
mexp (d/σ)2 erfc(d/σ) (15)
here erfc(x) = [1 − 2√π
∫ x0 exp(−t2) dt] is the complementary
rror function, erf(x). On the basis of these assumptions, forach mean plane distance, d, the number of contacts, N, the realontact area, Ar, and the total applied load, P, are given by
N/An = 1
16
m2
σ2
exp ((−d/σ)2)
erfc(d/σ), Ar/An = 1
2erfc(d/σ),
P/An = pn = HvAr/An (16)
here the expression for the real contact area in Eq. (16) cor-esponds to the classical formula derived from the bearing areaurve concept [29]. In fact, according to this approach, the rela-ionship between the real contact area, Ar, and the mean planeistance, d, is derived on the basis of pure geometrical consider-tions on the undeformed profiles, without taking into consider-tion the interactions between the asperities and their deforma-ions.
Considering the relationship between the Vickers hardness,v, and the indentation diagonal, dv, reported in Eq. (13), asell as the relationship between the indentation diagonal, dv,
nd the contact spot mean radius, a, in Eqs. (14) and (15), theependence ofP/An on the resolution δ can be put into evidence
/An ∝ Hv ∝ d−αv ∝ a−α ∝ m−α (17)
nd then, introducing the definition of m given in Eq. (7) intoqs. (16) and (17), we have the following scaling laws
N/An ∝ m2 ⇒ N/An ∝ δ2(1−D),
Ar/An independent of δ ⇒ Ar/An ∝ δ0,
P/An ∝ Hv ⇒ P/An ∝ δα(1−D) (18)
ccording to this model, both the number of contact spots andhe total applied load would tend to infinity when the lower cut-ff length tends to zero. Since the mean absolute slope tends tonfinity when δ → 0, in this limit case we have an infinity ofontacts with a vanishing mean contact radius, a. As a result ofhe application of the bearing area concept, the predicted realontact area is independent of the sampling interval.
Also, according to Eq. (18), for a given mean plane separa-ion, the slope of the real contact area versus normal pressure
urve scales asAr
pn∝ δα(D−1) (19)
hus predicting again a vanishing slope for δ → 0.
i
dso
262 (2007) 42–54
.3. Mikic’s model
The Mikic model (M) [3] assumes the same geometry sur-ace model adopted in the CMY one. Hence, the same statisticalarameters and the bearing area concept are involved in the for-ulation, but, in contrast with CMY, the mechanical behavior
f the asperities is assumed to be elastic.As a result, the following contact formulae can be summa-
ized
N/An = 1
16
m2
σ2
exp ((−d/σ)2)
erfc(d/σ), Ar/An = 1
2erfc(d/σ),
P/An = pn = ArEm√2An
(20)
ntroducing the definition of m given in Eq. (7) into Eq. (20), theependence of the contact predictions on the sampling intervals obtained
N/An ∝ m2 ⇒ N/An ∝ δ2(1−D),
Ar/An independent of δ ⇒ Ar/An ∝ δ0,
P/An ∝ m ⇒ P/An ∝ δ(1−D) (21)
ccording to this model, both the number of contact spots andhe normal pressure would tend to infinity when the lower cut-offength tends to zero. On the other hand, the predicted real contactrea is independent of the sampling interval. As a consequence,or a given mean plane separation, the slope of the real contactrea versus applied load curve scales as
Ar
pn∝ δ(D−1) (22)
ending again to zero for δ → 0.
. Resolution dependence of the contact predictionsrovided by fractal contact models
In this section we shall briefly review some of the fractalontact models proposed in the literature, namely the ICARUSIncremental Contact Analysis of Rough Unmated Surfaces)odel [5], the Persson’s model (P) [30], and the Majumdar andhushan’s contact model (MB) [31]. A particular attention isevoted to the effect of the lower cut-off length on the contactredictions. Also in this case the dependencies on δ are summa-ized in Table 1.
.1. ICARUS model
The problem of normal elastic contact between rough randomurfaces can be deterministically solved through a discretizationf the interface and a numerical procedure. In the ICARUS for-ulation, Borri-Brunetto et al. [5] have implemented an active
et strategy to express the contact domain as a function of thencreasing relative closure displacement, d.
A discrete version of the problem is considered by intro-ucing in the reference plane x–y a square grid of points withpacing δ. This spacing parameter corresponds to the resolutionf the sampled height data. At each node of the grid two facing
Wear
paati
(
(
(
Ia
u
wpgHtia
totd
DAt
hsic
dDcefton
soco
(
(
Ftftc
CbdtosiCcW
fioOrstc
4
cemf
wemtg
A
w
G. Zavarise et al. /
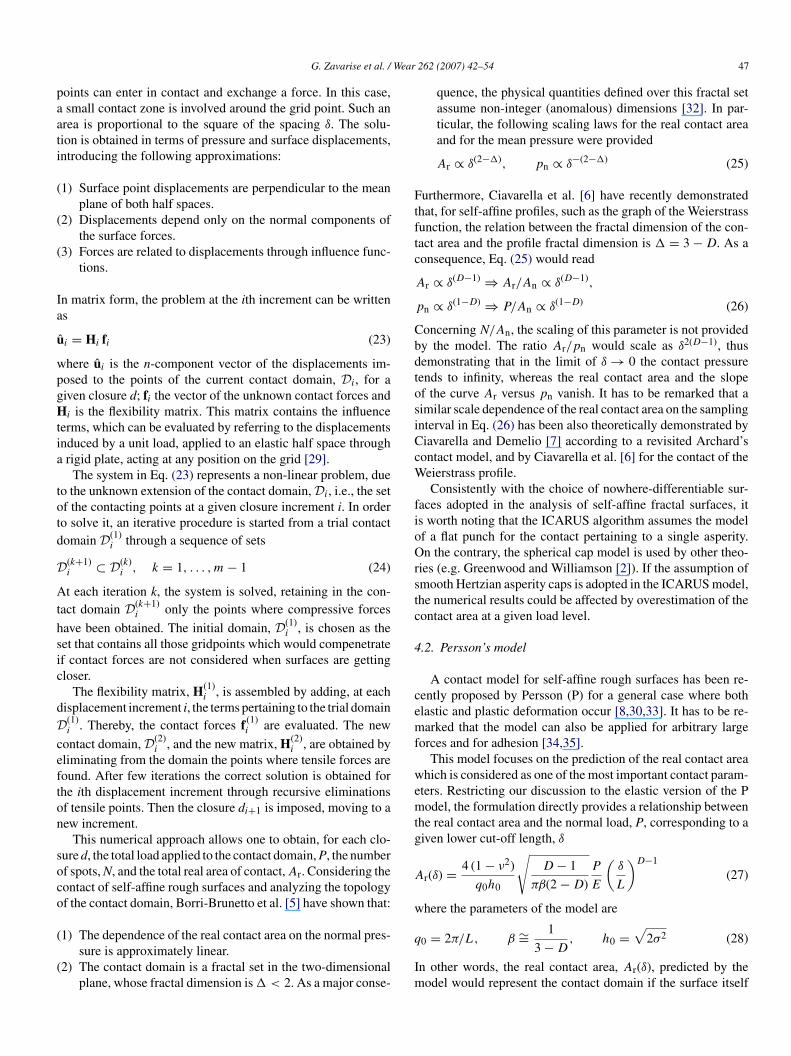
oints can enter in contact and exchange a force. In this case,small contact zone is involved around the grid point. Such an
rea is proportional to the square of the spacing δ. The solu-ion is obtained in terms of pressure and surface displacements,ntroducing the following approximations:
1) Surface point displacements are perpendicular to the meanplane of both half spaces.
2) Displacements depend only on the normal components ofthe surface forces.
3) Forces are related to displacements through influence func-tions.
n matrix form, the problem at the ith increment can be writtens
ˆ i = Hi fi (23)
here ui is the n-component vector of the displacements im-osed to the points of the current contact domain, Di, for aiven closure d; fi the vector of the unknown contact forces andi is the flexibility matrix. This matrix contains the influence
erms, which can be evaluated by referring to the displacementsnduced by a unit load, applied to an elastic half space throughrigid plate, acting at any position on the grid [29].
The system in Eq. (23) represents a non-linear problem, dueo the unknown extension of the contact domain, Di, i.e., the setf the contacting points at a given closure increment i. In ordero solve it, an iterative procedure is started from a trial contactomain D(1)
i through a sequence of sets
(k+1)i ⊂ D(k)
i , k = 1, . . . , m− 1 (24)
t each iteration k, the system is solved, retaining in the con-act domain D(k+1)
i only the points where compressive forces
ave been obtained. The initial domain, D(1)i , is chosen as the
et that contains all those gridpoints which would compenetratef contact forces are not considered when surfaces are gettingloser.
The flexibility matrix, H(1)i , is assembled by adding, at each
isplacement increment i, the terms pertaining to the trial domain(1)i . Thereby, the contact forces f (1)
i are evaluated. The new
ontact domain, D(2)i , and the new matrix, H(2)
i , are obtained byliminating from the domain the points where tensile forces areound. After few iterations the correct solution is obtained forhe ith displacement increment through recursive eliminationsf tensile points. Then the closure di+1 is imposed, moving to aew increment.
This numerical approach allows one to obtain, for each clo-ure d, the total load applied to the contact domain, P, the numberf spots, N, and the total real area of contact,Ar. Considering theontact of self-affine rough surfaces and analyzing the topologyf the contact domain, Borri-Brunetto et al. [5] have shown that:
1) The dependence of the real contact area on the normal pres-sure is approximately linear.
2) The contact domain is a fractal set in the two-dimensionalplane, whose fractal dimension is� < 2. As a major conse-
q
Im
262 (2007) 42–54 47
quence, the physical quantities defined over this fractal setassume non-integer (anomalous) dimensions [32]. In par-ticular, the following scaling laws for the real contact areaand for the mean pressure were provided
Ar ∝ δ(2−�), pn ∝ δ−(2−�) (25)
urthermore, Ciavarella et al. [6] have recently demonstratedhat, for self-affine profiles, such as the graph of the Weierstrassunction, the relation between the fractal dimension of the con-act area and the profile fractal dimension is � = 3 −D. As aonsequence, Eq. (25) would read
Ar ∝ δ(D−1) ⇒ Ar/An ∝ δ(D−1),
pn ∝ δ(1−D) ⇒ P/An ∝ δ(1−D) (26)
oncerning N/An, the scaling of this parameter is not providedy the model. The ratio Ar/pn would scale as δ2(D−1), thusemonstrating that in the limit of δ → 0 the contact pressureends to infinity, whereas the real contact area and the slopef the curve Ar versus pn vanish. It has to be remarked that aimilar scale dependence of the real contact area on the samplingnterval in Eq. (26) has been also theoretically demonstrated byiavarella and Demelio [7] according to a revisited Archard’sontact model, and by Ciavarella et al. [6] for the contact of theeierstrass profile.Consistently with the choice of nowhere-differentiable sur-
aces adopted in the analysis of self-affine fractal surfaces, its worth noting that the ICARUS algorithm assumes the modelf a flat punch for the contact pertaining to a single asperity.n the contrary, the spherical cap model is used by other theo-
ies (e.g. Greenwood and Williamson [2]). If the assumption ofmooth Hertzian asperity caps is adopted in the ICARUS model,he numerical results could be affected by overestimation of theontact area at a given load level.
.2. Persson’s model
A contact model for self-affine rough surfaces has been re-ently proposed by Persson (P) for a general case where bothlastic and plastic deformation occur [8,30,33]. It has to be re-arked that the model can also be applied for arbitrary large
orces and for adhesion [34,35].This model focuses on the prediction of the real contact area
hich is considered as one of the most important contact param-ters. Restricting our discussion to the elastic version of the Podel, the formulation directly provides a relationship between
he real contact area and the normal load, P, corresponding to aiven lower cut-off length, δ
r(δ) = 4 (1 − ν2)
q0h0
√D− 1
πβ(2 −D)
P
E
(δ
L
)D−1
(27)
here the parameters of the model are
0 = 2π/L, β ∼= 1
3 −D, h0 =
√2σ2 (28)
n other words, the real contact area, Ar(δ), predicted by theodel would represent the contact domain if the surface itself
4 Wear
wtntEan
(
(
(
4
b
(
(
(
ets
a
h
w(
faigcmo
ρ
Dt[tts(
N
waac
a
A
Msrc
A
Tvs
s
Asse
s
Wf
+ 4D
E√G
π3
Oc
P
Cm
8 G. Zavarise et al. /
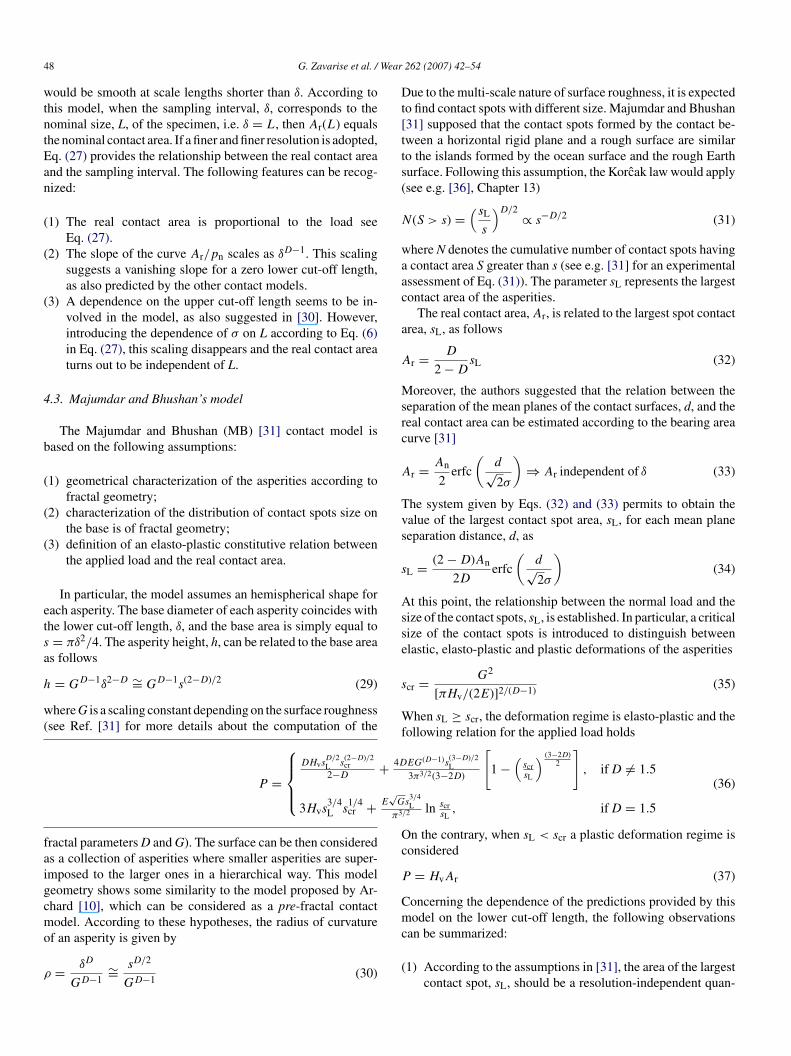
ould be smooth at scale lengths shorter than δ. According tohis model, when the sampling interval, δ, corresponds to theominal size, L, of the specimen, i.e. δ = L, then Ar(L) equalshe nominal contact area. If a finer and finer resolution is adopted,q. (27) provides the relationship between the real contact areand the sampling interval. The following features can be recog-ized:
1) The real contact area is proportional to the load seeEq. (27).
2) The slope of the curve Ar/pn scales as δD−1. This scalingsuggests a vanishing slope for a zero lower cut-off length,as also predicted by the other contact models.
3) A dependence on the upper cut-off length seems to be in-volved in the model, as also suggested in [30]. However,introducing the dependence of σ on L according to Eq. (6)in Eq. (27), this scaling disappears and the real contact areaturns out to be independent of L.
.3. Majumdar and Bhushan’s model
The Majumdar and Bhushan (MB) [31] contact model isased on the following assumptions:
1) geometrical characterization of the asperities according tofractal geometry;
2) characterization of the distribution of contact spots size onthe base is of fractal geometry;
3) definition of an elasto-plastic constitutive relation betweenthe applied load and the real contact area.
In particular, the model assumes an hemispherical shape forach asperity. The base diameter of each asperity coincides withhe lower cut-off length, δ, and the base area is simply equal to= πδ2/4. The asperity height, h, can be related to the base areas follows
= GD−1δ2−D ∼= GD−1s(2−D)/2 (29)
here G is a scaling constant depending on the surface roughnesssee Ref. [31] for more details about the computation of the
ractal parameters D and G). The surface can be then considereds a collection of asperities where smaller asperities are super-mposed to the larger ones in a hierarchical way. This modeleometry shows some similarity to the model proposed by Ar-hard [10], which can be considered as a pre-fractal contactodel. According to these hypotheses, the radius of curvature
P =
⎧⎪⎪⎨⎪⎪⎩
DHvsD/2L s
(2−D)/2cr
2−D
3Hvs3/4L s
1/4cr +
f an asperity is given by
= δD
GD−1∼= sD/2
GD−1 (30)
c
(
262 (2007) 42–54
ue to the multi-scale nature of surface roughness, it is expectedo find contact spots with different size. Majumdar and Bhushan31] supposed that the contact spots formed by the contact be-ween a horizontal rigid plane and a rough surface are similaro the islands formed by the ocean surface and the rough Earthurface. Following this assumption, the Korcak law would applysee e.g. [36], Chapter 13)
(S > s) =( sLs
)D/2 ∝ s−D/2 (31)
here N denotes the cumulative number of contact spots havingcontact area S greater than s (see e.g. [31] for an experimentalssessment of Eq. (31)). The parameter sL represents the largestontact area of the asperities.
The real contact area,Ar, is related to the largest spot contactrea, sL, as follows
r = D
2 −DsL (32)
oreover, the authors suggested that the relation between theeparation of the mean planes of the contact surfaces, d, and theeal contact area can be estimated according to the bearing areaurve [31]
r = An
2erfc
(d√2σ
)⇒ Ar independent of δ (33)
he system given by Eqs. (32) and (33) permits to obtain thealue of the largest contact spot area, sL, for each mean planeeparation distance, d, as
L = (2 −D)An
2Derfc
(d√2σ
)(34)
t this point, the relationship between the normal load and theize of the contact spots, sL, is established. In particular, a criticalize of the contact spots is introduced to distinguish betweenlastic, elasto-plastic and plastic deformations of the asperities
cr = G2
[πHv/(2E)]2/(D−1) (35)
hen sL ≥ scr, the deformation regime is elasto-plastic and theollowing relation for the applied load holds
EG(D−1)s(3−D)/2L
3π3/2(3−2D)
[1 −
(scrsL
) (3−2D)2
], ifD = 1.5
s3/4L
/2 ln scrsL, ifD = 1.5
(36)
n the contrary, when sL < scr a plastic deformation regime isonsidered
= HvAr (37)
oncerning the dependence of the predictions provided by thisodel on the lower cut-off length, the following observations
an be summarized:
1) According to the assumptions in [31], the area of the largestcontact spot, sL, should be a resolution-independent quan-
Wear
(
5
tfamwppbpbsawe
i
ψ
wttriii
ψ
Ai
ta
ψ
IE
ψ
wacf
cpra
H
Tethe
ψ
Io(
ads
G. Zavarise et al. /
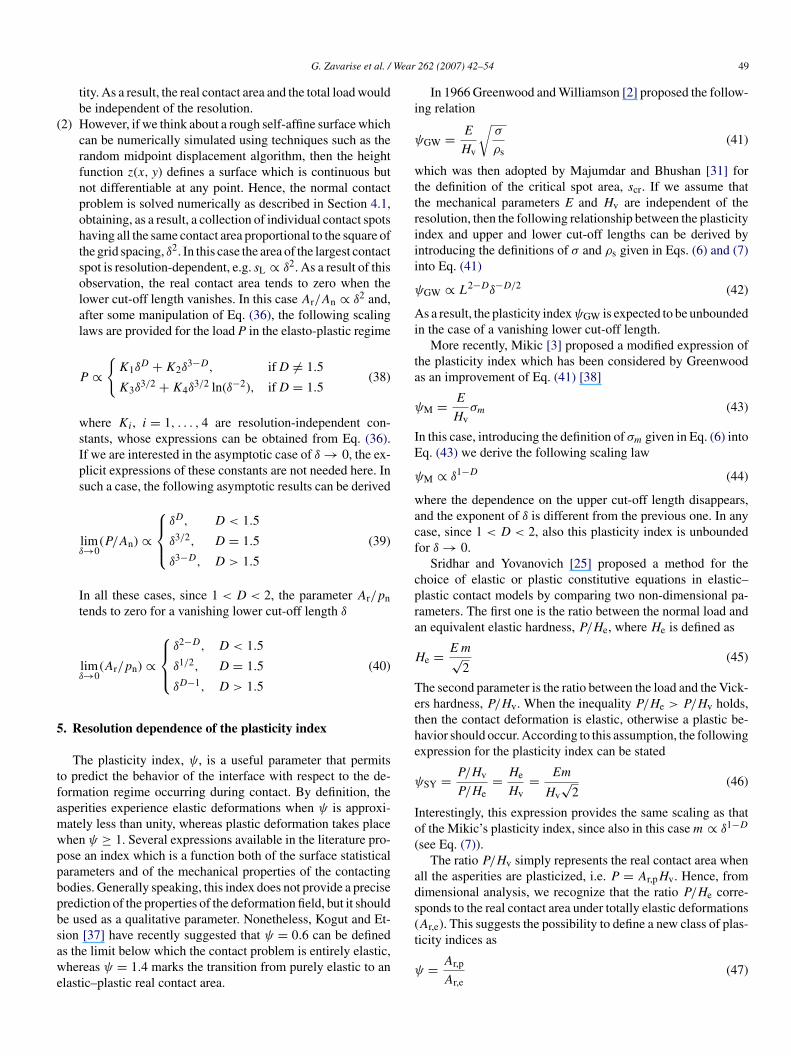
tity. As a result, the real contact area and the total load wouldbe independent of the resolution.
2) However, if we think about a rough self-affine surface whichcan be numerically simulated using techniques such as therandom midpoint displacement algorithm, then the heightfunction z(x, y) defines a surface which is continuous butnot differentiable at any point. Hence, the normal contactproblem is solved numerically as described in Section 4.1,obtaining, as a result, a collection of individual contact spotshaving all the same contact area proportional to the square ofthe grid spacing, δ2. In this case the area of the largest contactspot is resolution-dependent, e.g. sL ∝ δ2. As a result of thisobservation, the real contact area tends to zero when thelower cut-off length vanishes. In this case Ar/An ∝ δ2 and,after some manipulation of Eq. (36), the following scalinglaws are provided for the load P in the elasto-plastic regime
P ∝{K1δ
D +K2δ3−D, ifD = 1.5
K3δ3/2 +K4δ
3/2 ln(δ−2), ifD = 1.5(38)
where Ki, i = 1, . . . , 4 are resolution-independent con-stants, whose expressions can be obtained from Eq. (36).If we are interested in the asymptotic case of δ → 0, the ex-plicit expressions of these constants are not needed here. Insuch a case, the following asymptotic results can be derived
limδ→0
(P/An) ∝
⎧⎪⎨⎪⎩δD, D < 1.5
δ3/2, D = 1.5
δ3−D, D > 1.5
(39)
In all these cases, since 1 < D < 2, the parameter Ar/pntends to zero for a vanishing lower cut-off length δ
limδ→0
(Ar/pn) ∝
⎧⎪⎨⎪⎩δ2−D, D < 1.5
δ1/2, D = 1.5
δD−1, D > 1.5
(40)
. Resolution dependence of the plasticity index
The plasticity index, ψ, is a useful parameter that permitso predict the behavior of the interface with respect to the de-ormation regime occurring during contact. By definition, thesperities experience elastic deformations when ψ is approxi-ately less than unity, whereas plastic deformation takes placehen ψ ≥ 1. Several expressions available in the literature pro-ose an index which is a function both of the surface statisticalarameters and of the mechanical properties of the contactingodies. Generally speaking, this index does not provide a preciserediction of the properties of the deformation field, but it shoulde used as a qualitative parameter. Nonetheless, Kogut and Et-
ion [37] have recently suggested that ψ = 0.6 can be defineds the limit below which the contact problem is entirely elastic,hereas ψ = 1.4 marks the transition from purely elastic to anlastic–plastic real contact area.
(t
ψ
262 (2007) 42–54 49
In 1966 Greenwood and Williamson [2] proposed the follow-ng relation
GW = E
Hv
√σ
ρs(41)
hich was then adopted by Majumdar and Bhushan [31] forhe definition of the critical spot area, scr. If we assume thathe mechanical parameters E and Hv are independent of theesolution, then the following relationship between the plasticityndex and upper and lower cut-off lengths can be derived byntroducing the definitions of σ and ρs given in Eqs. (6) and (7)nto Eq. (41)
GW ∝ L2−Dδ−D/2 (42)
s a result, the plasticity indexψGW is expected to be unboundedn the case of a vanishing lower cut-off length.
More recently, Mikic [3] proposed a modified expression ofhe plasticity index which has been considered by Greenwoods an improvement of Eq. (41) [38]
M = E
Hvσm (43)
n this case, introducing the definition of σm given in Eq. (6) intoq. (43) we derive the following scaling law
M ∝ δ1−D (44)
here the dependence on the upper cut-off length disappears,nd the exponent of δ is different from the previous one. In anyase, since 1 < D < 2, also this plasticity index is unboundedor δ → 0.
Sridhar and Yovanovich [25] proposed a method for thehoice of elastic or plastic constitutive equations in elastic–lastic contact models by comparing two non-dimensional pa-ameters. The first one is the ratio between the normal load andn equivalent elastic hardness, P/He, where He is defined as
e = Em√2
(45)
he second parameter is the ratio between the load and the Vick-rs hardness, P/Hv. When the inequality P/He > P/Hv holds,hen the contact deformation is elastic, otherwise a plastic be-avior should occur. According to this assumption, the followingxpression for the plasticity index can be stated
SY = P/Hv
P/He= He
Hv= Em
Hv√
2(46)
nterestingly, this expression provides the same scaling as thatf the Mikic’s plasticity index, since also in this casem ∝ δ1−Dsee Eq. (7)).
The ratio P/Hv simply represents the real contact area whenll the asperities are plasticized, i.e. P = Ar,pHv. Hence, fromimensional analysis, we recognize that the ratio P/He corre-ponds to the real contact area under totally elastic deformations
Ar,e). This suggests the possibility to define a new class of plas-icity indices as= Ar,p
Ar,e(47)

5 Wear 262 (2007) 42–54
amo
tOEP
ψ
T[ttiade
ψ
at
6a
sdlssqrb
Sohssdrtops
oaotetP
Table 2Geometrical, fractal and mechanical parameters of rough surfaces Zr4 and SS304
Parameters Zr4 SS304
Geometricσ (m) 5.99 × 10⁻⁷ 1.08 × 10⁻⁵
m 4.84 × 10⁻² 1.90 × 10⁻¹
ρs (m) 7.40 × 10⁻⁵ 8.64 × 10⁻⁵
ns (m−2) 6.49 × 10+9 3.07 × 10+8
FractalD 1.5 1.5G 1.33 × 10⁻⁷ 9.10 × 10⁻⁸
δ (m) 4.69 × 10⁻⁶ 2.15 × 10⁻⁵
MechanicalHv (MPa) 3320 d−0.145
v 6271 d−0.229v
E (MPa) 96000 210000
P
m[
asSHeTiigl
tosa2tomAn example of such surfaces is shown in Fig. 1.
All the statistical parameters for the applicability of thestochastic and fractal contact models are then computed from
0 G. Zavarise et al. /
nd also in this case the limit between elastic and plastic defor-ation corresponds to a plasticity index approximately equal to
ne.Considering for instance the contact predictions provided by
he Persson’s model,Ar,e can be estimated according to Eq. (27).n the other hand, recalling that Ar,p = P/Hv (see for instanceqs. (16) and (37)), we define a plasticity index based on theersson’s model
P = Ar,p
Ar,e= q0h0
4 (1 − ν2)
√πβ(2 −D)
D− 1
E
Hv
(L
δ
)D−1
(48)
his expression, which is also in accordance with Eq. (C12) in33], presents the advantage that the dependence of the index onhe resolution can be readily recognized. In particular, we havehe same influence of the sampling interval as in the Mikic’s andn the Sridhar and Yovanovich’s plasticity indices. Furthermore,s already observed about the Persson’s model (Eq. (27)), noependence of the real contact area on the upper cut-off lengthxists. In fact, we have
P ∝ q0h0LD−1δ1−D = 2π
L
√2σ2LD−1δ1−D (49)
nd, upon introducing the definition of σ in Eq. (6) into Eq. (49),he dependence on L disappears and we obtain ψP ∝ δ1−D.
. Comparison between stochastic and fractalpproaches in the case of a non-zero lower cut-off length
It has been pointed out so far that, due to roughness, bothtochastic and fractal contact approaches provide resolution-ependent solutions. According to the above discussed scalingaws, it has been shown that the slope of the real contact area ver-us mean pressure curve tends to zero for an unbounded powerpectrum, i.e. for a vanishing lower cut-off length. As a conse-uence, to avoid this asymptotic behavior and to obtain finiteesults, the application of the functional filtering technique maye used.
According to this approach, which was firstly proposed byayles and Thomas [13,15], both an upper and a lower boundn the power spectrum of the heights of a profilometric traceave to be considered. A criterion for the choice of the correctampling interval, or a lower limit wavelength below which allurface features may be ignored, can be provided according toifferent criteria. For instance, when the asperities deformationegime is known beforehand, this information can be used forhe choice of δ, as outlined in [12]. In any case, as also pointedut by Persson [30], a lower cut-off length should exist in anyhysical system, due to the presence of a characteristic lowercale length of the surface texture.
Hence, we exploit the possibility to compare the predictionsf stochastic and fractal contact models when the fractal surfacesre filtered according to a functional filtering technique. Becausef their popularity in the engineering community, we consider
he Greenwood and Williamson’s elastic model [2], the Mikic’slastic model [3] and the Cooper, Mikic and Yovanovich’s plas-ic model [4]. We consider also the fractal contact models byersson [30], Majumdar and Bhushan [31], as well as the nu-ν 0.3 0.3
arameter dv has to be introduced in micrometers.
erical elastic solutions computed using the ICARUS model5].
In order to compare contact results, we follow a numericalpproach based on the generation of fractal surfaces statisticallyimilar to the rough specimens of Zircalloy 4 (Zr4) and Stainlessteel 304 (SS304), whose statistical data are reported in [24].owever, the most relevant geometrical and mechanical param-
ters of the Zr4 and SS304 rough surfaces are summarized inable 2. The surfaces analyzed in this section are not mathemat-
cal fractals, since the power spectrum of their asperity heightss bounded by both a lower and an upper cut-off length. Theseenerated surfaces are only an image of a fractal set, which is aimit concept for a vanishing sampling interval.
To be more specific, the surfaces are generated accordingo the random midpoint displacement method, which producesn a grid with a given spacing δ, a height-field with self-affinecaling properties (see [19] for more details about the generationlgorithm). Then, assuming a surface fractal dimension equal to.5, as experimentally observed in many fracture surfaces [39],he amplitude of the heights and the grid spacing, δ, are tuned inrder to have the same roughness, σ, and mean absolute slope,, as those experimentally reported for the specimens in [24].
Fig. 1. Example of a rough surface generated with the RMD method.
G. Zavarise et al. / Wear 262 (2007) 42–54 51
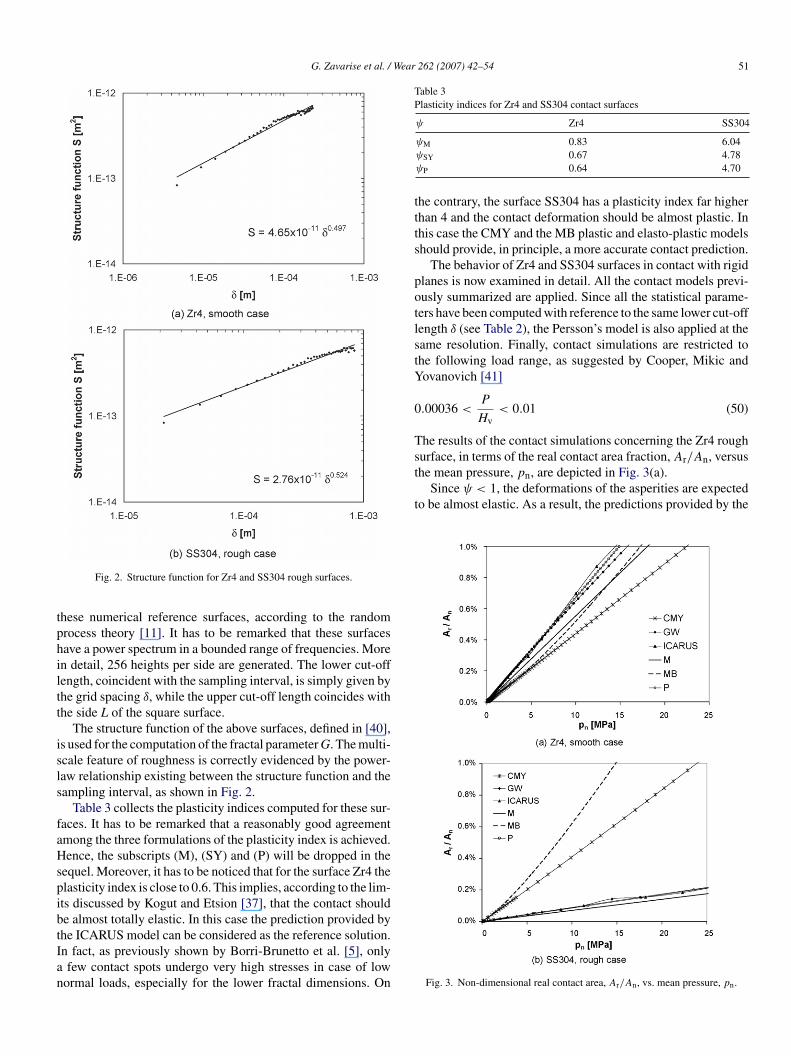
tphiltt
isls
faHspibtIan
Table 3Plasticity indices for Zr4 and SS304 contact surfaces
ψ Zr4 SS304
ttts
potlstY
0
Tsurface, in terms of the real contact area fraction,Ar/An, versusthe mean pressure, pn, are depicted in Fig. 3(a).
Since ψ < 1, the deformations of the asperities are expectedto be almost elastic. As a result, the predictions provided by the
Fig. 2. Structure function for Zr4 and SS304 rough surfaces.
hese numerical reference surfaces, according to the randomrocess theory [11]. It has to be remarked that these surfacesave a power spectrum in a bounded range of frequencies. Moren detail, 256 heights per side are generated. The lower cut-offength, coincident with the sampling interval, is simply given byhe grid spacing δ, while the upper cut-off length coincides withhe side L of the square surface.
The structure function of the above surfaces, defined in [40],s used for the computation of the fractal parameter G. The multi-cale feature of roughness is correctly evidenced by the power-aw relationship existing between the structure function and theampling interval, as shown in Fig. 2.
Table 3 collects the plasticity indices computed for these sur-aces. It has to be remarked that a reasonably good agreementmong the three formulations of the plasticity index is achieved.ence, the subscripts (M), (SY) and (P) will be dropped in the
equel. Moreover, it has to be noticed that for the surface Zr4 thelasticity index is close to 0.6. This implies, according to the lim-ts discussed by Kogut and Etsion [37], that the contact shoulde almost totally elastic. In this case the prediction provided byhe ICARUS model can be considered as the reference solution.
n fact, as previously shown by Borri-Brunetto et al. [5], onlyfew contact spots undergo very high stresses in case of lowormal loads, especially for the lower fractal dimensions. On
ψM 0.83 6.04ψSY 0.67 4.78ψP 0.64 4.70
he contrary, the surface SS304 has a plasticity index far higherhan 4 and the contact deformation should be almost plastic. Inhis case the CMY and the MB plastic and elasto-plastic modelshould provide, in principle, a more accurate contact prediction.
The behavior of Zr4 and SS304 surfaces in contact with rigidlanes is now examined in detail. All the contact models previ-usly summarized are applied. Since all the statistical parame-ers have been computed with reference to the same lower cut-offength δ (see Table 2), the Persson’s model is also applied at theame resolution. Finally, contact simulations are restricted tohe following load range, as suggested by Cooper, Mikic andovanovich [41]
.00036 <P
Hv< 0.01 (50)
he results of the contact simulations concerning the Zr4 rough
Fig. 3. Non-dimensional real contact area, Ar/An, vs. mean pressure, pn.
5 Wear 262 (2007) 42–54
mGctu
FpbMtdtswtte
tfTcsiptaip
a[ttbfi[ttbt
doasoow
tioMlt
ps
7
toeacpcid
lribw
2 G. Zavarise et al. /
odels assuming an elastic behavior of the asperities, such asW, M, P and ICARUS, should be representative of the real
ontact conditions. These contact models provide solution closeo each other, whereas the fully plastic CMY contact modelnderestimates the amount of the real contact area.
The contact results for the SS304 rough surface are reported inig. 3(b). In this case ψ > 1 and plastic deformations should berevalent. Here the CMY and MB contact models are expected toe more accurate than the elastic contact models. However, theB model provides an anomalous non-linear relationship be-
ween the real contact area and the nominal pressure, which is inisagreement with the other theories (see Fig. 3(b)). Accordingo Archard [10], the ratio between the real contact area shouldcale with the pressure according to the power-law Ar ∝ p
γn ,
here the exponent γ should range from 2/3 (Hertzian contact)o 1 (perfectly plastic model). On the contrary, the curve ob-ained according to the MB model can be recovered only if thexponent γ is larger than unity.
Results depicted in Fig. 3(b) clearly show that elastic solu-ions underestimate the real contact area approximately by aactor of 8 with respect to the plastic ones when Ar/An ∼= 1%.he scatter between the solutions provided by elastic and plasticontact models is higher than that observed for the Zr4 contacturface. As a consequence, it is clear that the role of the plastic-ty index for the prediction of the deformation regime is crucial,articularly for values higher than unity. The use of the elas-ic contact solutions instead of the plastic ones may result intosignificant underestimation of the real contact area involved
n the contact process, with serious implications for designurposes.
Concerning the load–displacement curves, these diagramsre particularly important because, as recently proven by Barber42], the normal stiffness can be related in a straightforward wayo the electrical resistance of the interface. Furthermore, fromhe computational point of view, the normal stiffness providedy micromechanical contact models can be profitably adopted innite element contact algorithms within a penalty-like approach43,44]. Since the P model does not provide a relationship be-ween applied pressure and separation distance, it is not possibleo include it in the comparison. Regarding the MB model, theearing area assumption is used to obtain a correlation betweenhe real contact area and the separation d.
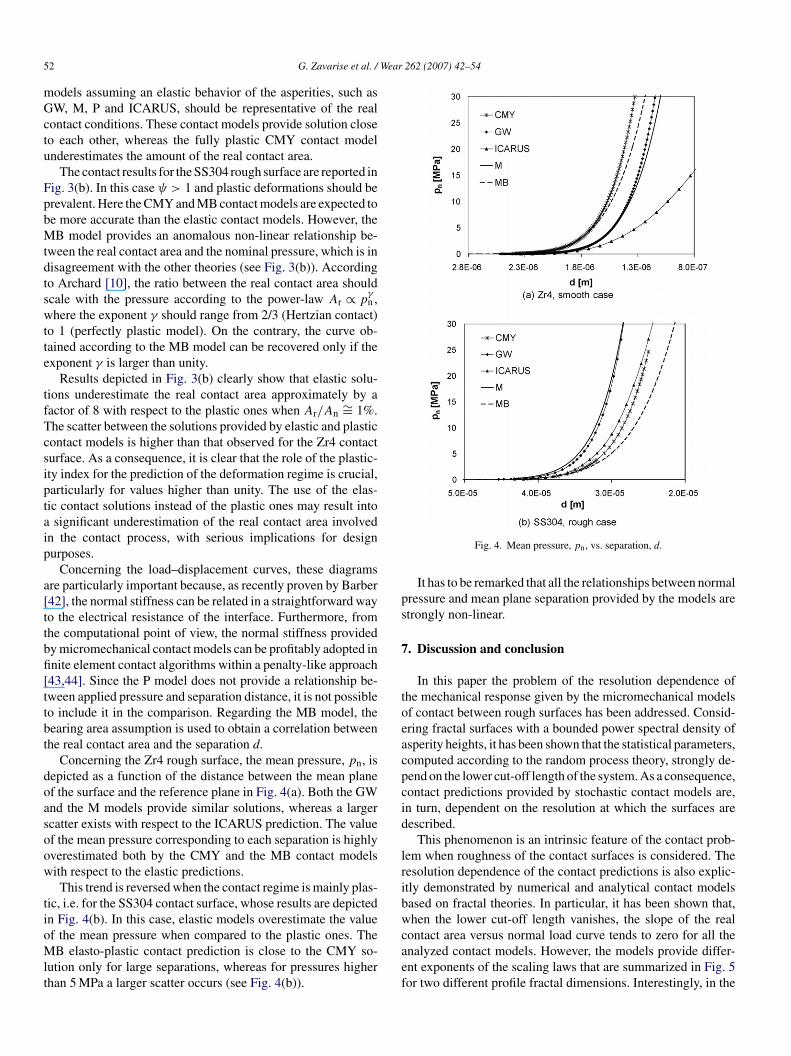
Concerning the Zr4 rough surface, the mean pressure, pn, isepicted as a function of the distance between the mean planef the surface and the reference plane in Fig. 4(a). Both the GWnd the M models provide similar solutions, whereas a largercatter exists with respect to the ICARUS prediction. The valuef the mean pressure corresponding to each separation is highlyverestimated both by the CMY and the MB contact modelsith respect to the elastic predictions.This trend is reversed when the contact regime is mainly plas-
ic, i.e. for the SS304 contact surface, whose results are depictedn Fig. 4(b). In this case, elastic models overestimate the value
f the mean pressure when compared to the plastic ones. TheB elasto-plastic contact prediction is close to the CMY so-ution only for large separations, whereas for pressures higherhan 5 MPa a larger scatter occurs (see Fig. 4(b)).
caef
Fig. 4. Mean pressure, pn, vs. separation, d.
It has to be remarked that all the relationships between normalressure and mean plane separation provided by the models aretrongly non-linear.
. Discussion and conclusion
In this paper the problem of the resolution dependence ofhe mechanical response given by the micromechanical modelsf contact between rough surfaces has been addressed. Consid-ring fractal surfaces with a bounded power spectral density ofsperity heights, it has been shown that the statistical parameters,omputed according to the random process theory, strongly de-end on the lower cut-off length of the system. As a consequence,ontact predictions provided by stochastic contact models are,n turn, dependent on the resolution at which the surfaces areescribed.
This phenomenon is an intrinsic feature of the contact prob-em when roughness of the contact surfaces is considered. Theesolution dependence of the contact predictions is also explic-tly demonstrated by numerical and analytical contact modelsased on fractal theories. In particular, it has been shown that,hen the lower cut-off length vanishes, the slope of the real
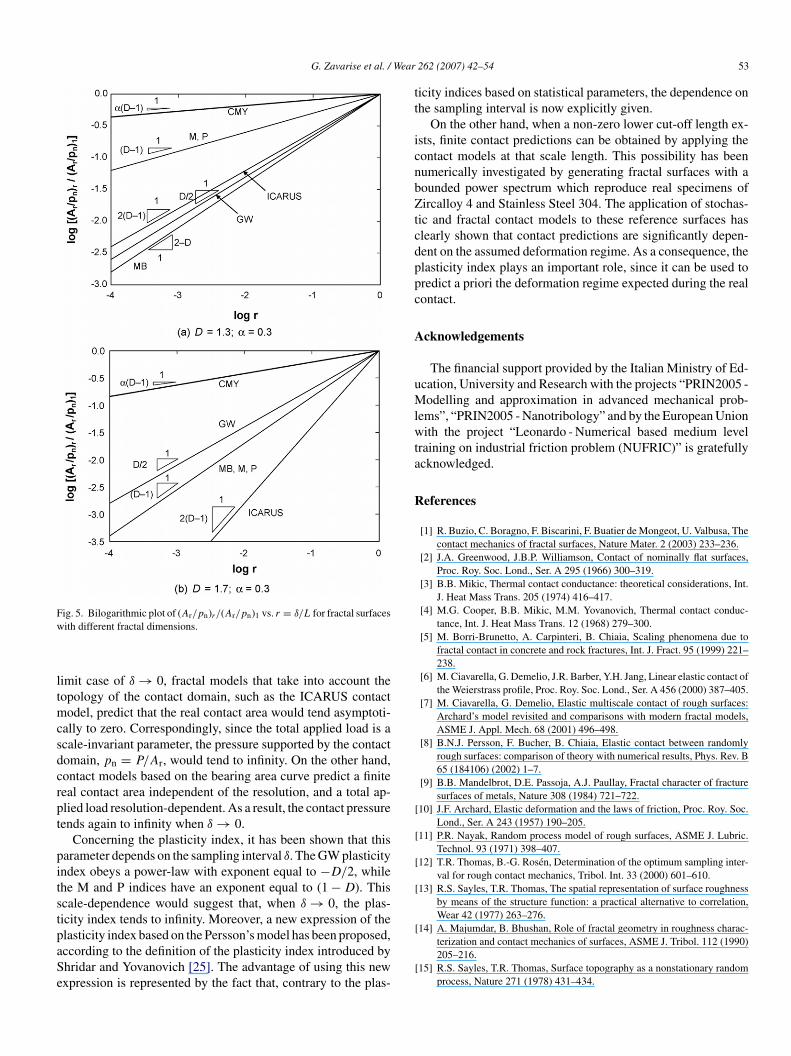
ontact area versus normal load curve tends to zero for all thenalyzed contact models. However, the models provide differ-nt exponents of the scaling laws that are summarized in Fig. 5or two different profile fractal dimensions. Interestingly, in the
G. Zavarise et al. / Wear
Fw
ltmcsdcrpt
pitstpaSe
tt
icnbZtcdppc
A
uMlwta
R
[
[
[
[
[14] A. Majumdar, B. Bhushan, Role of fractal geometry in roughness charac-
ig. 5. Bilogarithmic plot of (Ar/pn)r/(Ar/pn)1 vs. r = δ/L for fractal surfacesith different fractal dimensions.
imit case of δ → 0, fractal models that take into account theopology of the contact domain, such as the ICARUS contact
odel, predict that the real contact area would tend asymptoti-ally to zero. Correspondingly, since the total applied load is acale-invariant parameter, the pressure supported by the contactomain, pn = P/Ar, would tend to infinity. On the other hand,ontact models based on the bearing area curve predict a finiteeal contact area independent of the resolution, and a total ap-lied load resolution-dependent. As a result, the contact pressureends again to infinity when δ → 0.
Concerning the plasticity index, it has been shown that thisarameter depends on the sampling interval δ. The GW plasticityndex obeys a power-law with exponent equal to −D/2, whilehe M and P indices have an exponent equal to (1 −D). Thiscale-dependence would suggest that, when δ → 0, the plas-icity index tends to infinity. Moreover, a new expression of thelasticity index based on the Persson’s model has been proposed,
ccording to the definition of the plasticity index introduced byhridar and Yovanovich [25]. The advantage of using this newxpression is represented by the fact that, contrary to the plas-[
262 (2007) 42–54 53
icity indices based on statistical parameters, the dependence onhe sampling interval is now explicitly given.
On the other hand, when a non-zero lower cut-off length ex-sts, finite contact predictions can be obtained by applying theontact models at that scale length. This possibility has beenumerically investigated by generating fractal surfaces with aounded power spectrum which reproduce real specimens ofircalloy 4 and Stainless Steel 304. The application of stochas-
ic and fractal contact models to these reference surfaces haslearly shown that contact predictions are significantly depen-ent on the assumed deformation regime. As a consequence, thelasticity index plays an important role, since it can be used toredict a priori the deformation regime expected during the realontact.
cknowledgements
The financial support provided by the Italian Ministry of Ed-cation, University and Research with the projects “PRIN2005 -odelling and approximation in advanced mechanical prob-
ems”, “PRIN2005 - Nanotribology” and by the European Unionith the project “Leonardo - Numerical based medium level
raining on industrial friction problem (NUFRIC)” is gratefullycknowledged.
eferences
[1] R. Buzio, C. Boragno, F. Biscarini, F. Buatier de Mongeot, U. Valbusa, Thecontact mechanics of fractal surfaces, Nature Mater. 2 (2003) 233–236.
[2] J.A. Greenwood, J.B.P. Williamson, Contact of nominally flat surfaces,Proc. Roy. Soc. Lond., Ser. A 295 (1966) 300–319.
[3] B.B. Mikic, Thermal contact conductance: theoretical considerations, Int.J. Heat Mass Trans. 205 (1974) 416–417.
[4] M.G. Cooper, B.B. Mikic, M.M. Yovanovich, Thermal contact conduc-tance, Int. J. Heat Mass Trans. 12 (1968) 279–300.
[5] M. Borri-Brunetto, A. Carpinteri, B. Chiaia, Scaling phenomena due tofractal contact in concrete and rock fractures, Int. J. Fract. 95 (1999) 221–238.
[6] M. Ciavarella, G. Demelio, J.R. Barber, Y.H. Jang, Linear elastic contact ofthe Weierstrass profile, Proc. Roy. Soc. Lond., Ser. A 456 (2000) 387–405.
[7] M. Ciavarella, G. Demelio, Elastic multiscale contact of rough surfaces:Archard’s model revisited and comparisons with modern fractal models,ASME J. Appl. Mech. 68 (2001) 496–498.
[8] B.N.J. Persson, F. Bucher, B. Chiaia, Elastic contact between randomlyrough surfaces: comparison of theory with numerical results, Phys. Rev. B65 (184106) (2002) 1–7.
[9] B.B. Mandelbrot, D.E. Passoja, A.J. Paullay, Fractal character of fracturesurfaces of metals, Nature 308 (1984) 721–722.
10] J.F. Archard, Elastic deformation and the laws of friction, Proc. Roy. Soc.Lond., Ser. A 243 (1957) 190–205.
11] P.R. Nayak, Random process model of rough surfaces, ASME J. Lubric.Technol. 93 (1971) 398–407.
12] T.R. Thomas, B.-G. Rosen, Determination of the optimum sampling inter-val for rough contact mechanics, Tribol. Int. 33 (2000) 601–610.
13] R.S. Sayles, T.R. Thomas, The spatial representation of surface roughnessby means of the structure function: a practical alternative to correlation,Wear 42 (1977) 263–276.
terization and contact mechanics of surfaces, ASME J. Tribol. 112 (1990)205–216.
15] R.S. Sayles, T.R. Thomas, Surface topography as a nonstationary randomprocess, Nature 271 (1978) 431–434.
5 Wear
4 G. Zavarise et al. /[16] J.A. Greenwood, J.H. Tripp, The contact of two nominally flat rough sur-faces, Proc. Inst. Mech. Eng., Part J 185 (1971) 625–633.
[17] J.I. McCool, Comparison of models for the contact of rough surfaces, Wear107 (1986) 37–60.
[18] J.A. Greenwood, J.J. Wu, Surface roughness and contact: an apology, Mec-canica 36 (2001) 617–630.
[19] G. Zavarise, M. Borri-Brunetto, M. Paggi, On the reliability of microscop-ical contact models, Wear 257 (2004) 229–245.
[20] W.R. Chang, I. Etsion, D.B. Bogy, An elastic-plastic model for the contactof rough surfaces, ASME J. Tribol. 109 (1987) 257–263.
[21] I. Green, A transient dynamic analysis of mechanical seals including as-perity contact and face deformation, Tribol. Trans. 45 (2002) 284–293.
[22] G.G. Adams, S. Muftu, N.M. Azhar, A scale-dependent model for multi-asperity contact and friction, ASME J. Tribol. 125 (2003) 700–708.
[23] G.G. Adams, S. Muftu, Improvements to a scale-dependent model for con-tact and friction, Int. J. Phys. D 38 (2005) 1402–1409.
[24] A.A.H. Hegazy, Thermal joint conductance of conforming rough surfaces:effect of surface micro-hardness variation, Ph.D. Thesis, University of Wa-terloo, 1985.
[25] M.R. Sridhar, M.M. Yovanovich, Review of elastic and plastic contactconductance models: comparison with experiments, J. Thermophys. HeatTrans. 8 (4) (1994) 633–640.
[26] W.D. Nix, H. Gao, Indentation size effects in crystalline materials: alaw for strain gradient plasticity, J. Mech. Phys. Solids 46 (1998) 411–425.
[27] M.M. Yovanovich, A.A. Hegazy, J. De Vaal, Hardness distribution effectsupon contact, gap and joint conductances. AIAA Paper, 82-0887, 1982.
[28] M.M. Yovanovich, A.A. Hegazy, V.W. Antonetti, Experimental verifica-tion of contact conductance models based upon distributed surface micro-
hardness. AIAA Paper, 83-0532, 1983.[29] K.L. Johnson, Contact Mechanics, Cambridge University Press, Cam-bridge, 1985.
[30] B.N.J. Persson, Elastoplastic contact between randomly rough surfaces,Phys. Rev. Lett. 87 (116101) (2001) 1–4.
262 (2007) 42–54
[31] A. Majumdar, B. Bhushan, Fractal model of elastic-plastic contact betweenrough surfaces, ASME J. Tribol. 113 (1991) 1–11.
[32] A. Carpinteri, Scaling laws and renormalization groups for strength andtoughness of disordered materials, Int. J. Solids Struct. 31 (1994) 291–302.
[33] B.N.J. Persson, Theory of rubber friction and contact mechanics, J. Chem.Phys. 115 (8) (2001) 3840–3861.
[34] B.N.J. Persson, Adhesion between elastic bodies with randomly roughsurfaces, Phys. Rev. Lett. 89 (245502) (2002) 1–4.
[35] B.N.J. Persson, Adhesion between elastic bodies with randomly roughsurfaces, Eur. Phys. J. E8 (2002) 385.
[36] J. Feder, Fractals, Plenum Press, New York, 1988.[37] L. Kogut, I. Etsion, A finite element based elastic-plastic model for the
contact of rough surfaces, Tribol. Trans. 46 (2003) 383–390.[38] J.A. Greenwood, A unified theory of surface roughness, Proc. Roy. Soc.
Lond., Ser. A 393 (1984) 133–157.[39] E.E. Underwood, K. Banerjee, Fractal analysis of fracture surfaces, ASM
Handbook, vol. 12: Fractography, ASM International, Metals Park, Ohio,USA, 1987, pp. 211–215.
[40] B. Bhushan, A. Majumdar, Elastic-plastic contact model for bifractal sur-faces, Wear 153 (1992) 53–64.
[41] M.M. Yovanovich, J.W. De Vaal, A.A. Hegazy, A statistical model to pre-dict thermal gap conductance between conforming rough surfaces. AIAAPaper, 82-0888, 1982.
[42] J.R. Barber, Bounds on the electrical resistance between contacting elasticrough bodies, Proc. Roy. Soc. Lond., Ser. A 459 (2003) 53–66.
[43] G. Zavarise, P. Wriggers, E. Stein, B.A. Schrefler, A numerical modelfor thermomechanical contact based on microscopic interface laws, Mech.Resource Commun. 19 (1992) 173–182.
[44] M. Paggi, A. Carpinteri, G. Zavarise, A unified interface constitutive law
for the study of fracture and contact problems in heterogeneous materials,in: P. Wriggers, U. Nackenhorst (Eds.), Analysis and Simulation of ContactProblems, Lecture Notes in Applied and Computational Mechanics, vol.27, Springer-Verlag, 2006, pp. 297–304.