On the Ratios between Elastic Modulus and Uniaxial Compressive Strength of Heterogeneous Carbonate...
8
TECHNICAL NOTE On the Ratios between Elastic Modulus and Uniaxial Compressive Strength of Heterogeneous Carbonate Rocks V. Palchik Received: 18 March 2010 / Accepted: 29 July 2010 / Published online: 12 August 2010 Ó Springer-Verlag 2010 Abstract The ratios M R = E/r c for 11 heterogeneous carbonate (dolomites, limestones and chalks) rock forma- tions collected from different regions of Israel were examined. Sixty-eight uniaxial compressive tests were conducted on weak-to-strong (5 MPa \r c \100 MPa) and very strong (r c [ 100 MPa) rock samples exhibiting wide ranges of elastic modulus (E = 6100–82300 MPa), uniaxial compressive strength (r c = 14–273.9 MPa), Poisson’s ratio (m = 0.13–0.49), and dry bulk density (q = 1.7–2.7 g/cm 3 ). The observed range of M R = 60.9–1011.4 and mean value of M R = 380.5 are compared with the results obtained by Deere (Rock mechanics in engineering practice, Wiley, London, pp 1–20, 1968) for limestones and dolomites, and the statistical analysis of M R distribution is performed. Mutual relations between E, r c , q, M R for all studied rocks, and separately for concrete rock formations are revealed. Linear multiple correlations between E on the one hand and r c and q on the other for Nekorot and Bina limestone and Aminadav dolomite are obtained. It is established that the elastic modulus and M R in very strong carbonate samples are more correlated with q-r c combination and e a max , respectively, than in weak to strong samples. The relation between M R and maximum axial strain (e a max ) for all studied rock samples (weak-to-strong and very strong) is discussed. Keywords Uniaxial compressive test Elastic modulus Maximum axial strain Rock density 1 Introduction For a successful solution of different problems in rock engineering, two important mechanical parameters, namely, uniaxial compressive strength (r c ) and elastic modulus of rock (E) should be estimated correctly. It is well known that the elastic modulus increases with increasing uniaxial compressive strength; and there are different empirical relations between r c and E obtained for greywackes, limestones, agglomerates, dolomites, chalks, sandstones, and basalts (Deere 1968; ACI 1989; Palchik 1999; Al-Shayea 2004; Gokceoglu and Zorlu 2004; Sonmez et al. 2004; Vasarhelyi 2005; Palchik 2007; Ocak 2008). The values of empirical coefficients involved in r c -E depen- dencies, mathematical forms of these dependencies, and values of squared regression coefficient (0.57 \ R 2 \ 0.98) vary with rock formation. Some of these empirical relations are presented elsewhere (Palchik 2007). Deere (1968) has established ranges of ratios M R = E/r c for ten different types of intact rocks (diabase, granite, basalts, limestones and dolomites, sandstones, shales, quartzite, gneiss, marble and schist) and mean values of M R in each of these ten rock types. In particular, the value of M R for carbonate rocks (limestone and dolomites) ranges from 250 to 700 with the mean of 420. However, the mean value of M R cannot be used to define reliable relations between r c and E in each of rock samples, in particular, in heterogeneous carbonate rocks, where rock samples exhibit different mechanical properties even within the same rock formation. Therefore, a study of the influence of mechan- ical properties on the value of M R is required. The objective of this study was to examine the values of M R = E/r c for different heterogeneous carbonate rocks (dolomites, limestones and chalks) exhibiting a wide range of uniaxial compressive strength (14 \ r c \ 273.9 MPa) V. Palchik (&) Department of Geological and Environmental Sciences, Ben-Gurion University of the Negev, P.O. Box 653, 84105 Beer-Sheva, Israel e-mail: [email protected] 123 Rock Mech Rock Eng (2011) 44:121–128 DOI 10.1007/s00603-010-0112-7
-
Upload
independent -
Category
Documents
-
view
4 -
download
0
Transcript of On the Ratios between Elastic Modulus and Uniaxial Compressive Strength of Heterogeneous Carbonate...
TECHNICAL NOTE
On the Ratios between Elastic Modulus and Uniaxial CompressiveStrength of Heterogeneous Carbonate Rocks
V. Palchik
Received: 18 March 2010 / Accepted: 29 July 2010 / Published online: 12 August 2010
� Springer-Verlag 2010
Abstract The ratios MR = E/rc for 11 heterogeneous
carbonate (dolomites, limestones and chalks) rock forma-
tions collected from different regions of Israel were
examined. Sixty-eight uniaxial compressive tests were
conducted on weak-to-strong (5 MPa\rc\100 MPa) and
very strong (rc [ 100 MPa) rock samples exhibiting wide
ranges of elastic modulus (E = 6100–82300 MPa), uniaxial
compressive strength (rc = 14–273.9 MPa), Poisson’s ratio
(m = 0.13–0.49), and dry bulk density (q = 1.7–2.7 g/cm3).
The observed range of MR = 60.9–1011.4 and mean value
of MR = 380.5 are compared with the results obtained by
Deere (Rock mechanics in engineering practice, Wiley,
London, pp 1–20, 1968) for limestones and dolomites, and
the statistical analysis of MR distribution is performed.
Mutual relations between E, rc, q, MR for all studied rocks,
and separately for concrete rock formations are revealed.
Linear multiple correlations between E on the one hand and
rc and q on the other for Nekorot and Bina limestone and
Aminadav dolomite are obtained. It is established that the
elastic modulus and MR in very strong carbonate samples
are more correlated with q-rc combination and ea max,
respectively, than in weak to strong samples. The relation
between MR and maximum axial strain (ea max) for all
studied rock samples (weak-to-strong and very strong) is
discussed.
Keywords Uniaxial compressive test � Elastic modulus �Maximum axial strain � Rock density
1 Introduction
For a successful solution of different problems in rock
engineering, two important mechanical parameters,
namely, uniaxial compressive strength (rc) and elastic
modulus of rock (E) should be estimated correctly. It is
well known that the elastic modulus increases with
increasing uniaxial compressive strength; and there are
different empirical relations between rc and E obtained for
greywackes, limestones, agglomerates, dolomites, chalks,
sandstones, and basalts (Deere 1968; ACI 1989; Palchik
1999; Al-Shayea 2004; Gokceoglu and Zorlu 2004; Sonmez
et al. 2004; Vasarhelyi 2005; Palchik 2007; Ocak 2008). The
values of empirical coefficients involved in rc-E depen-
dencies, mathematical forms of these dependencies, and
values of squared regression coefficient (0.57 \ R2 \ 0.98)
vary with rock formation. Some of these empirical relations
are presented elsewhere (Palchik 2007).
Deere (1968) has established ranges of ratios MR = E/rc
for ten different types of intact rocks (diabase, granite,
basalts, limestones and dolomites, sandstones, shales,
quartzite, gneiss, marble and schist) and mean values of MR
in each of these ten rock types. In particular, the value of
MR for carbonate rocks (limestone and dolomites) ranges
from 250 to 700 with the mean of 420. However, the mean
value of MR cannot be used to define reliable relations
between rc and E in each of rock samples, in particular, in
heterogeneous carbonate rocks, where rock samples exhibit
different mechanical properties even within the same rock
formation. Therefore, a study of the influence of mechan-
ical properties on the value of MR is required.
The objective of this study was to examine the values of
MR = E/rc for different heterogeneous carbonate rocks
(dolomites, limestones and chalks) exhibiting a wide range
of uniaxial compressive strength (14 \ rc \ 273.9 MPa)
V. Palchik (&)
Department of Geological and Environmental Sciences,
Ben-Gurion University of the Negev,
P.O. Box 653, 84105 Beer-Sheva, Israel
e-mail: [email protected]
123
Rock Mech Rock Eng (2011) 44:121–128
DOI 10.1007/s00603-010-0112-7

and elastic modulus (E = 6,100–82,300 MPa), and to
define how uniaxial compressive strength, dry bulk density,
and maximum axial strain (at a uniaxial compressive
strength) influence these MR values.
2 Laboratory testing and test results
Sixty-eight uniaxial compressive tests were performed
in the Rock Mechanics Laboratory at the Ben-Gurion
University. A sophisticated test equipment (load frame,
TerraTek system) operates under hydraulic closed-loop
servo-control with the maximum axial force of 1.4 MN and
load frame stiffness of 5 9 109 N/m (Hatzor and Palchik
1998; Palchik and Hatzor 2004). The axial strain cantilever
set has a 10% strain range, and the radial strain cantilevers
have a strain range limit of 7%, with linearity of 1% for the
full scale in both sets. The samples were loaded in com-
pression at a constant strain rate of 10-5/s at the ambient
temperature.
The NX (D = 54 mm) sized cylindrical rock samples
having the ratio L/D = 2 were used in the tests according
to ISRM (1981). The samples were ground to the planeness
of 0.01 mm and cylinder perpendicularity within 0.05
radians. All samples were oven-dried at the temperature of
110�C for 24 h.
The test results are summarized in Tables 1 and 3. Table 1
includes rock samples which may be described according to
the ISRM suggested methods (ISRM 1981) as very strong
(rc [ 100 MPa), whereas Table 2 presents weak-to-strong
samples (5 MPa \ rc \ 100 MPa according to ISRM
(1981)). All the samples presented in Tables 1 and 2 exhibit
maximum axial strain ea max B 1%. The rock samples hav-
ing ea max [ 1% are presented in Table 3. The elastic mod-
ulus (E) and Poisson’s ratio (m) were calculated using linear
regression along the linear portion of the stress–strain curve.
The dry bulk density (q) was calculated as M/V, where M and
V are oven-dried mass and bulk volume of a cylindrical
sample, respectively. Porosity (n, %) was defined using
values of dry bulk density (q) and specific gravity of the
solids (Gs = 2.7–2.8 g/cm3): n = [1-(q/Gs)] 9 100%.
3 Statistical analysis of MR values
The graph shown in Fig. 1 presents values of MR = E/rc in
each of all 68 studied rock samples. The value of MR is
between 60.9 and 1,011.4 with the mean of 380.5. There
Table 1 Observed mechanical properties of very strong (rc [ 100 MPa) carbonate rock samples at ea max B 1%
Rock i Sample q (g/cm3) m n (%) ea max (%) rc (MPa) E (MPa) MR
AM 1 Ad2 2.75 0.16 2 0.178 117.4 70,000 596.3
2 Ad4 – – – 0.132 102 82,300 806.9
3 Ad6 2.63 – 6.4 0.41 171 51,460 300.9
4 Ad43 2.65 0.27 5.4 0.475 273.9 64,000 233.7
5 Ad80 2.62 0.28 6.4 0.316 174.2 58,500 335.8
BIN 6 Bina1 2.63 0.23 6.1 0.326 187.2 60,450 322.9
7 Tb2-12 2.43 0.24 13.2 0.567 104.2 25,300 242.8
8 Tb3-2 2.59 0.26 7.5 0.362 139 41,830 300.9
9 Tb3-4 2.47 0.25 11.8 0.408 100.4 32,130 320
SAK 10 Sakh2 2.46 – 12.1 0.325 129.8 47,800 368.3
11 Sakh3 2.6 – 7.1 0.289 144.6 57,300 396.3
YG 12 Yn1 2.34 0.24 16.4 0.387 112 33,290 297.2
13 Ca3541 2.57 0.19 8.2 0.346 173.9 54,000 310.5
14 Ca5631 2.56 0.21 8.6 0.529 186 46,400 249.5
NK 15 Gn2-1b 2.48 0.23 11.4 0.431 177 47,000 265.5
16 Gn2-4a 2.43 0.25 13.2 0.33 141 44,600 316.3
17 Gn2-5b 2.49 0.25 11.1 0.364 162 48,600 300
18 Gn3-2a 2.45 0.24 12.5 0.361 150 44,800 298.7
19 Gn3-2c 2.42 0.25 13.6 0.395 163 44,400 272.4
20 Gn3-3a 2.47 0.28 11.8 0.394 178 49,000 275.3
KSH 21 Gir1 2.64 0.28 5.7 0.4 172.4 54,420 315.7
i number of sample, q dry bulk density, m Poisson’s ratio, n porosity, ea max maximum axial strain (at rc), rc uniaxial compressive strength, Eelastic modulus, MR ratio between E and rc, – there are no data, AM Aminadav dolomite, BIN Bina limestone, SAK Sakhnin limestone, YG Yagur
dolomite, NK Nekorot limestone, KSN Kiryat—Shmone limestone
122 V. Palchik
123

Table 2 Observed mechanical properties of weak-to-strong (5 MPa \rc \ 100 MPa) carbonate rocks samples at ea max B 1%
Rock i Sample q (g/cm3) m n (%) ea max (%) rc (MPa) E (MPa) MR
AD 22 Rc1 2.12 0.23 21.5 0.32 53.2 17,400 327.1
23 Rc3 2.07 0.26 23.3 0.41 51 16,000 313.7
24 Rc4 1.93 0.2 28.5 0.32 31.9 11,700 366.8
25 Rc6 2.14 0.26 20.7 0.41 63.3 19,250 304.1
26 Rc7 1.89 0.21 30 0.41 32.1 9,500 296
27 Rc8 2.11 0.2 21.9 0.37 60.3 17,300 287
28 Rc9 2.17 0.27 19.6 0.31 63.1 20,950 332
29 St1a 2.15 0.27 20.4 0.37 50.9 15,300 300.6
30 St1b 2.16 0.23 20 0.39 53.7 15,400 286.8
31 St2a 2.14 0.2 20.7 0.4 52.3 14,300 273.7
32 St2b 2.06 0.22 23.7 0.34 37.4 11,400 304.8
AM 33 Ad5 2.62 0.37 6.4 0.2 97.8 56,000 572.6
34 Ad15 2.19 0.26 21.8 0.25 67.2 29,000 431.5
35 Ad83 2.37 0.25 15.4 0.34 61.6 20,000 324.7
BM 36 Bm2 2.32 0.4 17.1 0.25 71.5 38,100 532.9
37 Bm3 1.98 0.22 29.3 0.22 45.6 21,400 469.3
BIN 38 Bina2 2.36 0.25 15.7 0.317 77 34,400 446.8
39 Bina3 2.08 – 25.7 0.362 87 28,700 329.9
40 Bina5 2.41 0.24 13.9 0.22 80 38,700 483.8
41 Bina6 2.5 0.27 10.7 0.48 89 24,800 278.7
42 Bina7 2.4 0.2 14.3 0.29 64 25,000 390.6
43 Th5-15 2.42 0.27 13.6 0.25 84 37,700 448.8
44 Th3-24 2.19 0.26 21.8 0.18 15.4 10,000 649.4
45 Th5-13 2.2 0.31 21.4 0.14 31.3 24,000 766.8
46 Tb2-5a 2.37 0.22 15.36 0.412 90.5 25,900 286.2
47 Tb3-9 2.36 0.22 15.7 0.188 44.5 25,500 574.2
48 Tb8-16 2.31 0.23 17.5 0.345 77.9 26,590 341.3
49 B1 2.59 0.4 7.5 0.19 66.5 43,100 648.1
50 B2 2.21 0.25 21.1 0.16 25 20,900 836
51 B3 2.06 0.31 26.4 0.19 35 21,000 600
52 B4 1.74 0.2 37.9 0.15 14 11,500 821
53 B5 2.33 0.25 16.8 0.29 98 35,200 359.2
54 B7 2.24 0.15 20 0.78 54.4 10,900 200.4
SOR 55 Bz5-16 2.31 0.22 17.5 0.4 78 24,300 311.5
56 Bz2-61 2.42 0.2 13.6 0.5 85.8 22,300 259.9
57 Bz2-35 2.36 0.26 15.7 0.26 32 16,200 506.3
YR 58 Yarka1 2.36 0.15 15.7 0.63 38.7 6,500 168
59 Yarka2 2.3 0.24 17.9 0.74 38.7 6,200 160.2
60 Yarka3 2.3 0.18 17.9 0.69 41 6,200 151.2
61 Yarka4 2.34 0.19 16.4 1.07 71 8,400 118.3
SAK 62 Sakh1 2.43 – 13.2 0.254 89 40,700 457.3
YG 63 Yn6 2.44 0.25 12.9 0.176 77 47,700 619.5
64 Ca5671 2.33 0.19 16.8 0.232 60 35,500 591.7
YAN 65 Yan2 2.35 0.32 16.1 0.11 35 35,400 1,011.4
i number of sample, q dry bulk density, m Poisson’s ratio, n porosity, ea max maximum axial strain (at rc), rc uniaxial compressive strength,
E elastic modulus, MR ratio between E and rc, – no data, AD adulam chalk, AM Aminadav dolomite, BM Beit-Meir dolomite, BIN Bina
limestone, SOR Sorek limestone, YR Yarka limestone, SAK Sakhnin limestone, YG Yagur dolomite, YAN Yanuach limestone
On the Ratios between Elastic Modulus 123
123
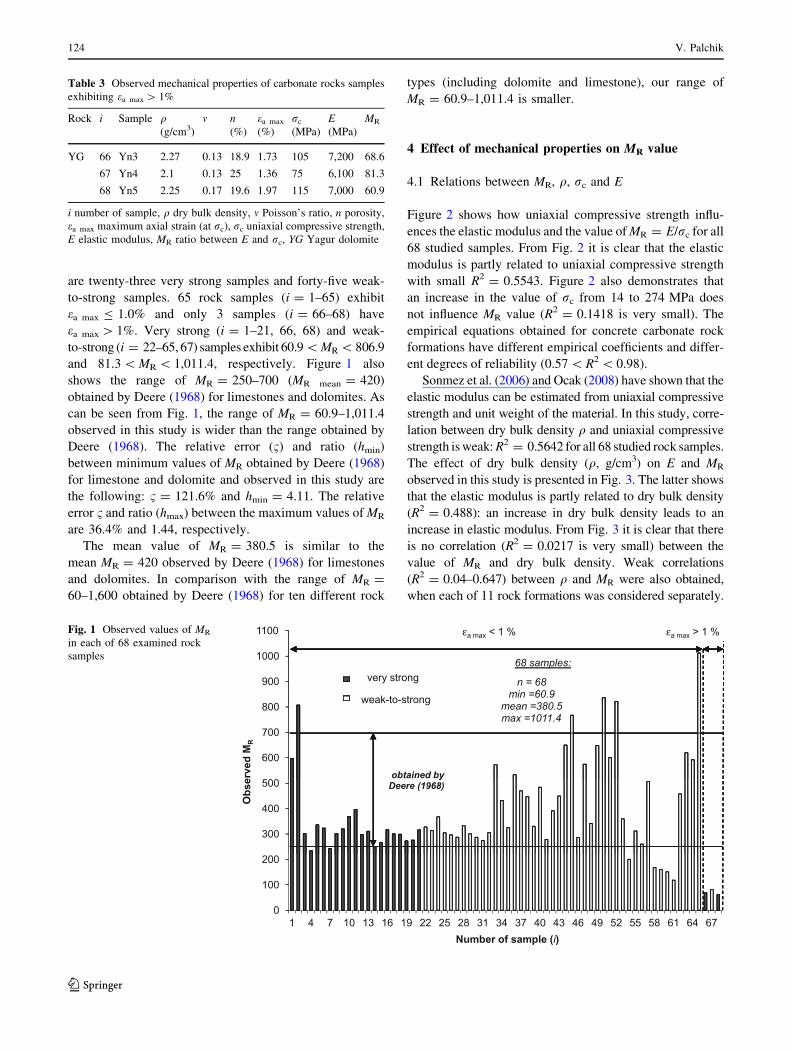
are twenty-three very strong samples and forty-five weak-
to-strong samples. 65 rock samples (i = 1–65) exhibit
ea max B 1.0% and only 3 samples (i = 66–68) have
ea max [ 1%. Very strong (i = 1–21, 66, 68) and weak-
to-strong (i = 22–65, 67) samples exhibit 60.9 \ MR \ 806.9
and 81.3 \ MR \ 1,011.4, respectively. Figure 1 also
shows the range of MR = 250–700 (MR mean = 420)
obtained by Deere (1968) for limestones and dolomites. As
can be seen from Fig. 1, the range of MR = 60.9–1,011.4
observed in this study is wider than the range obtained by
Deere (1968). The relative error (1) and ratio (hmin)
between minimum values of MR obtained by Deere (1968)
for limestone and dolomite and observed in this study are
the following: 1 = 121.6% and hmin = 4.11. The relative
error 1 and ratio (hmax) between the maximum values of MR
are 36.4% and 1.44, respectively.
The mean value of MR = 380.5 is similar to the
mean MR = 420 observed by Deere (1968) for limestones
and dolomites. In comparison with the range of MR =
60–1,600 obtained by Deere (1968) for ten different rock
types (including dolomite and limestone), our range of
MR = 60.9–1,011.4 is smaller.
4 Effect of mechanical properties on MR value
4.1 Relations between MR, q, rc and E
Figure 2 shows how uniaxial compressive strength influ-
ences the elastic modulus and the value of MR = E/rc for all
68 studied samples. From Fig. 2 it is clear that the elastic
modulus is partly related to uniaxial compressive strength
with small R2 = 0.5543. Figure 2 also demonstrates that
an increase in the value of rc from 14 to 274 MPa does
not influence MR value (R2 = 0.1418 is very small). The
empirical equations obtained for concrete carbonate rock
formations have different empirical coefficients and differ-
ent degrees of reliability (0.57 \ R2 \ 0.98).
Sonmez et al. (2006) and Ocak (2008) have shown that the
elastic modulus can be estimated from uniaxial compressive
strength and unit weight of the material. In this study, corre-
lation between dry bulk density q and uniaxial compressive
strength is weak: R2 = 0.5642 for all 68 studied rock samples.
The effect of dry bulk density (q, g/cm3) on E and MR
observed in this study is presented in Fig. 3. The latter shows
that the elastic modulus is partly related to dry bulk density
(R2 = 0.488): an increase in dry bulk density leads to an
increase in elastic modulus. From Fig. 3 it is clear that there
is no correlation (R2 = 0.0217 is very small) between the
value of MR and dry bulk density. Weak correlations
(R2 = 0.04–0.647) between q and MR were also obtained,
when each of 11 rock formations was considered separately.
very strong
weak-to-strong
obtained b
68 samples:
Deere (1968)
0
100
200
300
400
500
600
700
800
900
1000
1100
1 4 7 10 13 16 19 22 25 28 31 34 37 40 43 46 49 52 55 58 61 64 67
Obs
erve
d M
R
Number of sample (i)
εa max > 1 %
n = 68min =60.9
mean =380.5max =1011.4
εa max < 1 %
y
Fig. 1 Observed values of MR
in each of 68 examined rock
samples
Table 3 Observed mechanical properties of carbonate rocks samples
exhibiting ea max [ 1%
Rock i Sample q(g/cm3)
m n(%)
ea max
(%)
rc
(MPa)
E(MPa)
MR
YG 66 Yn3 2.27 0.13 18.9 1.73 105 7,200 68.6
67 Yn4 2.1 0.13 25 1.36 75 6,100 81.3
68 Yn5 2.25 0.17 19.6 1.97 115 7,000 60.9
i number of sample, q dry bulk density, m Poisson’s ratio, n porosity,
ea max maximum axial strain (at rc), rc uniaxial compressive strength,
E elastic modulus, MR ratio between E and rc, YG Yagur dolomite
124 V. Palchik
123

Linear multiple regression analysis performed for each
of rock formations shows that the elastic modulus for some
rock formations can be presented as a composite function
of q and rc:
E ¼ aþ bqþ crc ð1Þ
where a, b, and c are regression coefficients: a = -88,440,
-147,900 and -40,640; b = 52,120, 75,180, and 24,270,
c = 41.98, 45.76, and 162.1 for Nekorot limestone, Aminadav
dolomite and Bina limestone, respectively.
Here, Nekorot limestone (Fstat = 6.47), Aminadav
dolomite (Fstat = 10.19), and Bina limestone (Fstat = 13.6)
exhibit R2 = 0.812, 0.836 and 0.65, respectively.
Further, linear multiple regression analysis for E = f (rc, q)
was performed separately for weak-to-strong and very strong
samples taking into account all studied rock formations. It
is established that R2 in Eq. 1 for weak-to-strong rocks is
small (R2 = 0.338). On the other hand, very strong rocks
(when ea max B 1%) exhibit relatively large R2 = 0.793
(Fstat = 19.86, a = -171,600, b = 82,380 and c = 70.4),
R² = 0.5543
R² = 0.1418
All 68 samples
0
200
400
600
800
1000
1200
0
10000
20000
30000
40000
50000
60000
70000
80000
90000
0 50 100 150 200 250 300
Ob
serv
ed M
R
Ob
serv
ed E
, MP
a
Uniaxial compressive strength (σc), MPa
E MR Poly. (E) Poly. (MR)
Fig. 2 Influence of uniaxial
compressive strength (rc) on
elastic modulus (E) and the
value of MR for all studied
samples
R2 = 0.4884800
900
1000
1100
10
20
30
40
ζ (1)
, %
χ(1) = 5670 MPa
R2 = 0.0217400
500
600
700O
bse
rved
MR
0
0
100
200
300
0
10000
20000
30000
40000
50000
60000
70000
80000
90000
1.7 1.8 1.9 2 2.1 2.2 2.3 2.4 2.5 2.6 2.7 2.80
10000
20000
1.7 1.8 1.9 2 2.1 2.2 2.3 2.4 2.5 2.6 2.7 2.8
Ela
stic
mo
du
lus
(E),
MP
a
Dry bulk density (ρ), g/cm3
E MR Expon. (E) Log. (MR)
1 4 6 8 10 12 14 16 18 20Number of sample (i )
Fig. 3 Effect of dry bulk
density (q) on mechanical
parameters: relations between qand elastic modulus (E) and MR
for all 68 samples, and relative
(1(1), %) and root-mean-square
(v(1)) errors between calculated
(Eq.1) and observed E for very
strong rock samples
On the Ratios between Elastic Modulus 125
123
and maximum relative error 1 (1), and root-mean-square
error 1(1) (at n = 20) are 20.8–34.7% and 5,670 MPa,
respectively (see Fig. 3). These errors are less than errors
1(1) max = 37–49% and v(1) = 7,480 MPa obtained for
Aminadav dolomite samples (exhibiting the largest value of
R2 = 0.836) without taking the levels of rc in consideration.
The relative (1, %) and root-mean-square (v) errors between
the observed and calculated parameterQ
have been calcu-
lated as
1ðmÞ ¼2Q
obsðjÞ �Q
calðjÞ
���
���
QobsðjÞ þ
QcalðjÞ
� 100 ð2Þ
vðmÞ ¼
ffiffiffiffiffiffiffiffiffiffiffiffiffiffiffiffiffiffiffiffiffiffiffiffiffiffiffiffiffiffiffiffiffiffiffiffiffiffiffiffiffiPn
j¼1
½Q
obsðjÞ �Q
calðjÞ�2
n� 1
vuuut
ð3Þ
where (m) is the number of equation used to calculate the
parameterQ
(whereQ
is E or MR), m = 1 and 4 for
Eqs. 1 and 4, respectively; j = 1, 2, 3, … , n is the number
of tested samples;Q
obs(j) is the observed value of the
parameterQ
in jth sample;Q
cal(j) is the calculated value of
the parameterQ
in jth sample.
4.2 Relation between MR and maximum axial strain
Mathematically analyzing the observed stress–strain rela-
tions for weak-to-strong (5 MPa \rc \ 100 MPa) rock
samples, Palchik (2006) has created a stress–strain model
based on Haldane’s distribution function (Haldane 1919),
which relates the axial stress to the square of an expo-
nential function, where the exponent is axial strain (ea).
Further, the stress–strain model based on Haldane’s dis-
tribution function was used to formulate a prediction model
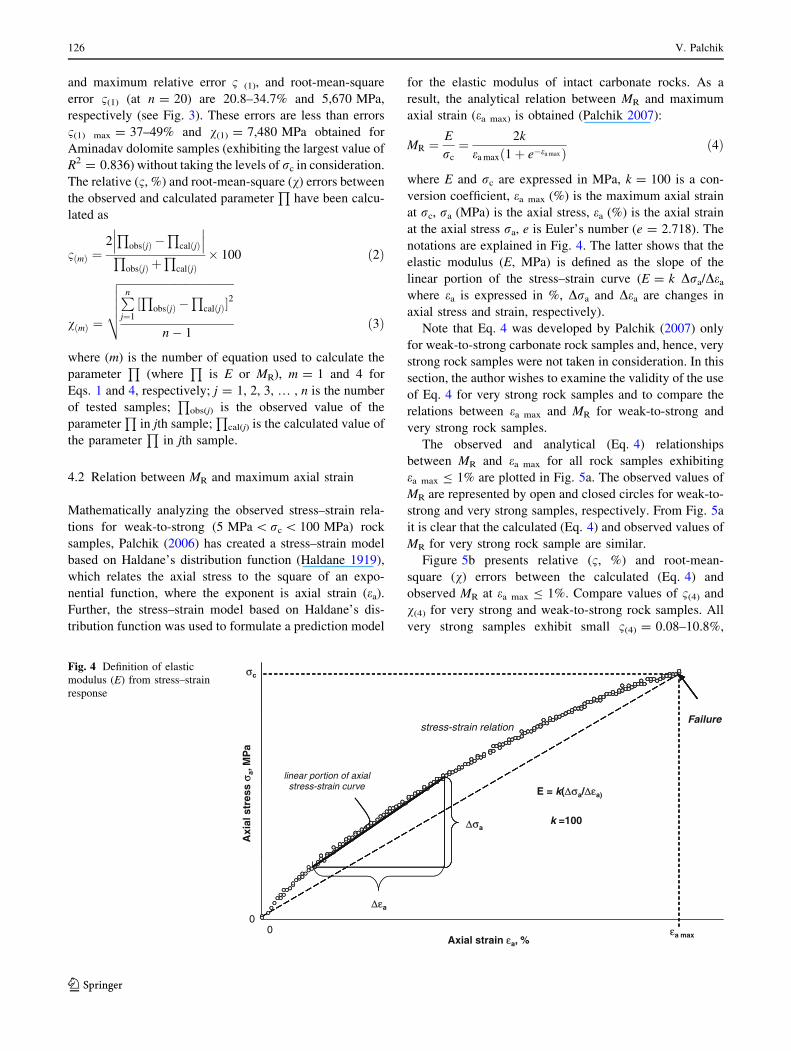
for the elastic modulus of intact carbonate rocks. As a
result, the analytical relation between MR and maximum
axial strain (ea max) is obtained (Palchik 2007):
MR ¼E
rc
¼ 2k
ea maxð1þ e�ea maxÞ ð4Þ
where E and rc are expressed in MPa, k = 100 is a con-
version coefficient, ea max (%) is the maximum axial strain
at rc, ra (MPa) is the axial stress, ea (%) is the axial strain
at the axial stress ra, e is Euler’s number (e = 2.718). The
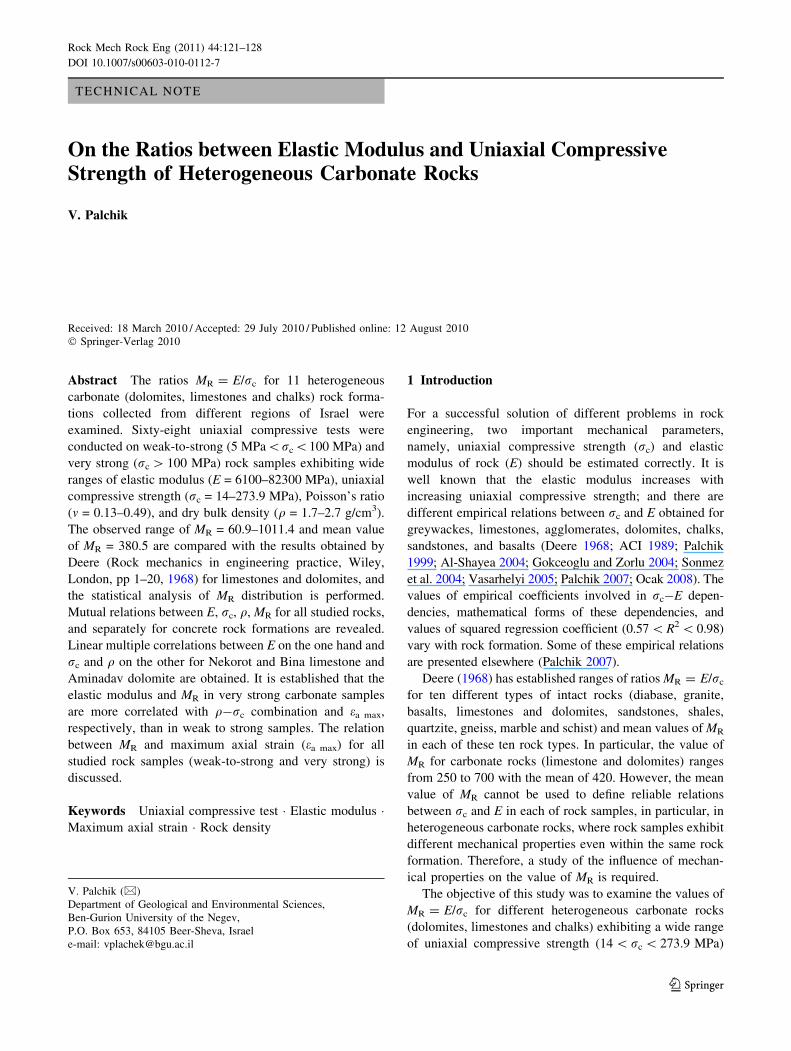
notations are explained in Fig. 4. The latter shows that the
elastic modulus (E, MPa) is defined as the slope of the
linear portion of the stress–strain curve (E = k Dra/Dea
where ea is expressed in %, Dra and Dea are changes in
axial stress and strain, respectively).
Note that Eq. 4 was developed by Palchik (2007) only
for weak-to-strong carbonate rock samples and, hence, very
strong rock samples were not taken in consideration. In this
section, the author wishes to examine the validity of the use
of Eq. 4 for very strong rock samples and to compare the
relations between ea max and MR for weak-to-strong and
very strong rock samples.
The observed and analytical (Eq. 4) relationships
between MR and ea max for all rock samples exhibiting
ea max B 1% are plotted in Fig. 5a. The observed values of
MR are represented by open and closed circles for weak-to-
strong and very strong samples, respectively. From Fig. 5a
it is clear that the calculated (Eq. 4) and observed values of
MR for very strong rock sample are similar.
Figure 5b presents relative (1, %) and root-mean-
square (v) errors between the calculated (Eq. 4) and
observed MR at ea max B 1%. Compare values of 1(4) and
v(4) for very strong and weak-to-strong rock samples. All
very strong samples exhibit small 1(4) = 0.08–10.8%,
Failurestress-strain relation
linear portion of axial
0
Axi
al s
tres
s σ a
, MP
a
Axial strain εa, %0 εa max
σc
Δεa
Δσa
E = k(Δσa/Δεa)
k =100
stress-strain curve
Fig. 4 Definition of elastic
modulus (E) from stress–strain
response
126 V. Palchik
123

whereas for weak-to-strong rock samples this value
reaches 20.1–24.3%. The value of v(4) = 23 for very
strong samples is less than v(4) = 43.6 for weak-to-strong
samples. Hence, parameter MR in very strong rock sam-
ples is more correlated with ea max than in weak-to-strong
samples.
5 Conclusions
The laboratory compressive tests, statistical analysis, and
empirical and analytical relations have been used to esti-
mate the values of MR = E/rc in heterogeneous carbonate
rocks. The following main conclusions are made:
• Although the mean value of MR observed in this study
(380.5 for all samples) and MR mean = 420 obtained by
Deere (1968) for limestones and dolomites are similar,
the range of MR = 60.9–1,011.4 for carbonate rocks is
wider than the range (250 \ MR \ 700) obtained by
Deere (1968). The range of MR observed in this study
does not overtop the range of 60 \ MR \ 1,600
obtained by Deere (1968) for 10 rock types (including
dolomite and limestone).
• The observations confirm that there are no general
empirical correlations (with reliable R2) between elastic
modulus (E) and uniaxial compressive strength (rc),
MR = E/rc and uniaxial compressive strength (rc),
elastic modulus (E) and dry bulk density (q), MR and
dry bulk density (q), uniaxial compressive strength (rc),
and dry bulk density (q) which could be suitable for all
studied heterogeneous carbonate rock formations.
• The elastic modulus (E) of some studied rock forma-
tions can be presented as a combined function of rc and
700
800
900
1000
1100
R
400
500
600
700
Val
ue
of
MR
100
200
300
0.1 0.2 0.3 0.4 0.5 0.6 0.7 0.8 0.9 1 1.1
Maximum axial strain (εεa max),%
weak -to- strong very strong Eq.(4)
10
15
20
25
Rel
ativ
e er
ror
(ζ(4
)), %
very strong samples weak- to -strong samples
χ(4) = 23
ζ(4) = 10 %
χ(4) = 43.6
0
5
1 4 7 10 13 16 19 22 25 28 31 34 37 40 43 46 49 52 55 58 61 64
Number of sample (i)
ζ(4) = 10 %
a
b
Fig. 5 Relations between
ea max B 1% and MR.
a Calculated (Eq. 4) and
observed MR; b relative (1(4), %)
and root-mean-square (v(4))
errors between calculated
(Eq. 4) and observed MR
On the Ratios between Elastic Modulus 127
123
q. The linear multiple correlations (Eq. 1) between
E and rc, q for Nekorot and Bina limestones, and
Aminadav dolomite were obtained. It is observed that
the elastic modulus in very strong carbonate samples is
more dependent on combined effect of rc and q (Eq. 1)
than in weak-to-strong rocks.
• It is observed that the parameter MR is inversely related
to the maximum axial strain (ea max). The ratio between
E and rc is exponential function of the maximum axial
strain (Eq. 4) not only in weak-to-strong, but also in
very strong carbonate rock samples. The parameter MR
in very strong rock samples is more correlated with
ea max than in weak-to-strong samples.
References
ACI (1989) Building code requirements for reinforced concrete (ACI
318-89). American Concrete Institute, Detroit
Al-Shayea NA (2004) Effect of testing methods and conditions on the
elastic properties of limestone rock. Eng Geol 74:139–156
Deere DU (1968) Geological considerations. In: Stagg KG, Zie-
nkiewicz OC (eds) Rock mechanics in engineering practice.
Wiley, London, pp 1–20
Gokceoglu C, Zorlu K (2004) A fuzzy model to predict the uniaxial
compressive strength and modulus of elasticity of problematic
rocks. Eng Appl Artif Intell 17(1):61–72
Haldane JBS (1919) The combination of linkage values and the
calculation of distances between the loci of linked factors.
Genetics 8:299–309
Hatzor YH, Palchik V (1998) A microstructure—based failure
criterion for Aminadav dolomites. Int J Rock Mech Min Sci
35(6):797–805
ISRM (1981) Rock characterization testing and monitoring. In: Brown
ET (ed) ISRM suggested methods. Pergamon Press, Oxford
Ocak I (2008) Estimating the modulus of elasticity of the rock
material from compressive strength and unit weight. J S Afr Inst
Min Metall 108(10):621–629
Palchik V (1999) Influence of porosity and elastic modulus on
uniaxial compressive strength in soft brittle porous sandstones.
Rock Mech Rock Eng 32(4):303–309
Palchik V (2006) Stress-strain model for carbonate rocks based on
Haldane’s distribution function. Rock Mech Rock Eng
39(3):215–232
Palchik V (2007) Use of stress-strain model based on Haldane’s
distribution function for prediction of elastic modulus. Int J Rock
Mech Min Sci 44(4):514–524
Palchik V, Hatzor YH (2004) The influence of porosity on tensile and
compressive strength of porous chalks. Rock Mech Rock Eng
37(4):331–341
Sonmez H, Tuncay E, Gokceoglu C (2004) Models to predict the
uniaxial compressive strength and the modulus of elasticity
for Ankara agglomerate. Int J Rock Mech Min Sci 41(5):717–729
Sonmez H, Gokceoglu C, Nefeslioglu HA, Kayabasi A (2006)
Estimation of rock modulus: for intact rocks with an artificial
neural network and for rock masses with a new empirical
equation. Int J Rock Mech Min Sci 43(2):224–235
Vasarhelyi B (2005) Statistical analysis of the influence of water
content on the strength of the Miocene limestone. Rock Mech
Rock Eng 38(1):69–76
128 V. Palchik
123