On the Physics of Flow Separation Along a Low Pressure Turbine Blade Under Unsteady Flow Conditions
23
Meinhard T. Schobeiri and Burak Öztürk Texas A&M University, College Station, Texas David E. Ashpis Glenn Research Center, Cleveland, Ohio On the Physics of Flow Separation Along a Low Pressure Turbine Blade Under Unsteady Flow Conditions NASA/TM—2003-212290 June 2003 GT–2003–38917
Transcript of On the Physics of Flow Separation Along a Low Pressure Turbine Blade Under Unsteady Flow Conditions

Meinhard T. Schobeiri and Burak ÖztürkTexas A&M University, College Station, Texas
David E. AshpisGlenn Research Center, Cleveland, Ohio
On the Physics of Flow Separation Alonga Low Pressure Turbine Blade UnderUnsteady Flow Conditions
NASA/TM—2003-212290
June 2003
GT–2003–38917

The NASA STI Program Office . . . in Profile
Since its founding, NASA has been dedicated tothe advancement of aeronautics and spacescience. The NASA Scientific and TechnicalInformation (STI) Program Office plays a key partin helping NASA maintain this important role.
The NASA STI Program Office is operated byLangley Research Center, the Lead Center forNASA’s scientific and technical information. TheNASA STI Program Office provides access to theNASA STI Database, the largest collection ofaeronautical and space science STI in the world.The Program Office is also NASA’s institutionalmechanism for disseminating the results of itsresearch and development activities. These resultsare published by NASA in the NASA STI ReportSeries, which includes the following report types:
• TECHNICAL PUBLICATION. Reports ofcompleted research or a major significantphase of research that present the results ofNASA programs and include extensive dataor theoretical analysis. Includes compilationsof significant scientific and technical data andinformation deemed to be of continuingreference value. NASA’s counterpart of peer-reviewed formal professional papers buthas less stringent limitations on manuscriptlength and extent of graphic presentations.
• TECHNICAL MEMORANDUM. Scientificand technical findings that are preliminary orof specialized interest, e.g., quick releasereports, working papers, and bibliographiesthat contain minimal annotation. Does notcontain extensive analysis.
• CONTRACTOR REPORT. Scientific andtechnical findings by NASA-sponsoredcontractors and grantees.
• CONFERENCE PUBLICATION. Collectedpapers from scientific and technicalconferences, symposia, seminars, or othermeetings sponsored or cosponsored byNASA.
• SPECIAL PUBLICATION. Scientific,technical, or historical information fromNASA programs, projects, and missions,often concerned with subjects havingsubstantial public interest.
• TECHNICAL TRANSLATION. English-language translations of foreign scientificand technical material pertinent to NASA’smission.
Specialized services that complement the STIProgram Office’s diverse offerings includecreating custom thesauri, building customizeddatabases, organizing and publishing researchresults . . . even providing videos.
For more information about the NASA STIProgram Office, see the following:
• Access the NASA STI Program Home Pageat http://www.sti.nasa.gov
• E-mail your question via the Internet [email protected]
• Fax your question to the NASA AccessHelp Desk at 301–621–0134
• Telephone the NASA Access Help Desk at301–621–0390
• Write to: NASA Access Help Desk NASA Center for AeroSpace Information 7121 Standard Drive Hanover, MD 21076

Meinhard T. Schobeiri and Burak ÖztürkTexas A&M University, College Station, Texas
David E. AshpisGlenn Research Center, Cleveland, Ohio
On the Physics of Flow Separation Alonga Low Pressure Turbine Blade UnderUnsteady Flow Conditions
NASA/TM—2003-212290
National Aeronautics andSpace Administration
Glenn Research Center
Prepared for theTurbo Expo 2003cosponsored by the American Society of Mechanical Engineersand the International Gas Turbine InstituteAtlanta, Georgia, June 16–19, 2003
GT–2003–38917
June 2003

Acknowledgments
The presented study is a part of the NASA Glenn Research Center Low Pressure Turbine Flow Physics Program.Meinhard T. Schobeiri and Burak Öztürk acknowledge the support by NASA Cooperative Agreement NCC3–793.
The authors also gratefully acknowledge Pratt & Whitney for providing the blade coordinates.
Available from
NASA Center for Aerospace Information7121 Standard DriveHanover, MD 21076
National Technical Information Service5285 Port Royal RoadSpringfield, VA 22100
Trade names or manufacturers’ names are used in this report foridentification only. This usage does not constitute an officialendorsement, either expressed or implied, by the National
Aeronautics and Space Administration.
This report contains preliminaryfindings, subject to revision as
analysis proceeds.
Available electronically at http://gltrs.grc.nasa.gov
The Propulsion and Power Program atNASA Glenn Research Center sponsored this work.
ON THE PHYSICS OF FLOW SEPARATION ALONG A LOW PRESSURE TURBINE BLADE UNDER UNSTEADY FLOW CONDITIONS
Meinhard T. Schobeiri and Burak Öztürk David E. Ashpis Texas A&M University National Aeronautics and Space Administration Turbomachinery Performance and Flow Research Laboratory Glenn Research Center College Station, Texas 77843 Cleveland, Ohio 44135-3191
ABSTRACT
The present study, which is the first of a series ofinvestigations dealing with specific issues of lowpressure turbine (LPT) boundary layer aerodynamics,is aimed at providing detailed unsteady boundary flowinformation to understand the underlying physics of theinception, onset, and extent of the separation zone. Adetailed experimental study on the behavior of theseparation zone on the suction surface of a highlyloaded LPT-blade under periodic unsteady wake flowis presented.
Experimental investigations were performed atTexas A&M Turbomachinery Performance and FlowResearch Laboratory using a large-scale unsteadyturbine cascade research facility with an integratedwake generator and test section unit. To account for ahigh flow deflection of LPT-cascades at design and off-design operating points, the entire wake generator andtest section unit including the traversing system isdesigned to allow a precise angle adjustment of thecascade relative to the incoming flow. This is done bya hydraulic platform, which simultaneously lifts androtates the wake generator and test section unit. Theunit is then attached to the tunnel exit nozzle with anangular accuracy of better than 0.05o, which ismeasured electronically.
Utilizing a Reynolds number of 110,000 based onthe blade suction surface length and the exit velocity,one steady and two different unsteady inlet flowconditions with the corresponding passing frequencies,wake velocities and turbulence intensities areinvestigated using hot-wire anemometry. In addition tothe unsteady boundary layer measurements, bladesurface pressure measurements were performed at Re=50,000, 75,000, 100,000, and 125,000 at one steady andtwo periodic unsteady inlet flow conditions.
Detailed unsteady boundary layer measurementidentifies the onset and extent of the separation zone aswell as its behavior under unsteady wake flow. Theresults presented in ensemble-averaged and contour plotforms contribute to understanding the physics of theseparation phenomenon under periodic unsteady wakeflow. Several physical mechanisms are discussed.
NOMENCLATUREc blade chordcax axial chordCp pressure coefficient, dR rod diameterM number of samples N number of wake cyclesp, pt static, total pressurep1 static pressure of first tap on suction surface Re Reynolds number
1NASA/TM—2003-212290
Proceeding of the ASME Turbo Expo 2003Power for Land, Sea, and Air
June 16–19, 2003, Atlanta, Georgia, USA
GT–2003–38917
SB blade spacingSR rod spacings streamwise distance from blade leading edges0 blade suction surface arc lengtht timeTu turbulence intensityU belt translational velocityVax axial velocityVexit exit velocityV velocityv fluctuation velocityy normal distance from the surface( blades stagger angle< kinematic viscosityJ one wake-passing periodF cascade solidity, F = c/SB
n flow coefficient, n = Vax/US reduced frequency
INTRODUCTION
In recent years gas turbine engine aerodynamicistshave focused their attention on improving the efficiencyand performance of the low pressure turbine (LPT)component. Research at industry, research centers, andacademia has shown that reduction in blade count canbe achieved without substantially sacrificing theefficiency of the LPT-blading. This reductioncontributes to an increase in thrust/weight ratio, thusreducing the fuel consumption. Contrary to the highpressure turbine (HPT) that operates in a relatively highReynolds number environment, the LPT experiences avariation in Reynolds number ranging from 50,000 to250,000 dependent on operation conditions. Since themajor portion of the boundary layer, particularly alongthe suction surface, is laminar, the low Reynoldsnumber in conjunction with the local adverse pressuregradient makes it susceptible to flow separation, thusincreasing the complexity of the LPT- boundary layeraerodynamics. The periodic unsteady nature of theincoming flow associated with wakes substantiallyinfluences the boundary layer development includingthe onset and extent of the laminar separation and itsturbulent re-attachment. Of particular relevance incontext of LPT-aerodynamics is the interaction of thewake flow with the suction surface separation zone.While the phenomenon of the unsteady boundary layerdevelopment and transition in the absence of separationzones has been the subject of intensive research that hasled to better understanding the transition phenomenon,comprehending the multiple effect of mutuallyinteracting parameters on the LPT-boundary layerseparation and their physics still requires more research.
The significance of the unsteady flow effect on theefficiency and performance of compressor and turbinestages was recognized in the early seventies by severalresearchers. Fundamental studies by Pfeil and Herbst[1], Pfeil et al. [2], and Orth [3] studied and quantifiedthe effect of unsteady wake flow on the boundary layertransition along flat plates. Schobeiri and his co-workers [4, 5, 6, 7] experimentally investigated theeffects of periodic unsteady wake flow and pressuregradient on the boundary layer transition and heattransfer along the concave surface of a constantcurvature plate. The measurements were systematicallyperformed under different pressure gradients andunsteady wake frequencies using a squirrel cage typewake generator positioned upstream of the curved plate.Liu and Rodi [8] carried out boundary layer and heattransfer measurements on a turbine cascade, which wasinstalled downstream of a squirrel cage type wakegenerator mentioned previously.
Analyzing the velocity and the turbulence structureof the impinging wakes and their interaction with theboundary layer, Chakka and Schobeiri [7] developed anintermittency based unsteady boundary layer transitionmodel. The analysis revealed a universal pattern for therelative intermittency function for all frequencies andpressure gradient investigated. However, the aboveinvestigations were not sufficient to draw anyconclusion with regard to universal character of therelative intermittency function. Further detailedinvestigations of the unsteady boundary layer along ahigh Reynolds number turbine blade of the SpaceShuttle Main Engine (SSME) by Schobeiri et al. [9]and its subsequent analysis [10], [11], and [12] verifiedthe universal character of the relative intermittencyfunction. For this purpose, Schobeiri et al. [9] utilizeda conceptually different type wake generator, which isalso used for the investigation presented in this paper.Fottner and his co-workers [13], [14] and Schulte andHodson [15] used the same wake generating concept forinvestigating the influence of unsteady wake flow onthe LPT-boundary layer. Kaszeta, Simon, and Ashpis[16] experimentally investigated the effect of unsteadywakes on laminar-turbulent transition within a channelwith the side walls simulating the suction and pressuresurfaces of a LPT-blade. They utilized a retractablecascade of cylindrical rods for generating the unsteadywakes. Lou and Hourmouziadis [17] experimentallyinvestigated the effect of oscillating inlet flowconditions on laminar boundary layer separation alonga flat plate under a strong negative pressure gradientwhich was imposed by the opposite wall.
2NASA/TM—2003-212290
Using the surface mounted hot film measurementtechnique, Fottner and his co-workers [13], [14]Schröder [18], and Haueisen, Schröder, and Hennecke[19] documented strong interaction between wakes andthe suction surface separation zone on LPT- blades,both in wind tunnel cascade tests and in turbine rig.Furthermore, they investigated the boundary layertransition under the influence of periodic wakes alongthe LPT-surface and found that the interaction ofwakes with the boundary layer greatly affects the lossgeneration. Investigations by Halstead et al. [20] on alarge-scale LP-turbine use surface mounted hot films toacquire detailed information about the quasi-shearstress directly on the blade surface. As investigations byCardamone et al. [14] and Schröder [18] indicate, thebenefit of the wake-boundary layer interaction can beused for design procedure of modern gas turbineengines with reduced LPT- blade number withoutaltering the stage efficiency.
Most of the above mentioned studies on LP-turbinecascade aerodynamics have largely concentrated on themeasurement of the signals stemming from hot filmmounted on the suction and pressure surfaces of theblades under investigation. Although this technique iseffective in qualitatively reflecting the interaction of theunsteady wake with the boundary layer, because of lackof an appropriate calibration method, it is not capableof quantifying the surface properties such as the wallshear stress. The few boundary layer measurements arenot comprehensive enough to provide any conclusiveevidence for interpretation of the boundary layertransition and separation processes and their directimpact on the profile loss, which is a critical parameterfor blade design. Furthermore, numerical simulation ofunsteady LPT-blade aerodynamics using conventionalturbulence and transition models fails if applied to lowReynolds number cases. Recent work presented byCardamone et al. [14] shows that in the steady statecase at Re= 60,000, the separation is captured,however, in the unsteady case, the separation zone isnot reproduced.
The objective of the present study, which is thefirst of a series of investigations dealing with specificissues of LPT-boundary layer aerodynamics, is toprovide detailed unsteady boundary flow information tounderstand the underlying physics of the inception,onset, and extent of the separation zone. Furthermore,the unsteady boundary layer data from the present andplanned experimental investigations will serve to extendthe intermittency based unsteady boundary layertransition model developed by Schobeiri and his co-
workers [7, 11, 12] to the LPT-cases, where separationoccurs on the suction surface at low Reynolds numberat design and off-design points. Furthermore, theexperimental results are intended to serve as abenchmark data for comparison with numericalcomputation using DNS, LES or RANS-codes.
It is well known that boundary layer measurementis one of the time consuming aerodynamicmeasurements. Any attempt to increase the number ofparameters to be studied would inevitably result insubstantial increase of the measurement time.Considering this fact, the research facility described in[9] and [10] with state-of-the-art instrumentation hasbeen substantially modified to study systematically andefficiently the influence of periodic unsteady and highlyturbulent flow on LPT-cascade aerodynamics at thedesign and off-design incidence angles, where Reynoldsnumber, wake impingement frequency, free-streamturbulence, and the blade solidity can be variedindependently.
EXPERIMENTAL RESEARCH FACILITY
To investigate the effect of unsteady wake flow onturbine and compressor cascade aerodynamics,particularly on unsteady boundary layer transition, amulti-purpose large-scale cascade research facility wasdesigned and has been taken into operation since 1993.Since the facility in its original configuration isdescribed in [9] and [10], only a brief description of themodifications and the main components is given below.The research facility consists of a large centrifugal airsupplier, a diffuser, a settling chamber, a nozzle, anunsteady wake generator, and a turbine cascade testsection (Fig. 1). An air supplier with a volumetric flowrate of 15 m3/s is capable of generating a maximummean velocity of 100 m/s at the test section inlet. Thesettling chamber consists of five screens and onehoneycomb flow straightener to control the uniformityof the flow.
Two-dimensional periodic unsteady inlet flow issimulated by the translational motion of a wakegenerator (see Fig. 1), with a series of cylindrical rodsattached to two parallel operating timing belts driven byan electric motor. To simulate the wake width andspacing originating from the trailing edge of rotorblades, the diameter and number of rods can be varied.The rod diameter, its distance from the LPT-bladeleading edge, the wake width and the correspondingdrag coefficient are chosen according to the criteriaoutlined by Schobeiri et al. [21].
3NASA/TM—2003-212290
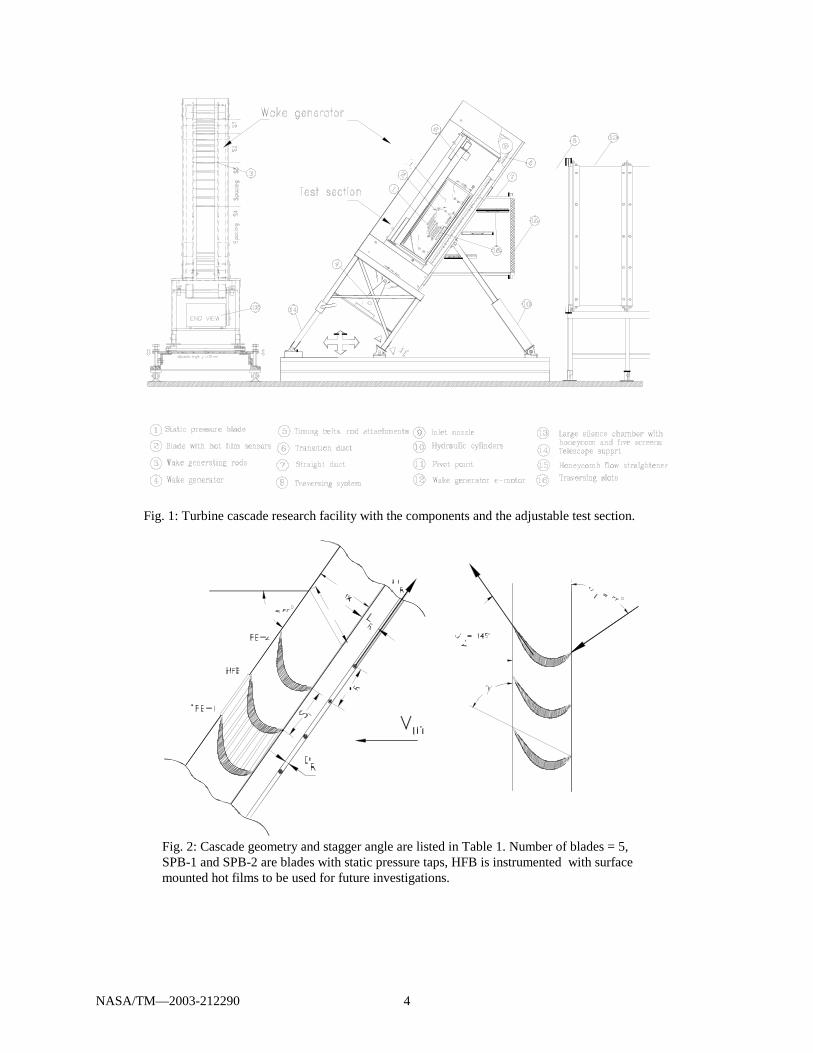
Fig. 1: Turbine cascade research facility with the components and the adjustable test section.
Fig. 2: Cascade geometry and stagger angle are listed in Table 1. Number of blades = 5,SPB-1 and SPB-2 are blades with static pressure taps, HFB is instrumented with surfacemounted hot films to be used for future investigations.
4NASA/TM—2003-212290
Parameters Values Parameters Values
Inlet velocity Vin = 4 m/s Inlet turbulence intensity Tuin = 1.0 %
Rod translational speed U = 5.0 m/s Blade Re-number Re = 110,000
Nozzle width W = 200.0 mm Blade height hB = 200 mm
Blade chord c = 203.44 mm Blade stagger angle ( = 26o
Blade axial chord cax = 182.85mm Cascade solidity F = 1.248
Blade suction surface length LSS = 270.32 mm Cascade angle * = 55°
Cascade flow coefficient M = 0.80 Cascade spacing SB = 163 mm
Inlet air angle, Fig. 2 "1 = 35.0° Exit air angle, Fig. 2 "2 = 145.0°
Rod diameter DR = 2.0 mm Rod distance to lead. edge LR = 122 mm
Cluster 1 (no rod, steady) SR = 4 S - parameter steady case S = 0.0
Cluster 2 rod spacing SR = 160.0 mm S - parameter for cluster 1 S = 1.59
Cluster 3 rod spacing SR = 80.0 mm S - parameter for cluster 2 S = 3.18
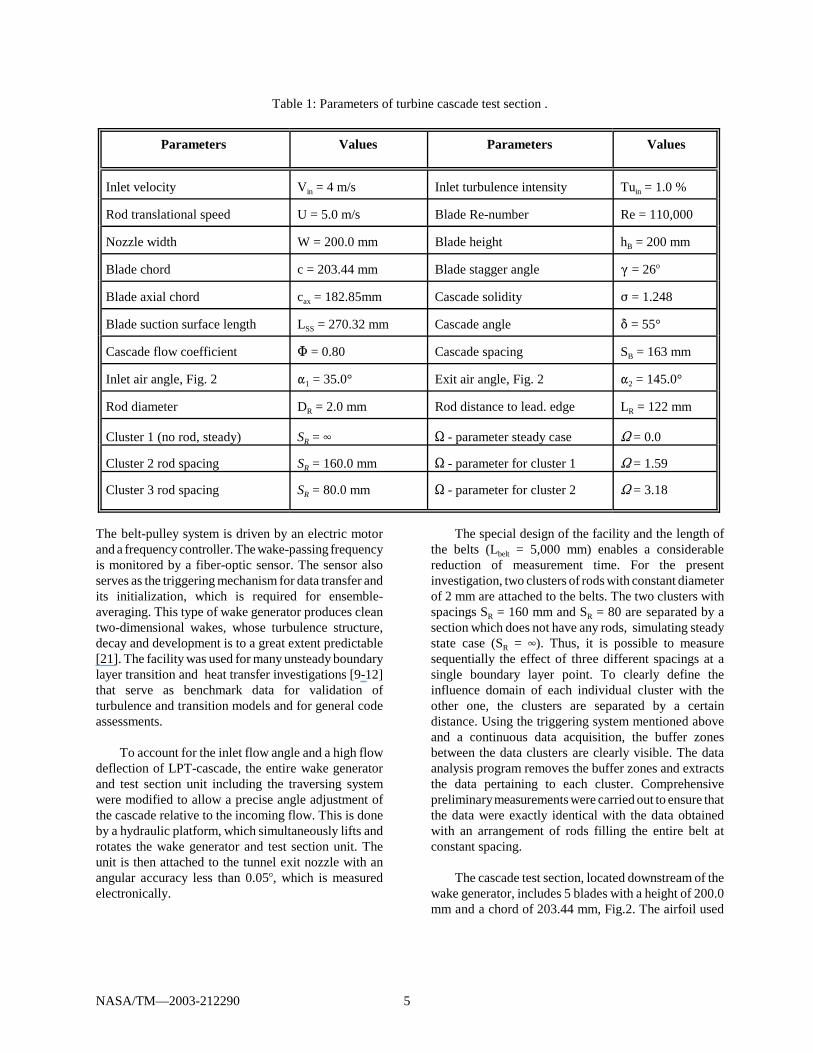
Table 1: Parameters of turbine cascade test section .
The belt-pulley system is driven by an electric motorand a frequency controller. The wake-passing frequencyis monitored by a fiber-optic sensor. The sensor alsoserves as the triggering mechanism for data transfer andits initialization, which is required for ensemble-averaging. This type of wake generator produces cleantwo-dimensional wakes, whose turbulence structure,decay and development is to a great extent predictable[21]. The facility was used for many unsteady boundarylayer transition and heat transfer investigations [9-12]that serve as benchmark data for validation ofturbulence and transition models and for general codeassessments.
To account for the inlet flow angle and a high flowdeflection of LPT-cascade, the entire wake generatorand test section unit including the traversing systemwere modified to allow a precise angle adjustment ofthe cascade relative to the incoming flow. This is doneby a hydraulic platform, which simultaneously lifts androtates the wake generator and test section unit. Theunit is then attached to the tunnel exit nozzle with anangular accuracy less than 0.05o, which is measuredelectronically.
The special design of the facility and the length ofthe belts (Lbelt = 5,000 mm) enables a considerablereduction of measurement time. For the presentinvestigation, two clusters of rods with constant diameterof 2 mm are attached to the belts. The two clusters withspacings SR = 160 mm and SR = 80 are separated by asection which does not have any rods, simulating steadystate case (SR = 4). Thus, it is possible to measuresequentially the effect of three different spacings at asingle boundary layer point. To clearly define theinfluence domain of each individual cluster with theother one, the clusters are separated by a certaindistance. Using the triggering system mentioned aboveand a continuous data acquisition, the buffer zonesbetween the data clusters are clearly visible. The dataanalysis program removes the buffer zones and extractsthe data pertaining to each cluster. Comprehensivepreliminary measurements were carried out to ensure thatthe data were exactly identical with the data obtainedwith an arrangement of rods filling the entire belt atconstant spacing.
The cascade test section, located downstream of thewake generator, includes 5 blades with a height of 200.0mm and a chord of 203.44 mm, Fig.2. The airfoil used
5NASA/TM—2003-212290

(1)
(2)
(3)
(4)
is the Pratt & Whitney “Pak B” airfoil, whose cascadegeometry is given in Table 1. The cascade test sectionexhibits the essential flow features such as laminarboundary layer separation that is inherent to typicalLPT- blades. The blade geometry was made availableto NASA researchers and academia to study the specificproblems of LPT-flow separation, its passive and activecontrol and its prevention. As shown in [9], a minimumblade number of 5 is necessary and sufficient to securea spatial periodicity for the cascade flow. Theperiodicity was verified by comparing the pressuredistributions of blade number 2 (SPB-1) and 4 (SPB-2)shown in Fig. 2. These blades were speciallymanufactured for measurement of pressure and showedidentical pressure distributions. A computer controlledtraversing system is used to measure the inlet velocitiesand turbulence intensities, as well as the boundarylayers on the suction and pressure surfaces. Thetraversing system is vertically mounted on theplexiglass side wall. It consists of a slider and a leadscrew that is connected to a DC- stepper motor with anencoder and decoder. The optical encoder provides acontinuous feedback to the stepper motor for accuratepositioning of the probes. The system is capable oftraversing in small steps up to 2.5 :m, which isspecifically required for boundary layer investigationswhere the measurement of the laminar sublayer is ofparticular interest.
INSTRUMENTATION, DATA ACQUISITION, ANDDATA REDUCTION
The data acquisition system is controlled by apersonal computer that includes a 16 channel, 12-bitanalog-digital (A/D) board (NI, PCI-MIO-16E-1). Timedependent velocity signals are obtained by using acommercial 3-channel (TSI, IFA-100), constanttemperature hot-wire anemometer system that has asignal conditioner with a variable low pass filter andadjustable gain. A Prandtl probe, placed upstream ofthe diffuser, monitors the reference velocity at a fixedlocation. The pneumatic probes are connected to highprecision differential pressure transducers (MKS220CD, range: 0 to 10mmHg) for digital readout.Several calibrated thermocouple are placed downstreamof the test section to constantly monitor the flowtemperature. The wake generator speed and the passingfrequency signals of the rods are transmitted by a fiber-optic trigger sensor. The passage signals of the rods aredetected by the sensor using a silver-coated reflectivepaint on one of the belts. This sensor gives an accuratereadout of the speed of the wake generator and thepassing frequency of the rods. The signals of the
pressure transducers, thermocouples, and trigger sensorsare transmitted to the A/D board and are sampled by thecomputer. The second and fourth blade are eachinstrumented with 48 static pressure taps. The taps areconnected to a scanivalve, which sequentially transferredthe pressure signals to one of the transducers that wasconnected to the A/D board. Using Labview software,the data acquisition system including the computer andthe A/D board was upgraded. Two adjacent blades areused for boundary layer measurement.
Steady and unsteady data are taken by anglecalibrated, custom designed miniature single hot wireprobes. At each boundary layer position samples weretaken at a rate of 20 kHz for each of 100 revolutions ofthe wake generator and low pass filtered at 10 kHz. Thedata were ensemble-averaged with respect to therotational period of the wake generator. Before final datawere taken, the number of samples per revolution and thetotal number of revolutions were varied to determine theoptimum settings for convergence of the ensemble-average.
For the steady state case, the instantaneous velocitycomponents are calculated from the temperaturecompensated instantaneous voltages by using thecalibration coefficients. The instantaneous velocity canbe represented in the following form.
Where is the mean (time-averaged) velocity and v isthe turbulent fluctuation component. The mean velocity,also known as the time-average, is given by:
where M is the total number of samples at one boundarylayer location. The root mean square value of theturbulent velocity fluctuation is obtained from theinstantaneous and mean velocities by:
and the local turbulence intensity is defined as:
The ensemble-averaged velocity, fluctuation velocity,and the turbulence intensity were calculated from theinstantaneous velocity samples by:
6NASA/TM—2003-212290
(6)
(7)
(5)
(8)
(10)
(9)
where N= 100 is the total number of wake generatorperiods and M the number of samples taken per period.<V (t)>ref is the reference ensemble averaged velocityfor the particular boundary layer traverse. Theensemble-averaged boundary layer parameters such asdisplacement thickness <*1>, momentum thickness<*2>, and shape factor <H12> are calculated as follows:
In the above equations the signs < > refer to ensembleaveraged quantities. For brevity we will drop < > inthe following discussions.
EXPERIMENTAL RESULTS AND DISCUSSION
Detailed surface pressure and boundary layermeasurements were performed at three different Re-numbers. For each Reynolds number three differentreduced frequencies were applied. For generation ofunsteady wakes, cylindrical rods with the diameter dR =2 mm were chosen to fulfill the similarity criterion thatrequires the generation of a drag coefficient CD that isapproximately equal to the CD of the turbine blade withthe chord and spacing given in Table 1 (for details werefer to the studies in [21] and [22].
To accurately account for the unsteadiness causedby the frequency of the individual wakes and theirspacings, the flow velocity, and the cascade parameters,we define a reduced frequency S that includes thecascade solidity F, the flow coefficient n, the bladespacing SB, and the rod spacing SR. Many researchers
have used Strouhal number as the unsteady flowparameter, which only includes the speed of the wakegenerator and the inlet velocity. However, the currentlydefined reduced frequency S is an extension of Strouhalnumber in the sense that it incorporates the rod spacingSR and the blade spacing SB in addition to the inletvelocity and wake generator speed. For surface pressuremeasurement rods with uniform spacings as specified inTable 1 were attached over the entire belt length. Forboundary layer measurement, however, clusters of rodswere used, as described previously.
Surface Pressure Distributions
Detailed static surface pressure measurements weretaken at Re=50,000, 75,000, 100,000, and 125,000 usingthe two static pressure blades SPB-1 and SPB-2 shownin Fig. 2. The two blades measured identical staticpressure distributions confirming the spatial periodicity.For each Reynolds number three different reducedfrequencies, namely S = 0.0, 1.59, and 3.18, are appliedthat correspond to the rod spacings SR = 4, 160 mm, and80 mm. The pressure distributions in Fig. 3, whichpertain to SPB-1, show the results of one steady and twounsteady cases. The pressure signals inherently signifythe time-averaged pressure because of the internalpneumatic damping effect of the connecting pipes to thetransducer. The noticeable deviation in pressuredistribution between the steady and unsteady cases,especially on the suction surface, is due to the dragforces caused by the moving rods. The drag forces areimposed on the main stream and cause momentumdeficiency that lead to a reduction of the total and staticpressure.
The time-averaged pressure coefficients along thepressure and suction surfaces are plotted in Fig. 3.Starting with Re=50,000 and steady state with S=0shown in Fig 3a, the suction surface (upper portion),exhibits a strong negative pressure gradient. The flowaccelerates at a relatively steep rate and reaches itsmaximum surface velocity that corresponds to theminimum at . Passing through the
minimum pressure, the fluid particles within theboundary layer encounter a positive pressure gradientthat causes a sharp deceleration until has been
reached. This point signifies the beginning of the laminarboundary layer separation and the onset of a separationzone. As seen in the subsequent boundary layerdiscussion, the part of the separation zone characterizedby a constant cp- plateau extends up to , thusoccupying more than 19% of the suction surface.
7NASA/TM—2003-212290
s/so
Cp
0 0.2 0.4 0.6 0.8 1
-4
-3
-2
-1
0
1
no rod160 mm80 mm
Re=50,000
Sta
rt:0
.555
SE
:0.7
46
UE
:0.6
64
(a)
s/so
Cp
0 0.2 0.4 0.6 0.8 1
-4
-3
-2
-1
0
1
no rod160 mm80 mm
Re=75,000
(b)
s/so
Cp
0 0.2 0.4 0.6 0.8 1
-4
-3
-2
-1
0
1
no rod160 mm80 mm
Re=125,000
(d)
s/so
Cp
0 0.2 0.4 0.6 0.8 1
-4
-3
-2
-1
0
1
no rod160 mm80 mm
Re=100,000
Sar
t:0.
555
SE
:0.7
46
UE
:0.6
64
(c)
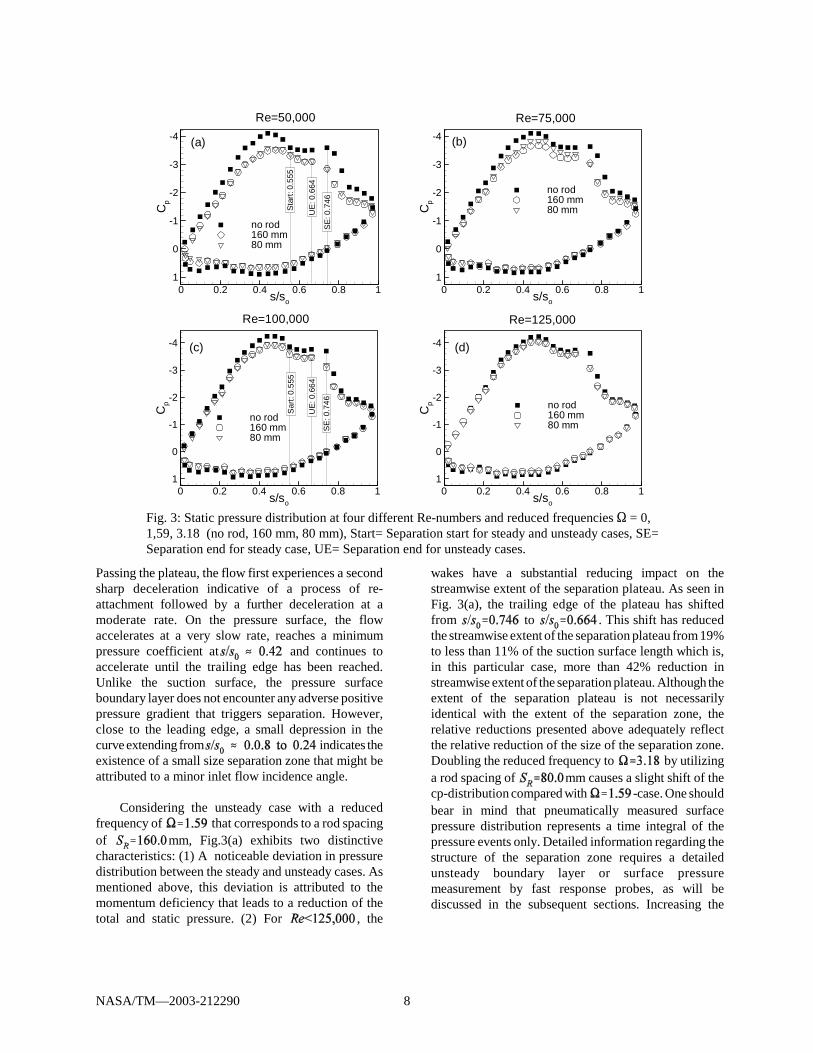
Fig. 3: Static pressure distribution at four different Re-numbers and reduced frequencies S = 0,1,59, 3.18 (no rod, 160 mm, 80 mm), Start= Separation start for steady and unsteady cases, SE=Separation end for steady case, UE= Separation end for unsteady cases.
Passing the plateau, the flow first experiences a secondsharp deceleration indicative of a process of re-attachment followed by a further deceleration at amoderate rate. On the pressure surface, the flowaccelerates at a very slow rate, reaches a minimumpressure coefficient at and continues toaccelerate until the trailing edge has been reached.Unlike the suction surface, the pressure surfaceboundary layer does not encounter any adverse positivepressure gradient that triggers separation. However,close to the leading edge, a small depression in thecurve extending from indicates theexistence of a small size separation zone that might beattributed to a minor inlet flow incidence angle.
Considering the unsteady case with a reducedfrequency of that corresponds to a rod spacingof mm, Fig.3(a) exhibits two distinctivecharacteristics: (1) A noticeable deviation in pressuredistribution between the steady and unsteady cases. Asmentioned above, this deviation is attributed to themomentum deficiency that leads to a reduction of thetotal and static pressure. (2) For , the
wakes have a substantial reducing impact on thestreamwise extent of the separation plateau. As seen inFig. 3(a), the trailing edge of the plateau has shiftedfrom to . This shift has reducedthe streamwise extent of the separation plateau from 19%to less than 11% of the suction surface length which is,in this particular case, more than 42% reduction instreamwise extent of the separation plateau. Although theextent of the separation plateau is not necessarilyidentical with the extent of the separation zone, therelative reductions presented above adequately reflectthe relative reduction of the size of the separation zone.Doubling the reduced frequency to by utilizinga rod spacing of mm causes a slight shift of thecp-distribution compared with -case. One shouldbear in mind that pneumatically measured surfacepressure distribution represents a time integral of thepressure events only. Detailed information regarding thestructure of the separation zone requires a detailedunsteady boundary layer or surface pressuremeasurement by fast response probes, as will bediscussed in the subsequent sections. Increasing the
8NASA/TM—2003-212290
0 0.25 0.5v(m/s)
0
2
4
6
8
10
s/s o
=0.
588
0 0.5 1v(m/s)
0
5
10
15
20
s/s o=
0.70
5
0 0.5 1v(m/s)
0
10
20
30
40
50
60
s/s o
=0.
951
0 2 4 6 8V(m/s)
0
2
4
6
8
10
y(m
m)
s/so=0.52
(a)
no rod160 mm80 mm
0 2 4 6 8V(m/s)
0
10
20
30
40
50
60
s/so=0.951
no rod160 mm80 mm
0 2 4 6 8V(m/s)
0
2
4
6
8
10
s/so=0.588no rod160 mm80 mm
0 2 4 6 8V(m/s)
0
5
10
15
20
s/so=0.705
no rod160 mm80 mm
0 0.25 0.5v(m/s)
0
2
4
6
8
10
y(m
m)
s/s o=
0.52
(b)
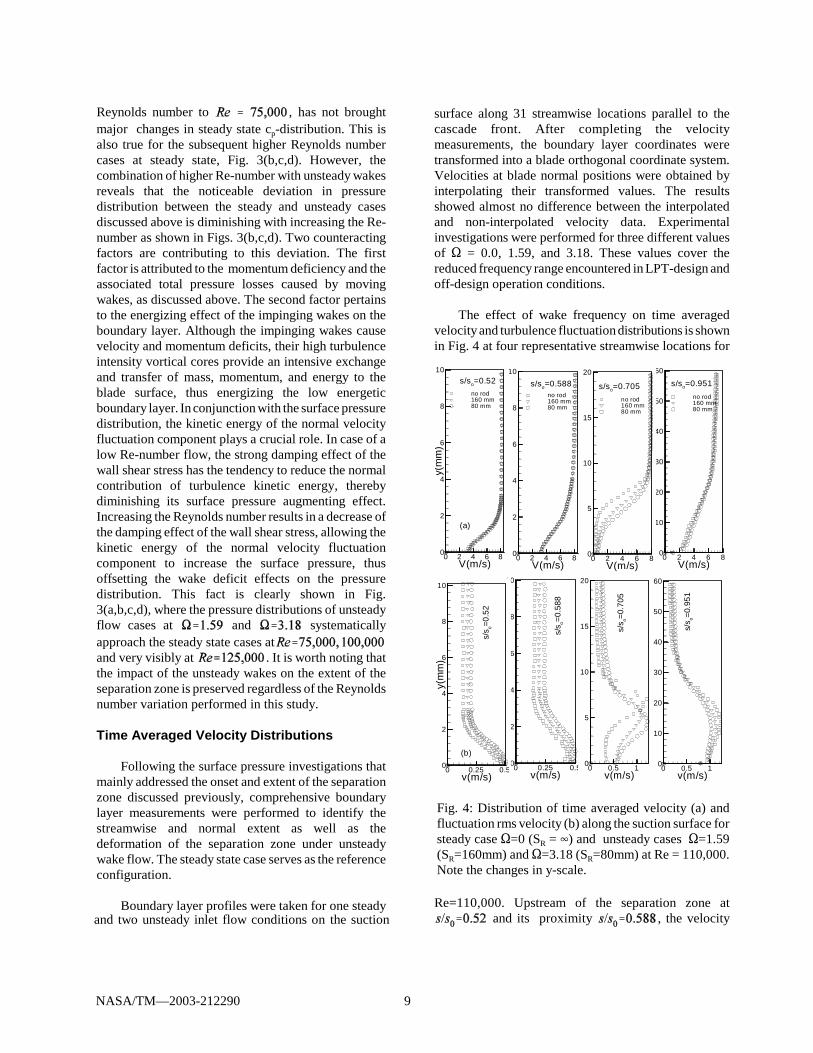
Fig. 4: Distribution of time averaged velocity (a) andfluctuation rms velocity (b) along the suction surface forsteady case S=0 (SR = 4) and unsteady cases S=1.59(SR=160mm) and S=3.18 (SR=80mm) at Re = 110,000.Note the changes in y-scale.
Reynolds number to , has not broughtmajor changes in steady state cp-distribution. This isalso true for the subsequent higher Reynolds numbercases at steady state, Fig. 3(b,c,d). However, thecombination of higher Re-number with unsteady wakesreveals that the noticeable deviation in pressuredistribution between the steady and unsteady casesdiscussed above is diminishing with increasing the Re-number as shown in Figs. 3(b,c,d). Two counteractingfactors are contributing to this deviation. The firstfactor is attributed to the momentum deficiency and theassociated total pressure losses caused by movingwakes, as discussed above. The second factor pertainsto the energizing effect of the impinging wakes on theboundary layer. Although the impinging wakes causevelocity and momentum deficits, their high turbulenceintensity vortical cores provide an intensive exchangeand transfer of mass, momentum, and energy to theblade surface, thus energizing the low energeticboundary layer. In conjunction with the surface pressuredistribution, the kinetic energy of the normal velocityfluctuation component plays a crucial role. In case of alow Re-number flow, the strong damping effect of thewall shear stress has the tendency to reduce the normalcontribution of turbulence kinetic energy, therebydiminishing its surface pressure augmenting effect.Increasing the Reynolds number results in a decrease ofthe damping effect of the wall shear stress, allowing thekinetic energy of the normal velocity fluctuationcomponent to increase the surface pressure, thusoffsetting the wake deficit effects on the pressuredistribution. This fact is clearly shown in Fig.3(a,b,c,d), where the pressure distributions of unsteadyflow cases at and systematicallyapproach the steady state cases atand very visibly at . It is worth noting thatthe impact of the unsteady wakes on the extent of theseparation zone is preserved regardless of the Reynoldsnumber variation performed in this study.
Time Averaged Velocity Distributions
Following the surface pressure investigations thatmainly addressed the onset and extent of the separationzone discussed previously, comprehensive boundarylayer measurements were performed to identify thestreamwise and normal extent as well as thedeformation of the separation zone under unsteadywake flow. The steady state case serves as the referenceconfiguration.
Boundary layer profiles were taken for one steadyand two unsteady inlet flow conditions on the suction
surface along 31 streamwise locations parallel to thecascade front. After completing the velocitymeasurements, the boundary layer coordinates weretransformed into a blade orthogonal coordinate system.Velocities at blade normal positions were obtained byinterpolating their transformed values. The resultsshowed almost no difference between the interpolatedand non-interpolated velocity data. Experimentalinvestigations were performed for three different valuesof S = 0.0, 1.59, and 3.18. These values cover thereduced frequency range encountered in LPT-design andoff-design operation conditions.
The effect of wake frequency on time averagedvelocity and turbulence fluctuation distributions is shownin Fig. 4 at four representative streamwise locations for
Re=110,000. Upstream of the separation zone at and its proximity , the velocity
9NASA/TM—2003-212290
100 200 300Time (ms)
1
2
3
4
Vel
ocity
(m/s
)
y=1.06mm
y=0.1mm
y=0.375mm
y=1.403y=2.1mm
y=4.1mmy=0.72mm
(a)
500 550 600Time (ms)
1
2
3
4
Vel
ocity
(m/s
) y=3.45
y=6.6mm y=10.1mm
y=0.1mm
y=0.375
(b)
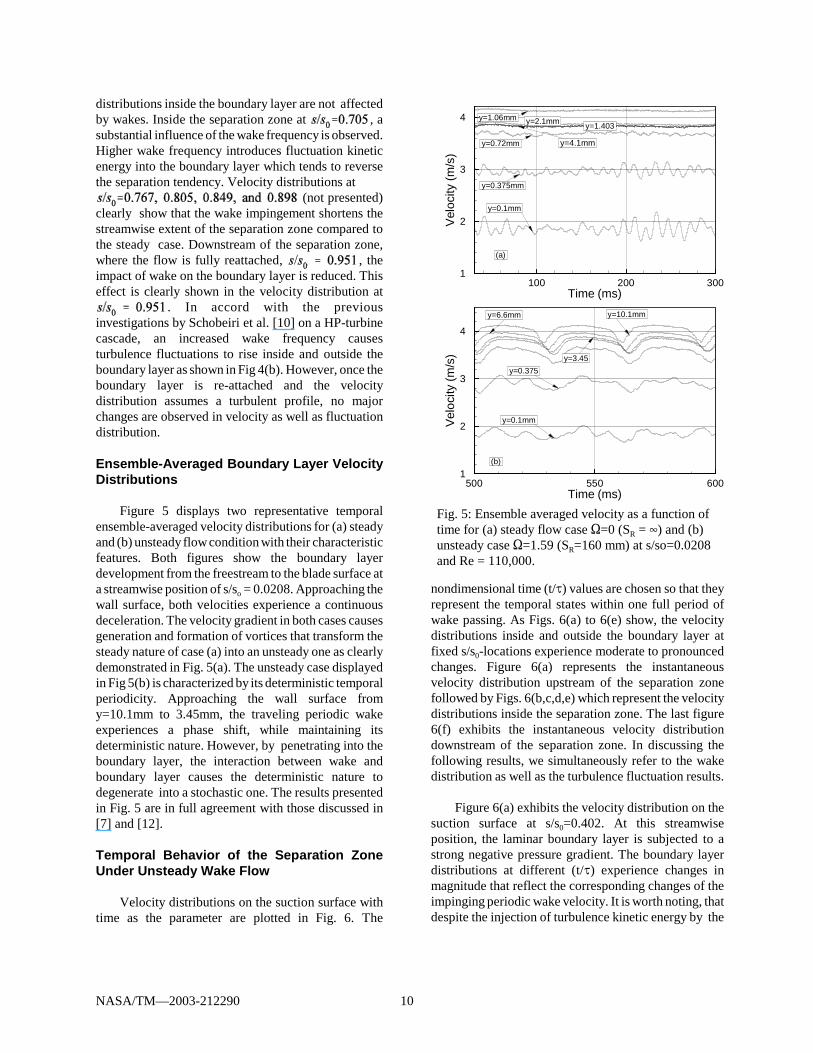
Fig. 5: Ensemble averaged velocity as a function oftime for (a) steady flow case S=0 (SR = 4) and (b)unsteady case S=1.59 (SR=160 mm) at s/so=0.0208and Re = 110,000.
distributions inside the boundary layer are not affectedby wakes. Inside the separation zone at , asubstantial influence of the wake frequency is observed.Higher wake frequency introduces fluctuation kineticenergy into the boundary layer which tends to reversethe separation tendency. Velocity distributions at
(not presented)clearly show that the wake impingement shortens thestreamwise extent of the separation zone compared tothe steady case. Downstream of the separation zone,where the flow is fully reattached, , theimpact of wake on the boundary layer is reduced. Thiseffect is clearly shown in the velocity distribution at
. In accord with the previousinvestigations by Schobeiri et al. [10] on a HP-turbinecascade, an increased wake frequency causesturbulence fluctuations to rise inside and outside theboundary layer as shown in Fig 4(b). However, once theboundary layer is re-attached and the velocitydistribution assumes a turbulent profile, no majorchanges are observed in velocity as well as fluctuationdistribution.
Ensemble-Averaged Boundary Layer VelocityDistributions
Figure 5 displays two representative temporalensemble-averaged velocity distributions for (a) steadyand (b) unsteady flow condition with their characteristicfeatures. Both figures show the boundary layerdevelopment from the freestream to the blade surface ata streamwise position of s/so = 0.0208. Approaching thewall surface, both velocities experience a continuousdeceleration. The velocity gradient in both cases causesgeneration and formation of vortices that transform thesteady nature of case (a) into an unsteady one as clearlydemonstrated in Fig. 5(a). The unsteady case displayedin Fig 5(b) is characterized by its deterministic temporalperiodicity. Approaching the wall surface fromy=10.1mm to 3.45mm, the traveling periodic wakeexperiences a phase shift, while maintaining itsdeterministic nature. However, by penetrating into theboundary layer, the interaction between wake andboundary layer causes the deterministic nature todegenerate into a stochastic one. The results presentedin Fig. 5 are in full agreement with those discussed in[7] and [12]. Temporal Behavior of the Separation ZoneUnder Unsteady Wake Flow
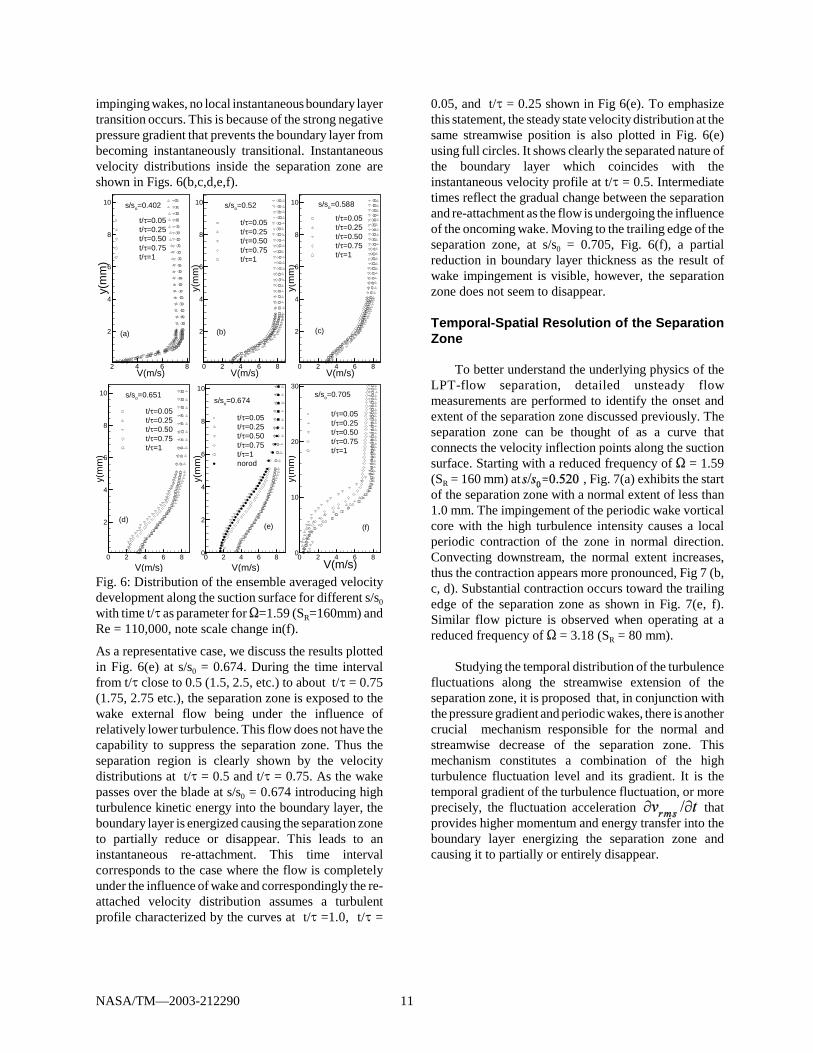
Velocity distributions on the suction surface withtime as the parameter are plotted in Fig. 6. The
nondimensional time (t/J) values are chosen so that theyrepresent the temporal states within one full period ofwake passing. As Figs. 6(a) to 6(e) show, the velocitydistributions inside and outside the boundary layer atfixed s/s0-locations experience moderate to pronouncedchanges. Figure 6(a) represents the instantaneousvelocity distribution upstream of the separation zonefollowed by Figs. 6(b,c,d,e) which represent the velocitydistributions inside the separation zone. The last figure6(f) exhibits the instantaneous velocity distributiondownstream of the separation zone. In discussing thefollowing results, we simultaneously refer to the wakedistribution as well as the turbulence fluctuation results.
Figure 6(a) exhibits the velocity distribution on thesuction surface at s/s0=0.402. At this streamwiseposition, the laminar boundary layer is subjected to astrong negative pressure gradient. The boundary layerdistributions at different (t/J) experience changes inmagnitude that reflect the corresponding changes of theimpinging periodic wake velocity. It is worth noting, thatdespite the injection of turbulence kinetic energy by the
10NASA/TM—2003-212290
0 2 4 6 8V(m/s)
2
4
6
8
10
y(m
m)
s/so=0.588
(c)
t/τ=0.05t/τ=0.25t/τ=0.50t/τ=0.75t/τ=1
2 4 6 8V(m/s)
2
4
6
8
10
y(m
m)
s/so=0.402
(a)
t/τ=0.05t/τ=0.25t/τ=0.50t/τ=0.75t/τ=1
0 2 4 6 8V(m/s)
2
4
6
8
10y(
mm
)s/so=0.52
(b)
t/τ=0.05t/τ=0.25t/τ=0.50t/τ=0.75t/τ=1
0 2 4 6 8
V(m/s)
2
4
6
8
10
y(m
m)
s/so=0.651
(d)
t/τ=0.05t/τ=0.25t/τ=0.50t/τ=0.75t/τ=1
0 2 4 6 8V(m/s)
0
10
20
30
y(m
m)
s/so=0.705
(f)
t/τ=0.05t/τ=0.25t/τ=0.50t/τ=0.75t/τ=1
0 2 4 6 8
V(m/s)
0
2
4
6
8
10
y(m
m)
s/so=0.674
(e)
t/τ=0.05t/τ=0.25t/τ=0.50t/τ=0.75t/τ=1norod
Fig. 6: Distribution of the ensemble averaged velocitydevelopment along the suction surface for different s/s0
with time t/J as parameter for S=1.59 (SR=160mm) andRe = 110,000, note scale change in(f).
impinging wakes, no local instantaneous boundary layertransition occurs. This is because of the strong negativepressure gradient that prevents the boundary layer frombecoming instantaneously transitional. Instantaneousvelocity distributions inside the separation zone areshown in Figs. 6(b,c,d,e,f).
As a representative case, we discuss the results plottedin Fig. 6(e) at s/s0 = 0.674. During the time intervalfrom t/J close to 0.5 (1.5, 2.5, etc.) to about t/J = 0.75(1.75, 2.75 etc.), the separation zone is exposed to thewake external flow being under the influence ofrelatively lower turbulence. This flow does not have thecapability to suppress the separation zone. Thus theseparation region is clearly shown by the velocitydistributions at t/J = 0.5 and t/J = 0.75. As the wakepasses over the blade at s/s0 = 0.674 introducing highturbulence kinetic energy into the boundary layer, theboundary layer is energized causing the separation zoneto partially reduce or disappear. This leads to aninstantaneous re-attachment. This time intervalcorresponds to the case where the flow is completelyunder the influence of wake and correspondingly the re-attached velocity distribution assumes a turbulentprofile characterized by the curves at t/J =1.0, t/J =
0.05, and t/J = 0.25 shown in Fig 6(e). To emphasizethis statement, the steady state velocity distribution at thesame streamwise position is also plotted in Fig. 6(e)using full circles. It shows clearly the separated nature ofthe boundary layer which coincides with theinstantaneous velocity profile at t/J = 0.5. Intermediatetimes reflect the gradual change between the separationand re-attachment as the flow is undergoing the influenceof the oncoming wake. Moving to the trailing edge of theseparation zone, at s/s0 = 0.705, Fig. 6(f), a partialreduction in boundary layer thickness as the result ofwake impingement is visible, however, the separationzone does not seem to disappear.
Temporal-Spatial Resolution of the SeparationZone
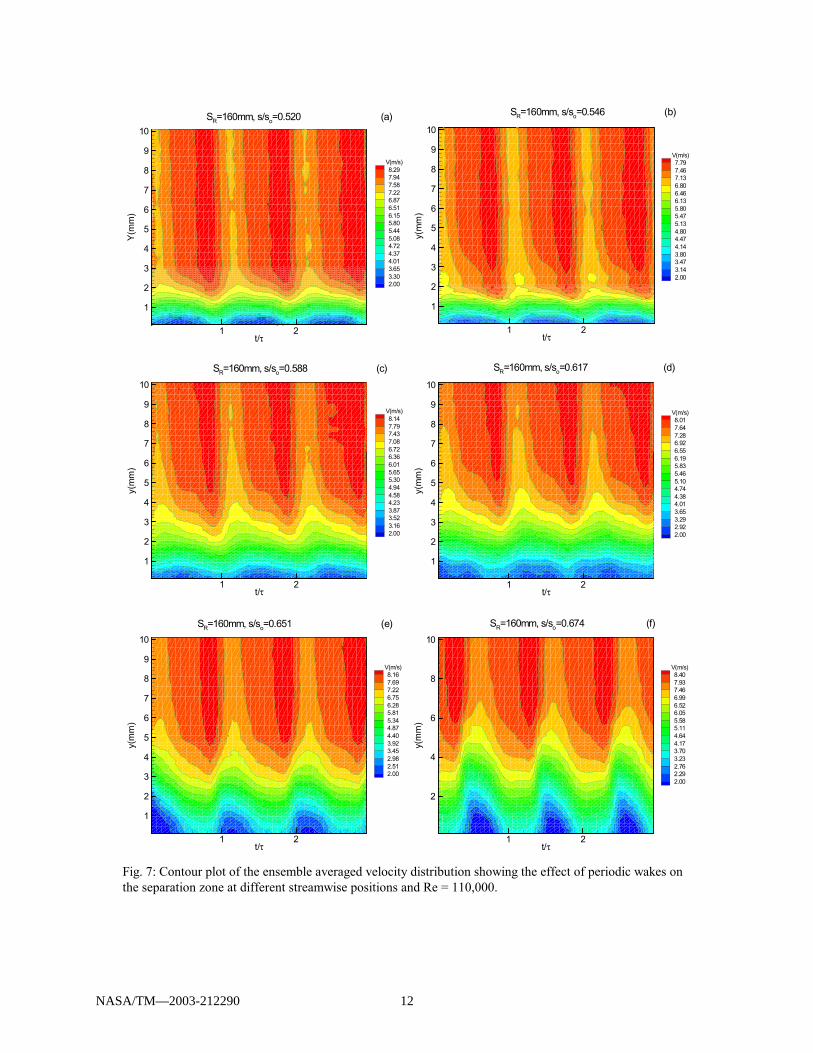
To better understand the underlying physics of theLPT-flow separation, detailed unsteady flowmeasurements are performed to identify the onset andextent of the separation zone discussed previously. Theseparation zone can be thought of as a curve thatconnects the velocity inflection points along the suctionsurface. Starting with a reduced frequency of S = 1.59(SR = 160 mm) at , Fig. 7(a) exhibits the startof the separation zone with a normal extent of less than1.0 mm. The impingement of the periodic wake vorticalcore with the high turbulence intensity causes a localperiodic contraction of the zone in normal direction.Convecting downstream, the normal extent increases,thus the contraction appears more pronounced, Fig 7 (b,c, d). Substantial contraction occurs toward the trailingedge of the separation zone as shown in Fig. 7(e, f).Similar flow picture is observed when operating at areduced frequency of S = 3.18 (SR = 80 mm).
Studying the temporal distribution of the turbulencefluctuations along the streamwise extension of theseparation zone, it is proposed that, in conjunction withthe pressure gradient and periodic wakes, there is anothercrucial mechanism responsible for the normal andstreamwise decrease of the separation zone. Thismechanism constitutes a combination of the highturbulence fluctuation level and its gradient. It is thetemporal gradient of the turbulence fluctuation, or moreprecisely, the fluctuation acceleration thatprovides higher momentum and energy transfer into theboundary layer energizing the separation zone andcausing it to partially or entirely disappear.
11NASA/TM—2003-212290
t/τ
y(mm)
1 2
1
2
3
4
5
6
7
8
9
10
V(m/s)7.797.467.136.806.466.135.805.475.134.804.474.143.803.473.142.00
SR=160mm, s/so=0.546 (b)
t/τ
y(mm)
1 2
1
2
3
4
5
6
7
8
9
10
V(m/s)8.147.797.437.086.726.366.015.655.304.944.584.233.873.523.162.00
SR=160mm, s/so=0.588 (c)
t/τ
y(mm)
1 2
1
2
3
4
5
6
7
8
9
10
V(m/s)8.017.647.286.926.556.195.835.465.104.744.384.013.653.292.922.00
SR=160mm, s/so=0.617 (d)
t/τ
y(mm)
1 2
1
2
3
4
5
6
7
8
9
10
V(m/s)8.167.697.226.756.285.815.344.874.403.923.452.982.512.00
SR=160mm, s/so=0.651 (e)
t/τ
y(mm)
1 2
2
4
6
8
10
V(m/s)8.407.937.466.996.526.055.585.114.644.173.703.232.762.292.00
SR=160mm, s/so=0.674 (f)
t/τ
Y(mm)
1 2
1
2
3
4
5
6
7
8
9
10
V(m/s)8.297.947.587.226.876.516.155.805.445.084.724.374.013.653.302.00
SR=160mm, s/so=0.520 (a)
Fig. 7: Contour plot of the ensemble averaged velocity distribution showing the effect of periodic wakes onthe separation zone at different streamwise positions and Re = 110,000.
12NASA/TM—2003-212290
t/τ
vx4,V(m/s)
0 1 2 31
2
3
4
5s/s0=0.651, y= 2.85mm
lowv
highV
Vorticalcore
Wakeexternalregion
Vorticalcore
Vorticalcore
fluctuation
velocity
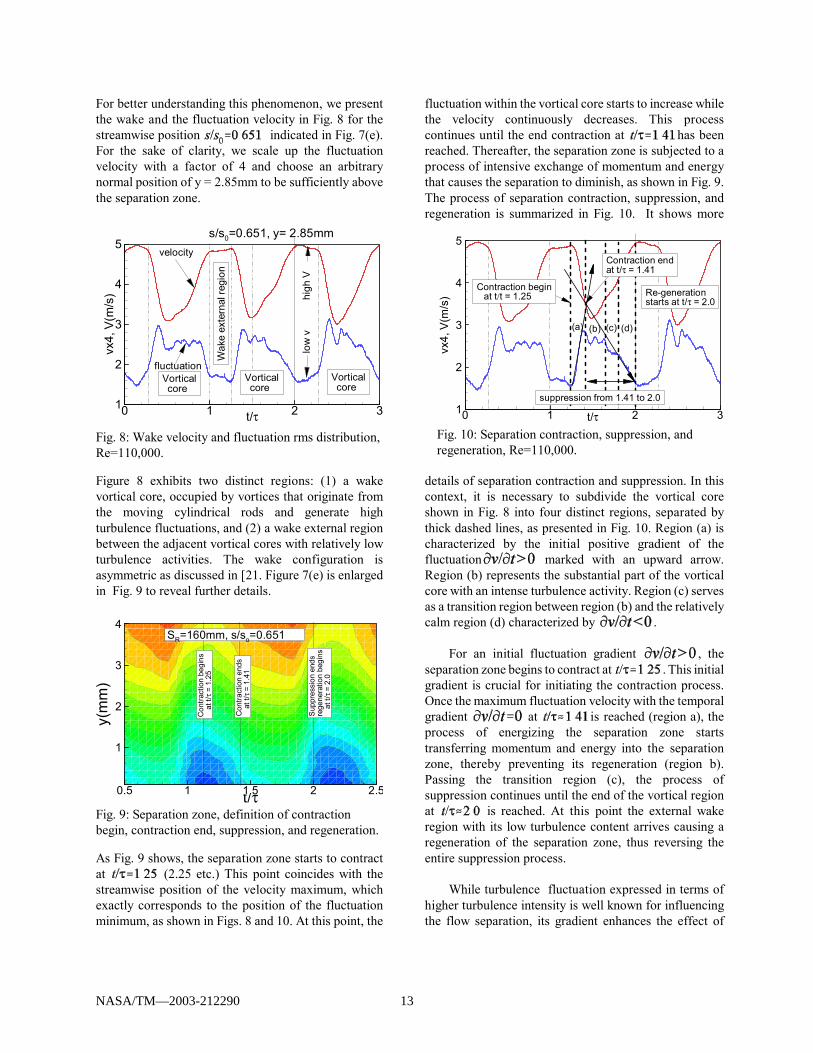
Fig. 8: Wake velocity and fluctuation rms distribution,Re=110,000.
Suppressionends
regenerationbegins
att/τ=2.0
Contractionbegins
att/τ=1.25
Contractionends
att/τ=1.41
t/τ
y(mm)
0.5 1 1.5 2 2.5
1
2
3
4SR=160mm, s/so=0.651
Fig. 9: Separation zone, definition of contractionbegin, contraction end, suppression, and regeneration.
Contraction beginat t/t = 1.25
(d)(a) (b) (c)
t/τ
vx4,V(m/s)
0 1 2 31
2
3
4
5
Re-generationstarts at t/τ = 2.0
suppression from 1.41 to 2.0
Contraction endat t/τ = 1.41
Fig. 10: Separation contraction, suppression, andregeneration, Re=110,000.
For better understanding this phenomenon, we presentthe wake and the fluctuation velocity in Fig. 8 for thestreamwise position indicated in Fig. 7(e).For the sake of clarity, we scale up the fluctuationvelocity with a factor of 4 and choose an arbitrarynormal position of y = 2.85mm to be sufficiently abovethe separation zone.
Figure 8 exhibits two distinct regions: (1) a wakevortical core, occupied by vortices that originate fromthe moving cylindrical rods and generate highturbulence fluctuations, and (2) a wake external regionbetween the adjacent vortical cores with relatively lowturbulence activities. The wake configuration isasymmetric as discussed in [21. Figure 7(e) is enlargedin Fig. 9 to reveal further details.
As Fig. 9 shows, the separation zone starts to contractat (2.25 etc.) This point coincides with thestreamwise position of the velocity maximum, whichexactly corresponds to the position of the fluctuationminimum, as shown in Figs. 8 and 10. At this point, the
fluctuation within the vortical core starts to increase whilethe velocity continuously decreases. This processcontinues until the end contraction at has beenreached. Thereafter, the separation zone is subjected to aprocess of intensive exchange of momentum and energythat causes the separation to diminish, as shown in Fig. 9.The process of separation contraction, suppression, andregeneration is summarized in Fig. 10. It shows more
details of separation contraction and suppression. In thiscontext, it is necessary to subdivide the vortical coreshown in Fig. 8 into four distinct regions, separated bythick dashed lines, as presented in Fig. 10. Region (a) ischaracterized by the initial positive gradient of thefluctuation marked with an upward arrow.Region (b) represents the substantial part of the vorticalcore with an intense turbulence activity. Region (c) servesas a transition region between region (b) and the relativelycalm region (d) characterized by .
For an initial fluctuation gradient , theseparation zone begins to contract at . This initialgradient is crucial for initiating the contraction process.Once the maximum fluctuation velocity with the temporalgradient at is reached (region a), theprocess of energizing the separation zone startstransferring momentum and energy into the separationzone, thereby preventing its regeneration (region b).Passing the transition region (c), the process ofsuppression continues until the end of the vortical regionat is reached. At this point the external wakeregion with its low turbulence content arrives causing aregeneration of the separation zone, thus reversing theentire suppression process.
While turbulence fluctuation expressed in terms ofhigher turbulence intensity is well known for influencingthe flow separation, its gradient enhances the effect of
13NASA/TM—2003-212290
SR=160mms/so=0.588
s/so=0.617s/so=0.52
t/τ
δ 2/(δ
2)Ω
=0
0 1 2 30.8
0.85
0.9
0.95
1
1.05
1.1
1.15
(b)
SR=160mm s/so=0.422
s/so=0.368s/so=0.384
(a)
t/τ
δ 2/(δ
2)Ω
=0
0 1 2 3
0.9
0.95
1
1.05
1.1
1.15
SR=160mm
s/so=0.705
s/so=0.849s/so=0.805
s/so=0.767
(c)
t/τ
δ 2/(δ
2)Ω
=0
0 1 2 30.6
0.7
0.8
0.9
1
1.1
1.2
1.3
1.4
1.5
1.6
1.7
1.8
Fig. 11: Ensemble-averaged relative momentumthickness distribution along the suction surface for S =1.59 (SR=160 mm) and Re = 110,000.
SR=160mm
s/so=0.705
s/so=0.767 s/so=0.805s/so=0.849(c)
t/τ
H12
/(H
12) Ω
=0
0 1 2 3
0.4
0.6
0.8
1
SR=160mm s/so=0.588
s/so=0.617s/so=0.52
(b)
t/τ
H12
/(H
12) Ω
=0
0 1 2 30.8
0.9
1
1.1
SR=160mm
s/so=0.368
s/so=0.384s/so=0.422
(a)
t/τ
H12
/(H
12) Ω
=0
0 1 2 3
0.9
1
1.1
Fig. 12: Ensemble averaged relative form parameterdistribution along the suction surface for S = 1.59(SR=160mm), Re = 110,000.
delaying the onset and reducing the extent of theseparation zone. The fluctuation gradient is an inherentfeature of the incoming periodic wake flow and doesnot exist in a statistically steady flow that might havehigh turbulence intensity.
The results clearly indicate that for the particularblade under investigation, one has to deal with a largeseparation on the suction surface. These observations incomparison with the steady state reference case suggestthat, once a separation zone is manifested, its size canbe significantly reduced by periodic wake impingement,but it cannot be completely removed. The resultspresented here are valid for blades with a similarpressure distribution discussed earlier. Since the onsetand extent of the separation zone is uniquely associatedwith the pressure gradient, blades can be designed with
less local adverse pressure gradient, whose separationonset can completely be suppressed by impinging wakes.
Boundary Layer Ensemble Averaged IntegralQuantities
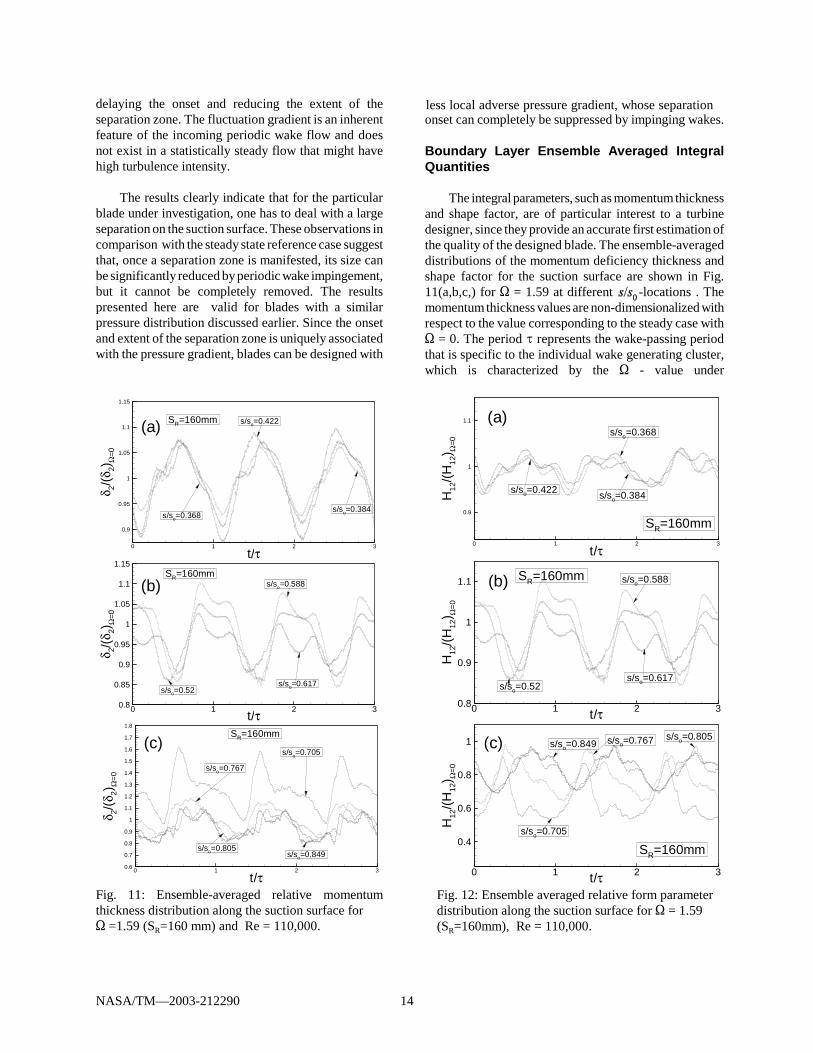
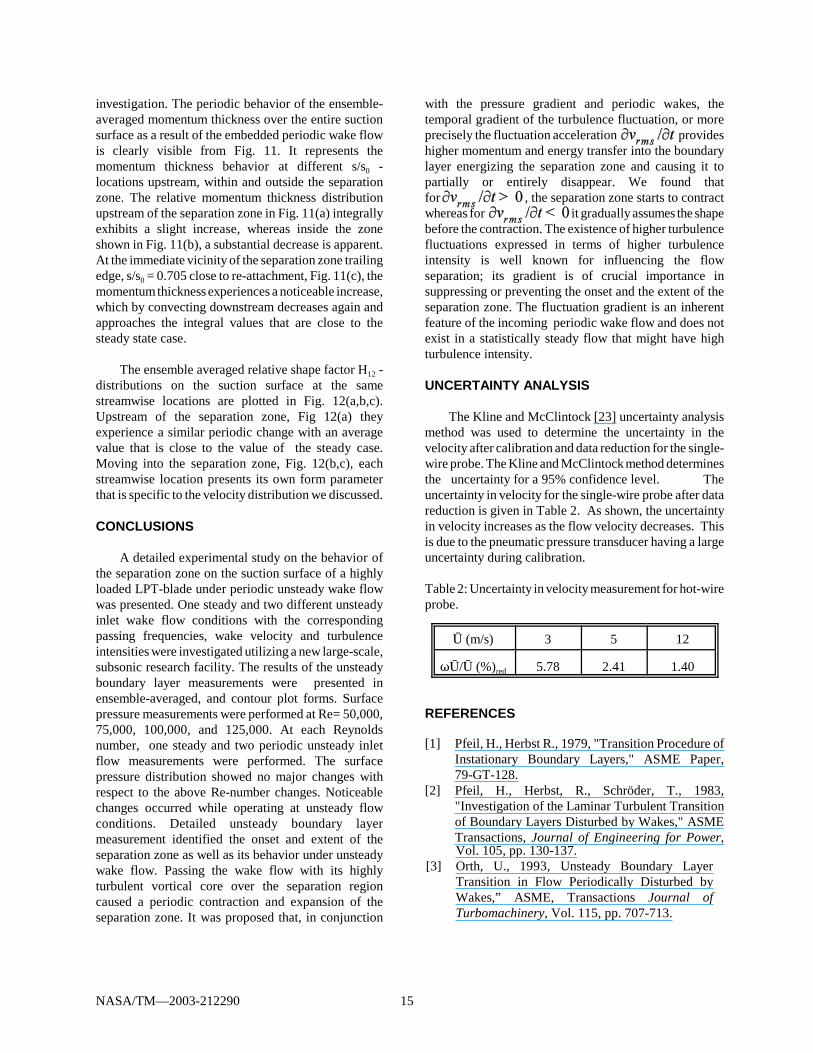
The integral parameters, such as momentum thicknessand shape factor, are of particular interest to a turbinedesigner, since they provide an accurate first estimation ofthe quality of the designed blade. The ensemble-averageddistributions of the momentum deficiency thickness andshape factor for the suction surface are shown in Fig.11(a,b,c,) for S = 1.59 at different -locations . Themomentum thickness values are non-dimensionalized withrespect to the value corresponding to the steady case withS = 0. The period J represents the wake-passing periodthat is specific to the individual wake generating cluster,which is characterized by the S - value under
14NASA/TM—2003-212290
investigation. The periodic behavior of the ensemble-averaged momentum thickness over the entire suctionsurface as a result of the embedded periodic wake flowis clearly visible from Fig. 11. It represents themomentum thickness behavior at different s/s0 -locations upstream, within and outside the separationzone. The relative momentum thickness distributionupstream of the separation zone in Fig. 11(a) integrallyexhibits a slight increase, whereas inside the zoneshown in Fig. 11(b), a substantial decrease is apparent.At the immediate vicinity of the separation zone trailingedge, s/s0 = 0.705 close to re-attachment, Fig. 11(c), themomentum thickness experiences a noticeable increase,which by convecting downstream decreases again andapproaches the integral values that are close to thesteady state case.
The ensemble averaged relative shape factor H12 -distributions on the suction surface at the samestreamwise locations are plotted in Fig. 12(a,b,c).Upstream of the separation zone, Fig 12(a) theyexperience a similar periodic change with an averagevalue that is close to the value of the steady case.Moving into the separation zone, Fig. 12(b,c), eachstreamwise location presents its own form parameterthat is specific to the velocity distribution we discussed.
CONCLUSIONS
A detailed experimental study on the behavior ofthe separation zone on the suction surface of a highlyloaded LPT-blade under periodic unsteady wake flowwas presented. One steady and two different unsteadyinlet wake flow conditions with the correspondingpassing frequencies, wake velocity and turbulenceintensities were investigated utilizing a new large-scale,subsonic research facility. The results of the unsteadyboundary layer measurements were presented inensemble-averaged, and contour plot forms. Surfacepressure measurements were performed at Re= 50,000,75,000, 100,000, and 125,000. At each Reynoldsnumber, one steady and two periodic unsteady inletflow measurements were performed. The surfacepressure distribution showed no major changes withrespect to the above Re-number changes. Noticeablechanges occurred while operating at unsteady flowconditions. Detailed unsteady boundary layermeasurement identified the onset and extent of theseparation zone as well as its behavior under unsteadywake flow. Passing the wake flow with its highlyturbulent vortical core over the separation regioncaused a periodic contraction and expansion of theseparation zone. It was proposed that, in conjunction
with the pressure gradient and periodic wakes, thetemporal gradient of the turbulence fluctuation, or moreprecisely the fluctuation acceleration provideshigher momentum and energy transfer into the boundarylayer energizing the separation zone and causing it topartially or entirely disappear. We found thatfor , the separation zone starts to contractwhereas for it gradually assumes the shapebefore the contraction. The existence of higher turbulencefluctuations expressed in terms of higher turbulenceintensity is well known for influencing the flowseparation; its gradient is of crucial importance insuppressing or preventing the onset and the extent of theseparation zone. The fluctuation gradient is an inherentfeature of the incoming periodic wake flow and does notexist in a statistically steady flow that might have highturbulence intensity.
UNCERTAINTY ANALYSIS
The Kline and McClintock [23] uncertainty analysismethod was used to determine the uncertainty in thevelocity after calibration and data reduction for the single-wire probe. The Kline and McClintock method determinesthe uncertainty for a 95% confidence level. Theuncertainty in velocity for the single-wire probe after datareduction is given in Table 2. As shown, the uncertaintyin velocity increases as the flow velocity decreases. Thisis due to the pneumatic pressure transducer having a largeuncertainty during calibration.
Table 2: Uncertainty in velocity measurement for hot-wireprobe.
â (m/s) 3 5 12
Tâ/â (%)red 5.78 2.41 1.40
REFERENCES
[1] Pfeil, H., Herbst R., 1979, "Transition Procedure ofInstationary Boundary Layers," ASME Paper,79-GT-128.
[2] Pfeil, H., Herbst, R., Schröder, T., 1983,"Investigation of the Laminar Turbulent Transitionof Boundary Layers Disturbed by Wakes," ASMETransactions, Journal of Engineering for Power,Vol. 105, pp. 130-137.
[3] Orth, U., 1993, Unsteady Boundary LayerTransition in Flow Periodically Disturbed byWakes,” ASME, Transactions Journal ofTurbomachinery, Vol. 115, pp. 707-713.
15NASA/TM—2003-212290
[4] Schobeiri, M. T., Radke, R. E., 1994, "Effects ofPeriodic Unsteady Wake Flow and PressureGradient on Boundary Layer Transition along theConcave Surface of a Curved Plate,"ASME Paper94-GT-327, presented at the International GasTurbine and Aero-Engine Congress andExposition, Hague, Niederlands, June 13-16,1994.
[5] Schobeiri, M.T., Read, K. Lewalle, J.2002,“Effect of Unsteady Wake Passing Frequency onBoundary Layer Transition, ExperimentalInvestigation and Wavelet Analysis,” of FluidsEngineering, in press.
[6] Wright, L., Schobeiri, M. T., 1999, “The Effect ofPeriodic Unsteady Flow on Boundary Layer andHeat Transfer on a Curved Surface,” ASMETransactions, Journal of Heat Transfer,November 1998, Vol. 120, pp. 22-33.
[7] Chakka, P., Schobeiri, M.T. , 1999, “Modelingof Unsteady Boundary Layer Transition on aCurved Plate under Periodic Unsteady FlowCondition: Aerodynamic and Heat TransferInvestigations,” ASME Transactions, Journal ofTurbomachinery, January 1999, Vol. 121, pp. 88-97.
[8] Liu, X., Rodi, W., 1991, "Experiments onTransitional Boundary Layers with Wake-InducedUnsteadiness," Journal of Fluid Mechanics, Vol.231 pp. 229-256.
[9] Schobeiri, M. T., Pappu, K., Wright, L., 1995,“Experimental Study of the Unsteady BoundaryLayer Behavior on a Turbine Cascade,” ASME95-GT-435, presented at the International GasTurbine and Aero-Engine Congress andExposition, Houston, Texas, June 5-8, 1995.
[10] Schobeiri, M. T., John, J., Pappu, K., 1997,“Experimental Study on the effect ofUnsteadiness on Boundary layer Development ona Linear Turbine Cascade,” Journal ofExperiments in Fluids, 23 (1997), pp. 303-316.
[11] Schobeiri, M. T., Wright, L., Chakka, P., 1998“Periodic Unsteady Flow Aerodynamics and HeatTransfer Studies on a Curved Surface, CombinedPart I and II," in press , International Journal ofRotating Machinery.
[12] Schobeiri, M. T., Chakka, P., 2002, “Predictionof Turbine Blade Heat Transfer andAerodynamics Using Unsteady Boundary LayerTransition Model,” International Journal of Heatand Mass Transfer, 45 (2002) pp. 815-829
[13] Brunner, S, Fottner, L, Schiffer, 2000, “Comparisonof two highly loaded turbine cascade under theinfluence of wake-induced transition,” ASME 2000-GT-268, presented at the International Gas Turbineand Aero-Engine Congress and Exposition, Munich,Germany, May 8-11, 2000.
[14] Cardamone, P, Stadtmüller, Fottner, L, Schiffer,2000, “Numerical Investigation of the Wake-Boundary Layer Interaction on a Highly Loaded LP-Turbine Cascade Blade,” ASME 2002-GT-30367,presented at the International Gas Turbine andAero-Engine Congress and Exposition, Amsterdam,Niederlands, June 3-6, 2002.
[15] Schulte, V., Hodson, H. P., 1996, “Unsteady Wake-Induced Boundary Layer Transition in High Lift LPTurbines,” ASME Paper 96-GT-486.
[16] Kaszeta, R., W., Simon T. W, Ashpis, D.E.,2001,“Experimental Investigation of Transition toTurbulence as Affected by Passing Wakes ,” ASMEPaper 2001-GT-0195.
[17] Lou, W., Hourmouziadis, J., 2000,“Separationbubbles under Steady and Periodic Unsteady MainFlow Conditions,”ASME Paper 200-GT-270.
[18] Schröder, Th., 1989, “Measurements with hot-filmprobes and surface mounted hot film gages in amulti-stage low-pressure turbine,” EuropeanPropulsion Forum, Bath, UK.
[19] Hauieisen V., Schröder, Th., Hennecke D., 1997,“Advanced Non-Intrusive for propulsion engines,”AGARD-CP-598.
[20] Halstead, D.E., Wisler, D, C., Okiishi, T.H, Walker,G.J., Hodson, H.P., and Shin, H.-W,1997, “Boundary layer development in axialcompressors and turbines: Part 3 of 4,” ASMETransactions, Journal of Turbomachinery, 119, pp.225-237
[21] Schobeiri, M. T., John, J., Pappu, K., 1996,“Development of Two-Dimensional Wakes WithinCurved Channels, Theoretical Framework andExperimental Investigation,”, ASME Transactions,Journal of Turbomachinery, July, 1996, Vol. 118,pp. 506-518.
[22] Eifler, J., 1975, "Zur Frage der freien turbulentenStrömungen, insbesondere hinter ruhenden undbewegten Zylindern," Dissertation D-17, TechnischeHochschule Darmstadt, Germany.
[23] Kline, S. J., and McKlintock, F. A., “DescribingUncertainties in Single-Sample Experiments,”Mechanical Engineering, Vol. 75, Jan. 1953, pp. 3-8.
16NASA/TM—2003-212290

This publication is available from the NASA Center for AeroSpace Information, 301–621–0390.
REPORT DOCUMENTATION PAGE
2. REPORT DATE
19. SECURITY CLASSIFICATION OF ABSTRACT
18. SECURITY CLASSIFICATION OF THIS PAGE
Public reporting burden for this collection of information is estimated to average 1 hour per response, including the time for reviewing instructions, searching existing data sources,gathering and maintaining the data needed, and completing and reviewing the collection of information. Send comments regarding this burden estimate or any other aspect of thiscollection of information, including suggestions for reducing this burden, to Washington Headquarters Services, Directorate for Information Operations and Reports, 1215 JeffersonDavis Highway, Suite 1204, Arlington, VA 22202-4302, and to the Office of Management and Budget, Paperwork Reduction Project (0704-0188), Washington, DC 20503.
NSN 7540-01-280-5500 Standard Form 298 (Rev. 2-89)Prescribed by ANSI Std. Z39-18298-102
Form Approved
OMB No. 0704-0188
12b. DISTRIBUTION CODE
8. PERFORMING ORGANIZATION REPORT NUMBER
5. FUNDING NUMBERS
3. REPORT TYPE AND DATES COVERED
4. TITLE AND SUBTITLE
6. AUTHOR(S)
7. PERFORMING ORGANIZATION NAME(S) AND ADDRESS(ES)
11. SUPPLEMENTARY NOTES
12a. DISTRIBUTION/AVAILABILITY STATEMENT
13. ABSTRACT (Maximum 200 words)
14. SUBJECT TERMS
17. SECURITY CLASSIFICATION OF REPORT
16. PRICE CODE
15. NUMBER OF PAGES
20. LIMITATION OF ABSTRACT
Unclassified Unclassified
Technical Memorandum
Unclassified
National Aeronautics and Space AdministrationJohn H. Glenn Research Center at Lewis FieldCleveland, Ohio 44135–3191
1. AGENCY USE ONLY (Leave blank)
10. SPONSORING/MONITORING AGENCY REPORT NUMBER
9. SPONSORING/MONITORING AGENCY NAME(S) AND ADDRESS(ES)
National Aeronautics and Space AdministrationWashington, DC 20546–0001
Available electronically at http://gltrs.grc.nasa.gov
June 2003
NASA TM—2003-212290GT–2003–38917
E–13852
WBS–22–708–28–07
22
On the Physics of Flow Separation Along a Low Pressure Turbine Blade UnderUnsteady Flow Conditions
Meinhard T. Schobeiri, Burak Öztürk, and David E. Ashpis
Boundary layer; Separation; Turbomachinery; Transition; Turbines; Bypass transition;Wakes; Turbulent spots
Unclassified -UnlimitedSubject Categories: 02, 34, and 07 Distribution: Nonstandard
Prepared for the Turbo Expo 2003 cosponsored by the American Society of Mechanical Engineers and the InternationalGas Turbine Institute, Atlanta, Georgia, June 16–19, 2003. Meinhard T. Schobeiri and Burak Öztürk, Texas A&MUniversity, Turbomachinery Performance and Flow Research Laboratory, College Station, Texas 77843; David E.Ashpis, NASA Glenn Research Center. Responsible person, David E. Ashpis, organization code 5820, 216–433–8317.
The present study, which is the first of a series of investigations dealing with specific issues of low pressure turbine (LPT) boundarylayer aerodynamics, is aimed at providing detailed unsteady boundary flow information to understand the underlying physics of theinception, onset, and extent of the separation zone. A detailed experimental study on the behavior of the separation zone on the suctionsurface of a highly loaded LPT-blade under periodic unsteady wake flow is presented. Experimental investigations were performed atTexas A&M Turbomachinery Performance and Flow Research Laboratory using a large-scale unsteady turbine cascade research facilitywith an integrated wake generator and test section unit. To account for a high flow deflection of LPT-cascades at design and off-designoperating points, the entire wake generator and test section unit including the traversing system is designed to allow a precise angleadjustment of the cascade relative to the incoming flow. This is done by a hydraulic platform, which simultaneously lifts and rotates thewake generator and test section unit. The unit is then attached to the tunnel exit nozzle with an angular accuracy of better than 0.05 °,which is measured electronically. Utilizing a Reynolds number of 110,000 based on the blade suction surface length and the exit velocity,one steady and two different unsteady inlet flowconditions with the corresponding passing frequencies, wake velocities and turbulenceintensities are investigated using hot-wire anemometry. In addition to the unsteady boundary layer measurements, blade surface pressuremeasurements were performed at Re=50,000, 75,000, 100,000, and 125,000 at one steady and two periodic unsteady inlet flow condi-tions. Detailed unsteady boundary layer measurement identifies the onset and extent of the separation zone as well as its behavior underunsteady wake flow. The results presented in ensemble-averaged and contour plot forms contribute to understanding the physics of theseparation phenomenon under periodic unsteady wake flow. Several physical mechanisms are discussed.