On the existence and structure of a mush at the inner core boundary of the Earth
14
Physics of the Earth and Planetary Interiors 164 (2007) 36–49 On the existence and structure of a mush at the inner core boundary of the Earth R. Deguen ∗ , T. Alboussi` ere, D. Brito Laboratoire de G´ eophysique Interne et Tectonophysique, Universit´ e Joseph Fourier, Grenoble, France Received 17 December 2006; received in revised form 10 May 2007; accepted 11 May 2007 Abstract It has been suggested about 20 years ago that the liquid close to the inner core boundary (ICB) is supercooled and that a sizable mushy layer has developed during the growth of the inner core. The morphological instability of the liquid–solid interface which usually results in the formation of a mushy zone has been intensively studied in metallurgy, but the freezing of the inner core occurs in very unusual conditions: the growth rate is very small, and the pressure gradient has a key role, the newly formed solid being hotter than the adjacent liquid. We investigate the linear stability of a solidification front under such conditions, pointing out the destabilizing role of the thermal and solutal fields, and the stabilizing role of the pressure gradient. The main consequence of the very small solidification rate is the importance of advective transport of solute in liquid, which tends to remove light solute from the vicinity of the ICB and to suppress supercooling, thus acting against the destabilization of the solidification front. For plausible phase diagrams of the core mixture, we nevertheless found that the ICB is likely to be morphologically unstable, and that a mushy zone might have developed at the ICB. The thermodynamic thickness of the resulting mushy zone can be significant, from ∼100 km to the entire inner core radius, depending on the phase diagram of the core mixture. However, such a thick mushy zone is predicted to collapse under its own weight, on a much smaller length scale (1km). We estimate that the interdendritic spacing is probably smaller than a few tens of meter, and possibly only a few meters. © 2007 Elsevier B.V. All rights reserved. Keywords: Inner core boundary; Morphological instability; Mushy zone; Compaction; Interdendritic spacing 1. Introduction As the Earth’s core is gradually cooling down, the inner core is freezing from the liquid core mixture (Jacobs, 1953) thought to be mostly iron-nickel alloyed with a small quantity of lighter elements. Although the nature and relative abundances of these light elements are still controversial (Poirier, 1994a), mineralogical mod- els consistent with the seismological constraints indicate ∗ Corresponding author. E-mail address: [email protected] (R. Deguen). that their concentration is greater, perhaps by a factor 4, in the liquid core than in the inner core (Anderson and Ahrens, 1994): like most alloys, the core mixture is frac- tionating during the process of crystallization, the liquid core being slowly enriched in light elements. The release of light elements which results from the gradual solidification of the core is thought to be a major source of buoyancy for driving the core convec- tion and the geodynamo (Braginsky, 1963; Gubbins et al., 2004), but segregation of light solute may also have dramatic consequences on the structure of the solid inner core itself (Fearn et al., 1981). It is well known from metallurgical experiments that solute segregation during 0031-9201/$ – see front matter © 2007 Elsevier B.V. All rights reserved. doi:10.1016/j.pepi.2007.05.003
-
Upload
independent -
Category
Documents
-
view
3 -
download
0
Transcript of On the existence and structure of a mush at the inner core boundary of the Earth
Physics of the Earth and Planetary Interiors 164 (2007) 36–49
On the existence and structure of a mush at the innercore boundary of the Earth
R. Deguen ∗, T. Alboussiere, D. BritoLaboratoire de Geophysique Interne et Tectonophysique, Universite Joseph Fourier, Grenoble, France
Received 17 December 2006; received in revised form 10 May 2007; accepted 11 May 2007
Abstract
It has been suggested about 20 years ago that the liquid close to the inner core boundary (ICB) is supercooled and that a sizablemushy layer has developed during the growth of the inner core. The morphological instability of the liquid–solid interface whichusually results in the formation of a mushy zone has been intensively studied in metallurgy, but the freezing of the inner core occursin very unusual conditions: the growth rate is very small, and the pressure gradient has a key role, the newly formed solid beinghotter than the adjacent liquid.
We investigate the linear stability of a solidification front under such conditions, pointing out the destabilizing role of the thermaland solutal fields, and the stabilizing role of the pressure gradient. The main consequence of the very small solidification rate isthe importance of advective transport of solute in liquid, which tends to remove light solute from the vicinity of the ICB and tosuppress supercooling, thus acting against the destabilization of the solidification front. For plausible phase diagrams of the coremixture, we nevertheless found that the ICB is likely to be morphologically unstable, and that a mushy zone might have developed
at the ICB. The thermodynamic thickness of the resulting mushy zone can be significant, from ∼100 km to the entire inner coreradius, depending on the phase diagram of the core mixture. However, such a thick mushy zone is predicted to collapse under itsown weight, on a much smaller length scale (�1 km). We estimate that the interdendritic spacing is probably smaller than a fewtens of meter, and possibly only a few meters.© 2007 Elsevier B.V. All rights reserved.ne; Com
Keywords: Inner core boundary; Morphological instability; Mushy zo1. Introduction
As the Earth’s core is gradually cooling down, theinner core is freezing from the liquid core mixture(Jacobs, 1953) thought to be mostly iron-nickel alloyedwith a small quantity of lighter elements. Although the
nature and relative abundances of these light elements arestill controversial (Poirier, 1994a), mineralogical mod-els consistent with the seismological constraints indicate∗ Corresponding author.E-mail address: [email protected] (R. Deguen).
0031-9201/$ – see front matter © 2007 Elsevier B.V. All rights reserved.doi:10.1016/j.pepi.2007.05.003
paction; Interdendritic spacing
that their concentration is greater, perhaps by a factor 4,in the liquid core than in the inner core (Anderson andAhrens, 1994): like most alloys, the core mixture is frac-tionating during the process of crystallization, the liquidcore being slowly enriched in light elements.
The release of light elements which results from thegradual solidification of the core is thought to be amajor source of buoyancy for driving the core convec-tion and the geodynamo (Braginsky, 1963; Gubbins et
al., 2004), but segregation of light solute may also havedramatic consequences on the structure of the solid innercore itself (Fearn et al., 1981). It is well known frommetallurgical experiments that solute segregation during
h and P
suicma
s(o(atMimpcsat
csstcbzdbmCtasdpimrs
hiFau6etl
R. Deguen et al. / Physics of the Eart
olidification can result in the supercooling of the liq-id close to the solidification front. This supercoolings usually suppressed by either solidification of isolatedrystals in a slurry layer, or by the development of aushy zone, where solid cells or dendrites coexist withsolute rich liquid (e.g., Kurz and Fisher, 1989).
Loper and Roberts (1981) and Fearn et al. (1981)how that the conditions at the inner core boundaryICB) are almost certainly favorable to the formationf either a slurry layer or a mushy layer. Fearn et al.1981) gave preference to the latter and concluded thatmushy zone of considerable depth, possibly extending
o the inner core center, must have developed at the ICB.ore recently, Shimizu et al. (2005) quantitatively stud-
ed the possible regimes of solidification (slurry layer orushy zone) and found that a dendritic regime is more
robable than a slurry layer regime, because of the diffi-ulty to supply enough nuclei to feed a slurry layer. Someeismological studies (e.g., Cao and Romanowicz, 2004)lso argue in favor of the existence of a mushy zone athe top of the inner core.
Morse (1986, 2002) challenged this view arguing thatonvective motion should quantitatively remove lightolute from the inner core boundary, thus suppressingupercooling. From an analogy between the growth ofhe inner core and cumulate solidification in magmahambers, Morse (2002) concluded that the ICB muste microscopically flat, and rejected the idea of a mushyone at the top of the inner core. Cumulates and den-ritic layers have dynamics similar in many respects,oth being reactive porous media, but their develop-ent occurs through two physically different processes.umulates form by sedimentation of early formed crys-
als from the melt, the possible porosity resulting fromcompetition between sedimentation of crystals and
olidification in the layer. In contrast, a dendritic layerevelops as a consequence of an instability of an initiallylane solid–liquid interface. Whether Morse’s analysiss appropriate or not to the formation of a dendritic layer
ay therefore be questionable, but it is probably cor-ect that advective transport of solute may affect theolidification regime of the ICB.
The morphological stability of a solidification frontas been intensively studied both theoretically and exper-mentally (e.g., Mullins and Sekerka, 1963; Kurz andisher, 1989; Davis, 2001) but, as noted by Shimizu etl. (2005), the freezing of the inner core occurs in verynusual conditions: the growth rate is very small, about
orders of magnitude smaller than in typical laboratoryxperiments, and the pressure gradient has a key role,he newly formed solid being hotter than the adjacentiquid.
lanetary Interiors 164 (2007) 36–49 37
In this work, we will take into account first ordereffects of advective transport and investigate possibleeffects of the very slow solidification rate and of thepressure gradient on the stability of a solidification front(Sections 2–4). In Section 5, the thermophysical param-eters and conditions relative to the crystallization of theinner core will be evaluated from a survey of the litera-ture and from the use of thermodynamic constraints. Thestability of the ICB will then be discussed and we shallargue that the existence of a mushy zone is very likely.Finally, in Section 6, we will estimate various lengthscales relevant to the structure of a mushy inner core,such as its depth and interdendritic spacing.
2. Supercooling in the vicinity of an interface
When a dilute alloy is frozen from the melt, the newlyformed solid usually differs in composition from the liq-uid, in a way which depends on the solubility of thesolute in the solid and liquid phases. This solute redis-tribution is conveniently described by the distributioncoefficient k = cs/c, where cs and c are, respectively,the mass fractions of solute in the solid and in the liquid.In the common case where k < 1, solidification resultsin the rejection of solute from the solid phase, the liq-uid phase being enriched in solute in the vicinity of thesolidification front.
As the melting temperature is lowered by the pres-ence of solute, the liquidus temperature at the interfaceis lower than that of the liquid ahead of the interface,which is richer in solute. If the actual temperature gradi-ent at the solidification front is smaller than the gradientof the melting temperature, the temperature of the liquidclose to the interface is smaller than the liquidus tempera-ture, i.e., the liquid is supercooled. This non-equilibriumstate usually does not persist and results in the formationof either a mushy zone, through a destabilization of thesolidification front, or a slurry layer.
Denoting T � and Tm the temperature in the liquid andthe melting temperature, respectively, the criterion forsupercooling is:
dT �
dz
∣∣∣∣0
<dTm
dz
∣∣∣∣0
(1)
where the subscript 0 denotes the value at the solid–liquidinterface, and where the z axis points toward the liquid.In the core, the melting temperature depends on both the
solute concentration c and the pressure P. Defining theliquidus and Clapeyron slopes as:mc = ∂Tm
∂c
∣∣∣∣P
< 0 and mP = ∂Tm
∂P
∣∣∣∣c
> 0, (2)
h and P
38 R. Deguen et al. / Physics of the Eartthe supercooling criterion can be written:
G�T − mP GP < mc Gc (3)
where G�T = dT �/dz|0, Gc = dc/dz|0 and GP =
dP/dz|0 are, respectively, the thermal, chemical andpressure gradients at the solid–liquid interface. In thesolidification conditions of the core, the pressure gra-dient is negative and mP positive (e.g., Boehler, 1993),thus mPGP is negative and the pressure field acts againstsupercooling. In contrast, the temperature and concen-tration fields both promote supercooling, as G�
T < 0 andmc Gc > 0. We can therefore predict that the pressurefield should have a stabilizing effect on the solidificationfront whereas temperature and solutal fields should bedestabilizing.
3. The effect of advective transport on thesupercooling criterion
If motion is present in the liquid, advective transportof solute, and, to a smaller extent, of heat, may affect thesolutal and thermal profiles near the solid–liquid bound-ary, and thus the degree of supercooling. In this section,we consider the effects of buoyancy-driven convectionon the mean solute and thermal fields. Let us considerthe directional solidification of a dilute binary alloy atconstant velocity V. The solute has a concentration c∞in the bulk of the liquid and a chemical diffusivity Dc inthe liquid. The coordinate system is fixed on the movingfront, the z axis pointing toward the liquid perpendicu-larly to the solidification front. The liquid has a velocityu.
In the melt, the solute concentration c is given by theequation of conservation in the bulk:
−V∂c
∂z+ (u · ∇)c = Dc ∇2c, (4a)
with boundary conditions at infinity:
c → c∞ at z → ∞, (4b)
and at the interface z = 0, given by the equation of con-servation of solute at the solidification front:
Gc = (cs0 − c0)
V
Dc
= c0(k − 1)V
Dc
, (4c)
where cs0 and c0 are the concentration in the solid and
liquid phases at the interface. If advective transport is
negligible, a solute boundary layer of thickness δc =Dc/V will build up, and after a transient stage duringwhich the solute concentration in the solid at the solid-ification front gradually increases from kc∞ to c∞, thelanetary Interiors 164 (2007) 36–49
system reaches a steady state where the concentration ofsolute c(z) in the liquid is
c(z) = c∞ + c∞1 − k
kexp
(− z
δc
)(5)
(e.g., Kurz and Fisher, 1989; Davis, 2001). The concen-tration in the liquid at the interface is c0 = c∞/k and thechemical gradient at the interface is
Gc = c∞k − 1
k
V
Dc
. (6)
However, if the solidification is very slow, as it is atthe ICB, advection may affect strongly the concentrationgradient at the interface. With a solidification veloc-ity of 10−11 m s−1 and a chemical diffusivity of order10−9 m2 s−1, the chemical diffusive boundary layerthickness is δc = Dc/V ∼100 m. Defining the solutalRayleigh number Ras as:
Ras = βgGcδ4c
νDc
, (7)
where β ∼ 1 (Gubbins et al., 2004) is the compositionalexpansion coefficient, g = 4.4 m s−2 is the magnitude ofgravity at the ICB (Dziewonski and Anderson, 1981) andν ∼ 10−6 m2 s−1 is the kinematic viscosity of the liquid,we found Ras ∼ 1021. This is much larger than the criti-cal Rayleigh number for the Rayleigh–Taylor instability.The purely diffusive boundary layer is therefore sub-ject to convective instabilities, which remove light solutefrom the vicinity of the interface much more efficientlythan diffusion alone.
The purely diffusive concentration profile describedby Eq. (5) is therefore not relevant to the case of theEarth’s inner core solidification, and effects of advectivesolute transport on the mean concentration profile mustbe investigated. In the case of purely diffusive solutetransport, c0 is equal to c∞/k. This is the maximumallowed value as a greater value will imply a solute con-centration in the solid greater than c∞. If convectivemotions are present, advective transport results in thedepletion of solute close to the solidification front, andthe concentration in the liquid at the boundary will becloser to c∞ as convection is more vigorous, whereasconcentration in the solid will tend to kc∞. Becausesolute conservation implies that the concentration in thesolid cannot exceed c∞ and must be greater than kc∞,
the concentration gradient Gc at the interface is boundedby:c∞(k − 1)V
Dc
≤ Gc ≤ c∞k − 1
k
V
Dc
, (8)

h and P
tdtttb
G
wts
at
cd
c
tflwid
−
−
wlii
L
wttat
T
w
R. Deguen et al. / Physics of the Eart
he upper bound being the value of the chemical gra-ient in the purely diffusive case. This gradient tendsoward its lower bound as the efficiency of advectiveransport is enhanced; in what follows, we will considerhat the actual chemical gradient can be approximatedy its lower bound:
c � c∞(k − 1)V
Dc
, (9)
hich should be compared with Eq. (6). If k is small,he convective chemical gradient can be considerablymaller than the diffusive gradient.
With a no-slip boundary condition, u(x, y, 0) = 0 forll (x, y), Eq. (4a) taken at z = 0 gives the second deriva-ive of the mean concentration profile at the interface:
d2c
dz2
∣∣∣∣∣0
= − V
Dc
dc
dz
∣∣∣∣0
= − 1
δc
Gc. (10)
In what follows, the vertical variations of the meanoncentration field in the vicinity of the interface will beescribed by a second order Taylor expansion:
(z) = c0 + Gcz − Gc
1
δc
z2
2. (11)
Because the thermal diffusivity is much larger thanhe solute diffusivity Dc, advection affects the soluteow much more strongly than the thermal flow, and weill ignore the effects of advection on the thermal field,
.e., the mean temperature is solution of the equation ofiffusion in the liquid and in the solid:
V∂T �
∂z= D�
T ∇2T �, (12)
V∂T s
∂z= Ds
T ∇2T s, (13)
here D�T and Ds
T are the thermal diffusivities in theiquid and solid, respectively. The thermal gradient at thenterface is given by the heat balance at the solid–liquidnterface:
vV = κsGsT − κ�G�
T , (14)
here Lv is latent heat per unit volume, κs and κ� thehermal conductivities in the solid and liquid, respec-ively, and Gs
T and G�T are the gradient of temperature
t the interface in the solid and liquid, respectively. Theemperature field can be expanded as
(z) = T0 + G�T z − G�
T
1
δT
z2
2, (15)
here δT = DT /V .
lanetary Interiors 164 (2007) 36–49 39
Shimizu et al. (2005) did not take into account effectsof convection on the thickness of the boundary layer, andassumed it to be given by the diffusive boundary layerthickness δc = Dc/V . They study the possibility that afraction of the solidification occurs in the supercooledzone, whose thickness has been taken to be the diffu-sive boundary layer thickness, that is ∼100 m. With thisvalue, they found that it is unlikely that a significant frac-tion of the solidification occurs in a slurry layer, becauseof the difficulty of supplying continuously enoughnuclei. Taking into account advective transport leads to amuch thinner supercooled zone, with smaller supercool-ing, where the amount of crystals solidified is probablymuch smaller than expected from the model of Shimizuet al. (2005). We will therefore consider that all the solid-ification occurs at the solid–liquid interface, and thatgrowth of crystals in the supercooled zone is negligible.
4. Linear stability analysis of the growthinterface of a binary alloy in a pressure gradient
4.1. Solutal and thermal instabilities
Considerations of Section 3 allow us to determine amean state for the solute and thermal fields, hereafternoted c and T , respectively, described by Eqs. (11) and(15); the pressure field is taken to be hydrostatic, thepressure gradient being G�
P = −ρ�g.In this section we consider the stability of the planar
interface against infinitesimal perturbations of the meanfields. The interface is not planar anymore, but has aninfinitesimal topography h(x, y, t) which temporal evo-lution we study. The solute and thermal fields can beexpressed as the sum of the mean field and infinitesi-mal disturbances : c(x, y, z, t) = c(z) + c(x, y, z, t) andT (x, y, z, t) = T (z) + T (x, y, z, t). The linear stabilityanalysis we propose here is similar in principle toMullins and Sekerka’s analysis (Mullins and Sekerka,1963). The two main differences concern the formula-tion of the basic state, which is considered here to bealtered by convective motions, and the dependence ofthe melting temperature on pressure.
The thermal and solutal fields must satisfy:
(i) the equations of conservation of solute and heat inthe liquid and solid phases:
∂c ∂c
∂t− V
∂z= Dc∇2c, (16a)
∂T �
∂t− V
∂T �
∂z= D�
T ∇2T �, (16b)

h and P
�G�T
) − ((D
40 R. Deguen et al. / Physics of the Eart
∂T s
∂t− V
∂T s
∂z= Ds
T ∇2T s. (16c)
Diffusion of solute in the solid is neglected.(ii) the boundary conditions at the interface. At thermo-
dynamic equilibrium, the temperature at the inter-face T I must obey the Gibbs-Thomson relation:
T I = Tm + ΓH + mPG�Ph + mcc, (16d)
which states that the temperature at the interface isequal to the melting temperature of the curved inter-face, when variations with pressure, concentrationand interface curvature are taken into account. Tmis the solvent melting temperature of a flat interface
at z = 0, H � ∇2h is the interface curvature andΓ = Tmγ/Lv is the Gibbs coefficient, where γ isthe liquid–solid interfacial energy.
In addition, the thermal and solutal fields must,respectively, satisfy the heat balance and the soluteconservation at the interface:
Lvvn(x, y) = (κs∇T s − κ�∇T �) · n(x, y), (16e)
(cs − c)vn(x, y) = Dc ∇c · n(x, y), (16f)
where vn(x, y) � V + ∂h/∂t is the speed of thefront and n is the unit normal vector pointing towardthe liquid.
(iii) boundary conditions at infinity: the perturbationsmust decay to zero at infinity (but see discussionbelow).
Eq. (16) lead to a system in perturbation quantitiesh, c, T � and T s which is linearized, allowing to seeksolutions for the perturbed fields under the followingnormal mode form:⎛⎜⎜⎜⎝
h
c
T �
T s
⎞⎟⎟⎟⎠ =
⎛⎜⎜⎜⎝
h1
c1(z)
T �1 (z)
T s1 (z)
⎞⎟⎟⎟⎠ exp(ωt + ikxx + ikyy)
(17)
ω = αmcGc − α
(Lv/(κsβs − κ�β�)
where ω is the growth rate of the disturbance and kx
and ky are the wave numbers along the interface in thedirection x and y. From Eqs. (16a–(16c) and the bound-ary condition (iii), c1(z), T �
1 (z) and T s1 (z) are found to be
proportional to exp(βz), exp(β�z) and exp(βsz), respec-tively, where β, β� and βs are
lanetary Interiors 164 (2007) 36–49
βs = −1
2
V
DsT
⎡⎣1 −
√1 + 4
(Ds
T kh
V
)2⎤⎦ ≥ 0,
β� = −1
2
V
D�T
⎡⎢⎣1 +
√√√√1 + 4
(D�
T kh
V
)2⎤⎥⎦ ≤ − V
D�T
,
β = −1
2
V
Dc
⎡⎣1 +
√1 + 4
(Dckh
V
)2⎤⎦ ≤ − V
Dc
.
Using expression (17) in the perturbation equationsleads to a set of homogeneous, linear equations in h1,c1, T �
1 and T s1 which have nontrivial solutions if the
following dispersion equation is satisfied:
− αsGsT + mPGP − Γk2
h
c/V 2)/(βDc/V + 1 − k))mcGc
, (18)
where:
kh =√
k2x + k2
y,
α� = κ�β� + κ�V/D�T
κ�β� − κsβs ∈[
0κ�
κ� + κs
],
αs = −κsβs + κsV/DsT
κ�β� − κsβs ∈[
κs
κ� + κs
κsD�T
κ�DsT
],
α = β + V/Dc
β + (1 − k)V/Dc
∈ [0 1].
Stability of the interface against infinitesimal pertur-bations depends on the sign of ω: the solidification frontis stable if ω is negative for all wave numbers whereasit is unstable if ω is positive for any wave number. Asκsβs − κ�β� ≥ 0, βDc/V + 1 − k ≤ 0 and mcGc > 0,the denominator is always positive and so the sign of ω
depends only on the sign of the numerator, which is acombination of temperature, concentration and pressuregradient weighted by wave number dependent functions.
Convection has been taken into account when esti-mating the mean chemical gradient, but to be rigorous,we should have considered the effects of convection onthe perturbed fields as well. We might have imposed, asCoriell et al. (1976) or Favier and Rouzaud (1983) did,that perturbations of the solute field must decay to zeroon a finite length, imposed by convection, but numericalcalculations not presented here show that this does notsignificantly affect the prediction of the stability of theinterface. This can be understood as follows. With theadditional hypothesis of a small solutal Peclet number
V/khDc (that is, for instability wavelengths small com-pared to 2πDc/V � 300 m, an hypothesis which will beshown in Section 5 to be well verified), β is very closeto −kh, and α is very close to one because kh � V/Dc.
h and Planetary Interiors 164 (2007) 36–49 41
Ifitccliaobo
desuaat
tvTtbiv(stle
Ffst
R. Deguen et al. / Physics of the Eart
f taken into account, advection of the perturbed solutaleld would decrease the decay length of the perturba-
ions, and so increase β. This would make α to be evenloser to one, but will hardly affect the value of thehemical term in the numerator. Effects on the stabilityimit and on the critical wavelength would therefore bensignificant. However, an increase of β would result indecrease of the denominator, and hence in an increasef ω: the instability growth rate may be underestimatedy Eq. (18), but this point will not weaken our analysisf the ICB solidification regime.
The dispersion relation confirms the qualitativeifferences between constant pressure solidificationxperiments and the crystallization of the inner core, aseen from the criterion of supercooling. In contrast withsual solidification, temperature gradients are negativend destabilizing, as α is positive. As mPGP is neg-tive, the pressure field stabilizes the interface againstopography perturbations.
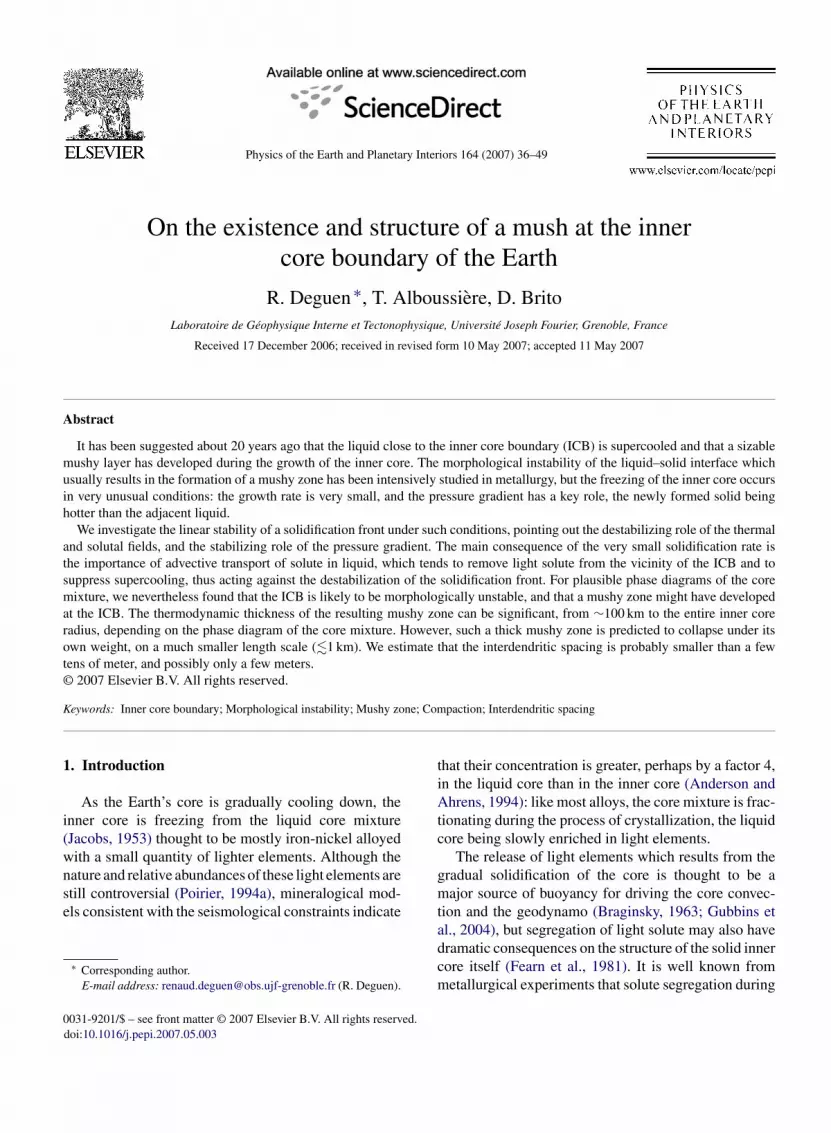
The differences between usual solidification and crys-allization in a pressure field are illustrated in a ln V
ersus ln c diagram (Fig. 1) constructed from Eq. (18).he dashed curve is the neutral curve for the purely solu-
al stability problem: temperature gradients are taken toe constants and rejection of latent heat at the interfaces neglected. In this limiting case, the neutral curve isery similar to that of constant pressure solidificatione.g., Davis, 2001): the curve possesses two asymptotic
traight lines of slopes −1 and +1 which correspond tohe constitutional supercooling limit and to the abso-ute stability limit, respectively, where the stabilizingffect of the surface tension becomes dominant. In con-ig. 1. Neutral curves for linear morphological stability, constructedrom Eq. (18). The dashed line is the neutral curve for the purelyolutal stability problem. The solid line is the neutral curve for thehermo-solutal stability problem.
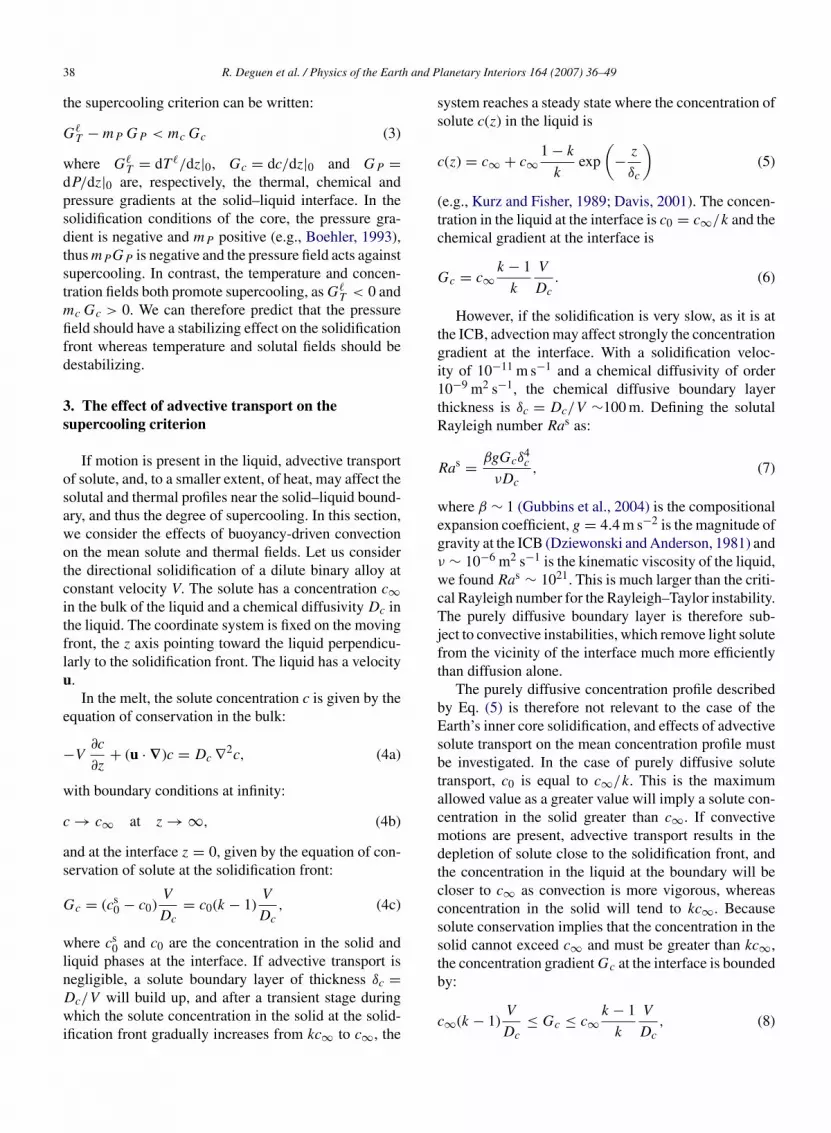
Fig. 2. Neutral curves for purely diffusive transport of solute (dashedline) and for advective transport (solid line). mc = −103 K, k = 0.2.
stant pressure solidification, allowing perturbations ofthe thermal field slightly stabilizes the interface for smallc, and flattens the nose of the marginal curve (Davis,2001). In the system considered here, the thermal gra-dient is destabilizing, and even when solidifying a puremelt (no solutal destabilization), the solidification frontmay become unstable if the solidification velocity ishigh enough. The neutral curve of the complete thermo-solutal problem is shown as a solid line in Fig. 1. Forlow c∞, the instability is mainly thermally driven andthe critical solidification velocity is independent of theconcentration. As for the purely solutal destabilization,the system reaches an absolute stability limit for veryhigh solidification rates, with the neutral curve beingindependent of c∞ at small concentration.
Effects of advection on the stability limit is illustratedin Fig. 2, which represent neutral curves obtained withtwo different expressions for the chemical gradient atthe interface. The dashed curve has been obtained withthe upper bound of Gc, in inequality (8), and thereforecorresponds to a purely diffusive solutal transport. Thesolid curve has been obtained with the lower bound ofGc, which corresponds to the case of maximum advec-tive transport of solute. If the segregation coefficient k issmall, convection has a considerable stabilizing effect: ata given solute concentration c, the critical solidificationvelocity can be as much as an order of magnitude greaterthan in the case of no convection.
4.2. Damping of instabilities by solid deformation
The only effect of the pressure gradient which hasbeen considered so far is the pressure dependence of themelting temperature. Yet, because of the difference ofdensity �ρ between the solid and the liquid, a surface
h and P
42 R. Deguen et al. / Physics of the Earttopography may induced horizontal pressure gradientswhich may tend to flatten the interface, therefore act-ing against its destabilization. To quantify the possibleimportance of solid flow on the interface stability, we willestimate the timescale of isostatic adjustment, assum-ing that the viscous deformation is driven by a balancebetween the pressure gradient and the viscous force:
0 = −∇p + η∇2u, (19)
where η is the solid state viscosity. Let us assume that theinterface has a topography of amplitude h which varieson a length scale λ. We are still dealing with linear stabil-ity analysis and infinitesimal perturbations, so that, as λ
is finite, h � λ. The finite amplitude case, i.e., dendritescompaction, will be considered in Section 6.1.2. Becauseh � λ, the deformation induced by the topography mustbe accommodated in depth, on a length-scale ∼ λ, andthe horizontal and vertical velocity u and w must be ofthe same order of magnitude. The horizontal pressuregradient is of order �ρgh/λ, ∇2u is of order u/λ2, sothat:
u ∼ w ∼ �ρg
ηhλ. (20)
The timescale of isostatic adjustment can be definedas the ratio of the topography to the vertical velocityτ = h/w, and is equal to:
τ ∼ η
�ρgλ. (21)
In the limit of h � λ which is considered here, τ hasa finite value even for an infinitesimal amplitude h ofthe topography. This process is therefore relevant whendealing with linear stability analysis. We will howeverconsider that this effect is negligible compared to thedestabilizing effect of the thermal and compositional gra-dient, an assumption which will be justified a posterioriin Section 5.2 where τ will be compared to the timescale1/ω of the growth of an instability.
5. Morphological stability of the ICB
5.1. Thermo-physical parameters, composition,growth rate
As discussed in Section 2, the degree of supercoolingand the stability of the boundary depend strongly on theabundance of solute and on the phase diagram of the crys-
tallizing alloy, i.e., the liquidus slope and the segregationcoefficient. The nature and relative abundances of lightelements in the core are still uncertain (Poirier, 1994a),but recent studies seem to show a preference for O, S andlanetary Interiors 164 (2007) 36–49
Si as major light elements (Ringwood and Hibberson,1991; Stixrude et al., 1997; Alfe et al., 2002; Rubie etal., 2004). Very little is known about the phase diagramsof the candidate alloys and it is not even clear whetherthose systems have an eutectic or solid–solution behav-ior (Williams and Jeanloz, 1990; Knittle and Jeanloz,1991; Boehler, 1993, 1996; Sherman, 1995). However,a fundamental constraint on the phase diagram of theiron-major light elements system is that the outer core isricher in light solute than the inner core. Major light com-ponents must therefore have a segregation coefficient ksmaller than one and this necessarily imposes that theirliquidus slopes mc are negative near the Fe-rich end.
The liquidus slope and solute concentration of inter-est here are that of the fractionating elements. Elementswhich do not fractionate during the process of solidi-fication, such as Ni and perhaps S and Si (Alfe et al.,2002), will not create chemical heterogeneity and hencewill not contribute to supercooling and radial variationsin melting temperature.
Assuming ideal mixing, a crude estimate of the liq-uidus slope of the core mixture at ICB pressure andtemperature may be provided by the van’t Hoff relation(Chalmers, 1964). We consider here the effect of alloy-ing Fe with a single light element, of mole fraction x, onthe melting temperature of the mixture. Chemical equi-librium between two multicomponents phases requiresequality of the chemical potentials of each componentin the two phases. In particular, the chemical potentialsof the solvent, here Fe, must be equal in the liquid andin the solid: μ�
Fe = μsFe. In an ideal solid or liquid solu-
tion, the chemical potential of a component i is expressedas μi = μ◦
i + RT ln xi, where xi is the mole fraction ofcomponent i and μ◦
i is the chemical potential of pure i.Equality of the chemical potentials of iron in the liquidand solid phases then requires that
μ◦sFe + RT ln xs
Fe = μ◦�Fe + RT ln x�
Fe, (22)
which can be rewritten, using the fact that the mole frac-tion of the solute is x = 1 − xFe and that xs = kx�, as
μ◦sFe − μ◦�
Fe
T= R ln
1 − x�
1 − kx�. (23)
Taking the derivative of Eq. (23) with respect to T,and using the Gibbs-Helmoltz relation then gives
∂(
1 − x�)
∂(
μ◦sFe − μ◦�
Fe
)
∂Tln1 − kx�
P
=∂T RT
,
= h◦sFe − h◦�
Fe
RT 2m
, = MFeL
RT 2m
, (24)

h and P
wuhAw
w∂
m
wpvTubt(ahss
iA
TP
CLLG
TSLTTTTCVLG
R. Deguen et al. / Physics of the Eart
here h◦sFe and h◦�
Fe are the molar enthalpy of solid and liq-id Fe, respectively, L = (h◦s
Fe − h◦�Fe)/MFe is the latent
eat of pure iron and MFe is the atomic weight of iron.ssuming k to be constant, for a dilute solution (x� � 1),e obtain
∂
∂T
(ln
1 − x�
1 − kx�
)P
=(
k
1 − kx�− 1
1 − x�
)∂x�
∂T
∣∣∣∣P
∼ (k − 1)∂x�
∂T
∣∣∣∣P(25)
hich together with (24) yields, as mc can be written asTm/∂x�,
c � RT ◦2m
MFeL(k − 1) � (6 ± 3)(k − 1) × 103 K (26)
here T ◦m is the melting temperature of pure iron at ICB
ressure and mc is given in Kelvin per atomic fraction;alues and incertitudes of T ◦
m and L are from Table 1.his relation means that for an ideal solution, the liq-idus slope and the segregation coefficient are relatedy parameters which are independent of the nature ofhe alloying element. For a non-partitioning elementk = 1), the ideal liquidus slope is equal to zero, whereashighly partitioning element (k small compared to 1) willave a high liquidus slope. Through this relation, con-traints on k may provides informations on the liquidus
lope of the core mixture.From estimates of the volume change during melt-ng and of the density jump at the inner core boundary,nderson and Ahrens (1994) estimated the ratio of light
able 1arameters used in this study
lapeyron slope mP � 10−8 K Pa−1a
iquidus slope mc −102 to −104 Kb
ight elements concentration c∞ 2 to 10 wt.%b
rowth rate of the inner core V 6 × 10⁻¹² to2 × 10−11 m s−1b
emperature at the ICB TICB 5000 to 6000 Ka,c
pecific heat at constant pressure cP 860 J kg−1 K−1
atent heat of crystallization L 600c to 1200 kJ kg−1a
hermal conductivity in the liquid κ� 63 W m−1 K−1d
hermal conductivity in the solid κs 79 W m−1 K−1d
hermal diffusivity in the liquid D�T 6 × 10⁻⁶ m2 s−1d
hermal diffusivity in the solid DsT 7 × 10⁻⁶ m2 s−1d
hemical diffusivity Dc 10−9 m2 s−1c
iscosity of the inner core η 1016 to 1021 Pa sb
iquid–solid interfacial energy γ 0.4 ± 0.2 J m−2b
ibbs-Thomson coefficient Γ � 2 × 10⁻⁷ K mb
a From Anderson and Duba (1997).b See text.c From Poirier (1994b).d From Stacey and Anderson (2001).
lanetary Interiors 164 (2007) 36–49 43
elements in the outer core to that in the inner core to beapproximately 4–1. This gives a global segregation fac-tor k = 0.25 and, by Eq. (26), a liquidus slope mc �−4.5 ± 2.5 × 10³ K. Note that the segregation factorestimated here is an effective segregation factor, whichis higher than the thermodynamic one, and should give alower bound of |mc|. This estimate may be appropriate ifthere is only one light element in the core, but finer esti-mates are needed if there are several light elements ofcomparable concentrations. As an example, the ab initiosimulations of Alfe et al. (2002) suggest that the outercore may be composed of �10 mole% of S and/or Siand ∼8 mole% (�2 wt.%) of O. According to Alfe et al.(2002), S and Si do not significantly fractionate and thedensity jump at the ICB may be accounted for by frac-tionation of oxygen alone, whose segregation coefficienthas been estimated to be 0.02. With this value,mc tends toits k = 0 bound mc � −6 ± 3 × 10³ K. In what follows,two chemical models of the core will be considered: onewith a single light element of concentration � 10 wt.%,and the other with only one fractionating light element(but several light elements), oxygen, of concentration�2 wt.%.
Our relation is similar to the one derived by Alfeet al. (2002). Stevenson (1981) and Anderson andDuba (1997) estimated the melting point depressionby assuming equilibrium between a pure solid and analloyed liquid, and therefore obtained the upper boundof our estimate (i.e., our k = 0 value). Those theoreti-cal estimates are in poor agreement with experiments.Experimental results on the melting temperature of theFe–O system (Knittle and Jeanloz, 1991; Boehler, 1993)predict a small melting temperature depression, and per-haps a solid-solution behavior. The case of the Fe–Ssystem if more controversial. Williams and Jeanloz(1990) results suggest that the eutectic behavior persistsat high pressure, and predict a significant melting pointdepression (mc is of order −5 × 10³ K at core-mantleboundary pressure). In contrast Boehler (1996) foundthat the Fe–FeS eutectic melting depression becomesmuch smaller at high pressures, and conclude that thissupports the possibility of solid-solution between Fe andFeS at core pressures. To our knowledge, there is noexperimental work at this pressure range dealing withother candidate alloys. In the present work, values of mc
between −102 K and −104 K will be considered.The interfacial energy of iron at ICB conditions can
be deduced from estimates of the latent heat of crystal-
lization, because those two parameters both derive fromthe difference of atoms bonds energy between the solidand liquid phase. The interfacial energy per atom γacan be calculated to be 1/4 of the atomic latent heat

h and P
−103 K or −104 K. If the growth of the inner core isepisodic, with a much higher instantaneous solidificationvelocity, the ICB would be even more unstable.
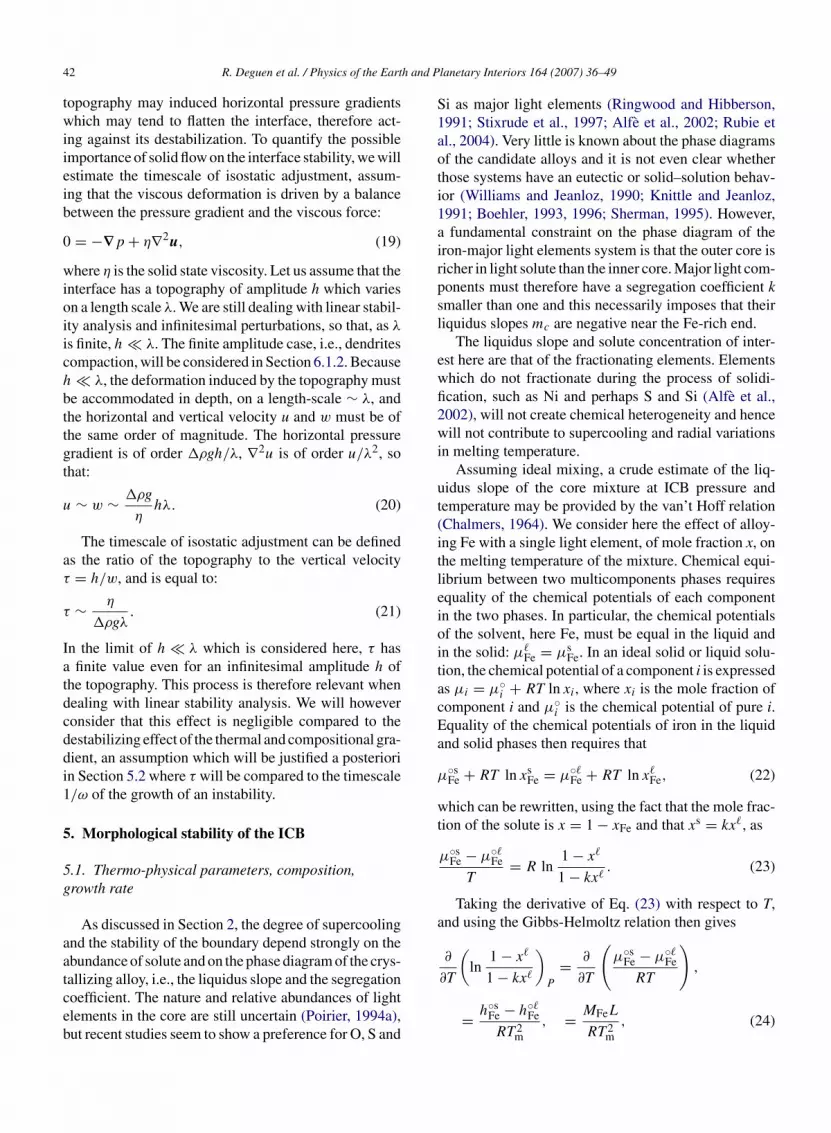
Fig. 3. Neutral curves for linear morphological stability, with mc =−102 K (dotted line), mc = −103 K (dashed line) and mc = −104 K(solid line). Gs = 0 K m−1 and k = 0.25. The straight lines cross is
44 R. Deguen et al. / Physics of the Eart
La for a flat close-packed surface (Chalmers, 1964).Estimates of the latent heat of iron at ICB conditionsrange from 600 kJ kg−1to 1200 kJ kg−1(Poirier, 1994b;Anderson and Duba, 1997; Laio et al., 2000; Vocadlo etal., 2003a) and from these values, we estimate the interfa-cial energy per unit area γ to be 0.4 ± 0.2 J m−2, whichcan be compared to the 0.204 J m−2 value at standardconditions (Chalmers, 1964).
Buffett et al. (1992) proposed an analytical modelof growth of the inner core and found that the radiusincrease at leading order as the root square of time,r = ric
√t/a, where ric is the present radius of the inner
core and a is its age. The present solidification veloc-ity is then V = ric/2a. If the inner core is young (e.g.,Labrosse et al., 2001; Nimmo et al., 2004), i.e., a ∼1 Ga, V is found to be 2 × 10⁻¹¹ m s−1. On the otherhand, if the inner core nucleated around 3 Ga ago, asChristensen and Tilgner (2004) claim, V could be oforder 6 × 10⁻¹² m s−1. Wen (2006) observed a tempo-ral change of travel time of the PKiKP phase betweenthe two events of an earthquake doublet, indicating alocalized change of the inner core radius of about 1km in 10 years. This observation may be interpretedas reflecting episodic growth of the inner core, coupledwith non-stationary convection in the outer core (Wen,2006). The resulting instantaneous solidification veloc-ity is �10 km/10 years � 10−6 m s−1, which is muchhigher than the mean solidification velocity estimatedfrom models of the core thermal history.
Other parameters used in this study, with values cur-rently found in the literature, are listed in Table 1.
5.2. Supercooling and stability analysis
The liquid at the ICB is supercooled if condition (3)is satisfied. This criterion can be rewritten, using the heatbalance at the interface (Eq. (14)), as:
LvV
κ�+ mc Gc − κs
κ�Gs
T > ρgmP. (27)
Depending on the age of the inner core, on the value ofthe thermal conductivity and on the hypothetical pres-ence of radioactive elements, the thermal gradient Gs
T inthe inner core at the ICB may vary widely (Yukutake,1998). However, the thermal term LvV/κ�, which isthe contribution to supercooling from the heat releasedby crystallization, is high enough to balance the pres-sure term if the solidification velocity is higher than
∼ 5 × 10⁻¹² m s−1. This is roughly equal to the low-est estimates of V, and, as the term −GsT is positive, itis thus likely that thermal terms alone are sufficientlyhigh to ensure supercooling. The chemical term mcGc
lanetary Interiors 164 (2007) 36–49
is probably much higher, at least one order of magnitudegreater than the pressure term if mc is as small as −102 Kand three order of magnitude greater if mc = −104 K,and the conclusion that the vicinity of the ICB is indeedsupercooled seems to be inescapable.
We now use the dispersion Eq. (18) to investigatemore quantitatively the stability of an initially planesolid–liquid interface in the actual conditions of the ICB.As discussed in Section 3, we choose to take the lowerbound of the chemical gradient, given by Eq. (9), so thatthe effect of convection on the basic state may be over-estimated rather than underestimated. We tested severalvalues of each parameter within their uncertainty rangesand found that for all plausible sets of values, the ICBis unstable. The liquidus slope is by far the most criticalparameter. Because the chemical gradient is proportionalto mc, the two orders of magnitude uncertainty on mc
propagate directly in the uncertainties on the location ofthe marginal stability curve. Neutral curves for linear sta-bility are plotted in Fig. 3, with mc = −102 K, −103 Kand −104 K, Gs
T = 0 K m−1and k = 0.25. Despite thestrong dependence on mc of the neutral curve location,the solidification velocity is two orders of magnitudegreater than the critical velocity for a liquidus slope assmall as −102 K, and three or four orders of magnitudegreater than the critical velocity for a liquidus slope of
T
the location of the ICB in the stability diagram. Uncertainties in Vresult from uncertainties in the age of the inner core. The value of c∞depends on the chemical model chosen: c∞ � 10 wt.% if there is onlyone dominant light element, and c∞ � 2 wt.% if the model of Alfe etal. (2002) is adopted.

R. Deguen et al. / Physics of the Earth and P
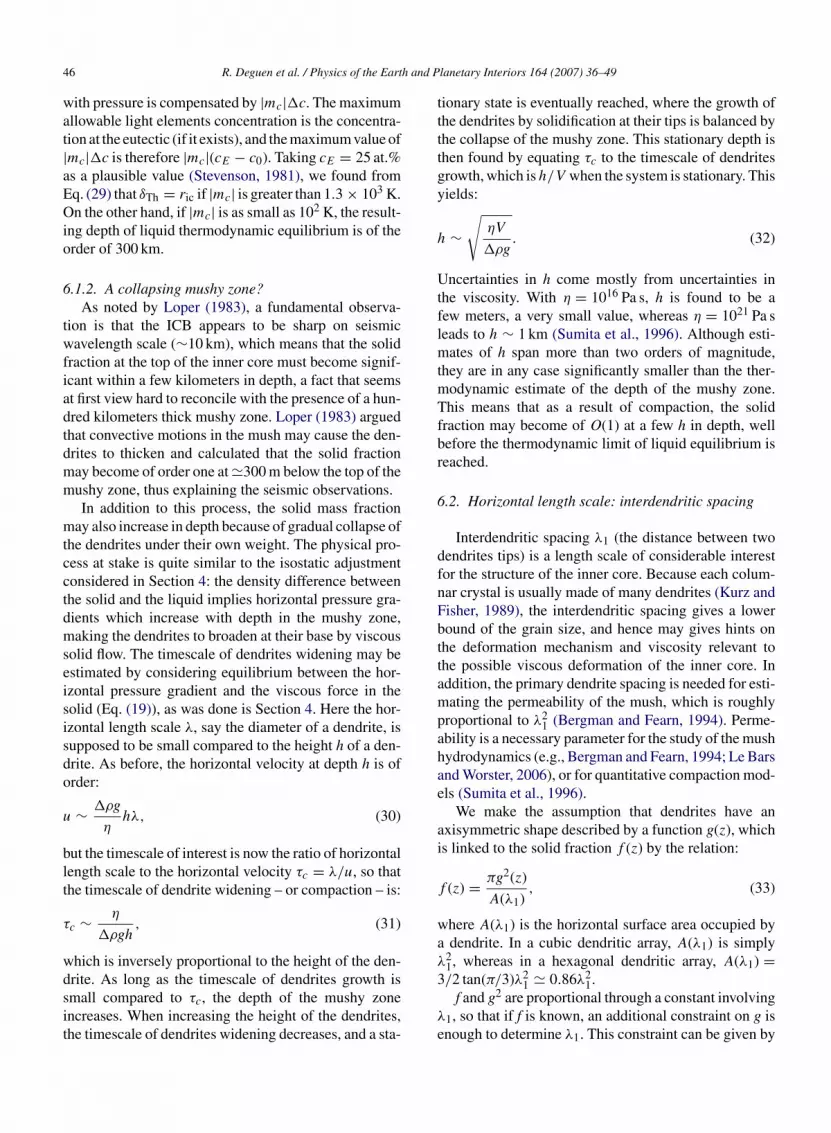
Fig. 4. Growth rate of infinitesimal perturbations against wave length,a 4 3
(6
hos3stcfYflWAooiiogcf
(fiersmttt
t the conditions of the ICB, for mc = −10 K (solid line), −10 Kdashed line) and −102 K (dash-dotted line). k = 0.02 and Lv =00 kJ kg−1.
In Fig. 4, the growth rate of infinitesimal perturbationsas been plotted against wave length, at the conditionsf the ICB, for three different values of mc. The corre-ponding time-scales range from a few years to about00 years. We may now estimate the timescale of iso-tatic adjustment, given by Eq. (21), and compare ito the timescale of instability growth. The solid innerore viscosity is poorly constrained: estimates rangerom 1016 Pa s to more than 1021 Pa s (Buffett, 1997;oshida et al., 1996). A lower estimate of the viscousow timescale may be given by taken η = 1016 Pa s.ith �ρ = 600 kg m−3, g = 4.4 m s−1(Dziewonski andnderson, 1981), the isostatic adjustment timescale is ofrder 1014 s � 3 × 10⁶ years for λ ∼ 1 cm, about fourr six orders of magnitude greater than the timescale ofnstability growth: isostatic adjustment will not delay thenstability. Our results are consistent with the conclusionf Shimizu et al. (2005) that the timescale of dendritesrowth is very short compared to the timescale of innerore growth, suggesting that a mushy layer will indeedorm at the ICB.
Results have been presented here for parametersgrowth rate, thermal and pressure gradient) inferredor the present state of the inner core, but when deal-ng with the internal structure of the inner core, it is ofqual interest to investigate what was the solidificationegime during its past history. As explained before, theolidification regime depends primarily upon the ther-
al, solutal and pressure gradients at the interface, thehermal and solutal fields being destabilizing whereashe pressure field is stabilizing. Because the solidifica-ion velocity was most certainly greater in the past than
lanetary Interiors 164 (2007) 36–49 45
it is today, the rates of release of heat and solute werealso greater; thermal and solutal gradients were thereforesteeper (more destabilizing). In addition, the liquidusslope mPGP is less steep at deeper depth (because thegravity field, and hence the pressure gradients decreaseto zero at the center of the Earth), and therefore less sta-bilizing. At first order, all terms seem to act in the sameway, and it is then likely that the solidification of theinner core has been dendritic for most of its history.
6. Length scales of the mush
6.1. Vertical length scales
6.1.1. Thermodynamic depth of the mushy zoneIn the laboratory, and in metallurgical applications,
the mushy zone depth is typically a few centimeters.However, because of the very small temperature gra-dient in the inner core, and of the additional effect ofpressure, the temperature in the inner core remains closeto the melting temperature, which suggests that liquidenriched in solute may remain thermodynamically stableat considerable depths (Fearn et al., 1981).
While freezing occurs in the mushy zone, interden-dritic melt is further enriched in solute, lowering itsmelting temperature further. An enriched liquid phasecan coexist with the solid phase as long as the actual tem-perature is above the melting temperature. The depth δThat which a liquid of concentration c = co + �c can be inthermodynamic equilibrium with the surrounding solidphase is then given by equating the actual and meltingtemperatures:
T (δTh) = Tm(δTh). (28)
To a good approximation, the acceleration of gravity islinear in r in the inner core, so that pressure is quadraticin radius. Assuming for convenience the temperatureprofile to be quadratic as well (which is a not so badapproximation if the cooling rate is approximately con-stant within the inner core), the following expression forδTh can be found:
δTh
ric�√
|mc|�c
�Θ, (29)
where �Θ � 150 to 200 K is the difference betweenthe actual temperature and the melting temperatures (atouter core composition) at the center of the inner core(Yukutake, 1998). The precise form of the temperature
profile (quadratic or not) is not of great importance forour order of magnitude estimates.The mushy zone can extend to the center of the innercore (δTh/ric = 1) if the variation of melting temperature
h and P
46 R. Deguen et al. / Physics of the Eartwith pressure is compensated by |mc|�c. The maximumallowable light elements concentration is the concentra-tion at the eutectic (if it exists), and the maximum value of|mc|�c is therefore |mc|(cE − c0). Taking cE = 25 at.%as a plausible value (Stevenson, 1981), we found fromEq. (29) that δTh = ric if |mc| is greater than 1.3 × 10³ K.On the other hand, if |mc| is as small as 102 K, the result-ing depth of liquid thermodynamic equilibrium is of theorder of 300 km.
6.1.2. A collapsing mushy zone?As noted by Loper (1983), a fundamental observa-
tion is that the ICB appears to be sharp on seismicwavelength scale (∼10 km), which means that the solidfraction at the top of the inner core must become signif-icant within a few kilometers in depth, a fact that seemsat first view hard to reconcile with the presence of a hun-dred kilometers thick mushy zone. Loper (1983) arguedthat convective motions in the mush may cause the den-drites to thicken and calculated that the solid fractionmay become of order one at �300 m below the top of themushy zone, thus explaining the seismic observations.
In addition to this process, the solid mass fractionmay also increase in depth because of gradual collapse ofthe dendrites under their own weight. The physical pro-cess at stake is quite similar to the isostatic adjustmentconsidered in Section 4: the density difference betweenthe solid and the liquid implies horizontal pressure gra-dients which increase with depth in the mushy zone,making the dendrites to broaden at their base by viscoussolid flow. The timescale of dendrites widening may beestimated by considering equilibrium between the hor-izontal pressure gradient and the viscous force in thesolid (Eq. (19)), as was done is Section 4. Here the hor-izontal length scale λ, say the diameter of a dendrite, issupposed to be small compared to the height h of a den-drite. As before, the horizontal velocity at depth h is oforder:
u ∼ �ρg
ηhλ, (30)
but the timescale of interest is now the ratio of horizontallength scale to the horizontal velocity τc = λ/u, so thatthe timescale of dendrite widening – or compaction – is:
τc ∼ η
�ρgh, (31)
which is inversely proportional to the height of the den-
drite. As long as the timescale of dendrites growth issmall compared to τc, the depth of the mushy zoneincreases. When increasing the height of the dendrites,the timescale of dendrites widening decreases, and a sta-lanetary Interiors 164 (2007) 36–49
tionary state is eventually reached, where the growth ofthe dendrites by solidification at their tips is balanced bythe collapse of the mushy zone. This stationary depth isthen found by equating τc to the timescale of dendritesgrowth, which is h/V when the system is stationary. Thisyields:
h ∼√
ηV
�ρg. (32)
Uncertainties in h come mostly from uncertainties inthe viscosity. With η = 1016 Pa s, h is found to be afew meters, a very small value, whereas η = 1021 Pa sleads to h ∼ 1 km (Sumita et al., 1996). Although esti-mates of h span more than two orders of magnitude,they are in any case significantly smaller than the ther-modynamic estimate of the depth of the mushy zone.This means that as a result of compaction, the solidfraction may become of O(1) at a few h in depth, wellbefore the thermodynamic limit of liquid equilibrium isreached.
6.2. Horizontal length scale: interdendritic spacing
Interdendritic spacing λ1 (the distance between twodendrites tips) is a length scale of considerable interestfor the structure of the inner core. Because each colum-nar crystal is usually made of many dendrites (Kurz andFisher, 1989), the interdendritic spacing gives a lowerbound of the grain size, and hence may gives hints onthe deformation mechanism and viscosity relevant tothe possible viscous deformation of the inner core. Inaddition, the primary dendrite spacing is needed for esti-mating the permeability of the mush, which is roughlyproportional to λ2
1 (Bergman and Fearn, 1994). Perme-ability is a necessary parameter for the study of the mushhydrodynamics (e.g., Bergman and Fearn, 1994; Le Barsand Worster, 2006), or for quantitative compaction mod-els (Sumita et al., 1996).
We make the assumption that dendrites have anaxisymmetric shape described by a function g(z), whichis linked to the solid fraction f (z) by the relation:
f (z) = πg2(z)
A(λ1), (33)
where A(λ1) is the horizontal surface area occupied bya dendrite. In a cubic dendritic array, A(λ1) is simplyλ2, whereas in a hexagonal dendritic array, A(λ ) =
1 13/2 tan(π/3)λ21 � 0.86λ21.
f and g2 are proportional through a constant involvingλ1, so that if f is known, an additional constraint on g isenough to determine λ1. This constraint can be given by
h and P
Lriwtw(nhtosgPtbF
R
Rap
td
R
w(
A
o
λ
AataddE
mf
depth is taken equal to the inner core radius, Eq. (37)gives λ1 ∼ 100–300 m, in very good agreement withBergman’s estimate.
R. Deguen et al. / Physics of the Eart
anger and Muller-Krumbhaar’s theory of dendrite tipadius selection (Langer and Muller-Krumbhaar, 1977),n which the dendrite tip radius R is equal to the shortestavelength λi for which the interface is unstable. This
heory is in very good agreement with experiments, ande will follow it in the present work. It can be shown
see Kurz and Fisher, 1989) that at low solutal Pecletumber (Pec = VR/D � 1), a condition well satisfiedere, the chemical gradient Gc at the dendrite tip is equalo the lower bound of the chemical gradient we used inur stability analysis (Eq. (9)). Estimates of λi from ourtability analysis thus directly give the adequate R. Aood approximation for R at low solutal and thermaleclets numbers can be derived from Eq. (18), noting
hat the chemical term in the numerator of (18) is muchigger than the thermal and pressure terms (Kurz andisher, 1989):
� 2π
√ΓD
mcc∞(k − 1)V(34)
ranges from ∼1 mm if mc = −104 K to ∼1 cm if mc iss low as −102 K (see Fig. 4). Uncertainties from otherarameters than mc are much smaller.
On the other hand, the dendrite tip radius R is equalo the radius of curvature of g taken in z = 0 which is byefinition equal to:
= − (1 + g′(0)2)3/2
g′′(0)(35)
here R is defined to be positive. Inserting Eq. (33) into35), with the boundary condition f (0) = 0, yields
(λ1) = 2πR
∂f/∂z|ICB. (36)
r, for an hexagonal dendritic array:
1 =√
2πR
0.86(∂f/∂z)|ICB. (37)
lthough simple, this relation is quite general, the onlyssumptions made here being that of stationary state andhat of an axisymmetric dendrite tip. If the appropriatessumptions on solute transport and selection of den-
rites tip radius are made, classical models of primaryendrite spacing (Trivedi, 1984; Hunt, 1979) follow fromq. (37).These models have been derived for non-convectingushy zones where the solid fraction increase smoothly
rom zero to one at the thermodynamic depth of the
lanetary Interiors 164 (2007) 36–49 47
mush, that is, ∂f/∂z|ICB scales as 1/δTh.1 However, seis-mology tells us that the ICB is sharp on a scale of10 km, which means that the scale length of solid frac-tion increase at the top of the inner core is obviouslynot the thermodynamic mushy zone depth, and must beat maximum ∼10 km. Therefore, a minimum order ofmagnitude of ∂f/∂z|ICB is 1/10 km = 10−4 m−1. Thismay give upper bounds for λ1; we found λ1 ∼ 10 m ifmc = −104 K and λ1 ∼ 30 m if mc = −102 K. Tighterconstraints may be found if we could estimate more pre-cisely ∂f/∂z|ICB. Compaction is not expected to affectsignificantly the dendrites spacing because it is not effec-tive in the very top of the mush. The solid fractionprofile in the upper few meters, from which the pri-mary spacing results, is more probably controlled byconvection. In his convective mushy zone model, Loper(1983) found that ∂f/∂z|ICB ∼ 3 × 10⁻³ m−1. With thisvalue and our estimates of R, we found λ1 to be 1 to5 meters. In Loper’s estimate, ∂f/∂z|ICB is proportionalto the typical velocity W of descending liquid close tothe ICB, taken to be around 10−6 m s−1. This value isquite uncertain, but as λ1 is inversely proportional tothe square root of ∂f/∂z|ICB, a change of two orders ofmagnitude in W is needed in order to change the orderof magnitude of λ1. As a consequence, and consider-ing all sources of uncertainties, it appears difficult tohave an interdendritic spacing of more than a few tens ofmeters, our preferred estimate being a few meters. If thegrowth of the inner core is episodic, the interdendriticspacing is expected to be smaller. As λ1 ∝ V−1/4, tak-ing V = 10−6 m s−1 instead of V = 10−11 m s−1 wouldresult in an interdendritic spacing about twenty timessmaller than estimated above, that is, a few tens of cen-timeters.
Our estimates are significantly smaller than estimateof a few hundred meters from scaling laws (Bergman,1998). This is not surprising because those scalinglaws have been derived for non-convecting (and non-compacting) mushy zones, where f is linearly increasingin the whole thermodynamic mushy zone. Assuming fora demonstrative purpose that f increases linearly from0 to 1 within the thermodynamic mushy zone, whose
1 Note that, in laboratory experiments, with no pressure gradient andwith a constant temperature gradient δTh ∼ mc(ce − c∞)/GT , so that,as R ∝ V−1/2, λ1 ∝ G
−1/2T V−1/4. This scaling law has been shown to
be in very good agreement with experiments (e.g., Kurz and Fisher,1989).

h and P
48 R. Deguen et al. / Physics of the EartOur assumption of an axisymmetric dendritic shapeis justified if the iron phase at inner core conditions is fccor bcc iron (Vocadlo et al., 2003b), but might not holdif it is ε-iron, as hcp materials (e.g., ice or zinc) usuallyhave plateshaped dendrites, known as platelets (Bergmanet al., 2003). If iron dendrites are indeed platelets, esti-mating the inter-platelets spacing would require somemodifications of our analysis to take into account thespecific geometry of platelets. Although this is expectedto give quantitatively different results, this should notalter the qualitative conclusion that convection in themush reduces the interdendritic spacing, and that inter-dendritic spacing at ICB should be much smaller thansuggested by classic scaling laws.
7. Conclusion
The morphological stability of an initially planesolidification front at the ICB conditions has been inves-tigated. Despite the stabilizing effects of convectionand of the pressure gradient, a continuous solidifica-tion implies non-zero solutal and thermal gradients atthe ICB which, for plausible parameters values, are highenough for the interface to be destabilized. Because theconditions in the past were even more destabilizing, it isprobable that the ICB has been dendritic through mostof the inner core history.
Thermodynamic considerations predict a very thickmushy zone which, as noted by Fearn et al. (1981), couldpossibly extend to the center of the Earth. However, con-siderable uncertainties on the phase diagram do not allowa precise estimate of the thermodynamic depth, whichmay be only a few tens of kilometers if the liquidus slopeis small. The most superficial part of the inner core maybe understood as a collapsing mushy zone, where bothconvection and compaction act to rapidly increase thesolid fraction within a length scale probably smaller than1 km, making the ICB to appear seismically sharp. Thelength scale of the thermodynamic depth of the mushyzone and the compaction length scale, although clearlydifferent, are unconstrained by the current knowledge ofthe phase diagram of the core mixture and of the solidiron viscosity at inner core conditions. Progress in thedetermination of these parameters may greatly help theunderstanding of the inner core structure.
We tried to constrain the primary dendrite spac-ing λ1 of the mushy zone. λ1 appears to depend onthe vertical derivative of the solid fraction at the top
of the mush which, in turn, depends on the vigorof convection in the mush. Here again, it is difficultto make precise and reliable estimates, but we foundthat the interdendritic spacing is most probably smallerlanetary Interiors 164 (2007) 36–49
than a few tens of meters, and possibly only a fewmeters.
Whether or not a significant amount of melt may sub-sists at large depth remains an open question. If the mushpermeability is of order λ2
1/100 (Bergman and Fearn,1994), our estimate of λ1 suggests permeability valueshigher than 10−2 m2. The work of Sumita et al. (1996)suggests that with such a high permeability, the liquidwill be very efficiently removed from the inner core bycompaction, and that the residual liquid fraction will beessentially zero. A high permeability in the mush doesnot however rule out the possibility that unconnected,trapped liquid pockets persist in depth. The answer to thisquestion may depend in part on surface tension drivenprocesses. Sintering, i.e., migration of grain boundariesdriven by surface tension, may play an important rolein the redistribution of the liquid phase and have conse-quences on the efficiency of compaction, in a way whichwill depend on the wetting properties of the melt. If the(unknown) dihedral angle of light elements rich liquidiron in contact with solid iron is greater than 60◦ (Bulau etal., 1979), the liquid phase is expected to become uncon-nected at a given liquid fraction, thus leaving a residualliquid phase in the inner core.
Acknowledgement
We thank the two anonymous reviewers for their care-ful reviews and constructive suggestions. We are gratefulto Thierry Duffar, Hisayochi Shimizu, Jean-Louis LeMouel and Jean-Paul Poirier for helpful discussions.Careful reading and useful comments by DominiqueJault, Alexandre Fournier, Philippe Cardin, Franck Plu-nian and Elisabeth Canet were much appreciated.
References
Alfe, D., Gillan, M.J., Price, G.D., 2002. Ab initio chemical potentialsof solid and liquid solutions and the chemistry of the Earth’s core.J. Chem. Phys. 116, 7127–7136.
Anderson, O.L., Duba, A., 1997. Experimental melting curve of ironrevisited. J. Geophys. Res. 102, 22659–22670.
Anderson, W., Ahrens, T., 1994. An equation of state for liquid ironand implications for the Earth’s core. J. Geophys. Res. 99, 4273–4284.
Bergman, M.I., 1998. Estimates of the Earth’s inner core grain size.Geophys. Res. Lett. 25, 1593–1596.
Bergman, M.I., Agrawal, S., Carter, M., M., M.-S., 2003. Transversesolidification textures in hexagonal close-packed alloys. J. Crystal
Growth 255, 204–211.Bergman, M.I., Fearn, D.R., 1994. Chimneys on the Earth’s inner-outercore boundary? Geophys. Res. Lett. 21, 477–480.
Boehler, R., 1993. Temperatures in the Earth’s core from melting-pointmeasurements of iron at high static pressures. Nature 363, 534–536.

h and P
B
B
B
B
B
C
C
C
C
D
D
F
F
G
H
JK
K
L
L
L
L
L
L
Yoshida, S., Sumita, I., Kumazawa, M., 1996. Growth model of the
R. Deguen et al. / Physics of the Eart
oehler, R., 1996. Fe–FeS eutectic temperatures to 620 kbar. Phys.Earth Planet. Inter. 96, 181–186.
raginsky, S., 1963. Structure of the F layer and reasons for convectionin the Earth’s core. Dokl. Akad. Nauk. SSSR Engl. Trans. 149,1311–1314.
uffett, B.A., 1997. Geodynamics estimates of the viscosity of theEarth’s inner core. Nature 388, 571–573.
uffett, B.A., Huppert, H.E., Lister, J.R., Woods, A.W., 1992. Ana-lytical model for solidification of the Earth’s core. Nature 356,329–331.
ulau, J.R., Waff, H.S., Tyburczy, J.A., Oct 1979. Mechanical andthermodynamic constraints on fluid distribution in partial melts. J.Geophys. Res. 84, 6102–6108.
ao, A., Romanowicz, B., 2004. Hemispherical transition of seismicattenuation at the top of the Earth’s inner core. Earth planet. Sci.Lett. 228, 243–253.
halmers, B., 1964. Principles of Solidification. J. Wiley & Sons, NY,319 pp.
hristensen, U., Tilgner, A., 2004. Power requirement of the geody-namo from ohmic losses in numerical and laboratory dynamos.Nature 429, 169–171.
oriell, S., Hurle, D., Sekerka, R., 1976. Interface stability duringcrystal growth: the effect of stirring. J. Crystal Growth 32, 1–7.
avis, S.H., 2001. Theory of Solidification. Cambridge UniversityPress, Cambridge, UK, p. 400.
ziewonski, A.M., Anderson, D.L., 1981. Preliminary reference Earthmodel. Phys. Earth Planet. Inter. 25, 297–356.
avier, J.J., Rouzaud, A., 1983. Morphological stability of the solid-ification interface under convective conditions. J. Crystal Growth64, 367–379.
earn, D., Loper, D., Roberts, P., 1981. Structure of the Earth’s innercore. Nature 292, 232–233.
ubbins, D., Alfe, D., Masters, G., Price, G.D., Gillan, M., 2004. Grossthermodynamics of two-component core convection. Geophys. J.Int. 157, 1407–1414.
unt, J., 1979. Solidification and Casting of Metals. The Metal Society,London.
acobs, J., 1953. The Earth’s inner core. Nature 172, 297.nittle, E., Jeanloz, R., 1991. The high-pressure phase diagram of
Fe(0.94)O—a possible constituent of the earth’s core. J. Geophys.Res. 96, 16169–16180.
urz, W., Fisher, D., 1989. Fundamentals of Solidification. Trans TechPublications, Switzerland, 305 pp.
abrosse, S., Poirier, J.-P., Le Mouel, J.-L., 2001. The age of the innercore. Earth planet. Sci. Lett. 190, 111–123.
aio, A., Bernard, S., Chiarotti, G.L., Scandalo, S., Tosatti, E., 2000.Physics of Iron at Earth’s Core Conditions. Science 287, 1027.
anger, J., Muller-Krumbhaar, H., 1977. Stability effects in dendriticcrystal growth. J. Crystal Growth 42, 11–14.
e Bars, M., Worster, M., 2006. Interfacial conditions between a purefluid and a porous medium: implications for binary alloy. J. Fluid
Mech. 550, 149–173.oper, D., Roberts, P., 1981. A study of conditions at the inner coreboundary of the Earth. Phys. Earth Planet. Inter. 24, 302–307.
oper, D.E., 1983. Structure of the inner core boundary. Geophys. andAstrophys. Fluid Dyn. 25, 139–155.
lanetary Interiors 164 (2007) 36–49 49
Morse, S.A., 1986. Adcumulus growth of the inner core. Geophys.Res. Lett. 13, 1466–1469.
Morse, S.A., 2002. No mushy zones in the Earth’s core. Geochimicaand Cosmochimica Acta 66, 2155–2165.
Mullins, W., Sekerka, R., 1963. Stability of a planar interface dur-ing solidification of a dilute binary alloy. J. Appl. Phys. 35, 444–451.
Nimmo, F., Price, G.D., Brodholt, J., Gubbins, D., 2004. The influenceof potassium on core and geodynamo evolution. Geophys. J. Int.156, 363–376.
Poirier, J.-P., 1994a. Light elements in the Earth’s outer core: A criticalreview. Phys. Earth Planet. Inter. 85, 319–337.
Poirier, J.-P., 1994b. Physical properties of the Earth’s core. C.R. Acad.Sci. Paris 318, 341–350.
Ringwood, A.E., Hibberson, W., 1991. Solubilities of mantle oxides inmolten iron at high pressures and temperatures—implications forthe composition and formation of Earth’s core. Earth planet. Sci.Lett. 102, 235–251.
Rubie, D.C., K., G.C., Frost, D. J., 2004. Partitioning of oxygen duringcore formation on the Earth and Mars. Nature 429, 58–61.
Sherman, D.M., 1995. Stability of possible Fe FeS and Fe FeOalloy phases at high pressure and the composition of the Earth’score. Earth planet. Sci. Lett. 132, 87–98.
Shimizu, H., Poirier, J.-P., Le Mouel, J.-L., 2005. On crystallization atthe inner core boundary. Phys. Earth Planet. Inter. 151, 37–51.
Stacey, F.D., Anderson, O.L., 2001. Electrical and thermal conductivi-ties of Fe Ni Si alloy under core conditions. Phys. Earth Planet.Inter. 124, 153–162.
Stevenson, D.J., 1981. Models of the earth’s core. Science 214,611–619.
Stixrude, L., Wasserman, E., Cohen, R.E., 1997. Composition andtemperature of Earth’s inner core. J. Geophys. Res. 102, 24729–24740.
Sumita, I., Yoshida, S., Kumazawa, M., Hamano, Y., 1996. A modelfor sedimentary compaction of a viscous media and its applicationto inner-core growth. Geophys. J. Int. 124, 302–324.
Trivedi, R., 1984. Interdendritic Spacing. II. –A Comparison of Theoryand Experiment. Metall. Trans. A. 15A, 977–982.
Vocadlo, L., Alfe, D., Gillan, M.J., Price, G.D., 2003a. The propertiesof iron under core conditions from first principles calculations.Phys. Earth Planet. Inter. 140, 101–125.
Vocadlo, L., Alfe, D., Gillan, M.J., Wood, I., Brodholt, J., Price,G.D., 2003b. Possible thermal and chemical stabilization ofbody-centred-cubic iron in the Earth’s core. Nature 424, 536–539.
Wen, L., 2006. Localized temporal changes of the Earth’s inner coreboundary. Science 314, 967–970.
Williams, Q., Jeanloz, R., 1990. Melting relations in the iron-sulfursystem at ultra-high pressures—implications for the thermal stateof the earth. J. Geophys. Res. 95, 19299–19310.
inner core coupled with the outer core dynamics and the resultingelastic anisotropy. J. Geophys. Res. 101, 28085–28104.
Yukutake, T., 1998. Implausibility of thermal convection in the Earth’ssolid inner core. Phys. Earth Planet. Inter. 108, 1–13.