On The Causation and Timing of Mutations During Cancer ...
207
On The Causation and Timing of Mutations During Cancer Evolution Daniel Peter Harry Temko Doctoral Thesis submitted for the degree of PhD University College London. Department of Computer Science UCL April 25, 2018
-
Upload
khangminh22 -
Category
Documents
-
view
0 -
download
0
Transcript of On The Causation and Timing of Mutations During Cancer ...

On The Causation and Timing ofMutations During Cancer Evolution
Daniel Peter Harry Temko
Doctoral Thesis submitted for the degree of PhD
University College London.
Department of Computer Science
UCL
April 25, 2018

2
I, Daniel Peter Harry Temko, confirm that the work presented in this thesis is
my own. Where information has been derived from other sources, I confirm that
this has been indicated in the thesis.

Abstract
Mutations are the proximal causes of cancer and of drug resistance. Better under-
standing the causation of mutations before and during cancer can open up avenues
for improved cancer prevention and treatment. Early mutations may be of particular
interest for therapeutic targeting and early detection.
In Chapter 2, I use a mathematical model of breast cancer development to
assess the hypothesis that varying numbers of progenitor cells causes a slow-down
in mutation accumulation. In Chapter 3, I present an adapted method to time the
accumulation of copy number changes using sequencing data, and an application
of this method in colorectal cancer. This application supports the hypothesis of a
catastrophic process where multiple copy number alterations develop at the same
time in colorectal cancer.
In Chapter 4, I present evidence that a mutational process linked to defects in
the POLE gene causes key driver mutations in colorectal and endometrial cancer.
Based on this evidence and other analyses I argue that POLE mutations are very
early events in colorectal and endometrial cancer.
In Chapter 5, I build on the ideas presented in Chapter 4 to assess the causa-
tion of driver mutations by mutational processes in a pan-cancer analysis. These
results suggest causal explanations for key driver mutations in terms of mutational
processes, and shed light on the important underlying biology of selection of driver
mutations.
In whole my work expands our knowledge of the effects of mutational pro-
cesses on cancer mutations and the timing of these mutations, indicates research
strategies for novel approaches to cancer prevention and treatment, and informs our

Abstract 4
understanding of the biological context of cancer evolution.

Impact Statement
In this thesis I present several mathematical modelling-based analyses that investi-
gate the causation and timing of mutations, and the cellular dynamics of tumours.
The key findings of the research include:
(i) Evidence that copy number alterations (CNAs) often occur in a punctuated
fashion, close in time to the last common ancestor of all tumour cells, in colorectal
cancers.
(ii) Evidence that pathogenic mutations in the POLE gene are early events in the
colorectal and endometrial cancers in which these mutations occur.
(iii) Suggestive evidence of causal relationships between mutational processes and
driver mutations.
(iv) Evidence for differences in selection between different mutations (amino acid
changes) in the same driver gene and related driver genes.
There are several ways in which the work presented in this thesis could have a
beneficial impact:
My findings on mutation timing have potential implications for tumour surveil-
lance. I argue that POLE mutations are early events in colorectal and endometrial
cancers in which they occur somatically. CNAs, by contrast, appear to often occur
in a cluster of late events (close to the last common ancestor of cancer cells) in
colorectal cancer. The early occurrence of POLE mutations make them good can-
didates for surveillance programs, albeit the relatively small proportion of tumours
in which these mutations are found must be taken into account. In terms of CNA

Abstract 6
mutations, my results suggest that there may be limited scope to assess progres-
sion towards colorectal cancer in terms of CNA accumulation, since the window of
time before the last clonal expansion during which these changes are detectable is
relatively narrow.
The results presented here also point to possible mechanisms of mutation cau-
sation that could be of relevance for cancer prevention. The results in Chapters 4
and 5 identify a key role for potentially modifiable alterations to the mutation rate
in accumulation of driver mutations. Whereas, the results of Chapter 3 support the
hypothesis that WGD events play an important role in the aetiology of colorectal
cancer, and motivate further research into the mechanisms of this type of change.
The differential selection results presented here are of interest for our wider
understanding of cancer evolution. These results challenge the prevailing thinking
on driver mutations and passenger mutations by demonstrating a spectrum of selec-
tive effects between driver mutations. Many previous studies have assumed a fixed
selective impact among drivers [Beerenwinkel et al., 2007, Waclaw et al., 2015,
McFarland et al., 2014]. Some studies have allowed for a distribution of effects,
but have relied on indirect estimates for parameter estimation [Foo et al., 2015].
My results argue in favour of incorporating such distributions in future studies, and
also point to possible parameterisations. Thus, these findings have the potential to
impact discourse and thinking in the cancer research field, to promote future dis-
coveries.
In summary, the results presented in this thesis have the potential to impact
tumour surveillance and prevention, and could also impact our wider understanding
of cancer evolution. In total, the work provides a contribution to the growing body
of work on the forces that govern the course of tumour evolution.

Publications
Work from the following manuscripts forms an important part of this thesis:
* Equal contribution
1. Temko D.*, Cheng Y.K.*, Polyak K., and Michor F. (2017). Mathematical
modeling links pregnancy-associated changes and breast cancer risk. Cancer Res,
77(11):2800-2809
2. Temko D., Van Gool I.C., Rayner E., Glaire M., Makino S., Brown M.,
Chegwidden L., Palles C., Depreeuw J., Beggs A., Stathopoulou C., Mason M,
Baker A., Williams M., Cerundolo V., Rei M., Taylor J.C., Schuh A., Ahmed A.,
Amant F., Lambrechts D., Smit V.T.H.B.M., Bosse T., Graham T.A., Church D.N.,
Tomlinson I. Somatic POLE exonuclease domain mutations are early events in spo-
radic endometrial and colorectal carcinogenesis, determining driver mutation land-
scape, clonal neo-antigen burden and immune response. in press, The Journal of
Pathology, 2018
3. Temko D., Tomlinson I., Severini S., Schuster-Bckler B., Graham T.A.
The effects of mutational processes and selection on driver mutations across cancer
types, in press, Nature Communications, 2018
4. Cross W., Kovac M., Mustonen V., Temko D., Davis H., Baker A., Biswas
S., Arnold R., Chegwidden L., Gatenbee C., Anderson A.R., Koelzer V.H., Mar-
tinez P., Jiang X., Domingo E., Woodcock D., Feng Y., Kovacova M., Jansen M.,
Rodriguez-Justo M., Ashraf S., Guy R., Cunningham C., East J.E., Wedge D., Wang
L.M., Palles C., Heinimann K., Sottoriva A., Leedham S.J., Graham T.A. and Tom-
linson I. The evolutionary landscape of colorectal tumorigenesis, in preparation,
2018

Abstract 8
I have also contributed to the following manuscripts which do not feature
prominently in the thesis:
1. Baker A.*, Cross W.*, Curtius K.*, Al-Bakir I.*, Choi C.R.*, Davis H.,
Temko D., Biswas S., Martinez P., Williams M., Lindsay J.O., Feakins R., Vega
R., Hayes S., Tomlinson I., McDonald S.A.C., Moorghen M., Silver A., East J.E.,
Wright N.A., Wang L.M., Rodriguez-Justo M., Jansen M., Hart A.L., Leedham S.J.
and Graham T.A. The evolutionary history of human colitis-associated colorectal
cancer, submitted, 2018
2. Werner B., Case J., Williams M., Chkhaidze K., Temko D., Cross W., Spiteri
I., Huang W., Tomlinson I., Barnes C., Graham T. and Sottoriva A. Measuring single
cell divisions in human cancers from multi-region sequencing data, in preparation,
2018

Acknowledgements
I would like to thank my supervisors Simone Severini, Trevor Graham and Ian Tom-
linson. Through your expertise and insights you have helped me to turn vague
ideas into research of relevance to the terrible disease that is the topic of this the-
sis. Through your passion for your work and love of life, you have demonstrated
to me that on top of the grit and grind, the best science involves an essential in-
gredient of fun (and occasionally beer too). In your different leadership styles you
have also each been role models to me, providing an example of fair, and effective
leadership, which I hope one day to emulate. Finally, thank you for both the sup-
port you have provided on a personal level, which has been a great help throughout
the process, and for trusting me to make my own mistakes and come to my own
conclusions, which undoubtedly has helped make me a better scientist. Also, thank
you for teaching me statistics.
In addition, I would like to thank my collaborators: Benjamin Schuster-
Boeckler, David Church, Franziska Michor, Nelly Polyak, Marc Williams, Anne-
Marie Baker, William Cross, Laura Gay, Kit Curtius, Ibrahim Al-Bakir, Viola
Walther, Jacob Househam, Pierre Martinez, Weini Huang, and Philipp Altrock form
a necessarily incomplete list.
I must also thank my funders, the Engineering and Physical Sciences Research
Council (EPSRC) and the Yule Bogue bequest, without the support of whom this
work would not have have been possible.
Lastly, I wish to thank my family (current and future). To my parents Ned
and Astra, thank you for your ever-willingness to lend an ear and provide me with
good food throughout this journey. And to Gaby, my fiancee, thank you for your

Abstract 10
endless patience and willingness to discuss cancer evolution, long after the novelty
had presumably warn off.

Contents
1 Introduction 17
1.1 Precis . . . . . . . . . . . . . . . . . . . . . . . . . . . . . . . . . 17
1.2 Motivation . . . . . . . . . . . . . . . . . . . . . . . . . . . . . . . 18
1.3 Identification and timing of mutator processes: Theory . . . . . . . 21
1.4 Identification and timing of mutation processes: Data . . . . . . . . 24
1.4.1 SNA mutation processes . . . . . . . . . . . . . . . . . . . 25
1.4.2 CNA mutation processes . . . . . . . . . . . . . . . . . . . 27
1.5 Selection . . . . . . . . . . . . . . . . . . . . . . . . . . . . . . . 34
1.6 Prognostic implications of mutation processes . . . . . . . . . . . . 39
1.7 Aims and objectives . . . . . . . . . . . . . . . . . . . . . . . . . . 41
2 Mathematical modeling links pregnancy-associated changes and breast
cancer risk 43
2.1 Precis . . . . . . . . . . . . . . . . . . . . . . . . . . . . . . . . . 43
2.2 Contribution . . . . . . . . . . . . . . . . . . . . . . . . . . . . . . 44
2.3 Introduction . . . . . . . . . . . . . . . . . . . . . . . . . . . . . . 44
2.4 Mathematical Framework . . . . . . . . . . . . . . . . . . . . . . . 48
2.4.1 Mathematical model . . . . . . . . . . . . . . . . . . . . . 48
2.4.2 Model summary . . . . . . . . . . . . . . . . . . . . . . . 55
2.5 Model Exploration . . . . . . . . . . . . . . . . . . . . . . . . . . 57
2.5.1 Model fitting procedure . . . . . . . . . . . . . . . . . . . . 57
2.5.2 Analysis of model fit . . . . . . . . . . . . . . . . . . . . . 58
2.6 Conclusion . . . . . . . . . . . . . . . . . . . . . . . . . . . . . . 65

Contents 12
3 Evidence for punctuated accumulation of copy number alterations in
colorectal cancer 69
3.1 Precis . . . . . . . . . . . . . . . . . . . . . . . . . . . . . . . . . 69
3.2 Contribution . . . . . . . . . . . . . . . . . . . . . . . . . . . . . . 70
3.3 Introduction . . . . . . . . . . . . . . . . . . . . . . . . . . . . . . 70
3.4 Mathematical Framework . . . . . . . . . . . . . . . . . . . . . . . 73
3.4.1 Growth model . . . . . . . . . . . . . . . . . . . . . . . . 73
3.4.2 Joint estimation procedure . . . . . . . . . . . . . . . . . . 74
3.4.3 Likelihood Maximisation . . . . . . . . . . . . . . . . . . . 75
3.4.4 Confidence intervals . . . . . . . . . . . . . . . . . . . . . 80
3.4.5 Testing for punctuated CNA evolution in exome data . . . . 81
3.5 Application to data . . . . . . . . . . . . . . . . . . . . . . . . . . 81
3.5.1 Application of timing model to whole genome sequencing
data in a study of colorectal cancer . . . . . . . . . . . . . . 82
3.5.2 Exome test power analysis . . . . . . . . . . . . . . . . . . 84
3.5.3 Application of timing model to whole exome sequencing
data in a study of colorectal cancer . . . . . . . . . . . . . . 86
3.5.4 Application of timing model to whole exome sequencing
data in a study of IBD-associated-colorectal cancer . . . . . 89
3.6 Conclusion . . . . . . . . . . . . . . . . . . . . . . . . . . . . . . 90
4 POLE mutations are early events in colorectal cancer and endometrial
cancer 94
4.1 Precis . . . . . . . . . . . . . . . . . . . . . . . . . . . . . . . . . 94
4.2 Contribution . . . . . . . . . . . . . . . . . . . . . . . . . . . . . . 95
4.3 Introduction . . . . . . . . . . . . . . . . . . . . . . . . . . . . . . 95
4.4 Methods . . . . . . . . . . . . . . . . . . . . . . . . . . . . . . . . 100
4.4.1 Mutational signature framework . . . . . . . . . . . . . . . 100
4.4.2 Tumour growth model . . . . . . . . . . . . . . . . . . . . 101
4.4.3 Likelihood of a cancer mutation on the background of a
mutational signature . . . . . . . . . . . . . . . . . . . . . 102

Contents 13
4.4.4 POLE heuristic mutational signature score . . . . . . . . . . 103
4.4.5 Ethical approval . . . . . . . . . . . . . . . . . . . . . . . 105
4.4.6 Patients and tumour samples . . . . . . . . . . . . . . . . . 105
4.4.7 DNA extraction . . . . . . . . . . . . . . . . . . . . . . . . 105
4.4.8 DNA sequencing . . . . . . . . . . . . . . . . . . . . . . . 105
4.4.9 Definition of driver genes . . . . . . . . . . . . . . . . . . 106
4.4.10 Clonality of POLE mutations . . . . . . . . . . . . . . . . 107
4.4.11 Classification of SNAs to a mutational processes . . . . . . 107
4.4.12 POLE consensus mutational signature scores in driver genes 108
4.5 Results . . . . . . . . . . . . . . . . . . . . . . . . . . . . . . . . . 109
4.5.1 Whole genome sequencing . . . . . . . . . . . . . . . . . . 109
4.5.2 POLE mutations often occur before the last common ances-
tor of all tumour cells . . . . . . . . . . . . . . . . . . . . . 109
4.5.3 POLE signature scores of driver mutations . . . . . . . . . 111
4.6 Conclusion . . . . . . . . . . . . . . . . . . . . . . . . . . . . . . 119
5 The effects of mutation and selection on driver mutations across cancer
types 122
5.1 Precis . . . . . . . . . . . . . . . . . . . . . . . . . . . . . . . . . 122
5.2 Contribution . . . . . . . . . . . . . . . . . . . . . . . . . . . . . . 123
5.3 Summary . . . . . . . . . . . . . . . . . . . . . . . . . . . . . . . 123
5.4 Introduction . . . . . . . . . . . . . . . . . . . . . . . . . . . . . . 123
5.5 Methods . . . . . . . . . . . . . . . . . . . . . . . . . . . . . . . . 125
5.5.1 Testing for evidence of differential selection between muta-
tions in a cancer type . . . . . . . . . . . . . . . . . . . . . 125
5.5.2 Modelled relative risk . . . . . . . . . . . . . . . . . . . . 126
5.5.3 Data collection . . . . . . . . . . . . . . . . . . . . . . . . 127
5.5.4 Sample-specific mutation collection . . . . . . . . . . . . . 127
5.5.5 Definition of driver genes . . . . . . . . . . . . . . . . . . 127
5.5.6 Sample-specific mutational signature estimation . . . . . . . 127
5.5.7 Required mutations for signature assignment . . . . . . . . 128

Contents 14
5.5.8 Power calculations . . . . . . . . . . . . . . . . . . . . . . 129
5.5.9 Comparison of genomic and exonic mutation distributions . 130
5.5.10 Variation explained by mutation probability . . . . . . . . . 130
5.5.11 Multiple testing corrections . . . . . . . . . . . . . . . . . 131
5.6 Results . . . . . . . . . . . . . . . . . . . . . . . . . . . . . . . . . 131
5.6.1 Testing for mutational process and driver mutation associa-
tions . . . . . . . . . . . . . . . . . . . . . . . . . . . . . . 131
5.6.2 Mutational processes shape driver mutation landscape . . . 133
5.6.3 Detecting differential selection . . . . . . . . . . . . . . . . 136
5.6.4 Differential selection between pathogenic amino acid
changes within a driver gene . . . . . . . . . . . . . . . . . 138
5.6.5 Differential selection between mutationally-exclusive
driver genes . . . . . . . . . . . . . . . . . . . . . . . . . . 140
5.7 Conclusion . . . . . . . . . . . . . . . . . . . . . . . . . . . . . . 145
6 Discussion 149
7 Methods 152
7.1 Standard Mutation Calling Pipeline . . . . . . . . . . . . . . . . . . 152
7.1.1 Quality Control . . . . . . . . . . . . . . . . . . . . . . . . 152
7.1.2 Alignment and Preprocessing . . . . . . . . . . . . . . . . 152
7.1.3 Somatic Mutations . . . . . . . . . . . . . . . . . . . . . . 153
7.1.4 Mutation context information used to identify mutation
channel . . . . . . . . . . . . . . . . . . . . . . . . . . . . 153
7.1.5 Copy Number Alterations . . . . . . . . . . . . . . . . . . 153
Appendices 155
A Supplementary Figures 155
B Colophon 174
Bibliography 175

List of Tables
2.1 Fixed parameter values. Parameters that remained unchanged
throughout all simulations. ttotal: Simulation time (years), αpreg:
Proportional reduction of cell cycle time of stem cells during preg-
nancy, αmenopuase: Proportional increase of cell cycle time of stem
cells after menopause, ppost : Proportional reduction in number of
progenitor cells after initial pregnancy. . . . . . . . . . . . . . . . 55
2.2 Range of parameter values investigated. For each parameter of in-
terest, we tested multiple values. Values defaulted to the numbers
in bold. tcycle: Cell cycle time of stem cells (hours), N: Stem cell
number, z: Progenitor cells divisions, p: Asymmetric division rate,
µ: Mutation rate (per cell division), γbase: Self-renewal event rate,
fmut : Mutant stem cell relative fitness, zmut : Mutant progenitor ex-
pansion, nmut : Mutations required, zpreg: Pregnancy progenitor ex-
pansion, ppost,subs: Proportional reduction in number of progenitor
cells after subsequent pregnancies. . . . . . . . . . . . . . . . . . . 55
3.1 Colorectal cancer whole genome sequencing data considered for
timing analysis . . . . . . . . . . . . . . . . . . . . . . . . . . . . 82
3.2 Colorectal cancer whole exome sequencing data considered for
CNA catastrophe test . . . . . . . . . . . . . . . . . . . . . . . . . 87
3.3 Application of test for punctuated CNA evolution to colorectal can-
cer exomes . . . . . . . . . . . . . . . . . . . . . . . . . . . . . . 89
3.4 IBD-associated-colorectal cancer whole exome sequencing data
considered for CNA catastrophe test . . . . . . . . . . . . . . . . . 89
List of Tables 16
3.5 Application of test for punctuated CNA evolution to IBD-associated
colorectal cancer exomes . . . . . . . . . . . . . . . . . . . . . . . 90
4.1 POLE-mutant tumours . . . . . . . . . . . . . . . . . . . . . . . . 105
4.2 Clonality of POLE mutations in endometrial cancer and colorectal
cancer samples. p-value’s shown are for one-sided binomial tests of
the null hypothesis that the mutation was present in every tumour cell.114
5.1 Samples used for study . . . . . . . . . . . . . . . . . . . . . . . . 132
5.2 Associations between mutational signatures and driver mutations
within cancer types. ‘Frequency’: Mutation frequency in the tu-
mour type . . . . . . . . . . . . . . . . . . . . . . . . . . . . . . . 135

Chapter 1
Introduction
1.1 Precis
Mutations play a causal role in cancer initiation and progression. Mutations arise
due to mutation-causing processes (mutation processes or mutational processes) in
somatic tissues and change in frequency in the population due to natural selection
and drift. Improved understanding of these mutation processes is therefore of inter-
est for prevention, early detection, and treatment of cancer. In addition, refined un-
derstanding of mutation causation is important to define a null model against which
it is possible to identify those mutations that are more frequent than expected in
cancer genomes, and are subject to selection; a task of central importance to cancer
research. The lack of data following the evolution of individual patients over time
presents a major challenge for identification of mutation processes. Mathematical
modelling can be a useful toolset to recover information on the causes of mutation
in data that comes from a single point in time. Here, I present several analyses
that aim to infer mutation-causing processes from molecular data that represents a
snapshot in time. In the final chapter, I will present an application of a model of
mutation-causing processes that aims to infer the strength of selection experienced
by individual mutations. Overall, I aim to contribute to the expanding literature on
the operation of mutation-causing processes in cancer and the selective impact of
individual mutations.

1.2. Motivation 18
1.2 Motivation
Genetic mutations are proximal causes of cancer inititiation [Lawrence et al., 2014,
Vogelstein et al., 2013], and play an important role in resistance to targeted ther-
apy [Chong and Janne, 2013, Weisberg et al., 2007]. In addition, somatic mutations
can lead to the recognition of tumours by the immune system [Brown et al., 2014],
and this recognition can be harnessed for therapy [McGranahan et al., 2016]. Al-
beit, the identity of the mutations that play a causal role in disease is a mat-
ter of long-standing research and the subject of ongoing debate [Cooper, 1982,
Lawrence et al., 2014, Martincorena et al., 2017]. Mutations arise in human tissues
at varying rates, their survival and expansion depends on natural selection and drift,
both of which relate to population structure.
As a result, understanding the causation and timing of mutations during cancer
evolution is important for several reasons. First, due to the causal role of mutation in
disease progression, in a straightforward sense this understanding is important for
cancer prevention and treatment. Indeed, many existing cancer prevention strate-
gies are based on removal of mutation-causing processes that have already been
identified, including strategies to reduce ultra-violet, and tobacco exposure. By the
same token understanding of mutation-causing processes and how they impact the
accumulation of mutations in the evolving tumour population could enable better
prognostication. In many cases the mutation processes present in cancer genomes
are measurable [Alexandrov et al., 2013a], so in theory it may be possible to predict
evolutionary trajectories.
Secondly, there is a particular rationale for identifying early mutation-causing
processes and mutations [Loeb, 2011]: In a straightforward sense early mutations
have the most relevance for early detection. In addition, mutations that occur before
the last common ancestor of all tumour cells (LCA) are expected to be present
in every tumour cell (clonal) and can consequently be targeted in every tumour
cell by a therapy. Finally, some researchers have argued that oncogene addiction
is most likely for early mutations [Cristea et al., 2017]. Oncogene addiction is a
phenomenon where tumour cells, but not healthy cells, become dependent on the

1.2. Motivation 19
presence of a mutation for survival [Weinstein, 2002].
In addition, accurate understanding of muation-causing processes is key
to determining the selective impacts of individual mutations. Multiple stud-
ies (reviewed below) have aimed to identify genes under selection by finding
genes that are mutated more (or less) frequently in tumours than would be ex-
pected based on underlying mutation rates [Greenman et al., 2007, Kan et al., 2010,
Martincorena et al., 2017]. The conclusions of these studies have been shown to be
sensitive to the underlying model of mutation rate [Lawrence et al., 2013], and have
generally developed in step with improved understanding of mutation-causing pro-
cesses (see below). Further improvements in the understanding of mutation-causing
processes could continue to drive these efforts forward.
Identifying the role played by individual mutations in disease can help to
design treatments. The EGFR gene is a case in point. Multiple lines of evi-
dence, including frequent mutations, supported a causal role for this gene in disease
[Dowell and Minna, 2006]. This lead to the development of treatments targeting the
protein encoded by this gene, including Erlotinib, which interferes with the capacity
of the EGFR-coded protein to propagate signalling cascades via phosphorylation
[Dowell and Minna, 2006, Schettino et al., 2008]. Although resistance remains a
major problem, such therapies have improved survival time in non-small cell lung
cancer [Dowell and Minna, 2006]. Treatments targeting a fusion mutation involv-
ing the genes BCR and ABL provide another example in chronic myeloid leukemia
[Mitelman et al., 2007, Quintas-Cardama et al., 2009]. Thus, mutations that play a
causal role in disease can provide good treatment targets.
A major challenge for the identification of mutation processes, and indeed in
cancer research more broadly, is that the process of cancer development in humans
cannot usually be directly observed. By necessity, the molecular data that is avail-
able to cancer researchers represents a single snapshot in time at the point when
the tumour was removed. There are some exceptions in the case of blood cancers
[da Silva-Coelho et al., 2017], and promising technological advances suggest that
this may not always be the case for solid tumours; recent research has demonstrated

1.2. Motivation 20
that tumour DNA is detectable in the blood from the earliest stages of tumorigenesis
and tumour relapse [Abbosh et al., 2017, Cohen et al., 2018]. At present, though,
single time-point data remains a major challenge for most tumour types.
At that single timepoint, there has recently been a rapid expansion in the
amount of data available. Of note, since 2005 the Cancer Genome Atlas (TCGA)
study generated publicly available whole exome sequencing (WXS) data for over
11,000 patients across 21 primary cancer sites (https://portal.gdc.cancer.gov). The
PanCancer Analysis of Whole Genome (PCAWG) study that is currently in progress
promises to generate a similarly rich public resource of tumour whole genome se-
quencing (WGS) data.
There is a precedent for mathematical modelling approaches to these questions
(which I discuss). However, there are two, informative, reasons why they are not
more common. First, the complexity of the process of mutation accumulation and
subsequent DNA sequencing means that mathematical models of mutation accumu-
lation often have multiple free parameters. This has historically been the case for
mathematical models of cancer development. A case in point is the seminal 1954
study by Armitage and Doll [Armitage and Doll, 1954] that provided key evidence
that cancer initiation is a multi-step process. While the study is rightly regarded as
one of the key contributions of mathematical modelling to cancer research, the con-
clusions on the specific number of mutations required for cancer have been ques-
tioned by later research – it has become clear that changes to the model to take
into account the impact of clonal expansions can greatly effect the estimation of
the number of steps required for cancer [Moolgavkar, 2004]. This exemplifies the
fact that the findings from mathematical modelling studies are typically subject to
caveats, and progress can be incremental.
Secondly, this approach is mutli-disciplinary. My approach requires applica-
tions of mathematical techniques to biological content (including formalisation of
biological concepts and synthesis of diverse areas of biological theory). This re-
quires some appreciation of both the mathematics and the biology in the researcher,
in addition to close collaboration between genuine subject area experts. As a result,
1.3. Identification and timing of mutator processes: Theory 21
the pool of researchers and groups with appropriate interests and backgrounds is
relatively limited.
Below, I review the literature on causes and timing of mutations in cancer. I
first review the literature on mutation-causing processes. I then turn to the literature
on the inference of selection, which often relies on modelling of mutation processes.
Finally, I review the literature on the impact of varying mutation rates on outcomes
in cancer.
1.3 Identification and timing of mutator processes:
TheoryThe question of whether mutator phenotypes (defined as an increased cell-intrinsic
mutation rates compared to non-cancerous cells) are common in cancer is a matter
of longstanding debate. Two types of argument have been made in favour of preva-
lent mutator phenotypes, by Lawrence Loeb and others. First, it has been argued
that increased mutation rates are necessary to explain disordered genomes found
in cancer cells, and the high incidence levels of cancer [Loeb, 2001] (necessity ar-
guments). The second argument is based on two observations. First, that there are
numerous genetically-encoded cellular processes involved in the faithful replication
of DNA and the repair of insults to DNA [Loeb, 2011]. Secondly, that cancer initi-
ation requires the accumulation of multiple genetic mutations that occur slowly in
the absence of a mutator phenotype. The argument claims that, as a result, mutator
mutations and likely to be common during the process of carcinogenesis, leading
to mutator phenotypes in the resulting cancers [Christians et al., 1995, Loeb, 2011]
(efficiency arguments).
Historically necessity arguments for a mutator phenotype by Loeb and col-
leagues have relied on the need for more than two rate-limiting steps in carcinogen-
esis [Loeb, 1991], and the possibility that even six or 12 mutations are required for
carcinogenesis. [Loeb, 2001, Armitage and Doll, 1954].
Theoretical models [Moolgavkar and Knudson, 1981] and novel data-driven
approaches [Tomasetti et al., 2015] have challenged traditional views that a large
1.3. Identification and timing of mutator processes: Theory 22
number of mutations are required for cancer development – the latter study sug-
gested that only three driver mutations are required for the development of lung
cancer and colon cancer. In addition, studies that consider the effects of clonal ex-
pansion have predicted faster rates of mutation accumulation under normal mutation
rates, and concluded that mutator phenotypes are unlikely to be necessary to explain
mutation and incidence rates [Beerenwinkel et al., 2007, Tomlinson et al., 1996].
However, none of these considerations are definitive. The Tomasetti study
was restricted to colon cancer and lung cancer, and the length of routes to cancer
across all cancer types is not known. Regarding the effects of clonal expansions -
[Beerenwinkel et al., 2007] finds that cancers can develop within a human lifespan
under a normal mutation rate assuming that drivers confer a selective advantage of
1%. However, the study assumes a well-mixed population in which the effects of
selection could be overstated.
It is likely that the necessity or not of a mutator will depend on the balance
between the length of routes to cancer (i.e. the number of causal mutations required
and the probability of these mutations), and the efficacy of selection to accelerate
mutagenesis, and there is still a long way to go to understand that balance.
There is a related body of literature evaluating efficiency arguments, describ-
ing whether faithful DNA replication should be expected to fail en route to cancer,
given its complexity, and in light of the number of mutations required for cancer,
and at what time during carcinogenesis we should expect these failures to occur. An
important paper in the field investigated the required effect size of a mutator pheno-
type that would lead to the expectation of seeing mutator phenotypes in over half of
cancers [Beckman and Loeb, 2006]. The study found that the required effect size
varied over 1,000-fold depending on the number of mutations required for cancer,
the number of mutator loci and the mutation rate. The same study found that if
mutator phenotypes emerge, then they are more likely to be early events.
A model that took into account both clonal expansion and the effects of dele-
terious mutations [Datta et al., 2013] also found a wide range of predictions regard-
ing the likelihood of a mutator phenotype emerging, with the probability of mutator

1.3. Identification and timing of mutator processes: Theory 23
phenotypes varying between zero and one depending on the probability of mutator
mutations. Interestingly this study predicted that mutator phenotypes were more
likely to occur under intermediate selection for drivers, than under strong or weak
selection regimes.
Ian Tomlinson made the intriguing prediction, that although mutator pheno-
types were predicted to be early events if they occurred, that they are more likely
to occur in later onset cancers [Tomlinson et al., 1996], due to the extra steps re-
quired for these cancers to develop. In a model that allows for back-mutation Ko-
marova et al. recently predicted that when the selective effects of drivers muta-
tions are in balance with the potential effects of deleterious mutations, then mutator
phenotypes can emerge early in cancer development and later revert to stability
[Asatryan and Komarova, 2016]
The impact of ‘tumour suppressor genes’ (TSGs) which may require two hits
before conferring a selective advantage has been studied in detail by Franziska Mi-
chor and colleagues. These studies generally focus on chromosomal instability
(CIN) as opposed to instability at the level of point mutations, since classical TSGs
are thought to be inactivated by chromosomal mutations. A study by Franziska
Michor found that the requirement to inactivate a tumour suppressor gene en route
to cancer meant that CIN is likely to occur early even if only one or a few CIN-
conferring mutations are possible, given a fixed cell population size [Michor, 2005].
The same study found that the requirement for two TSGs to be inactivated implies
CIN is likely to occur early even if the mutations that lead to CIN come at a selec-
tive cost. A later study, which included a growing population of cells found that the
tendency of clones with CIN to accumulate deleterious mutations that could slow
their growth had little effect on the prediction that these mutations would be early
in the context of tumour suppressor genes [Nowak et al., 2006]. These results sug-
gest that tumour suppressor genes increases the likelihood of early instability during
the develop of cancer. However, it is unclear how these results are affected by the
complicating factors of multiple possible mutational paths to cancer, some of which
may not involve tumour suppressor genes.

1.4. Identification and timing of mutation processes: Data 24
These modelling results illustrate the complexity of the evolutionary setting in
which cancer develops, often confounding firm predictions from theory. However,
on a more optimistic note, they also illustrate the unexpected dynamics that can
arise in this complex setting, motivating further research, and potential therapeutic
targets.
1.4 Identification and timing of mutation processes:
DataTo discuss the literature on mutation-causing processes (mutation processes) it is
useful to distinguish two major classes of mutation. Single nucleotide alterations
(SNAs) describe substitution of one DNA base (A,C,G or T) for another in the linear
DNA sequence, as well as insertions and deletions on the same length scale. Copy
number alterations (CNAs) describe changes at the level of megabases. CNAs in-
clude duplications (copies of a large section of DNA), and deletions; duplications
that are re-inserted adjacent to the copied sequence are known as tandem duplica-
tions. CNAs also include rearrangements of the continuous DNA sequence. Here,
I have included rearrangements in the definition of CNAs, even though they do not
alter copy number (in the sense of the number of genomic copies of a stretch of
sequence), for ease of exposition; since my focus here is on mutation-causing pro-
cesses and many processes that cause CNAs (more narrowly defined) also cause
rearrangements. Thus, the term CNA used here, may be thought of as a short-hand
for CNA and rearrangement as used elsewhere in the literature.
Although there is a broad literature on mutation processes in cancer, these
studies generally share some commonalities in approach. In general, mutations
with common genomic features are inferred to be caused by a similar mutation
process, often backed up by evidence from experimental systems. It is possible
to partially reconstruct the dynamics in several ways. First, temporal information
can be accessed by harnessing the idea that different individuals represent different
time-points of a common process. Thus types of mutation that correlate across in-
dividuals can identify the influence of a common process realised across different

1.4. Identification and timing of mutation processes: Data 25
time-points. Similarly, evidence from putative pre-malignant lesions can be com-
pared to frank carcinomas to approximate temporal data. Further evidence is pro-
vided by studies of the clonal status of mutations attributed to different processes;
mutations that are present in every cell probably occurred before the last common
ancestor of all tumour cells. In addition, for copy number change in particular, the
final state records some information on the order of events. This is the case for
two reasons. First, since copy number changes effect large regions of the genome
they often overlap and the order of events influences the final pattern. Secondly,
the SNAs within CNA mutations can be used as a molecular clock to time their
occurrence. This research has cast light on multiple mutation processes involving
different types of mutation that are active in cancer (reviewed presently).
1.4.1 SNA mutation processes
There are a number of well-described mutation processes at the level of SNAs,
two of these processes merit special mention given their relevance to the content
of the thesis. The first is microsatellite instability (MSI). Microsatellites are seg-
ments of DNA consisting of multiple repeats of the same short sequence of one
to several bases. In microsatellite instability frequent indels increase or decrease
the number of repeats in the segment. MSI was described in 1993 in colorectal
cancer [Thibodeau et al., 1993]. It has since been shown to occur in around 15%
of colorectal cancers [Vilar and Gruber, 2010]. In this setting it is most commonly
caused by methylation of the MLH1 gene, which is one of those genes involved
in the mismatch repair (MMR) process that repairs microsatellite indels, in addi-
tion to other types of mutation [Vilar and Gruber, 2010]. While MSI is traditionally
recognised as playing a role in colorectal, endometrial and gastric cancers, a re-
cent support suggested that that MSI may occur at low levels in most tumour types
[Hause et al., 2016].
The second is a mutation process linked with mutations in the POLE gene
(discussed in detail in Chapter 4). The POLE gene encodes a subunit of the DNA
replicase (Polε) [Rayner et al., 2016]. A subset of mutations in the gene cause a
mutation process involving a very high rate of C>A changes that occur at TCT trin-

1.4. Identification and timing of mutation processes: Data 26
ucleotides due to disrupted DNA repair [Rayner et al., 2016]. These mutations are
found in 7-12% of endometrial cancers and 1-2% of colorectal cancers, as well as a
range of other tumour types [Rayner et al., 2016], referred to as ‘ultramutator’ can-
cers. Endometrial cancers with POLE mutations are associated with high immune
infiltration and improved prognosis [Hussein et al., 2015, Church et al., 2015].
In 2013 Ludmil Alexandrov and colleagues published a landmark paper in-
troducing a mutational signature framework in cancer that provides a way of es-
timating the SNA mutation-causing processes involved in the history of a tu-
mour sample and ascribing mutations probabilistically to individual processes
[Alexandrov et al., 2013b, Alexandrov et al., 2013a]. The framework classifies
SNAs into 96 types defined by the base change (such as C>T), and the genomic
context including the two flanking bases of the mutated base (such as TCT). Under
the assumption that each mutation process creates a characteristic distribution of
mutations across the types (or a mutational signature), the study used the mutational
catalogues from multiple tumours to identify 21 inferred processes and their asso-
ciated mutational signatures. The signatures framework has since been extended to
over 30 processes and associated signatures [Petljak and Alexandrov, 2016]. Many,
but not all, of the signatures have a biological interpretation. Signatures 6, 15, 20
and 26 are linked to MMR defects, and signature 10 is linked to POLE mutation.
Other signatures are linked to a range of processes including tobacco-induced dam-
age (signature 4), mutation by APOBEC (apolipoprotein B mRNA editing enzyme,
catalytic polypeptide-like) deaminases (signatures 2 and 13) and ultraviolet radia-
tion (UV) (signature 7) (cancer.sanger.ac.uk/cosmic/signatures).
Studies have indicated diverse patterns with respect to SNA mutation process
timing. A study that analysed mutation accumulation in individuals spanning a large
age range suggests that some SNA mutation processes may occur gradually over
the course of a lifetime, showing a clock-like relationship with age, in both tumour
tissue [Alexandrov et al., 2015] and normal tissue [Blokzijl et al., 2016]. These in-
clude a mutation process thought to be caused by deamination of methylated cy-
tosines, which causes C>T mutations where the C base is followed by a G base in

1.4. Identification and timing of mutation processes: Data 27
the normal sequence (signature 1), and a process of unknown etiology which causes
a broad spectrum of SNAs (signature 5) [Helleday et al., 2014].
Studies of the clonal status of SNA mutations can also reveal information on
the timing of SNA mutational processes. One of the key discoveries of cancer
research of recent years has been the widespread presence of intra-tumour het-
erogeneity at the level of SNAs [Gerlinger et al., 2012, Andor et al., 2016]. This
discovery tends to suggest that SNA processes are ongoing in tumours. However,
variation in the rate of SNA processes over time has been identified. Mcgranahan et
al. [McGranahan et al., 2015] analysed whether mutations associated with a range
of SNA mutation processes were clonal (present in all cancer cells), or sublconal, in
a range of cancer types. Notably, mutations likely to be caused by APOBEC were
enriched for subconal mutations, consistent with a later onset in carcinogenesis of
this mutation process. In a multi-region sequencing study of lung cancer, de Bruin
et al. also found that mutations likely to be caused by APOBEC were enriched for
subclonal mutations, whereas mutations likely to be caused by smoking were de-
pleted among these later mutations [de Bruin et al., 2014]. As against this, a very
recent report found heterogoneous timing with respect to the timing of APOBEC
signatures, with heterogeneity between patients, including some where the signa-
ture was predominantly early and clonal [Yates et al., 2017]. This suggests that
APOBEC-linked mutations can also occur in the earlier stages of tumorigenesis.
1.4.2 CNA mutation processes
Copy number alterations were the first type of mutations to be recognised in
cancer. In 1914 Theodor Boveri theorised that cancer involves the disruption
of cellular chromosomes [Harris, 2008, Jeggo et al., 2016]. Around twenty years
later the observation was made that human cancer cells are frequently found
with abnormal chromosome numbers [Harris, 2008, Jeggo et al., 2016]. The ad-
vent of next generation sequencing has confirmed that over half of breast can-
cers, colorectal cancers and non-small cell lung cancers have non-diploid chro-
mosome complement [Sansregret et al., 2018]. In 1997, Bert Vogelstein demon-
strated ongoing chromosomal instability (CIN) in human colorectal cancer cell

1.4. Identification and timing of mutation processes: Data 28
lines [Lengauer et al., 1997]; this provided the first evidence that some cancers
have genuinely unstable genomes, as opposed to a stably aneuploid genome. In
the literature the presence of aneuploidy is often, confusingly, reported as CIN
[Sansregret et al., 2018]. However, determining the extent of ongoing CIN across
human cancers remains a major challenge due to the lack of temporally-resolved
mutation data.
In 2011 a study identified a mutation process which was labelled chromoth-
ripsis, involving multiple localised CNAs [Stephens et al., 2011]. In this study,
Stephens and colleagues identified complex genomic rearrangements in cancer
samples rewiring the linear DNA sequence localised to one or a few chromo-
somes [Stephens et al., 2011]. They found this pattern in 2-3% of all cancers
and 25% of bone cancers. In the same year, Kloosterman et al. found evidence
for widespread chromothripsis events in primary and metastatic colorectal cancer
[Kloosterman et al., 2011]. In 2016 Notta et al. found evidence for at least one chro-
mothripsis event in 65% (70/107) of pancreatic cancers subjected to whole genome
sequencing [Notta et al., 2016].
In the original study that identified chromothripsis, the authors put forward
several arguments to suggest that these changes are likely to occur in a single catas-
trophic event, as opposed to gradually over many cell divisions. The main line
of argument observes that the copy number states alternate between just one and
sometimes two values. They argue that this is consistent with a single shattering
event followed by stitching together of the fragments by DNA repair processes.
By contrast, they use an intuitive argument, backed up with Monte Carlo simula-
tions, to argue that this pattern is very unlikely based on a gradual model involving
the successive accumulation of multiple types of CNA over multiple cell divisions.
However, in my view, the assumed model of what gradual change would look like
is rather artificially restricted, and there are plausible scenarios of gradual change
that may explain the data, that are not considered in their model. In particular, the
model seems to assume gradual change would consist of the random accumulation
of CNAs of many types, including duplications, and deletions, and they do not seem

1.4. Identification and timing of mutation processes: Data 29
to consider the plausible scenario of multiple small-scale events of shattering and
repair. In my view their secondary argument, that it is difficult to explain the highly
clustered nature of the CNA breakpoints under a gradual scenario may be more
convincing.
More recent experimental evidence has clarified some of these issues. In 2015
another group used a combination of live-cell imaging and DNA sequencing to
show that the hallmarks of chromothripsis can indeed result from changes that take
place in a single cell division [Zhang et al., 2015]. Specifically, they observed in-
dividual cells with a structure called a micronucleus, which is presumed to contain
a lagging chromosome that was incorrectly segregated during cell division (mi-
cronucleated cells). Single-cell sequencing revealed an asymmetric pattern of copy
number change in daughter cells of micronucleated cells, with DNA damage in
some daughter cells that recapitulated the hallmarks of chromothripsis. The authors
also showed that DNA in micro-nuclei is under-replicated. Therefore one explana-
tion for the data is that under-replicated chromosome fragments in micro-nuclei are
stitched together by the cells DNA repair machinery during cell division, leading to
chromothripsis.
In 2013, Baca et al. identified complex chains of rearrangements in 88%
(50/57) of prostate cancers sequenced by whole genome sequencing, which they
labelled chromoplexy [Baca et al., 2013]. 63% of tumours had two or more of these
chains. Some of these chains involved five or more chromosomes, in contrast to
chromothripsis which typically occurs over a few chromosomes (but can involve
more in some cases) [Stephens et al., 2011]. However, the authors note that some
of the instances of chromoplexy resembled chromothripsis, and it seems plausible
that the underlying mechanism may be related.
Another CNA mutation process involving multiple contemporaneous CNA
events which may be widespread in cancer is whole genome doubling (WGD). In
normal tissue WGD events (tetraploidisations) play a role in the development of a
range of cell types [Sansregret et al., 2018]. Carter et al considered the number of
copies of the two alleles of each chromosome across samples in a pan-cancer anal-

1.4. Identification and timing of mutation processes: Data 30
ysis [Carter et al., 2012]. They found that in high ploidy samples the allele with
the higher copy number tended to have an even copy number. They show that this
is consistent with a model where gains occur by whole-genome doublings (after
which both alleles with have the same even copy number), followed by individ-
ual copy losses (which leave two copy states for each allele, with the highest state
being even). Based on their analysis they argue that WGD events occurred in the
history of over 40% of oesophageal adenocarcinomas and in high proportions of
lung adenocarcinomas and several other cancer types. However, arguably, there are
other explanations for this pattern of copy number change that are plausible, such as
common duplications of individual chromosomes, and this method may be prone to
over or under-call WGD events in individual samples. A later pan-cancer study by
the same group found a multimodal distribution of copy number states across can-
cer types which is suggestive of frequent past WGD events [Zack et al., 2013]. One
report argues that genome doubling events occurred in the majority of colorectal
cancers [Dewhurst et al., 2014]. However, the parsimony-type method for identify-
ing historic WGD used in this study cannot distinguish genuine WGD cases from
those cases that have reached high ploidy through other routes. Together, the cu-
mulative evidence supports an important role for WGD events in cancer, but other
explanations for the data appear to be possible.
At the molecular level, a variety of mechanisms can lead to whole genome
doubling and may underlie WGD events in cancer. Cells may undergo a pro-
cess called endoreplication where DNA duplication proceeds without cell division
[Sansregret et al., 2018]. Relatedly, defects in cellular processes including DNA
replication and the functioning of the mitotic spindle can cause cells to abort cell
division, producing a tetraploid cell [Storchova and Pellman, 2004]. Additionally,
entosis, engulfment by another cell, may lead to tetraploidisation by blocking cell
division [Sansregret et al., 2018]. Cell fusions are known to play a role in de-
velopment and disease, and could also play a role in tetraploidisation in cancer
[Storchova and Pellman, 2004].
Multiple other molecular mechanisms of CNA accumulation are thought to

1.4. Identification and timing of mutation processes: Data 31
play a role in cancer, suggesting possible causal sequences of events among the
observed CNAs in tumour samples. Merotelic chromosomal attachments are one
well-described mechanism of CNA accumulation in cancer [Sansregret et al., 2018,
Gordon et al., 2012]. This phenomenon arises when a single chromosomal kine-
tochore becomes attached to mircotubules from both poles of the mitotic spindle
[Gordon et al., 2012] and has been linked with lagging chromosomes during cell
division [Sansregret et al., 2018]. Experimentally, a study using long-term live-cell
imaging showed that the presence of extra copies of nuclear bodies called centro-
somes leads to merotelic attachments and chromosome mis-segregation in cell lines
[Ganem et al., 2009]. Thus, given the link between lagging chromosomes and chro-
mothripsis, one possible sequence of events is that WGD due to failed division leads
to supernumerary centrosomes and ongoing instability including chromothripsis via
frequent merotely.
Another mechanism that is likely to play a role in CNA formation is a phe-
nomenon known as ‘telomere crisis’, reviewed in [Maciejowski and de Lange, 2017].
Telomeres are composed of long tracts of repetitive double-stranded DNA. They
function to protect the ends of chromosomes from recognition as sites of DNA
damage by the cell. In most human somatic cells telomeres are depleted by around
50bps in each cell division. Loss of telomeres can trigger apoptosis or senescence.
However, cells lacking the capacity for cell cycle arrest may undergo what is known
as ‘telomere crisis’, a process involving multiple DNA aberrations, including fused
dicentric chromosomes. Exit from telomere crisis may be acheived by activation of
telomerase enzymes by the cell [Maciejowski and de Lange, 2017].
Two recent studies have demonstrated intriguing links between telomere short-
ing and mutations observed in cancer. The first study showed that human cells in
telomere crisis underwent tetraploidisation [Davoli and de Lange, 2012]. The sec-
ond study used live-cell imaging to show that cells with dicentric chromosomes in-
duce rupture of the nuclear envelope and that cell clones that have undergone telom-
ere crisis show chromothripsis [Maciejowski et al., 2015]. Additionally, the break-
age of dicentric chromosomes found in telomere crisis can lead to what is known

1.4. Identification and timing of mutation processes: Data 32
as breakage-fusion-bridge cycle (BFB cycle) [Maciejowski and de Lange, 2017].
BFB cycles can result in a range of CNAs, including gene amplification and rear-
rangements. These results suggest another possible chain of events in some human
cancers whereby cells undergo telomere crisis, resulting in WGD and chromothrip-
sis, followed by ongoing stability as telomerase activity is restored.
Various other mechanisms of CNA accumulation in cancer have been de-
scribed, with both cell-intrinsic and cell-extrinsic origins [Sansregret et al., 2018].
Defects in the spindle assembly checkpoint (SAC), and in chromosome cohe-
sion are two cell-intrinsic mechanisms that are of uncertain significance in hu-
man cancer [Gordon et al., 2012]. In normal functioning the SAC monitors the
correct attachment of kinetochores to the mitotic spindle [Gordon et al., 2012].
SAC defects promote cancer in mice, and predispose to cancer in the rare condi-
tion mosaic variegated aneuploidy, albeit the pathway is rarely mutated in humans
[Gordon et al., 2012]. Chromosome cohesion is one of the processes involved in
ensuring correct chromosome segregation. Mutations in genes related to chromo-
some cohesion have been found in colorectal cancer, suggesting a potential role for
disruption of cohesion in disease [Gordon et al., 2012]. External to the cell, aspects
of the tumour micro-environment including hypoxia and glucose deprivation can
induce CNAs [Sansregret et al., 2018], and cell migration may lead to karyotypic
abnormalities due to nuclear envelope rupture [Sansregret et al., 2018].
There are also interesting links between CNA mutation processes and SNA
mutation processes. Nuclear envelope rupture, which is implicated in chromoth-
ripsis [Zhang et al., 2015, Maciejowski et al., 2015], exposes DNA to a nuclease
present in the cytosol, which can create the single-stranded substrate for SNAs
caused by APOBEC [Sansregret et al., 2018]. This may explain clusters of localised
mutations, termed kataegis, that have been found near chromothripsis breakpoints
[Maciejowski et al., 2015]. Thus, mechanisms that cause CIN may be responsible
for SNAs caused by APOBEC found in cancer.
There is increasing evidence to suggest that WGD events frequently occur
early in cancer. Abou-Elhamd et al. carried out an analysis of premalignant

1.4. Identification and timing of mutation processes: Data 33
(n=41) and malignant (n=79) Head and Neck Squamous Cell Carcinoma (HN-
SCC) lesions using image cytomtery [Abou-Elhamd and Habib, 2007]. They found
that 37% of premalignant lesions were tetraploid (appeared genome doubled) and
17% were aneuploid. By contrast, 90% of malignant lesions were aneuploid,
and none were tetraploid. This data is consistent with early WGD events giving
way to ongoing instability in HNSCC. Supporting this, Jamal-Hanjani et al. re-
ported a high level of clonal WGD events and a significant correlation between
WGD and sub-clonal copy number diversity in a large multi-region sequencing
study of lung cancer [Jamal-Hanjani et al., 2017]. Studies of pre-cancerous le-
sions [Stachler et al., 2015, Li et al., 2014] support an early role for WGD events
in esophageal adenocarcinoma and colorectal cancer. Finally, a study in pancre-
atic cancer provides additional temporal resolution by using SNAs within the CNA
regions as a molecular clock. This study made three observations. First, polyploidi-
sation events were predominantly clonal. Secondly, most SNA mutations attributed
to a mutational signature linked with ageing occurred before polyploidisation. Fi-
nally, most CNAs occurred after polyploidisation. These observations support the
impression that WGD events can occur early and give rise to ongoing instability,
and the first two observations additionally suggest that early WGD events may oc-
cur shortly before the last common ancestor of all tumour cells.
Adding to this picture, emerging data suggests heterogeneity in the rate of CNA
accumulation across tumours. A recent single-cell sequencing study in triple neg-
ative breast cancer by Gao et al. found high inter-tumour copy number profile het-
erogeneity but high within-tumour copy-number homogeneity among single cells
within each of 13 cancers [Gao et al., 2016]. They argue that, precluding a recent
clonal expansion, these profiles suggest historic chromosomal instability that has
given way to regained stability, representing a historic punctuated burst of evolution
(Figure 1.1 A). These data are consistent with earlier longitudinal studies in breast
cancer that found similar CNA profiles between (1/2) paired pre-cancerous ‘DCIS’
lesions invasive carcinomas [Kuukasjarvi et al., 1997b] and between some paired
carcinomas and metastases [Kuukasjarvi et al., 1997a]. Very recently similar results
1.5. Selection 34
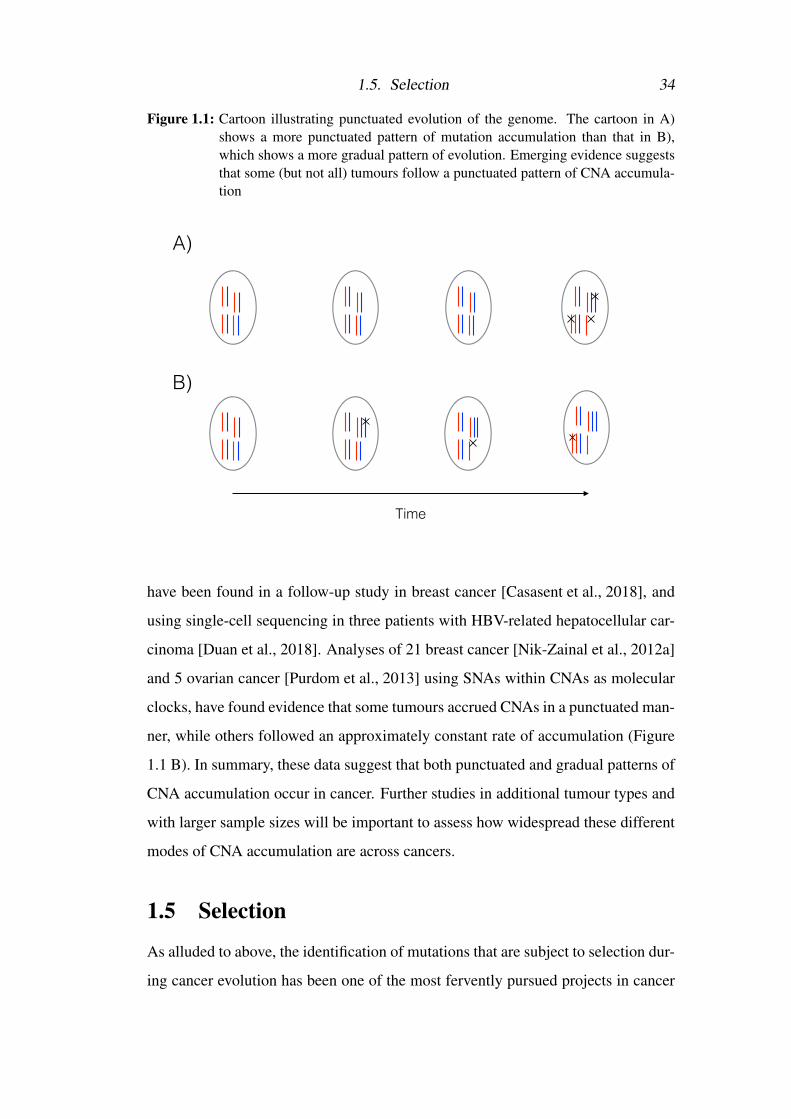
Figure 1.1: Cartoon illustrating punctuated evolution of the genome. The cartoon in A)shows a more punctuated pattern of mutation accumulation than that in B),which shows a more gradual pattern of evolution. Emerging evidence suggeststhat some (but not all) tumours follow a punctuated pattern of CNA accumula-tion
Time
A)
B)
have been found in a follow-up study in breast cancer [Casasent et al., 2018], and
using single-cell sequencing in three patients with HBV-related hepatocellular car-
cinoma [Duan et al., 2018]. Analyses of 21 breast cancer [Nik-Zainal et al., 2012a]
and 5 ovarian cancer [Purdom et al., 2013] using SNAs within CNAs as molecular
clocks, have found evidence that some tumours accrued CNAs in a punctuated man-
ner, while others followed an approximately constant rate of accumulation (Figure
1.1 B). In summary, these data suggest that both punctuated and gradual patterns of
CNA accumulation occur in cancer. Further studies in additional tumour types and
with larger sample sizes will be important to assess how widespread these different
modes of CNA accumulation are across cancers.
1.5 Selection
As alluded to above, the identification of mutations that are subject to selection dur-
ing cancer evolution has been one of the most fervently pursued projects in cancer

1.5. Selection 35
research in the genomic era. While these studies (reviewed below) have become
increasingly sophisticated as new knowledge has emerged on the mechanisms of
mutation, they generally follow a common structure: They define a background
mutation rate at which non-selected mutations are expected to occur in a cohort
of cancer samples. They identify mutations that are found at a higher frequency
than expected under neutrality, significantly recurrent mutations (SRMs). These
mutations are then classified as driver mutations, typically defined as mutations that
have been selected at some point during tumour growth, and the genes that contain
them are deemed driver genes. Often these mutations are considered good targets
for potential treatment. The implicit rationale for considering these mutations for
targeting is that reverting the mutation to wild type could arrest tumour growth.
Before reviewing the findings, it is useful to highlight three points about this
argument that are rarely spelled out explicitly. First, the claim that SRMs are driver
mutations, in the sense of conferring a selective growth advantage at some point
during tumour growth, is not straightforward. Consider a classical tumour sup-
pressor gene, which requires a mutation, or ‘hit’, to both alleles before providing
a growth advantage. Conceivably, a particular mutation that provided the first hit
could be recurrent in a set of tumour samples but not have ever provided a selec-
tive growth advantage (although the combined mutation consisting of the two hits
would provide an advantage). Secondly, consider a mutator mutation, that is neu-
tral or deleterious on whatever background it occurs but increases the rate of future
positively selected mutations. Again, this mutation may be recurrent but never have
provided a growth advantage. Finally, the argument that an SRM was selected also
relies on the assumption that individual mutations occur independently. As a result
of these considerations a more appropriate definition of driver gene (that deals with
the first two considerations) would perhaps be a mutation that increases the likely
number of future progeny of a cell.
Secondly, the rationale that reverting a driver mutation could arrest tumour
growth may often be very weak as it depends on biological parameters that are dif-
ficult to estimate. The effects of epistasis i.e. the way in which fitness of a mutation

1.5. Selection 36
at one genomic sites depends on fitness at others, influence the extent to which the
effects of a mutation on one genetic background can predict the effects of reverting
the mutation on a likely different genetic background at the time of treatment. Sim-
ilarly, to the extent that the selective effects of mutations are context-dependent, the
reversion of a mutation that was selected early in tumour growth could have unpre-
dictable effects. Consider a hypothetical mutation that is highly immunogenic but is
selected in early tumour growth due to an immune-privileged environment. Target-
ing such a mutation in a later immune-exposed tumour could actually be deleterious.
A 2010 study that found that restoration of p53 activity failed to shrink tumours in
some mice due to context-specific effects of the gene, illustrates the relevance of
this point [Junttila et al., 2010] – Although, the effectiveness of targeting APC in
colorectal cancer models provides a counterpoint [Dow et al., 2015]. It is important
to bear these considerations in mind when interpreting conclusions about SRMs,
including those presented here.
The analysis of selection in cancer genomes has developed in step with im-
proved understanding of background mutation rates. Early studies to identify se-
lection from cancer genomes compared numbers of nonsynonymous mutations in
genes to a simple cohort-level background mutation rate model inferred from non-
synonymous mutations [Greenman et al., 2007, Kan et al., 2010]. The MutSigCV
method represented a major step forward when it was introduced in 2013. This
method takes into account patient-specific and gene-specific mutation rates to re-
fine the background mutation model [Lawrence et al., 2013, Lawrence et al., 2014].
Gene-specific mutation rates are determined based on the replication timing and
transcription level of the gene, which are known to covary with mutation rate across
the genome [Makova and Hardison, 2015]. The method also took into account dif-
ferent rates for several different classes of SNA mutation (such as C>T). The au-
thors demonstrate that these changes can reduce the false positive rate for detecting
driver genes. A recent study by the same group that developed MutSigCV identifies
suspected indel driver mutations using a model of background indel mutation rates
[Maruvka et al., 2017]. It is worth noting that these methods focus on distinguish-

1.5. Selection 37
ing genes that are subject to positive selection from those that are not, and do not
attempt to quantify the selection experienced by individual genes beyond this binary
distinction.
A very recent study by Martincorena and colleagues represented another
major advance [Martincorena et al., 2017]. The mutation rate model used
in this study takes into account all 96 SNA mutation classes considered by
[Alexandrov et al., 2013b] as well as information on the transcribed versus the non-
transcribed strand of genes, and other epigenetic mutation rate covariates. More
importantly, this study models a distribution of per-gene mutation rates rather than
assuming a point mutation rate per gene, and thereby takes into account remaining
uncertainty surrounding per-gene mutation rates. This innovation is particularly
important given the history of previous refinements to mutation rate models that
may suggest further discoveries are likely. Both this study, and another very recent
study [Weghorn and Sunyaev, 2017] quantify the effects of selection on individual
genes by estimating the ratio of non-synonymous changes to synonymous changes
in the gene (dN/dS). Albeit, this dN/dS measure is difficult to interpret.
Another strand of work has focused on identifying the effects of selection
based on the frequencies of sub-clonal SNAs. The effects of selection are inter-
twined with the pattern of cancer growth, and selection may be harder to detect
that is usually assumed. A study by Sottoriva et al. indicated that sub-clonal
diversity diversity that arose early in colorectal tumour development was main-
tained during tumour growth, suggesting weak selection at the level of subclones
[Sottoriva et al., 2015]. Previous work showed that in c. 30% of tumours the dis-
tribution of sub-clonal mutations is consistent with the expectation under neutrality
[Williams et al., 2016]. The authors have since gone on to develop techniques to di-
rectly quantify the effects of selection, and measure individual fitness effects from
samples that deviate from this expected mutation distribution (Williams et al., in
press).
Inference of selection for CNAs is much less developed, probably due to chal-
lenges in determining mutation rates in the absence of selection. A 2013 study by

1.5. Selection 38
Zach et al. using TCGA data reported recurrent CNA mutations with the caveat
that the recurrence could represent increased mutation rates rather than selection.
Of note, the single study that has developed a mutational signature framework for
CNAs in breast cancer attempted to use these background mutation rates to infer
selected changes, although they do not appear to have used the rearrangement sig-
natures in their inference directly.
In addition to these studies there is a related body of literature on experimental
measurement of somatic selection in model systems. These results are important
because they circumvent some of the problems of interpretation mentioned above,
and it is also generally possible to make more accurate quantitative measurements in
these controlled experimental systems. One important study measured the coloni-
sation of mouse colonic crypts by genetically induced mutations over time. The
authors observed colonisation by cells with Kras G12D mutations and single-allelic
Apc and bi-allelic Apc mutations, which are related to common mutations found in
human cancers. The results suggested that the probability of a Kras G12D-mutant
cell replacing a neighbouring wild-type cell is greater than half (0.75 to 0.81).
Single-allelic Apc mutations replaced wild-type cells with probability between 0.58
and 0.66, wherease bi-allelic Apc mutants replaced wild-type cells with probabilities
between 0.75 and 0.82. In yeast, high-throughput experimentation combined with
novel cell barcoding techniques have enabled the measurement of the distribution
of fitness effects across all genomic mutations [Venkataram et al., 2016]. Important
differences between both these model systems and human cancer place a limit on
the relevance of these results to human cancer, both in terms of the differences in
mutation effects compared to humans and in the micro-environment in which these
mutations are selected. Illustrating this, an extensive study that applied the type
of selection inference model described above to mutation data from mouse mod-
els found marked differences in the genes that were selected compared to human
cancers [Ben-David et al., 2017]. However, while results for individual genes and
mutations may not be translatable across systems, it seems plausible that general
properties in terms of the distribution of selective effects may be less variable.

1.6. Prognostic implications of mutation processes 39
1.6 Prognostic implications of mutation processes
Here I review the relationship between mutation processes and outcomes in cancer.
These relationships provide further motivation for the thesis, by showing in more
detail the importance of mutation rates in terms of clinical outcome.
There is a complex relationship between mutation rates and outcome in can-
cer. Genetically unstable colorectal cancer cells show multidrug resistance in
culture [Lee et al., 2011]. In mice, chromosomal instability confers tumours with
the ability to survive the removal of an oncogene [Sansregret et al., 2018]. How-
ever, in breast cancer, very high levels of chromosomal instability portend a bet-
ter prognosis, compared to more genetically stable cancers [Birkbak et al., 2011,
Roylance et al., 2011]. As mentioned above, in some tissue types at least,
ultramutator cancers with POLE mutations, also have a better prognosis
[Church et al., 2015]. And colon cancers with MSI show high immune
cell infiltration and improved prognosis compared to other colon cancers
[Vilar and Gruber, 2010].
There is a related complex relationship between mutation diversity and out-
comes, which is also informative on the role of mutation processes influencing
outcomes, given the close relationship between mutation diversity and the muta-
tion rates that generate this diversity. In Barrett’s Oesophagus, higher copy number
diversity predicts progression to cancer [Maley et al., 2006, Martinez et al., 2016].
In lung cancer, copy number diversity is an independent factor associated with in-
creased risk of recurrence or death [Jamal-Hanjani et al., 2017]. However, in a pan-
cancer analysis tumours in the highest (or lowest) quartile of copy number diversity
had reduced mortality risk [Andor et al., 2016]. And in the lung cancer study above,
SNA diversity does not predict worse outcome, despite a large sample size (n=100)
[Jamal-Hanjani et al., 2017].
One possible explanation for these observations is that raised mutation rates,
as well as increasing the likelihood of mutations leading to disease progres-
sion, cause mutations that form novel cell-surface proteins, which are recog-
nised by the immune system or neo-antigens. In support of this view, MSI

1.6. Prognostic implications of mutation processes 40
colon cancers upregulate the ligand PD-1, which suppresses anti-tumour immune
response [Llosa et al., 2015], suggesting possible coevolution of cancer and im-
mune cells in the MSI context, with a higher immune response creating a se-
lection pressure for immunosuppressive mutations in the cancer - a phenomenon
called immunoediting. More generally, there is a pan-cancer association between
the predicted number of neo-antigens, inferred tumour cytotoxic T cell content
and prognosis [Brown et al., 2014]. In addition, novel checkpoint inhibitor im-
munotherapies that inhibit the effects of PD-1, are more effective in lung cancers
with more neoantigens, and, in particular, cancers with more clonal neoantigens
[McGranahan et al., 2016]. A recent report showed that the clonal status and likeli-
hood of immune recognition of neoantigens predicted response to immunotherapy
in cohorts of lung cancer and melanoma patients [Luksza et al., 2017].
A fascinating strand of theory work accompanies these findings. A study by
McFarland predicts that mutator cancers will accumulate deleterious mutations,
which could include neo-antigens. In particular the authors predict that many
moderately deleterious mutations accumulate in mutator tumours, whereas strongly
deleterious mutations are filtered out by selection [McFarland et al., 2013]. A fol-
lowup study shows that these predictions explain certain features of incidence data
[McFarland et al., 2014]. Relating these findings to prognosis, a study in HIV
viruses has found evidence for a mutational meltdown, caused by a mutation rate
beyond which the viruses cannot adapt [Loeb and Mullins, 2000]. There is an in-
dication that a limit of around 20,000 somatic SNAs exists in some cancers with
POLE mutations [Shlien et al., 2015], which could support the existence of muta-
tional meltdown in tumours. Albeit issues related to the detection limit of sequenc-
ing confound the latter observation.
In conclusion, although difficulties in accurately measuring mutation rates in
human tumours have limited the amount of data available, there is data to suggest a
paradoxical relationship between mutation rates and outcomes in cancer, with high-
est mutation rates portending a better prognosis. Build-up of deleterious mutations,
especially at higher mutation rates, may underlie this data. Improved understand-

1.7. Aims and objectives 41
ing of the dynamics that relate underlying mutation rates to the accumulation of
mutations in the tumour population as a whole, are needed to fully understand the
influence of mutation processes on tumour evolution.
1.7 Aims and objectivesIn this chapter I have provided a motivation for attempting to better understand
the mutation processes that are operative in cancer. I surveyed the literature on
mutation processes active in human cancer, the inference of selection in cancer and
the prognostic impliations of mutation processes.
Although major progress has been made in the understanding of mutation pro-
cesses operative in cancer, important questions remain. In particular, questions re-
main around the timing of SNAs and CNAs during cancer evolution, as well as
around identifying the links between mutation causing processes and individual mu-
tations. While improvements in the identification of selection from tumour genomes
have been made in step with improvements in understanding mutation rate, there is
a need for research that can quantify the effects of selection in a meaningful manner.
At the start of the thesis, in Chapter 2, I present a study of the factors influ-
encing mutation accumulation in breast cancer. I aim to shed light on the influence
of population size variation on mutation accumulation during early cancer develop-
ment, as well as to give a more detailed motivation of the mathematical modelling
approach to cancer research.
In the following Chapters (Chapters 3 and 4) I aim to address specific questions
about the timing of SNA and CNA mutations during cancer evolution. In chapter
3, I aim to assess the timing of CNA accumulation during colorectal cancer evolu-
tion. In chapter 4, I aim to shed light on the timing of POLE mutations during the
evolution of colorectal and endometrial cancers.
I then turn to analyse the the causal relationships between mutation-causing
processes and individual SNA driver mutations in chapter 5.
Finally, also in chapter 5, I aim to infer the selective differences between driver
mutations through application of a recent model of mutation causation.

1.7. Aims and objectives 42
My broader aim in the thesis, in addition to answering the specific points men-
tioned above, is to make progress towards understanding the complex web of inter-
actions that link the causation of mutations (via population dynamics and selection)
to the occurrence and timing of these mutations in patient tumours.

Chapter 2
Mathematical modeling links
pregnancy-associated changes and
breast cancer risk
The work in this chapter is now published in Cancer Research [Temko et al., 2017].
2.1 PrecisRecent debate has concentrated on the contribution of unavoidable mutations, that
may occur on cell division, to cancer development. The tight correlation between
the number of tissue-specific stem cell divisions and cancer risk of the same tissue
suggests that bad luck has an important role to play in tumor development, but the
full extent of this contribution remains an open question. Improved understand-
ing of the interplay between extrinsic (external to the population of cells at risk of
cancer) and intrinsic (internal to the population of cells at risk of cancer) factors at
molecular scales is one promising route to identifying the limits on extrinsic control
of tumor initiation, which is highly relevant to cancer prevention. Here we use a
simple mathematical model to show that recent data on the variation in numbers
of breast epithelial cells with progenitor features due to pregnancy are sufficient to
explain the known protective effect of full-term pregnancy in early adulthood for
estrogen receptor positive (ER+) breast cancer later in life. Our work provides a
mechanism for this previously ill-understood effect and illuminates the complex in-

2.2. Contribution 44
fluence of extrinsic factors at the molecular level in breast cancer. These findings
represent an important contribution to the ongoing research into the role of bad luck
in human tumorigenesis.
2.2 ContributionWork on this project had already begun when I joined the project; the mathematical
model was already largely in place and coded in C++. My main contributions were:
(i) To broaden the aims of the analysis to include a more detailed analysis of the
model predictions and compare the model predictions to epidemiological data. (ii)
To adapt the model outputs for these purposes. (iii) To make some changes to the
model, including to accommodate changes in cell proliferation after menopause.
(iv) To run the model simulations and analyse the results. (v) To implement a sen-
sitivity analysis, including necessary adaptations to the model code. (vi) To write
the manuscript sections other than ‘Mathematical Framework’, with input from my
co-authors (vii) To produce the figures, other than figure 2.2, with input from my
co-authors.
2.3 IntroductionA recent study [Tomasetti and Vogelstein, 2015] by Tomasetti and Vogelstein anal-
ysed the relationship between the number of stem cell divisions and cancer risk
across tissues to investigate the role of “bad luck” in carcinogenesis. The authors
demonstrated that the logarithm of lifetime cancer incidence in a tissue is closely
correlated with the logarithm of the cumulative number of stem cell divisions in the
same tissue (R2 = 0.64; Figure 2.1 A). One possible interpretation of these results
runs as follows. The correlation suggests that random mutations that occur when
stem cells divide explain most of the differences in cancer risk between tissues.
Consequently, exposure to exogeneous mutagens make only a limited contribution
to the risk differences between tissues, despite large presumed variation in expo-
sures between anatomic sites. As a result of the correlation the authors claimed that
the majority of the variance in cancer risk among tissues is due to bad luck.
In the reporting of the study and ensuing debate some commentators drew

2.3. Introduction 45
Figure 2.1: Multiple factors can affect cancer risk in a complex setting. A, An analysisby Tomassetti and Vogelstein demonstrated a close correlation between the logof lifetime cancer incidence in a tissue and the cumulative number of stemcell divisions in the same tissue. Plot shown is a schematic showing randomlygenerated data, illustrating the linear relationship that was found by the study.B, Variation in multiple molecular factors may affect cancer risk when theychange from the homeostatic state (top left), including the number of progenitorcells (top right), the mutation rate (bottom left), and the fitness effect conferredby mutations (bottom right). Blue circles represent wild-type cells, red circlesrepresent mutated cells.
A) B)Stem cells Stem cells
Progenitor cells
Stem cells
Progenitor cellsProgenitor cells
Progenitor cells
Stem cells
●
●
●
●
●
●
●
●
●
●
●
●
●
●●
●
●
●
●
●
●●
●
●
●●
●
●
● ●
●
6 8 10 12
−6−5
−4−3
−2
log (stem cell divisions)
log
(can
cer i
ncid
ence
)
broader conclusions from the correlation found by Tomasetti and Vogelstein. While
the initial study claimed that two thirds of the variation in cancer risk between tis-
sues is due to bad luck, an accompanying commentary suggested that two thirds
of all cancers, rather than two thirds of the variation, are due to random muta-
tions in healthy cells [Couzin-Frankel, 2015]. Subsequent analyses have shown that
the initial correlation is not sufficient to imply a lower bound on the proportion
of all cancers that are due to bad luck at 64%. To draw this conclusion from the
study would require strong assumptions about the effects of controllable factors
in the data set considered. To adapt an example given by Weinberg and Zaykin
[Weinberg and Zaykin, 2015]: suppose that all cancers were made four times as
likely by a carcinogen; then the correlation between log incidence and log stem cell
divisions would remain the same at 0.64. However, cancer risk could be reduced by
75% by removing the carcinogen. So clearly we cannot conclude from the data as
it stands that at least 64% of all cancers are due to bad luck.

2.3. Introduction 46
Importantly, the regression analysis used by Tomassetti and Vogelstein
cannot quantify the possible effects of extrinsic factors that do not already
vary within the data set used, which notably did not include breast cancer
[Potter and Prentice, 2015]. Therefore, the regression cannot be used to draw
conclusions about unavoidable bad luck, taking into account the variation of all
possible extrinsic factors. To illustrate this point, consider the (perhaps unlikely)
possibility that it is possible to safely alter the fitness advantage of mutations that
can lead to cancer. The correlation analysis presented in the study cannot tell us
about the impact such variation could have on cancer risk.
The insufficiency of the current evidence to draw conclusions about the con-
tribution of unavoidable bad luck to cancer demonstrates the important potential
role of mechanistic models in determining the contribution of controllable factors
to different cancer types, and whether these factors can be harnessed for cancer
prevention. The changes that lead to cancer are thought to develop in a complex
molecular setting, which defies simple characterization. In this setting variation of
any number of parameters may affect lifetime risk of cancer; these include but are
not limited to the number of cells susceptible to transformation, the mutation rate of
cells, and the fitness advantage conferred by those mutations when they occur (Fig.
2.1 B).
Full-term pregnancy in young adulthood is a well-documented natural protec-
tive factor for breast cancer [MacMahon et al., 1970, Albrektsen et al., 2005]. Es-
timates suggest that risk increases by 5% for every five-year increase in the age at
first birth for women with one birth [Albrektsen et al., 2005]. The specific effects of
parity vary by hormone-receptor status of the resulting tumors [Colditz et al., 2004].
Analysis of the Nurses Health Study (NHS) cohort showed that the risk for ER+
breast cancer decreases with the number of pre-menopausal years accumulated
since first birth [Colditz et al., 2004]. Hence, early first birth confers the greatest
protective effect; a woman with four births at age 20, 23, 26 and 29 years old has an
estimated 29% reduced risk of ER+/PR+ breast cancer between the ages of 30 and
70, compared to a nulliparous woman during the same time period. The same study

2.3. Introduction 47
found that first birth causes a one-off increase in risk for PR- cancer compared to
nulliparous women, with an effect size that increases with age at first birth. As a
result, women with a first birth over the age of 35 can be at an increased risk of
breast cancer.
Mathematical models, informed by data, have demonstrated the plausibility of
general molecular explanations for the protective effects of pregnancy. An impor-
tant study by Moolgavkar et al. explored a framework where breast cancer is caused
by two cellular transitions occurring in normal cells [Moolgavkar et al., 1980]. In
this model, pregnancy decreases the numbers of normal and partially transformed
cells at risk of progression. The study leads to a good fit to the data of MacMa-
hon and colleagues [MacMahon et al., 1970]. Another study [Pike et al., 1983]
uses a concept of breast tissue age: breast cancer incidence is modeled as a lin-
ear function of the logarithm of breast tissue age, and risk factors for breast can-
cer alter the rate of breast tissue aging. First full-term pregnancy causes a one-
off increase in breast tissue age, but decreases its subsequent rate of increase.
This study also demonstrated a good fit to the Moolgavkar et al. data. Ros-
ner and Colditz then adapted and extended the model developed by Pike et al.,
including changes to further improve the fit and accommodate multiple births,
and applied the adapted model to data from the NHS cohort [Colditz et al., 2004,
Rosner et al., 1994, Rosner and Colditz, 1996]. The fit of these models to epidemi-
ological data provide support for the theory that pregnancy alters the number of cells
that are at risk for accumulating changes leading to breast cancer. However, they do
not identify the molecular mechanisms responsible, nor do they accommodate the
effects of a cellular hierarchy of stem and progenitor cells.
Recently, single cell technology has made it possible to collect quantitative
data on changes in individual mammary sub-populations, presenting the possibility
to quantitatively assess the molecular-level changes, as well as the epidemiological
incidence curves, associated with pregnancy. Studies in mice and humans provide
evidence that p27+ mammary epithelial cells decrease in number with pregnancy,
and are present in high numbers in BRCA1 and BRCA2 germline mutation carriers

2.4. Mathematical Framework 48
[Choudhury et al., 2013, Huh et al., 2015]. Evidence was presented that a subset of
p27+ cells with progenitor features are hormone-responsive quiescent luminal pro-
genitors with proliferative potential, and that their variation could relate to breast
cancer risk [Choudhury et al., 2013]. Briefly, p27 cells were found to express es-
trogen receptor (ER), indicating they may be hormone responsive. The fraction of
p27+ cells correlated inversely with the fraction of cells expressing the prolifera-
tion marker Ki67, and the two proteins were mutually exclusively expressed, sug-
gesting that the p27+ and Ki67+ cells could represent quiescent and proliferative
hormone-responsive cells respectively. Finally, a subset of p27+ cells also express
the progenitor cell marker CD44, and the expression of p27 in CD44+ cells de-
creases significantly with pregnancy. These data, raise the possibility that a subset of
p27 cells represent quiescent-hormone responsive progenitors and their number de-
creases with pregnancy. Here, we use a simple mathematical model to test whether,
given a role for p27+ progenitor cells as proliferative progenitors which can accu-
mulate changes leading to breast cancer, the observed reduction in the populations
of p27+ progenitor cells with pregnancy is sufficient to explain the protective effect
of pregnancy.
2.4 Mathematical Framework
2.4.1 Mathematical model
We aimed to test the hypothesis that a decreasing cell number and proliferative ca-
pacity of luminal progenitor cells after pregnancy can result in a protective effect
against breast cancer and that the effect decreases with increasing age of pregnancy.
To this end, we designed a mathematical model of the dynamics of proliferating
cells in the breast tissue that can accumulate the changes leading to cancer initia-
tion. We considered two types of cells: a self-renewing population of stem cells,
and a population of proliferating luminal progenitor cells that result from differen-
tiation of these stem cells and respond to hormonal stimuli. We first tested whether
we could identify a biologically plausible parameter setting in our model under
which the variation in progenitor cell numbers results in a risk decrease that fits the
2.4. Mathematical Framework 49
quantitative risk decreases observed with pregnancy (Section 2.5.1). We then tested
the robustness of the fit of our model in the surrounding parameter space (Section
2.5.2).
We first studied the dynamics of stem cells in the breast ductal system. Given
the population structure inherent to breast ducts, we considered the stem cells in
each duct to act independently. As such, we investigated the dynamics of a sin-
gle duct within the breast since the total probability of cancer initiation is given
by the probability per niche times the number of niches; thus, the relative likeli-
hood of cancer initiation is not altered by considering only one niche. The over-
all number of stem cells in the breast is estimated to be on the order of 5 to 10
cells per duct [Eirew et al., 2008, Villadsen et al., 2007], and we denoted this num-
ber by N (Fig. 2.2), although there is some uncertainty in these estimates. We
defined a fundamental time unit of our system to be dictated by the division time
of stem cells, tcycle, which varies during pregnancy. In in vivo experiments, the
mean cell cycle length of benign breast cancer cells was approximately 162 hours
per cell [Schiffer et al., 1979]. We assumed that even pre-cancerous cells divide
faster than stem cells; thus, using tcycle = 162 hours as the average pre-menopausal
stem cell cycle length when not pregnant may be an overestimation of the number
of stem cell divisions that occur in the normal breast, and we verified that our re-
sults were unaffected at higher stem cell cell cycle lengths (shown below). Further,
previous data [Choudhury et al., 2013, Popnikolov et al., 2001, Taylor et al., 2009,
Chung et al., 2012, Olsson et al., 1996, Going et al., 1988, Anderson et al., 1989]
suggests that the percentage of cells in normal breast that stain positive for Ki67
are approximately 3% and 12% in the follicular and luteal phases of the menstrual
cycle, respectively. Assuming that the duration of these two menstrual cycle phases
is roughly the same, at two weeks per cycle, leads to an average Ki67 value of 7.5%.
Considering that Ki67 is detectable for 24 hours during the active phases of the cell
cycle [Scholzen and Gerdes, 2000, Cooper, 2000], this translates to an estimate of
320 hours (24 / 0.075) for the average cell cycle length, which is also within the
range tested (162 hours to 324 hours). Other studies have shown a broadly consis-

2.4. Mathematical Framework 50
tent range of results [Olsson et al., 1996] or results consistent with still longer cell
cycle times [Taylor et al., 2009, Chung et al., 2012].
Experimental data suggests that proliferation decreases 4-5 fold after
menopause, irrespective of parity [Choudhury et al., 2013, Huh et al., 2016]. To
take this effect into account, we assumed that the cell cycle length increases by
a factor of αmenopause = 4 after menopause. In our model, a single stem cell in
each duct is randomly chosen to divide during each time step, proportional to
the fitness of the cell, following a stochastic process known as the Moran model
[Moran, 1962]. According to this model, the divided cell is replaced by one of
the daughter cells of the division, while the other daughter replaces another stem
cell that was randomly selected from the population to die. The use of this model
ensures preservation of homeostasis in the normal breast epithelial cell population.
Since the specific dynamics of stem cells in the breast are not known, we chose the
Moran model as it has been used to model stem cell populations in other tissues
[Hambardzumyan et al., 2011, Traulsen et al., 2013, Foo et al., 2015]. For each cell
division, we allowed for a single mutation to arise in one of the two daughter cells
of the division with a certain probability.
In the mature breast, stem cells divide primarily to maintain cellular in-
tegrity. However, differentiating events do occur, although rarely [Bresciani, 1968,
Daniel and Young, 1971, Faulkin and Deome, 1960]. In our model, with probabil-
ity p, we allowed the cell division in the current time step to be asymmetric, produc-
ing one daughter stem cell to maintain the stem cell population and one progenitor
daughter to arise (Fig. 2.2). Since the exact rate of differentiation is unknown, we
tested p = 10−1 to 10−3. With the remaining 1− p probability, the stem cell divi-
sion is symmetric and follows the usual Moran division dynamics. In each time step
thereafter, all cells resulting from the progenitor daughter divide and differentiate
further until a total of z cell divisions are accumulated. The number of luminal ep-
ithelial progenitors in humans is unknown. As a result, we set z = 10 to fit data from
mouse mammary fat pad transplantation experiments [Kordon and Smith, 1998],
and tested a wide range of alternate values for this parameter. After zpre divisions,
2.4. Mathematical Framework 51
we considered the cells differentiated and at this point, they are no longer consid-
ered in our mathematical model. Thus, in the wild-type system, there are N stem
cells per duct and 2z+1− 1 progenitor cells per differentiation cascade. Since the
dynamics of progenitor cells in the human breast are not known, we have adopted
the assumption that progenitor cells undergo a limited number of divisions, similar
to what has been observed for transit-amplifying cells in the colon and other tissues.
Figure 2.2 A describes the temporal dynamics of the system.
During each cell division, genetic alterations contributing to cancer initiation
may arise with a small probability. We considered a number nmut of mutations that,
when combined, result in a single cell leading to cancer initiation. These mutations
could each be any of the many mutations commonly found in breast cancer with
initiation potential. As a simplifying assumption we considered a mutation rate on
the order of 10−5 mutations per oncogenic mutation per cell division to limit the
required number of simulations for detection to a reasonable number.
The baseline mutation rate is roughly 5× 10⁻⁹ per base pair per cell division
[Jones et al., 2008, Salk et al., 2010]. It is estimated that there are roughly 34,000
possible driver base pairs in the genome [Bozic et al., 2010], thus it may be reason-
able to assume that there are on the order of 10,000 possible ways to achieve each
oncogenic mutation, which would lead to the above rates on the order of 10−5 mu-
tations per oncogenic mutation. However, it is important to note that not all driver
loci are relevant in breast cancer, and in particular the exact combinations of driver
loci that could cause breast cancer are unknown, thus the 10−5 figure can only be
a broad approximation. For this reason, we also tested our model at other mutation
rates, and found that our main conclusions were also consistent at lower mutation
rates (shown below).
We studied the following mutational effects for each mutation: under the de-
fault assumptions in stem cells, mutant cells had a relative fitness of fmut = 1.1, i.e.
a fitness increase of 10%, resulting in an increased probability of dividing, while
mutant progenitor cells divided an additional zmut = 1 times (Fig. 2.2 B). In gen-
eral a stem cell with n mutations was assumed to have a relative fitness of 1.1n,

2.4. Mathematical Framework 52
Figure 2.2: Schematic representation of the mathematical model. A, Initially, there areN wild-type stem cells (blue), which give rise to a differentiation cascade of2z+1 − 1 wild-type luminal progenitor cells (purple). At each time step, allprogenitor cells as well as one randomly selected stem cell divide. With prob-ability 1− p, the stem cell divides symmetrically and one daughter cell re-places another randomly chosen stem cell. With probability p, the stem cell di-vides asymmetrically and one daughter cell remains a stem cell while the otherdaughter cell becomes committed to the progenitor population (light pink). Re-gardless of the dividing stem cell’s fate, all existing progenitor cells divide sym-metrically for a total of z times to give rise to successively more differentiatedcells (progressively darker shades of purple) before becoming terminally dif-ferentiated. In the figure, the darkening purple gradations refer to successivelymore differentiated cells and serve to clarify a single time step of the stochasticprocess. B, The acquisition of mutations leading to breast cancer initiation allresult in an increased relative fitness (i.e. growth rate) fmut in stem cells (red)as compared to wild-type cells (blue) and an additional number of divisionszmut progenitor cells can undergo before terminally differentiating. C, Duringpregnancy, progenitor cells experience an expansion in proliferative capacitythrough an additional number of divisions zpreg in order to form terminally dif-ferentiated milk-producing cells (dotted triangle) and a decrease in cell cyclelength.
wt rel. fitness: 1mut rel. fitness: fmut

2.4. Mathematical Framework 53
whereas a progenitor cell with n mutations could divide an additional n times be-
fore terminal differentiation. Since the number of stem cells per duct is small, the
fitness of mutant alleles has little effect on cancer initiation probabilities, as the
fixation time of mutations is much smaller than the mutation accumulation time
[Hambardzumyan et al., 2011]; we also tested our results at other values of fmut
and zmut . Additionally, progenitor cells must accumulate some propensity towards
self-renewal: we defined a parameter γ = γbase− (iγbase)/(2 ∗ z) as the probability
of a progenitor cell at differentiation level 0≤ i≤ z+nzmut to acquire self-renewal.
Here n is the number of mutations borne by the progenitor cell. Therefore we as-
sumed that cells closer to the stem cell apex have higher self-renewal propensity,
and we explored different values of γbase within this framework. We defined cancer
initiation as a single cell that accumulated all required mutations and either retained
or acquired the ability to self-renew, either through being a stem cell or through
acquiring a genetic or epigenetic self-renewal event.
As we were interested in the effects of the timing of pregnancy, we consid-
ered the phenotypic alterations that occur in the breast during pregnancy and as a
result of pregnancy. For the purposes of this simulation, we considered the 280
day period of time for the pregnancy itself as the time period during which pa-
rameters are altered by pregnancy. Evidence suggests that pregnancy results in the
differentiation of mammary epithelial cells [Russo et al., 2005, Russo et al., 1992]
as well as their increased proliferation [Chung et al., 2012, Suzuki et al., 2000]. To
model these effects, we allowed further differentiation of progenitor cells during
pregnancy by an additional zpreg differentiation levels, and a decrease in the cell
cycle length of stem cells (Figure 2.2 C). There is a 4.5 to 8.5-fold increase in the
number of Ki67+ cells during pregnancy [Chung et al., 2012, Suzuki et al., 2000].
Thus, we allowed a 4-fold to 8-fold increase in progenitor cells during pregnancy,
corresponding to zpreg = 2 to 3. The remaining ∼ 1.1 fold increase in prolifera-
tion was modeled as a decrease in stem cell cycle length, specifically a change by
a factor of αpreg = (1/1.1). Importantly, we considered that pregnancy reduces
the progenitor population in our model. We simulated this change in population

2.4. Mathematical Framework 54
structure by decreasing the rate of asymmetric division of stem cells giving rise to
progenitor cells by a factor of ppost,init after an initial pregnancy. Our experiments
suggested a 2-3 fold drop in p27+ expressing progenitor cells, which suggests a
value of ppost,init = 0.5 [Choudhury et al., 2013].
We also modeled the effects of more than one pregnancy. In runs of the model
with more than one birth, we considered the effect of the period of subsequent preg-
nancies to be the same as for the first birth. That is, the number of levels in the
differentiation hierarchy of progenitor cells increases by zpreg levels, and the cell
cycle length of stem cells decreases to tcycle,preg = 147 hours. Regarding the lasting
effects of pregnancy on the structure of the breast epithelium, we allowed for the
possibility of a smaller decrease in the probability of asymmetric stem cell division
after later births compared to the decrease after the first birth, and defined a sepa-
rate parameter, ppost,subs, for the decrease in asymmetric divisions after subsequent
births.
Our simulation spanned from menarche to death or initiation of cancer within
the duct. Our total simulation time was calculated from the average woman’s life
expectancy in the US, which was 81.2 years in 2014 [NCHS, 2016], and the average
age of menarche, which ranged between 12.2 and 12.8 years of age for different
ethnic groups in 2007 [Cabrera et al., 2014]. We used the mean age of menarche
between the groups, which was 12.5 years and thus resulted in a total of 68.7 years
of simulation time.
The parameters in Table 2.1 were set at fixed values from the literature. The
parameters in Table 2.2 were set at values that fit to epidemiological data, as de-
scribed below (Section 2.5.1). We tested the robustness of the fit by varying each of
these parameters individually (Section 2.5.2).

2.4. Mathematical Framework 55
Table 2.1: Fixed parameter values. Parameters that remained unchanged throughout allsimulations. ttotal: Simulation time (years), αpreg: Proportional reduction of cellcycle time of stem cells during pregnancy, αmenopuase: Proportional increase ofcell cycle time of stem cells after menopause, ppost : Proportional reduction innumber of progenitor cells after initial pregnancy.
ttotal αpreg αmenopause ppost68.7 1/1.1 4 0.5
Table 2.2: Range of parameter values investigated. For each parameter of interest, we testedmultiple values. Values defaulted to the numbers in bold. tcycle: Cell cycletime of stem cells (hours), N: Stem cell number, z: Progenitor cells divisions,p: Asymmetric division rate, µ: Mutation rate (per cell division), γbase: Self-renewal event rate, fmut : Mutant stem cell relative fitness, zmut : Mutant progeni-tor expansion, nmut : Mutations required, zpreg: Pregnancy progenitor expansion,ppost,subs: Proportional reduction in number of progenitor cells after subsequentpregnancies.
tcycle N z p µ γbase fmut zmut nmut zpreg ppost,subs162162162 5 6 10−3 2×10⁻⁶ 3.2×10⁻⁴ 1.01 111 1 222 0.50.50.5324 888 101010 10−210−210−2 2×10−52×10−52×10−5 3.2×10−33.2×10−33.2×10⁻³ 1.11.11.1 2 222 3 0.8
10 14 10−1 2×10⁻⁴ 3.2×10⁻² 3
2.4.2 Model summary
2.4.2.1 Cellular dynamics of the stem cell and proliferative progen-
itor cell populations
There are N stem cells per terminal end duct. The stem cells follow a stochastic
process known as the Moran model. One cell division occurs during each time
step of length tcycle/N. In each time step a single stem cell is randomly chosen to
divide proportional to the fitness of the cell, with the two daughter cells replacing
the divided cell and another randomly chosen cell.
With probability p, stem cell divisions are asymmetric, giving rise to one stem
cell that replaces the divided cell and one progenitor cell that forms the founder in
a new cascade of progenitors. All cells in a progenitor cascade divide during every
time step. In non-pregnant women, wild-type progenitor cells can divide a total
of z times before becoming terminally differentiated (see below for the effects of
mutations and effects of pregnancy). Cells that are terminally differentiated exit the
simulation.

2.4. Mathematical Framework 56
2.4.2.2 Cancer initiation
During each cell division, one of the two daughter cells in a division attains a new
(epi)genetic mutation with probability µ . In stem cells, mutations increase the rel-
ative fitness of the cell by a factor of fmut . In progenitor cells mutations increase
the number of levels in the differentiation hierarchy by zmut levels. Thus a stem cell
with n mutations has relative fitness in the Moran model given by equation 2.1 and
a progenitor cell with n mutations is able to divide a total number of times given by
equation 2.2 before terminal differentiation:
( fmut)n (2.1)
nzmut (2.2)
Additionally, progenitor cells must acquire the ability to self-renew. We as-
sumed that the probability of a progenitor cell at differentiation level 0 ≤ i ≤
z+nzmut attaining self-renewal is given by equation 2.3:
γ = γbase−iγbase
2z(2.3)
We assumed that cancer initiation occurs when a cell has accumulated a total of
nmut mutations and either retained (through being a stem cell) or attained (through
a self-renewal event) the ability to self-renew.
2.4.2.3 Effect of pregnancy
Our model simulates an entire life-course over ttotal years. The model takes into
account possible changes to cellular dynamics during pregnancy, after pregnancy,
and after menopause. During pregnancy we assumed that the stem cell cycle length
decreases to tcycle,preg, whereas the number of levels in the differentiation hierarchy
of progenitor cells increases by zpreg levels. After menopause, the stem cell cycle
length increases to tcycle,menopause.
In parous scenarios, after the first birth the probability of asymmetric stem cell
division changes by a multiplicative factor ppost,init (0 < ppost,init < 1). After the

2.5. Model Exploration 57
second birth and subsequent births, the probability of asymmetric stem cell division
changes by a factor of ppost,subs (ppost,init < ppost,subs < 1).
2.5 Model Exploration
2.5.1 Model fitting procedure
We first investigated whether our model could quantitatively match the epidemio-
logical data available on the protective effect of early pregnancy on breast cancer
risk, within the space of biologically plausible parameters. From the literature, a
woman with one birth at age 20 has a cumulative relative risk of ER+/PR+ breast
cancer of 0.88 (C.I = 0.81 to 0.96) between the ages of 30 and 70, compared to
a nulliparous woman, while a woman with four births at ages 20, 23, 26 and 29
has a cumulative relative risk of 0.71 (C.I. = 0.60 to 0.84) over the same age range
[Colditz et al., 2004]. To match these rates, we varied the probability that a progen-
itor cell acquires the ability to self-renew, γbase, and the reduction of the size of the
p27+ progenitor cell population after the second pregnancy and later pregnancies,
ppost,subs.
Specifically we tested all 42 combinations of values of γbase and ppost,subs with
γbase chosen among the seven values evenly spaced in geometric progression be-
tween 1e-4 and 1e-1 and ppost,subs chosen among the six values evenly spaced in
arithmetic progression between 0.5 and 1. All other parameters were set at the de-
fault values given in tables 2.1 and 2.2. Under each parameter combination we ran
one million model iterations under a nulliparous scenario and under each of two
birth scenarios: (i) One birth at age 20, (ii) four births at ages 20, 23, 26 and 29. For
comparison to the epidemiological data we then calculated a relative risk for each
birth scenario according to the formula (cancer incidence in the scenario between
ages 30.5 and 70.5 / cancer incidence in nulliparous scenario between ages 30.5 and
70.5). We considered risk during the 40-year period from age 30.5 to 70.5, rather
than 30 to 70, due to binning of modeled incidence into annual groups. We found
that with γbase = 3.2x10⁻³ and ppost,subs = ppost,init = 0.5, the modeled relative risk
were within the confidence intervals reported in the literature for these two data

2.5. Model Exploration 58
Figure 2.3: Behaviour of the model under the default parameter settings. Evolution ofinitiation-free ducts with age under the default parameter settings for three birthscenarios (nulliparous, a single birth at age 20, and four births at ages 20, 23,26 and 29).
20 30 40 50 60 70 80
0.90
0.92
0.94
0.96
0.98
1.00
Age
Prop
ortio
n of
initi
atio
nfre
e du
cts
NulliparousBirth at age 20Births at ages 20, 23, 26 and 29
points, at 0.86 and 0.73, respectively (Fig. 2.3). We note that there are likely other
parameter settings that could fit the data, in addition to those that we used. There-
fore the parameterisation presented here serves as an example of how our model can
explain the data, rather than as an exact parameter estimation approach. Similarly,
the possibility that multiple parameter settings could explain is one reason for the
relatively cautious conclusion of our study, which we see as providing support for,
but not proof of, our mechanistic hypotheses.
2.5.2 Analysis of model fit
Using the fitted model, we first tested the effects of varying model parameters in the
nulliparous simulations to test the behavior of the model. As expected, we found
that the rate of cancer initiation per duct was increased by increasing the number
of stem and progenitor cells per duct, the rate of asymmetric stem cell division,
the mutation rate, the probability of progenitor cells attaining self-renewal capacity,

2.5. Model Exploration 59
Figure 2.4: Effect of parameter variation on cancer initiation in nulliparous simulations.Effects of varying individual parameters of the model on nulliparous cancerinitiation. Bars show log fold change of cancer incidence relative to that underdefault parameter settings.
effect of subsequent pregnancies (ppost,subs) = 0.8
pregnancy progenitor expansion (zpreg) = 3
mutations required (nmut) = 3
mutations required (nmut) = 1
effect of mutation in progenitor cells (zmut) = 2
effect of mutation in stem cells (fmut) = 1.01
self renewal event rate ( base) = 3.2e 2
self renewal event rate ( base) = 3.2e 4
mutation rate (μ) = 2e 4
mutation rate (μ) = 2e 6
asymmetric division rate (p) = 0.1
asymmetric division rate (p) = 0.001
progenitor cell divisions (z) = 12
progenitor cell divisions (z) = 8
stem cell number (N) = 10
stem cell number (N) = 5
cell cycle time of stem cells (tcycle) = 13.5
default
4 2 0 2 4
Effect on cancer initiation relative to default
and the fitness advantage of mutated progenitor cells compared to wild type cells.
By contrast, the rate of cancer initiation per duct was increased by decreasing the
number of mutations required for cancer initiation. Also, as expected, changes in
the proliferative capacity of progenitor cells during pregnancy, and the effects of
subsequent pregnancies, have no effect in the nulliparous state (Figs. 2.4 2.5).
We then tested the robustness of the fit of our model to the result that early
pregnancy protects against breast cancer in the surrounding parameter space. We
compared the relative likelihood of cancer initiation with pregnancy occurring at
five year intervals during a woman’s childbearing years as compared to the nulli-
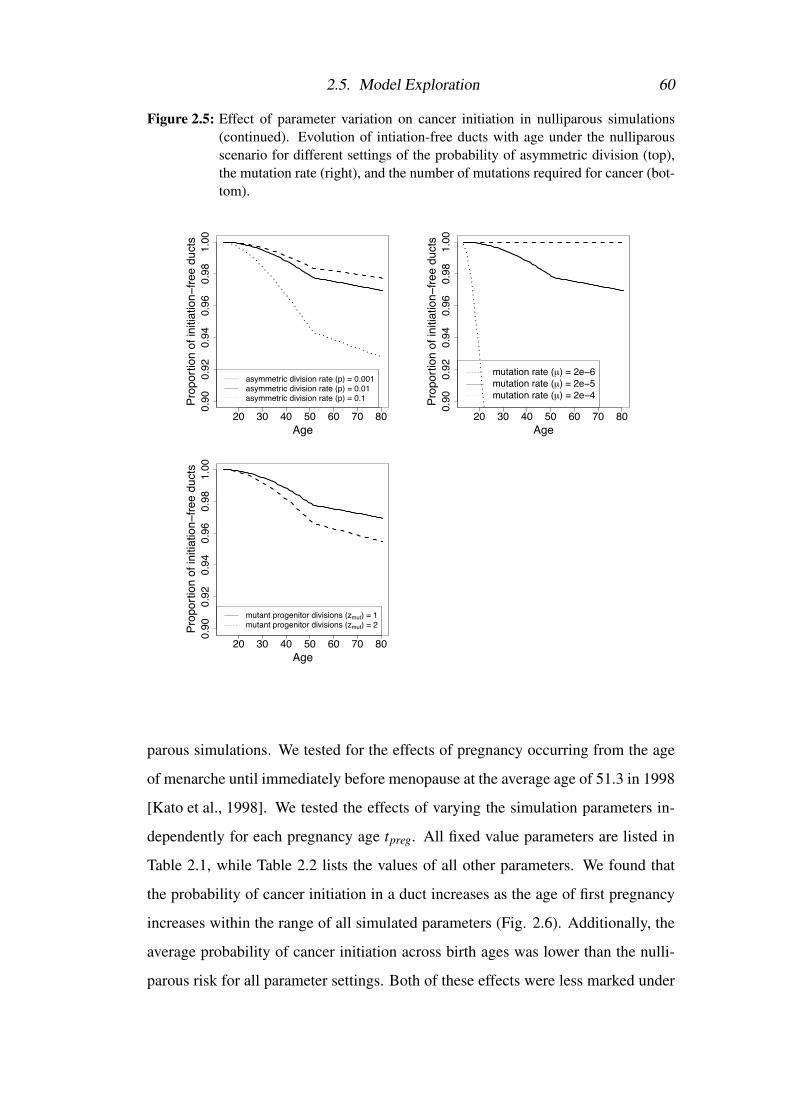
2.5. Model Exploration 60
Figure 2.5: Effect of parameter variation on cancer initiation in nulliparous simulations(continued). Evolution of intiation-free ducts with age under the nulliparousscenario for different settings of the probability of asymmetric division (top),the mutation rate (right), and the number of mutations required for cancer (bot-tom).
20 30 40 50 60 70 80
0.90
0.92
0.94
0.96
0.98
1.00
Age
Prop
ortio
n of
initi
atio
nfre
e du
cts
asymmetric division rate (p) = 0.001asymmetric division rate (p) = 0.01asymmetric division rate (p) = 0.1
20 30 40 50 60 70 80
0.90
0.92
0.94
0.96
0.98
1.00
AgePr
opor
tion
of in
itiat
ion
free
duct
s
mutation rate (μ) = 2e 6mutation rate (μ) = 2e 5mutation rate (μ) = 2e 4
20 30 40 50 60 70 80
0.90
0.92
0.94
0.96
0.98
1.00
Age
Prop
ortio
n of
initi
atio
nfre
e du
cts
mutant progenitor divisions (zmut) = 1mutant progenitor divisions (zmut) = 2
parous simulations. We tested for the effects of pregnancy occurring from the age
of menarche until immediately before menopause at the average age of 51.3 in 1998
[Kato et al., 1998]. We tested the effects of varying the simulation parameters in-
dependently for each pregnancy age tpreg. All fixed value parameters are listed in
Table 2.1, while Table 2.2 lists the values of all other parameters. We found that
the probability of cancer initiation in a duct increases as the age of first pregnancy
increases within the range of all simulated parameters (Fig. 2.6). Additionally, the
average probability of cancer initiation across birth ages was lower than the nulli-
parous risk for all parameter settings. Both of these effects were less marked under

2.5. Model Exploration 61
Figure 2.6: Relative probability of cancer initiation per duct as compared to nulliparoussimulations. Variation in cancer initiation relative to nulliparous for differentages at first birth under default parameter settings (green lines), and when vary-ing individual model parameters upwards (red lines) or downwards (blue lines).Left to right from top left, effects of varying stem cell cell cyle time, numberof stem cells, number of progenitors, probabilities of stem cell differentiation,mutation rate, probability of progenitor cells attaining ability to self-renew, fit-ness effects of mutations, number of mutations required for cancer initiation,and additional pregnancy divisions, are shown.
15 25 35 45
0.6
0.7
0.8
0.9
1.0
Age at pregnancy
Can
cer
initi
atio
n ra
te r
elat
ive
to n
ullip
arou
s
tcycle = 13.5tcycle = 6.75
15 25 35 45
0.6
0.7
0.8
0.9
1.0
Age at pregnancy
Can
cer
initi
atio
n ra
te r
elat
ive
to n
ullip
arou
s
N = 5N = 8N = 10
15 25 35 45
0.6
0.7
0.8
0.9
1.0
Age at pregnancy
Can
cer
initi
atio
n ra
te r
elat
ive
to n
ullip
arou
s
z = 6z = 10z = 14
15 25 35 45
0.6
0.7
0.8
0.9
1.0
Age at pregnancy
Can
cer
initi
atio
n ra
te r
elat
ive
to n
ullip
arou
s
p = 0.001p = 0.01p = 0.1
15 25 35 45
0.6
0.7
0.8
0.9
1.0
Age at pregnancy
Can
cer
initi
atio
n ra
te r
elat
ive
to n
ullip
arou
s
µ = 2e−6µ = 2e−5µ = 2e−4
15 25 35 45
0.6
0.7
0.8
0.9
1.0
Age at pregnancy
Can
cer
initi
atio
n ra
te r
elat
ive
to n
ullip
arou
s
γbase = 3.2e−4γbase = 3.2e−3γbase = 3.2e−2
15 25 35 45
0.6
0.7
0.8
0.9
1.0
Age at pregnancy
Can
cer
initi
atio
n ra
te r
elat
ive
to n
ullip
arou
s
fmut = 1.01fmut = 1.1
15 25 35 45
0.6
0.7
0.8
0.9
1.0
Age at pregnancy
Can
cer
initi
atio
n ra
te r
elat
ive
to n
ullip
arou
s
zmut = 1zmut = 2
15 25 35 45
0.6
0.7
0.8
0.9
1.0
Age at pregnancy
Can
cer
initi
atio
n ra
te r
elat
ive
to n
ullip
arou
s
nmut = 1nmut = 2nmut = 3
15 25 35 45
0.6
0.7
0.8
0.9
1.0
Age at pregnancy
Can
cer
initi
atio
n ra
te r
elat
ive
to n
ullip
arou
s
zpreg = 2zpreg = 3
parameter settings in which most of the cancers resulted from the stem cells under
the nulliparous scenario (P < 4× 10⁻⁴ Spearman’s rank correlation coefficient, in
both cases). Indeed, the z = 6 setting had the highest proportion of stem cell cancers
under the nulliparous setting.
We also investigated the effects of multiple births on cancer risk. We tested
model runs with one, two, three, and four total births. For each of these cases, we
investigated varying the age at first birth in five year intervals as above from the
age of menarche to the age of menopause, assuming that all subsequent births were
distributed evenly across the intervening years between the first birth and the age
of menopause. For all numbers of total births, risk increased with increasing age at
first birth. Additionally, as expected, scenarios with a larger total number of births

2.5. Model Exploration 62
Figure 2.7: Relative probability of cancer initiation per duct as compared to nulliparoussimulations (continued). Variation in cancer initiation relative to nulliparousfor different ages at first birth and different numbers of total births.
15 20 25 30 35 40 45
0.6
0.7
0.8
0.9
1.0
Age at first pregnancy
Can
cer
initi
atio
n ra
te r
elat
ive
to n
ullip
arou
s
Total births = 1Total births = 2Total births = 3Total births = 4
were at a lower risk compared to scenarios with fewer births (Figure 2.7).
We also tested for robustness of the quantitative fit to the two data points con-
sidered. As expected, we found that for some parameters the decrease in risk in the
two modeled scenarios remained within the bounds of the confidence intervals for
all settings tested, whereas for other parameters, there were some settings where the
risk decrease did not match the literature values (Fig. 2.8, 2.9, 2.10). In particular
the quantitative fit to both data points was robust to changes in the cell cycle time
of stem cells, the number of stem cells per duct, the fitness effects of mutations in
stem cells, the number of additional progenitor cell divisions during pregnancy and
the reduction in numbers of progenitors with subsequent births, within the range of
values tested. The quantitative fit was also robust to decrease in the mutation rate
in the range of values tested. Thus, our analysis demonstrates that the hypothesis
can explain these two observed quantitative decreases in breast cancer risk, under

2.5. Model Exploration 63
Figure 2.8: Reduced risk of breast cancer between the ages of 30 and 70 in the scenariosindicated. Dotted and solid lines represent literature estimate and confidenceintervals from [Colditz et al., 2004]. ‘+’ Represents base case setting
● ● ● ● ● ● ● ●
7 9 11 13
0.0
0.2
0.4
0.6
0.8
1.0
Cell cycle timeof stem cells (tcycle)
Can
cer i
nitia
tion
birth
at a
ge 2
0re
lativ
e to
nul
lipar
ous
● ● ● ● ● ● ● ●
7 9 11 13
0.0
0.2
0.4
0.6
0.8
1.0
Cell cycle timeof stem cells (tcycle)
Can
cer i
nitia
tion
birth
s at
age
s 20
, 23,
26
and
29re
lativ
e to
nul
lipar
ous
● ● ● ● ●
5 6 7 8 9 10
0.0
0.2
0.4
0.6
0.8
1.0
Stem cell number (N)
Can
cer i
nitia
tion
birth
at a
ge 2
0re
lativ
e to
nul
lipar
ous
● ● ● ● ●
5 6 7 8 9 10
0.0
0.2
0.4
0.6
0.8
1.0
Stem cell number (N)Can
cer i
nitia
tion
birth
s at
age
s 20
, 23,
26
and
29re
lativ
e to
nul
lipar
ous
● ● ●●
●
● ●
●
6 8 10 12 14
0.0
0.2
0.4
0.6
0.8
1.0
Progenitor cell divisions (z)
Can
cer i
nitia
tion
birth
at a
ge 2
0re
lativ
e to
nul
lipar
ous
●●
●
●
●
●
●●
6 8 10 12 14
0.0
0.2
0.4
0.6
0.8
1.0
Progenitor cell divisions (z)Can
cer i
nitia
tion
birth
s at
age
s 20
, 23,
26
and
29re
lativ
e to
nul
lipar
ous
●●
●●
●
●● ●
−3.0 −2.0 −1.0
0.0
0.2
0.4
0.6
0.8
1.0
log10(Asymmetric division rate (p))
Can
cer i
nitia
tion
birth
at a
ge 2
0re
lativ
e to
nul
lipar
ous
●●
●
●
●
●
●
●
−3.0 −2.0 −1.0
0.0
0.2
0.4
0.6
0.8
1.0
log10(Asymmetric division rate (p))Can
cer i
nitia
tion
birth
s at
age
s 20
, 23,
26
and
29re
lativ
e to
nul
lipar
ous
some, but not all, plausible biological settings. Our hypothesis is thus one possible
explanation for the observed protective effect of parity. However, we cannot rule
out other possible explanations for the relatively limited amount of available data
on the quantitative risk reduction.
Another interesting result is the specificity of the effect of the decrease in the
progenitor pool with pregnancy to decrease the risk of cancers initiating from the
progenitor compartment. We noted that the risk of cancers initiating from the pro-
genitor cell compartment increased with age at first birth, while the risk of cancers
where the final mutation occurs in the stem cell compartment showed a (smaller)
decrease (P < 4×10⁻⁵ in both cases under linear regression). Similarly, under the
default parameter settings, whereas the risk of cancers initiated from the progenitor
compartment was lower under all parous scenarios compared to the nulliparous sce-
narios, the risk of cancers initiated from the stem compartment was slightly higher
under all parous scenarios.
This result raises one possible explanation for the specificity of the protective
effect of early pregnancy to ER+/PR+ cancer [Colditz et al., 2004]. Mounting ex-
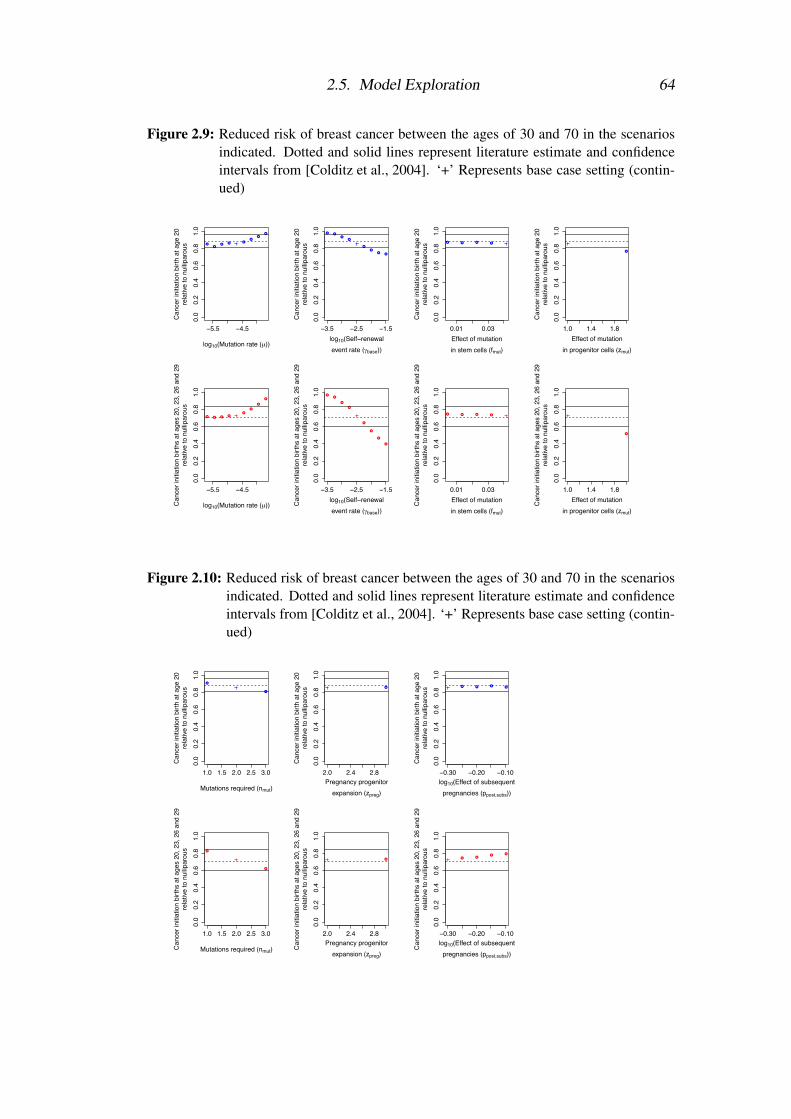
2.5. Model Exploration 64
Figure 2.9: Reduced risk of breast cancer between the ages of 30 and 70 in the scenariosindicated. Dotted and solid lines represent literature estimate and confidenceintervals from [Colditz et al., 2004]. ‘+’ Represents base case setting (contin-ued)
●●
● ● ●●
●●
−5.5 −4.5
0.0
0.2
0.4
0.6
0.8
1.0
log10(Mutation rate (µ))
Can
cer i
nitia
tion
birth
at a
ge 2
0re
lativ
e to
nul
lipar
ous
● ● ● ●●
●
●
●
−5.5 −4.5
0.0
0.2
0.4
0.6
0.8
1.0
log10(Mutation rate (µ))Can
cer i
nitia
tion
birth
s at
age
s 20
, 23,
26
and
29re
lativ
e to
nul
lipar
ous
● ●●
●
●
●● ●
−3.5 −2.5 −1.5
0.0
0.2
0.4
0.6
0.8
1.0
log10(Self−renewalevent rate (γbase))
Can
cer i
nitia
tion
birth
at a
ge 2
0re
lativ
e to
nul
lipar
ous
●●
●
●
●
●
●
●
−3.5 −2.5 −1.5
0.0
0.2
0.4
0.6
0.8
1.0
log10(Self−renewalevent rate (γbase))
Can
cer i
nitia
tion
birth
s at
age
s 20
, 23,
26
and
29re
lativ
e to
nul
lipar
ous
● ● ● ●
0.01 0.03
0.0
0.2
0.4
0.6
0.8
1.0
Effect of mutationin stem cells (fmut)
Can
cer i
nitia
tion
birth
at a
ge 2
0re
lativ
e to
nul
lipar
ous
● ● ● ●
0.01 0.03
0.0
0.2
0.4
0.6
0.8
1.0
Effect of mutationin stem cells (fmut)
Can
cer i
nitia
tion
birth
s at
age
s 20
, 23,
26
and
29re
lativ
e to
nul
lipar
ous
●
1.0 1.4 1.8
0.0
0.2
0.4
0.6
0.8
1.0
Effect of mutationin progenitor cells (zmut)
Can
cer i
nitia
tion
birth
at a
ge 2
0re
lativ
e to
nul
lipar
ous
●
1.0 1.4 1.8
0.0
0.2
0.4
0.6
0.8
1.0
Effect of mutationin progenitor cells (zmut)
Can
cer i
nitia
tion
birth
s at
age
s 20
, 23,
26
and
29re
lativ
e to
nul
lipar
ous
Figure 2.10: Reduced risk of breast cancer between the ages of 30 and 70 in the scenariosindicated. Dotted and solid lines represent literature estimate and confidenceintervals from [Colditz et al., 2004]. ‘+’ Represents base case setting (contin-ued)
●
●
1.0 1.5 2.0 2.5 3.0
0.0
0.2
0.4
0.6
0.8
1.0
Mutations required (nmut)
Can
cer i
nitia
tion
birth
at a
ge 2
0re
lativ
e to
nul
lipar
ous
●
●
1.0 1.5 2.0 2.5 3.0
0.0
0.2
0.4
0.6
0.8
1.0
Mutations required (nmut)Can
cer i
nitia
tion
birth
s at
age
s 20
, 23,
26
and
29re
lativ
e to
nul
lipar
ous
●
2.0 2.4 2.8
0.0
0.2
0.4
0.6
0.8
1.0
Pregnancy progenitorexpansion (zpreg)
Can
cer i
nitia
tion
birth
at a
ge 2
0re
lativ
e to
nul
lipar
ous
●
2.0 2.4 2.8
0.0
0.2
0.4
0.6
0.8
1.0
Pregnancy progenitorexpansion (zpreg)
Can
cer i
nitia
tion
birth
s at
age
s 20
, 23,
26
and
29re
lativ
e to
nul
lipar
ous
● ● ● ●
−0.30 −0.20 −0.10
0.0
0.2
0.4
0.6
0.8
1.0
log10(Effect of subsequentpregnancies (ppost,subs))
Can
cer i
nitia
tion
birth
at a
ge 2
0re
lativ
e to
nul
lipar
ous
● ●● ●
−0.30 −0.20 −0.10
0.0
0.2
0.4
0.6
0.8
1.0
log10(Effect of subsequentpregnancies (ppost,subs))
Can
cer i
nitia
tion
birth
s at
age
s 20
, 23,
26
and
29re
lativ
e to
nul
lipar
ous

2.6. Conclusion 65
perimental evidence suggests that the typical cell of origin of breast carcinomas is
a stem or progenitor cell [Visvader, 2011]. The specificity of the protective effects
in our model to a single cellular compartment poses the question of whether other
breast cancer molecular subtypes may have a different cell of origin as a possible
explanation for the observed specificity of protective effects. Relatedly it is also
possible that changes during carcinogenesis render other breast cancer subtypes in-
sensitive to hormone-driven growth or that some of the molecular parameters con-
sidered differ between breast cancer subtypes. By the same token, our model is
agnostic on whether the pregnancy should protect against other histological breast
cancer types, such as lobular cancers. Whether or not protective effects would be
expected for these subtypes depend on the extent to which the etiology of these can-
cer types, in terms of cell of origin and other molecular parameters, corresponds to
ER+ cancers. The possibility of a luminal progenitor cell of origin for ER+ breast
cancer has been proposed previously [Polyak, 2007]. Explaining the distinct ae-
tiologies of different breast cancer molecular subtypes is a long-standing area of
breast cancer research.
As a further test of our framework, we investigated whether our model re-
produced the known effect that breast cancer risk is increased for a short period
immediately following pregnancy [Albrektsen et al., 2005]. For these purposes we
investigated an extended model including a variable delay between initiation of can-
cer within the duct and clinical presentation. We investigated two scenarios, first
birth at age 20, and first birth at age 40, and calculated the relative risk compared
to nulliparous women of matched age in the years following pregnancy for varying
average waiting times to clinical presentation between 0 and 5 years. We found that
with an average waiting time of one year, relative risk in both parous scenarios was
greater than one during the two years following the pregnancy (Fig. 2.11).
2.6 Conclusion
Here, we investigated whether variation in the size of the progenitor cell population
is sufficient to explain the protective effects of pregnancy against breast cancer. We

2.6. Conclusion 66
Figure 2.11: Evolution of cancer initiation relative to nulliparous with age in a sub-modelwhich includes a delay between initiation of cancer in a duct and clinical pre-sentation. Left panels show cancer initiation relative to nulliparous for a singlebirth at age 20, right hand panels show cancer initiation relative to nulliparousfor a single birth at age 40. Differences in cancer initiation before the age ofthe birth result arise due to low incidence levels at younger ages.
●
●
●●●
●●●
●
●●●●●●●●●●●●●●
●●●●●●●●●●●●●●●●●●●
●●●●●●●
●●●●●●●●●●●●●●●
●●●●●●
10 20 30 40 50 60 70 80
0.5
1.5
2.5
No delay
AgeCan
cer i
nitia
tion
rela
tive
to n
ullip
arou
s
●
●●●●●●●●●
●●●●●●●●●●●●●●●
●●●
●
●●●●●●●●●●●●
●●●●●●●●●
●●●●●●●
●●●●●
●●●●
●●●●
10 20 30 40 50 60 70 80
0.5
1.5
2.5
No delay
AgeCan
cer i
nitia
tion
rela
tive
to n
ullip
arou
s
●
●●●
●●●
●
●●
●●●
●●●●
●●●●●●●●●●●●●●●●●●●●●●●
●●●●●●●
●●●●●●
●●●●●●●●●
●●●●●●●
●
10 20 30 40 50 60 70 80
0.5
1.5
2.5
1 year delay
AgeCan
cer i
nitia
tion
rela
tive
to n
ullip
arou
s
●●●●●
●●●
●●
●●●●●
●●●●●●●●
●●●●●
●●
●●●●●●●●●●●●●
●●●●●●●●●●
●●●●●●●
●●
●
●●●●
●●●
10 20 30 40 50 60 70 80
0.5
1.5
2.5
1 year delay
AgeCan
cer i
nitia
tion
rela
tive
to n
ullip
arou
s
used a simple mathematical model of the steps leading to cancer initiation, which
included both stem cells and progenitor cells. We analysed the fit of our model
to data from the Nurses’ Health Study, a prospective study of breast cancer that
followed 66,145 US women over 1,029,414 person years [Colditz et al., 2004]. We
found that within the range of biologically plausible parameters, our model matches
the observed decrease in ER+/PR+ cancer risk for a woman with a birth at age 20
and a woman with four births in her 20’s compared to a nulliparous woman. Using
these parameter settings, we found that the risk of cancer in our model decreased
with increasing age of first birth in scenarios with one birth. Moreover, the risk
of cancer was lower in all scenarios with one birth compared to the nulliparous
case. This behavior was robust to variation in key model parameters. The ability of
our model to robustly recreate the effect on cancer risk when varying the progen-

2.6. Conclusion 67
itor population size with pregnancy is striking given the modeled assumption that
progenitor cells terminally differentiate after a finite number of divisions, so that
mutations arising in progenitor cells are liable to leave the population without any
functional impact. Taken together, these results support the hypothesis that a sub-
set of p27+ cells represents quiescent hormone-responsive luminal progenitor cells
with proliferative potential.
Our mathematical modeling approach for breast cancer can be useful in under-
standing the contribution of unavoidable bad luck to cancer risk. We have presented
evidence that, in the setting of breast cancer, the size of a sub-population of pro-
genitor cells may vary safely over the course of a life to alter breast cancer risk,
independent of the probability of mutations. While it is possible that the mecha-
nisms explored here are specific to the breast cancer setting, our results highlight
the possibility that extrinsic factors can interact with molecular parameters to af-
fect cancer risk in ways that are not yet fully mapped out. These results therefore
further motivate the use of complementary approaches to assess the contribution of
bad luck to cancer risk that do not rely on strong assumptions about the effects of
extrinsic factors, which may still be subject to revision. The modeling approach
developed here is one such possible complementary approach. Therefore, the main
implications of our study are support for a mechanism in the breast cancer setting,
with potential implications for other cancers with an important role for hormone-
driven growth, including endometrial and ovarian cancers. And, in addition, the
current approach may be usefully applied in a range of cancer types.
In conclusion, our results demonstrate that variation in the size of the pool
of progenitor cells with proliferative potential is capable of explaining the protec-
tive effect of early pregnancy against breast cancer. We obtained good agreement
between our simple model’s predictions and specific epidemiological data points
within the range of plausible parameters. Intense recent debate, prompted by the
work of Tomasetti and Vogelstein [Tomasetti and Vogelstein, 2015], has indicated
the limits of regression techniques for determining the ultimate contribution of bad
luck to cancer incidence. Continuing improvements in our mechanistic understand-

2.6. Conclusion 68
ing of the etiology of different cancers can help elucidate the contribution of bad
luck to cancer risk and the limits of cancer prevention strategies. Given the com-
plexity of the molecular setting in which cancer develops, mathematical models
can be a useful tool in developing such a mechanistic understanding. Our work
has developed this approach for the case of breast cancer to provide evidence for a
possible mechanism for the protective effect of early pregnancy against the disease.

Chapter 3
Evidence for punctuated
accumulation of copy number
alterations in colorectal cancer
The work is in preparation for submission
Cross W., Kovac M., Mustonen V., Temko D., Davis H., Baker A., Biswas S.,
Arnold R., Chegwidden L., Gatenbee C., Anderson A.R., Koelzer V.H., Martinez P.,
Jiang X., Domingo E., Woodcock D., Feng Y., Kovacova M., Jansen M., Rodriguez-
Justo M., Ashraf S., Guy R., Cunningham C., East J.E., Wedge D., Wang L.M.,
Palles C., Heinimann K., Sottoriva A., Leedham S.J., Graham T.A. and Tomlinson
I. The evolutionary landscape of colorectal tumorigenesis, in preparation, 2018
3.1 PrecisEmerging evidence from breast cancer and other tumour types suggests that some
tumours accumulate (CNAs) in a punctuated fashion, consistent with the occurrence
of a ‘chromosomal catastrophe’ in an ancestral tumour cell, whereas others follow a
more gradual pattern of CNA accumulation. The extent to which these patterns exist
across cancer types is currently unknown. Here, I present a method that uses SNAs
in the region of CNAs as a molecular clock to time the occurrence of CNAs. The
method uses information from across the genome to jointly time CNAs, building
on previous methods which timed CNAs singly. I also present a method to test for

3.2. Contribution 70
punctuated CNA evolution using whole exome data (WXS). In the latter part of the
chapter I describe applications of the methods to whole genome and exome data
from a study of colorectal cancers, and to exome data from a study of inflammatory
bowel disease (IBD)-associated colorectal cancers. The results provide support for
the occurrence of punctuated CNA accumulation in a subset of colorectal cancers.
Although it appears that the whole exome data method often suffers from a lack
of power, the whole genome method represents a potentially useful complement to
existing methods.
3.2 ContributionI developed the adapted timing methods in the first part of the chapter. Application
of the methods to colorectal cancer WGS data was performed in collaboration with
Dr William Cross. I performed the application to WXS data alone. As indicated
below, some of the figures presented in this section were generated by Dr William
Cross.
3.3 IntroductionThe timing, mechanistic cause, and functional consequence of the CNAs observed
in cancer samples is still largely unknown and is an active area of research (see
Introduction, Chapter 1). Mounting evidence suggests that episodes of punctu-
ated CNA accumulation, where multiple CNA events accrue in a short period of
time, are common across cancer types. In particular chromothripsis appears to
be common across cancer types [Stephens et al., 2011, Kloosterman et al., 2011,
Notta et al., 2016], and several studies have suggested that whole genome dupli-
cations are also common [Carter et al., 2012, Zack et al., 2013]. However, accurate
identification of WGD events from sequencing data relies on strong assumptions
that the most parsimonious explanation for a set of CNAs is the correct explanation.
Recently, several studies in individual cancer types have shed light on some
of these questions using a variety of techniques that enable the temporal phas-
ing of CNAs in individual tumour samples (see Chapter 1). Evidence for
a punctuated model of CNA accumulation has been presented in breast can-

3.3. Introduction 71
cer [Nik-Zainal et al., 2012a, Gao et al., 2016, Casasent et al., 2018], lung can-
cer [Jamal-Hanjani et al., 2017], ovarian cancer [Purdom et al., 2013], and HBV-
related hepatocellular carcinoma [Duan et al., 2018]. Studies have indicated that
a more gradual model of CNA accumulation, where the CNA accumulation
rate appears to be relatively constant in time, is also possible, in breast cancer
[Nik-Zainal et al., 2012a] and ovarian cancer [Purdom et al., 2013].
In theory, gradual accumulation of CNAs in small isolated cell populations that
occasionally rise to prominence quickly could underlie punctuated changes at the
level of the population - a situation known as ‘punctuated equilibrium’. By contrast,
similar population patterns could result from punctuated CNA accumulation at the
level of individual cells that creates highly mutated cells (termed ‘hopeful mon-
sters’) [Graham and Sottoriva, 2017]. The foregoing studies suggest that hopeful
monsters may be a common feature of somatic cell populations en route to cancer.
The methods presented here build on a number of previous methods that
use single nucleotide alterations (SNAs) within CNAs as a molcular clock
to time CNAs in tumour samples. Steffen Durinck proposed the idea that
SNAs that occurred before a duplication in a genomic region were distin-
guishable from SNAs occurring afterwards, since they are duplicated with
the rest of the region [Durinck et al., 2011], suggesting a natural method to
time CNA events in the history of tumour samples (see Figure 3.1). This
method was adapted and applied to data in the context of breast cancer
[Greenman et al., 2012, Nik-Zainal et al., 2012a, Nik-Zainal et al., 2012b]. A later
study expanded on the original method, and made adjustments to correct for prob-
lems caused by low-depth samples [Purdom et al., 2013].
Whereas previous methods have timed each CNA singly, using the local SNAs,
here I present a method to time each of the CNAs in a tumour using a joint likelihood
maximisation; I use the information that the total age of every CNA is the same to
make use of information from across the genome to time each CNA. The method
presented here is agnostic to the causative mutational process; i.e. it can be used to
time CNAs that arise due to any mutational process, and uses SNAs in the region of

3.3. Introduction 72
Figure 3.1: A) Diagram representing a cell genome with an ancestral duplication on oneallele of chromosome 1p, and an ancestral duplication on both alleles on chro-mosome 2q, crosses represent SNAs. In the gained region on 1p, 4 SNAs onthe gained allele occured prior to the duplication and so are present on 2 out of3 copies of the region. B) and C), hypothetical sequencing data from the twogained regions. In B) the SNAs that occurred prior to the gain are distinguish-able since a greater proportion of reads from the locus show evidence of theSNA (higher Variant Allele Frequency).
1p
2q
A) B)
C)Duplication on 2q
0.0 0.2 0.4 0.6 0.8 1.0
Variant Allele Frequency
01
23
45
6
Num
ber o
f SN
As
Duplication on 1p
0.0 0.2 0.4 0.6 0.8 1.0
Variant Allele Frequency
01
23
45
Num
ber o
f SN
As
the CNAs as the only indicator of timing. As a result, the inferred timings can point
to possible causative mutational processes.

3.4. Mathematical Framework 73
3.4 Mathematical Framework
3.4.1 Growth model
The modelling makes the assumption that the average SNA mutation rate was equal
in all of the regions considered, in addition to those assumptions mentioned explic-
itly below (see 3.6).
Suppose that during the growth of cell lineage L, an ancestral cell, c, gained
an extra copy of region r of the A-allele of chromosome j. We note that any SNAs
that occurred in an ancestor of c in region r on the A-allele of j will be present on
2 of the 3 copies of this region. However, SNAs that occurred in an ancestor of the
cell in region r on the B-allele, and SNAs that occurred in a descendent on the A-
allele or B-allele will be present in only 1 of the 3 copies of the region. In general,
SNAs in region r will fall into two groups in terms of allele frequency, with SNAs
that occurred before the gain, on the gained allele, falling into the higher frequency
group [Durinck et al., 2011].
Formalising this reasoning, α , the number of high frequency SNAs in region
r, and β , the number of low frequency SNAs in region r, are Poisson distributed
random variables with means λα = µlθ and λβ = 2µl(T−θ)+µlT. Here µ is the
average SNA mutation rate per base pair per year, l is the length of region r in base
pairs, θ is the time in years between the start of the cell lineage and the copy gain
of r, and T is the time in years between the start of the lineage and the end of the
lineage.
We can consider three types of copy number alteration that result in A copies
of the A-allele (the more numerous allele) and B copies of the B-allele (the less
numerous allele), ordered for ease of exposition:
Case I: A≥ 2,B = 0 (LOH and amplification)
Case II: A = B≥ 2 (balanced amplification)
Case III: A≥ 2,B = 1 (unbalanced amplification)
leading to Poisson distributions for α and β with mean parameters:
Case I: λα = µlθ , λβ = Aµl(T−θ)
Case II: λα = 2µlθ , λβ = 2Aµl(T−θ)
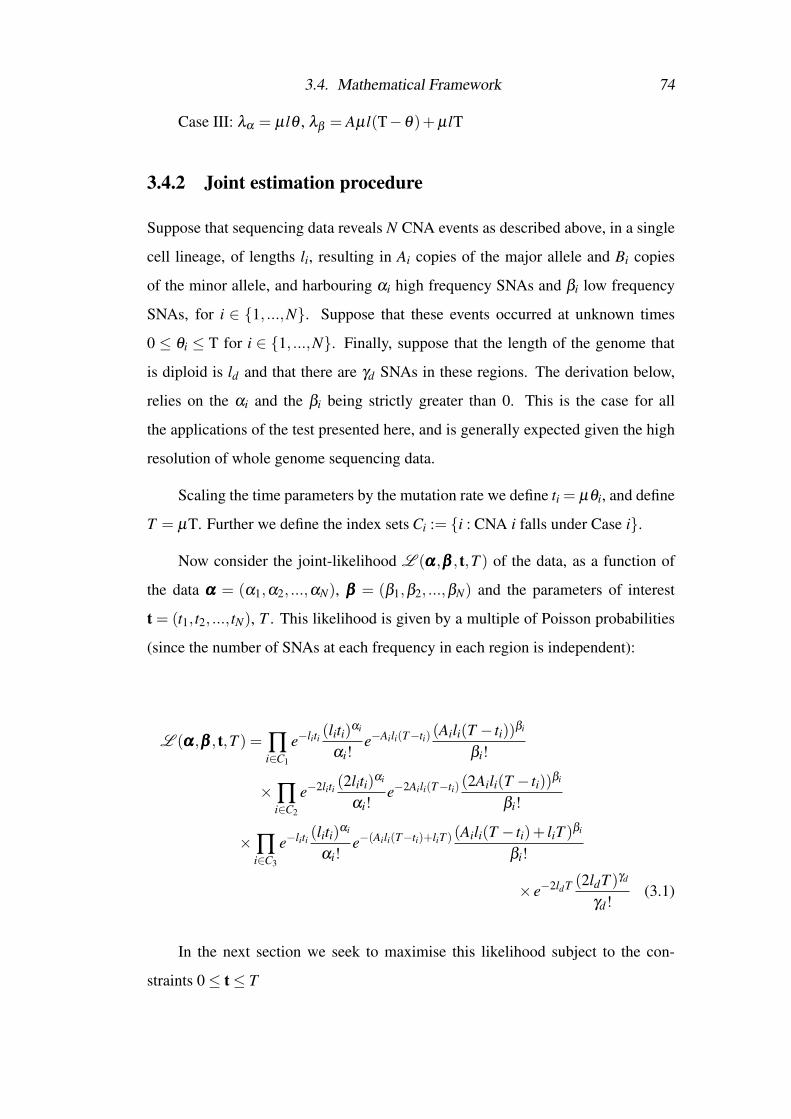
3.4. Mathematical Framework 74
Case III: λα = µlθ , λβ = Aµl(T−θ)+µlT
3.4.2 Joint estimation procedure
Suppose that sequencing data reveals N CNA events as described above, in a single
cell lineage, of lengths li, resulting in Ai copies of the major allele and Bi copies
of the minor allele, and harbouring αi high frequency SNAs and βi low frequency
SNAs, for i ∈ {1, ...,N}. Suppose that these events occurred at unknown times
0 ≤ θi ≤ T for i ∈ {1, ...,N}. Finally, suppose that the length of the genome that
is diploid is ld and that there are γd SNAs in these regions. The derivation below,
relies on the αi and the βi being strictly greater than 0. This is the case for all
the applications of the test presented here, and is generally expected given the high
resolution of whole genome sequencing data.
Scaling the time parameters by the mutation rate we define ti = µθi, and define
T = µT. Further we define the index sets Ci := {i : CNA i falls under Case i}.
Now consider the joint-likelihood L (ααα,βββ , t,T ) of the data, as a function of
the data ααα = (α1,α2, ...,αN), βββ = (β1,β2, ...,βN) and the parameters of interest
t = (t1, t2, ..., tN), T . This likelihood is given by a multiple of Poisson probabilities
(since the number of SNAs at each frequency in each region is independent):
L (ααα,βββ , t,T ) = ∏i∈C1
e−liti (liti)αi
αi!e−Aili(T−ti) (Aili(T − ti))βi
βi!
×∏i∈C2
e−2liti (2liti)αi
αi!e−2Aili(T−ti) (2Aili(T − ti))βi
βi!
×∏i∈C3
e−liti (liti)αi
αi!e−(Aili(T−ti)+liT ) (Aili(T − ti)+ liT )βi
βi!
× e−2ldT (2ldT )γd
γd!(3.1)
In the next section we seek to maximise this likelihood subject to the con-
straints 0≤ t≤ T

3.4. Mathematical Framework 75
3.4.3 Likelihood Maximisation
We seek to solve the constrained optimisation max0≤t≤T
L
For this type of problem we can find a set of conditions on the Lagrangian,
known as the Kuhn-Tucker conditions, satisfied by any feasible local maximum,
and, a fortiori, by a global maximum (Theorem 2.1 in [Luptacik, 2010])
Thus, defining I = {1,2, ...,N}, we have the Lagrangian:
L(ααα,βββ , t,T ) = L (ααα,βββ , t,T )+∑i∈I
λiti +∑i∈I
λN+i(T − ti) (3.2)
and Kuhn-Tucker conditions:
∀i ∈ I,∂L∂ ti
= 0,∂L∂T
= 0,
∀i ∈ I, ti ≥ 0, T − ti ≥ 0,
∀i ∈ I, λiti = 0, λN+i(T − ti) = 0,
∀i ∈ I, λi ≥ 0, λN+i ≥ 0
We will now find expressions for (t,T ) that must hold at a global maximum,
and show that there is at most one solution.
For all i ∈ I, since αi > 0, ti = 0 =⇒ L = 0. There are at least some admis-
sible points where L > 0, so at a global maximum, 0 < ti and therefore λi = 0.
Similarly, for all i ∈ C1 ∪C2, since βi > 0, ti = T =⇒ L = 0. So in these
cases ti < T and therefore λN+i = 0.
So we can simplify 3.2
L = L (ααα,βββ , t,T )+ ∑i∈C3
λN+i(T − ti) (3.3)

3.4. Mathematical Framework 76
Our strategy will now be to express each ti in terms of T and then solve for T .
Consider i ∈C1:
∂L∂ ti
= 0
=⇒ ∂L
∂ ti= 0
=⇒ ∂ log(L )
∂ ti= 0
Since log(L )= (Ai−1)liti+αi log(ti)+βi log(T−ti)+C, where C does not depend
on ti
=⇒ (Ai−1)li +αi
ti− βi
(T − ti)= 0
=⇒ (Ai−1)li(T − ti)ti +αi(T − ti)−βiti = 0
=⇒ (1−Ai)lit2i +((Ai−1)liT −αi−βi)ti +T αi = 0
=⇒ ti =((1−Ai)liT +αi +βi)±
√((1−Ai)liT +αi +βi)2−4(1−Ai)liT αi
2(1−Ai)liSince −4(1−Ai)liT αi > 0, 2(1−Ai)li < 0 and ti > 0
=⇒ ti =((1−Ai)liT +αi +βi)−
√((1−Ai)liT +αi +βi)2−4(1−Ai)liT αi
2(1−Ai)li(3.4)

3.4. Mathematical Framework 77
Consider i ∈C2:
∂L∂ ti
= 0
=⇒ ∂L
∂ ti= 0
=⇒ ∂ log(L )
∂ ti= 0
Similar to the above
=⇒ 2(Ai−1)li +αi
ti− βi
(T − ti)= 0
By a similar argument to the above
=⇒ ti =(2(1−Ai)liT +αi +βi)−
√(2(1−Ai)liT +αi +βi)2−8(1−Ai)liT αi
4(1−Ai)li(3.5)
Consider i ∈C3:
∂L∂ ti
= 0
=⇒L ((Ai−1)li +αi
ti− Aiβi
(Ai +1)T −Aiti)−λN+i = 0
Since L > 0
=⇒ (Ai−1)li +αi
ti− Aiβi
(Ai +1)T −Aiti=
λN+i
L
If ti < T , since λN+i(T − ti) = 0, we have λN+i = 0. So
(Ai−1)li +αi
ti− Aiβi
(Ai +1)T −Aiti= 0

3.4. Mathematical Framework 78
and similar to Cases 1 and 2
ti =((1−Ai)(Ai +1)liT +Ai(αi +βi))
2(1−Ai)Aili−√
((1−Ai)(1+Ai)liT +Ai(αi +βi))2−4(1−Ai)Ai(Ai +1)liT αi
2(1−Ai)Aili(3.6)
Moreover
0 =λN+i
L= (Ai−1)li +
αi
ti− Aiβi
(Ai +1)T −Aiti> (Ai−1)li +
αi−Aiβi
T
=⇒ T <Aiβi−αi
(Ai−1)li
Whereas if ti−T = 0, then
ti = T (3.7)
λN+i
L= (Ai−1)li +
αi
ti− Aiβi
(Ai +1)T −Aiti= (Ai−1)li +
αi−Aiβi
T(3.8)
Moreover, since λN+i ≥ 0
0≤ λN+i
L= (Ai−1)li +
αi
ti− Aiβi
(Ai +1)T −Aiti= (Ai−1)li +
αi−Aiβi
T
=⇒ T ≥ Aiβi−αi
(Ai−1)li
So defining Tcriti := Aiβi−αi(Ai−1)li
; if T < Tcriti then 3.6 holds, and if T ≥ Tcriti then
3.7 and 3.8 hold.
Defining C31(T ) := {i ∈ C3 : T < Tcriti} and C32(T ) := {i ∈ C3 : T ≥ Tcriti},
we can now give a piecewise determination of ∂L∂T in terms of T only, with the
determination depending on which of the possible |C3|+2 intervals, defined by the

3.4. Mathematical Framework 79
|C3| values of Tcrit , contains T
∂L
∂T= L (−( ∑
i∈C1
Aili + ∑i∈C2
2Aili + ∑i∈C3
(Ai +1)li +2ld)
+( ∑i∈C1
βi
T − ti+ ∑
i∈C2
βi
T − ti+ ∑
i∈C3
(Ai +1)βi
(Ai +1)T −Aiti+
γd
T))
+ ∑i∈C32
λN+i (3.9)
So we have
0 =∂L
∂T
=⇒ 0 = ∑i∈C1
βi
T − ti+ ∑
i∈C2
βi
T − ti+ ∑
i∈C3
(Ai +1)βi
(Ai +1)T −aiti+
γd
T
−(
∑i∈C1
Aili + ∑i∈C2
2Aili + ∑i∈C3
(Ai +1)li +2ld)+ ∑
i∈C32
λN+i
L
Substituting from 3.7 and 3.8
=⇒ 0 = ∑i∈C1
βi
T − ti+ ∑
i∈C2
βi
T − ti+ ∑
i∈C3
(Ai +1)βi
(Ai +1)T −Aiti+
γd
T
−(
∑i∈C1
Aili + ∑i∈C2
2Aili + ∑i∈C3
(Ai +1)li +2ld)+ ∑
i∈C32
((Ai−1)li +αi−Aiβi
T)
=⇒ 0 = ∑i∈C1∪C2
βi
T − ti+ ∑
i∈C31
(Ai +1)βi
(Ai +1)T −Aiti+ ∑
i∈C32
αi +βi
T+
γd
T
−(
∑i∈C1
Aili + ∑i∈C2
2Aili + ∑i∈C31
(Ai +1)li + ∑i∈C32
2li +2ld)
(3.10)
It is easily shown that this function is continuous by showing it is continuous
at the piecewise breakpoints. Moreover we now show it is decreasing in T so that it
has at most one solution.
The right summand is a negative constant. The left summand is a sum of
fractions with constant numerators. Therefore it suffices to show that denominators
of the fractions in the left summand are all increasing.

3.4. Mathematical Framework 80
Consider i ∈C1
From 3.4
T − ti =((1−Ai)liT −αi−βi)+
√((1−Ai)liT +αi +βi)2−4(1−Ai)liT αi
2(1−Ai)liLet x = (1−Ai)li, then
T − ti =(xT −αi−βi)+
√(xT +αi +βi)2−4xT αi
2xSuppose for a contradiction that ∂ (T−ti)
∂T < 0
=⇒ 12+
(2x(xT +αi +βi)−4xαi)
4x√
(xT +αi +βi)2−4xT αi< 0
=⇒ (xT +αi +βi)−2αi√(xT +αi +βi)2−4xT αi
<−1
=⇒√(xT +αi +βi)2−4xT αi <−(xT −αi +βi)
=⇒ x2T 2 +(βi +αi)2 +2xT (βi−αi)< x2T 2 +(βi−αi)
2 +2xT (βi−αi)
=⇒ 4αiβi < 0
Which contradicts the fact that in all cases αi and βi are greater than 0
The other denominators can all be shown to be increasing by similar reasoning.
In all cases presented here we are able to find a root of 3.10, numerically, and
can thus be confident that it is the only root.
3.4.4 Confidence intervals
We use bootstrapping to calculate mean square errors for each of the estimated pa-
rameters (t,T ). Using the generative mathematical model described above param-
eterised by the estimates for (t,T ), we generate 100 simulated mutation data-sets.
In each case the numbers of high and low frequency SNAs αi and βi are simulated
as Poisson random numbers with mean values depending on the (t,T ) estimates.

3.5. Application to data 81
In each case we then use the pipeline to re-estimate (t,T ) from the simulated data.
We then calculate the mean square error of these results compared to the original
estimates used for the simulation.
3.4.5 Testing for punctuated CNA evolution in exome data
Mounting evidence suggests that multiple CNA events may occur at the same time,
as described above. However, the majority of sequencing studies to date do not have
whole genome resolution, so there may be insufficient mutations to time individual
CNAs with high resolution. As such I developed a method to test the null hypothesis
that all CNAs occurred in a single event (H0 : ∀i, j(ti = t j)), which can be applied
to whole exome sequencing data. As an indication, among the samples where I
applied the test, there were an average of 32 (range: 2-96) usable SNAs, within on
average 48 separate CNAs (range: 25-96).
Taking the parameters and concepts as defined above; for each CNA i, we
estimate the number of SNAs that occurred per allele before the CNA nearlyi and
the number of SNAs that occurred per allele after the CNA nlatei according to the
heuristic calculations below:
Case I: nearly = α , nlate =β
A
Case II: nearly =α
2 , nlate =β
2A
Case III: nearly = α , nlate =β−nearly
A
We generate a 2×N table of the early and late SNA rate per allele for each
of the N CNAs. We then use Fisher’s exact test to test against the null hypothesis
that the distribution of SNAs between late and early groups is independent of which
CNA is under consideration.
3.5 Application to data
This section describes the application of the methods to whole genome and exome
data from a study of colorectal cancers, and to exome data from a study of inflam-
matory bowel disease (IBD)-associated colorectal cancers.

3.5. Application to data 82
Table 3.1: Colorectal cancer whole genome sequencing data considered for timing analysis
Sample Sequencing Strategy Regions SequencedAdenoma 4 WGS 3
Carcinoma 3 WGS 6Carcinoma 5 WGS 6
Carcinoma 9 Distal WGS 5Carcinoma 9 Proximal WGS 5
Carcinoma 10 WGS 5
3.5.1 Application of timing model to whole genome sequencing
data in a study of colorectal cancer
The method was applied to 6 tumours, each with multiregion whole genome se-
quencing data (see Table 3.1).
The timing model requires as input the number of high and low frequency
SNAs in regions of specific copy number changes at the endpoint of the evolution
of a lineage of cells. We used the availability of multi-region sequencing data to
determine this information for a subset of genomic regions in the last common an-
cestor of all tumour samples as described below.
We identified regions of the genome with a clonal copy number state of either
2:0, 2:1 or 2:2 across samples within a tumour. Since these states were common
across samples, we reasoned that these states represented the state in the last com-
mon ancestor in these genomic regions. Similarly, within these regions we con-
sidered SNAs that were present in all samples as these SNAs were likely to have
already been present in the last common ancestor of all tumour samples. We also
identified regions that were diploid in all samples, and identified clonal SNAs within
these regions to input into the model (see Figure 3.2).
Within each region we clustered the SNAs into a high frequency and
a low frequency group using the R package MClust [Fraley et al., 2012,
Fraley and Raftery, 2002]. CNAs where the clustering of SNAs violated expec-
tations based on the inferred cancer cell fraction (cellularity) and copy number
states were discarded, as were CNAs with genomic length below a threshold (see
Figure 3.3).

3.5. Application to data 83
Figure 3.2: Schematic illustration of a tumour used for multi-region sequencing. The car-toon cells within tumour samples represent the average states inferred by se-quencing each bulk sample. Here, the duplication pictured on the bottom rightchromosome would be correctly assumed to have been present in the LCA oftumours samples as evidence survives in all samples. Similarly the 3/4 SNAson this chromosome present in alls samples would be correctly assumed tohave been present in the LCA. The CNA on the top left chromosome whichwas present in the LCA, would be missed, as it has been lost in sample 2.
Tumour
Sample 1
Sample 2
Sample 3
Time
Divergence tumour and
normal
Last common ancestor tumour
samples
The results of the model application (See Figure 3.4) indicate a rapid accumu-
lation of CNAs in the time period before the last common ancestor of all tumour
samples in four of the five tumours where the model was applied - the exception
being Carcinoma 5, which appears to show a more even distribution of the CNAs
in time between the tumour divergence from the normal and the last common an-
cestor. The rapid accumulation of CNAs is in keeping with a model of punctuated
copy number evolution, as opposed to gradual evolution, during colorectal cancer
development, similar to observations in breast cancer and pancreatic cancer. Fur-
thermore, the presence of a cluster of CNAs close in time to the last common an-
cestor of tumour samples in four cases, is consistent with a potential causal role

3.5. Application to data 84
Figure 3.3: Figure created by Dr William Cross showing two examples of clustering ofSNAs within CNAs into high and low allele frequency groups. The regionshown in A) was used for the timing model. The region shown in B) was notused, as the SNAs did not show the clustering expected given the assumedpresence of a CNA.
clustering VAF distribution
VAF
Den
sity
0.0 0.2 0.4 0.6 0.8 1.0
05
1015
clustering VAF distribution
VAF
Den
sity
0.0 0.2 0.4 0.6 0.8 1.0
05
1015
A) B)
for a punctuated CNA event in driving the last clonal expansion. However, more
evidence is needed to draw a firm conclusion.
3.5.2 Exome test power analysis
The detection power of the exome data punctuated evolution test was investigated
using simulations. I investigated the power to reject the null hypothesis that all
CNAs occurred simultaneously under different scenarios of the numbers of detected
CNAs and the number of SNAs within them. For each scenario I simulated 1,000
mutation data sets with random CNA timings chosen from a uniform distribution.
The CNAs in each simulation were chosen with random lengths and types (among
the three possibilities of types of copy number alteration considered), and the SNA
mutation rate in each scenario was set so that the expected number of SNAs, given
the CNA lengths, timings and states was equal to the number of SNAs for the sce-
nario. In each scenario the test was applied to the number of early and late SNAs in
the region of each CNA, sampled using a Poisson distribution. These simulations

3.5. Application to data 85
Figure 3.4: Figure created by Dr William Cross showing CNA timings in colorectal cancerdata. The timing model was applied to 1 adenoma and 5 carcinomas. Thebottom left figure of each panel shows the accumulation of CNAs over time (x-axis), with horizontal lines representing the confidence interval for the timingof each CNA (y-axis). The top figures show the cumulative proportion of CNAsthat have occurred at each point in time. Cumulative line is plotted relative toinferred time of 5q LOH (measured in a few cases, then assumed to the sameproportion in the other cases).
Carcinoma 3
APC p.Q1303X
tetrasomy
trisomy
loss of heterozygosity
loss
polysomy
chromothripsis
Carcinoma 5
APC p.S1327X
Adenoma 4
APC p.G1288X
Carcinoma 10
Carcinoma 9 Distal
Carcinoma 9 Proximal
−2 −1 0 1 2
1.6e
−06
2.0e
−06
2.4e
−06
QQ plot of SCNA timings
−1.5 −1.0 −0.5 0.0 0.5 1.0 1.5
5.0e
−07
1.5e
−06
Sam
ple
Qua
ntile
s
−1 0 1
1.6e
−06
2.0e
−06
2.4e
−06
−1.0 −0.5 0.0 0.5 1.0
1.9e
−06
2.1e
−06
2.3e
−06
−1.5 −1.0 −0.5 0.0 0.5 1.0 1.5
1.8e
−06
2.0e
−06
2.2e
−06
p (short arm)
q (long arm)
whole chomosome
� � � � � �
�
� � � � �
� �
� � � � � � � � � � � � � � � � � � � � � � � � � � � �
0 1e−06 � � � � � � � � � � � � � � � � � � � � � � � � � � � � � � � �
� �
�
� �
�
�
�
�
�
� �
�
� � � �
� � � � � � � � � � � � � � � � � � � � � � � �
0 1e−06 2e−06 3e−06
� � � �
� � � � � � � � � � � � � � � � � � �
� � � � �
� �
� � � �
� � � �
� � �
�
�
�
� � � � � � � � � � � � � � � � � � � � � � �
0 1e−06 2e−06
carcinomanormal MRCA
age 70
normal MRCA adenoma
carcinomaMRCA
age 79 � � � � � � � � � � � � � � � � � � � � � � � � � � � � � � � � � � � � � �
�
� � �
� � � � � � � � �
� � � � � � � � � � � � � � � � � � � �
0 1e−06 2e−06 3e−06
carcinomaMRCA
age 84
age 84
age 83
� � � � � � � � � � � � � � � � � � � � � � � � � � � � � � � � � � �
� �
�
�
�
� �
�
� � �
� � � � � � � � � � � � � � � � � � � � �
� �
0 1e−06 2e−06 3e−06
carcinomaMRCA
� � � � � � � � � � � � � � � � � � � � � � � � � � � � � � � �
� �
� �
� �
�
�
�
�
�
� �
�
�
� � � � �
�
� � � � � � � � � � � � � � � � � �
0 1e−06 2e−06
carcinomanormalMRCA
APC p.K1462fs
p53 p.H154Y
% ti
med
SCN
As
% ti
med
SCN
As
% ti
med
SCN
As
% ti
med
SCN
As
% ti
med
SCN
As
% ti
med
SCN
As
p = 0.23p = 8.3e−05
p = 0.0079p = 0.053
p = 5e−04p = 0.0018

3.5. Application to data 86
Figure 3.5: Power to detect heterogeneous (non-catastrophic) timing of CNAs in WXSdata. Proportion of tests with significant P values (<0.05) based on testing1,000 simulated data sets assuming a uniform distribution of CNA mutationsover time. Dotted line indicates 80% power. Among the combinations testeddetection power was highest for the largest number of informative SNAs (100)distributed across the smallest number of CNAs (10).
●
●
●
●
●
●
●
●
●
●
20 40 60 80 100
0.0
0.2
0.4
0.6
0.8
1.0
SNAs
Pow
er
● ● ●●
●
●
●
●
●
●
● ● ● ● ●
●
●
●
●
●
● ● ● ● ● ●●
●
●
●
●
●
●
●
10 CNAs40 CNAs70 CNAs100 CNAs
showed that, as expected, the power to detect non-catastrophic CNA accumulation
increased with the number of informative SNAs, and decreased with the number of
CNAs across which these SNAs were distributed (Figure 3.5).
3.5.3 Application of timing model to whole exome sequencing
data in a study of colorectal cancer
I applied the exome data punctuated evolution test to 8 tumours (4 adenomas and
4 cancers) from the same study where multi-region whole exome sequencing data

3.5. Application to data 87
Table 3.2: Colorectal cancer whole exome sequencing data considered for CNA catastrophetest
Sample Sequencing Strategy Regions SequencedAdenoma 1 WES 6Adenoma 2 WES 4Adenoma 3 WES 5Adenoma 9 WES 6
Carcinoma 1 WES 5Carcinoma 6 WES 13Carcinoma 7 WES 8Carcinoma 8 WES 5
was available (see Table 3.2).
As above, I attempted to identify a subset of the regions of the genome that
were subject to specific types of CNAs in the last common ancestor of all tumour
samples, and to identify low and high frequency SNAs present at the time in those
regions. Due to noise associated with calling CNAs from exome data, which can
lead to incorrect copy number assignments due to the low numbers of mutations
providing information about the copy number state in each region (see Figure 3.2), I
relaxed the assumption for CNAs to be clonal in every sample. Instead I considered
regions where the most common copy number state across samples was one of the
states described in Cases I,II and III in Section 3.4, inferring that this was the state
in the last common ancestor of all tumour cells in these regions and that differences
in the inferred copy number were false.
For each ancestral CNA event, I found the SNAs that were clonal across re-
gions with the common copy state. For each such SNA, considering each tumour
sample with surviving evidence of the CNA, I tested the number of variant reads
of the clonal SNA for consistency with occurence before the CNA, and for consis-
tency with occurence after the CNA. Fisher’s method was used to combine tests of
the same hypothesis across tumour samples. I considered SNAs to be present early,
if the early hypothesis was not rejected, and the late hypothesis was rejected, and
vice-versa. I did not consider SNAs that were inconsistent with both the early and
late hypotheses (see Figure 3.6).
One adenoma could not be used for the test since there were no late SNAs

3.5. Application to data 88
Figure 3.6: For each SNA in a CNA region I tested the hypotheses that the SNA was early(before the CNA), and the hypothesis that the SNA was late (after the CNA). P-values generated for the same hypothesis across samples were combined usingFisher’s method. SNAs which were consistent with earliness and inconsistentwith lateness were classed as early – illustrative example shown in (A). SNAsinconsistent with both the early and late hypotheses were not considered for thetest – illustrative example shown in (B).
A) B)
●
●
●
0.0
0.2
0.4
0.6
0.8
1.0
Alle
le F
requ
ency
Sample 1 Sample 2 Sample 3
●●
●
●
●
●
●
●
●
Early ExpectationLate ExpectationObserved
●
●
●
0.0
0.2
0.4
0.6
0.8
1.0
Alle
le F
requ
ency
Sample 1 Sample 2 Sample 3
●●
●
● ● ●
●
●
●
Early ExpectationLate ExpectationObserved
found. The null hypothesis of chromosomal catastrophe was rejected in 1/3 adeno-
mas tested (P = 0.001, Table 3.3). The null hypothesis was not rejected in the other
two cases, albeit based on my simulations the test appeared underpowered, with
only 2-3 SNAs used for the test in these cases. One cancer could not be used as
there were no early SNAs found. The null hypothesis of catastrophe was rejected in
2/3 cancers (min (P) = 0.002), and not rejected in the other cancer (P = 0.772). This
cancer had a higher number of informative SNAs (51), albeit the power still appears
low based on my simulations. Additionally in this cancer 89% of SNAs occured
before the CNAs, consistent with late occurence of many CNAs recently before the
last clonal expansion. Notwithstanding the low power, the failure of 1/3 cancers to
reject the null hypothesis of punctuated evolution is consistent with the hypothesis

3.5. Application to data 89
Table 3.3: Application of test for punctuated CNA evolution to colorectal cancer exomes
Sample Number CNAs Number SNAs PAdenoma 2 37 2 1.00Adenoma 3 61 54 0.001Adenoma 5 32 3 1.00Adenoma 9 18 1 NA
Carcinoma 1 96 51 0.772Carcinoma 6 77 1 NACarcinoma 7 51 17 0.048Carcinoma 8 71 48 0.002
Table 3.4: IBD-associated-colorectal cancer whole exome sequencing data considered forCNA catastrophe test
Sample Sequencing Strategy Regions SequencedH1195 WES 2H1331 WES 2
Oxford IBD1 WES 4Oxford IBD2 WES 5
STM003 WES 2STM005 WES 2STM006 WES 2STM007 WES 2STM008 WES 2UCL001 WES 2
that some colorectal cancers show evidence of punctuated bursts of copy number
change.
3.5.4 Application of timing model to whole exome sequencing
data in a study of IBD-associated-colorectal cancer
I applied the catastophe test to 10 tumours (10 cancers) with multi-region whole
exome sequencing data from a study of IBD-associated colorectal cancer, (see Table
3.4). The data was processed as described above in section 3.5.3
Four tumours were not considered due to having no early SNAs or no late
SNAs. The null hypothesis of a chromosomal catastrophe was not rejected in any
of the six cases where the test was applied (min (P) = 0.176, Table 3.5). These
data suggest that chromosomal catastrophes may be commmon in IBD-associated
colorectal cancer, in as much as the test is powered to reject the null hypothesis.

3.6. Conclusion 90
Table 3.5: Application of test for punctuated CNA evolution to IBD-associated colorectalcancer exomes
Sample Number CNAs Number SNAs PH1195 41 34 0.176H1331 39 96 0.275
Oxford IBD1 56 37 0.448Oxford IBD2 25 12 1.00
STM003 38 14 0.714STM005 38 0 NASTM006 34 17 1.00STM007 4 0 NASTM008 44 1 NAUCL001 36 37 NA
3.6 Conclusion
Here, I developed an adapted method to time the accumulation of CNAs in tumour
samples. I also developed a test to assess the hypothesis that all CNAs occurred
simultaneously in a tumour sample, designed to be applied to WXS data. I applied
these models to data from multi-region sequencing studies of sporadic colorectal
cancer and IBD-associated colorectal cancer that are ongoing in our laboratory. The
results suggest that punctuated evolution is a common feature of sporadic colorec-
tal cancer, and that a model of more gradual CNA accumulation also occurs in
some samples. Punctuated evolution may also be a feature of IBD-associated col-
orectal cancer. Interestingly, our analysis of WGS data found catastrophic CNA
accumulation shortly before the last common ancestor of all tumour cells, suggest-
ing a potential role for these catastrophic events in cancer causation. As to the
causative mechanism of these punctuated copy number events, the large number
of chromosomes affected indicates that WGD events are a likely explanation for
many of the punctuated events described in the whole-genome sequenced samples.
However, the causative mechanism cannot be definitively determined from our data
alone. Taken together the results support the hypothesis that catastrophic genome-
disruption events can occur in the colon during the progression to cancer and play
an important role in disease, but do not explain all CNAs that occur during the
progression to cancer.

3.6. Conclusion 91
The joint timing method developed represents a potentially useful comple-
ment to existing methods; albeit the advantage over other methods appears to be
more limited than I had hoped. The method combines information from across
the genome to jointly estimate the timing of multiple CNAs. Initially I was un-
der the impression that this approach could lead to more accurate timing of CNAs
(narrower confidence intervals) than existing methods that time CNAs individually.
Based on a recent re-evalution of the literature it appears that the method of Purdom
and colleagues [Purdom et al., 2013] is as accurate as my method in terms of esti-
mation of the relative time of CNAs as a fraction of the total age of the cell lineage.
However, to the extent that the parameters estimated here, (t,T), which give a sense
of the absolute timing of CNAs, are of interest, then my approach will give more
accurate estimates than other methods. Although, often the relative timing of CNAs
is likely to be of most interest, the estimated total mutation time t of CNAs may be
of interest in linking chromosomal instablity to choronological age. In this regard,
recent studies giving accurate estimates of SNA mutation rates in non-dysplastic
tissue would be of use [Alexandrov et al., 2015].
The whole exome data timing test, although of interest, appears to suffer from
a lack of power in most contexts. The applications presented of the WXS timing test
provide interesting complementary information to the joint timing method. How-
ever, the low power of the test due to the relatively few SNAs within CNAs in WXS
data, combined with the difficulty in accurately assigning copy number states to
WXS samples, means that the extra information provided by this test is limited. As
a result, we decided not to focus on further development and applications of this
test.
While methods that use SNAs as a molecular clock to time CNAs can provide
important insight into CNA accumulation, it is worth noting that these methods
make several important assumptions. First, I have assumed that the SNA muta-
tion rate is constant over time (as well as across genomic regions). To the ex-
tent that this assumption is violated then the timing estimations here are expected
to be skewed. To illustrate this, suppose that SNAs occur at an accelerating rate

3.6. Conclusion 92
during tumorigenesis (the SNA clock starts to run faster). It is likely that this
will lead to overestimation of the times between later events. Secondly, since
the SNA mutation rate is assumed to be constant, I assume a fortiori that the
per base pair SNA mutation rates are independent of CNA accumulation. There
is some evidence to support this, in the case of whole genome doublings, where
the per chromosome point mutation rate appears to be unchanged before and af-
ter doubling events in vitro [Dewhurst et al., 2014]. However, there is also evi-
dence to suggest that rupture of the nuclear envelope which has been associated
with chromothripsis [Zhang et al., 2015], can also lead to point mutations due to
APOBEC [Sansregret et al., 2018]. Thirdly, I have assumed that mutation rates
are constant across regions considered. This assumption is likely to be incor-
rect; multiple studies have found variation in mutation rates across the genome
[Lawrence et al., 2013, Makova and Hardison, 2015]. The issue is likely to be par-
tially mitigated by considering only large CNAs (above a length threshold). How-
ever, we cannot rule out possible biases to our results due to this assumption. Fi-
nally, and relatedly, I make the assumption that SNA mutations are neutral (i.e. their
rates of accumulation are not affected by selection).
The assumption that the majority of SNAs in cancer genomes are effectively
neutral is well supported by data [Williams et al., 2016] and is a common assump-
tion in the literature [Tomasetti et al., 2013]. Concerns stemming from the first
two assumptions could be partially mitigated in future work by considering re-
stricted classes of SNA mutations for which there is stronger evidence of clock-
like accumulation. C>T mutations where the C base is followed by a G base
in genomic sequence are good candidates to consider based on current data due
to their prominence in signature 1 which is clock-like with age in normal tissue
[Blokzijl et al., 2016] and their relative rarity in the APOBEC-associated signatures
2 and 13. Overall, the assumption of constant SNA mutation rates is important to
bear in mind for applications of this model, but adjustments might be possible to
limit their impact in future work.
In all, the results of this chapter provide novel information on CNA mutation

3.6. Conclusion 93
accumulation in colorectal cancer, and develop methods that may be of use in future
research into the biology of CNA accumulation.

Chapter 4
POLE mutations are early events in
colorectal cancer and endometrial
cancer
The work in this chapter is now published in the Journal of Pathology
[Temko et al., 2018].
4.1 PrecisMutations in the POLE gene affecting the polymerase epsilon proofreading domain
(POLE proofreading mutations) predispose to a range of cancer types, including
colorectal and endometrial cancer. POLE proofreading mutations also occur so-
matically in several tumour types. Tumours with POLE mutations are ultra-mutated
(with a distinctive mutational signature). In addition, POLE proofreading mutations
are associated with an improved prognosis and a high immune infiltrate, features
which are probably related to high neo-antigen burden. The timing of POLE mu-
tations is currently unknown, but may cast light on tumour-immune dynamics, and
is of clinical interest. Here, I first present a model that relates the complement
of driver mutations found in a tumour to the timing of mutation processes during
tumour growth. Secondly I analyse the timing of somatic POLE proofreading mu-
tations in a combined cohort of colorectal and endometrial cancers, including six
tumours subjected to whole genome sequencing and public mutation data from 32

4.2. Contribution 95
tumours analysed with a combination of whole genome and whole exome sequenc-
ing. I first provide evidence that POLE mutations are often clonal, in all tumour
cells. I then apply the model developed earlier in the chapter to driver mutations in
these samples. The results suggest that POLE mutation often occurs early relative
to key driver mutations. These results provide an insight into the temporal acqui-
sition of genetic instability in POLE-mutant tumours and the influence of mutation
and selection on cancer genomes.
4.2 ContributionI conducted the analyses in this chapter and developed the mathematical model.
DNA sequencing library preparation was carried out by Dr Ann-Marie Baker. I
wrote the text in this chapter, with the following exceptions: (i) I did not write the
sections of the Methods on DNA sequencing, ethics and definition of driver genes.
(ii) Dr David Church provided input to the parts of the Methods sections “POLE
consensus mutational signature scores in driver genes” and “Clonality of POLE
mutations”
4.3 IntroductionIn 2013, Ian Tomlinson’s group and collaborators identified two mutations in
the genes POLE and POLD1, namely POLE L424V and POLD1 S478N, that
predispose to colorectal cancer [Palles et al., 2013]. POLE and POLD1 encode
subunits of the DNA replicases polymerase epsilon (Polε) and polymerase delta
(Polδ ), respectively [Rayner et al., 2016]. The mutations identified are within
the proofreading, or exonuclease, domains of the respective genes, which encode
the ability to remove mis-incorporated bases from the newly synthesised DNA
strands [Briggs and Tomlinson, 2013]. Since this initial publication, multiple other
pathogenic germline mutations have been identified in the POLE and POLD1 proof-
reading domains, predisposing to a range of tumour types including pancreatic can-
cer, as well as colorectal cancer and endometrial cancer [Rayner et al., 2016].
Somatic POLE exonuclease domain mutations (EDMs) are also found in a
range of tumour types, with distinct molecular features. Whereas somatic POLD1

4.3. Introduction 96
Figure 4.1: Mutations in the POLE gene are associated with a mutational signature,whereby C>A mutations in the TCT context (referred to as TCT>TATmutations) and C>T mutations in the TCG context (referred to asTCG>TTG mutations) each account for more 20% of SNAs. Data fromhttp://cancer.sanger.ac.uk/cosmic/signatures
AC
A>
AA
AA
CC
>A
AC
AC
G>
AA
GA
CT
>A
ATC
CA
>C
AA
CC
C>
CA
CC
CG
>C
AG
CC
T>
CAT
GC
A>
GA
AG
CC
>G
AC
GC
G>
GA
GG
CT
>G
ATT
CA
>TA
AT
CC
>TA
CT
CG
>TA
GT
CT
>TA
TA
CA
>A
GA
AC
C>
AG
CA
CG
>A
GG
AC
T>
AG
TC
CA
>C
GA
CC
C>
CG
CC
CG
>C
GG
CC
T>
CG
TG
CA
>G
GA
GC
C>
GG
CG
CG
>G
GG
GC
T>
GG
TT
CA
>T
GA
TC
C>
TG
CT
CG
>T
GG
TC
T>
TG
TA
CA
>AT
AA
CC
>AT
CA
CG
>AT
GA
CT
>AT
TC
CA
>C
TAC
CC
>C
TC
CC
G>
CT
GC
CT
>C
TT
GC
A>
GTA
GC
C>
GT
CG
CG
>G
TG
GC
T>
GT
TT
CA
>T
TAT
CC
>T
TC
TC
G>
TT
GT
CT
>T
TT
ATA
>A
AA
ATC
>A
AC
ATG
>A
AG
ATT
>A
ATC
TA>
CA
AC
TC
>C
AC
CT
G>
CA
GC
TT
>C
ATG
TA>
GA
AG
TC
>G
AC
GT
G>
GA
GG
TT
>G
ATT
TA>
TAA
TT
C>
TAC
TT
G>
TAG
TT
T>
TAT
ATA
>A
CA
ATC
>A
CC
ATG
>A
CG
ATT
>A
CT
CTA
>C
CA
CT
C>
CC
CC
TG
>C
CG
CT
T>
CC
TG
TA>
GC
AG
TC
>G
CC
GT
G>
GC
GG
TT
>G
CT
TTA
>T
CA
TT
C>
TC
CT
TG
>T
CG
TT
T>
TC
TAT
A>
AG
AAT
C>
AG
CAT
G>
AG
GAT
T>
AG
TC
TA>
CG
AC
TC
>C
GC
CT
G>
CG
GC
TT
>C
GT
GTA
>G
GA
GT
C>
GG
CG
TG
>G
GG
GT
T>
GG
TT
TA>
TG
AT
TC
>T
GC
TT
G>
TG
GT
TT
>T
GT
POLE−associated Signature
0.0
0.2
Pro
port
ion
of M
utat
ion
Type
EDMs are rare, somatic POLE EDMs are found in 7-12% of endometrial cancers
and 1-2% of colorectal cancers, and are also reported in cancers of the brain, breast
stomach and pancreas, reviewed in [Rayner et al., 2016]. POLE EDMs are asso-
ciated with a distinctive mutator phenotype, occuring in tumours with very high
mutation burden and an excess of C>A mutations; the most common somatic mu-
tation, POLE P286R occurs in tumours with a median of 5,147 exonic mutations, in
93% of which over one fifth of mutations are C>A changes [Rayner et al., 2016].
Some of these mutator mutations have been shown to disrupt polymerase activity
in model systems or occur in a conserved region of DNA sequence. In these cases
there is good evidence that the mutation is pathogenic, i.e. disrupts polymerase
function leading to a strong mutator phenotype. POLE mutation is associated with
Alexandrov Signature 10 [Alexandrov et al., 2013a] (Figure 4.1).
A number of studies suggest that tumours with POLE somatic EDMs (EDMs
hereinafter) have relatively good outcomes. Church et al. investigated survival in
a large endometrial cancer cohort of 788 patients, 48 of which had POLE EDMs,
and all of which underwent some form of radiation therapy [Church et al., 2015].
The authors found that among grade 3 tumours (109/788 tumours analysed) POLE-
mutant tumours had significantly greater recurrence free survival compared to

4.3. Introduction 97
POLE-wild type tumours of matched grade in a multivariate analysis. Sev-
eral other studies have found an association between POLE-mutation and im-
proved outcome in endometrial cancer [Kandoth et al., 2013, Meng et al., 2014,
Talhouk et al., 2015]; with one study finding no association, likely due to be-
ing underpowered [Billingsley et al., 2015]. However, at present there are insuf-
ficient data to assess whether the independent association of POLE mutation status
and positive prognosis extends beyond grade 3 tumours to lower-grade tumours,
or importantly, holds in the absence of adjuvant treatment. Early data from a
study with six POLE-mutant tumours suggests a similar trend may hold in glioma
[Erson-Omay et al., 2015]. Further data will be important to back up these promis-
ing findings.
Relatedly, several studies have shown POLE-mutant tumours have a high level
of immune infiltration, which may be related to ultramutation. High levels of in-
filtrating immune cells have been observed in POLE-mutant endometrial cancers
[Hussein et al., 2015, van Gool et al., 2015] and glioma [Erson-Omay et al., 2015]
et al. In their study Van Gool et al also presented evidence that CD8+ T-Cells are
enriched in POLE-mutant endometrial cancer compared to MSS comparators, and
(in the central tumour region) compared to MSI comparators. As explained in Chap-
ter 1, there is a correlation between predicted neo-antigen burden, inferred cytotoxic
T cell response, and prognosis, across tumour types [Brown et al., 2014]. Therefore
increased neo-antigen load, due to raised mutation rates, is one possible explanation
for the immune infiltrate, and indeed for the good prognosis.
The timing of POLE EDMs during tumour evolution is therefore of key in-
terest. As explained in the Introduction, the dynamics of mutation accumulation –
the mutation rate – appears to be an important determinant of tumour evolutionary
trajectory, including immune response. The timing of POLE mutation could cast
light on this important relationship. In addition, to the extent that POLE mutations
occur early and drive tumorigenesis, they are of potential interest for targeting and
early intervention (see Introduction).
Theoretical considerations support a hypothesis that POLE EDMs occur early.

4.3. Introduction 98
The implication of germline proofreading domain mutations in cancer predispo-
sition makes it plausible that somatic EDMs could be found as the first event in
a sequence of somatic mutations leading to cancer [Rayner et al., 2016]. In addi-
tion, although identifying selected genes in samples with high mutation rates is
particularly difficult [Martincorena et al., 2017], the recurrence of certain ’hotspot’
mutations, such as POLE P286R, suggests these mutations are under positive selec-
tion. Indeed, the Cancer Genome Atlas (TCGA) study of endometrial cancer found
POLE to be a ’significantly mutated gene’ [Kandoth et al., 2013]. Mutations under
positive selection may play a role in the earliest stages of disease, and indeed driver
mutations have been found to be predominantly clonal in a pan-cancer analysis
[McGranahan et al., 2015]. Finally, tumours with POLE EDMs have a distinctive
pattern of mutations in driver genes [Church et al., 2013, Palles et al., 2013]. And
links have been drawn between the distinctive spectrum of mutations in driver genes
and the POLE mutational signature [Shinbrot et al., 2014]. In endometrial cancer,
among other differences, cancers with POLE EDMs have a higher frequency of
PTEN codon 130 mutations than those cancers without POLE or POLD1 muta-
tions [Church et al., 2013]. In colorectal cancer, POLE-mutant cancers have an in-
creased frequency of APC R1114X mutations [Briggs and Tomlinson, 2013]. Since
the genes PTEN and APC are thought to be mutated early in endometrial and col-
orectal cancer respectively, these differences could suggest that POLE mutations
occur as early events. However, it may also be possible that initial pathogenic mu-
tations to these genes that occur before POLE mutation are drowned out by later,
frequent, mutations bearing the POLE mutational signature.
There is currently limited data on the timing of POLE EDMs during cancer
evolution. Shlien et al. analysed variant allele frequencies of seven POLE muta-
tions in brain tumours that developed on a genetic background of inherited defects
in mismatch repair genes. The results suggest that POLE mutations were clonal in
these tumours, occurring before the last ancestor of all tumour cells. Erson-Omay
et al. found evidnece that POLE mutations were clonal in five out of six gliomas,
two of which, similarly, developed on a genetic background of mismatch repair de-

4.3. Introduction 99
fects [Erson-Omay et al., 2015]. A recent large-scale targeted sequencing study of
cancers with mutator phenotypes used mutation variant allele frequencies to argue
that POLE mutations were early events in a subset of cases [Campbell et al., 2017].
However, this study did not have matched normal samples and was unable to distin-
guish somatic and germline mutations. Very recently, a single example of a POLE
EDM shared between an endometrial cancer and a likely precursor lesion was found
[Miyamoto et al., 2018]. Overall, limited data suggests that POLE mutations may
often occur before the last common ancestor of all tumour cells, but the timing
of POLE mutations relative to other clonal mutations has not been systematically
analysed.
The mathematical model presented in this chapter represents a formalisation
of long-standing ideas. The mutational signatures framework presented by Alexan-
drov et al. [Alexandrov et al., 2013a] is based on the notion that mutations in can-
cer genomes bear the signatures of mutational processes. By the same reasoning,
the specific cancer-causing mutations in individual samples are also influenced by
mutational processes. In fact, both of these ideas long predate the mutational sig-
natures study of Alexndrov et al. [Greenblatt et al., 1994]. Early studies to identify
mutational signatures in cancer were based on sequencing the driver gene TP53
[Greenblatt et al., 1994]. Multiple studies, summarised in [Greenblatt et al., 1994]
took advantage of the high frequency of mutations in this gene, using compara-
tively low-throughput Sanger sequencing, to gain early indications of the signatures
of Ultraviolet (UV) radiation and the mutagen aflatoxin. Based on similar ideas,
Homfray et al. [Homfray et al., 1998] and Sarebo et al. [Sarebo et al., 2006] car-
ried out an informal analysis of the spectrum of mutation in driver genes to assess
the likelihood that certain mutation processes were operative at the time when these
driver genes were mutated. Alexandrov and colleagues formalised the dependence
of the spectrum of neutral mutations in cancer samples on mutational processes, but
did not consider the effects of selection. Here, we make progress towards formalis-
ing the alternate contributions of mutation and selection to determining the specific
cancer-causing mutations found in individual tumour samples.

4.4. Methods 100
4.4 Methods
4.4.1 Mutational signature framework
Below, I introduce the model that is relied upon in [Alexandrov et al., 2013b] and
used in both this chapter and chapter 5. Here, I develop the model using the 96
mutation classes described in Chapter 1. However, any mutation classification can
be used.
We assume that mutations in cancer genomes are generated by a finite num-
ber of muational processes Πi, 1 ≤ i ≤ n. Let µ j(Πi, t,G), 1 ≤ j ≤ 96 be the
rate of mutation type j under process Πi in a given tumour at time t, consider-
ing genomic sequence G. Now define p j(Πi,G) = µ j(Πi, t,G)/∑96k=1(µk(Πi, t,G)).
For a given process and genomic sequence, the p j(Πi,G) are assumed to be
invariant over time and across tumours, and the 96-element vector p(Πi,G) =
(p1(Πi,G), p2(Πi,G), ..., p96(Πi,G)) is referred to as the mutational signature of
process Πi for the genomic sequence G. Additionally, for a given tumour we define
the activity of Πi between times t1 and t2 for genomic sequence G, αi(t1, t2,G) =∫ t2t1 ∑
96k=1(µk(Πi, t,G))dt. And the exposure to Πi between t1 and t2 for genomic
sequence G is then defined as, ei(t1, t2,G) = αi(t1, t2,G)/∑nk=1(αk(t1, t2,G)).
The relevant sequence G is not always stated explicitly when referring to a mu-
tational signature, or to the activity or exposure of a mutational signature in a tumour
sample. Unless otherwise stated, or clear from the context, mutational signatures
and their activities and exposures given here are stated based on equal trinucleotide
frequencies (i.e. a genomic sequence G with sites at which each mutation type can
occur present in equal proportions). On another definitional point, I will sometimes
refer to the activity, or exposure, of a mutational signature as a convenient shorthand
for the activity or exposure of the mutational process associated with that signature.
Mutational signatures have been reported for 30 mutational processes in the
human genome (http://cancer.sanger.ac.uk/cosmic/signatures). Under the assump-
tion that these signatures represent the complete set of mutational processes, the
spectrum of mutations across the 96 types in a cancer genome can be viewed as be-
ing generated by a linear combination of of these signatures. Specifically, defining

4.4. Methods 101
M j as the random variable describing the number of mutations of type j accumu-
lated in a tumour genomic sequence G between times t1 and t2, then the expectation
of this variable is given by
E(M j) =n
∑k=1
αk(t1, t2,G)p j(Πk,G)
Therefore the reported signatures can be used in conjunction with the spectrum
of mutations in a tumour sample to estimate the activities of individual processes in
individual tumour samples.
Finally, we note that a mutational signature of a process Πi quoted in terms
of a genomic sequence G can be transformed to the mutational signature of the
same process, with respect to another genome H, in the following way. Let g j
be the number of sites in sequence G where a mutation of type j is possible, and,
similarly, let h j be the number of sites in sequence H at which a mutation of type j
is possible 1 ≤ j ≤ 96. Then the mutational signature of Πi in terms of H is given
by S(Πi,H) = (p1(Πi,H), p2(Πi,H), ..., p96(Πi,H)), where
p j(Πi,H) =p j(Πi,G)(h j/g j)
∑96k=1 pk(Πi,G)(hk/gk)
And similarly, the activity of process Πi between t1 and t2 for genome G can
be transformed to the activity of the same process between t1 and t2 with respect to
genome H, using the formula
αi(t1, t2,H) = αi(t1, t2,G)96
∑k=1
pk(Πi,G)(hk/gk)
4.4.2 Tumour growth model
Following Tomassetti [Tomasetti and Vogelstein, 2015] we make the simplify-
ing assumption that a given mutation Mi occurs at a constant low rate µi per
year, µi � 1. Suppose that after the occurrence of the mutation sequence R =
〈M1,M2, ...,Mn〉, cancer occurs with constant rate λ � 1. Then, by well-known re-
sults [Tomasetti and Vogelstein, 2015, Armitage and Doll, 1954], the probability of
cancer incidence at time t is given by:

4.4. Methods 102
I(t) =µ1µ2...µntnλ
n!
Extending this framework to take into account cancer causation by multiple
sequences of mutations S j =< M1( j), ...,Mn( j) >, with rate λ j. Cancer incidence
at time t is given by
I(t) = ∑j
µ1( j)µ2( j)...µn( j)λ jtn
n!
The above closely follows [Tomasetti and Vogelstein, 2015].
Definition: - Mutations M1 and M2 are similar with relative risk r12 if they
satisfy the following property: A mutation sequence S j containing M2 causes cancer
with rate λ j, just if the mutation sequence Sk, that results from substituting M1 for
M2 in S j, causes cancer with rate λk = r12λ j. Mutations are said to be equivalent if
they are similar with relative risk 1.
We note that by this definition all cancer-causing mutations are trivially equiv-
alent to themselves.
Now consider a set of similar mutations A = {Mi : 1 ≤ i ≤ n}. Let ri j be the
relative risk of mutation Mi compared to mutation M j. Then the probability that Mi
occurs in a cancer sample, given that one of these mutations occurs is given by:
P(Mi|A) =µi
∑nj=1 µ jr ji
(4.1)
4.4.3 Likelihood of a cancer mutation on the background of a
mutational signature
Let B= {Mi,M2, ...,M j} be the full set of cancer-causing mutations in a single gene.
Define c(M) as the type of mutation M among the 96 possibilities, referred to as the
‘causal channel’ of M . Let S = (p1, ..., p96) be the mutational signature active in
a tumour sample rescaled to a genome with equal trinucleotide frequencies (i.e. a
genome where the number of sites where each mutation type can occur is equal).
We make the following two simplifying assumptions, the appropriateness of which

4.4. Methods 103
are discussed in Section 4.6:
Assumption 1: The mutations in B are uniformly distributed across the 96 mu-
tation channels (irrespective of the frequency of the channels in the genome)
Assumption 2: All mutations in B are equivalent, in the sense defined above
Then based on Equation 4.1 we can give the probability of the tumour sample
harbouring a mutation from B with a given causal channel, c, given that it harbours
a mutation from B.
P(M ∈ B,c(M) = c|B) = pc
Put another way, we can express the likelihood of observing a mutation in B
with causal channel c (the data), given that there is some mutation in B, in terms of
the mutational signature of the sample
L (c,S) = pc (4.2)
A concrete example can help to illustrate the approach. Suppose that a col-
orectal cancer sample includes a KRAS mutation with causal channel (ACC>ATC)
(KRAS G12D, is one possible such KRAS mutation). Under the assumptions above,
the likelihood of observing a mutation in KRAS with this causal channel on the back-
ground of the POLE-associated mutational signature, given that there is a cancer-
causing KRAS mutation, is equal to the probability of the (ACC>ATC) channel in
the signature.
4.4.4 POLE heuristic mutational signature score
We were interested in using the causal channels of mutations in driver genes to as-
sess the likelihood that all the mutations in the gene occurred on the background of
the POLE mutational signature. To this effect we devised a score for each driver
gene with at least one mutation in a sample. We assume that at any time during
the development of POLE-mutant samples there are three possible mutational sig-
natures active:
(i) S0 = (p0,1, p0,2, ..., p0,96) (POLE-mut signature) is active on a background

4.4. Methods 104
of POLE mutation
(ii) S1 = (p1,1, p1,2, ..., p1,96) (MSI signature) is active on a POLE-wild type
and microsatellite unstable background
(iii) S2 = (p2,1, p2,2, ..., p2,96) (MSS) is active on a POLE-wild type and mi-
crosatellite stable background
Thus we assume that, when present, the signal of mismatch repair de-
fects dominates; except when there is a pathogenic POLE mutation, in which
case the POLE mutational signature dominates. We assume that there is a sin-
gle MSS signature for convenience. However, in reality, this group is likely
to contain considerable variation among samples. This is especially relevant
in endometrial cancer, where APOBEC-linked mutational processes are reported
(https://cancer.sanger.ac.uk/signatures/matrix.png). This heterogeneity is not ex-
pected to greatly influence the modeling conclusions - albeit refining of the three
mutational signature framework would be a potential area for future development.
Given a putative driver gene, D, with n mutations, U={M1,M2, ...,Mn}, in a
sample, we define the POLE mutational signature score of the gene, s(D), as
s(D) = log(
mini∈{1,...,n}
(min(
L (ci,S0)
L (ci,S1),L (ci,S0)
L (ci,S2))))
(4.3)
where ci is the causal channel of mutation Mi
Note that this heuristic score is similar to a likelihood ratio. However, since
there are two possible background signatures (other than POLE-mut) and may be
more than one possible causal mutation (n > 1), the minimum (most conservative)
likelihood ratio out of all the possible comparisons is used for the score. It is useful
in terms of interpretation to note that the heuristic score has the property that if
s(D)> 0 then for all mutations in D the most probable background for the mutation
is the POLE-mut signature.
Under the assumptions above and using 4.2, we can calculate 4.3 using
s(G) = log(
mini∈{1,...,n}
(min(
p0,ci
p1,ci
,p0,ci
p2,ci
)))

4.4. Methods 105
Table 4.1: POLE-mutant tumours
Sample Sequencing StrategyOXF 001 WGS
POLE 040 WGSPOLE 049 WGSPOLE 072 WGSPOLE 147 WGSBIR 001 WGS
4.4.5 Ethical approval
Patient consent for research on tumour tissue was obtained at the recruiting centres
under local ethical approval. Molecular analysis of anonymised tissue was per-
formed under Oxford Research Ethics Committee A approval (05/Q1605/66).
4.4.6 Patients and tumour samples
Six fresh frozen tumours with pathogenic somatic POLE mutations (five endome-
trial, one colorectal) were identified from a Leuven endometrial cancer cohort used
in a previous study [Church et al., 2015], a prospective clinical sequencing pro-
gramme (HICF2) at the University of Oxford, or the University of Birmingham
tissue bank (Table 4.1). TCGA colorectal (COADREAD) [TCG, 2012] and en-
dometrial (uterine corpus endometrial carcinoma - UCEC) [Kandoth et al., 2013]
cancer data were downloaded from the Genomic Data Commons (GDC) Data Por-
tal (https://portal.gdc.cancer.gov; June 2017). Molecular analyses were performed
on a single tumour region in each case.
4.4.7 DNA extraction
After review to confirm adequate tumour cellularity, DNA was extracted from fresh
frozen or microdissected FFPE tumours and precursors using standard methods
(Roche FFPE-T DNA kit, Machery Nagel Nucleospin DNA FFPE XS / FFPE DNA
kit or Qiagen Blood and Tissue kit) and resuspended in buffer or water.
4.4.8 DNA sequencing
DNA from fresh frozen endometrial tumours and paired normal samples for whole
genome sequencing (WGS) was quantified using the Qubit 2.0 fluorometer (Life

4.4. Methods 106
Technologies, Paisley, UK), and fragmented using the Covaris M220 ultrasonicator
(Covaris, Inc., Woburn, MA) to an average fragment size of 250-300bp. Approx-
imately 50ng was used as input for the NEBNext Ultra DNA Library Prep Kit for
Illumina (New England Biolabs, Hitchin, UK). Libraries were prepared as per the
manufacturer’s guidelines, with size selection for a 250bp insert size, dual index-
ing and 9 cycles of library amplification. Libraries were sequenced to a median
depth of 50x on Illumina’s HiSeq X Ten (150bp paired end reads) at BGI Tech
Solutions Ltd, Hong Kong. Sequenced reads were aligned to the ’hg19’ human
genome assembly using bwa-mem [Heng and Durbin, 2009] (see Methods, Chap-
ter 7). Somatic mutations were called from DNA sequencing data using Mutect2
[Cibulskis et al., 2013]. Variants flagged as ‘PASS’ or ‘clustered events’ were ac-
cepted as somatic. Variants were annotated using Annovar [6]. Copy number pro-
files were derived using Sequenza [Favero et al., 2015] for a subset of samples,
and manually curated to remove probable model artefacts. DNA from the col-
orectal cancer was prepared for WGS using the Truseq PCR-free library prepa-
ration kit (Illumina) as per manufacturer’s guidelines and sequenced on an Illumina
HiSeq 2500. Sequenced reads were aligned to the GrCh37 reference genome using
the Isaac aligner [Raczy et al., 2013], and variant calling performed using Strelka
[Saunders et al., 2012].
Somatic mutations in TCGA cancers were called from BAMs using Mutect2
[5]. Additional cases from the TCGA COADREAD and UCEC data sets were
downloaded as Mutect Mutation Annotation Format (MAF) files from the GDC
Data Portal. Variant annotation and model curation was performed as for the WGS
cases.
4.4.9 Definition of driver genes
Driver genes were defined using the IntOGen driver gene repository (https://-
www.intogen.org/search) and included both PanCancer (Pooled driver) and tumour
type-specific (perProject driver) variants [Gonzalez-Perez et al., 2013]. High con-
fidence driver mutations (defined as either truncating mutation in genes likely to be
tumour suppressors or recurrent missense mutations in any endometrial or colorec-
4.4. Methods 107
tal cancer-specific or pan-cancer gene from the IntOGen set), were determined for
a subset of driver genes by manual curation, blinded to tumour molecular charac-
teristics.
4.4.10 Clonality of POLE mutations
36 of 38 endometrial and colorectal cancers with pathogenic POLE mutations were
disomic at the POLE locus (chr12q24) and were informative for clonality analysis.
Of these, 20 of 22 endometrial cancers, and 12 or 14 colorectal cancers had available
copy number annotation. As all 32 of these showed near-diploid genomes (> 80%
of the genome), we assumed diploid genomes for the four remaining cases.
Mutations were filtered to include only autosomal variants in diploid regions
of the genome, with depth of at least 20x. Mutation allele frequency distributions
were generated using the R ‘histogram’ function, and tumour cellularity inferred
as twice the mid-point of the allele frequency bin with highest mutation density,
excluding bins with a lower bound below allele frequency 0.1. These values were
then subjected to manual curation. The hypothesis that the mutation was present in
every tumour cell was tested by a one-sided binomial test, based on the numbers of
reference and variant reads at the POLE mutation site and the inferred tumour cel-
lularity. Specifically, for a mutation with coverage R, in a tumour with cellularity C,
the number of variant reads was modelled as a random variable X , with distribution:
X ∼ Bin(R,C/2).
In each case we calculated the probability, p, of finding the observed number
of variant reads, v, or fewer, P(X ≤ v). Mutations were considered subclonal for
p≤ 0.05.
4.4.11 Classification of SNAs to a mutational processes
Previously reported mutational signatures based on the trinucleotide frequen-
cies of the human genome were obtained from http://cancer.sanger.ac.uk-
/cosmic/signatures/ on 1st June 2017. In each tumour mutations were classified
into 96 categories following Alexandrov [Alexandrov et al., 2013a] (Cosmic Signa-

4.4. Methods 108
tures). Non-negative least squares regression, implemented in the R package ‘nnls’
[Katharine M. Mullen, 2012], was used to model the counts of mutations across
categories in each tumour as a linear combination of the Cosmic Signatures. For
cases analysed by whole exome sequencing, mutational signatures were rescaled
to exonic trinucleotide frequencies before conducting the regression. For this anal-
ysis, only mutational signatures previously reported as active in that cancer type
(endometrial signatures 1, 2, 5, 6, 10, 13, 14 and 26; colorectal signatures 1, 5, 6,
and 10) were used for the regression. A mutational process was deemed to have
been active in the life-history of a tumour if the associated mutational signature
had a coefficient of at least 2 per cent of the total coefficients in the best-fitting
model. Mutations likely to be due to POLE exonuclease domain mutation (POLE),
APOBEC upregulation (APOBEC) or deficient DNA mismatch repair (dMMR)
were identified by considering mutational signatures as multinomial probability
distributions. The probability of the causal channel of each mutation under all
mutational processes active in that tumour was calculated, and mutations were
assigned to a particular mutational process in cases where the probability of the
mutation causal channel under that process was at least twice the probability under
any other process.
4.4.12 POLE consensus mutational signature scores in driver
genes
Tumour mutations were obtained from calling based on tumour/normal .bam files
(POLE mutant cases) or TCGA MAF files (MMR-P, MMR-D cases), and classi-
fied into 96 categories following Alexandrov [Alexandrov et al., 2013a]. For each
tumour, the distribution of mutations across the 96 types was found (i.e. the pro-
portion of mutations in the sample falling into each category) as an estimate of the
sample-specific active mutational signature. The signatures for each sample were
then rescaled to equal trinucleotide frequencies. Tumours were categorised into
three groups according to POLE mutation and mismatch repair status (i.e. POLE-
mutant, MMR-P and MMR-D), and a consensus mutational signature was calcu-
lated for each group as the average of the rescaled sample-specific signatures among

4.5. Results 109
samples in the group, weighted by the number of mutations in each sample. The
probability of all non-silent mutations (‘nonsynonymous SNV’, or ‘stopgain’) in
driver genes (as defined above) under each of the three consensus mutational signa-
tures was then calculated, and the ratio of the probability of each mutation under the
POLE consensus mutational signature compared to that under each of the other two
consensus mutational signatures was obtained. For each individual gene, a ‘POLE
score’ was then calculated as the base two logarithm of the minimum value of these
ratios across all the non-silent mutations within that gene.
4.5 Results
4.5.1 Whole genome sequencing
As expected, all tumours were highly mutated (122 mutations per megabase (Mb) to
731 mutations per Mb). All samples showed a preponderance of TCT>TAT muta-
tions (Figure 4.2), as expected based on the POLE-associated mutational signature.
4.5.2 POLE mutations often occur before the last common an-
cestor of all tumour cells
In all six cases the number of reads supporting the POLE mutation was consistent
with the mutation being clonal (present in every tumour cell) (Figure 4.3, Table 4.2).
I also analysed the allele frequencies of mutations that could be probabilistically as-
signed to a single generating mutational process (Figure 4.3). Mutations likely to be
due to the POLE-associated mutational process (e.g. TCT>TAT mutations), were
present across the allele frequency distribution. These data support the hypothesis
that POLE mutations occurred prior to the last common ancestor of all tumour cells
(Figure 4.3).
I carried out a similar analysis for 17 endometrial cancers and 13 colorectal
cancers from the TCGA series with pathogenic POLE mutations. The allele fre-
quency of the POLE mutation was consistent with clonality in 17/17 endometrial
cancers and 12/13 colorectal cancers (Figures 4.4, 4.5, Table 4.2); one colorec-
tal cancer had an apparently subclonal POLE P286R mutation (TCGA-CA-6717),

4.5. Results 110
Figure 4.2: Whole genome sequencing of five endometrial cancers and one colorectal can-cer with the POLE P286R mutation. Plots show distribution of mutations across96 mutation channels in each of the six tumour samples
AC
A>
AA
AA
CC
>A
AC
AC
G>
AA
GA
CT
>A
ATC
CA
>C
AA
CC
C>
CA
CC
CG
>C
AG
CC
T>
CAT
GC
A>
GA
AG
CC
>G
AC
GC
G>
GA
GG
CT
>G
ATT
CA
>TA
AT
CC
>TA
CT
CG
>TA
GT
CT
>TA
TA
CA
>A
GA
AC
C>
AG
CA
CG
>A
GG
AC
T>
AG
TC
CA
>C
GA
CC
C>
CG
CC
CG
>C
GG
CC
T>
CG
TG
CA
>G
GA
GC
C>
GG
CG
CG
>G
GG
GC
T>
GG
TT
CA
>T
GA
TC
C>
TG
CT
CG
>T
GG
TC
T>
TG
TA
CA
>AT
AA
CC
>AT
CA
CG
>AT
GA
CT
>AT
TC
CA
>C
TAC
CC
>C
TC
CC
G>
CT
GC
CT
>C
TT
GC
A>
GTA
GC
C>
GT
CG
CG
>G
TG
GC
T>
GT
TT
CA
>T
TAT
CC
>T
TC
TC
G>
TT
GT
CT
>T
TT
ATA
>A
AA
ATC
>A
AC
ATG
>A
AG
ATT
>A
ATC
TA>
CA
AC
TC
>C
AC
CT
G>
CA
GC
TT
>C
ATG
TA>
GA
AG
TC
>G
AC
GT
G>
GA
GG
TT
>G
ATT
TA>
TAA
TT
C>
TAC
TT
G>
TAG
TT
T>
TAT
ATA
>A
CA
ATC
>A
CC
ATG
>A
CG
ATT
>A
CT
CTA
>C
CA
CT
C>
CC
CC
TG
>C
CG
CT
T>
CC
TG
TA>
GC
AG
TC
>G
CC
GT
G>
GC
GG
TT
>G
CT
TTA
>T
CA
TT
C>
TC
CT
TG
>T
CG
TT
T>
TC
TAT
A>
AG
AAT
C>
AG
CAT
G>
AG
GAT
T>
AG
TC
TA>
CG
AC
TC
>C
GC
CT
G>
CG
GC
TT
>C
GT
GTA
>G
GA
GT
C>
GG
CG
TG
>G
GG
GT
T>
GG
TT
TA>
TG
AT
TC
>T
GC
TT
G>
TG
GT
TT
>T
GT
Birmingham
0e+002e+044e+046e+048e+041e+05
Mut
atio
ns
AC
A>
AA
AA
CC
>A
AC
AC
G>
AA
GA
CT
>A
ATC
CA
>C
AA
CC
C>
CA
CC
CG
>C
AG
CC
T>
CAT
GC
A>
GA
AG
CC
>G
AC
GC
G>
GA
GG
CT
>G
ATT
CA
>TA
AT
CC
>TA
CT
CG
>TA
GT
CT
>TA
TA
CA
>A
GA
AC
C>
AG
CA
CG
>A
GG
AC
T>
AG
TC
CA
>C
GA
CC
C>
CG
CC
CG
>C
GG
CC
T>
CG
TG
CA
>G
GA
GC
C>
GG
CG
CG
>G
GG
GC
T>
GG
TT
CA
>T
GA
TC
C>
TG
CT
CG
>T
GG
TC
T>
TG
TA
CA
>AT
AA
CC
>AT
CA
CG
>AT
GA
CT
>AT
TC
CA
>C
TAC
CC
>C
TC
CC
G>
CT
GC
CT
>C
TT
GC
A>
GTA
GC
C>
GT
CG
CG
>G
TG
GC
T>
GT
TT
CA
>T
TAT
CC
>T
TC
TC
G>
TT
GT
CT
>T
TT
ATA
>A
AA
ATC
>A
AC
ATG
>A
AG
ATT
>A
ATC
TA>
CA
AC
TC
>C
AC
CT
G>
CA
GC
TT
>C
ATG
TA>
GA
AG
TC
>G
AC
GT
G>
GA
GG
TT
>G
ATT
TA>
TAA
TT
C>
TAC
TT
G>
TAG
TT
T>
TAT
ATA
>A
CA
ATC
>A
CC
ATG
>A
CG
ATT
>A
CT
CTA
>C
CA
CT
C>
CC
CC
TG
>C
CG
CT
T>
CC
TG
TA>
GC
AG
TC
>G
CC
GT
G>
GC
GG
TT
>G
CT
TTA
>T
CA
TT
C>
TC
CT
TG
>T
CG
TT
T>
TC
TAT
A>
AG
AAT
C>
AG
CAT
G>
AG
GAT
T>
AG
TC
TA>
CG
AC
TC
>C
GC
CT
G>
CG
GC
TT
>C
GT
GTA
>G
GA
GT
C>
GG
CG
TG
>G
GG
GT
T>
GG
TT
TA>
TG
AT
TC
>T
GC
TT
G>
TG
GT
TT
>T
GT
POLE_040
0e+00
1e+05
2e+05
3e+05
4e+05
5e+05
Mut
atio
ns
AC
A>
AA
AA
CC
>A
AC
AC
G>
AA
GA
CT
>A
ATC
CA
>C
AA
CC
C>
CA
CC
CG
>C
AG
CC
T>
CAT
GC
A>
GA
AG
CC
>G
AC
GC
G>
GA
GG
CT
>G
ATT
CA
>TA
AT
CC
>TA
CT
CG
>TA
GT
CT
>TA
TA
CA
>A
GA
AC
C>
AG
CA
CG
>A
GG
AC
T>
AG
TC
CA
>C
GA
CC
C>
CG
CC
CG
>C
GG
CC
T>
CG
TG
CA
>G
GA
GC
C>
GG
CG
CG
>G
GG
GC
T>
GG
TT
CA
>T
GA
TC
C>
TG
CT
CG
>T
GG
TC
T>
TG
TA
CA
>AT
AA
CC
>AT
CA
CG
>AT
GA
CT
>AT
TC
CA
>C
TAC
CC
>C
TC
CC
G>
CT
GC
CT
>C
TT
GC
A>
GTA
GC
C>
GT
CG
CG
>G
TG
GC
T>
GT
TT
CA
>T
TAT
CC
>T
TC
TC
G>
TT
GT
CT
>T
TT
ATA
>A
AA
ATC
>A
AC
ATG
>A
AG
ATT
>A
ATC
TA>
CA
AC
TC
>C
AC
CT
G>
CA
GC
TT
>C
ATG
TA>
GA
AG
TC
>G
AC
GT
G>
GA
GG
TT
>G
ATT
TA>
TAA
TT
C>
TAC
TT
G>
TAG
TT
T>
TAT
ATA
>A
CA
ATC
>A
CC
ATG
>A
CG
ATT
>A
CT
CTA
>C
CA
CT
C>
CC
CC
TG
>C
CG
CT
T>
CC
TG
TA>
GC
AG
TC
>G
CC
GT
G>
GC
GG
TT
>G
CT
TTA
>T
CA
TT
C>
TC
CT
TG
>T
CG
TT
T>
TC
TAT
A>
AG
AAT
C>
AG
CAT
G>
AG
GAT
T>
AG
TC
TA>
CG
AC
TC
>C
GC
CT
G>
CG
GC
TT
>C
GT
GTA
>G
GA
GT
C>
GG
CG
TG
>G
GG
GT
T>
GG
TT
TA>
TG
AT
TC
>T
GC
TT
G>
TG
GT
TT
>T
GT
POLE_049
0100002000030000400005000060000
Mut
atio
ns
AC
A>
AA
AA
CC
>A
AC
AC
G>
AA
GA
CT
>A
ATC
CA
>C
AA
CC
C>
CA
CC
CG
>C
AG
CC
T>
CAT
GC
A>
GA
AG
CC
>G
AC
GC
G>
GA
GG
CT
>G
ATT
CA
>TA
AT
CC
>TA
CT
CG
>TA
GT
CT
>TA
TA
CA
>A
GA
AC
C>
AG
CA
CG
>A
GG
AC
T>
AG
TC
CA
>C
GA
CC
C>
CG
CC
CG
>C
GG
CC
T>
CG
TG
CA
>G
GA
GC
C>
GG
CG
CG
>G
GG
GC
T>
GG
TT
CA
>T
GA
TC
C>
TG
CT
CG
>T
GG
TC
T>
TG
TA
CA
>AT
AA
CC
>AT
CA
CG
>AT
GA
CT
>AT
TC
CA
>C
TAC
CC
>C
TC
CC
G>
CT
GC
CT
>C
TT
GC
A>
GTA
GC
C>
GT
CG
CG
>G
TG
GC
T>
GT
TT
CA
>T
TAT
CC
>T
TC
TC
G>
TT
GT
CT
>T
TT
ATA
>A
AA
ATC
>A
AC
ATG
>A
AG
ATT
>A
ATC
TA>
CA
AC
TC
>C
AC
CT
G>
CA
GC
TT
>C
ATG
TA>
GA
AG
TC
>G
AC
GT
G>
GA
GG
TT
>G
ATT
TA>
TAA
TT
C>
TAC
TT
G>
TAG
TT
T>
TAT
ATA
>A
CA
ATC
>A
CC
ATG
>A
CG
ATT
>A
CT
CTA
>C
CA
CT
C>
CC
CC
TG
>C
CG
CT
T>
CC
TG
TA>
GC
AG
TC
>G
CC
GT
G>
GC
GG
TT
>G
CT
TTA
>T
CA
TT
C>
TC
CT
TG
>T
CG
TT
T>
TC
TAT
A>
AG
AAT
C>
AG
CAT
G>
AG
GAT
T>
AG
TC
TA>
CG
AC
TC
>C
GC
CT
G>
CG
GC
TT
>C
GT
GTA
>G
GA
GT
C>
GG
CG
TG
>G
GG
GT
T>
GG
TT
TA>
TG
AT
TC
>T
GC
TT
G>
TG
GT
TT
>T
GT
POLE_072
050000
100000150000200000250000300000
Mut
atio
ns
AC
A>
AA
AA
CC
>A
AC
AC
G>
AA
GA
CT
>A
ATC
CA
>C
AA
CC
C>
CA
CC
CG
>C
AG
CC
T>
CAT
GC
A>
GA
AG
CC
>G
AC
GC
G>
GA
GG
CT
>G
ATT
CA
>TA
AT
CC
>TA
CT
CG
>TA
GT
CT
>TA
TA
CA
>A
GA
AC
C>
AG
CA
CG
>A
GG
AC
T>
AG
TC
CA
>C
GA
CC
C>
CG
CC
CG
>C
GG
CC
T>
CG
TG
CA
>G
GA
GC
C>
GG
CG
CG
>G
GG
GC
T>
GG
TT
CA
>T
GA
TC
C>
TG
CT
CG
>T
GG
TC
T>
TG
TA
CA
>AT
AA
CC
>AT
CA
CG
>AT
GA
CT
>AT
TC
CA
>C
TAC
CC
>C
TC
CC
G>
CT
GC
CT
>C
TT
GC
A>
GTA
GC
C>
GT
CG
CG
>G
TG
GC
T>
GT
TT
CA
>T
TAT
CC
>T
TC
TC
G>
TT
GT
CT
>T
TT
ATA
>A
AA
ATC
>A
AC
ATG
>A
AG
ATT
>A
ATC
TA>
CA
AC
TC
>C
AC
CT
G>
CA
GC
TT
>C
ATG
TA>
GA
AG
TC
>G
AC
GT
G>
GA
GG
TT
>G
ATT
TA>
TAA
TT
C>
TAC
TT
G>
TAG
TT
T>
TAT
ATA
>A
CA
ATC
>A
CC
ATG
>A
CG
ATT
>A
CT
CTA
>C
CA
CT
C>
CC
CC
TG
>C
CG
CT
T>
CC
TG
TA>
GC
AG
TC
>G
CC
GT
G>
GC
GG
TT
>G
CT
TTA
>T
CA
TT
C>
TC
CT
TG
>T
CG
TT
T>
TC
TAT
A>
AG
AAT
C>
AG
CAT
G>
AG
GAT
T>
AG
TC
TA>
CG
AC
TC
>C
GC
CT
G>
CG
GC
TT
>C
GT
GTA
>G
GA
GT
C>
GG
CG
TG
>G
GG
GT
T>
GG
TT
TA>
TG
AT
TC
>T
GC
TT
G>
TG
GT
TT
>T
GT
POLE_147
0e+001e+052e+053e+054e+055e+056e+05
Mut
atio
ns
AC
A>
AA
AA
CC
>A
AC
AC
G>
AA
GA
CT
>A
ATC
CA
>C
AA
CC
C>
CA
CC
CG
>C
AG
CC
T>
CAT
GC
A>
GA
AG
CC
>G
AC
GC
G>
GA
GG
CT
>G
ATT
CA
>TA
AT
CC
>TA
CT
CG
>TA
GT
CT
>TA
TA
CA
>A
GA
AC
C>
AG
CA
CG
>A
GG
AC
T>
AG
TC
CA
>C
GA
CC
C>
CG
CC
CG
>C
GG
CC
T>
CG
TG
CA
>G
GA
GC
C>
GG
CG
CG
>G
GG
GC
T>
GG
TT
CA
>T
GA
TC
C>
TG
CT
CG
>T
GG
TC
T>
TG
TA
CA
>AT
AA
CC
>AT
CA
CG
>AT
GA
CT
>AT
TC
CA
>C
TAC
CC
>C
TC
CC
G>
CT
GC
CT
>C
TT
GC
A>
GTA
GC
C>
GT
CG
CG
>G
TG
GC
T>
GT
TT
CA
>T
TAT
CC
>T
TC
TC
G>
TT
GT
CT
>T
TT
ATA
>A
AA
ATC
>A
AC
ATG
>A
AG
ATT
>A
ATC
TA>
CA
AC
TC
>C
AC
CT
G>
CA
GC
TT
>C
ATG
TA>
GA
AG
TC
>G
AC
GT
G>
GA
GG
TT
>G
ATT
TA>
TAA
TT
C>
TAC
TT
G>
TAG
TT
T>
TAT
ATA
>A
CA
ATC
>A
CC
ATG
>A
CG
ATT
>A
CT
CTA
>C
CA
CT
C>
CC
CC
TG
>C
CG
CT
T>
CC
TG
TA>
GC
AG
TC
>G
CC
GT
G>
GC
GG
TT
>G
CT
TTA
>T
CA
TT
C>
TC
CT
TG
>T
CG
TT
T>
TC
TAT
A>
AG
AAT
C>
AG
CAT
G>
AG
GAT
T>
AG
TC
TA>
CG
AC
TC
>C
GC
CT
G>
CG
GC
TT
>C
GT
GTA
>G
GA
GT
C>
GG
CG
TG
>G
GG
GT
T>
GG
TT
TA>
TG
AT
TC
>T
GC
TT
G>
TG
GT
TT
>T
GT
Oxford
050000
100000150000200000250000300000350000
Mut
atio
ns

4.5. Results 111
Figure 4.3: Clonality of POLE mutations and mutational processes in six samples sub-jected to whole genome sequencing. Frequency histograms and kernel densityplots showing variant allele frequency (VAF) of all SNA mutations, and SNAslikely due to POLE exonuclease domain mutation (POLE) and APOBEC muta-genesis (APOBEC). Only mutations in diploid regions of autosomes, and withcoverage > 20x are shown. The relatively low proportion of SNAs categorisedas being due to POLE mutation reflects the stringency of the classification used(see Methods, Classification of SNAs to a mutational process). Vertical redline indicates clonal peak used to calculate cellularity. Arrow indicates VAF ofpathogenic POLE mutation.
Any SNVPOLE
OXF_001POLE P286R
0.0 0.2 0.4 0.6 0.8 1.0
VAF
Any SNVPOLE
Any SNVPOLE
POLE_040_WGS
POLE P286R
0.0 0.2 0.4 0.6 0.8 1.0
VAF
Any SNVPOLE
Any SNVPOLEAPOBEC
POLE_049_WGSPOLE P286R
0.0 0.2 0.4 0.6 0.8 1.0
VAF
Any SNVPOLEAPOBEC
Any SNVPOLE
POLE_072_WGS
POLE P286R
0.0 0.2 0.4 0.6 0.8 1.0
VAF
Any SNVPOLE
Any SNVPOLE
POLE_147_WGS
POLE P286R
0.0 0.2 0.4 0.6 0.8 1.0
VAF
Any SNVPOLE
Any SNVPOLE
BIR_001POLE P286R
0.0 0.2 0.4 0.6 0.8 1.0
VAF
Any SNVPOLE
(Figure 4.5, Table 4.2). Again mutations attributed to the POLE mutator pheno-
type were present across the allele frequency spectrum in all cases (Figures 4.4,
4.5). Taken together, these data suggest that pathogenic POLE mutations are often
early events (prior to the last common ancestor of tumour cells) in endometrial and
colorectal cancers.
4.5.3 POLE signature scores of driver mutations
I next sought to investigate the timing of POLE mutation relative to driver muta-
tions. Since driver mutations are often clonal in tumour samples [McGranahan et al., 2015],
the fact that POLE mutations are often clonal provides little information about their

4.5. Results 112
Figure 4.4: Clonality of POLE mutations and mutational processes in TCGA endometrialcancers. Frequency histograms and kernel density plots showing variant allelefrequency (VAF) of all SNA mutations, and SNAs likely due to POLE exonu-clease domain mutation (POLE), APOBEC upregulation (APOBEC) and de-ficient DNA mismatch repair (dMMR). Only mutations in diploid regions ofautosomes, and with coverage > 20x are shown. The relatively low proportionof SNAs categorised as being due to POLE mutation reflects the stringency ofthe classification used (see Methods, Classification of SNAs to a mutationalprocess). VAF of POLE mutations are highlighted. Vertical red line indicatesclonal peak used to calculate cellularity. Arrow indicates VAF of pathogenicPOLE mutation.
Any SNVPOLE
TCGA A5 A0GP_WXS
POLE V411L
0.0 0.2 0.4 0.6 0.8 1.0
VAF
Any SNVPOLE
Any SNVPOLEdMMR
TCGA AP A051_WGSPOLE L424I
0.0 0.2 0.4 0.6 0.8 1.0
VAF
Any SNVPOLEdMMR
Any SNVPOLE
TCGA AP A059_WXSPOLE S297F
0.0 0.2 0.4 0.6 0.8 1.0
VAF
Any SNVPOLE
Any SNVPOLEdMMR
TCGA AP A0LM_WXS
POLE V411L
0.0 0.2 0.4 0.6 0.8 1.0
VAF
Any SNVPOLEdMMR
Any SNVPOLEdMMR
TCGA AP A0LM_WXS
POLE V411L
0.0 0.2 0.4 0.6 0.8 1.0
VAF
Any SNVPOLEdMMR
Any SNVPOLE
TCGA AX A0J0_WXSPOLE P286R
0.0 0.2 0.4 0.6 0.8 1.0
VAF
Any SNVPOLE
Any SNVPOLE
TCGA B5 A0JY_WXSPOLE P286R
0.0 0.2 0.4 0.6 0.8 1.0
VAF
Any SNVPOLE
Any SNVPOLEdMMR
TCGA B5 A11E_WXS
POLE V411L
0.0 0.2 0.4 0.6 0.8 1.0
VAF
Any SNVPOLEdMMR
Any SNVPOLE
TCGA B5 A11N_WXS
POLE P286R
0.0 0.2 0.4 0.6 0.8 1.0
VAF
Any SNVPOLE
Any SNVPOLE
TCGA BG A0VX_WXS
POLE L424V
0.0 0.2 0.4 0.6 0.8 1.0
VAF
Any SNVPOLE
Any SNVPOLE
TCGA BS A0TC_WGS
POLE M444K
0.0 0.2 0.4 0.6 0.8 1.0
VAF
Any SNVPOLE
Any SNVPOLE
TCGA BS A0UF_WXS
POLE P286R
0.0 0.2 0.4 0.6 0.8 1.0
VAF
Any SNVPOLE
Any SNVPOLE
TCGA BS A0UV_WXSPOLE P286R
0.0 0.2 0.4 0.6 0.8 1.0
VAF
Any SNVPOLE
Any SNVPOLE
TCGA D1 A103_WXSPOLE A456P
0.0 0.2 0.4 0.6 0.8 1.0
VAF
Any SNVPOLE
Any SNVPOLE
TCGA D1 A16X_WXS
POLE P286R
0.0 0.2 0.4 0.6 0.8 1.0
VAF
Any SNVPOLE
Any SNVPOLE
TCGA D1 A16Y_WXS
POLE V411L
0.0 0.2 0.4 0.6 0.8 1.0
VAF
Any SNVPOLE
Any SNVPOLE
TCGA D1 A17Q_WXS
POLE P286R
0.0 0.2 0.4 0.6 0.8 1.0
VAF
Any SNVPOLE

4.5. Results 113
Figure 4.5: Clonality of POLE mutations and mutational processes in TCGA colorectalcancers. Frequency histograms and kernel density plots showing variant allelefrequency (VAF) of all SNA mutations, and SNAs likely due to POLE exonu-clease domain mutation (POLE) and deficient DNA mismatch repair (dMMR).Only mutations in diploid regions of autosomes, and with coverage > 20x areshown. The relatively low proportion of SNAs categorised as being due toPOLE mutation reflects the stringency of the classification used (see Methods,Classification of SNAs to a mutational process). VAF of POLE mutations arehighlighted. Vertical red line indicates clonal peak used to calculate cellularity.Arrow indicates VAF of pathogenic POLE mutation.
Any SNVPOLE
TCGA A6 6141_WGS
POLE S297F
0.0 0.2 0.4 0.6 0.8 1.0
VAF
Any SNVPOLE
Any SNVPOLE
TCGA A6 6141_WGS
POLE S297F
0.0 0.2 0.4 0.6 0.8 1.0
VAF
Any SNVPOLE
Any SNVPOLE
TCGA AA 3555_WGS
POLE P286H
0.0 0.2 0.4 0.6 0.8 1.0
VAF
Any SNVPOLE
Any SNVPOLE
TCGA AA 3977_WGS
POLE F367S
0.0 0.2 0.4 0.6 0.8 1.0
VAF
Any SNVPOLE
Any SNVPOLE
TCGA AA A00N_WXS
POLE V411L
0.0 0.2 0.4 0.6 0.8 1.0
VAF
Any SNVPOLE
Any SNVPOLE
TCGA AA A010_WXS
POLE P436R
0.0 0.2 0.4 0.6 0.8 1.0
VAF
Any SNVPOLE
Any SNVPOLE
TCGA AG 3892_WXS
POLE S459F
0.0 0.2 0.4 0.6 0.8 1.0
VAF
Any SNVPOLE
Any SNVPOLE
TCGA AG A002_WXS
POLE S459F
0.0 0.2 0.4 0.6 0.8 1.0
VAF
Any SNVPOLE
Any SNVPOLE
TCGA CA 6717_WGSPOLE P286R
0.0 0.2 0.4 0.6 0.8 1.0
VAF
Any SNVPOLE
Any SNVPOLE
TCGA CA 6718_WGS
POLE P286R
0.0 0.2 0.4 0.6 0.8 1.0
VAF
Any SNVPOLE
Any SNVPOLEdMMR
TCGA EI 6917_WGS
POLE V411L
0.0 0.2 0.4 0.6 0.8 1.0
VAF
Any SNVPOLEdMMR
Any SNVPOLE
TCGA F5 6814_WGS
POLE P286R
0.0 0.2 0.4 0.6 0.8 1.0
VAF
Any SNVPOLE
Any SNVPOLE
TCGA AZ 4315_WGS
POLE V411L
0.0 0.2 0.4 0.6 0.8 1.0
VAF
Any SNVPOLE

4.5. Results 114
Table 4.2: Clonality of POLE mutations in endometrial cancer and colorectal cancer sam-ples. p-value’s shown are for one-sided binomial tests of the null hypothesis thatthe mutation was present in every tumour cell.
Sample Tumour type POLE mutation VAF p-value1 POLE 040 Endometrial P286R 7/28 0.822 POLE 049 Endometrial P286R 15/40 0.573 POLE 072 Endometrial P286R 6/56 0.124 POLE 147 Endometrial P286R 13/29 0.845 Oxford Endometrial P286R 31/91 0.676 TCGA-A5-A0GP Endometrial V411L 81/266 0.267 TCGA-AP-A051 Endometrial L424I 6/20 0.51
10 TCGA-AP-A059 Endometrial S297F 35/164 0.4011 TCGA-AP-A0LM Endometrial V411L 14/71 0.3512 TCGA-AX-A05Z Endometrial P286R 9/41 0.2713 TCGA-AX-A0J0 Endometrial P286R 44/97 0.7514 TCGA-B5-A0JY Endometrial P286R 52/166 0.4115 TCGA-B5-A11E Endometrial V411L 12/21 0.9416 TCGA-B5-A11N Endometrial P286R 67/223 0.8217 TCGA-BG-A0VX Endometrial L424V 13/69 0.0718 TCGA-BS-A0TC Endometrial M444K 15/55 0.0720 TCGA-BS-A0UF Endometrial P286R 56/163 0.7221 TCGA-BS-A0UV Endometrial P286R 39/115 0.2422 TCGA-D1-A103 Endometrial A456P 62/175 0.3123 TCGA-D1-A16X Endometrial P286R 41/113 0.9424 TCGA-D1-A16Y Endometrial V411L 16/31 0.8925 TCGA-D1-A17Q Endometrial P286R 88/172 0.9926 Birmingham Colorectal P286R 15/65 0.6127 TCGA-A6-6141 Colorectal S297F 25/68 0.9628 TCGA-AA-3510 Colorectal A456P 21/55 0.8529 TCGA-AA-3555 Colorectal P286H 27/68 0.6930 TCGA-AA-3977 Colorectal F367S 24/67 0.7632 TCGA-AA-A00N Colorectal V411L 20/94 0.6833 TCGA-AA-A010 Colorectal P436R 42/117 0.4034 TCGA-AG-3892 Colorectal S459F 25/98 0.9336 TCGA-AG-A002 Colorectal S459F 34/94 0.4437 TCGA-AZ-4315 Colorectal V411L 45/119 0.9139 TCGA-CA-6717 Colorectal P286R 7/70 0.0241 TCGA-CA-6718 Colorectal P286R 36/104 0.9644 TCGA-EI-6917 Colorectal V411L 31/74 1.0047 TCGA-F5-6814 Colorectal P286R 39/93 0.84
timing compared to drivers. I therefore applied the POLE mutational signature
score method, described above, to analyse whether the genomic context of muta-

4.5. Results 115
tions in driver genes could provide information about the mutational processes that
were present at the time of these mutations.
For this analysis, in addition to the 38 POLE-mutant samples, mutation data
was downloaded for 802 MMR-proficient (MMR-P) tumours and 194 MMR-
deficient (MMR-D) tumours from the TCGA series (450 endometrial cancers and
546 colorectal tumours). POLE signature scores (POLE scores) were calculated
for each driver gene with at least one non-silent mutation in a sample (scores were
calculated for mutated genes in MMR-D and MMR-P samples as a comparison for
scores in genes in POLE-mutant samples).
In total, among 206 endometrial and/or colorectal cancer driver genes exam-
ined in the cases from the combined endometrial and colorectal cancer cohorts, 50%
(1,065/2,118) of those in POLE-mutant samples had a POLE signature score > 0,
compared to 14% (628/4,427) in MMR-D and MMR-P cancers (P < 1× 10⁻²⁶)
(Figure 4.6, 4.7). This suggests that many mutations in driver genes in POLE-
mutant samples occurred on a background of POLE mutations.
To minimise the possibility of confounding by non-pathogenic mutations in the
complete set of driver genes, I repeated these analyses considering only manually
curated, high-confidence pathogenic mutations. High confidence driver mutations
(defined as either truncating mutation in genes likely to be tumour suppressors or re-
current missense mutations in any endometrial or colorectal cancer-specific or pan-
cancer gene from the IntOGen set), were determined for a subset of driver genes by
manual curation, blinded to tumour molecular characteristics. Again, the propotion
of genes in POLE-mutant samples that had a score above zero, was significantly
greater than among MMR-P and MMR-D samples (P < 1× 10⁻²⁶, Figures 4.8,
4.9).
As mutation of the tumour suppressors PTEN and APC are well recognised
as early, if not initiating, events in the pathogenesis of endometrial and colorec-
tal cancers respectively, I specifically examined whether somatic variants in these
genes varied according to tumour POLE mutation status. Among high-confidence
pathogenic PTEN mutations in endometrial cancers, the proportion with POLE con-

4.5. Results 116
CDKN1BACO1
PTPN11PIK3R1
POLR2BRBM10
GOLGA5ARNTLCDC73STAG2SF3B1MED24
FXR1PPP2R1ATP53BP1
DIS3TCF7L2MECOM
SOS2NRAS
DNMT3ATGFBR2NUP107
NTN4ACSL6EGFRCHD9
AKAP9WIPF1RTN4CHD4TBX3CUL1
ATMATRX
CLSPNFOXP1
BRWD1MYH10
PTENSMAD4BCOR
CASP8GATA3
RUNX1MSR1
ZC3H11AMGA
MAP2K1TP53
ARID1ASYNCRIP
NR4A2NUP98
CEP290SMC1AFBXW7
BRAFPTGS1RAD21SMAD2NR2F2ASPMGNASKRAS
NF1FN1
PTPRUCTNNB1PIK3CA
TAF1CDK12
SRGAP3CNOT1BMPR2AXIN2CTCF
CREBBPTRIOWT1APCIDH2
ITSN1BPTF
TCF12MAP3K4ACVR1B
MED12CAD
PCBP1SOX9ELF3POLE
Bir
min
gham
P28
6R
TC
GA
−A
6−61
41 S
297F
TC
GA
−A
A−
3510
A45
6P
TC
GA
−A
A−
3555
P28
6H
TC
GA
−A
A−
3977
F36
7S
TC
GA
−A
A−
A00
N V
411L
TC
GA
−A
A−
A01
0 P
436R
TC
GA
−A
G−
3892
S45
9F
TC
GA
−A
G−
A00
2 S
459F
TC
GA
−A
Z−
4315
V41
1L
TC
GA
−C
A−
6717
P28
6R
TC
GA
−C
A−
6718
P28
6R
TC
GA
−E
I−69
17 V
411L
TC
GA
−F
5−68
14 P
286R
TC
GA
−A
A−
3984
V41
1L
PO
LE m
eta−
sam
ple
sample
varia
ble
−4
−2
0
2
value
POLE Cases
CDKN1BACO1
PTPN11PIK3R1
POLR2BRBM10
GOLGA5ARNTLCDC73STAG2SF3B1MED24
FXR1PPP2R1ATP53BP1
DIS3TCF7L2MECOM
SOS2NRAS
DNMT3ATGFBR2NUP107
NTN4ACSL6EGFRCHD9
AKAP9WIPF1RTN4CHD4TBX3CUL1
ATMATRX
CLSPNFOXP1
BRWD1MYH10
PTENSMAD4BCOR
CASP8GATA3
RUNX1MSR1
ZC3H11AMGA
MAP2K1TP53
ARID1ASYNCRIP
NR4A2NUP98
CEP290SMC1AFBXW7
BRAFPTGS1RAD21SMAD2NR2F2ASPMGNASKRAS
NF1FN1
PTPRUCTNNB1PIK3CA
TAF1CDK12
SRGAP3CNOT1BMPR2AXIN2CTCF
CREBBPTRIOWT1APCIDH2
ITSN1BPTF
TCF12MAP3K4ACVR1B
MED12CAD
PCBP1SOX9ELF3POLE
M
SI m
eta−
sam
ple
M
SS
met
a−sa
mpl
e
set
varia
ble
−4
−2
0
2
value
MSI and MSS cases
Figure 4.6: “POLE scores” in driver genes in endometrial cancer samples. Scoresare shown for individual genes (rows) in individual POLE-mutant samples(columns left-hand raster), averaged across MMR-D samples (first columnright-hand raster) and averaged across MMR-P samples (second column right-hand raster). Most genes had a POLE-score greater than zero in at least onePOLE-mutant sample, indicating that all mutations in the gene in that samplewere more likely to have occurred on a POLE-mutant background than on aMMR-D or MMR-P backround.

4.5. Results 117
CHEK2GPS2
NF2TGFBR2
MLH1MAP2K4
CUL1NCF2DIS3
EIF1AXZNF814
NRASRAD23B
RHEBCDKN1B
TBX3RB1
TFDP1PIK3R1ARNTLFGFR2
ALKPIK3R3RPL22
RUNX1MET
STIP1MAP3K1CARM1NFE2L2
PPP2R5ACASTMLH3PHF6
INPP4AIREB2
PCDH18SMAD2
EIF2AK3GNAI1
EIF4A2RBBP7
BRAFBAZ2B
FXR1SUZ12
ZMYM2CAPN7
RPL5ARID5B
MYBSYNCRIP
PTPN11CTNND1
CTCFMED17FUBP1
PGRNEDD4L
RAD21SEC31ABCLAF1DHX15
NCKAP1TBL1XR1
DEPDC1BEIF4G1FBXW7
ATICG3BP2
ZC3H11ANCOR1SHMT1
SPOPDICER1PLCG1EP300
PRRX1ROBO2SOX17MYH10NUP93BRCA1ERBB3SMC1A
TP53FLT3CLTCMKL1AXIN1WIPF1CUX1
ARHGAP35INPPL1U2AF1
NDRG1TP53BP1
EGFRATM
KLF4CHD4
AHRCNOT4
CSNK1G3HGF
ACACAATRFAS
KDM6AKRASMGACAT
GPSM2RTN4
SRGAP3DHX35ARAP3ZFHX3
PLXNB2CHD9
ARID1APTENING1
HDAC3CHD3
PPP2R5CNF1
RBM5VHL
ANK3ATF1
DNMT3AAPC
PPP2R1AARHGEF6
CLOCKCTNNB1
CCND1ACTG1PIK3CA
MAXIDH1
ACTBAKT1
PRPF8NR2F2MUC20BMPR2FOXA2POLE
PO
LE_0
40 P
286R
PO
LE_0
49 P
286R
PO
LE_0
72 P
286R
PO
LE_1
47 P
286R
Oxf
ord
P28
6R
TC
GA
−A
5−A
0GP
V41
1L
TC
GA
−A
P−
A05
1 L4
24I
TC
GA
−A
P−
A05
6 V
411L
TC
GA
−A
P−
A05
9 S
297F
TC
GA
−A
P−
A0L
M V
411L
TC
GA
−A
X−
A05
Z P
286R
TC
GA
−A
X−
A0J
0 P
286R
TC
GA
−B
5−A
0JY
P28
6R
TC
GA
−B
5−A
11E
V41
1L
TC
GA
−B
5−A
11N
P28
6R
TC
GA
−B
G−
A0V
X L
424V
TC
GA
−B
S−
A0T
C M
444K
TC
GA
−B
S−
A0U
F P
286R
TC
GA
−B
S−
A0U
V P
286R
TC
GA
−D
1−A
103
A45
6P
TC
GA
−D
1−A
16X
P28
6R
TC
GA
−D
1−A
16Y
V41
1L
TC
GA
−D
1−A
17Q
P28
6R
PO
LE m
eta−
sam
ple
sample
varia
ble
−8
−6
−4
−2
0
2
value
POLE Cases
CHEK2GPS2
NF2TGFBR2
MLH1MAP2K4
CUL1NCF2DIS3
EIF1AXZNF814
NRASRAD23B
RHEBCDKN1B
TBX3RB1
TFDP1PIK3R1ARNTLFGFR2
ALKPIK3R3RPL22
RUNX1MET
STIP1MAP3K1CARM1NFE2L2
PPP2R5ACASTMLH3PHF6
INPP4AIREB2
PCDH18SMAD2
EIF2AK3GNAI1
EIF4A2RBBP7
BRAFBAZ2B
FXR1SUZ12
ZMYM2CAPN7
RPL5ARID5B
MYBSYNCRIP
PTPN11CTNND1
CTCFMED17FUBP1
PGRNEDD4L
RAD21SEC31ABCLAF1
DHX15NCKAP1
TBL1XR1DEPDC1B
EIF4G1FBXW7
ATICG3BP2
ZC3H11ANCOR1SHMT1
SPOPDICER1PLCG1EP300
PRRX1ROBO2SOX17MYH10NUP93BRCA1ERBB3SMC1A
TP53FLT3CLTCMKL1
AXIN1WIPF1CUX1
ARHGAP35INPPL1U2AF1
NDRG1TP53BP1
EGFRATM
KLF4CHD4
AHRCNOT4
CSNK1G3HGF
ACACAATRFAS
KDM6AKRASMGACAT
GPSM2RTN4
SRGAP3DHX35ARAP3ZFHX3
PLXNB2CHD9
ARID1APTENING1
HDAC3CHD3
PPP2R5CNF1
RBM5VHL
ANK3ATF1
DNMT3AAPC
PPP2R1AARHGEF6
CLOCKCTNNB1
CCND1ACTG1PIK3CA
MAXIDH1
ACTBAKT1
PRPF8NR2F2MUC20BMPR2FOXA2POLE
M
SI m
eta−
sam
ple
M
SS
met
a−sa
mpl
e
set
varia
ble
−8
−6
−4
−2
0
2
value
MSI and MSS cases
Figure 4.7: “POLE scores” in driver genes in colorectal cancer samples. Rows and columnsas for Figure 4.6. Most genes had a POLE-score greater than zero in at least onePOLE-mutant sample, indicating that all mutations in the gene in that samplewere more likely to have occurred on a POLE-mutant background than on aMMR-D or MMR-P backround.

4.5. Results 118
Figure 4.8: “POLE scores” in driver genes in endometrial cancer samples - high confidencepathogenic mutations only. Rows and columns as for Figure 4.6. Most geneshad a POLE-score greater than zero in at least one POLE-mutant sample, indi-cating that all pathogenic mutations in the gene in that sample were more likelyto have occurred on a POLE-mutant background than on a MMR-D or MMR-Pbackround.
MAP3K1MLH1MLH3CTCF
ARHGEF6CTNND1
FGFR2PIK3R1EP300
NF1ATM
ARHGAP35APC
PTENCUX1
FBXW7ARID1A
TP53DICER1
CTNNB1PPP2R1A
ING1MAX
PIK3CAKRAS
NFE2L2POLE
POLE
_040
P28
6RPO
LE_0
49 P
286R
POLE
_072
P28
6RPO
LE_1
47 P
286R
Oxf
ord
P286
RTC
GA−
A5−A
0GP
V411
LTC
GA−
AP−A
051
L424
ITC
GA−
AP−A
056
V411
LTC
GA−
AP−A
059
S297
FTC
GA−
AP−A
0LM
V41
1LTC
GA−
AX−A
05Z
P286
RTC
GA−
AX−A
0J0
P286
RTC
GA−
B5−A
0JY
P286
RTC
GA−
B5−A
11E
V411
LTC
GA−
B5−A
11N
P28
6RTC
GA−
BG−A
0VX
L424
VTC
GA−
BS−A
0TC
M44
4KTC
GA−
BS−A
0UF
P286
RTC
GA−
BS−A
0UV
P286
RTC
GA−
D1−
A103
A45
6PTC
GA−
D1−
A16X
P28
6RTC
GA−
D1−
A16Y
V41
1LTC
GA−
D1−
A17Q
P28
6RPO
LE m
eta−
sam
ple
sample
varia
ble
−8−6−4−202
value
POLE Cases
MAP3K1MLH1MLH3CTCF
ARHGEF6CTNND1
FGFR2PIK3R1EP300
NF1ATM
ARHGAP35APC
PTENCUX1
FBXW7ARID1A
TP53DICER1
CTNNB1PPP2R1A
ING1MAX
PIK3CAKRAS
NFE2L2POLE
M
SI m
eta−
sam
ple
M
SS m
eta−
sam
ple
set
varia
ble
−8−6−4−202
value
MSI and MSS cases
Figure S3. POLE signature in high-con�dence endometrial cancer driver mutations
POLE
sco
re
sensus mutational signature scores > 0 was substantially and significantly greater
among POLE-mutant cases than among MMR-P and MMR-D tumours (10 of 14
[71.4%] vs. 14 of 82 [17.1%] mutations respectively; P = 7.8× 10⁻³, Fisher’s
Exact Test). Analysis of high-confidence pathogenic APC mutations in colorectal
cancers revealed similar results (corresponding proportions 9 of 14 [64.3%] vs. 10
of 69 [14.5%] mutations; P = 0.012, Fisher’s Exact Test).
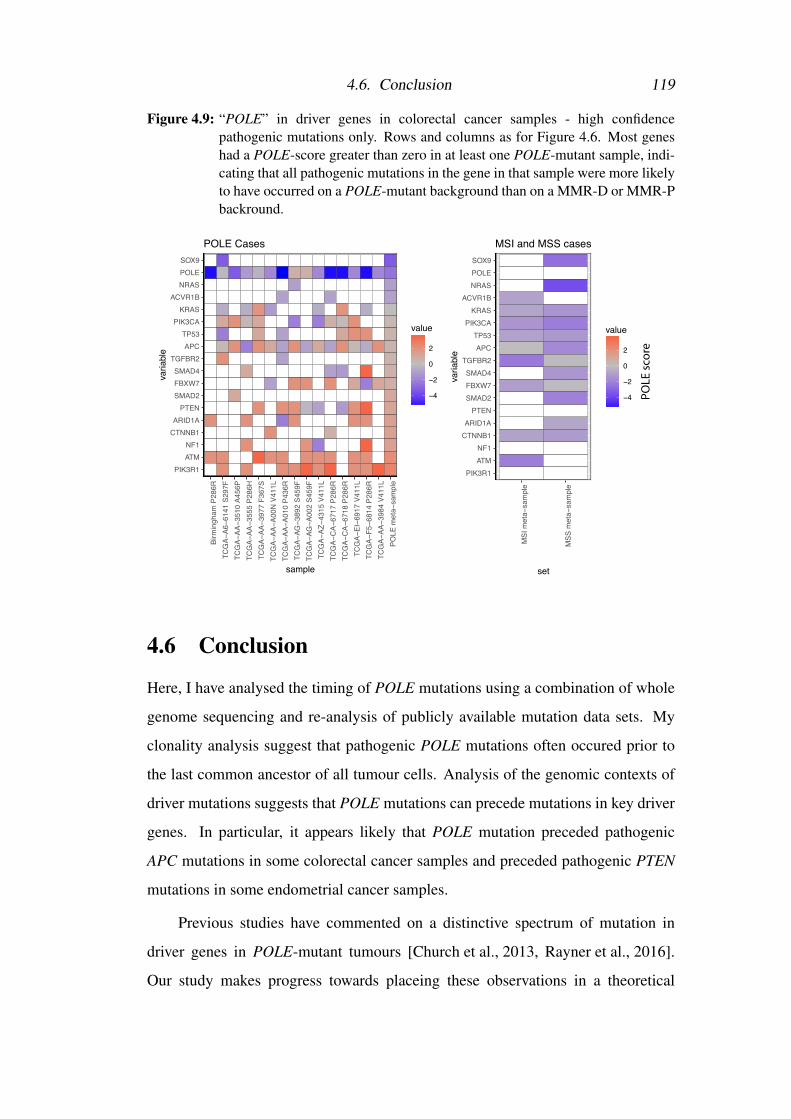
4.6. Conclusion 119
Figure 4.9: “POLE” in driver genes in colorectal cancer samples - high confidencepathogenic mutations only. Rows and columns as for Figure 4.6. Most geneshad a POLE-score greater than zero in at least one POLE-mutant sample, indi-cating that all pathogenic mutations in the gene in that sample were more likelyto have occurred on a POLE-mutant background than on a MMR-D or MMR-Pbackround.
Figure S4. POLE signature in high-con�dence colorectal cancer driver mutations
PIK3R1ATMNF1
CTNNB1ARID1A
PTENSMAD2FBXW7SMAD4
TGFBR2APC
TP53PIK3CA
KRASACVR1B
NRASPOLESOX9
Birm
ingh
am P
286R
TCG
A−A6
−614
1 S2
97F
TCG
A−AA
−351
0 A4
56P
TCG
A−AA
−355
5 P2
86H
TCG
A−AA
−397
7 F3
67S
TCG
A−AA
−A00
N V
411L
TCG
A−AA
−A01
0 P4
36R
TCG
A−AG
−389
2 S4
59F
TCG
A−AG
−A00
2 S4
59F
TCG
A−AZ
−431
5 V4
11L
TCG
A−C
A−67
17 P
286R
TCG
A−C
A−67
18 P
286R
TCG
A−EI
−691
7 V4
11L
TCG
A−F5
−681
4 P2
86R
TCG
A−AA
−398
4 V4
11L
POLE
met
a−sa
mpl
e
sample
varia
ble
−4
−2
0
2
value
POLE Cases
PIK3R1ATMNF1
CTNNB1ARID1A
PTENSMAD2FBXW7SMAD4
TGFBR2APC
TP53PIK3CA
KRASACVR1B
NRASPOLESOX9
MSI
met
a−sa
mpl
e
MSS
met
a−sa
mpl
eset
varia
ble
−4
−2
0
2
value
MSI and MSS cases
POLE
sco
re4.6 Conclusion
Here, I have analysed the timing of POLE mutations using a combination of whole
genome sequencing and re-analysis of publicly available mutation data sets. My
clonality analysis suggest that pathogenic POLE mutations often occured prior to
the last common ancestor of all tumour cells. Analysis of the genomic contexts of
driver mutations suggests that POLE mutations can precede mutations in key driver
genes. In particular, it appears likely that POLE mutation preceded pathogenic
APC mutations in some colorectal cancer samples and preceded pathogenic PTEN
mutations in some endometrial cancer samples.
Previous studies have commented on a distinctive spectrum of mutation in
driver genes in POLE-mutant tumours [Church et al., 2013, Rayner et al., 2016].
Our study makes progress towards placeing these observations in a theoretical

4.6. Conclusion 120
framework and assesses, to our knowledge for the first time, the extent to which
all the potentially pathogenic mutations in putative driver genes are likely to have
occurred on the background of the POLE mutational signature.
Further analysis by co-authors that is included in the manuscript supports the
conclusions that POLE mutations are early events. Dr David Church and colleagues
analysed four cases where a POLE-mutant endometrial cancer was resected together
with what is likely to be a remnant of the precursor lesion. In all four cases, the
same POLE mutation that was present in the cancer portion of the sample was also
identified in the precursor lesion. These results are consistent with POLE mutations
occuring in the very earliest stages of tumour evolution.
Our findings provide an important contribution to the growing understanding
of the relationship between mutation rates and tumour immune response. Early
POLE mutations are expected to generate large numbers of clonal neo-antigens
[McGranahan et al., 2016]. Given the important role that is hypothesised for clonal
neo-antigens in immunotherapy response (see Chapter 1), the early timing of POLE
mutations is relevant to the (very limited) data showing these tumours may respond
well to immunotherapy [Santin et al., 2016]. The findings motivate further research
into the potential for immunotherapy in these tumours. More broadly these results
suggest that early ongoing instability may be associated with immune recognition
and good prognosis. This is an important data point in terms of understanding the
dynamic relationship between mutation and immune response. Further studies to
clarify the relationship between immune response and other types of instability will
be important in this regard.
There are some limitations to the application of the model presented in this
chapter. In particular, the application assumes that the cancer-causing mutations in
a driver gene are uniformly distributed across the 96 mutation channels, and that
similar mutations are equivalent in terms of selection. The first assumption repre-
sents a fair estimate in the absence of information. Arguably it is more likely to be
correct for tumour suppressor genes (TSGs), where there may be a large number
of alternative mutations for any given cancer-causing mutation, than in oncogenes.

4.6. Conclusion 121
In theory this would make the effects of mutational process more easily discernible
from mutations in TSGs than oncogenes, and this is one potential reason that muta-
tional signatures were first recognised in TP53, which has many characteristics of
a TSG. The second assumption is unlikely to be true. It is testable in large cohorts
with known (or assumed) timing of mutational processes and is analysed directly
in the next chapter. Potential error due to these assumptions is partially mitigated
by the use of multiple cancer genes and comparison with MMR-D and MMR-P tu-
mours. However, I accept that some uncertainty remains due to these assumptions.
The model I have presented here goes some way to formalising the dependence
of driver mutations in a sequenced tumour on the mutational processes present in
the history of the tumour and selection. Developing these ideas more fully is of
potential interest to dissect the causes of driver mutations in other tumours and
tumour types. Some of this development is done in the next chapter. In the next
chapter, I present a pan-cancer analysis of the differential contributions of mutation
processes and selection in determining driver mutation complement. In addition,
some development is left for future work. In particular, the POLE signature score
presented here is a heuristic measure designed to capture the probability that cancer
mutations developed on a background of POLE mutation. Developing this further
into an exact Bayesian posterior probability is of potential interest for future work.
In conclusion, I have presented evidence that suggests POLE EDMs are early
events in colorectal and endometrial cancer in two, largely orthogonal senses; with
respect to the last common ancestor of the all tumour cells and with respect to
driver mutations. These findings suggest cautious further research into whether
immunotherapy could benefit patients with POLE-mutant tumours. I have also
presented a model of the effects of mutation and selection on cancer mutations.
Notwithstanding certain limitations of the model, these findings represent an impor-
tant contribution to our understanding of POLE-mutant tumours and, more broadly,
the relationship between mutation and selection in tumour development.

Chapter 5
The effects of mutation and selection
on driver mutations across cancer
types
The work presented in this chapter has been accepted at Nature Communications
3. Temko D., Tomlinson I., Severini S., Schuster-Bckler B., Graham T.A.
The effects of mutational processes and selection on driver mutations across cancer
types, in press, Nature Communications, 2018
5.1 PrecisEpidemiological evidence has long associated environmental mutagens with in-
creased cancer risk. However, links between specific mutation-causing processes
and the acquisition of individual driver mutations have remained obscure. Here I
have used public cancer sequencing data from 11,336 cancers of various types to in-
fer the independent effects of mutation and selection on the set of driver mutations in
a cancer type. First, I detect associations between a range of mutational processes,
including those linked to smoking, ageing, APOBEC and DNA mismatch repair
(MMR) and the presence of key driver mutations across cancer types. Second, I
quantify differential selection between well-known alternative driver mutations, in-
cluding differences in selection between distinct mutant residues in the same gene.
These results show that while mutational processes play a large role in determin-

5.2. Contribution 123
ing which driver mutations are present in a cancer, the role of selection frequently
dominates.
5.2 ContributionI designed and carried out all the analysis in this chapter. The text in this chapter
closely mirrors the paper, which was written by TG and myself with input from the
other authors.
5.3 SummaryMutational likelihood and evolutionary selection together determine which driver
mutations a cancer will accrue. In a pan-cancer analysis, here I show that the oc-
currence of a particular driver mutation is strongly correlated with the activity of
underlying mutational processes, suggesting a potentially causative role for the mu-
tational process in determining which driver mutations are found in a cancer. Then,
by using these relationships to normalise differences in mutational likelihood, I infer
large differences in the selective advantage of mutually exclusive driver mutations.
Overall, the study provides a quantitative understanding of the evolutionary forces
governing driver mutation acquisition across cancer types.
5.4 IntroductionEnvironmental mutagens have long been associated with cancer risk [Weinberg, 2014,
Parkin et al., 2011, Hanahan and Weinberg, 2011], but links between muta-
gens and the generation of specific pathological mutations have remained ob-
scure. A landmark study by Alexandrov et al. [Alexandrov et al., 2013a,
Alexandrov et al., 2013b] identified distinct “mutational signatures”, each the out-
come of distinct mutagenic processes, many of which are attributable to environ-
mental mutagens (see Chapter 1). The study described 21 different mutational
signatures, each characterised by different proportions of the 96 mutation types.
Subsequently more than 30 signatures, many with tumour type-specificity, have
been reported [Wagener et al., 2015, Mouw et al., 2016, Nik-Zainal et al., 2016,
Hong et al., 2015, Schulze et al., 2015, Petljak and Alexandrov, 2016].

5.4. Introduction 124
In the previous chapter I investigated the dependence of the likelihood of ac-
quisition of specific cancer-causing mutations [Sieber et al., 2005] on the underly-
ing mutational processes and selection. Under this model analysis of the genomic
context of driver mutations in POLE-mutant tumours suggested that the POLE-
associated mutational signature was implicated in causing many of the driver muta-
tions, consistent with early POLE mutation in these tumours. In the first part of this
chapter I use a related analysis (measuring the covariation between mutational sig-
natures and driver mutations across tumour types) to investigate causation between
a broad range of mutational processes and driver mutations. Specifically, I provide a
comprehensive statistical assessment of the relationship between relative mutational
process activity and driver mutation acquisition across cancer types (methodology
summarised in Figure 5.1 A).
The strength of selection experienced by a mutation is also expected to in-
fluence the frequency at which the mutation is detected in the patient popula-
tion. If two mutations are equally likely to occur, I reason that the more strongly
selected mutation will be found more frequently across cancers. Traditionally,
it has been convenient to classify mutations found in cancer as drivers or pas-
sengers [Bozic et al., 2010], but it is likely that the effects of driver mutations
actually lie on a continuum, including both “mini-drivers” and major drivers
[Castro-Giner et al., 2015, Vogelstein et al., 2013]. However, the relative selective
advantages of individual driver mutations have not yet been quantified. Here, I
present evidence for differential selection between frequently mutated amino acids
within a driver gene by controlling for differences in the sequence-specific mutation
rate, in cases where the mutational signatures alone cannot fully explain the spectra
of mutations in driver genes. I also explore differential selection between sets of re-
lated genes that show patterns of mutational exclusivity (methodology summarised
in Figure 5.1 B).
Together, my analysis quantifies the contributions of both mutation and selec-
tion in shaping the spectrum of driver mutations across cancer types.

5.5. Methods 125
Figure 5.1: Schematic representation of the approach. A) In the first part of the chapter,the effects of mutational process activity on driver mutation frequencies are in-vestigated. For a driver mutation, the change was assigned to one of the 96trinucleotide mutational channels (e.g. CTG>CCG), referred to as the “causalchannel” of the mutation. I hypothesised that mutational signatures in whichthat channel was higher than average would be over-represented in cancers withthese mutations. I tested this hypothesis by comparing the levels of signaturesin cancers harbouring the mutations to those in cancers that did not harbour themutations. B) In the second part of the study, I investigated the effects of mu-tational processes on the relative frequencies of specific pathogenic mutationsin cancer driver genes. The causal channels of the different driver mutations(different amino acid changes) within a gene were identified on a tumour typeby tumour type basis. I then tested whether observed frequencies of each drivermutation differed significantly from those expected based on mutational pro-cess activity alone, thus indicating differential selection between mutations inthe same gene. Using a simple mathematical model, I transformed normalisedmeasurements of mutation frequency into estimates of relative risk betweenmutations. This analysis was then extended to comparisons between mutationsin different driver genes with apparently equivalent functional effects in a can-cer type.
A)
B)
Mutation A (CTG>CCG)
Mutation B (GCG>GTG)
Mutation A (CTG>CCG)
Expe
cted
Obs
erve
d
Expe
cted
Obs
erve
d
Expected and Observed Mutations
Mutation A Mutation B
Mutation Risk
Ris
k
Mutation A Mutation B
Signature S in Samples with Mutation A
Sign
atur
e S
Activ
ity
wt Mutation A
Mutational Signatures
Signature SAverage Signature
CTG>CCG
Prob
abilit
y
Consider mutationcontext in
mutational signature
Statisticallyassess correlation
Consider relativeprobability of
each mutation inmutational signature
Compare observedrelative mutation
frequency to relative mutational
probability
Express asrelative risk
CTG>CCG
Mutational Signatures
Sample Signature
GCG>GTG
Prob
abilit
y
5.5 Methods
5.5.1 Testing for evidence of differential selection between mu-
tations in a cancer type
Here, I present an approach to test mutation frequencies against the null hypothesis
of equivalent selection, by developing the model introduced in Chapter 4
Consider mutations M1 and M2, assumed to be equivalent in the sense defined
in Chapter 4. Let ci be the causal channel of Mi and let ui be the underlying rate
of occurrence of mutation Mi per year. Let S = (p1, ..., p96) represent the active

5.5. Methods 126
mutational signature based on equal trinucleotide frequencies.
Then by 4.1 we have that
P(M1|M1∪M2) =u1
u1 +u2
Or equivalently
P(M1|M1∪M2) =pc1
pc1 + pc2
Let I = {A1, ...,An} be the set of samples in cancer type C in which exactly one
of M1 or M2 occurs and no other mutation in the set of mutations under consideration
for differential selection occurs. Let Si = (pi,1, ..., pi,96) be the mutational signature
of sample Ai.
Therefore, under the null hypothesis of equivalent selection, we can model the
number of samples in which M1 occurs by a Poisson binomially distributed random
variable X
X ∼ Poibin(q1, ...,qn)
Where qi is the probability that M1 occurs in sample Si given that either M1 or
M2 do
qi =pi,c1
pi,c1 + pi,c2
5.5.2 Modelled relative risk
Now assume that M1 and M2 are similar, but not necessarily equivalent, with M1
having relative risk r1,2 compared to M2. By the same logic as above, we model the
probability qi, that M1 is present in sample i given that either M1 or M2 is present
by the following formula:
qi =r1,2 pi,c1
r1,2 pi,c1 + pi,c2
Defining I1 and I2 as the sets of sample numbers where M1 and M2 occurred,

5.5. Methods 127
respectively, then the likelihood of the data, L, is given by:
L = ∏i∈I1
qi ∏i∈I2
(1−qi)
Likelihood maximisation can be used to infer the a value of r1,2 for each pair
of mutations in each tumour type, based on this formula. Bootstrapping can be used
to find approximate confidence intervals around these estimates.
5.5.3 Data collection
Mutation data (single nucleotide alterations- SNAs) were downloaded from the
ICGC and TCGA data portals in May 2016. I excluded data sets aligned to a refer-
ence genome other than hg19, and those with non-conforming formatting.
5.5.4 Sample-specific mutation collection
Only mutations on canonical nuclear chromosomes were considered. For ICGC
data, mutations labelled as “single base substitution” in the simple somatic mutation
files were considered for further analysis. For TCGA data, only mutations labelled
as ‘SNP’ in the mutation annotation files were considered.
From these lists, non-synonymous mutations in driver genes were extracted.
Driver genes definitions were as is stated below. After filtering for drivers, these
mutations were re-annotated using Annovar [Wang et al., 2010]. I included muta-
tions labelled as ‘non-synonymous SNV’, ‘stopgain’, or ‘stoploss’ in a driver gene
in the annotation by Annovar.
5.5.5 Definition of driver genes
Driver genes were defined based on a recent study by Vogelstein et al.
[Vogelstein et al., 2013].
5.5.6 Sample-specific mutational signature estimation
The total number of SNAs in each of the 96 channels was calculated for each
sample. Non-synonymous mutations in driver genes were excluded. Muta-
tional signatures based on equal trinucleotide frequencies were obtained from
the Wellcome Trust Sanger Institute (http://cancer.sanger.ac.uk/cosmic/signatures)

5.5. Methods 128
in April 2016 (Cosmic Signatures). Information on the presence/absence of
these signatures in individual cancer types was obtained from the same source.
Non-negative least squares regression, implemented in the R package ‘nnls’
[Katharine M. Mullen, 2012], was used to model the counts of mutations across
categories in each tumour as a linear combination of the Cosmic Signatures present
in the cancer type. For whole exome data, the Cosmic Signatures were rescaled to
the trinucleotide frequencies of the exome for the regression. The activity of each
process in each cancer sample (based on the trinucleotide frequencies of the sample)
was estimated as the regression coefficient for that signature in that sample. The ac-
tivity of each process in each sample, thus identified by regression, was rescaled
to find the activity of the process for a genomic sequence with equal trinucleotide
frequencies (see Section 4.4). These activities were then normalised to one to find
the mutational signature exposures.
The analysis of differential selection was based on a single mutational signa-
ture based on equal trinucleotide frequencies for each sample. These signatures
were found as follows. For each sample, for each mutation type j, let p j(Πk,E)
represent the frequency of mutation type j in Cosmic Signature k, rescaled to equal
trinucleotide frequencies. Define ek(E) as the exposure to signature k for the sam-
ple found in the paragraph above. The sample-specific signature was estimated as
S = (p1, p2, ..., p96), with p j given by
p j =n
∑k=1
ek(E)p j(Πk,E)
5.5.7 Required mutations for signature assignment
By treating each of the 30 signatures as a multinomial probability distribution, I sim-
ulated data sets from each signature with n total informative mutations (1< n< 96).
For each signature, for each value of n, I applied non-linear least squares regression
to the simulated data to assign weights to the true generating signature and a set of
14 randomly chosen other signatures. I classified the regression as successful when
over 50% of the regression weights were assigned to the true signature. I chose
to use 15 possible generating signatures as this was above the maximum number

5.5. Methods 129
of signatures identified in any individual cancer type. For each signature, for each
number n of informative mutations, I calculated the proportion of simulated data
sets where the regression was successful. I found that 20 mutations gave an average
classification accuracy of 80% across signatures. As a result, I chose to use a cut-
off of 20 mutations to strike a balance between including as many tumour samples
as possible while still maintaining reasonable accuracy of signature assignment. I
repeated the analysis of associations between driver mutations and mutational sig-
natures using a cut-off of 50 mutations per sample for comparison. This analysis
recovered 41 associations, of which 37 were also found using the 20 mutation cut-
off.
5.5.8 Power calculations
I sought to test the power to detect an association between mutation M and the
signature A in cancer type C, where M occurred m times among the c tumours in
C. I considered a simple model of cancer initiation, where M is one of a set of
mutations R of size |R|= n, one of which is required for cancer initiation. For these
purposes I assumed n = 10.
I identified the channel among the 96 possibilities that matched the mutation
M (the causal channel of the mutation). For each random iteration of the power
model I randomly selected causal channels out of 96 possibilities of the 9 other
mutations in R. I identified the signature exposures of each sample in C. By treating
the signatures as multinomial probability distributions, I then calculated the per-
sample probabilities that mutation M occurred rather than any of the 9 mutations in
each sample. Based on these probabilities I randomly selected m samples to bear
the mutation M. I then applied the Mann-Whitney U test described below to test
whether the m mutant samples had significantly higher exposure to signature A than
the c−m samples without the mutation.
I analysed the power to detect an association for each of 1,019 tests for an
association between a recurrent driver mutation and a mutational signature within
a cancer type. Mean power to detect associations was estimated at 13% at alpha
= 0.05 (min = 0%, max = 96%), and 30/1,020 tests had a power above 50%. I

5.5. Methods 130
found that the power was influenced by the number of times a mutation occurred,
as well as the enrichment of the mutation causal channel in the signature compared
to average in the cancer type (Multiple Regression, P < 2×10⁻¹⁶ both variables).
Out of 1,019 triplets tested, relatively few significant associations (43) were
found. The low number of associations can be partly explained by the low average
power. Even if associations were genuinely present in every case, the expected
number of significant tests was 130 based on the estimated power. Part of the reason
for this is the technical challenges inherent in deconvolving mutational signature
intensities. Timing mismatches between the activity of a mutational selection and
the window of selection for a driver mutation probably also contribute to the low
numbers of associations.
5.5.9 Comparison of genomic and exonic mutation distributions
Our study used a combination of whole genome sequencing (WGS) and whole ex-
ome sequencing (WXS) data. The 1,441 whole WGS samples were distributed pre-
dominantly across 8/22 cancer types. In total five associations between mutational
signatures and driver mutations were identified across these eight cancer types (see
results below). All five of these associations were in liver cancer, where 27% of
samples (305/1110) were WGS samples.
To assess the effect of using both whole genome and whole exome samples
on my analysis, I analysed the effect on the results of replacing the WGS data with
only the exonic subset of mutations. I recovered 41/43 associations between driver
mutations and mutational signatures and found no new associations, suggesting that
using WGS data in addition to WXS has a limited effect on the analysis.
5.5.10 Variation explained by mutation probability
For each mutation, the probability of the mutation in each sample of a cancer type
was calculated based on sample-specific mutational signature exposures. The mean
probability across samples was found, as well as the number of times the muta-
tion occurred. Linear regression was carried out to find the proportion of variance
in mutation frequencies across different mutations explained by variation in their

5.6. Results 131
probabilities.
5.5.11 Multiple testing corrections
Multiple testing q values were calculated from test P values using the Benjamini
and Hochberg method.
5.6 Results
5.6.1 Testing for mutational process and driver mutation associ-
ations
I investigated the correlations between mutational process activity and recurrent
driver mutations across cancer types. I reasoned that when a mutational process
acts, it makes specific driver mutations, caused by a mutation in a specific channel
enriched in the mutational signature of the process, more likely. I therefore tested
for a difference in the levels of relative mutational process activity between can-
cers with and without specific driver mutations (Figure 5.1 A). The use of signature
and individual channel activity information was designed to increase the sensitiv-
ity and specificity of the approach. Where the activity of a mutational process was
significantly higher in cancers with a mutation of interest compared to those with-
out, I considered it supporting evidence for a causative relationship between the
mutational process activity and the acquisition of the driver mutation.
Data were obtained and curated from the TCGA and International Cancer
Genome Consortium (ICGC) data portals (see Methods). Driver genes were clas-
sified according to a recent study [Vogelstein et al., 2013]. The data set for anal-
ysis represented 11,336 samples across 22 major cancer types (summarised in Ta-
ble 5.1). There were 1,447 whole genome samples and 9,889 whole exome sam-
ples. Analysis using only exonic mutations from the whole genome samples re-
vealed similar relationships between mutational processes and driver mutations (see
Methods). Downstream analysis was based on 14,356,672 SNAs, of which 40,753
were non-synonymous mutations in driver genes. I did not consider other types of
genome alteration (such as copy number alteration).

5.6. Results 132
Table 5.1: Samples used for study
Disease Prefiltered Samples Filtered Samples1 AML 394 1802 Liver 1153 11103 Bladder 515 5094 Glioblastoma 396 3895 Glioma Low Grade 516 4486 Breast 1107 9097 Cervix 198 1898 CLL 262 1999 Colorectum 531 525
10 Prostate 741 69911 Oesophagus 532 51212 Stomach 450 44113 Head and Neck 616 61014 Thyroid 511 17915 Kidney Clear Cell 573 56016 Kidney Papillary 282 27417 Lung Adeno 230 22818 Lung Squamous 497 49119 Ovary 380 37320 Pancreas 803 71821 Melanoma 344 33722 Uterine Carcinoma 305 303
I excluded 1,153 samples with insufficient mutations for the signature assign-
ments (fewer than 20 mutations), leaving 10,183 samples for further analysis. To
test for potential signature mis-assignment, I also considered a more stringent cut-
off of 50 mutations, which gave similar results (see Methods). In each cancer type,
I classed as “recurrent” non-silent DNA mutations in driver genes that occurred
at least four times in the cancer type (these recurrent mutations were considered
candidate tissue-specific driver mutations). For each mutation, I selected the chan-
nel among the 96 possibilities that matched the observed mutation (hereinafter the
“causal channel” of the candidate driver mutation). For this channel, I identified the
signatures where the frequency of the causal channel was above average, relative
to all mutational processes active in the cancer type. For each of these signatures,
I tested for a correlation between mutational process activity and presence of the
mutation in the cancer type. Specifically, I used a one-sided Mann-Whitney U test

5.6. Results 133
to test whether samples in the cancer type bearing the mutation had significantly
higher exposure to the mutational signature.
5.6.2 Mutational processes shape driver mutation landscape
There were 43 significant correlations between signature activity and driver muta-
tions (Mann-Whitney U test, FDR = 0.05; one-sided test), out of 1,019 triplets of
specific mutations in individual driver genes, mutational signatures and cancer types
tested. Three of the associations involved signatures linked to extrinsic mutational
processes (i.e. mutagens), 30 involved signatures linked to intrinsic mutational pro-
cesses and 10 involved signatures with no known aetiology (Table 5.2 for the full
list of associations).
Of the associations involving signatures linked to extrinsic mutational
processes, signature 4, linked to smoking, was associated with KRAS G12C
(CCA>CAA) in lung adenocarcinoma (Figure 5.2 A) and with CTNNB1 D32Y
(TCC>TAC) in liver cancer. Signature 24, linked to aflatoxin, was associated with
TP53 R249S (GCC>GAC) mutations in liver cancer.
There were multiple associations involving signatures linked to intrinsic mu-
tational processes. APOBEC activity (Signatures 2 and 13) had 11 associations.
Remarkably, PIK3CA E542K (TCA>TTA) and E545K (TCA>TTA) were associ-
ated with these signatures across 5 cancer types, accounting for 82% (9/11) of all
APOBEC associations (Figure 5.2 B). Additionally, PIK3CA E453K (TCT>TTT)
was associated with an APOBEC signature in breast cancer.
DNA mismatch repair (MMR)-linked signatures (signatures 6, 15, 20 and 26)
showed 9 positive associations across four cancer types (stomach, colorectum, uter-
ine carcinoma and glioma low grade). Of these associations, PIK3CA H1047R
(ATG>ACG) occurred twice. FBXW7 R465C (GCG>GTG), was associated with
MMR signatures in both colorectum and stomach cancer (Figure 5.2 C). KRAS
G12D (ACC>ATC) and KRAS G13D (GCC>GTC) were associated with MMR
signatures in uterine carcinoma and stomach cancer respectively (Figure 5.2 D).
These results suggest an important role for MMR defects shaping the driver muta-
tion spectrum of common cancers, and illustrate the likely sequence of events (early

5.6. Results 134
Figure 5.2: Selected associations between driver mutations and mutational process activitywithin cancer types. Q-values shown are for Mann-Whitney U test. A) KRASG12C and signature 4 in lung adenocarcinoma. B) PIK3CA E545K and signa-ture 2 in breast cancer C) FBXW7 R465C and Signature 15 in stomach cancerD) KRAS G12D and signature 26 in uterine carcinoma E) PTEN R130Q andsignature 10 in uterine carcinoma F) APC R213X and signature 1 in colorectalcancer.
A) B)
C) D)
E F)
KRAS G12C (CCA>CAA) and Signature 4 in LUAD
Sign
atur
e 4
wt KRAS G12C (CCA>CAA)
0.0
0.2
0.4
0.6
0.8
1.0
N = 192 N = 36Q=3.9e 02
PIK3CA E545K (TCA>TTA) and Signature 2 in BRCA
Sign
atur
e 2
wt PIK3CA E545K (TCA>TTA)
0.0
0.2
0.4
0.6
0.8
1.0 N = 855 N = 54
Q=2.2e 02
FBXW7 R465C (GCG>GTG) and Signature 15 in Stomach
Sign
atur
e 15
wt FBXW7 R465C (GCG>GTG)
0.0
0.2
0.4
0.6
0.8
1.0
N = 432 N = 9Q=1.5e 03
KRAS G12D (ACC>ATC) and Signature 26 in UC
Sign
atur
e 26
wt KRAS G12D (ACC>ATC)
0.0
0.2
0.4
0.6
0.8
1.0
N = 285 N = 18Q=1.5e 02
PTEN R130Q (TCG>TTG) and Signature 10 in UC
Sign
atur
e 10
wt PTEN R130Q (TCG>TTG)
0.0
0.2
0.4
0.6
0.8
1.0
N = 285 N = 18Q=1.5e 03
APC R213X (ACG>ATG) and Signature 1 in CRC
Sign
atur
e 1
wt APC R213X (ACG>ATG)
0.0
0.2
0.4
0.6
0.8
1.0
N = 510 N = 15Q=4.5e 02

5.6. Results 135
Table 5.2: Associations between mutational signatures and driver mutations within cancertypes. ‘Frequency’: Mutation frequency in the tumour type
Mutation Signature Disease Frequency q-value1 APC R213X (ACG>ATG) 1 Colorectum 0.03 4.50e-022 ERBB2 S310F (TCC>TTC) 2 Bladder 0.04 5.35e-033 PIK3CA E545K (TCA>TTA) 2 Cervix 0.14 8.98e-034 PIK3CA E542K (TCA>TTA) 2 Breast 0.04 1.06e-025 PIK3CA E545K (TCA>TTA) 2 Breast 0.06 2.20e-026 PIK3CA E545K (TCA>TTA) 2 Bladder 0.05 2.47e-027 PIK3CA E542K (TCA>TTA) 2 Lung Squamous 0.03 2.86e-028 PIK3CA E545K (TCA>TTA) 2 Head and Neck 0.05 3.69e-029 PIK3CA E453K (TCT>TTT) 2 Breast 0.01 3.93e-02
10 CTNNB1 D32Y (TCC>TAC) 4 Liver 0.01 2.76e-0211 KRAS G12C (CCA>CAA) 4 Lung Adeno 0.16 3.93e-0212 ALK R259P (GCG>GGG) 5 Glioblastoma 0.01 1.32e-0213 PTPN11 S189A (TTC>TGC) 5 Glioblastoma 0.01 3.13e-0214 HRAS Q61R (CTG>CCG) 5 Bladder 0.01 3.93e-0215 PTPN11 Y197X (ATA>AGA) 5 Glioblastoma 0.01 4.16e-0216 KIT K642E (TTG>TCG) 5 Melanoma 0.01 4.66e-0217 FBXW7 R465C (GCG>GTG) 6 Colorectum 0.02 1.34e-0218 IDH1 R132H (ACG>ATG) 6 Glioma Low Grade 0.72 2.76e-0219 PTEN R130Q (TCG>TTG) 10 Uterine Carcinoma 0.06 1.48e-0320 PIK3R1 R348X (TCG>TTG) 10 Uterine Carcinoma 0.03 3.44e-0321 ARID1A R1989X (TCG>TTG) 10 Uterine Carcinoma 0.03 3.72e-0322 APC R2204X (TCG>TTG) 10 Uterine Carcinoma 0.02 8.98e-0323 PTEN R130Q (TCG>TTG) 10 Colorectum 0.01 1.19e-0224 SF3B1 R957Q (TCG>TTG) 10 Uterine Carcinoma 0.01 1.32e-0225 FUBP1 R430C (TCG>TTG) 10 Uterine Carcinoma 0.01 1.60e-0226 PIK3CA R88Q (TCG>TTG) 10 Colorectum 0.02 3.30e-0227 APC R1114X (TCG>TTG) 10 Colorectum 0.04 3.33e-0228 PIK3CA E545K (TCA>TTA) 13 Head and Neck 0.05 1.06e-0229 PIK3CA E542K (TCA>TTA) 13 Lung Squamous 0.03 1.28e-0230 PIK3CA E545K (TCA>TTA) 13 Bladder 0.05 2.78e-0231 ATRX R1426X (GCG>GTG) 14 Glioma Low Grade 0.01 4.56e-0232 FBXW7 R465C (GCG>GTG) 15 Stomach 0.02 1.48e-0333 KRAS G13D (GCC>GTC) 15 Stomach 0.02 4.56e-0234 CTNNB1 S37C (TCT>TGT) 16 Liver 0.01 3.93e-0235 CTNNB1 S45Y (TCT>TAT) 16 Liver 0.01 4.70e-0236 PIK3CA H1047R (ATG>ACG) 20 Stomach 0.04 7.40e-0437 KRAS G13D (GCC>GTC) 20 Stomach 0.02 8.98e-0338 PIK3CA H1047R (ATG>ACG) 21 Stomach 0.04 2.17e-0239 CTNNB1 S37F (TCT>TTT) 23 Liver 0.01 7.36e-0340 TP53 R249S (GCC>GAC) 24 Liver 0.01 1.01e-0441 FBXW7 R465C (GCG>GTG) 26 Stomach 0.02 3.07e-0442 PIK3CA H1047R (ATG>ACG) 26 Stomach 0.04 7.40e-0443 KRAS G12D (ACC>ATC) 26 Uterine Carcinoma 0.06 1.46e-02
MMR-linked mutational processes relative to driver mutation acquisition) in some
cancers with these defects.
Nine associations with deficiency in DNA-proofreading (signature 10) were

5.6. Results 136
seen in uterine carcinoma and colorectum. PTEN R130Q (TCG>TTG) was asso-
ciated with this signature in both colorectum and uterine carcinoma (Figure 5.2 E).
2/11 positive associations involved stop-gain mutations in the APC gene, one in
colorectum and one in uterine carcinoma. Therefore it appears that POLE defects
may cause characteristic driver lesions in these cancer types.
Six of the associations involved signatures that are known to correlate with age
at diagnosis [Alexandrov et al., 2015]. Of particular note, signature 1 was associ-
ated with APC R213X (ACG>ATG) in colorectum (Figure 5.2 F). This result in
particular highlights the important role of ageing-related processes in cancer devel-
opment.
Our test for correlation between mutational processes and driver mutations
focussed on processes which exhibit higher activity of the causal channel. This
reduces the overall number of tests and increases the power to detect putative as-
sociations. However, to probe whether mutational processes and driver mutation
acquisition are correlated in general, I repeated the analysis above without restrict-
ing the tests to signatures where the frequency of the causal channel was above
average in the cancer type. An enrichment for positive associations between driver
mutations and signatures where the underlying process has a higher than average
activity of the causal channel would be indicative of a mechanistic relationship.
Indeed, I found that 24 out of 37 significant associations had higher than average
channel activity, compared to only 13 cases where the causal channel was lower
than average (P = 5.5× 10⁻⁵; Fisher’s Exact Test; Figure 5.3), supporting the no-
tion that the respective mutational processes are responsible for the driver mutation.
However, since my analysis is correlative, I cannot entirely rule out the possibility
of other explanations for these associations. Despite this, the results above support
a model whereby mutational processes play an important role in determining driver
mutation spectrum.
5.6.3 Detecting differential selection
Driver mutations are recurrent in cancer because they experience positive selection.
Consequently, the frequency that a particular driver is observed across cancers is

5.6. Results 137
Figure 5.3: Causal channels of associations between mutational signatures and driver mu-tations. Log fold change of the causal channel of the driver mutation in themutational signature for significantly associated driver mutations and muta-tional signatures within cancer types (red) and for those with no association(grey). To calculate the log fold change, 1/96 was added to the probability ofthe causal channel in the mutational signature, and to the average probabilityof the causal channel across signatures present in the cancer type. The log foldchange shown represents the logarithm of the ratio of the two resulting values.
All tests
Log fold change causal channel
Fre
quen
cy
−4 −2 0 2 4
010
030
050
0
P = 5.5e−05
AssociationNo Association
a function both of the mutational likelihood of it occurring in the first place, and
also the selective advantage that the mutation confers. Accordingly, the selective
difference between the mutations can be inferred by normalising the observed fre-
quency of the mutations across cancers by their underlying mutational likelihood
(see Methods for mathematical model). With this logic as my foundation, I there-
fore aimed to quantify the differences in selective advantage between (typically)
mutually exclusive driver mutations by using the results from the first part of this
chapter to normalise for mutational likelihood.
To test for differential selection between two related mutations in a cancer type
(e.g. mutation of different residues of the same driver gene), I calculated the fre-
quency of each mutation and their relative likelihoods of occurrence, inferred from

5.6. Results 138
the mutational process exposures (as per the analysis above). I then used the Pois-
son binomial test to examine the null hypothesis that the mutation counts were ex-
plained solely by their relative mutational likelihood of occurrence (see Methods).
I explored potential differential selection among the most common driver mutations
(> 1% of non-synonymous mutations) in nine genes: KRAS, BRAF, NRAS, IDH1,
IDH2, TP53, PIK3CA, SMAD4 and CTNNB1 in individual cancer types. I con-
ducted pairwise tests among the common mutations from each gene in each cancer
type where the common mutations in the gene occurred at least 10 times.
5.6.4 Differential selection between pathogenic amino acid
changes within a driver gene
Differential selection between driver genes was common. In total, 19% (655/3,476)
of pairwise comparisons between mutational-likelihood corrected frequency of mu-
tations of different residues in the same gene in individual cancer types returned a
significant result (Binomial Test, FDR = 0.05, Figure A.1-A.11). All 9 genes ex-
amined had at least one pair of mutations that occurred at frequencies inconsistent
with the underlying mutational likelihood.
Among the most highly significant results, KRAS G12R appeared more
strongly selected than other KRAS mutations, including KRAS G12C and G13D,
in pancreatic cancer (quantified by the relative risk of the mutation occurring rel-
ative to a reference mutation; Figure 5.4 A), as did BRAF V600E compared to
other BRAF common mutations, including BRAF K601E, in thyroid, melanoma
and colorectal cancer. Also highly significant was apparent preferential selection
for PIK3CA H1047R compared to multiple PIK3CA mutations, including PIK3CA
E545K and E542K, in breast cancer (Figure 5.4 B), and for NRAS Q61K and Q61R
above NRAS G12D and G13D in melanoma. These results suggest that there are
strong selective differences among important driver mutations in the same gene in
these cancer types.
A number of the results are of potential therapeutic interest. For example, I
found evidence that IDH1 R132H is selected more strongly than IDH1 R132C in
low grade glioma (Figure 5.4 C) and glioblastoma. This is of particular interest

5.6. Results 139
Figure 5.4: A, Modelled Relative risk (RR) of frequent KRAS mutations in pancreatic can-cer compared to KRAS G12R. For each mutation, the maximum likelihood es-timate of relative risk compared to KRAS G12R is shown. B, C, and D illus-trate modelled relative risk for respectively, PIK3CA mutations in breast cancer,IDH1 mutations in glioma low grade, and KRAS mutations in lung adenocarci-noma. Grey dashed line indicates relative risk of one. Error bars represent 95%confidence intervals obtained by bootstrapping across 100 iterations.
A)
C)
B)
D)
A146
TG
12S
G13
DG
12A
G12
CQ
61H
(CTT
>CAT
)Q
61H
(CTT
>CG
T)G
12V
G12
DG
12R
KRAS in Pancreas
RR
vs
G12
R
0.00.20.40.60.81.01.2
R88
QE7
26K
E453
KG
118D
Q54
6KE5
42K
C42
0RQ
546R
E545
KH
1047
LN
345K
H10
47R
PIK3CA in Breast
RR
vs
H10
47R
0.00.20.40.60.81.01.2
R13
2C
R13
2S
R13
2H
R13
2G
IDH1 in Glioma Low Grade
RR
vs
R13
2H
0.0
0.5
1.0
1.5
2.0
G13
DQ
61H
(CTT
>CG
T)A1
46T
Q61
H (C
TT>C
AT)
G12
SG
12R
G12
DG
12V
G12
AG
12C
KRAS in Lung Adeno
RR
vs
G12
C
0.00.20.40.60.81.01.2
given the potential specificity of therapeutic small molecular inhibitors that target
IDH1 and IDH2 mutations [Garrett-Bakelman and Melnick, 2016].
KRAS G12C, which was found to be associated with smoking-associated signa-
ture 4 in lung adenocarcinoma (see above), also appears more strongly selected than
other KRAS mutations (including G12D, G12R, and G13D) in this cancer type (Fig-
ure 5.4 D). Thus it appears that the high frequency of this KRAS mutation compared
to others in lung adenocarcinoma is, potentially, due to both smoking-associated
mutational processes and the intrinsic selective advantage of the mutation.
Interestingly, the relative selective advantages of particular pathogenic muta-
tions in each gene were broadly consistent across cancer types. Specifically, there
were only 7/118 cases of differentially selected mutations where a mutation ap-

5.6. Results 140
peared selected more strongly than another in the same gene in one cancer type, but
less strongly in another cancer type. These included 3 pairs of KRAS mutations,
two pairs of PIK3CA mutations and two pairs of TP53 mutations. Of note, KRAS
mutations, KRAS G12C appeared selected above KRAS G12D and KRAS Q61H
(CTT>CGT) in lung adenocarcinoma, but below these mutations in pancreatic can-
cer. And PIK3CA E545K appeared selected above PIK3CA H1047R and PIK3CA
N345K in colorectum, but below these mutations in breast cancer. Since the method
controls for differences in mutational process activity between cancer types, these
results provide evidence to support the hypothesis that the mechanisms that under-
pin the selective advantage caused by a specific driver mutation are broadly uniform
across tissue types.
5.6.5 Differential selection between mutationally-exclusive
driver genes
I next used the same methodology to investigate differential selection between mu-
tations within and between small sets of genes that typically show mutually exclu-
sive mutation patterns. I considered the common driver mutations in three sets of
functionally-related genes: KRAS, BRAF and NRAS; APC and CTNNB1; and IDH1
and IDH2.
There was evidence of greater selective differences between genes than be-
tween different residues within a gene. 12% (306/2,541 pairwise comparisons)
of tests were significant for mutations within a gene, whereas 28% (841/2,995)
were significant for mutations in different genes (Figures A.12-A.20)). Further-
more, for two of the mutation sets - KRAS, BRAF and NRAS (Figure 5.5); and
APC and CTNNB1 (Figure 5.6) - there was significant heterogeneity across cancer
types in terms of the number of mutations in each gene with evidence of prefer-
ential selection (selection above at least one other mutation in the set) (Fisher test,
Q = 2.2×10⁻³, 7.2×10⁻⁷, respectively), supporting a model where gene-specific
effects on selection vary across cancer types.
Amongst KRAS, BRAF and NRAS mutations, only particular KRAS mutations
showed evidence of preferential selection over mutations in other genes in pan-

5.6. Results 141
Figure 5.5: The number of mutations from each of KRAS, BRAF and NRAS with a fre-quency significantly greater than expectation under equivalent selection com-pared to at least one other mutation in each cancer type. Whereas colorectumand pancreas cancer appeared to be dominated by selection for KRAS muta-tions, melanoma appeared to be dominated by selection for NRAS and BRAFmutations.
1
2
1
1
8
1
1
0
0
1
3
0
0
1
0
0
7
0
0
1
0
0
3
0
3
1
5
1
0
2
BRAF
KRAS
NRAS
Bla
dder
Col
orec
tum
Glio
blas
tom
a
Lung
Ade
no
Mel
anom
a
Oes
opha
gus
Pan
crea
s
Sto
mac
h
Thy
roid
Ute
rine
Car
cino
ma
Disease
Gen
e
02468
value
creatic cancer and uterine carcinoma (Figure 5.7 A,B), whereas preferential selec-
tion across genes was predominantly in favour of BRAF and NRAS mutations in
melanoma and thyroid cancer (Figure 5.7 C,D). Illustrating this, BRAF V600E and
NRAS Q61R appeared to be selected more strongly than KRAS G12D in melanoma
and thyroid cancer, but more weakly than this mutation in pancreatic cancer. Other
cancer types showed a range of patterns of differential selection for these three
genes (Figures 5.7 E,F).
When APC and CTNNB1 mutations were compared, there was evidence for
selection of CTNNB1 mutations over common APC mutations in each of liver can-
cer, uterine carcinoma, prostate cancer and colorectal cancer (Figure 5.8 A,B,C).
Interestingly however, evidence for selection of APC mutations above CTNNB1
mutations was found in colorectal cancer only (Figure 5.8 C). I note that this mu-
tation, APC Q1378X, falls within the functionally defined mutation cluster region

5.6. Results 142
Figure 5.6: The number of mutations from each of CTNNB1 and APC with a frequencysignificantly greater than expectation under equivalent selection compared to atleast one other mutation in each cancer type. Whereas liver cancer and uter-ine carcinoma appeared to be dominated by selection for CTNNB1 mutations,colorectum appeared to be dominated by selection for APC mutations.
7
1
0
22
0
2
0
13
APC
CTNNB1C
olor
ectu
m
Live
r
Pro
stat
e
Ute
rine
Car
cino
ma
Disease
Gen
e
05101520
value
(MCR) of the gene [Rowan et al., 2000].
Among IDH1 and IDH2 mutations, I found preferential selection for IDH1
R132H (glioma low grade, AML and glioblastoma), IDH1 R132C (glioma low
grade, AML, liver cancer and melanoma), IDH1 R132G and IDH1 R132S (glioma
low grade) above common IDH2 mutations, as well as preferential selection for
IDH2 R172K above IDH1 R132C in glioma low grade.
Taken together these results inform our understanding of the selective land-
scape experienced by driver genes, and its similarities and differences between can-
cer types. Across the cancer types and mutation sets considered there was a positive
correlation (correlation coefficient > 0) between mutation frequency and mutation
probability in 58/76 cases. Among these cases on average 20% (mean R-squared)
of variation in frequency between related mutations within the cancer type is ex-
plained by variation in mutation probabilities. This suggests an important role for

5.6. Results 143
Figure 5.7: Evidence for differential selection between mutations in KRAS, BRAF andNRAS. Bar plots show modelled relative risk of KRAS, BRAF, and NRAS mu-tations (compared to a reference mutation). A Modelled relative risk of KRAS,BRAF and NRAS, mutations compared to KRAS G12R in pancreatic cancer. BAs above, with comparison to KRAS G12A mutations in uterine carcinoma. CAs above, with comparison to BRAF V600E mutations in melanoma. D Asabove, with comparison to BRAF V600E mutations in thyroid cancer. E Asabove, with comparison to BRAF V600E in colorectum. F As above, withcomparison to KRAS G12C in lung adenocarcinoma.
A)
C)
E)
B)
D)
F)
KRAS
A14
6TBR
AF N
581S
BRAF
G46
9ABR
AF V
600E
BRAF
D59
4NBR
AF K
601E
BRAF
G46
6EN
RAS
G13
DN
RAS
Q61
HN
RAS
G12
CN
RAS
Q61
KN
RAS
G13
RN
RAS
Q61
RN
RAS
Q61
LKR
AS G
12S
NR
AS G
12D
KRAS
G13
DBR
AF D
594G
KRAS
G12
AKR
AS G
12C
KRAS
Q61
H (C
TT>C
AT)
KRAS
Q61
H (C
TT>C
GT)
KRAS
G12
VKR
AS G
12D
KRAS
G12
R
Pancreas
RR
vs
KRAS
G12
R
0.0
0.2
0.4
0.6
0.8
1.0
1.2
BRAFKRASNRAS
KRAS
A14
6TKR
AS G
12R
KRAS
Q61
H (C
TT>C
AT)
BRAF
D59
4GBR
AF N
581S
BRAF
G46
9ABR
AF V
600E
BRAF
D59
4NBR
AF G
466E
NR
AS G
13D
NR
AS Q
61H
NR
AS G
12C
NR
AS Q
61K
NR
AS G
13R
NR
AS Q
61L
KRAS
G12
SN
RAS
G12
DBR
AF K
601E
KRAS
G13
DKR
AS Q
61H
(CTT
>CG
T)N
RAS
Q61
RKR
AS G
12C
KRAS
G12
DKR
AS G
12A
KRAS
G12
V
Uterine Carcinoma
RR
vs
KRAS
G12
V
0.0
0.5
1.0
1.5
2.0
KRAS
G12
SKR
AS G
12V
KRAS
G12
DKR
AS G
13D
KRAS
Q61
H (C
TT>C
GT)
KRAS
G12
AKR
AS G
12C
KRAS
A14
6TKR
AS G
12R
KRAS
Q61
H (C
TT>C
AT)
BRAF
D59
4GBR
AF N
581S
BRAF
G46
9ABR
AF D
594N
BRAF
K60
1EBR
AF G
466E
NR
AS G
13D
NR
AS G
12D
NR
AS Q
61H
NR
AS G
12C
NR
AS G
13R
NR
AS Q
61L
NR
AS Q
61K
NR
AS Q
61R
BRAF
V60
0E
Thyroid
RR
vs
BRAF
V60
0E
0.0
0.2
0.4
0.6
0.8
1.0
1.2
KRAS
G12
SKR
AS G
12V
KRAS
G13
DKR
AS Q
61H
(CTT
>CG
T)KR
AS G
12A
KRAS
G12
CKR
AS A
146T
KRAS
Q61
H (C
TT>C
AT)
BRAF
D59
4GBR
AF G
469A
NR
AS G
12D
NR
AS G
12C
BRAF
D59
4NBR
AF G
466E
KRAS
G12
DN
RAS
G13
DBR
AF N
581S
NR
AS Q
61H
KRAS
G12
RBR
AF K
601E
NR
AS G
13R
NR
AS Q
61L
NR
AS Q
61R
NR
AS Q
61K
BRAF
V60
0E
Melanoma
RR
vs
BRAF
V60
0E
0.0
0.2
0.4
0.6
0.8
1.0
1.2
BRAF
N58
1SBR
AF K
601E
BRAF
G46
6EN
RAS
Q61
HN
RAS
G13
DBR
AF D
594G
NR
AS G
12C
NR
AS Q
61R
BRAF
D59
4NN
RAS
G12
DKR
AS A
146T
KRAS
Q61
H (C
TT>C
AT)
BRAF
G46
9AKR
AS Q
61H
(CTT
>CG
T)N
RAS
G13
RN
RAS
Q61
LKR
AS G
12S
KRAS
G13
DN
RAS
Q61
KKR
AS G
12C
KRAS
G12
RKR
AS G
12A
KRAS
G12
DKR
AS G
12V
BRAF
V60
0E
Colorectum
RR
vs
BRAF
V60
0E
0.0
0.2
0.4
0.6
0.8
1.0
1.2
KRAS
G13
DKR
AS Q
61H
(CTT
>CG
T)KR
AS A
146T
KRAS
Q61
H (C
TT>C
AT)
BRAF
D59
4GBR
AF G
469A
BRAF
K60
1EBR
AF G
466E
NR
AS G
13D
NR
AS G
12D
NR
AS Q
61H
NR
AS G
12C
NR
AS Q
61K
NR
AS G
13R
NR
AS Q
61R
BRAF
D59
4NKR
AS G
12S
KRAS
G12
RN
RAS
Q61
LBR
AF N
581S
KRAS
G12
DBR
AF V
600E
KRAS
G12
VKR
AS G
12A
KRAS
G12
C
Lung Adeno
RR
vs
KRAS
G12
C
0.00.20.40.60.81.01.2

5.6. Results 144
Figure 5.8: Evidence for differential selection between mutations in APC and CTNNB1.Equivalent to Figure 5.7, for APC and CTNNB1 mutations in A, liver cancer,B, uterine carcinoma and C, colorectum.
A)
B)
C)
APC
R22
04X
APC
R21
6X
APC
R14
50X
APC
R21
3X
APC
R49
9X
APC
R87
6X
APC
R11
14X
APC
Q13
78X
APC
R23
2X
CTN
NB1
G34
R
CTN
NB1
D32
Y
CTN
NB1
D32
N
CTN
NB1
S37
P
CTN
NB1
G34
E
CTN
NB1
S33
P
CTN
NB1
S33
F
CTN
NB1
T41
I
CTN
NB1
G34
V
CTN
NB1
D32
G
CTN
NB1
S33
Y
CTN
NB1
S45
Y
CTN
NB1
S37
F
CTN
NB1
S37
C
CTN
NB1
S45
F
CTN
NB1
D32
V
CTN
NB1
T41
A
CTN
NB1
S33
C
CTN
NB1
S45
P
CTN
NB1
K33
5I
CTN
NB1
I35S
CTN
NB1
H36
P
Liver
RR
vs
CTN
NB1
H36
P
0.00.20.40.60.81.01.2 APC
CTNNB1
CTN
NB1
S45
P
CTN
NB1
H36
P
CTN
NB1
K33
5I
CTN
NB1
D32
V
CTN
NB1
S45
Y
APC
R21
6X
APC
R14
50X
APC
R21
3X
APC
R49
9X
APC
R87
6X
APC
Q13
78X
APC
R11
14X
APC
R23
2X
APC
R22
04X
CTN
NB1
T41
A
CTN
NB1
G34
E
CTN
NB1
G34
V
CTN
NB1
S33
P
CTN
NB1
D32
G
CTN
NB1
S45
F
CTN
NB1
T41
I
CTN
NB1
D32
N
CTN
NB1
S37
P
CTN
NB1
I35S
CTN
NB1
S33
Y
CTN
NB1
D32
Y
CTN
NB1
S33
F
CTN
NB1
G34
R
CTN
NB1
S37
F
CTN
NB1
S33
C
CTN
NB1
S37
C
Uterine Carcinoma
RR
vs
CTN
NB1
S33
C
0
1
2
3
4
CTN
NB1
S45
P
CTN
NB1
G34
V
CTN
NB1
G34
E
CTN
NB1
G34
R
CTN
NB1
H36
P
CTN
NB1
K33
5I
CTN
NB1
S37
C
CTN
NB1
S33
F
CTN
NB1
D32
G
CTN
NB1
S33
P
CTN
NB1
D32
Y
CTN
NB1
S37
P
CTN
NB1
D32
V
CTN
NB1
S33
Y
CTN
NB1
I35S
CTN
NB1
S45
Y
CTN
NB1
D32
N
APC
R22
04X
APC
R49
9X
APC
R21
3X
APC
R21
6X
APC
R23
2X
APC
R87
6X
APC
R14
50X
APC
R11
14X
CTN
NB1
S37
F
CTN
NB1
S45
F
CTN
NB1
T41
I
CTN
NB1
T41
A
CTN
NB1
S33
C
APC
Q13
78X
Colorectum
RR
vs
APC
Q13
78X
0.00.20.40.60.81.01.21.4

5.7. Conclusion 145
selective differences in explaining this variation. These results suggest that both
intra-gene and inter-gene effects contribute to differential selection, with inter-gene
but not intra-gene effects varying across cancer types.
5.7 Conclusion
Here, I have demonstrated correlations between mutational processes and key driver
mutations across cancer types, and highlighted the possibility that these correlations
may actually be the result of the mutational process causing specific driver muta-
tions. Moreover, by normalising for mutational likelihood I have quantified rela-
tive selective differences between related key driver mutations across cancer types,
which sheds light on the selective landscape constraining cancer evolution.
Many of the associations between mutational processes and driver mutations
presented here are novel to the best of our knowledge, and warrant further molecular
investigation to explore causality. My analysis suggests that an ageing-associated
process (signature 1) may cause initiating events in colorectal cancer because of the
implied role of the process in causing APC R213X “gatekeeping” mutations in col-
orectal cancer [Vogelstein et al., 2013, Rowan et al., 2000] suggesting a sometimes
critical role for mutations that occur randomly on cell divisions in this cancer type
[Tomasetti and Vogelstein, 2015].
Previous work by McGranahan et al. examined the relationship between
APOBEC associated mutational processes (signatures 2 and 13) and driver muta-
tions and found that clonal non-synonymous mutations in driver genes occur in an
APOBEC context in bladder cancer [McGranahan et al., 2015]. They also described
subclonal mutations in driver genes in an APOBEC context in bladder, breast, head
and neck, and lung cancers (cervical cancer was not considered). Supporting their
findings, I detected associations with APOBEC in bladder cancer and breast can-
cer, and to a lesser extent in head and neck, lung squamous, and cervical cancer.
Notably, I report novel associations between APOBEC activity and ERBB2 S310F
mutations in bladder cancer. Our findings support the impression of a pervasive
effect of APOBEC activity on driver mutation spectra in human cancers. Some as-
5.7. Conclusion 146
sociations I describe have been reported previously, notably the association between
pack years of smoking and the KRAS G12C mutation in lung adenocarcinoma where
the connection between the causal channel of this mutation (C>A in a CCA con-
text) and the general tendency for tobacco carcinogens to cause transversions is well
known [Dogan et al., 2012, Riely et al., 2008].
Remarkably, 14/43 associations between mutational signatures and driver
mutations involved PIK3CA mutations, and most of these associations in-
volved signatures linked to APOBEC, which tends to occur later in carcino-
genesis [McGranahan et al., 2015]. Thus, late arising APOBEC linked mu-
tational processes can still have important influences on the driver mutation
spectrum. Recent results showing that PIK3CA mutations are often subclonal
[McGranahan et al., 2015] support this interpretation.
Through normalising for mutational likelihood, I have also been able to quan-
tify the relative contribution of clonal selection, over and above mutational likeli-
hood, in determining driver mutation spectra across cancers. I found evidence for
widespread differences in selective effects between mutations in the same gene and
related genes, and moreover, that these differences appear to vary across cancer
types. These results confirm that not all driver mutations have the same selective
effects, and instead exist on a spectrum of selective potency. Both mutational likeli-
hood and selective difference strongly contribute to the occurrence of specific driver
mutations in cancers.
The selective differences between mutations identified here relate to a diverse
set of genes, including genes encoding proteins involved in intra-cell signalling
(TP53, KRAS, BRAF, NRAS and APC), a protein involved in inter-cell signalling
(CTNNB1), a transcription factor (SMAD4) and proteins involved in metabolism
(IDH1 and IDH2). Interestingly the selective differences we have identified also
span both traditional oncogenes (KRAS) and traditional tumour suppressor genes
(TP53). As a result of this diversity, it is likely that the selective differences identi-
fied here relate to a wide range of differences in biological function. Speculatively,
it is possible that selective differences within SMAD4 could relate to differential

5.7. Conclusion 147
DNA binding affinity of the encoded transcription factor, or that differences among
IDH1 and IDH2 activity could relate to differences in metabolic enzymatic activity.
Although the definitive identification of the biological explanation for these differ-
ences is beyond the scope of the current data, this will be important to assess in
future work.
On a related point, the differences I have identified could reflect variation in
the potential of the mutations in question to initiate disease, or alternately variation
in the growth advantages conferred by these cells in established tumours. Interest-
ingly, if there are differences in on-going growth advantages, then our data suggests
that the forces of selection acting in tumours are often insufficient (or have insuf-
ficient temporal opportunity [Sottoriva et al., 2015]) to displace sub-optimal muta-
tions, as less highly selected mutations remain detectable. For a limited number
of driver genes, there is evidence to suggest that specific mutations correlate with
disease outcomes [Margonis et al., 2015, Goh et al., 1995]. Further work is needed
to clarify whether and to what extent the selective differences indicated here have
prognostic and therapeutic implications.
In lung cancer, the KRAS G12C mutation provides a striking example of the
potential for “alignment” of mutation and selection: the likelihood of the KRAS
G12C mutation is increased by smoking, but in addition it is also selectively ad-
vantageous above other common KRAS mutations in the disease. The same is also
true for PIK3CA H1047R mutations in stomach cancer, wherein MMR-associated
processes increase the likelihood of the driver mutation, which is then subsequently
strongly selected.
There are caveats to this analysis. First, I have used data from a number of
sources, which may vary in terms of quality, depth of coverage and the pipeline
used to call mutations. Secondly, I have relied on the assignment of signatures
to individual samples and I note that some samples have relatively few mutations,
making this assignment less accurate. Relatedly, in some cancer types, there are
other active signatures that were not considered in this study. Where other signa-
tures are present, the regression method used here can only approximate the signa-

5.7. Conclusion 148
ture contributions. Thirdly, some mutational signatures are similar to each other in
composition, making it difficult to determine whether mutations are generated by
one or more independent processes. I rely on assumptions of uniformity of a mu-
tational process across the genomic loci considered, and over time. Finally, causal
links between driver mutations and mutational processes are one explanation for the
associations presented here, but other explanations cannot be ruled out from these
data alone.
In summary, our framework quantifies the combined influence of both mutation
and selection on shaping a cancer’s driver mutation complement – and importantly
emphasises that neither evolutionary force alone provides a sufficient explanation of
the observed mutation distribution. In colon cancer for example, BRAF mutations
(that are relatively uncommon) are mutationally unlikely, but are strongly selected.
By contrast, KRAS drivers (that are more common), are mutationally much more
likely, but are less highly selected. Our data also offer an explanation for the high
frequency of driver APC mutations and relative paucity of driver CTNNB1 muta-
tions in the colon: APC mutations can be both more strongly selected and more
mutationally likely than CTNNB1 mutations.
Overall, our results begin to quantitatively delineate the distinct contributions
of mutation and selection in shaping the spectra of driver mutations in the cancer
genome.

Chapter 6
Discussion
Over the course of this thesis, I have presented results on both the timing and causa-
tion of mutations during cancer evolution, and have pointed to selective differences
between key driver mutations. Here, I discuss the implications of these results for
cancer surveillance and prevention, as well as the implications of the results for our
wider understanding of the process of cancer evolution.
My findings on mutation timing have potential implications for tumour surveil-
lance. I have argued that POLE mutations are early events in colorectal and endome-
trial cancers in which they occur somatically. CNAs, by contrast, appear to often
occur in a cluster of late events (close to the last common ancestor of cancer cells) in
colorectal cancer. The early occurrence of POLE mutations make them good can-
didates for surveillance programs, albeit the relatively small proportion of tumours
in which these mutations are found must be taken into account. In terms of CNA
mutations, our results suggest that there may be limited scope to assess progres-
sion towards colorectal cancer in terms of CNA accumulation, since the window of
time before the last clonal expansion during which these changes are detectable is
relatively narrow.
The results presented here also point to mechanisms of mutation causation
that could be of relevance for cancer prevention. The results in Chapters 4 and
5 identify a key role for potentially modifiable alterations to the mutation rate in
accumulation of driver mutations. Whereas, the results of Chapter 3 support the
hypothesis that WGD events play an important role in the aetiology of colorectal

150
cancer, and motivate further research into the mechanisms of this type of change.
The differential selection results presented here are of interest for our wider
understanding of cancer evolution. These results challenge the prevailing thinking
on driver mutations and passenger mutations by demonstrating a spectrum of selec-
tive effects between driver mutations. Many previous studies have assumed a fixed
selective impact among drivers [Beerenwinkel et al., 2007, Waclaw et al., 2015,
McFarland et al., 2014]. Some studies have allowed for a distribution of effects, but
have relied on indirect estimates for parameter estimation [Foo et al., 2015]. My
results argue in favour of incorporating such distributions in future studies, and also
point to possible parameterisations.
These analyses have some limitations. My results on timing and causation
can be interpreted as describing the lineage of cells that eventually became the tu-
mour. The population dynamics that describes interactions between cells (including
lineages that did not survive to the final tumour) are difficult to access from the
tumour-only data I have analysed in this thesis. Similarly, as alluded to in Chapter
5, further experiments are needed to interpret the results on differential selection in
terms of cellular dynamics.
Some of the other results here are also informative about these population dy-
namics, but to a relatively limited extent. My analysis of CNA timing points to
historic clonal expansions in copy-number-altered cells. Our analysis of breast can-
cer risk suggests that the population frequencies of stem and progenitor cells may
vary over time in breast tissue. These results begin to reveal complex population
dynamics involved in the growth of tumour populations, but, clearly, much remains
to be done.
Cellular dynamics can be addressed in two ways. First, by directly
sequencing and analysing normal and early-cancer tissue, intermediate lin-
eages that would be lost in later samples can be directly analysed. Recent
studies that measure mutation accumulation in normal tissue provide useful
data in this regard [Martincorena et al., 2015, Blokzijl et al., 2016]. And it is
likely that similar studies focusing on normal tissue dynamics will soon be-
151
come available (http://www.sanger.ac.uk/science/programmes/cancer-genetics-
and-genomics). Secondly, theoretical considerations, and mathematical modelling
approaches can be used to impute cellular dynamics in the current data using ex-
perimental evidence, similar to the approach in Chapter 2. Both these avenues are
of potential interest for future work.
Recently, the longstanding theory of cancer causation by mutation has been
challenged from multiple directions, which will also be important to bear in mind
in future work. First, mounting evidence suggests that non-genetic factors influence
cancer initiation and progression. The role of methylation of the MLH1 gene in the
aetiology of MSI cancers is an obvious example. The role of the immune system has
been discussed above. Convincing evidence is emerging that the microbiome plays
a role in sustaining tumour growth [Bullman et al., 2017]. These considerations
highlight the increasing acceptance that a broad focus is required to understand the
spectrum of factors that determine cancer risk, of which mutation processes are only
a subset.
In conclusion, I have presented mathematical modelling results on the tim-
ing and causation of mutations during cancer evolution. I have analysed the selec-
tive differences between putative cancer mutations across cancers by controlling for
mutation-causing processes using similar techniques. These results have potential
implications for tumour prevention and surveillance. They also begin to shed light
on the emerging complexity of the processes that shape tumour genome landscapes
and play a role in tumour initiation and progression. In total, the work provides a
contribution to the growing body of work on the forces that govern the course of
tumour evolution.

Chapter 7
Methods
7.1 Standard Mutation Calling PipelineA large part of my work is based on analysis of sequencing data. Except where
otherwise specified in the results, I followed the below steps to process DNA se-
quencing data and identify mutations.
7.1.1 Quality Control
Raw sequencing read data was received in either ’fastq’ format. The FastQC soft-
ware [Simon, 2010] was used to assess the data quality. This software calculates a
range of relevant metrics, including the per base sequence quality.
Fastq files for each sample were analysed for quality with the with:
fastqc [sample.read1.fa] [sample.read2.fa]
7.1.2 Alignment and Preprocessing
The Burrows-Wheeler Aligner (BWA) [Heng and Durbin, 2009] was used to align
read files against the ’hg19’ human genome assembly. I used the BWA-MEM set-
ting, which is based on the Smith-Waterman algorithm.
Read files were aligned using:
bwa mem -M -t 6 -R ucsc.hg19.fasta [sample.reads1.fasta] [sample.reads2.fasta]
to generate an aligned reads file in the ’bam’ format.
The aligned reads were prepared for downstream analysis using the Picard
software package [Broad, b]. The reads were sorted by coordinate using:

7.1. Standard Mutation Calling Pipeline 153
Picard SortSam INPUT = [sample.aligned.reads.bam] SORT ORDER = co-
ordinate VALIDATION STRINGENCY = lenient
Duplicate reads were marked:
Picard MarkDuplicates INPUT = [sample.sorted.reads.bam] REMOVE DUPLICATES
= FALSE VALIDATION STRINGENCY = lenient
A read index was created using:
Picard BuildBamIndex INPUT = [sample.dedup.reads.bam] VALIDA-
TION STRINGENCY = lenient
Where applicable reads from the same tumour or normal sample but different
lanes were merged together.
7.1.3 Somatic Mutations
Somatic mutations were called using Mutect2 [Cibulskis et al., 2013] from the
Genome Analysis Toolkit using [Broad, a]. Mutect identifies mutations by assess-
ing the likelihood of mutation at each genomic site and controlling for false dis-
covery rate. The software was run with filtration based on the dbsnp 138.hg19.vcf
file:
7.1.4 Mutation context information used to identify mutation
channel
The 96-channel context of each SNA was imputed using the R package ‘Somat-
icSignatures’ [Gehring et al., 2015].
GenomeAnalysisTK -T MuTect2 -R [ucsc.hg19.fasta] -I:tumor [tumor.sample.dedup.reads.bam]
-I:normal [normal.sample.dedup.reads.bam] –dbsnp dbsnp 138.hg19.vcf
7.1.5 Copy Number Alterations
Copy number alterations were called using Sequenza. Sequenza uses a maximum-
likelihood approach to infers cellularity and ploidy from paired tumour and normal
sequencing data] [Favero et al., 2015]. Bam files were converted to the required
’seqz’ format using:
sequenza-utils –fasta ucsc.hg19.fasta -t tumor.sample.dedup.reads.bam -n nor-
mal.sample.dedup.reads.bam -gc hg19.gc5Base.txt.gz

7.1. Standard Mutation Calling Pipeline 154
The sequenza analysis was run using:
sequenza.extract(window = 1e5, min.reads = 10, min.reads.normal = 10) se-
quenza.fit(segment.filter = 1e6) sequenza.results()

Appendix A
Supplementary Figures

156
Figure A.1: Evidence for differential selection between mutations in KRAS. Modelled Rel-ative risk (RR) of frequent KRAS mutations compared to an informative refer-ence mutation in each cancer type. For each mutation, the maximum likelihoodestimate of relative risk compared is shown. Grey dashed line indicates rela-tive risk of one. Error bars represent 95% confidence intervals obtained bybootstrapping across 100 iterations.
G12
S
Q61
H (
CT
T>
CG
T)
A14
6T
G13
D
G12
A
Q61
H (
CT
T>
CAT
)
G12
V
G12
R
G12
D
G12
C
KRAS in Bladder
RR
vs
G12
D
0
1
2
3
4
Q61
H (
CT
T>
CAT
)
A14
6T
Q61
H (
CT
T>
CG
T)
G12
S
G12
R
G13
D
G12
C
G12
A
G12
D
G12
V
KRAS in Colorectum
RR
vs
G12
D
0.0
0.5
1.0
1.5
G13
D
Q61
H (
CT
T>
CG
T)
A14
6T
Q61
H (
CT
T>
CAT
)
G12
S
G12
R
G12
D
G12
V
G12
A
G12
C
KRAS in Lung Adeno
RR
vs
G12
C
0.0
0.2
0.4
0.6
0.8
1.0
1.2G
12V
G12
A
A14
6T
G12
R
Q61
H (
CT
T>
CAT
)
Q61
H (
CT
T>
CG
T)
G12
S
G12
C
G13
D
G12
D
KRAS in Oesophagus
RR
vs
G12
D
0.0
0.2
0.4
0.6
0.8
1.0
1.2
A14
6T
G12
S
G13
D
G12
A
G12
C
Q61
H (
CT
T>
CAT
)
Q61
H (
CT
T>
CG
T)
G12
V
G12
D
G12
R
KRAS in Pancreas
RR
vs
G12
R
0.0
0.2
0.4
0.6
0.8
1.0
1.2
G12
A
G12
R
Q61
H (
CT
T>
CAT
)
A14
6T
G12
C
Q61
H (
CT
T>
CG
T)
G13
D
G12
S
G12
V
G12
DKRAS in Stomach
RR
vs
G12
D
0.0
0.5
1.0
1.5
A14
6T
G12
R
Q61
H (
CT
T>
CAT
)
G12
S
G13
D
Q61
H (
CT
T>
CG
T)
G12
C
G12
D
G12
A
G12
V
KRAS in Uterine Carcinoma
RR
vs
G12
V
0.0
0.5
1.0
1.5

157
Figure A.2: Same as Figure A.1 for BRAF mutations.
N58
1S
K60
1E
G46
6E
D59
4G
D59
4N
G46
9A
V60
0E
BRAF in Colorectum
RR
vs
V60
0E
0.0
0.2
0.4
0.6
0.8
1.0
1.2
D59
4G
G46
9A
D59
4N
G46
6E
N58
1S
K60
1E
V60
0E
BRAF in Melanoma
RR
vs
V60
0E
0.0
0.2
0.4
0.6
0.8
1.0
1.2
D59
4G
N58
1S
G46
9A
D59
4N
K60
1E
G46
6E
V60
0EBRAF in Thyroid
RR
vs
V60
0E
0.0
0.2
0.4
0.6
0.8
1.0
1.2
Figure A.3: Same as Figure A.1 for NRAS mutations.
Q61
H
G12
C
Q61
L
Q61
K
Q61
R
G13
R
G12
D
G13
D
NRAS in AML
RR
vs
G13
D
0
1
2
3
4
5
6
Q61
H
G13
D
Q61
R
G12
C
Q61
L
G13
R
G12
D
Q61
K
NRAS in Colorectum
RR
vs
Q61
K
0.0
0.5
1.0
1.5
2.0
2.5
G12
C
G12
D
G13
D
Q61
H
G13
R
Q61
L
Q61
R
Q61
K
NRAS in Melanoma
RR
vs
Q61
K
0.0
0.2
0.4
0.6
0.8
1.0
1.2
G13
D
G12
D
Q61
H
G12
C
G13
R
Q61
L
Q61
K
Q61
R
NRAS in Thyroid
RR
vs
Q61
R
0.0
0.5
1.0
1.5

158
Figure A.4: Same as Figure A.1 for IDH1 mutations.
R13
2S
R13
2G
R13
2H
R13
2C
IDH1 in AML
RR
vs
R13
2C
0.0
0.5
1.0
1.5
2.0
R13
2S
R13
2C
R13
2H
R13
2G
IDH1 in Glioblastoma
RR
vs
R13
2H
0
1
2
3
4
R13
2C
R13
2S
R13
2H
R13
2GIDH1 in Glioma Low Grade
RR
vs
R13
2H
0.0
0.5
1.0
1.5
2.0
R13
2H
R13
2S
R13
2G
R13
2C
IDH1 in Melanoma
RR
vs
R13
2C
0.0
0.2
0.4
0.6
0.8
1.0
1.2
Figure A.5: Same as Figure A.1 for IDH2 mutations.
K48
NE
208X
M41
1IG
137E
R17
2S (
GC
C>
GG
C)
R17
2MI1
68S
G38
3VK
251N
V21
7MG
302S
R17
2WR
172S
(G
CC
>G
AC
)R
172G
D27
7ND
187V
T27
AR
60H
G41
7VG
220D
L289
IV
195I
W37
5XR
60G
F27
0SN
156S
E52
XR
362W
I419
TW
63X
V21
7LR
382G
V31
5GG
302D
G20
1DL1
43M
K13
3RG
421S
K28
0NE
268D
I228
LA
370T
R15
9HD
83V
R14
0WR
140Q
R17
2K
IDH2 in AML
RR
vs
R17
2K
0.0
0.2
0.4
0.6
0.8
1.0
1.2
R14
0QR
140W
K48
NE
208X
M41
1IG
137E
R17
2S (
GC
C>
GG
C)
I168
SG
383V
K25
1NV
217M
G30
2SD
277N
D18
7VT
27A
R60
HG
417V
G22
0DL2
89I
V19
5IW
375X
R60
GF
270S
N15
6SE
52X
R36
2WI4
19T
W63
XV
217L
R38
2GV
315G
G30
2DG
201D
L143
MK
133R
G42
1SK
280N
E26
8DI2
28L
A37
0TR
159H
D83
VR
172S
(G
CC
>G
AC
)R
172W
R17
2GR
172M
R17
2K
IDH2 in Glioma Low Grade
RR
vs
R17
2K
0.0
0.2
0.4
0.6
0.8
1.0
1.2

159
Figure A.6: Same as Figure A.1 for TP53 mutations.
R21
3X
Y22
0C
R19
6X
R34
2X
R27
3H
V15
7F
R30
6X
G24
5S
R24
8W
R28
2W
R27
3C
R17
5H
H17
9R
R24
8Q
TP53 in Bladder
RR
vs
R24
8Q
0.0
0.5
1.0
1.5
2.0
2.5
R28
2W
G24
5S
R24
8Q
R27
3C
R30
6X
R34
2X
R21
3X
R27
3H
R24
8W
V15
7F
R19
6X
R17
5H
H17
9R
Y22
0C
TP53 in Breast
RR
vs
Y22
0C
0.0
0.2
0.4
0.6
0.8
1.0
1.2
R34
2X
R30
6X
R19
6X
R27
3C
R21
3X
R27
3H
G24
5S
R24
8W
H17
9R
R24
8Q
R28
2W
R17
5H
V15
7F
Y22
0C
TP53 in Colorectum
RR
vs
R17
5H
0
1
2
3
4
5
V15
7F
R30
6X
R21
3X
R34
2X
R27
3H
R19
6X
G24
5S
R28
2W
R24
8W
R24
8Q
R27
3C
R17
5H
H17
9R
Y22
0C
TP53 in Glioblastoma
RR
vs
Y22
0C
0.0
0.5
1.0
1.5
2.0
V15
7F
R34
2X
R21
3X
R30
6X
R19
6X
G24
5S
R17
5H
R24
8W
R28
2W
R27
3H
R24
8Q
R27
3C
H17
9R
Y22
0C
TP53 in Glioma Low Grade
RR
vs
R27
3C
0.0
0.5
1.0
1.5
2.0
2.5
3.0
R34
2X
R27
3H
R27
3C
R30
6X
G24
5S
R19
6X
R21
3X
R24
8W
R24
8Q
R28
2W
R17
5H
V15
7F
H17
9R
Y22
0C
TP53 in Head and Neck
RR
vs
Y22
0C
0.0
0.5
1.0
1.5
2.0
H17
9R
R19
6X
G24
5S
R17
5H
R24
8W
R34
2X
R27
3H
R30
6X
R28
2W
R27
3C
R21
3X
R24
8Q
Y22
0C
V15
7F
TP53 in Liver
RR
vs
V15
7F
0.0
0.2
0.4
0.6
0.8
1.0
1.2
1.4
R24
8Q
R24
8W
H17
9R
R30
6X
G24
5S
R27
3H
R21
3X
R34
2X
R27
3C
R28
2W
V15
7F
R19
6X
R17
5H
Y22
0C
TP53 in Lung Adeno
RR
vs
R17
5H
0
5
10
15
20
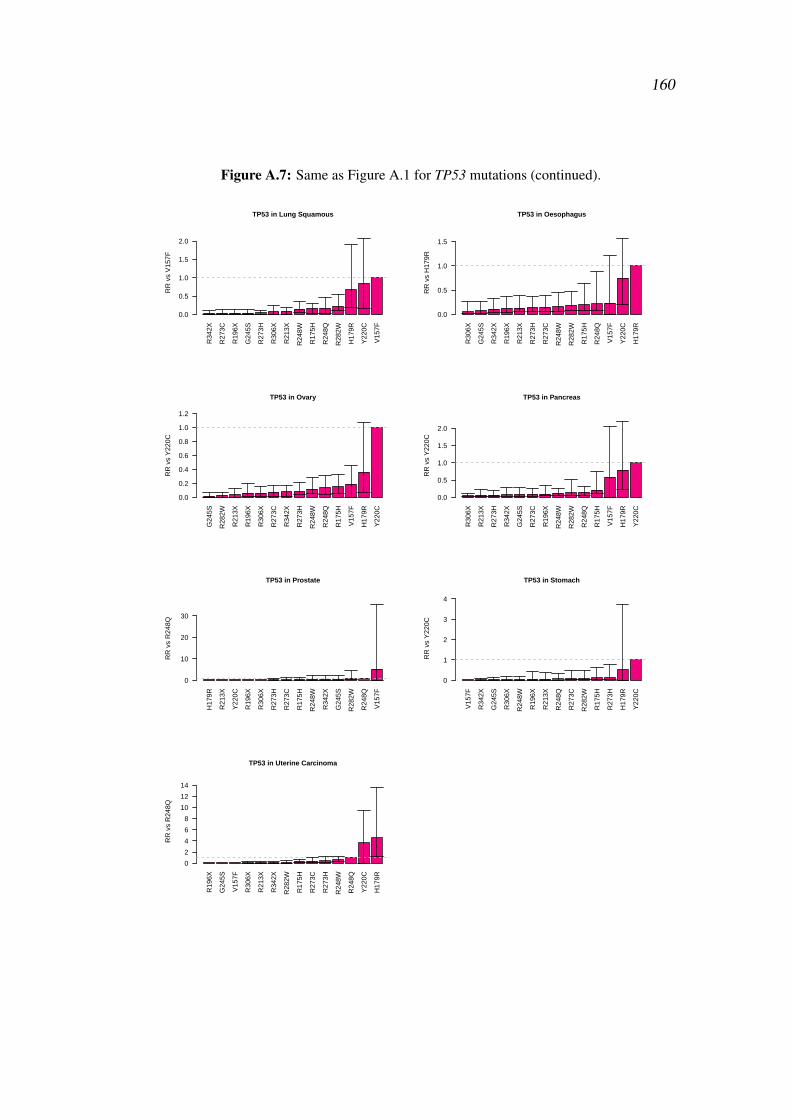
160
Figure A.7: Same as Figure A.1 for TP53 mutations (continued).
R34
2X
R27
3C
R19
6X
G24
5S
R27
3H
R30
6X
R21
3X
R24
8W
R17
5H
R24
8Q
R28
2W
H17
9R
Y22
0C
V15
7F
TP53 in Lung Squamous
RR
vs
V15
7F
0.0
0.5
1.0
1.5
2.0
R30
6X
G24
5S
R34
2X
R19
6X
R21
3X
R27
3H
R27
3C
R24
8W
R28
2W
R17
5H
R24
8Q
V15
7F
Y22
0C
H17
9R
TP53 in Oesophagus
RR
vs
H17
9R
0.0
0.5
1.0
1.5
G24
5S
R28
2W
R21
3X
R19
6X
R30
6X
R27
3C
R34
2X
R27
3H
R24
8W
R24
8Q
R17
5H
V15
7F
H17
9R
Y22
0C
TP53 in Ovary
RR
vs
Y22
0C
0.0
0.2
0.4
0.6
0.8
1.0
1.2
R30
6X
R21
3X
R27
3H
R34
2X
G24
5S
R27
3C
R19
6X
R24
8W
R28
2W
R24
8Q
R17
5H
V15
7F
H17
9R
Y22
0C
TP53 in Pancreas
RR
vs
Y22
0C
0.0
0.5
1.0
1.5
2.0
H17
9R
R21
3X
Y22
0C
R19
6X
R30
6X
R27
3H
R27
3C
R17
5H
R24
8W
R34
2X
G24
5S
R28
2W
R24
8Q
V15
7F
TP53 in Prostate
RR
vs
R24
8Q
0
10
20
30
V15
7F
R34
2X
G24
5S
R30
6X
R24
8W
R19
6X
R21
3X
R24
8Q
R27
3C
R28
2W
R17
5H
R27
3H
H17
9R
Y22
0C
TP53 in Stomach
RR
vs
Y22
0C
0
1
2
3
4
R19
6X
G24
5S
V15
7F
R30
6X
R21
3X
R34
2X
R28
2W
R17
5H
R27
3C
R27
3H
R24
8W
R24
8Q
Y22
0C
H17
9R
TP53 in Uterine Carcinoma
RR
vs
R24
8Q
0
2
4
6
8
10
12
14

161
Figure A.8: Same as Figure A.1 for PIK3CA mutations.
Q54
6R
C42
0R
R88
Q
E45
3K
E72
6K
G11
8D
E54
2K
Q54
6K
E54
5K
N34
5K
H10
47L
H10
47R
PIK3CA in Bladder
RR
vs
H10
47R
0.0
0.5
1.0
1.5
2.0
R88
Q
E72
6K
E45
3K
G11
8D
Q54
6K
E54
2K
C42
0R
Q54
6R
E54
5K
H10
47L
N34
5K
H10
47R
PIK3CA in Breast
RR
vs
H10
47R
0.0
0.2
0.4
0.6
0.8
1.0
1.2
N34
5K
R88
Q
Q54
6K
E45
3K
C42
0R
E72
6K
E54
2K
G11
8D
H10
47R
E54
5K
Q54
6R
H10
47L
PIK3CA in Cervix
RR
vs
E54
5K
0
2
4
6
8
10
N34
5K
H10
47L
E45
3K
G11
8D
R88
Q
Q54
6K
Q54
6R
C42
0R
E72
6K
H10
47R
E54
2K
E54
5K
PIK3CA in Colorectum
RR
vs
E54
5K
0.0
0.2
0.4
0.6
0.8
1.0
1.2
H10
47L
E72
6K
E45
3K
C42
0R
R88
Q
G11
8D
Q54
6R
Q54
6K
E54
2K
H10
47R
N34
5K
E54
5K
PIK3CA in Glioblastoma
RR
vs
E54
5K
0.0
0.5
1.0
1.5
2.0
2.5
N34
5K
E72
6K
Q54
6K
R88
Q
C42
0R
Q54
6R
E54
5K
G11
8D
H10
47R
E54
2K
H10
47L
E45
3K
PIK3CA in Glioma Low Grade
RR
vs
H10
47R
0
2
4
6
8
10
12
G11
8D
R88
Q
E45
3K
E72
6K
Q54
6K
C42
0R
N34
5K
Q54
6R
H10
47L
E54
2K
E54
5K
H10
47R
PIK3CA in Head and Neck
RR
vs
H10
47R
0.0
0.2
0.4
0.6
0.8
1.0
1.2
N34
5K
E72
6K
R88
Q
Q54
6K
Q54
6R
G11
8D
C42
0R
E45
3K
H10
47L
E54
2K
E54
5K
H10
47R
PIK3CA in Liver
RR
vs
H10
47R
0.0
0.5
1.0
1.5
2.0
2.5

162
Figure A.9: Same as Figure A.1 for PIK3CA mutations (continued).
N34
5K
R88
Q
Q54
6K
Q54
6R
E72
6K
E45
3K
G11
8D
C42
0R
H10
47L
E54
2K
E54
5K
H10
47R
PIK3CA in Lung Squamous
RR
vs
E54
5K
0.0
0.5
1.0
1.5
2.0
2.5
N34
5K
R88
Q
Q54
6R
E45
3K
Q54
6K
E72
6K
G11
8D
H10
47R
C42
0R
E54
2K
E54
5K
H10
47L
PIK3CA in Oesophagus
RR
vs
E54
5K
0
1
2
3
4
5
H10
47L
E72
6K
Q54
6R
E45
3K
G11
8D
R88
Q
C42
0R
E54
5K
N34
5K
H10
47R
Q54
6K
E54
2K
PIK3CA in Prostate
RR
vs
E54
2K
0.0
0.5
1.0
1.5
2.0
2.5
3.0
3.5
H10
47L
E72
6K
Q54
6K
R88
Q
Q54
6R
E45
3K
C42
0R
G11
8D
E54
2K
E54
5K
H10
47R
N34
5K
PIK3CA in Stomach
RR
vs
N34
5K
0.0
0.2
0.4
0.6
0.8
1.0
1.2
E72
6K
E45
3K
R88
Q
G11
8D
Q54
6K
E54
5K
C42
0R
E54
2K
Q54
6R
N34
5K
H10
47R
H10
47L
PIK3CA in Uterine Carcinoma
RR
vs
H10
47R
0.0
0.5
1.0
1.5
2.0
2.5
3.0
3.5

163
Figure A.10: Same as Figure A.1 for SMAD4 mutations.
E37
4K
R44
5X
R13
5X
R36
1C
R36
1H
SMAD4 in Colorectum
RR
vs
R36
1H
0.0
0.5
1.0
1.5
2.0
2.5
E37
4K
R13
5X
R36
1H
R44
5X
R36
1C
SMAD4 in Pancreas
RR
vs
R36
1C
0.0
0.5
1.0
1.5
2.0
2.5
3.0
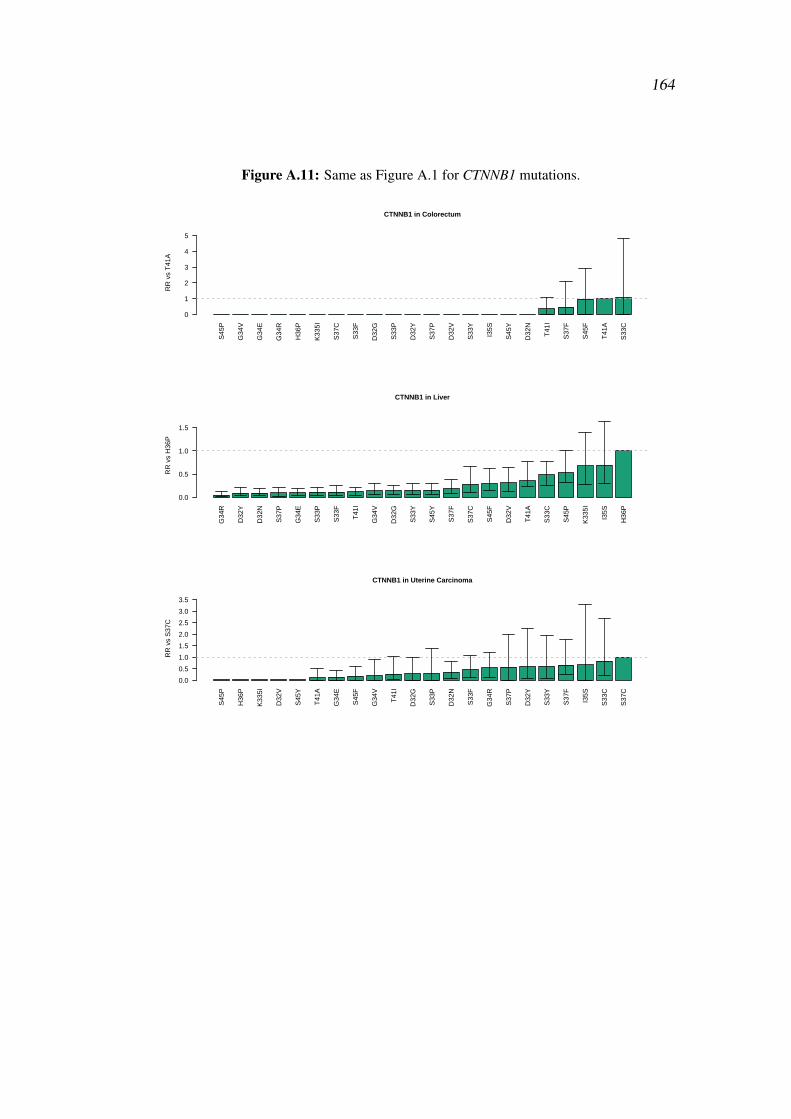
164
Figure A.11: Same as Figure A.1 for CTNNB1 mutations.
S45
P
G34
V
G34
E
G34
R
H36
P
K33
5I
S37
C
S33
F
D32
G
S33
P
D32
Y
S37
P
D32
V
S33
Y
I35S
S45
Y
D32
N
T41
I
S37
F
S45
F
T41
A
S33
C
CTNNB1 in Colorectum
RR
vs
T41
A
0
1
2
3
4
5
G34
R
D32
Y
D32
N
S37
P
G34
E
S33
P
S33
F
T41
I
G34
V
D32
G
S33
Y
S45
Y
S37
F
S37
C
S45
F
D32
V
T41
A
S33
C
S45
P
K33
5I
I35S
H36
P
CTNNB1 in Liver
RR
vs
H36
P
0.0
0.5
1.0
1.5
S45
P
H36
P
K33
5I
D32
V
S45
Y
T41
A
G34
E
S45
F
G34
V
T41
I
D32
G
S33
P
D32
N
S33
F
G34
R
S37
P
D32
Y
S33
Y
S37
F
I35S
S33
C
S37
C
CTNNB1 in Uterine Carcinoma
RR
vs
S37
C
0.0
0.5
1.0
1.5
2.0
2.5
3.0
3.5

165
Figure A.12: Evidence for differential selection between mutations in KRAS, BRAF andNRAS. Modelled Relative risk (RR) of frequent KRAS mutations comparedto an informative reference mutation in each cancer type. For each mutation,the maximum likelihood estimate of relative risk compared is shown. Greydashed line indicates relative risk of one. Error bars represent 95% confidenceintervals obtained by bootstrapping across 100 iterations.
KR
AS
G12
S
KR
AS
G12
V
KR
AS
G12
D
KR
AS
G13
D
KR
AS
Q61
H (
CT
T>
CG
T)
KR
AS
G12
C
KR
AS
A14
6T
KR
AS
G12
R
KR
AS
Q61
H (
CT
T>
CAT
)
BR
AF
D59
4G
BR
AF
N58
1S
BR
AF
G46
9A
BR
AF
V60
0E
BR
AF
D59
4N
BR
AF
K60
1E
BR
AF
G46
6E
NR
AS
Q61
H
NR
AS
G12
C
NR
AS
Q61
L
NR
AS
Q61
K
NR
AS
Q61
R
KR
AS
G12
A
NR
AS
G13
R
NR
AS
G12
D
NR
AS
G13
D
KRAS, BRAF, and NRAS in AML
RR
vs
NR
AS
G13
D
BRAFKRASNRAS
0.0
1.5
3.0
4.5
6.0
7.5
KR
AS
G12
S
KR
AS
Q61
H (
CT
T>
CG
T)
KR
AS
A14
6T
BR
AF
N58
1S
BR
AF
D59
4N
BR
AF
K60
1E
BR
AF
G46
6E
NR
AS
G13
D
NR
AS
G12
D
NR
AS
Q61
H
NR
AS
G12
C
KR
AS
G13
D
BR
AF
G46
9A
BR
AF
D59
4G
NR
AS
Q61
K
KR
AS
G12
A
NR
AS
G13
R
KR
AS
Q61
H (
CT
T>
CAT
)
BR
AF
V60
0E
NR
AS
Q61
L
KR
AS
G12
V
KR
AS
G12
R
KR
AS
G12
D
NR
AS
Q61
R
KR
AS
G12
C
KRAS, BRAF, and NRAS in Bladder
RR
vs
KR
AS
G12
D
BRAFKRASNRAS
0.0
1.0
2.0
3.0
4.0
BR
AF
N58
1S
BR
AF
K60
1E
BR
AF
G46
6E
NR
AS
Q61
H
NR
AS
G13
D
BR
AF
D59
4G
NR
AS
G12
C
NR
AS
Q61
R
BR
AF
D59
4N
NR
AS
G12
D
KR
AS
A14
6T
KR
AS
Q61
H (
CT
T>
CAT
)
BR
AF
G46
9A
KR
AS
Q61
H (
CT
T>
CG
T)
NR
AS
G13
R
NR
AS
Q61
L
KR
AS
G12
S
KR
AS
G13
D
NR
AS
Q61
K
KR
AS
G12
C
KR
AS
G12
R
KR
AS
G12
A
KR
AS
G12
D
KR
AS
G12
V
BR
AF
V60
0E
KRAS, BRAF, and NRAS in Colorectum
RR
vs
BR
AF
V60
0E
BRAFKRASNRAS
0.0
0.5
1.0

166
Figure A.13: Evidence for differential selection between mutations in KRAS, BRAF andNRAS (continued). Modelled Relative risk (RR) of frequent KRAS muta-tions compared to an informative reference mutation in each cancer type. Foreach mutation, the maximum likelihood estimate of relative risk compared isshown. Grey dashed line indicates relative risk of one. Error bars represent95% confidence intervals obtained by bootstrapping across 100 iterations.
KR
AS
G12
S
KR
AS
G12
V
KR
AS
G13
D
KR
AS
Q61
H (
CT
T>
CG
T)
KR
AS
G12
A
KR
AS
G12
C
KR
AS
A14
6T
KR
AS
G12
R
KR
AS
Q61
H (
CT
T>
CAT
)
BR
AF
D59
4G
BR
AF
N58
1S
BR
AF
G46
9A
BR
AF
D59
4N
BR
AF
K60
1E
BR
AF
G46
6E
NR
AS
G13
D
NR
AS
G12
D
NR
AS
Q61
H
NR
AS
G12
C
NR
AS
G13
R
NR
AS
Q61
R
KR
AS
G12
D
NR
AS
Q61
K
NR
AS
Q61
L
BR
AF
V60
0E
KRAS, BRAF, and NRAS in Glioblastoma
RR
vs
BR
AF
V60
0E
BRAFKRASNRAS
0.0
0.5
1.0
KR
AS
G12
S
KR
AS
G12
V
KR
AS
G12
A
KR
AS
A14
6T
KR
AS
G12
R
KR
AS
Q61
H (
CT
T>
CAT
)
BR
AF
D59
4G
BR
AF
G46
9A
BR
AF
D59
4N
BR
AF
K60
1E
BR
AF
G46
6E
NR
AS
G13
D
NR
AS
G12
D
NR
AS
Q61
H
NR
AS
G12
C
NR
AS
G13
R
NR
AS
Q61
L
KR
AS
G13
D
BR
AF
N58
1S
KR
AS
G12
C
NR
AS
Q61
K
BR
AF
V60
0E
NR
AS
Q61
R
KR
AS
Q61
H (
CT
T>
CG
T)
KR
AS
G12
D
KRAS, BRAF, and NRAS in Liver
RR
vs
KR
AS
G12
D
BRAFKRASNRAS
0.0
1.0
2.0
3.0
KR
AS
G13
D
KR
AS
Q61
H (
CT
T>
CG
T)
KR
AS
A14
6T
KR
AS
Q61
H (
CT
T>
CAT
)
BR
AF
D59
4G
BR
AF
G46
9A
BR
AF
K60
1E
BR
AF
G46
6E
NR
AS
G13
D
NR
AS
G12
D
NR
AS
Q61
H
NR
AS
G12
C
NR
AS
Q61
K
NR
AS
G13
R
NR
AS
Q61
R
BR
AF
D59
4N
KR
AS
G12
S
KR
AS
G12
R
NR
AS
Q61
L
BR
AF
N58
1S
KR
AS
G12
D
BR
AF
V60
0E
KR
AS
G12
V
KR
AS
G12
A
KR
AS
G12
C
KRAS, BRAF, and NRAS in Lung Adeno
RR
vs
KR
AS
G12
C
BRAFKRASNRAS
0.0
0.5
1.0

167
Figure A.14: Evidence for differential selection between mutations in KRAS, BRAF andNRAS (continued). Modelled Relative risk (RR) of frequent KRAS muta-tions compared to an informative reference mutation in each cancer type. Foreach mutation, the maximum likelihood estimate of relative risk compared isshown. Grey dashed line indicates relative risk of one. Error bars represent95% confidence intervals obtained by bootstrapping across 100 iterations.
KR
AS
G12
S
KR
AS
G12
D
KR
AS
G13
D
KR
AS
Q61
H (
CT
T>
CG
T)
KR
AS
G12
C
KR
AS
A14
6T
KR
AS
G12
R
BR
AF
D59
4G
BR
AF
N58
1S
BR
AF
V60
0E
BR
AF
K60
1E
NR
AS
G13
D
NR
AS
G12
D
NR
AS
Q61
H
NR
AS
Q61
L
BR
AF
G46
6E
KR
AS
G12
V
NR
AS
G12
C
NR
AS
Q61
K
BR
AF
D59
4N
BR
AF
G46
9A
NR
AS
G13
R
KR
AS
Q61
H (
CT
T>
CAT
)
KR
AS
G12
A
NR
AS
Q61
R
KRAS, BRAF, and NRAS in Lung Squamous
RR
vs
KR
AS
G12
V
BRAFKRASNRAS
0.0
2.0
4.0
6.0
8.0
10.0
KR
AS
G12
S
KR
AS
G12
V
KR
AS
G13
D
KR
AS
Q61
H (
CT
T>
CG
T)
KR
AS
G12
A
KR
AS
G12
C
KR
AS
A14
6T
KR
AS
Q61
H (
CT
T>
CAT
)
BR
AF
D59
4G
BR
AF
G46
9A
NR
AS
G12
D
NR
AS
G12
C
BR
AF
D59
4N
BR
AF
G46
6E
KR
AS
G12
D
NR
AS
G13
D
BR
AF
N58
1S
NR
AS
Q61
H
KR
AS
G12
R
BR
AF
K60
1E
NR
AS
G13
R
NR
AS
Q61
L
NR
AS
Q61
R
NR
AS
Q61
K
BR
AF
V60
0E
KRAS, BRAF, and NRAS in Melanoma
RR
vs
BR
AF
V60
0E
BRAFKRASNRAS
0.0
0.5
1.0
KR
AS
G12
V
KR
AS
G12
A
KR
AS
A14
6T
KR
AS
G12
R
KR
AS
Q61
H (
CT
T>
CAT
)
BR
AF
D59
4G
BR
AF
N58
1S
BR
AF
G46
9A
BR
AF
V60
0E
BR
AF
D59
4N
BR
AF
K60
1E
BR
AF
G46
6E
NR
AS
G13
D
NR
AS
G12
D
NR
AS
Q61
H
NR
AS
G12
C
NR
AS
Q61
K
NR
AS
G13
R
NR
AS
Q61
R
NR
AS
Q61
L
KR
AS
Q61
H (
CT
T>
CG
T)
KR
AS
G12
S
KR
AS
G12
C
KR
AS
G13
D
KR
AS
G12
D
KRAS, BRAF, and NRAS in Oesophagus
RR
vs
KR
AS
G12
D
BRAFKRASNRAS
0.0
0.5
1.0

168
Figure A.15: Evidence for differential selection between mutations in KRAS, BRAF andNRAS (continued). Modelled Relative risk (RR) of frequent KRAS muta-tions compared to an informative reference mutation in each cancer type. Foreach mutation, the maximum likelihood estimate of relative risk compared isshown. Grey dashed line indicates relative risk of one. Error bars represent95% confidence intervals obtained by bootstrapping across 100 iterations.
KR
AS
A14
6T
BR
AF
N58
1S
BR
AF
G46
9A
BR
AF
V60
0E
BR
AF
D59
4N
BR
AF
K60
1E
BR
AF
G46
6E
NR
AS
G13
D
NR
AS
Q61
H
NR
AS
G12
C
NR
AS
Q61
K
NR
AS
G13
R
NR
AS
Q61
R
NR
AS
Q61
L
KR
AS
G12
S
NR
AS
G12
D
KR
AS
G13
D
BR
AF
D59
4G
KR
AS
G12
A
KR
AS
G12
C
KR
AS
Q61
H (
CT
T>
CAT
)
KR
AS
Q61
H (
CT
T>
CG
T)
KR
AS
G12
V
KR
AS
G12
D
KR
AS
G12
R
KRAS, BRAF, and NRAS in Pancreas
RR
vs
KR
AS
G12
R
BRAFKRASNRAS
0.0
0.5
1.0
KR
AS
G12
A
KR
AS
G12
R
KR
AS
Q61
H (
CT
T>
CAT
)
BR
AF
D59
4G
BR
AF
N58
1S
BR
AF
V60
0E
BR
AF
G46
6E
NR
AS
G13
D
NR
AS
G12
D
NR
AS
Q61
H
NR
AS
G13
R
NR
AS
Q61
L
BR
AF
D59
4N
NR
AS
G12
C
BR
AF
K60
1E
KR
AS
A14
6T
KR
AS
G12
C
NR
AS
Q61
R
NR
AS
Q61
K
KR
AS
Q61
H (
CT
T>
CG
T)
BR
AF
G46
9A
KR
AS
G13
D
KR
AS
G12
S
KR
AS
G12
V
KR
AS
G12
D
KRAS, BRAF, and NRAS in Stomach
RR
vs
KR
AS
G12
D
BRAFKRASNRAS
0.0
0.5
1.0
1.5
KR
AS
G12
S
KR
AS
G12
V
KR
AS
G12
D
KR
AS
G13
D
KR
AS
Q61
H (
CT
T>
CG
T)
KR
AS
G12
A
KR
AS
G12
C
KR
AS
A14
6T
KR
AS
G12
R
KR
AS
Q61
H (
CT
T>
CAT
)
BR
AF
D59
4G
BR
AF
N58
1S
BR
AF
G46
9A
BR
AF
D59
4N
BR
AF
K60
1E
BR
AF
G46
6E
NR
AS
G13
D
NR
AS
G12
D
NR
AS
Q61
H
NR
AS
G12
C
NR
AS
G13
R
NR
AS
Q61
L
NR
AS
Q61
K
NR
AS
Q61
R
BR
AF
V60
0E
KRAS, BRAF, and NRAS in Thyroid
RR
vs
BR
AF
V60
0E
BRAFKRASNRAS
0.0
0.5
1.0

169
Figure A.16: Evidence for differential selection between mutations in KRAS, BRAF andNRAS (continued). Modelled Relative risk (RR) of frequent KRAS muta-tions compared to an informative reference mutation in each cancer type. Foreach mutation, the maximum likelihood estimate of relative risk compared isshown. Grey dashed line indicates relative risk of one. Error bars represent95% confidence intervals obtained by bootstrapping across 100 iterations.
KR
AS
A14
6T
KR
AS
G12
R
KR
AS
Q61
H (
CT
T>
CAT
)
BR
AF
D59
4G
BR
AF
N58
1S
BR
AF
G46
9A
BR
AF
V60
0E
BR
AF
D59
4N
BR
AF
G46
6E
NR
AS
G13
D
NR
AS
Q61
H
NR
AS
G12
C
NR
AS
Q61
K
NR
AS
G13
R
NR
AS
Q61
L
KR
AS
G12
S
NR
AS
G12
D
BR
AF
K60
1E
KR
AS
G13
D
KR
AS
Q61
H (
CT
T>
CG
T)
NR
AS
Q61
R
KR
AS
G12
C
KR
AS
G12
D
KR
AS
G12
A
KR
AS
G12
V
KRAS, BRAF, and NRAS in Uterine Carcinoma
RR
vs
KR
AS
G12
V
BRAFKRASNRAS
0.0
0.5
1.0
1.5
2.0

170
Figure A.17: Same as Figure A.12 for APC and CTNNB1 mutations
CT
NN
B1
S45
P
CT
NN
B1
G34
V
CT
NN
B1
G34
E
CT
NN
B1
G34
R
CT
NN
B1
H36
P
CT
NN
B1
K33
5I
CT
NN
B1
S37
C
CT
NN
B1
S33
F
CT
NN
B1
D32
G
CT
NN
B1
S33
P
CT
NN
B1
D32
Y
CT
NN
B1
S37
P
CT
NN
B1
D32
V
CT
NN
B1
S33
Y
CT
NN
B1
I35S
CT
NN
B1
S45
Y
CT
NN
B1
D32
N
AP
C R
2204
X
AP
C R
499X
AP
C R
213X
AP
C R
216X
AP
C R
232X
AP
C R
876X
AP
C R
1450
X
AP
C R
1114
X
CT
NN
B1
S37
F
CT
NN
B1
S45
F
CT
NN
B1
T41
I
CT
NN
B1
T41
A
CT
NN
B1
S33
C
AP
C Q
1378
X
CTNNB1 and APC in Colorectum
RR
vs
AP
C Q
1378
X
APCCTNNB1
0.0
0.5
1.0
AP
C R
2204
X
AP
C R
216X
AP
C R
1450
X
AP
C R
213X
AP
C R
499X
AP
C R
876X
AP
C R
1114
X
AP
C Q
1378
X
AP
C R
232X
CT
NN
B1
G34
R
CT
NN
B1
D32
Y
CT
NN
B1
D32
N
CT
NN
B1
S37
P
CT
NN
B1
G34
E
CT
NN
B1
S33
P
CT
NN
B1
S33
F
CT
NN
B1
T41
I
CT
NN
B1
G34
V
CT
NN
B1
D32
G
CT
NN
B1
S33
Y
CT
NN
B1
S45
Y
CT
NN
B1
S37
F
CT
NN
B1
S37
C
CT
NN
B1
S45
F
CT
NN
B1
D32
V
CT
NN
B1
T41
A
CT
NN
B1
S33
C
CT
NN
B1
S45
P
CT
NN
B1
K33
5I
CT
NN
B1
I35S
CT
NN
B1
H36
P
CTNNB1 and APC in Liver
RR
vs
CT
NN
B1
H36
P
APCCTNNB1
0.0
0.5
1.0
CT
NN
B1
S45
F
CT
NN
B1
G34
V
CT
NN
B1
G34
E
CT
NN
B1
G34
R
CT
NN
B1
H36
P
CT
NN
B1
K33
5I
CT
NN
B1
T41
I
CT
NN
B1
S37
F
CT
NN
B1
S33
F
CT
NN
B1
D32
G
CT
NN
B1
S33
P
CT
NN
B1
S37
P
CT
NN
B1
I35S
CT
NN
B1
S45
Y
CT
NN
B1
D32
N
AP
C R
2204
X
AP
C R
1450
X
AP
C R
213X
AP
C R
499X
AP
C R
876X
AP
C Q
1378
X
AP
C R
232X
AP
C R
216X
AP
C R
1114
X
CT
NN
B1
S33
Y
CT
NN
B1
D32
Y
CT
NN
B1
S45
P
CT
NN
B1
T41
A
CT
NN
B1
D32
V
CT
NN
B1
S33
C
CT
NN
B1
S37
C
CTNNB1 and APC in Prostate
RR
vs
CT
NN
B1
T41
A
APCCTNNB1
0.0
2.5
5.0
7.5
10.5
13.5
16.5

171
Figure A.18: Same as Figure A.12 for APC and CTNNB1 mutations (continued)
CT
NN
B1
S45
F
CT
NN
B1
S45
P
CT
NN
B1
G34
V
CT
NN
B1
T41
A
CT
NN
B1
H36
P
CT
NN
B1
K33
5I
CT
NN
B1
T41
I
CT
NN
B1
S33
F
CT
NN
B1
D32
G
CT
NN
B1
S33
C
CT
NN
B1
S37
P
CT
NN
B1
D32
V
CT
NN
B1
S33
Y
CT
NN
B1
I35S
CT
NN
B1
S45
Y
CT
NN
B1
D32
N
AP
C R
216X
AP
C R
213X
AP
C R
876X
AP
C Q
1378
X
AP
C R
232X
AP
C R
499X
AP
C R
1450
X
AP
C R
1114
X
AP
C R
2204
X
CT
NN
B1
G34
E
CT
NN
B1
D32
Y
CT
NN
B1
S33
P
CT
NN
B1
S37
F
CT
NN
B1
G34
R
CT
NN
B1
S37
C
CTNNB1 and APC in Stomach
RR
vs
CT
NN
B1
G34
E
APCCTNNB1
0.0
0.5
1.0
1.5
2.0
2.5
3.0
3.5
CT
NN
B1
S45
P
CT
NN
B1
H36
P
CT
NN
B1
K33
5I
CT
NN
B1
D32
V
CT
NN
B1
S45
Y
AP
C R
216X
AP
C R
1450
X
AP
C R
213X
AP
C R
499X
AP
C R
876X
AP
C Q
1378
X
AP
C R
1114
X
AP
C R
232X
AP
C R
2204
X
CT
NN
B1
T41
A
CT
NN
B1
G34
E
CT
NN
B1
G34
V
CT
NN
B1
S33
P
CT
NN
B1
D32
G
CT
NN
B1
S45
F
CT
NN
B1
T41
I
CT
NN
B1
D32
N
CT
NN
B1
S37
P
CT
NN
B1
I35S
CT
NN
B1
S33
Y
CT
NN
B1
D32
Y
CT
NN
B1
S33
F
CT
NN
B1
G34
R
CT
NN
B1
S37
F
CT
NN
B1
S33
C
CT
NN
B1
S37
C
CTNNB1 and APC in Uterine Carcinoma
RR
vs
CT
NN
B1
S33
C
APCCTNNB1
0.0
1.0
2.0
3.0
4.0

172
Figure A.19: Same as Figure A.12 for IDH1 and IDH2 mutations
IDH
1 R
132S
IDH
1 R
132G
IDH
2 K
48N
IDH
2 E
208X
IDH
2 M
411I
IDH
2 G
137E
IDH
2R17
2S (
GC
C>
GG
C)
IDH
2 R
172M
IDH
2 I1
68S
IDH
2 G
383V
IDH
2 K
251N
IDH
2 V
217M
IDH
2 G
302S
IDH
2 R
172W
IDH
2R17
2S (
GC
C>
GA
C)
IDH
2 R
172G
IDH
2 D
277N
IDH
2 D
187V
IDH
2 T
27A
IDH
2 R
60H
IDH
2 G
417V
IDH
2 G
220D
IDH
2 L2
89I
IDH
2 V
195I
IDH
2 W
375X
IDH
2 R
60G
IDH
2 F
270S
IDH
2 N
156S
IDH
2 E
52X
IDH
2 R
362W
IDH
2 I4
19T
IDH
2 W
63X
IDH
2 V
217L
IDH
2 R
382G
IDH
2 V
315G
IDH
2 G
302D
IDH
2 G
201D
IDH
2 L1
43M
IDH
2 K
133R
IDH
2 G
421S
IDH
2 K
280N
IDH
2 E
268D
IDH
2 I2
28L
IDH
2 A
370T
IDH
2 R
159H
IDH
2 D
83V
IDH
2 R
140W
IDH
1 R
132H
IDH
1 R
132C
IDH
2 R
140Q
IDH
2 R
172K
IDH1 and IDH2 in AML
RR
vs
IDH
2 R
140Q
IDH1IDH2
0.0
1.0
2.0
3.0
4.0
5.0
IDH
1 R
132S
IDH
2 R
140Q
IDH
2 R
140W
IDH
2 R
172K
IDH
2 K
48N
IDH
2 E
208X
IDH
2 M
411I
IDH
2 G
137E
IDH
2R17
2S (
GC
C>
GG
C)
IDH
2 R
172M
IDH
2 G
383V
IDH
2 K
251N
IDH
2 R
172W
IDH
2R17
2S (
GC
C>
GA
C)
IDH
2 R
172G
IDH
2 D
277N
IDH
2 D
187V
IDH
2 T
27A
IDH
2 R
60H
IDH
2 G
417V
IDH
2 G
220D
IDH
2 L2
89I
IDH
2 V
195I
IDH
2 W
375X
IDH
2 R
60G
IDH
2 F
270S
IDH
2 N
156S
IDH
2 E
52X
IDH
2 R
362W
IDH
2 I4
19T
IDH
2 W
63X
IDH
2 V
217L
IDH
2 R
382G
IDH
2 V
315G
IDH
2 G
302D
IDH
2 G
201D
IDH
2 L1
43M
IDH
2 K
133R
IDH
2 G
421S
IDH
2 K
280N
IDH
2 E
268D
IDH
2 I2
28L
IDH
2 A
370T
IDH
2 R
159H
IDH
2 D
83V
IDH
2 V
217M
IDH
1 R
132C
IDH
2 G
302S
IDH
1 R
132H
IDH
1 R
132G
IDH
2 I1
68S
IDH1 and IDH2 in Glioblastoma
RR
vs
IDH
1 R
132H
IDH1IDH2
0.0
2.5
5.0
7.5
10.0
13.0
IDH
2 R
140Q
IDH
2 R
140W
IDH
2 K
48N
IDH
2 E
208X
IDH
2 M
411I
IDH
2 G
137E
IDH
2R17
2S (
GC
C>
GG
C)
IDH
2 I1
68S
IDH
2 G
383V
IDH
2 K
251N
IDH
2 V
217M
IDH
2 G
302S
IDH
2 D
277N
IDH
2 D
187V
IDH
2 T
27A
IDH
2 R
60H
IDH
2 G
417V
IDH
2 G
220D
IDH
2 L2
89I
IDH
2 V
195I
IDH
2 W
375X
IDH
2 R
60G
IDH
2 F
270S
IDH
2 N
156S
IDH
2 E
52X
IDH
2 R
362W
IDH
2 I4
19T
IDH
2 W
63X
IDH
2 V
217L
IDH
2 R
382G
IDH
2 V
315G
IDH
2 G
302D
IDH
2 G
201D
IDH
2 L1
43M
IDH
2 K
133R
IDH
2 G
421S
IDH
2 K
280N
IDH
2 E
268D
IDH
2 I2
28L
IDH
2 A
370T
IDH
2 R
159H
IDH
2 D
83V
IDH
2R17
2S (
GC
C>
GA
C)
IDH
1 R
132C
IDH
2 R
172M
IDH
2 R
172G
IDH
2 R
172W
IDH
1 R
132S
IDH
2 R
172K
IDH
1 R
132H
IDH
1 R
132G
IDH1 and IDH2 in Glioma Low Grade
RR
vs
IDH
1 R
132H
IDH1IDH2
0.0
0.5
1.0
1.5
2.0

173
Figure A.20: Same as Figure A.12 for IDH1 and IDH2 mutations (continued)
IDH
1 R
132H
IDH
1 R
132S
IDH
2 R
140Q
IDH
2 R
140W
IDH
2 K
48N
IDH
2 E
208X
IDH
2 M
411I
IDH
2 G
137E
IDH
2 R
172M
IDH
2 I1
68S
IDH
2 G
383V
IDH
2 K
251N
IDH
2 V
217M
IDH
2 G
302S
IDH
2R17
2S (
GC
C>
GA
C)
IDH
2 R
172G
IDH
2 D
277N
IDH
2 D
187V
IDH
2 T
27A
IDH
2 R
60H
IDH
2 G
417V
IDH
2 G
220D
IDH
2 L2
89I
IDH
2 V
195I
IDH
2 W
375X
IDH
2 W
63X
IDH
2 V
217L
IDH
2 R
382G
IDH
2 V
315G
IDH
2 G
302D
IDH
2 G
201D
IDH
2 L1
43M
IDH
2 K
133R
IDH
2 G
421S
IDH
2 K
280N
IDH
2 E
268D
IDH
2 I2
28L
IDH
2 A
370T
IDH
2 R
159H
IDH
2 D
83V
IDH
2 R
362W
IDH
2 I4
19T
IDH
2 N
156S
IDH
2 E
52X
IDH
2 R
172K
IDH
1 R
132C
IDH
2 R
60G
IDH
2 R
172W
IDH
2 F
270S
IDH
2R17
2S (
GC
C>
GG
C)
IDH
1 R
132G
IDH1 and IDH2 in Liver
RR
vs
IDH
1 R
132C
IDH1IDH2
0.0
3.5
7.0
11.0
15.5
20.0
IDH
1 R
132H
IDH
1 R
132S
IDH
1 R
132G
IDH
2 R
140Q
IDH
2 R
140W
IDH
2 R
172K
IDH
2 K
48N
IDH
2 E
208X
IDH
2 M
411I
IDH
2R17
2S (
GC
C>
GG
C)
IDH
2 R
172M
IDH
2 I1
68S
IDH
2 G
383V
IDH
2 K
251N
IDH
2 V
217M
IDH
2 G
302S
IDH
2 R
172W
IDH
2R17
2S (
GC
C>
GA
C)
IDH
2 R
172G
IDH
2 D
277N
IDH
2 D
187V
IDH
2 T
27A
IDH
2 R
60H
IDH
2 G
417V
IDH
2 G
220D
IDH
2 L2
89I
IDH
2 V
195I
IDH
2 W
375X
IDH
2 R
60G
IDH
2 F
270S
IDH
2 N
156S
IDH
2 E
52X
IDH
2 R
362W
IDH
2 I4
19T
IDH
2 W
63X
IDH
2 V
217L
IDH
2 R
382G
IDH
2 V
315G
IDH
2 G
302D
IDH
2 G
201D
IDH
2 L1
43M
IDH
2 K
133R
IDH
2 G
421S
IDH
2 K
280N
IDH
2 E
268D
IDH
2 I2
28L
IDH
2 A
370T
IDH
2 R
159H
IDH
2 D
83V
IDH
2 G
137E
IDH
1 R
132C
IDH1 and IDH2 in Melanoma
RR
vs
IDH
1 R
132C
IDH1IDH2
0.0
0.5
1.0

Appendix B
Colophon
This document was set in the Times Roman typeface using LATEX and BibTEX, com-
posed with a text editor.

Bibliography
[TCG, 2012] (2012). Comprehensive molecular characterization of human colon
and rectal cancer. Nature, 487(7407):330–7.
[Abbosh et al., 2017] Abbosh, C., Birkbak, N. J., Wilson, G. A., Jamal-Hanjani,
M., Constantin, T., Salari, R., Le Quesne, J., Moore, D. A., Veeriah, S., Rosen-
thal, R., Marafioti, T., Kirkizlar, E., Watkins, T. B. K., McGranahan, N., Ward,
S., Martinson, L., Riley, J., Fraioli, F., Al Bakir, M., Gronroos, E., Zambrana,
F., Endozo, R., Bi, W. L., Fennessy, F. M., Sponer, N., Johnson, D., Laycock,
J., Shafi, S., Czyzewska-Khan, J., Rowan, A., Chambers, T., Matthews, N., Tu-
rajlic, S., Hiley, C., Lee, S. M., Forster, M. D., Ahmad, T., Falzon, M., Borg,
E., Lawrence, D., Hayward, M., Kolvekar, S., Panagiotopoulos, N., Janes, S. M.,
Thakrar, R., Ahmed, A., Blackhall, F., Summers, Y., Hafez, D., Naik, A., Gan-
guly, A., Kareht, S., Shah, R., Joseph, L., Marie Quinn, A., Crosbie, P. A., Naidu,
B., Middleton, G., Langman, G., Trotter, S., Nicolson, M., Remmen, H., Kerr,
K., Chetty, M., Gomersall, L., Fennell, D. A., Nakas, A., Rathinam, S., Anand,
G., Khan, S., Russell, P., Ezhil, V., Ismail, B., Irvin-Sellers, M., Prakash, V.,
Lester, J. F., Kornaszewska, M., Attanoos, R., Adams, H., Davies, H., Oukrif,
D., Akarca, A. U., Hartley, J. A., Lowe, H. L., Lock, S., Iles, N., Bell, H., Ngai,
Y., Elgar, G., Szallasi, Z., Schwarz, R. F., Herrero, J., Stewart, A., Quezada,
S. A., Peggs, K. S., Van Loo, P., Dive, C., Lin, C. J., Rabinowitz, M., Aerts,
H., et al. (2017). Phylogenetic ctdna analysis depicts early-stage lung cancer
evolution. Nature, 545(7655):446–451.
[Abou-Elhamd and Habib, 2007] Abou-Elhamd, K. E. and Habib, T. N. (2007).

Bibliography 176
The flow cytometric analysis of premalignant and malignant lesions in head and
neck squamous cell carcinoma. Oral Oncol, 43(4):366–72.
[Albrektsen et al., 2005] Albrektsen, G., Heuch, I., Hansen, S., and Kvale, G.
(2005). Breast cancer risk by age at birth, time since birth and time intervals
between births: exploring interaction effects. Br J Cancer, 92(1):167–75.
[Alexandrov et al., 2015] Alexandrov, L. B., Jones, P. H., Wedge, D. C., Sale, J. E.,
Campbell, P. J., Nik-Zainal, S., and Stratton, M. R. (2015). Clock-like mutational
processes in human somatic cells. Nat Genet, 47(12):1402–7.
[Alexandrov et al., 2013a] Alexandrov, L. B., Nik-Zainal, S., Wedge, D. C., Apari-
cio, S. A., Behjati, S., Biankin, A. V., Bignell, G. R., Bolli, N., Borg, A.,
Borresen-Dale, A. L., Boyault, S., Burkhardt, B., Butler, A. P., Caldas, C.,
Davies, H. R., Desmedt, C., Eils, R., Eyfjord, J. E., Foekens, J. A., Greaves, M.,
Hosoda, F., Hutter, B., Ilicic, T., Imbeaud, S., Imielinski, M., Jager, N., Jones,
D. T., Jones, D., Knappskog, S., Kool, M., Lakhani, S. R., Lopez-Otin, C., Mar-
tin, S., Munshi, N. C., Nakamura, H., Northcott, P. A., Pajic, M., Papaemmanuil,
E., Paradiso, A., Pearson, J. V., Puente, X. S., Raine, K., Ramakrishna, M.,
Richardson, A. L., Richter, J., Rosenstiel, P., Schlesner, M., Schumacher, T. N.,
Span, P. N., Teague, J. W., Totoki, Y., Tutt, A. N., Valdes-Mas, R., van Buuren,
M. M., van ’t Veer, L., Vincent-Salomon, A., Waddell, N., Yates, L. R., Zucman-
Rossi, J., Futreal, P. A., McDermott, U., Lichter, P., Meyerson, M., Grimmond,
S. M., Siebert, R., Campo, E., Shibata, T., Pfister, S. M., Campbell, P. J., and
Stratton, M. R. (2013a). Signatures of mutational processes in human cancer.
Nature, 500(7463):415–21.
[Alexandrov et al., 2013b] Alexandrov, L. B., Nik-Zainal, S., Wedge, D. C., Camp-
bell, P. J., and Stratton, M. R. (2013b). Deciphering signatures of mutational
processes operative in human cancer. Cell Rep, 3(1):246–59.

Bibliography 177
[Anderson et al., 1989] Anderson, T. J., Battersby, S., King, R. J., McPherson, K.,
and Going, J. J. (1989). Oral contraceptive use influences resting breast prolifer-
ation. Hum Pathol, 20(12):1139–44.
[Andor et al., 2016] Andor, N., Graham, T. A., Jansen, M., Xia, L. C., Aktipis,
C. A., Petritsch, C., Ji, H. P., and Maley, C. C. (2016). Pan-cancer analysis of the
extent and consequences of intratumor heterogeneity. Nat Med, 22(1):105–13.
[Armitage and Doll, 1954] Armitage, P. and Doll, R. (1954). The age distribution
of cancer and a multi-stage theory of carcinogenesis. Br J Cancer, 8(1):1–12.
[Asatryan and Komarova, 2016] Asatryan, A. D. and Komarova, N. L. (2016).
Evolution of genetic instability in heterogeneous tumors. J Theor Biol, 396:1–12.
[Baca et al., 2013] Baca, S. C., Prandi, D., Lawrence, M. S., Mosquera, J. M.,
Romanel, A., Drier, Y., Park, K., Kitabayashi, N., MacDonald, T. Y., Ghandi,
M., Van Allen, E., Kryukov, G. V., Sboner, A., Theurillat, J. P., Soong, T. D.,
Nickerson, E., Auclair, D., Tewari, A., Beltran, H., Onofrio, R. C., Boysen,
G., Guiducci, C., Barbieri, C. E., Cibulskis, K., Sivachenko, A., Carter, S. L.,
Saksena, G., Voet, D., Ramos, A. H., Winckler, W., Cipicchio, M., Ardlie, K.,
Kantoff, P. W., Berger, M. F., Gabriel, S. B., Golub, T. R., Meyerson, M., Lander,
E. S., Elemento, O., Getz, G., Demichelis, F., Rubin, M. A., and Garraway, L. A.
(2013). Punctuated evolution of prostate cancer genomes. Cell, 153(3):666–77.
[Beckman and Loeb, 2006] Beckman, R. A. and Loeb, L. A. (2006). Efficiency of
carcinogenesis with and without a mutator mutation. Proc Natl Acad Sci U S A,
103(38):14140–5.
[Beerenwinkel et al., 2007] Beerenwinkel, N., Antal, T., Dingli, D., Traulsen, A.,
Kinzler, K. W., Velculescu, V. E., Vogelstein, B., and Nowak, M. A. (2007). Ge-
netic progression and the waiting time to cancer. PLoS Comput Biol, 3(11):e225.
[Ben-David et al., 2017] Ben-David, U., Ha, G., Tseng, Y. Y., Greenwald, N. F.,
Oh, C., Shih, J., McFarland, J. M., Wong, B., Boehm, J. S., Beroukhim, R., and

Bibliography 178
Golub, T. R. (2017). Patient-derived xenografts undergo mouse-specific tumor
evolution. Nat Genet, 49(11):1567–1575.
[Billingsley et al., 2015] Billingsley, C. C., Cohn, D. E., Mutch, D. G., Stephens,
J. A., Suarez, A. A., and Goodfellow, P. J. (2015). Polymerase varepsilon (pole)
mutations in endometrial cancer: clinical outcomes and implications for lynch
syndrome testing. Cancer, 121(3):386–94.
[Birkbak et al., 2011] Birkbak, N. J., Eklund, A. C., Li, Q., McClelland, S. E., En-
desfelder, D., Tan, P., Tan, I. B., Richardson, A. L., Szallasi, Z., and Swanton, C.
(2011). Paradoxical relationship between chromosomal instability and survival
outcome in cancer. Cancer Res, 71(10):3447–52.
[Blokzijl et al., 2016] Blokzijl, F., de Ligt, J., Jager, M., Sasselli, V., Roerink, S.,
Sasaki, N., Huch, M., Boymans, S., Kuijk, E., Prins, P., Nijman, I. J., Martin-
corena, I., Mokry, M., Wiegerinck, C. L., Middendorp, S., Sato, T., Schwank,
G., Nieuwenhuis, E. E., Verstegen, M. M., van der Laan, L. J., de Jonge, J., JN,
I. J., Vries, R. G., van de Wetering, M., Stratton, M. R., Clevers, H., Cuppen,
E., and van Boxtel, R. (2016). Tissue-specific mutation accumulation in human
adult stem cells during life. Nature, 538(7624):260–264.
[Bozic et al., 2010] Bozic, I., Antal, T., Ohtsuki, H., Carter, H., Kim, D., Chen, S.,
Karchin, R., Kinzler, K. W., Vogelstein, B., and Nowak, M. A. (2010). Accu-
mulation of driver and passenger mutations during tumor progression. Proc Natl
Acad Sci U S A, 107(43):18545–50.
[Bresciani, 1968] Bresciani, F. (1968). Cell proliferation in cancer. Eur J Cancer,
4(4):343–66.
[Briggs and Tomlinson, 2013] Briggs, S. and Tomlinson, I. (2013). Germline and
somatic polymerase epsilon and delta mutations define a new class of hypermu-
tated colorectal and endometrial cancers. J Pathol, 230(2):148–53.
[Broad, a] Broad. Genome analysis toolkit: Variant discovery in high-throughput
sequencing data.

Bibliography 179
[Broad, b] Broad. Picard: A set of command line tools (in java) for manipulating
high-throughput sequencing (hts) data and formats such as sam/bam/cram and
vcf.
[Brown et al., 2014] Brown, S. D., Warren, R. L., Gibb, E. A., Martin, S. D.,
Spinelli, J. J., Nelson, B. H., and Holt, R. A. (2014). Neo-antigens predicted by
tumor genome meta-analysis correlate with increased patient survival. Genome
Res, 24(5):743–50.
[Bullman et al., 2017] Bullman, S., Pedamallu, C. S., Sicinska, E., Clancy, T. E.,
Zhang, X., Cai, D., Neuberg, D., Huang, K., Guevara, F., Nelson, T., Chipashvili,
O., Hagan, T., Walker, M., Ramachandran, A., Diosdado, B., Serna, G., Mulet,
N., Landolfi, S., Ramon, Y. C. S., Fasani, R., Aguirre, A. J., Ng, K., Elez, E.,
Ogino, S., Tabernero, J., Fuchs, C. S., Hahn, W. C., Nuciforo, P., and Meyerson,
M. (2017). Analysis of fusobacterium persistence and antibiotic response in
colorectal cancer. Science, 358(6369):1443–1448.
[Cabrera et al., 2014] Cabrera, S. M., Bright, G. M., Frane, J. W., Blethen, S. L.,
and Lee, P. A. (2014). Age of thelarche and menarche in contemporary us fe-
males: a cross-sectional analysis. J Pediatr Endocrinol Metab, 27(1-2):47–51.
[Campbell et al., 2017] Campbell, B. B., Light, N., Fabrizio, D., Zatzman, M.,
Fuligni, F., de Borja, R., Davidson, S., Edwards, M., Elvin, J. A., Hodel, K. P.,
Zahurancik, W. J., Suo, Z., Lipman, T., Wimmer, K., Kratz, C. P., Bowers, D. C.,
Laetsch, T. W., Dunn, G. P., Johanns, T. M., Grimmer, M. R., Smirnov, I. V.,
Larouche, V., Samuel, D., Bronsema, A., Osborn, M., Stearns, D., Raman, P.,
Cole, K. A., Storm, P. B., Yalon, M., Opocher, E., Mason, G., Thomas, G. A.,
Sabel, M., George, B., Ziegler, D. S., Lindhorst, S., Issai, V. M., Constantini, S.,
Toledano, H., Elhasid, R., Farah, R., Dvir, R., Dirks, P., Huang, A., Galati, M. A.,
Chung, J., Ramaswamy, V., Irwin, M. S., Aronson, M., Durno, C., Taylor, M. D.,
Rechavi, G., Maris, J. M., Bouffet, E., Hawkins, C., Costello, J. F., Meyn, M. S.,
Pursell, Z. F., Malkin, D., Tabori, U., and Shlien, A. (2017). Comprehensive
analysis of hypermutation in human cancer. Cell, 171(5):1042–1056 e10.

Bibliography 180
[Carter et al., 2012] Carter, S. L., Cibulskis, K., Helman, E., McKenna, A., Shen,
H., Zack, T., Laird, P. W., Onofrio, R. C., Winckler, W., Weir, B. A., Beroukhim,
R., Pellman, D., Levine, D. A., Lander, E. S., Meyerson, M., and Getz, G. (2012).
Absolute quantification of somatic dna alterations in human cancer. Nat Biotech-
nol, 30(5):413–21.
[Casasent et al., 2018] Casasent, A. K., Schalck, A., Gao, R., Sei, E., Long, A.,
Pangburn, W., Casasent, T., Meric-Bernstam, F., Edgerton, M. E., and Navin,
N. E. (2018). Multiclonal invasion in breast tumors identified by topographic
single cell sequencing. Cell, 172(1-2):205–217 e12.
[Castro-Giner et al., 2015] Castro-Giner, F., Ratcliffe, P., and Tomlinson, I. (2015).
The mini-driver model of polygenic cancer evolution. Nat Rev Cancer,
15(11):680–5.
[Chong and Janne, 2013] Chong, C. R. and Janne, P. A. (2013). The quest to over-
come resistance to egfr-targeted therapies in cancer. Nat Med, 19(11):1389–400.
[Choudhury et al., 2013] Choudhury, S., Almendro, V., Merino, V. F., Wu, Z.,
Maruyama, R., Su, Y., Martins, F. C., Fackler, M. J., Bessarabova, M., Kowal-
czyk, A., Conway, T., Beresford-Smith, B., Macintyre, G., Cheng, Y. K., Lopez-
Bujanda, Z., Kaspi, A., Hu, R., Robens, J., Nikolskaya, T., Haakensen, V. D.,
Schnitt, S. J., Argani, P., Ethington, G., Panos, L., Grant, M., Clark, J., Herlihy,
W., Lin, S. J., Chew, G., Thompson, E. W., Greene-Colozzi, A., Richardson,
A. L., Rosson, G. D., Pike, M., Garber, J. E., Nikolsky, Y., Blum, J. L., Au, A.,
Hwang, E. S., Tamimi, R. M., Michor, F., Haviv, I., Liu, X. S., Sukumar, S., and
Polyak, K. (2013). Molecular profiling of human mammary gland links breast
cancer risk to a p27(+) cell population with progenitor characteristics. Cell Stem
Cell, 13(1):117–30.
[Christians et al., 1995] Christians, F. C., Newcomb, T. G., and Loeb, L. A. (1995).
Potential sources of multiple mutations in human cancers. Prev Med, 24(4):329–
32.
Bibliography 181
[Chung et al., 2012] Chung, K., Hovanessian-Larsen, L. J., Hawes, D., Taylor, D.,
Downey, S., Spicer, D. V., Stanczyk, F. Z., Patel, S., Anderson, A. R., Pike,
M. C., Wu, A. H., and Pearce, C. L. (2012). Breast epithelial cell prolifer-
ation is markedly increased with short-term high levels of endogenous estro-
gen secondary to controlled ovarian hyperstimulation. Breast Cancer Res Treat,
132(2):653–60.
[Church et al., 2013] Church, D. N., Briggs, S. E., Palles, C., Domingo, E.,
Kearsey, S. J., Grimes, J. M., Gorman, M., Martin, L., Howarth, K. M., Hodgson,
S. V., Kaur, K., Taylor, J., and Tomlinson, I. P. (2013). Dna polymerase epsilon
and delta exonuclease domain mutations in endometrial cancer. Hum Mol Genet,
22(14):2820–8.
[Church et al., 2015] Church, D. N., Stelloo, E., Nout, R. A., Valtcheva, N., De-
preeuw, J., ter Haar, N., Noske, A., Amant, F., Tomlinson, I. P., Wild, P. J., Lam-
brechts, D., Jurgenliemk-Schulz, I. M., Jobsen, J. J., Smit, V. T., Creutzberg,
C. L., and Bosse, T. (2015). Prognostic significance of pole proofreading muta-
tions in endometrial cancer. J Natl Cancer Inst, 107(1):402.
[Cibulskis et al., 2013] Cibulskis, K., Lawrence, M. S., Carter, S. L., Sivachenko,
A., Jaffe, D., Sougnez, C., Gabriel, S., Meyerson, M., Lander, E. S., and Getz,
G. (2013). Sensitive detection of somatic point mutations in impure and hetero-
geneous cancer samples. Nat Biotechnol, 31(3):213–9.
[Cohen et al., 2018] Cohen, J. D., Li, L., Wang, Y., Thoburn, C., Afsari, B.,
Danilova, L., Douville, C., Javed, A. A., Wong, F., Mattox, A., Hruban, R. H.,
Wolfgang, C. L., Goggins, M. G., Dal Molin, M., Wang, T. L., Roden, R., Klein,
A. P., Ptak, J., Dobbyn, L., Schaefer, J., Silliman, N., Popoli, M., Vogelstein,
J. T., Browne, J. D., Schoen, R. E., Brand, R. E., Tie, J., Gibbs, P., Wong, H. L.,
Mansfield, A. S., Jen, J., Hanash, S. M., Falconi, M., Allen, P. J., Zhou, S., Bet-
tegowda, C., Diaz, L., Tomasetti, C., Kinzler, K. W., Vogelstein, B., Lennon,
A. M., and Papadopoulos, N. (2018). Detection and localization of surgically
resectable cancers with a multi-analyte blood test. Science.

Bibliography 182
[Colditz et al., 2004] Colditz, G. A., Rosner, B. A., Chen, W. Y., Holmes, M. D.,
and Hankinson, S. E. (2004). Risk factors for breast cancer according to estrogen
and progesterone receptor status. JNCI Journal of the National Cancer Institute,
96(3):218–228.
[Cooper, 1982] Cooper, G. M. (1982). Cellular transforming genes. Science,
217(4562):801–6.
[Cooper, 2000] Cooper, G. M. (2000). The cell a molecular approach. NCBI book-
shelf. Sinauer Associates, Sunderland, Mass., 2nd edition.
[Couzin-Frankel, 2015] Couzin-Frankel, J. (2015). Biomedicine. the bad luck of
cancer. Science, 347(6217):12.
[Cristea et al., 2017] Cristea, S., Kuipers, J., and Beerenwinkel, N. (2017). path-
timex: Joint inference of mutually exclusive cancer pathways and their progres-
sion dynamics. J Comput Biol, 24(6):603–615.
[da Silva-Coelho et al., 2017] da Silva-Coelho, P., Kroeze, L. I., Yoshida, K.,
Koorenhof-Scheele, T. N., Knops, R., van de Locht, L. T., de Graaf, A. O., Mas-
sop, M., Sandmann, S., Dugas, M., Stevens-Kroef, M. J., Cermak, J., Shiraishi,
Y., Chiba, K., Tanaka, H., Miyano, S., de Witte, T., Blijlevens, N. M. A., Muus,
P., Huls, G., van der Reijden, B. A., Ogawa, S., and Jansen, J. H. (2017). Clonal
evolution in myelodysplastic syndromes. Nat Commun, 8:15099.
[Daniel and Young, 1971] Daniel, C. W. and Young, L. J. (1971). Influence of cell
division on an aging process. life span of mouse mammary epithelium during
serial propagation in vivo. Exp Cell Res, 65(1):27–32.
[Datta et al., 2013] Datta, R., Gutteridge, A., Swanton, C., Maley, C. C., and Gra-
ham, T. A. (2013). Modelling the evolution of genetic instability during tumour
progression. Evol Appl, 6(1):20–33.

Bibliography 183
[Davoli and de Lange, 2012] Davoli, T. and de Lange, T. (2012). Telomere-driven
tetraploidization occurs in human cells undergoing crisis and promotes transfor-
mation of mouse cells. Cancer Cell, 21(6):765–76.
[de Bruin et al., 2014] de Bruin, E. C., McGranahan, N., Mitter, R., Salm, M.,
Wedge, D. C., Yates, L., Jamal-Hanjani, M., Shafi, S., Murugaesu, N., Rowan,
A. J., Gronroos, E., Muhammad, M. A., Horswell, S., Gerlinger, M., Varela, I.,
Jones, D., Marshall, J., Voet, T., Van Loo, P., Rassl, D. M., Rintoul, R. C., Janes,
S. M., Lee, S. M., Forster, M., Ahmad, T., Lawrence, D., Falzon, M., Capitanio,
A., Harkins, T. T., Lee, C. C., Tom, W., Teefe, E., Chen, S. C., Begum, S., Rabi-
nowitz, A., Phillimore, B., Spencer-Dene, B., Stamp, G., Szallasi, Z., Matthews,
N., Stewart, A., Campbell, P., and Swanton, C. (2014). Spatial and temporal di-
versity in genomic instability processes defines lung cancer evolution. Science,
346(6206):251–6.
[Dewhurst et al., 2014] Dewhurst, S. M., McGranahan, N., Burrell, R. A., Rowan,
A. J., Gronroos, E., Endesfelder, D., Joshi, T., Mouradov, D., Gibbs, P., Ward,
R. L., Hawkins, N. J., Szallasi, Z., Sieber, O. M., and Swanton, C. (2014). Toler-
ance of whole-genome doubling propagates chromosomal instability and accel-
erates cancer genome evolution. Cancer Discov, 4(2):175–85.
[Dogan et al., 2012] Dogan, S., Shen, R., Ang, D. C., Johnson, M. L., D’Angelo,
S. P., Paik, P. K., Brzostowski, E. B., Riely, G. J., Kris, M. G., Zakowski, M. F.,
and Ladanyi, M. (2012). Molecular epidemiology of egfr and kras mutations in
3,026 lung adenocarcinomas: higher susceptibility of women to smoking-related
kras-mutant cancers. Clin Cancer Res, 18(22):6169–77.
[Dow et al., 2015] Dow, L. E., O’Rourke, K. P., Simon, J., Tschaharganeh, D. F.,
van Es, J. H., Clevers, H., and Lowe, S. W. (2015). Apc restoration promotes
cellular differentiation and reestablishes crypt homeostasis in colorectal cancer.
Cell, 161(7):1539–1552.

Bibliography 184
[Dowell and Minna, 2006] Dowell, J. E. and Minna, J. D. (2006). Egfr mutations
and molecularly targeted therapy: a new era in the treatment of lung cancer. Nat
Clin Pract Oncol, 3(4):170–1.
[Duan et al., 2018] Duan, M., Hao, J., Cui, S., Worthley, D. L., Zhang, S., Wang,
Z., Shi, J., Liu, L., Wang, X., Ke, A., Cao, Y., Xi, R., Zhang, X., Zhou, J., Fan,
J., Li, C., and Gao, Q. (2018). Diverse modes of clonal evolution in hbv-related
hepatocellular carcinoma revealed by single-cell genome sequencing. Cell Res.
[Durinck et al., 2011] Durinck, S., Ho, C., Wang, N. J., Liao, W., Jakkula, L. R.,
Collisson, E. A., Pons, J., Chan, S. W., Lam, E. T., Chu, C., Park, K., Hong,
S. W., Hur, J. S., Huh, N., Neuhaus, I. M., Yu, S. S., Grekin, R. C., Mauro, T. M.,
Cleaver, J. E., Kwok, P. Y., LeBoit, P. E., Getz, G., Cibulskis, K., Aster, J. C.,
Huang, H., Purdom, E., Li, J., Bolund, L., Arron, S. T., Gray, J. W., Spellman,
P. T., and Cho, R. J. (2011). Temporal dissection of tumorigenesis in primary
cancers. Cancer Discov, 1(2):137–43.
[Eirew et al., 2008] Eirew, P., Stingl, J., Raouf, A., Turashvili, G., Aparicio, S.,
Emerman, J. T., and Eaves, C. J. (2008). A method for quantifying normal hu-
man mammary epithelial stem cells with in vivo regenerative ability. Nat Med,
14(12):1384–9.
[Erson-Omay et al., 2015] Erson-Omay, E. Z., Caglayan, A. O., Schultz, N., Wein-
hold, N., Omay, S. B., Ozduman, K., Koksal, Y., Li, J., Serin Harmanci, A.,
Clark, V., Carrion-Grant, G., Baranoski, J., Caglar, C., Barak, T., Coskun, S.,
Baran, B., Kose, D., Sun, J., Bakircioglu, M., Moliterno Gunel, J., Pamir, M. N.,
Mishra-Gorur, K., Bilguvar, K., Yasuno, K., Vortmeyer, A., Huttner, A. J.,
Sander, C., and Gunel, M. (2015). Somatic pole mutations cause an ultramu-
tated giant cell high-grade glioma subtype with better prognosis. Neuro Oncol,
17(10):1356–64.

Bibliography 185
[Faulkin and Deome, 1960] Faulkin, L. J., J. and Deome, K. B. (1960). Regulation
of growth and spacing of gland elements in the mammary fat pad of the c3h
mouse. J Natl Cancer Inst, 24:953–69.
[Favero et al., 2015] Favero, F., Joshi, T., Marquard, A. M., Birkbak, N. J., Krzys-
tanek, M., Li, Q., Szallasi, Z., and Eklund, A. C. (2015). Sequenza: allele-
specific copy number and mutation profiles from tumor sequencing data. Ann
Oncol, 26(1):64–70.
[Foo et al., 2015] Foo, J., Liu, L. L., Leder, K., Riester, M., Iwasa, Y., Lengauer, C.,
and Michor, F. (2015). An evolutionary approach for identifying driver mutations
in colorectal cancer. PLoS Comput Biol, 11(9):e1004350.
[Fraley and Raftery, 2002] Fraley, C. and Raftery, A. E. (2002). Model-based clus-
tering, discriminant analysis and density estimation. Journal of the American
Statistical Association, 97(1):611–631.
[Fraley et al., 2012] Fraley, C., Raftery, A. E., Murphy, B., and Scrucca, L. (2012).
mclust version 4 for r: Normal mixture modeling for model-based clustering,
classification, and density estimation technical report no. 597. N/A.
[Ganem et al., 2009] Ganem, N. J., Godinho, S. A., and Pellman, D. (2009).
A mechanism linking extra centrosomes to chromosomal instability. Nature,
460(7252):278–82.
[Gao et al., 2016] Gao, R., Davis, A., McDonald, T. O., Sei, E., Shi, X., Wang, Y.,
Tsai, P. C., Casasent, A., Waters, J., Zhang, H., Meric-Bernstam, F., Michor, F.,
and Navin, N. E. (2016). Punctuated copy number evolution and clonal stasis in
triple-negative breast cancer. Nat Genet, 48(10):1119–30.
[Garrett-Bakelman and Melnick, 2016] Garrett-Bakelman, F. E. and Melnick,
A. M. (2016). Mutant idh: a targetable driver of leukemic phenotypes linking
metabolism, epigenetics and transcriptional regulation. Epigenomics, 8(7):945–
57.

Bibliography 186
[Gehring et al., 2015] Gehring, J. S., Fischer, B., Lawrence, M., and Huber,
W. (2015). Somaticsignatures: inferring mutational signatures from single-
nucleotide variants. Bioinformatics, 31(22):3673–5.
[Gerlinger et al., 2012] Gerlinger, M., Rowan, A. J., Horswell, S., Math, M.,
Larkin, J., Endesfelder, D., Gronroos, E., Martinez, P., Matthews, N., Stewart,
A., Tarpey, P., Varela, I., Phillimore, B., Begum, S., McDonald, N. Q., Butler, A.,
Jones, D., Raine, K., Latimer, C., Santos, C. R., Nohadani, M., Eklund, A. C.,
Spencer-Dene, B., Clark, G., Pickering, L., Stamp, G., Gore, M., Szallasi, Z.,
Downward, J., Futreal, P. A., and Swanton, C. (2012). Intratumor heterogene-
ity and branched evolution revealed by multiregion sequencing. N Engl J Med,
366(10):883–892.
[Goh et al., 1995] Goh, H. S., Yao, J., and Smith, D. R. (1995). p53 point mutation
and survival in colorectal cancer patients. Cancer Res, 55(22):5217–21.
[Going et al., 1988] Going, J. J., Anderson, T. J., Battersby, S., and MacIntyre,
C. C. (1988). Proliferative and secretory activity in human breast during natural
and artificial menstrual cycles. Am J Pathol, 130(1):193–204.
[Gonzalez-Perez et al., 2013] Gonzalez-Perez, A., Perez-Llamas, C., Deu-Pons, J.,
Tamborero, D., Schroeder, M. P., Jene-Sanz, A., Santos, A., and Lopez-Bigas,
N. (2013). Intogen-mutations identifies cancer drivers across tumor types. Nat
Methods, 10(11):1081–2.
[Gordon et al., 2012] Gordon, D. J., Resio, B., and Pellman, D. (2012). Causes and
consequences of aneuploidy in cancer. Nat Rev Genet, 13(3):189–203.
[Graham and Sottoriva, 2017] Graham, T. A. and Sottoriva, A. (2017). Measuring
cancer evolution from the genome. J Pathol, 241(2):183–191.
[Greenblatt et al., 1994] Greenblatt, M. S., Bennett, W. P., Hollstein, M., and Har-
ris, C. C. (1994). Mutations in the p53 tumor suppressor gene: clues to cancer
etiology and molecular pathogenesis. Cancer Res, 54(18):4855–78.
Bibliography 187
[Greenman et al., 2007] Greenman, C., Stephens, P., Smith, R., Dalgliesh, G. L.,
Hunter, C., Bignell, G., Davies, H., Teague, J., Butler, A., Stevens, C., Edkins,
S., O’Meara, S., Vastrik, I., Schmidt, E. E., Avis, T., Barthorpe, S., Bhamra, G.,
Buck, G., Choudhury, B., Clements, J., Cole, J., Dicks, E., Forbes, S., Gray,
K., Halliday, K., Harrison, R., Hills, K., Hinton, J., Jenkinson, A., Jones, D.,
Menzies, A., Mironenko, T., Perry, J., Raine, K., Richardson, D., Shepherd, R.,
Small, A., Tofts, C., Varian, J., Webb, T., West, S., Widaa, S., Yates, A., Cahill,
D. P., Louis, D. N., Goldstraw, P., Nicholson, A. G., Brasseur, F., Looijenga, L.,
Weber, B. L., Chiew, Y. E., DeFazio, A., Greaves, M. F., Green, A. R., Campbell,
P., Birney, E., Easton, D. F., Chenevix-Trench, G., Tan, M. H., Khoo, S. K.,
Teh, B. T., Yuen, S. T., Leung, S. Y., Wooster, R., Futreal, P. A., and Stratton,
M. R. (2007). Patterns of somatic mutation in human cancer genomes. Nature,
446(7132):153–8.
[Greenman et al., 2012] Greenman, C. D., Pleasance, E. D., Newman, S., Yang, F.,
Fu, B., Nik-Zainal, S., Jones, D., Lau, K. W., Carter, N., Edwards, P. A., Futreal,
P. A., Stratton, M. R., and Campbell, P. J. (2012). Estimation of rearrangement
phylogeny for cancer genomes. Genome Res, 22(2):346–61.
[Hambardzumyan et al., 2011] Hambardzumyan, D., Cheng, Y. K., Haeno, H.,
Holland, E. C., and Michor, F. (2011). The probable cell of origin of nf1- and
pdgf-driven glioblastomas. PLoS One, 6(9):e24454.
[Hanahan and Weinberg, 2011] Hanahan, D. and Weinberg, R. A. (2011). Hall-
marks of cancer: the next generation. Cell, 144(5):646–74.
[Harris, 2008] Harris, H. (2008). Concerning the origin of malignant tumours by
theodor boveri. translated and annotated by henry harris. preface. J Cell Sci, 121
Suppl 1:v–vi.
[Hause et al., 2016] Hause, R. J., Pritchard, C. C., Shendure, J., and Salipante, S. J.
(2016). Classification and characterization of microsatellite instability across 18
cancer types. Nat Med.

Bibliography 188
[Helleday et al., 2014] Helleday, T., Eshtad, S., and Nik-Zainal, S. (2014). Mech-
anisms underlying mutational signatures in human cancers. Nat Rev Genet,
15(9):585–98.
[Heng and Durbin, 2009] Heng, L. and Durbin, R. (2009). Burrows-wheeler
aligner.
[Homfray et al., 1998] Homfray, T. F., Cottrell, S. E., Ilyas, M., Rowan, A., Talbot,
I. C., Bodmer, W. F., and Tomlinson, I. P. (1998). Defects in mismatch repair
occur after apc mutations in the pathogenesis of sporadic colorectal tumours.
Hum Mutat, 11(2):114–20.
[Hong et al., 2015] Hong, M. K., Macintyre, G., Wedge, D. C., Van Loo, P., Patel,
K., Lunke, S., Alexandrov, L. B., Sloggett, C., Cmero, M., Marass, F., Tsui,
D., Mangiola, S., Lonie, A., Naeem, H., Sapre, N., Phal, P. M., Kurganovs, N.,
Chin, X., Kerger, M., Warren, A. Y., Neal, D., Gnanapragasam, V., Rosenfeld,
N., Pedersen, J. S., Ryan, A., Haviv, I., Costello, A. J., Corcoran, N. M., and
Hovens, C. M. (2015). Tracking the origins and drivers of subclonal metastatic
expansion in prostate cancer. Nat Commun, 6:6605.
[Huh et al., 2015] Huh, S. J., Clement, K., Jee, D., Merlini, A., Choudhury, S.,
Maruyama, R., Yoo, R., Chytil, A., Boyle, P., Ran, F. A., Moses, H. L., Barcellos-
Hoff, M. H., Jackson-Grusby, L., Meissner, A., and Polyak, K. (2015). Age-
and pregnancy-associated dna methylation changes in mammary epithelial cells.
Stem Cell Reports, 4(2):297–311.
[Huh et al., 2016] Huh, S. J., Oh, H., Peterson, M. A., Almendro, V., Hu, R., Bow-
den, M., Lis, R. L., Cotter, M. B., Loda, M., Barry, W. T., Polyak, K., and
Tamimi, R. M. (2016). The proliferative activity of mammary epithelial cells in
normal tissue predicts breast cancer risk in premenopausal women. Cancer Res,
76(7):1926–34.
[Hussein et al., 2015] Hussein, Y. R., Weigelt, B., Levine, D. A., Schoolmeester,
J. K., Dao, L. N., Balzer, B. L., Liles, G., Karlan, B., Kobel, M., Lee, C. H., and

Bibliography 189
Soslow, R. A. (2015). Clinicopathological analysis of endometrial carcinomas
harboring somatic pole exonuclease domain mutations. Mod Pathol, 28(4):505–
14.
[Jamal-Hanjani et al., 2017] Jamal-Hanjani, M., Wilson, G. A., McGranahan, N.,
Birkbak, N. J., Watkins, T. B. K., Veeriah, S., Shafi, S., Johnson, D. H., Mit-
ter, R., Rosenthal, R., Salm, M., Horswell, S., Escudero, M., Matthews, N.,
Rowan, A., Chambers, T., Moore, D. A., Turajlic, S., Xu, H., Lee, S. M., Forster,
M. D., Ahmad, T., Hiley, C. T., Abbosh, C., Falzon, M., Borg, E., Marafioti,
T., Lawrence, D., Hayward, M., Kolvekar, S., Panagiotopoulos, N., Janes, S. M.,
Thakrar, R., Ahmed, A., Blackhall, F., Summers, Y., Shah, R., Joseph, L., Quinn,
A. M., Crosbie, P. A., Naidu, B., Middleton, G., Langman, G., Trotter, S., Nicol-
son, M., Remmen, H., Kerr, K., Chetty, M., Gomersall, L., Fennell, D. A., Nakas,
A., Rathinam, S., Anand, G., Khan, S., Russell, P., Ezhil, V., Ismail, B., Irvin-
Sellers, M., Prakash, V., Lester, J. F., Kornaszewska, M., Attanoos, R., Adams,
H., Davies, H., Dentro, S., Taniere, P., O’Sullivan, B., Lowe, H. L., Hartley, J. A.,
Iles, N., Bell, H., Ngai, Y., Shaw, J. A., Herrero, J., Szallasi, Z., Schwarz, R. F.,
Stewart, A., Quezada, S. A., Le Quesne, J., Van Loo, P., Dive, C., Hackshaw, A.,
and Swanton, C. (2017). Tracking the evolution of non-small-cell lung cancer.
N Engl J Med, 376(22):2109–2121.
[Jeggo et al., 2016] Jeggo, P. A., Pearl, L. H., and Carr, A. M. (2016). Dna repair,
genome stability and cancer: a historical perspective. Nat Rev Cancer, 16(1):35–
42.
[Jones et al., 2008] Jones, S., Chen, W. D., Parmigiani, G., Diehl, F., Beerenwinkel,
N., Antal, T., Traulsen, A., Nowak, M. A., Siegel, C., Velculescu, V. E., Kinzler,
K. W., Vogelstein, B., Willis, J., and Markowitz, S. D. (2008). Comparative
lesion sequencing provides insights into tumor evolution. Proc Natl Acad Sci U
S A, 105(11):4283–8.
[Junttila et al., 2010] Junttila, M. R., Karnezis, A. N., Garcia, D., Madriles, F., Ko-
rtlever, R. M., Rostker, F., Brown Swigart, L., Pham, D. M., Seo, Y., Evan, G. I.,

Bibliography 190
and Martins, C. P. (2010). Selective activation of p53-mediated tumour suppres-
sion in high-grade tumours. Nature, 468(7323):567–71.
[Kan et al., 2010] Kan, Z., Jaiswal, B. S., Stinson, J., Janakiraman, V., Bhatt, D.,
Stern, H. M., Yue, P., Haverty, P. M., Bourgon, R., Zheng, J., Moorhead, M.,
Chaudhuri, S., Tomsho, L. P., Peters, B. A., Pujara, K., Cordes, S., Davis, D. P.,
Carlton, V. E., Yuan, W., Li, L., Wang, W., Eigenbrot, C., Kaminker, J. S., Eber-
hard, D. A., Waring, P., Schuster, S. C., Modrusan, Z., Zhang, Z., Stokoe, D.,
de Sauvage, F. J., Faham, M., and Seshagiri, S. (2010). Diverse somatic mutation
patterns and pathway alterations in human cancers. Nature, 466(7308):869–73.
[Kandoth et al., 2013] Kandoth, C., Schultz, N., Cherniack, A. D., Akbani, R., Liu,
Y., Shen, H., Robertson, A. G., Pashtan, I., Shen, R., Benz, C. C., Yau, C.,
Laird, P. W., Ding, L., Zhang, W., Mills, G. B., Kucherlapati, R., Mardis, E. R.,
and Levine, D. A. (2013). Integrated genomic characterization of endometrial
carcinoma. Nature, 497(7447):67–73.
[Katharine M. Mullen, 2012] Katharine M. Mullen, I. H. M. v. S. (2012). nnls: The
lawson-hanson algorithm for non-negative least squares (nnls).
[Kato et al., 1998] Kato, I., Toniolo, P., Akhmedkhanov, A., Koenig, K. L., Shore,
R., and Zeleniuch-Jacquotte, A. (1998). Prospective study of factors influencing
the onset of natural menopause. J Clin Epidemiol, 51(12):1271–6.
[Kloosterman et al., 2011] Kloosterman, W. P., Hoogstraat, M., Paling, O.,
Tavakoli-Yaraki, M., Renkens, I., Vermaat, J. S., van Roosmalen, M. J., van
Lieshout, S., Nijman, I. J., Roessingh, W., van ’t Slot, R., van de Belt, J., Guryev,
V., Koudijs, M., Voest, E., and Cuppen, E. (2011). Chromothripsis is a common
mechanism driving genomic rearrangements in primary and metastatic colorectal
cancer. Genome Biol, 12(10):R103.
[Kordon and Smith, 1998] Kordon, E. C. and Smith, G. H. (1998). An entire func-
tional mammary gland may comprise the progeny from a single cell. Develop-
ment, 125(10):1921–30.

Bibliography 191
[Kuukasjarvi et al., 1997a] Kuukasjarvi, T., Karhu, R., Tanner, M., Kahkonen, M.,
Schaffer, A., Nupponen, N., Pennanen, S., Kallioniemi, A., Kallioniemi, O. P.,
and Isola, J. (1997a). Genetic heterogeneity and clonal evolution underlying
development of asynchronous metastasis in human breast cancer. Cancer Res,
57(8):1597–604.
[Kuukasjarvi et al., 1997b] Kuukasjarvi, T., Tanner, M., Pennanen, S., Karhu, R.,
Kallioniemi, O. P., and Isola, J. (1997b). Genetic changes in intraductal
breast cancer detected by comparative genomic hybridization. Am J Pathol,
150(4):1465–71.
[Lawrence et al., 2014] Lawrence, M. S., Stojanov, P., Mermel, C. H., Robinson,
J. T., Garraway, L. A., Golub, T. R., Meyerson, M., Gabriel, S. B., Lander, E. S.,
and Getz, G. (2014). Discovery and saturation analysis of cancer genes across
21 tumour types. Nature, 505(7484):495–501.
[Lawrence et al., 2013] Lawrence, M. S., Stojanov, P., Polak, P., Kryukov, G. V.,
Cibulskis, K., Sivachenko, A., Carter, S. L., Stewart, C., Mermel, C. H., Roberts,
S. A., Kiezun, A., Hammerman, P. S., McKenna, A., Drier, Y., Zou, L., Ramos,
A. H., Pugh, T. J., Stransky, N., Helman, E., Kim, J., Sougnez, C., Ambrogio,
L., Nickerson, E., Shefler, E., Cortes, M. L., Auclair, D., Saksena, G., Voet,
D., Noble, M., DiCara, D., Lin, P., Lichtenstein, L., Heiman, D. I., Fennell,
T., Imielinski, M., Hernandez, B., Hodis, E., Baca, S., Dulak, A. M., Lohr, J.,
Landau, D. A., Wu, C. J., Melendez-Zajgla, J., Hidalgo-Miranda, A., Koren, A.,
McCarroll, S. A., Mora, J., Crompton, B., Onofrio, R., Parkin, M., Winckler, W.,
Ardlie, K., Gabriel, S. B., Roberts, C. W. M., Biegel, J. A., Stegmaier, K., Bass,
A. J., Garraway, L. A., Meyerson, M., Golub, T. R., Gordenin, D. A., Sunyaev,
S., Lander, E. S., and Getz, G. (2013). Mutational heterogeneity in cancer and
the search for new cancer-associated genes. Nature, 499(7457):214–218.
[Lee et al., 2011] Lee, A. J., Endesfelder, D., Rowan, A. J., Walther, A., Birkbak,
N. J., Futreal, P. A., Downward, J., Szallasi, Z., Tomlinson, I. P., Howell, M.,

Bibliography 192
Kschischo, M., and Swanton, C. (2011). Chromosomal instability confers intrin-
sic multidrug resistance. Cancer Res, 71(5):1858–70.
[Lengauer et al., 1997] Lengauer, C., Kinzler, K. W., and Vogelstein, B. (1997).
Genetic instability in colorectal cancers. Nature, 386(6625):623–7.
[Li et al., 2014] Li, X., Galipeau, P. C., Paulson, T. G., Sanchez, C. A., Arnaudo,
J., Liu, K., Sather, C. L., Kostadinov, R. L., Odze, R. D., Kuhner, M. K., Maley,
C. C., Self, S. G., Vaughan, T. L., Blount, P. L., and Reid, B. J. (2014). Temporal
and spatial evolution of somatic chromosomal alterations: a case-cohort study of
barrett’s esophagus. Cancer Prev Res (Phila), 7(1):114–27.
[Llosa et al., 2015] Llosa, N. J., Cruise, M., Tam, A., Wicks, E. C., Hechen-
bleikner, E. M., Taube, J. M., Blosser, R. L., Fan, H., Wang, H., Luber, B. S.,
Zhang, M., Papadopoulos, N., Kinzler, K. W., Vogelstein, B., Sears, C. L., An-
ders, R. A., Pardoll, D. M., and Housseau, F. (2015). The vigorous immune
microenvironment of microsatellite instable colon cancer is balanced by multi-
ple counter-inhibitory checkpoints. Cancer Discov, 5(1):43–51.
[Loeb, 1991] Loeb, L. A. (1991). Mutator phenotype may be required for multi-
stage carcinogenesis. Cancer Res, 51(12):3075–9.
[Loeb, 2001] Loeb, L. A. (2001). A mutator phenotype in cancer. Cancer Res,
61(8):3230–9.
[Loeb, 2011] Loeb, L. A. (2011). Human cancers express mutator phenotypes:
origin, consequences and targeting. Nat Rev Cancer, 11(6):450–7.
[Loeb and Mullins, 2000] Loeb, L. A. and Mullins, J. I. (2000). Lethal mutagen-
esis of hiv by mutagenic ribonucleoside analogs. AIDS Res Hum Retroviruses,
16(1):1–3.
[Luksza et al., 2017] Luksza, M., Riaz, N., Makarov, V., Balachandran, V. P., Hell-
mann, M. D., Solovyov, A., Rizvi, N. A., Merghoub, T., Levine, A. J., Chan,
T. A., Wolchok, J. D., and Greenbaum, B. D. (2017). A neoantigen fitness

Bibliography 193
model predicts tumour response to checkpoint blockade immunotherapy. Na-
ture, 551(7681):517–520.
[Luptacik, 2010] Luptacik, M. (2010). Mathematical optimization and economic
analysis. Springer optimization and its applications. Springer, New York ; Lon-
don.
[Maciejowski and de Lange, 2017] Maciejowski, J. and de Lange, T. (2017).
Telomeres in cancer: tumour suppression and genome instability. Nat Rev Mol
Cell Biol, 18(3):175–186.
[Maciejowski et al., 2015] Maciejowski, J., Li, Y., Bosco, N., Campbell, P. J., and
de Lange, T. (2015). Chromothripsis and kataegis induced by telomere crisis.
Cell, 163(7):1641–54.
[MacMahon et al., 1970] MacMahon, B., Cole, P., Lim, T., Lowe, A., Mirra, B.,
Ravnihar, B., Salber, E., Valaoras, V., and Yuasa, S. (1970). Age at first birth and
breast cancer risk. Bull. Wld Hlth Org., 43(1):209–221.
[Makova and Hardison, 2015] Makova, K. D. and Hardison, R. C. (2015). The
effects of chromatin organization on variation in mutation rates in the genome.
Nat Rev Genet, 16(4):213–23.
[Maley et al., 2006] Maley, C. C., Galipeau, P. C., Finley, J. C., Wongsurawat, V. J.,
Li, X., Sanchez, C. A., Paulson, T. G., Blount, P. L., Risques, R. A., Rabinovitch,
P. S., and Reid, B. J. (2006). Genetic clonal diversity predicts progression to
esophageal adenocarcinoma. Nat Genet, 38(4):468–73.
[Margonis et al., 2015] Margonis, G. A., Kim, Y., Spolverato, G., Ejaz, A., Gupta,
R., Cosgrove, D., Anders, R., Karagkounis, G., Choti, M. A., and Pawlik, T. M.
(2015). Association between specific mutations in kras codon 12 and colorectal
liver metastasis. JAMA Surg, 150(8):722–9.
[Martincorena et al., 2017] Martincorena, I., Raine, K. M., Gerstung, M., Dawson,
K. J., Haase, K., Van Loo, P., Davies, H., Stratton, M. R., and Campbell, P. J.

Bibliography 194
(2017). Universal patterns of selection in cancer and somatic tissues. Cell,
171(5):1029–1041 e21.
[Martincorena et al., 2015] Martincorena, I., Roshan, A., Gerstung, M., Ellis, P.,
Van Loo, P., McLaren, S., Wedge, D. C., Fullam, A., Alexandrov, L. B., Tubio,
J. M., Stebbings, L., Menzies, A., Widaa, S., Stratton, M. R., Jones, P. H., and
Campbell, P. J. (2015). Tumor evolution. high burden and pervasive positive
selection of somatic mutations in normal human skin. Science, 348(6237):880–
6.
[Martinez et al., 2016] Martinez, P., Timmer, M. R., Lau, C. T., Calpe, S., Sancho-
Serra Mdel, C., Straub, D., Baker, A. M., Meijer, S. L., Kate, F. J., Mallant-Hent,
R. C., Naber, A. H., van Oijen, A. H., Baak, L. C., Scholten, P., Bohmer, C. J.,
Fockens, P., Bergman, J. J., Maley, C. C., Graham, T. A., and Krishnadath, K. K.
(2016). Dynamic clonal equilibrium and predetermined cancer risk in barrett’s
oesophagus. Nat Commun, 7:12158.
[Maruvka et al., 2017] Maruvka, Y. E., Mouw, K. W., Karlic, R., Parasuraman, P.,
Kamburov, A., Polak, P., Haradhvala, N. J., Hess, J. M., Rheinbay, E., Brody, Y.,
Koren, A., Braunstein, L. Z., D’Andrea, A., Lawrence, M. S., Bass, A., Bernards,
A., Michor, F., and Getz, G. (2017). Analysis of somatic microsatellite indels
identifies driver events in human tumors. Nat Biotechnol, 35(10):951–959.
[McFarland et al., 2013] McFarland, C. D., Korolev, K. S., Kryukov, G. V., Sun-
yaev, S. R., and Mirny, L. A. (2013). Impact of deleterious passenger mutations
on cancer progression. Proc Natl Acad Sci U S A, 110(8):2910–5.
[McFarland et al., 2014] McFarland, C. D., Mirny, L. A., and Korolev, K. S.
(2014). Tug-of-war between driver and passenger mutations in cancer and other
adaptive processes. Proc Natl Acad Sci U S A, 111(42):15138–43.
[McGranahan et al., 2015] McGranahan, N., Favero, F., de Bruin, E. C., Birkbak,
N. J., Szallasi, Z., and Swanton, C. (2015). Clonal status of actionable driver

Bibliography 195
events and the timing of mutational processes in cancer evolution. Sci Transl
Med, 7(283):283ra54.
[McGranahan et al., 2016] McGranahan, N., Furness, A. J., Rosenthal, R., Ram-
skov, S., Lyngaa, R., Saini, S. K., Jamal-Hanjani, M., Wilson, G. A., Birk-
bak, N. J., Hiley, C. T., Watkins, T. B., Shafi, S., Murugaesu, N., Mitter, R.,
Akarca, A. U., Linares, J., Marafioti, T., Henry, J. Y., Van Allen, E. M., Miao,
D., Schilling, B., Schadendorf, D., Garraway, L. A., Makarov, V., Rizvi, N. A.,
Snyder, A., Hellmann, M. D., Merghoub, T., Wolchok, J. D., Shukla, S. A., Wu,
C. J., Peggs, K. S., Chan, T. A., Hadrup, S. R., Quezada, S. A., and Swanton,
C. (2016). Clonal neoantigens elicit t cell immunoreactivity and sensitivity to
immune checkpoint blockade. Science, 351(6280):1463–9.
[Meng et al., 2014] Meng, B., Hoang, L. N., McIntyre, J. B., Duggan, M. A., Nel-
son, G. S., Lee, C. H., and Kobel, M. (2014). Pole exonuclease domain mutation
predicts long progression-free survival in grade 3 endometrioid carcinoma of the
endometrium. Gynecol Oncol, 134(1):15–9.
[Michor, 2005] Michor, F. (2005). Chromosomal instability and human cancer.
Philos Trans R Soc Lond B Biol Sci, 360(1455):631–5.
[Mitelman et al., 2007] Mitelman, F., Johansson, B., and Mertens, F. (2007). The
impact of translocations and gene fusions on cancer causation. Nat Rev Cancer,
7(4):233–45.
[Miyamoto et al., 2018] Miyamoto, T., Ando, H., Asaka, R., Yamada, Y., and Sh-
iozawa, T. (2018). Mutation analysis by whole exome sequencing of endome-
trial hyperplasia and carcinoma in one patient: Abnormalities of polymerase ep-
silon and the phosphatidylinositol-3 kinase pathway. J Obstet Gynaecol Res,
44(1):179–183.
[Moolgavkar et al., 1980] Moolgavkar, S., Day, N., and Stevens, R. (1980). Two-
stage model for carcinogenesis- epidemiology of breast cancer in females. JNCI
Journal of the National Cancer Institute, 65(1):559–569.

Bibliography 196
[Moolgavkar, 2004] Moolgavkar, S. H. (2004). Commentary: Fifty years of the
multistage model: remarks on a landmark paper. Int J Epidemiol, 33(6):1182–3.
[Moolgavkar and Knudson, 1981] Moolgavkar, S. H. and Knudson, A. G., J.
(1981). Mutation and cancer: a model for human carcinogenesis. J Natl Cancer
Inst, 66(6):1037–52.
[Moran, 1962] Moran, P. A. P. (1962). The statistical processes of evolutionary
theory. Clarendon Press.
[Mouw et al., 2016] Mouw, K., Braunstein, L. Z., Kim, J., Polak, P., Getz, G., and
D’Andrea, A. D. (2016). Somatic ercc2 mutations are associated with a distinct
mutational signature in muscle-invasive bladder cancer. Int J Radiat Oncol Biol
Phys, 96(2S):S54.
[NCHS, 2016] NCHS (2016). Health, united states, 2015: With special features on
racial and ethnic health disparities.
[Nik-Zainal et al., 2012a] Nik-Zainal, S., Alexandrov, L. B., Wedge, D. C.,
Van Loo, P., Greenman, C. D., Raine, K., Jones, D., Hinton, J., Marshall, J.,
Stebbings, L. A., Menzies, A., Martin, S., Leung, K., Chen, L., Leroy, C., Ra-
makrishna, M., Rance, R., Lau, K. W., Mudie, L. J., Varela, I., McBride, D. J.,
Bignell, G. R., Cooke, S. L., Shlien, A., Gamble, J., Whitmore, I., Maddison,
M., Tarpey, P. S., Davies, H. R., Papaemmanuil, E., Stephens, P. J., McLaren,
S., Butler, A. P., Teague, J. W., Jonsson, G., Garber, J. E., Silver, D., Miron,
P., Fatima, A., Boyault, S., Langerod, A., Tutt, A., Martens, J. W., Aparicio,
S. A., Borg, A., Salomon, A. V., Thomas, G., Borresen-Dale, A. L., Richard-
son, A. L., Neuberger, M. S., Futreal, P. A., Campbell, P. J., and Stratton, M. R.
(2012a). Mutational processes molding the genomes of 21 breast cancers. Cell,
149(5):979–93.
[Nik-Zainal et al., 2016] Nik-Zainal, S., Davies, H., Staaf, J., Ramakrishna, M.,
Glodzik, D., Zou, X., Martincorena, I., Alexandrov, L. B., Martin, S., Wedge,
D. C., Van Loo, P., Ju, Y. S., Smid, M., Brinkman, A. B., Morganella, S., Aure,

Bibliography 197
M. R., Lingjaerde, O. C., Langerod, A., Ringner, M., Ahn, S. M., Boyault, S.,
Brock, J. E., Broeks, A., Butler, A., Desmedt, C., Dirix, L., Dronov, S., Fatima,
A., Foekens, J. A., Gerstung, M., Hooijer, G. K., Jang, S. J., Jones, D. R., Kim,
H. Y., King, T. A., Krishnamurthy, S., Lee, H. J., Lee, J. Y., Li, Y., McLaren,
S., Menzies, A., Mustonen, V., O’Meara, S., Pauporte, I., Pivot, X., Purdie,
C. A., Raine, K., Ramakrishnan, K., Rodriguez-Gonzalez, F. G., Romieu, G.,
Sieuwerts, A. M., Simpson, P. T., Shepherd, R., Stebbings, L., Stefansson, O. A.,
Teague, J., Tommasi, S., Treilleux, I., Van den Eynden, G. G., Vermeulen, P.,
Vincent-Salomon, A., Yates, L., Caldas, C., van’t Veer, L., Tutt, A., Knappskog,
S., Tan, B. K., Jonkers, J., Borg, A., Ueno, N. T., Sotiriou, C., Viari, A., Futreal,
P. A., Campbell, P. J., Span, P. N., Van Laere, S., Lakhani, S. R., Eyfjord, J. E.,
Thompson, A. M., Birney, E., Stunnenberg, H. G., van de Vijver, M. J., Martens,
J. W., Borresen-Dale, A. L., Richardson, A. L., Kong, G., Thomas, G., and Strat-
ton, M. R. (2016). Landscape of somatic mutations in 560 breast cancer whole-
genome sequences. Nature, 534(7605):47–54.
[Nik-Zainal et al., 2012b] Nik-Zainal, S., Van Loo, P., Wedge, D. C., Alexandrov,
L. B., Greenman, C. D., Lau, K. W., Raine, K., Jones, D., Marshall, J., Ra-
makrishna, M., Shlien, A., Cooke, S. L., Hinton, J., Menzies, A., Stebbings,
L. A., Leroy, C., Jia, M., Rance, R., Mudie, L. J., Gamble, S. J., Stephens, P. J.,
McLaren, S., Tarpey, P. S., Papaemmanuil, E., Davies, H. R., Varela, I., McBride,
D. J., Bignell, G. R., Leung, K., Butler, A. P., Teague, J. W., Martin, S., Jonsson,
G., Mariani, O., Boyault, S., Miron, P., Fatima, A., Langerod, A., Aparicio, S. A.,
Tutt, A., Sieuwerts, A. M., Borg, A., Thomas, G., Salomon, A. V., Richardson,
A. L., Borresen-Dale, A. L., Futreal, P. A., Stratton, M. R., and Campbell, P. J.
(2012b). The life history of 21 breast cancers. Cell, 149(5):994–1007.
[Notta et al., 2016] Notta, F., Chan-Seng-Yue, M., Lemire, M., Li, Y., Wilson,
G. W., Connor, A. A., Denroche, R. E., Liang, S. B., Brown, A. M., Kim, J. C.,
Wang, T., Simpson, J. T., Beck, T., Borgida, A., Buchner, N., Chadwick, D.,
Hafezi-Bakhtiari, S., Dick, J. E., Heisler, L., Hollingsworth, M. A., Ibrahimov,
E., Jang, G. H., Johns, J., Jorgensen, L. G., Law, C., Ludkovski, O., Lungu,

Bibliography 198
I., Ng, K., Pasternack, D., Petersen, G. M., Shlush, L. I., Timms, L., Tsao,
M. S., Wilson, J. M., Yung, C. K., Zogopoulos, G., Bartlett, J. M., Alexandrov,
L. B., Real, F. X., Cleary, S. P., Roehrl, M. H., McPherson, J. D., Stein, L. D.,
Hudson, T. J., Campbell, P. J., and Gallinger, S. (2016). A renewed model of
pancreatic cancer evolution based on genomic rearrangement patterns. Nature,
538(7625):378–382.
[Nowak et al., 2006] Nowak, M. A., Michor, F., and Iwasa, Y. (2006). Genetic
instability and clonal expansion. J Theor Biol, 241(1):26–32.
[Olsson et al., 1996] Olsson, H., Jernstrom, H., Alm, P., Kreipe, H., Ingvar, C.,
Jonsson, P. E., and Ryden, S. (1996). Proliferation of the breast epithelium in
relation to menstrual cycle phase, hormonal use, and reproductive factors. Breast
Cancer Res Treat, 40(2):187–96.
[Palles et al., 2013] Palles, C., Cazier, J. B., Howarth, K. M., Domingo, E., Jones,
A. M., Broderick, P., Kemp, Z., Spain, S. L., Guarino, E., Salguero, I., Sherborne,
A., Chubb, D., Carvajal-Carmona, L. G., Ma, Y., Kaur, K., Dobbins, S., Barclay,
E., Gorman, M., Martin, L., Kovac, M. B., Humphray, S., Lucassen, A., Holmes,
C. C., Bentley, D., Donnelly, P., Taylor, J., Petridis, C., Roylance, R., Sawyer,
E. J., Kerr, D. J., Clark, S., Grimes, J., Kearsey, S. E., Thomas, H. J., McVean,
G., Houlston, R. S., and Tomlinson, I. (2013). Germline mutations affecting the
proofreading domains of pole and pold1 predispose to colorectal adenomas and
carcinomas. Nat Genet, 45(2):136–44.
[Parkin et al., 2011] Parkin, D. M., Boyd, L., and Walker, L. C. (2011). 16. the
fraction of cancer attributable to lifestyle and environmental factors in the uk in
2010. Br J Cancer, 105 Suppl 2:S77–81.
[Petljak and Alexandrov, 2016] Petljak, M. and Alexandrov, L. B. (2016). Under-
standing mutagenesis through delineation of mutational signatures in human can-
cer. Carcinogenesis, 37(6):531–40.

Bibliography 199
[Pike et al., 1983] Pike, M., Krailo, M., Henderson, B., Casagrande, J., and Hoel,
D. (1983). ’hormonal’ risk factors, ’breast tissue age’ and the age-incidence of
breast cancer. Nature, 303(1):769–770.
[Polyak, 2007] Polyak, K. (2007). Breast cancer: origins and evolution. J Clin
Invest, 117(11):3155–63.
[Popnikolov et al., 2001] Popnikolov, N., Yang, J., Liu, A., Guzman, R., and
Nandi, S. (2001). Reconstituted normal human breast in nude mice: effect of
host pregnancy environment and human chorionic gonadotropin on proliferation.
J Endocrinol, 168(3):487–96.
[Potter and Prentice, 2015] Potter, J. D. and Prentice, R. L. (2015). Cancer risk:
tumors excluded. Science, 347(6223):727.
[Purdom et al., 2013] Purdom, E., Ho, C., Grasso, C. S., Quist, M. J., Cho, R. J.,
and Spellman, P. (2013). Methods and challenges in timing chromosomal abnor-
malities within cancer samples. Bioinformatics, 29(24):3113–20.
[Quintas-Cardama et al., 2009] Quintas-Cardama, A., Kantarjian, H., and Cortes,
J. (2009). Imatinib and beyond–exploring the full potential of targeted therapy
for cml. Nat Rev Clin Oncol, 6(9):535–43.
[Raczy et al., 2013] Raczy, C., Petrovski, R., Saunders, C. T., Chorny, I., Kruglyak,
S., Margulies, E. H., Chuang, H. Y., Kallberg, M., Kumar, S. A., Liao, A., Little,
K. M., Stromberg, M. P., and Tanner, S. W. (2013). Isaac: ultra-fast whole-
genome secondary analysis on illumina sequencing platforms. Bioinformatics,
29(16):2041–3.
[Rayner et al., 2016] Rayner, E., van Gool, I. C., Palles, C., Kearsey, S. E., Bosse,
T., Tomlinson, I., and Church, D. N. (2016). A panoply of errors: polymerase
proofreading domain mutations in cancer. Nat Rev Cancer, 16(2):71–81.
[Riely et al., 2008] Riely, G. J., Kris, M. G., Rosenbaum, D., Marks, J., Li, A.,
Chitale, D. A., Nafa, K., Riedel, E. R., Hsu, M., Pao, W., Miller, V. A., and

Bibliography 200
Ladanyi, M. (2008). Frequency and distinctive spectrum of kras mutations in
never smokers with lung adenocarcinoma. Clin Cancer Res, 14(18):5731–4.
[Rosner and Colditz, 1996] Rosner, B. and Colditz, G. A. (1996). Nurses’ health
study: log-incidence mathematical model of breast cancer incidence. J Natl
Cancer Inst, 88(6):359–64.
[Rosner et al., 1994] Rosner, B. A., Colditz, G. A., and Willett, C. (1994). Repro-
ductive risk factors in a prospective study of breast cancer - the nurses’ health
study. American Jounral of Epidemiology, 139(8):819–835.
[Rowan et al., 2000] Rowan, A. J., Lamlum, H., Ilyas, M., Wheeler, J., Straub, J.,
Papadopoulou, A., Bicknell, D., Bodmer, W. F., and Tomlinson, I. P. (2000). Apc
mutations in sporadic colorectal tumors: A mutational ”hotspot” and interdepen-
dence of the ”two hits”. Proc Natl Acad Sci U S A, 97(7):3352–7.
[Roylance et al., 2011] Roylance, R., Endesfelder, D., Gorman, P., Burrell, R. A.,
Sander, J., Tomlinson, I., Hanby, A. M., Speirs, V., Richardson, A. L., Birkbak,
N. J., Eklund, A. C., Downward, J., Kschischo, M., Szallasi, Z., and Swanton,
C. (2011). Relationship of extreme chromosomal instability with long-term sur-
vival in a retrospective analysis of primary breast cancer. Cancer Epidemiol
Biomarkers Prev, 20(10):2183–94.
[Russo et al., 2005] Russo, J., Moral, R., Balogh, G. A., Mailo, D., and Russo, I. H.
(2005). The protective role of pregnancy in breast cancer. Breast Cancer Res,
7(3):131–42.
[Russo et al., 1992] Russo, J., Rivera, R., and Russo, I. H. (1992). Influence of age
and parity on the development of the human breast. Breast Cancer Res Treat,
23(3):211–8.
[Salk et al., 2010] Salk, J. J., Fox, E. J., and Loeb, L. A. (2010). Mutational hetero-
geneity in human cancers: origin and consequences. Annu Rev Pathol, 5:51–75.

Bibliography 201
[Sansregret et al., 2018] Sansregret, L., Vanhaesebroeck, B., and Swanton, C.
(2018). Determinants and clinical implications of chromosomal instability in
cancer. Nat Rev Clin Oncol.
[Santin et al., 2016] Santin, A. D., Bellone, S., Buza, N., Choi, J., Schwartz, P. E.,
Schlessinger, J., and Lifton, R. P. (2016). Regression of chemotherapy-resistant
polymerase epsilon (pole) ultra-mutated and msh6 hyper-mutated endometrial
tumors with nivolumab. Clin Cancer Res, 22(23):5682–5687.
[Sarebo et al., 2006] Sarebo, M., Skjelbred, C. F., Breistein, R., Lothe, I. M., Ha-
gen, P. C., Bock, G., Hansteen, I. L., and Kure, E. H. (2006). Association
between cigarette smoking, apc mutations and the risk of developing sporadic
colorectal adenomas and carcinomas. BMC Cancer, 6:71.
[Saunders et al., 2012] Saunders, C. T., Wong, W. S., Swamy, S., Becq, J., Murray,
L. J., and Cheetham, R. K. (2012). Strelka: accurate somatic small-variant call-
ing from sequenced tumor-normal sample pairs. Bioinformatics, 28(14):1811–7.
[Schettino et al., 2008] Schettino, C., Bareschino, M. A., Ricci, V., and Ciardiello,
F. (2008). Erlotinib: an egf receptor tyrosine kinase inhibitor in non-small-cell
lung cancer treatment. Expert Rev Respir Med, 2(2):167–78.
[Schiffer et al., 1979] Schiffer, L. M., Braunschweiger, P. G., Stragand, J. J., and
Poulakos, L. (1979). The cell kinetics of human mammary cancers. Cancer,
43(5):1707–19.
[Scholzen and Gerdes, 2000] Scholzen, T. and Gerdes, J. (2000). The ki-67 pro-
tein: from the known and the unknown. J Cell Physiol, 182(3):311–22.
[Schulze et al., 2015] Schulze, K., Imbeaud, S., Letouze, E., Alexandrov, L. B.,
Calderaro, J., Rebouissou, S., Couchy, G., Meiller, C., Shinde, J., Soysouvanh,
F., Calatayud, A. L., Pinyol, R., Pelletier, L., Balabaud, C., Laurent, A., Blanc,
J. F., Mazzaferro, V., Calvo, F., Villanueva, A., Nault, J. C., Bioulac-Sage, P.,
Stratton, M. R., Llovet, J. M., and Zucman-Rossi, J. (2015). Exome sequencing

Bibliography 202
of hepatocellular carcinomas identifies new mutational signatures and potential
therapeutic targets. Nat Genet, 47(5):505–11.
[Shinbrot et al., 2014] Shinbrot, E., Henninger, E. E., Weinhold, N., Covington,
K. R., Goksenin, A. Y., Schultz, N., Chao, H., Doddapaneni, H., Muzny, D. M.,
Gibbs, R. A., Sander, C., Pursell, Z. F., and Wheeler, D. A. (2014). Exonuclease
mutations in dna polymerase epsilon reveal replication strand specific mutation
patterns and human origins of replication. Genome Res, 24(11):1740–50.
[Shlien et al., 2015] Shlien, A., Campbell, B. B., de Borja, R., Alexandrov, L. B.,
Merico, D., Wedge, D., Van Loo, P., Tarpey, P. S., Coupland, P., Behjati, S.,
Pollett, A., Lipman, T., Heidari, A., Deshmukh, S., Avitzur, N., Meier, B., Ger-
stung, M., Hong, Y., Merino, D. M., Ramakrishna, M., Remke, M., Arnold, R.,
Panigrahi, G. B., Thakkar, N. P., Hodel, K. P., Henninger, E. E., Goksenin, A. Y.,
Bakry, D., Charames, G. S., Druker, H., Lerner-Ellis, J., Mistry, M., Dvir, R.,
Grant, R., Elhasid, R., Farah, R., Taylor, G. P., Nathan, P. C., Alexander, S.,
Ben-Shachar, S., Ling, S. C., Gallinger, S., Constantini, S., Dirks, P., Huang, A.,
Scherer, S. W., Grundy, R. G., Durno, C., Aronson, M., Gartner, A., Meyn, M. S.,
Taylor, M. D., Pursell, Z. F., Pearson, C. E., Malkin, D., Futreal, P. A., Stratton,
M. R., Bouffet, E., Hawkins, C., Campbell, P. J., and Tabori, U. (2015). Com-
bined hereditary and somatic mutations of replication error repair genes result in
rapid onset of ultra-hypermutated cancers. Nat Genet, 47(3):257–62.
[Sieber et al., 2005] Sieber, O. M., Tomlinson, S. R., and Tomlinson, I. P. (2005).
Tissue, cell and stage specificity of (epi)mutations in cancers. Nat Rev Cancer,
5(8):649–55.
[Simon, 2010] Simon, A. (2010). Fastqc: A quality control tool for high throughput
sequence data.
[Sottoriva et al., 2015] Sottoriva, A., Kang, H., Ma, Z., Graham, T. A., Salomon,
M. P., Zhao, J., Marjoram, P., Siegmund, K., Press, M. F., Shibata, D., and Curtis,

Bibliography 203
C. (2015). A big bang model of human colorectal tumor growth. Nat Genet,
47(3):209–16.
[Stachler et al., 2015] Stachler, M. D., Taylor-Weiner, A., Peng, S., McKenna, A.,
Agoston, A. T., Odze, R. D., Davison, J. M., Nason, K. S., Loda, M., Leshchiner,
I., Stewart, C., Stojanov, P., Seepo, S., Lawrence, M. S., Ferrer-Torres, D., Lin,
J., Chang, A. C., Gabriel, S. B., Lander, E. S., Beer, D. G., Getz, G., Carter,
S. L., and Bass, A. J. (2015). Paired exome analysis of barrett’s esophagus and
adenocarcinoma. Nat Genet, 47(9):1047–55.
[Stephens et al., 2011] Stephens, P. J., Greenman, C. D., Fu, B., Yang, F., Bignell,
G. R., Mudie, L. J., Pleasance, E. D., Lau, K. W., Beare, D., Stebbings, L. A.,
McLaren, S., Lin, M. L., McBride, D. J., Varela, I., Nik-Zainal, S., Leroy, C., Jia,
M., Menzies, A., Butler, A. P., Teague, J. W., Quail, M. A., Burton, J., Swerdlow,
H., Carter, N. P., Morsberger, L. A., Iacobuzio-Donahue, C., Follows, G. A.,
Green, A. R., Flanagan, A. M., Stratton, M. R., Futreal, P. A., and Campbell,
P. J. (2011). Massive genomic rearrangement acquired in a single catastrophic
event during cancer development. Cell, 144(1):27–40.
[Storchova and Pellman, 2004] Storchova, Z. and Pellman, D. (2004). From poly-
ploidy to aneuploidy, genome instability and cancer. Nat Rev Mol Cell Biol,
5(1):45–54.
[Suzuki et al., 2000] Suzuki, R., Atherton, A. J., O’Hare, M. J., Entwistle, A.,
Lakhani, S. R., and Clarke, C. (2000). Proliferation and differentiation in the
human breast during pregnancy. Differentiation, 66(2-3):106–15.
[Talhouk et al., 2015] Talhouk, A., McConechy, M. K., Leung, S., Li-Chang, H. H.,
Kwon, J. S., Melnyk, N., Yang, W., Senz, J., Boyd, N., Karnezis, A. N.,
Huntsman, D. G., Gilks, C. B., and McAlpine, J. N. (2015). A clinically ap-
plicable molecular-based classification for endometrial cancers. Br J Cancer,
113(2):299–310.
Bibliography 204
[Taylor et al., 2009] Taylor, D., Pearce, C. L., Hovanessian-Larsen, L., Downey, S.,
Spicer, D. V., Bartow, S., Pike, M. C., Wu, A. H., and Hawes, D. (2009). Pro-
gesterone and estrogen receptors in pregnant and premenopausal non-pregnant
normal human breast. Breast Cancer Res Treat, 118(1):161–8.
[Temko et al., 2017] Temko, D., Cheng, Y. K., Polyak, K., and Michor, F. (2017).
Mathematical modeling links pregnancy-associated changes and breast cancer
risk. Cancer Res, 77(11):2800–2809.
[Temko et al., 2018] Temko, D., Van Gool, I. C., Rayner, E., Glaire, M., Makino,
S., Brown, M., Chegwidden, L., Palles, C., Depreeuw, J., Beggs, A.,
Stathopoulou, C., Mason, J., Baker, A. M., Williams, M., Cerundolo, V., Rei,
M., Taylor, J. C., Schuh, A., Ahmed, A., Amant, F., Lambrechts, D., Smit, V. T.,
Bosse, T., Graham, T. A., Church, D. N., and Tomlinson, I. (2018). Somatic pole
exonuclease domain mutations are early events in sporadic endometrial and col-
orectal carcinogenesis, determining driver mutational landscape, clonal neoanti-
gen burden and immune response. J Pathol.
[Thibodeau et al., 1993] Thibodeau, S. N., Bren, G., and Schaid, D. (1993). Mi-
crosatellite instability in cancer of the proximal colon. Science, 260(5109):816–
9.
[Tomasetti et al., 2015] Tomasetti, C., Marchionni, L., Nowak, M. A., Parmigiani,
G., and Vogelstein, B. (2015). Only three driver gene mutations are required
for the development of lung and colorectal cancers. Proc Natl Acad Sci U S A,
112(1):118–23.
[Tomasetti and Vogelstein, 2015] Tomasetti, C. and Vogelstein, B. (2015). Cancer
etiology. variation in cancer risk among tissues can be explained by the number
of stem cell divisions. Science, 347(6217):78–81.
[Tomasetti et al., 2013] Tomasetti, C., Vogelstein, B., and Parmigiani, G. (2013).
Half or more of the somatic mutations in cancers of self-renewing tissues origi-
nate prior to tumor initiation. Proc Natl Acad Sci U S A, 110(6):1999–2004.

Bibliography 205
[Tomlinson et al., 1996] Tomlinson, I. P., Novelli, M. R., and Bodmer, W. F.
(1996). The mutation rate and cancer. Proc Natl Acad Sci U S A, 93(25):14800–
3.
[Traulsen et al., 2013] Traulsen, A., Lenaerts, T., Pacheco, J. M., and Dingli, D.
(2013). On the dynamics of neutral mutations in a mathematical model for a
homogeneous stem cell population. J R Soc Interface, 10(79):20120810.
[van Gool et al., 2015] van Gool, I. C., Eggink, F. A., Freeman-Mills, L., Stelloo,
E., Marchi, E., de Bruyn, M., Palles, C., Nout, R. A., de Kroon, C. D., Osse,
E. M., Klenerman, P., Creutzberg, C. L., Tomlinson, I. P., Smit, V. T., Nij-
man, H. W., Bosse, T., and Church, D. N. (2015). Pole proofreading mutations
elicit an antitumor immune response in endometrial cancer. Clin Cancer Res,
21(14):3347–3355.
[Venkataram et al., 2016] Venkataram, S., Dunn, B., Li, Y., Agarwala, A., Chang,
J., Ebel, E. R., Geiler-Samerotte, K., Herissant, L., Blundell, J. R., Levy, S. F.,
Fisher, D. S., Sherlock, G., and Petrov, D. A. (2016). Development of a compre-
hensive genotype-to-fitness map of adaptation-driving mutations in yeast. Cell,
166(6):1585–1596 e22.
[Vilar and Gruber, 2010] Vilar, E. and Gruber, S. B. (2010). Microsatellite insta-
bility in colorectal cancer-the stable evidence. Nat Rev Clin Oncol, 7(3):153–62.
[Villadsen et al., 2007] Villadsen, R., Fridriksdottir, A. J., Ronnov-Jessen, L., Gud-
jonsson, T., Rank, F., LaBarge, M. A., Bissell, M. J., and Petersen, O. W.
(2007). Evidence for a stem cell hierarchy in the adult human breast. J Cell
Biol, 177(1):87–101.
[Visvader, 2011] Visvader, J. E. (2011). Cells of origin in cancer. Nature,
469(7330):314–22.
[Vogelstein et al., 2013] Vogelstein, B., Papadopoulos, N., Velculescu, V. E., Zhou,
S., Diaz, L. A., J., and Kinzler, K. W. (2013). Cancer genome landscapes. Sci-
ence, 339(6127):1546–58.

Bibliography 206
[Waclaw et al., 2015] Waclaw, B., Bozic, I., Pittman, M. E., Hruban, R. H., Vogel-
stein, B., and Nowak, M. A. (2015). A spatial model predicts that dispersal and
cell turnover limit intratumour heterogeneity. Nature, 525(7568):261–4.
[Wagener et al., 2015] Wagener, R., Alexandrov, L. B., Montesinos-Rongen, M.,
Schlesner, M., Haake, A., Drexler, H. G., Richter, J., Bignell, G. R., McDermott,
U., and Siebert, R. (2015). Analysis of mutational signatures in exomes from
b-cell lymphoma cell lines suggest apobec3 family members to be involved in
the pathogenesis of primary effusion lymphoma. Leukemia, 29(7):1612–5.
[Wang et al., 2010] Wang, K., Li, M., and Hakonarson, H. (2010). Annovar: func-
tional annotation of genetic variants from high-throughput sequencing data. Nu-
cleic Acids Res, 38(16):e164.
[Weghorn and Sunyaev, 2017] Weghorn, D. and Sunyaev, S. (2017). Bayesian
inference of negative and positive selection in human cancers. Nat Genet,
49(12):1785–1788.
[Weinberg and Zaykin, 2015] Weinberg, C. R. and Zaykin, D. (2015). Is bad luck
the main cause of cancer? J Natl Cancer Inst, 107(7).
[Weinberg, 2014] Weinberg, R. A. (2014). The biology of cancer. Garland Science,
Taylor & Francis Group, New York, second edition. edition.
[Weinstein, 2002] Weinstein, I. B. (2002). Cancer. addiction to oncogenes–the
achilles heal of cancer. Science, 297(5578):63–4.
[Weisberg et al., 2007] Weisberg, E., Manley, P. W., Cowan-Jacob, S. W.,
Hochhaus, A., and Griffin, J. D. (2007). Second generation inhibitors of bcr-
abl for the treatment of imatinib-resistant chronic myeloid leukaemia. Nat Rev
Cancer, 7(5):345–56.
[Williams et al., 2016] Williams, M. J., Werner, B., Barnes, C. P., Graham, T. A.,
and Sottoriva, A. (2016). Identification of neutral tumor evolution across cancer
types. Nat Genet, 48(3):238–44.

Bibliography 207
[Yates et al., 2017] Yates, L. R., Knappskog, S., Wedge, D., Farmery, J. H. R., Gon-
zalez, S., Martincorena, I., Alexandrov, L. B., Van Loo, P., Haugland, H. K.,
Lilleng, P. K., Gundem, G., Gerstung, M., Pappaemmanuil, E., Gazinska, P.,
Bhosle, S. G., Jones, D., Raine, K., Mudie, L., Latimer, C., Sawyer, E., Desmedt,
C., Sotiriou, C., Stratton, M. R., Sieuwerts, A. M., Lynch, A. G., Martens, J. W.,
Richardson, A. L., Tutt, A., Lonning, P. E., and Campbell, P. J. (2017). Genomic
evolution of breast cancer metastasis and relapse. Cancer Cell, 32(2):169–184
e7.
[Zack et al., 2013] Zack, T. I., Schumacher, S. E., Carter, S. L., Cherniack, A. D.,
Saksena, G., Tabak, B., Lawrence, M. S., Zhsng, C. Z., Wala, J., Mermel, C. H.,
Sougnez, C., Gabriel, S. B., Hernandez, B., Shen, H., Laird, P. W., Getz, G.,
Meyerson, M., and Beroukhim, R. (2013). Pan-cancer patterns of somatic copy
number alteration. Nat Genet, 45(10):1134–40.
[Zhang et al., 2015] Zhang, C. Z., Spektor, A., Cornils, H., Francis, J. M., Jackson,
E. K., Liu, S., Meyerson, M., and Pellman, D. (2015). Chromothripsis from dna
damage in micronuclei. Nature, 522(7555):179–84.