On Combining Network Research and Computational ...
257
Technische Universit¨ at M¨ unchen TUM School of Social Sciences and Technology On Combining Network Research and Computational Methods on Historical Research Questions and its Implications for the Digital Humanities Cindarella Sarah Maria Petz Vollst¨ andiger Abdruck der von der TUM School of Social Sciences and Technology der Technischen Universit¨ at M¨ unchen zur Erlangung des akademischen Grades einer Doktorin der Philosophie (Dr. phil.) genehmigten Dissertation. Vorsitzende: Prof. Dr. Katrin Paula Pr¨ ufer der Dissertation: 1. Prof. Dr. J¨ urgen Pfeffer 2. Assoc. Prof. Dr.-Ing. Michael Piotrowski (Universit´ e de Lausanne) Die Dissertation wurde am 22.09.2021 bei der Technischen Universit¨ at M¨ unchen eingereicht und durch die TUM School of Social Sciences and Technology am 17.01.2022 angenommen.
-
Upload
khangminh22 -
Category
Documents
-
view
3 -
download
0
Transcript of On Combining Network Research and Computational ...

Technische Universitat Munchen
TUM School of Social Sciences and Technology
On Combining Network Research andComputational Methods on Historical Research
Questions and its Implications for theDigital Humanities
Cindarella Sarah Maria Petz
Vollstandiger Abdruck der von der TUM School of Social Sciences and Technology der
Technischen Universitat Munchen zur Erlangung des akademischen Grades einer
Doktorin der Philosophie (Dr. phil.)
genehmigten Dissertation.
Vorsitzende: Prof. Dr. Katrin Paula
Prufer der Dissertation: 1. Prof. Dr. Jurgen Pfeffer
2. Assoc. Prof. Dr.-Ing. Michael Piotrowski
(Universite de Lausanne)
Die Dissertation wurde am 22.09.2021 bei der Technischen Universitat Munchen eingereicht
und durch die TUM School of Social Sciences and Technology am 17.01.2022 angenommen.


Acknowledgments
Let me express my joy in the support I have received over the years. I want to thank my
doctoral father Jurgen Pfeffer for this adventure and the trust he placed in me, and the
academic support I received from my colleagues and mentors. My sincerest gratitude go
to my friends and family: Without your unwavering support, I would not be where I am
today. Thank you for always being there.
i


Abstract
Computer-based methods and approaches increasingly find entry in the humanities. The
digital humanities are perceived as a research paradigm that introduced computational,
quantitative, and digital methods into the humanities, which originate from a vast range
of fields such as computer science, math, or the social sciences.
This thesis evaluates the chances and challenges when combining network research and
computational methods in historical research based on two main case studies. In the
first case study, we assessed the extent of political judiciary in the autocratic Corporate
State of Austria based on court records of 1935 from both Viennese provincial courts.
We analyzed structural configurations of a conviction dependent on the political orien-
tation of the defendants using quantitative methods, network analysis, and qualitative
historical contextualization. In the second case study, we analyzed influence networks
of intellectuals based on a Linked Open Dataset in a series of articles, applying a rela-
tional approach to the history of intellectuals. We evaluated the network positions of
intellectuals and the structural evolution of their influence networks in time.
These mixed methods approach combining network research, computational methods,
and historical contextualization allowed us to extend on and to falsify historical knowl-
edge both on the judicial practices during the Corporate State and on the importance
of intellectuals in time.
This thesis provides an overview of the historical development and prospects of the dig-
ital humanities and network research, focusing on the interdisciplinary work of digital
history and historical network research. We address the limitations and implications of
the epistemological and ontological changes when working with the digital and critically
reflect on the multimodal literacies–such as data and methodological literacy, as well as
tool criticism–needed to assess the implications of computationally derived insights.
iii


Zusammenfassung
Computergestutzte Methoden und Ansatze finden zunehmend Eingang in den Geis-
teswissenschaften. Die Digital Humanities werden als ein Forschungsparadigma wahrgenom-
men, welches zur Einfuhrung von computational methods, sowie digitalen, quantitativen
und qualitativen Methoden in den Geisteswissenschaften gefuhrt haben, die wiederum
aus einer Vielzahl verschiedener Disziplinen wie der Computerwissenschaft, Mathematik
oder den Sozialwissenschaften stammen.
Diese Thesis evaluiert Chancen und Herausforderungen der Anwendung von Netzw-
erkforschung und computational methods in der historischen Forschung anhand zweier
Fallstudien. In der ersten Fallstudie untersuchten wir das Ausmaß politischer Justiz
im autokratischen Standestaad Osterreichs anhand von Gerichtsakten von 1935 der
beiden Wiener Landesgerichte. Wir analysierten strukturelle Konfigurationen einer
Verurteilung abhangig zur politischen Orientierung der Angeklagten mithilfe quanti-
tiativer Methoden, Netzwerkanalyse, und einer qualitativen historischen Kontextual-
isierung. In der zweiten Fallstudie untersuchten wir influence networks von Intellek-
tuellen basierend auf einem Linked Open Dataset in einer Reihe von Artikeln, in welchen
wir einen relationalen Ansatz auf die history of intellectuals anwendeten. Dazu analysierten
wir die Positionen der Intellektuellen im Netzwerk und deren strukturelle Entwicklung
im Verlauf der Zeit.
Dieser mixed methods Ansatz verbindet Netzwerkforschung, computational methods mit
einer historischen Kontextualisieren, welcher es uns erlaubt an bestehender historischer
Erkenntnis sowohl zur Justizpraxis im Standestaat als auch zur Bedeutung von Intellek-
tuellen anzuknupfen, zu erweitern und zu falsifizieren.
Diese Thesis gibt einen Uberblick zur historischen Entwicklung und zu den Moglichkeiten
der Digital Humanities und Netzwerkforschung mit einem Schwerpunkt auf die interdiszi-
plinare Arbeit der Digital History und Historical Network Research. Wir gehen dabei auf
die Grenzen und Implikationen der epistemologischen und ontologischen Veranderungen
bei der Arbeit mit dem Digitalen ein und reflektieren kritisch ob der multimodal lit-
eracies–wie Daten- und Methodenkompetences, sowie tool criticism–, welche notwendig
sind, um die Implikationen computergestutzerter Erkenntnis zu bewerten.
v


Publications
This thesis is based on five peer-reviewed papers, which are listed in the overview in
Table 1. These papers are organized around two big topics: the first targeting the
extend of political judiciary during the Corporate State, the latter analyzing a big data
network of a Linked Open Dataset on the history of intellectuals.
Table 1: Peer-reviewed publication basis of this dissertation
No. Year Authors Paper Venue
1 2021 Petz, Cindarella& Pfeffer, Jurgen
Configuration to Conviction: NetworkStructures of Political Judiciary in theAustrian Corporate State
Social Networks, vol. 66,July 2021, pp. 185–201. DOI:10.1016/j.socnet.2021.03.001.
5 2021 Petz, Cindarella& Ghawi, Raji &Pfeffer, Jurgen
Tracking the Evolution of Communi-ties in a Social Network of IntellectualInfluences
Journal for Historical NetworkResearch (JHNR) 2021, acceptedfor publication Sept. 18, 2021.
3 2020 Petz, Cindarella& Ghawi, Raji &Pfeffer, Jurgen
A Longitudinal Analysis of a SocialNetwork of Intellectual Influence
IEEE/ACM InternationalConference on Advancesin Social Network Analysisand Mining (ASONAM)2020, pp. 340–347. DOI:10.1109/ASONAM49781.2020.93-81318
4 2021 Ghawi, Raji &Petz, Cindarella& Pfeffer, Jurgen
Dynamics of Influence in a Social Net-work of Intellectuals
Social Network Analysis and Min-ing (SNAM) 2021, vol. 11, num-ber 63. DOI: 10.1007/s13278-021-00771-x.
2 2019 Ghawi, Raji &Petz, Cindarella& Pfeffer, Jurgen
’On the Shoulders of Giants’, Analy-sis of a Social Network of IntellectualInfluence
Sixth International Conference onSocial Networks Analysis, Man-agement and Security (SNAMS)2019, pp. 248–255. DOI:10.1109/SNAMS.2019.8931821.
vii

The following list includes invited talks and presentations I gave during this disserta-
tion:
Date Title and Venue
05/2021 Historical Network Research in a Nutshell: On courts, intellectuals, and the perks of networks,Seminar “Digital History” (Dr. U. Hasenohrl) at Innsbruck University (virtual).
03/2021 A mixed methods approach to political judiciary, Conference “Digital Methods and Resources inLegal History” (DHL2021), Max Planck Institute for Legal History and Legal Theory, Frankfurtam Main (virtual). Postponed from 2020 to 2021.
12/2020 A Longitudinal Analysis of a Social Network of Intellectual History, IEEE/ACM InternationalConference on Advances in Social Network Analysis and Mining (ASONAM) 2020, The Hague,Netherlands (virtual).
07/2020 Analyzing Political Trials during the Austrian Authoritative Rule using a Network Approach,SUNBELT 2020 Virtual Conference.
10/2019 Historische Netzwerkforschung und Politische Justiz am Beispiel Wien 1935 (Diss.), Obersem-inar, Research Institute for the History of Technology and Science at the German MuseumMunich.
09/2019 Political Judiciary in the Corporate State of Austria, 4th European Conference on Social Net-works (EUSN), Zurich.
06/2019 Networks of Political Judiciary in the Corporate State: The provincial courts of Vienna in1935, Poster Presentation, 2nd Heidelberg Computational Humanities Summer School “MixedMethods in the Making” (HCH), Heidelberg University.
05/2019 Disseminating Political Judiciary with ERGM, Kolloquium Prof. C. Stadtfeld, ETH Zurich.
05/2019 Networks of Political Judiciary in the Corporate State in Austria, 13th Workshop HistoricalNetwork Research “Networks across Time and Space.” Methodological Challenges and Theoret-ical Concerns of Network Research in the Humanities, Akademie der Wissenschaften und derLiteratur Mainz.
03/2019 Gerichtsakten als Quelle historischer Netzwerkanalyse zur Politischen Verfolgung im Osterre-ichischen Standestaat, Workshop “Von Chancen und Herausforderungen.” Werkstattgesprachezur Historischen Netzwerkanalyse, FWF-DACH-Projekt “Issues with Europe”, Forschungszen-trum Digital Humanities at Innsbruck University.
06/2018 Networks of Political Prosecution, XXXVIII SUNBELT Conference Utrecht.
viii

Contents
Acknowledgments i
Abstract iii
Zusammenfassung v
Publications vii
Table of Contents x
1 Introduction 1
2 Digital Humanities 5
2.1 Defining Digital Humanities – a tension field . . . . . . . . . . . . . . . . 5
2.1.1 DH as independent discipline vs. sub-field . . . . . . . . . . . . . . 5
2.1.2 DH as a meta-discipline . . . . . . . . . . . . . . . . . . . . . . . . 7
2.1.3 Descriptive definitions of DH . . . . . . . . . . . . . . . . . . . . . 9
2.2 Historiographical perspectives on the DH and Digital History . . . . . . . 15
2.3 Methodologies in the DH . . . . . . . . . . . . . . . . . . . . . . . . . . . 28
3 Network Research and Historical Network Analysis 31
3.1 Networks and models . . . . . . . . . . . . . . . . . . . . . . . . . . . . . . 31
3.2 Origins of network research . . . . . . . . . . . . . . . . . . . . . . . . . . 33
3.3 Development of Historical Network Research . . . . . . . . . . . . . . . . 39
4 Case Study Political Judiciary in the Corporate State 45
4.1 Topicality . . . . . . . . . . . . . . . . . . . . . . . . . . . . . . . . . . . . 45
4.2 On political judiciary . . . . . . . . . . . . . . . . . . . . . . . . . . . . . . 46
4.3 Innovation and discussion . . . . . . . . . . . . . . . . . . . . . . . . . . . 48
4.3.1 Extending on previous qualitative scholarship . . . . . . . . . . . . 48
4.3.2 Methodological approaches . . . . . . . . . . . . . . . . . . . . . . 49
Paper 1: Configuration to Conviction. Network Structures of Political Judiciary
in the Austrian Corporate State. (Social Networks 2021) 53
5 Case Study Social Networks in the History of Intellectuals 71
5.1 On intellectuals and intellectual history . . . . . . . . . . . . . . . . . . . 71
ix

Contents
5.2 Innovation and discussion . . . . . . . . . . . . . . . . . . . . . . . . . . . 72
5.2.1 Relational intellectual history . . . . . . . . . . . . . . . . . . . . . 72
5.2.2 Methodological approaches . . . . . . . . . . . . . . . . . . . . . . 75
Paper 2: ’On the Shoulders of Giants’ – Analysis of a Social Network of
Intellectual Influence. (SNAMS 2019) 86
Paper 3: A Longitudinal Analysis of a Social Network of Intellectual Influence.
(IEEE/ACM ASONAM 2020) 95
Paper 4: Diffusion Dynamics of Influence in a Social Network of Intellectuals.
(SNAM 2021) 104
Paper 5: Tracking the Evolution of Communities in a Social Network of Intel-
lectual Influences. (JHNR 2021) 128
6 Discussion 163
6.1 Becoming DH . . . . . . . . . . . . . . . . . . . . . . . . . . . . . . . . . . 163
6.1.1 Discourses of subjectivisation . . . . . . . . . . . . . . . . . . . . . 163
6.1.2 On the need to define DH – Differentiation and definiteness . . . . 164
6.1.3 Historicity of DH discourses – History on repeat . . . . . . . . . . 166
6.1.4 Theoriezation . . . . . . . . . . . . . . . . . . . . . . . . . . . . . . 168
6.2 Impact of the DH . . . . . . . . . . . . . . . . . . . . . . . . . . . . . . . . 170
6.2.1 Prospects . . . . . . . . . . . . . . . . . . . . . . . . . . . . . . . . 170
6.2.2 Criticism . . . . . . . . . . . . . . . . . . . . . . . . . . . . . . . . 172
6.2.3 Keeping promises . . . . . . . . . . . . . . . . . . . . . . . . . . . . 172
6.3 Challenges and implications . . . . . . . . . . . . . . . . . . . . . . . . . . 180
6.3.1 Establishing literacy . . . . . . . . . . . . . . . . . . . . . . . . . . 180
6.3.2 Towards a complementation of methodologies . . . . . . . . . . . . 191
6.3.3 Interdisciplinary research cooperation . . . . . . . . . . . . . . . . 197
6.3.4 Next steps in future research avenues . . . . . . . . . . . . . . . . . 199
6.3.5 A long way towards digital competences coming of age . . . . . . . 200
Bibliography 203
x

Chapter 1
Introduction
The digital has become a commodity in the humanities. While the digital has found
entry into humanities research work in terms of computer-assisted searching, text pro-
duction, and publication, the implementation of computer-based analysis and its sensible
concatenation with qualitative approaches still remain in many open questions.
At the beginning of this thesis, the development of the digital humanities was still
about to turn to a professionalization and formalization of computer-assisted digital
and computational methodologies and argument-driven analysis. This direction gained
traction during the course of this thesis.
The underlying goal of this thesis is to identify hidden patterns in data, that are too
big to easily overview and to further historical knowledge on specific historical research
questions using a mixed methods approach that combines traditional hermeneutics from
the historical studies with computational methodologies from the fields of computer
science, (computational) social science, and the digital humanities in general. This is
put to practice in two case studies: on political judiciary in an autocratic regime, and
on a big data analysis of the history of intellectuals utilizing a Linked Open Dataset
(LOD).
This thesis assumption is that the DH offer a broad kaleidoscope of tools and methods
which necessarily need to be contextualized by domain-specific knowledge–a traditional
historical core–in order to be able to interpret any findings of technical methods. In-
terdisciplinary computational-based methods provide a magnifying glass or prism for
historical research in order to detect connections, structures and patterns even in estab-
lished research fields–if put under a considerate, pronounced method, tool, and (digital)
source criticism.
The underlying epistemic framework of this endeavor is that of modeling.1 Based on
the classical definition by Herbert Stachowiak (1973), models offer an approximation
to reality through the–subjective–selection of (supposedly) important or representative
factors and parameters and their (subjective) weighting and evaluation. Modeling is
a fundamental epistemic tool: “We model to understand,” summarized this Le Moigne
1. This idea of the importance of modeling for the digital and computational humanities has been
picked up in a workshop organized by GESIS in January 2017, which results have been published in a
supplement of the Historical Social Research journal by Ciula et al. (2018), the compendium on modeling
in the digital humanities edited by Flanders and Jannidis (2019b) and Piotrowski (2020).
1

Chapter 1 Introduction
(2004) paraphrasing Stachowiak (1973, p. 56)’s take that all insights are insights in mod-
els or through models2 (compare also to Piotrowski 2020, p. 10) As a consequence of
the selection of (or: focus on) certain attributes, any model is ultimately subjectively
biased, and constitutes only one instance of an “endless number of potential other mod-
els” (Rehbein 2020, p. 265). Principally, it can be refined constantly to represent reality
(the research object) more closely, dependent on the available data. As such models to
only offer a ‘crutch’ to understanding and insight, but can not give an absolute ’truth’
on the object of research (Drucker 2011).
With this framework of modeling, this thesis re-conceptualizes computational method-
ologies for historical research questions: in the papers, we conceptualize court records as
networks consisting of e.g., co-occurring pairs of paragraphs, uni-, bi- and multimodal
networks of judges, prosecutors, their cases, and the defendants; identify modeling as an
inherent concept within the historical studies, i.e. the historical narrative as a best-fit
model to explain the how and why of history and periodization as models of time-scales
as a model or construct of analysis to sharpen focus; and the use of networks as epistemic
tools.
This thesis provides a critical discussion of the digital humanities (DH) and reflects
on their state, prospects, and the methodological and epistemic implications of digital
research with a special focus on the interdisciplinary work of historical network research
(HNR), which combines historical studies with computer science- and social science-
based methodologies in two case studies. The two main case studies provide (1) new
historical insights on their respective topics, and (2) proof-of-concept of a sensible appli-
cation of a computational methodology in combination with historical contextualization,
which are then (3) critically discussed and their implications evaluated.
The first part of this thesis attempts a classification of the DH, their status, and their
historiographical development, and locates the DH in a dichotomous tension field be-
tween digitization and digitalization. The focus of this thesis lies on network research,
which in the second part is defined and discussed alongside its historiographical devel-
opment and theoretical origins in order to make inferences on network methodology.
This thesis presents two main case studies in five papers. The first case study is based
on the analysis of the extend of political judiciary on the example of court records from
the autocratic Corporate State of Austria. There, we analyzed the configurations of a
conviction dependent on the political orientation of the defendants using quantitative
methodologies, network analysis, and qualitative historical contextualization.
The second case study is based on a Linked Open Dataset, which infers on a social
network of intellectual influences in the broad strokes of a master narrative. In a series
of papers, we employed various big data analyses on this data, which we successively
extended, identifying the most important scholars in time based on their structural
2. The original quote reads in German: “Hiernach ist alle Erkenntnis Erkenntnis in Modellen oder
durch Modelle, und jegliche menschliche Weltbegegenung uberhaupt bedarf des Mediums ‘Modell’.” (Sta-
chowiak 1973, p. 56)
2

position, their development in time, and changes in their community compositions, and
critically discuss its applications and limitations.
In the discussion, this thesis critically discusses digital research, and reflects on the
epistemological and ontological transformations when working with the digital, and as-
sesses the implications of computational derived insights, as well as pitfalls, issues, and
biases, and the importance of a multimodal literacy, that combines computational, quan-
titative, digital, and qualitative approaches. Finally, this thesis gives an outlook on fu-
ture research strands specific for the case studies as well as within the DH that include to
establish a computational and methodological literacy, and various digital competences.
3

Chapter 2
Digital Humanities
2.1 Defining Digital Humanities – a tension field
There is a lot of arguing on what are the digital humanities (DH).1 While a definite
answer has no been set, within the growing scientific community of DH it constitutes a
“sport” to come up with ever-new and individual definitions of what are the DH.2 The
digital humanities can be described as a movement within the humanities answering to
the technological changes of digitization, digitalization and the demands and possibili-
ties of big data, that have transformed not only the scientific world. As such the term
encompasses the many. It can be located in a tension field between its status of an
independent discipline3, a summary of a plethora of sub-fields, a meta-discipline, or an
auxiliary science4. The term DH is used to describe a wide range of processes incor-
porating the digital into the humanities’ research by interdisciplinary methods (During
2015; Jannidis et al. 2017), tools (Ayers 1999), or workflows. More vaguely, DH describe
pure digitization projects as well, which facilitate the widespread accessibility through
online availability of sources to humanities’ scholarship.
By its practitioners and supporters, the digital humanities are considered a paradigm
change.5 In the following, we will discuss these tension fields of the DH, its aims,
implications, historiography, and methodologies.
2.1.1 DH as independent discipline vs. sub-field
The DH show all signs of being established as an independent discipline6 in its profes-
sionalization in institutions and formalized gatherings specialized on the research of the
1. We will refer to the digital humanities in the following in the plural form, as it describes an
encompassing term for a multitude of fields within the humanities.2. Compare exemplary Sahle (2015, p. 47) or Terras (2011). It is a requisite for the attendance of the
“Day of Digital Humanities” Conference to define the DH; the website https://whatisdigitalhumanities.
com/ shows a new definition collected with the conference’s participants whenever refreshed.3. Such as suggested e.g., by Jannidis et al. (2017).4. As characterized e.g., by Fickers (2017).5. Compare to the discussion in section 6.2.3.6. A discipline is characterized according to Krishnan (2009) by a specific object of research, ac-
cumulated specialist knowledge, theories, concepts and research methods, a specific terminology, and
institutionalization. Piotrowski (2020, p. 9) argued as well that the DH qualify as a discipline.
5

Chapter 2 Digital Humanities
DH. The DH are discussed in an increasingly unoverseeable number of highly specialized
conferences, workshops, and journals7. Since the late 1990s8, a wide range of specialized
institutions were founded to push research projects related to the DH: in associations9,
working groups10, and departmental institutions11. While the new DH institutions tend
to have non-traditional formats such as focus centers instead of departments, exam-
ples can be found for both traditional and non-traditional initiatives. Alongside of new
DH degree programs12, an increasing amount of professorial positions are appointed
at almost every university all over the world, alongside other (im)permanent academic
positions13.
The process of institutionalization, professionalization, and thus that of the indepen-
dence of the field DH, is not yet finite. This is also reflected in the integration of these
new positions within the broader universities organizations. Few research facilities have
a distinct “digital humanities” department, though they are of growing number.14 Most
are part of the more traditional fields such as e.g., digital history positions or working
groups within the history or computer science departments15. These are clearly orga-
nized as sub-disciplines within their respective originating fields, but aim to connect
traditional studies with new technical methodology originating from the humanities,
computer science or the social sciences respectively, applying a quantitative and compu-
7. Such as i.a. the Digital Humanities Quarterly (DHQ, founded in 2007, http://www.
digitalhumanities.org/dhq/), the Journal for Digital History (JDH, 2020, https://journalofdigitalhistory.
org/en), the Frontiers in Digital Humanities (2014, https://www.frontiersin.org/journals/digital-
humanities#), the Journal for Historical Network Research (2017, https://jhnr.uni.lu/index.php/jhnr).8. For an overview on the development of the digital humanities and digital history see section 2.2.9. Such as the European Association for Digital Humanities (EADH, http://eadh.org/), the Digital
Humanities im deutschsprachigen Raum (DHd, https:// dig-hum.de/ ), or the Alliance of Digital Human-
ities Organizations (ADHO, http://adho.org/).10. Exemplary, the Arbeitsgemeinschaft Digitale Geschichtswissenschaften (founded in 2012, https:
//www.historikerverband.de/arbeitsgruppen/ag-digitale-gw.html) organized in the Verband der His-
torikerinnen und Historiker Deutschlands (VHD).11. For an overview of institutions in Germany compare to Hohls (2018, A.1-26–28).12. An overview provides CLARIN-DARIAH’s voluntary course registry for Europe (https://registries.
clarin-dariah.eu/courses/).13. For Germany, Sahle (2016, 2019) keeps tracking the creation of openly denominated DH profes-
sorships. Since Germany’s first professorship of “Archaoinformatik” (computational archeology) 2008 in
Berlin, 101 DH professorial positions have been announced. This development is accelerating: as from
2015, 10 and more new professorial positions are created per year in Germany (Sahle 2019).14. Noteworthy example is the DH Department at University of Stuttgart (https://www.ilw.uni-
stuttgart.de/abteilungen/digital-humanities/). Usually instead, DH centers and labs with less for-
mal institutionalization are created, as e.g. the Austrian Center for Digital Humanities at the Uni-
versity of Vienna with a “Forschungsschwerpunkt” (established in October 2020, https://fsp-digital-
humanities.univie.ac.at/).15. An example would be the in 2019 newly inaugurated professorships for digital history at the In-
stitute for History at Humboldt University of Berlin (https://www.geschichte.hu-berlin.de/de/bereiche-
und-lehrstuehle/digital-history) and for digital transformation and digital humanities at the faculty for
computer science at Otto von Guericke University of Magdeburg (https://www.dtdh.ovgu.de/).
6

2.1 Defining Digital Humanities – a tension field
tational approach to traditional humanities’ research questions.16 As such the DH can
be considered a conglomerate of various sub-disciplines within the broader humanities.17
As we will show in section 2.2, what we call the digital humanities has been human-
ities computing in the 1980s, and–at least for the historical studies–cliometrics in the
1960s. Each of those had introduced machine-based methodologies and an advance-
ment of humanities’ theories to the existing method tool-boxes of the humanities with
varying success. Hayles ([2011] 2012) and Sahle (2015, p. 47) argued that the suc-
cessful re-naming and concatenating of these fields signify the “coming of age” of the
digital humanities, and the discussions of their status as a sign of self-awareness and
professionalization as their own discipline. The ongoing discussion on the definition and
scope of DH are interpreted also as a need for legitimization of digital or computational
approaches within the humanities (compare to Schnapp and Presner 2009), which is
reflected in its professional implementation as that of a (or many) sub-discipline(s).
Several schematic views have been introduced to make sense of this multiplicity of
the DH, and its relationship to the various mother disciplines. A sphere model on the
status of DH shows it as threefold: as independent discipline, as digitally transformed
disciplines, and as that of a sub-discipline’s incorporation of digital elements in still
traditional disciplines (Sahle 2013, pp. 6–7; Sahle 2015, p. 50).
Recently, another layered sphere model was introduced by Rehbein (2020, p. 254), in
which he argued for accepting the dual-nature of the digital humanities as field and
sub-field, that oscillates between the humanities and the quantitative sciences. This
oscillation results in gradual greater influences by either side, as in e.g., digital history
which is more influenced by the humanities, or historical information sciences (now more
often referred as computational history) more influenced by the quantitative sciences.
2.1.2 DH as a meta-discipline
Due to these problems of proper categorization of the DH as a field or sub-field, some
scholars argue that the DH can be best described as a meta-discipline, transcending the
restrictions of usual disciplines, and establishing something of a post-disciplinary field.18
As such, the DH offer the “productive uncertainty” of a “diplomatic” interpretative
16. An exception to this development provides computer linguistics at the intersection of linguistics,
philology, and computer science, which are widely founded in independent institutions and increasingly
are accepted as their own field of research, such emancipating themselves from both linguistics and the
digital humanities.17. In this line of though, the question arises whether the new field of computational social science can
be considered part of the DH, too. This is closely related to the question, whether the social sciences
can be considered part of the humanities. The reasons for this lie in the relatively recent emergence of
the social science from the humanities, which in turn developed to use more quantitative methodologies
than the humanities.18. E.g., Sahle (2015) and Konig (2016); similarly also interpreted as a transformative science by
Jannidis et al. (2017, p. XI).
7

Chapter 2 Digital Humanities
transdisciplinary field, which allows a certain flexibility to choose its focus and method-
ology in an interpretive “diplomatic” position (Breckmann 2014, p. 287), and stresses
on the devotion for openness and “compatibility” to other research areas (Konig 2021,
p. 40).19 In this vein, Rehbein (2020, p. 254) proposed a two-fold definition of the DH:
• First, the DH encompass all kinds of research in the Humanities that partly gains
its findings from applying computer-based procedures, practices, and tools. In
this understanding, the DH are purely humanities’ scholarship, as its objects and
questions are those from the humanities. An example of this would be digital
history for the historical studies.
• second, the DH encompass the design, development, and generalization of these
computer-based procedures, practices, and tools, as well as the study of their
underlying theories and models. In this understanding, the DH are rather an aux-
iliary science located at the intersection between humanities and computer science.
Proposed implementations entail a sort of information science for the humanities,
such as humanistic informatics (Aarseth 1997, compare to) or historical informa-
tion science for history (Boonstra et al. [2004] 2006). If however the epistemological
interests were to be grounded in the functional question of this intersection, the
DH would posses their own objects and questions for study, and such would con-
stitute a “science of its own, with its own methodological framework” (ibid., p. 10;
compare also to Piotrowski 2020, p. 9).
Similarly, Roth (2019) argued for the DH as three different disciplines: the digitized
humanities, the numerical humanities, and the humanities of the digital. The digitized
humanities, Roth (2019) characterized as the digitizing enterprises within humanities, as
well as the application of computational methodologies, while the numerical humanities
involve a different epistemic practice in the development of “mathematical abstraction
and modeling” (ibid., p. 617) and the discovery and validation of “general mechanisms”
of social processes (ibid., p. 618). While the former are prevalent in the humanities, the
later, Roth (2019, pp. 622–3) identified as mainly part in the social science’s new fields
of computational social science.20
19. This follows the argument brought forward by Breckmann (2014) for intellectual history, that could
be applied analogous for the DH as well. Just as the DH, intellectual history is basically a container term
for multiple different fields, such as history of ideas, social history of intellectuals, history of the book,
and more. Breckmann (2014, p. 287) argued that intellectual history’s “lack of firm location within the
present epistemological and institutional organization of the disciplines” would provide a “productive
uncertainty” and constitute the field’s “biggest strengths” for flexibility as a meta-discipline. The DH
shares this status with intellectual history containing a plethora of different subfields; both can as such
be considered “meta-disciplines.”20. Which is coincidently a result of that Roth regards the social sciences as part of the humani-
ties, which classical methodological divide grew smaller in the process of turning to quantitative (and
computational) methods.
8

2.1 Defining Digital Humanities – a tension field
2.1.3 Descriptive definitions of DH
Beyond the argued status of DH, the term DH is used on processes of digitization and
digitalization.21
DH as a process of digitization
In a more vague manner, the term DH is applied on projects primarily occupied with the
digitization of analogue sources to a computer-processable format. The DH were vastly
understood as means to establish the digitization of publications and primary sources,
archives, and any other physical matter, ranging from texts to photos to artifacts. In
digitization, we can differ between two types of digital objects:
- Retro digitals. The result of converting (or digitally migrating) analogue sources
via e.g., scanning, (digital) photography, or manual or automatic transcription is
called retro digital (“Retrodigitalisat”), a static digital copy that represents the
analogue original. Post-processing of retro digitals often involves a manual text
transcription or automated text recognition via OCR22 or HTR23 of texts, and
pictures annotations, enriching them with further content-based metadata besides
21. When working with the digital, we have to establish a sensitivity towards the differences be-
tween digitalization and digitization (following Brennen and Kreiss 2014). When addressing the
transformation of the analogue into the digital–a machine-processable conversion–this is digitiza-
tion. Digitalization is when we infer on the influences of the digital on life, work, social struc-
tures, scientific research. These terms are frequently mixed-up and used interchangeably; the Ox-
ford Learner’s Dictionaries for example lists both as “the process of changing data into a digital form
that can be easily read and processed by a computer,” missing out on a differentiated view (com-
pare to https://www.oxfordlearnersdictionaries.com/definition/english/digitalization and https://www.
oxfordlearnersdictionaries.com/definition/english/digitization; accessed 2018-05-08).22. Optical Character Recognition is a process of pattern recognition , which works best on standard
fonts printed on bright backgrounds (Holley 2009) as most commonly used models have been trained for
commercial purposes of contemporary documents. Examples are the proprietary ABBYY FineReader
(https://pdf.abbyy.com/de/) or Kofax OmniPage (https://www.kofax.de/products/omnipage), as well
as Tesseract developed by Ray Smith (HP Lab, https://github.com/tesseract-ocr/tesseract) or OCRo-
pus/OCRopy by Tom Breuel (DFKI Kaiserslautern, https://github.com/ocropus/ocropy) both pub-
lished by Google in open source format. Prints of the 20th are considered a problem solved with a recog-
nition accuracy of close to 99% (Springmann and Ludeling 2017). OCR for historical prints however
remains an ongoing challenge due to typographical heterogeneity, special characters (such as incunab-
ula), and structuring problems through layout diversity that make the blocking and tokenization of the
page more difficult (compare e.g., to Cordell 2017; Springmann and Ludeling 2017). An example for
current research project would be the OCR-D project of the DFG (since 2015, currently in project phase
III putting the prototype software on use-cases, https://ocr-d.de/de/).23. Handwritten Text Recognition. Since 2018, the tool “Transcribus” developed by READ-COOP
at the University of Innsbruck makes this more accessible (https://readcoop.eu/de/transkribus/). Sta-
tistical deep learning is combined with a model set of human transcribed text to train the HTR tool
Transkribus for corpora of handwritten texts, which ‘learns’ by connecting correctly transcribed hand-
written text parts with text images. The amount of error decreases significantly with more model training
data sets (compare to e.g., Muehlberger et al. 2019).
9

Chapter 2 Digital Humanities
their resolution. This digital migration or re-mediasation of analogue objects is
applied in order to protect the original from potentially harmful usage when access-
ing, as in the case of rare manuscripts, and increases their (remote) accessibility24,
and in general serve to secure and publicize the inventory of memory institutions
(“Bestandssicherung”, Baum and Stacker 2015, p. 9).25 As such, digitization de-
mocratizes access and, consequently, knowledge.
- Born digital objects. Objects of digital origin are called born digital. In the
context of constantly changing operating systems and data formats, born digital
objects might have to be (re-)viewed by emulating (i.e., imitating) the original
software environment, and as such have to be considered dynamic digital objects.
Increasingly these born-digital objects become relevant for historical research as
well, as historians turn to study the beginnings of the internet, or start to use
social media data for analysis (Terras 2012; Rehbein 2020, p. 260).
- Metadata. Meta data are structural tags with machine-processable information
on digital objects (both on born digital and retro digital objects). Metadata include
(but are not limited to) timestamps, geo-information, image resolution, copyright
and license information, or description of the content, dates, materials. The process
of inserting explicit tags about implicit features of digital objects is called markup
language.26
In the course of the last three decades, a wide-range of projects have been funded
to digitize archives, journals, and books.27 The digitization is usually applied on text
and documents, whereas in object-based sciences e.g. archeology or art history, this also
entails the 3D-digitization of objects and artifacts (compare to Bock et al. 2013; Kohle
2017).
This vast-scaled digitization led to a democratization of access to knowledge, and
in the words of the “World Digital Library” (founded by the Library of Congress and
UNESCO in 2009) is suited to “promote international and intercultural understanding”
by “tell[ing] the story of the world’s culture.”28 The digitization of analogue sources is
an on-going project, but the general state of digitization is not far of.
Edelstein et al. (2017, p. 416) argued that the next step of digitization would be
the harmonization of data through standardization and interlinkage, as in e.g., through
Linked Open Data (LOD). Developments pointing into this direction are an increasing
24. Consequently, the original underlies greater protection, and thus reduced physical accessibility.
Researchers need a heightened justification to access such rare originals in vito, which physical access is
thus decreased, ironically, while improving their digital accessibility.25. On the methodological implications of transforming sources to data, which apply especially to retro
digitals, compare to section 6.3.1 on data biases.26. Compare to TEI P5 guidelines (TEI Consortium 2020).27. Compare to section 2.2.28. https://www.wdl.org/en/
10

2.1 Defining Digital Humanities – a tension field
number of initiatives to find a common data structure for within the humanities, as
in e.g., the long term national data infrastructure project (Nationale Forschungsdaten
Infrastruktur e.V., NFDI)29, a joint project of the DFG and German Ministry for Edu-
cation and Research (BMBF) to find a common data structure for both the humanities
and the natural sciences. Projects like these are designed to provide the grounds for
future interoperable analysis of data, in which various research projects can contribute
to a reusable supra-database. As such, the discussions on the definitions of DH are also
intended to raise awareness about the DH to go beyond of a purely digitizing enterprise
in a process of emancipating the DH.
Challenges for digitization. Even before anything becomes digitized, digitization projects
experience significant problems due to reservations regarding the legal protection of pri-
vacy, copyright restrictions, and prevention of misuse. Legal restrictions surrounding
the protection of personal (and copy) rights are progressively eased through the so-
called “moving wall” (Guthrie 1999, p. 297) of permitted publication–in Germany 70
years after the death of the author, regulated in §64 of the Urheberrecht30 (Metzger
2010).31 In Germany, the copyright law was updated to the current requirements of
the “knowledge society” that specifically regulated digital resources only in 2018.32 Be-
fore, the copyright law had last been significantly extended in 2007 (effect in January 1,
2008) to specify restrictive usage of electronic reading places of archival media to cater
to the necessities of the “information society.”33 Ethical considerations play a role in the
context of publications that entail discrimination, violence, genocide, and appropriation
(Royakkers et al. 2018).
This conversion process to a machine-readable format is full of technical challenges.
The (automated) recognition of characters is not without faults: wrongly recognized
letters result in wrongly spelled words that in turn become un-retrievable (compare
e.g., Cordell 2017).34 A famous problem is the one of the long-S in pre-19th century
texts, distorting the meaning of certain words and constitute unwanted “artifact[s] of
29. www.dfg.de/nfdi30. https://www.buzer.de/s1.htm?a=64-66&ag=483831. The Open Access movement however regulates different forms of access through license standards.
Demanding to make information “widely and readily available to society” “Berlin Declaration on Open
Access to Knowledge in the Sciences and Humanities” (2003), an Open Access movement formed in the
early 200s to make scientific publications and research accessible and re-usable by researchers and society,
defining different forms of licenses to use data freely (Muller 2006; Heise 2017). This was extended too
for Open Source, Open Data, and to shape a shift in scientific culture to Open Science.32. The “Gesetz zur Angleichung des Urheberrechts an die aktuellen Erfordernisse der Wissensge-
sellschaft” came into effect in March 1, 2018 (https://dip.bundestag.de/vorgang/gesetz-zur-angleichung-
des-urheberrechts-an-die-aktuellen-erfordernisse-der/81080), and its limited period of validity has been
repealed in July 2021 (https://www.bmjv.de/SharedDocs/Gesetzgebungsverfahren/DE/UrhWissG.
html).33. Compare to the “Zweites Gesetz zur Regelung des Urheberrechts in der Informationsgesellschaft (2.
InfoGesellUrhRG)” (https://www.buzer.de/gesetz/7937/a152235.htm.34. Further problems and biases that arise from digitizing will be discussed in section 6.3.1.
11

Chapter 2 Digital Humanities
the digitization process” (Crymble 2021, pp. 33–4). Usually, re-keying through an hu-
man annotator is applied in order to catch those issues, but accuracy still would not
reach more than 99% correctly identified words, the current gold standard for OCR
(Springmann and Ludeling 2017).35.
After conversion, the standardization of digitized objects remains another challenge.
Any humanities data is notoriously heterogenous, which constitutes a problem for highly
standardized methodologies and processing via computers.36 There are attempts to
standardize the kind of necessary meta-data for digital objects as in the regularly up-
dated TEI Consortium Guidelines (e.g., the “TEI P5: Guidelines for Electronic Text
Encoding and Interchange” by TEI Consortium 2020). In 2016, the DFG for the first
time published in DFG-Praxisregeln “Digitalisierung” a set of recommendations con-
cerning the digitization of sources as a requisite to receive funding, regulating technical
processes, parameter (such as color intensity or image resolution), necessary metadata
informations, or rules for citations. These recommendations apply of course only to
DFG-funded projects since 2016. In the US, the Federal Agencies Digital Guidelines
Initiative (FADGI) (2016) updates their “Technical Guidelines for Digitizing Cultural
Heritage Materials. Creation of Raster Image Files” regularly as well, but which vary
slightly from the recommendations of the DFG. As a result various levels of standard-
ization exist for metadata or digitization requisites over all projects.
In 2019, the NFDI37 was founded in Germany to standardize data and metadata over
all disciplines. In an extensive process, each (sub-)disciplines are forming consortia to
discuss their own data challenges, and to develop suitable standardized formats, which
then are supposed to be merged to one national research data standard over all dis-
ciplines, the natural sciences and the humanities alike. However, as Rehbein (2020,
p. 263) puts it, the fear pertains that “consistent formalization among potentially het-
erogeneous sources is difficult if not impossible to attain.” To undertake this maybe
impossible endeavor offers the reward of a huge range of research possibilities38: making
previous research data sets available for current research; allowing to ask new questions
on old data; enabling cross-disciplinary research using discipline-foreign data sets; easy
recycling of former research outputs in replication studies, as well as with an updated
analysis or further research goals; permitting meta-studies over various data sets; and
in general promoting the accessibility and machineprocessability of data sets in a co-
herently managed data format over various projects, that ideally do not need to be
processed time-intensively anymore (in a sort of ‘ready-made’ data format).
The digital transformation is not the last step in the process of digitization: the sus-
tainability of digitized objects entail a range of problems for any provider in regards
35. As e.g., shown by Crymble (2021, p. 35) for the Old Bailley Proceedings Online with still one error
in every 4000 words after rekeying36. For a discussion of humanities data and biases in digitized sources compare to section 6.3.1.37. Nationale Forschungsdaten Infrstruktur e.V., https://www.nfdi.de/38. And if only at least for the standardization of humanities’ data.
12

2.1 Defining Digital Humanities – a tension field
to the upkeep39, contextualization40, and security risks management41 of both the digi-
tal objects and the infrastructure they are embedded in (exemplary Cunningham 2008;
Conway 2010; Terras 2012). Ensuring sustainably is last but not least also a cost fac-
tor. Institutions such as the DFG hard-coded the need to ensure sustainability in data
management as a requisite to receive funding through the format of the project’s data
output42–without providing a clear (financial) path on how the applicants should ensure
their long-term maintenance.
Finally, beyond reservations due to security issues on the protection of legal rights,
many memory institutions such as archives and museums are hesitant to give up the
interpretation ex cathedra of their sources (“Deutungshoheit”), despite their mandate for
the public utilization of archival resources out of fear of misrepresentation and potential
abuse. “Politically, many heritage institutions are reluctant to relinquish control over
the catalogues of the cultural patrimony entrusted to them,” summarized this Hotson
(2019, p. 250). This also has a financial aspect in potential “loss of revenue from rights
and reproduction activities” as pointed out by Kapsalis (2016, p. 10). But there are also
potentials of this “digital remediation” for heritage and memory institutions (Ward and
Wisnicki 2019, p. 200): increased accessibility of their collections, potentially increased
traffic and as such importance of the collection, and the potential for new discussions
on the collections as in the context of e.g., colonial pasts and provenance43. As a side-
effect of the digitization, differences in the collection behavior between archives and
libraries are vanishing in the digital realm, when collections are merged in digital supra-
libraries: borders between unique and duplicate source collections are blurred as both are
provided digitally online–which is heavily criticized by Cunningham (2008, pp. 532–3).
Increasingly, collections are only made available digitally.
39. Preservation of accessibility and continuous maintenance, including the potential emulation of digi-
tal objects when data standards change to ensure interoperability, as well as the accessibility and usability
of the interfaces the objects are embedded into in terms of performance effectiveness.40. Providing a framework of e.g. metadata of these digital objects, and their origins in i.e. a collection
in order to ensure their archival provenance.41. In order to ensure authenticity and security from manipulation. Possible future enterprises are to
secure digital objects from manipulation using the block chain technology.42. The “DFG-Praxisregeln “Digitalisierung”” (2016, p. 9) read in German: “Die
Langfristverf’ugbarkeit der Ergebnisse von Digitalisierungsprojekten ergibt sich einerseits aus der
Wahl der Daten- und Metadatenformate. Andererseits ist sicherzustellen, dass die digitalen Daten
auch physikalisch verfugbar bleiben. Dabei gilt: Kosten fur die projektbezogene Sicherung der Daten
werden [...] als Eigenleistung fur die Laufzeit des Projects anerkannt. Eine Forderung diesel Kosten aus
DFG-Mitteln kann nicht erfolgen.”43. Such as e.g., in the joint pilot project “3-Road Strategy for the Documentation and Digital Publica-
tion of Collections from Colonial Contexts held in Germany” by various collection-holding stakeholders
and the Federal Foreign Office and the Ministers of Culture und Cultural Affairs of the Lander (Museum
fur Naturkunde Berlin 2021).
13

Chapter 2 Digital Humanities
DH as a process of digitalization
The digitization of digital sources constitutes one premise of the digitalization of research:
the potential to do new research with new kind of sources, as e.g. with historical network
research (Rehbein 2020, p. 259).
In another strand, the efforts within the DH to combine technical advancements to
humanities’ work can be described as a process of digitalization. As such the DH entail
a broad variety of approaches that combine humanities’ thought with heterogeneous
quantitative and computational methodologies as well as novel formats of representation
of the natural sciences, mainly computer science, mathematics, and quantitative methods
developed in the social sciences.
These interdisciplinary approaches are still in the process of sounding to the require-
ments of the specific applications within the humanities, and as such use not thoroughly
formalized methods except for the established means of application from the originating
fields. These methods entail statistics and computational methods, network research,
text mining, and more, such as data base management and the creation of specialized
websites. As such, the DH are part of a digitalization process within the humanities and
general science. As the DH do not favor any specific methods, Thaller (2017a, p. 15) char-
acterized the DH “method neutral despite their methodological implications”. In many
instances, the DH are equated with a variety of computational tools and methods: the
“sum of all attempts to apply information technology to the objects of Humanities schol-
arship” (Thaller). This is also represented in the idea of the reformation–or update–of
the traditional humanities through these methodologies, as in the concept of a “contem-
porary humanities” (Piotrowski 2020, p. 4), working digitally with pre-formatted tools
(but rarely with computational methodologies, as in the “computational humanities”).
Several suggestions have been made to classify the DH according to their usage of
technology. Systematic interpretations of the DH propose a scale-oriented model of ei-
ther low-end DH (where researchers use generic tools) and high-end DH (where they
develop new and highly specialized tools and methods (compare to Burghardt and Wolff
2014, p. 40)), or a minimalist understanding of DH (as an auxiliary science adding tools
and methods) vs a maximalist one (as a paradigm change in how to do research in
the humanities (see Kirsch 2014). In a similar vein, Fridlund (2020, pp. 74–6) differ-
entiated between a regular history (“1.0”) that has naturalized certain digital elements
which go mostly “invisible” (such as online searching or databases), and a revolutionized
completely digital and computational history (“2.0”).44
.”
44. Compare to section 6.2.3 evaluating the extend of DH and the paradigmatic changes it represents.
14

2.2 Historiographical perspectives on the DH and Digital History
2.2 Historiographical perspectives on the DH and Digital
History
Whereas the incentives of the DH are new, the usage of quantitative or computer-based
methodology in the humanities is certainly not.45
Earliest beginnings and narratives of foundation. “Unlike many other interdisci-
plinary experiments, humanities computing has a very well-known beginning,” claimed
Hockey (2004, p. 4). Canonically, the history of the DH began with the indexing of
the writings of Thomas Aquinas by the Jesuit monk Father Roberto Busa (1913–2011)
in the 1940s using reading machines and room-filling computers in cooperation with
IBM. Often described as “seminal work” on word concordance, Busa (in cooperation
with a range of female computer operators Terras and Nyhan (2016) devised a punch-
card-based concordance of the writings of Thomas Aquinas in what would become a
56 book-edition of the “Index Thomasticus” (published in 1992 as hypertext-featuring
CD-ROM and online in 2005 as “Corpus Thomisticum”46), laying the foundation for the
development of corpus linguistics, and ultimately the creation of humanities computing
(e.g., Hockey 2004; Svensson 2009; Graham et al. 2016, pp. 19–26; Gaffield 2018, p. 123;
Hohls 2018, A.1-14; Winters 2019; Konig 2021, p. 38).
This narrative traces a genealogy of the DH from computer linguistics (Reiche et
al. 2014; Knopp 2018, p. 20; Sula and Hill 2019, p. 191) that in a “first wave [...]
focus[ed], perhaps somewhat narrowly, on text analysis (such as classification systems,
mark-up, text encoding, and scholarly editing) within established disciplines” (Presner
2010a, p. 6; see also Hockey 2004).
This founding narrative has since been criticized (such as by Piotrowski 2020, p. 12;
Sula and Hill 2019, p. 191; Crymble 2021, p. 17), and unmasked as a “founding myth”
(Interview with Tito Orlandi in Nyhan and Flinn 2016, p. 80) and a “useful fiction”
(Juliane Nyhan in the same interview with Tito Orlandi in ibid., p. 80). “[C]omputation
in research is [...] about a way of thinking algorithmically about a problem and applying
certain principles of problem solving to evidence, in search of a solution. The groundwork
for this algorithmic thinking had been set decades if not centuries before 1949,” stressed
Crymble (2021, p. 18).
Other pioneers of computational thought are increasingly (re)discovered: such as
William Weaver or Norbert Wiener (Interview with Tito Orlandi in Nyhan and Flinn
2016, p. 79), or pioneers of non-numerical computing and the social functions of textual
computings by Andrew Donald Booth and Warren Weaver (compare to Rockwell 2007;
Sula and Hill 2019, pp. 192–3).
Especially history has a long tradition to employ quantitative and computer-based
45. The following focuses on the history of the DH with a special focus on the integration of quantitative
and computer-based methodologies in the historical studies.46. http://www.corpusthomisticum.org/
15

Chapter 2 Digital Humanities
thinking: In quantitative history (also called cliometrics, or econometrics) a quantitative
perspective opened previously non-utilized types of sources up for analysis since the
early 20th century (Crymble 2021; Thaller 2017b; compare to the following section on
quantitative history). Similar remarks have been made for quantitative methods in
linguistics that traces stylometry going back to the 19th century (Hockey 2004, p. 5;
compare also to Knopp 2018, pp. 20–1).
Humanities Computing, 1960-80s. Machine-based approaches and computational ap-
proaches were first popularized in the humanities under the terms ‘humanities comput-
ing’ and ‘computing in the humanities’. Founded in an interest in structuralism, the
new technological advances and availability of computing machines47 led to an opening
of quantitative approaches and statistical software to the humanities that allowed to
search for patterns and insights using machines, focusing mainly on texts in linguistics
and literary studies (Hockey 2004, p. 5; Crymble 2021, p. 24). The ability to count
“in much greater numbers and much more accurately than any human being” led to
a series of studies in regards to large-scale concordances, authorship attribution, and
literary styles (Graham et al. 2016, p. 21). The 1962 conference “The Use of Computers
in Anthropology” in Burg Wartenstein, Austria, is often referred as the “first ‘digital
humanities’ meeting” (Zaagsma 2013, p. 7) and “presumably the first attempt to clarify
a methodological position for the interdisciplinary world between the humanities and
computer science” (Thaller 2012, p. 8).
Noteworthy are the e.g., the influential study by Mosteller and Wallace (1964) to
identify the disputed authors of the “Federalist Papers,” or the first electronic version
of the “Modern Language Association International Bibliography” in the late 1960s,
that was searchable using telephone couplers (Knopp 2018, p. 21), or the “Thesasaurus
Linguae Graecae” (TLG) at the University of California, Irvine, a databank of Ancient
Greek texts (Hockey 2004, p. 9).48
During the 1970s and 1980s, text analysis methodologies consolidated (ibid., p. 9;
Svensson 2009) as a result of both methodological and technical advances, such as an
increase in “storage and processing capabilities” (Sula and Hill 2019, p. 191). During
this time, humanities computing experienced increasingly a professionalization: besides
the inauguration of the journal Computation and the Humanities in 1966 (Boonstra
et al. [2004] 2006, p. 15) that would represent the humanities computing until 200449,
new computer-based text-focused methodologies were discussed and presented in mul-
tiple recurrent conferences in the UK and in the USS50, and an increasing number of
47. At first punch card reading machines, then in the late 1950 in size ever shrinking computing
machines, this development culminated in the 1980s in the personal computer.48. For an overview on projects compare to Hockey 2004; Knopp 2018, pp. 21-22.49. By which point the journal had lost its dominant status in the field (Svensson 2009; Sula and Hill
2019, p. 191.50. Such as the International Conference on Computing in the Humanities (ICCH)
16

2.2 Historiographical perspectives on the DH and Digital History
specialized study centers and organizations51 and their publishing venues52 (compare to
Hockey 2004, pp. 7–8).
From humanities computing specialized sub-disciplines evolved such as computer philol-
ogy and computer linguistics53, or history and computing, and historical information
science (Boonstra et al. [2004] 2006). Hockey (2004, p. 13) noted that humanities com-
puting lost “some aspects of linguistic computing, particularly corpus linguistics, to
conferences and meetings of its own” and “continued to be a separate discipline.”
From the 1980s on, computers had finally “pervaded every conceivable field of the
humanities,” summarized Boonstra et al. ([2004] 2006, p. 13) the integration of the
personal computer and electronic mail, alongside new advances in how files could be
processed by computers (Hockey 2004, p. 9). Instead of having to do batch processing
or sequential processing, results were instantaneously obtainable from searches with early
DOS-based text analysis programs (ibid., p. 10).
As one of the greatest accomplishments of the humanities computing, Hockey (2004,
pp. 12, 16) identified as the Text Encoding Initiative54, which in 1994 had published
their first Guidelines for Electronic Text Encoding and Interchange, a joint project of
the ACH, ALLC, and the Association for Computational Linguistics (which renamed to
Text Encoding Initiative in 2001).
Quantitative History, 1960s-80s. Independent from–and in parallel to–the introduc-
tion of machine-based approaches to textual processing in humanities computing, machine-
based approaches of quantification also found entry to the historical studies. Computa-
tional thinking can be identified since the Early Modern period in demographical and
socio-historical studies utilizing the products of earliest forms bureaucracy of taxation
and census, and in the late 19th century in the quest for ‘objectively’ study the past
during the professionalization of the historical studies55 (compare to S. Gordon (1991)
2003; chapter 1 in Novick 1988; Crymble 2021, pp. 20–7). As Anderson (2007) noted,
“true ‘data analysis’ in the current sense had to await the growth of the social and sta-
tistical sciences in the first half of the twentieth century, and the diffusion to universities
in the 1950s of the capacity for machine tabulation of numerical records, and then of
mainframe computing in the 1960s.” Since the late 1920s, the French Annales d’historic
economique et sociale school had subsequently focused on serial census lists, registers,
tax records, and more, as historical sources to write a new quantitative social history
51. The Association for Literary and Linguistic Computing (ALLC) was founded in 1973, the Associ-
ation for Computers and the Humanities (ACH) in 1978. Both jointly organized recurrent conferences
on humanities computing.52. Publishing before in Bulletins, the ALLC founded their own journal Literary and Linguistic Com-
puting in 1986, which would become the “key publication for humanities computing” (Svensson 2009).53. E.g., in 1963 the Centre for Literary and Linguistic Computing was founded at Cambridge Univer-
sity (Hockey 2004, p. 7).54. Founded in 1987, https://tei-c.org/.55. Part of which branched out to focus on the rules on how groups and societies form, growing to
become the social sciences and sociology.
17

Chapter 2 Digital Humanities
of the lives of the ordinary people , giving a point of contrast to the dominant histo-
riography of the elites (the ‘great men’) (Anderson 2007; Crymble 2021, p. 22). These
early studies involved computational thinking, and/or working with the newest method-
ological and technological advances in statistical analysis: starting with human com-
puters (often female statisticians), proto-computers (punch card reading machines), and
then with electrical mainframe computers, that each offered new possibilities in working
with quantitative-based data (ibid., p. 21), and enabled the easy access to “machine-
tabulation of numerical records” in the 1960s and the aggregation of “historical patterns
of multiple events or phenomena” (Anderson 2007).
From the 1950s to the late 1970s, quantitative-based historical studies gained traction;
an increasing number of historians started to incorporate quantitative methods from
the social sciences into historical research projects. This finally lead to the formation
of two new historical sub-fields: social history and economic history (Reynolds 1998,
pp. 141-2; Aydelotte 1966, Boonstra et al. (2004) 2006, p. 25; Anderson 2007). This new
quantitative history–also known as cliometrics or econometrics (focusing on economic
history)–was carried by the younger generation within historical studies (Whales 1991,
p. 296; Crymble 2021, p. 25) that gained broader popularity in the 1960s, as access to
adequate technical support had increased (Aydelotte 1966; Reynolds 1998, pp. 141–2;
Boonstra et al. (2004) 2006; Anderson 2007).
Computational and quantitative exemplary studies included pioneering distant ap-
proaches of macro analysis to history, as e.g., the longue duree studies by Fernand
Braudel on the Mediterranean (1949, extended and republished in 1966) tracking long-
term changes resulting from the “constant ebb and flow of poverty and other endemic
structural features” that lie “beyond the narrow focus of individual events” that the
Annales School, too, had refuted (Graham et al. 2016, p. 22). Similarly, Katz (1975)
“traced economic mobility over decades using manuscript censuses” (Graham et al. 2016,
p. 22).
Other new economic historians used micro analytical studies (Williamson 1965, p. 109),
which, e.g., utilized computers to “statistically support arguments” to identify a middle
social hierarchy of small scale farmers as a third part to the previous “dichotomy of rich
slave owners and poor white people” in the antebellum US-South (Owsley 1949; compare
also to Crymble 2021, pp. 17–22); assessed the “Making of an American Community”
in an American Frontier County using newspapers, private papers, county histories, and
censuses of the mid- to late 19th century (Curti et al. 1959; compare also to Anderson
2007); or that challenged the assertion that railroads were central for the industrial de-
velopment in the US, and quantitatively argued that the “combination of wagon and
water transportation [via canals, added by CP] could have provided a relatively good
substitute for the fabled iron horse” (Fogel 1964, p. 219; compare to Williamson 1965;
Anderson 2007). More controversially received were studies on the prosperity of slavery
and the effects of the US civil war in the South (“The Economics of Slavery in the Ante
Bellum South” by Conrad and Meyer (1958); or “Time on the Cross. The economics of
18

2.2 Historiographical perspectives on the DH and Digital History
American negro slavery” by Fogel and Engerman (1974)). Fogel and Engerman (1974)’s
study was criticized as being apologetic to slavery, and “has since become a caricature
for statistical approaches to history gone wrong” (Crymble 2021, p. 23; compare also to
the contemporary review by Haskell 1975).
New Journals were created to host these new approaches, such as the Historical Meth-
ods Newsletter in 1967 (Reynolds 1998, p. 141). Quantitative historical research found
their way into established historical journals such as the American Historical Review56,
and were featured in conferences–e.g., a special feature on quantification in history at
the AHA conference in 1967–, or in the humanities computing journal Computers and
the Humanities (Graham et al. 2016, p. 23). Graham et al. (2016, p. 23) noted how com-
putational history in the 1960s was primarily associated with studies of demographic,
population, and economic histories,” despite them also being published in humanities
computing contexts.
“For a time in the 1970s, it looked like history might move wholesale into quantitative
histories, with the widespread application of math and statistics to the understanding
of the past,” noted (ibid., p. 24; compare to Fridlund 2020, p. 76). While quantitative
research projects have been featured in traditional journals, conferences, and integrated
into and into institutional structures and university curricula57, their approaches also
met resistance due to actual and perceived claims of quantitative methodologies mak-
ing “more substantial ’truth’ claims” or supposedly offering “a ‘scientific method’ of
history” (Graham et al. 2016, p. 23). Common were also accusations of positivism and
reductionism– of unjustified reduction of complex historical phenomena to numbers, and
focusing only on what is enumerable58–, in which quantitative history would have been
“pushed too far” (as refuted e.g., by Aydelotte 1966, p. 821) and “too much trust [placed]
in counting” a fragmented historical past (Boonstra et al. [2004] 2006, p. 25),59 or in
danger to replace the “subjective craft” of the qualitative methodology with statistical
approaches (as addressed by Bullough 1967, p. 61). As such, quantitative history was of-
ten perceived as a “betrayal of the historical project” (Anderson 2007).60 These claims,
accusations, and criticism of the more “orthodox” historical studies were (ultimately
unsuccessfully) refuted by e.g., Aydelotte (1966) or Bullough (1967), who argued for the
“positive possibilities of the computer in historical research” (ibid., p. 61; compare also
to Reynolds 1998, p. 141).
As a result, “cliometrics became estranged from the mainstream of the profession”
(Graham et al. 2016, p. 23), having failed to sufficiently answer to accusations that quan-
titative methodology would deviate too far from traditional historical research questions
56. https://academic.oup.com/ahr57. Statistical methods had been introduced in around 40% of US curricula by the early 1980s (Ander-
son 2007).58. As have been brought forward against e.g., Fogel and Engerman (1974).59. Instead, quantitative historians had work on to establish a reflection on the limitations of the
sources used, as well as the reliability of their content, as Crymble (2021, p. 25) stressed.60. On the actuality of this criticism and opposition, compare to section 6.1.3.
19

Chapter 2 Digital Humanities
and methodology (Aydelotte 1966; Reynolds 1998). Its popularity “collapsed suddenly”
in the 1980s as Ayers (1999) described this due to its “own inflated claims, limited
method and machinery” facing an ‘orthodox’ historical scholarship. This lead to a re-
cline in the usage of statistical methods since 1985 and stagnation in the usage of what
Reynolds (1998, pp. 141–2) described as more elementary statistics;61 established in-
stitutions or curricula were “folded back in with history departments” (Crymble 2021,
p. 26).
Quantitative history had but secured a niche in historical studies–most successful in
economic history, to a lesser extend in political and social history as perceived by Ay-
delotte (1966, p. 809), but in general quantitative methodology was instead regarded
as a specialization of “some historians” instead of a “methodological necessity” (An-
derson 2007), having failed to be incorporated in the historical toolkit (Reynolds 1998,
pp. 146–7).
The decline of cliometrics in the broader historical studies followed on foot with the
methodological implications of the post-structuralist cultural turn (influenced by anthro-
pology) in the mid-1980s, and the new focus on the social nature of text and text analysis
of the linguistic turn (influenced by literary studies), which questioned the objectivity
of data (ibid., p. 146; Anderson 2007). “Texts replaced tables,” summarized this Ayers
(1999).
Usually, the history of cliometrics is not regarded as part of the history of the DH.
The focus on textual analysis in the historiography of the DH led to an omission of the
developments of computer-based methodologies in quantitative history62, which utilized
statistical methodologies to historical research questions. While there is a continuity in
the usage of computer-enabled research, overviews like Anderson (2007) does not use
the term of DH nor ‘digital history’, but instead “‘technologically enabled’ history.”
Similarly remarked this Hohls (2018).
Advent of the Personal Computer, the Internet and Beginning of Mass Digitization,
mid-1980s to early 2000s. The niche of quantitative history found new impetus in the
Association for History and Computing (AHC, established in 1987)63, and its respective
61. Aydelotte (1966, p. 808) had advertised that statistical methods for history would be generally
“not complex,” and therefore very feasible: A “few totals, a few percentages, and a few correlations in
which the relationship between certain variables is examined while other variables are controlled.” In
contrast, Reynolds (1998, pp. 145–6) observed that the migration to “newer and more arcane statistical
techniques” had not happened in the majority of the field of quantitative history.62. Sula and Hill (2019, p. 192) criticized that cliometrics fell “outside the narrow focus on the text that
is found in the standard narrative [on the history of the Digital Humanities] and received no mention.”
Hohls (2018, A.1-16) mentioned quantitative history as a “second strand” to the digital humanities.63. Zaagsma (2013) gives the date of 1985 for its foundation, whereas the website of the AHC gives
the date of proposition in 1986 at the Westfield conference, and its foundation in 1987 (compare
to https://web.archive.org/web/20010702205234if /http://odur.let.rug.nl:80/ahc/; retrieved URL from
the Internet Archive – version 2001; accessed 2021-08-02).
20

2.2 Historiographical perspectives on the DH and Digital History
Journal of the Association for History and Computing (JAHC, 1998–2010)64 In the
Westfield conference in 1986, the “microcomputer revolution” was described as the future
of history (Boonstra et al. [2004] 2006, p. 29) with the onset possibility of personal
computers.65
In the 1990s, the World Wide Web revolutionized the usage of computers. Focused
turned to the possibilities of the then-new internet: novel means of publication and ac-
cess, hypertexts, digital libraries, and new forms of collaborative editing were developed
(Sula and Hill 2019, p. 191), and achievements in database search and retrieval, automa-
tion, hyper card stacking, development of easier-to-use tools, and large-scale digitization
projects (compare to Graham et al. 2016; Schnapp and Presner 2009; Presner 2010b).
Hockey (2004, p. 14) stressed while many new projects were envisioned, it was highly
problematic to receive funding; as a result “few of these [planned] publications saw the
light of day except as prototypes or small samples.”
These developments in the 1990s to early 2000s, Schnapp and Presner (2009) and
Presner (2010b) described as the first wave of the DH. This, too, Graham et al. (2016,
p. 24) regarded as the second wave of computational history66, in which quantitative
history “re-emerged” within humanities computing as ‘history and computing’ with the
“advent of personal computing,” and their shift in focus on texts. Historians turned to
linguistically inspired humanities computing and cultural analytics in the wake of greater
access to digitized resources, which finally lead to the overlap of the traditions of quanti-
tative history and computing in the humanities (Crymble 2021, p. 27). Crymble (2021,
pp. 42, 18) however argued against a linear genealogy between quantitative history, and
the linguistically focused work (cultural analytics) of the early digital humanities/history
computing of “simple” similarity using computers, as they weren’t rooted in the same
intellectual premises and purposes.67 Instead, digital history was born out of their com-
bination in the mass-digitization in the 90s.
One of the first digital libraries was Project Gutenberg68, established in 1971. Thaller
(1987) developed an influential first CLIO historical database management system in
the 1980s (Boonstra et al. [2004] 2006, pp. 26–7). The first historical online-only pub-
64. Which on its website (https://quod.lib.umich.edu/j/jahc/; Accessed 2020-08-02) claims to have
been sponsored by the American Association for History and Computing(AAHC, founded in 1996), that
appears to be the successor to the AHC Graham et al. (2016, p. 24).65. Working with computers however was still tedious: Anderson (2007) described how one had to
“order tapes and paper codebooks, which were delivered by mail” and then “mounted on a mainframe
computer, to be accessed in a statistical package” in order to access archived data sets in the 1980s
as e.g., at the Inter-university Consortium for Political and Social Research (ICPSR), while oftentimes
universities charged for the privilege of computer access. This progressed to have mainframe replaced
with personal computers, and to be able to directly download data files on the desktop by the early
2000s.66. After the first wave being quantitative history.67. Crymble (2021) argued, that Busa’s humanities computing work was “fundamentally different from
the various econometric analyses.” While Busa mostly did linguistic or literary analysis of the choice of
work, this was based on a methodological focus instead of on historical insights (ibid., pp. 27–8).68. https://www.gutenberg.org
21

Chapter 2 Digital Humanities
lication was The Valley of the Shadow by Edward L. Ayers (launched in 1993), which
detailed the life “two communities in the American Civil War,” offering access to “let-
ters and diaries, newspaper and speeches, census and church records [...]. Giving voice
to hundreds of individual people, the Valley project tells forgotten stories of life during
the era of the Civil War.”69 In 1994, the Roy Rosenzweig Center for History and New
Media (RRCHNM) was founded. One of its earliest projects was “History Matters: The
U.S. Survey Course on the Web”70 (launched in 1998), that entailed an annotated dig-
ital archive with multiple options to historical “web resources and [...] unique teaching
materials, first-person primary documents, and goes to analyzing historical evidence”71
accompanied by an online forum, syllabi, and interviews for “using the historical sources
in the classroom” (Robertson 2016, p. 292). Similar projects to digitize historical re-
sources emerged, which had a clear focus on public history (ibid., pp. 292–3; this also
became clear in the focus on web presentation as in Cohen and Rosenzweig 2005; or in
the definition of digital history as “examining and representing the past [...] with new
communication technologies” by Seefeldt and Thomas 2009). Examples for this are the
Virginia Center for Digital History72 (founded in 1998, and one of the first uses of ‘digital
history’, which was “charged with creating new forms of historical scholarship and with
performing public service and outreach”73; or the “Digital History Project”74 (founded
in 2002) for educational purposes; or the “September 11 Digital Archive”75 (launched in
2002 by the RRCHNM), which “use[d]” electronic media to collect, preserve, and present
the history of September 11, 2001 and its aftermath,” containing “more than 150,000
digital items” that have been collected and crowdsourced (Robertson 2016, p. 293); or
cartographing projects that combined historical resources with GIS, such as the “Texas
Slavery Project”76 founded in 2007 by Andrew J. Torget, or “The Geography of Slavery
in Virginia”77 founded in 2005 by Tom Costa. In 1996, the “Internet Archive”78 and
its front-end, the “Wayback Machine,” were introduced to archive the web as a born
digital archive (compare to Romein et al. 2020, pp. 5–6; (for an extensive overview on
web history see Brugger and Milligan 2019)); it was extended to an Open Library in
2005 (ibid.)). In Germany, the information and communication forum “H-Soz-Kult”79
was founded early in 1996, which conjoined in 2002 with “Clio-online - Gateway for
69. Compare to https://valley.lib.virginia.edu/ (Accessed 2021-06-18).70. http://historymatters.gmu.edu/71. Compare to http://historymatters.gmu.edu/expansion.html (Accessed 2021-06-18).72. http://www.vcdh.virginia.edu/index.php?page=VCDH73. Compare to the Virginia Center for Digital History (http://www.vcdh.virginia.edu/index.php?
page=About; accessed 2021-08-02).74. http://digitalhistory.unl.edu/75. https://911digitalarchive.org/76. http://www.texasslaveryproject.org/77. http://www2.vcdh.virginia.edu/gos/78. https://archive.org/79. https://www.hsozkult.de
22

2.2 Historiographical perspectives on the DH and Digital History
Historical Scholarship e.V.”80 funded by the German Research Foundation as an open
access and community network.
Renaming to “Digital Humanities.” Around the same time of the emergence of digital
history81, the term ‘digital humanities’ was introduced as befitting of the new possibil-
ities of the personal computer and the internet. Blackwell’s “A Companion to Digital
Humanities” edited by Schreibman et al. (2004) is usually credited with the first use of
the term DH, which caused a process of renaming the humanities computing to ‘digi-
tal humanities’ (Konig 2021, p. 44), whereas a seminar at the University of Virginia’s
English Department had already mentioned the term in 2001, where the “Digital Hu-
manities Curriculum Seminar” ran from 2001 to 2002 (Drucker and Unsworth 2002;
compare to Allington et al. 2016; Crymble 2021, p. 29). Slowly, the humanities comput-
ing became ‘digital humanities’ by a shift in focus from ‘computing’ to ‘digital’ (ibid.,
p. 27).
“A pertinent question is whether the discursive transition from humanities comput-
ing to digital humanities is mainly a matter of repackaging (humanities computing), or
whether the new level also indicated an expanded scope, a new focus or a different rela-
tion to traditional humanities computing work,” Svensson (2009) analyzed this change
and noted that “it is obvious that the term ‘digital humanities’, as used by the humanities
computing community, often serves as an overarching denotation in book and journal ti-
tles,” but that still “humanities computing is often used in the actual narrative.”82 “The
shift towards the digital humanities was not simply a shift in nomenclature, although
there are elements of that as well,” instead it constituted a “new method of thinking,”
claimed Graham et al. (2016, p. 25).
The term of ‘digital humanities’ provided a vision for (a new field) to encompass all
the humanities, introducing projects from archaeology, art history, history, lexicographic,
music, multimedia studies, performing arts, philosophy, and religion (Sula and Hill 2019,
p. 192), that was suited to extend the function of humanities computing as “technical
support to the ‘real’ humanities” (Berry 2011, p. 3) and to broaden their focus.83
The change in terms is often understood as signifying the independence as a profes-
sional field (compare to Hayles [2011] 2012), and the occupation with its genesis as an act
of “canonization and self-ascertainment” (Sahle 2015, p. 47). Its use however remains
criticized as often meaning “little more than ‘new”’ (Crymble 2021, p. 165).
80. https://www.clio-online.de/81. The Virginia Center for Digital History used the term as one of the first, in 1998.82. Similarly, Boonstra et al. ([2004] 2006, p. 18) still perceived ‘history and computing’ as the “most
neutral and encompassing term” for the computerization of the humanities/digital history. Tellingly,
Boonstra et al. ([2004] 2006) do not mention the term ‘digital humanities’ at all in their discussion of
the past and future of digital history.83. In order to re-adjoin humanities computing to the DH, McPherson (2009) declared a trias of fields:
the computing humanities, the blogging humanities, and the multimodal humanities all covered by the
DH umbrella (Sula and Hill 2019, p. 192).
23

Chapter 2 Digital Humanities
This change was also reflected institutionally: In 2005, the ALLC fused to the Al-
liance of Digital Humanities Organizations, which was then joined by the Society for
Digital Humanities/Socieete pour l’etide des meDias interactions (SDH/SEMI) in 2008,
and “predominantly address[ed] textual analysis, markup, retrieval systems and related
areas” (Svensson 2009; compare also to Sula and Hill 2019, p. 192). The journal of
Humanities and Computing discontinued in 2004; it was renamed in 2005 as Language
Resources and Evaluation and “had by this time lost its status as one of the ‘official’
journals for humanities computing” (Svensson 2009).
Since the mid-2000s, humanities computing evolved to what Schnapp and Presner
(2009) and Presner (2010b) described as the second wave of DH, characterized by a fo-
cus on the “qualitative, interpretive, experiential, emotive, generative [...]. It harnesses
digital tool kits in the service of the Humanities’ core methodological strengths: atten-
tion to complexity, medium specificity, historical context, analytical depth, critique and
interpretation” and in “creating the environments and tools for producing, curating, and
interacting with knowledge that is ‘born digital’ and lives in various digital contexts.”
Manfred Thaller described this developments as “break-through” in applicable methods
since the 2000s.
While the first digital editions were mere replications of printed scholarly editions
in a virtual format in the 1990s, soon digital scholarly editions became extended on:
to provide additional analytical features, visualizations, and tools (Romein et al. 2020,
pp. 9–10); examples for this are the “Samuel Beckett Digital Manuscript Project”84
(founded in 2011) offering a digital library and “genetic edition” of his works genesis
(Neyt and Van Hulle 2020), or the “Wittgenstein Source”85 (founded in 2009) that hold
the digitized collections of the written legacy of Ludwig Wittgenstein, which the “WIT-
Tfind” project86 semantically processed to enable search queries, image and transcription
reviews. One of the pioneering projects in data management was the charter encoding
initiative “Monasterium.net”87 founded in the early 2000s, which Rehbein (2020, p. 260)
lauded as exemplary in regards to their systematic approach, the completeness of sources
(hosting over 400,000 charters), and transparency on the shortcomings and approaches
to the collection; since 2014 it is developed in open source.
The interlinkage of humanities computing and computer linguistics remained to con-
tinue in the close connection between DH and the digital literary studies (Robertson
2016, p. 291; Crymble 2021, p. 30)88, whereas digital history ventured more often within
84. https://www.beckettarchive.org/85. http://www.wittgensteinsource.org/86. Founded in 2018 by the Wittgenstein Archives of University of Bergen and LMU Munich, http:
//wittfind.cis.uni-muenchen.de/87. https://www.icar-us.eu/cooperation/online-portals/monasterium-net/88. Which hegemony in also reflected in the distribution of newly created professorial positions in
Germany, of which roughly one third were created in the field of language studies and literature studies
(compare to Sahle 2019).
24

2.2 Historiographical perspectives on the DH and Digital History
public history projects (Robertson 2016, pp. 292–3; Hohls 2018, A.1-8; Konig 2021,
p. 38).
The developments within DH–introduction of methodologies, progress of digitization,
data standardization, automatic annotation, data linkage, visualization and publication
media–served as an accelerator for their subfields, such as digital history (Boonstra et
al. (2004) 2006, pp. 20–1; Rehbein 2020, p. 259). As such, digital history is rooted deeply
within the digital humanities; the term is used as an interdisciplinary collecting basin
for any ‘digital’ research employed on historical fields, data, or research questions, or
using computational or computer-based methods (Romein et al. 2020, pp. 3, 293; Konig
2021, p. 38). Their research conversations however remained for a large part “distinct”:
Crymble (2021, p. 30) observed a “preference for presenting in history-focused venues”
such as at conferences of the American Historical Association, which casted “doubt on
the depth of connection between history and digital humanities research.”
Within history, the status of digital history is not that of a formal sub-discipline, but
more of a set of new methodologies, tools, and reflections on the nature of the newly
digitized sources (retro digitals), as well as the (specialized) use of softwares and tools.
As such, digital history can be considered a new frontier in methodological patchwork
“mosaic” of historical studies (compare to Guldi 2020, p. 327; Fridlund 2020, p. 73).
Following the argument that quantitative history is a sub-field of history characterized
by its specific methodology (Anderson 2007), it can be argued, too, that digital history
constitutes a sub-field characterized by a certain methodological use. Hohls (2018, A.1-
24) stressed that digital history is a field still in the process of creation.
Computational Turn. Large-scale digitization projects and building of technology in-
frastructure since the 1990s resulted in an ‘explosion of image, video, and audio”’ (Crym-
ble 2021, p. 27).
Europeana89 (founded in 2008) represents an international European project to con-
nect localized national digital libraries and digital archives. In the early 2000s, corporate
initiatives–on the forefront: Google Books which started scanning books in 2002 first as
Project Ocean–spearheaded the digitization of books (Shillingsburg 2009; Conway 2010;
Somers 2017). State-based libraries followed soon, and famously founded public-private
partnerships, such as the Austrian National Library cooperated with Google Books in
the Project “Austrian Books Online”90, who jointly digitized over 600,000 works in the
public domain using the technological infrastructure of Google (Kaiser and Majewski
2013).
This mass digitization raised new questions: “What do you do with a million books?”
(Cane 2006). Accompanied by decreasing storage costs, the emergence of cloud comput-
ing, new methodologies (and tools, increasingly open source) had to be developed that
could deal with this big data (Graham et al. 2016, pp. 26–7; Rosenzweig 2003), and to
89. https://www.europeana.eu/de90. https://www.onb.ac.at/digitaler-lesesaal/austrian-books-online-abo
25

Chapter 2 Digital Humanities
assess the practical limitations of this new frontier, i.e. developing a new digital source
criticism, or more efficient online repositories (Crymble 2021, p. 33), that have been
criticized as relatively lacking a debate and reflection (e.g., Zaagsma 2013, p. 5). The
Google Ngram Viewer91 was announced in 2011 as an automatic tool to mine the Google
Books corpora for word frequencies, and “was presented as a revolutionary new way of
looking at culture” (Romein et al. 2020, p. 14).92. Using a macro perspective on dealing
with the abundance of data was summoned oftentimes: such as in the computational
guidebook for historians (the “Exploring Big Historical Data. The Historian’s Macro-
scope” by Graham et al. 2016); in the macroanalysis of stylistics by Jockers (2013); or
in the development of the concept of “distant reading” to grasp big data collections by
Moretti (2005). Put in contrast to the “close reading” of examining each source material
individually, originally “distant reading” was intended to make clear what was missing in
bibliographic data. The technique was reinterpreted to provide an overview on big data,
which was successively expanded by the compound of distant and close reading, “scal-
able reading” (first coined as “not-reading” in Mueller 2013, then re-named to “scalable
reading,” compare to the conference program of Weitin 2015).
This wave saw the launch of new journals such as the Digital Humanities Quarterly93,
the Journal for Digital History94 (JDH, in 2020), the Frontiers in Digital Humanities95
(in 2014), or the Journal for Historical Network Research96 (in 2017), as well as a series
of Debates in the Digital Humanities that “highlight current issues in the field [...] and
track[] the field as it continues to grow” since 2012.97
These developments have been described as the third wave of the DH, and as an
“computational turn” (Berry 2011, p. 11).98 Berry (2011, pp. 4–6) argued an epistemic
paradigm in knowledge production through the computer: “computational technology
became the condition of possibility required in order to think about many of the questions
raised in the humanities today.” In this the medium of computers changed the way
of thought, and the underlying and implicit assumptions of research, such as “close
reading, canon information, periodization, liberal humanism,” have to be questioned
that have been taken for granted before. The “computational turn” thus would signify
the “understanding [of] culture through the digital,” and the “cultural dimensions to
91. https://books.google.com/ngrams92. The study by Michel et al. (2011a) to use digitized book to explain culture was put under pronounced
criticism; the mere existence of a book would not suffice, but would need “careful contextualization
through structured metadata: knowing who wrote what, when and in which context [...] to explain
changes in frequency” (Romein et al. 2020, p. 14), and make interferences about culture.93. http://www.digitalhumanities.org/dhq/ (DHQ, founded in 2007)94. https://journalofdigitalhistory.org/en95. , https://www.frontiersin.org/journals/digital-humanities#96. https://jhnr.uni.lu/index.php/jhnr97. urlhttps://dhdebates.gc.cuny.edu/98. Berry does not seem to have invented the term. Other sources are quoting the website http:
//www.thecomputationalturn.com/ as one of the first of using this term. This website however as of
2021 is defunct.
26

2.2 Historiographical perspectives on the DH and Digital History
computation” and the “medial affordances of software.”
Berrys understanding of the importance of reflection on how codes are used in research
and in life, are following the impetus of the critical code studies99. Fuller (2006) even
claimed, that “[i]n a sense, all intellectual work is now ‘software study’, in that software
provides its media and its contexts,” pointing towards a new critical encounter needed.
Similarly was this also coined as “cultural software” by Manovich (2011), based on the
idea that “all disciplines which deal with contemporary society and culture [...] need to
account for the role of software and its effects in whatever subjects they investigate.”
In this context, it is an act of autonomy and emancipation of the field, when arguing
for that coding and programming should become a requisite in the future (Matthew
Kirschenbaum 2009). Initiatives to support programming in the historical studies such
as the “Programming Historian”100 founded in 2008 by William J. Turkel and Alan
MacEachern, which at first focused primarily on Python, and then was restructured
as an “open access peer reviewed scholarly journal of methodology for digital histori-
ans” in 2012101. The online guidebook “Computational Historical Thinking” by L. A.
Mullen (2019) also offers a similar introduction to programming for historians, just as the
overview on available tool in the “Historians Macroscope”102 by Graham et al. (2016).
New, specialized tools (increasingly in open source format) were development for analy-
sis, and their usage encouraged for further research projects: such as Palladio103 was de-
veloped by Stanford University by the Humanities Design Lab in the course of analyzing
the correspondence-(metadata-)networks of the Mapping the Republic of Letters project
as a prototype in 2009 and subsequently further developed. Voyant104 was originally
published under the name Voyeur in 2011, but soon renamed. Voyant and Mallet105, are
a linguistic processing tools: Mallet allows for “statistical natural language processing,
document classification, clustering, topic modeling, information extraction, and other
machine learning applications to text” (compare to the introduction in ibid., pp. 126–9).
The Gephi106 (launched in 2010) remains a popular tool for network visualizations (e.g.,
Grandjean 2015; Graham et al. 2016, pp. 253–263).
This epistemic paradigm furthermore would be signified in the change from individu-
alistic research to “truly collaborative” endeavors (Berry 2011, p. 9), and fundamentally
challenged what reading and writing should mean in the computational age (ibid., p. 7).
Changes resulted in a variety of fields. Increasingly journals were replaces with social
media platforms of blogging from publishing behavior replacing many journals with social
media and informal blogging that became important publishing venues for the discussions
99. Compare to section 6.3.1.100. https://programminghistorian.org/101. Compare to https://programminghistorian.org/en/about (Accessed 2021-08-17).102. http://www.themacroscope.org/2.0/103. https://hdlab.stanford.edu/palladio/104. https://voyant-tools.org/105. http://mallet.cs.umass.edu/106. https://gephi.org/
27

Chapter 2 Digital Humanities
of the DH, while the human computing journals alongside newer DH journals, such as
the Journal Digital Humanities, which ceased to publish in 2014 (Crymble 2021, p. 4).
To this date, the amount of research projects, organizations, publications, and venues
have reached an unoverseeable amount–an assessment that Sahle (2015, p. 45) already
shared for 2015–as such the projects presented here and in overviews (compare e.g., to
Arguing with Digital History working group 2017; Romein et al. 2020; Konig 2021) only
represent a small recollection.
In the 2010s, the “hack vs. yack” debate dominated discussions in the DH and the
relationship / importance of building software vs. discussing theory. This debate “cen-
tered on the idea that DH was what I do, not what you do,” summarized this Crymble
(2021, p. 163), which “failed to capture the broad scope of activity.”
Since the late decade of 2010s, stake holders started to push for more “digital ar-
gumentation,” and to increase computational modeling, led to the wake of the compu-
tational humanities/computational history within the DH/digital history.107 This has
been described as the third wave of digital/computational history that has “potential to
transform the practice of historians research” (Fridlund 2020, p. 69), if methodological
reflections are integrated beyond mere buzz word dropping. This development is accom-
panied by an increasing professionalization of the research infrastructure, programs, and
professorial positions as described in section 2.1.1.
2.3 Methodologies in the DH
The digital humanities combine methodologies from the humanities as well as computer
science and a range of other disciplines such as (computer) linguistics and social sci-
ence. These involve both the traditionally qualitative hermeneutical approaches of the
humanities, as well as quantitative/computational108 and digital109 approaches.
An overview of methods in the DH provides this list (without claiming completeness):
– statistical analysis, using inferential methods such as frequency, means, distribu-
tions, significance testing, regressions, and more. For an introduction to quantita-
tive methods in the digital humanities compare to Lemercier and Zalc (2019) or
107. Compare to section 6.1.2 “On the need to define DH.”108. The difference between quantitative and computational methods are fluid: quantitative methods
for the most part are computational, as they are performed using computers. The term ‘computational
methods’ tends to be used for more complex computational methods, such as e.g., machine learning or
network analysis (Jager and Winckler 2013, p. v).109. This thesis wants to differentiate digital methods from computational ones. While the terms are
often used interchangeably–as e.g., in the overview article on digital methods by Reichert in Jannidis et
al. (2017, pp. 29–34), computational methods such as text analysis, sentiment analysis, network analysis
are discussed–this thesis wants to differentiate between the applied data-driven analysis of computational
methods and digital methods, that are more concerned with the presentation, transformation, and
structural modeling of data.
28

2.3 Methodologies in the DH
Jannidis et al. (2017, pp. 279–97); for general statistical methods e.g., to Everitt
and Skrondal (2010).
– automated textual analysis of the so-called “Distant Reading” (Moretti 2005)
that makes the “accurate reading of a historical source” as “not necessarily cen-
tral for understanding the past anymore” (Rehbein 2020, p. 261) by allowing a
distanced overview over a selection of sources/corpora. (Semi) automated text
analysis entails NLP techniques that identify linguistic patterns, such as word
frequencies, automatic indexing, contextualization with (key) words in context,
unique word ratios in texts, collocation and co-occurrences, automated entity res-
olution/disambiguation (Named Entity Recognition, Place Name Ambiguation),
complex relation extraction, sentiment analysis, which allows automated process-
ing and/or coding of structured (historical) data, and topic modeling using LDA, or
to identifying authors through statistical attributes in texts (stylometry, compare
e.g., to Rebora 2019. For an overview on text analysis, exemplary: Blei et al. 2003;
Grimmer and Stewart 2013; Schurer et al. 2015; Reinert et al. 2015; Lemke and
Wiedemann 2016; Lemercier and Zalc 2019, pp. 142–54; J. Kuhn 2019; Romein
et al. 2020, pp. 14–6).
– As well as more advanced computational methods such as supervised and super-
vised machine learning (see Bloothooft et al. 2015): as applied in topic modeling
(Blei et al. 2003); or in neuronal networks, e.g., used to detect and classify features
of images and identify trends in historical archives (Wevers and Smits 2019); or
used in automatic optical character recognition110.
– spatial approaches using geographical information systems and analysis, employing
GIS and other tools that “compute on location data in order to understand how
geography or region shaped a [...] process” (Arguing with Digital History working
group 2017, p. 18; compare also to Jannidis et al. 2017, pp. 299–312; Gregory
et al. 2015). Spatial approaches overlap to textual analysis (e.g., Place Name
Disambiguation) or network research (e.g., spatial networks).
– relational approaches as in formalized network analysis, describing relations be-
tween entities structurally, e.g., network density, centrality of entities, tie formation
behavior, and more.111
110. For an overview on Optical Character Recognition (OCR) compare to Holley (2009), Cordell (2017),
and Springmann and Ludeling (2017); also to section 2.1.3 on retro digitals. The tool Transkribus
(https://readcoop.eu/de/transkribus/) is a project to advance Handwritten Text Recognition (HTR).
Statistical deep learning is combined with a model set of human transcribed text to train Transkribus
for corpora of handwritten texts, which ‘learns’ by connecting correctly transcribed handwritten text
parts with text images. The amount of error decreases significantly with more model training data sets
(compare to Muehlberger et al. 2019)111. Compare to the following chapter 3; for an introduction to network research see Lemercier 2012;
Stark 2016; During et al. 2016; Jannidis et al. 2017, pp. 147–160.
29

Chapter 2 Digital Humanities
– source critical and hermeneutical approaches of analogue sources updated to be
applicable to digital data and digital sources and the changes in their epistemo-
logical implications (prominently advocated, e.g., by Fickers 2016, 2017, 2020).
Hermeneutics as coined by Droysen ([1882] 1977) entail the interpretative “close
reading” of sources112 and their interpretation: the data source is studied by the
researcher, interpreted, contextualized113, and its purported perspectives critically
examined114. The goal of an hermeneutical approach is to derive to source-driven
inferences similar to the “grounded theory” approach of the social sciences. This is
applicable both to the analogue sources, as well as to the digital source in a “new
standard” of adapting traditional hermeneutics to the needs and challenges of the
digital (Guldi 2020, p. 330), i.a. the epistemological changes through the digital
mediatisation.115 Hermeneutical qualitative approaches are bound by the quality
criteria of good scientific practice such as verifiability, elaborateness–“a commit-
ment to showing as much as possible” (Seale 1999)–, reproducibility, limitation of
applicability, validity (e.g., through triangulation), reliability (e.g., through doc-
umentation and transparency), and intersubjectivity. Source critical approaches
include data literacy.116 A digital hermeneutics constitutes an epistemological and
ontological research paradigm: a transfer from analogue sources to digital data,
and a new critical reflection that is needed to work with them.
- digital methodologies related to the management, processing and online presen-
tation of data or information (as in databases, digital scholarly editions, repos-
itories), which “freed from the constraints of the printing press, [...] can create
searchable and linkable connections between textual features,” including visual-
izations, in a “virtually unlimited critical apparatus and commentary” (Romein
et al. 2020, p. 9). These digital methodologies mainly originated from the com-
puter sciences/information technology and rely heavily on structuring and tagging
(meta)data with e.g., TEI guided XML (Extensible Markup Language), web pre-
sentation with HTML (HyperText Markup Language), and format standardiza-
tions to optimize data reuse such as RDF for Linked Open Data117 (Compare to
D. Schmidt 2012; Jannidis et al. 2017; and various best practice recommendations
such as by the National Information Standards Organization (NISO) 2007).
112. In contrast to the “distant reading” of computational methodology.113. For which extensive surrounding knowledge of the direct source is needed.114. E.g., texts are adaptable and can change their meaning with each reading (Baum and Stacker 2015,
p. 9).115. Compare to section 6.3.1 on “Establishing Literacy.”116. See section 6.3.1 on “Establishing Literacy.”117. Compare to section 5.2.2 on Linked Open Data.
30

Chapter 3
Network Research and Historical NetworkAnalysis
3.1 Networks and models
Network research is famously characterized by Freeman (2004, p. 3) according to the
following four criteria: (1) an (intuitive) analysis of social relations of actors, (2) a
systematic analysis of empirical data, (3) the graphical representation of such data, and
(4) mathematical, computer-assisted formal models to analyze such data.
A network is a semantically annotated “specific set of linkages among a defined set
of persons, with the additional property that the characteristics of these linkages as a
whole may be used to interpret the social behavior of the persons involved,” following
the commonly used definition by Mitchell (1969b, p. 2). Basis of this concept is the
focus on the interdependences of entities rather than on their independence (Wasserman
and Faust 1994, p. 4); these interdependencies thus form the scope of action of the
entities involved, and that their patterns of relations define “economic, political and
social structures” (Wetherell 1998, p. 126). The underlying idea of such a relational
approach is that the position of an entity in a social network is of importance: for power,
performance, or the ‘capital’ of potential social exchange in terms of social, economic, or
political connections. A network stands in for (and is the result of) the social connections
between entities, which allow inferences on “political, social and cultural phenomena”
(Romein et al. 2020, p. 17).
The mathematical definition of a network is that of a semantically annotated graph
that consists of nodes (also referred to as actors or vertices) and edges, i.e. the relations
between entities in a network:
A graph G = (V, E) with V = a set of nodes, and E = a set of edges.
The semantic annotation of a network is dependent on the research objective, and can
comprise of different types of relations in order to grasp complex information (compare to
Emirbayer 1997). The types of nodes present in a network can belong to the same group
(an unimodal network) or to different ones (bi- or multimodal). Dependent on the view
on the network, we can differentiate between ego-networks (focusing on the relations of a
specific node), or complex (whole) networks (see e.g., Wetherell 1998, pp. 127–8). These
31

Chapter 3 Network Research and Historical Network Analysis
relation can be formally and structurally described: from centralities of entities to the
density of the network to complex agent-based simulations and modeling.1
Network models. In their core, networks are models that are operationalized based on
specific relations or interconnections between entities. Networks–as any model–are only a
representation of reality following the classic definition on models by Stachowiak (1973).
A model offers an approximation to reality through the (ultimately always subjective)
selection of supposedly important or representative factors and parameters and their
subjective weighting and evaluation. The goal of modeling is to facilitate understanding
on the object of research. Modeling is a fundamental epistemic tool: “We model to
understand,” summarized this Le Moigne (2004) paraphrasing Stachowiak’s (1973, p. 56)
take that all insights are insights in models or through models.2 As a consequence of the
selection of (or: focus on) certain attributes, any model is ultimately subjectively biased,
and constitutes only one instance of an “endless number of potential other models”
(Rehbein 2020, p. 265). Principally, it can be refined constantly to represent reality (the
research object) more closely, dependent on the available data. As such models to only
offer a ‘crutch’ to understanding and insight, but can not give an absolute ‘truth’ on the
object of research (Drucker 2011).
Networks as a reduction of complexity. As epistemic tools, networks provide a rela-
tional perspective on the object of research by having the modeler selecting represen-
tatives types of interconnections–the choices of which influence the perspective on the
research object and which aspects of reality are going to be tackled (or approximated).
Consequently, it can be argued that networks are a model to analyze social structures
at a reduced complexity: they offer an abstract, focused, and thus undercomplex per-
spective on and description of the vast heterogenous changing and (sometimes fuzzy)
relations between entities that the model is focused on (or reduced to).3 Networks be-
1. For a general introduction to network research compare to e.g., Wasserman and Faust (1994),
Jansen (2006), Stegbauer and Haußling (2010b), Hennig et al. (2012), and During et al. (2016).2. The original quote by Stachowiak (1973, p. 56) reads in German: “Hiernach ist alle Erkenntnis
Erkenntnis in Modellen oder durch Modelle, und jegliche menschliche Weltbegegenung uberhaupt bedarf
des Mediums ‘Modell’.”3. Similarly this has been argued as a reason for the formations of networks. Niklas Luhmann (1984)
had argued that social organization in systems constitute a reduction of complexity. In this he diverted
from his teacher Talcott Parsons et al. (1961): not survival structured these social systems, but the
reduction of complexity, i.e. by limiting the infinity of possible options trough their composition and
institutions to provide security and relief. Luhmann illustrated this with various examples: cultural
practice which provide guidance; language which structures the interpretation of communication; law
which provides a framework of acceptable and punishable behavior. This idea has been also already
present in the writings of Gehlen, who developed a theory of humans as “acting beings” that are able
to decide, and therefore able to break the stimulus-reaction chain (which characterize animals) with
cognition. This theory resolved around the assumption that humans are “Mangelwesen” that need
to transform their environment in order to survive; they establish institutions in order to satisfy the
human need for safety and stability. This transformed environment Gehlen ([1940] 1986) considered
32

3.2 Origins of network research
come overcomplex, when (too) many attributes are included; this results in what is
called meaningless ”giant multivariate networks” that include all possible information of
a dataset (Graham et al. 2016, pp. 250–1). Another danger is that of misinterpretation,
when the quality, complexity, and importance of connections cannot be properly assessed
or is inconsistent (Hennig et al. 2012, p. 96; Graham et al. 2016, pp. 250–1; Rehbein
2020, p. 264). As any other tool, networks need to be reflected on critically–what can it
show, where does it fall short?–and be subjected to a critical computational literacy.4
3.2 Origins of network research
The history of network research is closely connected to the development of the field of
sociology beginning in the late 19th century, which was dedicated to study how people
form social relations, groups, and societies. Common historiography of the modern
network research is associated to be inaugurated with the sociometry by Jakob L. Moreno
and Helen H. Jennings in the 1940s.
Intellectual ancestors. One of the intellectual ancestors to network research was Georg
Simmel, who is credited with founding sociology as a field of research when trying to
find explanations for the formation of society, and organizations of humans (compare
to Raab 2010, p. 30). Simmel himself did not use the term ‘network’, but theorized
a similar group concept – that of “social circles” – in order to explain the creation of
society in his main body of work on “Vergesellschaftung”. Simmel theorized that group
have a great influence on individuals, while at the same time memberships in a group
reflected a specific choice of individuals. Simmel (1908, 1911) theorized the concepts of
social circles, and differentiated between organic circles (whom individuals were born
into such as family or neighborhood) and rational circles (to whom individuals opted in,
such as organizations) (Schnegg 2010, pp. 21–2). The decisions of individuals are the
basis for group formations and various social circles, which could overlap. Simmel (1908,
pp. 326–7) stressed the reciprocal influences of the actor on the network, and vice versa.5.
Simmel also noticed that people categorize and recognize other people in typified social
roles (Fuhse 2010, p. 168) The idea of overlapping and mixing social circles were later
further developed in the conceptualization of the social role as by Nadel (1957), and
different dimensions of relationships, such as kinship or neighborhood (Gluckman 1955,
p. 18), and later on as single-/multistrained or uni-/multiplex relationships (Schnegg
2010, p. 22).
Simmel’s student Leopold von Wiese renewed the interest on social relations in the
to be culture, which self-disciplines humans by offering orientation for certain behavior and through
institutions. This can be too considered a form of reduction of complexity.4. Compare to section 6.3.1.5. The original quote reads as follows: “[A]us Individuen entsteht die Gesellschaft, aus Gesellschaften
entsteht das Individuum.”
33

Chapter 3 Network Research and Historical Network Analysis
concept of “Beziehungslehre” (study of relationships), and identified the main goal of
sociology as the study of patterns and mechanisms of social behavior in forming groups
(Wiese [1924] 1933, p. 109). Wiese worked with four categories of analysis: the social
processes directing the closeness/distance of two individuals (social distance) in a non-
physical social room, the relationships forming social constructs (ibid., p. 113; Schnegg
2010, p. 22). Wiese theorized that individuals would orientate their actions/relations
accordingly to these social constructs (organizations, state, etc.), which Fuhse (2010,
p. 168) characterized as supra-personal structures of expectations (“uberpersonlichen
Erwartungsstrukturen”). These in turn lead to the manifestation of these constructs and
empowerment over these individuals (Wiese [1924] 1933, pp. 24–5). These deliberations
of formal sociology interpreted humans as acting agents, who oriented their actions on
supra-personal structures (Fuhse 2010, p. 168).
In another strand, in the 1940s, structural functionalist Radcliffe-Brown (1940, p. 2)
defined the field of ethnology as the science to study social structures, situated in a
“network of actually existing relations.” Radcliffe-Brown interpreted culture accordingly
as a product of social structure, and therefore as an imprecise category of study (as
opposed to the US research on ethnology; compare to Schnegg 2010, p. 23). He proposed
to study network structures instead as the research goal of ethnology (Radcliffe-Brown
1940, p. 3).
These three intellectual ancestors formulated different theories on why humans form
social relations/groups/societies, but agreed in that groups and therefore society are
an emergent product of social relations of individuals. This placed the (sociological)
foundation for social network research (Schnegg 2010, pp. 23, 26). This early assessment
on the inner mechanisms of society follows closely Freeman’s (2004) first category of
defining network research; however Schnegg (2010, p. 27) noted that neither the relation
of the micro and macro, nor the creation and dynamics of societies in social network
theory are solved until today.
Founder of network research. In general, the foundation of network research is placed
with the creation of sociometry in the 1940s by Jakob Moreno and Hellen Hall Jennings6.
J. L. Moreno (1948, p. 122) regarded his work on the “Stegreiftheater”7 developed in 1923
as the “decisive inspiration” for the succulent development of the sociogram and “so-
ciomatrix” of sociometry, which was one of the early schematic graphical representations
of groups. After his emigration to the US, Moreno and Jennings started studying the
Sing Sing prison and girl’s classes at the Hudson School for Girls, where they surveyed
participants on their most important relations (J. Moreno 1936). The sociograms used
simplified graph models to show the various networked relations between the subjects
6. Who increasingly is acknowledged for her significance contributions to Moreno’s research (see e.g.,
Freeman 2004, pp. 35–6).7. A method still used by psychologists in playing different social roles in the “Psychodrama” (Schnegg
2010, p. 23).
34

3.2 Origins of network research
studied (Jansen 2006, p. 40; Nitschke 2016, p. 12). Moreno theorized that social con-
figurations had an effect on the wellbeing of individuals, which configurations would be
produced by (psychological) powers of attraction and rejection (compare to ibid., p. 12).
Jennings is credited with the idea that in-coming relations do not follow a normal distri-
bution (Barabasi 2002; Schnegg 2010, p. 24), but are skewed left (ibid., p. 24), which led
to discovery of the concept of surplus choices that an actor could draw on themselves
(Moreno and Jennings 1938). This concept was later reiterated by Barabasi and Al-
bert (1999) for all sorts of complex networks as preferential attachment (also commonly
referred to as the Matthew effect). The work of Moreno and Jennings resulted in the
foundation of the journal Sociometric Review (1936), which was renamed Sociometry in
1937. Wiese (1949, pp. 202–3) had read Moreno’s sociometric studies and agreed that
the “concept of sociology is basically a system of relations between men.”8
This foundation of modern network research is since continuously traced back fur-
ther (Nitschke 2016, p. 11). Heidler et al. (2014) (re-)discovered the works of Johannes
Delitsch, who already in 1880 portrayed friendships of pupils in sociomatrices; his re-
search however had been ignored until recently.
Early network research centers: New York, Harvard, Manchester, and London. In
parallel, two early network research centers developed in New York, and in Harvard
around Radcliffe-Brown (Schnegg 2010, p. 25).
In New York, one early path finding study was Lundberg and Lawsing’s analysis of
Lady Bountiful in an American community, which studied the social status of an old lady
who lived from donations. Lundberg and Lawsing (1937, p. 333) theorized a connection
between social status and prosperity, and questioned whether individuals form relations
within/outside their own social economical class, and tested these based on empirical
network data, as one of the first studies on what would be later known as homophily
(Schnegg 2010, p. 25). Another well-known study from New York is the one on social
structures in worker’s colonies such as by Wiese (1937).
Radcliffe-Brown educated a generation of students on the empirical analysis of net-
works at Harvard University. One of which was the anthropologist W. Lloyd Warner,
who first studied social structures among native groups of the Murngin in Australia
1937. W. L. Warner transferred ethnological/anthropological research methods on or-
ganization theories, where he studied patterns of interaction in an urban context, and
the influence of social context on these interaction processes (compare to Freeman 2004,
pp. 43–5; Jansen 2006, pp. 45–7; Schnegg 2010, p. 26; Nitschke 2016, p. 13). W. L.
Warner is most famously known for his work with psychologist Elton Mayo on the
Hawthorne works (1924-1932), where they reviewed the influence of outside factors on
the productivity of workers. This study resulted in the discovery of the influence of infor-
8. Unlike von Wiese, Moreno actually did not try to explain the formation of society, but thought in
social relations the cause for societal problems; understanding these social relationships with network
research would offer a cure for these problems with psychoanalysis (ibid., p. 26).
35

Chapter 3 Network Research and Historical Network Analysis
mal social relations on the productivity of formal work relations. The results published
by Roethlisberger and Dickson (1939) visualized these social structures graphically in
network graphs resembling conduits, in order to illustrate the groups but without further
structural analysis; they also did not cite to Moreno’s sociograms (Nitschke 2016, p. 14).
In the “Old City”-Study, Warner research on a racially biased class society at Natchez,
Mississipi, and in the “Yankee City”-Study the emergence of cliques (Warner and Lunt
1941), where he first described and structurally analysed resulting networks and posi-
tions in matrices (compare Nitschke 2016, pp. 13–5). This research was furthered in
the “Deep South”-Study by Davis et al. (1941) on the communication in cliques, and
identification for patterns in class’ membership, which is still perceived as an exemplary
data set of two-mode matrices (Borgatti and Everett 1997; Nitschke 2016, p. 15).
In the post-war era of the 1950s, in Manchester and in London, a ethnologist influenced
network research developed at the University of Manchester (famously headed by Max
Gluckmann) and at London School of Economics, influenced by the ideas of Radcliffe-
Brown (Freeman 2004, pp. 103–5; Nitschke 2016, p. 16) A series of studies focused
however more on personal ego-networks instead of a broad analysis of society, leading
to the development of the ego-centered network analysis (ibid., p. 16). Noteworthy here
are the studies by Barnes (1954) on class in a Norwegian community, innovations in data
collections and perspective on networks in the survey of both marriage partners in the
studies by Bott (1957) on family structures (Jansen 2006, p. 43), and the theoretical
and methodological reflection of multiplex network relationship by Mitchell (1969a), as
well as the studies by Boissevain (1974) and Kapferer (1969) (compare to Nitschke 2016,
pp. 16–8).
Early network studies include as well as the fundamental sociological studies by Claude
Levi-Strauß on kinship, or unemployment and community by Paul Lazarsfeld and Maria
Jahoda, on role models and reference groups by Robert Merton, on communication
in groups social psychological studies by Kurt Lewin or by Alexander Bavelas, or the
rational choice theory developed by George C. Homans. Freeman (2004, pp. 129-30)
argued that these however focused on the individual person’s research and did not lead
to a general establishment of a relational perspective in sociology.
Methodological breakthroughs. In 1936, Denes Konig published a coherent graph the-
ory based on the ideas of Leonhard Euler on the topological and graph theoretical math-
ematics used to solve the “Konigsberger Bruckenproblem” in 1736, which would be the
beginning of a mathematical graph theory (Nitschke 2016, pp. 18–9).
In the 1950s another breakthrough was achieved: the description of the mathematical
properties of substructures of social structures building upon Heider (1946)’s theory of
interpersonal balance in positively and negatively charged relationships (Cartwright and
Harary 1956; compare to Jansen 2006, p. 41; Nitschke 2016, p. 19).
In the late 1950s, the research by Erdos and Renyi (1959) on random graphs and
the emergence of networks at a threshold number of nodes and edges revolutionized the
36

3.2 Origins of network research
field of graph theory (Barabasi 2002, p. 245; Nitschke 2016, pp. 20–1). Erdos and Renyi
(1959) thought this as evidence that all existing networks must be guided by randomness;
however social networks did not consequently follow the theorized behavior of random
graphs (Nitschke 2016, p. 21).
Milgram (1967) and Travers and Milgram (1969) proved that it is possible to reach in
only 5.5 steps any other human solely relying on personal contacts, later named after the
Broadway-Show “Six Degrees of Separation” by John Guare (1990; compare to Barabasi
2002, pp. 18–9, 29; Nitschke 2016, pp. 21–2), closely representing the results on random
networks threshold by Erdos and Renyi (1959).
In the 1950s, sociology had focused mainly on surveys, attributes, and variables (the
so-called “Variablensoziologie”), and mostly ignored social relations until the 1970s
(Ziegler 2010, p. 39). In sociology, two approaches stood against each other: a positivist
view of attributes and empirical statistical analysis, and the structural functionalism
coined by Parson. The breakthrough of a relational perspective and a graph theory
based network research in sociology and mathematics coincided with further advance-
ment in the computerization of the universities, which enabled computational research
and facilitated a fastened analysis of quantitative data. Raab (2010, p. 32) claimed this
situation had made time “ripe” for a relational turn in sociology, offering sort of a third
methodological strand in the field.
In the 1960s, Harrison White formed a new center at Harvard University, which fo-
cused on the relational sociological perspective. White’s group’s research ultimately lead
to a renewed interest in network research in general sociology and related disciplines, and
other major innovations until the 1980s, combining innovative conceptualizations and
the employment of mathematical and computational prowess (ibid., pp. 29, 31; Nitschke
2016, pp. 23–4). White was influenced by Levi-Strauss9 and had a strong structural per-
spective on sociology, from which he conceptualized role structures, which would then
evolve into the concept of structural equivalency (Lorrain and White 1971), as well as
basic matrix computation (Raab 2010, p. 31). This made possible to mathematically
compute (and compare) social roles–and paved the way for an “allegedly exact” formal
network science (Nitschke 2016, p. 23). White made clear in his courses that the at-
tribute analysis of survey-based sociology was to fail (Raab 2010, p. 32). White’s focus
was on networks as the object of research from a global perspective, therefore on their
structural composition and patterns (such as role structures) in networks. They devel-
oped methods to compare networks and their structures (White and Breiger 1975) in
order to derive to a formal generalizations, position and role structure network analysis
with cognizant mathematical models (Raab 2010, p. 33). Their concept of structural
equivalence in block model analysis (White et al. 1976; Boorman and White 1976) of-
fered an operationalization of a central sociological concept, that of the social role, for
network research: structural equivalency described two actors that have the same rela-
9. Such as in White (1963) work on kinship, which built upon Levi-Strauss ([1949] 1969)’s concepts
and kinship diagrams.
37

Chapter 3 Network Research and Historical Network Analysis
tions to the same other actors based on the algorithm CONCOR (convergence of iterated
correlations) (Jansen 2006, p. 47; Raab 2010, pp. 33–4). White thus placed the founda-
tions for a “widefounded legitimacy” of a mathematically based network methodology
and helped its spread with his teaching (Freeman 2004, p. 125; Nitschke 2016, p. 24).
Two other network research groups formed outside Harvard: one around Linton Free-
man at UC Irvine California focused on the development of centrality measures (compare
e.g., Freeman 1978), another group of Edward Lauman and James Coleman at Univer-
sity Chicago focused on stratification, power structures, social capital (e.g., Coleman
1998) and the composition of political and social networks (Freeman 2004, pp. 148–9;
Nitschke 2016, p. 25).
Professionalization in 1980s. Since the late 1970s, network research experienced a suc-
cessive formalization and upturn in reception (compare e.g., to Stegbauer and Haußling
2010a).
The systematic integration of these groups were made possible by the foundation of the
International Network for Social Network Analysis in 1978 (Raab 2010, p. 32; Nitschke
2016, p. 25). In Germany, too, a research association Analyse sozialer Netzwerke (1977–
1981) was founded by the DFG (Ziegler 2010, p. 39). The relational turn brought a
change in the dissemination of sociology, focusing on the functions and changes in social
structures (ibid., p. 40).
Methodological innovations of the 1980s included the concept of embeddedness (M. S.
Granovetter 1985, p. 490)–bridging economic and sociological theory stressing the “role
of concrete personal relations (or “networks”) of such relations in generating trust and
discouraging malfeasance” as a structuring mechanism of behavior–, the concept of weak
ties, and the modeling of different types (strengths) of edge relations, and the effects of
network structures e.g., on the successful job hunt (M. Granovetter 1973), or on how
to find information on sensible topics such as abortion through chains of friends (Lee
1969). Schnegg (2010, pp. 26–7) and Nitschke (2016, p. 26) both noted the sound effect
of these studies to further a relational perspective in sociology and the acceptance of
network analysis into sociology.
Further achievements have been made in the field of structural equivalence and block-
modelling: a regular equivalence which makes structural positions comparable through
different networks (Borgatti and Everett 1989), or a generalized blockmodeling by Dor-
eian et al. (2005). Bonacich (1987) furthered Granovetter’s concepts in differentiating
between positive and negative exchange systems, which Burt (1992) combined in the
concept of structural holes, and positional roles profiting from weak ties. Watts and
Strogatz (1998) mathematically described small word networks as a class of random
graphs, characterized by the clustering coefficient and the average shortest path length–
these characteristics are shared by a wide range of real-world networks, which allows
them to be analyzed applying the same mathematical models. The studies on power law
distributions and preferential attachment in networks by Barabasi and Albert (1999,
38

3.3 Development of Historical Network Research
pp. 66–9) mathematically sustaining Moreno’s observation on surplus choices (Nitschke
2016, pp. 28-9).
Since then, research in network approaches resulted in an unoverseeable list of publica-
tions and insights since the late 1990s–from exponential random graph modeling (Lusher
et al. 2012) to stochastic graph modeling of complex networks (compare e.g., to Block
et al. 2019; Ragozini and Vitale 2020) to brokerage in networks (Burt 2005) to dynamic
and temporal network analysis (Freeman 2003; Batagelj et al. 2014) or context-aware
social networks (e.g., Schonfeld and Pfeffer 2020), among many more–, and experienced
a spread of methodologies into other disciplines, such as in history.
3.3 Development of Historical Network Research
The spread of network research methodology into historical studies is considered a trans-
disciplinary research paradigm by its practitioners.10 Historical network research (HNR)
consists of methodological approaches adopted from the interdisciplinary field of network
research (which itself combines input from sociology, anthropology, political studies,
mathematics, and computer science) to study network models of the past embedded
into a larger context of historical research to generate greater understanding and new
insights on historical objects of research.
“The roots of HNR go back to the year 2009 when Ulrich Eumann, Martin Stark,
Linda von Keyserlingk-Rehbein and Martin During decided to organize a workshop for
historians interested in social network analysis”, recounts the website of the “Historical
Network Research Community”11 the origins of historical network research. Despite this
assertion, we can identify multiple strands influencing the creation of the field of HNR,
resulting in its popularity since the late-2000s.
Early historical network studies. Network studies based on historical research topics
emerged in the 1990s after SNA’s “maturing” in the late 1980s and 1990s (Wetherell
1998, p. 125), but lacked the involvement of trained historians–a result of the change in
focus in historical studies from social history to postmodernist thought during the 1980s,
the reception of network analysis in the general field of history itself was very limited
(ibid., p. 125; Reynolds 1998; Gamper et al. 2015a, p. 24).
In 1993, the political scientists John F. Padgett and Christopher K. Ansell published
the now-famous study on the rise of the Medici in Florentine (1499–1434), linking the
Medici economical influence to a specific marriage strategy using a network approach
and blockmodel analysis. The sociologist Roger V. Gould in 1995 published on social
10. A research paradigm is considered a consensus-based set of procedures that define what object to
be studied, what kind of questions be asked, and what kind of hypotheses be tested, according to T. S.
Kuhn ([1962] 2012).11. https://historicalnetworkresearch.org/about/)
39

Chapter 3 Network Research and Historical Network Analysis
movement and identity in the Paris communes of revolutionary France in the 19th cen-
tury.
In the general historical studies, a network perspective did not found greater doorway;
instead, a niche in the quantitatively-based economic, business and social history began
to form. Early network studies by historians were made in business history, drawing from
sociological organizational theory: such as a study by Cookson (1997) on the inter-firm
relations of textile engineering industry in mid-19th century Yorkshire12 or e.g., on bank
network relations and credit distribution (Godley and Ross 1996), or on how networking
activities of fire insurance offices in England influenced economic development during
British industrialization (Pearson and Richardsson 2001). These network studies in
general entailed a relational perspective based on the “concept of ‘networking”’ (ibid.,
p. 657) without describing the emergent network structures formally. In social history,
Wetherell (1998) tried to popularize a network methodology in historical studies by
showing how HNR (then termed Historical Social Network Analysis) “can advance our
understanding of historical kinship” and community, lauding the potential of a network
methodology to the study of history, while lamenting how historians have been “slow to
adopt the approach” (ibid., p. 125).
An exception to this tendency of a lacking historian involvement was the work by
Wolfgang Reinhard: based on his concept of “Verflechtung” (embeddedness) Reinhard
focused on different types of relationships as result of social contexts and social roles, but
deliberately avoided the usage of the term ‘network’ (Reinhardt 2002, p. 236).13 This
specific network approach was not receipted within general historical studies, and is now
considered an island development; Reinhardt (2002, pp. 239–41) argued that Wolfgang
Reinhard’s embedded study of elites did neither relate to then prominent focus on “All-
tagsgeschichte” (ordinary history) nor to the shift from quantitative-based approaches
to text.
In contrast to the highly formalized and structural analysis of social network research,
the use of ‘networks’ in historical studies have been criticized as metaphorical (e.g.,
Gamper et al. 2015a, p. 8) or as undifferentiated use of “buzz”-words for social interac-
tions (During 2015, p. 42), and in general used inflationary for a relational perspective
but lacking a formalized (mathematical) approach (Rehbein 2020). The value of these
less formalized approaches however has been identified as e.g., by Reitmayer and Marx
(2010, p. 876) in the shift in perception from isolated historical actors to a relational
perspective on the web of dependencies historical entities operate in.
12. Cookson (1997, p. 5) preferred the metaphor of the “wheel” over that of a network (“for that concept
implies the equal status of each member”) to describe business hierarchies in the textile engineering
industry.13. Reinhardt (2002) argued that this concept of “Verflechtung” would be better placed under the term
of patron-clientele-relationships.
40

3.3 Development of Historical Network Research
A growing HNR community. Since the turn of the millennia, Gamper et al. (2015a)
registered an explosive growth’ in publications concerning historical network research, of
which a regularly updated online bibliography tries to keep track of.14 This development
happened on the backdrop of the growing popularity of computer-assisted work through
the mass digitization of the 1990s, the introduction of the personal computer and the
internet, and the popularization of the digital humanities.15
In 2009, a workshop was organized on “Historische Netzwerkforschung” (Kucking
2010) heralding an on-going initiative to advance historical network research in Europe
with a series of yearly German-based workshop meetings since 2009, and a series of
Europe-wide “HNR conferences” since 201316. This was accompanied by the establish-
ment of historical network research as the common denominator for network approaches
in historical research contexts, dropping the previously used moniker ‘social’ from his-
torical social network analysis (compare to Wetherell 1998).
HNR unifies very heterogenous research endeavors from diverse fields from the human-
ities (from archeology to history of art, literature and language studies), social studies
(sociology, political studies), and the MINT fields (computer science, physics) by using
the common methodology of network approaches17 on historical data sets. In 2010, Re-
itmayer and Marx (pp. 870–1) differentiated between two basic research strands within
HNR, which are frequently mixed: for one, to research networks as a regulating mech-
anism that permits and constrains action of entities within the networks–such as the
concept of social capital and rational-choice theory, identified mostly within business
and economic history. For two, the existence and the function of the network as is and
diverse interpretative frameworks and the possible scope of action of entities as in mainly
social history. Since Reitmayer and Marx’s (2010) assessment the scope of research with
historical research questions and/or historical data has extended dramatically: network
approaches and methodologies are explored in studies over all periods on:18
- correspondence and citation networks, such as the reconstruction of the (multi-
modal) intellectual network of two astronomers at the Res temple in Uruk during
the Seleucid period based on colophons of astronomical tablets (Ossendrijver 2011),
which however focused on a visual reconstruction and abstained from a structural
analysis. The study on astronomer’s networks in the Early Modern period by
Knopp (2018) used correspondences to identify the most important individuals,
14. Starting from 2013, there are over 1060 publications recorded at https://historicalnetworkresearch.
org/bibliography/ (vol. 8, accessed 2021-08-27; compare this also to its adjacent Zotero group at https:
//www.zotero.org/groups/209983/historical network research/items/98BTGBUE/library).15. Compare to section 2.2.16. Compare to the overview on https://historicalnetworkresearch.org/hnr-events/.17. Reitmayer and Marx (2010, p. 867) stressed that the incorporation of network methodologies in
the historical studies happened “pragmatic and eclectic” as addition to the historian’s tool box, and
therefore have to be labeled as “approaches” only.18. The following list is exemplary and does not aim for completeness, but is intended to show the
scope of research areas and methodologies.
41

Chapter 3 Network Research and Historical Network Analysis
and studied the ego-networks of selected key players, such as Johannes Kepler
and Johannes Hevelius. Noteworthy, too, are the on-going projects to reconstruct
and map the “Republic of Letters” (Grafton 2009a; Winterer 2012; Edelstein et
al. 2017; Vugt 2017; Hotson and Wallnig 2019), which range from manual draw-
ings of networks on maps, e.g., in the reconstruction of flows of information to
Issac Newton from his contacts and their sources (e.g., Schaffer 2008, Fig. 4 on p.
39) to the computer-facilitated quantiative analysis and mapping of multi-layered
dynamic networks of letters (Vugt 2017).19
- organizational, business, and economic networks. Noteworthy here are studies on
the personal and capital embeddings, such as the social influence on economic
success in a historical credit market (Stark 2014; Reupke and Stark 2015) or on
interlocking of positions in intercorporate networks (for an overview compare to
Carroll and Sapinski 2011).
- clientele networks. A prosopographical patronage-clientele study of the profes-
sional relationships between individuals mentioned in stamped bricks of Rome
(0–300 CE20) identified important players in the brick industry, and computed the
density in occupational communities (Graham and Ruffini 2007).
- elite networks, such as on movement and migration in social networks of intel-
lectuals (Verbruggen et al. 2020), or the reconstruction of the personal networks
of the aristocratic abbot of Cluny in the early Middle Ages building a relational
database in Microsoft Excel (Rose 2011, pp. 214–5). Noteworthy is the formal
network analysis of the Dominican investigation of Cathar heresy in the “Great
Inquisition” of 1245–46 based on a digital edition of the source text “BM Toulouse
MS 609”21 that was created in the course of their project (Rehr 2019).
- political network analysis. Prominent here are the works by Preiser-Kapeller geo-
graphically mapping conflict among power elites in Medieval Europe and the Near
East based on nonlinear time series analysis and agent-based modeling (Preiser-
Kapeller 2015), or the study reframing empires as “networks of princes” in the
early 13th century by Gramsch (2013), which was succecently extended to detect
communities in the emperors aristocratic circles (Dahmen et al. 2017; Gramsch-
Stehfest 2020).
- criminal networks, such as the network reconstruction of the conspirators of the
July 20th assassination attempt on Hitler, representing the state of knowledge of
the Gestapo investigation (Keyserlingk-Rehbein 2018). Social network analysis
in criminology (for an overview, compare to Masys 2014; Diviak 2018; Burcher
19. Compare to section 5.2.1 on network approaches in intellectual history.20. Common Era21. https://eadh.org/projects/de-heresi-documents-early-medieval-inquisition
42

3.3 Development of Historical Network Research
2020; Bright et al. 2021) often, too, uses historical datasets, such as the network
reconstruction of the South African arms deal in the late 1990s drawn from two
secondary literatures (Kriegler 2014), or the regression analysis of dyadic relational
data testing the influence of kinship and violence on cooperation in criminal orga-
nizations in Italy, whose networks were reconstructed based on phone transcripts
(Campana and Varese 2013).22
- judicial networks. Oftentimes these are essentially cooccurrence networks, such
as the on-going project by Schwandt (2021) to reconstruct spatial networks of
traveling judges of the Kings Bench mentioned in the courts protocols of English
counties in the 13th century in order to reconstruct the judicial practices of the
Kings Bench justice in competition to the county courts. From legal studies,
judicial network analysis is used to study judicial decisions and the genealogies
of law (e.g., Shomade and Hartley 2010; Kastellec 2010; Clark and Lauderdale
2012; for an overview compare to Box-Steffensmeier et al. 2016) or the internal
and external organizational effects of courts such as the influence of amicus curae
networks on court decisions (Box-Steffensmeier and Christenson 2014). These
kinds of analyses are based on court documents, and interview data, briding from
the social sciences to legal studies.
Since the mid-2010s, a variety of introductory and overview works has been pub-
lished on network analysis (Jansen 2006; Scott and Carrington 2011; Hennig et al. 2012;
Kranakis 2013; Ragozini and Vitale 2020) and its applications in the humanities (com-
pare to Gamper et al. 2015b; During et al. 2016; During et al. 2020). In 2013, the
yearly SUNBELT conference (of the International Network for Social Network Analysis,
INSNA) incorporated for the first time a track on historical network research23, that has
since become a recurring part of the program under varying names, suggesting the firm
location of HNR as part of the general network research community.
22. Oftentimes, criminal network analysis finds application to support and to facilitate policing and
law enforcement during active investigations especially against organized crime (compare to Diviak 2018;
Burcher 2020).23. Compare to the program of the XXXIII SUNBELT at University of Hamburg (https://www.
dropbox.com/s/lzz7magmaajh44o/33 Program.pdf?dl=0), that has since become a recurring part of
the program under varying names.
43


Chapter 4
Case Study Political Judiciary in theCorporate State
In our first study “Configuration to Conviction. Network Structures of Political Judiciary
in the Austrian Corporate State,” we computationally analyzed the extend of political
judiciary during the authoritarian Corporate State in Austria, and discussed the obtained
results in the light of their historical context and the preexisting, mainly qualitative
scholarship in order to carefully draw historical implications. Our main research question
in this project was if there is evidence for political judiciary in the judicial practice of the
Corporate State on the example of Viennese courts in 1935, and investigated differences
in the legal prosecution of the political opposition.
In the following, we will extend on the topicality of targeting a political opposition
and on the definitions of political judiciary, before introducing the paper itself. Finally,
the methodologies used in the paper will be reflected on, and its innovation discussed.
4.1 Topicality
Targeting a political opposition is a typical character trait of an autocratic regime. Until
today, we see examples of this in Europe, where the division of politics and judiciary is
slowly undermined.
In Poland, the government introduced laws to retire non-compliant judges early be-
tween 2017 and 2019, which were taken back after pressure from the EU (BBC.com
2019). In Hungary, a transformed judiciary is used to prosecute the political opposition
(Kingsley 2018; Novak and Kingsley 2018), and in 2020, prime minister Viktor Orban
assumed unlimited power to supposedly better battle the coronavirus crisis in Hungary
(SZ.de/kit/mati 2020). The extend of these transformed systems became painfully clear
in the maneuvers of both country’s governments to decouple constitutional legality as
a requisite of EU funding schemes (which the EU accused both Poland and Hungary
to have critically damaged) threatening to hinder the negotiations of a joint EU ef-
fort to support the European economy during the coronavirus crisis (compare e.g. to,
tagesschau.com 2020b; se/fab (dpa, afp, ap) 2020). While a consensus was found in the
distribution of EU budget and corona stimuli by end of 2020 (tagesschau.com 2020a),
45

Chapter 4 Case Study Political Judiciary in the Corporate State
the conflict between the EU and Poland and Hungary is still on-going in regards to their
judicial transformation and constitutional legality (Strupczewski 2020; Riegert 2021).
The Austrian “Corporate State” used to be such an transformed system, too, put into
place by elected Chancellor Engelbert Dollfuß (1933–1934) and his Secretary of Justice
and later successor Kurt Schuschnigg (1934–1938) in Austria. Ruling the former republic
of Austria with emergency decrees since March 1933–based on a wartime accreditation
law of 1917–, the regime gradually tightened control over the justice system, abolishing
the constitutional court and introducing an oath of loyalty, overriding the lay judiciary,
and continuously restricting civil rights and political freedom. This resulted in open
political repression and the creation of an autocratic regime.
4.2 On political judiciary
The legal situation in Austria has been retroactively assessed as fitting the characteristics
of political judiciary, often under the more generic term of repression (compare to e.g.,
Holtmann 1975a, 1975b, 1978; Neugebauer 1995a, 1995b, 1995c; Jesionek 1995; Reiter-
Zatloukal 2012, 2013; Rothlander 2012; Neugebauer 2012; Wachter 2013; Wenninger
et al. 2017).
Governments operate at an intersection of governing their state’s population, and
letting themselves be governed by this population’s political engagement. Beyond per-
spectives of legalism–the assumption that the rule of law is an end of itself–, the purpose
of law in general is considered to organize humans interactions, and to punish violent
or deviant behavior (Posner 2005, p. 89). What constitutes political judiciary is a con-
troversially discussed and sensitive topic–as it is often decided retroactively from the
perspective of a succeeding or victorious system in transitional settings (ibid., p. 77).1
Political justice stands at as the embodiment of an unfair justice, which punishes
political expression while ignoring legal safeguards, as due process or equality in front
of the law. While there is no consensus on the true nature of political judiciary, per
common definition the very political expression (or: opposition) of a dissenter is prose-
cuted in a (thus political) trial, following the seminal work by Otto Kirchheimer (1964,
1965): “Wenn gerichtsformige Verfahren politischen Zwecken dienstbar gemacht werden,
sprechen wir von politischer Justiz” (Kirchheimer [1955] 1964, p. 96). Political judiciary
is such characterized to use the judiciary to serve political purposes. One form of this is
the control of political dissent: political trials where political partisanship is prosecuted;
or when such partisanship is a coveted factor for the prosecution of not-necessarily po-
litical crimes; or in trumped up charges for non-political crimes that get politicized to
target political partisans (instead of being applied unambigiously). The law thus gets
1. The question therefore arises, wether there can be a non-political justice at all, as the legal system
is based on the ideals of a political elite, and subjected to major changes in time.
46

4.2 On political judiciary
weaponized against a political opposition, which Kirchheimer (1965, pp. 80–1) coined a
political lawsuit.2
Ernst Fraenkel ([1927] 1968, pp. 36–7) specified the same concept as tendency justice,
stressing that also pre-existing laws could be construed disadvantageously against a
political opposition. Fraenkel ([1927] 1968) conceptualized political judiciary instead
as the personal political beliefs of the judge which could influence the dispensation of
justice in the verdict.
More broad definitions of political judiciary are concerned with the political executive
influencing justice, i.a. that include any connections between the judiciary and politics
(see Hannover and Hannover-Druck 1987, p. 13). Holtmann (1978, p. 57) reinterpreted
the concept of tendency justice in the sense of Kirchheimer’s political lawsuit and stressed
its momentum of deterrence. Belknap (1994, p. xvi) stressed that political trials should
enclose those which “immediately affects or is intended to affect the structure, personnel,
or policies of government, that is the product of or has its outcome determined by
political controversy, or that results from the efforts of a group within society having
control of the machinery of government to use the courts to disadvantage its rivals in a
power struggle which is not itself immediately political or to preserve its own economic
or social position.” Whereas Posner (2005, p. 75) defined political trials as those when
“the defendant’s opposition to the existing government or the constitutional order is the
main issue.” Broader definitions are usually applied in the literature on Austrian legal
history, or not defined at all while implicitly assuming a connection between political
influences and juridical decisions as political judiciary (compare e.g., Neugebauer 1995a).
As Kirchheimer has noted, political justice is not only present in authoritarian or
totalitarian regimes3, but also in democracies as “legitimate” political judiciary forms
as e.g., in defense of the system, against a threat to society, in the quest of security and
stability, or due educational purposes (not only in a transitional context) as a kind of
a “dark side” of justice (Ooyen 2012, p. 243; for an analysis of (ill)legitimate form of
political judiciaries in democracies compare to Posner 2005). From a legalistic point of
view, political trials are always objectionable as they violate legal norms and the due
process (ibid., p. 89), and represent a “corruption of the judicial process and a betrayal
of liberal principles” (ibid., p. 78).
The Austrian Corporate State proves ample examples for these kinds of political trials,
as will be shown later4 in the legal foundations for prosecution of oppositional partisan-
ship, as well as in the direct influence on the independence of judges, who were subjected
to an oath of loyalty, and had their permeability removed, forced to change court or into
retirement. While the Austrian Corporate State can be considered an authoritarian
2. Whereas in show trials, the result–the guilt of the defendant–is determined a priori, and the trial
itself serves as a platform of propaganda.3. In one interpretation, Kirchheimer argued that the common association of political judiciary with
autocratic or totalitarian regimes could be false; because these regimes controlled justice completely,
justice would not be possible, but only ”friend-enemy” politics (Ooyen 2012, p. 243).4. Compare to Petz and Pfeffer (2021).
47

Chapter 4 Case Study Political Judiciary in the Corporate State
regime, it’s judiciary still had a little scope of control as will be shown in the conclusions
of our case study; it’s control of the judiciary was not absolute, even though the perme-
ability and independence of judges has been revoked, the constitutional court has been
abolished, and a series of highly specialized laws has been introduced that eased the
prosecution of political opposition and repressed civil rights and freedom of expressions.
For analysis, we operationalized political judiciary two-fold according to the defi-
nition given by Kirchheimer’s political judiciary and political lawsuit, supplemented by
Fraenkel’s concept of tendency justice. In the following case study, we examined whether
the law was strategically utilized against specific groups (Kirchheimer’s political lawsuit)
and as in the more lenient version of Fraenkel’s tendency justice, we analyzed whether the
law was disadvantageously interpreted for specific partisanship up to a blatant breach
of judicial conduct.
4.3 Innovation and discussion
4.3.1 Extending on previous qualitative scholarship
The “Vergangenheitsbewaltigung”5 of the Austrian authoritarian pre-NS past is a more
recent phenomena in Austria, which was delayed by the long held narrative of Austria
as the first victim of NS-Germany, and Dollfuss’ and Schuschniggs’ Corporate State as
‘savior’ or ‘rampant’ from Nazism held in postwar-Austria (compare e.g., to Wenninger
2021, p. 70).6 In the 1970s, encouraged by the Scientific Commission of the Theodor-
Korner-Stiftungsfonds and the allocation of the “Leopold Kunschak Price to Research
Austrian History between 1927 to 1938”, a younger generation of Austrian historians
looked into the question of responsibility for the dictatorship in Austria after the First
Republic (compare to Jedlicka 1975). Later, the nature of the regime was controversially
discussed, and still is heterogeneously assessed in scholarship. This ranges from claims
of an Austrian specific type of fascism–“austrofashism”–(e.g., Talos 2013) picking up on
the contemporary usage as a “Kampfbegriff ” of the Social Democratic opposition against
the regime, such as by deputy chairman of the SDAPO Otto Bauer (Botz 1985). The
fascist nature of the Corporate State is abnegated by other researchers, who stress that
the regime lacked a thorough penetration of society except for the organization of the
“Heimwehr” party (compare to Holtmann 1978; Botz 1980). Holtmann (1978, p. 15)
considered the Corporate State authoritarian, not totalitarian. The term “Corporate
5. This term does not find an english exact match, but entails the public (scientific) dissemination,
reflection, judicial processing, and work of remembrance in order to coming to terms with the past.6. Schuschnigg cultivated this image as well. After having been detained in a series of concentration
camps as a prominent “Sonderhaftling” in the course of the “Anschluss,” and kept with certain privileges
for a show trial for after a successful NS-war, Schuschnigg moved from Italy to the US in 1947 (after
being refused to remigrate to Austria), and attained citizenship and a professorship for state law at the
University of St. Louis through his contacts (Saint Louis University, n.d.). In 1968, he returned to
Austria, and published his final book Im Kampf gegen Hitler. Die Uberwinderung der Anschlußidee in
1969.
48

4.3 Innovation and discussion
State” was the self-referral nomen of the regime; both terms have however become a
term of analysis in the history of Austria (Schwarz 2013).
A more recent scholarship focuses since the early 2010s on the still open questions
of social and administration aspects of the Corporate State, as well as on the scope
and development of the repression (compare to e.g., the anthologies edited by Reiter-
Zatloukal et al. (2012), or by Dreidemy and Wenninger (2013), among others). There
are still many open questions about these five years of pre-NS-dictatorship in Austria,
especially in the field of the judicial history of the Corporate State. Research on the
judicial history of the Corporate State has focused on a qualitative evaluation in overview
studies (focusing on the introduction of new laws) and specific isolated cases of the
political repressive system of the drumhead courts and great show trials against political
agitators in the early years of the regime (1933/34) and in the later period just before the
integration of Austria into NS-Germany (1937/38) (Neugebauer 1995a; Reiter-Zatloukal
2007, 2012, among others). Additionally, scholarship has focused on the more turbulent
early and late period of the Corporate State, while the intermediate period of the more
consolidated regime of 1935/36 was not considered much.7 Methodologically, previous
scholarship built on qualitative analysis; only few quantitative studies on the Corporate
State have been conducted.8 A research project conducted at University of Vienna
addressed this lack of quantitative analysis and collected empirical data on politically
motivated court cases with a focus on Viennese courts in 1935, and expanded this project
for the following years (Wenninger et al. 2017). The analysis of political judiciary in the
Austrian Corporate State with means of modern technological advances and qualitative
knowledge is a missing void that this case study aimed to fill.
4.3.2 Methodological approaches
In this work, we were interested in the extend of political judiciary in the Corporate
State.9 Was the law strategically utilized against specific groups (following Kirchheimer’s
political lawsuit), or was the law disadvantegously interpreted–up to blatant breach of
judicial conduct–for specific partisanship (fitting Fraenkel’s concept of tendency justice)?
We innovatively modeled court trials as multimodal networks, which structures we an-
alyzed quantitatively; the results of which we contextualized drawing from the mainly
qualitative scholarship. While judicial network analysis (influenced from a perspective of
law studies) considered the genealogies of laws and court decisions as citation networks,
or developed sociological interview-studies to evaluate the extend of e.g., amicus curae
influence on court decisions, these do in general not analyze the networks structurally
7. Such as in the qualitative study on political judiciary in the Corporate State by Neugebauer (1995a),
the sentence practice of 1935 is not mentioned, except for the “Schutzbundprozess” in April 1935.8. Such as by Botz (1995), who analyzed the relationship of politics and judiciary in the First Republic
in regards to violent crimes, but used a tiny sample; or the quantitative-based dissertation by Bauer
(2001) on the social structure of the July Putsch 1934.9. For the following compare to Petz and Pfeffer (2021).
49

Chapter 4 Case Study Political Judiciary in the Corporate State
as criticized by Whalen (2016, p. 540). In historical studies, there have been few stud-
ies on judicial matters: Schwandt (2021) traced travel patterns of traveling judges in
13th England in spatial networks, while Keyserlingk-Rehbein (2018) reconstructed the
state of knowledge of the Gestapo investigation against the conspirators of the July 20th
assassination attempt. Noteworthy are also the Old Bailey Proceedings10 which offer a
rich available database on historical court trials, but has been mainly analyzed using
text mining approaches in regards to a social history of criminality and insights into
‘ordinary history’ (Hitchcock 2013; Graham et al. 2016, pp. 4–8; Emsley et al. 2018).
In this study, we combined statistical and network methodologies in order to study a
historical phenomena: the penal practice exerted in the provincial courts of Vienna in
1935. As we can show with this approach a network analysis beyond its metaphorical
use offers new perspectives and insights upon the Corporate State and allowed us to
identified patterns of prosecution and structures relevant of convictions or acquittal. We
implemented the following analyses using the Python::NetworkX 11 library for network
analysis, and Python::Numpy12 and Python::Pandas13 for statistical analysis.
Operationalizing the aforementioned concepts of political judiciary, we investigated
the usage of certain charges for particular groups, and the penal practices applied on
them in order to detect biases against the political opposition.
- We analyzed statistically distributions of prosecution, conviction, acquittal, and
imprisonment rates for each group. We computed the standardized residuals for
each (compare to e.g., Everitt and Skrondal 2010, p. 367), which show the dif-
ference between the observed and expected counts and the standard deviation of
the expected count, such measuring the strength of difference between observed
and expected values. We did the same for the percentages’ distribution of offenses
leading to trial or conviction or imprisonment. None of the standard residuals
showed significant results in outliers.
- Then, we looked for significant differences in the treatment of both left- and right-
wing groups in dependence to their sentence lengths in convictions via a t.test,
which evaluates the differences in two groups and tests whether both are from
the same distribution (ibid., p. 420); it revealed significant differences. With a
χ2-test (ibid., p. 81), we tested the significance of influence of specific political
partisanship in cases where the defendant was brought to trial or not, or was
convicted or acquitted, or was sentenced to prison or not in the verdict.
- We introduced a technique to match the actual sentence in the possible sentence
range as regulated in penal law, in order to infer whether the sentences can be
10. https://www.oldbaileyonline.org/11. https://networkx.org/12. https://numpy.org/13. https://pandas.pydata.org/
50

4.3 Innovation and discussion
considered severe. As two different principles led the range of possible sentence–
the principle of absorption (the most harsh individual offense) and the principle
of aggravation (cumulative sentence)–, we computed for each the upper, lower,
and aggravated limits of penalty for each case with a prison sentence and delicts
of convictions. This allowed us to identified key players and tandems in a social
network of judges and prosecutors, who stood out in the sentencing of particular
political groups.
- We harnessed the advantages of a network approach in the visual representation
of the characteristics of an average case of each political group using a clustered
graph approach as suggested by Brandes et al. (2008), showing a fingerprint of each
aggregated co-occurrence networks of the ego-networks of political defendants.
- We tested for systematic predispositions, such as specialized charges for political
groups employing cooccurrences networks. A co-occurrence network shows ele-
ments that occur next to each other. Originally, this is used in text analysis in
order to mark words that appear in close proximity to each other, usually in the
same text, or as keywords in context in a distance of a number n other words around
the target word (Wasserman and Faust 1994, p. 295) We employed the concept
of co-occurrence from text to court cases: if a judge, prosecutor, defendant, or
offense appear in the same case, we perceive them as co-occurring, and therefore
draw an edge between those entities. We constructed various such co-occurence
networks: multimodal ones of judges, prosecutors, and court processes (group trials
of various defendants), or of judges and prosecutors only, as well as of the differ-
ent offenses of inquiries, charges, or delicts of conviction. In these cooccurrence
networks of offenses, we analyzed significant combinations of inquiries, charges,
and delicts of convictions, and their specialized usages for certain political groups.
We constructed an average occurrence of an edge between two offenses, such con-
structing a threshold over all political partisan groups. In differentiating between
co-occurrence networks of each political group, e.g., an inquiry co-occurrence net-
works of Social Democrats, we are able to highlight above average combinations,
visually representing such in an easily readable format. This helps to disseminate
specialized strategies for political groups in the evolution of charges.
- We tested for specialization of judges on political groups, which we found incon-
clusive.
- In a co-occurrence network of judges and prosecutors cooperating in cases, we
identified clusters using a spectral cluster analysis. The spectral cluster analysis
is based on a normalized graph Laplacian closely related to a random walk in
order to identify clusters in the component, as described by Luxburg (2007) for
sparse networks. We chose the amount of suitable clusters based on the spectrum
of the normalized graph Laplacian, which showed a gap after the third eigen-
51

Chapter 4 Case Study Political Judiciary in the Corporate State
value indicating three clusters. The actual clusters were then extracted from the
corresponding first three eigenfunctions of the graph Laplacian using a k-means
algorithm (Wasserman and Faust 1994, p. 708). The clustering algorithm identi-
fied three clusters–one of which in the separate component of the remnant Steyr
court–, and securely identified both Viennese courts in the data.
- We identified one judge as the best connected node in the network–the vice pres-
ident of LGSt Vienna II–with a Pagerank score. This Pagerank score shows the
node with the highest degree, i.e., the most edges to other nodes.14 Despite this,
we refrained from centrality analysis in the networks, as this would show the mere
quantity of choice, but not real ‘importance’ as in a social network, and does not
make sense in the context of trials.
Discussing the results of our quantitative and computational-based analysis, we were
able to falsify and extend on the historical knowledge of qualitative-based scholarship
on judicial practice during the consolidated period of the Corporate State in 1935.
14. Compare to the documentation of Python::networkx.pagerank (https://networkx.org/
documentation/networkx-1.7/reference/generated/networkx.algorithms.link analysis.pagerank alg.
pagerank.html).
52

4.3 Innovation and discussion
Configuration to Conviction. Network Structures of Political
Judiciary in the Austrian Corporate State
Authors
Petz, Cindarella, and Pfeffer, Jurgen
In
Social Networks, vol. 66, July 2021, pp. 185–201. DOI: 10.1016/j.socnet.2021.03.001.
Abstract
In this paper, we analyze the extent of political judiciary in the transformed system of
the Corporate State of Austria using the computational methods of a network approach.
We investigate the differences in the legal prosecution of the political opposition, namely
of members of the Communist, Social Democratic and National Socialist parties based
on Vienna as a case study. Based on over 1,800 court records from 1935 processed at
the Viennese provincial courts, we evaluate the courts’ practice in contrast to the offi-
cial legislature during the consolidated phase of the regime. In this study, we examine
whether the law was strategically utilized against specific groups (following the concept
of Kirchheimer’s political lawsuit), and as in the more lenient version of Fraenkel’s ten-
dency justice, we analyze whether the law was disadvantageously interpreted for political
partisanship up to a blatant breach of conduct. Combining quantitative and qualitative
methods with network science approaches, we identify patterns of political prosecution
and structural predispositions for the sentencing of left- and right-wing groups of the
political opposition. We can prove different practices of political judiciary and differ-
entiate between the different treatment of Social Democrats, Communists and National
Socialists in 1935 in Vienna. We identify specialized strategies to prosecute the political
opposition, resulting in a clear bias against left-wing groups and a relative leniency in
the conviction of National Socialists based on the evolution of charges in the courts’ ac-
tions. Using a multimodal network approach, we reveal key players and cooperation of
judges and prosecutors which accounted for harsher sentences. We provide evidence that
the system of control over the judiciary and over the political opposition was already
crumbling in the Austrian capital in 1935, even before the “Anschluss” to NS-Germany
in 1938.
Contribution of thesis author
Theoretical operationalization, computational implementation and analysis, qualitative
evaluation and contextualization, as well as manuscript writing, revision, and edit-
ing.
53

Contents lists available at ScienceDirect
Social Networks
journal homepage: www.elsevier.com/locate/socnet
Configuration to conviction: Network structures of political judiciary in theAustrian Corporate StateCindarella Petz ∗, Jürgen PfefferBavarian School of Public Policy, Technical University of Munich, Richard-Wagner-Str. 1, 80333 Munich, Germany
A R T I C L E I N F O
Keywords:Historical network researchJudicial networksNetwork analysisBig historical dataMixed methodsComputational historyDigital humanities
A B S T R A C T
In this paper, we analyze the extent of political judiciary in the transformed system of the Corporate Stateof Austria using the computational methods of a network approach. We investigate the differences in thelegal prosecution of the political opposition, namely of members of the Communist, Social Democratic andNational Socialist parties based on Vienna as a case study. Based on over 1,800 court records from 1935processed at the Viennese provincial courts, we evaluate the courts’ practice in contrast to the officiallegislature during the consolidated phase of the regime. In this study, we examine whether the law wasstrategically utilized against specific groups (following the concept of Kirchheimer (1965)’s political lawsuit),and as in the more lenient version of Fraenkel (1927/1968)’s tendency justice, we analyze whether the lawwas disadvantageously interpreted for political partisanship up to a blatant breach of conduct. Combiningquantitative and qualitative methods with network science approaches, we identify patterns of politicalprosecution and structural predispositions for the sentencing of left- and right-wing groups of the politicalopposition. We can prove different practices of political judiciary and differentiate between the differenttreatment of Social Democrats, Communists and National Socialists in 1935 in Vienna. We identify specializedstrategies to prosecute the political opposition, resulting in a clear bias against left-wing groups and a relativeleniency in the conviction of National Socialists based on the evolution of charges in the courts’ actions. Usinga multimodal network approach, we reveal key players and cooperation of judges and prosecutors whichaccounted for harsher sentences. We provide evidence that the system of control over the judiciary and overthe political opposition was already crumbling in the Austrian capital in 1935, even before the ‘‘Anschluss" toNS-Germany in 1938.
1. Introduction
The division of politics and the judiciary is one of the foundingprinciples of a democracy (Jesionek, 1995, p. 141). Today, we observeattempts to obstruct this principle all over the world: political agentsintervene in the independence of judges in order to effectively targeta political opposition, or to control the direction of the judiciary. Inearly 2018 the Polish government introduced a law that could forcenon-compliant judges to retire early.1 Hungary used such a transformedjudiciary to prosecute the political opposition (Kingsley, 2018; Novakand Kingsley, 2018) as well. During the recent coronavirus crisis,Hungary’s prime minister assumed power for an unlimited time based
∗ Correspondence to: Richard-Wagner-Str. 1, 80333 Munich, Germany.E-mail address: [email protected] (C. Petz).
1 As of November 2018, the EU pressured the Polish government to reinstate those forcefully retired judges (Day, 2018). This fight re-ignited in early 2020,when the European Court ruled every judge appointed by the Polish government since 2018 as dependent, annulled their judicial decisions (Hassel, 2020), andrecently nullified governmental disciplinary measures imposed on Polish judges (SZ.de/dpa/jsa/bix, 2020) after having first refrained from intervening (Gökkayaet al., 2019).
on emergency decrees — without future checks and balances by Parlia-ment or the judiciary (SZ.de/kit/mati, 2020). The Austrian CorporateState (1933–1938) used to be such an example, too.
Historical background. Founded by the specifications of the Treaty ofSaint-Germain (1919), the Austrian democracy lasted until March 1933,when Chancellor Engelbert Dollfuß took power over the parliamentwith the use of police force in a ‘‘cold coup’’ (Holtmann, 1978, p.166). Gradually, Dollfuß established a dictatorship in Austria by rulingwith emergency decrees, such utilizing a remnant wartime economyaccreditation law of 1917. Dollfuß changed the former republic in theMay Constitution of 1934 as Federal State of Austria, as ‘‘CorporateState’’ (in German Ständestaat) with a distinct Catholic notion. Its
https://doi.org/10.1016/j.socnet.2021.03.001

C. Petz and J. Pfeffer
‘‘austrofascist’’ nature – an Austrian-specific way of fascism, as coinedby Social Democratic contemporaries such as by Otto Bauer, deputychairman of the SDAPÖ (Botz, 1985) – is contested in the litera-ture (Holtmann, 1978; Botz, 1980), and it is considered authoritarian,not totalitarian (Holtmann, 1978, p. 15). This transformation into anautocracy targeted the civil legislature as well as the justice systemitself.
Control over the judiciary. Stressing the need to establish the state’sauthority in the political takeover, then Secretary of Justice KurtSchuschnigg administered the regime’s subsequent gradual restructur-ing of the justice system, the courts, the professional and lay judiciary,and the scope of competence of the police forces. The first victim of thiscontrol was the constitutional court in Vienna, which was dissolvedby Dollfuß on May 23, 1933, thus removing the only instance withthe legal capacity to object to the regime’s emergency decree rule(Neugebauer, 1995a, p. 115; Reiter-Zatloukal, 2012b, pp. 286, 317).
‘‘Judges who confuse politics and jurisprudence need to be re-moved from the judicature’’, proclaimed Kurt Schuschnigg in July1933 (translated from German by the author, quoted in Holtmann,1978, p. 61). Judges were suspected of not behaving in line to thenew directives. These suspicions were based on their German-nationalsympathies, and subsequent anti-communist and partisan National So-cialist sentiments, and more profoundly, anti-state resentments as partof the former empire’s elite that had supported the foundation of‘‘German-Austria’’ in 1918 (Holtmann, 1978, p. 57; Neugebauer, 1995c,p. 319; Stimmer, 1997, pp. 881–3; Mattel, 2007, p. 69; Botz, 1995,pp. 110–1; Neugebauer, 1995b, p. 58; Kann, 1975, p. 155).
In a ‘‘masked claim to power’’ (Holtmann, 1978, p. 56) designednot to oppose the conservative judges and to keep up the appearanceof a seemingly independent judiciary, the regime required every judgeto give an oath of loyalty from May 10, 1933. This slow approach onjudicial control was taken in order to keep good relations with the for-mer Triple Entente, and not to be put on a par with the German Reich’spolicies (Neugebauer, 1995b, pp. 52–3). While in the May Constitution,articles 100 to 102 regulated the non-transferability2 and independenceof judges as a cornerstone of an independent judiciary, these passageswere overthrown in the Corporate State’s Verfassungsübergangsgesetz ofJune 19, 1934 (Neugebauer, 1995b, 56). After having at first suspendedthe judge’s permanency and non-transferability for only one year inearly February, the professional judiciary’s independence was finallydissolved permanently in order to ‘‘preserve the authority of the Stateand the well regard of the jurisdiction’’ (translated from German by theauthor, quoted in Neugebauer, 1995b, p. 53; Tálos, 2013, p. 277; Holt-mann, 1978, pp. 62–3, 110-11; Neugebauer, 1995a, p. 118). The civilunrest of February and July 1934 had made the need for exertingcontrol over the ordinary courts to prevail over any reservations aboutthe international regard.(Neugebauer, 1995a, p. 118). Henceforward,the Department of Justice would regulate the allocation of duties andpersonal of the judiciary. This allowed the regime to replace judges eas-ily in order to react to ‘‘changing needs in the allocation of individualsenates or divisions within the same courts’’ (translated from Germanby the author, quoted in Neugebauer, 1995b, p. 54).
The lay judiciary was mistrusted, too. The regime suspected layjudiciary of being supported by and supportive of Social Democrats,as the regulation of laymen nomination used to be proportional toparty representation. The lay judiciary was relegated to an outside roleby mid-1934 (Holtmann, 1978, pp. 56–58; Reiter-Zatloukal, 2012b,pp. 311–12 ; Neugebauer, 1995a, p. 115).
In parallel, the regime established a system of police justice by1934 assigned with virtual judicial functions, which would ensurefaster prosecution, by-passing the traditional judiciary in furtheranceof ‘‘immediate atonement and deterrence’’ (translated from German by
2 Judges are not to be removed from office nor transferred.
the author, quoted in Holtmann, 1978, p. 59, see also p. 50; Reiter-Zatloukal, 2012b, p. 307). This intended effect was not always suc-cessful. Reiter-Zatloukal (2012b, p. 317) stressed the more experimen-tal than consistently planned nature of police policy; other scholarspointed out the ambivalent position of the police towards the regime,too, favoring National Socialist groups (Rivo, 2011, pp. 13, 34; Kann,1975, p. 155; Jedlicka, 1975, p. 158).
Political repression. The regime restricted various forms of politicalexpression, among them the civil right to gather and to strike, thefreedom of political expression (Reiter-Zatloukal, 2012b, pp. 272–4),and introduced preventive censorship (Duchkowitsch, 1995, p. 568).In parallel the regime encouraged state prosecutors to tighten inquiriesfor prosecution (Holtmann, 1975b, p. 45). Simultaneously, the treat-ment of the political opposition grew more repressive and resultedin the legal abolishment of the opposition’s political groups (Reiter-Zatloukal, 2012c, p. 61): the Communist Party KPÖ as early as inMay 1933, the Social Democratic Party SDAPÖ in February 1934after the civil fights, rendering Social Democratic political engage-ment illegal retroactively (Reiter-Zatloukal, 2012b, p. 338). In February1934, Schuschnigg proclaimed a state of emergency facing civil un-rest (‘‘Staatsnotstand’’, Holtmann, 1978, p. 96). New repressive lawswere introduced, such as the aggravation of criminal law, the far-reaching confiscations of property, the introduction of martial law andthe death penalty for the insurgents (Holtmann, 1978, p. 132; Neuge-bauer, 1995b, pp. 116–7); also new crimes were created in penallaw.3 These served to criminalize, prosecute and harshly punish anyperceived enemies of the regime under the guise of retaining public se-curity (Reiter-Zatloukal, 2012c; Neugebauer, 1995a; Reiter-Zatloukal,2012b; Schölnberger, 2012; Tálos, 2013; Rothländer, 2012b). The in-creasingly violent National Socialist groups were only prohibited inJuly 1934 after their failed putsch attempt but successful assassinationof Chancellor Dollfuß.
Uncovered areas. Holtmann’s doctoral thesis (1978) on the prosecu-tion of the workers’ movement, and the more recent research conductedby Reiter-Zatloukal (2012c) and Neugebauer (1995a) on repressivepolitics, among others, brought to notice political judiciary practicesduring the authoritative rule of Chancellor Engelbert Dollfuß (1933–1934) and his successor Kurt Schuschnigg (1934–1938). Previous stud-ies refrain, with rare exceptions,4 from a quantitative analysis. Instead,they have focused on a qualitative evaluation of the approaches of theregime to take control over the judiciary and the police, as well as legalframeworks of judicial prosecution against the political opposition andthe early year’s show trials (Reiter-Zatloukal, 2012a,b, 2013; Neuge-bauer, 1995c,a), on class justice against left-wing groups (Holtmann,1978), the system of detention camps (Schölnberger, 2012), proprietaryconfiscations (Rothländer, 2012b), and more generally on the originsof National Socialist engagement in Austria (Rothländer, 2012a; Botz,1980; Rivo, 2011) leading to the ‘‘Anschluss’’ in 1938. They showedqualitatively the legal prerequisites and political agenda of the Cor-porate State in order to control and prosecute citizens based on theirpolitical activities.
Missing are studies on the quantitative aspects of political repres-sion, as well as on the actual legal practices outside the early andlate period of the Corporate State.5 A research project conducted atUniversity of Vienna by Wenninger et al. (2017) addressed this lack,
3 Among them: disturbance of public tranquility, death sentences, doublejeopardy, and permanent preventive internment.
4 Such as Botz (1995), who analyzed the relationship of politics with thejudiciary in the First Republic with regard to violent crimes, but used a tinysample. Also, the dissertation by Bauer (2001) focused in a quantitative wayon the social structure of the July Putsch.
5 Neugebauer (1995a) broad qualitative study of the whole period does notmention the sentence practice in 1935, except for the ‘‘Schutzbundprozess’’ inApril 1935.

C. Petz and J. Pfeffer
and collected empirical data on politically motivated court cases witha focus on Viennese courts in 1935, which is the data foundation forthis paper’s analysis. The analysis of political judiciary in the AustrianCorporate State with means of modern technological advances andqualitative knowledge is a void that this paper aims to fill.
This paper situates itself in regards to the computational method-ology employed by the Digital Humanities using historical networkanalysis. More formalized quantitative network methods are applied inthis field recently in order to study complex historical dependencies,and to identify patterns of interaction, such as on networks in Modernhistory such as by Düring (2015) or von Keyserlingk-Rehbein (2018). Inanother strand, legal studies use network approaches to study judicialdecisions (such as Clark and Lauderdale, 2012) or internal and externalorganizational effects of courts (such as Shomade and Hartley, 2010;Box-Steffensmeier and Christenson, 2014). A project bridging legalstudies and social history are the Old Bailey Record project (Emsleyet al., 2012), in which close to 200,000 court trials in London fromthe 17th to the 19th century were analyzed applying text miningapproaches (Hitchcock, 2013; Graham et al., 2016).
In this paper, we analyze the extent of political judiciary in thetransformed system of the Corporate State in Vienna during the calmerand more consolidated period of the regime in 1935. The civil unrestof the prior year had passed, as well as the major legislature changeshad taken effect. We investigate the legal prosecution of the politicalopposition, namely of members of the Communist, Social Democraticand National Socialist parties in Austria. Based on over 1,800 courtcases from 1935 tried at the Viennese provincial courts, we evaluatehow the courts’ applied the legislation originating from times of distressand the need for preservation of power in the much calmer period of1935. Our main research question is: Were there differences evident inhow the political opposition was prosecuted? Based on over 1,800 courtcases, the contributions of this paper are the following:
• We analyze penal practice applied to Social Democrats, NationalSocialists and Communists, identifying patterns of prosecutionand structures of conviction.
• We identify structural predispositions in trials relevant to theprosecution, conviction, or acquittal, analyzing co-occurrencenetworks of inquiries, charges, and delicts of conviction.
• We identify key players and cooperation of actors, who stood outin the sentencing of particular political groups, based on a socialnetwork of judges and prosecutors.
This paper is organized as follows: in Section 2, we operationalizedifferent forms of political judiciary, and describe the data. There, weintroduce clustered graphs as fingerprint of each political groups’ cases.Section 3 is devoted to the analysis of prosecution and penalties ofpolitical groups, and of co-occurrence networks of charges and keyplayers, the results of which we juxtapose to the assumptions in theliterature. Finally, we address limitations of working with historicaldata and discuss in Section 5 this study’s conclusions on the systemof political judiciary in the consolidated phase of the Corporate State.
2. Data and method
2.1. Data description
The data for this study was collected by a research project onpolitical repression during the Corporate State coordinated by Wen-ninger et al. (2017). Between 2015 and 2017, this project created anunpublished database on over 1,800 suspects’ case files tried beforethe Viennese provincial courts I and II. They collected and transcribedarchival case records featuring political charges of the year 1935 fromthe municipal and provincial archives of Vienna, as well as the archive
of the Viennese provincial courts for criminal cases.6 The databaseconsists of court records tried before the provincial courts I (LGSt I)and II (LGSt II) of Vienna, with the exception of 8 records that weretransferred from other courts to LGSt I or II, to be either re-tried there,7or to open prosecution in Vienna instead before a sentence was derivedin the other court.8 The only differences between LGStI and LGStIIwere in their jurisdiction over different quarters within Vienna: LGSt I,located in the infamous ‘‘gray house’’, attended to the Viennese districts1 to 12, 16, 17, and 20, while LGSt II dealt with the remaining districtsand the surrounding commuter belt of Vienna (compare to Waldstätten,2012; Bundesministerium für Justiz, 2009).
The archival case files include information on:
• The cognizant jurisdiction authority, the respective province,where the offense had occurred, and the initial subject-mattersof investigation by the police against the suspect (henceforwardreferenced as inquiries);
• In prosecution cases, the charges brought forward by the pros-ecutor against the suspect, the names of the prosecutor andjudges leading the prosecution, and if existent, the defender andwitnesses approved by the court;
• In criminal conviction cases, the verdict given by the judges withthe delicts the defendant was convicted of (henceforward: delictsof conviction), the date of conviction, the kind of punishment(detention for a certain period, possible mode fees), and the dateof incarceration, and possibly of the release,
• And miscellaneous information, such as added letters.
The database of Wenninger et al. (2017) added, among other things,unique case IDs, source origins, and the duration of the imprisonment,as well as personal information on the involved persons.
As we use court proceedings as base, we have to be aware ofcontext bias. Schwerhoff (2011) rightly noted that court-documents areinvoluntary ego-documents, and as such the courts, the judiciaries, andthe police have a specific and non-objective worldview imposed ontheir defendants and cases. Therefore, we can make inferences only onthe view on the suspects’ punishable oppositional behavior as presentedby the records of the courts. As such any findings necessarily reflect theview of the courts.
Based on the strict Austrian privacy laws for archival data, we usedunique and anonymous identifiers for every person in the database,which can be translated back if needed. For analysis, we focused onthe following categories of political orientation: Communists, SocialDemocrats, National Socialists, and a container category for miscel-laneous memberships such as in religious or loyalist groups, and one
6 As such, there is of course a selection bias in the transmission of records.The case files were pre-selected in 1980 by the Institute for ContemporaryHistory at the University of Vienna, which assessed 10,057 case files anddiscarded them until 3,000 remained today (Wenninger et al., 2017). Unfor-tunately, neither lists about these discarded records nor information on theremoval criteria exist anymore. It is very likely that disproportionately highamounts of political actions survived. The research project at the Universityof Vienna on political repression (2015–2017) identified 1,836 cases, whichapply to the above-mentioned definitions of political actions (Wenninger et al.,2017). The focus on mentions of political orientation and politically-chargedaccusations falls short, on the one hand, on political agitators, who could havebeen charged with something non-political and whose consecutive trial did notmention their affiliation. On the other hand, there is little reason to believethat the regime would mask their intent to prosecute a political orientation sothat it could have the intended deterrence effect.
7 As in the case of the investigation against nine members of the NSDAPat Kreisgericht Steyr, of whom six were sentenced in January 1935 in Steyr.Of the remaining three, who were not prosecuted then, one was accused andconvicted of illegal membership in a secret organization, and imprisoned for14 days with mitigated punishment.
8 As in the case of two National Socialists transferred from BH Tulln to LGVienna II, and sentenced for ‘‘Aufwiegelung’’ and ‘‘Agitation’’.

C. Petz and J. Pfeffer
for unknown political orientation. We derived to these categories bymapping the actual group membership recorded in the database toone of these categories, e.g. members of the Wachtturmgesellschaft ofJehovah’s Witnesses as ‘‘religious’’, the SDAPÖ and Schutzbund as‘‘Social Democrats’’, or the Revolutionary Socialists as ‘‘Communists’’.9
To translate all charges in the documents, we used the then mostrecent version of the criminal law edition (Tlapek, 1933), and supple-mented it with the then relevant legal updates published in the Bundes-gesetzblatt preserved by the Österreichische Nationalbibliothek. Austrianpenal law of 1935 recognized different forms of anti-state disruptions,such as riots, insurrections, public disruption, gatherings, incitement,and ‘‘Agitation’’, which differentiated between violent and non-violentassemblies and gatherings which resisted against State power. Manyof these had only been recently introduced by the Dollfuß-Schuschniggregime. We left them untranslated in order to preserve their unique con-notations, but gave an interpretation each. Then, we grouped offensesbased on content, i.e. the group of high treason (§58–61) consistingof §58 defining high treason, §59 its punishment, §60 punishing themisprision to prevent high treason, and §61 the respective punishment.Additionally, we grouped scam, embezzlement and theft as monetaryoffenses, as well as murder and homicide as homicidal offenses.
The database is focusing on Vienna. During the Corporate State,Vienna was the only mega city in Austria, and in 1934 was home to1.9 Mio of 6.7 Mio of the total population in Austria (Statistik Austria,2015). With the new constitution of 1934, Vienna lost its status ofBundeshauptstaat and its independence as Bundesland; instead it wasreorganized as bundesunmittelbare Stadt in the course of centraliza-tion (compare to the May constitution of 1934 as in Kimmel, 1936,p. 95), but remained the political center of Austria (Suttner, 2017, pp.23, 47). Therefore, it is reasonable to assume the pivotal role of Viennaduring the Corporate State, and the focus of analysis of the de factocapitol of the Dollfuß-Schuschnigg regime.
The dataset encompasses 1,836 individual cases in 549 group trialsinvestigated by the police on 1,521 suspects at LGSt I and LGSt II ofVienna,10 and their inquiries, charges, and delicts of conviction, andpunishments. Within a subsample of 490 cases, the database records ad-ditional information on the court personnel in 204 cases with verdicts:the judges, prosecutors, defenders, and witnesses involved in each case.
315 individuals were the subject of more than one inquiry, 259 ofthem were investigated twice, and 21 three times. Three individualswere investigated four,11 five,12 and eight times13 21 defendants weresentenced twice; the highest rate of four sentences was imposed on anambassador of the Yehovah’s Witnesses.
Communism, Social Democracy and National Socialism cover 91%of all suspects’ political orientations. There are no prominent cases orshow trials; instead, these processes represent the day-to-day businessin court.
We interpret these court trials as multimodal networks. The maininformation of an exemplary single case are shown on the right inFig. 1. This case’s suspect was a twenty year old metalworker and mem-ber of the Socialist Youth, who was accused of forbidden gathering, ofdiscrimination against the administration and general societal values,and of spreading rumors. This defendant was sentenced in June 1935
9 There are some instances, when individuals were recorded with multiplememberships, which we mapped into one political orientation only, e.g. ifthe database records for a defendant a membership in the Social DemocraticRepublican Schutzbund and in the Communist party, we picked the more’pronounced’ partisanship, and coded this person accordingly as ‘‘Communist’’.
10 Of these 21 defendants in 8 group trials had been either investigated ortried in other courts, and their records were transferred for re-trial in Vienna.
11 A tenured professor at the Anthropological Institute in Vienna and editorof the Austrian Journal for Racial Studies.
12 A vice-mayor of Vienna.13 An ambassador of the Yehovah’s Witnesses, who later emigrated to
Switzerland.
for the discrimination charges, and imprisoned until June 1936. Thiscase was part of a group trial alongside fifteen other accused SocialDemocrats, who were charged with individually tailored offenses.
Viewing court trials as networks allows us to draw relations betweendifferent types of nodes, and to analyze their structures quantitativelyusing a network research methodology. As the court trials offer diversepieces of information, for analysis we have to focus on certain attributesof these cases. Fig. 1 shows a sample network of 206 cases with verdictsin 88 group trials, featuring judges, prosecutors, and suspects of variouspolitical orientation only. This allows us to make inferences on theirrelations based on different interpretations of connections, e.g. as hereedges represent convictions. For analysis, we assume that all casesin the relatively short time-frame of 1935 were tried close together,and were heard in parallel. Therefore we treat court personnel thatco-occurred in other cases as ’’knowing’’ each other based on themworking together.
In order to explore the dataset, we used the clustered graph ap-proach (Brandes et al., 2008; Lubbers et al., 2010) to give an overviewon the characteristics of cases against defendants of the main groupsof the political opposition, namely Social Democrats, Communists, andNational Socialists. We interpreted each defendant’s case as ego, andthe information of the case as alteri within the following six caseattributes (henceforward referred to as ‘‘classes’’): the judges bench,the prosecutor bench, the witnesses’ bench, the inquiries of the police,the charges by the prosecutor, and the delicts of conviction by thejudiciary. We aggregated the average amount of elements in each alterclass, which is reflected in the node size. The shade of each alter classreflects their aggregated ratio of co-occurrence. Here, we differentiatedbetween inter-class co-occurrences and within-class co-occurrence. Thewithin-class co-occurrence shows how many elements of the attributeappeared together in other cases as well. In the visualization, the shadeof the node shows the average of this relative co-occurrence within eachclass. The inter-class co-occurrence shows whether e.g. one judge ofthe judges bench appeared together with a witness in another case,attributing to the case a 0 (no co-occurrence) or a 1 (at least oneco-occurrence to another class of alteri).14 For the visualization, weaveraged the aggregated inter-class co-occurrence represented as theshade of edges.
We thus constructed an average case for each main group of thepolitical opposition. In Fig. 2, Social Democrats and Communists sharea very similar profile. There are gradual differences in the Communists’graph in the much higher average and higher inter-class co-occurrencerate of witnesses, and a slightly less inter-class co-occurrence for judgesand delicts of convictions. The high inter-class co-occurrence for thelevels of inquiries display a very homogeneous accusation structureof the same charges. In contrast to the left-wing groups, the NationalSocialists’ graph shows an average of two judges, who only occasion-ally worked together on cases. The lower inter-class co-occurrence ofinquiries suggests that National Socialists were not charged for morediverse crimes, but surprisingly got inquired by the police and wereconvicted by the judiciary for very similar offenses throughout thedataset. All political groups only had one prosecutor.
The clustered graphs show visual differences in the co-occurrencenetworks of the political defendants: each group has their own distinct‘‘fingerprint’’ structural characteristics.
14 Computation of density punishes the amount of people involved: If thereare three judges and three witnesses and each judge knew one other witnessfrom other cases, it would be three co-occurrences out of nine possibleones, therefore a co-occurrence ratio of 33%. While in reality, it is of moreimportance if there is a connection at all, which could be the defining momentwhether the defendant would be convicted or not. As we were more interestedin whether there was an overlap within these classes, we used a binarydefinition of co-occurrence: 1 if there was any co-occurrence, 0 if there wasnone.

C. Petz and J. Pfeffer
Fig. 1. Figure of a multimodal sample network of 88 court proceedings, featuring 201 defendants in 204 cases with verdicts, 55 judges and 27 prosecutors. An edge equals aconviction. On the right: Figure focusing on one defendant in a random single case’s court trial interpreted as a network. The suspect shown here was a twenty year old metalworker and member of the Socialist Youth, who was – individually charged alongside fifteen others – accused of forbidden gathering, discrimination against the administrationand general societal values, and of spreading rumors. The suspect was sentenced in June 1935 due to the discrimination charges, and was imprisoned until June 1936. Layoutalgorithm used: Fruchterman-Rheingold in R::igraph..
Fig. 2. Clustered graphs of convicted members of political groups. Node size shows the average amount of elements within each graph’s attributes’ class.
2.2. Operationalization of political judiciary
We operationalized political judiciary for analysis two-fold accord-ing to the definition given by Kirchheimer’s political judiciary and po-litical lawsuit (1955/1964, 1965), supplemented by Fraenkel’s conceptof tendency justice (1927/1968).
In his fundamental work on politically influenced judiciaries, Kirch-heimer (1955/1964, 1965) defined political judiciary as justice and thejudicial system serving political purposes. We saw evidence for thisalready in the legal foundations for prosecution of oppositional parti-sanship as described above. Kirchheimer (1965, pp. 80–1) specified apolitically influenced legal practice as political lawsuit, which he charac-terized as the weaponization of the law against an opposition. Fraenkel(1927/1968, pp. 36–7) coined the same concept as tendency justice,
while stressing that even pre-existing laws could be disadvantageouslyapplied against specific groups in order to serve a political purpose.15
In the literature, there is some disagreement on the definition ofpolitical judiciary. Holtmann reinterpreted the concept of tendencyjustice in the sense of Kirchheimer’s political lawsuit and stressed its mo-mentum of deterrence (compare Holtmann, 1978, p. 57). Broader defi-nitions of political judiciary are very common, which include any con-nections between the judiciary and politics (Hannover and Hannover-Drück, 1987, p. 13). These broad definitions are usually applied in the
15 Fraenkel thought of political judiciary as the influence on the dispensationof justice by the judges’ own political beliefs and the ‘‘interests and ideologiesof a ruling class’’, which we could not include in this study.

C. Petz and J. Pfeffer
Table 1Table of cases on the frequency of prosecution, and the respective group percentagesand standard residuals. Roughly 42% of police inquiries against political groups werebrought to trial, but there is not significant bias evident against a singular group.
n No Trial Trial
All suspects 1836 1076 760–Group Percentage 1.00 0.59 0.41
Political Groups 1,673 971 702–Group Percentage 0.91 0.58 0.42 (−0.96)
National Socialists 836 504 332–Group Percentage (St.Res.) 0.46 0.60 (0.86) 0.40 (−0.96)Left-wing Groups 837 467 370–Group Percentage (St.Res.) 0.46 0.56 (−0.81) 0.44 (1.01)
Communists 456 242 214–Group Percentage (St.Res.) 0.25 0.53 (−1.35) 0.47 (1.66)Social Democrats 381 225 156–Group Percentage (St.Res.) 0.21 0.59 (0.26) 0.41 (−0.23)
literature on Austrian legal history, or not defined at all while implic-itly assuming a connection between political influences and juridicaldecisions as political judiciary (compare e.g. Neugebauer, 1995a).
In this study, we examined whether the law was strategically uti-lized against specific groups (Kirchheimer’s political lawsuit) and asin the more lenient version of Fraenkel’s tendency justice, we ana-lyzed whether the law was disadvantageously interpreted for specificpartisanship up to a blatant breach of judicial conduct.
Hence, in biases against the political opposition, we investigatedthe usage of certain charges for particular groups. We tested for sys-tematic predispositions, such as tandems of judges and prosecutors,and their possible individual predispositions leading to more or harsherconvictions. Thus we use a mixed methods approach in supplementingquantitative and qualitative methods to analyze practices of politicaljudiciary in the provincial courts of Vienna in 1935.
3. Analysis
In order to make inferences with regard to differences in the pros-ecution of the political opposition, we first investigated possible biasesagainst oppositional partisanship. Was a political group unfavorably triedin the dataset?
3.1. Prosecution and conviction rates
In the frequencies of their prosecution, we found no significantevidence of a bias against a singular group in the sense of Fraenkel(1927/1968)’s tendency justice (compare Table 1). Instead, the left-winggroups of Communists and Social Democrats and the right-wing groupwere relatively evenly prosecuted, and even similarly in size.16 Therewas a slightly higher tendency of Communists to be tried at 47%,constituting an above average prosecution in comparison to the totalof 41% of prosecuted suspects. However, we did not see significantstandard residuals.
The conviction rates in cases with prosecution revealed a cleartendency to sentencing (see Table 2). Consistently over the three biggroups, 87% were found guilty if a trial commenced, even though theproportion for a Social Democrat’s conviction was higher than for anyother group. Over the whole dataset, if a defendant was tried in court,this meant an 83% chance of being sentenced to imprisonment (or, ifconvicted, 96% were imprisoned). There is some difference from analmost 100% incarceration rate for convicted National Socialists and
16 However, the courts tended to treat leftist print works of Social Demo-cratic members as being of Communists, leading to an fluent attributionof Social Democratic and Communist membership. This is another factor tocombine both partisanships in the left-wing group in the subsequent analyses.
Table 2Table of the frequency of acquittals and convictions in verdicts, and the respectivegroup percentages and standard residuals. Roughly 87% of cases would result in aconviction.
Trial Acquittal Conviction
All suspects 760 99 661–Group Percentage 1.0 0.13 0.87
Political Groups 702 90 612–Group Percentage 0.92 0.13 0.87
National Socialists 332 41 291–Group Percentage (St.Res.) 0.44 0.12 (−0.15) 0.88 (0.11)Left-wing 370 49 321–Group Percentage (St.Res.) 0.48 0.13 (0.29) 0.87 (−0.05)
Communists 214 37 177–Group Percentage (St.Res.) 0.28 0.17 (1.92) 0.83 (−0.65)Social Democrats 156 12 144–Group Percentage (St.Res.) 0.20 0.08 (−1.78) 0.92 (0.68)
Table 3Table of the frequency of incarcerations in convictions, and the respective grouppercentages and standard residuals. A conviction meant a prison sentence in 97% ofcases of political groups. Some variation between a 100% incarceration rate of NationalSocialists vs. a 88% incarceration rate in Social Democrats.
Conviction No Prisona Prisona
All suspects 661 38 636–Group Percentage 1.0 0.06 0.96
Political Groups 612 31 594–Group Percentage 0.93 0.05 0.97
National Socialists 291 0 291–Group Percentage (St.Res.) 0.44 0.0 (−3.7) 1.0 (0.90)Left-wing 321 31 303–Group Percentage (St.Res.) 0.49 0.01 (3.75) 0.94 (−0.78)
Communists 177 10 176–Group Percentage (St.Res.) 0.27 0.06 (0.33) 0.99 (0.0)Social Democrats 144 21 127–Group Percentage (St.Res.) 0.22 0.15 (5.29) 0.88 (−1.09)
aNote that an incarceration verdict could be combined with a monetary penalty;Therefore, these columns do not necessarily add up to 100.
Table 4Table of average prison sentence lengths (in days) in convictions. While right- and left-wing groups were convicted in a similar number of trials, National Socialist defendantswere, on average, sentenced to 160 days less than left-wing defendants.
Mean St.Error
All suspects 306.9 (15.1)
Political Groups 320.8 (15.9)
National Socialists 239.6 (10.9)Left-wing 399.6 (28.7)
Communists 376.6 (31.53)Social Democrats 430.1 (52.5)
Communists, and a 12-point lower one for convicted Social Democrats(see Table 3). This observation might be connected to the type ofoffenses specified against the right- and left-wing groups, as will beshown later.
3.2. Prison sentence lengths
In order to evaluate the differences within these prosecution fre-quencies, which seemed to imprison National Socialists slightly morefrequently than left-wing groups, we examined their lengths of im-prisonment (see Table 4). Comparing the left-wing and right-winggroups of similar sizes, a clear bias against left-wing groups becomesevident in the differences of absolute sentencing. Social Democratsand Communists were sentenced to over a year of incarceration onaverage. The particularly high standard errors for Social Democrats

C. Petz and J. Pfeffer
Fig. 3. Histogram of prison sentence lengths of political groups in log365 on the x-Axis (In order to increase readability, we marked Social Democrats in blue). NationalSocialists were mostly sentenced up to one-year of incarceration, while left-wing groupsreceived much more extreme sentences, resulting in a much higher average. A t-testrevealed significant differences between the sentence lengths of left- and right-winggroups. (For interpretation of the references to colour in this figure legend, the readeris referred to the web version of this article.)
suggest a very widespread distribution of sentences. By contrast, Na-tional Socialists were convicted in the almost same amount of cases,but received on average a prison sentence of 160 days less than theleft-wing groups. A t-test revealed these differences in sentence lengthsbetween left- and right-wing groups to be significant (t=5.1, p<0.001).These differences are the result of the circumstance that Communistsand Social Democrats received much more extreme sentences withup to 10-year prison sentences, thus increasing their average, whichNational Socialists’ convictions were missing. Fig. 3 shows a relativelyhomogeneous sentence distribution for National Socialists, who re-ceived most frequently sentences of up to one-year of incarceration.Up until this range, the sentences of Communists and Social Democratswere more lenient, but beyond that showed the most extreme sentencelengths. The lower average of sentence lengths over the whole dataset(306.9 days) suggests a more lenient imprisonment of the other suspectsgroups, too, in comparison to the left-wing groups (399.6 days).
We tested whether these differences were statistically significant forNational Socialists’, Communists’ and Social Democrats’ cases at courtusing a 𝜒2-test, employing a significance level of 0.05. For the dataset of1935, we found significant differences between political partisans basedon the tests of whether the defendant was brought to trial or not (𝜒2 =6.5, DoF = 2, p = 0.03), and whether the defendant was convicted oracquitted (𝜒2 = 7.5, DoF = 2, p = 0.02). Very significant results showedthe test on prison or no prison sentences in the convictions dependenton political partisanship (𝜒2 = 41.9, DoF = 2, p<0.001).
The parity of Social Democrat’s and Communist’s sentence lengthsis more remarkable when attribution is implicated: The courts con-sidered left-wing printed works as Communist, which were some ofthe most frequent offenses for Communists (around 15%). Therefore,Social Democrats, who published those printed works, were more likelytreated as Communists, too. Thus, the courts (and as such the database)had a bias for an over-attribution to Communism. The political at-tribution represented the view of the courts, and not necessarily theindividually perceived political orientation of the defendant. Still, theaverage length of sentences are very similar between Communists andSocial Democrats, which indicates that there was no real differencebetween those two groups in the eyes of the courts.
In general, Communists were almost always imprisoned if con-victed, but in absolute numbers Social Democrats received the mostextreme sentences. This does not mean that National Socialists gotlenient sentences in general. In fact, up to the one-year sentencemark, they had very similar absolute sentence lengths compared to theleft-wing groups, and even more one-year sentences than they did.
3.3. Proportionality of sentences
While the absolute lengths and frequencies of sentences can beconsidered rather high, we investigated next whether these sentencescan be viewed as severe in the eyes of the contemporary penal law.Therefore, we established the proportionality of sentences to the officialdegree of penalty for offenses as regulated in penal law. This allows usto analyze the question, if there was an a priori harsher conviction ofdefendants based on their political orientation, following Kirchheimer(1965)’s concept of political judiciary as operationalized above.
The proportionality of convictions is difficult to measure, as inpenal law the degree of penalty varied greatly from, e.g. a minimumdegree of penalty (henceforward: lower limit) of 6 months, to anupper degree of penalty (upper limit) of 1 year of incarceration withan optional aggravated degree of penalty (aggravated limit) of upto 5 years, as for the offense of deceiving, facilitating, or hiding acrime (§214, see Tlapek, 1933). The final sentence was a compositeof the individual degree of penalties for each charge, which by codeof conduct could be based on either the principle of absorption (inGerman Absorptionsprinzip), or the principle of aggravation (in GermanAsperationsprinzip). The principle of absorption sought to apply theindividually most harsh penalty from all the accused offenses, butthe penalty would not add up to the sum of each individual offense.The principle of aggravation regulated a cumulative sentence in casesof many delicts, but again would not reach the summed degree ofpenalty for each individual offense either.17 The principle of absorptionis named oftentimes in the convictions. But as in case no. 1888 or 1859,a one-year incarceration was sentenced, whereas the individual degreeswould not have exceeded 6 months. Therefore, the degrees were added,and both absorption and aggravation principle ignored, and insteadan extra-legal accumulated punishment used. This constitutes one ofthe breach of law concepts that Fraenkel (1927/1968) theorized astendency justice. Did the courts decide to sentence more harshly thanusual in these two exemplary cases, or can this be considered commonpractice in the courts? As penal law did not regulate for every offensean aggravated, upper and lower limit for degree of penalty, we replacedmissing limits with one level down, e.g. the missing aggravated limitwith the existent upper limit, so that aggravated limit ≥ upper limit ≥lower limit.
Sentencing based on principle of aggravation. To test the proportional-ity of sentences in terms of the principle of aggravation, for each case,we summed all its offenses all lower limits of punishment, all upperlimits, and all aggravated limits, and compared the sentence length ofthe case’s verdict to these penalty limits’ boundaries. In Table 5, weevaluated whether the prison sentence in a trial reached the summedpunishment of the individual offense’s penalty limits of a case’s delicts.According to the principle of aggravation, the sentence would have tobe lower than the summed penalty of each offense.
Around 92% of defendants were sentenced below the upper limitof the summed penalties for each case’s charges, in which SocialDemocrats peaked with 98% of cases. The Social Democrats wereconvicted most coherently within this legal prerequisite: 51% were con-victed within (and including the lower) and the upper penalty limits,and 2% within the upper and aggravated penalties. Social Democratsreached neither the summed penalty of the upper nor the aggravated
17 This paragraph did not change until today, except its number from §28to §22 (JUSLINE Österreich, 2020).

C. Petz and J. Pfeffer
Table 5Table showing the principle of aggravation in cases with prison sentences and delictswith penalty limits. Did the sentences reach the summed penalty of each offense’spenalty limits in a case? Abbreviations: L = Lower Limit, U = Upper Limit, A =Aggravated Limit of Applicable Penalty.
n <L =L L<U =U >U (noA) U<A =A >A
All suspects 504 0.47 0.09 0.35 0.03 0.03 0.02 0.01 0.01
Political Groups 467 0.46 0.1 0.36 0.02 0.03 0.02 0.01 0.004
National Socialists 212 0.42 0.14 0.33 0.04 0.05 0.01 0.005 0.0Left-wing 255 0.50 0.06 0.37 0.01 0.01 0.03 0.02 0.01
Communists 144 0.53 0.06 0.31 0.01 0.01 0.03 0.03 0.01Social Democrats 111 0.46 0.05 0.46 0.0 0.01 0.02 0.0 0.0
limit. National Socialists had the highest value (4%) for sentences ofthe accumulated upper limit, and Communists with 3% for sentences ofthe accumulated aggravated limit, which according to the principle ofaggravation would not be legal. The 1% of Communists with sentencesabove the accumulated aggravated limits, and 5% of National Socialistsabove the accumulated upper limits (as well as for Communists andSocial Democrats of 1% each) constituted breach of law as well. Theextremely high percentage of sentences below the accumulated lowerlimit of penalty suggests that the principle of absorption was notapplied commonly by the Viennese courts. These results contradictthe scholarship’s assessment of a common cumulative sentencing inthe Austrian courts during the Corporate State (Neugebauer 1995a, p.119; Reiter-Zatloukal 2012c, p. 75). In the consolidated phase of theregime, we cannot assume that accumulated sentences were commonpractice. Instead, we see some evidence for an excessive punishmentbeyond the limits of the law when applying the principle of aggrava-tion, which focused on the Communist political group, as well as onNational Socialists.
Sentencing according to principle of absorption. In Table 6, we ana-lyzed the application of the principle of absorption, in which the delictwith the harshest penalty limits would constitute the sentence.
Here, National Socialists received with 83% most of the sentencesbelow the upper limit of a single delict’s penalty, whereas SocialDemocrats and Communists the least in this category (68% and 74%,respectively). An interesting observation is also that Communists re-ceived by far the most sentences outside the aggravated limit (6%),as well as a notable 5% of National Socialist member cases outsidethe upper limit of penalty, which both constitute a breach of conductbased on the principle of absorption. For Social Democrats, a drastichigh number of 19% of cases received the exact aggravated penaltylimit (6% National Socialists, and 9% Communists). Again, the largenumber of sentences of below the highest single lower limit of penaltyare noteworthy (around 29%), and highest for Communists (34%). Thiswould mean that in general, sentences would not exceed the possibleharshest penalty for an offense, but in fact would go much below that.
3.4. Interim conclusions I
We can already summarize that the Viennese courts (and as such theregime) prosecuted left- and right-wing groups in equal numbers, whichmarked a new line of policy since the regimes’ focus in the previousyear on the left after the February Fights and then on the right afterthe July putsch (Holtmann 1978, p. 144; Neugebauer 1995a, p. 118).We were able to show that there were only slight differences in theirprosecution: Communists had a higher likelihood for a trial opening anda higher acquittal probability, but also a close to a 100% imprisonmentrate, as did National Socialists. Over all political groups, when a trialcommenced (in more than 40% of police inquiries), political defendantswere most of the time found guilty (87%), and imprisoned (97%).
We saw clear signs for bias against left-wing groups in the verdicts,who received the most extreme prison sentence lengths.
When evaluating the proportionality of prison sentences, we couldshow that the verdicts were usually not extreme according to thespecifications of law. The courts did not seem to insist on deterrenceeffects and refrained from extreme sentences, as the legal range ofpenalty, with few exceptions, was not exploited to the fullest (andin roughly a third of cases was even below the lower individualpenalty limits). Death penalties, which had remained a legal option forhigh treason, for example, were not issued anymore either. Scholar-ship indicated that with the end of the prominent ‘‘Schutzbundprozess’’of April 1935 (which was investigated by late 1934, and does notappear in our dataset) marked also the end of the policy of compur-gation justice (German Rechtfertigungsjustiz) and preventive disciplineof the regime (Holtmann 1978, pp. 144–6, 150; Neugebauer 1995a, p.117; Neugebauer 1995b, p. 56). This comports with our observationhere.
Aside from the court’s refrainment from extreme exploitation ofpenalty ranges, the sentence range limits were severe nonetheless. New,excessive offenses were still introduced in February 1935 so that diver-gent press and printing works could be prosecuted as ‘‘anti-state’’ withup to one year of incarceration, and if they were of ‘‘high-treacherouscharacter’’, with up to 5 years, which were designed to destroy thenewly formed left underground movement Holtmann (1978, pp. 148–9). We should also stress the fact that a judicial conviction (as well as amere political inquiry) could and would ruin an individual’s existencein the interwar society (Holtmann, 1978, p. 156) by causing theirremoval from employment, pension benefits, housing, and subjectedthem to confiscations and other additional monetary penalties, or dailylump sum charges for their detainment in ‘‘Anhaltelager’’ (Schölnberger,2012). As such, political trials must be considered a weapon to ostracizetargeted individuals.
Our observations also show that cumulative sentencing was not ascommon as scholarship assessed for the earlier periods of the regime(Neugebauer 1995a, p. 119; Reiter-Zatloukal 2012c, p. 75), as 46%of political group’s cases had sentences below the accumulated lowerpenalty limits of their offenses.
We were also able to contradict scholarship’s assertion that legalpractice would be tied to the written law in the Corporate State (Neuge-bauer, 1995b, p. 58). We could show that judicial decisions oftentimeswould go beyond the written law, or breach the regular legal conduct,which fit Fraenkel (1927/1968)’s concept of tendency justice. We foundexamples for double jeopardy, too, when trials were repeated until theseemingly appropriate punishment was received.18
This observed relative leniency on trials against National Socialistsbecomes clear when the specialized strategies on the evolution ofcharges are taken into account (see Section 3.5 on structural predis-positions).
We investigated this matter further when we looked at the judges’co-operations and whether some judges influenced these punishmentsoutside the legal prescriptions (see Section 3.6 on cooperation struc-tures).
3.5. Structural predispositions based on the kind of offenses
Next, we investigated whether the differences in sentencing can beexplained with different oppositional behavior of right- and left-winggroups, and/or with structural differences in how the courts handledtheir cases. Hence, the subject-matters of investigation by the police,
18 As in the case when a defendant was not found guilty by the court for thecharge of planning an explosives attack in the first trial, but was retried by adifferent set of judges, and found guilty for the mere possession of explosivematerials. However, we have to mention double jeopardy might not be suitablyrepresented in our dataset, as police sentences are not part of the court records.Scholarship refers to judicial sentences and police sentences as orchestrated tosupplement each other, e.g. when the release from judicial prison was followedby police imprisonment (Holtmann, 1978, p. 152).

C. Petz and J. Pfeffer
Table 6Table showing the principle of absorption in cases with prison sentences and delicts with penalties. Didthe sentence exceed the maximum penalty limit of a case’s single offense? Abbreviations: mL = maximumLower Limit, mU = maximum Upper Limit, mA = maximum Aggravated Limit.
n <mL =mL mL<mU =mU >mU (noA) mU<mA =mA >mA
All suspects 504 0.30 0.24 0.23 0.05 0.03 0.02 0.1 0.03
Political Groups 467 0.29 0.25 0.23 0.05 0.03 0.02 0.1 0.03
National Socialists 212 0.25 0.30 0.28 0.05 0.05 0.005 0.06 0.01left-wing 255 0.32 0.22 0.18 0.06 0.01 0.04 0.13 0.04
Communists 144 0.34 0.22 0.19 0.04 0.01 0.04 0.09 0.06Social Democrats 111 0.29 0.22 0.17 0.08 0.01 0.04 0.19 0.01
the charges by the state prosecution, and the delicts by the judiciarywill be analyzed in the following. This means that the kind of offensesbrought forward in each phase represents the focus of the respectivecourt’s action.
Structural Predisposition of Offenses leading to Conviction. Follow-ing the line of thought of Kirchheimer’s political lawsuit (1965), weanalyzed whether specific offenses led to convictions. We looked atinquiries that did (or did not) result in a trial, as well as charges thatresulted in a conviction (or not).
Over the whole dataset, the most common inquiry was of hightreason (38.8% of cases), followed by ‘‘Aufwiegelung’’ (non-violent sedi-tion against the State, 38.5%), membership in an illegal organization(33.3%) and ‘‘Agitation’’ (non-violent enmity against morality, prop-erty or legality, 31.4%). Of those with a trial, 44.6% were due to‘‘Aufwiegelung’’, ‘‘Agitation’’ (39.9%), high treason (35.3%), and ille-gal organization (17.9%), gossip (17.1%) and ‘‘Beschwerdesammlung’’(collection of appeals, 16.3%). This stayed similar in cases with a ver-dict: ‘‘Aufwiegelung’’ (43.6%), ‘‘Agitation’’ (38.4%), secret organization(31.8%), and anti-state printed works (22.7%).
The mere frequencies of punishable offenses being prosecuted ordropped show that there were no specific initial inquiries leading totrial. The most common inquiry in the dataset, high treason (38.8%),was not prosecuted in 23% of cases (60% of police inquiries due tohigh treason), but in only 15% led to a trial. The most common chargewas participation in an illegal or secret organization in 22% of cases,but 1/3 of those charges did not lead to a trial. Also ‘‘Agitation’’ (enmityagainst morality, property or legality) more often did not lead to a trial.
We could argue that high treason would often result in a trial, andthat twice of the inquiries for participation in a secret organization wereprosecuted, but overall the type of inquiry brought forward against asuspect does not seem to have determined a trial.
We can assume thus that other decisions must have determinedwhether a case was brought to trial. Among these decisions was theobvious need for evidence. Whether or not a piece of evidence in courtwas genuine cannot be accessed anymore. Beside references to printingmatters, we know of witnesses in court. The members of the executivebranch constituted the biggest proportion of a particular profession forthe witnesses in cases involving all three major political groups. In206 cases recorded with witnesses, 33.7% of them were policemen orcountry constables. The percentage was higher for cases with SocialDemocratic defendants (43.1% of 51 witnesses), and National Socialistdefendants (42.3% of 182 witnesses), and lowest in cases with Commu-nists (27.1% of 199 witnesses). It is therefore not far-fetched to inferthat the evidence needed for a trial could be presented with the meansof the police force alone, and erased the need for other evidence.
Structural Differences in Allegations against Political Partisans. Wefound clear differences in the kind of allegations brought forwardagainst left- and right-wing groups in the process of the court’s action.
High treason was a particularly National Socialist inquiry (in 22%of cases) and charge (18%), which shrank in the judges’ convictionsto appear in only 7.5% of cases. Instead, the rates for participationin illegal organization started out with 14% of cases in the inquiries,dropped to 8% in the charges, and rose to 21% in the convictions.
While high treason was almost equally represented in cases in-volving Social Democrats and Communists (around 8%), this rose inthe prosecutions’ charges to 12% for Social Democrats, and droppedagain to 4% in the convictions. For Communists however, the hightreason offense led to a conviction in less than 4% of cases. Communistswere accused and sentenced based on the so-called rubber paragraphs(in German ‘‘Kautschukparagraphen’’) ‘‘Aufwiegelung’’ and ‘‘Agitation’’,that could be flexibly adapted to cover a wide variety of conduct;Social Democrats to a lesser extend. It must be especially noted, thata mitigation of punishment was ordered by the court for every 7thNational Socialist, but only for 3 and 2 out of 100 Communists andSocial Democrats, respectively.
It is striking that violent crimes have a negligibly small share on allthese charges and delicts. Offenses concerning weapons and explosives,violent resistance and homicide all fall under a 1% barrier for both left-and right-wing groups, except the singular observation of 2% of caseswith police inquiries on violent resistance for Communists. The policeinvestigated in less than 1% of cases on weapon delicts, 3% on violentresistance, and 1% on homicide, which in the verdicts amounted toless than 1% of cases in each of these three categories of violent acts.We can conclude that the differences in sentences cannot be explainedby a more violent behavior of a political group. This observation ofa non-violent opposition is in direct contradiction to the generalizedassumption of qualitative scholarship, that the right-wing groups wereopenly violent against infrastructure, institutions, individuals — incontrast to the ’’verbal radicalism’’ and defensive use of force of theleft-wing groups (Reiter-Zatloukal, 2012b, p. 273) –, as well as to theregime’s assumption about a violent left-wing opposition. Instead, wedid not find differences in violent acts of the political opposition in1935 regarding weapons, violent resistance and homicide: There wasno higher use of openly violent acts by neither group, of which almostall fall under a 1% barrier of cases. Across the whole dataset, offensesconnected to violence were rare.
These findings could also revise several other scholarly assertionson common judicial behavior. Among them is the assertion that hightreason would tend not be applied as it is poorly verifiable, as wellas §287 participation in secret or forbidden societies (Neugebauer,1995a, p. 118). We found high treason in 1935 to be one of themost common police inquiry (39%), and in prosecution’s charge (35%),but this offense was used in only 11% of verdicts in the dataset.Allegations of §287 membership in secret societies were among themost common charges used for right-wing groups, too, and also in thewhole dataset in 33% of cases when investigated by the police, 18%when charged by the prosecution, and in 28% of cases with verdicts.We could verify the claim that the most common offenses were thoseof so-called press delicts, which Neugebauer (1995a, p. 118) definedas §300 ‘‘Aufwiegelung’’, §305 ‘‘Agitation’’, §308 ‘‘Gossip’’, and §310/2‘‘Beschwerdesammlung’’. These appeared in 40% of inquiries, 47% ofcharges, and 41% of verdicts.
Structural Predispositions in Co-occurrences of Allegations against Op-positional Partisans. Another indication of a structural predispositioncould be the combination of allegations brought forward to prosecutionagainst the political opposition. We identified offenses co-occurring in

C. Petz and J. Pfeffer
Table 7Networks of co-occurring offenses of members of left- and right-wing political groups. Members of the National Socialist group (NS) show an aboveaverage combination of gossip and illegal organization membership. Noteworthy are their high frequency of mitigation of punishment in combinationwith membership in illegal organizations in the verdicts. Members of the Communist group (CM) were most often investigated for public disruption andsecret organization memberships, and ac cussed of high treasonous offenses in an above average combination of ‘‘Aufwiegelung’’ and ‘‘Agitation’’, butconvicted for public disruption and anti-state printed works. Social Democratic members (SD) were investigated most prominently for high treason anddeception, disrespecting religion, public disruption, gossip, ‘‘Aufwiegelung’’ and ‘‘Agitation’’, whereas have no peculiarities in their charges and delicts ofconviction. Circular Layout Algorithm used in python::networkx.
the inquiries, charges, and delicts of convictions, and marked those whoappeared more frequently together than others.
In general, the most frequent combination of inquiries was‘‘Aufwiegelung’’–‘‘Agitation’’ in 30.0% of all cases, and different formsof high treason (28%). The most common inquiry for Communistswas in almost 11% of cases ‘‘Aufwiegelung’’–‘‘Agitation’’ and in 7%high treason offense combinations. For Social Democrats these werein 8.7% of cases ‘‘Aufwiegelung’’–‘‘Agitation’’ and in 6.4% high treasonoffenses, and for National Socialists in 14.2% high treason delicts and9% ‘‘Aufwiegelung’’–‘‘Agitation’’. In the charges, high treason offensesincreased for Communists’ cases by 4 points to 11.4%, but decreasedfor Social Democrats to 5.4%, and rose slightly for National Socialiststo 15.8%. There, also ‘‘Aufwiegelung’’–‘‘Agitation’’ increased for Commu-nists by 4 points to 15.7%, for Social Democrats to 10.5%, and to 10.1%for National Socialists. In the delicts, Communists were sentenced in12.6% of cases with ‘‘Aufwiegelung’’–‘‘Agitation’’, and over 7% for either‘‘Aufwiegelung’’ or ‘‘Agitation’’ in combination with anti-state printedworks. This holds true for Social Democrats as well, but with a morebroadly differentiated range of charge combinations, ‘‘Aufwiegelung’’–‘‘Agitation’’ reaching 8.7%, followed by 3.7% for ‘‘Agitation’’-a-nti-state
printed works. Whereas for National Socialists, in the delicts the ac-cusation of high treason disappeared by half (5.9%), instead 17.5%of cases were convicted for illegal organization offenses, and 8.3%for ‘‘Aufwiegelung’’–‘‘Agitation’’, and ‘‘Aufwiegelung’’–anti-state printedworks (7.2%).
The visualizations in Table 7 of these co-occurrence networks forNational Socialists’, Communists’, and Social Democrats’ cases show thespecific combinations of inquiries, charges, and delicts of each politicalgroup, which are inherently different for each. There, we additionallyhighlighted the outlier combinations of co-occurring paragraphs in eachgroup. For this, we constructed threshold values that signify whethera combination of paragraphs occurred more often than the averageoccurrence of this combination over all political groups; we coloredthe edge red, if the combination occurred more than 1.95 times of theaverage occurrence of this combination. The co-occurrence highlightedabove of illegal organization and gossip in police inquiries for NationalSocialists is also noteworthy. For Communists, the combination ofillegal organization and public disruption was above average in thepolice inquiries, whereas Social Democrats were charged above average

C. Petz and J. Pfeffer
with disrespecting religion, public disruption, ‘‘Agitation’’ and gossip,as well as deception and high treason. Communist had a clear highcombination of high treason with ‘‘Aufwiegelung’’ or ‘‘Agitation’’ inthe prosecutors’ charges. In the verdicts, National Socialists had anabove average co-occurrence of illegal organization and mitigationof punishment, but Communist in illegal organization and absorptionprinciple, and public disruption and printed works regulations. SocialDemocrats did not show any above average co-occurrences in theircharges or delicts of conviction.
3.6. Interim conclusions II
These findings on offenses applied characteristically to specific po-litical partisanship reveal a structural predisposition for convictionbased on political partisanship, explaining the differences in prisonlengths for right- and left-wing groups. These observations show astructural evolution in the kind of offenses brought forward by thepolice, the prosecution, and the judiciary for each political group,which influenced the severity of their subsequent sentences. Namelyfor National Socialists, the most common inquires of high treason bythe police declined rapidly in the prosecution’s charges, and werereversed to the much ‘lighter’ crime of illegal participation in secretgroups by the judiciary. This, in turn, influenced the relative leniencyon National Socialist cases’ sentences imposed by judiciary. Holtmann(1978, pp. 260–1) mentioned a new law to take effect in 1936 thatwas designed to put an end to judges favorably changing charges fromhigh treason to illegal secret organization participation, and thus thepreferential treatment of National Socialists by the judiciary.
These specialized prosecution strategies for political groups fitclearly Kirchheimer (1965)’s concept of the political lawsuit.
This observed lenience for right-wing groups fits the orientation oflegal practice within the First Republic and the show trials of 1934only to some extent. For a small sample of trials during the First Re-public, scholarship had identified a tendency for conspicuously lenientsentences for right-wing perpetrators and more serious sentences forleft-wing ones (Reiter-Zatloukal 2007, p. 90; Holtmann 1978, pp. 1,52), which in general was characterized as class justice (Neugebauer1995b, p. 115; Holtmann 1975a, p. 158; Botz 1975, p. 159).19 Thisjudicial bias was attributed to the judiciary favoring the ‘‘anti-Marxiststreet fight’’ of the right-wing groups (Botz, 1995, pp. 109–11).
Other ‘‘conspicuously lenient sentences’’ (Holtmann, 1978, p. 1)were recorded by scholarship for the July putschists compared to theFebruary fighters (Holtmann 1975b; Neugebauer 1995b, pp. 57–8).This leniency was again attributed to the German sympathies of thejudiciary, but answered also to political pressure from NS-Germany.This might be the case in 1935 again, which resulted in the selection ofcharges on how right-wingers were prosecuted, but with the differencethat generally the convictions did not exceed the possible limits ofpenalty.
3.7. Cooperation structures
In the preceding sections, we focused on the case properties andthe kind of charges that were brought forward. Next, we looked at thecourt personnel themselves. The dataset features 204 cases in 88 courtproceedings, where at least one judge was recorded by the digitizationproject (see Fig. 1). This sample features 55 judges and 27 prosecutorsworking on 204 cases with verdicts on 201 different defendants from88 processes. Did certain judges specialize on prosecuting politicalpartisanship? Did the cooperation of certain judges and prosecutorsresult in harsher sentences? Did court personnel stand out in crucialpositions, whom we can consider as key players?
19 And criticized, as such, for misattribution, as neither left- nor right-winggroups consisted of a homogeneous class (compare Wandruszka, 1975, p. 110).
Specialization in political groups. When we looked for specializationin political groups, we found certain judges who focused on specificgroups. This is visibly striking as in Fig. 1, where several judgesare surrounded by groups of one political orientation only, as the12 National Socialists surrounding Judge Oskar Strasser of LGSt II.However, this would ignore the historical fact that multiple defendantscould be accused in one (big) proceeding. In order to elicit this sortof over-attribution of judges, we grouped cases according to their trialnumbers. There are 549 cases with a unique trial number out of a1,836 individual cases against 1,521 different defendants. Of these 549,278 group trials (processes) were opened, with convictions in 256. In278 trials, 39% had 3 or more different defendants (in a total of 111group trials). Within these grouped cases, each defendant received anindividually tailored sentence.
An analysis taking the group processes into account shows no clearspecialization on any group by judges and prosecutors in our sample(compare Fig. 4). This might be used, however, to complete missinginformation on political orientation of individuals.
Cluster Analysis. The courts LGSt I and LGSt II of Vienna wereresponsible for separate districts of the city: LGSt I was responsiblefor the Viennese districts 1 to 12, 16, 17, and 20, while LGSt II dealtwith the remaining districts and the surrounding commuter belt ofVienna (Waldstätten, 2012; Bundesministerium für Justiz, 2009). Wewere able to show, however, that judges did not work solely withintheir respective courts.
A spectral cluster analysis using a normalized Laplacian closelyrelated to a random walk on the graph (for a comprehensive descriptionof spectral clustering see von Luxburg, 2007) reveals three clusters ontwo connected components in Fig. 5. The two clusters on the biggestcomponent coincide with the two provincial courts of Vienna, while thethird cluster constitutes a case processed at the court of Steyr.20 We seecooperations spanning from the provincial court of Vienna I to II andvice versa, and certain individuals working in both courts.
Harshness of Verdicts dependent on Judges, Prosecutors and their Co-operations. We analyzed the average sentence practice for each judge,prosecutor, and their cooperations, and computed the percentage ofthe applicable range between the lowest and highest penalty limit,having 0 as the penalty minimum, and 1 as the penalty maximum. Wedifferentiated again between the principle of aggravation, construct-ing the penalty minimum/maximum cumulatively, and the principleof absorption, which took the highest penalty of each upper, lowerand aggravated limit. In order to allow for reasonable inferences, werestricted this analysis to all court personnel who brought forward aconviction in a minimum of 8 cases (compare Fig. 6).
For court personnel, who made convictions in at least 8 cases, thehighest average for an accumulated sentence (= principle of aggrava-tion) was 35% of the possible maximum penalty by Judge Dr. Gasserof LGSt II in 15 cases against Social Democrats (ranging within thelower and the upper penalty limit) in combination with Prosecutor Dr.Schmidt of LGSt I, as well as Schmidt with Judge Dr. Eder of LGStI and II (35%) The lower individual average of Eder (32%) suggestsa slightly less stern sentence behavior, as in another case against aNational Socialist he gave a sentence below the lower limit.
This trio (compare to upper right corner in Fig. 6) also stoodout with the highest average for sentences based on the principle ofabsorption with 61% of the highest penalty limits. In their cases, eightof 15 Social Democrats received the highest single upper penalty limit,and four the aggravated one.
20 Steyr appears in this data set, because a court record about nine NationalSocialists defendants (of which six were convicted in January 1935 in Steyr,and three were not prosecuted) was transferred to LGSt II for the trial of one ofthose remaining three defendants who were not prosecuted yet. This defendantwas finally found guilty of secret membership in an illegal organization in June1935, and was imprisoned for 14 days. As this corresponding court record nowis to be found in the provincial court archive, it was recorded in the database.

C. Petz and J. Pfeffer
Fig. 4. Network of 53 judges, 25 prosecutors, and 84 processes (of cases with convictions) colored according to its majority’s political orientation. Edges represent convictions.Layout algorithm used: Kamada–Kawaii in python::networkx. (For interpretation of the references to colour in this figure legend, the reader is referred to the web version of thisarticle.)
A fourth judge affiliated with this group, the Vice President ofthe Viennese provincial court Judge Dr. Alois Osio (active at bothLGSt I and II), also had an average 60% sentence rate (absorptivesentencing) respective 35% (accumulated sentencing) in combinationwith Prosecutor Schmidt. Individually, however, Osio had an averageof 33% of the possible maximum penalty (according to the principleof absorption) in 58 cases, which were evenly distributed among thepolitical groups. Of these, only one was above the upper limit of thesentence, and 8 below the lower limits. Did Osio push the aggravationin this one case? His own lower average does not seem to suggestthis. In terms of cumulative sentencing, he individually administeredon average -5% of the applicable penalty range, suggesting an averagesentencing below the lower penalty limit provided by penal law forthe convicted offenses. Interestingly though, Osio was described bycontemporaries as conservative, outspokenly anti-communist (Meisel,1985, p. 56) and famous for harsh sentences (Kreisky, 2014), havingsentenced the Young Socialist Joseph Gerl to death in martial court in1934 (Pal, 2006, p. 9).21 In our dataset notwithstanding Osio did not
21 Osio targeted Communists, Social Democrats and National Socialistsalike (DöW, 0000b). His processes against National Socialists made him oneof the first prominent deportees from Vienna to the Dachau concentrationcamp after the Austrian ‘‘Anschluss’’ (DöW, 0000a). Osio died in January1939 in Buchenwald. Socialist Otto Binder remembered meeting his formerjudge shortly before Osio’s death as an ‘‘invalid’’, drawn by the camp illnessphlegmone (Binder, 2010, p. 80).
appear to be an extremely harsh judge. A PageRank clustering scorerevealed Osio as the most central node in the sample, as reflected byhis many cases in the sample.
Another group consisted of judges mainly from LGSt I (see Fig. 6 inthe upper middle) that were conspicuous in their sentence practice inregard to the principle of absorption. Individually, Judge Dr. Naumannof LGSt I gave 57% of the highest penalties on average in 9 cases againstCommunists, of which 3 received sentences below the lower limit, and2 above the aggravated limit. OLGR Judge Dr. Standhartinger of LGSt Ihad an average of 41% in 10 Communist and 4 Social Democrat casesas an individual. Both formed with Prosecutor Ludwig Tlapek of LGSt I(individual average of 16%) and Judge Dr. Anton Werner of LGSt I andII (15%) another quartet that had an average sentence of 57% of themaximum penalty (absorptive sentencing) in 9 cases, suggesting thatin fact Naumann and Standhartinger were the hardliners in that group.This is also supported by the observation that Tlapek with Judge Dr.Brick of LGSt I had an average of −5% in 21 cases against left-winggroups, suggesting an average sentence rate slightly below the lowerlimits of penalty.
The lowest average based on a cumulative and an absorptive sen-tence had Judge Dr. Felix Cazafura of LGSt II in 9 cases with -40%and -14% below the lower accumulated and individual sentence limitsagainst all political groups. Noteworthy here is also prosecutor Dr.Ferdinand Nagl of LGSt II with a penal practice of −2% (accumulatedsentencing) and -3% (absorptive sentencing) of the applicable range:he had 18 cases with National Socialists only.

C. Petz and J. Pfeffer
Fig. 5. Network of judges and prosecutors grouped based on their trials’ court house. An edge symbolizes collaboration in the same processes; the dashed line signifies overlaps in1 process, gray more than 1, and black in at least 5 processes. A spectral cluster analysis revealed three clusters, as represented in node colors. (For interpretation of the referencesto colour in this figure legend, the reader is referred to the web version of this article.)
Fig. 6. Average sentence practices of judges and prosecutors with convictions in at least 8 processes based on the principle of aggravation (x-axis) and of absorption (y-axis).The sentence practices constitute the average penalty these court personnel brought forward in convictions. The penalty was normalized based on the percentage of the applicablerange between the lowest and highest penalty limits of each individual case, having 0 as the penalty minimum and 1 as the penalty maximum. If values are negative, the averagesentencing was below the lower penalty limit provided by penal law.

C. Petz and J. Pfeffer
4. Limitations
Court proceedings as a social historical source can shed light onthe social strata of criminality as well as on the evolution of penallaw practice (Hoffmann, 1995). A few challenges appear when workingwith this kind of data. We have to take different forms of biases intoaccount.
We have to consider a selection bias in the transmission of records.The case files were pre-selected in 1980 by the Institute for Contem-porary History at the University of Vienna, which assessed 10,057case files and discarded them until 3,000 remained today (Wenningeret al., 2017). Unfortunately, neither lists about these discarded recordsnor information on the removal criteria exist anymore. It is verylikely that disproportionately high amounts of political actions sur-vived. The research project at the University of Vienna on politicalrepression (2015–2017) identified 1,836 cases, which apply to theabove-mentioned definitions of political actions (Wenninger et al.,2017). The focus on mentions of political orientation and politically-charged accusations falls short, on the one hand, on political agitators,who could have been charged with something non-political and in theconsecutive trial did not mention their affiliation. On the other hand,there is little reason to believe that the regime would mask their intentto prosecute the political orientation so that it could have the intendeddeterrence effect.
The case records as historical sources need to be considered frag-mentary. There is an unknown number of incomplete records, as partsof the documentation were removed or deliberately destroyed by ad-ministration officials during the Corporate State, or simply have beenlost. Others were not properly documented at the time, which is es-pecially true for the fragmentary transmission of the period of impris-onment. Often times, the entrance or release date is not known, andthere were duration differences in official rulings and served sentences.The fees for imprisonment and/or prosecution in most cases were notenumerated in the case records, but we know of contemporary witness’accounts that those were in fact imposed. Other issues arise owing toillegible hand-written entries or other missing information.
The database is noisy, too. The transcription process executed bymany different people is not without fault: Transposed digits, missedinformation or simply illegible names contribute to another kind offragmentary data, which was not coded into the database. The examin-ing magistrate (who is different from the judges in the trial), associatedlay assessors as well as other witnesses not appearing in court, are miss-ing as well. We do not know how long those cases were tried at courtbased on the database, their duration is only indirectly coded basedon the first imprisonment by the police and later imprisonment by thecourt. The data was initially not gathered with a quantitative analysisin mind. It must be noted that sentence length could be incomplete, too,owing to sloppy police documentation or lost documents, but holds trueto the data available in archives. During pre-processing, we correctedas many of these noises as much as possible.
Using fragmented and fuzzy data on historical network researchfundamentally differs from other social sciences: Historians work witharchival source material instead of being able to interview, and ingeneral try to rebuke the problem of sources with their diversification,disclosure of their lacks, and clarification of their authenticity andorigin.
Also networks are always a representation of real-world systems,and as such a reduced (not complete) version of it (Lemercier 2012,pp. 24–5; Hennig et al. 2012). While missing data can be problematicwhen studying social networks, there is also evidence that centralitymetrics are indeed suited to accurately describe the dataset (Costen-bader and Valente, 2003; Borgatti et al., 2006).
The size of the dataset counterweights such fragment issues.Lemercier and Zalc (2019, p. 39) recently stressed that there is ‘‘almostno reason in historical research to gather more than 1,000 cases’’following the line of the law of big numbers. A dataset of over 1,800
cases should suffice for this rule. We can therefore infer tendencies ofthe politically influenced prosecution in 1935 Vienna.
Finally, we have to consider context bias. The data does consist ofcourt records, and does not account for every police record or confis-cation record, which could be used for an encompassing picture if theyexist. Schwerhoff (2011, p. 40) has argued that court-document are in-voluntary ego-documents of the accused within the administrative-legalarea such as questioning or witness protocols. The courts, judiciariesand police have a specific and non-objective worldview imposed ontheir defendants and cases. Therefore, the findings on the datasetrepresent the view of the world as seen by the courts: for example,leftist print works of Social Democratic members were treated as beingof Communists. This does not change the validity of the results.
5. Conclusion
The Corporate State of Austria (1933–38) gives a vivid case exampleon the transformation of justice in order to serve political purposes ofthe ruling elite. Research so far has focused on a qualitative evalua-tion of the system of political repressive in the early years, and onthe reorganization of the former democracy to become an authori-tarian state by its chancellors Engelbert Dollfuß (1933–34) and KurtSchuschnigg (1934–38) using emergency decrees. This had revealed themechanics of the purification of and control over the judiciary, and theongoing aggravation of criminal law, and criminalizing of a politicalopposition. These practices fit the definitions of political judiciary byOtto Kirchheimer and Ernst Fraenkel very closely, which emphasizethe weaponization of the law and the executive against any perceivedenemies of the State. Whereas previous research disseminated the earlyyears of the great show trials against political agitators (1933/34) andthe later period leading to the integration of Austria into NS-Germany,this paper focused on the structural forms of political judiciary in thebrief consolidated phase of the regime in 1935. In this paper, we wereable to identify the following patterns of prosecution:
We found a clear tendency to sentencing of the political oppositionin the Viennese courts, which tended to give more extreme sentencesto left-wing groups. This relative leniency towards the National So-cialist group in Austria can be explained with a specialized strategyof prosecution: For National Socialists indictments of serious crimessuch as high treason were transformed by the prosecution and thecognizant judges to less serious offenses as forbidden membershipin illegal organizations, and listed more often mitigating reasons inverdicts. Communists and Social Democrats were convicted with the so-called ‘‘Kautschukparagraphen’’ of ‘‘Agitation’’ and ‘‘Aufwiegelung’’. Thisshows clear parallels to aspects of political judiciary as in the utilizationof law against specific political groups, conceptualized by Kirchheimer’spolitical lawsuit, as well as the breach of conduct for certain groups astheorized in Fraenkel’s tendency justice. We could furthermore refinevarious assumption of qualitative scholarship on the legal practice andmechanism in the consolidated phase of the Corporate State based onthe example of its capital, such as the use of accumulated penalties,usage of high treason allegations, and more. Finally, we revealed keyplayers and cooperation of judges and prosecutors which accounted forharsher sentences at court.
A crumbling system. Overall, we found evidence that the systemapparatus did not work entirely uniformly. The prosecution and thejudiciary still had their own agenda on what kind of charges wereallowed for a political defendant, and their subsequent convictions.
The extent of judicial guilt, according to Neugebauer (1995b),should be closely related to its agency. Courts were the ‘‘preferredweapon’’ against Social Democracy in the civil war (Neugebauer,1995b, p. 55), whose composition was dependent on the regime andwho implemented laws designed to suppress the political opponents.The regime however distrusted its courts. The abolishment of theformal independence of judges, the inauguration of special courts to

C. Petz and J. Pfeffer
sentence the July putschists, and other regulations in order to put thejudiciary in line were a testimony to that ‘‘fundamental distrust’’ of thejudiciary (Neugebauer, 1995b, p. 57). As a result, the judicial branchwas under constant calibration by the regime. The judiciary couldnot satisfy the ‘‘changing regulations of a centrally initiated tendencyjustice’’ (Holtmann, 1978, p. 118) fast enough, quite literally.22
Consequently, Neugebauer (1995b, pp. 51–2) argues, the courtscould not be held responsible for their judicial decisions. We disagreewith this notion of a not-guilty judiciary during the Corporate State. Inour study of 1935 Viennese courts, we could see clear signs of agencywithin the police, the prosecution and the judiciary, resulting in adrastically different interpretation of the suspects’ supposed offenses.On the one hand, this shows that the judiciary was not controlledsustainably enough by the regime. On the other hand, this suggeststhat the judiciary can be held guilty owing to its own still-independentagency.
On January 10, 1935, Schuschnigg proclaimed that the Julyputschists and February fighters had both been enemies to the Statealike, which suggested no difference in the legal treatment of the left-wing movement or the National Socialist groups (Holtmann, 1978, p.169).23 In legal practice, this stance did not hold true, because of thedifferences in prosecution and conviction as described above.
These cracks in the system foreshadowed its own failure by disagree-ment. The Austrian regime was not a totalitarian system Holtmann(1978, p. 15), but its authoritative stance crumbled under its internalcontradictions in the apparatus itself.
In May 1935, on the day of the first anniversary of the Cor-porate State’s constitution, most of the regime’s convictions wereamnestied (Holtmann, 1978, p. 171), which was followed by the‘‘Christmas amnesty’’ in December 1935 (Reiter-Zatloukal, 2012a, p.346; Marschalek, 1990, pp. 179–181). These amnesties were already anod to the stressed relations with the German Reich, and to the criti-cism experienced by the former Triple Entente, and intended to calmdown the workers movement as well (Holtmann, 1978, p. 278; Reiter-Zatloukal, 2012a). On July 11, 1936, the deal with the German Reichwas finalized, followed up by a new wave of amnesties of mainlyNational Socialists convicts (Reiter-Zatloukal, 2012a). The so-called‘‘Deutscher Kurs’’ became prevalent: the tendency for lenient sentencesfor National Socialist offenders became stronger, while for Social-ist defendants the penalty range would be exhausted as describedby Neugebauer (1995b, p. 58). A subsequent analysis of the periodleading to the German ‘‘Anschluss’’ in 1938 would elaborate on thesejudicial developments.
Outlook. By connecting historical network methods and statisticalanalysis in a historical study of the provincial courts of Vienna in 1935,we revealed key players cooperating in harsher sentences, and iden-tified specialized strategies and structural predispositions to sentencethe political opposition. Thus, we were able to widen the historicalknowledge obtained before by qualitative research on the legal practiceand mechanism during this time.
The dataset used in this study was not intended for a quantitativeanalysis. In future research, we could tackle some of its limitations bybuilding a database of court records that were digitized employing Op-tical Character Recognition and Handwritten Text Recognition. Then,
22 The courts could not keep up with the amount of trials. By the end ofJuly 1934, the majority of cases concerning the civil unrest of February werenot tried yet. After the putsch in July, the so-called ‘‘Februarprozesse’’ declinedrapidly (Holtmann, 1978, p. 118). In this dataset of 1935, still 60 cases relatedto the previous year’s February fights are recorded, of which 6 were broughtto trial.
23 The regime did however tailor laws to illegalize activities of certainpolitical groups, such as the retroactive ban of the Social Democratic partyafter the civil unrest in February 1934, or to set harsher sentences on printingworks interpreted as ‘‘anti-state’’.
we could use text mining approaches in identifying different usagesof wording in the inquiries and verdicts of the political opposition.This would also allow a comparative perspective on the evolution ofdifferences in the judicial treatment of Social Democratic, Commu-nist and National Socialist perpetrators in Austria. Another in-depthanalysis on the internal and external influences on the judiciary willbecome possible when the personal files of judges of the CorporateState are opened for general research. The latest research suggests thatexternal agents such as the right-wing ‘‘Deutscher Klub’’ exerted theirinfluences on the judiciary during the First Republic (Huber et al.,2020). Future examination of these personal files will shed light on theinner structures of judges.
Acknowledgments
We would like to express our sincere gratitude for the coopera-tion with Dr. Florian Wenninger and Philipp Tzaferis (University ofVienna), who shared their database with us for this research project.Additionally, we are grateful for the valuable feedback we receivedfrom the historical network research community on our conferencepresentations.
References
Bauer, K., 2001. Aspekte des nationalsozialistischen Juliputsches 1934 (Ph.D. thesis).University of Vienna.
Binder, O., 2010. Wien – retour: Bericht an die Nachkommen, 3. ergänzte Auflage ed.Böhlau Verlag, Vienna Cologne Weimar.
Borgatti, S., Carley, K.M., Krackhardt, D., 2006. On the robustness of centralitymeasures under conditions of imperfect data. Soc. Netw. 28 (2), 124–136.
Botz, G., 1975. Diskussionsbeitrag. Diskussion zum Beitrag Holtmann. In: Jedlicka, L.,Neck, R. (Eds.), Das Jahr 1934: 12. Februar. Protokoll des Symposiums in Wienam 5. Februar 1974, 2. In: Wissenschaftliche Kommission zur Erforschung derösterreichischen Geschichte der Jahre 1918 bis 1938, Verlage für Geschichte undPolitik, Vienna, pp. 155–159.
Botz, G., 1980. Die österreichischen NSDAP-Mitglieder: Probleme einer quantita-tiven Analyse aufgrund der NSDAP-Zentralkartei in Berlin Document Center. In:Mann, R. (Ed.), Die Nationalsozialisten: Analysen Faschistischer Bewegungen,No. 9. In: Historisch-Sozialwissenschaftliche Forschungen: Quantitative sozial-wissenschaftliche Analysen von historischen und prozeß-produzierten Daten,Klett-Cotta, pp. 98–136.
Botz, G., 1985. Faschismustheorien Otto Bauers. In: Fröschl, E. (Ed.), Otto Bauer1881–1938. Theorie und Praxis. Europa-Verlag, Vienna, pp. 161–192.
Botz, G., 1995. Zum Verhältnis von Politik und Rechtswesen in der Ersten Republik. In:Weinzierl, E., Rathkolb, O., Ardelt, R., Mattl, S. (Eds.), Justiz und Zeitgeschichte.Symposionsbeiträge 1976–1993, Vol. 1, Vienna.
Box-Steffensmeier, J.M., Christenson, D.P., 2014. The evolution and formation of amicuscuriae networks. Special Issue on Political Networks, Social Networks Special Issueon Political Networks, 36, 82–96.http://dx.doi.org/10.1016/j.socnet.2012.07.003,
Brandes, U., Lerner, J., Lubbers, M.J., McCarty, C., Molina, J.L., 2008. Visual statisticsfor collections of clustered graphs. In: Visualization Symposium PacificVIS’08. IEEEPacific, pp. 47–54.
Bundesministerium für Justiz, 2009. Geschichtliches. Landesgericht für StrafsachenWien. URL: https://www.justiz.gv.at/web2013/lg-fuer-strafsachen-wien/landesgericht-fuer-strafsachen-wien/geschichtliches~2c94848540b9d489014203d96eca28e0.de.html.
Clark, T.S., Lauderdale, B.E., 2012. The genealogy of law. Political Anal. 20, 329–350.http://dx.doi.org/10.1093/pan/mps019.
Costenbader, E., Valente, T.W., 2003. The stability of centrality measures whennetworks are sampled. Social Networks 25 (4), 283–307.
Day, M., 2018. Poland bows to EU pressure on controversial judicial reforms. (ISSN:0307-1235) The Telegraph, 2018-11-21. URL: https://www.telegraph.co.uk/news/2018/11/21/poland-bows-eu-pressure-controversial-judicial-reforms/.
DöW, 0000a. Der erste Dachau-Transport aus Wien, 1. April 1938. DöW– Dokumentationsarchiv des österreichsichen Widerstands. URL: https://www.doew.at/erinnern/fotos-und-dokumente/1938-1945/der-erste-dachau-transport-aus-wien-1-april-1938.
DöW, 0000b. Der erste Dachau-Transport aus Wien, 1. April 1938 – OSIO AloisDr.. DöW – Dokumentationsarchiv des österreichsichen Widerstands. URL:https://www.doew.at/erinnern/fotos-und-dokumente/1938-1945/der-erste-dachau-transport-aus-wien-1-april-1938/osio-alois-dr.
Duchkowitsch, W., 1995. Das unfreie ‘‘Haus der Presse’’. Zensur im ‘‘Ständestaat’’. In:Weinzierl, E., Rathkolb, O., Ardelt, R., Mattel, S. (Eds.), Justiz und Zeitgeschichte.Symposionsbeiträge 1976–1993, Vol. 2, pp. 565–575.

C. Petz and J. Pfeffer
Düring, M., 2015. Verdeckte soziale Netzwerke im Nationalsozialismus: Die Entstehungund Arbeitsweise von Berliner Hilfsnetzwerken für verfolgte Juden. De Gruyter,Berlin/Boston, http://dx.doi.org/10.1515/9783110368949.
Emsley, C., Hitchcock, T., Shoemaker, R., 2012. Old Bailey Online - about this project.Old Bailey Proceedings Online. URL: https://www.oldbaileyonline.org/ version 8.
Fraenkel, E., 1927/1968. Zur Soziologie der Klassenjustiz. In: Fraenkel, E. (Ed.),Zur Soziologie der Klassenjustiz und Aufsätze zur Verfassungskrise 1931–32.Wissenschaftliche Buchgesellschaft, Darmstadt, pp. 1–41, Mit einem Vorwort zumNeudruck.
Gökkaya, H., AFP, dpa, 2019. Europäischer Gerichtshof: EU-Kommissionverklagt Polen wegen Vorgehen gegen Richter. Die Zeit, 2019-10-10. URL:https://www.zeit.de/politik/ausland/2019-10/europaeischer-gerichtshof-klage-polen-richter-eu-kommission.
Graham, S., Milligan, I., Weingart, S., 2016. The Historian’s Macroscope: Big Digital His-tory. Imperial College Press, Open Draft Version, URL: http://www.themacroscope.org/?page_id=584.
Hannover, H., Hannover-Drück, E., 1987. Politische Justiz 1918–1933. Lamuv Verlag,Bornheim-Merten.
Hassel, F., 2020. Polen - Streit um unabhängige Justiz verschärft sich. Sued-deutsche.de, 2020-01-23. URL: https://www.sueddeutsche.de/politik/polen-richter-justiz-1.4768659.
Hennig, M., Brandes, U., Pfeffer, J., Mergel, I., 2012. Studying Social Networks: A Guideto Empirical Research. Campus Verlag, Frankfurt / New York.
Hitchcock, T., 2013. Historyonics: Big data for dead people: Digital readings andthe conundrums of positivism. Historyonics. URL: http://historyonics.blogspot.com/2013/12/big-data-for-dead-people-digital.html.
Hoffmann, R., 1995. Strafprozeßakten als sozialgeschichtliche Quelle. In: Weinzierl,E., Rathkolb, O., Ardelt, R., Mattl, S. (Eds.), Justiz und Zeitgeschichte.Symposionsbeiträge 1976–1993, Vol. 1, Vienna, pp. 163–175.
Holtmann, E., 1975a. Diskussionsbeitrag. Diskussion zum Beitrag Holtmann. In:Jedlicka, L., Neck, R. (Eds.), Das Jahr 1934: 12. Februar. Protokoll des Symposiumsin Wien am 5. Februar 1974, 2. In: Wissenschaftliche Kommission zur Erforschungder österreichischen Geschichte der Jahre 1918 bis 1938, Verlage für Geschichteund Politik, Vienna, pp. 155–159.
Holtmann, E., 1975b. Zwischen ‘‘Blutschuld’’ und ‘‘Befriedung’’: Autoritäre Julijustiz. In:Jedlicka, L., Neck, R. (Eds.), Das Jahr 1934: 12. Februar. Protokoll des Symposiumsin Wien am 5. Februar 1974, 2. In: Wissenschaftliche Kommission zur Erforschungder österreichischen Geschichte der Jahre 1918 bis 1938, Verlage für Geschichteund Politik, Vienna, pp. 36–45.
Holtmann, E., 1978. Zwischen Unterdrückung und Befriedung. Sozialistische Arbeiter-schaft und autoritäres Regime in Österreich 1933–1938. In: Studien und Quellenzur österreichischen Zeitgeschichte, No. 1, Vienna.
Huber, A., Erker, L., Taschwer, K., 2020. Wie ein rechtes Netzwerk Österreich unter-wanderte. Ein neues Buch legt konkrete Hinweise auf politische Beeinflussungender Justiz vor. Allerdings von rechts - und für die Erste Republik. Ein Vorabdruck.Der Standard, 2020-02-29.
Jedlicka, L., 1975. Diskussionsbeitrag. Diskussion zum Beitrag Holtmann. In:Jedlicka, L., Neck, R. (Eds.), Das Jahr 1934: 12. Februar. Protokoll des Symposiumsin Wien am 5. Februar 1974, 2. In: Wissenschaftliche Kommission zur Erforschungder österreichischen Geschichte der Jahre 1918 bis 1938, Verlage für Geschichteund Politik, Vienna, pp. 155–159.
Jesionek, U., 1995. Parlamentarische Demokratie und richterliche Unabhängigkeit. In:Weinzierl, E., Rathkolb, O., Ardelt, R., Mattl, S. (Eds.), Justiz und Zeitgeschichte.Symposionsbeiträge 1976-1993, Vol. 1, Vienna, pp. 141–156.
JUSLINE Österreich, 2020. § 28 StGB (Strafgesetzbuch), Zusammentreffen strafbarerHandlungen. URL: https://www.jusline.at/gesetz/stgb/paragraf/28.
Kann, R., 1975. Diskussionsbeitrag. Diskussion zum Beitrag Holtmann. In: Jedlicka, L.,Neck, R. (Eds.), Das Jahr 1934: 12. Februar. Protokoll des Symposiums in Wienam 5. Februar 1974, 2. In: Wissenschaftliche Kommission zur Erforschung derösterreichischen Geschichte der Jahre 1918 bis 1938, Verlage für Geschichte undPolitik, Vienna, pp. 155–159.
Kimmel, J., 1936. Das österreichische Staatsbürgerbuch. Ein Handbuch der Staats- undRechtskunde für jedermann. Verlag Rudolf Kaan, Vienna.
Kingsley, P., 2018. After Viktor Orban’s victory, Hungary’s judges start to tumble. (ISSN:0362-4331) The New York Times, 2018-05-01. URL: https://www.nytimes.com/2018/05/01/world/europe/hungary-viktor-orban-judges.html.
Kirchheimer, O., 1955/1964. Politische Justiz. In: Politik und Verfassung. Suhrkamp,Frankfurt a. Main, pp. 96–122.
Kirchheimer, O., 1965. Politische Justiz. Verwendung juristischer Verfahrens-möglichkeiten zu politischen Zwecken, Vol. 17. Luchterhand, Neuwied undBerlin.
Kreisky, B., 2014. Erinnerungen: Das Vermächtnis des Jahrhundertpolitikers.Styriabooks.
Lemercier, C., 2012. Formale Methoden der Netzwerkanalyse in den Geschichtswis-senschaften: Warum und Wie? Österreichische Zeitschrift für Geschichtswis-senschaften 23, 16–41, Translated by Albert Müller and Wolfgang Neurath.
Lemercier, C., Zalc, C., 2019. Quantitative Methods in the Humanities: An Introduction.University of Virginia Press, Charlottesville.
Lubbers, M.J., Molina, J.L., Lerner, J., Brandes, U., Ávila, J., McCarty, C., 2010.Longitudinal analysis of personal networks. The case of Argentinean migrants inSpain. Soc. Netw. 32 (1), 91–104.
von Luxburg, U., 2007. A tutorial on spectral clustering. Statist. Comput. 17 (4),395–416. http://dx.doi.org/10.1007/s11222-007-9033-z.
Marschalek, M., 1990. Untergrund und Exil. Sozialistische Bibliothek, vol. 3, LöckerVerlag.
Mattel, S., 2007. Zur Sozialgeschichte und Habitus österreichischer RichterInnen seit1924. In: Helige, B., Olechowski, T. (Eds.), Hundert (100) Jahre Richtervereinigung.Beiträge zur Juristischen Zeitgeschichte. In: Zeitschrift der Savigny-Stiftung fürRechtsgeschichte. Germanistische Abteilung, Vienna, pp. 67–87.
Meisel, J., 1985. ‘‘Jetzt haben wir Ihnen, Meisel!’’ Kampf, Widerstand und Verfol-gung des österreichischen Antifaschisten Josef Meisel (1911–1945). Verlag fürGesellschaftskritik, Verein Kritische Sozialwissenschaft und Politische Bildung,Vienna.
Neugebauer, W., 1995a. Politische Justiz in Österreich 1934–1945. In: Weinzierl,E., Rathkolb, O., Ardelt, R.G., Mattl, S. (Eds.), Justiz und Zeitgeschichte.Symposionsbeiträge 1976–1993, Vol. 1, Vienna, pp. 114–138.
Neugebauer, W., 1995b. Richterliche Unabhängigkeit 1934–1945 unter Berücksich-tigung der Standgerichte und der Militärgerichte. In: Weinzierl, E., Rathkolb,O., Ardelt, R., Mattel, S. (Eds.), Justiz und Zeitgeschichte. SymposionsbeiträGe1976–1993, Vol. 2, pp. 51–74.
Neugebauer, W., 1995c. Standgerichtsbarkeit und Todesstrafe in Österreich 1933 bis1938. In: Weinzierl, E., Rathkolb, O., Ardelt, R., Mattl, S. (Eds.), Justiz undZeitgeschichte. Symposionsbeiträge 1976–1993, Vol. 1, Vienna, pp. 317–328.
Novak, B., Kingsley, P., 2018. Hungary creates new court system, cementing leader’scontrol of judiciary. (ISSN: 0362-4331) The New York Times, 2018-12-12. URL:https://www.nytimes.com/2018/12/12/world/europe/hungary-courts.html.
Österreichische Nationalbibliothek, 2011. ALEX Historische Rechts- und GesetzestexteOnline. Bundesgesetzblatt 1935. URL: http://alex.onb.ac.at/cgi-content/alex?apm=0&aid=bgl&datum=1935.
Pal, C., 2006. Heinrich Steinitz: Anwalt und Poet. Mandelbaum, Vienna.Reiter-Zatloukal, I., 2007. Richterliche Unabhängigkeit im autoritären Ständestaat.
In: Helige, B. Olechowski, T. (Eds.), Hundert (100) Jahre Richtervereinigung.BeiträGe zur Juristischen Zeitgeschichte. In: Zeitschrift der Savigny-Stiftung fürRechtsgeschichte. Germanistische Abteilung, Vienna, pp. 89–111.
Reiter-Zatloukal, I., 2012a. Die Begnadigungspolitik der Regierung Schuschnigg.Von der Weihnachtsamnestie 1934 bis zur Februaramnestie 1938. BeiträgeRechtsgeschichte Österreichs 2, 336–364.
Reiter-Zatloukal, I., 2012b. Politische Radikalisierung, NS-Terrorismus und ‘‘innereSicherheit" in Österreich 1933-1938. In: Härter, K., De Graaf, B., Sälter, G.(Eds.), Vom Majestätsverbrechen zum Terrorismus. Politische Kriminalität, Recht,Justiz und Polizei zwischen Früher Neuzeit und 20. Jahrhundert. Klostermann,Frankfurt/M., pp. 271–319.
Reiter-Zatloukal, I., 2012c. Repressivpolitik und Vermögenskonfiskation 1933–1938.In: Reiter-Zatloukal, I., Rothländer, C., Schölnberger, P. (Eds.), Österreich 1933–1938: InterdisziplinäRe Annäherungen an das Dollfuß-Schuschnigg-Regime. BöhlauVerlag, pp. 61–76.
Reiter-Zatloukal, I., 2013. Verwaltungs- und justizgeschichtliche Forschungsdesiderate1933–1938. In: Dreidemy, L., Wenninger, F. (Eds.), Das Dollfuß/Schuschnigg-Regime 1933–1938. Vermessung eines Forschungsfeldes. Böhlau Verlag, Vienna,pp. 429–448.
Rivo, S., 2011. Dr. Michael Skubl - ein polizeihistorischer Streifzug zwischen Monarchie,Ständestaat und Nationalsozialismus (Master thesis). University of Vienna.
Rothländer, C., 2012a. Die Anfänge der Wiener SS. Böhlau Verlag.Rothländer, C., 2012b. Die Durchführungspraxis des politisch motivierten Ver-
mögensentzugs in Wien 1933–1938. In: Reiter-Zatloukal, I., Rothländer, C.,Schölnberger, P. (Eds.), Österreich 1933–1938: Interdisziplinäre Annäherungen andas Dollfuß-Schuschnigg-Regime. Böhlau Verlag, pp. 77–93.
Schölnberger, P., 2012. Ein Leben ohne Freiheit ist kein Leben. Das ‘‘An-haltelager’’ Wöllersdorf 1933–1938. In: Reiter-Zatloukal, I., Rothländer, C.,Schölnberger, P. (Eds.), Österreich 1933–1938: Interdisziplinäre Annäherungen andas Dollfuß-Schuschnigg-Regime. Böhlau Verlag, pp. 94–107.
Schwerhoff, G., 2011. Historische Kriminalitätsforschung. Campus Verlag, Frankfurt/M..Shomade, S.A., Hartley, R.E., 2010. The application of network analysis to the study
of trial courts. Justice Syst. J. 31 (2), 144–163.Statistik Austria, 2015. Bevölkerung. In: Statistisches Jahrbuch. pp. 38–116, URL:
http://www.statistik.at/web_de/static/k02_054401.pdf.Stimmer, G., 1997. Eliten in Österreich, 1848–1970. In: Studien zu Politik und
Verwaltung, vol. 57/2, Böhlau Verlag, Vienna.Suttner, A., 2017. Das Schwarze Wien. Bautätigkeit im Ständestaat 1934–1938. Böhlau
Verlag, Vienna Köln Weimar.SZ.de/dpa/jsa/bix, 2020. Polen muss Gesetz zur Disziplinierung von Richtern ausset-
zen. Süddeutsche Online, 2020-04-08. URL: https://www.sueddeutsche.de/politik/polen-justizreform-richter-eugh-1.4872142.
SZ.de/kit/mati, 2020. Ungarn: Orbans Notstandsgesetz vom Parlament gebilligt. Süd-deutsche Online, 2020-03-30. URL: https://www.sueddeutsche.de/politik/ungarn-orban-notstandsgesetz-1.4862238.
Tálos, E., 2013. Das austrofaschistische Herrschaftssystem Österreich 1933–1938,second ed. LIT Verlag, Münster.
Tlapek, L.M. (Ed.), 1933. Das österreichische Strafgesetz samt Novellen undNebengesetzen nach dem Stande vom November 1933. Steyrermühl-Verl., Vienna.

C. Petz and J. Pfeffer
von Keyserlingk-Rehbein, L., 2018. Nur eine ‘‘ganz kleine Clique’’?: Die NS-Ermittlungenüber das Netzwerk vom 20. Juli 1944. In: Schriften der Gedenkstätte DeutscherWiderstand, 12, A, Analysen und Darstellungen.
Waldstätten, A., 2012. Das ‘‘Graue Haus’’. In: Bibliotheksverein im Landesgericht fürStrafsachen Wien (Ed.), Die Geschichte des Grauen Hauses und der österreichischenStrafgerichtsbarkeit. Bundesministerium für Justiz Hausdruckerei - Reinhard Eder,Vienna, pp. 24–27.
Wandruszka, A., 1975. Diskussionsbeitrag. Diskussion zum Beitrag Holtmann. In:Jedlicka, L., Neck, R. (Eds.), Das Jahr 1934: 12. Februar. Protokoll des Symposiumsin Wien am 5. Februar 1974, 2. In: Wissenschaftliche Kommission zur Erforschungder österreichischen Geschichte der Jahre 1918 bis 1938, Verlage für Geschichteund Politik, Vienna, pp. 110–111.
Wenninger, F., Mesner, M., Ardelt, R., 2017. Forschungsbericht Repression und politis-che Justiz unter dem Dollfuß/Schuschnigg-Regime. Das Beispiel Wien 1935. Pro-jektleitung Dr. Mesner (2014-15), Prof. Dr. Ardelt (2015-17), ProjektkoordinationDr. Wenninger. Unpublished manuscript.

Chapter 5
Case Study Social Networks in the Historyof Intellectuals
In the following series of studies, we approached the history of intellectuals with a net-
work perspective, computationally examining the relational importance of individuals in
intellectual history based on a Linked Open Dataset extracted from YAGO3, an ontology
linking knowledge mainly from Wikipedia. Our main research question was whether we
can make historical inferences on the patterns of relations of intellectuals.
In the first paper of this series, “‘On the Shoulders of Giants’ – Analysis of a Social
Network of Intellectual Influence” (paper no. 2), we considered the complete history of
intellectuals, and identified those intellectuals over all time with the greatest influences
(network centralities) and the longest reaching influences (influence cascade trees). In
the second paper “A Longitudinal Analysis of a Social Network of Intellectual History”
(paper no. 3), we introduced a longitudinal perspective on the dataset, which we en-
riched with a periodization. Within the resulting network snapshots, we looked for the
most important scholars within periods, in interperiod combinations, and in accumu-
lated periods, and identified the brokerage roles of intellectuals. In “Diffusion Dynamics
of Influence in a Social Network of Intellectuals” (paper no. 4), we extended this paper
by influence cascade trees and analyzed their diffusion dynamics.
In the final paper, “Tracking the Evolution of Communities in a Social Network of Intel-
lectual Influences” (paper no. 5; forthcoming), we enriched the dataset furthermore with
geographic locations of the scholars, and their disciplines, enabling a deeper dissemina-
tion of the inner workings of these periods, and identified structures of communities of
scholars.
5.1 On intellectuals and intellectual history
There is no common definition of intellectuals that can be applied universally (Ringer
1990, p. 281). There are distinctions of the ‘intellectual’ as a “social class charged with
the business of thinking”1 and a “class of phenomena [...] that is not tied to any specific
1. Such as suggested by Lasch (1965) to consider intellectuals as a social type since the late 19th
century. However, Wickberg (2001, p. 387) noted, that a generalization of intellectuals as a social type
would not be historically correct.
71

Chapter 5 Case Study Social Networks in the History of Intellectuals
class of persons” (Wickberg 2001, p. 385). In general, the term is used for anybody
concerned with thinking, i.a. researchers, philosophers, writers, scholars.
Intellectual history entails both the study of discarnate, “ageless” concepts and ideas,
as much as the lives and achievements of the intellectuals bringing forward those. In-
tellectual history itself is an umbrella concept entailing as argued by Wickberg (2001,
p. 383) on one hand the history of ideas/thought, history of science, technology, and
academic disciplines (as well as their methodologies), history of the book and reading,
conceptual history, and on the other hand the history of intellectuals (‘intellectual life’
and intellectual biography), and their meeting grounds of cultural history, cultural soci-
ology, sociology of science, and the social history of ideas and of intellectuals (compare
also to P. E. Gordon 2013).
Dependent on the focus within intellectual history, influence studied can be the influ-
ence of concepts on each other, but also personal influences of intellectuals (and their
work) on each other.
5.2 Innovation and discussion
In this series of case studies, we proposed to study the history of intellectuals from a
formalized network approach by taking the embeddedness of scholarship into account.
This allows us to understand the interconnections of thinkers throughout time, and the
dynamics of influence and the spread of ideas through history.
5.2.1 Relational intellectual history
The concept that the history of intellectuals and of ideas are situated in a complex net
of interdependencies is focus of the social history of ideas (also known as: historical
sociology of knowledge; or: social history of intellectuals), which places intellectuals
and ideas (or concepts) in an “anterior social reality” of their historical context and
social environment (Wickberg 2001, p. 384), and disseminates as well the “conditions
and modalities of ’knowledge production”’ (Goldman 1994, p. 266).
This concept of a relational positioning of ideas goes back to the 1970s and the works
of Pierre Bourdieu and Karl Mannheim. Ideas have positional or relational attributes
and exist in an “intellectual field” of negotiation processes2 within a “cultural uncon-
scious” (Bourdieu 1969, p. 89) or a “cultural pre-consciousness” as coined by Ringer,
2. Ringer (1990, p. 270) explains this concept as follows: “The intellectual field at a given time and
place is made up of agents taking up various intellectual positions. [...] it is a configuration or a network
of relationships. The elements in the field are not only related to each other in determinate ways; each
also has a specific ‘weight’ or authority, so that the field is a distribution of power as well. The agents in
the field are in conflict with each other. They compete for the right to define or to co-define what shall
count as intellectually established and culturally legitimate.” These elements can entail ideas, concepts,
theoretical positions, or persons.
72

5.2 Innovation and discussion
(p. 270) following Mannheim ([1952] 1993) concept of the “pre-theoretical” grounding
of worldviews. 3
Wickberg (2001, p. 385) described this development of a relational intellectual history
as the result of a monolithic culture called into question and turn to an ordinary history
of the “little people” (in contrast to a history of the elites) in which intellectual history
is updated “into a form of social history.”4
Drawing from Quentin Skinner, Ringer (1990, p. 272) argued for the “need to under-
stand a great text positionally, by understanding its relationship to an intellectual field,”
which can be extended to the body of works and the authors themselves, and is based
on the assumption, that texts stand in a discourse to each other. “One cannot chart
the influence of Darwin or of Nietzsche,” Ringer (1990, p. 277) wrote, “without knowing
and explaining a great deal about those who subsequently used or misused their works.”
Wickberg (2001, p. 391) however warned about to determine the “relevance of a text”
based on the “social identity of the thinker.” This kind of prejudice can be avoided by
sampling texts in an relational perspective, such as an “intellectual field” as theorized
by Bourdieu (Ringer 1990, p. 276).
A relational perspective on the history on ideas puts the focus on context. This
includes also local, national, trans- and international perspectives–in order to track the
“transtemporal and transnational voyage” of ideas (Armitage 2014). This follows both
the remark by Bonaventure D’Argonne of 1699 that ideas “embrace [...] the whole
world” (quoted in Grafton 2009b, p. 1) and picks up on the contention by Lovejoy
(1940) that ideas are the “most migratory things in the world.” Baring (2016, p. 568),
too, suggested to place “Machiavelli to post-Savonarola Florence, Freud to fin-de-siecle
Vienna” to enable new perspectives on ideas in context. These recent suggestions for a
transnational relational intellectual history answers to criticism (such as by Ringer 1990,
p. 278) of the constricted focus on “more specialized and usually biographical studies,”
limited to specific regions or time spans as a trade-off for thorough comparative and
textual analysis (compare also to Subrahmanyam 2017). Attempts to rectify these closed
perspectives and to write a global intellectual history as by Moyn and Sartori (2013)
have been criticized to focus again on already well-research intellectuals despite their
3. One effect of these negotiation processes and the situateness of ideas and intellectuals is the habitus
of groups: the habitus understood as an “tacit social knowledge internalized in the individual” (Wagner
2012, p. 450) and as a “structuring structure” it is “shaped and transmitted by the social and institutional
environment, as well as by the practices and traditions of a culture” (Ringer 1990, p. 275), as e.g., evident
in the structural homologies between Gothic architecture and scholasticism (Panofsky 1951; compare to
Ringer 1990, p. 274).4. Wickberg (2001, pp. 388–90) warned that if intellectual history would become truly part of social
history, ideas as entities would become causally instrumentalized: ideas would “come to be seen as
tools,” or “instruments to achieve goals,” ignoring that ideas could come from nothing and are not
necessarily shaped by agency (which is the driving force of social actors as perceived in social history)
nor experience. Similarly remarked this also Ringer (1990, p. 281): he warned about the tendency of
historical sociology of knowledge to portray ideas as “mere effects” of social situations and preferences,
which “deemphasize[s] the originality of creative individuals [emph. in original].”
73

Chapter 5 Case Study Social Networks in the History of Intellectuals
transnational approach (Subrahmanyam 2015).
Network approaches in intellectual history
“The digital age has been a boon for intellectual historians,” emphasized Edelstein (2016,
p. 237), as it made sources more accessible, “research more efficient than ever,” and
provided increasingly more sophisticated options for their dissemination–but “[t]he same
cannot be said, however, about our methods.” Edelstein (2016, p. 240) criticized the
underutilization of the methodologies developed in the Digital Humanities for intellectual
history, faced with the challenge of finding meaning in the quantitative abundance.
In related works, network methodologies have been implemented in the study of com-
munication and correspondence networks. The concept of a relational history of intel-
lectuals has been applied in various studies, which most often use a non-formalized and
metaphorical network perspective to analyze historical structures, such as study of the
ego network of philologist Gottfried Groddeck (Bednarczuk 2017) or the correspondence
networks of naturalist Conrad Gessner (Delisle 2008). A noteworthy exception to this is
the early study on Jesuit travels, in which Harris (1999, pp. 228–9) hypothesized “thread
maps” as schematic models, which he differentiated using a network terminology, e.g.,
by identifying outgoing links. Lacking the tools to depict those networks systematically,
Harris (1999, p. 227) voiced the regret that these “thread maps” remain “an exercise in
imagination” as “the actual mapping of provenance for all the constituents of a scientific
text would be an exceedingly tedious task.” In a further step of progression, the early
study by Schaffer (2008) to reconstruct the influences and contacts on Isaac Newton’s
“Principia Mathematica” already used maps, on which these information have been
manually identified and linked. Advances in the computational depiction of space–such
as in historical GIS–and tools have been developed since.
The web-based visualization tool Palladio5 was one such tool, which was developed
in 2009 in the course of a project at Stanford University to map and link historical
intellectual networks of the respublica litterare. The project “Mapping the Republic of
Letters”6 was one of the first studies on intellectual history employing digitization of
sources, text processing, and formalized network methodologies. In 2008, the project
started at Stanford University with the objective to research the network of letters of
intellectuals of the 17th and 18th as a whole as well as focusing on individual ego networks
in a series of case studies7, mapping the epistolary exchanges and migratory patterns as
spatial networks of a “cultural space” (Edelstein et al. 2017, pp. 421–2). More recent
5. https://hdlab.stanford.edu/palladio/6. http://republicofletters.stanford.edu/7. In these, the ego network of Jesuit polymath Athanasius Kircher (Edelstein et al. 2017, pp. 404–
9), the international relationships of John Locke (compare to http://republicofletters.stanford.edu/
publications/locke/), the ties of Voltaire to England (Edelstein and Kassabova 2020), and Benjamin
Franklin’s correspondences during the “London Decades” (Winterer 2012) were researched, as well as
the ties of British architects on the Grand Tour in Italy (Cesarani et al. 2017).
74

5.2 Innovation and discussion
projects on the “Republic of Letters” have incorporated a temporal perspective on multi-
layered dynamic networks (Vugt 2017), or reflected on the challenges to model discrete
and continuous time when dealing with fuzzy dating (Kudella 2019, p. 50). In 2019, a
compendium was published reflecting on the challenges encountered when “Reassembling
the Republic of Letters in the Digital Age. Standards, Systems, Scholarships” (edited by
Hotson and Wallnig 2019), addressing issues with assembling and standardizing data,
the transcription of text, and modeling of geographies, chronologies, prosopographies,
and mining the available database of letters. The volume intended to pave way for a
greater linkage of data to fulfill their vision to “reconcile the records of all the learned
letters scattered across and beyond Europe” (Hotson 2019, p. 450).
Recently, also Verbruggen et al. (2020) studied in an actor oriented approach organi-
zational mobility patterns of social activists and reformers in the long 19th century based
on the biographical database TIC Collaborative8, which records for the 19th and early
20th century international organizations and congresses memberships (ibid., p. 133). In-
fluenced by the analysis of social movements and collective actions, this study tracked
temporal changes in the “evolution of networks and organizational exchanges” using the
tools Nodegoat and Gephi (ibid., p. 127).
5.2.2 Methodological approaches
The following series of case studies combine both a global transnational perspective on
the history of intellectuals and a formalized network analysis of the emerging networks
of influences, and builds on the concept that the history intellectuals is a sequence of
intellectual genealogies and their competing influences on each others.
A formal network analysis of a social network of intellectual influence
We considered the complete history of intellectuals as recorded in the knowledge database
YAGO.
On LOD and YAGO. YAGO9 is a knowledge base developed at the Max Plan Institute
for Informatics, that links open data from Wikipedia10, WordNet11, and GeoNames12.
YAGO’s extraction of information from these sources employ text mining and web scrap-
ing techniques, as well as natural language processing of e.g., entity disambiguation
and result filtering (compare to Suchanek et al. 2007, n.d.; Mahdisoltani et al. 2015).
Linked Open Data (LOD) are license-free data formatted in the standardized Resource
8. https://www.ghentcdh.ugent.be/projects/tic-collaborative9. Yet Another Great Ontology. See https://www.mpi-inf.mpg.de/de/departments/databases-and-
information-systems/research/yago-naga/yago; compare also to Suchanek et al. (2007).10. https://www.wikipedia.org/. Information are extraced from e.g., Wikipedia’s categories, redirects,
and infoboxes.11. In order to extract senses, hyponymy, etc.; compare also to Miller (1995).12. http://www.geonames.org/
75

Chapter 5 Case Study Social Networks in the History of Intellectuals
Description Framework (RDF) (for an overview compare to Bizer et al. 2009). These
data are tagged with information using unique and machine-processable identifiers (Uni-
form Resource Identifiers, URI), which allow to establish relations between entities from
previously unrelated datasources. The idea of the LOD goes back to the idea of the
interconnected Semantic Web and to establish a Web of Linked Data–with the intend
to fruitfully utilize the available (open) data. This creates many areas of application;
one well-known example is that of Google’s Knowledge Graph, which evaluates the con-
text of a search term in order to provide relevant information (Singhai 2012; Romein
et al. 2020, p. 11). YAGO is one of the pioneers to contribute to the Web of Data:
it hosts more than 120 million information on more than 10 million entities and it is
integrated into the linked data cloud through the DBpedia ontology13 and the SUMO
ontology14. We worked with YAGO 3 (published 2015, which we extracted in 2018),
which records in an yago:influence predicate the relations of scholars who are influenced
by the ideas, thoughts or works of other scholars, as specified in datasources of YAGO
such as Wikipedia and WikiData; it’s accuracy has been evaluated as of 95% (Mahdis-
oltani et al. 2015). We extracted a (raw) dataset from YAGO3 that encompasses all
influence relationships available with an SPARQL query15 as suggested by Ghawi and
Pfeffer (2019). Using the triple structure of the RDF data model (subject, predicate,
object), we reinterpreted this as a (node, edge, node) relationship within a social network
of influence, in which the influence relation between two scholars make up the edges and
nodes in our social network of influence.
Methodological approaches. In “‘On the Shoulders of Giants’ – Analysis of a Social
Network of Intellectual Influence”16 (paper no. 2), we identified the most important
intellectuals according to their positions in a social network of intellectual influence,
and studied the underlying influence structures in the network. The directed network
graphs as described in the following were created in Python with the Python::NetworkX
library17 (Hagberg et al. 2008). We described the network’s properties of
- connectivity (identifying the amount and size of strongly and weakly connected
components)18 in order to identify the largest weakly connected component, which
entails 81% of nodes and 93% of edges of the complete network, which we used for
the remaining analysis.
13. https://linkeddata1.calcul.u-psud.fr/sparql (Accessed 2019-07-15).14. http://www.mpi-inf.mpg.de/gdemelo/yagosumo/15. For an introduction to SPARQL compare to Prud’hommeaux and Seaborne (2008) and Harris and
Seaborne (2013).16. The following descriptions draw from Ghawi et al. (2019).17. https://networkx.org/18. Strongly connected components are sub-graphs that consist of a maximum number of nodes, which
have a direct path to another node within the sub-graph. Weakly connected components have at least
one undirected path between nodes (compare to Hennig et al. 2012, pp. 114, 120).
76

5.2 Innovation and discussion
- centrality and degree distribution (identifying the most central scholars, with the
greatest betweenness19 and closeness20 centralities, as well as those being the most
influential to others–with the highest out-degree–and most influenced by others,
i.a. with the greatest in-degree. The analysis of their distribution allowed us to
identify the network as a scale-free network with a power-law degree distribution
(Clauset et al. 2004; Hennig et al. 2012, pp. 119–20).
- flows of influence (identifying what we conceptualized as source nodes21, inner
nodes with positive in- and out-degrees, and sink nodes22, as well as evaluating
the reciprocity of influences23.
- triadic census (frequencies of the 16 possible triadic configurations as described by
Holland and Leinhardt (1976) and Batagelj et al. (2014), e.g., to identify three
nodes that influence each other in a ‘teacher-student’ cycle when u influences v,
who influences w, and u also influences w).
- Furthermore, we identified the diffusion dynamics of influence by tracking the
longest reaching influences in the network24 in influence cascade trees, which size25,
(average) depth26, and (average) breadth27, and their correlations we studied. A
cluster analysis using a k-mean clustering algorithm with k=2 (MacQueen 1967;
Lloyd 1982) identified clusters of small and large cascades. The emergence of large
cascades we interpreted as the result of far-reaching influences from Greek-Roman
antiquity and the Medieval Ages.
Longitudinal analysis. In “A Longitudinal Analysis of a Social Network of Intellectual
History”28 (paper no. 3), we extended our previous analysis with a temporal perspec-
tive, adding a longitudinal perspective on how these intellectual influence networks were
formed. We therefore extracted birth and death dates for each scholar in the dataset,
and controlled for missing information, which we either deduced by subtracting 60 years
from their death date and vice versa (up to the symbolic year of 2020), or manually
verified them when both were missing. This also involved some cleaning of data that did
19. Measuring how often an entity lies on the shortest path between two other entities, i.a. which
intellectuals serve as a bridge from one intellectual to others.20. Measuring how close an entity is to all other entities in the network, i.a. identifying the intellectual
with the shortest directed path of influence to other scholars.21. Who are not influenced by another scholar, i.a. their in-degree is zero.22. Who have no succeeding influence on another, i.a. whose out-degree is zero.23. Which we found to be evident in contemporaries only.24. For which analysis, reciprocal ties had to be resolved by arbitrarily choosing one of the reciprocal
edges in order to transform the graph into a directed acyclical graph (DAG) for each root node with an
in-degree of zero, which we referred to as cascade.25. The amount of nodes present in a cascade starting from a root node.26. The length of the largest path starting from the root node in the cascade.27. The maximum number of (influenced) entities at any depth of a cascade.28. The following descriptions draw from Petz et al. (2020).
77

Chapter 5 Case Study Social Networks in the History of Intellectuals
not correspond to individual intellectuals, such as e.g., concepts, legendary characters,
or groups.
In related work, longitudinal networks (also refereed to as: temporal, dynamic or
time-varying networks) have been used to model the changes of networks in time by col-
lecting edge-relations at various time-points, which are then analyzed using time-slices
of the complete network at various time points, i.e. resulting in static networks that can
be described with the established network methodology (Wasserman and Faust 1994,
pp. 730–1; Hennig et al. 2012, pp. 55–6; Batagelj et al. 2014, pp. 23–5).29 As data at
varying time-points is hard to acquire, this is used most often in panel data based on
interviews in social studies (as for example in the study on changes in personal networks
of immigrants by Lubbers et al. 2010) in order to understand how social structures de-
velop or change over time (Batagelj et al. 2014, p. 2; for an overview compare to Holme
and Saramaki 2019).
In order to transform the static complete network, we structured the dataset into pe-
riods using a global periodization, which satisfies the demands for an inclusive, transna-
tional and global view on the history of intellectuals in order to move beyond the “mas-
ter narratives” (Ganger and Lewis 2013, p. 347) of a Western European centrist view
(Subrahmanyam 2017).30 The global periodization as proposed by Osterhammel (2006)
compartmentalized the continuous time-span of history into sections, i.a. consecutive
periods or eras, into which we embedded the network entities. We mapped each scholar
into a singular and unambiguous era by calculating the midpoint of the scholar’s lifes-
pan (minus the first 20 years of their lives) and manually outliers resulting from different
dating schemes (e.g., missing signs for BCE, or the Hijri calendar instead of the Grego-
rian) correcting reverse links of eras (this usually happened, when the influencing scholar
lived much longer than the influenced one). The final cleaned data set consists of 22,485
influence links among 12,506 intellectuals.
The periodization allowed us to slice the whole network into six network snapshots,
in which we interpreted micro-level influences among scholars as macro-level influences
among periods of history. Using these network snapshots, we proceeded in a fine-grained
analysis of influence networks within each period (which we dubbed within-era), between
chronologically ordered but not necessarily consecutive pairs of periods (inter-era), and
in consecutively accumulated periods (accumulated-era, which include all intellectuals up
to and including a target period). This allowed us to make more fine-tuned inferences
29. Recent conceptualizations of longitudinal networks include stochastic actor-oriented models for
dynamic networks, in which “composition changes are modeled as exogenous events that occur at given
time points” (Huisman and Snijders 2003, p. 253; compare also to Snijders et al. 2010), Relational Event
Models (REM) (Butts 2008), or Time Varying Graphs (TVG) (Casteigts et al. 2012), or new approaches
such as stream graphs with temporal nodes and temporal links (Latapy et al. 2018).30. On the conceptualizations of periodizations compare to the following part on periodization as a
model.
78

5.2 Innovation and discussion
on
- the importance of scholars (greatest influence within a period, on contemporaries,
and on intellectual descendants in succeeding periods),
- the characteristics of these longitudinal sub-networks (in regard to their structural
metrics, degree, number of weakly and strongly connected components, reciprocity,
and transitivity as has been outlined above for the complete network–which in the
context of the network snapshots represents the final accumulated-era network–,
as well as e.g., on the self-containment of a period’s influence or its influence on
other periods),
- patterns of influence of intellectuals over periods (We described influence patterns
of periods to establish the frequency of directed influence from a period to another.
We conceptualized an individual longitudinal influence power of scholars as an
indicator for the influence of an intellectual throughout history, which considers
both the number of influence links (= influence intensity) and the consistency of
influence over many periods, i.a. the temporal influence diversity), and
- the structural knowledge broker roles scholars took in these influence networks
(following the concept by Gould and Fernandez 1989), in which we re-framed
the concept of group membership as that of in periods, differentiating between
Liaison31, Gatekeeper32, Representative33, and Coordinator34 brokerage.
This study was extended in “Diffusion Dynamics of Influence in a Social Network
of Intellectuals”35 (paper no. 4) to consider influence cascade trees and the diffusion
dynamics in the networks.
Periodizations as models. We split the time-span using a periodization that takes
a global perspective into account, befitting the internationality of the scholars in our
dataset.
A periodization is a construct of analysis: it is used to divide time into sections that
share meaningful characteristics based on important caesura points–which are usually
not based on the calendarial flow of time (Osterhammel 2006, pp. 52–3). Osterhammel
(2006, p. 49) called periodization part of the basic vocabulary of history; as such they
31. When a node A influences B, which in turn influences C, B has the structural position of a Liaison,
if all nodes belong to different groups/periods.32. The node B has the structural position of a Gatekeeper, if the node A does not belong to the same
group/period as B and C.33. The node B has the structural position of a Representative, if the node C does not belong to the
same group/period as A and B.34. The node B has the structural position of a Coordinator, if all nodes belong to the same
group/period.35. The following descriptions draw from Ghawi et al. (2021).
79

Chapter 5 Case Study Social Networks in the History of Intellectuals
are both “inevitable” but only “ostensibly exact” (“scheinexakt”, Osterhammel 2006,
p. 48). Periodization are highly variable: each field of research argues for their own
timeline-characterizing periods, which are dependent on different weighting of points of
caesura and on the respective object of research (Pot 1999, p. 63; Osterhammel 2006,
pp. 50–51, that are a compromise of “either highly local definitions or definitions that
are so broad and vague as to be all encompassing” (Rabinowitz 2014).
We can reframe the constructive nature of periods as that of a model that structures
the perception of and group processes in time based on attribution and significant points
of caesura. Recently also Flanders and Jannidis (2019a, p. 3) expressed the idea that
periodizations are models shaped by “choices we made in representing and analyzing the
materials we study.” These models of periodization are necessarily a reduction.
These events used as anchoring caesura might be the result of previous developments
and not their starting point, but used out of custom, such as the end of the German
Kaiserreich with the loss of World War I in 1918, instead of already politically in mid-
1916 (Osterhammel 2006, pp. 49–50); the beginning and end of processes might also
be difficult to directly pointed to a specific data (ibid., p. 48). As such, periodization
are put under high scrutiny and discussion–used as a tool of focus to analyze certain
phenomena.36
“Periodizations are always a play with many solutions, not a puzzle which can be put
together ‘correctly’,” summarized Osterhammel (2006, p. 57) the problematic argumen-
tative nature of periodizations.37 In oder to establish a longitudinal perspective on a
global scale that matches the internationality of intellectuals in our dataset, we opera-
tionalized the global periodization as proposed by Osterhammel (2006). He structured
the process of time from a global perspective into six consecutive periods: from Antiquity
(up to 600 AD), Middle Ages (600—1350), Early Modern Period (1350—1760), Tran-
sitioning Period (1760—1870), Modern Age (1870—1945), and Contemporary Period
(1945—2020).
As a consequence, differences in the evolution of network structures are not necessarily
related to those historical events; but might be the result of previous developments, and
not their starting point.
Detecting communities. In the final paper, “Tracking the Evolution of Communities
in a Social Network of Intellectual Influences”38 (paper no. 5; forthcoming), we enriched
the dataset furthermore with geographic locations of the scholars, and their disciplines,
enabling a deeper dissemination of the inner workings of these periods, and identified
36. The project “Periods, Organized” (PeriodO, 2014–2018) by Adam Rabinowitz and Ryan Shaw
reflects on the multiplicity and heterogeneity of periods utilized in scholarship by giving an overview on
periods established by scholarship dependent on their spatial and temporal coverage (Rabinowitz 2014),
compare to https://perio.do/en/.37. Translated from German by the author. The quote reads in German: “Periodisierung ist immer
ein Spiel mit mehreren Losungen, kein Puzzle, das ‘richtig’ zusammengesetzt werden kann [...].”38. The following descriptions draw from Petz et al. (2021).
80

5.2 Innovation and discussion
structures of communities of scholars. We tracked the formation and evolution of in-
tellectual communities (up to and not including the Contemporary period) to facilitate
a better understanding of the emergence and evolution of schools of thoughts, and to
test whether we can computationally identify trends in the history of intellectuals. The
perspective on the history of intellectuals as organized in network communities can thus
serve as a starting point for an analysis of the transformation and evolution of intellectual
thought.
The underlying idea of community structures in networks is that the nodes within a
group (community, or cluster) have a higher likelihood of being connected to (and to
interact with) each other than to members of other groups (Girvan and Newman 2002;
Leskovec et al. 2008; Fortunato 2010). This closeness of members within communities
is based on similarity; is assumes implicitly an underlying structuring principle of ho-
mophily39 (Dakiche et al. 2019; compare also to McPherson et al. 2001). Community
detection is used to infer on the organization of networks, and to classify nodes based
on the roles they take within their community. Several methods have been developed to
find communities in networks (for an overview compare to Fortunato 2010).
In addition to the previously describe pre-processing (data cleaning, adding a global
periodization, mapping intellectuals into periods), we further manually enriched the
dataset with the geographic domain of agency for each intellectual (geo-location) and
their main area of work (main discipline) in a human annotation process with pre-
selected categories; the result in turn was then manually verified. In the process of this,
we found further entities that had to be removed as they were either non-intellectual
inspirations40, or groups which members already were included in the dataset. The
final cleaned dataset (of up to the Contemporary period) consists of 5,287 intellectuals
with 7,803 influence relations. We described the general characteristics of the network
based on the frequencies of the disciplines, regions, and periods, and the distribution
of scholars of their combinations in 2-dimensional matrices (era-discipline, region-era,
region-discipline), which allowed to inferences on e.g, differences in centralization of
research in the Medieval Arab world and in Medieval Europe.
Then, we constructed the five accumulated influence networks over the five periods,
and
- applied a community detection algorithm. As the influence network is a directed
network, we used the InfoMap community detection algorithm as implemented in
the map equation framework (Bohlin et al. 2014): neighboring nodes are joined
into modules (clusters), which then are joined into super modules. We applied
this InfoMap algorithm on each of the five accumulated-era networks. As the
InfoMap algorithm is based on random walks, it would produce different results
each time when executed–therefore, we had to chose one seed (the algorithm’s
39. Conceptualized by McPherson et al. (2001) as a selection strategy within social processes based on
common features.40. Such as the sailor Owen Chase, whose biography had inspired Hermann Melville’s “Moby Dick.”
81

Chapter 5 Case Study Social Networks in the History of Intellectuals
entry configuration) in order to provide for a consistent clustering run over all five
networks. We developed the following evaluation method in order to derive to
the most coherent result: We based this evaluation on the homogeneity of these
communities on the attributes surveyed in preprocessing, and defined a diversity
measure, which ranges from 1 if the group is completely heterogenous, and 0 if
completely homogenous:
diversity(A) =
{0 if L = 1N−1L−1 otherwise
(5.1)
For each era, we evaluated the diversity of the community detection algorithm
10 times with a different randomization seed, in order to derive to homogenous
communities. We combined these results with a weighted average41; the diversity of
each clustering run was then calculated as the average diversity of the communities
detected. Out of this sample of 10 randomized clustering run, we chose the initial
seed of the clustering that had the lowest diversity, i.e. the most homogenous set
of communities.42
- we described the composition and size of the resulting communities in each (accu-
mulated) period network. An interesting phenomena in this regard, is that com-
munities in each period were characterized by a major era and major region, and
an intermediate level of diversity in disciplines, despite the weighting as described
above.
- tracked the evolution of these communities over time in the consecutive eras fol-
lowing the approach by Greene et al. (2010). This identifies as set of dynamic
communities, i.e. a type of “evolving complex networks” present in a network
across various time steps43, which composition change due to the behavior of its
members (Dakiche et al. 2019, p. 1085; compare also to Qiu et al. 2010). The evo-
lution of a dynamic community can be described with life-cycle events of each of
their step communities at time step t, such as its birth44, death45, merge events46,
41. We weighted the disciplines the highest with 45%–following the observations that scholars of specific
disciplines influenced others of the same discipline the most–, regions 30% following the contention
that spatial distances are not unbridgeable and that connection should weight more in a transnational
perspective (Baring 2016), and eras 25%.42. The influence of the recorded discipline in the evaluation of the homogenity/diversity of communities
is obvious. A robustness analysis of the influence of the specificity of the main discipline could shed light
on the changes in the diversity measure, when different or multiple disciplines were to be recorded for
each intellectual (instead of focusing on only one main discipline as in this analysis).43. A community at a certain time step is therefore referred to as step communities.44. The ermergence of a step community at time step t, when there is no preceding corresponding
dynamic community.45. The dissolution of a dynamic community, that has no succeeding corresponding step community.46. Two dynamic step communities match to a single step community, and share a common timeline
from this time step.
82

5.2 Innovation and discussion
as well as split or continuation events. In order to identify these life-cycles of
dynamic communities, their evolution needs to be tracked in time: a heuristic
threshold-based method allows to to this with many-to-many mapping approach
between communities across different time steps.47 The matching and classifica-
tion process48 continues until all communities have been processed. The matching
process is dependent on a matching threshold of similarity. While usually the Jac-
card index49 is used for this matching (as e.g., proposed by Greene et al. 2010), it
focuses on the overlap in two communities, instead of on how many members of a
front community is present in the next step community. We opted to use instead
the Quantity Insertion measure (QI) (Boujlaleb et al. 2017, p. 6132), which focuses
on the amount of members of a front community present in the subsequent step
community. If the similarity of front and step communities exceeded a match-
ing threshold of θ ∈ [0, 1], the community pair is matched, and can be classified
according to the life-cycle events as outlined above. For our analysis, we used a
similarity threshold of θ ≥ 0.5, i.a. a match occurred if 50% or more scholars of a
step community belonged to the respective front community.50 This allowed us to
structurally describe the number of step communities (that start a dynamic com-
munity), the number of distinct intellectuals across the whole dynamic community
and their average number of scholars (which subtracted allows us to measure the
change behavior of a dynamic community and differentiate between self-containing
stable and highly changing unstable communities), and to describe the pattern of
evolution of communities per era. Furthermore, we could establish the step-wise
similarity of communities for scholars using the Jaccard and QI measured and
based on the three dimensions of geo-categories, periods and disciplines using a
cosine similarity51. This allowed us to structurally describe the step-wise similar-
ity of communities analyzing the loss and gain numbers of lost and new members
in the step communities, the forward and backward stability of ratio of scholars
present in the succeeding and preceding step community, and their correlation,
and specific sub-type of a self-contained community with a stable set of members
47. Many-to-many mappings refer to the mapping of relationships of the instances of entities, that can
be present in source/parent instances and in target/children instances in another entity. In this context,
this means that a community can consist of scholars that are present in a subsequent or preceding
community of a later or earlier period; this relation is tracked by the method. A matching of communities
occurs, if the similarity of both exceeds a certain threshold of θ ∈ [0, 1]. The step community at a time-
step t is considered a front, the succeeding community at time-step t + 1 its respective step community.48. The identification of the relationship between step communities within a dynamic’s community, as
fronts and steps (iteratively progressing with each time step).49. The Jaccard index/coefficient establishes the similarity of a sample set (i.e. communities), based
on the overlap of the sample set (e.g., the overlap of two communities) divided by the size of the united
sample set (e.g., the sum of those two communities combined).50. This entails that intellectuals can ‘change’ their step communities in different periods.51. This allowed us to describe each dimension in vector form: e.g., a community with 6 scholars from
Europe and 4 scholars from the Americas can be represented as (0,6,0,0,4,0).
83

Chapter 5 Case Study Social Networks in the History of Intellectuals
through its dynamic evolution. This helps to study the genealogy of scholars as
operationalized in the evolution of dynamic communities, and to understand the
variety of relation influence, as well as provides a means to computationally iden-
tify schools of thought (operationalized as homogeneity in community members),
which we then can exemplify in the changes of core groups and floating members.
A master narrative. The aforementioned studies are based on a dataset extracted from
YAGO. Intellectuals as recorded in YAGO entail a broad group of thinkers: from philoso-
phers, natural scientists, artists, writers, anthropologists, to physicians, mathematicians,
polymaths, and many more.52 An intellectual (and their influence relations) appears in
the dataset extracted from YAGO if there was an influence recorded from or to other
scholars in the datasources that are linked within YAGO: Wikipedia, WikiData, DBpe-
dia, WordNets, or GeoNames53 As a result, the information on the influence relations
of intellectuals in YAGO are not exhaustive.54 The information of the included intel-
lectuals and their main influences draw mainly from Wikipedia–the “primary source of
knowledge for a huge number of people around the world” (Anderka 2013, p. 12)–, and
consequently represent a crowd-sourced and semi-popular knowledge on intellectuals and
their influence relations in history.
The reliability of the information on the online encyclopedia Wikipedia is ensured
with a consistent “major peer review activity” (Viseur 2014, p. 3). This review process
has been majorly professionalized in the last decade, including regular proof-reading
and peer-reviewing, traceability of changes and version control, and the facilitated re-
versing of vandalized articles using the MediaWiki software55 (Anderka 2013, p. 9). As
such we consider the collection of and information on scholars to closely represent the
current state of research. They encompass what can be considered the ‘main’ intel-
lectuals in history. These are neither exhaustive nor unbiased: they are focused on
major ‘canonized’ and male scholars from mainly Europe (despite featuring scholars
from all over the world). This “gender gap” entails a lack of entries on female scientists
and the higher probability of those to be deleted (K. Kramer 2019). Projects such as
the ‘WikiProject Women in Red” by Roger Bamkin56 and the “Project Vox” at Duke
University Libraries57 addressed this by systematically including the under-represented
female entries. In 2016, only 16.72% of entries in the English Wikipedia were on women
(Stephenson-Goodknight 2016); this was raised to 18% in 2018 (K. Kramer 2019). These
changes however are not reflected in the dataset, as YAGO3 was created already in 2015.
52. The following parts are based on Petz et al. (2021).53. Compare to section 5.2.2 on LOD and YAGO.54. We might note e.g., the Medieval writer Bernardus Silvestris (1085–c. 1160), who influenced “the
father of English poetry” Geoffrey Chaucer (c. 1340–1400). While the former is not included in the
dataset, the latter is; his main influence however is recorded as Ovid.55. https://www.mediawiki.org/wiki/MediaWiki56. https://en.wikipedia.org/wiki/Wikipedia:WikiProject Women in Red (Accessed 2020-09-12)57. https://projectvox.library.duke.edu/ (Accessed 2020-09-12)
84

5.2 Innovation and discussion
When reviewing for female philosophers of the Early Modern period as highlighted by
“Project Vox,” 3 out of 7 appear in this dataset.58 Scholars from Asia, Africa, and the
Americas, too, are vastly underrepresented in the English Wikipedia.
The dataset extracted from YAGO constitutes an abstract view on intellectual history
recording the ‘most important’ influences on the ‘most important’ (canonized) intellectu-
als, which reflects closely the current state of research as added by a crowed-sourced and
crowd-curated Linked Open Data community–a contemporary view on the history of in-
tellectuals and their main influences on another similar to the broad strokes of a “Meister-
erzahlung” (master narrative),59 Any findings necessarily iterate their representation–as
such the results derived represent the main figures and their main influences and en-
tail representation biases favoring male European intellectuals (despite a general global
stance of the dataset).60
58. These are philosopher-rethorician Mary Astell (1666–1731), philosopher-mathematician Emilie du
Chatelet (1706–1749), and philosopher Anne Conway (1631–1679).59. Jarausch and Sabrow (2002, p. 10) reflected on master narratives to encompass both diverging
interpretations of historical events, and an universalist macro-perspective on a recollection of history.
The term oscillates between the respect for the opus magna of a “poet laureatus,” and the ironization of
the love poems of the Late Medieval Meistersinger (master singers)–both lines of traditions point to the
“constructive character of any historiography” (translated from German by CP, ibid., p. 12).60. For a discussion of future directions to counter-act these biases please refer to section 6.3.4.
85

Chapter 5 Case Study Social Networks in the History of Intellectuals
’On the Shoulders of Giants’, Analysis of a Social Network of
Intellectual Influence.
Authors
Ghawi, Raji, and Petz, Cindarella, and Pfeffer, Jurgen
In
Sixth International Conference on Social Networks Analysis, Management and Security
(SNAMS) 2019, pp. 248–255. DOI: 10.1109/SNAMS.2019.8931821
Abstract
Intellectuals, scholars, philosophers, writers, and scientists, and their work are embedded
in a long history of ideas. These traditions disseminated and diffused over a long history
spanning from Greek-Roman antiquity to recent times. But how did those lines of tra-
ditions and influence of thoughts develop over the ages? How did intellectuals influence
each other? What is the most farreaching impact of influence, as well as who are the
most immediate influencing, and the most influenced by other intellectuals in history?
To answer these types of questions, we mined a network of influence among over 12
thousand intellectuals, from YAGO, a pioneering data source of Linked Open Data.
We conducted several essential types of social network analysis, concerning connectiv-
ity, degree distribution, prestige (influence), and importance (centrality). We studied
the diffusion dynamics of influence by analyzing the influence cascades in terms of size,
depth and breadth. One interesting finding is the identification of two major, disjoint
categories of small and large cascades of influence.
Contribution of thesis author
Theoretical operationalization, iterative evaluation of computational implementation
and analysis, contextualization, as well as manuscript writing, revision, and editing.
86

‘On the Shoulders of Giants’, Analysis of a Social Network ofIntellectual Influence
Raji Ghawi, Cindarella Petz and Jurgen PfefferBavarian School of Public Policy
Technical University of Munich, Munich, GermanyEmail: {raji.ghawi, cindarella.petz, juergen.pfeffer}@tum.de
Abstract—Intellectuals, scholars, philosophers, writers, andscientists, and their work are embedded in a long history of ideas.These traditions disseminated and diffused over a long historyspanning from Greek-Roman antiquity to recent times. But howdid those lines of traditions and influence of thoughts developover the ages? How did intellectuals influence each other? Whatis the most far-reaching impact of influence, as well as who arethe most immediate influencing, and the most influenced by otherintellectuals in history?
To answer these types of questions, we mined a network ofinfluence among over 12 thousand intellectuals, from YAGO, apioneering data source of Linked Open Data. We conductedseveral essential types of social network analysis, concerningconnectivity, degree distribution, prestige (influence), and impor-tance (centrality). We studied the diffusion dynamics of influenceby analyzing the influence cascades in terms of size, depth andbreadth. One interesting finding is the identification of two major,disjoint categories of small and large cascades of influence.
I. INTRODUCTION
“If I have seen further, it is by standing on the shouldersof Giants”, wrote natural scientist Isaac Newton in 1675 tohis contemporary, the polygraph Robert Hooke [19]. By thesewords, Newton expressed the meaning of learning through imi-tation and building-upon established knowledge. This conceptgoes back to 12th century, attributed to scholar Bernard ofChartres [25]. The history of ideas (and as such the historyof intellectuals) is such a sequence of ideas based upon ideasthat came before, intertwined lines of thoughts, and competingtraditions of influential intellectuals.
There are changing assessments on who the most influentialintellectual supposedly was, and recent discussions point tothe need of a more global and representative perspective ofwho to actually include in a history of intellectuals [22].Understanding the interconnections of thinkers throughouttime, and the dynamics of influence and spread of ideasthrough history, we argue this should be answered by takingthe embeddedness of scholarship into account. We tackledthis using a network approach, re-framing the question of themost important intellectuals to their position in a network of ahistory of ideas. This allows to study their social relations andinteractions [27], [11], [20], and to provide deep insights intothe underlying social structure of the network. We such placeover 12 thousand intellectuals from Greek-Roman antiquityto recent times in their web of influence by extracting theseconnections from linked open data from YAGO, as proposedfirst in [7]. At YAGO, influence relations appear in termsof the yago:influences predicate that relates a person
(intellectual) to another when the latter is influenced by theideas, thoughts, or works of the former. Studying this typeof influence social network provides us deep insights in theevolution of the history of intellectuals. Which scholar influ-enced the most other intellectuals? Who was most inspired (orinfluenced) by others? And what tradition has proven to be oflongest lasting influence? To understand their social structureof influence, we conduct different basic analysis includingthe connectivity and triadic census of the network, the degreedistribution and centrality of the actors, and the reciprocity andtransitivity of the influence relations. Our particular interestlies in the dissemination of diffusion dynamics of influence,as the spread of influence takes the form of cascades inthe network. These influence cascades can be characterizedusing several properties, such as size, depth, and breadth.For all actors in the network, we measure and analyze theseproperties, and categorize the actors based on the propertiesof their influence cascades.
The contributions of this paper are:• we address the intellectual influence among scholars,
philosophers, writers, and scientists through history usinga network approach.
• we extract a social network of influence among intellec-tuals from YAGO, a major linked open data source.
• we conduct essential social network analysis, to answerseveral research questions about the the social structureof intellectual influence.
• we study the diffusion dynamics of influence through theanalysis of influence cascades in terms of size, depth, andbreadth. Among our findings is the identification of twodistinct categories of cascades.
The paper is organized as follows. Section II gives anoverview about the used data and the analysis method.Section III presents the essential analysis of the network, suchas connectivity, degree distribution, and centrality. SectionIV is devoted to the analysis of the diffusion dynamics ofinfluence. Section V concludes the paper.
II. DATA AND METHOD
A. Data
The Web is evolving from a “Web of linked documents”into a “Web of linked data”. Underpinning this evolution isa set of best practices known as Linked Open Data (LOD)
© 2019 IEE. Internal or personal use of this material is permitted. Reprinted, with permission, from Ghawi, Raji, Petz, Cindarella, and Pfeffer, Jürgen. 2019. “‘On the Shoulders of Giants’ – Analysis of a Social Network of Intellectual Influence.” In Sixth International Conference on Social Networks Analysis, Management and Security (SNAMS), Granada, Spain, 248–255. doi:10.1109/SNAMS.2019.8931821.

[3], which provide mechanisms for publishing and connect-ing structured data on the Web in a machine-readable formwith explicit semantics. Recently, the so called LOD cloudcontains over 1200 datasets, with billions of facts from manydifferent domains like geography, media, biology, chemistry,economy, energy, etc, and millions of links between entitiesfrom different datasets. The richness and openness of LODmake it an invaluable resource of information, and createnew opportunities for many areas of application. One of theinteresting data sources of LOD is YAGO (Yet Another GreatOntology) [23], [15], which is a huge semantic knowledgebase, developed at the Max Planck Institute for ComputerScience in Saarbrucken. YAGO was among the first projectsto extract semantic knowledge at large scale from Wikipedia.Together with DBpedia [4], it is one of the pioneering con-tributors of the web of data. Currently, YAGO contains morethan 10 million entities and more than 120 million facts aboutthese entities. The information in YAGO is extracted fromWikipedia1 (e.g., categories, redirects, infoboxes), WordNet[18] (e.g., synsets, hyponymy), and GeoNames2. The accuracyof YAGO was manually evaluated to be above 95% on asample of facts. To integrate it to the linked data cloud,YAGO has been linked to the DBpedia ontology3 and tothe SUMO ontology4. YAGO has been used in the Watsonartificial intelligence system [6].
We used YAGO as our data source, where we are particu-larly interested in yago:influences predicate that relatesintellectuals based on their influence relationship. The confi-dence score of this relation is 0.9625, as calculated by YAGO.However, the way YAGO recovered this type of knowledgefrom Wikipedia and WordNet is a sophisticated process, thatexploits Wikipedia infoboxes and categories, and involvesentity disambiguation and result filtering among others. [23],[24], [15]
To extract our target influence social network, we used aSPARQL [21], [10] query as shown in Figure 1. The query hasbeen executed over YAGO’s SPARQL endpoint.5 The resultof the query is a list of 22,818 records, where each recordhas two elements labeled u and v, that represent two actors(intellectuals) where u influences v. These records representthe edges of our target social network of influence.
Fig. 1. SPARQL query used to extract the influence social network
SELECT ?u ?vWHERE {?u yago:influences ?v.
}
This technique to extract social networks from LOD is
1https://www.wikipedia.org/2http://www.geonames.org/3http://www.mpi-inf.mpg.de/departments/databases-and-information-
systems/research/yago-naga/yago/linking/4http://www.mpi-inf.mpg.de/ gdemelo/yagosumo/5https://linkeddata1.calcul.u-psud.fr/sparql, as of July 2019.
called direct extraction pattern, as described in [7]. A casestudy has been presented in [8], where this extraction patternis used with yago:influences predicate to extract ego-centric networks of several intellectuals. Other extractionpatterns, such as derivation, are also described in [7], [8].
B. Method
The list of edges obtained as results of the SPARQL query(Fig. 1) is used to create a directed graph using pythonNetworkX library [9]. The obtained graph consists of 12,705nodes and 22,818 edges.
We tackle the analysis of the influence network in two majorparts. The first part (Section III) concerns essential types ofanalysis, such as:
• Connectivity: is the network (weakly/strongly) con-nected? how many components are there? and what isthe size of the largest connected component?
• Distribution of node degrees: how the node degrees (in-/out-) are distributed? does the distribution satisfy a powerlaw? if yes, what are its parameters? who are the mostinfluencing, and most influenced actors?
• Flow of influence: do all nodes have predecessors and/orsuccessors?
• Reciprocity: are there any mutual influences (such asactors who influence each other)?
• Centrality: who are the most important (central) actors?• Triadic census: what are the frequencies of interesting
triadic configurations, such as 3-cliques and full cycles?The second part of analysis concerns the diffusion dynamics
of influence (Section IV). For each actor, we construct acascade of influence as a DAG (directed acyclic graph).We study these cascades using a set of features, including:size, depth, average depth, and breadth. We then analyze thedistribution of cascade features, and find the top actors basedon those features. Finally, we apply a clustering algorithm toidentify main categories of influence cascades.
III. ANALYSIS
In this section we tackle essential types of analysis.
A. Connectivity
Our network consists of 12705 nodes and 22818 edges, butare all nodes connected? In directed networks, there are twosemantics of connectivity: weak and strong connectivity. Twonodes are strongly connected if they are reachable from eachother (there exists a directed path from each one to the other).They are weakly connected, if at least one undirected pathexists between them. The maximal sub-graphs in which allpairs of nodes are strongly or weakly connected are called thestrongly or weakly connected components. [11], [27]
Our influence network consists of 830 weakly connectedcomponents (WCC, Table I). The largest WCC has 10353nodes and 21261 edges, which comprises about 81% of nodes,and of 93% of edges of the original network. The remainingcomponents are small isolated groups: For instance, the secondlargest component is a group of contemporary South Korean

comedians; and the third largest component is a group of artistsand painters from medieval China. For the rest of the analysis,we will consider only the largest connected component (LCC).
TABLE IESSENTIAL CHARACTERISTICS OF THE INFLUENCE NETWORK
Complete networkNodes 12,705Edges 22,818Weakly connected components 830Nodes in largest WCC 10,353 (81.5 %)Edges in largest WCC 21,261 (93.2 %)Nodes in largest SCC 211 (1.7 %)Edges in largest SCC 640 (2.8 %)Density 0.00014Reciprocity 0.01236Transitivity 0.02116Average clustering coefficient 0.03262Diameter (longest shortest path) 26
Largest WCCDensity 0.00020Reciprocity 0.01251Average shortest path length 0.32541Average clustering coefficient 0.03858
B. Degree Distribution
Now let us look at the node degrees. Table II shows thestatistics of in- and out-degree of nodes: average, minimum,maximum and standard deviation. While the in-degree andout-degree have (obviously) the same average and the sameminimum value (0), they have significantly different maximumvalue, which is 48 for in-degree, and 158 for out-degree.
TABLE IIDEGREE
avg. min max std.in-degree 2.05 0 48 3.17out-degree 2.05 0 158 6.07
Figure 2 demonstrates the distribution (on log-log scale),CDF (Cumulative Distribution Function), CCDF (Complemen-tary CDF) of the in-degree and out-degree of nodes. Thisvisualization suggests that the degree distributions satisfy apower-law [5]. That is, the fraction P (x) of nodes in thenetwork with x connections to other nodes goes for largevalues of x (for x � xmin) as:
P (x) = Cx�↵
where ↵ is a parameter, xmin is the minimal value fromwhich the scaling relationship of the power law begins, andC is a constant which is related to ↵ and xmin:
C = (↵� 1)x↵�1min
To estimate the power law parameters of in- and out-degrees, we used the powerlaw python package [1]. Table IIIshows the estimation results, where ↵ and xmin are the powerlaw parameters, � is the estimate error, and R and p are the
(a) Distribution of in-degree (b) Distribution of out-degree
(c) CDF of in-degree (d) CDF of out-degree
(e) CCDF of in-degree (f) CCDF of out-degree
Fig. 2. Distribution, CDF and CCDF of in-degree and out-degree.
results of comparing the fit to exponential distribution.6 Hence,the influence network in hand is called scale-free network asit has a power-law degree distribution. [11]
TABLE IIIESTIMATED POWER LAW PARAMETERS OF DEGREE DISTRIBUTION
↵ xmin � R p-valuein-degree 4.457 11.0 0.200 12.95 0.0085out-degree 2.665 10.0 0.078 50.44 0.0002
Who are most influencing, and most influenced actors?
The most influencing actors are those with the highest out-degree; they represent the prestigious intellectuals with thehighest impact over others. Conversely, the most influencedactors are those with the highest in-degree; and they representintellectuals with diverse backgrounds and inspirations frommany predecessors.
Table IV shows two lists of top 10 influencing actors (withtheir out-degree), and top 10 influenced actors (with their in-degree). Marx, Nietzsche, Hegel, Kant, Aristotle and Plato arethe most influencing actors, each has > 100 influenced actors(followers).
6R is the log-likelihood ratio between the two candidate distributions. Thisnumber will be positive if the data is more likely in the first distribution(power-law), and negative if the data is more likely in the second distribution(exponential). The significance value for that direction is p. [1]

TABLE IVTOP 10 INFLUENCING ACTORS, AND TOP 10 INFLUENCED ACTORS
Top Influencing Top InfluencedActor Dout Actor Din
Karl Marx 158 Friedrich Nietzsche 48Friedrich Nietzsche 146 Christopher Hitchens 44G.W.F. Hegel 137 Karl Marx 38Immanuel Kant 135 Gilles Deleuze 37Aristotle 115 Alexandru Macedonski 37Plato 102 Michel Foucault 34Martin Heidegger 90 Jacques Derrida 33Ludwig Wittgenstein 80 Paul Auster 33James Joyce 79 Martin Heidegger 32Søren Kierkegaard 77 Benjamin Fondane 29
C. Influence Flow
We observe that there are many actors in the network whodo not have predecessors, i.e., they are not influenced by others(or at least we have no information about it!); and there aremany other actors who do not have successors, i.e. they donot influence others. We will call the former group as sourcenodes, and the later group as sink nodes. This way, we canregard this influence network as a multiple-source multiple-sink flow network (Figure 3).
Source nodes can be identified by having a zero in-degree(Din = 0), while sink nodes are identified by having a zeroout-degree (Dout = 0). The rest of nodes, called inner nodes,have positive in-degree and out-degree. Table V shows thenumber and percentage of these three group of nodes: source,inner, and sink nodes.
Fig. 3. Influence Network as a multi-source multi-sink flow network
TABLE VDISTRIBUTION OF SOURCE-, INNER-, AND SINK-NODES
source nodes inner nodes sink nodescount 2,828 2,959 4,566% 27 % 29 % 44 %avg. in-degree 0.0 3.99 2.07avg. out-degree 1.66 5.60 0.0
D. Reciprocity
Are there any mutual influences, such as actors who influ-ence each other? We measure the reciprocity of the network,which is the likelihood of nodes in a directed network to bemutually linked. It is the ratio of the number of links pointingin both directions mutual to the total number of links. In
our network, the reciprocity is: 0.0125, that is about 1% ofinfluence relations are mutual.
We also extracted a list of pairs of actors having the mutualinfluence, it comprises of 133 pairs. Table VI shows the top10 (ranked based on the product of actors degree).
These forms of reciprocity and mutual influence occuramong contemporaries only.
TABLE VITOP MUTUAL INFLUENCE RELATIONS
Charles E. Lindblom Robert A. DahlEadweard Muybridge Etienne-Jules MareyCarles Riba Marius TorresIlona Lenard Kas OosterhuisHenry Briggs John NapierJon Folkman Lloyd ShapleyAbhijit Banerjee Esther DufloGabriel Metsu Jan SteenGoran Tunstrom Leonard CohenLloyd Shapley Martin Shubik
E. Centrality
One of primary tasks in network analysis is the identificationof structurally important actors and, more generally, the rela-tive importance of all actors [11]. The most elementary actor-level indices of importance are degrees that can be consideredas measures of actor activity or involvement. However, thereare more elaborate ways of defining the actor importance, suchas closeness centrality and betweenness centrality. Closenesscentrality of a node is the inverse of the sum of distances toall other nodes. It measures how close an actor is to all otheractors in the network. Actors in the center can quickly interactwith all others, have short communication path to others, andreach others in a minimal number of steps.
cC(u) =1P
v2V d(u, v)
Betweenness centrality assesses the degree to which a nodelies on the shortest path between two other nodes. It is a wayof detecting the amount of influence a node has over the flowof information in a network, and is often used to find nodesthat serve as a bridge from one part of a network to another.Betweenness centrality of a node u is the fraction of shortestpaths between any two nodes s and t via u to all shortest pathsbetween s and t:
cB(u) =X
s 6=u 6=t2V
�(s, t | u)
�(s, t)
where �(s, t) is the total number of shortest paths from nodes to node t and �(s, t | u) is the number of those paths thatpass through u.
For our influence social network, we calculated closenessand betweenness centralities of all nodes, and ranked the nodesbased on centrality value in descending order. Table VII showstwo lists of the top 10 central actors, based on betweennessin the first list, and on closeness in the second. Apparently,intellectuals with highest centrality such as Nietzsche, Dos-toyevsky, and Sartre are those who bridge different cultures

and periods of time as they lay on large amount of pathwaysof influence.
TABLE VIITOP 10 CENTRAL ACTORS
Betweenness ClosenessJack Kerouac Christopher HitchensWilliam S. Burroughs Gary ForresterFriedrich Nietzsche David MitchellFyodor Dostoyevsky Chuck PalahniukJean-Paul Sartre Homi K. BhabhaWalt Whitman Richard RortyWilliam Carlos Williams Noah CiceroAlexander Pushkin Paul AusterJohn Keats Giannina BraschiTristan Tzara Salman Rushdie
F. Triadic Census
Another way to analyze network characteristics is to countconfigurations. An example is the triadic census of a directedgraph, in which the frequency of all 16 possible configurationsof the three dyads formed by three nodes as shown in Figure4 are determined. [12], [2].
Fig. 4. Triad types in directed networks. The conventional numbering schemeis based on the number of mutual, asymmetric, and null dyads (MAN), withtrailing characters: U: up, D: down, T: transitive, and C: cyclic.
Table VIII shows the triad census of our influence network.In particular, we are interested in some of the 16 motifs:
• 300: which is a 3-clique; i.e., three nodes are fullyconnected to each other. There are 4 cases of this motifin the network.
• 030C: which is a cycle of three connections in one direc-tion; i.e. an actor u influences v, who in turn influencesw, and w influences u back. There are 6 occurrences ofthis motif in our network.
• 030T: which is a pure transitivity relation where an actoru influences v, who in turn influences w, and u influencesw. There are 7,651 occurrences of this motif.
• 201: two nodes u and v are fully connected to a thirdnode w while they are not connected themselves to eachother; i.e. both u and v influence and influenced by w,
but they do not influence each other. This motif occurs75 times in our network.
• 120D: two nodes u and v influence each other, and theyare both influenced by a third node w (occurs 203 times).
• 120U: two nodes u and v influence each other, and theyboth influence a third node w (occurs 198 times).
TABLE VIIITRIAD CENSUS OF THE INFLUENCE NETWORK
Triad Count003 184,675,147,475012 216,554,712102 1,370,448021D 189,609021U 53,029021C 124,905111D 1,774111U 3,863030T 7,651030C 6201 75120D 203120U 198120C 13210 11300 4
IV. DIFFUSION DYNAMICS OF INFLUENCE
In this section, we observe the diffusion of influencethroughout the network.
We refer to the influence path formed as actors influencedby an original actor, influence other actors, as a cascade andthe original actor as the root actor.
For each actor, we construct his influence cascade, byconsidering out-going edges starting from that actor, as shownin Figure 5. We seek to avoid exhaustive search by convertingthe network into a directed acyclic graph (DAG), thereby, re-ducing the time complexity. Hence, we need to avoid cyclicity,therefore, in case of reciprocal edges between a pair of nodes,we arbitrarily choose one of the reciprocal edges. Thus, theresult we obtain is a directed acyclic graph (DAG), which wecall henceforth a cascade.
Fig. 5. Cascade properties

A. Characteristic cascade parameters
In order to characterize the influence cascades, we employthe following features as used in [26], [16].
• Size represents the number of nodes in the DAG whichare reachable from the root actor. It corresponds to thetotal number of unique actors involved in the cascade.
• Depth is the length of the largest path from the root nodeof the cascade. The depth of a cascade, D, with n nodesis defined as
D = max(di), 0 i n
• Average depth is the average path length of all nodesreachable from the root actor. For a cascade with n nodes,we define its average depth (AD) as
AD =1
n � 1
nX
i=1
di
where di is the depth of the node i.• Breadth is the maximum number of nodes present at any
particular depth in the DAG.
B = max(bi), 0 i d
where bi denotes the breadth of the cascade at depth iand d denotes the maximum depth of the cascade.
B. Analysis of influence cascades
For all nodes in the influence network in hand, we extractedtheir cascade DAGs, and computed the properties of cascades:size, depth, average depth and breadth. First, we observed thatsome nodes do not have cascades. That is because they do nohave successors; hence those nodes are exactly the group ofsink nodes as discussed before, which comprises about 44%of all nodes. Therefore, the cascades we obtained are 5,787nodes and correspond to source- and inner- nodes.
Figure 7 shows a histogram of cascade properties. We ob-serve that there exist two disjoint categories of cascades basedon the size and breadth, the first category is characterized bysmall size ( 1000) and small breadth ( 300), while thesecond category by a large size (� 4000) and large breadth(� 400).
In Table IX we show the top 10 actors based on thecharacteristics of their influence cascades. We observe that topcascades by size and by breadth correspond to intellectualsfrom Greek-Roman antiquity, such as Socrates, Pythagoras,and Euclid. Whereas, top cascades by depth mostly correspondto intellectuals from the medieval Islamic golden age, such asAbu H. anıfa and Malik ibn Anas. Both are 8th-century SunniMuslim theologians, who are the eponymous founders of twoof the four schools of Sunni jurisprudence [17].
Figure 7 shows CDF (Cumulative Distribution Function)and CCDF (Complementary CDF) of the cascade characteris-tics: size, depth and breadth.
Table X shows the correlation among pairs of cascadeproperties. The values demonstrate that those properties are
Fig. 6. Distribution of cascade characteristics
TABLE IXTOP 10 ACTORS BY CASCADE PROPERTIES
top cascades by Size top cascades by BreadthThales 5783 Aesop 2179Anaximander 5779 Crates of Thebes 2171Hesiod 5778 Hipparchia of Maroneia 2171Pherecydes of Syros 5777 Zeno of Citium 2171Pythagoras 5776 Diodorus Cronus 2171Heraclitus 5766 Stilpo 2171Xenophanes 5764 Euclid of Megara 2171Parmenides 5763 Thrasymachus of Corinth 2171Aesop 5759 Pasicles of Thebes 2171Socrates 5746 Philo the Dialectician 2171
top cascades by Depth top cascades by Avg. DepthAbu H. anıfa 26 Friedrich Karl Forberg 13.72Abu Suhail an-Nafi 26 Abu Suhail an-Nafi 13.29Hisham ibn Urwah 26 Hisham ibn Urwah 13.29Malik ibn Anas 25 Abu H. anıfa 13.24Muhammad al-Shaybani 25 Alfred Binet 12.8Ibrahim Y. al-Juzajani 25 James Mark Baldwin 12.8Ishaq Ibn Rahwayh 25 Hans Vaihinger 12.72Ali ibn al-Madini 25 Jacob L. Moreno 12.71Friedrich Karl Forberg 25 Conrad Hal Waddington 12.55Ibn Jurayj 25 Ibrahim Y. al-Juzajani 12.35
in general highly correlated. The most correlated features are:(depth, avg. depth) followed by (size, breadth).
TABLE XCORRELATION OF CASCADE PROPERTIES
Size Depth 0.856Size Avg. Depth 0.81Size Breadth 0.929Depth Avg. Depth 0.975Depth Breadth 0.661Avg. Depth Breadth 0.627
Figure 8 plots the correlation among cascade properties.We can clearly identify the existence of the two categoriesof cascades mentioned before: small cascades (blue) and large

(a) CDF of size (b) CCDF of size
(c) CDF of depth (d) CCDF of depth
(e) CDF of breadth (f) CCDF of breadth
Fig. 7. CDF and CCDF of cascade properties: size, depth and breadth
cascades (green). The distinction between the two categoriesis obvious in terms of size and breadth, but it is less clear interms of depth and avg. depth.
C. Clustering the influence cascades
In order to distinguish more precisely these two cate-gories, we apply a K-mean clustering algorithm [14], [13].As features, we used the four characteristics of cascades, size,breadth, depth, and avg. depth. As a number of clusters, weused k = 2. 7 As a result, we obtained two clusters of cascades,as depicted in Table XI.
The cluster of so-called small cascades (SC) contains 4629cascades; the size of cascades in this cluster ranges from 2to 952 with an average of 35. Whereas the cluster of so-called large cascades (LC) contains 1158 cascades; the sizeof cascades in this cluster ranges from 4134 to 5783 with anaverage of 4481. The depth in the SC cluster ranges from 1 to14 with average 2.6, while the depth in the LC cluster rangesfrom 8 to 26 with average 15.6. Similarly, the avg. depth inthe SC cluster is between 1 and 8.6 with average 1.8, whilein the LC cluster it is between 3.4 and 13.7 with an averageof 6.7. Finally, the breadth in the SC cluster ranges between1 and 203 with an average of 11.4, while in LC cluster itranges from 419 and 2179 with an average of 1138.6. Figure9 depicts the average values of cascade features for both SCand LC clusters.
7We used sklearn.cluster.KMeans python module.
Fig. 8. Correlation among cascade properties
!t
Fig. 9. Cascade features (average) for SC and LC clusters
TABLE XIFEATURES OF THE TWO CLUSTERS OF CASCADES
size depth avg. depth breadthSmall Cascades (4629 nodes)
avg 35.044 2.636 1.798 11.415std 99.284 2.382 1.159 25.881min 2 1 1 1max 952 14 8.579 203
Large Cascades (1158 nodes)avg 4481.335 15.585 6.706 1138.614std 477.712 4.177 1.909 532.533min 4134 8 3.392 419max 5783 26 13.719 2179
We interpret the emergence of clusters of large cascadesto the temporal dimension. Most of the intellectuals in thiscluster belong to Greek-Roman antiquity and medieval ages.This far-reaching time span has a major impact on developingsuch large influence cascades.
V. CONCLUSIONS
In this paper, we extracted a social network of influencesamong intellectuals from YAGO, which is one of the pio-

neering contributors of the web of data containing millionsof facts extracted from Wikipedia, WordNet and GeoNames.The network extraction was performed using a SPARQL query,which results make up the edges of the network. First, weconducted several essential types of analysis. Concerning theconnectivity, we could show that 81 per cent of nodes wereconnected in the biggest component, with an average shortestpath length of 0.325 and almost no reciprocity except forcontemporaries. Different definitions of centrality provideda detailed insight into the most influential and influencedactors in the network. We found that Karl Marx and FriedrichNietzsche were the two most influential and among the Top 3influenced intellectuals in the biggest component, suggestingthat the revolutionary of their ideas would appeal to manycontemporaries and thinkers after them. Whereas in termsof the amount of pathways, writer Jack Kerouac, and againNietzsche came up in the Top 3. In terms of being locatedclosely to all other nodes, author Christopher Hitchens wasfirst. Then, we focused on analyzing the diffusion of influencethroughout the network, noticing source nodes with an in-degree of zero making up 27 per cent of the network, and sinknodes with an out-degree of zero 44 per cent of the network. Aclustering algorithm identified small (SC) and large (LG) cas-cades. The construction of these influence cascades revealedthat Greek and Roman scholars of antiquity influenced thehighest numbers of intellectuals, whereas intellectuals frommedieval Islamic golden age, such as Abu H. anıfa and Malikibn Anas, have established the longest influence cascadeslasting until recent times.
This study of the social network of influence has revealeddeeper insights to interconnections of thinkers throughouttime, and the dynamics of influence and spread of ideasthrough history. Therefore, a more elaborate analysis that takesthe temporal aspect of the influence social network is crucial.In future work, we plan to extract a longitudinal version of theinfluence network, that can be used to analyze the evolutionof influence over time more precisely. In addition, we plan toexploit advanced tools such as community detection to identifygroups of actors that are highly connected and influence eachother more than others. This type of analysis could lead us to abetter understanding of the emergence and evolution of schoolsof thoughts in philosophy, such as idealism, materialism, andexistentialism, or in politics, as communism, socialism, andliberalism.
REFERENCES
[1] Jeff Alstott, Ed Bullmore, and Dietmar Plenz. powerlaw: a python pack-age for analysis of heavy-tailed distributions. PloS one, 9(1):e85777,2014.
[2] Vladimir Batagelj and Andrej Mrvar. A subquadratic triad censusalgorithm for large sparse networks with small maximum degree. SocialNetworks, 23:237–243, 2001.
[3] Christian Bizer, Tom Heath, and Tim Berners-Lee. Linked data - thestory so far. International Journal on Semantic Web and InformationSystems, 5(3):122, 2009.
[4] Christian Bizer, Jens Lehmann, Georgi Kobilarov, Soren Auer, ChristianBecker, Richard Cyganiak, and Sebastian Hellmann. DBpedia - ACrystallization Point for the Web of Data. Web Semant., 7(3):154–165,September 2009.
[5] Aaron Clauset, Cosma Rohilla Shalizi, and Mark EJ Newman. Power-Law Distributions in Empirical Data. SIAM review, 51(4):661–703,2009.
[6] David A. Ferrucci, Eric W. Brown, Jennifer Chu-Carroll, James Fan,David Gondek, Aditya Kalyanpur, Adam Lally, J. William Murdock,Eric Nyberg, John M. Prager, Nico Schlaefer, and Christopher A. Welty.Building Watson: An Overview of the DeepQA Project. AI Magazine,31(3):59–79, 2010.
[7] Raji Ghawi and Jurgen Pfeffer. Mining social networks from linkedopen data. In Dominik Endres, Mehwish Alam, and Diana Sotropa,editors, Graph-Based Representation and Reasoning, pages 221–229,Cham, 2019. Springer International Publishing.
[8] Raji Ghawi, Mirco Schonfeld, and Jurgen Pfeffer. Extracting Ego-Centric Social Networks from Linked Open Data. In WI ’19:IEEE/WIC/ACM International Conference on Web Intelligence, NewYork, NY, USA, October 2019. ACM.
[9] Aric A. Hagberg, Daniel A. Schult, and Pieter J. Swart. ExploringNetwork Structure, Dynamics, and Function using NetworkX. In GaelVaroquaux, Travis Vaught, and Jarrod Millman, editors, Proceedings ofthe 7th Python in Science Conference, pages 11 – 15, Pasadena, CAUSA, 2008.
[10] Steve Harris and Andy Seaborne. SPARQL 1.1 Query Language. W3CRecommendation, 2013.
[11] Marina Hennig, Ulrik Brandes, Jurgen Pfeffer, and Ines Mergel. StudyingSocial Networks: A Guide to Empirical Research. Campus Verlag, 2012.
[12] Paul W Holland and Samuel Leinhardt. The Statistical Analysis of LocalStructure in Social Networks. Sociological Methodology, pages 1–45,1976.
[13] Stuart P. Lloyd. Least Squares Quantization in PCM. IEEE Transactionson Information Theory, 28:129–137, 1982.
[14] James MacQueen. Some methods for classification and analysis of mul-tivariate observations. In Proceedings of the Fifth Berkeley Symposiumon Mathematical Statistics and Probability, Volume 1: Statistics, pages281–297, Berkeley, Calif., 1967. University of California Press.
[15] Farzaneh Mahdisoltani, Joanna Biega, and Fabian M. Suchanek.YAGO3: A knowledge base from multilingual wikipedias. In CIDR2015, Seventh Biennial Conference on Innovative Data Systems Re-search, Asilomar, CA, USA, January 4-7, 2015, Online Proceedings,2015.
[16] Binny Mathew, Ritam Dutt, Pawan Goyal, and Animesh Mukherjee.Spread of hate speech in online social media. CoRR, abs/1812.01693,2018.
[17] Josef W. Meri. Medieval Islamic Civilization: An Encyclopedia. Rout-ledge Encyclopedias of the Middle Ages. Taylor & Francis, 2005.
[18] George A. Miller. WordNet: A Lexical Database for English. Commun.ACM, 38(11):39–41, November 1995.
[19] Isaac Newton. Letter to robert hooke, 1675.[20] E. Otte and R. Rousseau. Social Network Analysis: a Powerful Strategy,
also for the Information Sciences. Information Science, 28(6):441–453,2002.
[21] Eric Prud’hommeaux and Andy Seaborne. SPARQL Query Languagefor RDF. W3C Recommendation, 2008.
[22] Sanjay Subrahmanyam. Beyond the usual suspects: on intellectualnetworks in the early modern world. Global Intellectual History,2(1):30–48, 2017.
[23] Fabian M. Suchanek, Gjergji Kasneci, and Gerhard Weikum. Yago: ACore of Semantic Knowledge. In Proceedings of the 16th InternationalConference on World Wide Web, WWW ’07, pages 697–706, New York,NY, USA, 2007. ACM.
[24] Fabian M. Suchanek, Gjergji Kasneci, and Gerhard Weikum. Yago: Alarge ontology from wikipedia and wordnet. Journal of Web Semantics,6(3):203 – 217, 2008. World Wide Web Conference 2007Semantic WebTrack.
[25] Scott D. Troyan. Medieval Rhetoric: A Casebook. Routledge, London,2004.
[26] Soroush Vosoughi, Deb Roy, and Sinan Aral. The spread of true andfalse news online. Science, 359(6380):1146–1151, 2018.
[27] Stanley Wasserman and Katherine Faust. Social Network Analysis:Methods and Applications. Structural analysis in the social sciences,8. Cambridge University Press, New York, 1 edition, November 1994.

5.2 Innovation and discussion
A Longitudinal Analysis of a Social Network of Intellectual
Influence
Authors
Petz, Cindarella, and Ghawi, Raji, and Pfeffer, Jurgen
In
IEEE/ACM International Conference on Advances in Social Network Analysis and Min-
ing (ASONAM) 2020, pp. 340–347. DOI: 10.1109/ASONAM49781.2020.9381318.
Abstract
The history of intellectuals consists of a complex web of influences and interconnections
of philosophers, scientists, writers, their work, and ideas. How did these influences
evolve over time? Who were the most influential scholars in a period? To answer these
questions, we mined a network of influence of over 12,500 intellectuals, extracted from
the Linked Open Data provider YAGO. We enriched this network with a longitudinal
perspective and analyzed time-sliced projections of the complete network differentiating
between within-era, inter- era, and accumulated-era networks. We thus identified various
patterns of intellectuals and eras and studied their development in time. We show which
scholars were most influential in different eras, and who took prominent knowledge broker
roles. One essential finding is that the highest impact of an era’s scholar was on their
contemporaries, and that the inter-era influence of each period was strongest on the
consecutive era. Furthermore, we see quantitative evidence that there was no rediscovery
of Antiquity during the Renaissance; rather, there has been a continuous reception of it
since the Middle Ages.
Contribution of thesis author
Theoretical operationalization, iterative evaluation of computational implementation
and analysis, qualitative evaluation and contextualization, as well as manuscript writing,
revision, and editing.
95

A Longitudinal Analysis of a Social Network of Intellectual History
Cindarella Petz, Raji Ghawi and Jurgen PfefferBavarian School of Public Policy
Technical University of Munich, Munich, GermanyEmail: {cindarella.petz, raji.ghawi, juergen.pfeffer}@tum.de
Abstract—The history of intellectuals consists of a complexweb of influences and interconnections of philosophers, scien-tists, writers, their work, and ideas. How did these influencesevolve over time? Who were the most influential scholars ina period? To answer these questions, we mined a network ofinfluence of over 12,500 intellectuals, extracted from the LinkedOpen Data provider YAGO. We enriched this network with alongitudinal perspective and analyzed time-sliced projections ofthe complete network differentiating between within-era, inter-era, and accumulated-era networks. We thus identified variouspatterns of intellectuals and eras and studied their developmentin time. We show which scholars were most influential in differenteras, and who took prominent knowledge broker roles. Oneessential finding is that the highest impact of an era’s scholar wason their contemporaries, and that the inter-era influence of eachperiod was strongest on the consecutive era. Furthermore, we seequantitative evidence that there was no rediscovery of Antiquityduring the Renaissance; rather, there has been a continuousreception of it since the Middle Ages.
I. INTRODUCTION
“No self is of itself alone,” wrote Erwin Schrodinger in 1918[15] and noted, “It has a long chain of intellectual ancestors.”The history of intellectuals is comprised of a myriad of suchlong chains, embedded in a tapestry of competing influences of“ageless” ideas, which —in the words of the French scholarBonaventura D’Argonne in 1699—“embrace [...] the wholeworld” [9].
To understand the dynamics of influence and spread of ideasthrough history, the embeddness and interconnections of schol-arship should be taken into account. A network approach offersto identify the most influential scholars via their positions ina network of intellectual influence through the history. Thisallows the study of their social relations [25], [11], [19], andto provide deep insights into the underlying social structure.
A recent study by Ghawi et al. [5] addressed the analysis ofsuch a social network of intellectual influence, incorporatingover 12,500 scholars from international origins since the be-ginning of historiography. In this paper, we build upon [5], andextend the analysis of that network by incorporating a temporaldimension. We analyze the network of scholars dependent totheir time, adding a longitudinal perspective on how scholarsformed networks. By doing so, we opt for an inclusive, globalperspective on the history of intellectuals. This perspectiveof a vast longitudinal global network of intellectuals is aresponse to recent discussions on not-global-enough researchwithin intellectual history [10]. We thus attempt to go beyondthe traditional “master narratives” [4] of a Western Europeancentrist view on intellectual history [23]. The goal of this paperis not only to understand how the influence relations among
scholars evolved over time, but also to get deep insights ontheir influence on historical periods.
• How did these influence networks evolve over time?• Who were the most influential scholars in a period?• And which patterns of influence did emerge?To answer these, we analyze the evolution of influences in
time in order to identify periods and scholars, who stand out.Our contributions are as follows:• We incorporate a longitudinal perspective on the social
network analysis of intellectuals based on a global peri-odization of history.
• We identify patterns of influence and their distribution inwithin-, inter-, and accumulated-era influence networks.
• We identify influence signatures of scholars and eras.• We identify scholars with various knowledge broker roles.This paper is organized as follows. Section II reviews
related works. In Section III, we briefly outline the dataset’scharacteristics and pre-processing. Section IV presents thenetwork analysis of the entire network, and its time-sliced pro-jections into partial influence networks (within-era, inter-era,and accumulated-era), featuring their basic network metrics,degree distribution, and connectivity. In Section V, we identifydifferent influence patterns of scholars and eras. Section VIis devoted to the longitudinal analysis of brokerage roles inscholars.
II. RELATED WORKThe term of intellectual history combines a plethora of
approaches on discourse analysis, evolution of ideas, intellec-tual genealogies, and the history of books, various scientificdisciplines, political thought, and intellectual social context[26], [7]. These studies are usually limited to specific regionsor time spans as a trade-off for thorough comparative andtextual analysis. Endeavors to write a “Global IntellectualHistory” [16] were criticized for focusing on the more well-known intellectual thinkers despite including a transnationalcomparative perspective [22].
Network methodologies allow analyzing intellectual historyand as such the history of intellectuals as big data, encom-passing time and space with a focus on their inter-connections.So far, computational methods have been used in the study ofcommunication networks of the respublica litteraria, in whichvarious studies modeled the Early Modern scholarly book andletter exchanges as networks. Among the first was “Mappingthe Republic of Letters” at Stanford University in 2008 [1].More recent studies have incorporated a temporal perspectiveon these epistolary networks [24].
© 2020 IEE. Internal or personal use of this material is permitted. Reprinted, with permission, from Petz, Cindarella, Ghawi, Raji, and Pfeffer, Jürgen. 2020. “A Longitudinal Analysis of a Social Network of Intellectual History.” IEEE/ACM International Conference on Advances in Social Network Analysis and Mining (ASONAM): 340–347. doi:10. 1109/ASONAM49781.2020.9381318.

A recent study [5] proposed to research the entire history ofintellectuals with the means of a network approach. This paperdefined the most influential as those with the longest reachinginfluence (influence cascades), and identified as such Antiqueand Medieval Islam scholars, and Karl Marx as the one withthe most out-going influences. In this paper, we extend thisanalysis by incorporating a temporal dimension in order toestablish a deeper insight on how these influences evolved intime.
Much research has been devoted to the area of longitudinalsocial networks [17], [13], [21], [12]. Longitudinal networkstudies aim at understanding how social structures developor change over time, usually by employing panel data [11].Snapshots of the social network at different points in timeare analyzed in order to explain the changes in the socialstructure between two (or more) points in time in terms of thecharacteristics of the scholars, their positions in the network,or their former interactions.
III. DATA
A. Data Acquisition and Preprocessing
The source of information used in this paper originatedfrom YAGO (Yet Another Great Ontology) [14], a pioneeringsemantic knowledge base that links open data on people, cities,countries, and organizations from Wikipedia, WordNet, andGeoNames. At YAGO, an influence relation appears in termsof the influences predicate that relates a scholar to anotherwhen the latter is influenced by the ideas, thoughts, or worksof the former. The accuracy of this relation was evaluated byYAGO at 95%. We extracted a dataset that encompasses allinfluence relationships available in YAGO, using appropriateSPARQL queries that implement mining techniques of socialnetworks from Linked Open Data [6]. The result consisted of22,818 directed links among 12,705 intellectuals that made upthe nodes and edges of our target social network of influence.In order to incorporate a time dimension to our analysis, weextracted birth and death dates of each scholar. Some scholarshad missing birth and/or death dates, which we deduced bysubtracting 60 years from the death date, and vice versa, up tothe symbolic year of 2020. When both dates were missing, wemanually verified them. During this process we had to removesome entities, as they did not correspond to intellectuals.These were either 1) concepts, e.g., ‘German philosophy’ and‘Megarian school’, 2) legendary characters, e.g., ‘Gilgamesh’and ‘Scheherazade’, or 3) bands e.g., ‘Rancid’ and ‘Tube.’ Tothis end, we obtained a new dataset of 12,577 scholars withcomplete birth and death dates.
B. Periodization
In this paper, we do not use the classical concept of networksnapshot, which is a static network depicted at a given point intime. Rather, we split the time span (i.e., the history) manuallyinto consecutive periods (eras), and embed the network nodes(actors) into the eras in which they lived. This way, the micro-level influence among scholars can be viewed as a macro-levelinfluence among periods of history. This enables the analysis
of the influence network within each era (= within-era),between different eras (= inter-era), and in an accumulativemanner (= accumulated-era). By introducing a longitudinalperspective, we split the time-span using a periodizationthat takes global events into account. Any periodization isa construct of analysis, as each field of research has itsown timeline characterizing periods [20] which are dependenton different caesura for the respective object of research[18]. This complicates an overarching longitudinal perspectiveon a global scale. In order to match the internationality ofscholars, we used Osterhammel’s global periodization [18] andworked with six consecutive periods (eras): Antiquity (up to600 AD), Middle Ages (600—1350), Early Modern Period(1350—1760), Transitioning Period (1760—1870), ModernAge (1870—1945), and Contemporary Period (1945—2020).
One conceptual challenge was to map scholars into eras.Many scholars fit to more than one period’s timeline. We optedfor a single era membership approach since it is more intuitiveand easier to conceptualize. A single era membership of eachscholar reduces the complexity of analysis and computations,while encompassing the essential membership of each scholarto a single era. It also offers adequate results when wecompare eras, since it avoids redundancy. This approach doesnot change the influences of the scholar to scholars of otherperiods.In order to assign a single era to a scholar, we used thefollowing method: We calculated the midpoint of the scholar’slifespan ignoring the first 20 years of their age, as we assumedthat scholars in general would not be active then. Then weassigned the era in which this midpoint occurs as the scholar’smembership to an era. After this initial assignment process,we verified the global validity of assignments by countingthe number of influence links from one era to another. Weobserved that there were some reverse links of eras, i.e., aninfluence relation from an actor in a recent era towards anactor assigned to an older era. Those anomaly cases (about200) were basically due to:
• Errors in dates:– some dates were stated in the Hijri calendar, instead
of the Gregorian calendar, and– some dates were BC and missing the negative sign.
• Errors in direction of the relationship: source and targetactors were wrongly switched.
• Inappropriate era-actor assignments.
The anomalies due to errors have been manually corrected.The cases of inappropriate assignment were technically noterroneous. This usually happened when the influencer livedmuch longer than the influenced, elevating the influencer’speriod into a more recent one. We solved this by iterativelyreassigning either the influencer backward to the era ofthe influenced, or the influenced forward to the era of theinfluencer. As a result, each scholar is assigned to exactlyone era, such that no reverse links of eras exist. The finalcleaned dataset consists of 22,485 influence links among12,506 intellectuals.

Fig. 1. Number of scholars alive in each year based on their assigned eras.
ML EM T MR CA
Fig. 2. Percentage of received influences in each era.
IV. ANALYSIS
Fig. 1 shows each era’s continuous density of scholars basedon their lifespan.
With scholars embedded in their respective eras, the entireinfluence network can be time-sliced: we projected it intoseveral partial networks based on the source era (of theinfluencer) and target era (of the influenced scholar). Whenthe source and target eras are the same, we call the partialnetwork a within-era influence network. When the source andtarget eras are different, we call the partial network an inter-era influence network. There are no reverse links from a laterera to a previous one due to pre-processing.
After time-slicing the whole network, we received sixwithin-era networks corresponding to all the six eras, and15 inter-era networks, corresponding to all chronologicallyordered (but not necessarily consecutive) pairs of differenteras. Moreover, we constructed six accumulated-era influencenetworks of scholars living up to and including a target era.
Fig. 2 shows the proportion of influence links amongall pairs of eras. There, we can already make two majorobservations for inter- and within-era influence relations: Forone, the highest fraction of influence received by scholars ofeach era comes from its own era. This means that the internalimpact of any era is in general higher than its external impact.In absolute numbers, the vast majority of links occur withinthe Contemporary era, followed by links from the ModernAge to the Contemporary period, and within the Modern Age,
which is clearly owed to the increased amount of scholars inthese periods.The inter-era influences of each period is strongest on itsconsecutive period. As our earliest period, Antiquity receivesonly influence links from itself, whereas the influence receivedin the Middle Ages are 82% internal, and 18% from An-tiquity. Subsequently, the amount of the within-era influenceshrinks throughout the consecutive periods, but still remainsthe biggest influence. Noteworthy here is the high proportionof influences of Antiquity on the Early Modern period, whichrepresents their increased reception during the Renaissance.However, the proportionately many links of Antiquity to theMiddle Ages reassert the shift in historical research that theRenaissance did not “rediscover” Antiquity, but was receivedbefore in the Middle Ages as well [3, p. 3—4].
A. Within-Eras Influence Networks
In the following, we analyzed the six within-era influencenetworks, which represent the internal impact of an era. Weextracted the following metrics, as shown in Table I:
• Number of nodes N , and edges E, and density D.• Average out-degree (= avg. in-degree due to the properties
of a directed graph).• Max. in-degree, max. out-degree, and max. degree.• WCC: number of weakly connected components.• LWCC: size of the largest weakly connected component.• SCC: number of strongly connected components, when
the number of nodes is > 1).• Reciprocity and transitivity.
TABLE IMETRICS OF WITHIN-ERA NETWORKS
Era A ML EM T MR CN 219 303 610 761 2102 6081N/A 82% 86% 81% 70% 73% 85%E 327 387 694 927 2806 7960Density .0068 .0042 .0019 .0016 .0006 .0002avg. out-degree 1.49 1.28 1.14 1.22 1.33 1.31max in-degree 12 9 17 27 21 26max out-degree 20 16 23 32 68 58max degree 32 20 32 41 73 58WCC 11 21 94 108 208 582Largest WCC 179 233 245 436 1495 4379
82% 77% 40% 57% 71% 72%SCC 0 2 6 8 31 38Reciprocity 0 0.005 0.023 0.028 0.036 0.014Transitivity 0.064 0.066 0.071 0.042 0.029 0.017

We included NA in Table I in order to contain that the
number of nodes N in a within-era network could be lessthan the number of actors of that of era A. This is owing tothe fact that not all scholars of an era necessarily participatedin its within-era influence network. Some scholars influencedor were influenced by actors of different eras only. However,around 80% of scholars in each era were active in these within-era networks. The highest value of 86% of the Middle Agesrefers to their relative self-containment as an era, as well asthe lowest value in the Transitioning period of 70% refers toits high out-going influences.
Over all eras, the amount of nodes and edges steadilyincreased, while the density of networks decreased. On av-erage, the out-degree revolves around 1.25, where the highestvalue of 1.5 occurs in Antiquity, and the lowest of 1.14 inthe Early Modern period. When we compare the evolutionof the max. out-degree in time, we find that the expectedcontinuous increase did not always hold due to two ex-ceptionally high observations at Antiquity and the ModernAge. Mutual ties among contemporaries were in general verylow. We can report none in Antiquity, and only one inthe Middle Ages between Avicenna and Al-Bırunı. In theEarly Modern period, eight mutual relations were observed,including, e.g., Gottfried Leibniz (1646—1716) and DavidBernoulli (1700—1782), whereas 13 mutual relations in theTransitioning period, such as Friedrich Engels (1820—1895)and Karl Marx (1818—1883), or Johann Goethe (1749—1832)and Friedrich Schelling (1775—1854). In the Modern Age, thenumber of mutual ties increased to 51 (e.g., Jean—Paul Sartre(1905—1980) and Simone de Beauvoir (1908—1986)); and to54 in the Contemporary period.
Fig. 3. Weakly connected components in within-era influence networks
Fig. 3 shows the number of weakly connected components(WCCs) in the within-era networks of each era, and therelative size of the largest ones w.r.t the whole correspondingnetwork. The number of WCCs increased gradually over theconsecutive eras. In general, the networks consisted of onegiant component, which encompassed the majority of nodes,while the rest of components were relatively smaller. Thiswas particularly developed in Antiquity and the Middle Ages,where the giant components constitute of 82% and 77% ofthe nodes, while the second largest were at 6% and 3%,respectively. The Early Modern period constitutes an exceptionto this giant component rule: the largest one was only at 40%,and the second largest at 16%. Looking at their composition,the first consisted of natural scientists, mathematicians, andphilosophers, such as Descartes, Newton, and Leibniz, while
TABLE IITOP 5 ACTORS, PER ERA, BASED ON OUT-DEGREE IN WITHIN-ERA
INFLUENCE NETWORKS.
Antiquity MiddleAges EarlyModernPlato 20 Avicenna 16 John Locke 23Aesop 13 Muhammad 11 Rene Descartes 22Pythagoras 10 Al-Ghazali 11 Isaac Newton 15Plotinus 10 Banu Musa 8 Hugo Grotius 13Euhemerus 10 J. S. Eriugena 8 Leibniz 11
Transition Modern ContemporaryGoethe 32 Nietzsche 68 Vladimir Nabokov 58Hegel 29 Jules Verne 35 Friedrich Hayek 50Lord Byron 24 Henri Bergson 35 Richard Pryor 50Immanuel Kant 22 Leo Tolstoy 24 Jacques Derrida 48von Schelling 17 Edmund Husserl 22 Michel Foucault 47
the smaller one was compromise of artists and painters,such as Rembrandt and Raphael. The single giant componentphenomenon appeared again in subsequent eras. For instance,in the Transitioning period, there were 108 WCCs, wherethe largest two incorporated 57% and 1.3% of the nodes. Inthe Modern and Contemporary Age, the largest componentscomprised about 70% of nodes.
Who was most influential on their contemporaries? TableII lists the top five scholars per era based on their out-degreein the within-era influence networks. The highest within-eraout-degree over all times was achieved by Friedrich Nietzsche(1844—1900) of the Modern Age with 68 outgoing influencelinks to other scholars of his era.
B. Inter-Era Influence Networks
Inter-era influence networks are partial networks wherethe source era precedes the target era. We interpreted thesenetworks as bipartite, as the actors belong to different groups;the source era and the target era. Therefore, only edgesbetween nodes sets are possible.
TABLE IIIMETRICS OF INTER-ERAS INFLUENCE NETWORKS
source ! N E Ns Nt D in-degree out degreetarget avg max avg maxA ! MA 82 87 38 44 .052 1.98 7 2.29 12A ! EM 117 145 46 71 .044 2.04 7 3.15 19A ! T 66 66 29 37 .062 1.78 5 2.28 11A ! MA 101 114 42 59 .046 1.93 11 2.71 23A ! C 169 177 49 120 .030 1.47 6 3.61 46ML ! EM 149 144 66 83 .026 1.73 9 2.18 21ML ! T 52 36 22 30 .055 1.20 5 1.64 6ML ! MR 77 62 27 50 .046 1.24 4 2.30 12ML ! C 146 121 50 96 .025 1.26 6 2.42 34EM ! T 392 432 159 233 .012 1.85 16 2.72 24EM ! MR 262 269 101 161 .016 1.67 13 2.66 15EM ! C 437 432 125 312 .011 1.38 7 3.46 35T ! MR 1,111 1,373 436 675 .005 2.03 19 3.15 53T ! C 888 1,041 212 676 .007 1.54 9 4.91 112MR ! C 3,817 4,885 1,271 2,546 .002 1.92 17 3.84 78
Table III shows the metrics for those inter-era influencenetworks. In general, each era had the most links with itsconsecutive era, and additionally with the Contemporaryperiod’s scholars. Exception to this was Antiquity, whichsaw its first peak with the Early Modern period relating toRenaissance interests. Their densities were again decreasingthrough the combinations, except for those periods that had

less links to other periods, such as the Middle Ages to theTransitioning period.
Which scholar influenced a successive era the most? TableIV shows the scholars with the highest degrees in the inter-eranetworks. Noteworthy here is Karl Marx, who had the highestout-degree over all times from the Transitioning period to theContemporary age, followed by modern philosopher FriedrichNietzsche and Martin Heidegger on Contemporary scholars.
C. Accumulative Influence Networks
For each era, we constructed an accumulative influencenetwork of all influence links among scholars who livedup to and including that era. We performed essential socialnetwork analysis on these six accumulated-eras networks,which combine the internal and external impact of eras. Thefinal network of the Contemporary Age is the same as thecomplete network over all periods [5].
Fig. 4 shows the best connected scholars for each era—those that influenced at least 10 others —in the finalaccumulated network. We clearly see two joined networks ofhubs. The right section is very diverse in terms of includingdifferent eras and different fields such as philosophy, theology,and science scholars. The left section consists mainly ofwriters since the Long 19th Century (1789—1914); AlexanderPushkin (1799—1837) is one of the eldest nodes there. Thiswriters’ network shows little diversity in comparison to otherhistorical periods and consists mostly of Modern and Con-temporary age writers. That writers are less connected to thephilosophy, theology, and science scholars shows that thesegroups referenced themselves more consistently.
Table V shows the metrics of accumulated-era networks. Re-garding node degrees change over consecutively accumulatederas, we observe that at all eras the maximum out-degree isgreater than the maximum in-degree. Moreover, those maxi-mum degrees continuously increase over eras, in contrast towithin-era networks. The average out-degree changes slightlyover time, taking its lowest value of 1.45 at Middle Ages, andhighest value of 1.8 at Contemporary age. Noteworthy is the
TABLE IVTOP SCHOLARS WITH HIGHEST OUT-DEGREE IN THE INTER-ERA
NETWORKS
s ! t First Rank Second RankA ! ML Aristotle 12 Augustine of Hippo 6A ! EM Aristotle 19 Plato 14A ! T Aristotle 11 Plato 9A ! MR Plato 23 Aristotle 16A ! C Aristotle 46 Plato 32ML ! EM Ibn Tufail 21 Thomas Aquinas 9ML ! T Petrarch 6 Dante Alighieri 5ML ! MR Dante Alighieri 12 Thomas Aquinas 11ML ! C Thomas Aquinas 34 Dante Alighieri 10EM ! T J. J. Rousseau 24 Shakespeare 21EM ! MR Baruch Spinoza 15 Shakespeare 15EM ! C Shakespeare 35 David Hume 25T ! MR Immanuel Kant 53 Karl Marx 43T ! C Karl Marx 112 Hegel 67MR ! C Nietzsche 78 Martin Heidegger 73
Schelling
Chesterton
Orwell
Joyce
TolstoyGoethe
Hegel
Tufail
Bacon
Descartes
Spinoza
FreudSchopenhauer
Nietzsche
Plato
Hobbes
Kant
Smith
RousseauDiderot
Engels
Pushkin
Husserl
Voltaire
Locke
Marx
VicoSartre
Turgenev
Beckett
Benjamin
Kierkegaard
Heidegger
Aquinas
Arendt
Durkheim
Weber
Dewey
Wittgenstein
Gadamer
Peirce
Jaspers
Cusa
ProustBeauvoir
Bergson
Nabokov
Camus
Borges
Magnus
Calvo
Blanchot
Lévi-Strauss
Leibniz
James
Merleau-Ponty
Hume
Shestov
Hemingway
Scheler
Mill
Santayana
Strauss
Kojève
Bentham
Rilke
Bataille
Levinas
Macedonski
Minulescu
Gracián
Tzara
Jacobi
Cantillon
Voegelin
AntiquityMiddle AgesEarly Modern PeriodTransition PeriodModern AgeContemporary History
Fig. 4. Network of the most influential actors with at least 10 out-goinginfluences. Node size = proximity prestige, node color = era, links within anera are colored with the color of the era, the other links are gray.
drastic collapse of the largest Weak Component in the EarlyModern period, which has steadily risen since.
Who was the most influential intellectual in an era? Fig. 5shows the evolution of the 10 most influential scholars in thecomplete network based on their out-degree progression in theaccumulative networks.The top two ranks of the most prolific scholars were consis-tently taken over by Antique philosophers Plato, and Aristotle(who among contemporaries was only in rank 6) Contem-porary scholars came on third rank in the Middle Ages(Avicenna), in the Early Modern period (Ibn Tufail, JohnLocke, Rene Descartes), and in the Transitioning period (JohnLocke, Johann Goethe). This changed in the Modern Age,when Transitioning period scholars Immanuel Kant and Hegeltook the first ranks. Aristotle still remained in the top five. Thehighest out-degree over all times is observed at the Contempo-rary Age, where Karl Marx had 158 out-going influence linksto other scholars of all eras, followed by Nietzsche, Hegel,and Kant.
V. PATTERNS OF INFLUENCE OVER ERAS
In this section, we study the influence patterns of scholarsover eras. We construct influence signatures based on how
TABLE VMETRICS OF ACCUMULATIVE-ERA NETWORKS
Era A ML EM T MR CN 219 552 1,227 2,141 4,697 12,506E 327 801 1,784 3,245 7,869 22,485Nsrc 54 155 388 677 1,501 3,890Ninner 71 178 353 597 1,331 3,080Nsink 94 219 486 867 1,865 5,536Density .0068 .0026 .0012 .0007 .0004 .0001avg. out-degree 1.49 1.45 1.45 1.5 1.68 1.80max in-degree 12 16 26 38 48 48max out-degree 20 24 41 52 75 158max degree 32 36 50 60 116 196WCC 11 30 110 211 390 817Largest WCC 179 441 797 1513 3550 10192
82% 80% 65% 71% 76% 81%SCC 0 2 8 16 47 85Reciprocity 0 0.002 0.010 0.014 0.019 0.011Transitivity 0.064 0.067 0.064 0.056 0.039 0.021

Out-deg
ree
Fig. 5. Top 10 of the most influential intellectuals of the complete networkbased on their out-degree, and their progression in the accumulated-eranetworks.
much on average a scholar influenced an era, and whichpatterns of directed influences characterize an era.
1) Influence Power of Scholars: For each scholar, we con-struct their influence signature as a sequence of their influencelinks towards each era, starting from their own. For example,the influence signature of Aristotle was [10, 12, 19, 11, 16, 46],which meant he had 10 influence links within Antiquity, 12links towards the Middle Ages, etc. Using those signatures,we define the longitudinal influence power of a scholar asthe average of their influence signature. A scholar wouldhave a high influence power when he has (1) a high numberof influence links, (2) over all or many eras. In contrast,having few influence links over several eras, or many linksover few eras would give a low value of this influencepower measure. For example, with an average around 19 bothAristotle and Shakespeare had similar influence powers. Inabsolute numbers, Aristotle had almost twice the number ofShakespeare’s influence links (114 to 73, respectively). WhileAristotle influenced all 6 eras, and Shakespeare only 4, theratio of the links per era decreased for Aristotle, resultingin their similar influence powers. This measure provides anindicator of the influence power of an intellectual throughouthistory, and combines both the intensity and the diversity ofinfluence.
Influence power also allows us to compare scholars fromdifferent eras. Table VI shows the top 5 scholars based onthe longitudinal influence power. Here, Aristotle, ThomasAquinas, William Shakespeare, Karl Marx, Friedrich Niet-zsche, and the writer Vladimir Nabokov (1899—1977) areidentified by their influence power as the most influential in-tellectuals of their respective periods. The highest longitudinalinfluence powers over all times had Nietzsche (73), followedby Nabokov (58) and Marx (52).
2) Influence Patterns: Which directed influences were mostcommon in an era? We derive these influence patterns oferas by replacing any non-zero entries by X of the scholar’sinfluence signatures, and aggregate all occurrences of each
TABLE VITOP 5 ACTORS BASED ON THE LONGITUDINAL INFLUENCE POWER.
Antiquity MiddleAges EarlyModernAristotle 19.0 Thomas Aquinas 12.6 William Shakespeare 18.2Plato 17.0 Dante Alighieri 6.0 Baruch Spinoza 14.8Augustine of Hippo 6.0 Ibn Tufail 5.8 Rene Descartes 14.0Plotinus 4.7 Avicenna 4.6 John Locke 13.0Heraclitus 4.2 Al-Ghazali 3.6 David Hume 12.5
Transition ModernAge ContemporaryKarl Marx 52.6 Friedrich Nietzsche 73.0 Vladimir Nabokov 58.0Hegel 45.7 Martin Heidegger 45.0 Friedrich Hayek 50.0Immanuel Kant 45.0 Ludwig Wittgenstein 40.0 Richard Pryor 50.0Søren Kierkegaard 25.3 James Joyce 39.5 Jacques Derrida 48.0Fyodor Dostoyevsky 23.0 Sigmund Freud 32.0 Michel Foucault 47.0
pattern for each era. We thus ignore the actual values ofinfluence (intensity), but keep the temporal effect (diversity).For example, the influence pattern [X, 0, · · · , 0] means thatthe scholarly influences goes to the first (own) era only,with no influence on other eras. The pattern [X,X, · · · , X]signifies that the influence is distributed over all applicableeras, regardless of the actual values. Table VII gives the toppatterns of each era with the pattern’s frequency of occurrencewith regard to the respective era.
TABLE VIITOP FREQUENT INFLUENCE PATTERNS OF ERAS (FROM LEFT TO RIGHT)
A ML EM T MR C
Antiquity
⇥ 0 0 0 0 0 43%0 0 0 0 0 ⇥ 8%0 ⇥ 0 0 0 0 7%0 0 ⇥ 0 0 0 7%
MiddleAges
⇥ 0 0 0 0 56%0 ⇥ 0 0 0 9%⇥ ⇥ 0 0 0 7%0 0 0 0 ⇥ 6%
EarlyModern
⇥ 0 0 0 51%0 ⇥ 0 0 13%0 0 0 ⇥ 7%⇥ ⇥ ⇥ ⇥ 7%
Transition
⇥ 0 0 35%0 ⇥ 0 29%⇥ ⇥ ⇥ 11%⇥ ⇥ 0 9%0 0 ⇥ 8%0 ⇥ ⇥ 7%
ModernAge0 ⇥ 38.8%⇥ 0 36.7%⇥ ⇥ 24.5%
Contemporary ⇥ 100%
For example, for the Middle Ages the most frequent patternis [�, X, 0, 0, 0, 0], which represents that 56% of scholarsonly influenced contemporaries with no influences on othereras. Over all eras, the most common pattern was within-erainfluence, followed by the influence on the consecutive period.Exception to this rule is the Modern period, which experiencedthe reverse, and had a higher influence on the Contemporaryperiod than on its own. Since the Early Modern period, thepattern of influencing all successive eras including its ownbecomes more frequent (from 7% on), and rises with eachsuccessive period.
VI. BROKERAGE ROLE
Which roles had scholars in regard to their influence onothers? By following the brokerage approach by Gould and

Fernandez [8], we infer on the roles of scholars by analyzingthe non-transitive triads, in which node A has a tie to node B,and B has a tie to node C, but there is no tie between A andC. In these triads, B is thought to play a structural role calleda broker.
The possible roles are shown in Fig. 6, which are adaptedfrom the work of Gould and Fernandez in [8], and Everettand Borgatti [2].1 This allows us to consider to what extenta node’s importance is based on joining two nodes that aremembers of the node’s own era, or on joining others outsidetheir group. We interpret nodal membership in groups as eras.
A
1. Liaison 2. Gatekeeper 3. Representative 4. Coodinator
B
C
A
B
C
A
B
C
A
B
C
Fig. 6. Brokerage Roles of the top right node of each triad, adapted fromGould and Fernandez (1989) [8].
In Table VIII, we analyze the above-described brokerageroles for each period. Over all eras, 23% of all scholars haveon average at least one of the above described brokerageroles. Since the Early Modern period, the amount of scholarswith exactly one brokerage role remains very stable at about12—13%, slightly higher in the Antiquity and Middle Ages.Both the first and the last of the periods could have a maximumof 2 different brokerage roles, because pre-processing didn’tallow reverse links. Therefore, Representative and Liaisonbrokerage was impossible for Contemporary, as well as Liai-son and Gatekeeper brokerage for Antiquity. Coordinator andGatekeeper roles represent the scholars importance within theirown period. Gatekeeper had inter-period influences and in turninfluenced their contemporaries. The scholars with the highestscores for Gatekeeper in their respective periods are medievalpolymath Avicenna (980—1037), Early Modern philoso-pher Rene Descartes (1596—1650), and Immanuel Kant(1724—1804), Friedrich Nietzsche (1844—1900), and MichelFoucault (1926—1984). The Coordinators with the highestscores are Plato, Avicenna again, John Locke (1632—1704),Johann Goethe (1749—1832), Friedrich Nietzsche, and con-temporary horror writer Stephen King (born 1947). As Coor-dinators, these scholars represent a within-period influence.Liaison brokers have the longest time frame of influence,which includes three successive periods. Thomas Aquinas, theDominican friar (1225—1274), and Early Modern philosopherBaruch Spinoza (1632—1677) had the highest scores, andagain Immanuel Kant and Friedrich Nietzsche as Liaisons.Representatives took the reverse role of an Gatekeeper: theyhave a within-era influence that spread to a successive era.
1The fifth brokerage role, the Consultant, where A and C belong to oneperiod, and B belongs to another, is not possible in our network, as we didn’tallow reverse influences of a more recent period onto a previous one by pre-processing.
Plato, Thomas Aquinas, David Hume (1711—1776), KarlMarx (1818—1883) and Martin Heidegger (1889—1976)stand out.
From Middle to Modern Age, the amount of scholars withall four brokerage roles steadily increased. Noteworthy herewere Thomas Aquinas (Middle Ages), Gottfried Leibniz (EarlyModern Period), Georg Hegel (Transitioning Period), andMartin Heidegger (Modern Age), who appeared most oftenin super brokerage roles: They combined Liaison, Gatekeeper,Representative, and Coordinator roles alike in their respectiveperiods. Surprisingly though, scholars with 3 brokerage roleswere roughly ten times less common than those with allbrokerages (compare Table VIII).
TABLE VIIINUMBER AND FRACTION OF ACTORS TAKING 1, 2, 3, OR 4 ROLES
No. of Roles 1 2 3 4Antiquity 55 (21%) 30 (11%)MiddleAges 62 (18%) 32 (9%) 12 (3%)EarlyModern 101 (13%) 51 (7%) 2 (0.3%) 38 (5%)Transition 136 (12%) 87 (8%) 6 (0.8%) 70 (6%)ModernAge 363 (13%) 269 (9%) 5 (0.7%) 200 (7%)Contemporary 879 (12%) 536 (7%)overall 1,596 1,005 13 320
12.8% 8.0% 0.1% 2.6%
VII. CONCLUSIONS
In this paper, we incorporated a longitudinal aspect inthe study of the influence networks of scholars. First, weextracted their social network of influence from YAGO, apioneering data source of Linked Open Data, which recordsthe main influences of and by intellectuals available fromWikipedia, WordNet, and GeoNames. Rigorous pre-processingresulted in a network of 12,705 intellectuals with 22,818 edges,including information on each scholar’s era. We opted for aglobal approach for the periodization of history to match theinternationality of scholars, resulting in six consecutive erasto study.
Our main question was whether we could identify pat-terns of influence, and their change over time. Therefore,we performed essential network analysis on every time-slicedprojection of the entire network in within-era, inter-era, andaccumulated-era influence networks. We investigated theirsocial network metrics, degree distribution, and connectivity.An influence pattern throughout all eras was that the internalimpact of any era was higher than its external impact. The vastmajority of scholars influenced scholars of their own period(= within-era influence) with a relatively stable average out-degree. There were only a few instances of reciprocity. Whenaccumulating eras, the max. degrees drastically increased.However, over all eras the maximum out-degree stayed greaterthan the maximum in-degree. In inter-era influence networks,each era hat the most influence on the consecutive one, and theContemporary period. The exception to this rule was a spike inthe absolute links of antique influences on the Early Modernperiod, representing the increased reception of antique scholarsduring the Renaissance. However, proportionally Antiquity’sinfluence on Early Modernity was as high as on the Middle

Ages, which reasserts the shift in historical research that theRenaissance thinkers did not “rediscover” Antiquity, but thatmedieval scholars also received it [3, p. 3—4].
With a longitudinal perspective, we can add a more pro-nounced view on who the most influential intellectuals are. Thescholar with the highest out-degree over all periods on con-temporaries (= within-era) was Modern age scholar FriedrichNietzsche. Plato in Antiquity, Avicenna in the Middle Ages,John Locke in the Early Modern period, Johann Goethe in theTransition period and Vladimir Nabokov in the Contemporaryperiod were the most influential on the contemporaries of theirrespective periods.
When accumulating eras, the most influential intellectualsof an era change: here, Plato was the most influential forAntiquity and the Middle Ages, Aristotle for the Early Modernand Transitioning period, Immanuel Kant for the Modern Age.In the Contemporary period, and therefore for the completenetwork of intellectuals, Karl Marx.
In the inter-era network analysis, Transitioning periodscholar Karl Marx had the highest out-degree over all timesto the Contemporary age. Modern intellectuals Friedrich Ni-etzsche and Martin Heidegger took second place over all timefor the Contemporary period.
We constructed the longitudinal influence power of intel-lectuals based on the average of their influences on eras,which favors consistency of influence. Here, again, Aristotle,Thomas Aquinas, William Shakespeare, Karl Marx, FriedrichNietzsche, and Vladimir Nabokov were the most consistentlyinfluential intellectuals of their respective periods. Nietzsche,Nabokov, and Marx had the highest influence.
In terms of knowledge brokering, we could identify Co-ordinator, Gatekeeper, Representative and Liaison knowledgebrokers, whom we interpreted as passing influence betweenand within eras. We found that the scholars with all four differ-ent brokerage roles were medieval scholar Thomas Aquinas,Early Modern polygraph Gottfried Leibniz, Georg Hegel ofthe Transitioning period, and the Modern philosopher MartinHeidegger.
This study of the longitudinal patterns of influence issuch suited to further the insights on the interconnections ofinfluence of thinkers and the dynamics of eras alike.
Therefore, we plan to study the evolution of communities inthese accumulated networks in future work. Another directionof research would be to study the effects of different peri-odizations on the importance of scholars, as well as derivingan automated periodization based on the dataset. In addition,we would like to compare this YAGO network of intellectualinfluence with a more detailed network of scholars based onthe main books on intellectual history, in order to establishtheir differences and insights in this field of study.
REFERENCES
[1] Dan Edelstein, Paula Findlen, Giovanna Ceserani, Caroline Winterer, andNicole Coleman. Historical Research in a Digital Age: Reflections fromthe Mapping the Republic of Letters Project. The American HistoricalReview, 122(2):400–424, April 2017. Publisher: Oxford Academic.
[2] Martin Everett and Stephen Borgatti. Categorical Attribute basedCentrality: E–I and G–F Centrality. Social Networks, 34:562–569, 2012.
[3] Jane Fejfer, Tobias Fischer-Hansen, and Annette Rathje. Introduction.In Jane Feijfer, Tobias Fischer-Hansen, and Annette Rathje, editors, TheRediscovery of Antiquity: The Role of the Artist, pages 11–20. MuseumTusculanum Press, Copenhagen, 2003.
[4] Stefanie Ganger and Su Lin Lewis. Forum: A world of ideas: Newpathways in global intellectual history, c.1880-1930. Modern IntellectualHistory, 10(2), 2013.
[5] Raji Ghawi, Cindarella Petz, and Jurgen Pfeffer. ‘On the Shoulders ofGiants’, Analysis of a Social Network of Intellectual Influence. In SixthInternational Conference on Social Networks Analysis, Management andSecurity (SNAMS), Granada, Spain, pages 248–255, 2019.
[6] Raji Ghawi and Jurgen Pfeffer. Mining Social Networks from LinkedOpen Data. In Dominik Endres, Mehwish Alam, and Diana Sotropa,editors, Graph-Based Representation and Reasoning, pages 221–229,Cham, 2019. Springer International Publishing.
[7] Peter E. Gordon. What is Intellectual History? A Frankly PartisanIntroduction to a Frequently Misunderstood Field. 2013.
[8] Roger V Gould and Roberto M Fernandez. Structures of Mediation: AFormal Approach to Brokerage in Transaction Networks. SociologicalMethodology, 19:89–126, 1989. Publisher: [American SociologicalAssociation, Wiley, Sage Publications, Inc.].
[9] Anthony Grafton. Worlds Made by Words: Scholarship and Communityin the Modern West. Harvard University Press, Cambridge, MA, 2009.
[10] Knud Haakonssen and Richard Whatmore. Global possibilities inintellectual history: a note on practice. Global Intellectual History,2(1):18–29, 2017.
[11] Marina Hennig, Ulrik Brandes, Jurgen Pfeffer, and Ines Mergel. StudyingSocial Networks: A Guide to Empirical Research. Campus Verlag, 2012.
[12] Petter Holme and Jari Saramaki. A Map of Approaches to TemporalNetworks. In Petter Holme and Jari Saramaki, editors, TemporalNetwork Theory, Computational Social Sciences, pages 1–24. SpringerInternational Publishing, Cham, 2019.
[13] Mark Huisman and Tom A. B. Snijders. Statistical Analysis ofLongitudinal Network Data With Changing Composition. SociologicalMethods & Research, 32(2):253–287, 2003.
[14] Farzaneh Mahdisoltani, Joanna Biega, and Fabian M. Suchanek.YAGO3: A knowledge base from multilingual Wikipedias. In CIDR2015, Seventh Biennial Conference on Innovative Data Systems Re-search, Asilomar, CA, USA, Online Proceedings, 2015.
[15] Walter Moore. A Life of Erwin Schrodinger. Cambridge UniversityPress, 1994.
[16] Samuel Moyn and Andrew Sartori, editors. Global Intellectual History.Columbia University Press, New York, 2013.
[17] Theodore M Newcomb. The Acquaintance Process as a prototype ofhuman interaction. 1961.
[18] Jurgen Osterhammel. uber die Periodisierung der neueren Geschichte(Vortrag in der Geisteswissenschaftlichen Klasse am 29. November2002). volume 10 of Berichte und Abhandlungen, pages 45–64.Akademie Verlag, Berlin, 2006.
[19] Evelien Otte and Ronald Rousseau. Social Network Analysis: a PowerfulStrategy, also for the Information Sciences. Information Science,28(6):441–453, 2002.
[20] Johan Hendrik Jacob van der Pot. Sinndeutung und Periodisierung derGeschichte. Eine systematische Ubersicht der Theorien und Auffassun-gen. Brill, Leiden Bosten Koln, 1999.
[21] Tom Snijders, Gerhard G. Bunt, and Christian Steglich. Introduction toActor-Based Models for Network Dynamics. Social Networks, 32:44–60, 01 2010.
[22] Sanjay Subrahmanyam. Global Intellectual History Beyond Hegel andMarx. History and Theory, 54(1):126–137, 2015.
[23] Sanjay Subrahmanyam. Beyond the usual suspects: on intellectualnetworks in the early modern world. Global Intellectual History,2(1):30–48, 2017.
[24] Ingeborg van Vugt. Using Multi-Layered Networks to Disclose Booksin the Republic of Letters. Journal of Historical Network Research,1(1):25–51, October 2017.
[25] Stanley Wasserman and Katherine Faust. Social Network Analysis:Methods and Applications. Structural analysis in the social sciences,8. Cambridge University Press, New York, 1 edition, November 1994.
[26] Daniel Wickberg. Intellectual History vs. the Social History of Intel-lectuals. Rethinking History, 5(3):383–395, November 2001. Publisher:Routledge eprint.

Chapter 5 Case Study Social Networks in the History of Intellectuals
Diffusion Dynamics of Influence in a Social Network of
Intellectuals
Authors
Ghawi, Raji, and Petz, Cindarella, and Pfeffer, Jurgen
In
Social Network Analysis and Mining 2021, volume 11, number 63. DOI: 10.1007/s13278-
021-00771-x.
Abstract
The history of intellectuals consists of a complex web of influences and interconnections
of philosophers, scientists, writers, their work, and ideas. To understand how did these
influences evolve over time, we mined a network of influence of over 12,500 intellectuals,
enriched it with a temporal dimension dividing the history into six eras. We analyze
time-sliced projections of the network into within-era, inter-era, and accumulated-era
networks, and identify various patterns of intellectuals and eras and studied their de-
velopment in time. We also construct influence cascades, analyze their properties: size,
depth and breadth, and analyze how the cascades of influence evolve over the consecu-
tive eras. We find out that the cascades are clustered into two categories, namely small-
and large cascades. An interesting finding here is that the fraction of small cascades in-
creases, while the fraction of larges cascades decreases over time. We also briefly analyze
the community structure within the influence network of scholars.
Contribution of thesis author
Theoretical operationalization, iterative evaluation of computational implementation
and analysis, contextualization, as well as manuscript writing, revision, and editing.
104

Vol.:(0123456789)1 3
Social Network Analysis and Mining (2021) 11:63 https://doi.org/10.1007/s13278-021-00771-x
ORIGINAL ARTICLE
Di!usion dynamics of"influence in"a"social network of"intellectuals
Raji!Ghawi1 !· Cindarella!Petz1!· Jürgen!Pfe"er1
Received: 14 February 2021 / Revised: 12 May 2021 / Accepted: 23 June 2021 © The Author(s) 2021
AbstractThe history of intellectuals consists of a complex web of influences and interconnections of philosophers, scientists, writers, their work, and ideas. To understand how did these influences evolve over time, we mined a network of influence of over 12,500 intellectuals, enriched it with a temporal dimension dividing the history into six eras. We analyze time-sliced projec-tions of the network into within-era, inter-era, and accumulated-era networks, and identify various patterns of intellectuals and eras and studied their development in time. We also construct influence cascades, analyze their properties: size, depth and breadth, and analyze how the cascades of influence evolve over the consecutive eras. We find out that the cascades are clustered into two categories, namely small- and large cascades. An interesting finding here is that the fraction of small cas-cades increases, while the fraction of larges cascades decreases over time. We also briefly analyze the community structure within the influence network of scholars.
Keywords Social networks!· Intellectual influence!· Di"usion dynamics
1 Introduction
“No self is of itself alone,” wrote Erwin Schrödinger in 1918 (Moore 1994) and noted, “It has a long chain of intellec-tual ancestors.” The history of intellectuals is comprised of a myriad of such long chains, embedded in a tapestry of competing influences of “ageless” ideas, which—in the words of the French scholar Bonaventura D’Argonne in 1699—“embrace [...] the whole world” (Grafton 2009).
To understand the dynamics of influence and spread of ideas through history, the embeddness and interconnections of scholarship should be taken into account. A network approach o"ers to identify the most influential scholars via their positions in a network of intellectual influence through the history. This allows the study of their social relations (Wasserman and Faust 1994; Hennig et!al. 2012; Otte and
Rousseau 2002), and to provide deep insights into the under-lying social structure.
In a previous work (Ghawi et!al. 2019), we addressed the analysis of such a social network of intellectual influ-ence, incorporating over 12,500 scholars from international origins since the beginning of historiography. In Petz et!al. (2020), we also extended the analysis of that network by incorporating a temporal dimension, analyzing the network of scholars dependent to their time, and adding a longitudi-nal perspective on how scholars formed networks. By doing so, we opted for an inclusive, global perspective on the his-tory of intellectuals. This perspective of a vast longitudinal global network of intellectuals is a response to recent dis-cussions on not-global-enough research within intellectual history (Haakonssen and Whatmore 2017). We thus attempt to go beyond the traditional “master narratives” (Gänger and Lewis 2013) of a Western European centrist view on intel-lectual history (Subrahmanyam 2017).
The goal is not only to understand how the influence rela-tions among scholars evolved over time, but also to get deep insights on their influence on historical periods. With this kind of longitudinal analysis, we can answer questions like: how did these influence networks evolve over time? who were the most influential scholars in a period? and which patterns of influence did emerge?
* Raji Ghawi [email protected] Cindarella Petz [email protected] Jürgen Pfe"er juergen.pfe"[email protected] Bavarian School of!Public Policy, Technical University
of!Munich, Munich, Germany

Social Network Analysis and Mining (2021) 11:63
1 3
63 Page 2 of 23
In this paper, we build upon (Petz et!al. 2020), and extend the analysis of the social network of scholars by addressing the di"usion dynamics of influence among scholars over the history. As scholars get influenced by other scholars, who are influenced by others, and so on, the influence of scholars spread over time, and takes the form of cascades. Influence cascades can be characterized using several properties, such as size, depth, and breadth. For all scholars in the social network, we measure and analyze these properties, and categorize the scholars based on the properties of their influence cascades.
Moreover, we analyze the community structure within the network of scholars. By applying a community detection algo-rithm, we are able to identify the major communities of scholars who densely influence each other, forming knowledge clusters.
Our contributions are as follows:
– We incorporate a longitudinal perspective on the social network analysis of intellectuals based on a global perio-dization of history.
– We identify patterns of influence and their distribution in within-, inter-, and accumulated-era influence networks.
– We identify influence signatures of scholars and eras.– We identify scholars with various knowledge broker
roles.– We construct influence cascades of scholars, and measure
and their properties.– We analyze the cascade properties over eras, and charac-
terize them into two clusters of small- and large cascades.– We analyze the community structure within the network
of scholars, and how the identified communities influence each other.
This paper is organized as follows. Section!2 reviews related works. In Sect.!3, we briefly outline the dataset’s character-istics and pre-processing. Section!4 presents the network analysis of the entire network, and its time-sliced projec-tions into partial influence networks (within-era, inter-era, and accumulated-era), featuring their basic network metrics, degree distribution, and connectivity. In Sect.!5, we identify di"erent influence patterns of scholars and eras. Section!6 is devoted to the longitudinal analysis of brokerage roles of scholars. In Sect.!7, we address the di"usion dynamics of influence through the analysis of influence cascades of scholars over di"erent eras. Finally, in Sect.!8, we address the communities of scholars, and the influence between them.
2 Related work
The term of intellectual history combines a plethora of approaches on discourse analysis, evolution of ideas, intel-lectual genealogies, and the history of books, various
scientific disciplines, political thought, and intellectual social context (Wickberg 2001; Gordon 2013). These stud-ies are usually limited to specific regions or time spans as a trade-o" for thorough comparative and textual analysis. Endeavors to write a “Global Intellectual History” (Moyn and Sartori 2013) were criticized for focusing on the more well-known intellectual thinkers despite including a trans-national comparative perspective (Subrahmanyam 2015).
Network methodologies allow analyzing intellectual history and as such the history of intellectuals as big data, encompassing time and space with a focus on their inter-con-nections. Notably, computational methods have been used in the study of communication networks of the respublica litteraria of the late 17th and 18th century, in which various studies modeled the Early Modern scholarly book and let-ter exchanges as formal networks. Since 2008, the project “Mapping the Republic of Letters” at Stanford University spearheaded the digitization of Early Modern letters and systematically modelled the metadata on who is connected to whom in correspondence networks mapped into spatial realm, similarly to a “tra#c analysis” (Edelstein et!al. 2017 p. 403). More recent studies have incorporated a temporal perspective on these epistolary networks, and studied their change in time, as well as di"erentiated between the types of correspondence exchanged in a multi-layered perspective (Vugt 2017). While the Republic of Letters contains a mul-titude of scholarly actors in an imagined intellectual com-munity—the so-called republic—consisting of “a palimpsest of people, books, and objects in motion” (Grafton 2009 p. 6), it is confined to the Early Modern period, and primarily studied through the in-depth analysis of selected ego net-works, such as e.g. the correspondence network of Benja-min Frankling during his “London Decades” (1757–1775) Winterer (2012), or the influence of English authors on the Enlightenment philosophy of Voltaire (Edelstein and Kass-abova 2020).
A recent study (Ghawi et!al. 2019) proposed to research the entire history of intellectuals with the means of a net-work approach. This paper defined the most influential as those with the longest reaching influence (influence cas-cades), and identified as such Antique and Medieval Islam scholars, and Karl Marx as the one with the most out-going influences. In this paper, we extend this analysis by incor-porating a temporal dimension in order to establish a deeper insight on how these influences evolved in time. Much research has been devoted to the area of longitudinal social networks (Newcomb 1961; Huisman and Snijders 2003; Sni-jders et!al. 2010; Holme and Saramäki 2019). Longitudinal network studies aim at understanding how social structures develop or change over time, usually by employing panel data (Hennig et!al. 2012). Snapshots of the social network at di"erent points in time are analyzed in order to explain the changes in the social structure between two (or more)
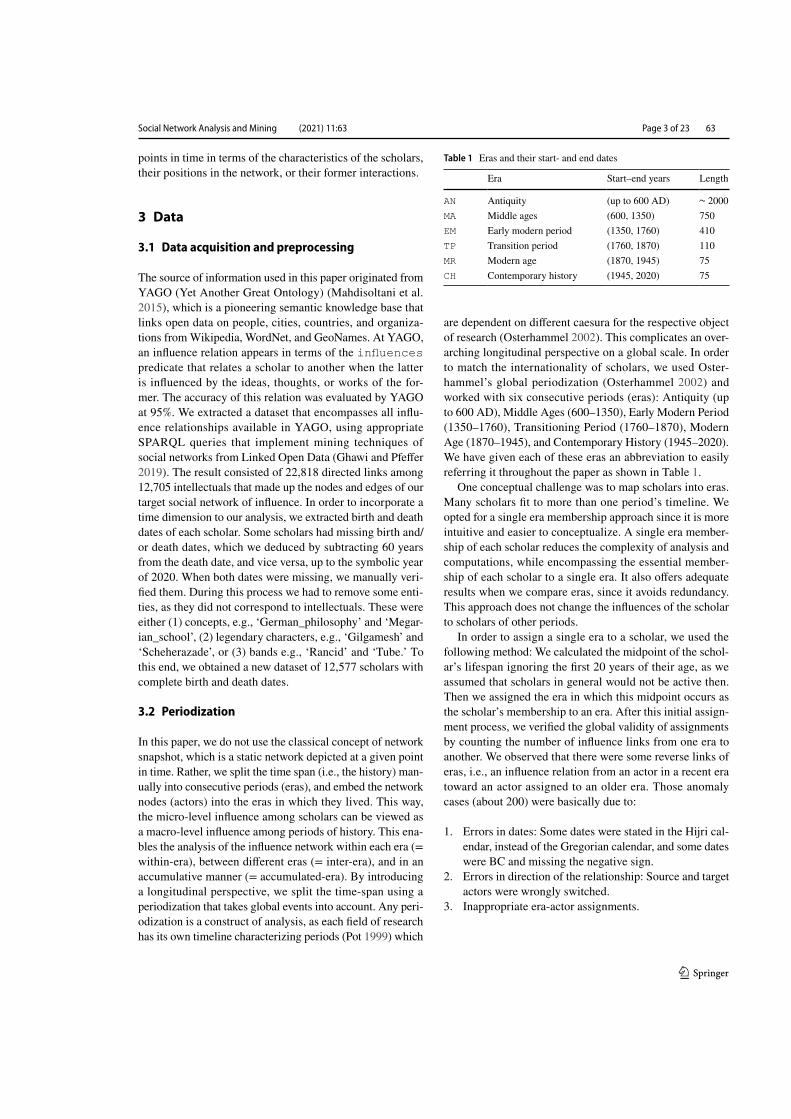
Social Network Analysis and Mining (2021) 11:63
1 3
Page 3 of 23 63
points in time in terms of the characteristics of the scholars, their positions in the network, or their former interactions.
3 Data
3.1 Data acquisition and!preprocessing
The source of information used in this paper originated from YAGO (Yet Another Great Ontology) (Mahdisoltani et!al. 2015), which is a pioneering semantic knowledge base that links open data on people, cities, countries, and organiza-tions from Wikipedia, WordNet, and GeoNames. At YAGO, an influence relation appears in terms of the influences predicate that relates a scholar to another when the latter is influenced by the ideas, thoughts, or works of the for-mer. The accuracy of this relation was evaluated by YAGO at 95%. We extracted a dataset that encompasses all influ-ence relationships available in YAGO, using appropriate SPARQL queries that implement mining techniques of social networks from Linked Open Data (Ghawi and Pfe"er 2019). The result consisted of 22,818 directed links among 12,705 intellectuals that made up the nodes and edges of our target social network of influence. In order to incorporate a time dimension to our analysis, we extracted birth and death dates of each scholar. Some scholars had missing birth and/or death dates, which we deduced by subtracting 60 years from the death date, and vice versa, up to the symbolic year of 2020. When both dates were missing, we manually veri-fied them. During this process we had to remove some enti-ties, as they did not correspond to intellectuals. These were either (1) concepts, e.g., ‘German_philosophy’ and ‘Megar-ian_school’, (2) legendary characters, e.g., ‘Gilgamesh’ and ‘Scheherazade’, or (3) bands e.g., ‘Rancid’ and ‘Tube.’ To this end, we obtained a new dataset of 12,577 scholars with complete birth and death dates.
3.2 Periodization
In this paper, we do not use the classical concept of network snapshot, which is a static network depicted at a given point in time. Rather, we split the time span (i.e., the history) man-ually into consecutive periods (eras), and embed the network nodes (actors) into the eras in which they lived. This way, the micro-level influence among scholars can be viewed as a macro-level influence among periods of history. This ena-bles the analysis of the influence network within each era (= within-era), between di"erent eras (= inter-era), and in an accumulative manner (= accumulated-era). By introducing a longitudinal perspective, we split the time-span using a periodization that takes global events into account. Any peri-odization is a construct of analysis, as each field of research has its own timeline characterizing periods (Pot 1999) which
are dependent on di"erent caesura for the respective object of research (Osterhammel 2002). This complicates an over-arching longitudinal perspective on a global scale. In order to match the internationality of scholars, we used Oster-hammel’s global periodization (Osterhammel 2002) and worked with six consecutive periods (eras): Antiquity (up to 600 AD), Middle Ages (600–1350), Early Modern Period (1350–1760), Transitioning Period (1760–1870), Modern Age (1870–1945), and Contemporary History (1945–2020). We have given each of these eras an abbreviation to easily referring it throughout the paper as shown in Table!1.
One conceptual challenge was to map scholars into eras. Many scholars fit to more than one period’s timeline. We opted for a single era membership approach since it is more intuitive and easier to conceptualize. A single era member-ship of each scholar reduces the complexity of analysis and computations, while encompassing the essential member-ship of each scholar to a single era. It also o"ers adequate results when we compare eras, since it avoids redundancy. This approach does not change the influences of the scholar to scholars of other periods.
In order to assign a single era to a scholar, we used the following method: We calculated the midpoint of the schol-ar’s lifespan ignoring the first 20 years of their age, as we assumed that scholars in general would not be active then. Then we assigned the era in which this midpoint occurs as the scholar’s membership to an era. After this initial assign-ment process, we verified the global validity of assignments by counting the number of influence links from one era to another. We observed that there were some reverse links of eras, i.e., an influence relation from an actor in a recent era toward an actor assigned to an older era. Those anomaly cases (about 200) were basically due to:
1. Errors in dates: Some dates were stated in the Hijri cal-endar, instead of the Gregorian calendar, and some dates were BC and missing the negative sign.
2. Errors in direction of the relationship: Source and target actors were wrongly switched.
3. Inappropriate era-actor assignments.
Table 1 Eras and their start- and end dates
Era Start–end years Length
AN Antiquity (up to 600 AD) ! 2000MA Middle ages (600, 1350) 750EM Early modern period (1350, 1760) 410TP Transition period (1760, 1870) 110MR Modern age (1870, 1945) 75CH Contemporary history (1945, 2020) 75

Social Network Analysis and Mining (2021) 11:63
1 3
63 Page 4 of 23
The anomalies due to errors have been manually corrected. The cases of inappropriate assignment were technically not erroneous. This usually happened when the influencer lived much longer than the influenced, elevating the influencer’s period into a more recent one. We solved this by iteratively reassigning either the influencer backward to the era of the influenced, or the influenced forward to the era of the influencer. As a result, each scholar is assigned to exactly one era, such that no reverse links of eras exist. The final cleaned dataset consists of 22,485 influence links among 12,506 intellectuals. Figure!1 shows each era’s continuous density of scholars based on their lifespan; whereas Fig.!2 shows the number of scholars assigned to each era.
4 Analysis
With scholars embedded in their respective eras, the entire influence network can be time-sliced: we projected it into several partial networks based on the source era (of the influencer) and target era (of the influenced scholar). When the source and target eras are the same, we call the partial network a within-era influence network. When the source and target eras are di"erent, we call the partial network an inter-era influence network. There are no reverse links from a later era to a previous one due to preprocessing.
As a result of time-slicing the whole network, we obtain six within-era networks corresponding to all the six eras, and 15 inter-era networks, corresponding to all chronologi-cally ordered (but not necessarily consecutive) pairs of dif-ferent eras. Moreover, we constructed six accumulated-era influence networks of scholars living up to and including a target era.
Figure!3 shows the distribution of influence links over pairs of eras, where the rows represent source eras, and the columns represent target eras, i.e., each cell displays the number of influence links incoming from (actors in) the row era, outgoing to (actors in) the columns era. One can easily observe that the greatest deal of links occur within the Contemporary era, followed by the links from Modern Age to Contemporary, and within Modern Age. This is obvi-ously because those recent eras comprise the largest deal of scholars in our dataset.
Figure!4 shows the proportion of influence links among all pairs of eras. There, we can already make two major observations for inter- and within-era influence relations: For one, the highest fraction of influence received by schol-ars of each era comes from its own era. This means that the internal impact of any era is in general higher than its exter-nal impact. In absolute numbers, the vast majority of links occur within the Contemporary era, followed by links from the Modern Age to the Contemporary period, and within the
Fig. 1 Number of scholars alive in each year based on their assigned eras
Fig. 2 Number of scholars per eraFig. 3 Number of influence links from preceding periods (rows) to target eras (columns)

Social Network Analysis and Mining (2021) 11:63
1 3
Page 5 of 23 63
Modern Age, which is clearly owed to the increased amount of scholars in these periods.
The inter-era influences of each period is strongest on its consecutive period. As our earliest period, Antiquity receives only influence links from itself, whereas the influ-ence received in the Middle Ages are 82% internal, and 18% from Antiquity. Subsequently, the amount of the within-era influence shrinks throughout the consecutive periods, but still remains the biggest influence. Noteworthy here is the high proportion of influences of Antiquity on the Early Mod-ern period, which represents their increased reception during the Renaissance. However, the proportionately many links of Antiquity to the Middle Ages reassert the shift in historical research that the Renaissance did not “rediscover” Antiquity, but was received before in the Middle Ages as well (Fejfer et!al. 2003 p. 3–4).
4.1 Within-eras influence networks
In the following, we analyzed the six within-era influence networks, which represent the internal impact of an era. We extracted the following metrics, as shown in Table!2:
– Number of nodes N, and edges E, and density D.– Average out-degree (= avg. in-degree due to the proper-
ties of a directed graph).– Max. in-degree, max. out-degree, and max. degree.– WCC: number of weakly connected components.– LWCC: size of the largest weakly connected component.– SCC: number of strongly connected components, when
the number of nodes is > 1).– Reciprocity (R) and transitivity (T).
Fig. 4 Percentage of received influences in each era
ML EM T MR CA
Table 2 Metrics of within-era networks Era AN MA EM TP MR CH
N 219 303 610 761 2102 6081N/A 82% 86% 81% 70% 73% 85%E 327 387 694 927 2806 7960Density .0068 .0042 .0019 .0016 .0006 .0002avg. dout 1.49 1.28 1.14 1.22 1.33 1.31max din 12 9 17 27 21 26max dout 20 16 23 32 68 58max d 32 20 32 41 73 58WCC 11 21 94 108 208 582LWCC 179 233 245 436 1495 4379
82% 77% 40% 57% 71% 72%SCC 0 2 6 8 31 38R 0 0.005 0.023 0.028 0.036 0.014T 0.064 0.066 0.071 0.042 0.029 0.017

Social Network Analysis and Mining (2021) 11:63
1 3
63 Page 6 of 23
We included NA in Table!2 in order to contain that the num-
ber of nodes N in a within-era network could be less than the number of actors of that of era A. This is owing to the fact that not all scholars of an era necessarily participated in its within-era influence network. Some scholars influenced or were influenced by actors of di"erent eras only. How-ever, around 80% of scholars in each era were active in these within-era networks. The highest value of 86% of the Middle Ages refers to their relative self-containment as an era, as well as the lowest value in the Transitioning period of 70% refers to its high out-going influences.
Over all eras, the amount of nodes and edges steadily increased, while the density of networks decreased. On aver-age, the out-degree revolves around 1.25, where the highest value of 1.5 occurs in Antiquity, and the lowest of 1.14 in the Early Modern period. When we compare the evolution of the max. out-degree in time, we find that the expected continuous increase did not always hold due to two excep-tionally high observations at Antiquity and the Modern Age. Mutual ties among contemporaries were in general very low. We can report none in Antiquity, and only one in the Middle Ages between Avicenna and Al-B#$#. In the Early Modern period, eight mutual relations were observed, including, e.g., Gottfried Leibniz (1646–1716) and David Bernoulli (1700–1782), whereas 13 mutual relations in the Transitioning period, such as Friedrich Engels (1820–1895) and Karl Marx (1818–1883), or Johann Goethe (1749–1832) and Friedrich Schelling (1775–1854). In the Modern Age, the number of mutual ties increased to 51 (e.g., Jean-Paul Sartre (1905–1980) and Simone de Beauvoir (1908–1986)); and to 54 in the Contemporary period.
Figure!5 shows the number of weakly connected compo-nents (WCCs) in the within-era networks of each era, and the
relative size of the largest ones w.r.t the whole corresponding network.
The number of WCCs increased gradually over the con-secutive eras. In general, the networks consisted of one giant component, which encompassed the majority of nodes, while the rest of components were relatively smaller. This was particularly developed in Antiquity and the Middle Ages, where the giant components constitute of 82% and 77% of the nodes, while the second largest were at 6% and 3%, respectively. The Early Modern period constitutes an exception to this giant component rule: the largest one was only at 40%, and the second largest at 16%. Looking at their composition, the first consisted of natural scientists, math-ematicians, and philosophers, such as Descartes, Newton, and Leibniz, while the smaller one was compromise of art-ists and painters, such as Rembrandt and Raphael. The single giant component phenomenon appeared again in subsequent eras. For instance, in the Transitioning period, there were 108 WCCs, where the largest two incorporated 57% and 1.3% of the nodes. In the Modern and Contemporary Age, the largest components comprised about 70% of nodes.
Who was most influential on their contemporaries? Table!3 lists the top five scholars per era based on their out-degree in the within-era influence networks. The highest within-era out-degree over all times was achieved by Frie-drich Nietzsche (1844–1900) of the Modern Age with 68 outgoing influence links to other scholars of his era.
4.2 Inter-era influence networks
Inter-era influence networks are partial networks where the source era precedes the target era. We interpreted these net-works as bipartite, as the actors belong to di"erent groups; the source era and the target era. Therefore, only edges between nodes sets are possible.
Fig. 5 Weakly connected components in within-era influence networks

Social Network Analysis and Mining (2021) 11:63
1 3
Page 7 of 23 63
Table!4 shows the metrics for those inter-era influence networks. In general, each era had the most links with its consecutive era, and additionally with the Contemporary period’s scholars. Exception to this was Antiquity, which saw its first peak with the Early Modern period relating to Renaissance interests.
Their densities were again decreasing through the combi-nations, except for those periods that had less links to other periods, such as the Middle Ages to the Transitioning period.
Which scholar influenced a successive era the most? Table!5 shows the scholars with the highest degrees in the inter-era networks. Noteworthy here is Karl Marx, who had the highest out-degree over all times from the Transition-ing period to the Contemporary age, followed by modern philosopher Friedrich Nietzsche and Martin Heidegger on Contemporary scholars.
4.3 Accumulative influence networks
For each era, we constructed an accumulative network of all influence links among scholars who lived up to and includ-ing that era. We performed essential social network analysis on these six accumulated-eras networks, which combine the internal and external impact of eras. The final network of the Contemporary Age is the same as the complete network over all periods (Ghawi et!al. 2019).
Figure!6 shows the best connected scholars for each era those that influenced at least 10 others - in the final accu-mulated network. We clearly see two joined networks of hubs. The right section is very diverse in terms of including di"erent eras and di"erent fields such as philosophy, theol-ogy, and science scholars. The left section consists mainly of writers since the Long 19th Century (1789–1914); Alex-ander Pushkin (1799–1837) is one of the eldest nodes there. This writers’ network shows little diversity in comparison to other historical periods and consists mostly of Modern and Contemporary age writers. That writers are less connected to the philosophy, theology, and science scholars show that these groups referenced themselves more consistently.
Table!6 shows the metrics of accumulated-era networks. Regarding node degrees change over consecutively accu-mulated eras, we observe that at all eras the maximum
Table 3 Top 5 actors, per era, based on out-degree in within-era influence networks
Antiquity MiddleAges
Plato 20 Avicenna 16Aesop 13 Muhammad 11Pythagoras 10 Al-Ghazali 11Plotinus 10 Ban$M$s% 8Euhemerus 10 J. S. Eriugena 8EarlyModern Transition
John Locke 23 Goethe 32René Descartes 22 Hegel 29Isaac Newton 15 Lord Byron 24Hugo Grotius 13 Immanuel Kant 22Leibniz 11 von Schelling 17Modern Contemporary
Nietzsche 68 Vladimir Nabokov 58Jules Verne 35 Friedrich Hayek 50Henri Bergson 35 Richard Pryor 50Leo Tolstoy 24 Jacques Derrida 48Edmund Husserl 22 Michel Foucault 47
Table 4 Metrics of inter-eras influence networks Source ! N E Ns Nt D In-degree Out degree
Target avg max avg max
AN ! MA 82 87 38 44 .052 1.98 7 2.29 12AN ! EM 117 145 46 71 .044 2.04 7 3.15 19AN ! TP 66 66 29 37 .062 1.78 5 2.28 11AN ! MR 101 114 42 59 .046 1.93 11 2.71 23AN ! CH 169 177 49 120 .030 1.47 6 3.61 46MA ! EM 149 144 66 83 .026 1.73 9 2.18 21MA ! TP 52 36 22 30 .055 1.20 5 1.64 6MA ! MR 77 62 27 50 .046 1.24 4 2.30 12MA ! CH 146 121 50 96 .025 1.26 6 2.42 34EM ! TP 392 432 159 233 .012 1.85 16 2.72 24EM ! MR 262 269 101 161 .016 1.67 13 2.66 15EM ! CH 437 432 125 312 .011 1.38 7 3.46 35TP ! MR 1111 1373 436 675 .005 2.03 19 3.15 53TP ! CH 888 1041 212 676 .007 1.54 9 4.91 112MR ! CH 3817 4885 1271 2546 .002 1.92 17 3.84 78

Social Network Analysis and Mining (2021) 11:63
1 3
63 Page 8 of 23
out-degree is greater than the maximum in-degree. Moreo-ver, those maximum degrees continuously increase over eras, in contrast to within-era networks. The average out-degree
changes slightly over time, taking its lowest value of 1.45 at Middle Ages, and highest value of 1.8 at Contemporary age. Noteworthy is the drastic collapse of the largest Weak Component in the Early Modern period, which has steadily risen since.
Who was the most influential intellectual in an era? Fig-ure!7 shows the evolution of the 10 most influential scholars in the complete network based on their out-degree progres-sion in the accumulative networks.
The top two ranks of the most prolific scholars were con-sistently taken over by Antique philosophers Plato, and Aris-totle (who among contemporaries was only in rank 6). Con-temporary scholars came on third rank in the Middle Ages (Avicenna), in the Early Modern period (Ibn Tufail, John Locke, René Descartes), and in the Transitioning period (John Locke, Johann Goethe). This changed in the Modern Age, when Transitioning period scholars Immanuel Kant and Hegel took the first ranks. Aristotle still remained in the top five. The highest out-degree over all times is observed at the Contemporary Age, where Karl Marx had 158 out-going influence links to other scholars of all eras, followed by Nietzsche, Hegel, and Kant.
Table 5 Top scholars w.r.t out-degree in inter-era networks
source ! target
First rank Second Rank
AN ! MA Aristotle 12 Augustine of Hippo 6AN ! EM Aristotle 19 Plato 14AN ! TP Aristotle 11 Plato 9AN ! MR Plato 23 Aristotle 16AN ! CH Aristotle 46 Plato 32MA ! EM Ibn Tufail 21 Thomas Aquinas 9MA ! TP Petrarch 6 Dante Alighieri 5MA ! MR Dante Alighieri 12 Thomas Aquinas 11MA ! CH Thomas Aquinas 34 Dante Alighieri 10EM ! TP J. J. Rousseau 24 Shakespeare 21EM ! MR Baruch Spinoza 15 Shakespeare 15EM ! CH Shakespeare 35 David Hume 25TP ! MR Immanuel Kant 53 Karl Marx 43TP ! CH Karl Marx 112 Hegel 67MR ! CH Nietzsche 78 Martin Heidegger 73
Schelling
Chesterton
Orwell
Joyce
TolstoyGoethe
Hegel
Tufail
Bacon
DescartesSpinoza
FreudSchopenhauer
Nietzsche
Plato
Hobbes
Kant
Smith
RousseauDiderot
Engels
Pushkin
Husserl
Voltaire
Locke
Marx
VicoSartre
Turgenev
Beckett
Benjamin
Kierkegaard
Heidegger
Aquinas
Arendt
Durkheim
Weber
Dewey
Wittgenstein
Gadamer
Peirce
Jaspers
Cusa
ProustBeauvoir
Bergson
Nabokov
Camus
Borges
Magnus
Calvo
Blanchot
Lévi-Strauss
Leibniz
James
Merleau-Ponty
Hume
Shestov
Hemingway
Scheler
Mill
Santayana
Strauss
Kojève
Bentham
Rilke
Bataille
Levinas
Macedonski
Minulescu
Gracián
Tzara
Jacobi
Cantillon
Voegelin
AntiquityMiddle AgesEarly Modern PeriodTransition PeriodModern AgeContemporary History
Fig. 6 Network of the most influential actors with at least 10 out-going influences. Node size = proximity prestige, node color = era, links within an era are colored with the color of the era, the other links are gray

Social Network Analysis and Mining (2021) 11:63
1 3
Page 9 of 23 63
5 Patterns of!in"uence over!eras
In this section, we study the influence patterns of scholars over eras. We construct influence signatures based on how much on average a scholar influenced an era, and which pat-terns of directed influences characterize an era.
5.1 Influence power of!scholars
For each scholar, we construct their influence signature as a sequence of their influence links toward each era, start-ing from their own. For example, the influence signature of Aristotle was [10,!12,!19,!11,!16,!46], which meant he had 10
influence links within Antiquity, 12 links toward the Middle Ages, etc. Using those signatures, we define the longitudinal influence power of a scholar as the average of their influ-ence signature. A scholar would have a high influence power when he has (1) a high number of influence links, (2) over all or many eras. In contrast, having few influence links over several eras, or many links over few eras would give a low value of this influence power measure. For example, with an average around 19 both Aristotle and Shakespeare had similar influence powers. In absolute numbers, Aristotle had almost twice the number of Shakespeare’s influence links (114 to 73, respectively). While Aristotle influenced all 6 eras, and Shakespeare only 4, the ratio of the links per era decreased for Aristotle, resulting in their similar influence
Table 6 Metrics of accumulative-era networks Era AN MA EM TP MR CH
N 219 552 1227 2141 4697 12,506E 327 801 1784 3245 7869 22,485Nsource 54 155 388 677 1501 3890Ninner 71 178 353 597 1331 3080Nsink 94 219 486 867 1865 5536Density .0068 .0026 .0012 .0007 .0004 .0001avg. dout 1.49 1.45 1.45 1.5 1.68 1.80max din 12 16 26 38 48 48max dout 20 24 41 52 75 158max d 32 36 50 60 116 196WCC 11 30 110 211 390 817LWCC 179 441 797 1513 3550 10192
82% 80% 65% 71% 76% 81%SCC 0 2 8 16 47 85R 0 0.002 0.010 0.014 0.019 0.011T 0.064 0.067 0.064 0.056 0.039 0.021
Fig. 7 Top 10 of the most influential intellectuals of the complete network based on their out-degree, and their progres-sion in the accumulated-era networks
Out
-deg
ree

Social Network Analysis and Mining (2021) 11:63
1 3
63 Page 10 of 23
powers. This measure provides an indicator of the influence power of an intellectual throughout history, and combines both the intensity and the diversity of influence.
Influence power also allows us to compare scholars from di"erent eras. Table!7 shows the top 5 scholars based on the longitudinal influence power. Here, Aristotle, Thomas Aqui-nas, William Shakespeare, Karl Marx, Friedrich Nietzsche, and the writer Vladimir Nabokov (1899–1977) are identified by their influence power as the most influential intellectuals of their respective periods. The highest longitudinal influ-ence powers over all times had Nietzsche (73), followed by Nabokov (58) and Marx (52).
5.2 Influence patterns
Which directed influences were most common in an era? We derive these influence patterns of eras by replacing any nonzero entries by X of the scholar’s influence signatures, and aggregate all occurrences of each pattern for each era. We thus ignore the actual values of influence (intensity), but keep the temporal e"ect (diversity). For example, the influ-ence pattern [X, 0,! , 0] means that the scholarly influences goes to the first (own) era only, with no influence on other eras. The pattern [X,X,! ,X] signifies that the influence is distributed over all applicable eras, regardless of the actual values. Table!8 gives the top patterns of each era with the pattern’s frequency of occurrence with regard to the respec-tive era.
For example, for the Middle Ages the most frequent pat-tern is [!,X, 0, 0, 0, 0] , which represents that 56% of scholars only influenced contemporaries with no influences on other eras. Over all eras, the most common pattern was within-era influence, followed by the influence on the consecutive period. Exception to this rule is the Modern period, which experienced the reverse, and had a higher influence on the Contemporary period than on its own. Since the Early Mod-ern period, the pattern of influencing all successive eras including its own becomes more frequent (from 7% on), and rises with each successive period.
6 Brokerage roles
Which roles had scholars in regard to their influence on oth-ers? By following the brokerage approach by Gould and Fernandez (Gould and Fernandez 1989), we infer on the roles of scholars by analyzing the non-transitive triads, in which node A has a tie to node B, and B has a tie to node C, but there is no tie between A and C. In these triads, B is thought to play a structural role called a broker.
The possible brokerage roles are shown in Fig.!8, which are adapted from the work of Gould and Fernandez in Gould and Fernandez (1989), and Everett and Borgatti (2012). These brokerage roles are:1
1. Coordinator, where A, B and C all belong to the same group;
2. Representative, where A and B belong to one group, and C belongs to another;
3. Gatekeeper, where A belongs to one group, and B and C belong to another;
4. Liaison, where A, B and C each belong to a di"erent group.
In this paper, we interpret nodal membership in groups as eras. This allows us to consider to what extent a node’s importance is based on joining two nodes that are members of the node’s own era, or on joining others outside their era.
Table!9 shows, for every type of brokerage roles, and for each era, the top three scholars with that role in that era. The number besides each scholar is the number of non-transitive triads of that scholar w.r.t the specified brokerage role and the specified era. Since reverse links, from an era to an older one, are not allowed (as per preprocessing), some brokerage roles are not possible in some eras. Namely, Representative
Table 7 Top scholars, in each era, with respect to longitudinal influ-ence power
Antiquity MiddleAges
Aristotle 19.0 Thomas Aquinas 12.6Plato 17.0 Dante Alighieri 6.0Augustine of Hippo 6.0 Ibn Tufail 5.8Plotinus 4.7 Avicenna 4.6Heraclitus 4.2 Al-Ghazali 3.6EarlyModernPeriod TransitionPeriod
William Shakespeare 18.2 Karl Marx 52.6Baruch Spinoza 14.8 Hegel 45.7René Descartes 14.0 Immanuel Kant 45.0John Locke 13.0 Søren Kierkegaard 25.3David Hume 12.5 Fyodor Dostoyevsky 23.0ModernAge ContemporaryHistory
Friedrich Nietzsche 73.0 Vladimir Nabokov 58.0Martin Heidegger 45.0 Friedrich Hayek 50.0Ludwig Wittgenstein 40.0 Richard Pryor 50.0James Joyce 39.5 Jacques Derrida 48.0Sigmund Freud 32.0 Michel Foucault 47.0
1 There is a fifth brokerage role, the Consultant, where A and C belong to one period, and B belongs to another. This role is not pos-sible in our network, as we did not allow reverse influences of a more recent period onto a previous one.

Social Network Analysis and Mining (2021) 11:63
1 3
Page 11 of 23 63
and Liaison brokerage roles are impossible for Contempo-rary, as well as Liaison and Gatekeeper brokerage roles for Antiquity.
For Coordinator role, A, B and C belong to the same era. Hence, a scholar with this role gets influence from- and influences other scholars from the same era. The scholars with the highest scores for Coordinator in their respec-tive periods are: the ancient Greek philosopher Plato, the medieval polymath Avicenna (980–1037), the Early Mod-ern philosopher John Locke (1632–1704), Johann Goethe (1749–1832), Friedrich Nietzsche (1844–1900), and the contemporary horror writer Stephen King (born 1947).
For Representative role, A and B belong to one era, and C belongs to another (more recent) era. Hence, a scholar with this role gets influence from other scholars from his own era, and influences other scholars from another era. The top scholars with this role are: Plato and Aristotle in Antiquity, Ibn Tufail (1105–1185) and Tomas Aquinas (1225–1274) in Middle Ages, David Hume (1711–1776) and
Leibniz (1646–1716) in Early Modern period, Karl Marx (1818–1883) and Hegel (1770–1831) in Transition period, and the modern philosophers Martin Heidegger (1889–1976) and Ludwig Wittgenstein (1889–1951).
For Gatekeeper role, A belongs to one era, and B and C belong to another more recent era. Hence, a scholar with this role gets influence from other scholars from an older era, and influences other scholars from his own era. The top scholars with this role are: Avicenna and Tomas Aquinas in Mid-dle Ages, René Descartes (1596–1650) and John Locke in Early Modern period, Immanuel Kant (1724–1804), Hegel, and Goethe in Transition period, Nietzsche in Modern Age, and the contemporary French philosopher Michel Foucault (1926–1984).
For Liaison role, A, B and C each belong to a di"erent group. Hence, a scholar with this role gets influence from other scholars from an older era, and influences other schol-ars from another more recent era. The top scholars with this role are: Tomas Aquinas in Middle Ages, the Early Modern
Table 8 Top frequent influence patterns of eras AN MA EM TP MR CH
Antiquity ! 0 0 0 0 0 43%0 0 0 0 0 ! 8%0 ! 0 0 0 0 7%0 0 ! 0 0 0 7%
MiddleAges ! 0 0 0 0 56%0 ! 0 0 0 9%! ! 0 0 0 7%0 0 0 0 ! 6%
EarlyModern ! 0 0 0 51%0 ! 0 0 13%0 0 0 ! 7%! ! ! ! 7%
Transition ! 0 0 35%0 ! 0 29%! ! ! 11%! ! 0 9%0 0 ! 8%0 ! ! 7%
ModernAge 0 ! 38.8%! 0 36.7%! ! 24.5%
Contemporary ! 100%
Fig. 8 Brokerage Roles of the top right node of each triad, adapted from Gould and Fernandez (1989) (Gould and Fernandez 1989)
A
B
C
A
B
C
A
B
C
A
C
B

Social Network Analysis and Mining (2021) 11:63
1 3
63 Page 12 of 23
philosopher Baruch Spinoza (1632–1677), Immanuel Kant in Transition period, and Nietzsche in Modern Age.
7 Di!usion dynamics of"in#uence
In order to get insight on how the influence spread through-out the network, and how this spread change over time, we study the di"usion of influence throughout the network, similarly to Ghawi et!al. (2019).
We refer to the influence path formed as scholars, influ-enced by an original scholar, influence other scholars, as a cascade; and we refer to the original scholar as the root (see Fig.!10). For each scholar, we construct his influence cascade, by considering out-going edges starting from that scholar. However, in order to avoid exhaustive search (due to cyclicity), we construct scholar’s cascade as a directed acy-clic graph (DAG), i.e., in case of reciprocal edges between a pair of nodes, we arbitrarily choose one of the reciprocal edges. Thus, the result we obtain is a directed acyclic graph (DAG), which we call henceforth a cascade.
In order to characterize the influence cascades, we employ the following features as used in Mathew et!al. (2018); Vosoughi et!al. (2018):
– Size: the number of nodes in the DAG which are reach-able from the root node, i.e., the total number of unique nodes involved in the cascade.
– Depth: the length of the longest path from the root node of the cascade. The depth of a cascade, D, with n nodes is defined as
where di is the distance (length of the shortest path) from the root to node i.
– Average depth: the average path length of all nodes reachable from the root node.
D = max(di), 0 ! i ! n
AD =1
n ! 1
n!i=1
di
Era Coordinator Representative Gatekeeper Liaison
AN
Plato 207 Plato 970
Aristotle 71 Aristotle 770
Zeno of Citium 47 Augustine of Hippo 137
MA
Avicenna 61 Thomas Aquinas 503 Avicenna 40 Thomas Aquinas 351
Thomas Aquinas 50 Ibn Tufail 203 Pseudo-Denys 37 Dante Alighieri 88
Al-Ghazali 33 Rumi 85 Thomas Aquinas 37 Meister Eckhart 43
EM
John Locke 194 David Hume 686 Rene Descartes 221 Baruch Spinoza 559
Leibniz 171 Leibniz 603 John Locke 125 Shakespeare 353
Rene Descartes 146 J.J. Rousseau 461 Leibniz 91 Rene Descartes 351
TP
Goethe 262 Karl Marx 4,094 Immanuel Kant 467 Immanuel Kant 2,496
Hegel 247 Hegel 901 Hegel 416 Karl Marx 1,666
Alexander Pushkin 124 Søren Kierkegaard 715 Goethe 361 Hegel 1,532
MR
Nietzsche 339 M. Heidegger 971 Nietzsche 2,808 Nietzsche 3,242
A. Macedonski 255 L. Wittgenstein 682 A. Macedonski 386 Martin Heidegger 1,243
Bertrand Russell 223 J.P. Sartre 597 Henri Bergson 365 Samuel Beckett 770
CH
Stephen King 480 Michel Foucault 1,085
Gilles Deleuze 400 Jacques Derrida 1,084
Michel Foucault 395 Friedrich Hayek 1,007
Fig. 9 Brokerage Roles
depth
breadth
root
Fig. 10 Influence cascade

Social Network Analysis and Mining (2021) 11:63
1 3
Page 13 of 23 63
– Breadth: the maximum number of nodes present at any particular depth in the cascade.
where bj denotes the breadth of the cascade at depth j and D denotes the maximum depth of the cascade.
For all scholars, we extracted their cascades, and computed the properties of cascades: size, depth, average depth and breadth. Clearly, there are some nodes that do not have cas-cades, since they do not have successors (they are not influ-encers), thus, we had to exclude those scholars. We also excluded cascades of size 1 (scholars who influence one another only). Therefore, we end up with 4,537 cascades (36% of all scholars).
Table!11 shows for each era the top 5 scholars based on the four features of cascades. We observe that top cascades by size and by breadth correspond to Antiquity intellectuals, whereas, top cascades by depth (and avg. depth) correspond to intellectuals of the Middle Ages (Islam theologians).
B = max(bj), 0 ! j ! D
However, in order to get insight on how the features of those cascades evolve over time, we compare them over the consecutive eras. Figure!12 shows the distribution of the four features (size, breadth, depth, and avg. depth) over the eras; whereas Table!9 provides, for those features, a statistical summary including the mean, median (50% quantile) and maximum, over the di"erent eras.
At a glance, one can see that the size and breadth features exhibit similar behaviors; while the depth and avg. depth fea-tures exhibit similar behaviors as well. We observe that the size of cascades decreases over time until it almost vanishes at Contemporary period. At the first four eras (up to Transi-tion Period) this decrease in size is smooth (average size is above 1500 on average), but it becomes more sharp in the last two eras (average size of less than 500 in Modern Age, and only 40 in contemporary). Moreover, we can see from Table!9, that in the first two eras (AN and MA) the mean size is less than the median, which means that the distribu-tion is negatively skewed; but starting from Early Modern Age, the mean becomes greater than the median, hence, the
Era Size Depth Avg. Depth BreadthAnt
iquity
Thales 5,725 71sesoM Moses 9.4 761,2poseAAnaximander 5,724 71noraA Aaron 9.4 Philo the Dialectician 2,163Hesiod 5,723 John the Evangelist 15 John the Evangelist 8.0 Pasicles of Thebes 2,163Pherecydes of Syros 5,722 Clement of Alexandria 15 Speusippus 7.8 Diodorus Cronus 2,163Pythagoras 5,721 Athanasius of Alexandria 15 Pasicles of Thebes 7.4 Thrasymachus of Corinth 2,163
Mid
dle
Ages Ja’far al-Sadiq 5,478 HubA . anıfa 20 HubA . anıfa 12.1 Al-Ghazali 2,125
Harbi al-Himyari 5,434 Abu Suhail an-Nafi 20 Abu Suhail an-Nafi 12.1 Al-Juwayni 2,125
Jabir ibn Hayyan 5,433 Hisham ibn Urwah 20 Hisham ibn Urwah 12.1 Abu Talib al-Makki 2,125
Muhammad 5,402 Malik ibn Anas 19 Al-Juzajani 11.2 Harith al-Muhasibi 2,125
Al-Kindi 5,401 Al-Shaybani 19 Ibn Jurayj 11.2 Al-Balkhi 2,104
Earl
yM
odern Nicholas of Cusa 5,203 William Derham 17 Jan van Scorel 9.2 Samuel Richardson 2,126
Michel de Montaigne 5,180 John Ray 17 William Derham 8.5 Denis Diderot 2,118571,5zerauSocsicnarF Giulio Cesare Croce 17 John Ray 8.5 G-F. Rouelle 2,118
Gemistus Pletho 5,172 N. Boileau-Despreaux 16 Giulio Cesare Croce 8.5 Pierre Bayle 2,114Basilios Bessarion 5,170 Thomas Gray 15 M. van Heemskerck 8.2 John Selden 1,965
Tra
nsition
J. N. Tetens 4,699 H. T. Buckle 18 F. K. Forberg 9.9 Oliver Goldsmith 1,960J. H. Lambert 4,699 J-F. Millet 18 J-F. Millet 9.3 Goethe 1,895Immanuel Kant 4,698 Monticelli 17 H. T. Buckle 9.1 James Macpherson 1,866Thomas Reid 4,644 F. K. Forberg 17 Bettina von Arnim 8.9 F. G. Klopstock 1,844J. G. Hamann 4,641 Costache Caragiale 16 A. P. de Candolle 8.6 Friedrich Schiller 1,838
Mod
ernA
ge
Hippolyte Taine 3,675 Anton Mauve 17 Alfred Binet 9.1 Hippolyte Taine 1,357African Spir 3,536 Edmund John 17 James Mark Baldwin 9.1 African Spir 1,283Jean-Marie Guyau 3,256 Thomas Mann 17 Jacob L. Moreno 9.1 Herbert Spencer 1,071Paul Bourget 3,253 Georges Seurat 17 E. E. Cummings 9.0 Nietzsche 1,008Paul Ree 3,253 Vasile Pogor 17 Hans Vaihinger 8.9 Paul Bourget 1,008
Con
tempor
ary R. E. Schultes 884 Witold Gombrowicz 15 Kenneth Patchen 8.0 Jean Genet 214
Witold Gombrowicz 857 Kenneth Patchen 15 Witold Gombrowicz 7.9 Henry Miller 193Kenneth Patchen 857 Thomas Bernhard 14 Robert Duncan 7.2 R. E. Schultes 155Robert Duncan 856 Allen Ginsberg 14 Allen Ginsberg 7.1 J-T. Desanti 154Thomas Bernhard 853 Robert Duncan 14 Thomas Bernhard 6.9 J. L. Austin 148
Fig. 11 Analysis of influence di"usion cascades of scholars. Table shows the top 5 scholars of each era

Social Network Analysis and Mining (2021) 11:63
1 3
63 Page 14 of 23
distribution is positively skewed. A similar behavior can be observed for the breadth of cascades.
The depth, and avg. depth features also decrease smoothly over time. The median depth is constant (at 10) over three eras, from MA until TP, and drops afterward. We can
observe a slight increase in depth and avg. depth in Middle Ages comparing to Antiquity: maximum depth goes from 17 to 20, mean avg.depth goes from 4.6 up to 5.0, and maximum avg-depth goes from 9.4 up to 12.1. Another slight increase in depth and avg. depth is also observed in Transition period
Fig. 12 Distribution of cascades features over eras
Table 9 Statistical summary (average, median and max) of cascade features over the di"erent eras
Era # Size Breadthavg 50% max avg 50% max
AN 177 3857 5189 5723 1371 1775 2167MA 199 2493 2985 5478 882 787 2125EM 400 2237 1463 5203 752 365 2126TP 594 1568 731 4699 455 165 1960MR 1437 477 20 3675 122 10 1357CH 1730 40 5 884 13 4 214Era # Depth Avg. depth
avg 50% max avg 50% max
AN 177 9.3 11 17 4.6 4.9 9.4MA 199 9.1 10 20 5.0 5.0 12.1EM 400 7.6 10 17 3.9 4.1 9.2TP 594 7.9 10 18 3.9 4.4 9.9MR 1437 6.0 4 17 3.2 2.5 9.1CH 1730 2.9 2 15 1.9 1.5 8.0

Social Network Analysis and Mining (2021) 11:63
1 3
Page 15 of 23 63
comparing to Early-Modern period: mean depth goes from 7.6 to 7.9, maximum depth goes up to 18, median avg-depth goes from 4.1 to 4.4, and maximum avg-depth goes from 9.2 up to 9.9. Moreover, in the first four eras (until TP) the mean depth is less than the median, which means that the distribu-tion is negatively skewed; but starting from Modern Age, the mean depth becomes greater than the median, hence, the distribution becomes positively skewed, with many outliers to the right (high values). The same applies for avg. depth.
Table!10 shows the correlation values between the di"er-ent features. We can see that there is a very strong correla-tion between size and breadth (0.98), and between depth and avg. depth (0.97). On the other hand, the correlation between Those values are almost the same over all eras.
In order to get insight on how the cascades evolve over the di"erent eras, Fig.!13 shows scatter plots of several pairs of cascade features.
Figure!13-a shows the relation between the size and the breadth of cascades over time. Besides the linear relation that we can clearly see between these features, we can also observe that in early eras, starting from AN, these features tend to have large values, and over time the values decreases gradually until they become relatively very small at CH. For instance, if we consider the cascades with size ! 4500 and breadth ! 1500 , the fraction of such large cascades is 66% in Antiquity. This fraction drops to 39% in Middle Ages, 31% in Early Modern, and only 3% in Transition period; then it becomes 0% in Modern and Contemporary periods.
Figure!13-b shows the relation between the size and the depth of cascades over time. We can see that at Antiquity most of the cascades have large values of size and depth, while some cascades have small size and small depth. On the one hand the fraction of large cascades with size ! 4500 and depth ! 9 is 69% in Antiquity, and it drops to 39% in MiddleAges, 33% in EarlyModern, and 3% in Transition period, and 0% afterwards. On the other hand, we observe that cascades that have a small depth ( ! 7 ) have always a very small size ( ! 400 ). In other words, we can say that the necessary condition to have a non-small size cascade, is to have a depth of at least 8. The fraction of such small cascades increases over time from 23% in Antiquity, to 93% in Contemporary period.
Figure!13-c shows the relation between the depth and the avg. depth of cascades over time. We can clearly see
the linear relation between these features (correlation 0.97) over all eras.
Now, in order to characterize this linear relation we apply a linear regression model, using depth as a dependent-, and avg. depth as independent variable. The result is:
Similarly, if we use avgdepth as a dependent-, and depth as independent variable, the result is:
In both cases, the prediction accuracy is pretty high, with R2
= 0.94.Moreover, in order to characterize the relation between
the size of cascades and the other features, we apply a mul-tiple regression model using size as a dependent variable, and depth and breadth as independent variables (we exclude avg. depth to avoid multicollinearity, due to its linearity with depth).
The result of this model is:
with a very high accuracy of R2= 0.98.
7.1 Clustering of!cascades
Based on previous discussion, we notice that most of the cascades tend to have either pretty small values of features, or pretty large values; while intermediate values are little frequent.
This observation can be verified be looking at Fig.!14 which depicts a kernel density estimate (KDE) plot of each feature, showing the data using a continuous probability den-sity curve. All the four features exhibit two dense regions, that are clearly distinguishable (we approximately separate them using a vertical dashed line), that correspond to small and large cascades.
Moreover, Fig.!15 depicts a violin plot of each feature over all eras, showing the full distribution of features. Here also we can clearly see the two regions, that distinguish small- and large cascades, over the di"erent consecutive eras.
In order to categorize influence cascades based on their aforementioned features, we apply a clustering algorithm, namely K-Means (Lloyd 1982; MacQueen 1967), using the four features of cascades: size, breadth, depth, and avg. depth. The goal is to obtain two clusters of cascades, namely small- and large cascades. Hence, we use k = 2 as the number of desired clusters. However, as we have seen, the features are on di"erent scales, for instance, the depth and avg. depth are below 20, while the size and breadth can be above 5000. Therefore, we need to normalize the features
depth ! "1.17 + 2.22 # avgdepth
avgdepth ! 0.67 + 0.42 " depth
size ! "139 + 52.1 # depth + 2.61 # breadth
Table 10 Correlation of cascade features
Breadth !!!Depth !!! Avg. depth
Size 0.98 0.71 0.64Breadth 0.63 0.57Depth 0.97

Social Network Analysis and Mining (2021) 11:63
1 3
63 Page 16 of 23
Fig. 13 Relation between fea-tures of cascades over eras
(a) Size, Breadth
(b) Size, Depth
(c) Depth, Avg. Depth

Social Network Analysis and Mining (2021) 11:63
1 3
Page 17 of 23 63
Fig. 14 Density of cascade features, showing a clear dis-tinction between small and large cascades
Fig. 15 Distribution of cascade features over eras

Social Network Analysis and Mining (2021) 11:63
1 3
63 Page 18 of 23
to put them on the same scale. This is done by dividing each feature by its maximum, thus each feature becomes in the range [0,1].
As a result of the clustering, we obtain two clusters of cascades, that can be indeed categorized as small cascades (CS), and large cascades (LC). As shown in Table!11, SC cluster comprises 3425 cascades (75.5%), while the remain-ing 1112 cascades (24.5%) belong to LC cluster.
The di"erences between the two clusters are clear. For instance, the size of small cascades is 54.5 on average (median = 6), and 3,214.4 for large cascades (median = 3,056). On the other hand, the depth of small cascades is 3.3 on average (median = 2), and 12.1 for large cascades (median 12).
Figure!16 depicts a violin plot for each feature showing its distribution. One can easily see how distinct the two clusters of small- and large-cascades are.
Moreover, we can also look more closely at these two clusters by looking at the scatter plots of Fig.!17, that show the relation between di"erent pairs of cascade features. For instance, when we look at the relation between size and breadth, we see the cluster of small-cascades (blue) located in a small area at bottom-left (size ! 1000 , and breadth ! 400 ); however, this small area comprises all small cas-cades that are more than 75% of all cascades!
Finally, it is of great importance to look at how these two clusters of cascades evolve over time. Table!12 shows the number and fraction of cascades in the small- and large-cascade clusters, over the di"erent consecutive eras. We see that, although the raw number of cascades in both clusters gradually increases over time (except for LC in MA and CH), the fraction of small cascades increases, while the frac-tion of large cascades decreases over time.
This change in the fractions of SC and LC clusters over time is also reflected in Fig.!18. We observe that in Antiq-uity, about 75% of cascades are classified as large, and 25% as small. In the next three eras, Middle Ages, Early Modern period, and Transition period, small- and large cascades are almost equally distributed (about 50% each). Then, in Mod-ern Age, large cascades make only 25% of cascades, and the remaining 25% are small. During Contemporary History, almost all cascades (99.4%) are small.
This result makes sense and is pretty reasonable. The longer history a scholar has, the more influence he can give, the bigger his legacy is; and the larger his chains of influence become. In other words, the influence cascade of a scholar is somewhat proportional to how long his history is. On the other hand, recent scholars have not yet enough time to develop large cascades of influence.
Table 11 Statistical summary of the features of small- and large cascades
Small cascades Large cascadescount 3425 (75.5%) 1,112 (24.5%)
avg min max avg min max
Size 54.4 2 1425 3214.4 653 5723Depth 3.3 1 13 12.1 8 20Avg. depth 2.1 1 8.1 5.6 3.4 12.1Breadth 17.3 1 389 1013.8 102 2167
Fig. 16 Feature distribution of the 2 clusters of cascades

Social Network Analysis and Mining (2021) 11:63
1 3
Page 19 of 23 63
8 Communities of!scholars
In order to get deep insights on how the scholars influence each other, we analyze the community structure in the social network of scholars. A community in a social network is a group of nodes that are relatively densely connected to each other but sparsely connected to other dense groups in the network (Porter et!al. 2009).
For this purpose, we applied a community detection algo-rithm, namely InfoMap2 algorithm (Bohlin et!al. 2014), on our complete influence-based social network of scholars (over all eras). As a result, we obtained 1,772 communities. However, since many of those communities are of small size,
Fig. 17 Distribution of the two clusters of small- and large cascade w.r.t di"erent pairs of features
Table 12 Number and fraction of cascades in small- and large clusters, over eras
AN MA EM TP MR CH
SC 42 87 190 296 1090 172023.7% 43.7% 47.5% 49.8% 75.9% 99.4%
LC 135 112 210 298 347 1076.3% 56.3% 52.5% 50.2% 24.1% 0.6%
Fig. 18 Fraction of SC and LC clusters over eras
2 InfoMap algorithm is a commonly used community detection algo-rithm that suits directed networks; it is implemented in the map equa-tion framework.

Social Network Analysis and Mining (2021) 11:63
1 3
63 Page 20 of 23
we opted to exclude communities that have 5 or less schol-ars; hence, we have 716 remaining communities.
In each of such detected communities, most of the influ-ence of member scholars goes toward other members of the same community. This means that those scholars belonging to the same community, while influencing each other, are forming a cluster of knowledge, that simulates a school of thought.
It is noteworthy that each of those communities com-prises scholars who belong to di"erent eras. This means that the communities are mostly diverse, and open (rather than closed), and evolved over time.
Table!13 provides an overview of the largest 10 com-munities, sorted by community size (number of member scholars). This table also shows the distribution of mem-ber scholars over the di"erent eras, and lists few of notable scholars belonging to that community (top 3 scholars based on out-degree).
The largest community consists of 180 scholars, who are mostly contemporary American actors (mainly comedians). The second largest community comprises 91 scholars, who are mostly philosophers of Transition period, including Hegel, Kant and Kierkegaard. Third and fourth communi-ties, respectively, comprise economists and poets from mod-ern and contemporary periods.
The fifth community mainly comprises scholars from Antiquity and Middle Ages, including Descartes and Tomas Aquinas. Among other noteworthy communities, the com-munity no. 7 which mainly represents the communism school of thought comprising modern and contemporary philosophers such as Marx and Engels; and the community no. 10 which comprises a group of modern famous painters, including Picasso, Cézanne and Matisse.
However, although most of the influence of communities is internal, there is still some observable external influence. That is, in some communities the scholars have influence on other scholars of other communities. Thus, we can measure how a community influences another one by aggregating the influence of individual scholars of the first community on the
scholars of the second. In other words, we define the influ-ence of a community A on another community B, denoted f(A,!B) as the sum of individual scholar influence over all scholars of A and all scholars of B:
where f(a,!b) is a function defining the influence of a scholar a on another b, and is given by:
Using this formula, we calculated the community influence over all possible pairs of the 716 detected communities in our social network of scholars. In fact, there are more than a half million of such pairs of communities; however, only 1% of those pairs exhibit a nonzero influence (about 5 thousand pairs). Even in this tiny portion, for many of these commu-nity pairs, the influence was negligible, with value 1 for 73% of cases (i.e., only 1 scholar from one community influences 1 scholar from the other), and value 2 for 16% of cases.
Thus, we opted to retain only the pairs of communi-ties where the value of community influence is greater than or equal 15. The result can be expressed as a directed and weighted network of communities, where the nodes represent the communities, and the directed edges repre-sent the community influence, and the weights represent the aggregated value of individual scholars (of one com-munity towards another). This network of communities is shown in Fig.!19, where each node is labeled by the id of the community, the node size is proportional to the size of the community, the color represents the dominant era of the
f (A,B) =!a!A
!b!B
f (a, b)
f (a, b) =
!
1 if scholar a influences scholar b
0 otherwise
Table 13 Communities of scholars, top 10 by size. Distribution of member scholars over eras, and notable scholars
# size AN MA EM TP MR CH Notable scholars
1 180 0 0 0 0 6 174 R. Pryor, L. Bruce, G. Carlin2 91 2 2 13 47 12 15 Hegel, Immanuel Kant, Kierkegaard3 88 2 0 12 14 21 39 F. Hayek, Ludwig von Mises, Adam Smith4 87 0 0 0 5 28 54 E. Kocbek, F. Pre&eren, S. Kosovel5 65 18 27 13 0 3 4 Thomas Aquinas, René Descartes, Augustine of Hippo6 60 0 1 0 11 43 5 A. Macedonski, E. Lovinescu, Ion Minulescu7 60 2 0 0 15 14 29 Karl Marx, L. Althusser, Friedrich Engels8 60 5 0 19 16 9 11 John Locke, David Hume, John Stuart Mill9 49 0 0 0 0 21 28 Ludwig Wittgenstein, Bertrand Russell, Rudolf Carnap10 48 0 0 1 7 25 15 Pablo Picasso, Paul Cézanne, Henri Matisse

Social Network Analysis and Mining (2021) 11:63
1 3
Page 21 of 23 63
community scholars, and the edges are labeled by the aggre-gated influence.
For instance, we realize that one of the central com-munities in this network is the community no. 16, which comprises a group of famous Antiquity scholars, including Aristotle and Plato. This community has a great influence on several other communities, including: community no. 5 (Middle Ages, incl. Descartes and Aquinas), community no. 8 (Early Modern age, incl. John Locke and David Hume), and community no. 2 (Transition period, incl. Hegel and Kant).
9 Conclusion
In this paper, we incorporated a longitudinal aspect in the study of the influence networks of scholars. First, we extracted their social network of influence from YAGO, a pioneering data source of Linked Open Data, which records the main influences of and by intellectuals We opted for a global approach for the periodization of history to match the internationality of scholars, resulting in six consecutive eras to study.
Our main question was whether we could identify pat-terns of influence, and their change over time. Therefore, we performed essential network analysis on every time-sliced projection of the entire network in within-era, inter-era,
and accumulated-era influence networks. We investigated their social network metrics, degree distribution, and con-nectivity. An influence pattern throughout all eras was that the internal impact of any era was higher than its external impact. The vast majority of scholars influenced scholars of their own period (= within-era influence) with a relatively stable average out-degree. There were only a few instances of reciprocity. When accumulating eras, the max. degrees drastically increased. However, over all eras the maximum out-degree stayed greater than the maximum in-degree. In inter-era influence networks, each era has the most influ-ence on the consecutive one, and the Contemporary period. The exception to this rule was a spike in the absolute links of antique influences on the Early Modern period, repre-senting the increased reception of antique scholars dur-ing the Renaissance. However, proportionally Antiquity’s influence on Early Modernity was as high as on the Middle Ages, which reasserts the shift in historical research that the Renaissance thinkers did not “rediscover” Antiquity, but that medieval scholars also received it (Fejfer et!al. 2003 p. 3–4).
With a longitudinal perspective, we can add a more pro-nounced view on who the most influential intellectuals are. The scholar with the highest out-degree over all periods on contemporaries (= within-era) was Modern age scholar Frie-drich Nietzsche. Plato in Antiquity, Avicenna in the Mid-dle Ages, John Locke in the Early Modern period, Johann Goethe in the Transition period and Vladimir Nabokov in the Contemporary period were the most influential on the contemporaries of their respective periods.
When accumulating eras, the most influential intellectu-als of an era change: here, Plato was the most influential for Antiquity and the Middle Ages, Aristotle for the Early Modern and Transitioning period, Immanuel Kant for the Modern Age. In the Contemporary period, and therefore for the complete network of intellectuals, Karl Marx.
In the inter-era network analysis, Transitioning period scholar Karl Marx had the highest out-degree over all times to the Contemporary age. Modern intellectuals Friedrich Nietzsche and Martin Heidegger took second place over all time for the Contemporary period.
To understand the di"usion dynamics of influence, we constructed influence cascades of scholars, and measured their properties, such as size, depth and breadth. First, we found that those properties decrease over time, which means that the influence cascades are larger for older scholars than for more recent ones. We also analyzed the inter-relations between the properties of cascades, and found that they are positively correlated, in particular, size with breadth, and depth with average depth. We also characterized such rela-tions in form of di"erent linear models, with high accuracy.
Moreover, we found out that the cascades are clustered into two categories, namely small- and large cascades. An interesting finding here is that the fraction of small cascades
16
5
26
2
18
8
15
18
22
52
19
717
14
18
276
229
19
19
53
16
3
115
19
11
18
29715
19
1225
17
1224
15
Fig. 19 Network of communities influencing each other

Social Network Analysis and Mining (2021) 11:63
1 3
63 Page 22 of 23
increases over time, while the fraction of larges cascades decreases. In particular, the majority of the cascades in Antiquity belong to the large category, whereas in Middle Ages, Early Modern, and Transition periods the cascades were evenly distributed into the small and the large catego-ries. The large cascades became the minority in Modern Age, and almost disappeared in Contemporary History. Hence, we could conclude that the influence cascade of a scholar is somewhat proportional to how long his history is. The longer history a scholar has, the more influence he can give, the bigger his legacy is; and the larger his chains of influence become.
This study of the longitudinal patterns of influence is such suited to further the insights on the interconnections of influence of thinkers and the dynamics of eras alike. There-fore, we plan to study the evolution of communities in these accumulated networks in future work. Another direction of research would be to study the e"ects of di"erent periodiza-tions on the importance of scholars, as well as deriving an automated periodization based on the dataset. In addition, we would like to compare this YAGO network of intellectual influence with a more detailed network of scholars based on the main books on intellectual history, in order to establish their di"erences and insights in this field of study.
Funding Open Access funding enabled and organized by Projekt DEAL.
Open Access This article is licensed under a Creative Commons Attri-bution 4.0 International License, which permits use, sharing, adapta-tion, distribution and reproduction in any medium or format, as long as you give appropriate credit to the original author(s) and the source, provide a link to the Creative Commons licence, and indicate if changes were made. The images or other third party material in this article are included in the article’s Creative Commons licence, unless indicated otherwise in a credit line to the material. If material is not included in the article’s Creative Commons licence and your intended use is not permitted by statutory regulation or exceeds the permitted use, you will need to obtain permission directly from the copyright holder. To view a copy of this licence, visit http:// creat iveco mmons. org/ licen ses/ by/4. 0/.
References
Bohlin L, Edler D, Lancichinetti A, Rosval M (2014) Community detection and visualization of networks with the map equation framework. In: Measuring scholarly impact: methods and prac-tice, pp 3–34
Edelstein D, Findlen P, Ceserani G, Winterer C, Coleman N (2017) Historical research in a digital age: reflections from the mapping the republic of letters project. Am Histor Rev 122(2):400–424
Edelstein D, Kassabova B (2020) How England fell o" the map of Voltaire’s Englightenment. Modern Intellect History 17(1):29–53. https:// doi. org/ 10. 1017/ S1479 24431 80001 5X
Everett M, Borgatti S (2012) Categorical attribute based centrality: E–I and G–F centrality. Soc Netw 34:562–569. https:// doi. org/ 10. 1016/j. socnet. 2012. 06. 002
Fejfer J, Fischer-Hansen T, Rathje A (2003) Introduction. In: Feijfer J, Fischer-Hansen T, Rathje A (eds) The rediscovery of antiquity: the role of the artist. Museum Tusculanum Press, Copenhagen, pp 11–20
Gänger S, Lewis SL (2013) Forum: a world of ideas: new pathways in global intellectual history, c.1880–1930. Modern Intellect His-tory 10(2)
Ghawi R, Petz C, Pfe"er J (2019) ‘On the shoulders of giants’, Analysis of a social network of intellectual influence. In: 6th International conference on social networks analysis, management and security (SNAMS). Granada, Spain, pp 248–255
Ghawi R, Pfe"er J (2019) Mining social networks from linked open data. In: Endres D, Alam M, 'otropa D (eds) Graph-Based repre-sentation and reasoning. Springer, Cham, pp 221–229
Gordon PE (2013) What is intellectual history? A frankly partisan introduction to a frequently misunderstood field
Gould RV, Fernandez RM (1989) Structures of mediation: a formal approach to brokerage in transaction networks. Sociol Methodol 19:89–126
Grafton A (2009) A sketch map of a lost continent: the republic of let-ters. Republic Lett J Study Knowl Politics Arts 1(1)
Grafton A (2009) Worlds made by words: scholarship and community in the modern west. Harvard University Press, Cambridge
Haakonssen K, Whatmore R (2017) Global possibilities in intellectual history: a note on practice. Global Intellect History 2(1):18–29
Hennig M, Brandes U, Pfe"er J, Mergel I (2012) Studying social net-works: a guide to empirical research. Campus Verlag, Frankfurt
Holme P, Saramäki J (2019) A map of approaches to temporal net-works. In: Holme P, Saramäki J (eds) Temporal network theory, computational social sciences. Springer, Cham, pp 1–24
Huisman M, Snijders TAB (2003) Statistical analysis of longitudinal network data with changing composition. Sociol Methods Res 32(2):253–287
Lloyd SP (1982) Least squares quantization in PCM. IEEE Trans Inf Theory 28:129–137
MacQueen J (1967) Some methods for classification and analysis of multivariate observations. In: Proceedings of the 5th Berkeley symposium on mathematical statistics and probability, Volume 1: Statistics. University of California Press, Berkeley, CA, pp 281–297
Mahdisoltani F, Biega J, Suchanek FM (2015) YAGO3: a knowledge base from multilingual Wikipedias. In: CIDR 2015, 7th biennial conference on innovative data systems research, Asilomar, CA, USA, Online Proceedings
Mathew B, Dutt R, Goyal P, Mukherjee A (2018) Spread of hate speech in online social media. CoRR abs/1812.01693
Moore W (1994) A life of Erwin Schrödinger. Cambridge University Press, Cambridge
Moyn S, Sartori A (eds) (2013) Global intellectual history. Columbia University Press, New York
Newcomb TM (1961) The acquaintance process as a prototype of human interaction
Osterhammel J (2006) über die Periodisierung der neueren Geschichte (Vortrag in der Geisteswissenschaftlichen Klasse am 29. Novem-ber 2002). Akademie Verlag, Berlin, pp 45–64
Otte E, Rousseau R (2002) Social network analysis: a powerful strat-egy, also for the information sciences. Inf Sci 28(6):441–453
Petz C, Ghawi R, Pfe"er J (2020) A longitudinal analysis of a social network of intellectual history. In: IEEE/ACM international conference on advances in social networks analysis and mining (ASONAM). The Hague, Netherlands (virtual), Dec 7–10 (2020)
Porter MA, Onnela JP, Mucha PJ (2009) Communities in networks. Notices AMS 56(9):1082–1097
Pot JHJvd, (1999) Sinndeutung und Periodisierung der Geschichte. Eine systematische Übersicht der Theorien und Au"assungen, Brill, Leiden Bosten Köln

Social Network Analysis and Mining (2021) 11:63
1 3
Page 23 of 23 63
Snijders T, Bunt GG, Steglich C (2010) Introduction to actor-based models for network dynamics. Soc Netw 32:44–60
Subrahmanyam S (2015) Global intellectual history beyond hegel and marx. History Theory 54(1):126–137
Subrahmanyam S (2017) Beyond the usual suspects: on intellectual networks in the early modern world. Global Intellect History 2(1):30–48
Vosoughi S, Roy D, Aral S (2018) The spread of true and false news online. Science 359(6380):1146–1151. https:// doi. org/ 10. 1126/ scien ce. aap95 59
Vugt I (2017) Using multi-layered networks to disclose books in the republic of letters. J Histor Netw Res 1(1):25–51
Wasserman S, Faust K (1994) Social network analysis: methods and applications, 1st edn. Cambridge University Press, New York
Wickberg D (2001) Intellectual history vs. the social history of intel-lectuals. Rethinking History 5(3):383–395
Winterer C (2012) Where is America in the republic of letters? Mod-ern Intellect History 9(3):597–623. https:// doi. org/ 10. 1017/ S1479 24431 20002 12
Publisher’s Note Springer Nature remains neutral with regard to jurisdictional claims in published maps and institutional a#liations.

Chapter 5 Case Study Social Networks in the History of Intellectuals
Tracking the Evolution of Communities in a Social Network of
Intellectual Influences
Authors
Petz, Cindarella, and Ghawi, Raji, and Pfeffer, Jurgen
In
Journal for Historical Network Research 2021, accepted for publication Sept. 18, 2021.
Abstract
The history of intellectuals consists of a long spanning entangled web of influences, in-
terdependencies, and inspirations. In this paper, we construe the history of intellectuals
with the means of a formalized network approach, and analyze structurally how com-
munities form and develop based on their intellectual influences. We are working with
a unique data set of Linked Open Data, which we critically reflect on. In this paper we
tackle the question if community detection can help us to identify schools of thought,
as well as patterns in the influence relations of scholars. We provide a detailed descrip-
tion of the process of extracting Linked Open Data, the construction of longitudinal
networks, and the methodology of identifying and evaluating intellectual communities
in the dataset using a community detection algorithm. Finally, we track the dynamic
evolution of these communities in time, and characterize the structural patterns of their
evolution, and the mechanisms of their development. We contextualize the changes in
selected network structures in order to establish the merit of this method for a new
perspective on the history of intellectuals, their influences, and their ideas.
Contribution of thesis author
Theoretical operationalization, data preparation, iterative evaluation of computational
implementation and analysis, qualitative evaluation and contextualization, as well as
manuscript writing, revision, and editing.
128

Tracking the Evolution of Communities
in a Social Network of Intellectual
Influences
Cindarella Petz Raji Ghawi Jurgen Pfe↵er
Bavarian School of Public PolicyTechnical University of Munich, Munich, Germany
{cindarella.petz, raji.ghawi, juergen.pfe↵er}@tum.de
Accepted for publication Sept. 18, 2021.
Manuscript version Sept. 20, 2021.
Abstract
The history of intellectuals consists of a long spanning entangled webof influences, interdependencies, and inspirations. In this paper, we con-strue the history of intellectuals with the means of a formalized networkapproach, and analyze structurally how communities form and developbased on their intellectual influences. We are working with a unique dataset of Linked Open Data, which we critically reflect on. In this paper wetackle the question if community detection can help us to identify schoolsof thought, as well as patterns in the influence relations of scholars. Weprovide a detailed description of the process of extracting Linked OpenData, the construction of longitudinal networks, and the methodology ofidentifying and evaluating intellectual communities in the dataset using acommunity detection algorithm. Finally, we track the dynamic evolutionof these communities in time, and characterize the structural patterns oftheir evolution, and the mechanisms of their development. We contextu-alize the changes in selected network structures in order to establish themerit of this method for a new perspective on the history of intellectuals,their influences, and their ideas.
Keywords longitudinal analysis, social network analysis, history of in-tellectuals, dynamic networks, community detection, community evolu-tion, big data
1

1 Introduction
The history of intellectuals consists of a long spanning and entangled web ofinfluences, interdependencies, and inspirations. In this paper, we work witha unique dataset on the influence relations of intellectuals, and explore theircommunities’ formation, development, and dissolution. The history of intellec-tuals encompasses an abundance of interdisciplinary research fields, includingthe history of scientific disciplines and methodologies, the history of ideas andof books, and the origins and the anterior social contexts of intellectuals andintellectual thought (Wickberg 2001; Gordon 2013). Research on intellectualhistory mostly employs a regionally limited perspective within a closed time-frame in order to develop a comprehensive comparative analysis, but lacks aninclusive, global perspective (Haakonssen and Whatmore 2017), as well as fo-cuses on the “usual suspects” of an Eurocentrist view (Subrahmanyam 2017).Attempts to rectify this in a Global Intellectual History as by Moyn and Sar-tori (2013) were criticized to focus on the already well-researched intellectualsdespite their transnational approach (Subrahmanyam 2015).A formalized network approach on the influences of and on intellectuals allows usto re-frame historical research beyond Lovejoy’s “unit-ideas” (1936) and extend-ing on Skinner’s “contextual history” (1969), focusing on the personal relationsand interdependencies of scholars. This follows the idea of philosophers such asPierre Bourdieu, Karl Mannheim, or Erwin Panofsky on the relational situate-ness of ideas and intellectuals in their historical and cultural context of the timein a social history of ideas (Ringer 1990, pp. 270–4), as well as on the “condi-tions and modalities of ‘knowledge production’” (Goldman 1994, p. 266). Thiskind of research is facilitated with the methodologies and tools of the DigitalHumanities, which Edelstein (2016) considered a “boon for intellectual history”.In order to answer to the requirements of a global perspective on the historyof intellectuals and to harness the prospects of formal network analysis on thestudy of intellectual history, Ghawi et al. (2019) proposed to study this as anetwork from a global perspective, and identified, among other things, the mostinfluential scholars in time as those with the longest reaching influences (influ-ence cascades). This analysis was extended in recent work, which introduced alongitudinal perspective on the most central scholars within each period (Petzet al. 2020). In social sciences, longitudinal network analysis is used on paneldata to facilitate understanding on the development of and changes in socialstructures and node characteristics in time by studying temporal snapshots ofsocial networks (Hennig et al. 2012; Newcomb 1961; Huisman and Snijders 2003;Snijders et al. 2010; Holme and Saramaki 2019). In historical studies, panel dataare usually not available. In the study by Petz et al. (2020), this was solvedby constructing temporal snapshots of networks by dividing the time span ofhistory into periods.In related work, the epistolary exchanges of Early Modern scholars were mappedas spatial networks (compare, e.g., Edelstein et al. 2017, p. 237). More recentprojects on the Republic of Letters have incorporated a temporal perspectiveon them as well (Vugt 2017), which provide challenges to model discrete andcontinuous time of fuzzy dating (Kudella 2019, p. 50).Recently, community detection in historical network research gained tractionin the analysis of conflict and coalition politics of Medieval sovereigns usingthe concept of Georg Simmel’s Social Circles (Dahmen et al. 2017; Gramsch-
2

Stehfest 2020) or the identification of communities in the transmission of me-dieval manuscripts with Gephi as by Fernandez Riva (2019).
In this paper, we are interested in the formation and evolution of intellec-tual communities in time. In order to study the patterns and mechanisms ofintellectual community evolution in time, we test whether we can computation-ally identify trends in the history of intellectuals. Can we identify schools ofthought? Can we identify hidden patterns in the influence relations of scholars?How do these structures change in time? The perspective on the history ofintellectuals as organized in network communities serves as a starting point foran analysis of the transformation and evolution of thought.
2 Data and Method
Our dataset is extracted from YAGO1, a large semantic knowledge base de-veloped by the Max Plank Institute for Informatics in Saarbrucken. YAGO isone of the pioneering contributors of Linked Open Data (LOD), and was along-side DBpedia (Bizer et al. 2009) one of the first to extract semantic knowledgeat a large scale from Wikipedia (Suchanek et al. 2007). YAGO compiles in-formation about millions of entities (such as on people, cities, countries, andorganizations): mining data from Wikipedia’s2 categories, redirects, and in-foboxes, covering synsets or hyponymy from WordNet3, and matching spatialand topographical entities from GeoNames4 (Mahdisoltani et al. 2015). Theseinformation were compiled with web scraping and text mining techniques whichwere employed on Wikipedia’s infoboxes and categories, as well as natural lan-guage processing applied on e.g., entity disambiguation and result filtering. InYAGO, the resulting data were merged with the DBpedia ontology5 and theSUMO ontology6. The accuracy of YAGO’s data has been manually evaluatedabove 95%. We work with the YAGO3 version (released in 2015, which weextracted in 2018), which features over 10 million entities and over 120 millionentries on their attributes.In the following, we will first describe the extraction process of the YAGO in-fluence relation and the pre-processing of the dataset, in which we enriched thedataset with a temporal, spatial and disciplines dimension, as well as the pro-cess of constructing longitudinal networks. Subsequently, we will discuss thepeculiarities and possible biases of the dataset presented.
Mining a social network of intellectuals from YAGO
Most LOD sources, including YAGO, are typically represented using RDF (Re-source Description Framework), which is the W3C7 standard for representinginformation in the Semantic Web (Manola and Miller 2004). RDF is a data
1. Yet Another Great Ontology2. https://www.wikipedia.org3. https://wordnet.princeton.edu4. https://www.geonames.org5. http://www.mpi-inf.mpg.de/departments/databases-and-informationsystems/research/yago-
naga/yago/linking/6. http://www.mpi-inf.mpg.de/ gdemelo/yagosumo/7. World Wide Web Consortium https://www.w3.org/
3

Table 1: Examples of influence relations
Ibn_Tufail yago:influences Christiaan_Huygens
Ibn_Tufail yago:influences Immanuel_Kant
Ibn_Tufail yago:influences Isaac_Newton
Rene_Descartes yago:influences Christiaan_Huygens
Rene_Descartes yago:influences Immanuel_Kant
Rene_Descartes yago:influences Isaac_Newton
Johannes_Kepler yago:influences Isaac_Newton
Maimonides yago:influences Isaac_Newton
Christiaan_Huygens yago:influences Isaac_Newton
Francis_Bacon yago:influences Isaac_Newton
Isaac_Newton yago:influences Abraham_de_Moivre
Isaac_Newton yago:influences Immanuel_Kant
Isaac_Newton yago:influences Voltaire
Baruch_Spinoza yago:influences Immanuel_Kant
model, where each piece of information (called statement or fact) is structuredin a triple of the form:
(subject, predicate, object)
where subject and object are labeled as noted, connected by an edge labeledpredicate. The standard query language for RDF is SPARQL (Prud’hommeauxand Seaborne 2008; Harris and Seaborne 2013), which became a W3C recom-mendation in 2008. As argued by Ghawi and Pfe↵er (2019, 2020), Linked OpenData can be used as a source of information to extract social networks amongentities, using various extraction patterns expressed in the SPARQL query lan-guage.
YAGO includes a predicate labeled yago:influences, that relates intellec-tuals based on their influence relationships as recorded in Wikipedia’s infoboxes.The accuracy of the yago:influences relation was evaluated with a confidencescore of 0.96 by YAGO. We are particularly interested in this predicate to ex-tract an influence social network among intellectuals. Table 1 shows a sample ofRDF triples from YAGO, depicting the influence relation among several intellec-tuals. To extract our target influence social network, we used a SPARQL queryas shown in Figure 1. The query has been executed over YAGO’s SPARQLendpoint.8
Figure 1: SPARQL query used to extract the influence social network
SELECT ?u ?v
WHERE {
?u yago:influences ?v.
}
This query returns all pairs (u, v) of entities (scholars in our case) thatare connected via the yago:influences relation, or in other words, if entity uinfluences entity v. We then use the result of this query as the basic edge-list forthe influence network of intellectuals, in which nodes constitute the raw data
8. https://linkeddata1.calcul.u-psud.fr/sparql, as of July 2019.
4

base of intellectuals available. The raw dataset comprises 12,705 nodes and22,818 edges, as reported in Ghawi et al. (2019).
Intellectuals and their influences in YAGO
As the influence relations in YAGO are originating from Wikipedia, any find-ings of this study using a dataset extracted from YAGO3 perforce reflect theknowledge hosted there. There are several important points to reflect on thetype of intellectuals and influence recorded. Intellectual is a broad category inYAGO following its historical dimensions that there is no “single definition ofthe intellectual’s condition that applies universally” as Ringer (1990, p. 281)noted, and we might add with Wickberg (2001, p. 387) that a generalizationof intellectuals as a social type would not be historically correct. YAGO’s in-tellectuals entail philosophers, writers, and scholars of the natural sciences aswell as artists, mathematicians, physicians, polymaths, musicians, and more,among which an illustrious list of polar explorers. These intellectuals appear inour dataset if there was a known influence from and to other intellectuals; theinfluences recorded are based on their main influences, and are therefore notexhaustive.9 The information on such included intellectuals and their main in-fluences are originating from Wikipedia, and as such represent a crowd-sourcedand semi-popular knowledge on intellectuals in history. Wikipedia is an onlineencyclopedia that provides the “primary source of knowledge for a huge numberof people around the world” (Anderka 2013, p. 12), which reliability of infor-mation is ensured with consistent “major peer review activity” (Viseur 2014,p. 3). Due to the professionalization of Wikipedia in the last decade10 , thiscollection of scholars closely represents the current state of research, and en-compasses what can be considered the main intellectuals in history (though notexhaustive). The intellectuals recorded in YAGO can be considered biased asthey are focused on major figures, and specifically, on men.11 While scholars likepioneering psychologist Leta Stetter Hollington (1886–1939) are missing fromour dataset12, the philosopher Emilie Du Chatelet (1706–1749) actually is in-cluded. Of seven female philosophers from the Early Modern Period highlightedby Project Vox (Duke University Libraries), three appear in our dataset.13
To conclude, the dataset o↵ers an abstract form of the history of intellectuals,which records the most important influences of the most important intellectualsreflecting closely the current state of research as added by the crowed-sourcedLinked Open Data community – similar to the broad strokes of a Meister-erzahlung (master narrative). Any findings necessarily iterate the representation
9. So for example, the Medieval writer Bernardus Silvestris (1085–c. 1160) is not includedin the dataset, whose allegorical philosophical work on the birth of the universe (“Cosmo-graphia”) heavily influenced the “father of English poetry” Geo↵rey Chaucer (c. 1340–1400).The latter is actually included in the dataset, but his main influence is recorded as Ovid.
10. This entails regular proof-reading, peer-reviewing, and facilitated reversals of vandalizedarticles using the MediaWiki software (Anderka 2013, p. 9).
11. WikiProject Women in Red by Roger Bamkin (Wikipedia) and Project Vox at DukeUniversity Libraries are initiatives designed to raise awareness about the “gender gap” inWikipedia: the absence of female scientist’s entries, and their higher probability to bedeleted (Kramer 2019). In 2016, 16.72% of English entries in Wikipedia were about women(Stephenson-Goodknight 2016); by 2019, this number was raised to 18% (Kramer 2019). Thesemore recent developments are not included in YAGO3, which was created in 2015.
12. Whose Wikipedia page was introduced later than the YAGO3 database from 2015.13. These are Mary Astell, Du Chatelet, and Anne Conway
5

on YAGO, and as such on Wikipedia.
Adding a temporal dimension
We expanded the dataset with birth and death dates of each scholar in order toincorporate a temporal dimension to analysis.14 We used the SPARQL queryshown in Figure 2, where the predicates wasBornOnDate and diedOnDate wereused to retrieve birth and death dates of the scholars in our dataset. Since ascholar could be an influencer or be influenced, their entity would appear in thesubject or object positions of the triple pattern. Therefore, the query containeda combination of both patterns using an UNION operator. Since the data setmay not have information about the birth date or the death date (or both) ofsome scholars, the triple patterns to retrieve those dates are stated as optional.
Figure 2: SPARQL query to extract birth and death dates
SELECT ?u ?birthDate ?deathDate
WHERE {
{ SELECT DISTINCT ?u WHERE {
{ ?u yago:influences ?v. }
UNION
{ ?v yago:influences ?u. }
} }
OPTIONAL {?u yago:wasBornOnDate ?birthDate .}
OPTIONAL {?u yago:diedOnDate ?deathDate .}
}
The results of this query are as follows:
• 8,073 entities have both dates (119 of them had errors: death dates beforebirth dates, which had to be manually corrected).
• 4,030 entities have birth date, but no death date.
• 82 entities have death date, but no birth date.
• 520 entities have neither dates.
Some entities had no birth or death dates recorded; we corrected such missinginformation by schematically adding/subtracting 60 years from the birth/deathdate15 up to the symbolic year of 2020, in order to get a broad estimationof their lifetime and later periodization. When both dates were missing, weverified those manually. In the course of the data processing, we removed entitiesthat were either conceptual actors, legendary figures, or groups, as e.g., the“Megarian school” or “Gilgamesh”. The interim dataset consisted of 12,577scholars with complete birth and death dates.
14. Compare the following data preparation and cleaning procedures to Petz et al. (2020).15. This process is then followed by another data verification, when introducing a periodiza-
tion into which the scholars are mapped, as described in the following parts.
6

Table 2: Overview on Eras
Abbrv. Era Start EndAN Antiquity 600MA Middle Ages 600 1350EM Early Modern Period 1350 1760TP Transitioning Period 1760 1870MA Modern Age 1870 1945
Mapping scholars into a periodization of time
In order to derive to a longitudinal perspective on a static network, we com-partmentalized the time-span of history manually into consecutive periods (or:eras) into which we embedded the scholars. From this perspective, influenceson the micro-level can be studied as influences on macro-level among periodsof history. We used the global periodization introduced in Petz et al. (2020) tomap scholars into eras that inferred five consecutive eras based on Osterham-mel’s global periodization (2006), as seen in Table 2. We decided for a globalperspective on the periodization in order to cater to the internationality of in-tellectual networks and their heterogeneous origins, and to satisfy the criticizedlack of international outlook in intellectual history.16 We left out the Contem-porary period starting in 1945, as for this study we focused on the periods up tothe Contemporary age. Of course any periodization is a construction to facili-tate research, and as such dependents on the specific caesura for the respectiveresearch field (Pot 1999, p. 63; Osterhammel 2006, pp. 50–51).
Then, every intellectual was assigned to an unambiguous period. In theprocess of this, we corrected outliers that resulted from di↵erent dating (e.g.,dates recorded in YAGO in the Hijri calendar instead of the Gregorian, ormissing negative signs for BC). We rectified some outliers of impossible influencerelations from a later period to an earlier one, which resulted from wronglyswitched influence relations and/or when the lifespans of a scholar influencinganother were drastically di↵erent, thus eliciting chronologically reverse links oferas. Finally we mapped ambiguous period membership of scholars, who fitmore than one era, into a single essential period. The approach of a singleperiod membership avoids redundancy, and o↵ers a more intuitive perspectiveto the longitudinal structure of the networks in order to grasp macro changesin their influence relations.
Adding a spatial dimension, and disciplines
As we are interested in identifying schools of thought, we manually establishedthe geographic domain of agency for each intellectual in the dataset (compareto Table 3), and surveyed their main disciplines, which we structured into 14container categories17 (see Table 4). These disciplines entail the main area of
16. Compare this also to the discussion.17. These container categories are sometimes of anachronistic nature as e.g., “social studies”
as a field developed only in modern time, but which term we used to group historians, anthro-pologists, and social scientists into. Also while “writer” as a category could be used for eachintellectual in the dataset, we only grouped those in there that worked as poets, journalists,or essayists, and who did not work more prominently in the other fields.
7

Table 3: Overview on Geo-categories
Abbrv. Geo-Category NotesGR Ancient Greeks and RomansEU EuropeAR Arab world including Near and Middle East,
“Al-Andalus”, Ottoman Empire,and Modern Turkey
AS Asia e.g., India, China, and JapanAM North AmericaOT Others Oceania, Africa and South America
Table 4: Overview on Disciplines
Abbrv. Discipline Noteswrt writer poets, journalists, essayistsart art painters, sculptorsphl philosophybio bio-sciences e.g. biology, physics, chemistry, geologyrel religious studies e.g., theology, mysticssoc social studies e.g., sociology, anthropology, historymed medicinepol political field e.g., politicians, military, statesmenmat mathematics including statisticseco economy including businessmenleg legal studies e.g. judges, jurists, lawyerslan language studies e.g., linguistics, translation, grammareng engineering including architectureply polymath
8

Table 5: A snippet of the final dataset of scholars.
actor dob dod era region discipline
Ibn_Tufail 1105 1185 MA AR plyMaimonides 1135 1204 MA AR plyFrancis_Bacon 1561 1626 EM EU phlJohannes_Kepler 1571 1630 EM EU bioRene_Descartes 1596 1650 EM EU phl, matChristiaan_Huygens 1629 1695 EM EU medBaruch_Spinoza 1632 1677 EM EU phlIsaac_Newton 1642 1727 EM EU plyAbraham_de_Moivre 1667 1754 EM EU matVoltaire 1694 1778 EM EU phlImmanuel_Kant 1724 1804 TP EU phl
Table 6: Accumulated-Era Networks.
Era Nodes EdgesAntiquity 209 313Middle Ages 5,41 786Early Modern Period 1,212 1,765Transition Period 2,123 3,223Modern Age 4,666 7,803
work of a scholar.For the survey of these attributes, we employed a human annotation process,
which involved dividing the dataset into ten chunks and manually classifying themain disciplines and geo-location for each intellectual. These annotations werethen manually verified. We found further 32 entities to be either non-intellectualinspirations18 or groups which members already existed in the dataset, which weremoved. The final cleaned dataset consists of 5,287 intellectuals in the networkwith 7,803 influence relations. Table 5 shows a snippet of our final dataset ofscholars, where each scholar is associated with his birth and death dates, era,geo-category, and main discipline(s).
Constructing Longitudinal Networks
We constructed longitudinal network snapshots of the original complete net-work by subsampling the dataset according to the five consecutive periods (alsoreferred to as eras, compare to Table 2) in order to transform the static finalnetwork into a series of time-steps. By adding these time-slices of the origi-nal network in consecutive order, we derive to five progressively accumulatednetworks, which consist of all influence links of scholars up to and includinga target period. For example, the first accumulated network (the Antiquitynetwork) consists of all scholars from Antiquity era only; whereas the secondaccumulated network (the Middle Ages network) consists of all scholars fromAntiquity and the Middle Ages, and so on. The last accumulated network (theModern Age network) consists of all scholars of all eras, hence, it is equivalent
18. Such as the sailor Owen Chase, whose biography inspired the story of Moby Dick byHermann Melville.
9

to the original (complete) network. Table 6 gives an overview on the number ofnodes and edges in each accumulated network.
In the following, we describe the network properties of the influence relationsof scholars and their time-sliced network projections, and investigate on theircommunities detected trough a community detection algorithm. For analysis, wecreated directed graphs for each time-sliced network with the Python::NetworkXlibrary (Hagberg et al. 2008).
3 General Data Exploration
After enriching of the dataset in preprocessing, we are able to characterize thedataset of international scholars more thoroughly. In the following we examinethe characteristics of scholars in the three dimensions of disciplines, regions, anderas (compare to Figure 3).
writerart
philosophybio_sciences
religious_studiessocial_studies
medicinepolitical_fieldmathematics
economylegal_studies
language_studiesengineering
polymath
26.91%
22.24%
10.6%
9.57%
6.92%
5.11%
4.84%
4.52%
3.33%
2.04%
1.39%
1.1%
0.8%
0.64%
Distribution of disciplines
Europe
N. America ArabAsia
Greek-RomanOther
66.14%
14.63%
6.61% 6.02%4.14% 2.45%
Distribution of geo-categories
Antiquity
MiddleAges
EarlyModern
Transition
ModernAge
4.84%6.68%
14.11%
20.54%
53.83%Distribution of eras
Figure 3: Distributions of Disciplines, Regions, and Eras
The most frequent profession in the database of scholars is writer (27%),followed by arts (22%), and philosophy (11%). The least frequent disciplinesare polymaths and engineering with < 1% each, catering to the relative rarityof polymathy and the recentness of the engineering as a discipline. While thedataset takes a global stance, the majority of scholars are from Europe (EU,66%), followed by North America (AM, 15%) and the Arab world (AR, 7%).The least frequent geo-categories of Oceania, South America, and Africa, whichwe summarized in the container category OT, constitute together less than 3%of all scholars.Despite its global representation, we can observe a relative bias of favoring theWest in the dataset. For what we defined as the Arab World intellectuals arerelatively well represented for the Medieval era (as a nod to the Islamic GoldenAge, in Baghdad as well as in Cordoba), for most of Africa there are almostno scholars, as well as for South America, and only a scrape on the surface ofthe rich intellectual history of Asia. There is also a prevalence of more recentscholars in the dataset: the percentage of scholars per era continuously increasedin time from 4.8% of all scholars in Antiquity to 53.8% in Modern Age.
In order to explore the interdependencies among the three dimensions (eras,regions and disciplines), we examine the frequency distribution of scholars overthe di↵erent combinations of dimensions. Figure 4 shows three 2-dimensionalmatrices, in which each corresponds to a pair of dimensions: era–discipline,
10

wrt art phl bio rel soc med pol mat eco leg lan eng ply
AN
MA
EM
TP
MR
48 4 134 11 28 14 27 0 14 0 4 3 0 1
61 23 57 41 154 30 19 9 30 0 27 17 0 17
149 271 101 68 99 26 29 13 42 7 20 7 6 13
319 219 116 204 50 67 78 60 44 26 21 13 12 9
954 688 255 264 117 208 170 212 87 93 34 36 33 10
Discipline
AN MA EM TP MR
GR
EU
AR
AS
AM
OT
Region
217 3 0 0 0
0 75 655 892 1907
13 232 37 17 54
28 44 43 27 179
0 0 9 139 652
0 0 2 22 112
Erawrt art phl bio rel soc med pol mat eco leg lan eng ply
GR
EU
AR
AS
AM
OT
44 4 122 9 19 13 18 0 14 0 4 2 0 0
1005 886 422 416 193 224 174 233 161 84 44 47 36 28
91 4 37 42 159 41 27 9 21 0 31 16 0 17
140 44 41 10 60 10 37 3 8 3 4 6 0 2
186 258 39 113 19 57 56 59 16 39 19 5 14 2
74 28 8 16 2 7 15 4 0 1 4 0 2 2
Discipline
Figure 4: Frequency distribution of scholars per Region–Era (left), per Era–Discipline (top), and per Region–Discipline (center). Read like: Frequency ofscholars with characteristics row and column.
region–era, and region–discipline.The first matrix (top) shows the distribution of scholars per era–discipline com-bination. We can see that the dominant discipline in Antiquity was philosophy,while in the Middle Ages it was religious studies, and in the Early Modern pe-riod arts. In all three eras, the second most prominent profession was writer,which became the dominant discipline in the Transitioning period and Modernage.The second matrix (left) shows the distribution of scholars per region-era combi-nations. We can see that the majority of scholars in Antiquity were from Greekand Roman Antiquity (GR), while in the Middle Ages they were from the Arabworld (AR). This reveals another peculiarity of the dataset: we located Greekand Roman Antique thinkers in this category, and not counted them towardEuropean scholars.The Arab regional subset has most of its information on Medieval scholars,therefore showing a relative increase during the Medieval period. This could beowed to the circumstance that Medieval research in the Arab world was morecentralized than in Europe at the time. In Europe, decentralized Monasticlearning was only replaced by the establishment of universities in an intellec-tual revolution during the 12th century (Burke 2000, p. 36; Lutz-Bachmann2003, p. 133), therefore resulting in di↵erences in intellectual influence genealo-gies. In the Arab world, college-like institutions already existed before that –who are thought to have been influential on the creation of the first collegesin Europe, albeit with the di↵erence that they were “fluid system[s]” with aninformality to teaching (Burke 2000, pp. 49-50, Quote on p. 50) and a focus on
11

prominent teachers instead of institutions (Berkey [1992] 2014, p. 16).19 When
(a) AR (b) EU
Figure 5: Medieval period influence networks of two sub-samples of scholarslocated in AR and EU, respectively. Communities are indicated in colors; com-munities of size < 3 are not shown (for the community detection process, pleaserefer to section 4).
comparing the networks of a sub-sample of AR and EU, respectively, the thesison the greater centralization and interconnection of scholarship in AR duringthe Middle Ages finds further support: of the AR sub-sample, 79% of scholars(171 out of 215 in total) cluster in the largest weakly connected component –in comparison to the 69% scholars (34 out of 49 in total) in the EU sub-samplegraph (compare to Figure 5). This di↵erence is even more remarkable, whenthe di↵erence in the amount of scholars is put into account: the AR sub-samplehosted more than 4 times the amount of scholar than in the EU sub-sample.
In order to explore the influence relations among aggregated scholars in thedi↵erent categories of each dimension (era, region, discipline), we look at thedistribution of influence relations of a scholar over the di↵erent combinationsof those categories, i.e. the characteristics of a scholar influencing another one.Figure 6 shows three 2-dimensional matrices, each corresponds to one of the di-mensions, and iterates the absolute frequency of scholars in each category. Thesematrices show the aggregated frequency of intellectuals (with characteristic inrow) dependent on the three dimensions (era, region, discipline) influencing like-wise aggregated intellectuals (with characteristic in column), i.e. the numberof scholars from the AR that influence scholars in AS. The first matrix (Figure6, top-left) shows the influence relations between the di↵erent eras. We can seethat each period was mostly influenced by (scholars from) itself, except for theTransitioning period which had more out-going influences to Modern Age. Thesecond matrix (Figure 6, bottom-left) shows the influence relations between thedi↵erent regions. We can see that the influence received by each region comes
19. It might be noted here, that Medieval European universities were also much less formal-ized before 1800 (Burke 2000, p. 50).
12

AN MA EM TP MR
AN
MA
EM
TP
MR
313 86 145 66 112
0 387 144 36 62
0 0 690 431 267
0 0 0 925 1359
0 0 0 0 2780
GR EU AR AS AM OT
GR
EU
AR
AS
AM
OT
294 335 34 4 23 1
0 5059 25 67 584 117
2 110 387 26 5 1
0 29 13 207 2 0
0 155 0 9 434 9
0 12 0 2 7 42
wrt art phl bio rel soc med pol mat eco leg lan eng ply
wrt
art
phl
bio
rel
soc
med
pol
mat
eco
leg
lan
eng
ply
2030 110 222 35 68 61 17 117 10 12 23 6 11 17
84 870 6 8 1 6 1 6 0 0 0 0 1 1
482 23 1441 85 205 135 128 200 96 69 50 22 7 68
66 4 98 310 42 40 94 14 36 14 10 3 8 43
136 6 175 23 263 41 14 33 14 6 51 11 3 28
88 3 100 19 32 125 15 37 2 21 10 6 3 5
20 5 114 91 20 20 172 8 20 9 4 4 6 16
140 6 108 17 31 39 6 76 5 20 19 3 2 14
11 2 104 37 21 12 26 7 85 15 3 3 3 19
17 3 41 6 3 13 4 19 5 133 3 1 2 0
35 3 59 6 36 21 2 19 1 1 39 3 0 9
8 0 16 4 5 10 5 1 1 1 0 40 2 2
3 2 1 1 0 4 4 1 3 3 0 0 10 0
16 2 95 35 36 18 12 7 30 1 8 3 2 27
Disciplines
Regions
Eras
Figure 6: Influence relations between eras (top-left), between regions (bottom-left), and between disciplines (right). Read like: Frequency of scholars withcharacteristic (in row) who influence scholars with characteristic (in column).
from that region itself, except for AM and OT, which received more influencesfrom EU than from themselves. We can also note that each era influenced itselfthe most, except for GR, which influenced EU more than itself.
The third matrix (Figure 6, right) shows the influence relations between thedi↵erent disciplines. There, scholars usually influence other scholars from theirown disciplines, as well as writers.
In the following sections, we develop a method to detect communities andstudy the patterns of community evolution of intellectuals over time, space anddisciplines, as well as the structural dynamics of eras, and identify mechanismregarding their development.
4 Community Detection
Most social networks exhibit community structures: their nodes are organizedinto groups, called communities or clusters, where each group’s nodes have ahigher probability of being connected to each other than to members of othergroups (Fortunato 2010). Pairs of nodes are more likely to be connected if theyare both members of the same community, and less likely to be connected ifthey do not share communities. Identifying communities may o↵er insight onhow the network is organized; it helps to classify nodes based on their role withrespect to the communities they belong to. The problem of detecting commu-nities in a network has been extensively studied in the literature, and severalmethods for community finding have been developed.20
In a social network, a community can be considered a set of entities closer con-
20. We refer to Fortunato (2010) for a comprehensive survey.
13

nected to each other than to the rest of the entities in the network (Girvan andNewman 2002), e.g., through more intense interaction with each other (Leskovecet al. 2008). This closeness is based on similarity, and implicitly assumes an un-derlying structuring principle of homophily (Dakiche et al. 2019, p. 1085; seealso McPherson et al. 2001).
As discussed before, we constructed five accumulated networks of scholarsover the five eras. In this paper, our goal is to study the evolution of communitiesof scholars over time. The method to do so consists of the following steps:
• First we apply a community detection algorithm on these accumulativenetworks, and
• Then we apply an algorithm to track the evolution of communities overtime in the five consecutive eras.
In this section we present the first step of community detection, whereas wepresent the second step of tracking the community evolution in the next section.
Finding communities with the InfoMap algorithm
We opted to use the InfoMap community detection algorithm for directed net-works as implemented in the map equation framework by Bohlin et al. (2014).The core of the InfoMap algorithm follows closely the Louvain method (Blondelet al. 2008), where neighboring nodes are joined into modules (clusters), whichsubsequently are joined into supermodules. The InfoMap algorithm allows todetect communities in directed networks, which we applied on the accumulatedinfluence networks of intellectuals, consisting of all influence links among schol-ars who lived up to and including target era.Since the InfoMap two-level algorithm is based on random walks, it would pro-vide di↵erent results each time when executed on the same network. Accord-ingly, we developed an evaluation method to choose the most coherent results:We opt to base such evaluation on the homogeneity of these communities basedon the attributes we surveyed in preprocessing. Thus, we define the followingdiversity measure:Let A be a group of items (duplicates allowed) of size L (number of all items),and let N be the number of unique items in A, we define the diversity of thisgroup as:
diversity(A) =
(0 if L = 1N�1L�1 otherwise
(1)
This measure will equal 1, when the group is completely heterogeneous (e.g., ifall items are di↵erent: N = L), and will equal 0 when it is completely homoge-neous (e.g., all items are the same: N = 1). We can use this measure to assessthe diversity of a group of scholars with respect to any dimension, where theitems are the categories of that group’s members according to the given dimen-sion. For instance, if a community consists of two scholars from Antiquity, andthree scholars from the Middle Ages, its diversity according to this measure is:2�15�1 = 0.25.In the process of detecting communities, we used this diversity measure to eval-uate the obtained results. For each era, we executed the community detection
14

algorithm 10 times with a di↵erent randomization seed21 each (henceforwardreferenced as clustering run). For each run, we established the diversity of theclustering results by calculating the diversity of each community with regardto their homogeneity in disciplines, regions, and eras. These results we com-bined with a weighted average, using the weights of 45% for disciplines, 30%for regions, and 25% for eras respectively.22 The diversity of the clustering runis then calculated as the average diversity of the communities detected in eachaccumulated network.23 Out of this sample of 10 randomized clustering runs,we chose the initial seed of the clustering run that minimized diversity, namely,the run with the most homogeneous set of communities.
Characterising these communities
When applying the community detection algorithm, we obtain a set of commu-nities for each accumulative-era network. Table 7 shows for each era the numberof detected communities (C), the number of communities with size > 3 (C 0), thesize (number of nodes) of the top three largest communities (LC1, LC2, LC3).and the average number of members per community M . We clearly observean increase in the number of communities, which is a result of the increasingnumber of scholars in the longitudinal accumulation.
Table 7: Overview on the sizes of detected communities per era. N : No. ofnodes, C: No. of communities, C 0: No. of communities with size > 3, LCi: ith
largest community, M : average members per community, De, Dg, Dd: diversityof eras, regions and disciplines, respectively. When the diversity measure iscloser to 0, the community is more homogeneous.
Era N C C 0 |LC1| |LC2| |LC3| M De Dg Dd
Antiquity 209 31 21 19 13 13 6.74 0.00 0.085 0.31MiddleAges 541 80 53 21 19 19 6.76 0.05 0.089 0.50EarlyModern 1212 201 103 41 29 29 6.03 0.07 0.072 0.37TransitionP. 2123 361 179 51 50 42 5.88 0.12 0.063 0.36ModernAge 4666 726 365 66 52 48 6.43 0.14 0.103 0.33
For each era and over all communities of each era, Table 7 shows the av-erage diversity with respect to eras (De), geo-categories (Dg), and disciplines(Dd). We observe that the communities of scholars exhibit a very low diver-sity with respect to eras and regions over all the consecutive eras, i.e. in anycommunity there is one major era and one major region to which most of themembers belong. On the other hand, communities exhibit a relatively interme-diate level of diversity with respect to disciplines over all eras even though this
21. The randomization seed is the entry configuration of the algorithm.22. We weighted disciplines the highest, as these we found the main reason for community
formation, following the observations in Figure 6. Regional location influences the formationof ties; however these spatial distances are not unbridgeable, and following the line of thoughtof Baring (2016), connection should weight more in a truly transnational perspective. Weweighted the influence of eras the least as we perceived this is an trivial di↵erence betweenscholars from di↵erent time frames.
23. In future work, a robustness analysis could evaluate changes in the diversity measure, ifdi↵erent or multiple disciplines would be recorded for each intellectual (instead of this analysis’focus on only one main discipline), as. e.g. Voltaire in the category writer as a poet insteadof (or including) philosophy as an Enlightenment philosopher.
15

Table 8: Overview on the composition of the largest communities in each era.
Era # |C| eras regions disciplines notable scholars
Antiquity
(AN)
1 19 AN 100% GK 95% phl 95% Plato, Aristotle, Socrates2 13 AN 100% RO 65% wrt 88% Virgil, Ovid, Theocritus3 13 AN 100% IN 77% pol 77% Buddha, Ashoka, Mahavira4 12 AN 100% GK 58% phl 88% Augustine of Hippo, Proclus, Boethius5 11 AN 100% GK 100% phl 100% Arcesilaus, Carneades, Xenocrates
MiddleAges
(MA)
1 21 AN 95% GK 90% phl 95% Plato, Aristotle, Socrates2 19 MA 100% AR 95% wrt 64% Ganjavi, Al-Hallaj, Omar Khayyam3 19 AN 89% GK 55% phl 71% Plotinus, Augustine of Hippo, the Areopagite4 17 MA 100% AR 100% rel 76% Ahmad ibn Hanbal, al-Bukhari, Abu Dawood5 17 MA 94% AR 71% phl 30% Ibn Tufail, Averroes, Maimonides
EarlyModern
(EM)
1 41 MA 51% EU 54% phl 48% Thomas Aquinas, Plotinus, Augustine of Hippo2 29 EM 93% EU 93% phl 39% John Locke, Francis Bacon, Thomas Hobbes3 29 MA 69% AR 86% wrt 71% Ganjavi, Al-Hallaj, Attar of Nishapur4 29 AN 90% GK 83% phl 83% Plato, Aristotle, Socrates5 29 MA 62% AR 48% phl 23% Ibn Tufail, Averroes, Maimonides
Transition(TP)
1 51 MA 51% EU 53% rel 47% Thomas Aquinas, Plotinus, Augustine of Hippo2 50 EM 66% EU 96% phl 44% Rene Descartes, John Locke, David Hume3 42 AN 90% GK 79% phl 67% Plato, Aristotle, Socrates4 33 TP 55% EU 67% wrt 77% Goethe, Friedrich Schiller, Ganjavi5 31 MA 58% AR 45% phl 31% Ibn Tufail, Averroes, Maimonides
ModernAge
(MR)
1 66 MR. 79% EU 78% art 100% Pablo Picasso, Paul Cezanne, Claude Monet2 52 MA 52% EU 62% rel 46% Thomas Aquinas, Plotinus, Augustine of Hippo3 48 MR 56% EU 83% phl 35% Hegel, Karl Marx, Friedrich Engels4 45 MR 78% EU 100% wrt 87% A. Macedonski, B. Fondane, Ion Minulescu5 41 TP 59% EU 98% phl 61% Immanuel Kant, Baruch Spinoza, Schelling
had the strongest weight in the optimization of communities homogeneity in thecommunity detection process.
Table 8 shows the composition of the largest communities per era. Theseshow clear thematic distinctions.The biggest three communities in Antiquity are a group of 19 Classical Philoso-phers around Aristotle, Plato and Socrates, a cluster of 13 Greek and Romanpoets (Virgil, Ovid, Ennius) and Cynic philosophers (Menippos of Gadara) asseen in Figure 8 on top, and a community mirroring the political influences onAshoka the Great of the Mauryan dynasties, and the Seleucid empire. Thiscommunity is identifiable in the top right of Figure 7, which shows the influencenetwork of intellectuals during the Antiquity era and their communities distin-guished in colors. On the top right, there are two communities not connectedto the others: on the right, the community surrounding Ashoka the Great, andon the left one of Chinese scholars.
The Classical Philosophers community survived into the Middle Ages asthe biggest cluster (of 21 scholars) influencing Medieval Georgian Neoplatonistphilosopher Ional Petrisi, followed by a two communities of equal size (19) ofPersian poets, Sufi mystics, Sunni poets and philologists dating from 9th to the13th century (Rumi, Saadi Shirazi, see Figure 8 second from top), and a com-munity of Neoplatonic philosophers influencing Christian theologians (Plotinus,Augustine of Hippo, Anselm of Canterbury)
In the Early Modern period, the biggest community (41 scholars) is formedby mostly Medieval Christian theologians and mystics (Thomas Aquinas, JohnCalvin) and Renaissance humanist Nicholas of Cusa, followed by three commu-nities (29) of Enlightenment scholars of political theory and statesmen (JohnLocke, Thomas Hobbes, Edmund Burke, compare to Figure 8 second from be-low), a Persian theosophic poets community (Rumi, Hafez), and a communityof Classical philosophers of Antiquity influencing Renaissance Greek philoso-phers Ioannis Kottounios and surgeon Marco Aurelio Severino. Noteworthy
16

Figure 7: Influence network of intellectuals in the Antiquity period with com-munities highlighted.
here are also the international and heterogeneous community around Andalu-sian Medieval scientist/philosophers (Abu al-Quasim al-Zahrawi, Maimonides),and the political theoretical influences of polymath Ibn Tufail on Early Modernscientists, politicians, and religious scholars. The sixth biggest cluster (20) ismerged from the Roman Poets with contemporary early Modern Poets of theRenaissance (Ludovico Ariosto), representing their interest in the Classical an-tiquity. An interesting configuration provides the seventh biggest cluster (18),too, which consists mainly of natural philosophers and mathematicians, and asurprising high concentration of polymaths (Gottfried Leibniz, Roger JosephBoscovich, Benjamin Franklin).
The biggest community of the Transitioning period (51 scholars) consists ofChristian Theologians and Mystics, again headed by Thomas Aquinus. The sec-ond biggest community (50) consists of Early Modern Enlightenment scholars ofpolitical theory and economy (Francis Bacon, John Locke, David Hume, AdamShmith), influencing science philosophers such as August Comte. The Classi-cal Philosophers constitute the third biggest cluster (42) here, too, in almostunchanged composition. Fourth biggest cluster of size 33 shows an interestingcommunity of Persian theosophic writer Hafez’s influence on German Romanticliterature (Goethe, Kleist, Schiller) as seen in Figure 8 below.
In Modern age, a community of 66 Modern artists emerges ranging from Im-pressionism (Cezanne, Matisse) to Kubism (Braque) and Social Realism (BenShaw). Second biggest community (52) of Antique and Medieval Christian reli-gious philosophers (Plotinus, Thomas Aquinus) with few links to Early Modernand Modern theologians (Nicholas of Cusa, Joseph Marechal). Third biggestcommunity (48) consists of a political philosophers influenced by Hegel and So-
17

cialist thinkers formed around Max Stirner, Bruno Bauer and Karl Marx, andModern influences ranging from Vladimir Lenin, to the political ”father of In-donesia” Tan Malaka, and Bertold Brecht.The communities detected revolve around the main influences of each scholar,and comprise of reasonable thematic groups, which allows us to identify variousschools of thought.
5 Evolution of Communities
In order to track the evolution of these communities computationally and toidentify their structural changes, we follow the approach of Greene et al. (2010).They proposed to identify a set of dynamic communities, a type of “evolvingcomplex networks” (Qiu et al. 2010; Dakiche et al. 2019, p. 1085) that are presentin the network across one or more time steps, which compositions change ac-cording to the behavior of its members, i.e. joining, leaving, or establishing newrelations. Communities identified at an individual time step are referred to asstep communities: they represent specific observations of a dynamic communityat a given point in time. Each dynamic community Di can be represented by atime-line of its constituent step communities, ordered by time and with at leastone step community for each step t. The most recent observation in a timelineis referred to as the front of the dynamic community.
Their model for dynamic community analysis is focused around the life cycleof communities, and the key events that characterize the evolution of dynamiccommunities, such as
• Birth: The emergence of a step community observed at time t for whichthere is no corresponding (preceding) dynamic community.
• Death: The dissolution of a dynamic community Di occurs when it cannotbe observed anymore (i.e. there is no corresponding step community to beobserved) for several consecutive time steps. Di is subsequently removedfrom the set D of dynamic communities.
• Merge: A merge occurs if two distinct dynamic communities (Di, Dj)observed at time t � 1 match to a single step community Cta at time t.The pair subsequently shares a common timeline starting from Cta.
• Split: It may occur that a single dynamic community Di present at timet � 1 is matched to two distinct step communities (Cta, Ctb) at time t. Abranching occurs with the creation of an additional dynamic communityDj that shares the timeline of Di up to time t � 1, but has a distincttimeline from time t onward.
• Continuation: Trivial one-to-one matching where a dynamic communityobserved at time t also has an observation at time t + 1.
This results into the need for tracking communities over time (p. 1085). Thestrategy of tracking communities across time steps is a heuristic threshold-basedmethod, which allows for many-to-many mappings between communities across
18

Vincenzo_Monti
Ugo_Foscolo
Jakob_Reinhold_Lenz
Leopold_von_Ranke
Anvari
Martin_Knutzen
Christoph_Wieland
Friedrich_Klopstock
Christian_Gellert
Khaqani
Hatef
Sydney_Morgan
Vahshi_BafqiKhwaju_Kermani
GoetheGiuseppe_Parini
James_Macpherson
Oliver_Goldsmith
�udovít_!túr
Johann_HamannK�lid�sa
Christoph_Nicolai
Asadi_Tusi
Heinrich_von_Kleist
Johann_Winckelmann
Fakhruddin_Gurgani
Emanuel_Swedenborg
Friedrich_Maximilian_Klinger
Saadi_Shirazi
Friedrich_Schiller
HafezJohann_Herder
Nizami_Ganjavi
Edward_Coke
Francis_Hutcheson
Richard_Hooker
Bernardino_Telesio
Robert_Filmer
Andrea_Alciato
Mary_Astell
Pierre_d'AillyFrançois_Connan
John_Selden
William_Blackstone
Anthony_Collins
Joseph_Butler
Montesquieu
Edmund_Burke
Anthony_Ashley-Cooper
William_Gilbert
Gershom_Carmichael
Samuel_Rutherford
Roger_Bacon
Francis_Bacon
Thomas_Hobbes
William_Petty
Bernard_Palissy
Abraham_Tucker Jonathan_Edwards
John_Locke
Vannoccio_Biringuccio
Abu_Ma'shar_al-Balkhi
Antiquity Middle Ages
Early Modern Transition
Abu_al-Hassan_al-Kharaqani
Amir_Khusrow
Attar_of_Nishapur
Khaqani
Fakhruddin_As'ad_Gurgani
Khwaju_Kermani Rumi
Omar_Khayyám
Ferdowsi
Ab�-Sa'�d_Abul-Khayr
Mansur_Al-Hallaj
Sanai
Dhul-Nun_al-Misri
Saadi_Shirazi
Khwaja_Abdullah_AnsariAsadi_Tusi
Shams_Tabrizi
Bayazid_Bastami
Nizami_Ganjavi
Statius LucanOvid
Virgil
CallimachusLucretius Theocritus
Propertius
Lucian
Ennius
Demonax Menippus
Apuleius
Community: Antiquity #2
Community: Middle Ages #4
Community: Early Modern #2
Community: Transition #4
Figure 8: Tracking influence relation compositions of various exemplary com-munities.
19

di↵erent time steps.24 The strategy proceeds as follows: Given the first stepgrouping C1 (communities of the first time step) a distinct dynamic communityis created for each step community. Then, with the next grouping C2, an at-tempt is made to match these step communities with the fronts {F1, · · · , Fk0}(i.e. the step communities from C1). All pairs (C2a, Fi) are compared, and thedynamic community timelines and fronts are updated based on the key eventrules described previously. The process continues until all step groupings havebeen processed and classified.
Matching front and step communities
To perform the actual matching between Ct and the fronts {F1, · · · , Fk0}, weneed a measure of similarity between sets. Greene et al. (2010) proposed to usethe widely-adopted Jaccard index25. The similarity of a united set of communi-ties however provides trivial results in our study, as it focuses on the overlap intwo communities instead of how much of one community is integrated into thenext.
Boujlaleb et al. (2017) proposed to use another measure, Quantity Insertion(QI), which reflects the quantity of members of front community Fi that areinserted into the step community Cta:
simQI(Cta, Fi) =|Cta \ Fi|
|Fi|
We opt to use this QI measure in our study as it is more robust and providesbetter interpretable results. If the similarity exceeds a matching threshold ✓ 2[0, 1], the pair is matched and Cta is added to the timeline for the dynamiccommunity Di. The output of the matching process will naturally reveal aseries of community evolution events. A step community matching to a singledynamic community indicates a continuation, while the case where it matchesmultiple dynamic communities results in a merge event. If no suitable match isfound for a step community above the threshold ✓, a new dynamic communityis created for it.
Characterization of community tracking results
We applied this tracking method on the detected communities over the five erasas time steps. We excluded small communities with 3 or less scholars, hence thenumber of remaining communities of the five eras are [21, 53, 103, 179, 365].For matching we used a similarity threshold ✓ � 0.5, that is two communitiesare considered a match when at least 50% of common members belong to thefront dynamic community.
24. Many-to-many mappings are a method of system analysis, and refer to the mapping ofrelationships of entities’ instances. An entity can contain a parent instance for which there aremany children instances in another entity, and vice versa. In our context this means that acommunity can consist of scholars, that are also present in a subsequent/preceding communityof a later/earlier era, which relationship is observed or tracked by this method. A mappingoccurs when the similarity of both entities passes a certain threshold.
25. The Jaccard index or coe�cient calculates the similarity of a sample set (in this case: ofcommunities) by dividing the size of overlap of the sample set by the size of the united sampleset, i.e. the overlap of two communities divided by the size of the two communities combined.
20

Figure 9: Evolution of dynamic communities with more than 3 members overeras, starting with Antiquity from the center outwards. The size of nodes rep-resents the amount of memberships.
The results of the process of tracking community evolution are 154 dynamiccommunities in time, among them 132 continued communities (with continua-tion events only) and 22 merged communities (with merge/split events). Figure9 shows an overview on the evolution of dynamic communities over all five pe-riods.
We recorded 4 split events (1 at EM, 2 at TP, and 1 at MR), and 36 mergeevents (2 at MA, 4 at EM, 10 at TP, and 20 at MR). On average, each dynamiccommunity consists of 14.3 members (median: 10 members). For each dynamiccommunity, we calculated the number of constituent step communities (denotedN), the number of distinct scholars (across all step communities, denoted M1),and the average number of scholars per step community (denoted M2). Notethat in any dynamic community, the constituent step communities are not dis-joint in general26; thus, a scholar can belong to a di↵erent step community indi↵erent eras. Therefore, M2 is not the same as M1 divided by N . In fact, M2
is the sum of the sizes of step communities divided by their member count N .M1 is the count of distinct scholars in all step communities of an entire dynamiccommunity over all eras.
The di↵erence M1 � M2 provides an indication of the change behavior of adynamic community. The lower this di↵erence is, the more static the communityis; for instance, when this di↵erence is 0 (i.e., M1 = M2), the community is self-contained and does not change its members); whereas the higher the di↵erenceis, the more changes in the community.
26. They are disjoint only when they are of the same era.
21

In continued dynamic communities, the number of constituent step com-munities N is the same as the number of corresponding eras, because in suchcontinued dynamic communities only one step-community is observed at eachera. This is not the case in merged dynamic communities, where multiple step-communities can be observed at a given era (e.g., get merged in a later era, orgot split in a former era).
Table 9 summarizes the largest 5 merged dynamic communities. It shows foreach one the number of constituent step-communities N , the number of distinctscholars M1, and the average number of scholars per step-community M2. Italso shows the number of step-communities from each era. For instance thelargest dynamic community consists of 23 step communities (7 from AN, 6 fromMA, 5 from EM, 3 from TP and 2 from MR). It comprises 100 distinct scholars(many of which belong to multiple step communities at di↵erent eras), their stepcommunities contain 15.3 scholars on average. This community is described indetail later.
Table 9: Summary of the top 5 merged dynamic communities. N : numberof step communities, M1: number of distinct scholars, M2: average number ofscholars per step community, Ne: number of step communities from era e.
N M1 M2 NAN NMA NEM NTP NMR
23 100 15.30 7 6 5 3 211 63 19.64 2 5 2 1 110 25 8.50 0 3 3 3 17 38 13.29 0 1 3 2 17 19 10.29 1 1 2 2 1
Patterns of dynamic communities
Table 10: Patterns of dynamic communities over eras. N : average numberof step communities, M1: average number of distinct scholars, M2: averagescholar-per-community ratio.
Eras Continued Merged
AN MA EM TP MR # N M1 M2 # N M1 M2 #
⇥ ! ⇥ ! ⇥ ! ⇥ ! ⇥ 9 5 10.4 8.7 4 11.75 55.5 15.3 13
⇥ ! ⇥ ! ⇥ ! ⇥ 1 5 19.0 7.0 1
⇥ ! ⇥ 1 2 9.0 7.5 1 3 12.0 7.0 2
⇥ ! ⇥ ! ⇥ ! ⇥ 16 4 11.0 9.8 8 6.13 25.9 12.3 24
⇥ ! ⇥ ! ⇥ 37 3 10.7 8.5 4 4.25 32.0 15.6 41
⇥ �! ⇥ 1 2 22.0 15.5 1
⇥ ! ⇥ 68 2 11.0 8.5 4 3 42.8 19.3 72
132 22 154
The pattern of communities per era is depicted in Table 10; along with somestatistics about their occurrence in both continued and merged cases.
For instance, the first pattern represents step communities from all five eras.This pattern occurs in 13 dynamic communities; 9 out of them are continued,while 4 are merged. In those 9 continued ones, the average number of step com-
22

munities is N = 5 (in accordance to the five periods we have), the average num-ber of distinct scholars is M1 = 10.4, and the average of scholar-per-communityratio is M2 = 8.7. Whereas in the 4 merged ones, the average number of stepcommunities is N = 11.75, the average number of distinct scholars is M1 = 55.5,and the average of scholar-per-community ratio is M2 = 15.3.
The most frequent patterns are:
• TP!MR: this pattern occurs 72 times (68 continued, and 4 merged).
• EM!TP!MR: this pattern occurs 41 times (37 continued, and 4 merged).
• MA!EM!TP!MR: this pattern occurs 24 times (16 continued, and 8 merged).
There is another interesting pattern, EM!MR, which consists of a step-community from EM that disappears in TP and reappears again in MR.
In order to be able to better interpret these patterns, we investigated in thesimilarity of communities in each time-step, and inspected their loss/gain ofmembers.
Step-wise similarity of communities
Over all dynamic communities, we calculated the similarity between matchingstep communities (inter-period similarity) regarding their common scholars us-ing the Jaccard and the QI measures, and their similarity in terms of the threedimensions: era, geo-categories and disciplines using the cosine similarity27).Table 11 shows the results, where we can observe a very high average similarityof around 92% (based on the QI measure) over all time-steps, revealing thatmost communities are relatively constant in their composition.
Table 11: Similarity between step communities
step # common scholars dimensionsJaccard QI era region discipline
AN ! MA 21 0.795 0.921 0.995 0.994 0.990MA ! EM 53 0.725 0.894 0.954 0.963 0.962EM ! TP 97 0.754 0.916 0.955 0.975 0.969TP ! MR 166 0.718 0.911 0.918 0.988 0.975MA ! TP 1 0.450 0.692 0.874 0.949 0.965EM ! MR 2 0.604 0.892 0.882 0.999 0.968
All 0.746 0.920 0.916 0.987 0.976
In a dynamic community, a constituent step community does not necessarilycontain all the members of its preceding step communities; and it does notnecessarily contain all the members of its succeeding step communities. Ingeneral, the members of a step community X at some era will be members ofdi↵erent communities Yi at the next era. If the similarity between X and Yis above a threshold, it matches, and the two communities will be identified asbelonging to the same dynamic community. However, if the similarity is below
27. For each step community, each dimension is described as a vector; for example, a com-munity with 6 scholars from EU and 4 scholars from AM, is represented as (0,6,0,0,4,0).
23

the threshold (and 6= 0), this means that there are some of X members whomoved to Y without having an observed connection between X and Y. Thus,there is an unobserved exchange of members, which means a loss of membersfor X, and a gain/introduction of new members for Y.In order to analyze this behavior of gaining/loosing scholars in communities, wecalculate several measures for a step community:
• Loss number (LossN (x)): the number of lost members, i.e., number of Xmembers, who are not present in its successors. We also calculate Lossratio (Lossr(x)) via dividing LossN (x) by the size of X.
• Gain number (GainN (x)): the number of newly-introduced members, i.e.,number of X members, who are not present in its predecessors. We alsocalculate Gain ratio (Gainr(x)) via dividing GainN (x) by the size of X.
• Forward Stability (FS(X)): ratio of X members, who are present in itssuccessors.
• Backward Stability (BS(X)): ratio of X members, who were present in itspredecessors.
Note that Lossr(x) + FS(X) = 1, and Gainr(x) + BS(X) = 1.The average loss per dynamic community is 2.2 members, where 90 out of the 154(58%) communities have 0 loss; the maximum gain is 44. The average gain perdynamic community is 3.3 members, where 61 out of the 154 (40%) communitieshave 0 gain, and the maximum is 60. The average forward stability is 0.92, whilethe average backward stability is 0.85; which means that we expect that 92% ofthe members of a step community will be observed in its successor communities;while 85% of the members were observed in its predecessor communities. Table12 provides a summary of these measures over all eras. These figures suggestagain little structural change in communities on average, and relatively stablecommunities in time.
Table 12: Summary of loss and gain of scholars per dynamic community
lossN FS gainN BSEra # sum avg max # sum avg maxAN 21 16 0.76 5 0.921MA 53 50 0.94 5 0.907 19 19 1.00 6 0.925EM 98 87 0.89 9 0.925 48 97 2.02 12 0.858TP 165 186 1.13 24 0.917 86 141 1.64 26 0.888MR 153 538 3.52 60 0.819
Given a dynamic community, there is a very strong correlation between thedi↵erence between the distinct scholars and the average amount of scholars ina step community M1 � M2 on one hand, and the sum of LossN as well as thesum of GainN over its constituent step communities:
corr(M1 � M2,X
LossN ) = 0.868
corr(M1 � M2,X
GainN ) = 0.844
24

A low di↵erence in the number of distinct scholar and the average amountof scholars in a step community (M1 � M2) means little loss and/or little gain,therefore communities have a high stability, and can be considered almost static,whereas a high M1 � M2 signifies more loss and/or more gain, characterizinglow stability in a highly changing community.
An interesting sub-class of dynamic communities are those who are self-contained. We say a dynamic community is self-contained if its constituent stepcommunities consists consistently of the same set of scholars. This means thatthere is no exchange of scholars with other communities at all. Based on thisdefinition, a self-contained community has the following characteristics:
• It is necessarily a continued community.
• M1 = M2, i.e., the number of distinct scholars equals the ratio of scholarsper step-community.
• The similarity of step-wise communities is 100% in terms of scholars andin terms of the three dimensions.
• Both the loss number, LossN (x), and the gain number, GainN (x), are 0.
• Both forward- and backward- stability (ratio of common scholars) is 100%.
We found that there are 52 of such self-contained communities (2 start atAntiquity, 8 at MA, 16 at EM, and 26 at TP). All of them survive intact untilModern Age. Table 13 shows the patterns of self contained communities withtheir average sizes.
Table 13: Self-contained communities
Eras M1 = M2
AN MA EM TP MR # avg min max
⇥ ! ⇥ ! ⇥ ! ⇥ ! ⇥ 2 5.50 4 7
⇥ ! ⇥ ! ⇥ ! ⇥ 8 7.50 4 17
⇥ ! ⇥ ! ⇥ 16 5.81 4 11
⇥ ! ⇥ 26 5.58 4 10
52 5.94
Description of the largest dynamic community
The largest merging dynamic community consists of two clusters on the left andright, and one intermediate branch merging in each of those two.The cluster of the left side of Figure 10 consists of two sub-branches meetingduring the Transitioning period, the first of which consists of a community of theinfluence of the Greek poet Aesop (6th BC) on later writers of fables (Avianus,Babrius), tragedians (Sophocles), historians (Herodot), rhetoricians (Himerius),and grammarians (Dositheus Magister) continuing as such in the Middle Agesand in the Early Modern period.The left cluster’s second sub-branch consists of two separate branches, whichmerge in the Early Modern period. One part of this (sub-)sub-branch consists
25

of a community of philosophers and mathematicians around Ionian philosopherPythagoras, which continues as such into the Medieval era. The other part ofthis (sub-)sub-branch consists of the group of Classical Philosophers of Socrates,Plato, and Aristotle. This community continues self-contained into the Medievalperiod, and finally merges with the Antique mathematical philosophers commu-nity of Pythagoras in the Early Modern period joined through Parmenides. Thisjoined community influences various Early Modern Neoplatonian philosophersand the Greek scholar Ionnais Kottounios (17th century).Finally, both sub-branches of the left cluster join in the Transit period, whichinclude the poetic influences on Socrates, and merge with another Sophist com-munity from the intermediate branch into a combined community of Sophist,poetic, mathematical, and Stoic influence network on Plato and Aristotle, whichcontinues into the Modern period, loosing the poet’s branch, but incorporatingthe Aristotelian influence on Francis Bacon.28
The intermediate branch consists of community of Socrates student Antisthenes’sinfluences on Cynicism (Diogenes of Sinope, Crates of Thebes) merging with acommunity of Stoic philosophers surrounding Zeno of Citium into a joined com-munity of Cynics’ influence on Stoicism through the Megalarian School. Thesecontinue into a community, which incorporates early Sophist influences of Cyni-cism as well. A split event leads to the Sophist part of the community to mergewith the aforementioned Classical philosopher’s community around Socrates,and the Cynics part to merge to community of Cynics around Zeno of Citiumand Stoics around Epictetus. The Stoics in turn influence a cluster of Jansenistsaround Early Modern scientist Blaise Pascal of the second cluster on the right,who after his religious epiphany in the 1650s was influenced by Epiktet andturned to Jansenism, a heretic branch of Catholic Popedom in fight against theJesuits.The second cluster on the right consists of two continuing communities, a Stoiccommunity of the school of Athen around Cleanthes and Epictetus and anotherStoic community in the Roman Republic around the teacher-student pair ofPanaetius and Posidonius that continue until Modern age, with exception to themerge event with the intermediate branch of Cynics, Stoics and Jansenists. Thisgroup then merges into a combination of both branches of Stoicism of Panaetiusand Cleanthes via Zeno of Citium, loosing the Early Modern Jansenists grouparound Pascal.
In order to infer on the question why these groups show these evolution dy-namics in communities, it is of equal importance to look for who is part of acommunity as it is for who is not. The scholars part of a community show agreater homogeneity than in other possible communities in regards to their disci-plines, regions, and periods – as this was optimized in the clustering algorithm.We can clearly identify schools of thought and reasonable thematic clusters.These communities are structured again by sub-group of cores – members ofcommunities that stay together even though the group changes communities intime, such as the Cynics genealogy of Diogenes of Sinope, Crates of Thebes,
28. Bacon’s work on natural philosophy drew heavily from ancient sources, and as Pesic(2014) argues, his terminology – such as the contested usage of “violence” of nature and thedominion of man (compare to Merchant 2008 – can only be understand “depend[ent] on theirAristotelian context”, which Bacon developed his “new philosophy” on (Pesic 2014, p. 79),though he also departed from his ancient sources (see also Cushing 1998, pp. 15-28).
26

22 9
31
5
67 9
21
8
19 13
9
11
16
6
10
46 9
3
8
17
5
511 9
20
9
17 10
11
10
10
5 5
18
4
5
25 9
4
9
1 19
1
19
42
6
30
40
9
17
9
10
28
29
6
10
10
18
21
27
9
9
10
16
20
10
8
9AN
MA
EM
TP
MR
Figure 10: Largest dynamic community with merge/split events (✓ = 0.5).
his wife Hipparchia of Maroneia, and her brother Metrocles, which closely re-semble schools and fields within the communities. The changing composition ofcommunities, exchanging core sub-groups and floating members, leads to thesecore-groups integrating into other groups that provide a stronger homogenity inrelation to the possible other groups in that era.
6 Conclusion
This study is founded on a database encompassing the influence relations ofintellectuals in the broad strokes of a “Meistererzahlung”: an abstract view onthe main influences of the main intellectuals as collected in the Linked OpenData base YAGO3 – and as such as recorded in Wikipedia, the biggest and mostaccessible encyclopedia of crowd-sourced origin29. This view on the history ofintellectuals closely iterates the state-of-knowledge compiled in the knowledgebase YAGO3/Wikipedia, and consequently represents a crowd-curated contem-porary view on the history of intellectuals and their main influences on another.Despite the focus of the database on main influences and biases in representationfavoring male European intellectuals notwithstanding a general global stance ofthe dataset (as described in Sections 2 and 3), this unique dataset constitutesstill the most complete dataset available on the history of intellectuals albeit inthe broad strokes of a master narrative.In this study, we o↵ered a network methodology to analyze the history of intel-lectuals. We provided a detailed description of the process of creating, enrich-ing, and preparing an extracted dataset from YAGO with SPARQL, and how tocreate longitudinal networks of such data based on a global periodization. Weinvestigated the community formation processes of scholars in time and devel-oped a method to evaluate the quality of resulting communities by taking theirdiversity into account. The community detection helps to understand the ge-nealogy of scholars, and the variety of relational influence, and provides a meansto computationally identify schools of thought. We traced the evolution of thesecommunities as a dynamic process throughout time and di↵erentiated between
29. Wikipedia grows by approx. 1,500 articles per day and o↵ers an unparalleled quickpotential correctional prowess of an average of 1,9 edits per second (Wikipedia).
27

154 dynamic communities of size 4 or greater, and tracked the continuation andmerge of communities throughout their evolution, as well as their similarity ineach time step. We described exemplary the mechanisms and characteristicsof their development based on the largest merging community in the dataset,exemplifying the change in core groups and floating members.These approaches helped to bring more quantitative/computational evidencefor some assumptions derived from qualitative research, and o↵er the potentialfor further falsification. In order to achieve this potential, a more “fine grained”database would be necessary. As the above analyses iterate the abstract “broadstroke” representation in YAGO/Wikipedia, ideally we would like to broadenthe database to include a representative and global outlook, and apply the estab-lished methodology of analyzing the YAGO network on a more “fine grained”influence network that takes more than the most important influences of themost important scholars into account. This could be based on a selection ofprimary sources from within intellectual history, which we would like to eval-uate di↵erences and insights on the dynamics of intellectual influences, and tocompare those with the results of the extracted YAGO3 dataset. A communityanalysis based on a more fluid interpretation of the disciplines of each scholar,taking multiple heterogeneous disciplines into account, would elevate on the ro-bustness of the formation of computationally detected communities. There, wewould like to add on this study in an extended in-depth analysis of the var-ious interrelations of the core groups these communities consist of, and theirinteractions (and exchange) with other communities.
References
Anderka, Maik. 2013. “Analyzing and predicting quality flaws in user-generatedcontent: the case of Wikipedia.” PhD diss., Professur Content Management/Web-Technologien. Faculty of Media. Bauhaus University Weimar. https://doi.org/10.25643/bauhaus-universitaet.1977.
Baring, Edward. 2016. “Ideas on the Move: Context in Transnational IntellectualHistory.” Journal of the History of Ideas 77 (4): 567–587. issn: 1086-3222.https://doi.org/10.1353/jhi.2016.0031. https://muse.jhu.edu/article/635628.
Berkey, Jonathan P. (1992) 2014. The Transmission of Knowledge in MedievalCairo: A Social History of Islamic Education. Princeton University Press.
Bizer, Christian, Jens Lehmann, Georgi Kobilarov, Soren Auer, Christian Becker,Richard Cyganiak, and Sebastian Hellmann. 2009. “DBpedia - A Crys-tallization Point for the Web of Data.” Web Semant. (Amsterdam, TheNetherlands) 7 (3): 154–165. issn: 1570-8268. https://doi.org/10.1016/j.websem.2009.07.002. http://dx.doi.org/10.1016/j.websem.2009.07.002.
Blondel, Vincent D, Jean-Loup Guillaume, Renaud Lambiotte, and EtienneLefebvre. 2008. “Fast Unfolding of Communities in Large Networks.” Jour-nal of Statistical Mechanics: Theory and Experiment 10:P10008. https://doi.org/10.1088/1742-5468/2008/10/p10008.
28

Bohlin, Ludvig, Daniel Edler, Andrea Lancichinetti, and Martin Rosval. 2014.“Community Detection and Visualization of Networks with the Map Equa-tion Framework.” In Measuring Scholarly Impact : Methods and Practice,3–34. isbn: 978-3-319-10377-8. https://doi.org/10.1007/978-3-319-10377-8.
Boujlaleb, Loubna, Ali Idarrou, and Driss Mammass. 2017. “Tracking Com-munity Evolution in Social Networks.” Journal of Theoretical and AppliedInformation Technology 95 (22): 6127–6137.
Burke, Peter. 2000. A social history of knowledge. From Gutenberg to Diderot.Cambridge: Polity Press.
Cushing, James. 1998. Philosophical concepts in physics: the historical relationbetween philosophy and scientific theories. Cambridge University Press. https://doi.org/https://doi.org/10.1017/CBO9781139171106.
Dahmen, Silvio, Ana. Bazzan, and Robert Gramsch. 2017. “Community De-tection in the Network of German Princes in 1225: A Case Study.” InComplex Networks VIII, edited by Bruno Goncalves, Ronaldo Menezes,Roberta Sinatra, and Vinko Zlatic, 193–200. Cham: Springer InternationalPublishing. isbn: 978-3-319-54241-6.
Dakiche, Narimene, Fatima Benbouzid-Si Tayeb, Yahya Slimani, and KarimaBenatchba. 2019. “Tracking community evolution in social networks: A sur-vey.” Information Processing & Management 56 (3): 1084–1102.
Duke University Libraries. Project Vox. https://projectvox.library.duke.edu/%20[Accessed%202020-09-12].
Edelstein, Dan. 2016. “Intellectual History and Digital Humanities.” ModernIntellectual History 13 (1): 237–246.
Edelstein, Dan, Paula Findlen, Giovanna Ceserani, Caroline Winterer, and NicoleColeman. 2017. “Historical Research in a Digital Age: Reflections from theMapping the Republic of Letters Project.” The American Historical Review122 (2): 400–424. issn: 0002-8762. https://doi.org/10.1093/ahr/122.2.400.https://academic.oup.com/ahr/article/122/2/400/3096208.
Fernandez Riva, Gustavo. 2019. “Network Analysis of Medieval ManuscriptTransmission. Basic Principles and Methods.” Journal of Historical Net-work Research 3:30–49.
Fortunato, Santo. 2010. “Community Detection in Graphs.” Physics Reports486 (3): 75–174. issn: 0370-1573. https://doi.org/https://doi.org/10.1016/j.physrep.2009.11.002. http://www.sciencedirect.com/science/article/pii/S0370157309002841.
Ghawi, Raji, Cindarella Petz, and Jurgen Pfe↵er. 2019. “‘On the Shoulders ofGiants’, Analysis of a Social Network of Intellectual Influence.” In SixthInternational Conference on Social Networks Analysis, Management andSecurity (SNAMS), Granada, Spain, 248–255. https://doi.org/10.1109/SNAMS.2019.8931821.
29

Ghawi, Raji, and Jurgen Pfe↵er. 2019. “Mining Social Networks from LinkedOpen Data.” In Graph-Based Representation and Reasoning, edited by Do-minik Endres, Mehwish Alam, and Diana Sotropa, 221–229. Cham: SpringerInternational Publishing. isbn: 978-3-030-23182-8.
. 2020. “Extraction Patterns to Derive Social Networks from Linked OpenData Using SPARQL.” Information 11 (7): 361. https://www.mdpi.com/2078-2489/11/7/361.
Girvan, Michelle, and Mark Newman. 2002. “Community Structure in Social andBiological Networks.” Proceedings of the National Academy of Sciences 99(12): 7821–7826. issn: 0027-8424. https://doi.org/10.1073/pnas.122653799.
Goldman, Harvey. 1994. “From social theory to sociology of knowledge and back:Karl Mannheim and the sociology of intellectual knowledge production.”Sociological Theory, 266–278.
Gordon, Peter E. 2013. “What is Intellectual History? A Frankly Partisan Intro-duction to a Frequently Misunderstood Field.” http://projects.iq.harvard.edu/files/history/files/what is intell history pgordon mar2012.pdf.
Gramsch-Stehfest, Robert. 2020. “Community detection and structural balance.Network analytical modelling of political structures and actions in the Mid-dle Ages.” In The Power of Networks. Prospects of Historical Network Re-search, edited by Florian Kerschbaumer, Linda von Keyserlingk-Rehbein,Martin Stark, and Marten During, 37–55. London New York: Routledge.
Greene, Derek, Donal Doyle, and Padraig Cunningham. 2010. “Tracking theEvolution of Communities in Dynamic Social Networks.” In Proceedings ofthe 2010 International Conference on Advances in Social Networks Analysisand Mining, 176–183. ASONAM ’10. USA: IEEE Computer Society. isbn:9780769541389. https://doi.org/10.1109/ASONAM.2010.17.
Haakonssen, Knud, and Richard Whatmore. 2017. “Global possibilities in in-tellectual history: a note on practice.” Global Intellectual History 2 (1):18–29. issn: 2380-1883. https://doi.org/10.1080/23801883.2017.1370248.https://doi.org/10.1080/23801883.2017.1370248.
Hagberg, Aric A., Daniel A. Schult, and Pieter J. Swart. 2008. “Exploring Net-work Structure, Dynamics, and Function using NetworkX.” In Proceedingsof the 7th Python in Science Conference, edited by Gael Varoquaux, TravisVaught, and Jarrod Millman, 11–15. Pasadena, CA.
Harris, Steve, and Andy Seaborne. 2013. “SPARQL 1.1 Query Language.” W3CRecommendation, http://www.w3.org/TR/sparql11-query.
Hennig, Marina, Ulrik Brandes, Jurgen Pfe↵er, and Ines Mergel. 2012. StudyingSocial Networks: A Guide to Empirical Research. Campus Verlag.
Holme, Petter, and Jari Saramaki. 2019. “A Map of Approaches to TemporalNetworks.” In Temporal Network Theory, edited by Petter Holme and JariSaramaki, 1–24. Computational Social Sciences. Cham: Springer Interna-tional Publishing. isbn: 978-3-030-23495-9. https://doi.org/10.1007/978-3-030-23495-9 1. https://doi.org/10.1007/978-3-030-23495-9 1.
30

Huisman, Mark, and Tom A. B. Snijders. 2003. “Statistical Analysis of Longi-tudinal Network Data With Changing Composition.” Sociological Methods& Research 32 (2): 253–287. https://doi.org/10.1177/0049124103256096.
Kramer, Katrina. 2019. Female scientists’ pages keep disappearing from Wikipedia– what’s going on? https : / /www . chemistryworld . com/news / female -scientists - pages - keep - disappearing - from - wikipedia - whats - going - on /3010664.article.
Kudella, Christoph. 2019. “How do we model the Republic of Letters? WithContributions from Neil Je↵eries.” In Reassembling the Republic of Lettersin the Digital Age. Standards, Systems, Scholarships, edited by HowardHotson and Thomas Wallnig, 41–53. Gottingen University Press. https ://doi.org/10.17875/gup2019-1146.
Leskovec, Jure, Kevin J. Lang, Anirban Dasgupta, and Michael W. Mahoney.2008. Community Structure in Large Networks: Natural Cluster Sizes andthe Absence of Large Well-Defined Clusters. arXiv: 0810.1355 [cs.DS].
Lovejoy, Arthur O. 1936. The Great Chain of Being: A Study of the History ofan Idea. Harvard University Press.
Lutz-Bachmann, Matthias. 2003. “Die Vielheit des Wissens und das neue Konzeptvon Wissenschaft. Zu den epistemologischen Voraussetzungen der Wissensrev-olution im 12. Jahrhundert.” In Wissenskulturen. Beitrage zu einem forschungsstrate-gischem Konzept, edited by Johannes Fried and Thomas Kailer, 133–140.Berlin: Akademie Verlag.
Mahdisoltani, Farzaneh, Joanna Biega, and Fabian M. Suchanek. 2015. “YAGO3:A Knowledge Base from Multilingual Wikipedias.” In CIDR 2015, SeventhBiennial Conference on Innovative Data Systems Research, Asilomar, CA,USA, Online Proceedings. http://cidrdb.org/cidr2015/Papers/CIDR15%5C Paper1.pdf.
Manola, Frank, and Eric Miller. 2004. “RDF Primer.” W3C Recommendation.
McPherson, Miller, Lynn Smith-Lovin, and James M Cook. 2001. “Birds of aFeather: Homophily in Social Networks.” Annual Review of Sociology 27(1): 415–444. https : //doi . org /10 . 1146/annurev . soc . 27 . 1 . 415. eprint:https://doi.org/10.1146/annurev.soc.27.1.415. https://doi.org/10.1146/annurev.soc.27.1.415.
Merchant, Carolyn. 2008. ““The Violence of Impediments”: Francis Bacon andthe Origins of Experimentation.” Isis 99 (4): 731–760.
Moyn, Samuel, and Andrew Sartori, eds. 2013. Global Intellectual History. NewYork: Columbia University Press. isbn: 978-0-231-53459-8.
Newcomb, Theodore M. 1961. “The Acquaintance Process as a prototype ofhuman interaction.”
Osterhammel, Jurgen. 2006. “Uber die Periodisierung der neueren Geschichte(Vortrag in der Geisteswissenschaftlichen Klasse am 29. November 2002),”edited by Berlin-Brandenburgische Akademie der Wissenschaften, 10:45–64. Berichte und Abhandlungen. Berlin: Akademie Verlag.
31

Pesic, Peter. 2014. “Francis Bacon, violence, and the motion of liberty: TheAristotelian background.” Journal of the History of Ideas 75 (1): 69–90.
Petz, Cindarella, Raji Ghawi, and Jurgen Pfe↵er. 2020. “A Longitudinal Anal-ysis of a Social Network of Intellectual History.” CoRR abs/2009.03604.arXiv: 2009.03604 [cs.SI]. https://arxiv.org/abs/2009.03604.
Pot, Johan Hendrik Jacob van der. 1999. Sinndeutung und Periodisierung derGeschichte. Eine systematische Ubersicht der Theorien und Au↵assungen.Leiden Boston Cologne: Brill. isbn: 978-90-04-11605-4.
Prud’hommeaux, Eric, and Andy Seaborne. 2008. “SPARQL Query Languagefor RDF.” W3C Recommendation, http ://www.w3.org/TR/sparql11-query.
Qiu, Baojun, Kristinka Ivanova, John Yen, and Peng Liu. 2010. “Behavior evo-lution and event-driven growth dynamics in social networks.” In 2010 IEEESecond International Conference on Social Computing, 217–224. IEEE.
Ringer, Fritz. 1990. “The intellectual field, intellectual history, and the sociologyof knowledge.” Theory and society 19 (3): 269–294.
Skinner, Quentin. 1969. “Meaning and Understanding in the History of Ideas.”History & Theory 8.
Snijders, Tom, Gerhard G. Bunt, and Christian Steglich. 2010. “Introductionto Actor-Based Models for Network Dynamics.” Social Networks 32:44–60.https://doi.org/10.1016/j.socnet.2009.02.004.
Stephenson-Goodknight, Rosie. 2016. Viewpoint: How I tackle Wiki gender gapone article at a time - BBC News. Accessed 2020-09-12. https://www.bbc.com/news/world-38238312.
Subrahmanyam, Sanjay. 2015. “Global Intellectual History Beyond Hegel andMarx.” History and Theory 54 (1): 126–137. issn: 1468-2303. https://doi.org/10.1111/hith.10746. https://onlinelibrary .wiley .com/doi/abs/10.1111/hith.10746.
. 2017. “Beyond the usual suspects: on intellectual networks in the earlymodern world.” Global Intellectual History 2 (1): 30–48.
Suchanek, Fabian M., Gjergji Kasneci, and Gerhard Weikum. 2007. “Yago: ACore of Semantic Knowledge.” In Proceedings of the 16th InternationalConference on World Wide Web, 697–706. WWW ’07. Ban↵, Alberta,Canada: ACM. isbn: 978-1-59593-654-7. https://doi.org/10.1145/1242572.1242667. http://doi.acm.org/10.1145/1242572.1242667.
Viseur, Robert. 2014. “Reliability of user-generated data: The case of biograph-ical data in Wikipedia.” In Proceedings of The International Symposium onOpen Collaboration, 1–3. https://doi.org/10.1145/2641580.2641581.
Vugt, Ingeborg van. 2017. “Using Multi-Layered Networks to Disclose Booksin the Republic of Letters.” Journal of Historical Network Research 1 (1):25–51. issn: 2535-8863, accessed 2020-04-15. // jhnr .uni . lu/ index .php/jhnr/article/view/7.
32

Wickberg, Daniel. 2001. “Intellectual History vs. the Social History of Intellec-tuals.” Rethinking History 5 (3): 383–395. issn: 1364-2529. https://doi.org/10.1080/13642520110078505. https://doi.org/10.1080/13642520110078505.
Wikipedia. Wikipedia:Statistics. Page Version ID: 977514767. https://en.wikipedia.org/w/index.php?title=Wikipedia:Statistics&oldid=977514767%20[Accessed%202020-09-10].
. Wikipedia:WikiProject Women in Red. Page Version ID: 977332878.https://en.wikipedia.org/wiki/Wikipedia:WikiProject Women in Red%20[Accessed%202020-09-12].
33


Chapter 6
Discussion
6.1 Becoming DH
6.1.1 Discourses of subjectivisation
The constant discussions on what belongs to the digital humanities, the negotiation of
their framework(s) and place within the established disciplines and in the institutional-
ized academia – be it either in permanent and temporary institutions – we can consider
a “discourse of subjectification” (“Subjektivierungsdiskurs”) following the conception of
Foucault ([1969] 1973). The discussions on the nature and place of the DH act as a
means to formally establish their disciplinary independence, and as such a means for
agency.
Foucault interpreted the participation in discourses as “practices of subjectification”
(“Praxis der Subjektivierung”). The individual participates in a discourse that revolves
around power (i.e. shaping the acceptable content in negotiation processes) and position
(i.e. the integration vs. opposition to the group of discourse), which allows a means of
agency of the individual. Foucault regarded the membership in these discourses in as
a form of reduction of complexity: Participation practices are based on time-dependent
epistles (the so-called “truths,” that are subject to change in time), and are structured
by a distinct set of rules (practices called “technologies of self”), which set the possible
range of behavior in the discourse, thus providing finite limits to complex interactions,
hence reduce complexity.1 In his later work, Foucault differentiated more on the possible
degrees of surrender of the subject to the discourse, taking more variation in behavior
into account.
We argue that many discussions in the DH can be characterized as discourses of
subjectification – specifically in the discussions on their definition – in order to become
a subject in the Foucauldian sense, establishing a means of agency. This process thus
enables the DH to become an independent field, of which individuals position themselves
1. A common example of these “technologies of self” in the social sciences would be practices of
masculinity that allow an individual to be perceived as a man. In the context of this thesis, “technologies
of self” entail what belongs to the digital humanities, which kind of methods are part of this, how these
methods are supposed to be applied, etc. These practices are subject to constant calibration in the
discourse community, and as such submitted to change.
163

Chapter 6 Discussion
to be a part. The specific practices of subjectification of individuals in this discourse
would then entail e.g., publishing in specific DH journals, participating in discussions on
DH, or declaring to belong to the DH community as a ‘Digital Humanist’, with which
the individual researcher becomes part of the DH discourse(s) and therefore subject
themselves to a distinct set of rules, such as research behavior.
Foucault pointed to the changing epistles in the discourses, which are evident as well
in the discourses of DH. So far, no unified answer–or singular practice in the Foucaldian
sense–has been found in the last decades that would yet remain uncontested. Instead,
these are subjected to a high degree of change, following the Foucauldian idea of constant
calibration of practices in negotiation process within the subjectification discourses.
6.1.2 On the need to define DH – Differentiation and definiteness
The continuing disagreements on a unifying definition of the DH or on common frame-
works resulted in a multitude of different (and changing) research approaches, research
objects, and fields of study.
Addressing the heterogeneity of the DH, the term of the“big tent” was coined2: all
digitizing and digitalizing advances in the humanities are part of the DH in a maximum
inclusive or even “ecumenical” way (Terras 2011). It was argued that a concise definition
of the DH would neither be necessary nor feasible, and that it could endure the tension
of the heterogeneity of the multitude of fields, concepts, ideas, methods, and approaches,
and ultimately, its indefiniteness (see e.g., Mathew Kirschenbaum 2014, p. 59; Nyhan
and Flinn 2016) or “definitional openness” (Ernst 2015, p. 1). Instead, the DH were
interpreted as a “phenomena” (Sahle 2015, p. 55) or “intersection” (Baum and Stacker
2015, p. 4) of digital technology, computational prowess, and the humanities disciplines
(Terras 2011; Thaller 2017b).
This “big tent”-perception of the DH was heavily criticized: a clear grasp on the
status of DH would be necessary to stake the field, and its position within academia.
“If everyone is a Digital Humanist, then no-one is really a Digital Humanists,” Terras
(2011) criticized the overly inclusive and generalist stance on the DH. This criticism was
fueled also by science-political considerations, such as to secure funding, a permanent
place within the academia, and a sustained permanence of professional positions and
non-temporary institutions in a situation of increasingly shrinking funding and financial
cuts in the humanities’ departments, and alternative career paths of the “alt-ac” tra-
jectories of unsecured part-time employment (ibid.; Nyhan et al. 2013, p. 1; Sahle 2015;
Piotrowski 2020, pp. 2, 13; Jannidis 2019, p. 70). In contrast to this assertion, Matthew
Kirschenbaum (2012) called it a “tactical” decision to consider everything digital as
part of the DH to opportunistically secure funding more easily (compare also Baum and
Stacker 2015, p. 7). Similar also voiced this Gerhard Wolf (quoted in Nerbonne 2015,
2. Attributed to have been used first by Pannapacker at the conference of Alliance of DH Organizations
(ADHO) at Stanford University in 2011 (Crymble 2021, p. 6).
164

6.1 Becoming DH
p. 33): dispensation of funding would favor the digital or computational application in-
stead of a more traditionally-minded one; as such embracing a digital methodology can
be interpreted to provide an attempt to escape the “chopping block” (Zelizer 2013).
Many attempts3 have been made to find a common definition of the DH intended to
counteract the danger of a meaningless umbrella term (see e.g., Matthew Kirschenbaum
2012; Terras 2011, 2013), which led to both the differentiation in more sub-fields and
model interpretations, but also to the abandonment of finding a common definition. Still
in 2021, Crymble (p. 5) argued that the different strands within the DH are inconsolable
as for their “different research realities.”
This development of not necessarily needing a unified definition was interpreted as
a testimony to the greater “self-consciousness,” independence and general disciplinary
security of the field (Konig 2021, p. 40), which led to abandon the earlier need for
justification of the new digital perspectives. This security stems from the ongoing pro-
fessionalization and institutionalization of the DH in the physical academic landscape,
even though these institutions are usually in the non-traditional and impermanent form
of focus groups or centers as well as temporary academical positions.4 Instead since
around the mid-2010s, the DH discourses focus more on establishing best research prac-
tices and applications.
Definiteness. In parallel, the perceived “big tent” of DH tended to split up: increas-
ingly the DH are differentiated into separate and more specialized sub-fields. This
catered to the wish for a more definitive grasp on the goals, outlooks, and specific
approaches of digital research, i.a. a distinct set of research rules, and to reverse the
meaninglessness of a term too broad. Examples for this are the exclusion strategy of
computational lingusitics and corpus linguistics to be regarded a separate discipline
from the DH5 (Sahle 2015, p. 54; Baum and Stacker 2015, p. 7), or the tendency of new
field and sub-fields emerging from replacing the adjective ‘digital’ with ‘computational’.
Computational history emerged from digital history; the former stressing a different
research focus on computational methodology in contrast to the perceived main occupa-
tion with digitization of sources and their online presentation of the digital history. In
the broader DH, similar developments show up recognizing a computational humanities
as a distinct discipline from the DH, as seen in a recent surge in activity ranging from
seminars and workshops, such as e.g., the “Dagstuhl-Seminar” on Computational Hu-
manities (Biemann et al. 2014, p. 81); or the change in focus at Heidelberg University
from hosting the “1st Summer School of Digital Humanities” in 2017 first6, which was
then succeeded with the “2nd Computational Humanities Summer School” in 20197; the
3. Compare to section 2.1.4. Compare to chapter 2 on “DH as an independent discipline vs. sub-field.”5. Or, humanities computing as this started already in the 1980s, compare to section 2.2.6. https://www.uni-heidelberg.de/fakultaeten/theologie/forschung/distant-reading/programm.html7. https://hch19.cl.uni-heidelberg.de/
165

Chapter 6 Discussion
“Computational Humanities Research Workshop”8 in 2020 alongside a discourse forum9
of the same name; or arguments for the further sub-differentiation of the computational
humanities as either focusing on applied or theoretical advances (Piotrowski 2020; sim-
ilarly, also Jager and Winckler 2013 argue for a separate discipline). Famously, Franco
Moretti–the “father” of distant r’eading–is quoted Hackler and Kirsten (in 2016, p. 5) as
supporting this development of differentiation by criticizing the unilateral usage of the
term DH:
“I use it only because everybody uses it [...]. But, frankly, I don’t like it.
I think it means nothing, whereas ’quantitative’ and ’computational’ means
something.”
Despite these developments the vast majority of the DH are still predominantly con-
cerned with digitization, whereas only a minority can be considered part of the compu-
tational or “numerical humanities,” as Roth (2019, p. 12) ascertained in a study on the
focus of recent publications in the DH.
Petitioning for an alternative approach for more definiteness while staying within the
‘big tent’ of DH, Crymble (2021, pp. 7, 44, 161) suggested for a more distinct language
in order to identify the different strands within the DH, their unique approaches, and
“different intellectual aims.” Addressing specific professions such as e.g., (digital) editors,
(digital) archivists, digitizers, computational analysts, and more, would properly reflect
on the stark differences in their “research realities” beyond specific sub-fields (ibid., p. 5).
6.1.3 Historicity of DH discourses – History on repeat
These on-going discussions and issues of the DH have to be historicized10 and contextu-
alized as part of constant reform and innovation in the humanities–following the familiar
aphorism “Those who cannot remember the past are condemned to repeat it” written
by the philosopher George Santayana ([1905] 2011, p. 172). “Considering that history as
a modern academic discipline and profession arguably dates back to the second half of
the nineteenth century, it follows that ‘digital history’ has been a part of the practice of
doing history for a substantial period of time and is certainly less new than the current
buzz surrounding digital humanities (DH) might suggest,” argued Zaagsma (2013, p. 4).
In 1966, William O. Aydelotte published a rebuttal on the criticism brought forward
against quantitative history, that targeted its limited applicability11, the dichotomous
extremes of either trivial or revolutionary results in falsification or replication studies
8. https://2020.computational-humanities-research.org/cfp/9. https://discourse.computational-humanities-research.org/
10. Crymble made this point one of the core arguments in the monograph “Technology and the Histo-
rian”, published only in mid-2021.11. Due to the nature of historical sources as fuzzy or unreliable (Aydelotte 1966, pp. 805, 811, 820).
166

6.1 Becoming DH
that could revise previously conventional knowledge (Aydelotte 1966, p. 820)12 and the
erroneous methodological application and spurious interpretation of results due to the
lack of adequate education of historians in statistics – from the side of the applicants
(“dilletantism”) as well as of the readers (Reynolds 1998, pp. 146-7).
The points brought forward by William O. Aydelotte in 1966 mirror discussions still
seen 60 years later, and proof to be still up-to-date when replacing the word ‘quantita-
tive’ with ‘digital’: the fear of traditional history that the quantitative might replace the
qualitative methodology13, and concerns about the missing adequate education of a new
generation of historians in statistics. Aydelotte (1966, p. 804) bemoaned that cliometrics
possibly “has been pushed too far,” as the fundamental knowledge of quantitative meth-
ods and statistics were not widespread enough in the historical studies. Therefore, there
is not enough mathematical foundation to prevent wrongly used techniques due to lack
of knowledge resulting in erroneous studies (ibid., pp. 809–10), or the ever prominent
believe in numbers14 (ibid., p. 812), and the assumption that it would be possible to
give “proof with figures” (ibid., p. 816), or that a quantitative approach would be more
accurate per se even if not employed thoroughly and sensibly (compare to ibid., p. 811).
This general lack of statistical knowledge (the “training gap”, Anderson 2007) would not
prevent spurious interpretation of numbers and figures from both the side of the appli-
cator and the side of the reader. This puzzled Aydelotte (1966, p. 804) as quantitative
assumptions are to be found almost everywhere, e.g.,“implicitly in any generalization.”
He criticized the “hostility” of more traditional scholarship15 regarding the feasability,
reliability, and general usefulness of quantitative methods (ibid., p. 809). At the same
time, Aydelotte (1966, p. 824) described the same “starry-eyed” fascination with the
possibilities of the quantitative methods , and suggested the advantages of quantitative
analysis of a (proto-) ‘big data’-like amount of historical sources, offering greater ob-
jectivity and accuracy using the then-modern tool of punch cards, identifying fruitful
research questions, and mining the “gold [...] still near the surface.” “Such manipula-
tions of the data would take an immense amount of time to do by hand, but ordinarily,
they can readily be performed by machines,” Aydelotte (1966, p. 806) summarized.
12. Aydelotte (1966, pp. 807, 815) mentioned in this context the study on the importance of infrastruc-
ture for the industrial advancement of the US by Fogel (1964), that challenged the “conventional wisdom
on the centrality of railroads” and highlighted that “canals would have also succeeded as a transportation
system” (Anderson 2007, pp. 247–8)13. “There is no single methodology in history,” tried Aydelotte (1966, p. 804) to rebut such concerns
as e.g. voiced by Reynolds (1998, p. 147) (much later) that the increased interest from the social sciences
would lead to replace historians.14. Following the reprimand by S. B. Warner ([1962] 1978, p. 173) that the “past tendency to [...]
accept statistics as prima facie fact must be abandoned.” Instead he advises to use “cross-information”
to assess the “reliance [...] place[d] upon a given set of statistics” (ibid., p. 174).15. As e.g., a commentary by Arthur Schlesinger Jr. (1962, p. 770) that “[a]lmost all important questions
are important precisely because they are not susceptible to quantitative answers.” As well as the reference
to the “dubious reputation” of cliometricians described by Reynolds (1998, p. 141) resulting in their
distance from the general field of history,
167

Chapter 6 Discussion
Contemporary discussions mirror these historical ones in a fashion of history on repeat,
while many of these remarks concerning the limitations and reservations of the machine-
based methodology still persist. This repeats also in more current discussions. In the
late 1980s, the necessity for “computing humanists to learn to program” was critically
discussed, characterized by “anxiety over which direction that should take if needed”,
as noted Black (2010) on a re-reading of mails traded on the HUMANIST BITNET list
server from 1987 (see also Hockey 2004, p. 9). Black (2010) expressed surprise on the
familiarity of the issues brought forward then.
Differences pertain in the scope of feasible future research enterprises. Avner Greif
(1997, p. 400) purported in the late 1990s new possibilities for cliometrics using com-
puters, in “cross-section studies” using longer timeframes and “data sets that could not
have been assembled or analyzed before.” This was similarly voiced since the 2010s on
the prospects of big data research (e.g., in “Exploring Big Historical Data. The Histo-
rian’s Macroscope” by Graham et al. 2016; see also Crymble 2021, p. 26) and shows the
ever changing perspectives on what is to be considered big and feasible, as well as which
methods would be best suitable for this. Ironically, the question of establishing a mathe-
matical foundation in humanities’ (especially historical) students remains unsolved since
the requests of the early cliometricians.
These outlined points in past discussions show a clear tendency in the DH of being
“unaware that the same points may have been debated” decades before Crymble (2021,
p. 3). The historical contextualization of methodological debates in the past offers a
multiple advantages: this establishes an awareness of past results (and open questions),
situates the new insights in a tradition of past accomplishments (Sula and Hill 2019,
p. 192), avoids the seasonal re-issuing of old debates (criticized as “eternal September”
by Nowviskie 2010), and paves the way for both new and original contributions (Crymble
2021, p. 3). Crymble (2021) argued to place digital history–and consequently DH as
well–into a long “history of technology impact on historical studies” (ibid., p. 2) in order
to actually draw from the experiences of the past, instead of “operating in an eternal
present, both ignoring and being ignored by the histories of the field of which they
should have been a part” (ibid., p. 3). “The key to its future–and in some measure
the future of all the related humanities–is its history. This history we must remember,”
stressed McCarty (n.d.) in the Roberto Busa Award lecture in 2013. This forgetful
historiography of the achievements and reservations of the generations prior is maybe
owed to the outsider status of the computer-based methodology within historical studies’
“disciplinary mosaic” (Fridlund 2020, p. 73). Still, a concise, encompassing critical
historiography of the origins of the digital humanities and digital history remains to be
written, taking into account all of the issues sketched out as part of this thesis.
6.1.4 Theoriezation
Alongside the forgetful historiography of the DH, a general problem in the DH are
their perceived theorylessness. This picks up on the “more hack less yack” debate in
168

6.1 Becoming DH
the 2010s, which heavily focused on the application of methodologies instead of the
theoretical implications and theorization of the DH, reminiscing the proclaimed end of
theories by Felsch (2015) since the 1970s (Radtke 2015). This was heavily criticized:
more methodologies than theories were discussed within the DH (as e.g., Scheinfeldt
2012, p. 125), favoring the “epistemologies of doing and building” as coined by Stephen
Ramsay in a MLA panel in 2011 (Cecire 2011).
Undoubtedly, science theories exist in the DH already, such as e.g. hermeneutics,
which is updated to include a wider variety of and digital sources; as such the critique
on a focus on methodologies instead of a ‘theory of the DH’ provides a “false focus” as
Piotrowski and Fafinski (2020, p. 5) stressed. “[T]heory and digital humanities aren’t
two separate enterprises that my be able to collaborate fruitfully. They are much closer
to being one and the same thing”, as B. M. Schmidt (2011) has argued.
In general, the DH use established theories from humanities’ disciplines (e.g. liter-
ary studies) and apply them to a data source with computer-based methodology, such
“renewing [...] theoretical traditions in humanities research” (ibid.).
The recent search for an again unifying and identity forming theory16 for the DH cul-
minates in various workshops and initiatives, such as e.g., the Workshop“Theorytellings”
organized by the Forum Digital Humanities Leipzig in 202117, or the “AG Digital Hu-
manities Theorie” founded in 201918, and more (e.g., Piotrowski 2020). The question
remains if there are DH-specific theories to be found; or whether the DH automatically
apply and refine theories of other disciplines that they combine interdisciplinary. Es-
tablishing a DH immanent theory would provide further independence of the field, and
provide a way out of the perceived status as an auxiliary science–which has no theories
on its own and offers application as a service only.
Network Theories
Similarly to the general digital humanities, network research is criticized lacking a conclu-
sive theory of social networks (compare to M. Granovetter 1979; Wellman 1983, p. 179).
Despite this assessment, network research is based on assumptions–either explicitly, and
much more often implicitly–why and how people form connections in networks (Fuhse
2010, p. 167). Even though it is not the goal of network research to derive to a sociology
of human nature, these assumptions are still rooted in such sociological concepts. These
greatly influence how network research is analyzing social phenomena that emerge from
structures of social relations of human (and non-human) actors. We want to identify
16. Theories constitute models and feature the premises needed to answer a research questions by
offering a modus operandi. Merton ([1949] 1968) argued that theories should not be applicable in each
and every situation; they could explain a lot, but not everything nor a single phenomena only. Instead,
theories should facilitate the understanding of a broader phenomena, which Merton ([1949] 1968) called
“middle range theories” in contrast to universally applicable theories that he deemed not suitable for
the humanities.17. https://fdhl.info/theorytellings/18. https://dhtheorien.hypotheses.org/
169

Chapter 6 Discussion
three major frameworks of network theories following Fuhse (2020): that of action the-
ory, pragmatist/interactionist theory, and relational sociology, supplemented by White’s
phenomenological relational sociology, and as argued by (Fuhse 2010), system theory.
Sociologists like Gehlen or Luhmann thought of human systems as a form of com-
plexity reduction, producing stability and orientation. This focus on embeddedness in
social networks offers a more interactive perspective in contrast to the more economi-
cal gain oriented approaches by Marx, Bourdieu, or within the rational choice theory
(ibid., p. 173). Phenomenological network theory offers explanations for still heteroge-
nous diverse network contexts, by recognizing the influence of few intensive relationships,
rendering culture (and other systems) a ”tool-kit” of possible social behavior and opin-
ions, of which individuals can draw from creatively (ibid., p. 173). Transactions lead to
the development of hierarchical roles, which serve as orientation of behavior and again
reduce thus social complexity. This provides not a complete new theory on the interre-
lations of humans and interhuman structures, but closely follows empirical research.
While Borgatti and Lopez-Kidwell (2011) suggested to differentiate between effects of
social networks as “network theory” and impacts on networks as “theory of networks,”
these can be regarded as mere recurring patterns/mechanisms in networks but not theory
in the sense of explaining the nature and constitution of networks and their reflection
on social phenomena (Wimmer and Lewis 2010, 139ff; Fuhse 2020).
Fuhse (2010, p. 173) noted that a macro level on society is still missing, as these
theories cover the meso level of structures only. For a theory on the level of societies,
Luhmann theorized that communication transforms these meso structures to bigger so-
cietal structures, while Foucault claims “discourse” results this.
6.2 Impact of the DH
6.2.1 Prospects
The lure of the DH is to ‘update’ traditionally analogue humanities’ methodologies and
approaches to the opportunities of the technological and digital changes. As such the
DH wields the promise of a transformative power:
- The prospect to generate new insights on the research fields of the humanities on
“deeper, less obvious connections” (Sternfeld 2014), latent structures (e.g., Ner-
bonne 2015, p. 35) or invisible trends hidden for the human eye, but detectable
with the help of the computer (Underwood 2014).
- This entails the aspect of being more efficient and saving time: big data sets can
be such analyzed that cannot be covered by an individual researcher in reasonable
time.
- As well as an approach for falsification, re-testing, and refinement of established
knowledge in replication studies (Edelstein et al. 2017, p. 408), increasing the
170

6.2 Impact of the DH
validity of research and testing the robustness of results (Baum and Stacker 2015,
p. 10), and minimizing (or counteracting) the “authority of the wise” few as phrased
by Nerbonne (2015, p. 38),
- suitable to provide new (or at least a change in) perspectives and new answers
and inferences on traditional and new research questions and even well-known
phenomena (a new “historical understanding for a new era,” Sternfeld 2014),
- as well as offer “new avenues of inquiry and [...] springboards for further research”
(Edelstein et al. 2017, p. 409),
- utilizing a large scale of sources “in a much broader space of possibilities” (ibid.,
p. 420), making “previously impossible or implausible research” approachable (Mil-
ligan 2013, p. 1).
- This bears the potential of innovation in the respective fields, and
- ultimately advances domain specific knowledge,
- and furthers a methodological awareness that “force[s] us to look closely at the in-
formation we have” and that information taken “for granted” (Edelstein et al. 2017,
p. 408).
These promises require new “frameworks” of thinking (Sternfeld 2014) in order to ensure
that the implications of the digitally-framed research are understood “as fully as possi-
ble” (Ayers 1999, p. 8), and to be made applicable for the humanities (Thaller 2017a,
p. 16). Part of these frameworks are the various forms of literacies have to be counted:
data literacy, computational literacy, and in general an updated digital hermeneutics
that includes analogue and digital sources.19
Similar promises have been made for the gains of applying a network methodology
on humanities’ research objects: the potential for innovation, and the flexibility that
a relational perspective offers to both reduce complexity (in an abstract view on an
object of research), but also to grasp a certain complexity in analysis (Stegbauer and
Haußling 2010b; During et al. 2016; During et al. 2020). In general, the complexity of
a research object can be reduced in network analysis by focusing only on specific parts
of relations of entities, and provide an abstract view in the form of a model of relations.
But this complexity can be enhanced or better differentiated, too. In order to increase
the validity of the results, it is possible to add more layers of metadata to the edge
relations: by discerning between different types and qualities/qualitative assessments
of relations, ranges of assuredness in regards to the factuality of an edge, as well as
the temporal evolvement20 of relationships. A relational perspective could thus bridge
19. See section 6.3.1.20. Such as e.g., in novel forms of modeling in layers of time to show temporal developments of succes-
sion and sequences (Baum and Stacker 2015, p. 10).
171

Chapter 6 Discussion
differences between theory and empiricism, the micro and the macro perspective, and
could bridge gaps between structural and performance levels (Stegbauer and Haußling
2010a, p. 14), and might consolidate and generalize heterogeneous methodologies from
the communities themselves (Rehbein 2020, pp. 256-7).
6.2.2 Criticism
These aforementioned promises in DH, digital history, and HNR are summoned again and
again, usually characterized by a language full optimism and pathos. The promise for
greatness is often perceived to have fallen short–“over-promised and under-delivered”
(Arguing with Digital History working group 2017, p. 2)–, and has attracted lots of
criticism: The DH would not ‘save’ the humanities (Kirsch 2014; Keeney 2016; Koh
2018; Hohls 2018, A.1-20–21; Piotrowski 2020, p. 3), the constant conjuration of new
insights within the “revolution rhetorics” of the “apostles of the ‘big data revolution”’
(Fickers 2020) would be bordering close to magical thinking.
“[W]hy should new methods produce radically different results? We are studying the
same objects that scholars have been painstakingly exploring for hundreds of years,”
asked Edelstein et al. (2017, p. 408). This rhetorical question picked up on the general
resistance against new tools and methods, which are met with skepticism and criticism21
until they are eventually accepted into mainstream (Rehbein 2018, p. 33). Hiltmann et
al. (2021, p. 123) tried to explain the resistance to the digital turn due to it coming
from “outside” (i.e., computer science) unlike the “internal” turns before from within
humanities, e.g., the cultural or the linguistic turn, among many more turns (compare
to Bachmann-Medick 2016).
6.2.3 Keeping promises
At the same time, these promises (especially on new insights on humanities’ research
objects) are perceived as requisite for the successful acceptance of the digital or computa-
tional methodology in the broader humanities and of the field of DH itself, as Nerbonne
(2015, p. 32) pointed out. Therefore the questions stands: Did the DH manage to fulfill
their promises?
Transforming humanities’ research. The promise for reformation of the humanities
through technology goes back to at least the 1970s.22 Then, the transformative power
of technologically assisted scholarship was described as “more convenient” and as funda-
mentally changing the possible scope of research (Wulf 1997, p. 111). It would change the
21. Compare to sections 6.1.3 and 6.3.2.22. And actually even further. The topos of transformation of scholarship via technology can be traced
back centuries. One of the most influential technological innovations in this regard was the invention of
the printing press (Eisenstein 1979).
172

6.2 Impact of the DH
“representation of and access to information,” allowing it “to organize kinds and quan-
tities of information that weren’t possible [before], hence to ask and answer questions
about the human record that couldn’t be answered before” (ibid., p. 111).
On the one hand, the promises on transforming research came true: the humanities
(alongside all other areas of research, and life in general) were fundamentally changed
by the digital revolution in the digital age23 and the vast possibilities of the ever-present
personal computers and the internet (e.g., Nerbonne 2015, p. 31; Arguing with Digital
History working group 2017, p. 12; Guldi 2020, p. 328)–the most successful information
technology since the the letterpress printing (Eisenstein 1979), and through the digital-
ization as influential in effect as the industrialization (Bunz 2012). Berry’s argument
goes as far that computer technology changed humanity (and the humanities) similarly
to the domestication of humanity through pen and paper (Latour 1986), which he called
the “computational turn.”
Research practices were irrevocably changed even for ‘traditional’ humanities that
do not consider themselves working digitally.24 This includes the ways information
is retrieved25, stored26, written27, or published28, to name only few instances. The
successful digitization of analogue sources led to a hegemony of online resource citations
in the humanities, and an ongoing replacement of the on-site archive in favor of the
remote (digital) archive (Fridlund 2020, p. 75). This solved many issues of accessibility,
which traditionally restricted or at least hampered humanities’ research, as dependency
on printed editions of primary sources or personal visits to archives aren’t a necessity
anymore when those sources are available digitally29 (Rehbein 2020, pp. 259–60), and
(at least in theory) democratically30.
In this context, the trope of going from “scarcity” to “abundance” of sources (as
coined e.g., by Rosenzweig 2003) through mass digitization is oftentimes referred. The
amount of (analogue) sources however did not change; only their access did. Graham et
al. (2016) argued accordingly that historical studies have always been a big data project
in their core, calling the impression of the scarcity of (historical) sources a myth. Mass
23. Which is considered a new epoch (Schmale 2017; Gugerli 2018, p. 8; Hohls 2018, A.1-1).24. In fact, it is arguable what can be considered ‘traditional’ in the humanities, as new methods and
research perspectives are continuously introduced, and usually met with skepticism at first. Crymble
(2021, p. 162) stressed that there is no stoic traditionalism in the humanities: “Neither can historians
continue to pretend that their field has been left untouched.”25. Key word search in search engine and bibliographic online catalogues instead of surveying physical
finding books in archives or bibliographical catalogues stored in cupboards in libraries.26. Usually digitally instead of in physical copies in order to make them further processable.27. Word processing programs on a personal computer instead of on a typewriter, as well as in solitary
as much as in collaborative ventures, who cooperate through digitally accessible writing formats (see
e.g., Walsh 2017, p. c), or through crowdsourcing efforts such as social editing (see e.g., Price 2016).28. E.g., using Hypertext, multimedia representation, or new publishing formats such as Open Access29. As a side effect, collection differences in memory institutions are blurred in digital supra-collections.
Before, collection habits were divided between libraries (for reprintable serial sources) and archives
(unique sources).30. However practically restricted by various copyright and privacy laws.
173

Chapter 6 Discussion
digitization reversed the access-scarcity to an access-abundance, which still is character-
ized by scarcity, i.e. missing documents, incomplete sources, a general fuzziness of data;
this constitutes a scarcity paradox.
Some authors such as Cohen and Rosenzweig (2005) claimed that already working
with a computer would constitute part of the DH–without needing a conscious reflection
on belonging to the DH community or the epistemic implications of the media used
(compare to Konig 2021, p. 40). Similarly, also Berry (2011, p. 1) regarded the usage of
e-Mails, online search, and virtual bibliographies as part of the successful digitalization
of the humanities through DH. As for the “Clio-Guide. Ein Handbuch zu digitalen
Ressourcen fur die Geschichtswissenschaften”, too, Hohls (2018, A.1-3) referred to the
“Selbstverstandlichkeit” of digital methods in the humanities, but essentially means the
digitization of sources, and changes in writing and publishing behavior through personal
computers.
On the other hand, this transformation of the humanities was not absolute. Despite
the profound changes in common research behavior of searching, finding, and editing,
the digital mediasation of sources and workflows is hardly reflected on in the ‘traditional’
humanities and remains too often “almost methodologically invisible” (Fridlund 2020,
p. 76). The computer serves in an auxiliary position and only assists in the research
workflow, while research itself pertained traditional and analogue methods. Common
problematic behavior entails that the print resource is cited even though the digitally-
accessible version was used (Blaney and Siefring 2017; Arguing with Digital History
working group 2017), thus neglecting the epistemic and source critical implications of
the digital version.
Instead, these changes in research behavior can be regarded as part of the digital turn
in society and general sciences, and not necessarily part of the DH’s influence. It can be
argued that also the DH are a product of this digital revolution (similarly e.g., Fridlund
2020 or Baum and Stacker 2015, p. 4). A distinction has to be made what actually
belongs (not) to the DH as also suggested by Sahle (2015, p. 55), who proposed that
there must be specificity to the DH’s tool of trade. Thus using an Online Public Access
Catalogue (OPAC) for acquiring sources or literature would not constitute part of the
DH. This question on what actually makes a ‘digital humanist’–whether or not this is a
conscious declaration–resonates in the distinction Fridlund (2020) made between “His-
tory 1.0” and “History 2.0.” Characterizing “History 2.0” as a revolutionized digital
or even computational history, Fridlund (2020, pp. 74–76) defined the former as certain
naturalized digital elements that got “domesticated”, “appropriated” or “augmented”–
but which application and influence on the research process is not overly reflected or
even “invisible” (ibid., p. 76), such as online searching, using data bases, or working in
general with a computer. Not every historian is already a ‘digital historian’ even when
using a wide range of computer-assisted indexes, literature portals, and word processing
software (Guldi 2020, p. 328). The familiarity of working in a digitally mediated re-
search framework culminated in the contention by Putnam (2016a, p. 380) that working
174

6.2 Impact of the DH
with online repositories became “as revolutionary as oatmeal.” This however falls short
on the epistemological reflection needed on naturalized digital workflows. Underwood
(2014, p. 64) called online searching, i.a. the “algorithmic mining of large electronic
databases”, a “deceptively modest name for a complex technology that has come to play
an evidentiary role” in how information is accessed.
Following these assertions, only the reflective usage of methodologies or techniques
can be considered part of the DH.
The development of a critical reflection on digital source criticism, digital hermeneu-
tics, and digital and computational methodology and their applications for the human-
ities are certainly part of the merits of the DH.31 These advances, however, remain to
become integrated into the broader humanities. If digital “technology is always already
with us” (Fridlund 2020) and if “computing and the use of digital sources and resources”
are daily tasks of modern humanities academia (Romein et al. 2020, p. 1), then proper
critical disseminations of the workflows using digital resources and computers are re-
quired. A digital hermeneutics (or an inclusive hermeneutics of the analogue and the
digital) for every historians is inevitable. The resulting changes in the “epistemologies
and ontologies that underlie a research program” that Berry (2011, p. 1) had postulated
remain to be acknowledged.
Paradigmatic change on the periphery. Still, the DH, digital history and HNR can
be considered paradigmatic changes in the humanities, historical studies, and network
research respectively (following e.g., Rehbein 2020), and a fundamental media change
(Hiltmann et al. 2021, p. 124). The digital format provided new kinds of data interesting
for humanities’ research, from eased-access retro digitals to born digital objects, social
media data, and metadata, and as Sternfeld (2014) put this,“an extraordinary amount
of visible and hidden information surrounding the text message [...] that conveys a his-
tory unto itself.” Digitization and abundant availability of digital sources led to changes
in the humanities’ methodology in order to deal with this new kind of sources, whose
amounts exceed the limits of human capacity (Nerbonne 2015, p. 36): from “distant
31. Partially, these overlap with developments in the broader sciences, such as new ideas on how to do
science in the digital space like the Open Science/Open Access movement. Their discussions are neither
unique nor solely focused on the DH, but consider all disciplines. The demand for publicly accessible
research outputs (Open Access to both publications and datasets in editable formats), a systematically
documented disclosure of the methodology (Open Methodology) and source-codes used in the scientific
process (Open Source) are part of a different understanding of research in the digital era. This spearheads
research practices that elevate intersubjective testing and comprehensible and wildly accessibly public
dissemination and peer review in a “connected web of scientific knowledge”, that focuses on the quality
of research work and fostering the dispersion of knowledge. Challenges for these developments pose
proprietary classifications, non-exclusive or commercial usage of datasets, and the heterogeneity of Open
Source-codes provided that miss a standardization. Other examples would be the critical code studies,
digital forensics, working with big data, or sociological concepts such as digital divide and participation
gaps (Jenkins et al. 2006), or the differentiation between digital natives and digital immigrants (Prensky
2001).
175

Chapter 6 Discussion
reading” complementing a “close reading” of sources (and variations of “scalable read-
ing”), to network approaches, statistical analysis, new geographical representation and
analysis, and new ways to structure and represent these sources as e.g., in databases and
digital repositories. These new approaches “follow[] a completely different logic than our
established approaches to historical research,” Hiltmann et al. (2021, p. 124) declared,
“thereby alerting the framework of historical scholarship as a whole.” Similarly, this
can be said about the scope of humanities’ research through digital and computational
methodologies.
But the DH’s methodological influence on the humanities still remains peripheral:
Only slowly and sometimes the digital and computational methodologies and digital
hermeneutics are integrated into the humanities’ tools of trade. This development is
juxtaposed by a growing community of DH scholars, and their processing professional-
ization. The way how, e.g., historical research is undertaken did not change profoundly,
as more traditional research questions persevered, even when working with digital sources
or digitally-accessible analogue sources. Dobson (2020) even argued that the humani-
ties’ methodologies remain virtually unchanged. Hohls (2018, A.1-10) remarked, that
promises on the potentials of the digital turn grew “more realistic” as the epistemology
in the humanities did “not [become] completely newly construed.”
Instead, the methodological tool box of the humanities was extended on with new
perspectives, approaches, and ways of thinking, while pertaining a specific humanities’
perspective; their thorough integration though still pending, and remaining the exception
not the rule. Porsdam (2013) and Rehbein (2020) noted that there is no common ground
on “reaching new territory in research” in the opposition between technological ideolo-
gist and critical traditionalists. Reservations pertain about adopting computational or
quantitative-based methodologies in fear of positivism and replacement of qualitative
approaches (compare to section 6.3.2 on “Perceived Division on Methods”). Edelstein
et al. (2017, p. 408) consternated that the humanities as a “field ha[ve] not been revolu-
tionized as a result”; instead it developed more island studies and fields without greater
“repercussions.” “If we look back at what ’history and computing’ has accomplished
the results are slightly disappointing”, Boonstra et al. ([2004] 2006, p. 9) wrote on the
lasting effects of DH’s predecessor, as “[...] ’history’ failed to acknowledge many of the
tools ’computing had come with.” Nonetheless, the broader humanities have been fun-
damentally changed by the ever-present personal computing and the digital revolution,
but more in the matter of a humanities“1.0” as remarked by Fridlund (2020, pp. 74–76)
that had naturalized digital elements without greater reflection.32
In this regard, the DH serve already as an auxiliary science (e.g., Baum and Stacker
2015, p. 5)33, as a “technical support to the ‘real’ humanities” (Berry 2011, p. 3), where
the “machine’s efficiency [is used] as a servant” (McCarty 2009). Milic remarked in 1966,
32. Compare to section 6.2.3.33. Piotrowski and Fafinski (2020, p. 6) argued, that the view of DH as a tool box would “undermine”
its establishment as an independent discipline.
176

6.2 Impact of the DH
p. 4, “we have not yet begun to think in ways appropriate to the nature of this machine.”
The further integration of the new methodologies and as such the possibility of research
otherwise unattainable before (Thaller) is one of the many challenges lying ahead.
Generating new domain-specific insights. The questions stands whether the promises
on new insights due to the discovery of hidden patterns “that would have been difficult,
if not impossible, to reach by analogue means” as e.g., proposed by Edelstein et al. (2017,
p. 404), were fulfilled. Was such domain-specific knowledge generated with computational
and digital methodologies?
The answer to this is manifold, and only some exemplary highlights will be brought
forward here:
- network approaches and efforts to combine various collections of retrodigitals helped
to cast a new understanding on the contacts, distribution, composition, and extent
of the “Republic of Letters.” In a broad series of studies new insights were gener-
ated from debunking the notion of Newton as a solitary working genius (Schaffer
2008), to an assessment of the actual role of English thought and influence on
Voltaire’s philosophy (Edelstein and Kassabova 2020), or reflections on the data
itself as in the compendium by Hotson and Wallnig (2019).
- using a computational approach and analyzing a Protestant letter correspondence
networks in Python, Ahnert and Ahnert (2015b) could shed light on the importance
of prosecuted Protestants for their community during Mary I’s reign in the 16th
century, identifying “trends that only an expert in the field would have a sense
of by reading all the letters, but would still find almost impossible to measure or
quantify” (ibid., p. 30).
- debunking the notion that inefficacy led to Heinrich (VII.) removed from power
by Friedrich II., but instead due to them supporting oppositional political factions
identified with network mapping and community detection approaches (Gramsch
2013; Dahmen et al. 2017; Gramsch-Stehfest 2020).
- text mining approaches brought the identification of authorships, or even language
characteristics for early signs of illness in a body of work, as in the study Identifying
signs of onset dementia in the later work of author Agatha Christie (Lancashire and
Hirst 2009), identifying e.g., gender dynamics and hierarchies in novels (Kraicer
and Piper 2018), using quantitative methods to describe the “invisible editorial la-
bor” of women abolitionists and the role of editing for community formation (Klein
2020, p. 27), or automatically annotating ambiguous concepts such as alchemical
language (Lang 2020).
- an analysis of how much the Gestapo investigations knew about the Stauffenberg–
conspiracy using network approaches (Keyserlingk-Rehbein 2018),
177

Chapter 6 Discussion
- new perspectives on helper’s network organization during the NS-regime (During
2015),
- identifying the underlying pattern of inquiry in the “Great Inquisition” in the
13th century by Dominican monks against Cathar Heresy as “principally aimed at
collecting evidence against village consulates” (Rehr 2019, p. 1).
- falsifying assumptions of the mainly qualitative scholarship on the penal practice
during the Corporate State, as shown in our case study, or highlighting various
levels of importance and interconnections of scholars in a global outlook on a big
history of intellectuals.
- in the collection of case studies edited by Knowles et al. (2014a), mapping the
spatio-temporal developments of the SS Concentration Camps in order to allow
their comparative study (Knowles et al. 2014b), or the 3D reconstruction of Auss-
chwitz in order to study the “tension between the idealized plan and the actualized
built environment, from the ideological goals to the physical realities of implemen-
tation” (Jaskot et al. 2014, p. 165).
Besides these achievements, the accusation remains that the DH (and digital history) did
not contribute to domain specific knowledge enough, that the DH have not yet proven
their worth for innovative discipline-based insights or revolutionary “revision[s] of lasting
tropes in the discipline[s]” (Guldi 2020, p. 337), and that its contribution to research
continue to be phrased in a “[p]erpetual future tense” (Blevins 2016). This is reiterated
as well for network analysis in the humanities as an unfulfilled potential: There are still
many open questions to be explored (Stegbauer and Haußling 2010a, p. 14), and the gain
of historical network research can only by “cautiously addressed” as its possibilities are
not yet fully utilized (Reitmayer and Marx 2010, p. 876), nor fully understood on how the
formalized methodology should actually be applied. Instead an “eclectic” inspiration are
taken from formalized methodological approaches that are enthusiastically adopted but
too often little understood, that in the humanities’ application often remain metaphorical
(ibid., p. 869).
From a methodological point of view, this perceived lack results from a general lack of
computational literacy and methodological understanding in the core humanities, and
missing conceptual grasp on how to operationalize computation-based methods on his-
torical research questions (Arguing with Digital History working group 2017). Coming
from a qualitative, hermeneutical, i.a. interpretative analysis, the adoption (and com-
prehension) of computational methodology is hard.34 There is no general curriculum
in computational methodology, nor the various literacies canonized.35 Only in the late
2010s, attempts have been made to establish a standardization of core DH methodolo-
gies, such as working with databases, computation-based spatial analysis, automated
34. Compare to section 6.3.5.35. As will be discussed in section 6.3.1 on “Establishing literacy.”
178

6.2 Impact of the DH
text mining, or network methodology36. In a similar vein, initiatives were founded to in-
crease the visibility of argument-driven digital scholarship: such as the Journal Current
Research in Digital History (inaugural issue in 2018) of the Roy Rosenzweig Center for
History and New Media (RRCMN) was specifically designed to “encourage and publish
scholarship in digital history that offers discipline-specific arguments and interpretations,
rather than simply showcase digital projects.”37 Similarly, the “Models of Argument-
Driven Digital History”-website of RRCMN (launched in August 2021) hosts a selection
of (preprint and first version) articles, annotated by their authors with reflections on
their underlying operationalizations, conceptualizations, and processing of their data,
and subsequent analysis38, in order “to highlight the use of digital methods to make
historical arguments”, and in a step to further the open discussion on the scientific
process.39
But there still remains a general lack of understanding on how to use network method-
ology, or how the resulting graphs and figures should be interpreted.
Crymble (2021, p. 4) argued that indeed the DH and digital history did not contribute
a lot to furthering the domain specific knowledge. Their focus have been on building the
digital research infrastructure, and a methodological and source critical awareness first,
and only then would turn to discipline based arguments and inferences using these tools
of the trade.40 As a result of these different goals, Crymble (2021, p. 33) argued it would
be unfair to judge digital history by the amount of domain specific knowledge generated,
as the focus lied on “working with the newly digital archive and understanding how or
if it would facilitate new historical knowledge” (ibid., p. 43).
This circumstance also fits to explain the common accusation that “methods have won
out over interpretations and argumentation” in DH as L. Mullen (2019a) noted, or that
historical understanding had been drowned in the noise of historical big data. Rebutting
this as a hypocrisy, L. Mullen (2019a) stressed that digitally working historians have to
be more reflective, and more importantly, more transparent about their methodologies –
including systematical approaches which data to include/exclude, their processing, and
limitations – in contrast to more traditionally working historians, who tend to under-
explain or “hide their methods” (similarly voiced also by Scheinfeldt 2012, or in regards
36. See for HNR the various “handbooks” edited by, e.g., During et al. 2016 or Stegbauer and
Haußling 2010b and for the DH in general “Digital Humanities: Eine Einfuhrung” edited by Jan-
nidis et al. 2017. Other examples would be the various online tutorials in the “Programming His-
torian” (https://programminghistorian.org/) or the “Computational Historical Thinking”-Guidebook
https://dh-r.lincolnmullen.com/index.html.37. https://crdh.rrchnm.org/about/38. Among those is also an annotated version of Ahnert and Ahnert (2015b) featuring insights on their
underlying ideas for operationalization, data processing, and network analysis (compare to Ahnert and
Ahnert 2015a).39. https://model-articles.rrchnm.org40. Not without irony, in multiple instances, Crymble (2021, pp. 33, 44) proceeds in making again
promises of what is about to come, as it is always too early to tell: “We are just now starting to the see
the fruits of their research as it comes to engage with the traditional historiography.”
179

Chapter 6 Discussion
to transparency in how sources are researched (Crymble 2021, p. 33))
Furthermore, Crymble (2021, p. 43) noticed the differences in the domain specific dis-
cussions: the problems and questions encountered in DH “were not necessarily connected
to the old ones,” resulting in an incompatibility to the more traditional journals as “right
venues for the new conversations.” The transparent discussion and reflection on method-
ologies thus provide for an unaccustomed practice for the more traditional humanities’
scholarship. This would then lead for one to the perception that DH focuses more on
methodology instead of on interpretation, and for two to an opening for further criticism
as a side effect of this transparency in methodology and data selection; a criticism that
most ‘analogous’ working historians are not exposed to when their methodologies remain
hidden.41
6.3 Challenges and implications
In the following, challenges and implications within the Digital Humanities and in the
context of this thesis’ case studies will be discussed, ranging from the problem of es-
tablishing literacy in the research process working with digital sources and data, (com-
putational) methods and tools, arguing for a complementation instead of the classical
divide between qualitative, qualitative, computational, and digital methods, reflecting
on interdisciplinary research, outlining specific next steps in future research avenues in
the context of the case studies, and finally giving an outlook.
6.3.1 Establishing literacy
In order to counteract the ‘naive’ belief in digital technology and in the ‘black on white’
number on paper (or, more accurately, on screen), an informed mature critical encounter
with stats, figures, tools and data needs to be established. Computational multimodal
literacy consists of the familiarity with a wide range of fields: methodological literacy,
data literacy, tool and interface criticism, algorithmic and visual literacy. These com-
petencies allow a reflection of the implications of the changes in the epistemological
approach: How is new knowledge generated with the data used? How does the restric-
tions of the data influence inferences? On which assumption is a methodology based
on? Does a user’s ability to browse digital technologies and to produce results with the
click of a button entail an intuitive assumption on whether these results are reasonable
or correct?
A multimodal literacy is the foundation to understand that digital objects, tools, and
methods are the products of decisions and processes which “are never neutral, and [which]
historians will need to be equipped to evaluate” (Milligan 2019, p. 214). Knowing how to
41. Sternfeld (2014) gives for this the example on how sources are found: there is a ‘tendency to
brush aside a detailed explanation for how we [the historians] search for and discover archival materials,
organize those findings, and then present them in a cogent argument” in traditional scholarship, that
would have to be explicated as a changed work-flow in digital scholarship.
180

6.3 Challenges and implications
deal with the new-found normality of digital media(s) and computational competencies
in navigating in the computerized world, the Directorate-General for Education, Youth,
Sport and Culture (European Commission) (2019) declared digital literacy (also referred
to as digital competence) as a necessity and part of “life-long learning goals.” In the
following, we will discuss these literacies that have yet to become a basic training in any
humanities curriculum.
Data Literacy and source criticism
Data literacy involves knowing about the content, the structure and formalities of the
data and metadata (including information on the format), the criteria of data selec-
tion, and the biases of the data used, following closely a source critical hermeneutical
dissemination.
On sources as data. The digital turn brought an ontological transformation of sources
to data in the humanities. In the commonly used definition by Kirn ([1947] 1968), sources
are used to draw inferences on a field of research. In a source critical hermeneutical
approach, sources need to be disseminated individually by the researcher, critically dis-
cussed and evaluated in their content, context, authenticity, and provenance. The classi-
cal definition thought of sources as ranging from text to imagery and multi-dimensional
artifacts, but can easily be extended to integrate digital and digitized sources as well.
In contrast to sources, data42 are formalized information made machine-processable,
i.e. structured or coded.43 Johanna Drucker (2011) rightly pointed out to the subjective
nature of the seemingly objective data: unlike its etymological connotation, data is not
something “given” (as its literal Latin translation purports), but consists of information
that was extracted and constructed from something, i.a. a source. Drucker (2011) there-
fore proposed the more appropriate labeling of data as “capta” (“taken” in Latin) to
stress its constructive and interpretive nature (similarly argued also H.E. Jensen in 1950,
quoted in Becker 1952, p. 278; see also Kitchin 2014, p. 2). In this extraction process,
sources (and their information) are interpreted, evaluated, weighted, and indexed, i.a.
which information are recorded in which format and in which classification scheme (or
index) from a source (compare to e.g., Kitchin 2014; Fickers 2020).
As a consequence, data literacy is overlapping to the humanities’ hermeneutical source
criticism–a “historical studies data criticism” (Fickers 2020) extended (or ‘updated’)
from the analogue to the digital realm. This includes a critical evaluation of the data’s
authenticity, reliability, and objectivity of the content dependent on the purpose of the
source. In contrast to the perception of authenticity in computer science as integrity,
i.a. the intactness or semantical correctness of the data (as a copy), historical authen-
ticity is concerned with the degree of reliability or factuality (and the provenance) of
42. Used in the following in plural following convention, which does not use the Latin plural of “datum”.43. For a conceptualization of data compare to Kitchin (2014, pp. 1–26) and Borgman (2015, pp. 17–29).
181

Chapter 6 Discussion
the source.44 A source critical approach entails, too, analyzing the context surrounding
the data and the data provenance or historicity (origin, creation, storage and process-
ing, possible migration), including its dating or periodization (either identified through
context or available metadata) and to reflect on its “Zeitgebundenheit” (historicity) of
the data used. In the words of Romein et al. (2020, p. 19), data literacy and a digital
hermeneutics is “to do what historians have always done, [to] question the origin and
authenticity of a historical source.” This sets a “new standard” (Guldi 2020, p. 330), as
“[h]ybridity is the new normal” when working with (digital and analogue) sources and
data (Zaagsma 2013, p. 13; compare also to Fickers 2020). A critical perception of data
brought new areas of expertise such as critical data studies as coined by Dalton and
Thatcher (2014) as a “systematic approach to data criticism” and its societal implica-
tions (compare also to boyd and Crawford 2012; Kitchin 2014), as well as critical code
studies and digital forensics or e-paleography, which critically examine the implications
of the code itself and engage in the digital provenance, materiality, and origins of the
digital object and its restoration (compare to Morris 1998; M. G. Kirschenbaum 2008;
Baker 2019a, 2019b; for an overview on critical code studies see Marino 2020).
As a consequence of this processing, data can be considered models: they are a subjec-
tive representation of a reality (e.g., a source), which creation was guided by (underly-
ing) assumptions that structured the selection (and indexing criteria) of the information
recorded.45 As a model, data are necessary a reduction (or: focus) on (supposedly) im-
portant factors striving to approximate reality (in this context: a source). The selection
of data can too become a model in the definition by Stachowiak (1973) of a fundamental
epistemic tools, which however remains a flawed approximation of the object of research.
Therefore Flanders and Jannidis (2019a, p. 3) rightly pointed to the need to “understand
the social, intellectual, and political contexts” in which data modeling took shape.
Similarly, research designs are models consisting of a set of assumptions, theories, and
guide the selection of suitable data to be included for subsequent analysis dependent
on the research focus. The problem here is representation: Is the parameter used in
the model falsifiable and the right one for the problem? Is it a meaningful parameter?
Meaningfulness can be justified with a corresponding theory that is guiding research as
in a deductive approach. Theories themselves can be considered as models consisting of
a set of assumptions. “A theory written in the form of a computer program is thus both
a theory, and, when placed on a computer and run, a model to which the theory applies,”
wrote Weizenbaum ([1976] 1983, pp. 144–5) on the interchangeable nature of models and
theories. Whereas there might be objective reasons to include certain data, the specific
research design in the model is still subjective. As such the research process in selecting
data and forming hypothesis need to be made clear as possible, especially when data is
44. Compare this to the discussion of authenticity and integrity in historical studies and computer
science in (Fohr 2017, pp. 186–90).45. Which implicit assumptions would have to be explicated in a ‘good’ model (compare to e.g., Flanders
and Jannidis 2019a, p. 3).
182

6.3 Challenges and implications
fuzzy (Gius and Jacke 2020; compare to the following section on data biases). “Debates
about methods are ultimately debates about our models,” summarized this Flanders
and Jannidis (2019a, p. 3)
Data Biases. Historical sources and the data extracted from them are in general bur-
dened with problems in variety, ambiguity, vagueness, fuzziness, scarcity, and incom-
pleteness (Rehbein 2020, p. 261)–Flanders and Jannidis (2019a, p. 5) called humanities
data “strongly layered”–, which quantitative utilization are studied since the 1960s and
1970s (compare e.g., Boonstra et al. (2004) 2006, p. 35; compare also to section 2.2). To
reflect on biases in analogue sources, a source-critical hermeneutics has been developed
to ensure a source-based critical dissemination, assessing the content, context, authen-
ticity and provenance of sources.46 This hermeneutics need to be extended to the digital
realm working with retrodigitals, born digitals, data, and metadata (compare e.g., to
Fohr 2017; Cordell 2017). In the following, we reflect on biases in data based on digital
and digitized sources, and their implications.
Systematic fragmentation. Already in the digital migration from analogue to digital,
analogue sources systematically loose information in the digital reproduction (Kwastek
2015, p. 18). After digitization, retro digitals have to be considered a pre-selected source,
that have become de-contextualized from the original artifact, and from their original
collection context, alongside loosing their materiality and haptic information conveyed
by examining the physical object, such as touch, weight, or smell (Arguing with Digital
History working group 2017, p. 4). The digital artifact thus becomes more fragmented,
if these information are not recorded in (meta)data.
Systematic and inherent subjectivity. At the same time, digitized sources can gain
further information through extensive metadata documentation (e.g., information on
the author, exact measurements, collection context), which enrich the available infor-
mation conveyed by the artifact itself (e.g., the text in a letter). As such, digital collec-
tions synthesize and contextualizes sources, and influence their fundability and visibility
heavily–but often fail to explain their choices for selection, description, and standard-
ization (ibid., pp. 6–7) It is important to stress, that this enrichment of data–and the
selection of which information to include in the data–is an act of interpretation, a trans-
lation accomplishment of an analogue source to a digital object. The digital collection
itself thus becomes an argument, stressed the Arguing with Digital History working
group (2017, p. 5). As a consequence, digitized sources are not the same as the analogue
source; questions about the original do not become “obsolete” as remarked by Fickers
46. Differentiating between an “outer” (structural context based) and “inner” (content reliability based)
source criticism, this allows to make inferences on the intention, motivation, and interpretation of the
source. For an introduction to the hermeneutical methodology and source criticism in the historical
studies compare to Droysen ([1882] 1977), and exemplarily, Beck and Henning (1994).
183

Chapter 6 Discussion
(2016). Instead, Cordell (2017, p. 189) warned that dependent on the quality of digi-
tization, digitized sources have a bibliographical “lineage” of texts: “dirty OCR” can
change the text itself as Cordell (2017) showed for Edgar Allen Poe’s poem “The Raven”
to what can be described as an (involuntary) edition, in which the OCR program acts as
a “compositor” that “interprets” text based on best-guess approximations of the char-
acters scanned (ibid., pp. 194–200). As such, a problematically digitized source becomes
the result of the “priorities, infrastructure, and economics” and technical possibilities of
digitization (ibid., p. 190). Digitized sources have to be considered “enriched (big) data”
instead of simply “digital surrogates” (Romein et al. 2020, p. 3). From a source critical
perspective, it is therefore relevant to cite the actual sources used. Blaney and Siefring
(2017) pointed out that “historians still pretended to cite paper-based sources, while
drawing heavily on new digitized archived, sticking their heads in the sand about any
implications of using the digital surrogates.” The Arguing with Digital History working
group (2017, p. 1) summarize this digitized data as a “digital literacy.”
Data are systematically not objective but constructed, characterized by systematic
subjectivity (see e.g., Drucker 2011; Kitchin 2014). Data based on historical sources
bear both such a systematic subjectivity and an inherent subjectivity. Historical sources
inherently purport a certain perspective (or narrative) influenced by their origin (e.g.,
author, context of origin, time period), which have to be contextualized in order to
deconstruct the narratives of their origin. The hermeneutical approaches applied on
traditional sources are as applicable to digital sources, and consequently to data, too.
Essentially, all data can be considered historical data.47 “We need to unmask their [the
data’s] underlying assumptions in order to get down to the level of historical evidence.
The role of the scholar thus becomes of finding meaning in the mass, which in the
case of historical data is often also a mess,” describes Edelstein et al. (2017, p. 419)
the need to de-construct data. “‘Raw data’ is both an oxymoron and a bad idea”, as
Geoffrey Bowker put this (quoted in Gitelman and Jackson 2013, p. 1), while neither
“[d]atasets seldom can be taken off the shelf and used blindly in an ‘as is’ form” (Batagelj
et al. 2014, p. 388). This transparency and reflection on how data have been “always
already ‘cooked”’ (Bowker quoted in Gitelman and Jackson 2013, p. 2), i.e. processed,
are needed in order to converge closer to the historical ‘truths’ these data represent.
This “data awareness” (Kwastek 2015, p. 17)–the understanding of data as models,
surrounded by assumptions and context–extends on the commonly assumed data literacy.
Inherent fragmentation and fuzziness. Furthermore, the sources might be inherently
fragmented, something that is almost always true for historical data. Rehbein (2020,
p. 260) noted that “digitization cannot change characteristics of historical research.” An
improved accessibility through digitization did not change problems of sources that entail
47. There pertain some differences in regards to the authorship; with exception to oral history, in
historical studies the researcher is not the author of the source used as e.g., in interviews or survey data
that are common in the social sciences
184

6.3 Challenges and implications
both known unknowns (such as vagueness or fragmentation that we known about/suspect)
and unknown unknowns (missing elements that we don’t know anything about), which
need to be met with a traditional hermeneutical dissemination. Fragmentation and lack
of sources naturally influence potential research angles and empirical analysis. As such
the quantification of sources needs a way to reflect the “ambiguities, paradoxes and
contingencies” of qualitative research (Edelstein et al. 2017, p. 419). The fuzziness of
data has been commented on since the 1960s and 1970s (Boonstra et al. [2004] 2006,
p. 35). Aydelotte (1966, pp. 805, 811, 820) warned on numerous occasions about “in-
herent frailties” and other restrictions that make a quantification (or: datafication, as in
this context) difficult. These limitations to the data are ultimately permeable and not
resolvable. All historical data is fuzzy, in that it is unclear how much information points
are missing and how these missing information influence the outcome of any analysis.
There are several angles to tackle this fuzziness of data, which entail documentation,
contextualization, robustness measures, further cross-referencing, and using large and
varied datasets. A thorough documentation of the origin of the data and potential
shortcomings helps to establish the validity of the data sources used, and their contex-
tualization situates the data source in their creation and significance in time.48 As such
the data should be documented explicitly and data biases openly exposed similar to
the “reading of a text in a scholarly edition” (Rehbein 2020, p. 265). Historical studies
tackle limitations of sources by testing, counterposing, and critically disseminating a
variety of sources from different perspectives and origins in order to infer to a historical
“truth.” Contextualization is key for historical work. Measures for robustness of data,
such as certainty levels, can be implemented in computational methods, which help to
again raise validity and reliability of the results. These can show varying degrees of the
certainty of analysis, as e.g., the likelihood of the factuality or certainty of a date (ibid.),
or forms of time-stamping of secured knowledge. Another approach would be to utilize
large datasets following the law of big numbers, which can level out missing information
due to the range of available data (Lemercier and Zalc 2019). However, problematic
data cannot be compensated with a more sophisticated approach as Aydelotte (1966,
p. 810) reminded his readers, and “boundaries of what it can accomplish” (and cannot
accomplish) need to be accepted (ibid., p. 825). Furthermore, a cross-reference to other
data sources such as cultural heritage resources or Linked Open Data could be used to
validate an/or enrich the available data (Edelstein et al. 2017, p. 420).
This frustration with fuzzy data is ultimately not resolvable. It can only be combated
with greater transparency on the data, their description, and reflection on possible short-
comings, and their significance for the outcome of research. Due to the fuzzy nature of
sources, after all, research is always only to the best of our knowledge, and needs to be
48. A gross disregard of this principle was the recent analysis of the development of trustworthiness
in portraits using machine learning by Safra et al. (2020), which received very strong criticism as “bad
science” (Booch 2020; compare also to Fafinski 2020; Spanton 2020). This paper lacked a proper critical
reflection on their sources, and ported among other things established bias on whiteness in their curated
data set into their analysis of “trustworthiness” in 500 years of portraits.
185

Chapter 6 Discussion
refined in the light of newer (and more accurate) evidence at all times, as one of the core
principles of science.
Selection and representation biases. Certain types of sources tend to be over-represented
due to the incomplete digitization of sources49 This bias in representation applies to
sources especially that are more easily digitized such as typeset sources (especially of 19th
and 20th century serial published newspapers) in contrast to handwritten manuscripts
(that would require more sophisticated OCR, and manually trained HTR), or that have
been digitized due to a project focusing on a specific source type (compare to Rehbein
2020, p. 259). Underlying to this is a selection bias which favors specific themes and
types of sources (Edelstein et al. 2017, p. 414).
The availability of digitized sources then facilitates their increased referencing – along-
side a hyper-focus on certain timeframes or periods these readily digitized sources origi-
nate from, and the specific perspectives these sources provide (Putnam 2016b). An illus-
trative example on this problem of over-representation gave Milligan (2013) on the digi-
tization of two major Canadian newspapers–the Toronto Star and the Toronto Herald–,
which in turn where used as main data sources in more research projects than ever before
(ibid., p. 7). Milligan could show that they were cited much more due to their acces-
sibility of digitization, but at the cost of neglecting other equally suited newspapers of
the same period. As a consequence, the ready availability of data (and digital/digitized
sources) guides research and veils what kind of (existant) sources are missing. Why look
further, if the first result already fits? This asks the researcher to examine thoroughly
and carefully what is included in the digitized collections, and what is literarily not
there, but only available in physical sources. “And when we fish in digitized text, we
are fishing in a very particular sea”, warned Putnam (2016b, p. 390) about the curated
collections of digital access (Crymble 2021, p. 33).
Canonization and uniformity. The focus on an again small (but on trend always in-
creasing) number of digital corpora of sources bears the danger of uniformity (in contrast
to their variety), as it pushes the specific perspectives of these readily available sources.
This threatens to render void one of the main advantages of mass digitization: to provide
a complete picture on a field of research by offering–seemingly–all the sources, when in-
stead the same sources are references again and again, and do not extend the “short tail”
of canonized authors as known in literary studies (which has been the initial intention
of Moretti 2005). As such the digitization of sources leads to a new form of canoniza-
tion, from which nevertheless a “host of forgotten characters” emerge still (Edelstein
et al. 2017, p. 414).
49. Which is constantly changing due to the “moving wall” of eligible sources for digitization.
186

6.3 Challenges and implications
In the context of this thesis, the same mechanisms of data biases are at play.50 The
analyses in the case study on political judiciary necessarily reflect the perspective (and
information recorded) in the sources. The source basis are the court records of the
provincial courts of Vienna I and II, which survived both the ‘tooth of time’51 and purges
where there was only kept considered of ‘value’ as in the 1980s, and finally through the
transmission into a database selected by the research project on political repression by
Wenninger et al. (2017), in which process 1,836 cases were recorded. These are different
forms of selection biases that dependent on transmission as well as on e.g., transcrip-
tion noise. The records themselves are subjectively biased: they do offer a specific and
non-objective view of the courts, the judiciaries, and the police on the supposed offenses
of the defendants, and can be considered involuntary ego-documents (Schwerhoff 2011,
p. 40). Any findings necessarily reflect the view of the courts, and can be considered
only an approximation to historical reality.
Similarly, the analysis of network structures within the history of intellectuals corre-
sponds to the information recorded in the datasource of YAGO, which obtained data
from Wikipedia.52 As such it reflects both current and popular knowledge on intellectu-
als in history and their influences, which were curated by a crowd-based review process.
In this format only the ‘most important’ information were recored. Therefore, the case
studies give an abstract view on the history of intellectuals similar to the broad strokes
of a master narrative.
Methodological and algorithmic literacy
A methodological literacy has oftentimes been demanded (as e.g., by Rehbein 2020,
p. 258; Mayer 2016; or in the white paper by the Arguing with Digital History working
group 2017, pp. 11–13) as the foundation to use any method: a familiarity with the
corresponding theories of the method, e.g., in network analysis with network and graph
theories, and with certain statistical and quantitative foundations. Underlying questions
guiding a methodological literacy entail: What is the method aiming at? Does the data
foundation allow this kind of analysis?
Establishing method competencies and a critical reflection of results when working
with computer-assisted tools is key. There are a myriad of introductory articles to help
in the quest to learn “How to Read Articles which Depend on Statistics” (Thomson
1989), educate on how to identify manipulations with data53, give guidance in adequate
50. For the following remarks, compare also to the sections on data description and limitations in Petz
and Pfeffer (2021).51. Resulting in their deliberate and random fragmentation through e.g., either removed or destroyed
or simply fragmentarily transmitted record parts, such as e.g., proofs for periods of imprisonment, release
dates, or imposed fees.52. Compare to the discussion in Petz et al. (2021) and in section 5.2.2 on “A master narrative.”53. A humorous and high-circulation print example would be “How to Lie with Statistics” by Huff
([1954] 1993), or “So lugt man mit Statistik” by W. Kramer ([1991] 2001). Best (2005, p. 210) noted
however, that statistics are socially constructed and less the product of lying than of “sincere, albeit
187

Chapter 6 Discussion
sampling sizes (Lemercier and Zalc 2019), or practical introductions to the methodolog-
ical basics of network analysis (e.g., Graham et al. 2016, pp. 195–264; Stark 2016; L.
Mullen 2019b; compare also to the tutorials of the “Programming Historian”54; and the
general introductions to the principles of network analysis as e.g., by Wasserman and
Faust 1994 or Jansen 2006).55
Methodological literacy is intricately interwoven with an algorithmic literacy: What
does the algorithm/the function(s) do? What are the differences in the available method-
ologies and algorithms, e.g., for structuring or processing the data? What are strengths,
advantages? If done thoroughly, algorithmic literacy means critical code review, as
Guldi (2020, p. 335) stressed. Neither algorithms nor their underlying methodologies
nor tools (which implement certain methods/algorithms) are neutral. This is rather
well-established for search algorithms, which rank and select information a priori. This
establishes hidden power relations in the background, which alter the obtainable results
and have due to their easy use significantly changes the heuristics of searching (Bunz
2012; Fickers 2020).
Tool and interface criticism
Tool and interface criticism are concerned on one hand with the implementation of a
methodology (or algorithm) in a tool, and on other hand with the presentation of tools
and interfaces and their usability, in order to ensure a reflected and learned application
and operation of a user. What does the tool do, what is the tool able to show? What are
its underlying principles and applied methods? How is a specific method operationalized
in the tool used? Connected to this: Are these methods appropriate for the research
problem or data source? As a consequence, methodological and algorithmic literacy are
requisites for tool criticism. The second part of tool and interface criticism is concerned
with the presentation and usability of the tool or interface: How does this tool or interface
influence potential research?
An ever increasing number of tools and interfaces–for text mining, distant reading,
network analysis, character recognition, corpus exploration, and more–offer results seem-
ingly with the click of a button (Wiedemann and Lemke 2016, p. 404; Rehbein 2020,
p. 258). This followed demands to provide software and applications to be used easily
by “masses of humanities scholars” (Boonstra et al. [2004] 2006, p. 19) with lower entry
hurdles and for a multitude of research contexts similar to the revolution of accessible
data analysis with SPSS since the mid-1980s (such as e.g., by Edelstein et al. 2017,
innumerate advocates [...] or [of] selectively highlighted” spotlights. For an overview on statistical
literacy advocators and practical recommendations for statistical training compare to Johannssen et
al. (2021).54. https://programminghistorian.org/55. For a discussion on the perceived divide and supposed hierarchy between quantitative and qualita-
tive methods, and on a reflection on the interchangeability of methods, island solutions and standard-
ization please compare to the following sections in 6.3.2.
188

6.3 Challenges and implications
p. 419; Rehbein 2020, pp. 258, 262).56 The perception that these tools offer correct
results clicking a button however is deceptive.
“All digital tools operate upon some form of modeled data, whether or not they fully
expose that model to us, so if nothing else, we are creating information that corre-
sponds to our tools way of modeling information,” summarized Flanders and Jannidis
(2019a, p. 11) this. As a consequence, its underlying model should be aligned with the
researcher’s own intentions (ibid., p. 12); the tool can control and restrain options of
functionality for research, and thus shapes insights generated–it has to be considered an
epistemic object of research.57 In order to open this ‘black box’ of automation, both
documentation from the side of the developer, but also a methodological and algorith-
mic literacy from the side of the user are requisites. The turn in recent years for open
source software and tools is a step into the direction to establish peer-reviewed source
codes. As a consequence, tools and interfaces need be re-contextualized as epistemic
objects of study and have to be considered “interpretational machines” that do not nec-
essarily provide the ‘correct’ answer (Romele et al. [2018] 2020). The computer–or any
other tool– is both epistemically and “semantically blind” (Schwandt 2018, p. 108). Any
meaning from the given results have to be brought forward by the respective researcher,
and cannot be relied on the tool itself. Tools should therefore neither be blindly trusted
nor discarded as “epistemologically incompatible” (Romein et al. 2020, p. 20). Tool and
interface criticism/literacy is about evaluating the “full implications and possibilities”
of the tool (Ayers 1999, p. 1) beyond a superficial usage (Nerbonne 2015, p. 39) in order
to make informed choices.
This option for peer-review helped to bring notice to e.g., the “common sin” of pro-
ducing spurious results when using the default metrics of the tool Gephi to analyze
two-mode networks instead of one-mode ones for which the default applies (Graham
et al. 2016, p. 262).
In the context of this thesis, for the case studies we decided to implement methods,
approaches, and data processing in our own code utilizing the established open-source
libraries of the statistical computing software R58 (for network analysis: R::Igraph59 and
R::Statnet60) before switching completely to the programming language Python61 due
56. “Now we do not have to be giants. We can be ordinary people, using statistical packages to play with
data and examine hundreds of analytic possibilities,” explained Wellman (1983, p. 74) the advantages
of accessible statistical software.57. The choice for specific tools can carry “cultural significance” as Flanders and Jannidis (2019a, p. 10)
noted, such as the practicability and elegance of XML tree structures in contrast to the pre-XML data
bases created in terms of speed and development, irregardible of their “extremely poor fit in modeling
terms.”58. https://www.r-project.org/59. https://igraph.org/r/60. http://statnet.org/61. Version 2.7, https://python.readthedocs.io/en/v2.7.2/contents.html
189

Chapter 6 Discussion
to it allowing to program object oriented62 (for network analysis: Python::NetworkX 63
library; for statistical analysis: Python::Numpy64 and Python::Pandas65.
Interface criticism can be part of a digital hermeneutics, too, which involves the criti-
cal appraisal of the interface as a source–e.g., a website–and its perception as the result
of a digital (re-)coding and possibly, a (re-)contextualisation as in e.g., how websites
are archived. Fickers (2020) showed the changes websites go through when e.g., re-
constructed by the “Wayback Machine” using time-stamped captures; their depiction
however is only an approximation of the original at a certain time point with a certain
browser. Consequently various forms of representation exists for a singular interface.
Visual literacy
Finally, visual literacy is essential to understand the visual output of research. What
does a visualization of aggregated data or graphs mean? How to ‘read’ a chart or graph?
This concerns both a critical reflection of the visual comprehensiveness–from accessible
color schemes to labeling or an optimal distribution of nodes on the available surface
or minimized line crossings (Tufte 1983; Mayer 2016; Pfeffer 2017)–, as well as the
ability to understand visual manipulations, e.g. through axis shortening, distortion, and
focus (for a popular overview on manipulation with visualizations see Huff (1954) 1993;
and W. Kramer (1991) 2001, pp. 37–50) to the correct interpretation of topological
location of a node within a network (Graham et al. 2016, pp. 159–194; Mayer 2016;
Rehbein 2020, p. 258). A critical reflection of presentation and visual evidence tying
in to visual literacy helps to uncover forms of appresentation of knowledge: where does
this presentation lack, which are its advantages? Representation in visuals alone are not
enough to provide explanations for “historical causality” (Sternfeld 2014).
Canonization of literacies
These literacies are iterated as digital competences in various contexts, as in e.g., Janssen
et al. (2013, p. 478) as building blocks of core competences applicable in everyday life
and support competences that reflect information and communication technology. Dig-
ital competence was officially recognized by the European Commission as part of the
“Key Competences for Lifelong Learning” (Directorate-General for Education, Youth,
62. Initializing classes of “objects” (instances) within the code, that bear certain attributes or methods
(compare to e.g., Lutz (1996) 2010, pp. 26–36). This allowed to process the raw database into e.g., the
class courtcase with the attribute defendant recording when instantiated the case’s defendant’s unique
ID. Object oriented programming as well offers the possibility to implement functions on the stored
information of the class properties.63. https://networkx.org/64. https://numpy.org/65. https://pandas.pydata.org/
190

6.3 Challenges and implications
Sport and Culture (European Commission) 2019), crossing over from a humanities spe-
cific competence to a universal one. It includes the “confident, critical and responsible
use of, and engagement with, digital technologies for learning, at work, and for par-
ticipation in society” as well as various other literacies such as “information and data
literacy, [...] media literacy66, digital content creation (including programming), safety
[...], intellectual property related questions, problem solving and critical thinking.”
However, for the most part, these aforementioned skills are not implemented in the
study curricula of the regular humanist scholar (compare to e.g., Rehbein 2020, p. 258);
also Best (2005, p. 210) remarked, that “while critics agree on the desirability of in-
creasing statistical literacy, it is unclear who might accept this responsibility.” As such
there is no canonization of these multimodal skills, as there is no mutual agreement
among peers (following the paradigm of a scientific revolution as presented by T. S.
Kuhn ([1962] 2012)) and remains a “niche” (Rehbein 2020, p. 259) that slowly was
professionalized in an increasing number of professorial positions and degree programs.
Online resources as the “Programming Historian”67 or the “Computational Historical
Thinking”-Guidebook68 (L. A. Mullen 2019) offer accessible tutorials to introduce pro-
gramming for historical research. It is no longer an option to engage as an historian
with historical data criticism (or: data literacy) but a necessity, warned Fickers (2020)
and pointed to what is at stake: the legitimacy of the field as a critical science.69
6.3.2 Towards a complementation of methodologies
The challenge remains to prove the “perpetual future tense” of the prospects of DH
wrong.
Ideal of complementation of methods.
This can be achieved by successfully and fruitfully integrate qualitative, quantitative,
digital, and computational approaches. Their combinations need a critical, reflected,
and sensible application, combined with digital hermeneutics and various forms of digital
competences and method literacies, as well as domain-specific knowledge and questions
to further insights within the respective discipline, that we will discuss in the following.
Ideally, quantitative and computational-based approaches70 would go hand-in-hand
with qualitative methods of “close reading” and hermeneutical, critical dissemination
of the sources used and their database be contextualized (as recommended e.g., by the
66. On the critical reflection, assessment and handling with media, awareness about technical manip-
ulation and transformation.67. https://programminghistorian.org/68. https://dh-r.lincolnmullen.com/index.html69. This reads in German as follows: “Sich als Historiker mit den Chancen und Herausforderungen in
der geschichtswissenschaftlichen Datenkritik zu beschaftigen ist night langer eine Option, sondern eine
Notwendigkeit.”70. For an overview see section 2.3.
191

Chapter 6 Discussion
Arguing with Digital History working group 2017, p. 14). Digital humanities project
try to combine both methodologies as complementary, both having different advantages
and perks that could harness the gains (Stegbauer and Haußling 2010a, p. 14), bridging
“micro and macro” perspectives (Guldi 2020, p. 333). Indeed, Lindgren (2020, p. 14)
argued that differences between both are not as grave: both approaches create “approx-
imation of ’the truth’ [...] [and are] by definition interpretive, no matter the chosen
methodological strategy.” However, the Arguing with Digital History working group
(2017, p. 14) pointed to the limits of such an combination: a mixed methods approach
is useful in the identification of structures and patterns, but is not discernible to give
inferences on “causation and experience.”71 We stress that both types of methodologies
actually complement each other, which we consider one of the core values of the digital
humanities methodological tool kit, from which research profits greatly by allowing to
make meaningful inferences on the topic research.
Perceived Division and Hierarchy of Methods.
Despite these assertions, the quantitative (computational) methods are practically not
commonly paired with qualitative methodologies. There is a perceived divide in the
humanities between quantitative (computational) methodologies and qualitative ap-
proaches.
The common accusation of qualitative methodologists against quantitative methods is
that these focus on empiricism: on what can be accurately measured (Bode 2020). On
the one side, this leads to the problematic association of quantitative-based approaches
with positivism (Graham et al. 2016, p. 23; Edelstein et al. 2017, p. 408; Jannidis 2019,
p. 67; Piotrowski and Fafinski 2020, p. 4). Critics warn that with a positivist approach
only things measurable are recognized; what cannot be empirically measured cannot be
targeted with empirical methodology. As a consequence, non-empirical information–such
as mentalities, feelings, or subtext–would be lost for humanities’ research. Qualitative
approaches in contrast would be able to capture these hidden information, and thus
would be superior to positivist approaches.
On the other side lies the claim that quantitative-based methods would be regarded
superior to qualitative-based methods–, a ”positivist, cliometric vision of computational
supremacy”72–, that mirrors a hierarchy between them. This reproach has been re-
futed ever since by the DH community, as e.g., by Russian computing historian Ivan
Koval’Chenko in 1964, pointing to that “quantitative methods are not a key to absolute
truth that is going to render qualitative research meaningless” (quoted in ibid., p. 175).
This fear about a super method mirrors a supposed hierarchy between the ‘hard sci-
ence’ approaches vs those of ‘soft’ science: the humanities would be“natural scientified”
71. This is in contrast to the field of cliodynamics that seeks to find universalizing rules in history and
causal theories to predict historical events in a macro perspective (Turchin 2008).72. Which Edelstein et al. (2017, p. 408) pointed out is not the point of introducing computer-based
methodologies into the humanities.
192

6.3 Challenges and implications
through quantification. The incorporation of digital methods and general digitalization
of research would as a side-effect somehow elevated the humanities to a “proper” sci-
ence on par with the “hard sciences”73, suggesting the inferiority of the “soft science”
of humanities’ methodology74. Subsequently, traditional analogue research would be in
danger of marginalization (Fridlund 2020, pp. 69–70; Guldi 2020, p. 330; Aydelotte 1966,
p. 804). In 2011, Hitchcock lauded that the humanities had “hitherto resisted the siren
call of analytical positivism” in the context of code-breaking culturomics.75
How deeply ingrained this perception of a hierarchy of approaches are showed again
Lindgren (2020, p. 7) argument for an “anarchistic approach” to combine both method-
ological strategies.
This perceived opposition of methods is refuted strongly in the DH, arguing for
the complementation of methods and sounding sensible ways how to combine both
quantitative- and qualitative driven approaches. It is saying a lot, that still in 2020
Guldi (p. 330) in her essay on the establishment of good scientific conduct in digi-
tal/computational research workflows in digital history felt the need to refute the “con-
tention that digital history is itself imperial and universalising in nature, threatening
to draw all history practitioners into a single method” addressing the fear that (ana-
logue) historical work might become obsolete in the age of computers. This iterates
concerns from the 1960s: Aydelotte (1966, p. 804) defended that there was no ”single
methodology in history” having addressed fears of the orthodox historical scholarship,
that the quantitative method might replace the qualitative one. Jannidis (2019, pp. 67–
8) stressed that neither methodology should exist alone in the DH research framework:
quantitative methods should not replace the act of hermeneutical interpretation and
contextualization, and quantitative method should not replace the qualitative analysis,
nor that computers should do the analysis independently.
Reservations about a positivist stance in computational methodology can be tackled
with a thorough hermeneutical approach that includes heterogeneous sources and an
explication of implicit biases. Any quantitative or computational analysis should be
accompanied by a qualitative-based contextualization to make meaningful inferences
73. In another strand, the assimilation of the humanities as a new “hard science” is consolidated in
the active re-framing of the humanities’ research experience: notes become lab diaries, the historian
an experimenter, the archive an laboratory, and passive learning an act of active creating, or the ideal
research process of “thinkering”, a portmanteau of thinking and tinkering as e.g. promoted by Fickers
(2017) and Fickers and Heijden (2020) of new DH research techniques. Instead, the incorporation of in-
terdisciplinary methodologies and approach is an ongoing process that is further blurring the disciplinary
boundaries since their establishment between humanities and natural sciences by Wilhelm Dilthey (1883)
(Nerbonne 2015, p. 33; Baum and Stacker 2015, p. 7).74. In a controversial editorial in Nature, “Poetry in Motion” (2011) suggested that through the DH,
the humanities would become actual sciences using scientific methodology, as if not before: “It seems
just a matter of time before the humanities like the social sciences before them, wholeheartedly em-
brace scientific methodology. And that should be reason to rejoice, not remonstrate” (compare also to
Piotrowski and Fafinski 2020, p. 330).75. Compare to section 6.3.2.
193

Chapter 6 Discussion
on the topic researched. As part of this thesis, we contextualized a quantitative and
network-based analysis of court records with the insights from a qualitative scholarship
in order to understand what and why things are happening in the Corporate State’s
Viennese courts in 1935. This allowed us to falsify certain assumptions of qualitative
scholarship about the judicial practice during the time. We operationalized the harshness
of sentences based on upper and lower bounds of penalty limits, and identified certain
configurations for malevolent court decisions towards political partisanship. In the case
study on intellectual history, we conceptualized various approaches on how to approach
their analysis on a big data scale, in order to assess the importance of scholars in various
contexts.
A bouquet of methods.
Instead of a perceived hierarchy of methods, any digital method, or its combination
with traditional method is only part of a big bouquet of methodologies available to
humanities’ scholarship. E.g., quantitative evidence of frequencies are only “one more
component in a complex landscape of evidence” (Hitchcock 2011). The computational
method is “one method among many,” remarked also the Arguing with Digital History
working group 2017, p. 14. However, the Arguing with Digital History working group
(2017, p. 18) warned, that computational methods within history alone “rarely provide[]
the complexity of explanation that historians seek”, and therefore should be “woven
with non-computational methods of history into a coherent argument” (ibid., p. 19).
“[D]ifferent scholarly agendas are best met by different technologies, we do not think it
possible or even desirable to dictate a unique methodological approach for all experiments
in digital history,” Edelstein et al. (2017, p. 422) stressed on this matter. Each and
every new approach unlocks new research questions and answers previously unavailable
before; therefore, Romein et al. (2020, p. 20) formulated the hope (or goal) that the
methodologies of the DH become mainstream, even if DH does not.
One step in the direction to educate on the different insights possible with different
approaches is the study on text re-use in citing the Bible in the accounts on the Conquest
of Jerusalem in 1099 by Hiltmann et al. (2021), highlighting the “differences between
the analogue and the digital approach” and their gains (ibid., p. 122).
On the interchangeability of methods. Despite these assertions of a bouquet of meth-
ods available, there is no ad lib interchangeability of methods and approaches, no free
pick of methods (L. Mullen 2019b) and no one approach “fits it all” to the very het-
erogenous research questions and sources.
Big data in historical studies is simply not the same size as social big data, but “filled
with hidden multipliers” (Edelstein et al. 2017, p. 411), insecurities and fuzziness in the
data.76 The humanities are missing the real-time live-streamed data common in the
76. Compare to the section 6.3.1 on data biases.
194

6.3 Challenges and implications
social sciences; consequently many statistical methods favored by data scientists are not
applicable (ibid., pp. 418–9). “[F]ormal statistical presentations are appropriate only for
a limited range of historical problems,” warned already Aydelotte (quoted in Piotrowski
and Fafinski 2020, p. 5). Small data of the humanities might be too problematic to
be properly statistically represented: Data biases, “[i]nherent frailties” and ambiguities
make research and quantification difficult dependent on the kind of sources (Aydelotte
1966, pp. 805, 811, 813, 820). If the data is incomplete or suspect, not even an “im-
pressionistic, subjective approach” such as qualitative analysis would be superior to a
quantitative approach (ibid., p. 816). Such problematic data would not be compen-
satable with a more sophisticated approach (ibid., p. 810). Aydelotte (1966, p. 825)
stressed that “boundaries of what it [the method] can accomplish” need to be accepted.
These boundaries have to entail an open critical discussion of the limitations of data,
and the perspectives these represent. As such, any analysis is highly dependent on the
nature and quality of the data (Baum and Stacker 2015, p. 9), and the applicability of
a methodology might be contained due to the aforementioned restrictions in data scope,
breath, validity, and fuzziness.
Indeed, also the presumptions of a methodology might not apply to the research prob-
lem and source base at hand. In the context of this thesis, an analysis of significant
factors for convictions using Exponential Random Graph models (ERGMs) had to be
abandoned. ERGMs model the probability of observing a set of relationships within
a graph on a fixed set of nodes without assuming any independence between them.77
The network is considered the dependent variable. ERGMs allow to test whether the
empirical network’s structures occurred by chance (Valente 2010, p. 156) and to describe
the strength of “local selection forces that shape the global structure of a network” us-
ing hypothesis testing variables (Hunter et al. 2008). ERGMs estimate statistically the
conditional probabilities (log-likelihoods or log-odds) of the “effects of covariates on the
ties in a network” in order to describe the “form of dependence that could exist” there
(Cranmer and Desmarais 2011, p. 67). Suitable data for ERGM analysis is considered to
be based on random choices for tie forming78 and cross-sectional data which did originate
77. ERGM similar a random selection of possible networks via a (now default) Marcov Chain Monte
Carlo procedure, a ‘forgetful’ random walk through a fixed set of nodes, which generates a multivari-
ate probability distribution of networks. The empirical network is regarded as the most likely of many
possible realizations of networks (Cranmer and Desmarais 2011, p. 70), which is compared to the simu-
lated networks. ERGM gives p-values to estimate the significance of the hypothesis-testing covariate’s
influence on the empirical network based on a logit-regression analysis with a binary outcome variable.
In order to make this feasible, it is required that in theory each tie could exist in the network. The
ERGM procedure thus allows to model complex dependencies without having to prove the independence
between the covariates and nodes first. For an overview on the functionality and use of ERGMs compare
to Hunter et al. 2008; Valente 2010; Cranmer and Desmarais 2011; Lusher et al. 2012; Heidler 2015;
Block et al. 2019.78. The networks’ “actors [have to have] consider[ed] the costs and rewards of each tie separately [...]
without a mutual comparison” of existing ties when the network was formed, therefore assuring that
195

Chapter 6 Discussion
at the same point in time (Valente 2010, p. 156).79 While in the case study on political
judiciary, the court trials can be considered to have been tried very close in time, some
of the requisites of ERGM analysis did not apply to the specificities of the data source:
Court cases are not randomly assigned to judges, but based on an underlying alloca-
tion mechanism regulated by the yearly “Geschaftsverteilung” (executive organization
chart), which is not available for 1935. As such, questions of systematic prejudice, or
professionalization in the sense that certain types of cases would be allocated to certain
judges, could not been tackled.
As a result of the problems with data in the humanities, methodologies of the DH
cannot be considered formalized, as the problems encountered are usually not standard-
problems. Sahle (2015, p. 53) noted the “unausrottbare Startannahme” (ineradicable
initial assumption) that a research problem within the DH can easily be solved with a
technical standard-problem. Instead, Lindgren (2020, p. 5) stressed that methods need
to be “transformed and adapted” to the requirements of the research questions and
the data base in question. Rehbein (2020, p. 262) warned that a profound (historical)
understanding is central for a source reading which cannot easily be delegated to an
algorithm. This as a backside tends to lead to a constant “re-imagination of the wheel”
(Sahle 2015, p. 52) for solutions for fuzzy problems, and to the establishment of “island
solutions” (Baum and Stacker 2015, p. 9), which also provide an option to coin one
of those80, and bear the danger of arbitrariness. Nerbonne (2015, p. 39) noted that
methodological approaches as a result develop “opportunistically” and often “naive” (as
in historiographical uncertainty).
Reasons for this lie in the lack of a consensual unification of best practices. In recent
years, suggestions for standardization/formalization and best-practice recommendations
have been made in a vast range of handbooks (as e.g. in the “Handbuch Historische
Netzwerkforschung” by During et al. 2016). These represent an attempt to both le-
gitimize the methods used and to increase the validity of the results (Sternfeld 2014).
This wish of many DH authors stems from the feeling of being neglected by traditional
humanities research and therefore to justify the methods used (see e.g., Cordell 2016;
compare also to the Arguing with Digital History working group 2017, pp. 1–2 white
paper’s recommendation to publish digital methods in traditional history journals in
order to combat missing acknowledgment by traditional historians and to become part
of the “historiographical conversation”).
there is no dependencies among the variables (Block et al. 2019, pp. 233, 69).79. For an overview on the functionality and use of ERGMs compare to Hunter et al. 2008; Valente
2010; Cranmer and Desmarais 2011; Lusher et al. 2012; Heidler 2015; Block et al. 201980. As e.g., in the attempt to coin “quantum age” for a new development within the DH (Sternfeld
2014), or in Fernandes Riva (2019, p. 40) on the transmission of Medieval manuscript, the spatial
metaphors of continent, archipelagos and islands were used to describe the network structures of core,
periphery, and isolates.
196

6.3 Challenges and implications
6.3.3 Interdisciplinary research cooperation
Both the humanities and computer sciences and maths can benefit from this mutual
enterprise. The humanities offer rich, extremely diverse–and problematically fuzzy–data
sources and real-world applicable research questions, onto which computational methods
can be applied. Guldi (2020, p. 341) called this the “biggest draw” of the humanities.
These provide both new fields of application, optimization problems training grounds for
new methodologies in real-world application contexts. In return, computer science and
maths offer novel and unique perspectives on what can be done with the humanities’
data, and can help to further the domain-specific knowledge on a research topic in the
respective fields. The goal in here is to develop innovative methodologies81 and domain-
specific insights.
Reclaiming the field for humanities’ arguments
In establishing a mutual literacy, voices can be appeased that warn about the humanities
experiencing a “hostile acquisition” by the technically affluent computer sciences (as
noted by e.g., Nerbonne 2015), resulting in what Fickers (2017) at the dhnord2017
conference called for history a “historia nuda”, a history devoid of interpretation and
argument in contrast to the desired “historia ornata.”82 Le Roy Ladurie brought this
already in 1973 to an escalation that the scholar will come to an end with the increased
usage of the computer: “L’historien de demain sera programmeur ou il ne sera plus.”83
This quote has been picked up as a positive stance for the humanities’ scholarship having
to adapt to the new technologies.
Hammer, nails, and code-breaking
Questions on the applicability of a method aside, the methodology should not be the
goal of inquiry in itself. A technologically-based method offers no road to / promise of
salvation (“Heilsversprechen”) nor “magically” fixes problems.84 When technology and
methods become a cause for themselves, this would lead to a “technical solutionism”
(ibid.) devoid of practical applicability and sincere historical (or other humanities’) in-
terpretation, finding “nails” for Maslow’s “hammer” of methodology.85
81. Something that has been bemoaned by e.g. Stegbauer and Haußling 2010a or White 1992 that
methodologies have only been refined but not innovated anymore since the 1980s.82. This assessment might also be the result of the different focus on developing a digital hermeneutics
and methodological literacy instead of on (historical) argument, as described in section 6.2.3 on “Keeping
promises.”83. Translated from French by the author: “The historian of the future will be a programmer, or he
will no more.”84. E.g., of claims of “big data evangelists” such as Anderson (2008), “the data does not speak for
themselves” (Lindgren 2020, p. 13). Lindgren (2020, p. 13) called this “mythological beliefs” that “a
higher form of truth [...] can be computationally distilled rather than interpretively achieved.”85. Referred to the law of the instrument introduced by Kaplan ([1964] 2017), Maslow (1966) described
in 1966 the cognitive bias to overly rely on the familiarity of a tool, or in this case, a methodology, even
197

Chapter 6 Discussion
The underlying problem of such “technical solutionism” is that any method will give
some result at any time. The question remains however how valid these results are, and
how robust. Are the findings actually meaningful? Does the applied method help gather
new knowledge on the object of research? Baum and Stacker (2015, p. 5) warned about
that not everything technically feasible is also worthwhile for scientific insights.86
From a normative perspective, DH-projects need to be funded in a research direction
based on humanities’ approaches: domain knowledge from the humanities are key to be
able to interpret the findings of the interdisciplinary (digital/computational) method.
This should help avoid attempts to “code breaking [...] human society” (Hitchcock
2011). A Science article on “Quantitative analysis of culture using millions of digitized
books” by Michel et al. (2011b) became a “caricature for over-exuberance” (Crymble
2021, p. 39) that dit not “critically discuss [...] why it was interesting, or even whether
it actually represented what it purported to show” (ibid., p. 38), or how a certain term
was used in the past (Hitchcock 2011). Recently, another such article was published
in Nature Communications on the development of trustworthiness in portraits using
machine learning (Safra et al. 2020), which received similar backlash.87
On the other hand, the amount of work needed for data preparation and analysis
sparks what (Baum and Stacker 2015, p. 5) called “digital discomfort” (“digitals Unbe-
hagen”): will this much work actually gain useful insights?
The use of programs for digital humanities was nevertheless until recently for the
most part of programmatic nature and rarely put into practice, due to constraints of
individual prowess, recognition of the importance of actually understanding the technol-
ogy/methodology, and willingness to go beyond familiar techniques. The decision for a
specific tool might not be based on the best fit, but often is the result of the unfamiliarity
of the researcher with other tools, as Flanders and Jannidis (2019a, p. 10) has warned.
This also repeats in the observation by Piotrowski (2020, p. 11) on the persistence of
using e.g., spreadsheets instead of more potent statistical programs such as R (Callaway
et al. 2020, p. 11).
Despite all technical advances, key to research are still “explicitly formulated hypothe-
ses” (Clubb and Allen 1967, p. 605) and to do more pronounced inferences “beyond
mined correlations followed by post hoc interpretations” (Piotrowski and Fafinski 2020,
p. 6). The goal is a historia ornata of accurate historical interpretation and analysis
in contrast to the historia nuda of dates, people and events (Fickers 2017). All those
technical new tools aside, in its core digital history is still a very hands-on profession:
The big databases are created by hand in archives, where the historian spends years of
their life to accumulate entries about original sources (Graham et al. 2016).
though it might not be fitting for the task ahead.86. This reads in German: “Nicht alles, was Technische [...] machbar erscheint, ist fur den wis-
senschaftlichen Erkenntnisgewinn much sinnvoll.”87. Compare to section 6.3.1.
198

6.3 Challenges and implications
Sustainability of research
Another aspect of interdisciplinary research is that of sustainability. This entails for
one that the developed methodologies and models can be adapted to fit more than one
project only. Guldi (2020, p. 328) painted a future of inter-fruitful research in which “the
topic models used here to analyze German humanist discourse” gets recycled “elsewhere
to [e.g.,] study the history of British parliamentary debates about infrastructure and
20th-century American newspaper coverage of cities”; and its training retained for more
uses. This ignores but that each model has to be trained again on the particular dataset.
For two, another requisite of sustainable research would be the expansion and combi-
nation of available data repositories as Linked Open Data in the context of Open Science.
Edelstein et al. (2017, pp. 417, 423–4) identified as the current challenges in this data
pooling and harmonization in standards in a LOD cyber-infrastructure. Despite the suc-
cesses in digitization processes in the last three decades, concerns remain in this context
how memory and heritage institutions can be enabled to “share [...] metadata without
relinquishing full control of it” (Hotson 2019, p. 451).
Interoperability of data still remains a challenge and promise unfulfilled (Bauman 2011;
D. Schmidt 2014), as it would need a shared understanding and shared conceptualizing
of data (Rehbein 2020, p. 263). Current developments such as the NFDI however are
pointing into such a direction.
6.3.4 Next steps in future research avenues
Next steps in regards to the specific case studies of this thesis involve the integration
of further court records from earlier and latter years of the Corporate State to further
evaluate the sentence practice, and to compare their results to those of qualitative schol-
arship. In a further development of this study, text mining approaches can be applied on
the court records made machine-processable in text format in order to track how these
differences in sentence practices regarding to political partisanship were semantically
constructed.
In regard to the history of intellectuals, we would like to extend our analysis on a dif-
ferent source basis. The analyses made in the series of case studies iterated the abstract
and ‘broad stroke’ representation of the history of intellectuals as recorded in YAGO
and its data providers. Ideally, we would like to extend the database for a representative
and global outlook, and to apply the established methods and conceptualization of the
YAGO network on a more ‘fine-grained’ influence network that takes more than the
‘most important’ influences of the ‘most important’ intellectuals into account derived
from e.g., primary sources or compendia on the history of intellectuals. This could be
used for a further evaluation of the dynamics of intellectual influences, and to compare
those tho the YAGO3 dataset. Furthermore, a more fluid or extended interpretation of
the disciplines of each intellectual (considering different or multiple disciplines) would
serve for a robustness evaluation of the formation of the computationally detected com-
199

Chapter 6 Discussion
munities. Further progress would entail an in-depth analysis of the interrelations of core
groups (which remain unchained) and their floating members (which ‘switch’ communi-
ties throughout the periods) with other communities.
6.3.5 A long way towards digital competences coming of age
Better, faster, bigger – harder
The long history of integrating technology in humanities’ scholarship shows that almost
everything can be bigger, better, and faster: The assessment of what is to be considered
big and feasible research changed continuously. While research (and work) became
easier through an eased and extended access to sources and bibliography, at the same
time, research also grew harder (similarly noted e.g., by Romein et al. 2020, p. 20) as the
requirements of domain-specific and methodological knowledge are constantly expanded,
and reached “sheer overwhelming scale[s]” (Guldi 2020, p. 331). Fickers (2020) also spoke
about a “methodological and epistemological double taxation.” This constant “task of
keeping up” (Guldi 2020, p. 331) also provides a great deal of stress on all those involved.
In order to counteract those notions, the idea of “slow scholarship in the Digital Age”
was introduced in Leeds in 2014, and published in a series of papers (Karkov 2019).
The very focus of computational methodology and quantitative analysis actually is
considered “repellant to many historians” (Decker 2020), and constitutes a hinderance
on the way to become included to the “general toolkit of humanistic inquiry” (Rehbein
2020, p. 258). Another aspect to why not many humanities embark on this course:
it is hard and needs effort. Using computer-based methods and approaches requires a
vast range of literacies from data to methods to tools and presentation, and are filled
with snares and pitfalls despite their appearance of easy results with a simple click of a
button.88
Towards better research
Finally, the success and goal of the DH ultimately lies in to provide better and more
reflected research.
This entails the sometimes not so obvious: to make research more inclusive. Some
strands in the DH embrace a greater diversity in research from the side of the researchers–
highlighting and/or including the work of BIPoC and LGBTQ+ researchers–as well as a
content-based focus on the histories of marginalized people in a post-colonial discourse
(see e.g., “Disrupting the Digital Humanities” edited by Kim and Stommel 2018; Risam
2016; Ruberg et al. 2018; or the new volume on “Exploring Digital Humanities in In-
dia” intended to “decolonialising the humanities in India and adapting emerging digital
cultures developing in India to wider uses” by Dodd 2020).
88. Compare to section 6.3.1.
200

6.3 Challenges and implications
This also entails to make ethical research: Any analysis has an ethical dimension in
the terms of the political implications and social dimensions; as we have established,
machine-based analysis and digital processing are not free of assumptions or biases
(Baum and Stacker 2015, p. 5; compare also to Bunz 2012).89 While this is more
problematic when using social media data, also humanities data features problem areas
such as access, consent, copyright, privacy, security, and public consideration when dis-
playing data online, and questions of provenance, provenience, and custody (compare
e.g., Kitchin 2014), as well as safeguards for manipulations, censorship, or various forms
information control.90 Better research means to reflect on inherent biases and possible
discrimination that would otherwise implicitly or explicitly guide the subsequent analy-
sis, and to cater to the ethical dimensions of the datas provenance (Arguing with Digital
History working group 2017, p. 10).
We agree here with the assertion by Fridlund (2020, p. 70): Better research and gen-
erating greater understanding should be the fundamental goal in any research project
regardless of applying analogue or digital methodologies. However, when working with
digital objects–which is hardly unavoidable–a certain critical literacy is requisite (Mayer
2016; During and Kerschbaumer 2016). Guldi (2020, p. 332) contrasted the compe-
tences needed as a new normal. The mentioned literacies–computational, digital, data,
methodological, visual–are important both for the researcher applying these techniques
and for the reader on the receiving end of the research, as the production and dissem-
ination of knowledge are deeply interconnected Establishing these literacies means to
loose the “naivety in the handling of the digital” as Romein et al. (2020, p. 3) put this
and to “open up the black box of digital analysis” (Guldi 2020, p. 333). A critical
thinking about the motives and limits of particular kinds of research, the constraints
of the research process, and the influences of the research design, e.g., which keywords,
tools, or algorithms that were used and how these choices influence the results (see e.g.,
Romein et al. 2020, p. 20), are fit to “highlight the distance between interpretive work
and computational work in each research process” and to make “the process of curation,
critical inquiry, secondary reading and interpretation [that] remain at the heart of schol-
arly inquiry” transparent, as Guldi (2020, p. 343) demands. The approach taken needs
to be made as explicit as possible to allow for a proper review: Does the model suffice?
Which biases are at play?
This thesis identifies the complementation of methodologies as the core of the fruitful
integration of computational methodologies, tools, and digital hermeneutics of the digital
humanities. These approaches provide a magnifying glass or prism for historical research
89. Another aspect of this is that of information control. As Tiffert (2019) has shown information does
not remain untampered after digitization, i.e. censorship or information control as in the removal of
access to certain documents in the knowledge platform JSTOR in China.90. In this context, the study by Tiffert (2019) raised awareness about the silent commission of certain
articles for a Chinese audience by respected online providers such as the knowledge platform JSTOR,
the collections of Cambridge University Press online edition of The China Quarterly, or Springer Nature.
201

Chapter 6 Discussion
in order to fulfill the prospects of DH.91 A pronounced method (tool) criticism needs to
be paired with a digital source criticism and digital hermeneutics in order to evaluate
the quality of analysis, relationship between the digital reproduction and the analogue
‘original’ (including a commitment to the full disclosure of the actual sources consulted
(Blaney and Siefring 2017) following the ontological and source critical implications) and
its consequences for the production and processing of data.92 Any analysis can only be
as good as the available source material; this follows the familiar aphorism in computer
science of ‘garbage in, [means] garbage out’. Gramsch (2016, p. 89) warned that the
available source materials have to guide the potential analysis. Ultimately, diligent
and reflected research generates better understanding and extends our knowledge with
(possibly new or) deeper insights.
The spread of computational and digital literacy in the humanities and in the DH need
to derive to a certain digital maturity, a digital coming of age: the responsible and
reflective digital “Mundigkeit” of a digital hermeneutical approach in critical reflected
research combining computational, quantitative, qualitative and digital methodologies
and bridging all disciplinary borders.
91. Refer to section 6.2 “Impact of the DH.”92. Compare to section 6.3.1.
202

Bibliography
Aarseth, Espen. 1997. “The field of Humanistic Informatics and its relation to the hu-
manities.” Human IT: Journal for Information Technology Studies as a Human
Science 1 (4). https://humanit.hb.se/article/view/259.
Ahnert, Ruth and Ahnert, Sebastian E. 2015a. “Protestant Letter Networks in the Reign
of Mary I: A Quantitative Approach.” Annotated version for “Models of Argument-
Driven Digital History”. Original article published in: English Literary History 82,
no. 1 (2015): 1–33, doi=10.1353/elh.2015.0000. doi:10.31835/ma.2021.04.
. 2015b. “Protestant Letter Networks in the Reign of Mary I: A Quantitative
Approach.” Spring, English Literary History 82 (1): 1–33. doi:10.1353/elh.2015.
0000.
Allington, Daniel, Brouilette, Sarah, and Columbia, David. 2016. “Neoliberal Tools (and
Archives): A Political History of Digital Humanities.” Los Angeles Review of Books
(website). https://lareviewofbooks.org/article/neoliberal-tools-archives-political-
history-digital-humanities/.
Anderka, Maik. 2013. “Analyzing and predicting quality flaws in user-generated con-
tent: the case of Wikipedia.” PhD Thesis, Professur Content Management/Web-
Technologien. Faculty of Media. Bauhaus University Weimar. doi:10.25643/bauhau
s-universitaet.1977.
Anderson, Margo. 2007. “Quantitative History.” In The SAGE Handbook of Social Sci-
ence Methodology, edited by William Outhwaite and Stephen P. Turner, 248–264.
London: Sage. doi:10.4135/9781848607958.n14.
Arguing with Digital History working group. 2017. Digital History and Argument. WHITE
PAPER. https://rrchnm.org/argument-white-paper/.
Armitage, David. 2014. “The International Turn in Intellectual History.” In Rethinking
Modern European Intellectual History, edited by Darrin M. McMahon and Samuel
Moyn, 232–252. Oxford University Press. DOI:10.1093/acprof:oso/9780199769230.
003.0012.
Aydelotte, William O. 1966. “Quantification in History.” The American Historical Re-
view 71 (3): 803–825.
203

Bibliography
Ayers, Edward L. 1999. “The Pasts and Futures of Digital History.” VCDH Virginia
Center for Digital History (website). http://www.vcdh.virginia.edu/PastsFutures.
html.
Bachmann-Medick, Doris. 2016. Cultural Turns. New Orientations in the Study of Cul-
ture. Berlin: De Gruyter. doi:10.1515/9783110402988.
Baker, James. 2019a. “Digital Forensics in the House of Lords: six themes relevant to
historians (Part One).” Software Sustainability Institute (website). https://softw
are.ac.uk/blog/2019- 03- 29- digital- forensics- house- lords- six- themes- relevant-
historians-part-one.
. 2019b. “Digital Forensics in the House of Lords: six themes relevant to historians
(Part Two).” Software Sustainability Institute (website). https://software.ac.uk/
blog/2019-04-05-digital-forensics-house-lords-six-themes-relevant-historians-part-
two.
Barabasi, Albert-Laszlo. 2002. Linked: the new science of networks. Cambridge: Perseus.
Barabasi, Albert-Laszlo and Albert, Reka. 1999. “Emergence of scaling in random net-
works.” Science, no. 286: 509–512.
Baring, Edward. 2016. “Ideas on the Move: Context in Transnational Intellectual His-
tory.” Journal of the History of Ideas 77 (4): 567–587. doi:10.1353/jhi.2016.0031.
https://muse.jhu.edu/article/635628.
Barnes, John A. 1954. “Class and committees in a Norwegian island parish.” Human
Relations (Sage CA: Thousand Oaks, CA) 7 (1): 39–58.
Batagelj, Vladimir, Doreian, Patrick, Ferligoj, Anuska, and Kejzar, Natasa. 2014. Un-
derstanding Large Temporal Networks and Spatial Networks: Exploration, Pattern
Searching, Visualization and Network Evolution. First. Wiley Series in Computa-
tional and Quantitative Social Science. John Wiley & Sons, Ltd.
Bauer, Kurt. 2001. “Aspekte des nationalsozialistischen Juliputsches 1934.” PhD Thesis,
University of Vienna.
Baum, Constanze and Stacker, Thomas. 2015. “Methoden – Theorien – Projekte.” In
Grenzen und Moglichkeiten der Digital Humanities, edited by Constanze Baum and
Thomas Stacker. (= Sonderband der Zeitschrift fur digitale Geisteswissenschaften)
PDF Format ohne Paginierung.
Bauman, Syd. 2011. “Interchange vs. Interoperability.” Presented at Balisage: The Markup
Conference 2011, Montreal, Canada, August 2 – 5, 2011, Proceedings of Balisage:
The Markup Conference 2011. Balisage Series on Markup Technologies 7. doi:10.
4242/BalisageVol7.Bauman01.
204

BBC.com. 2019. “Retirement age: Poland broke EU law with ruling on judges.” BBC
News. https://www.bbc.com/news/world-europe-50302102.
Beck, Friedrich and Henning, Eckhart, eds. 1994. Die archivalischen Quellen. Eine
Einfuhrung in hire Benutzung. Weimar: Verlag Hermann Bohlaus Nachfolger Weimar.
Becker, Howard. 1952. “Science, Culture, and Society.” Philosophy of Science 19 (4):
273–287. https://www.jstor.org/stable/185394.
Bednarczuk, Monika. 2017. “Gottfried Groddeck im Netz: Historische Konstellationen,
Gelehrtennetzwerke und Wissenstransfer in Mittelosteuropa an der Schwelle vom 18.
zum 19. Jahrhundert.” Zeitschrift fur Slawistik 62 (4): 518–546. doi:10.1515/slaw-
2017-0034.
Belknap, Michal R. 1994. “Introduction: Political Trials in the American Past.” In Amer-
ican Political Trials, edited by Michal R. Belknap, xiii–xxviii. Contributions in
American History 152. Santa Barbara: Greenwood Publishing Group.
“Berlin Declaration on Open Access to Knowledge in the Sciences and Humanities.”
2003. https://openaccess.mpg.de/67605/berlin declaration engl.pdf.
Berry, David. 2011. “The Computational Turn: Thinking about the digital humanities.”
Culture machine 12.
Best, Joel. 2005. “Lies, Calculations and Constructions: Beyond How to Lie with Statis-
tics.” Statistical Science 20 (3): 210–214. doi:10.1214/088342305000000232.
Biemann, Chris, Crane, Greogry R., Fellbaum, Christiane D., and Mehler, Alexander.
2014. Computational Humanities – Bridging the Gap Between Computer Science
and Digital Humanities. Report from Dagstuhl Seminar 14301, Schloss Dagstuhl.
Leibniz-Zentrum fur Informatik. https://drops.dagstuhl.de/opus/volltexte/2014/
4792/pdf/dagrep v004 i007 p080 s14301.pdf.
Bizer, Christian, Heath, Tom, and Berners-Lee, Tim. 2009. “Linked data - the story so
far.” International Journal on Semantic Web and Information Systems 5 (3): 1–22.
Black, Chad. 2010. “how far have we come in the digital humanities?” parezco y digs.
Reflections. On Early Latin America and Digital History (blog). https://parezcoyd
igo.wordpress.com/2010/10/14/how-far-have-we-come-in-the-digital-humanities/.
Blaney, Jonathan and Siefring, Judith. 2017. “A Culture of Non-Citation: Assessing
the Digital Impact of British History Online and the Early English Books Online
Text Creation Partnership.” Digital Humanities Quarterly 11 (1). http://www.
digitalhumanities.org/dhq/vol/11/1/000282/000282.html.
Blei, David M., Ng, Andrew Y., and Jordan, Michael I. 2003. “Latent Dirichlet Alloca-
tion.” Journal of Machine Learning Research 3:993–1022.
205

Bibliography
Blevins, Cameron. 2016. “Digital History’s Perpetual Future Tense.” In Debates in the
Digital Humanities 2016, edited by Matthew K. Gold and Lauren F. Klein. Uni-
versity of Minnesota Press. https://dhdebates.gc.cuny.edu/read/untitled/section/
4555da10-0561-42c1-9e34-112f0695f523.
Block, Per, Stadtfeld, Christoph, and Snijders, Tom A. B. 2019. “Forms of Dependence:
Comparing SAOMs and ERGMs From Basic Principles.” Sociological Methods &
Research 48 (1): 202–239. doi:10.1177/0049124116672680.
Bloothooft, Gerrit, Christen, Peter, Mandemakers, Kees, and Schraagen, Marijn. 2015.
Population reconstruction. Cham: Springer. doi:10.1007/978-3-319-19884-2.
Bock, Hans Georg, Jager, Willi, and Winckler, Michael J., eds. 2013. Scientific Com-
puting and Cultural Heritage. Contributions in Computational Humanities. Vol. 3.
Contributions in Mathematical and Computational Sciences. Berlin Heidelberg:
Springer. doi:10.1007/978-3-642-28021-4.
Bode, Katherine. 2020. “Why You Can’t Model Away Bias.” Modern Language Quarterly
81 (1). doi:10.1215/00267929-7933102.
Bohlin, Ludvig, Edler, Daniel, Lancichinetti, Andrea, and Rosval, Martin. 2014. “Com-
munity Detection and Visualization of Networks with the Map Equation Frame-
work.” In Measuring Scholarly Impact : Methods and Practice, 3–34. doi:10.1007/
978-3-319-10377-8.
Boissevain, Jeremy Fergus. 1974. Friends of friends: networks, manipulators and coali-
tions. Oxford: Blackwell.
Bonacich, Phillip. 1987. “Power and Centrality: A family of measures.” American Journal
of Sociology 92 (5): 1170–1182.
Booch, Grady. 2020. “This paper is an epic failure on every level: assumptions, pro-
cess, data science, and ethical foundations. Bad science, all around.” Twitter (social
media). https://twitter.com/Grady Booch/status/1309341161094479876.
Boonstra, Onno, Breure, Leen, and Doorn, Peter. (2004) 2006. “Past, Present and Future
of Historical Information Science.” (Amsterdam).
Boorman, Scott A. and White, Harrison C. 1976. “Social Structure from Multiple Net-
works. Blockmodels of Roles and Positions II: Role Structures.” American Journal
of Sociology 81:1384–1446.
Borgatti, Stephen P. and Everett, Martin G. 1989. “The class of all regular equivalences:
Algebraic structure and computation.” Social Networks 11 (1): 65–88.
. 1997. “Network analysis of 2-mode data.” Social Networks 19 (3): 243–270.
206

Borgatti, Stephen P. and Lopez-Kidwell, Virginie. 2011. “Network Theory.” In The
SAGE Handbook of Social Network Analysis, edited by John Scott and Peter J.
Carrington, 40–54. London: Sage Publications. doi:10.4135/9781446294413.n4.
Borgman, Christine L. 2015. Big Data, Little Data, No Data. Scholarship in the Net-
worked World. Cambridge, Massachusetts, London, England: The MIT Press.
Bott, Elizabeth. 1957. Family and social network: roles, norms, and external relationships
in ordinary urban families. London: Tavistock Publications.
Botz, Gerhard. 1980. “Die Osterreichischen NSDAP-Mitglieder: Probleme einer quanti-
tativen Analyse aufgrund der NSDAP-Zentralkartei in Berlin Document Center.”
In Die Nationalsozialisten: Analysen faschistischer Bewegungen, edited by Rein-
hard Mann, 98–136. Historisch-Sozialwissenschaftliche Forschungen: quantitative
sozialwissenschaftliche Analysen von historischen und prozeß-produzierten Daten 9.
Stuttgart: Klett-Cotta.
. 1985. “Faschismustheorien Otto Bauers.” In Otto Bauer 18881–1938. Theorie
und Praxis, edited by Erich Froschl, 161–192. Vienna: Europa-Verlag.
. 1995. “Zum Verhaltnis von Politik und Rechtswesen in der Ersten Republik.” In
Justiz und Zeitgeschichte. Symposionsbeitrage 1976-1993, edited by Erika Weinzierl,
Oliver Rathkolb, Rudolf Ardelt, and Siegfried Mattl, vol. 1. Vienna.
Boujlaleb, Loubna, Idarrou, Ali, and Mammass, Driss. 2017. “Tracking Community Evo-
lution in Social Networks.” Journal of Theoretical and Applied Information Tech-
nology 95 (22): 6127–6137.
Bourdieu, Pierre. 1969. “Intellectual field and creative project.” Social Science Informa-
tion 8 (2): 89–119. doi:10.1177/053901846900800205.
. (1979) 1983. Die feinen Unterschiede. Kritik der gesellschaftlichen Urteilskraft.
French: ”La distinction. Critique sociale du jugement” Paris. Frankfurt a. Main.
Box-Steffensmeier, Janet M. and Christenson, Dino P. 2014. “The evolution and forma-
tion of amicus curiae networks.” Social Networks, Special Issue on Political Net-
works, 36:82–96. doi:10.1016/j.socnet.2012.07.003.
Box-Steffensmeier, Janet M., Christenson, Dino P., and Leavitt, Claire. 2016. “Judicial
Networks.” Edited by Jennifer N. Victor, Alexander H. Montgomery, and Mark
Lubell. The Oxford Handbook of Political Networks. doi:10.1093/oxfordhb/9780190
228217.013.20.
boyd, dana and Crawford, Kate. 2012. “Critical Questions for Big Data. Provocations for
a cultural, technological, and scholarly phenomenon.” Information, Communication
& Society 15 (5): 662–678. doi:10.1080/1369118X.2012.678878.
207

Bibliography
Brandes, Ulrik, Lerner, Jurgen, Lubbers, Miranda J, McCarty, Chris, and Molina, Jose
Luis. 2008. “Visual statistics for collections of clustered graphs.” In Visualization
Symposium PacificVIS’08, 47–54. IEEE Pacific.
Braudel, Fernand. 1949. La mediterranee et le mode mediterraneen a l’epooch de Philippe
II. Paris: Armand Colin.
. 1966. La mediterranee et le mode mediterraneen a l’epooch de Philippe II. Ex-
tended version in 2 volumes. 1949: Armand Colin.
Breckmann, Warren. 2014. “Intellectual History and the Interdisciplinary Ideal.” In
Rethinking Modern European Intellectual History, edited by Darrin M. McMahon
and Samuel Moyn, 275–294. Oxford University Press. DOI:10.1093/acprof :oso/
9780199769230.003.0014.
Brennen, Scott and Kreiss, Daniel. 2014. “Digitalization and Digitization.” Culture Dig-
itally (blog). http://culturedigitally.org/2014/09/digitalization-and-digitization/.
Bright, David, Brewer, Russel, and Morselli, Carlo. 2021. “Using social network anal-
ysis to study crime: Navigating the challenges of criminal justice records.” Social
Networks 66:55–64. doi:10.1016/j.socnet.2021.01.006.
Brugger, Niels and Milligan, Ian, eds. 2019. The SAGE Handbook of Web History. Lon-
don: SAGE. doi:10.4135/9781526470546.
Bullough, Vern L. 1967. “The Computer and the Historian: Some Tentative Beginnings.”
Computers and the Humanities 1 (3): 61–4. https://www.jstor.org/stable/3019921
1.
Bunz, Mercedes. 2012. Die stille Revolution: Wie Algorithmen Wissen, Arbeit, Offentlichkeit
und Politik verandern, ohne dabei viel Larm zu machen. Berlin: Suhrkamp Verlag.
Burcher, Morgan. 2020. Social Network Analysis and Law Enforcement. Cham: Springer
International. doi:10.1007/978-3-030-47771-4.
Burghardt, Manuel and Wolff, Christian. 2014. “Digital Humanities: Buzzword oder
Strukturwandel der Geisteswissenschaften? Stand und Perspektiven anhand Regens-
burger Beispiele.” Blick in die Wissenschaft. Forschungsmagazin der Universitat
Regensburg (blog), 39–46.
Burt, Ronald S. 1992. Structural Holes. The Social Structure of Competition. Cambridge,
MA: Harvard University Press.
. 2005. Brokerage and Closure: An Introduction to Social Capital. Oxford Univer-
sity Press.
208

Busse, Laura, Enderle, Wilfried, Hohls, Rudiger, Meyer, Thomas, Prellwitz, Jens, and
Schuhmann, Annette, eds. 2018. Clio-Guide. Ein Handbuch zu digitalen Ressourcen
fur die Geschichtswissenschaften. 2. ERW. UND AKTUALISIERTE AUFLAGE.
Vol. 23. Historisches Forum 2. Berlin.
Butts, Carter T. 2008. “A Relational Event Framework for Social Action.” Sociological
Methodology 38:155–299. https://www.jstor.org/stable/20451153.
Callaway, Elizabeth, Turner, Jeffrey, Stone, Heather, and Halstrom, Adam. 2020. “The
Push and Pull of Digital Humanities: Topic Modeling the ”What is Digital Humani-
ties?” Genre.” Digital Humanities Quarterly 14 (1). http://www.digitalhumanities.
org/dhq/vol/14/1/000450/000450.html.
Campana, Paolo and Varese, Federico. 2013. “Cooperation in criminal organizations:
Kinship and violence as credible commitments.” Rationality and Society 25 (3):
263–289. doi:10.1177/1043463113481202.
Cane, Gregory. 2006. “What Do You Do with a Million Books?” D-Lib Magazine 12 (3).
http://www.dlib.org/dlib/march06/crane/03crane.html.
Carroll, William K. and Sapinski, Jean Philippe. 2011. “Corporate Elites and Intercor-
porate Networks.” In The SAGE Handbook of Social Network Analysis, edited by
Peter J. Carrington and John Scott, 180–95. London: SAGE Publications.
Cartwright, Dorwin and Harary, Frank. 1956. “Structural Balance: a generalization of
Heider’s theory.” Psychological Review 63 (5): 277–282.
Casteigts, Arnaud, Flocchini, Paola, Santoro, Nicola, and Quattrociocchi, Walter. 2012.
“Time-varying graphs and dynamic networks.” International Journal of Parallel,
Emergent and Distributed Systems 27 (5): 387–408. doi:10.1080/17445760.2012.
668546.
Cecire, Natalia. 2011. “Introduction: Theory and the Virtues of Digital Humanities.”
Journal of Digital Humanities 1 (1). http : / / journalofdigitalhumanities . org / 1 -
1/introduction-theory-and-the-virtues-of-digital-humanities-by-natalia-cecire/.
Cesarani, Giovanna, Cabiglia, Giorgio, Coleman, Nicole, De Armond, Thea, Murray,
Sarah, and Taylor-Poleskey, Molly. 2017. “British Travelers in Eighteenth-Century
Italy: The Grand Tour and the Profession of Architecture.” The American Historical
Review 122 (2): 425–450. doi:10.1093/ahr/122.2.425.
Ciula, Arianna, Øyvind, Eide, Marras, Cristina, and Sahle, Patrick, eds. 2018. Mod-
els and Modeling between Digital and Humanities: A Multidisplinary Perspective.
Vol. 31. https://nbn-resolving.org/urn:nbn:de:0168-ssoar-62883-7.
Clark, Tom S. and Lauderdale, Benjamin E. 2012. “The Genealogy of Law.” Political
Analysis 20:329–350. doi:10.1093/pan/mps019.
209

Bibliography
Clauset, Aaron, Newman, M. E. J., and Moore, Cristopher. 2004. “Finding Community
Structure in Very Large Networks.” Physical Reviewault E 70 (6): 1–6. doi:10.1103/
PhysRevE.70.066111.
Clubb, Jerome M. and Allen, Howard. 1967. “Computers and Historical Studies.” The
Journal of American History 54 (3): 599–607.
Cohen, Daniel J and Rosenzweig, Roy. 2005. Digital History. A Guide to Gathering,
Preserving, and Presenting the Past on the Web. Philadelphia: University of Penn-
sylvania Press.
Coleman, James S. 1998. “Social Capital in the Creation of Human Capital.” Sup-
plement: Organizations and Institutions: Sociological and Economic Approaches
to the Analysis of Social Structure, American Journal of Sociology 94:S95–S120.
https://www.jstor.org/stable/2780243.
Conrad, Alfred H. and Meyer, John R. 1958. “The Economics of Slavery in the Ante
Bellum South.” The Journal of Political Economy 66 (2): 95–130.
Conway, Paul. 2010. “Preservation in the Age of Google: Digitization, Digital Preserva-
tion, and Dilemmas.” The Library Quarterly: Information, Community, Policy 80
(1): 61–79. https://www.jstor.org/stable/10.1086/648463.
Cookson, Gillian. 1997. “Family Firms and Business Networks: Textile Engineering in
Yorkshire, 1780–1830.” Business History 39 (1): 1–20. doi:10.1080/00076799700000
001.
Cordell, Ryan. 2016. “How Not To Teach Digital Humanities.” In Debates in the Digital
Humanities 2016, edited by Matthew K. Gold and Lauren F. Klein. University of
Minnesota Press. https://dhdebates.gc.cuny.edu/read/untitled/section/31326090-
9c70-4c0a-b2b7-74361582977e#ch36.
. 2017. ““Q I-JTB THE RAVEN” Taking Dirty OCR Seriously.” PROJECT
MUSE, Book History 20:188–225. doi:10.1353/bh.2017.0006.
Cranmer, Skyler J. and Desmarais, Bruce A. 2011. “Inferential Network Analysis with
Exponential Random Graph Models.” Political Analysis 19 (1): 66–86. doi:10.1093/
pan/mpq037.
Crymble, Adam. 2021. Technology and the Historian. Transformation in the Digital Age.
Urbana, Chicago, Springfield: University of Illinois Press.
Cunningham, Adrian. 2008. “Digital Curation/Digital Archiving: A View from the Na-
tional Archives of Australia.” The American Archivist 71 (2): 530–543. https://
www.jstor.org/stable/40294529.
210

Curti, Merle, Daniel, Robert, Livermore Jnr, Shaw, Van Hise, Joseph, and Curti, Mar-
garet M. 1959. The Making of an American Community. A Case Study of Democracy
in a Frontier County. Stanford: Stanford University Press.
Dahmen, Silvio, Bazzan, Ana, and Gramsch, Robert. 2017. “Community Detection in
the Network of German Princes in 1225: A Case Study.” In Complex Networks VIII,
edited by Bruno Gon1.85mmcalves, Ronaldo Menezes, Roberta Sinatra, and Vinko
Zlatic, 193–200. Cham: Springer International Publishing.
Dakiche, Narimene, Tayeb, Fatima Benbouzid-Si, Slimani, Yahya, and Benatchba, Karima.
2019. “Tracking community evolution in social networks: A survey.” Information
Processing & Management 56 (3): 1084–1102.
Dalton, Craig and Thatcher, Jim. 2014. “What Does A Critical Data Studies Look
Like And Why Do We Care?” Society + Space (blog). Accessed 2021-06-13. https:
//www.societyandspace.org/articles/what-does-a-critical-data-studies-look-like-
and-why-do-we-care.
Davis, Allison, Gardner, Burleigh B., and Gardner, Mary R. 1941. Deep South. A social
anthropological study of caste and class. Chicago: University of Chicago Press.
Decker, Michael J. 2020. “The finger of God is here! Past, present and future of digital
history.” The Historian 82:7–21. doi:10.1080/00182370.2020.1725720.
Delisle, Candice. 2008. “Accessing Nature, Circulating Knowledge: Conrad Gessner’s
Correspondence Networks and his Medical and Naturalist Practices.” In History of
Universities, XXXIII:35–58. 2. Oxford University Press.
Deutsche Forschungsgemeinschaft. 2016. DFG-Praxisregeln “Digitalisierung”. https://
www.dfg.de/formulare/12 151/12 151 de.pdf.
Dilthey, Wilhelm. 1883. Einleitung in die Geisteswissenschaften. Versuch einer Grundle-
gend fur das Studium der Gesellschaft und der Geschichte. Vol. 1. Leipzig: Verpack
von Dunder & Humboldt.
Directorate-General for Education, Youth, Sport and Culture (European Commission).
2019. “Key Competences for Lifelong Learning.” doi:10.2766/569540.
Diviak, Tomas. 2018. “Sinister Connections: How to analyze Organized Crime with Social
Network Analysis?” Acta Universitatis Carolinae 2:115–135. doi:10.14712/2464705
5.2018.7.
Dobson, James E. 2020. Critical Digital Humanities. The Search for a Methodology.
Champaign, IL: University of Illinois Press.
Dodd, Maya. 2020. “Introduction.” In Exploring Digital Humanities in India, edited by
Maya Dodd and Nidhi Kalra. London: Routledge India.
211

Bibliography
Dodd, Maya and Kalra, Nidhi, eds. 2020. Exploring Digital Humanities in India. London:
Routledge India. doi:10.4324/9781003052302.
Doreian, Patrick, Batagelj, Vladimir, and Ferligoj, Anuska. 2005. Generalized Block-
modeling. Structural Analysis in the Social Sciences 25. Cambridge: Cambridge
University Press.
Dreidemy, Lucia and Wenninger, Florian, eds. 2013. Das Dollfuß/Schuschnigg-Regime
1933-1938. Vermessung eines Forschungsfeldes. Vienna: Bohlau Verlag.
Droysen, Johann Gustav. (1882) 1977. Historik. Historisch-kritische Ausgabe von Pe-
ter Leyh. Vol. 1: Rekonstruktion der ersten vollstandigen Fassung der Vorlesungen
(1857). Grundriß der Historik in der ersten handschriftlichen (1857/1858) und in der
letzten gedruckten Fassung (1882). Stuttgart–Bad Cannstatt: frommann–holzboog.
Drucker, Johanna. 2011. “Humanities Approaches to Graphical Display.” Digital Hu-
manities Quarterly 5 (1). http://www.digitalhumanities.org/dhq/vol/5/1/000091/
000091.html.
Drucker, Johanna and Unsworth, John. 2002. “Final Report for Digital Humanities Cur-
riculum Seminar.” IATH. The Institute for Advanced Technology in the Humanities
(website). http://www.iath.virginia.edu/hcs/dhcs/toc.html.
During, Marten. 2015. Verdeckte soziale Netzwerke im Nationalsozialismus: Die Entste-
hung und Arbeitsweise von Berliner Hilfsnetzwerken fur verfolgte Juden. Berlin
Boston: De Gruyter. doi:10.1515/9783110368949.
During, Marten, Eumann, Ulrich, Stark, Martin, and Keyserlingk, Linda von, eds. 2016.
Handbuch Historische Netzwerkforschung: Grundlagen und Anwendungen. Vol. 1.
Munster: LIT Verlag.
During, Marten and Kerschbaumer, Florian. 2016. “Quantifizierung und Visualisierung.
Anknupfungspunkte in den Geschichtswissenschaften.” In Handbuch Historische
Netzwerkforschung: Grundlagen und Anwendungen, edited by Marten During, Ul-
rich Eumann, Martin Stark, and Linda von Keyserlingk, 1:31–44. Munster: LIT
Verlag.
During, Marten, Kerschbaumer, Florian, Keyserlingk-Rehbein, Linda von, and Stark,
Martin, eds. 2020. The Power of Networks. Prospects of Historical Network Re-
search. London New York: Routledge.
Edelstein, Dan. 2016. “Intellectual History and Digital Humanities.” Modern Intellectual
History 13 (1): 237–246.
212

Edelstein, Dan, Findlen, Paula, Ceserani, Giovanna, Winterer, Caroline, and Coleman,
Nicole. 2017. “Historical Research in a Digital Age: Reflections from the Mapping
the Republic of Letters Project.” The American Historical Review 122 (2): 400–424.
doi:10.1093/ahr/122.2.400.
Edelstein, Dan and Kassabova, Biliana. 2020. “How England fell off the Map of Voltaire’s
Enlightenment.” Modern Intellectual History 17 (1): 29–53. doi:10.1017/S14792443
1800015X.
Eisenstein, Elizabeth. 1979. The Printing Press as an Agent of Change: Commincations
and Cultural Transformations in Early Modern Europe. Cambridge New York: Cam-
bridge University Press.
Emirbayer, Mustafa. 1997. “Manifesto for a Relational Sociology.” American Journal of
Sociology 103 (2): 281–317.
Emsley, Clive, Hitchcock, Tim, and Shoemaker, Robert. 2018. “The Proceedings of the
OLD BAILEY London’t Central Criminal Court, 1674 to 1913.” Version 8. Accessed
2021-07-29. https://www.oldbaileyonline.org/.
Erdos, Paul and Renyi, Alfred. 1959. “On Random Graphs I.” Publicationes Mathemat-
icae Debrecen 6:290–297.
Ernst, Thomas. 2015. “Vom Urheber zur Crowd, vom Werk zur Version, vom Schutz zur
Offnung? Kollaboratives Schreiben und Bewerten in den Digital Humanities.” In
Grenzen und Moglichkeiten der Digital Humanities, edited by Constanze Baum and
Thomas Stacker. (= Sonderband der Zeitschrift fur digitale Geisteswissenschaften)
PDF Format ohne Paginierung. doi:10.17175/sb001 021.
Everitt, B. S. and Skrondal, A. 2010. The Cambridge Dictionary of Statistics. Cambridge:
Cambridge University Press.
Fafinski, Mateusz. 2020. “Historical data. A portrait.” History in Translation (blog).
https://mfafinski.github.io/Historical data/.
Federal Agencies Digital Guidelines Initiative (FADGI). 2016. Technical Guidelines for
Digitizing Cultural Heritage Materials. Creation of Raster Image Files. Edited by
Thomas Rieger. http://www.digitizationguidelines.gov/guidelines/FADGI%5C%
20Federal%5C%20%5C%20Agencies%5C%20Digital%5C%20Guidelines%5C%20%
5CInitiative-2016%5C%20Final rev1.pdf.
Felsch, Philipp. 2015. Der lange Sommer der Theorie: Geschichte einer Revolte. Munchen:
C.H. Beck.
Fernandes Riva, Gustavo. 2019. “Network Analysis of Medieval Manuscript Transmis-
sion. Basic Principles and Methods.” Journal of Historical Network Research 3:30–
49. doi:10.25517/jhnr.v3i1.61.
213

Bibliography
Fickers, Andreas. 2016. “Digitale Metaquellen und doppelte Reflexivitat.” H-Soz-Kult
(blog). www.hsozkult.de/debate/id/diskussionen-2954.
. 2017. “Digital History: On the heuristic potential of thinking.” Conference Talk
at dhnord2017: (De)constructing Digital History, Lille. https://dhnord2017.science
sconf.org/resource/page/id/5.
. 2020. “Update fur die Hermeneutic. Geschichtswissenschaft auf dem Weg zur
digitalen Forensik?” Online-Ausgabe, Zeithistorische Forschungen (/) Studies in
Contemporary History 17 (1). doi:10.14765/zzf.dok-1765.
Fickers, Andreas and Heijden, Tim van der. 2020. “Inside the Trading Zone: Thinkering
in a Digital History Lab.” Digital Humanities Quarterly 13 (3). http : / / www .
digitalhumanities.org/dhq/vol/14/3/000472/000472.html.
Flanders, Julia and Jannidis, Fotis. 2019a. “Data Modeling in a Digital Humanities
Context.” In The Shape of Data in Digital Humanities. Modeling Texts and Text-
Based Resources, edited by Julia Flanders and Fotis Jannidis, 3–25. London New
York: Routledge.
, eds. 2019b. The Shape of Data in Digital Humanities. Modeling Texts and Text-
Based Resources. London New York: Routledge.
Fogel, Robert and Engerman, Stanley L. 1974. Time on the Cross. The economics of
American negro slavery.
Fogel, Robert William. 1964. Railroads and American Economic Growth: Essays in Eco-
nomic History. Baltimore: Johns Hopkins Press.
Fohr, Pascal. 2017. “Historische Quellenkritik im digitalen Zeitalter.” PhD Thesis, Uni-
versity of Basel, Faculty of Humanities and Social Sciences. doi:10.5451/unibas-
006805169.
Fortunato, Santo. 2010. “Community Detection in Graphs.” Physics Reports 486 (3):
75–174. doi:https://DOI.org/10.1016/j.physrep.2009.11.002.
Foucault, Michel. (1969) 1973. Archaologie des Wissens. French: ”L’Archeologie du
savoir”, Gallimard, Paris. Frankfurt a. Main: Suhrkamp.
Fraenkel, Ernst. (1927) 1968. “Zur Soziologie der Klassenjustiz.” In Zur Soziologie der
Klassenjustiz und Aufsatze zur Verfassungskrise 1931-32, edited by Ernst Fraenkel,
1–41. Mit einem Vorwort zum Neudruck. Darmstadt: Wissenschaftliche Buchge-
sellschaft.
Freeman, Linton C. 1978. “Centrality in Social Networks. Conceptual Clarification.”
Social Networks 1:215–239.
214

. 2003. “Finding Social Groups: A Meta-Analysis of the Southern Women Data.”
In Dynamic Social Network Modeling and Analysis, edited by R. Breiger, C. Carley,
and P. Pattison, 39–97. Washington DC: The National Academies Press.
. 2004. The development of social network analysis: a study in the sociology of
science. Vancouver, BC: Empirical Press.
Fridlund, Mats. 2020. “Digital History 1.5: A Middle Way between Normal and Paradig-
matic Digital Historical Research.” In Digital Histories: Emergent Approaches within
the new Digital History, edited by Mats Fridlund, M. Oiva, and P. Paju, 69–87.
Helsinki: Helsinki University Press. doi:10.33134/HUP-5-4.
Fuhse, Jan. 2010. “Menschenbild.” In Handbuch Netzwerkforschung, edited by Christian
Stegbauer and Roger Haußling, 4:167–176. Wiesbaden: VS Verlag fur Sozialwis-
senschaften.
. 2020. “Theories of Social Networks.” The Oxford Handbook of Social Networks:
34–49.
Fuller, Matthew. 2006. “Software Studies Workshop.” Accessed via the Internet Archive
Waybackmachine, version 2006. Accessed 2021-08-16. https://web.archive.org/we
b/20060217043644/http://pzwart.wdka.hro.nl/mdr/Seminars2/softstudworkshop.
Gaffield, Chad. 2018. “Words, Words, Words: How the Digital Humanities are Integrating
Diverse Research Fields to Study People.” Annual Reviews of Statistics and Its
Application 5:119–139. doi:10.1146/annurev-statistics-031017-100547.
Gamper, Markus, Reschke, Linda, and During, Marten. 2015a. “Das Millenium der
Netzwerkforschung? Die Bedeutung eines relationalen Paradigmas in der interna-
tionalen und deutschen Wissenschaft.” In Knoten und Kanten III. Soziale Netzw-
erkanalyse in Geschichts- und Politikforschung, edited by Markus Gamper, Linda
Reschke, and Marten During, 7–50. transcript Verlag. doi:10.14361/9783839427422-
001.
, eds. 2015b. Knoten und Kanten III. Soziale Netzwerkanalyse in Geschichts- und
Politikforschung. transcript Verlag.
Ganger, Stefanie and Lewis, Su Lin. 2013. “Forum: A world of ideas: New pathways in
global intellectual history, c.1880-1930.” Modern Intellectual History 10 (2). doi:10.
1017/S1479244313000048.
Gehlen, Arnold. (1940) 1986. Der Mensch. Seine Natur und seine Stellung in der Welt.
13th ed. Wiesbaden: Aula-Verlag.
215

Bibliography
Ghawi, Raji, Petz, Cindarella, and Pfeffer, Jurgen. 2019. “‘On the Shoulders of Giants’
– Analysis of a Social Network of Intellectual Influence.” In Sixth International Con-
ference on Social Networks Analysis, Management and Security (SNAMS), Granada,
Spain, 248–255. doi:10.1109/SNAMS.2019.8931821.
. 2021. “Diffusion Dynamics of Influence in a Social Network of Intellectuals.”
Social Network Analysis and Mining (SNAM) 11 (63). doi:10.1007/s13278- 021-
00771-x.
Ghawi, Raji and Pfeffer, Jurgen. 2019. “Mining Social Networks from Linked Open
Data.” In Graph-Based Representation and Reasoning, edited by Dominik Endres,
Mehwish Alam, and Diana 1.85mmSotropa, 221–229. Cham: Springer International
Publishing.
Girvan, Michelle and Newman, Mark. 2002. “Community Structure in Social and Bio-
logical Networks.” Proceedings of the National Academy of Sciences 99 (12): 7821–
7826. doi:10.1073/pnas.122653799.
Gitelman, Lisa and Jackson, Virginia. 2013. “Introduction.” In “Raw Data” is an Oxy-
moron, edited by Lisa Gitelman, 1–14. Cambridge, Massachusetts and London, Eng-
land: MIT Press.
Gius, Evelyn and Jacke, Janina. 2020. “Sinn und Unsinn von Strukturalismus in den Dig-
ital Humanities. Betrachtungen zur Theorie und Methode in der digitalen Literatur-
wissenschaft.” Lecture at Workshop “Theory Tellings in den Digital Humanities”,
Universitat Leipzig, Oct. 08 – 09, 2020.
Gluckman, Max. 1955. The judicial process among the Barotse of Northern Rhodesia.
Manchester: Manchester University Press.
Godley, Andrew and Ross, Duncan M. 1996. “Introduction: Banks, Networks and Small
Firm Finance.” Business History 38 (3): 1–10. doi:doi.org/10.1080/0007679960000
0091.
Goldman, Harvey. 1994. “From social theory to sociology of knowledge and back: Karl
Mannheim and the sociology of intellectual knowledge production.” Sociological
Theory: 266–278.
Gordon, Peter E. 2013. “What is Intellectual History? A Frankly Partisan Introduction
to a Frequently Misunderstood Field.” http://projects.iq.harvard.edu/files/history/
files/what is intell history pgordon mar2012.pdf.
Gordon, Scott. (1991) 2003. The history and philosophy of social science. Taylor &
Francis e-Library.
Gould, Roger V. 1995. Insurgent identities: Class, community, and protest in Paris from
1848 to the Commune. Chicago: University of Chicago Press.
216

Gould, Roger V. and Fernandez, Roberto M. 1989. “Structures of Mediation: A Formal
Approach to Brokerage in Transaction Networks.” Sociological Methodology 19:89–
126. doi:10.2307/270949.
Grafton, Anthony. 2009a. “A Sketch Map of a Lost Continent: The Republic of Letters.”
Republic of Letters: A Journal for the Study of Knowledge, Politics, and the Arts 1
(1). http://rofl.stanford.edu/node/34.
. 2009b. Worlds Made by Words: Scholarship and Community in the Modern
West. Cambridge, MA: Harvard University Press.
Graham, Shawn, Milligan, Ian, and Weingart, Scott. 2016. Exploring Big Historical Data.
The Historian’s Macroscope. London: Imperial College Press.
Graham, Shawn and Ruffini, Giovanni. 2007. “Network Analysis and Greco-Roman
Prosopography.” In Prosopography Approaches and Applications. A Handbook, 579–
601.
Gramsch, Robert. 2013. Das Reich als Netzwerk der Fursten: politische Strukturen unter
dem Doppelkonigutm Friedrichs II. Und Heinrichs (VII.) 1225–1235. Vol. 40. Mittelalter-
Forschungen. Zus.: Jena, Univ., Habil.-Schr. 2009. Ostfildern. doi:10.11588/diglit.
34756.
. 2016. “Zerstorte oder verblasste Muster? Anwendungsfelder mediavistischer
Netzwerkforschung und das Quellenproblem.” In Handbuch Historische Netzwerk-
forschung: Grundlagen und Anwendungen, edited by Marten During, Ulrich Eu-
mann, Martin Stark, and Linda von Keyserlingk, 1:85–100. Munster: LIT Verlag.
Gramsch-Stehfest, Robert. 2020. “Community detection and structural balance. Network
analytical modelling of political structures and actions in the Middle Ages.” In The
Power of Networks. Prospects of Historical Network Research, edited by Florian
Kerschbaumer, Linda von Keyserlingk-Rehbein, Martin Stark, and Marten During,
37–55. London New York: Routledge.
Grandjean, Martin. 2015. “GEPHI – Introduction to Network Analysis and Visualiza-
tion.” Martin Grandjean (blog). Accessed 2020-09-01. http://www.martingrandjea
n.ch/gephi-introduction/.
Granovetter, Mark. 1973. “The strength of weak ties.” American journal of sociology 78
(6): 1360–1380.
. 1979. “The theory-gap in social network analysis.” In Perspectives on Social
Network Research, 501–518. Elsevier.
Granovetter, Mark S. 1985. “Economic Action and Social Structure: The Problem of
Embeddedness.” American Journal of Sociology 91:481–510. https://www.jstor.
org/stable/2780199.
217

Bibliography
Greene, Derek, Doyle, Donal, and Cunningham, Padraig. 2010. “Tracking the Evolution
of Communities in Dynamic Social Networks.” In Proceedings of the 2010 Interna-
tional Conference on Advances in Social Networks Analysis and Mining, 176–183.
ASONAM ’10. USA: IEEE Computer Society. doi:10.1109/ASONAM.2010.17.
Gregory, Ian, Donaldson, Christopher, Murrieta-Flores, Patricia, and Rayson, Paul.
2015. “Geoparsing, GIS, and textual analysis: current developments in spatial hu-
manities research.” International Journal of Humanities and Arts Computing 9 (1):
1–14.
Greif, Avner. 1997. “Cliometrics After 40 Years.” The American Economic Review 87
(2): 400–403. https://www.jstor.org/stable/2950953.
Grimmer, Justin and Stewart, Brandon. 2013. “Text as Data: The Promise and Pit-
falls of Automatic Content Analysis Methods for Political Texts.” Political Analysis
Advance 21 (3): 267–297. doi:10.1093/pan/mps028.
Gugerli, David. 2018. Wie die Welt in den Computern kam: Zur Entstehung digitaler
Wirklichkeit. Franfkurt a. Main: S. Fischer.
Guldi, Jo. 2020. “The Common Landscape of Digital History: Universal Methods, Global
borderlands, longue-duree history, and critical thinking about approaches and insti-
tutions.” In Digital Histories: Emergent Approaches within the new Digital History,
edited by Mats Fridlund, M. Oiva, and P. Paju, 327–346. Helsinki: Helsinki Univer-
sity Press. doi:10.33134/HUP-5-18.
Guthrie, Kevin M. 1999. “JSTOR: Large Scale Digitization of Journals in the United
States.” LIBER Quarterly 9 (3): 291–297. doi:https://doi.org/10.18352/lq.7546.
Hackler, Ruben and Kirsten, Guido. 2016. “Distant Reading, Computational Criticism,
and Social Critique: An Interview with Franco Moretti.” Le Foucaldien 2 (1). doi:10.
16995/lefou.22.
Hagberg, Aric A., Schult, Daniel A., and Swart, Pieter J. 2008. “Exploring Network
Structure, Dynamics, and Function using NetworkX.” In Proceedings of the 7th
Python in Science Conference, edited by Gael Varoquaux, Travis Vaught, and Jar-
rod Millman, 11–15. Pasadena, CA.
Hannover, Heinrich and Hannover-Druck, Elisabeth. 1987. Politische Justiz 1918-1933.
Bornheim-Merten: Lamuv Verlag.
Harris, Steve and Seaborne, Andy. 2013. “SPARQL 1.1 Query Language.” W3C Recom-
mendation. http://www.w3.org/TR/sparql11-query.
Harris, Steven J. 1999. “Mapping Jesuit Science: The Role of Travel in the Geography
of Knowledge.” Edited by John W. O’Mailley, Gauvin Alexander Bailey, Steven J.
Harris, and T. Frank Kennedy, (Toronto): 212–240.
218

Haskell, Thomas L. 1975. “The True & Tragical History of ‘Time on the Cross’.” The New
York Review of Books 22 (15). https://www.nybooks.com/articles/1975/10/02/the-
true-tragical-history-of-time-on-the-cross/.
Hayles, N. Katherine. (2011) 2012. “How We Think: Transforming Power and Digital
Technologies.” In Understanding the Digital Humanities, edited by David M. Berry,
42–66. London: Palgrave Macmillan. doi:10.1057/9780230371934 3.
Heider, Fritz. 1946. “Attitudes and cognitive organization.” The Journal of psychology
21 (1): 107–112.
Heidler, Richard. 2015. “ERGM versus Blockmodelle. Vergleich zweier popularer netzw-
erkanalytischer Methoden.” In Knoten und Kanten III: Soziale Netzwerkanalyse in
Geschichts- und Politikforschung, edited by Markus Gamper, Linda Reschke, and
Marten During. Bielefeld: transcript Verlag. doi:10.14361/9783839427422.
Heidler, Richard, Gamper, Markus, Herz, Andreas, and Eßer, Florian. 2014. “Relation-
ship patterns in the 19th century: The friendship network in a German boys school
class from 1880 to 1881 revisited.” Social Networks 37:1–13. doi:10.1016/j.socnet.
2013.11.001.
Heise, Christian. 2017. Von Open Access zu Open Science: Zum Wandel digitaler Kul-
turen der wissenschaftlichen Kommunikation. meson press. doi:10.14619/1303.
Hennig, Marina, Brandes, Ulrik, Pfeffer, Jurgen, and Mergel, Ines. 2012. Studying Social
Networks: A Guide to Empirical Research. Frankfurt a. Main: Campus Verlag.
Hiltmann, Torsten, Keupp, Jan, Althage, Melanie, and Schneider, Philipp. 2021. “Digital
Methods in Practice. The Epistemological Implications of Applying Text Re-Use
Analysis to the Bloody Accounts of the Conquest of Jerusalem (1099).” Geschichte
und Gesellschaft. Zeitschrift fur Historische Sozialwissenschaft 47 (1). doi:10.13109/
gege.2021.47.1.122.
Hitchcock, Tim. 2011. “Culturomics, Big Data, Code Breakers and the Causabon Delu-
sion.” Historyonics (blog). http://historyonics.blogspot.com/2011/06/culturomics-
big-data-code-breakers-and.html.
. 2013. “Historyonics: Big Data for Dead People: Digital Readings and the Co-
nundrums of Positivism.” Historyonics (blog). http://historyonics.blogspot.com/
2013/12/big-data-for-dead-people-digital.html.
Hockey, Susan. 2004. “The History of Humanities Computing.” In A Companion to
Digital Humanities, edited by Susan Schreibman, Ray Siemens, and John Unsworth.
Oxford: Blackwell. http://digitalhumanities.org :3030/companion/view?docId=
blackwell/9781405103213/9781405103213.xml%5C&chunk.id=ss1-2-1%5C&toc.
depth=1%5C&toc.id=ss1-2-1%5C&brand=9781405103213 brand.
219

Bibliography
Hohls, Rudiger. 2018. “Digital Humanities und digitale Geschichtswissenschaften.” In
Clio-Guide. Ein Handbuch zu digitalen Ressourcen fur die Geschichtswissenschaften,
edited by Laura Busse, Wilfried Enderle, Rudiger Hohls, Thomas Meyer, Jens Prell-
witz, and Annette Schuhmann, vol. 23, A.1-1–A.1.34. Historisches Forum 2. Berlin.
Holland, Paul W and Leinhardt, Samuel. 1976. “The Statistical Analysis of Local Struc-
ture in Social Networks.” Edited by D. R. Heise. Sociological Methodology (San
Fransisco, CA): 1–45.
Holley, Rose. 2009. “How Good Can It Get? Analyzing and Improving OCR Accuracy
in Large Scale Newspaper Digitization Programs.” D-Lib Magazine 15 (3/4). http:
//www.dlib.org/dlib/march09/holley/03holley.html.
Holme, Petter and Saramaki, Jari. 2019. “A Map of Approaches to Temporal Networks.”
In Temporal Network Theory, edited by Petter Holme and Jari Saramaki, 1–24.
Computational Social Sciences. Cham: Springer International Publishing. doi:10.
1007/978-3-030-23495-9 1.
Holtmann, Everhard. 1975a. “Politische Tendenzjustiz wahrend des Februaraufstandes
1934.” In Das Jahr 1934: 12. Februar. Protokoll des Symposiums in Wien am 5.
Februar 1974, edited by Ludwig Jedlicka and Rudolf Neck, 45–57. Wissenschaftliche
Kommission zur Erforschung der Osterreichischen Geschichte der Jahre 1918 bis
1938 2. Vienna: Verlage fur Geschichte und Politik.
. 1975b. “Zwischen “Blutschuld” und “Befriedung”: Autoritare Julijustiz.” In Das
Jahr 1934: 12. Februar. Protokoll des Symposiums in Wien am 5. Februar 1974,
edited by Ludwig Jedlicka and Rudolf Neck, 36–45. Wissenschaftliche Kommission
zur Erforschung der Osterreichischen Geschichte der Jahre 1918 bis 1938 2. Vienna:
Verlage fur Geschichte und Politik.
. 1978. Zwischen Unterdruckung und Befriedung. Sozialistische Arbeiterbewegung
und autoritares Regime in Osterreich 1933-1938. Studien und Quellen zur Osterre-
ichischen Zeitgeschichte 1. Vienna.
Hotson, Howard. 2019. “Synopsis and Prospects.” In Reassembling the Republic of Letters
in the Digital Age. Standards, Systems, Scholarships, edited by Howard Hotson and
Thomas Wallnig, 449–61. Gottingen: Gottingen University Press.
Hotson, Howard and Wallnig, Thomas, eds. 2019. Reassembling the Republic of Letters in
the Digital Age. Standards, Systems, Scholarships. Gottingen: Gottingen University
Press.
Huff, Darrell. (1954) 1993. How to Lie with Statistics. ILLUSTRATED BY IRVING
GEIS. New York London: W. W. Norton & Company.
220

Huisman, Mark and Snijders, Tom A. B. 2003. “Statistical Analysis of Longitudinal
Network Data With Changing Composition.” Sociological Methods & Research 32
(2): 253–287. doi:10.1177/0049124103256096.
Hunter, David R., Handcock, Mark S., Butts, Carter T., Goodreau, Steven M., and Mor-
ris, Martina. 2008. “ergm: A Package to Fit, Simulate and Diagnose Exponential-
Family Models for Networks.” Journal of Statistical Software 24 (3). https://www.
ncbi.nlm.nih.gov/pmc/articles/PMC2743438/.
Jager, Willi and Winckler, Michael J. 2013. “Scientific Computing and Cultural Heritage:
Contributions in Computational Humanities.” In Scientific Computing and Cultural
Heritage. Contributions in Computational Humanities, edited by Hans Georg Bock,
Willi Jager, and Michael J. Winckler, 3:v–vii. Contributions in Mathematical and
Computational Sciences. Berlin Heidelberg: Springer. doi:10.1007/978-3-642-28021-
4.
Jannidis, Fotis. 2019. “Digitale Geisteswissenschaften: Offene Fragen – schone Aus-
sichten.” Zeitschrift fur Medien- und Kulturforschung 10 (1): 63–70. doi:10.28937/
1000108232.
Jannidis, Fotis, Kohle, Hubertus, and Rehbein, Malte, eds. 2017. Digital Humanities:
Eine Einfuhrung. Stuttgart: J. B. Metzler.
Jansen, Dorothea. 2006. Einfuhrung in die Netzwerkanalyse. Grundlagen, Methoden,
Forschungsbeispiele. 3. uberarbeitete Auflage. VS Verlag fur Sozialwissenschaften.
Janssen, Jose, Stoyanov, Slavi, Ferrari, Anusca, Punie, Yves, Pannekeet, Kees, and Sloep,
Peter. 2013. “Experts’ views on digital competence: Commonalities and differences.”
Computers & Education 68:473–481.
Jarausch, Konrad H. and Sabrow, Martin. 2002. ““Meistererzahlung” – Zur Karriere
eines Begriffs.” In Die historische Meistererzahlung. Deutungslinien der deutschen
Nationalgeschichte nach 1945, edited by Konrad H. Jarausch and Martin Sabrow,
9–32. Gottingen: Vandenhoeck und Ruprecht.
Jaskot, Paul B., Knowles, Anne Kelly, Harvey, Chester, and Blackshear, Benjamin Perry.
2014. “Visualizing the Archive. Building at Auschwitz as a Geographic Problem.”
In Geographies of the Holocaust, edited by Anne Kelly Knowles, T. I. M. Cole, and
Alberto Giordano, 159–191. Bloomington, Indiana: Indiana University Press.
Jedlicka, Ludwig. 1975. “Diskussionsbeitrag. Diskussion zum Beitrag Holtmann.” In Das
Jahr 1934: 12. Februar. Protokoll des Symposiums in Wien am 5. Februar 1974,
edited by Ludwig Jedlicka and Rudolf Neck, 155–159. Wissenschaftliche Kommission
zur Erforschung der Osterreichischen Geschichte der Jahre 1918 bis 1938 2. Vienna:
Verlage fur Geschichte und Politik.
221

Bibliography
Jenkins, Henry, Clinton, Katie, Purushotma, Ravi, Robison, Alice J., and Weigel, Mar-
garet. 2006. Confronting the Challenges of Participatory Culture: Media Education
for the 21st Century. Chicago: John D. and Catherine T. MacArthur Foundation.
Jesionek, Udo. 1995. “Parlamentarische Demokratie und richterliche Unabhangigkeit.” In
Justiz und Zeitgeschichte. Symposionsbeitrage 1976-1993, edited by Erika Weinzierl,
Oliver Rathkolb, Rudolf Ardelt, and Siegfried Mattl, 1:141–156. Vienna.
Jockers, Matthew L. 2013. “Macroanalysis: Digital Methods and Literary History.”
(Champaign).
Johannssen, Arne, Chukhrova, Nataliya, Schmal, Friederike, and Stabenow, Kevin. 2021.
“Statistical Literacy–Misuse of Statistics and Its Consequences.” Journal of Statis-
tics and Data Science Education 29 (1): 54–62. doi:10.1080/10691898.2020.1860727.
Kaiser, Max and Majewski, Stefan. 2013. “Austrian Books Online: Die Public Pri-
vate Partnership der Osterreichischen Nationalbibliothek mit Google.” Bibliothek,
Forschung und Praxis 37 (2): 197–208. doi:10.1515/bfp-2013-0020.
Kapferer, Bruce. 1969. “Norms and the manipulation of relationships in a work con-
text.” In Social Networks in Urban Situations: Analyses of Personal Relationships
in Central African Towns, edited by J. Clyde Mitchell. Manchester: Published for
the Institute for Social Research University of Zambia by University of Manchester
Press.
Kaplan, Abraham. (1964) 2017. The Conduct of Inquiry. Methodology for Behavioral
Science. With a new introduction by Charles Wolf, Jr. New York: Routledge.
Kapsalis, Effie. 2016. “The Impact of Open Access on Galleries, Libraries, Museums, &
Archives.” Smithsonian (website). http://s.si.edu/openSI.
Karkov, Catherine. 2019. “Introduction: A Slow and Ongoing Collaboration.” In Slow
Scholarship: Medieval Research and the Neoliberal University, edited by Catherine
Karkov, 72:3–16. Martlesham: Boydell & Brewer. doi:10.1017/9781787447042.
Kastellec, Jonathan P. 2010. “The Statistical Analysis of Judicial Decisions and Legal
Rules with Classification Trees.” Journal of Empirical Legal Studies 7 (2): 202–230.
Katz, Michael B. 1975. The People of Hamilton, Canada West. Family and Class in a
Mid-Nineteenth-Century City. Harvard University Press.
Keeney, Gavin. 2016. “No-media: Against the Coming Singularity.” ARTICLE 12, Con-
temporary Aesthetics 14. https://digitalcommons.risd.edu/liberalarts contempaest
hetics/vol14/iss1/12/.
222

Keyserlingk-Rehbein, Linda von. 2018. Nur eine ganz kleine Clique?: die NS-Ermittlungen
uber das Netzwerk vom 20. Juli 1944. Vol. 12. Schriften der Gedenkstatte Deutscher
Widerstand. Zugl.: Dissertation, Universitat Potsdam, Philosophische Fakultat, 2017.
Berlin: Lukas Verlag.
Kim, Dorothy and Stommel, Jesse, eds. 2018. Disrupting the Digital Humanities. Goleta:
Punctum Books. doi:10.2307/j.ctv19cwdqv.
Kingsley, Patrick. 2018. “After Viktor Orban’s Victory, Hungary’s Judges Start to Tum-
ble.” The New York Times 2018-05-01. https://www.nytimes.com/2018/05/01/
world/europe/hungary-viktor-orban-judges.html.
Kirchheimer, Otto. (1955) 1964. Politische Justiz, edited by Otto Kirchheimer, 96–122.
Frankfurt a. Main: Suhrkamp.
. 1965. “Politische Justiz. Verwendung juristischer Verfahrensmoglichkeiten zu
politischen Zwecken,” vol. 17. Neuwied und Berlin: Luchterhand.
Kirn, Paul. (1947) 1968. Einfurung in die Geschichtswissenschaft. 5. bearb. u. erg. Au-
flage. Fortgefuhrt von Joachim Leuschner. Berlin: De Gruyter.
Kirsch, Adam. 2014. “Technology is Taking Over English Departments. The false promise
of the digital humanities.” The New Republic (blog). https://newrepublic.com/
article/117428/limits-digital-humanities-adam-kirsch.
Kirschenbaum, Mathew. 2014. “What is ”Digital Humanities,” And Why Are They
Saying Such Terrible Things About It.” differences 25 (1): 46–63. doi:10 . 1215/
10407391-2419997.
Kirschenbaum, Matthew. 2009. “Hello Worlds. Why humanities students should learn to
program.” The Chronicle of Higher Education (magazine). https://www.chronicle.
com/article/hello-worlds/.
. 2012. “Digital Humanities As/Is a Tactical Term.” In Debates in the Digital
Humanities 2012, edited by Mathew K. Gold. Minneapolis London: University of
Minnesota Press. https://dhdebates.gc.cuny.edu/read/untitled-88c11800-9446-
469b-a3be-3fdb36bfbd1e/section/c0b0a8ee-95f0-4a9c-9451-e8ad168e3db5.
Kirschenbaum, Matthew G. 2008. Mechanisms: New Media and Forensic Imaginations.
Cambridge, Massachusetts, and London, England: MIT Press.
Kitchin, Rob. 2014. The Data Revolution. Big Data, Open Data, Data Infrastructures &
Their Consequences. Los Angeles, London, New Delhi, Singapore, Washington DC:
Sage.
223

Bibliography
Klein, Lauren F. 2020. “Dimensions of Scale: Invisible Labor, Editorial Work, and the
Future of Quantitative Literary Studies.” Publications of the Modern Language As-
sociation 135 (1): 23–39. doi:10.1632/pmla.2020.135.1.23.
Knopp, Hartmut. 2018. Netzwerke fruhneuzeitlicher Astronomen. Stuttgarter Beitrage
zur Wissenschafts- und Technikgeschichte. Dissertation an der Philosophisch-Historischen
Fakultat der Universitat Stuttgart. Berlin: Logos Verlag.
Knowles, Anne Kelly, Cole, T. I. M., and Giordano, Alberto, eds. 2014a. Geographies of
the Holocaust. Bloomington, Indiana: Indiana University Press.
Knowles, Anne Kelly, Jaskot, Paul B., Blackshear, Benjamin Perry, De Groot, Michael,
and Yule, Alexander. 2014b. “Mapping the SS Concentration Camps.” In Geogra-
phies of the Holocaust, edited by Anne Kelly Knowles, T. I. M. Cole, and Alberto
Giordano, 19–45. Bloomington, Indiana: Indiana University Press.
Koh, Adeline. 2018. “A Letter to the Humanities: DH Will Not Save You.” In Disrupting
the Digital Humanities, edited by Dorothy Kim and Jesse Stommel, 39–48. Goleta:
Punctum Books. doi:10.2307/j.ctv19cwdqv.5.
Kohle, Hubertus. 2017. “Digitale Rekonstruktion und Simulation.” In Digital Humani-
ties: Eine Einfuhrung, edited by Fotis Jannidis, Hubertus Kohle, and Malte Rehbein,
315–327. Stuttgart: J. B. Metzler.
Konig, Denes. 1936. Theorie der endlichen und unendlichen Graphen: Kombinatorische
Topologie der Streckenkomplexe. Vol. 16. Leipzig: Akademische Verlagsgesellschaft
mbh.
Konig, Mareike. 2016. “Was sind die Digital Humanities? Definitionsfragen und Prax-
isbeispiele aus der Geschichtswissenschaft.” Digital Humanities am DHIP (blog).
http://dhdhi.hypotheses.org/2642.
. 2021. “Die Digitale Transformation als reflexiver turn. Einfuhrende Literature
zur digital Geschichte im Uberblick.” Neue Politische Literature 66:37–60. doi:10.
1007/s42520-020-00322-2.
Kraicer, Eve and Piper, Andrew. 2018. “Social Characters: The Hierarchy of Gender
in Contemporary English-Language Fiction.” Journal of Cultural Analytics 3 (2).
doi:10.22148/16.032.
Kramer, Katrina. 2019. “Female scientists’ pages keep disappearing from Wikipedia –
what’s going on?” Chemistry World (newspaper). https://www.chemistryworld.
com / news / female - scientists - pages - keep - disappearing - from - wikipedia - whats -
going-on/3010664.article.
Kramer, Walter. (1991) 2001. So lugt man mit Statistik. 2nd ed. Munchen Zurich: Piper.
224

Kranakis, Eangelos, ed. 2013. Advances in Network Analysis and its Applications. Berlin
Heidelberg: Springer. doi:10.1007/978-3-642-30904-5.
Kriegler, Anine. 2014. “Using social network analysis to profile organized crime.” ISS–
Institute for Security Studies Policy Brief 57. https ://www. files . ethz . ch/ isn/
183611/PolBrief57.pdf.
Krishnan, Armin. 2009. “What are Academic Dicsiplines? Some observations on the
Disciplinarity vs Interdisciplinarity debate,” NCRM Working Paper Series. eprints.
ncrm.ac.uk/783/1/what are academic disciplines.pdf.
Kucking, Verena. 2010. “Tagungsbericht: Workshop “Historische Netzwerkforschung”.”
12.12.2009 – 13.12.2009 Koln, H-Soz-Kult (blog). Accessed 2020-08-01. www.hsozk
ult.de/conferencereport/id/tagungsberichte-2982.
Kudella, Christoph. 2019. “How do we model the Republic of Letters? With Contribu-
tions from Neil Jefferies.” In Reassembling the Republic of Letters in the Digital Age.
Standards, Systems, Scholarships, edited by Howard Hotson and Thomas Wallnig,
41–53. Gottingen University Press. doi:10.17875/gup2019-1146.
Kuhn, Jonas. 2019. “Computational text analysis within the Humanities: How to com-
bine working practices from the contributing fields?” Language Resources & Evalu-
ation 53:565–602. doi:10.1007/s10579-019-09459-3.
Kuhn, Thomas S. (1962) 2012. The structure of scientific revolutions. With an introduc-
tory essay by Ian Hacking. 4th ed. Chicago: University of Chicago Press.
Kwastek, Katja. 2015. “Vom Bild zum Bild – Digital Humanities jenseits des Textes.” In
Grenzen und Moglichkeiten der Digital Humanities, edited by Constanze Baum and
Thomas Stacker. (= Sonderband der Zeitschrift fur digitale Geisteswissenschaften)
PDF Format ohne Paginierung. doi:10.17175/sb001 002.
Lancashire, Ian and Hirst, Graeme. 2009. “Vocabulary changes in Agatha Christie’s
mysteries as an indication of dementia: a case study.” Presented at the 19th Annual
Rotman Research Institute Conference, Cognitive Aging: Research and Practice,
March 8–10, 2009, Toronto. http://ftp.cs.toronto.edu/pub/gh/Lancashire+Hirst-
extabs-2009.pdf.
Lang, Sarah. 2020. “Digitale Annotation alchemischer Decknamen.” In Annotations in
Scholarly Editions and Research, edited by Julia Nantke and Frederik Schlupkothen,
201–220. Berlin Boston: De Gruyter. doi:10.1515/9783110689112-010.
Lasch, Christopher. 1965. The new radicalism in America 1889–1963: the intellectual as
a social type. New York: Knopf.
225

Bibliography
Latapy, Matthieu, Viard, Tiphaine, and Magnien, Clemence. 2018. “Stream Graphs and
Link Streams for Modeling of Interactions over Time.” Social Networks Analysis
and Mining 8 (1): 61:1–61:29. doi:10.1007/s13278-018-0537-7.
Latour, Bruno. 1986. “Visualization and Cognition: Thinking with Eyes and Hands.”
Knowledge and Society 6:1–40.
Le Moigne, Jean-Louis. 2004. Le Constructivisme. Tome III. Modeliser pour comprendre.
Collection Ingenium. L’Harmattan.
Le Roy Ladurie, Emanuel. 1973. Le territoire de l’historien. Vol. 1. Paris: Gallimard.
Lee, Nancy. 1969. The search for an abortionist. Chicago: University of Chicago Press.
Lemercier, Claire. 2012. “Formale Methoden der Netzwerkanalyse in den Geschichtswis-
senschaften: Warum und Wie?” Translated by Albert Muller and Wolfgang Neurath,
Osterreichische Zeitschrift fur Geschichtswissenschaften 23:16–41.
Lemercier, Claire and Zalc, Claire. 2019. Quantitative Methods in the Humanities: An
Introduction. Charlottesville: University of Virginia Press.
Lemke, Matthias and Wiedemann, Gregor, eds. 2016. Text Mining in then Sozialwis-
senschaften. Wiesbaden: Springer Fachmedien. doi:10.1007/978-3-658-07224-7.
Leskovec, Jure, Lang, Kevin J., Dasgupta, Anirban, and Mahoney, Michael W. 2008.
Community Structure in Large Networks: Natural Cluster Sizes and the Absence of
Large Well-Defined Clusters. arXiv: 0810.1355 [cs.DS].
Levi-Strauss, Claude. (1949) 1969. “The Elementary Structures of Kinship.” (Boston).
Lindgren, Simon. 2020. Data Theory. Interpretive Sociology and Computational Methods.
Cambridge, Medford: Polity Press.
Lloyd, Stuart P. 1982. “Least Squares Quantization in PCM.” IEEE Transactions on
Information Theory 28:129–137.
Lorrain, Fran1.85mmcois and White, Harrison. 1971. “Structural equivalence of individ-
uals in social networks.” The Journal of Mathematical Sociology 1 (1): 49–80.
Lovejoy, Arthur O. 1940. “Reflection on the History of Ideas.” Journal of the History of
Ideas 1 (1): 3–23. https://www.jstor.org/stable/2707007.
Lubbers, Miranda J, Molina, Jose Luis, Lerner, Jurgen, Brandes, Ulrik, Avila, Javier,
and McCarty, Christopher. 2010. “Longitudinal analysis of personal networks. The
case of Argentinean migrants in Spain.” Social Networks 32 (1): 91–104.
Luhmann, Niklas. 1984. Soziale Systeme. Grundriß einer allgemeinen Theorie. Frankfurt
a. Main: Suhrkamp Verlag.
226

Lundberg, George and Lawsing, Margaret. 1937. “The sociography of some community
relations.” American Sociological Review, no. 2: 318–335.
Lusher, Dean, Koskinen, Johan, and Robins, Garry, eds. 2012. Exponential Random
Graph Models for Social Networks. Cambridge Core - Research Methods In Sociology
and Criminology. doi:10.1017/CBO9780511894701.
Lutz, Mark. (1996) 2010. Programming Python: Powerful Object Oriented Programming.
4th ed. Canada: O’Reilly.
Luxburg, Ulrike von. 2007. “A tutorial on spectral clustering.” Statistics and Computing
17 (4): 395–416. doi:10.1007/s11222-007-9033-z.
MacQueen, James. 1967. “Some methods for classification and analysis of multivariate
observations.” In Proceedings of the Fifth Berkeley Symposium on Mathematical
Statistics and Probability, Volume 1: Statistics, 281–297. Berkeley, CA: University
of California Press. https://projecteuclid.org/euclid.bsmsp/1200512992.
Mahdisoltani, Farzaneh, Biega, Joanna, and Suchanek, Fabian M. 2015. “YAGO3: A
Knowledge Base from Multilingual Wikipedias.” In CIDR 2015, Seventh Biennial
Conference on Innovative Data Systems Research, Asilomar, CA, USA, Online Pro-
ceedings. http://cidrdb.org/cidr2015/Papers/CIDR15%5C%5C Paper1.pdf.
Mannheim, Karl. (1952) 1993. “On the Interpretation of Weltanschauung.” In From Karl
Mannheim, edited by Kurt H. Wolff, Volker Meja, and David Kettler, 136–186. From
Essays on the Sociology of Knowledge (New York: Oxford University Press, 1952),
pp. 33–83. London: Routledge.
Manovich, Lev. 2011. “Cultural Software.” From new introduction to Software Takes
Command manuscript. July 2011 version, manovich (blog). manovich.net/content/
04-projects/070-cultural-software/67-article-2011.pdf.
Marino, Mark C. 2020. Critical Code Studies. Cambridge, Massachusetts: The MIT
Press.
Marx, Karl. (1859) 1971. “Zur Krititk der Politischen Okonomie.” In Karl Marx und
Friedrich Engels, Werke, 13:1–160. Berlin: Dietz.
Maslow, Abraham H. 1966. The Psychology of Science. A Reconnaissance. New York:
Harper & Row.
Masys, Anthony J., ed. 2014. Networks and Network Analysis of Defense and Security.
Cham: Springer. doi:10.1007/978-3-319-04147-6.
227

Bibliography
Mayer, Katja. 2016. “Netzwerkvisualisierungen. Anmerkungen zur visuellen Kultur der
Historischen Netzwerkforschung.” In Handbuch Historische Netzwerkforschung: Grund-
lagen und Anwendungen, edited by Marten During, Ulrich Eumann, Martin Stark,
and Linda von Keyserlingk, 1:139–153. Munster: LIT Verlag.
McCarty, Willard. 2009. “Attending from and to the machine.” Inaugural lecture, King’s
College London. http://staff .cch.kcl.ac.uk/∼wmccarty/essays/McCarty,%5C%
20Inaugural.pdf.
. n.d. “Getting there from here. Remembering the future of Digital Humanities.”
Roberto Busa Award Lecture 2013.
McPherson, Miller, Smith-Lovin, Lynn, and Cook, James M. 2001. “Birds of a Feather:
Homophily in Social Networks.” Annual Review of Sociology 27 (1): 415–444. doi:10.
1146/annurev.soc.27.1.415.
McPherson, Tara. 2009. “Introduction: Media Studies and the Digital Humanities.” Cin-
ema Journal 48 (2): 119–123. https://www.jstor.org/stable/20484452.
Merton, Robert K. (1949) 1968. Social Theory and Social Structure. Enlarges to include
two new essays on Theoretical Sociology. New York: The Free Press.
Metzger, Axel. 2010. “Urhheberrechtsschranken in der Wissensgesellschaft: “Fair Use”
oder enge EInzeltatbestande?” In Europaische Perspektiven des Geistigen Eigen-
tums, edited by Matthias Leistner. Tubingen. https://www.rewi.hu-berlin.de/de/
lf/ls/mzg/pub/urheberrechtsschranken-in-der-wissensgesellschaft.
Michel, Jean-Baptiste, Shen, Yuan Kui, Aiden, Aviva Presser, Veres, Adrian, et al. 2011a.
“Quantitative Analysis of Culture using Millions of Digitized Books.” Science 331
(6014): 176–82. doi:10.1126/science.1199644.
Michel, Jean-Baptiste, Shen, Yuan Kui, Aiden, Aviva Presser, Veres, Adrian, Gray,
Matthew K, Pickett, Joseph P, Hoiberg, Dale, Clancy, Dan, Norvig, Peter, Orwant,
Jon, et al. 2011b. “Quantitative analysis of culture using millions of digitized books.”
Nature 331 (6014): 176–182. doi:10.1126/science.1199644.
Milgram, Stanley. 1967. “The small world problem.” Psychology Today 2 (1): 60–67.
Milic, Louis T. 1966. “The Next Step.” Computers and the Humanities 1 (1): 3–6. https:
//www.jstor.org/stable/30199191.
Miller, George A. 1995. “WordNet: A Lexical Database for English.” Commun. ACM
(New York, NY, USA) 38 (11): 39–41. doi:10.1145/219717.219748.
Milligan, Ian. 2013. “Illusionary Order: Online Databases, Optical Character Recogni-
tion, and Canadian History, 1997-2010.” http://hdl.handle.net/10012/11748.
228

. 2019. History in the Age of Abundance? How the Web is Transforming Historical
Research. Montreal: McGill-Queen’s University Press.
Mitchell, J. Clyde, ed. 1969a. Social Networks in Urban Situations: Analyses of Personal
Relationships in Central African Towns. Oxford: Published for the Institute for
Social Research University of Zambia by Manchester University Press.
. 1969b. “The Concept and Use of Social Networks.” In Social Networks in Urban
Situations: Analyses of Personal Relationships in Central African Towns, edited
by J. Clyde Mitchell, 1–50. Oxford: Published for the Institute for Social Research
University of Zambia by Manchester University Press.
Moreno, Jacob. 1936. Who shall survive? Foundations of Sociometry, Group Psychother-
apy and Sociodrama. New York: Beacon House.
Moreno, Jacob L. 1948. “The Three Branches of Sociometry: A Postscript.” Sociometry
11 (1/2): 121–128. doi:10.2307/2785475.
Moreno, Jakob L. and Jennings, Helen H. 1938. “Statistics of Social Configurations.”
Sociometry, no. 1: 342–374.
Moretti, Franco. 2005. Graphs, maps, trees: abstract models for a literary history. London
Brooklyn: Verso.
Morris, R. J. 1998. “Electronic documents and the history of the late 20th century: black
holes or warehouses?” In History and Electronic Artefacts, edited by Edward Higgs,
31–48. Oxford: Clarendon Press.
Mosteller, F. and Wallace, D. L. 1964. Inference and Disputed Authorship: The Federalist.
Reading: MA.
Moyn, Samuel and Sartori, Andrew, eds. 2013. Global Intellectual History. New York:
Columbia University Press.
Muehlberger, Guenter, Seaward, Louise, Terras, Melissa, Oliveira, Sofia Ares, Bosch,
Vicente, Bryan, Maximilian, Colutto, Sebastian, Dejean, Herve, Diem, Markus, Fiel,
Stefan, et al. 2019. “Transforming scholarship in the archives through handwritten
text recognition. Transkribus as a case study.” Journal of Documentation 75 (5):
954–76. doi:10.1108/JD-07-2018-0114.
Mueller, Martin. 2013. “Morgenstern’s Spectacles or the Importance of Not-Reading.”
Scalable Reading (blog). https://scalablereading.northwestern.edu/2013/01/21/
morgensterns-spectacles-or-the-importance-of-not-reading/.
229

Bibliography
Mullen, Lincoln. 2019a. “A Braided Narrative for Digital History.” In Debates in the
Digital Humanities 2019, edited by Matthew K. Gold. https://dhdebates.gc.cuny.
edu/read/untitled-f2acf72c-a469-49d8-be35-67f9ac1e3a60/section/e5496dc6-dcc1-
42e7-8609-9377d05812c5#ch31.
. 2019b. “A Braided Narrative for Digital History.” In Debates in the Digital
Humanities 2019, edited by Mathew K. Gold, 382–388.
Mullen, Lincoln A. 2019. Computational Historical Thinking: With Applications in R
(2018–). website. https://dh-r.lincolnmullen.com.
Muller, Use. 2006. “Open Access. Eine Bestandsaufnahme.” doi:10.18452/9295.
Museum fur Naturkunde Berlin. 2021. “Germany-wide pilot project to record colonial
collection items.” Museum fur Naturkunde Berlin (website). https://www.museumf
uernaturkunde.berlin/en/about/news/germany-wide-pilot-project-record-colonial-
collection-items.
Nadel, Sigfried. 1957. The theory of social structure. London: Cohen & West.
“Poetry in Motion.” 2011. Nature 474 (420). doi:10.1038/474420b.
Nerbonne, John. 2015. “Die Informatik als Geisteswissenschaft.” In Grenzen und Moglichkeiten
der Digital Humanities, edited by Constanze Baum and Thomas Stacker. (= Sonder-
band der Zeitschrift fur digitale Geisteswissenschaften) PDF Format ohne Paginierung.
doi:10.17175/sb001 003.
Neugebauer, Wolfgang. 1995a. “Politische Justiz in Osterreich 1934-1945.” In Justiz
und Zeitgeschichte. Symposionsbeitrage 1976-1993, edited by Erika Weinzierl, Oliver
Rathkolb, Rudolf G Ardelt, and Siegfried Mattl, 1:114–138. Vienna.
. 1995b. “Richterliche Unabhangigkeit 1934-1945, unter Berucksichtigung der Standgerichte
und der Militargerichte.” In Justiz und Zeitgeschichte. Symposionsbeitrage 1976-
1993, edited by Erika Weinzierl, Oliver Rathkolb, Rudolf Ardelt, and Siegfried Mat-
tel, 2:51–74.
. 1995c. “Standgerichtsbarkeit und Todesstrafe in Osterreich 1933 bis 1938.” In
Justiz und Zeitgeschichte. Symposionsbeitrage 1976-1993, edited by Erika Weinzierl,
Oliver Rathkolb, Rudolf Ardelt, and Siegfried Mattl, 1:317–328. Vienna.
. 2012. “Repressionsapparat und -maßnahmen 1933-1938,” 6th ed., edited by Em-
merich Talos, Wolfgang Neugebauer, and Christine Schindler, 298–321. Vienna: LIT
Verlag.
Neyt, Vincent and Van Hulle, Dirk. 2020. “Developing the Beckett Digital Manuscript
Project.” Wiener Digitale Revue. Zeitschrift fur Germanistik und Gegenwart 1. doi:1
0.25365/wdr-01-03-01.
230

NISO Framework Working Group. 2007. “A Framework of Guidance for Building Good
Digital Collections.” (Baltimore), NISO Recommended Practices. http://www.niso.
org/sites/default/files/2017-08/framework3.pdf.
Nitschke, Christian. 2016. “Die Geschichte der Netzwerkanalyse.” In Handbuch His-
torische Netzwerkforschung: Grundlagen und Anwendungen, edited by Marten During,
Ulrich Eumann, Martin Stark, and Linda von Keyserlingk, 11–30. Munster: LIT
Verlag.
Novak, Benjamin and Kingsley, Patrick. 2018. “Hungary Creates New Court System,
Cementing Leader’s Control of Judiciary.” The New York Times 2018-12-12. https:
//www.nytimes.com/2018/12/12/world/europe/hungary-courts.html.
Novick, Peter. 1988. That Noble Dream. The ’Objectivity Question’ and the American
Historical Profession. Cambridge University Press.
Nowviskie, Bethany. 2010. “eternal september of the digital humanities.” Nowviskie
(blog). http://nowviskie.org/2010/eternal-september-of-the-digital-humanities/.
Nyhan, Julianne and Flinn, Andrew. 2016. Computation and the Humanities: Towards an
Oral History of Digital Humanities. Heidelberg: Springer Nature. doi:10.1007/978-
3-319-20170-2.
Nyhan, Julianne, Terras, Melissa, and Vanhoutte, Edward. 2013. “Introduction.” In
Defining Digital Humanities. A Reader, edited by Melissa Terras, Julianne Nyhan,
and Edward Vanhoutte, 1–10. London: Taylor & Francis.
Ooyen, Robert Chr. van. 2012. “Die dunkle Seite des Rechtsstaats: Otto Kirchheimers
“Politische Justiz” zwischen Freund-Feind, Klassenjustiz und Zivilisierung.” Jahrbuch
der Juristischen Zeitgeschichte (Berlin) 13 (1): 241–266. doi:10.1515/jjzg-b.2012.
13.1.241.
Ossendrijver, Mathieu. 2011. “Excellent Netzwerke: die Astronomen von Uruk.” In The
Empirical Dimension of Ancient Near Eastern Studies, edited by Gebhard J. Selz
and Klaus Wagensonner, 229–237. Wien: LIT Verlag. https : //www . topoi . org /
publication/19881/..
Osterhammel, Jurgen. 2006. “Uber die Periodisierung der neueren Geschichte (Vortrag
in der Geisteswissenschaftlichen Klasse am 29. November 2002),” edited by Berlin-
Brandenburgische Akademie der Wissenschaften, 10:45–64. Berichte und Abhand-
lungen. Berlin: Akademie Verlag.
Owsley, Frank L. 1949. Plain Folk of the Old South. Louisiana State University Press.
Padgett, John F. and Ansell, Christopher K. 1993. “Robust action and the rise of the
Medici, 1400-1434.” The American Journal of Sociology 98 (6): 1259–1319.
231

Bibliography
Panofsky, Erwin. 1951. Gothic Architecture and Scholasticism. Meridian Books.
Parsons, Talcott, Shils, Edward, Naegele, Kaspar D., and Pitts, Jesse R., eds. 1961. The-
ories of Society: Foundations of Modern Sociological Theory. One-volume edition.
London: Collier Macmillan.
Pearson, Robin and Richardsson, David. 2001. “Business networking in the industrial
revolution.” Economic History Review LIV (4): 657–679.
Petz, Cindarella, Ghawi, Raji, and Pfeffer, Jurgen. 2020. “A Longitudinal Analysis of
a Social Network of Intellectual History.” IEEE/ACM International Conference on
Advances in Social Network Analysis and Mining (ASONAM): 340–347. doi:10 .
1109/ASONAM49781.2020.9381318.
. 2021. “Tracking the Evolution of Communities in a Social Network of Intellectual
Influences.” Currently under review, Journal of Historical Network Research.
Petz, Cindarella and Pfeffer, Jurgen. 2021. “Configuration to Conviction. Network Struc-
tures of Political Judiciary in the Austrian Corporate State.” Social Networks Jour-
nal 66:185–201. doi:10.1016/j.socnet.2021.03.001.
Pfeffer, Jurgen. 2017. “Visualization of Political Networks.” In The Oxford Handbook
of Political Networks, edited by Jennifer Nicoll Victor, Alexander H. Montgomery,
and Mark Lubell. doi:10.1093/oxfordhb/9780190228217.013.13.
Piotrowski, Michael. 2020. “Ain’t No Way Around It: Why We Need to Be Clear About
What We Mean by ”Digital Humanities”.” Preprint submitted for the Pproceedings
of the Ssymposium “Wozu Digitale Geiteswissenschaft? Innovationen, Revisionen,
Binnenkonflikte,” held at Leuphana University Luneburg, Nov. 20 – 22, 2019. doi:10.
31235/osf.io/d2kb6.
Piotrowski, Michael and Fafinski, Mateusz. 2020. “Nothing New Under the Sun? Com-
putational Humanities and the Methodology of History.” In CHR2020: Proceedings
of the Workshop on Computational Humanities Research, 171–181. Amsterdam.
Porsdam, Helle. 2013. “Digital Humanities: On Finding the Proper Balance between
Qualitative and Quantitative Ways of Doing Research in the Humanities.” DHQ:
Digital Humanities Quarterly 7 (3).
Posner, Eric A. 2005. “Political Trials in Domestic and International Law.” Duke Law
Journal, Chicago Unbound, 55 (75). https://scholarship.law.duke.edu/dlj/vol55/
iss1/2/.
Pot, Johan Hendrik Jacob van der. 1999. Sinndeutung und Periodisierung der Geschichte.
Eine systematische Ubersicht der Theorien und Auffassungen. Leiden Boston Cologne:
Brill.
232

Preiser-Kapeller, Johannes. 2015. “Calculating the Middle Ages? The Project “Complex-
ities and Networks in the Medieval Mediterranean and Near East” (COMMED.”
Medieval Worlds 2:100–127. doi:10.1553/medievalworlds no2 2015s100.
Prensky, Marc. 2001. “Digital Natives, Digital Immigrants.” On the Horizon 9 (5): 1–6.
doi:10.1108/10748120110424816.
Presner, Todd. 2010a. “Digital Humanities 2.0: A Report on Knowledge.” doi:10.1.1.
469.1435\&rep=rep1\&type=pdf. http://citeseerx.ist.psu.edu/viewdoc/download.
. 2010b. “Digital Humanities 2.0. A Report on Knowledge.” Version 1.1.: April
18, 2010. http://cnx.org/content/m34246/1.1/.
Price, Kenneth M. 2016. “The Walt Whitman Archive and the prospects for social
editing.” Digital Scholarship in the Humanities 31 (4): 866–874. doi:10.1093/llc/
fqw056.
Prud’hommeaux, Eric and Seaborne, Andy. 2008. “SPARQL Query Language for RDF.”
W3C Recommendation. http://www.w3.org/TR/sparql11-query.
Putnam, Lara. 2016a. “The Transnational and the Text-Searchable: Digitized Sources
and the Shadows They Cast.” The American Historical Review 121 (2): 377–402.
doi:10.1093/ahr/121.2.377.
. 2016b. “The Transnational and the Text-Searchable: Digitized Sources and the
Shadows They Cast.” The American Historical Review 121 (2): 377–402. doi:10.
1093/ahr/121.2.377.
Qiu, Baojun, Ivanova, Kristinka, Yen, John, and Liu, Peng. 2010. “Behavior evolution
and event-driven growth dynamics in social networks.” In 2010 IEEE Second Inter-
national Conference on Social Computing, 217–224. Washington, DC: IEEE, IEEE
Computer Society.
Raab, Jorg. 2010. “Der ’Harvard Breaktrough’.” In Handbuch Netzwerkforschung, edited
by Christian Stegbauer and Roger Haußling, 4:29–38. Wiesbaden: VS Verlag fur
Sozialwissenschaften.
Rabinowitz, Adam. 2014. “It’s about time: historical periodization and Linked Ancient
World Data.” ISAW Papers 7 (22). http://dlib.nyu.edu/awdl/isaw/isaw-papers/
7/rabinowitz/.
Radcliffe-Brown, Alfred R. 1940. “On social structure.” Journal of the Royal Anthropo-
logical Institute of Great Britain and Ireland, no. 70: 1–12.
Radtke, Jorg. 2015. “Das Ende der theoretischen Bildung? Der Stellenwert von Theorien
im geisteswissenschaftlichen Studium 1975–2015.” Soziologiemagazin: 78–91. doi:10.
3224/soz.v8i2.21556.
233

Bibliography
Ragozini, Giancarlo and Vitale, Maria Prosperina, eds. 2020. Challenges in Social Net-
work Research. Cham: Springer. doi:10.1007/978-3-030-31463-7.
Rebora, Simone. 2019. “A Digital Edition between Stylometry and OCR. The Klagenfurt
Ausgabe of Robert Musil.” Textual Cultures 12 (2): 71–90. doi:10.14434/textual.
v12i2.27689.
Rehbein, Malte. 2018. ““L’historien de remain sera programmer ou il ne sera pas.”
(Digitale) Geschichtswissenschaften heute und morgen.” Digital Classics Online 4
(1): 23–43. doi:10.11588/dco.2017.0.48491.
. 2020. “Historical Network Research, Digital History, and Digital Humanities.” In
The Power of Networks. Prospects of Historical Network Research, edited by Marten
During, Florian Kerschbaumer, Linda von Keyserlingk-Rehbein, and Martin Stark,
253–279. London New York: Routledge.
Rehr, Jean-Paul. 2019. “Re-mapping the ‘Great Inquisition’ of 1245–46: The Case of
Mas-Saintes-Puelles and Saint-Martin-Lalande.” Open Library of Humanities 5 (1):
1–52. doi:10.16995/olh.414.
Reiche, Ruth, Becker, Rainer, Bender, Michael, Munson, Matthew, Schmunk, Stefan,
and Schoch, Christof. 2014. “Verfahren der Digital Humanities in den Geistes- und
Kulturwissenschaften.” (Gottingen), DARIAH-DE Working Papers Nr. 4.
Reichert, Ramon. 2017. “Digitale Methoden.” In Digital Humanities: Eine Einfuhrung,
edited by Fotis Jannidis, Hubertus Kohle, and Malte Rehbein, 29–34. Stuttgart: J.
B. Metzler.
Reinert, Matthias, Schrott, Maximilian, Ebneth, Bernhard, and Rehbein, Malte. 2015.
“From Biographies to Data Curation – The Making of www. deutsche-biographie.de.”
In Proceedings of the First Conference on Biographical Data in a Digital World
(BD), 13–19. Amsterdam.
Reinhard, Wolfgang. 1979. Freunde und Kreaturen. “Verflechtung” als Konzept zur Er-
forschung historischer Fuhrungsgruppen. Romische Oligarchie um 1600. Munchen:
Vogel.
Reinhardt, Nicole. 2002. “Verflechtung” –ein Blick zuruck nach vorn, edited by Peter
Burschel, Mark Haberlein, Volker Reinhardt-Gieler, Wolfgang E. J. Weber, and
Reinhardt Wendt, 235–262. Berlin: Akademie Verlag. doi:10.1524/9783050079691.
235.
Reiter-Zatloukal, Ilse. 2007. “Richterliche Unabhangigkeit im autoritaren Standestaat.”
In Hundert (100) Jahre Richtervereinigung. Beitrage zur juristischen Zeitgeschichte,
edited by Barbara Helige and Thomas Olechowski, 89–111. Zeitschrift der Savigny-
Stiftung fur Rechtsgeschichte. Germanistische Abteilung. Vienna.
234

. 2012. “Repressivpolitik und Vermogenskonfiskation 1933 - 1938.” In Osterre-
ich 1933-1938: Interdisziplinare Annaherungen an das Dollfuß-Schuschnigg-Regime,
edited by Ilse Reiter-Zatloukal, Christiane Rothlander, and Pia Scholnberger, 61–
76. Bohlau Verlag.
. 2013. “Verwaltungs- und justizgeschichtliche Forschungsdesiderate 1933-1938.”
In Das Dollfuß/Schuschnigg-Regime 1933-1938. Vermessung eines Forschungsfeldes,
edited by Lucia Dreidemy and Florian Wenninger, 429–448. Vienna: Bohlau Verlag.
Reiter-Zatloukal, Ilse, Rothlander, Christiane, and Scholnberger, Pia, eds. 2012. Osterre-
ich 1933-1938: Interdisziplinare Annaherungen an das Dollfuß-Schuschnigg-Regime.
Bohlau Verlag.
Reitmayer, Morten and Marx, Christian. 2010. “Netzwerkansatze in der Geschichtswis-
senschaft.” In Handbuch Netzwerkforschung, edited by Christian Stegbauer and
Roger Haußling, 869–880. Wiesbaden: VS Verlag fur Sozialwissenschaften. doi:10.
1007/978-3-531-92575-2 76.
Reupke, Daniel and Stark, Martin. 2015. “Von Glaubigern und Schuldnern. Kreditnet-
zwerke des 19. Jahrhunderts in geographischer Perspective.” In Knoten und Kanten
III: Soziale Netzwerkanalyse in Geschichts- und Politikforschung, edited by Markus
Gamper, Linda Reschke, and Marten During. Bielefeld: transcript Verlag.
Reynolds, John F. 1998. “Do Historians Count Anymore? The Status of Quantitative
Methods in History, 1975–1995.” Historical Methods: A Journal of Quantitative and
Interdisciplinary History 31 (4): 141–148.
Riegert, Bernd. 2021. “EU and Poland battle it out over the rule of law.” Translated
from German by Jon Shelton, Deutsche Welle. https://p.dw.com/p/3yzYG.
Ringer, Fritz. 1990. “The intellectual field, intellectual history, and the sociology of
knowledge.” Theory and society 19 (3): 269–294.
Risam, Roopika. 2016. “Navigating the Global Digital Humanities: Insights from Black
Feminism.” In Debates in the Digital Humanities 2016, edited by Matthew K. Gold
and Lauren F. Klein. University of Minnesota Press. https://dhdebates.gc.cuny.
edu/read/untitled/section/4316ff92-bad0-45e8-8f09-90f493c6f564.
Robertson, Stephen. 2016. “The Differences between Digital Humanities and Digital
History.” In Debates in the Digital Humanities 2016, edited by Matthew K. Gold
and Lauren F. Klein, 289–307. Minneapolis, MN: University of Minnesota Press.
doi:10.5749/j.ctt1cn6thb.28.
Rockwell, Geoffrey. 2007. “An alternate beginning to humanities computing.” Theoreti.ca
(blog). https://theoreti.ca/?p=1608.
235

Bibliography
Roethlisberger, Fritz J. and Dickson, William J. 1939. Management and the worker:
an account of a research program conducted by the Western Electric Company,
Hawthorne Works, Chicago. Cambridge: Harvard University Press.
Romein, C. Annemieke, Kemman, Max, Birkholz, Julie M., Baker, James, De Grui-
jter, Michel, Merono-Penuela, Albert, Ries, Thorsten, Ros, Ruben, and Scagliola,
Stefania. 2020. “State of the field: Digital History.” History 105 (365): 291–312.
Romele, Alberto, Severo, Marta, and Furia, Paolo. (2018) 2020. “Digital Hermeneu-
tics: From Interpreting with Machines to Interpretational Machines.” AI & Society
35:73–86. doi:10.1007/s00146-018-0856-2.
Rose, Isabelle. 2011. “Reconstitution, representation graphite et analyst des rebeaux de
pouvoir au haut Moyen Age. Approach des pratique socials de l’aristocratic a parter
de l’exempla d’odin de Cluny (†942).” REDES–Revista Hispano para el analists de
redes sociales 21 (5). https://revistes.uab.cat/redes/article/view/v21-n2-rose/420-
pdf-en.
Rosenzweig, Roy. 2003. “Scarcity or Abundance? Preserving the Past in a Digital Era.”
American Historical Review 108 (3): 735–762. https://rrchnm.org/essay/scarcity-
or-abundance-preserving-the-past-in-a-digital-era/.
Roth, Camille. 2019. “Digital, digitized, and numerical humanities.” Digital Scholarship
in the Humanities 34 (3): 616–632. doi:10.1093/llc/fqy057.
Rothlander, Christiane. 2012. “Die Durchfuhrungspraxis des politisch motivierten Vermogensentzugs
in Wien 1933 - 1938.” In Osterreich 1933-1938: Interdisziplinare Annaherungen an
das Dollfuß-Schuschnigg-Regime, edited by Ilse Reiter-Zatloukal, Christiane Rothlander,
and Pia Scholnberger, 77–93. Bohlau Verlag.
Royakkers, Lamber, Zimmer, Jelte, Kool, Linda, and Est, Rinie van. 2018. “Societal
and ethical issues of digitization.” Ethics and Information Technology 20:127–142.
doi:10.1007/s10676-018-9452-x.
Ruberg, Bonnie, Boyd, Jason, and Howe, James. 2018. “Toward a Queer Digital Hu-
manities.” In Bodies of Information. Intersectional Feminism and Digital Humani-
ties, edited by Elizabeth Losh and Jacqueline Wernimont. University of Minnesota
Press. https://dhdebates.gc.cuny.edu/read/untitled-4e08b137-aec5-49a4-83c0-
38258425f145/section/e1a72933-2aef-4158-b21c-e6fe35afc091.
Safra, Lou, Chevallier, Coralie, Greyes, and Baumard, Nicolas. 2020. “Tracking histor-
ical changes in trustworthiness using machine learning analyses of facial cues in
paintings.” Article number: 4728, Nature Communications 11. doi:10.1038/s41467-
020-18566-7.
236

Sahle, Patrick. 2013. “DH studieren! Auf dem Weg zu einem Kern- und Referenzcur-
riculum der Digital Humanities.” (Gottingen), DARIAH-DE working papers, no.
1.
. 2015. “Digital Humanities? Gibt’s doch gar nicht!” In Grenzen und Moglichkeiten
der Digital Humanities, edited by Constanze Baum and Thomas Stacker. (= Sonder-
band der Zeitschrift fur digitale Geisteswissenschaften) PDF Format ohne Paginierung.
doi:10.17175/sb001 004.
. 2016. “Zur Professionalisierung der Digital Humanities.” DHDBlog. Digital Hu-
manities im deutschsprachigen Raum (blog). https://dhd-blog.org/?p=6174.
. 2019. “Professuren fur Digital Humanities.” DHdBlog. Digital Humanities im
deutschsprachigen Raum (blog). Accessed 2021-08-20. https://dhd-blog.org/?p=
11018.
Saint Louis University. n.d. “Schuschnigg, Kurt.” https ://archives . slu .edu/agents/
people/383.
Santayana, George. (1905) 2011. The Life of Reason. Introduction and Reason in Com-
mon Sense. Edited by Marianne S. Wokeck and Martin A. Coleman. Vol. VII, Book
One. The Works of George Santayana. With an Introduction by James Gouinlock.
Cambridge, Massachusetts, and London, England: MIT Press.
Schaffer, Simon. 2008. “The Information Order of Isaac Newton’s Principia Mathemat-
ica.” THE HANS RAUSING LECTURE 2008 (Uppsala). https://www.idehist.uu.
se/digitalAssets/636/c 636622-l 3-k salvia 2008 b.pdf.
Scheinfeldt, Tom. 2012. “Sunset for Ideology, Sunrise for Methodology?” In Debates in
the Digital Humanities 2012, edited by Mathew K. Gold, 124–126. University of
Minnesota Press. https://dhdebates.gc.cuny.edu/read/untitled-88c11800-9446-
469b-a3be-3fdb36bfbd1e/section/4a0e25f7-0c3e-40bb-b06b-a64d52a2eaec.
Schlesinger Jr., Arthur. 1962. “The Humanist Looks at Empirical Social Research.”
American Sociological Review 27 (6): 768–771. https : //www . jstor . org / stable/
2090404.
Schmale, Wolfgang. 2017. “Digitales Zeitalter.” Wolfgang Schmale: Mein Europa (blog).
Accessed 2021-08-01. https://wolfgangschmale.eu/digitales-zeitalter/.
Schmidt, Benjamin M. 2011. “Theory First.” Journal of Digital Humanities 1 (1). http:
//journalofdigitalhumanities.org/1-1/theory-first-by-ben-schmidt/.
Schmidt, Desmond. 2012. “The role of markup in the digital humanities.” Historical
Social Research 37 (3): 125–146. doi:10.12759/hsr.37.2012.3.125-146.
237

Bibliography
Schmidt, Desmond. 2014. “Towards an Interoperable Digital Scholarly Edition.” Journal
of the Text Encoding Initiative 7. doi:10.4000/jtei.979.
Schnapp, J. and Presner, Todd. 2009. “The Digital Humanities Manifesto 2.0.” http:
//www.humanitiesblast.com/manifesto/Manifesto V2.pdf.
Schnegg, Michael. 2010. “Die Wurzeln der Netzwerkforschung.” In Handbuch Netzwerk-
forschung, edited by Christian Stegbauer and Roger Haußling, 4:21–28. Wiesbaden:
VS Verlag fur Sozialwissenschaften.
Schonfeld, Mirco and Pfeffer, Jurgen. 2020. “Networks and Context: Algorithmic Chal-
lenges for Context-Aware Social Network Research.” In Challenges in Social Net-
work Research, edited by Giancarlo Ragozini and Maria Prosperina Vitale, 115–130.
Cham: Springer. doi:10.1007/978-3-030-31463-7 8.
Schreibman, Susan, Siemens, Ray, and Unsworth, John, eds. 2004. Oxford: Blackwell.
http://www.digitalhumanities.org/companion/.
Schurer, Kevin, Penkova, Tatiana, and Shi, Yanshan. 2015. “Standardising and Coding
Birthplace Strings and Occupational Titles in the British Censuses of 1851 to 1911.”
Historical Methods: A Journal of Quantitative and Interdisciplinary History 48 (4):
195–213.
Schuschnigg, Kurt. 1969. Im Kampf gegen Hitler. Die Uberwinderung der Anschlußidee.
Wien: Fritz Molden.
Schwandt, Silke. 2018. “Digitale Methoden fur die Historische Semantik. Auf den Spuren
von Begriffen in digitalen Korpora.” Geschichte und Gesellschaft 44:107–134.
. 2021. Digitale Methoden in der mittelalterlichen Rechtsgeschichte – Menschen
vor Gericht in den englischen County Courts. Vortrag im Rahmen des “Digital
History”-Forschungskolloquium, April 28, 2021. https://www.youtube.com/watch?
v=v7fbd8v2MMQ.
Schwarz, Valentin. 2013. ““Austrofaschismus” – mehr als our ein Kampfbegriff? Be-
griffsgeschichte der konkurrierenden politisch-wissenschaftlichen Paradigmen des
Dollfuß/Schuschnigg-Regmines.” Master Thesis, University of Vienna. http://othes.
univie.ac.at/26544/.
Schwerhoff, Gerd. 2011. Historische Kriminalitatsforschung. Frankfurt/M.: Campus Ver-
lag.
Scott, John and Carrington, Peter J., eds. 2011. The SAGE Handbook of Social Network
Analysis. London: Sage Publications.
se/fab (dpa, afp, ap). 2020. “EU-Parlament bleibt im Streit mit Polen und Ungarn hart.”
Deutsche Welle. https://p.dw.com/p/3lX0O.
238

Seale, Clive. 1999. “Quality in Qualitative Research.” Qualitative Inquiry 5 (4): 465–478.
doi:10.1177/107780049900500402.
Seefeldt, Douglas and Thomas, William G. 2009. “What is Digital History?” Perspectives
in History: The newsmagazine of the American Historical Association (magazine).
https://www.historians.org/publications-and-directories/perspectives-on-history/
may-2009/what-is-digital-history.
Shillingsburg, Peter L. 2009. From Gutenberg to Google. Electronic Representations of
Literary Texts. Cambridge: Cambridge University Press. doi:10.1017/CBO9780511
617942.
Shomade, Salmon A. and Hartley, Roger E. 2010. “The Application of Network Analysis
to the Study of Trial Courts.” The Justice System Journal 31 (2): 144–163.
Simmel, Georg. 1908. Soziologie: Untersuchungen uber die Formen der Vergesellschaf-
tung. Leipzig: Duncker & Humblot.
. 1911. Philosophische Kultur. Gesammelte Essais. Leipzig: Klinkhardt.
Singhai, Amit. 2012. “Introducing the Knowledge Graph: things, not strings.” The Key-
word (blog). https://blog.google/products/search/introducing-knowledge-graph-
things-not/.
Snijders, Tom A. B., Bunt, Gerhard G., and Steglich, Christian. 2010. “Introduction
to Actor-Based Models for Network Dynamics.” Social Networks 32:44–60. doi:10.
1016/j.socnet.2009.02.004.
Somers, James. 2017. “Torching the Modern-Day Library of Alexandria. “Somewhere at
Google there is a database containing 25 million books and nobody is allowed to
read them.”” The Atlantic (magazine). https://www.theatlantic.com/technology/
archive/2017/04/the-tragedy-of-google-books/523320/.
Spanton, Rory. 2020. “A Top Scientific Journal Just Published a Racist Algorithm.”
Medium (blog). https://roryspanton.medium.com/a-top-scientific- journal- just-
published-a-racist-algorithm-b13c51c4e5b0.
Springmann, Uwe and Ludeling, Anke. 2017. “OCR of historical printings with an ap-
plication to building diachronic corpora: A case study using the RIDGES herbal
corpus.” Digital Humanities Quarterly 11 (2). http://www.digitalhumanities.org/
dhq/vol/11/2/000288/000288.html.
Stachowiak, Herbert. 1973. Allgemeine Modelltheorie. Wien, New York: Springer Verlag.
https://archive.org/details/Stachowiak1973AllgemeineModelltheorie.
Stark, Martin. 2014. “Soziale Einbettung lines landlichen Kreditmarkets im 19. Jahrhun-
dert.” PhD Thesis, Universitat Trier. doi:10.25353/ubtr-xxxx-b2c2-2f07.
239

Bibliography
Stark, Martin. 2016. “Netzwerkberechnungen. Anmerkungen zur Verwendung formaler
Methoden.” In Handbuch Historische Netzwerkforschung: Grundlagen und Anwen-
dungen, edited by Marten During, Ulrich Eumann, Martin Stark, and Linda von
Keyserlingk, 1:155–171. Munster: LIT Verlag.
Stegbauer, Christian and Haußling, Roger. 2010a. “Einleitung: Geschichte der Netzw-
erkforschung.” In Handbuch Netzwerkforschung, edited by Christian Stegbauer and
Roger Haußling, 4:19–20. Wiesbaden: VS Verlag fur Sozialwissenschaften.
, eds. 2010b. Handbuch Netzwerkforschung. Vol. 4. Wiesbaden: VS Verlag fur
Sozialwissenschaften.
Stephenson-Goodknight, Rosie. 2016. “Viewpoint: How I tackle Wiki gender gap one
article at a time - BBC News.” BBC (newspaper). Accessed 2020-09-12. https :
//www.bbc.com/news/world-38238312.
Sternfeld, Joshua. 2014. “Historical Understanding in the Quantum Age.” Journal of
Digital Humanities 3 (2). http://journalofdigitalhumanities.org/3- 2/historical-
understanding-in-the-quantum-age/.
Strupczewski, Jan. 2020. “EU lists rule of law concerns for Hungary, Poland, pivotal in
releasing COVID funds.” Reuters. https://www.reuters.com/world/europe/eu-
lists-rule-of-law-concerns-hungary-poland-could-withhold-funds-2021-07-20/.
Subrahmanyam, Sanjay. 2015. “Global Intellectual History Beyond Hegel and Marx.”
History and Theory 54 (1): 126–137. doi:10.1111/hith.10746. https://onlinelibrary.
wiley.com/doi/abs/10.1111/hith.10746.
. 2017. “Beyond the usual suspects: on intellectual networks in the early modern
world.” Global Intellectual History 2 (1): 30–48.
Suchanek, Fabian M., Kasneci, Gjergji, and Weikum, Gerhard. 2007. “Yago: A Core
of Semantic Knowledge.” In Proceedings of the 16th International Conference on
World Wide Web, 697–706. WWW ’07. Banff, Alberta, Canada: ACM. doi:10.1145/
1242572.1242667.
. n.d. World Wide Web Conference 2007 Semantic Web Track, Journal of Web
Semantics. doi:10.1016/j.websem.2008.06.001.
Sula, Chris A. and Hill, Heather. 2019. “The Early History of Digital Humanities: An
analysis of Computer and the Humanities (1966–2004) and Literary and Linguistic
Computing (1986–2004).” Digital Scholarship in the Humanities 34 (Supplement 1):
i190–i206. doi:10.1093/llc/fqz072.
Svensson, Patrick. 2009. “Humanities Computing as Digital Humanities.” Digital Hu-
manities Quarterly 3 (3). http://www.digitalhumanities.org/dhq/vol/3/3/000065/
000065.html.
240

SZ.de/kit/mati. 2020. “Ungarn: Orbans Notstandsgesetz vom Parlament gebilligt.” Suddeutsche
Online 2020-03-30. https://www.sueddeutsche.de/politik/ungarn-orban-notstands
gesetz-1.4862238.
tagesschau.com. 2020a. “EU einig bei Haushalt und Corona-Paket.” Tagesschau. https:
//www.tagesschau.de/ausland/europa/eu-gipfel-einigung-105.html.
. 2020b. “Ungarn fahrt die Krallen aus.” Tagesschau. https://www.tagesschau.
de/ausland/eu-corona-ungarn-103.html.
Talos, Emmerich. 2013. Das austrofaschistische Herrschaftssystem Osterreich 1933 -
1938. 2. Munster: LIT Verlag.
TEI Consortium. 2020. TEI P5: Guidelines for Electronic Text Encoding and Inter-
change. Version 4.0.0. Accessed 2020-04-29. https://www.tei-c.org/release/doc/tei-
p5-doc/en/html/index.html.
Terras, Melissa. 2011. “Peering Inside the Big Tent: Digital Humanities and the Crisis
of Inclusion.” Melissa Terras (blog). http://melissaterras.blogspot.com/2011/07/
peering-inside-big-tent-digital.html.
. 2012. “Digitization and digital resources in the humanities.” In Digital Human-
ities in Practice, edited by Claire Warwick, Melissa Terras, and Julianne Nyhan,
47–70. Facet. doi:10.29085/9781856049054.004.
. 2013. “Peering Inside the Big Tent.” In Defining Digital Humanities. A Reader,
edited by Melissa Terras, Julianne Nyhan, and Edward Vanhoutte, 263–270. Lon-
don: Taylor & Francis.
Terras, Melissa and Nyhan, Julianne. 2016. “Father Busa’s Female Punch Card Opera-
tives,” edited by Matthew K. Gold and Lauren F. Klein. University of Minnesota
Press. https://dhdebates.gc.cuny.edu/read/untitled/section/1e57217b-f262-4f25-
806b-4fcf1548beb5.
Thaller, Manfred. 1987. “Clio – ein datenbankorientiertes System fur die historischen
Wissenschaften: Fortschreibungsbericht.” Historical Social Research 12 (1): 88–91.
doi:10.12759/hsr.12.1987.1.88-91.
. 2012. “Controversies around the digital humanities: an agenda.” Historical Social
Research 37 (3): 7–23. doi:10.12759/hsr.37.2012.3.7-23.
. 2017a. “Digital Humanities als Wissenschaft.” In Digital Humanities: Eine Einfuhrung,
edited by Fotis Jannidis, Hubertus Kohle, and Malte Rehbein, 13–18. Stuttgart: J.
B. Metzler.
241

Bibliography
Thaller, Manfred. 2017b. “Geschichte der Digital Humanities.” In Digital Humanities:
Eine Einfuhrung, edited by Fotis Jannidis, Hubertus Kohle, and Malte Rehbein,
3–12. Stuttgart: J. B. Metzler.
Thomson, Norman. 1989. “How to Read Articles which Depend on Statistics.” Literary
and Linguistic Computing 4 (1): 6–11. doi:10.1093/llc/4.1.6.
Tiffert, Glenn D. 2019. “Peering down the Memory Hole: Censorship, Digitization, and
the Fragility of Our Knowledge Base.” American Historical Review 124 (2): 550–
568. doi:10.1093/ahr/rhz286.
Travers, Jeffery and Milgram, Stanley. 1969. “An experimental study of the small world
problem.” Sociometry 32 (4): 425–443.
Tufte, Edward R. 1983. The Visual Display of Qualitative Information. Cheshire, Con-
necticut: Graphics Press.
Turchin, Peter. 2008. “Arise ‘cliodynamics’.” Nature 454:34–35. doi:10.1038/454034a.
Underwood, Ted. 2014. “Theorize Research Practices We Forgot to Theorize Twenty
Years Ago.” Representations 127:64–72. doi:10.1525/rep.2014.127.5.64..
Valente, Thomas W. 2010. “Exponential Random Graph Models, P* and Actor Oriented
Models.” In Social Networks and Health: Models, Methods, and Applications, edited
by Thomas W. Valente, 151–163. New York Oxford: Oxford University Press.
Verbruggen, Christophe, D’haeninck, Thomas, and Blomme, Hans. 2020. “Mobility and
Movements in Intellectual History: A Social Network Approach.” In The Power
of Networks. Prospects of Historical Network Research, edited by Marten During,
Florian Kerschbaumer, Linda von Keyserlingk-Rehbein, and Martin Stark, 125–150.
London New York: Routledge.
Viseur, Robert. 2014. “Reliability of user-generated data: The case of biographical data in
Wikipedia.” In Proceedings of The International Symposium on Open Collaboration,
1–3. New York, NY: Association for Computing Machinery. doi:10.1145/2641580.
2641581.
Vugt, Ingeborg van. 2017. “Using Multi-Layered Networks to Disclose Books in the
Republic of Letters.” Journal of Historical Network Research 1 (1): 25–51. Accessed
2020-04-15. //jhnr.uni.lu/index.php/jhnr/article/view/7.
Wachter, Karina. 2013. “Politik und Strafjustiz in den Jahren 1933 und 1934.” PhD
Thesis, University of Vienna.
Wagner, David. 2012. “Peirce, Panofsky, and the Gothic.” Transactions of the Charles
S. Peirce Society 48 (4): 436–455. doi:10.2979/trancharpeirsoc.48.4.436.
242
Walsh, Brandon. 2017. Collaborative Writing to Build Digital Humanities Practice. Con-
ference Presentation from the Digital Humanities Conference in Montreal. doi:10.
17613/M61C20.
Ward, Megan and Wisnicki, Adrian S. 2019. “The Archive After Theory.” In Debates in
the Digital Humanities 2019, edited by Matthew K. Gold, 200–206.
Warner, Sam Bass. (1962) 1978. Streetcar Suburbs: The Process of Growth in Boston,
1870–1900. 2nd ed. Cambridge: Harvard University Press.
Warner, W. Lloyd. 1937. A black civilization: a social study of an Australian tribe. New
York: Harper & Brothers.
Warner, William Lloyd and Lunt, Paul Sanborn. 1941. The social life of a modern com-
munity. New Haven: Yale University Press.
Wasserman, Stanley and Faust, Katherine. 1994. Social Network Analysis: Methods and
Applications. 1st ed. Structural Analysis in the Social Sciences, 8. New York: Cam-
bridge University Press.
Watts, Duncan J. and Strogatz, Steven H. 1998. “Collective dynamics of ’small-world’
networks.” Nature 393 (6684): 440–442.
Weitin, Thomas. 2015. “Scalable Reading. Paul Heyses Deutscher Novellenschatz zwis-
chen Einzeltext und Makroanalyse. Kulturwissenschaftliches Kolleg Konstanz. Schloss
Seeburg, Kreuzlingen. 4.–6. Juni 2015.” Digital Humanities Cooperation (website).
http://digitalhumanitiescenter.de/wp-content/uploads/2015/03/scalable reading.
pdf.
Weizenbaum, Joseph. (1976) 1983. “Computer power and human reason: From judgment
to calculation.” (New York).
Wellman, Barry. 1983. “Network analysis: Some basic principles.” Sociological Theory
1:155–200.
Wenninger, Florian. 2021. “Austrofaschismus.” In Osterreichische Zeitgeschichte–Zeitgeschichte
in Osterreich, edited by Graser, Marcus and Rupnow, Dirk, 41:67–107. Bohlaus Zeit-
geschichtliche Bibliothek. Wien Koln: Bohlau Verlag. doi:10.7767/9783205209980.
Wenninger, Florian, Mesner, Maria, and Ardelt, Rudolf. 2017. “Forschungsbericht Re-
pression und politische Justiz unter dem Dollfuß/Schuschnigg-Regime. Das Beispiel
Wien 1935.” Projektleitung Dr. Mesner (2014-15), Prof. Dr. Ardelt (2015-17), Pro-
jektkoordination Dr. Wenninger. Unpublished manuscript.
Wetherell, Charles. 1998. “Historical Social Network Analysis.” Supplement, Interna-
tional Review of Social History 43:125–144. https://www.jstor.org/stable/2640551
6.
243

Bibliography
Wevers, Melvin and Smits, Thomas. 2019. “The visual digital turn: Using neural net-
works to study historical images.” Digital Scholarship in the Humanities 35 (1):
194–207. doi:10.1093/llc/fqy085.
Whalen, Ryan. 2016. “Legal Networks: The Promises and Challenges of Legal Network
Analysis.” Michigan State Law Review 2016 (539): 540–565. https ://ssrn .com/
abstract=3000144.
Whales, Robert. 1991. “A Quantitative History of the Journal of Economic History and
the Cliometric Revolution.” The Journal of Economic History 51 (2): 289–301.
White, Harrison C. 1963. An anatomy of kinship: Mathematical models for structures of
cumulated roles. Englewood Cliffs: Prentice Hall.
. 1992. “Identity and Control.” (Princeton, NJ) 273.
White, Harrison C., Boorman, Scott A., and Breiger, Ronald L. 1976. “Social Structure
from Multiple Networks I: Blockmodels of Roles and Positions.” American Journal
of Sociology 81:731–780.
White, Harrison C. and Breiger, Ronald L. 1975. “Pattern across networks.” Society
12:68–73.
Wickberg, Daniel. 2001. “Intellectual History vs. the Social History of Intellectuals.”
Rethinking History 5 (3): 383–395. doi:10.1080/13642520110078505. https://doi.
org/10.1080/13642520110078505.
Wiedemann, Gregor and Lemke, Matthias. 2016. “Text Mining fur die Analyse qual-
itativer Daten. Auf dem Weg zu einer Best Practice?” In Text Mining in then
Sozialwissenschaften, edited by Matthias Lemke and Gregor Wiedemann, 399–419.
Wiesbaden: Springer Fachmedien. doi:10.1007/978-3-658-07224-7 15.
Wiese, Leopold von. (1924) 1933. “System der Allgemeine Soziologie als Lehre von den
sozialen Prozessen und den sozialen Gebilden der Menschen.” (Munchen).
. 1937. “Sociometric Planning of a New Community.” Sociometry, no. 1: 220–254.
. 1949. “Sociometry.” Sociometry, no. 12: 202–214.
Williamson, Jeffrey G. 1965. “Review: Untitled.” Economic Development and Cultural
Change 14 (1): 109–113. http://www.jstor.org/stable/1152312.
Wimmer, Andreas and Lewis, Kevin. 2010. “Beyond and below racial homophily: ERG
models of a friendship network documented on Facebook.” American Journal of
Sociology 116 (2): 583–642.
Winterer, Caroline. 2012. “Where is America in the Republic of Letters?” Modern In-
tellectual History 9 (3): 597–623. doi:10.1017/S1479244312000212.
244

Winters, Jane. 2019. “Digital History,” edited by Peter Burk and Marek Tamm, 277–
300. Bloomsbury.
Wulf, William A. 1997. “The Science of Future Technology: Look in the Spaces for
Tomorrow’s Innovations.” J-CACM 40 (2): 109–111. doi:10.1145/253671.253744.
Zaagsma, Gerben. 2013. “On Digital History.” BMGN–Low Countries Historical Review
128 (4): 3–29. doi:0.18352/bmgn-lchr.9344.
Zelizer, Julian. 2013. “On the chopping block: History, literature, civics and the arts.”
CNN.com (newspaper). Accessed 2018-02-01. https://edition.cnn.com/2013/06/
24/opinion/zelizer-humanities-in-trouble/index.html.
Ziegler, Rolf. 2010. “Deutschsprachige Netzwerkforschung.” In Handbuch Netzwerkforschung,
edited by Christian Stegbauer and Roger Haußling, 4:39–53. Wiesbaden: VS Verlag
fur Sozialwissenschaften.
245