Handbok om kosttillskott för livsmedelstillsynsmyndigheter och ...

SUPERSONIC FIGHTER AIRCRAFT(SWEPT BACK WING)
A Project report
Submitted by
VEERAPPAN R 411011101021
PRABHAKARAN P 411011101015
In the partial fulfillment for the award of the degree
Of
BACHELOR OF ENGINEERING
IN
AERONAUTICAL ENGINEERING
ANNA UNIVERSITY : CHENNAI 600 025

COMPARATIVE DATA SHEETS:
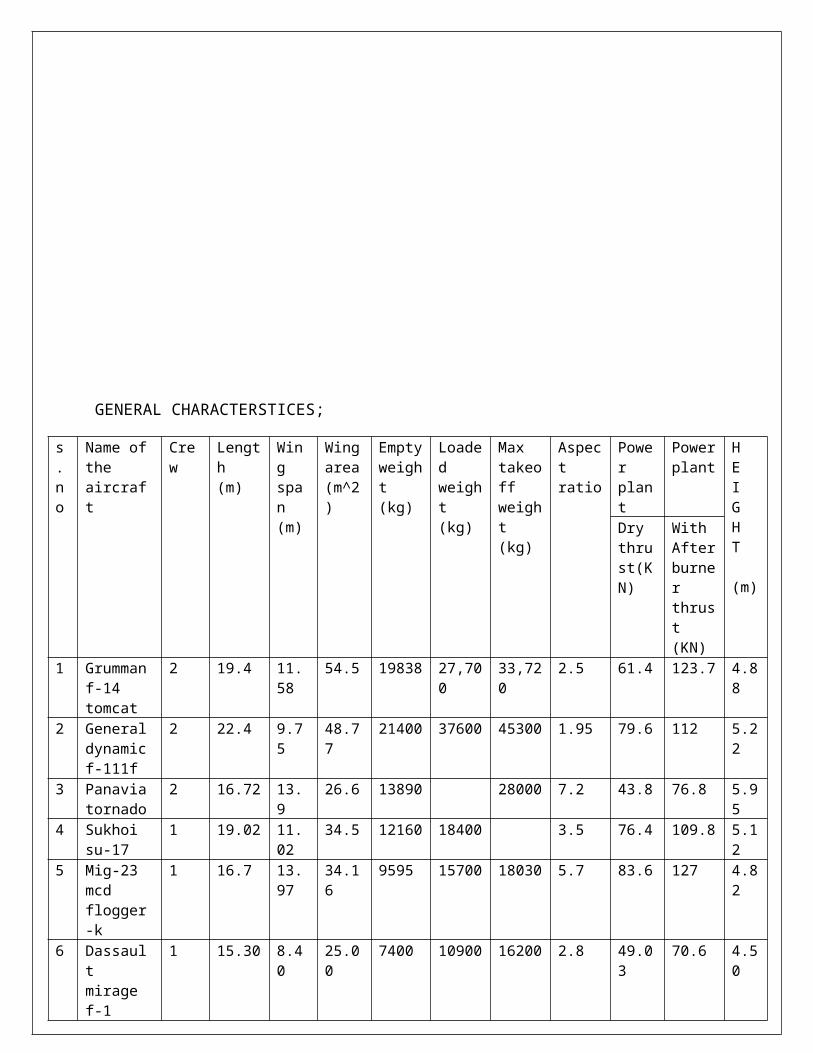
GENERAL CHARACTERSTICES;
s.no
Name ofthe aircraft
Crew
Length (m)
Wing span (m)
Wingarea(m^2)
Emptyweight (kg)
Loaded weight (kg)
Max takeoff weight (kg)
Aspect ratio
Power plant
Powerplant
HEIGHT (m)
Dry thrust(KN)
With Afterburner thrust (KN)
1 Grummanf-14 tomcat
2 19.4 11.58
54.5 19838 27,700
33,720
2.5 61.4 123.7 4.88
2 Generaldynamicf-111f
2 22.4 9.75
48.77
21400 37600 45300 1.95 79.6 112 5.22
3 Panaviatornado
2 16.72 13.9
26.6 13890 28000 7.2 43.8 76.8 5.95
4 Sukhoi su-17
1 19.02 11.02
34.5 12160 18400 3.5 76.4 109.8 5.12
5 Mig-23 mcd flogger-k
1 16.7 13.97
34.16
9595 15700 18030 5.7 83.6 127 4.82
6 Dassault mirage f-1
1 15.30 8.40
25.00
7400 10900 16200 2.8 49.03
70.6 4.50

7 MC donnelldouglasf4 phantomii
2 19.2 11.7
49.2 13757 18825 28030 2.8 52.9 79.4 5.0
8 Sukhoi su-24
2 22.5 10.34
55.2 22300 38040 43755 1.9 75 109.8 6.19
9 Vought xf8u-3 crusader-iii
1 17.86 12.16
41.8 9915 14660 17590 3.5 73.4 131.2 4.98
10
Englishelectric lightning
1 16.8 10.6
44.01
14092 18638 20752 2.5 55.74
71.17 5.97
11
Mikoyan-gurevich mig-17F
1 11.26 9.63
22.6 3919 5350 6069 4.1 22.5 33.8 3.80
12
Chengduj-7MG
1 14.885
8.32
24.88
5292 7540 9100 2.8 44.16
64.7 4.11
PERFORMANCES;
s.no
Name of the aircraft
Cruise speed(km/hr)
Range(km)
Service ceiling(m)
Thrust/weight
Rate ofclimb(m/s)
Wing loading(kg/m^2)
1 Grumman f-14 tomcat
2485 2960 15,200 .92 229 508.25
2 General dynamic f-111f
2655 6760 20100 0.61 131.5 771.96
3 Panavia tornado
2400 3890 15240 0.55 76.7 707.95
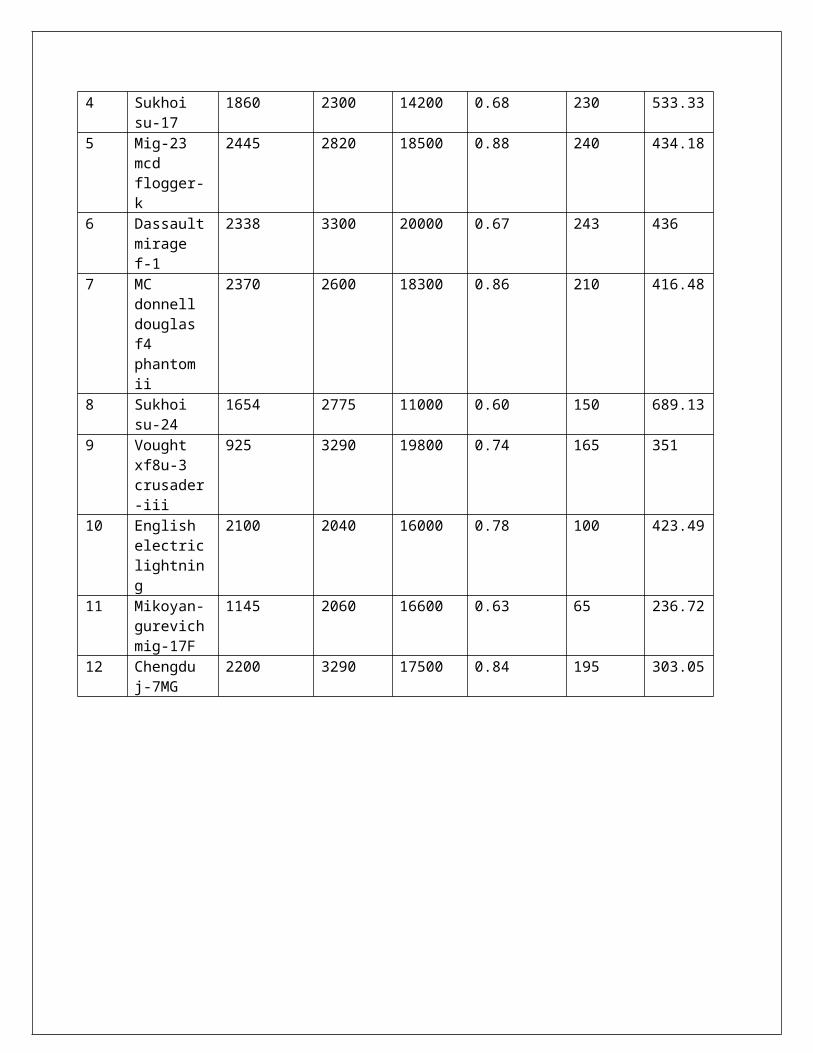
4 Sukhoi su-17
1860 2300 14200 0.68 230 533.33
5 Mig-23 mcd flogger-k
2445 2820 18500 0.88 240 434.18
6 Dassaultmirage f-1
2338 3300 20000 0.67 243 436
7 MC donnell douglas f4 phantom ii
2370 2600 18300 0.86 210 416.48
8 Sukhoi su-24
1654 2775 11000 0.60 150 689.13
9 Vought xf8u-3 crusader-iii
925 3290 19800 0.74 165 351
10 English electriclightning
2100 2040 16000 0.78 100 423.49
11 Mikoyan-gurevichmig-17F
1145 2060 16600 0.63 65 236.72
12 Chengdu j-7MG
2200 3290 17500 0.84 195 303.05

PRELIMINARY GRAPHS OF VARIOUS PARAMETERS WITH RESPECT TO VELOCITY
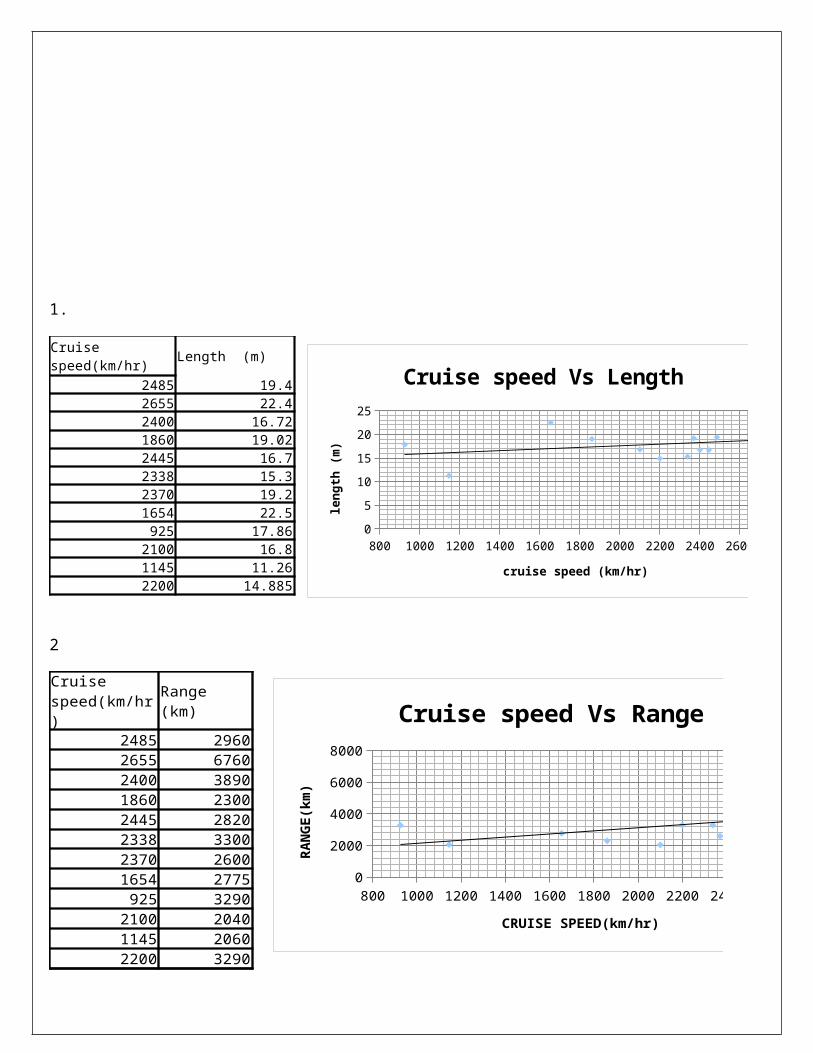
1.
Length (m)
2485 19.42655 22.42400 16.721860 19.022445 16.72338 15.32370 19.21654 22.5925 17.86
2100 16.81145 11.262200 14.885
Cruise speed(km/hr)
800 1000 1200 1400 1600 1800 2000 2200 2400 2600 28000510152025
Cruise speed Vs Length
cruise speed (km/hr)
leng
th (
m)
2
2485 29602655 67602400 38901860 23002445 28202338 33002370 26001654 2775925 3290
2100 20401145 20602200 3290
Cruise speed(km/hr)
Range (km)
800 1000 1200 1400 1600 1800 2000 2200 2400 2600 28000
2000
4000
6000
8000
Cruise speed Vs Range
CRUISE SPEED(km/hr)
RANG
E(km)
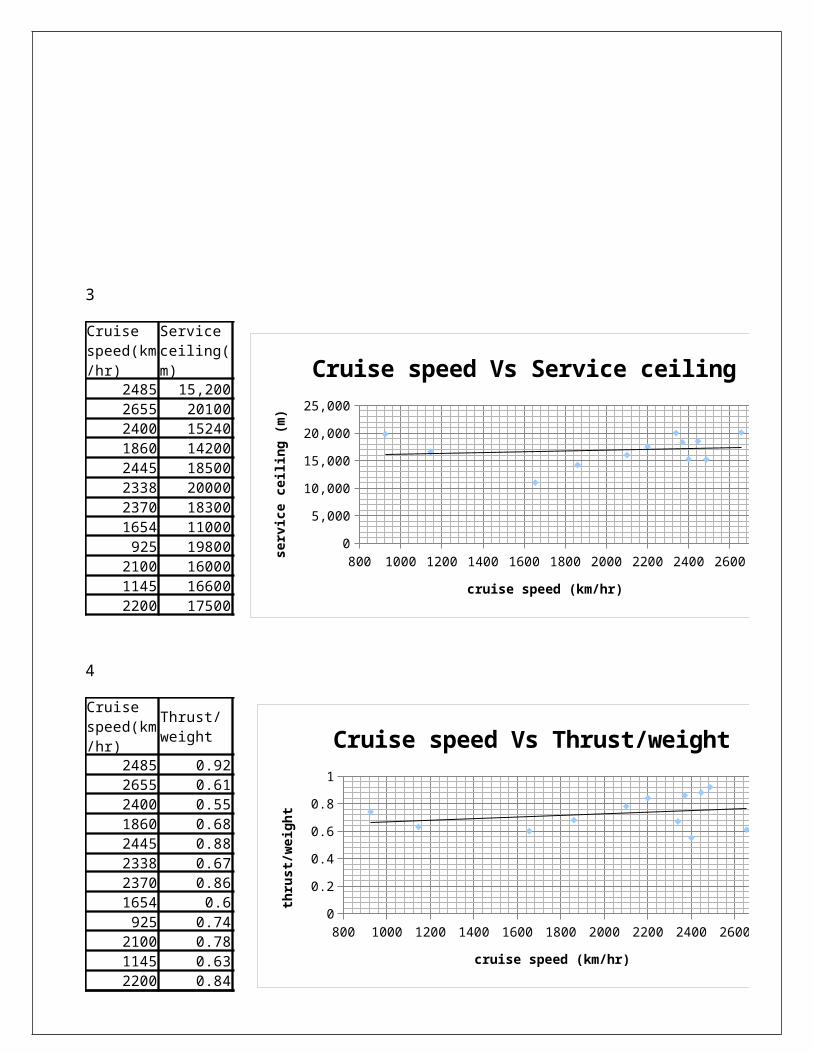
3
2485 15,2002655 201002400 152401860 142002445 185002338 200002370 183001654 11000925 19800
2100 160001145 166002200 17500
Cruise speed(km/hr)
Service ceiling(m)
800 1000 1200 1400 1600 1800 2000 2200 2400 2600 28000
5,000
10,000
15,000
20,000
25,000
Cruise speed Vs Service ceiling
cruise speed (km/hr)
serv
ice
ceil
ing
(m)
4
2485 0.922655 0.612400 0.551860 0.682445 0.882338 0.672370 0.861654 0.6925 0.74
2100 0.781145 0.632200 0.84
Cruise speed(km/hr)
Thrust/weight
800 1000 1200 1400 1600 1800 2000 2200 2400 2600 28000
0.2
0.4
0.6
0.8
1
Cruise speed Vs Thrust/weight
cruise speed (km/hr)
thru
st/w
eigh
t

5
2485 2292655 131.52400 76.71860 2302445 2402338 2432370 2101654 150925 165
2100 1001145 652200 195
Cruise speed(km/hr)
Rate of climb (m/s)
800 1000 1200 1400 1600 1800 2000 2200 2400 2600 2800050
100150200250300
Cruise speed Vs Rate of climb
cruise speed (km/hr)
rate
ofc
limb
(m/
s)
6
2485 11.582655 9.752400 13.91860 11.022445 13.972338 8.42370 11.71654 10.34925 12.16
2100 10.61145 9.632200 8.32
Cruise speed(km/hr)
Wing span (m)
800 1000 1200 1400 1600 1800 2000 2200 2400 2600 28000
5
10
15
Cruise speed Vs Wing span
cruise speed (km/hr)
wing
span
(m)
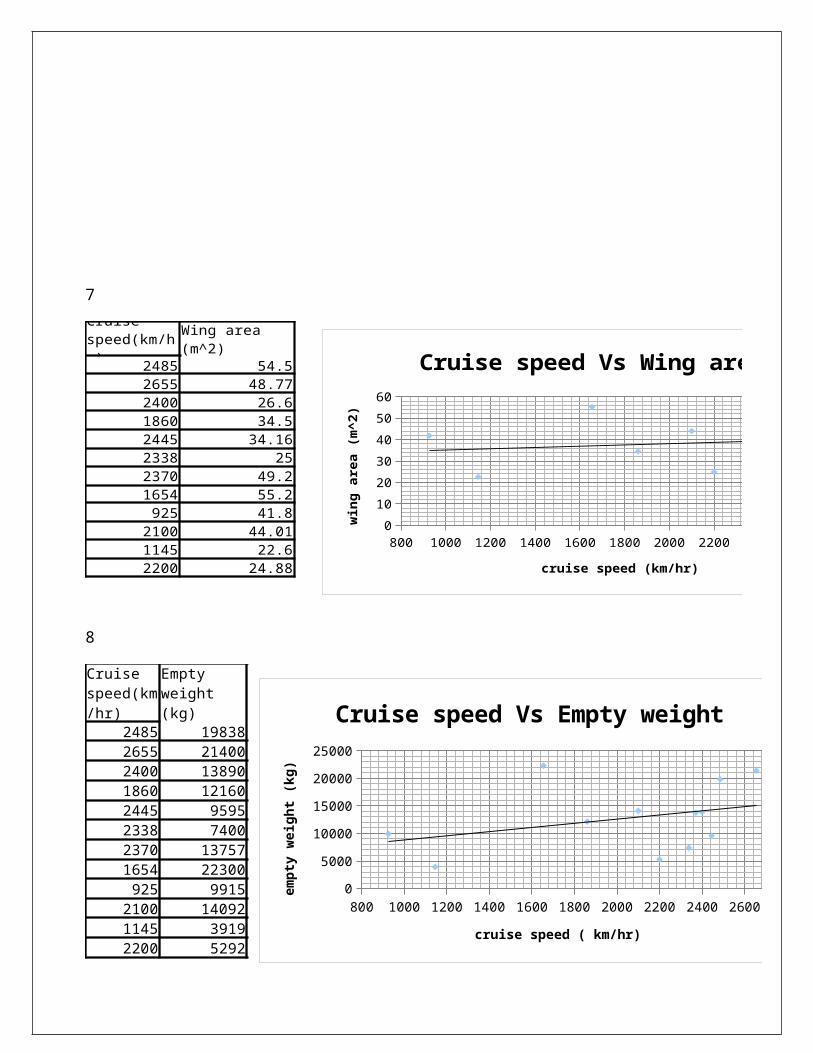
7
2485 54.52655 48.772400 26.61860 34.52445 34.162338 252370 49.21654 55.2925 41.8
2100 44.011145 22.62200 24.88
Cruise speed(km/hr)
Wing area (m^2)
800 1000 1200 1400 1600 1800 2000 2200 2400 2600 28000
102030405060
Cruise speed Vs Wing area
cruise speed (km/hr)
wing area (m^2)
8
cruise speed (km/hr)2485 198382655 214002400 138901860 121602445 95952338 74002370 137571654 22300925 9915
2100 140921145 39192200 5292
Cruise speed(km/hr)
Empty weight (kg)
800 1000 1200 1400 1600 1800 2000 2200 2400 2600 28000
5000
10000
15000
20000
25000
Cruise speed Vs Empty weight
cruise speed ( km/hr)
empty weig
ht (kg)
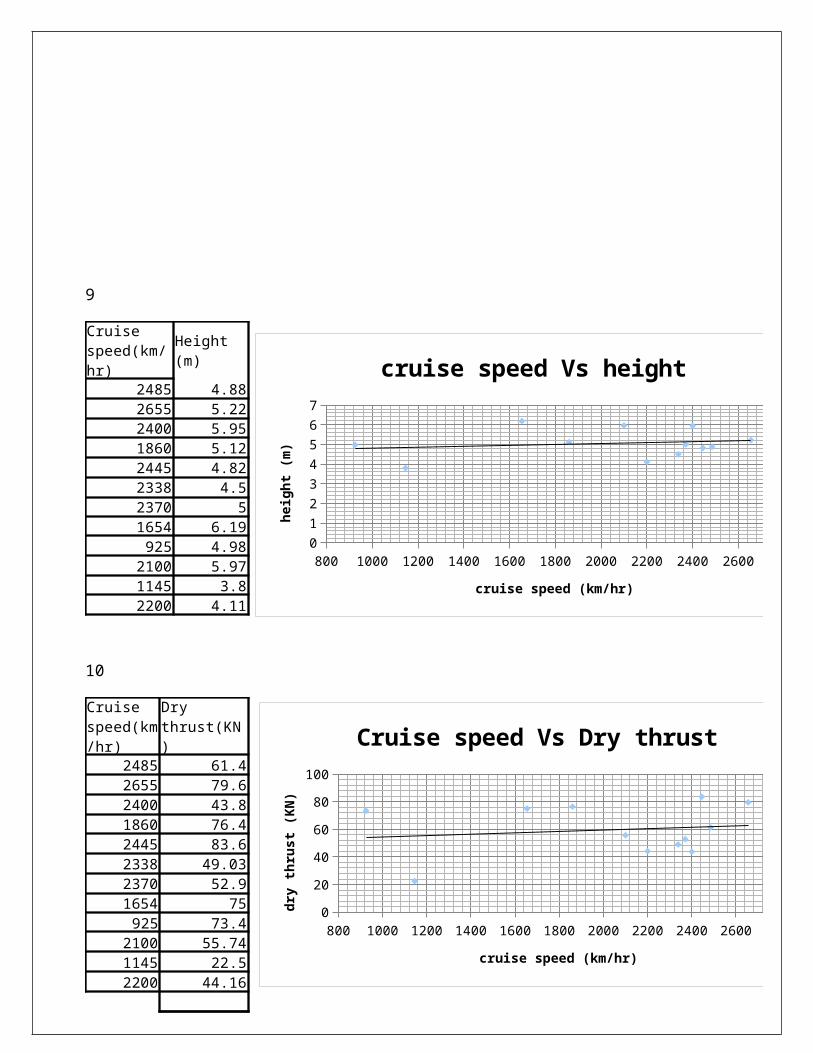
9
2485 4.882655 5.222400 5.951860 5.122445 4.822338 4.52370 51654 6.19925 4.98
2100 5.971145 3.82200 4.11
Cruise speed(km/hr)
Height (m)
800 1000 1200 1400 1600 1800 2000 2200 2400 2600 280001234567
cruise speed Vs height
cruise speed (km/hr)
height
(m)
10
2485 61.42655 79.62400 43.81860 76.42445 83.62338 49.032370 52.91654 75925 73.4
2100 55.741145 22.52200 44.16
Cruise speed(km/hr)
Dry thrust(KN)
800 1000 1200 1400 1600 1800 2000 2200 2400 2600 28000
20
40
60
80
100
Cruise speed Vs Dry thrust
cruise speed (km/hr)
dry th
rust (
KN)
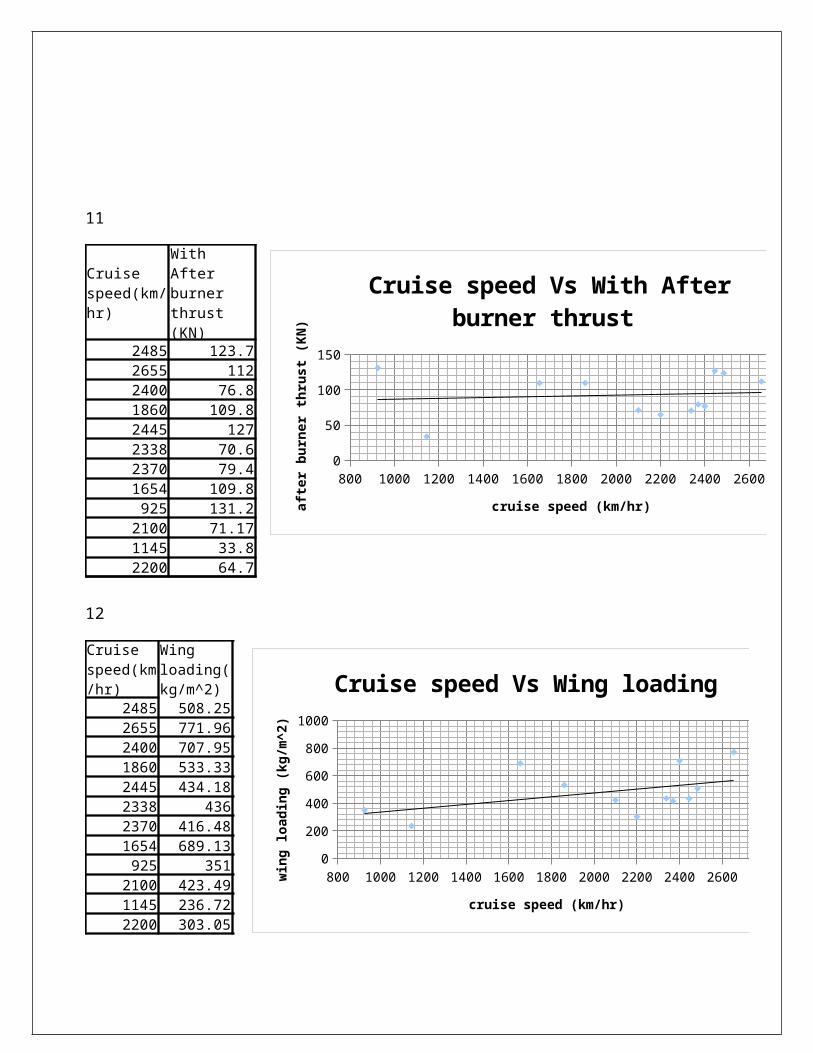
11
2485 123.72655 1122400 76.81860 109.82445 1272338 70.62370 79.41654 109.8925 131.2
2100 71.171145 33.82200 64.7
Cruise speed(km/hr)
With After burner thrust (KN)
800 1000 1200 1400 1600 1800 2000 2200 2400 2600 28000
50
100
150
Cruise speed Vs With After burner thrust
cruise speed (km/hr)afte
r bu
rner t
hrus
t (K
N)
12
2485 508.252655 771.962400 707.951860 533.332445 434.182338 4362370 416.481654 689.13925 351
2100 423.491145 236.722200 303.05
Cruise speed(km/hr)
Wing loading(kg/m^2)
800 1000 1200 1400 1600 1800 2000 2200 2400 2600 28000
200
400
600
800
1000
Cruise speed Vs Wing loading
cruise speed (km/hr)
wing
loa
ding
(kg
/m^2
)
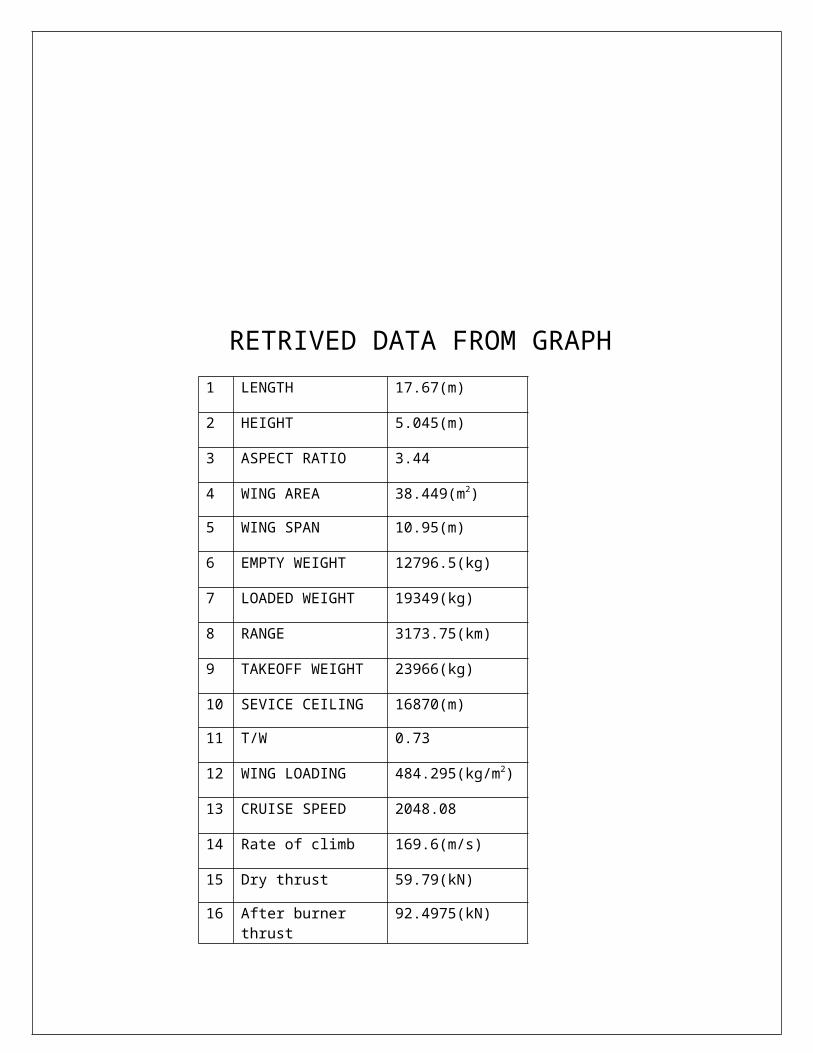
RETRIVED DATA FROM GRAPH
1 LENGTH 17.67(m)
2 HEIGHT 5.045(m)
3 ASPECT RATIO 3.44
4 WING AREA 38.449(m2)
5 WING SPAN 10.95(m)
6 EMPTY WEIGHT 12796.5(kg)
7 LOADED WEIGHT 19349(kg)
8 RANGE 3173.75(km)
9 TAKEOFF WEIGHT 23966(kg)
10 SEVICE CEILING 16870(m)
11 T/W 0.73
12 WING LOADING 484.295(kg/m2)
13 CRUISE SPEED 2048.08
14 Rate of climb 169.6(m/s)
15 Dry thrust 59.79(kN)
16 After burner thrust
92.4975(kN)

PRELIMINARY WEIGHT ESTIMATION
Weight estimation:
The common choice to subdivide and categorize theweight components of an airplane is:
1. CREW WEIGHT W crew-it comprises the people necessary to operatethe plane in flight. For our design the crew is 2
2. PAYLOAD WEIGHT WP-The payload is what the airplane intended tocarry.in our design payload is missiles.
3. FUEL WEIGHT Wf-is the weight of the fuel in the fuel tanks whichdecreases with time during flight.
4.EMPTY WEIGHT We-is weight of everything else –thestructure ,engines ,avionics ,landing gear ,seats and anything elsethat is not crew, payload or fuel.
The designs take-off weightWO is the weight of the airplane at the instant it begins itsmission. Hence it can be shown that,
W0 = Wcrew + WP +Wf + We
The crew and payload weightare both known since they are given in design requirement.The onlyunknowns are the fuel weight and empty weight. However, they areboth depend on the total aircraft weight.
To simplify thecalculation, both fuel and empty weight can be expressed asfraction of the total take-off weight (i.e) (Wf/W0) and (We/ W0).
Thus above eqn becomes
W0 = Wcrew + WP + (Wf/W0) W0 + (We/W0) W0.
This can be solved for W0 asfollows:
W0- (Wf/W0) W0 - (We/ W0) W0= Wcrew +WP
Now we can be determine if(Wf/W0) and (We/ W0).can be estimated .these are described below.
CREW WEGHT ESTIMATION:
In our design crew = 2
On an average, taking 200kg person,
Crew load = 2 x 90.72=182kg
PAYLOAD ESTIMATION:
In our design,
Pay load=4000 kg, and it’s given by
W0 ¿
Wcrew+WP
1−(WfW0 )−(We /W0)

Armaments detail:
Type Weight(kg)Mk 82 227Mk 83 454Mk 84 907Mk 117 340GBU 10 907BLU 109 907GBU-12 257
FUEL WEIGHT ESTIMATION:
Mission profile:
Mission profile is explaining thevarious stages and maneuver’s during flight of the aircraft fromstart to shut down. The mission for our fighter aircraft is shownin below
Phase 1 : engine start and warm up

Phase 2 : taxi
Phase 3 : take-off
Phase 4 : climb
Phase 5 : cruise-out
Phase 6 : loiter
Phase 7 : descend
Phase 8 : dash-out
Phase 9 : drop bombs
Phase 10 : strafe
Phase 11 : dash in
Phase 12 : climb to cruise
Phase 13 : cruise in
Phase 14 : descend
Phase 15 : landing
Mission fuel fraction (Mff):
The fuel weightratio can be obtained from product of mission segment weight at theend of the segment divided by the weight at the beginning ofsegment.
1. Engine start up : start weight is WTO and end weight is W1
W1/WTO=.990
2. Taxing : start weight is W1and end weight is W2
W2/W1=.990
3. Take-off : start weight is W2 and end weight is W3
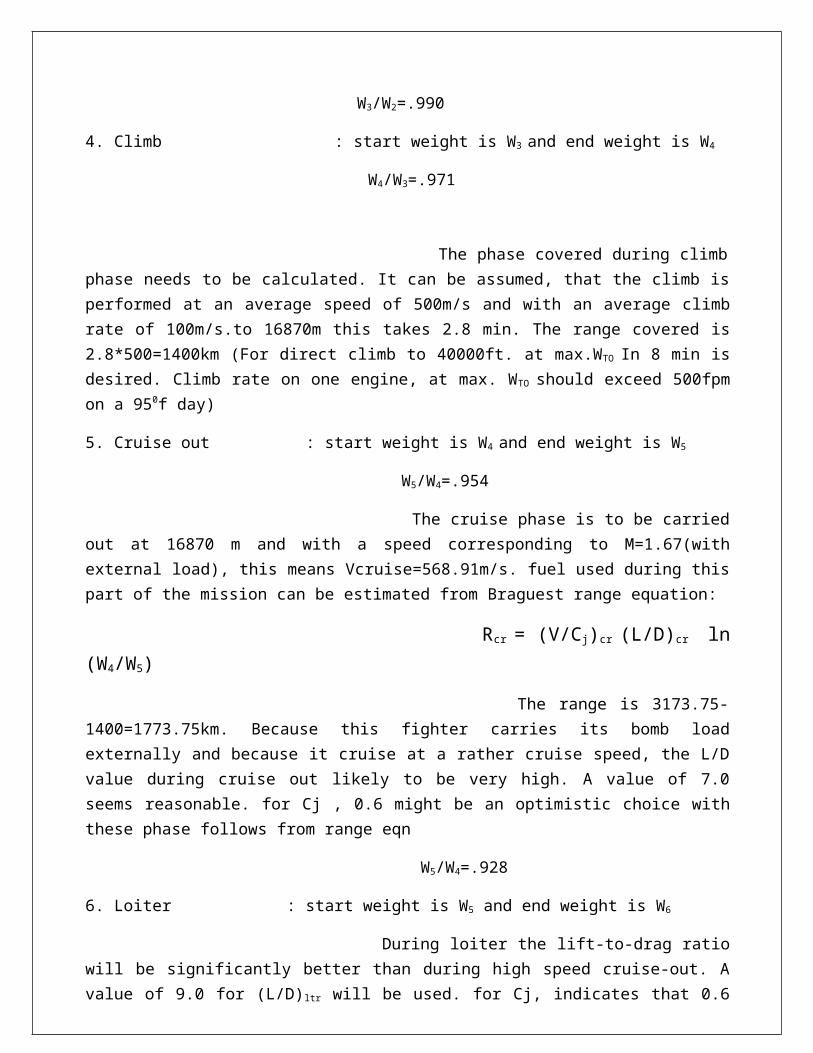
W3/W2=.990
4. Climb : start weight is W3 and end weight is W4
W4/W3=.971
The phase covered during climbphase needs to be calculated. It can be assumed, that the climb isperformed at an average speed of 500m/s and with an average climbrate of 100m/s.to 16870m this takes 2.8 min. The range covered is2.8*500=1400km (For direct climb to 40000ft. at max.WTO In 8 min isdesired. Climb rate on one engine, at max. WTO should exceed 500fpmon a 950f day)
5. Cruise out : start weight is W4 and end weight is W5
W5/W4=.954
The cruise phase is to be carriedout at 16870 m and with a speed corresponding to M=1.67(withexternal load), this means Vcruise=568.91m/s. fuel used during thispart of the mission can be estimated from Braguest range equation:
Rcr = (V/Cj)cr (L/D)cr ln(W4/W5)
The range is 3173.75-1400=1773.75km. Because this fighter carries its bomb loadexternally and because it cruise at a rather cruise speed, the L/Dvalue during cruise out likely to be very high. A value of 7.0seems reasonable. for Cj , 0.6 might be an optimistic choice withthese phase follows from range eqn
W5/W4=.928
6. Loiter : start weight is W5 and end weight is W6
During loiter the lift-to-drag ratiowill be significantly better than during high speed cruise-out. Avalue of 9.0 for (L/D)ltr will be used. for Cj, indicates that 0.6

is o.k loiter is specified at 30min. the fuel fraction for thisphase follows from Brequest endurance equation
Eltr= (Vcr/Cj) (L/D) ln W5/W6
This yields W6/W5=0.967
7. Descend : start weight is W6 and end weight is W7
W7/W6 =.99
8. Dash out : start weight is W7 and end weight is W8
W8/W7=.951
9. Drop bombs : start weight is W8 and end weight is W9
W9/W8=1
10. Strafe : start weight is W9 and end weight is W10
W10/W9=0.986
11. Dash in : start weight is W10 and end weight is W11
W11/W10=.966
12. Climb to Cruise: start weight is W11 and end weight is W12
W12/W11=.969
13. Cruise in : start weight is W12 and end weight is W13
W13/W12=.956
14. Descend : start weight is W13 and end weight is W14
W14/W13=.99
15. Landing : start weight is W14 and end weight is W15
W15/W14=.995
Therefore the mission fuelfraction is given by
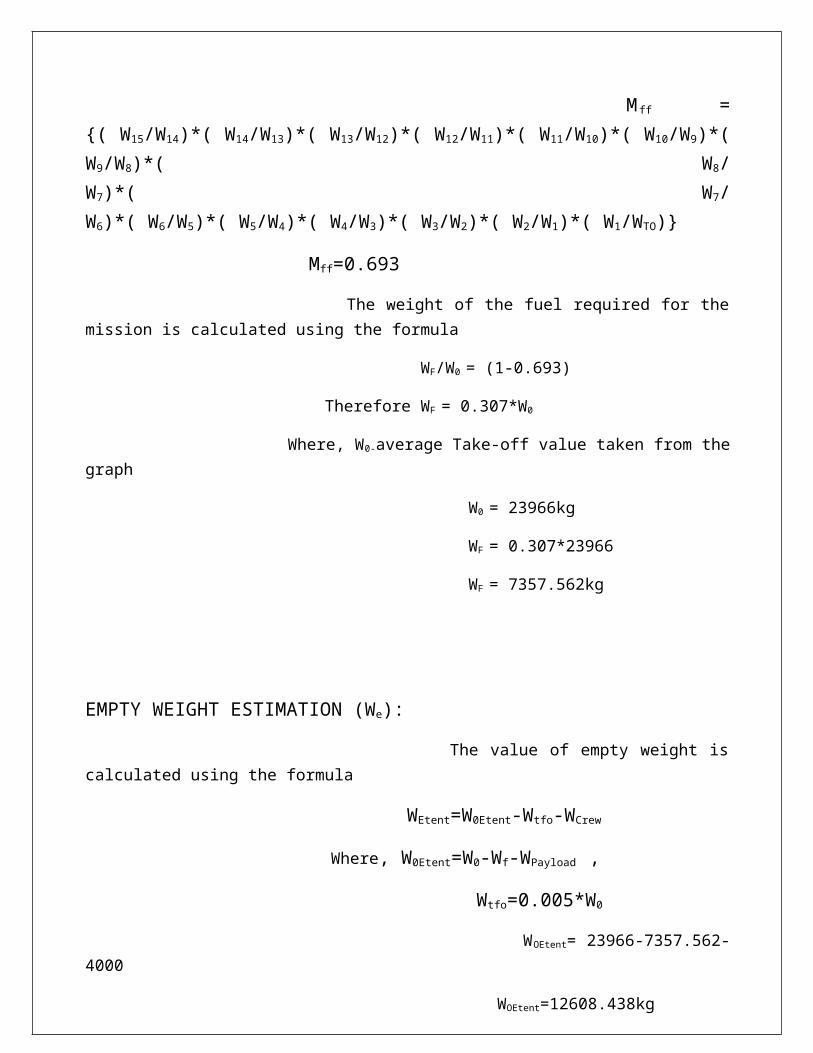
Mff ={( W15/W14)*( W14/W13)*( W13/W12)*( W12/W11)*( W11/W10)*( W10/W9)*(W9/W8)*( W8/W7)*( W7/W6)*( W6/W5)*( W5/W4)*( W4/W3)*( W3/W2)*( W2/W1)*( W1/WTO)}
Mff=0.693
The weight of the fuel required for themission is calculated using the formula
WF/W0 = (1-0.693)
Therefore WF = 0.307*W0
Where, W0-average Take-off value taken from thegraph
W0 = 23966kg
WF = 0.307*23966
WF = 7357.562kg
EMPTY WEIGHT ESTIMATION (We):
The value of empty weight iscalculated using the formula
WEtent=W0Etent-Wtfo-WCrew
Where, W0Etent=W0-Wf-WPayload ,
Wtfo=0.005*W0
WOEtent= 23966-7357.562-4000
WOEtent=12608.438kg

Therefore empty weight
W Etent=12608.438-(0.005*23966)-182
WEtent=12306.608kg
Where,
W OEtent -operatingempty weight tentative(kg),
WTfo -Trappedfuel-0il weight(kg)
We/W0=12306.608/23966
We/ W0 =0.513
W0 ¿ Wcrew+Wp
1−(WfW0 )−(We /W0)
W0 ¿182+4000
1−0.307−0.513
W0=23233.33kg
ITERATION PROCESS:
We/ W0=A(W0)CKVS
For fighter aircraft{A=2.34, C=-0.13, Kvs=1}
Iteration-1:
We/ W0 = 2.34*(23233.33)-0.13*1
= 0.633
Wo = 19441.71
Iteration-2:
We/ W0=2.34*(19441.71)-0.13*1
=0.648
Wo=18987.07
Iteration-3:
We/ W0=2.34*(18987.07)-0.13*1
=0.650
Wo=18929.75
Iteration-4:
We/ W0=2.34*(18929.75)-0.13*1
=0.650
Wo=18921.18
Iteration-5:
We/ W0=2.34*(18921.18)-0.13*1
=0.650
=18920.2
Iteration-6:
We/ W0=2.34*(18920.20)-0.13*1
=0.650
Wo=18920.07
OVERALL WEIGHT ESTIMATION:
Take off weight:
Wo =18920Kg
WEIGHT OF FUEL:
Wf = 0.307*18920
=5808.44Kg
Empty weight:
WEtent=W0Etent-Wtfo-WCrew
Where, W0Etent=W0-Wf-WPayload , Wtfo=0.005*W0
WOEtent =18920-5808.44-4000
WOEtent = 9111.56kg
Therefore empty weight
WEtent = 9111.56-(0.005*18920)-182
WEtent = 8834.96kg
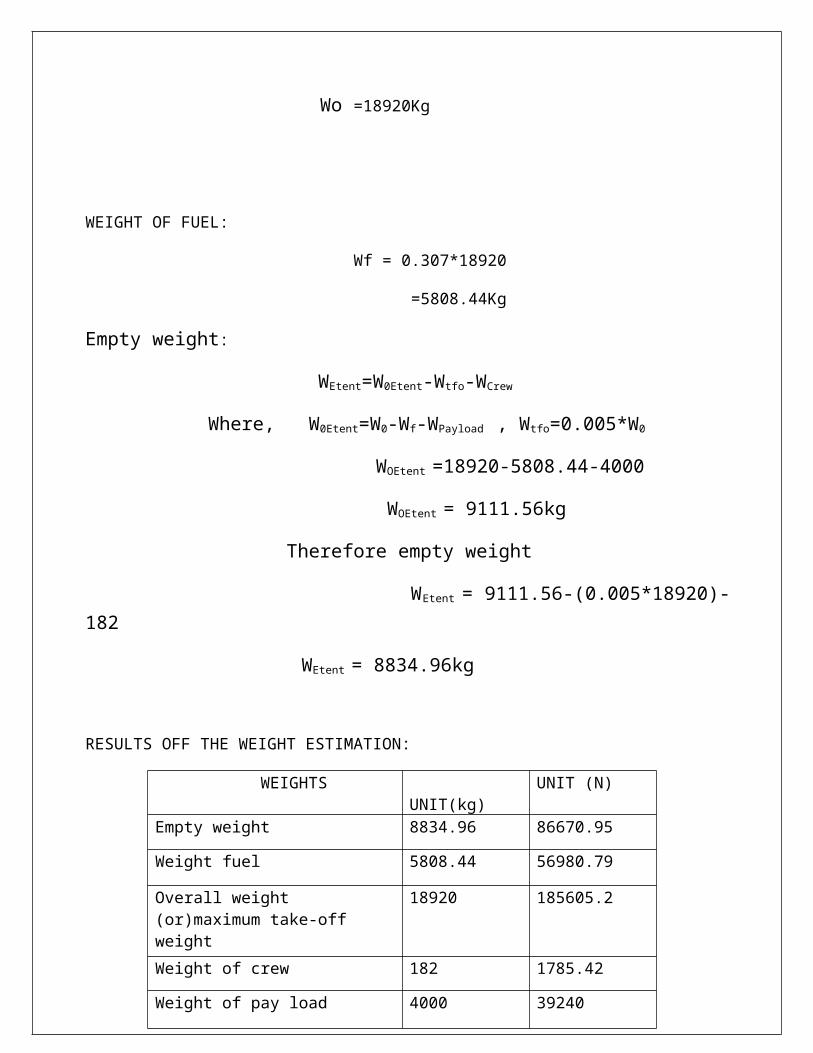
RESULTS OFF THE WEIGHT ESTIMATION:
WEIGHTS UNIT(kg)
UNIT (N)
Empty weight 8834.96 86670.95
Weight fuel 5808.44 56980.79
Overall weight (or)maximum take-off weight
18920 185605.2
Weight of crew 182 1785.42
Weight of pay load 4000 39240

ESTIMATION OF CRITICAL PERFORMANCE PARAMETER: 1. Airfoil selection
2. Wing selection
3. Powerplant selection
4. Wing tail and
5. Control surfaces (flap).
AIRFOIL SELECTION:
Airfoil nomenclature:
Chord length (c) – length from the leading edge to the trailing edge of a wing cross section that is parallel to the vertical axis of symmetry.
Mean camber line – line halfway between the upper and lower surfaces.
Leading edge (LE) – is the front most point on the mean camber line. trailing edge (TE) – Is the most rearward point on mean camber line.
Camber – maximum distance between the mean camber line and chord line, measured perpendicular to the chord line
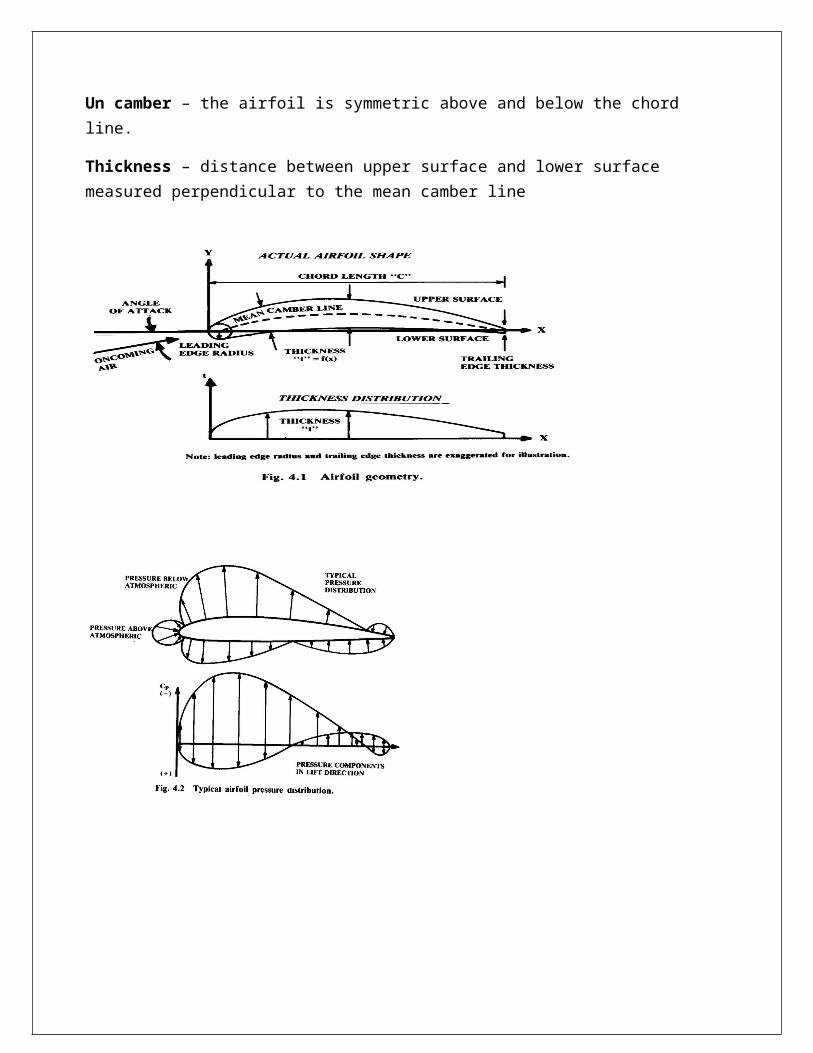
Un camber – the airfoil is symmetric above and below the chord line.
Thickness – distance between upper surface and lower surface measured perpendicular to the mean camber line

Family Advantages Disadvantages Applications
4-Digit 1. Good stall characteristics
2. Small center of pressure movement across large speed range
3. Roughness has little effect
1. Low maximum lift coefficient
2. Relatively high drag
3. High pitching moment
1. General aviation2. Horizontal tails
Symmetrical:
3. Supersonic jets4. Helicopter blades5. Shrouds6. Missile/rocket fins
5-Digit 1. Higher maximum lift coefficient
2. Low pitching moment
1. Poor stall behavior
2. Relatively high drag
1. General aviation2. Piston-powered bombers, transports3. Commuters4. Business jets
16-Series
1. Avoids low pressure peaks
2. Low drag at high speed
1. Relatively low lift 1. Aircraft propellers2. Ship propellers
6-Series 1. High maximum lift coefficient
2. Very low drag over a small range of operating conditions
3. Optimized for high speed
1. High drag outsideof the optimum rangeof operating conditions
2. High pitching moment
3. Poor stall behavior
1. Piston-powered fighters2. Business jets3. Jet trainers4. Supersonic jets
7-Series 1. Very low drag over a small range of operating conditions
2. Low pitching moment
1. Reduced maximumlift coefficient
2. High drag outsideof the optimum rangeof operating conditions
3. Poor stall behavior
Seldom used
8-Series Unknown Unknown Very seldom used

SELECTION PARAMETER:
Normally toselect an efficient aerofoil to produce maximum lift initially weconsider about some parameters like,
1. Co-efficient of lift
2. Stalling velocity
3. Reynolds number
4. t/c ratio
STALLING VELOCITY:
Stalling speed of fighter aircraft is given by
VA=1.2Vstall
Where, velocity approach for fighter aircraft is given by
VA=150 kts
Vstall = 150/1.2
Vstall=64.43m/s
COFFICIEND OF LIFTS:
L=(1/2)*(Vstall)2
*⍴*S*CLmax
Considering steady state level flight , L=W
1. calculation of aircraft maximum coefficient of lift(CLmax)
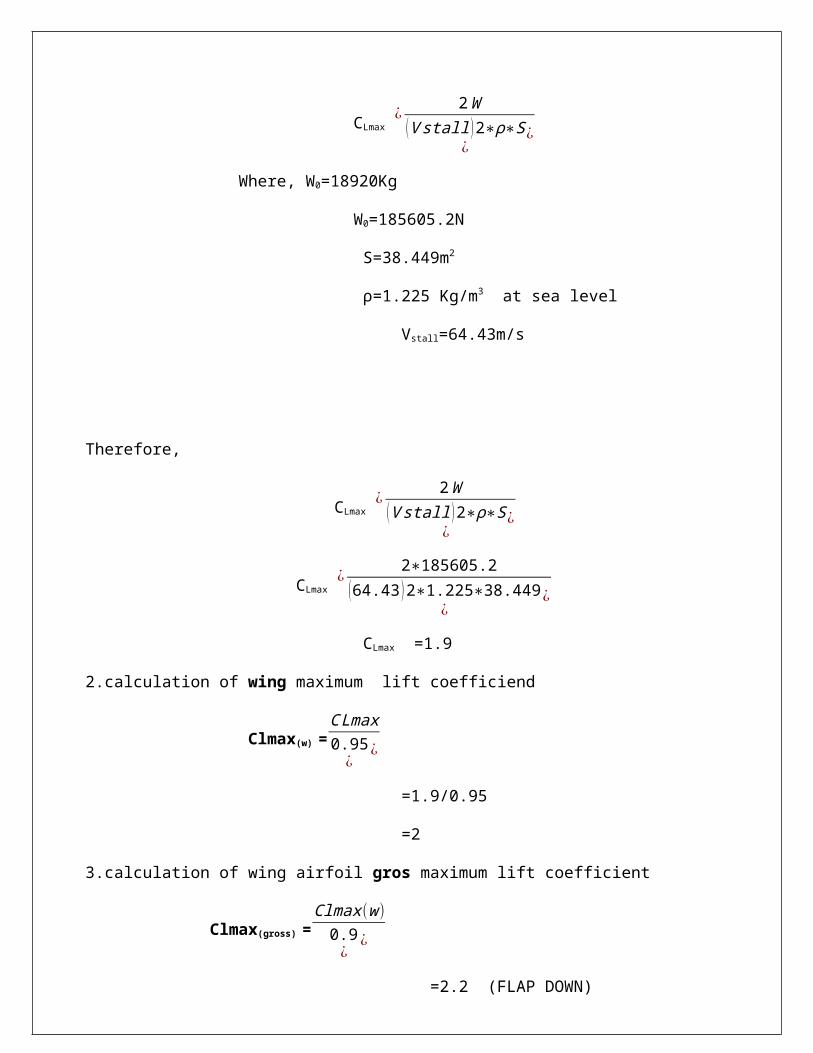
CLmax ¿2W
(Vstall )2∗⍴∗S¿
¿
Where, W0=18920Kg
W0=185605.2N
S=38.449m2
⍴=1.225 Kg/m3 at sea level
Vstall=64.43m/s
Therefore,
CLmax ¿2W
(Vstall )2∗⍴∗S¿
¿
CLmax ¿2∗185605.2
(64.43 )2∗1.225∗38.449¿
¿
CLmax =1.9
2.calculation of wing maximum lift coefficiend
Clmax(w) =CLmax0.95¿
¿
=1.9/0.95
=2
3.calculation of wing airfoil gros maximum lift coefficient
Clmax(gross) =Clmax(w)0.9¿
¿
=2.2 (FLAP DOWN)
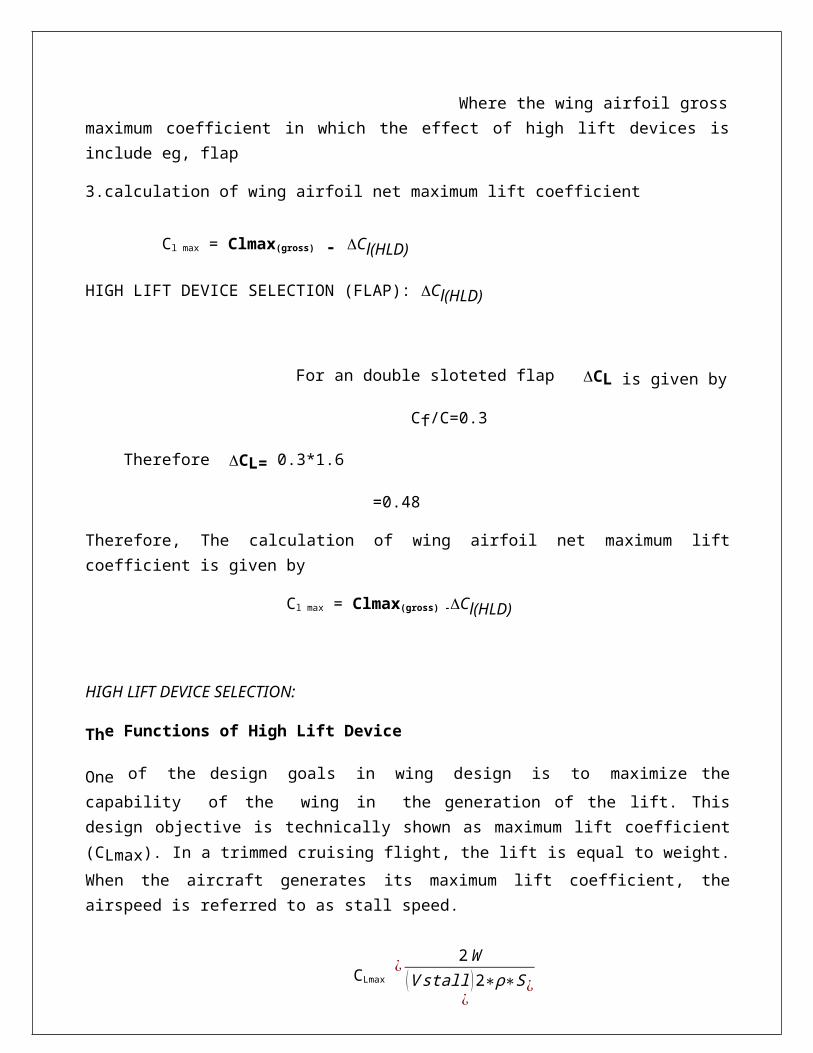
Where the wing airfoil grossmaximum coefficient in which the effect of high lift devices isinclude eg, flap
3.calculation of wing airfoil net maximum lift coefficient
Cl max = Clmax(gross) - Cl(HLD)
HIGH LIFT DEVICE SELECTION (FLAP): Cl(HLD)
For an double sloteted flap CL is given by
Cf/C=0.3
Therefore CL= 0.3*1.6
=0.48
Therefore, The calculation of wing airfoil net maximum liftcoefficient is given by
Cl max = Clmax(gross) -Cl(HLD)
HIGH LIFT DEVICE SELECTION:
The Functions of High Lift Device
One of the design goals in wing design is to maximize thecapability of the wing in the generation of the lift. Thisdesign objective is technically shown as maximum lift coefficient(CLmax). In a trimmed cruising flight, the lift is equal to weight.When the aircraft generates its maximum lift coefficient, theairspeed is referred to as stall speed.
CLmax ¿2W
(Vstall )2∗⍴∗S¿
¿
Two design objectives among the list of objectivesare: 1. maximizing the payload weight, 2. minimizing thestall speed (Vs). As the equation 5.36 indicates, increasing theCLmax tends to increase the payload weight (W) and decrease thestall speed. The lower stall speed is desirable since a safetake-off and landing requires a lower stall speed. On the otherhand, the higher payload weight will increase the efficiency ofthe aircraft and reduce the cost of flight. A higher CLmax allowsthe aircraft to have a smaller wing area that results in alighter wing. Hence, in a wing design, the designer must findway to maximize the CLmax. In order to increase the liftcoefficient, the only in-flight method is to temporarily vary(increase) the wing camber. This will happen only when the highlift device is deflected downward. In 1970’s the maximum liftcoefficient at take-off was 2.8; while the record currentlybelongs to Airbus A-320 with a magnitude of 3.2.
The primary applications of high lift devices are duringtake-off and landing operations. Since the airspeed is very lowcompared with the cruising speed, the wing must produce a biggerlift coefficient. The aircraft speed during take-off and landingis slightly greater than the stall speed. Airworthinessstandards specify the relationship between take-off speedand landing speed with stall speed. As a general rule, we have,
VTO=K.VS
where k is about 1.1 for fighter aircraft, and about 1.2 for jettransports and GA aircraft.
The application of the high lift device tends to change theairfoil section’s and wing’s camber (in fact the camber will bepositively increased). This in turn will change the pressuredistribution along the wing chord as sketched in figure 5.52.In this figure, CP denotes the pressure coefficient.
In contrast, the leading edge high lift device tends toimprove the boundary layer energy of the wing. Some type of highlift device has been used on almost every aircraft designed sincethe early 1930s. High lift devices are the means to obtain thesufficient increase in CLmax.
At the airfoil level, a high lift device deflection tends tocause the following six changes in the airfoil features:
1. Lift coefficient (Cl) is increased,2. Maximum lift coefficient (Clmax) is increased,

3. Zero-lift angle of attack (o) in changed,
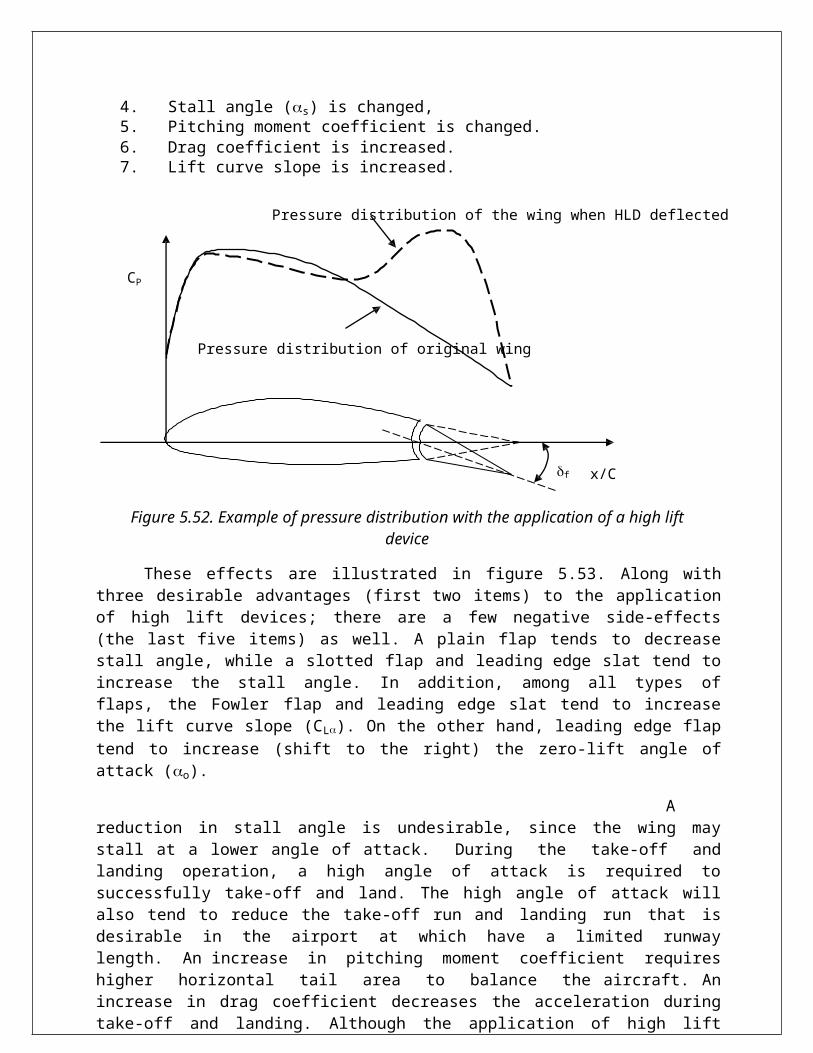
4. Stall angle (s) is changed,5. Pitching moment coefficient is changed.6. Drag coefficient is increased.7. Lift curve slope is increased.
Pressure distribution of the wing when HLD deflected
CP
Pressure distribution of original wing
f x/C
Figure 5.52. Example of pressure distribution with the application of a high liftdevice
These effects are illustrated in figure 5.53. Along withthree desirable advantages (first two items) to the applicationof high lift devices; there are a few negative side-effects(the last five items) as well. A plain flap tends to decreasestall angle, while a slotted flap and leading edge slat tend toincrease the stall angle. In addition, among all types offlaps, the Fowler flap and leading edge slat tend to increasethe lift curve slope (CL). On the other hand, leading edge flaptend to increase (shift to the right) the zero-lift angle ofattack (o).
Areduction in stall angle is undesirable, since the wing maystall at a lower angle of attack. During the take-off andlanding operation, a high angle of attack is required tosuccessfully take-off and land. The high angle of attack willalso tend to reduce the take-off run and landing run that isdesirable in the airport at which have a limited runwaylength. An increase in pitching moment coefficient requireshigher horizontal tail area to balance the aircraft. Anincrease in drag coefficient decreases the acceleration duringtake-off and landing. Although the application of high lift

device generates three undesirable side effects, but theadvantages outweigh the disadvantages.
If the natural value of CLmax for an aircraft is not high enoughfor safe take-off and landing, it can be temporarily increased bymechanical high lift devices. Thus, employing the same airfoilsection; one is able to increase CLmax temporarily as neededwithout actually pitching the aircraft. Two flight operations atwhich the CLmax needs to be increased are take-off and landing.Table5.14 shows the maximum lift coefficient for severalaircraft at take-off and landingconfigurations.
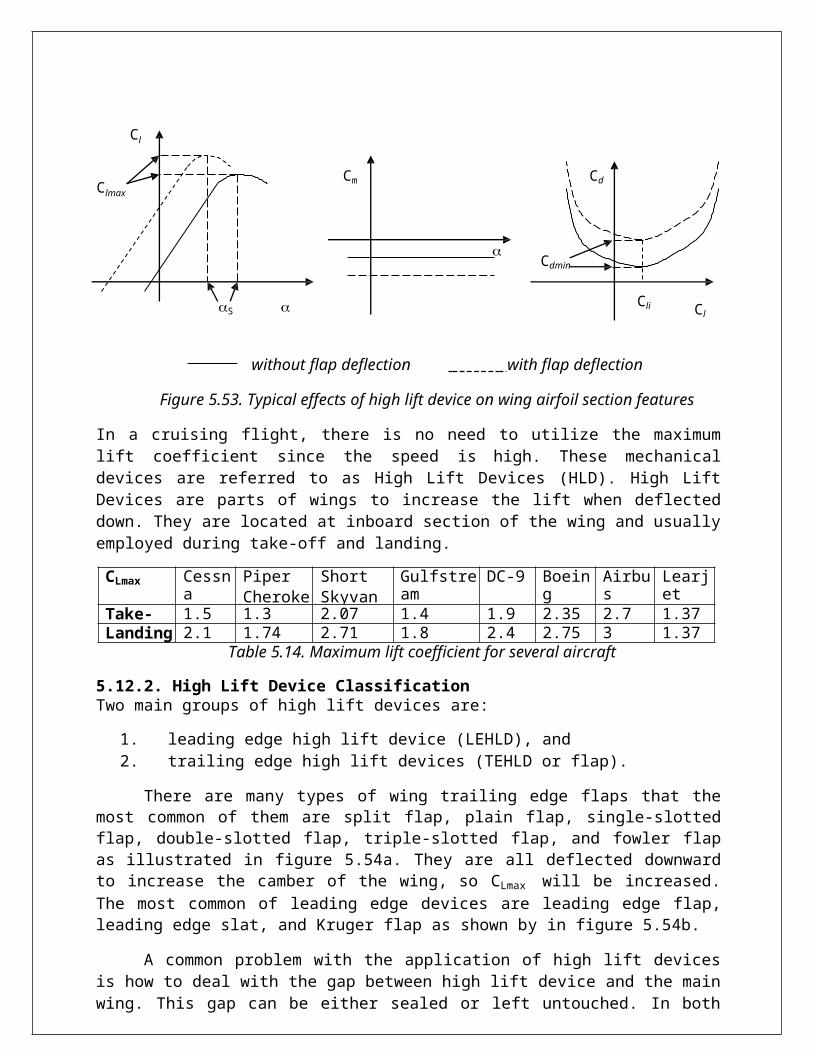
Cl
Cm CdClmax
S
Cdmin
Cli Cl
without flap deflection with flap deflection
Figure 5.53. Typical effects of high lift device on wing airfoil section features
In a cruising flight, there is no need to utilize the maximumlift coefficient since the speed is high. These mechanicaldevices are referred to as High Lift Devices (HLD). High LiftDevices are parts of wings to increase the lift when deflecteddown. They are located at inboard section of the wing and usuallyemployed during take-off and landing.
CLmax Cessna172
PiperCheroke
ShortSkyvan
GulfstreamII
DC-9 Boeing727
Airbus300
Learjet25Take-
Off1.5 1.3 2.07 1.4 1.9 2.35 2.7 1.37
Landing 2.1 1.74 2.71 1.8 2.4 2.75 3 1.37Table 5.14. Maximum lift coefficient for several aircraft
5.12.2. High Lift Device ClassificationTwo main groups of high lift devices are:
1. leading edge high lift device (LEHLD), and2. trailing edge high lift devices (TEHLD or flap).
There are many types of wing trailing edge flaps that themost common of them are split flap, plain flap, single-slottedflap, double-slotted flap, triple-slotted flap, and fowler flapas illustrated in figure 5.54a. They are all deflected downwardto increase the camber of the wing, so CLmax will be increased.The most common of leading edge devices are leading edge flap,leading edge slat, and Kruger flap as shown by in figure 5.54b.
A common problem with the application of high lift devicesis how to deal with the gap between high lift device and the mainwing. This gap can be either sealed or left untouched. In both

cases, there are undesirable side effects. If the gap left open,the airflow from downside escapes to the upper surface which inturn degrades the pressure distribution. On the other hand, ifthe gap is sealed by a means such diaphragm, it may be blocked byice during flight into colder humid air. In both cases, it needsspecial attention as an operational problem. In the following,the technical features of various high lift devices arediscussed.
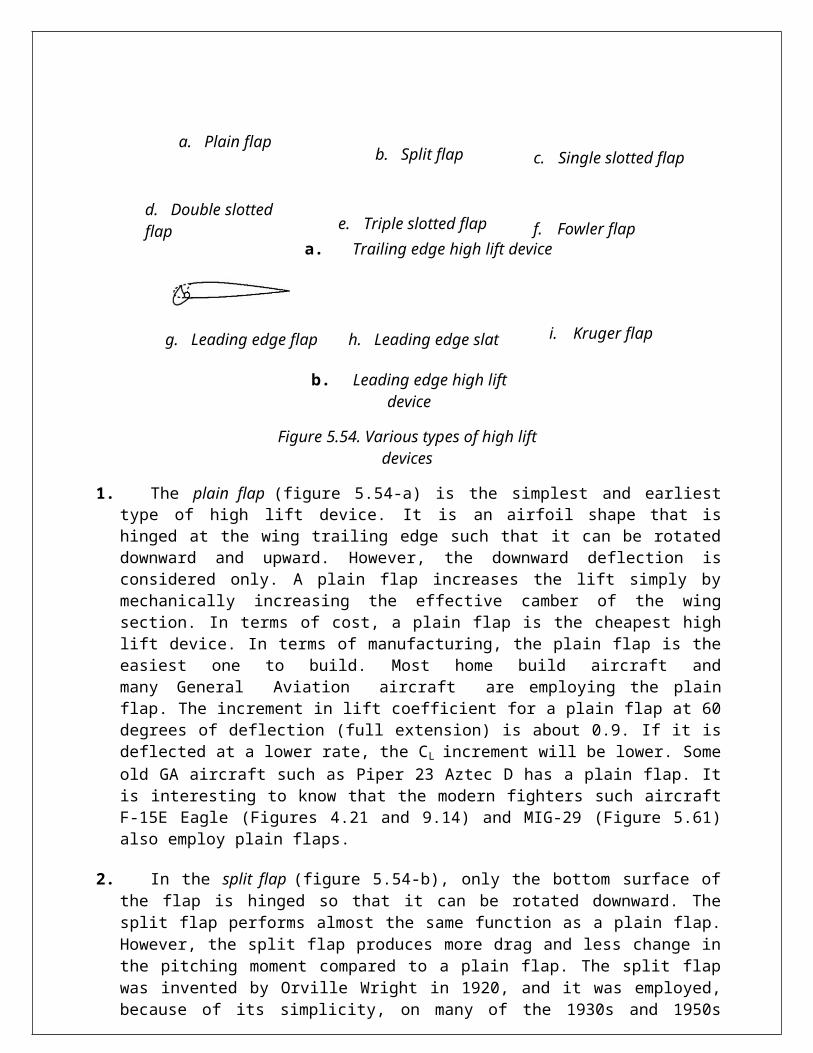
a. Plain flapb. Split flap c. Single slotted flap
d. Double slotted flap e. Triple slotted flap f. Fowler flap
a. Trailing edge high lift device
g. Leading edge flap h. Leading edge slat i. Kruger flap
b. Leading edge high liftdevice
Figure 5.54. Various types of high liftdevices
1. The plain flap (figure 5.54-a) is the simplest and earliesttype of high lift device. It is an airfoil shape that ishinged at the wing trailing edge such that it can be rotateddownward and upward. However, the downward deflection isconsidered only. A plain flap increases the lift simply bymechanically increasing the effective camber of the wingsection. In terms of cost, a plain flap is the cheapest highlift device. In terms of manufacturing, the plain flap is theeasiest one to build. Most home build aircraft andmany General Aviation aircraft are employing the plainflap. The increment in lift coefficient for a plain flap at 60degrees of deflection (full extension) is about 0.9. If it isdeflected at a lower rate, the CL increment will be lower. Someold GA aircraft such as Piper 23 Aztec D has a plain flap. Itis interesting to know that the modern fighters such aircraftF-15E Eagle (Figures 4.21 and 9.14) and MIG-29 (Figure 5.61)also employ plain flaps.
2. In the split flap (figure 5.54-b), only the bottom surface ofthe flap is hinged so that it can be rotated downward. Thesplit flap performs almost the same function as a plain flap.However, the split flap produces more drag and less change inthe pitching moment compared to a plain flap. The split flapwas invented by Orville Wright in 1920, and it was employed,because of its simplicity, on many of the 1930s and 1950s

aircraft. However, because of the higher drag associated withsplit flap, they are rarely used on modern aircraft.
3. The single slotted flap (figure 5.54-c) is very similar to aplain flap, except it has two modifications. First, theleading edges of these two trailing edge flaps are differentas shown in figure 5.51. The leading edge of a single slottedflap is carefully designed such that it modifies andstabilizes the boundary layer over the top surface of thewing. A low pressure is created on the leading edge thatallows a new boundary layer to form over the flap which inturn causes the flow to remain attached to very high flapdeflection. The second modification is to allow the flap moverearward during the deflection (i.e. the slot). The aftmovement of single slotted flap actually increases theeffective chord of the wing which in turn increases theeffective wing planform area. The larger wing planform areanaturally generated more lift.
Thus a single slotted flap generates considerably higherlift than a plain and split flap. The main disadvantage isthe higher cost and the higher degree of complexity in themanufacturing process associated with the single slottedflap. Single slotted flap are in common use on modern light,general aviation aircraft. In general, the stall angle isincreased by the application of the slotted flap. Severalmodern GA light aircraft such as Beech Bonanza F33A andseveral turboprop transport aircraft such as Beech 1900D andSaab 2000 has deployed single slotted flap.
4. The double slotted flap is similar to a single slotted flap,except it has two slots; i.e., the flap is divided into twosegments, each with a slot as sketched in figure 5.54-d. Aflap with two slots almost doubles the advantages of a singleslotted flap. This benefit is achieved at the cost ofincreased mechanical complexity and higher cost. Most modernturboprop transport aircraft such as ATR-42 (Figure 3.8); andseveral jet aircraft such as and jet trainer Kawasaki T-4employ the double slotted flap. The jet transport aircraftBoeing 767 (Figure 5.4) has single slotted outboard flap anddouble slotted inboard flap. It is a common practice todeflect the first segment (slot) of the flap during a take-offoperation, but employs full deflection (both segments) duringlanding. The reason is that more lift coefficient is neededduring a landing that a take-off.
5. A triple slotted flap (figure 5.54-e) is an extension to a double slotted flap; i.e. has three slots.
This flap is mechanically the most complex; and costly mostexpensive flap in design and operation. However, a tripleslotted flap produces the highest increment in liftcoefficient. It is mainly used in heavy weight transportaircraft which have high wing loading. The jet transportaircraft Boeing 747 (Figures 3.7, 3.12, 9.4) has employed thetriple slotted flap.
6. A Fowler flap (figure 5.54-f) has a special mechanism suchthat when deployed, not only deflects downward, but alsotranslates or tracks to the trailing edge of the wing. Thesecond feature increases the exposed wing area; which means afurther increase in lift. Because of this benefit, theconcept of the Fowler flap may be combined with the double
slotted and triple slotted flaps. For instance jet transportaircraft Boeing B-747 (Figures 3.7, 3.12, 9.4) has utilizedtriple slotted Fowler flap. In general, the wing liftcurve slope is slightly increased by the application of theFowler flap. Maritime patrol aircraft Lockheed Orion P-3 with4 turboprop engines has a Fowler engine.
7. A leading edge flap (or droop) is illustrated in figure 5.54-g.This flap is similar to trailing edge plain flap, except it isinstalled at the leading edge of the wing. Hence, the leadingedge pivots downward, increasing the effective camber. Afeature of the leading edge flap is that the gap between theflap and main wing body is sealed with no slot. In general,the wing zero-lift angle of attack is shifted to the right bythe application of leading edge flap. Since the leading edgeflap has a lower chord compared with the trailing edge flaps,it generates a lower increment in lift coefficient (CL isabout 0.3).
8. The leading edge slat (see figure 5.54-h) is a small, highlycambered section, located slightly forward of the leading edgethe wing body. When deflected, a slat is basically a flap atthe leading edge, but with an unsealed gap between the flapand the leading edge. In addition to the primary airflow overthe wing, there is a secondary flow that takes place throughthe gap
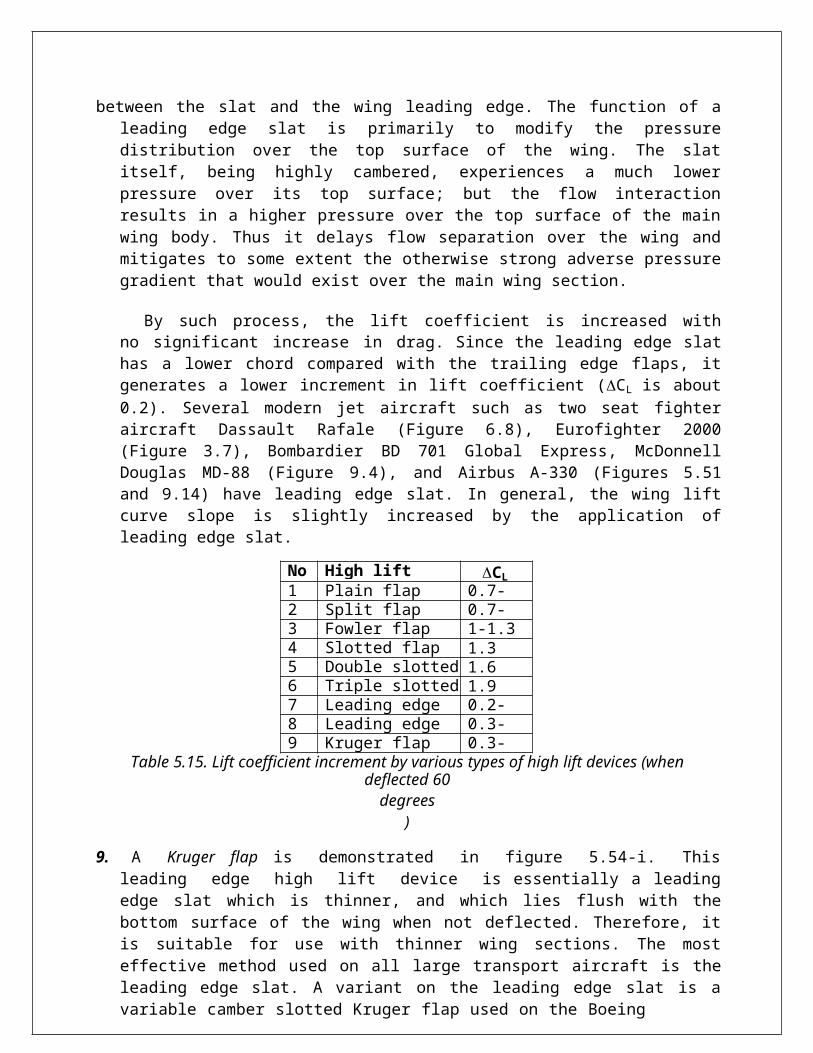
between the slat and the wing leading edge. The function of aleading edge slat is primarily to modify the pressuredistribution over the top surface of the wing. The slatitself, being highly cambered, experiences a much lowerpressure over its top surface; but the flow interactionresults in a higher pressure over the top surface of the mainwing body. Thus it delays flow separation over the wing andmitigates to some extent the otherwise strong adverse pressuregradient that would exist over the main wing section.
By such process, the lift coefficient is increased withno significant increase in drag. Since the leading edge slathas a lower chord compared with the trailing edge flaps, itgenerates a lower increment in lift coefficient (CL is about0.2). Several modern jet aircraft such as two seat fighteraircraft Dassault Rafale (Figure 6.8), Eurofighter 2000(Figure 3.7), Bombardier BD 701 Global Express, McDonnellDouglas MD-88 (Figure 9.4), and Airbus A-330 (Figures 5.51and 9.14) have leading edge slat. In general, the wing liftcurve slope is slightly increased by the application ofleading edge slat.
No High lift device
CL1 Plain flap 0.7-
0.92 Split flap 0.7-0.93 Fowler flap 1-1.3
4 Slotted flap 1.3 Cf/C5 Double slotted
flap1.6 Cf/C6 Triple slotted
flap1.9 Cf/C7 Leading edge
flap0.2-0.38 Leading edge
slat0.3-0.49 Kruger flap 0.3-0.4Table 5.15. Lift coefficient increment by various types of high lift devices (when
deflected 60degrees
)
9. A Kruger flap is demonstrated in figure 5.54-i. Thisleading edge high lift device is essentially a leadingedge slat which is thinner, and which lies flush with thebottom surface of the wing when not deflected. Therefore, itis suitable for use with thinner wing sections. The mosteffective method used on all large transport aircraft is theleading edge slat. A variant on the leading edge slat is avariable camber slotted Kruger flap used on the Boeing

747 (Figures 3.7, 3.12, and 9.4). Aerodynamically, this is a slat, but mechanically it is aKruger flap.
As a general comparison, table 5.15 shows the typical valuesof maximum wing lift coefficient for various types of high liftdevices. In this table, the symbol Cf/C denotes the ratio betweenthe chord of high lift device to the chord of the main wing bodyas shown in figure 5.55. Table 5.16 demonstrates various featuresfor high lift devices of several aircraft.
5.12.3. Design TechniqueIn designing the high lift device for a wing, the following items must be determined:
1. High lift device location along the span2. The type of high lift device (among the list in figure 5.54)3. High lift device chord (Cf)

Cf
bf/2
b/2
4. High lift device span (bf)5. High lift device maximum deflection (down) (fmax)
The last three parameters are sketched in figure 5.55. Thefirst and second item must be selected through an evaluation andanalysis technique considering all advantages and disadvantagesof each option regarding design requirements. However, the lastthree parameters must be determined through a series ofcalculations. In the following, the design technique for highlift device to determine the above five items will be presented.
Fuselage
CenterLine C
a. Top-view of the rightwing
Leading edge Chord
line
Trailing edge
fmaxCf
C
b. The side-view of the inboard wing (flap deflected)
Figure 5.55. High lift device parameters
a. HLD Location
The best location for high lift device is the inboardportion of both left and right of the wing sections. When highlift device is applied symmetrically on the left and right wingsections, it will prevent any rolling moment; hence the aircraftwill remain laterally trimmed. The deflection of high lift device

will increase the lift on both inboard sections, but since theyare generated symmetrically, both lift increments will canceleach other’s rolling moments.
There are two reasons for the selection of inboard section.First of all, it produces a lower bending moment on the wingroot. This makes the wing structure lighter and causes lessfatigue on the wing in the long run. The second reason is that itallows the aileron to have a large arm, which is employed on theoutboard wing trailing edge. The larger arm for the aileron,when
installed on the outboard panels, means the higher lateral control and a faster roll. The design of the aileron will be discussed in chapter 12.
b. Type of High Lift Device
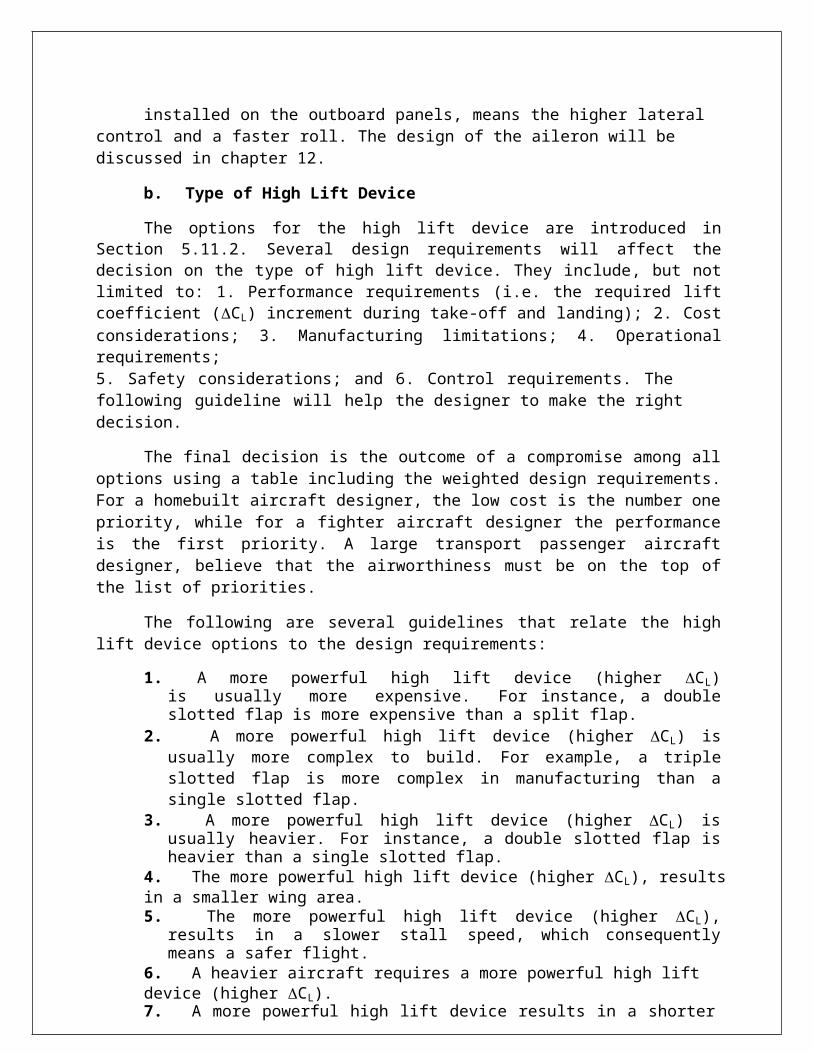
The options for the high lift device are introduced inSection 5.11.2. Several design requirements will affect thedecision on the type of high lift device. They include, but notlimited to: 1. Performance requirements (i.e. the required liftcoefficient (CL) increment during take-off and landing); 2. Costconsiderations; 3. Manufacturing limitations; 4. Operationalrequirements;5. Safety considerations; and 6. Control requirements. The following guideline will help the designer to make the right decision.
The final decision is the outcome of a compromise among alloptions using a table including the weighted design requirements.For a homebuilt aircraft designer, the low cost is the number onepriority, while for a fighter aircraft designer the performanceis the first priority. A large transport passenger aircraftdesigner, believe that the airworthiness must be on the top ofthe list of priorities.
The following are several guidelines that relate the highlift device options to the design requirements:
1. A more powerful high lift device (higher CL)is usually more expensive. For instance, a doubleslotted flap is more expensive than a split flap.
2. A more powerful high lift device (higher CL) isusually more complex to build. For example, a tripleslotted flap is more complex in manufacturing than asingle slotted flap.
3. A more powerful high lift device (higher CL) isusually heavier. For instance, a double slotted flap isheavier than a single slotted flap.
4. The more powerful high lift device (higher CL), resultsin a smaller wing area.5. The more powerful high lift device (higher CL),
results in a slower stall speed, which consequentlymeans a safer flight.
6. A heavier aircraft requires a more powerful high lift device (higher CL).7. A more powerful high lift device results in a shorter
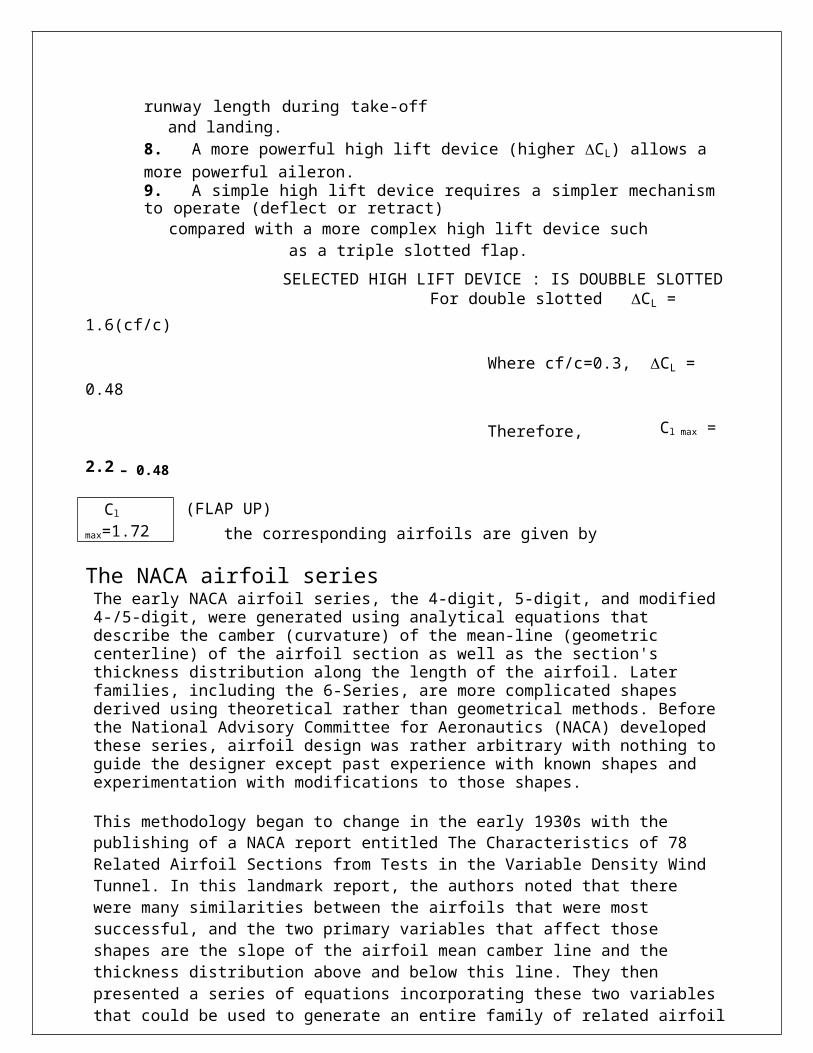
runway length during take-offand landing.
8. A more powerful high lift device (higher CL) allows a more powerful aileron.9. A simple high lift device requires a simpler mechanism to operate (deflect or retract)
compared with a more complex high lift device suchas a triple slotted flap.
SELECTED HIGH LIFT DEVICE : IS DOUBBLE SLOTTED For double slotted CL = 1.6(cf/c)
Where cf/c=0.3, CL = 0.48
Therefore, Cl max =
2.2 – 0.48
(FLAP UP) the corresponding airfoils are given by
The NACA airfoil seriesThe early NACA airfoil series, the 4-digit, 5-digit, and modified4-/5-digit, were generated using analytical equations that describe the camber (curvature) of the mean-line (geometric centerline) of the airfoil section as well as the section's thickness distribution along the length of the airfoil. Later families, including the 6-Series, are more complicated shapes derived using theoretical rather than geometrical methods. Beforethe National Advisory Committee for Aeronautics (NACA) developed these series, airfoil design was rather arbitrary with nothing toguide the designer except past experience with known shapes and experimentation with modifications to those shapes.
This methodology began to change in the early 1930s with the publishing of a NACA report entitled The Characteristics of 78 Related Airfoil Sections from Tests in the Variable Density Wind Tunnel. In this landmark report, the authors noted that there were many similarities between the airfoils that were most successful, and the two primary variables that affect those shapes are the slope of the airfoil mean camber line and the thickness distribution above and below this line. They thenpresented a series of equations incorporating these two variables that could be used to generate an entire family of related airfoil
Cl
max=1.72
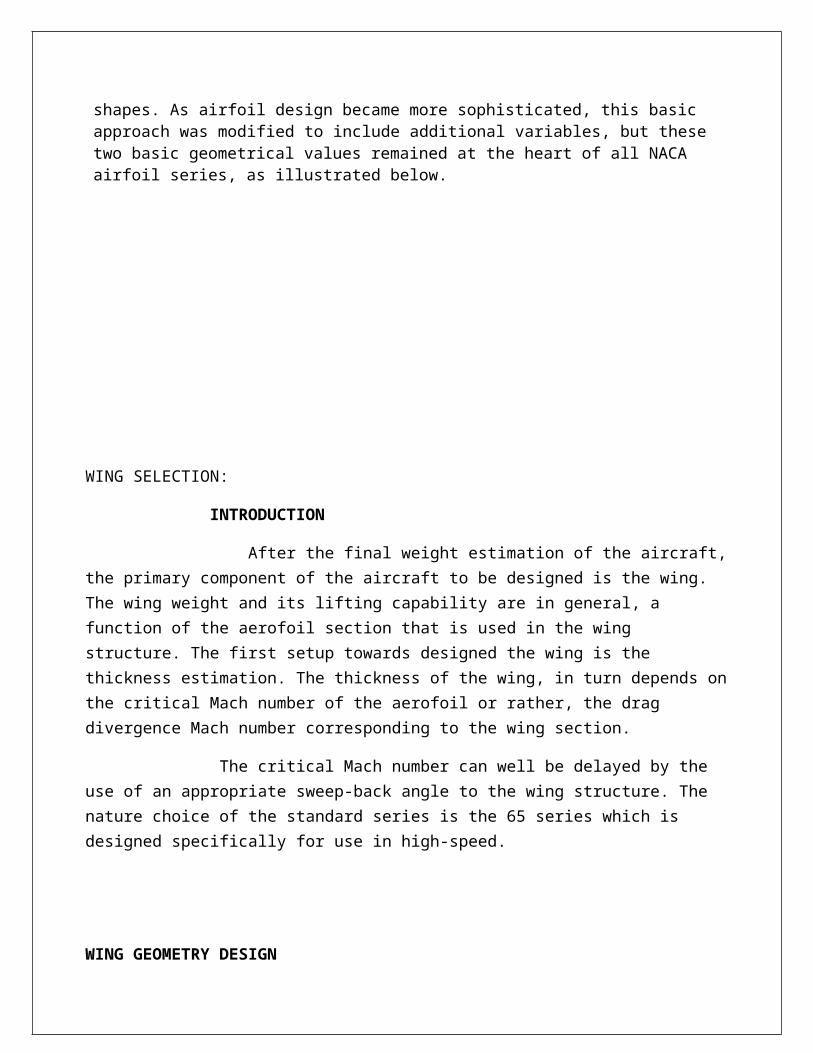
shapes. As airfoil design became more sophisticated, this basic approach was modified to include additional variables, but these two basic geometrical values remained at the heart of all NACA airfoil series, as illustrated below.
WING SELECTION:
INTRODUCTION
After the final weight estimation of the aircraft,the primary component of the aircraft to be designed is the wing. The wing weight and its lifting capability are in general, a function of the aerofoil section that is used in the wing structure. The first setup towards designed the wing is the thickness estimation. The thickness of the wing, in turn depends onthe critical Mach number of the aerofoil or rather, the drag divergence Mach number corresponding to the wing section.
The critical Mach number can well be delayed by the use of an appropriate sweep-back angle to the wing structure. The nature choice of the standard series is the 65 series which is designed specifically for use in high-speed.
WING GEOMETRY DESIGN

The geometry of the wing is a function for four parameter, namely the Wing loading (w/s), Aspect ratio (b2/s), Taper ratio (ʎ) and the sweepback angle at quarter chord (Ʌqc)
The take-off weight that was estimated in the previous analysis is used to find the wing area S (from W/S). The valueof S also enables to calculate the wingspan b (using the Aspect ratio). The root chord can now be found using the equation.
POSITION OF WING
The location of the wing in the fuselage (along thevertical axis) is very important. Each configuration (Low, High andmid) has its own advantages but in this design, the mid wing
Mid WingIn general, features of the mid-wing configuration (Figure5.3-b, and Figure 5.4-4) standsomewhat between features of high-wing configuration and featuresof low-wing configuration. The major difference lies in thenecessity to cut the wing spar in two half in order to save thespace inside the fuselage. However, another alternative is not tocut the wing spar and letting it to pass through the fuselage;which leads to an occupied space of the fuselage. Bothalternatives carry a few disadvantages. Other than those featuresthat can be easily derived from two previous sections, some newfeatures of a mid-wing configuration are as follows:
1. The aircraft structure is heavier, due to the necessityof reinforcing wing root at the intersection with the fuselage.
2. The mid wing is more expensive compared with high and low-wing configurations.3. The mid wing is more attractive compared with two other configurations.4. The mid wing is aerodynamically streamliner compared with two other configurations.5. The strut is usually not used to reinforce the wing structure.

6. The pilot can get into the cockpit using the wing as a stepin a small GA aircraft.7. The mid-wing has less interference drag than low-wing and high-wing.
. The Significance of Lift and LoadDistributionsThe distribution of wing non-dimensional lift (i.e. liftcoefficient; CL) per unit span along thewing is referred to as lift distribution. Each unit area of the wingalong the span is producing a specific amount of lift. The totallift is equal to the summation of these individual lifts. Thelift distribution goes to zero at the tips, because there is apressure equalization from the bottom to the top of the wingprecisely at y = -b/2 and +b/2. Hence no lift is generated atthese two points. In addition, the variation of “liftcoefficient times sectional chord (C.CL)” along span is referredto as the “load distribution”. Both lift distribution and loaddistribution are of great importance in the wing designprocess. The major application of lift distribution isin aerodynamiccalculation, while the primary application of the loaddistribution is in wing structural design as well ascontrollability analysis.
In the past (1930s), it was thought that for an elliptic liftdistribution, the chord must vary elliptically along the span.The direct result of such logic was that the wing planform mustbe elliptical. For this reason, several aircraft wing planformssuch as Supermarine Spitfire (Figure8.3), a famous British World War II fighter were made elliptic.But, today, we know that there are various parameters that makethe lift distribution elliptic, thus, there is no need for thewing planform to be planform.
The type of both lift distribution and load distributionare very important in wing design; and will influence the

aircraft performance, airworthiness, stability, control, andcost. Ideally both lift distribution and load distribution arepreferred to be elliptical. For the above mentioned reasons, theelliptical lift distribution and the elliptical load distributionare ideal and are the design objectives in the wing designprocess. An elliptical lift distribution is sketched in figure5.32, where a front view of the wing is illustrated. Thehorizontal axis in figure 5.32 is y/s where y is the location isy-axis, and s denotes the semispan (s = b/2). In this figure, nohigh lift device
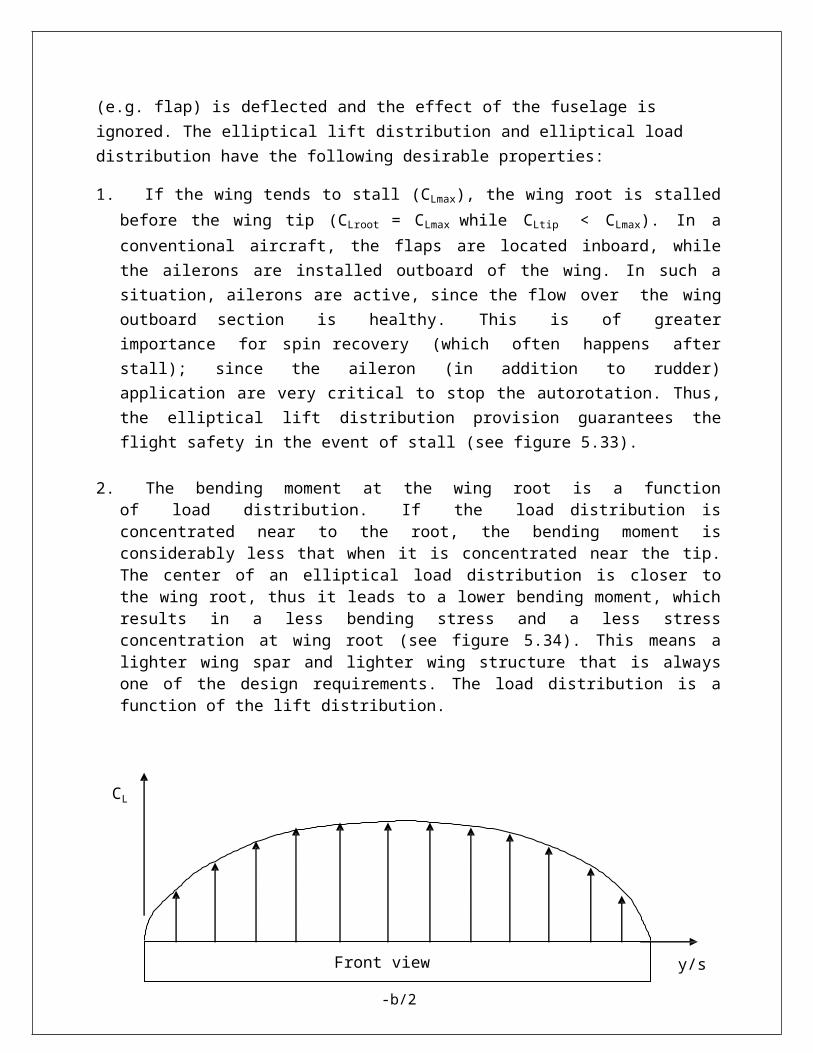
(e.g. flap) is deflected and the effect of the fuselage is ignored. The elliptical lift distribution and elliptical load distribution have the following desirable properties:
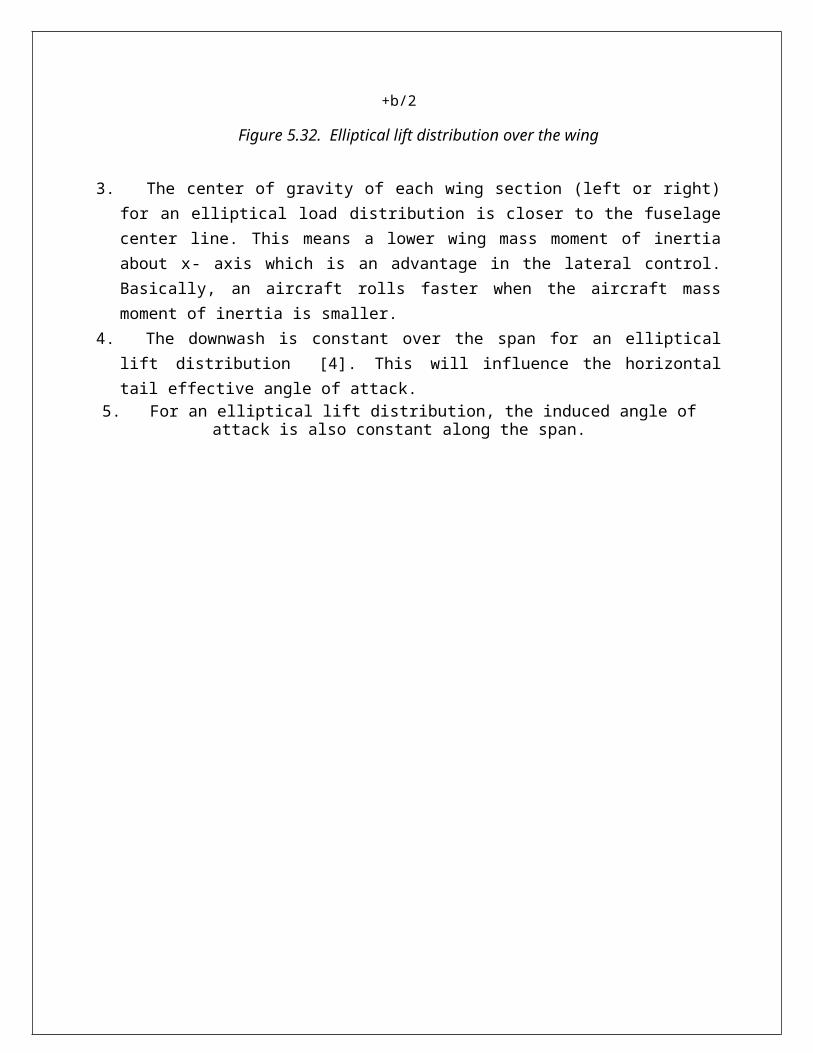
1. If the wing tends to stall (CLmax), the wing root is stalledbefore the wing tip (CLroot = CLmax while CLtip < CLmax). In aconventional aircraft, the flaps are located inboard, whilethe ailerons are installed outboard of the wing. In such asituation, ailerons are active, since the flow over the wingoutboard section is healthy. This is of greaterimportance for spin recovery (which often happens afterstall); since the aileron (in addition to rudder)application are very critical to stop the autorotation. Thus,the elliptical lift distribution provision guarantees theflight safety in the event of stall (see figure 5.33).
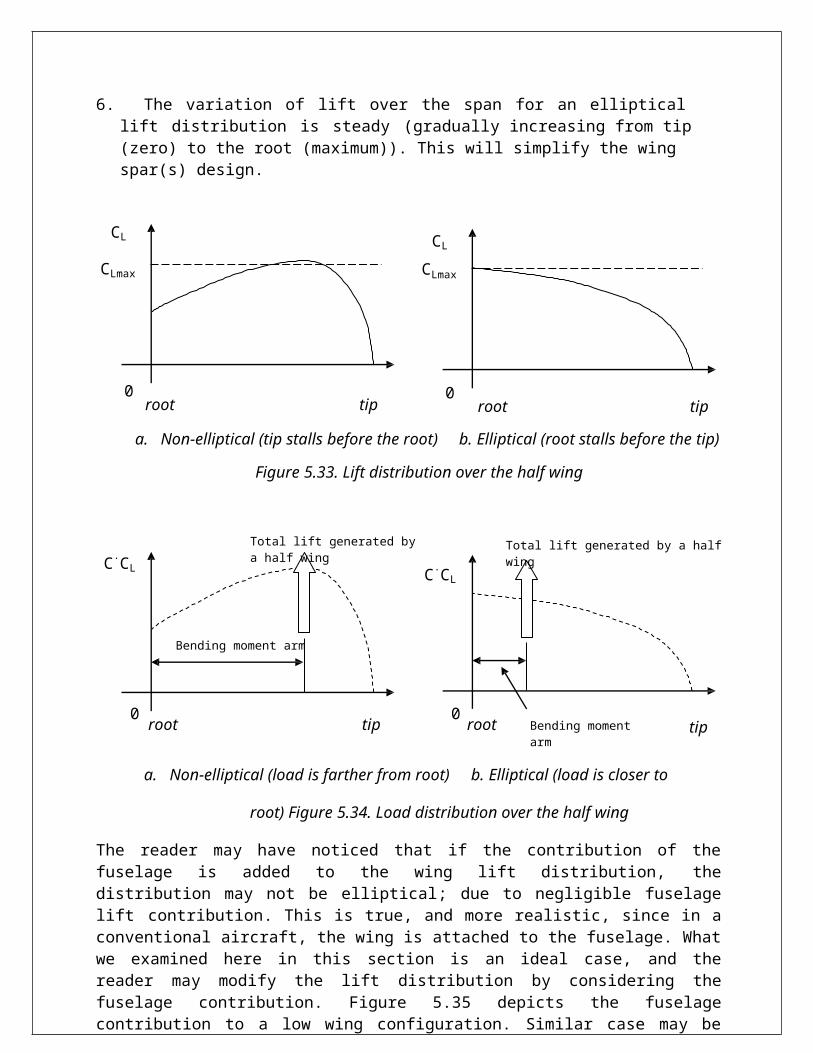
2. The bending moment at the wing root is a functionof load distribution. If the load distribution isconcentrated near to the root, the bending moment isconsiderably less that when it is concentrated near the tip.The center of an elliptical load distribution is closer tothe wing root, thus it leads to a lower bending moment, whichresults in a less bending stress and a less stressconcentration at wing root (see figure 5.34). This means alighter wing spar and lighter wing structure that is alwaysone of the design requirements. The load distribution is afunction of the lift distribution.
CL
Front view y/s
-b/2
+b/2
Figure 5.32. Elliptical lift distribution over the wing
3. The center of gravity of each wing section (left or right)for an elliptical load distribution is closer to the fuselagecenter line. This means a lower wing mass moment of inertiaabout x- axis which is an advantage in the lateral control.Basically, an aircraft rolls faster when the aircraft massmoment of inertia is smaller.
4. The downwash is constant over the span for an ellipticallift distribution [4]. This will influence the horizontaltail effective angle of attack.
5. For an elliptical lift distribution, the induced angle ofattack is also constant along the span.
6. The variation of lift over the span for an elliptical lift distribution is steady (gradually increasing from tip (zero) to the root (maximum)). This will simplify the wing spar(s) design.
CL
CLmaxCL
CLmax
0root tip 0
root tip
a. Non-elliptical (tip stalls before the root) b. Elliptical (root stalls before the tip)
Figure 5.33. Lift distribution over the half wing
C.CLTotal lift generated bya half wing
C.CL
Total lift generated by a half wing
Bending moment arm
0 0root tip root Bending momentarm
tip
a. Non-elliptical (load is farther from root) b. Elliptical (load is closer to
root) Figure 5.34. Load distribution over the half wing
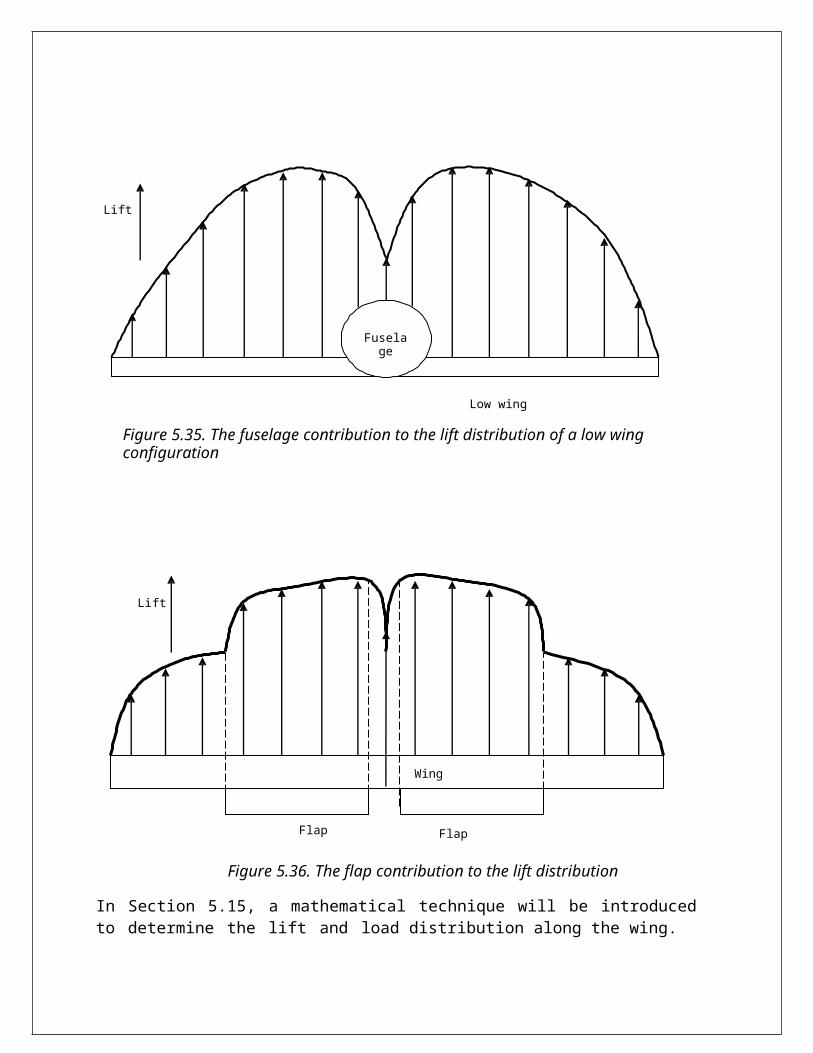
The reader may have noticed that if the contribution of thefuselage is added to the wing lift distribution, thedistribution may not be elliptical; due to negligible fuselagelift contribution. This is true, and more realistic, since in aconventional aircraft, the wing is attached to the fuselage. Whatwe examined here in this section is an ideal case, and thereader may modify the lift distribution by considering thefuselage contribution. Figure 5.35 depicts the fuselagecontribution to a low wing configuration. Similar case may be

made for the effect of flap of lift distribution when deflected.Figure 5.36 illustrates the flap contribution to the wing liftdistribution. In principle, the goal in the wing design is toobtain an elliptical wing distribution without considering thecontributions of fuselage, flap, or other components.
Lift
Fuselage
Low wing
Figure 5.35. The fuselage contribution to the lift distribution of a low wing configuration
Lift
Wing
Flap Flap
Figure 5.36. The flap contribution to the lift distribution
In Section 5.15, a mathematical technique will be introduced to determine the lift and load distribution along the wing.
SELECTED WING: SWEEP-BACK WING: SweepAngleConsider the top view of an aircraft. The angle between aconstant percentage chord line alongthe semispan of the wing and the lateral axis perpendicular tothe fuselage centerline (y-axis) is called leading edge sweep(LE). The angle between the wing leading edge and the y-axis ofthe aircraft is called leading edge sweep (LE). Similarly, theangle between the wing trailing edge and the longitudinal axis(y-axis) of the aircraft is called trailing edge sweep (TE). Inthe same fashion, the angle between the wing quarter chord lineand the y-axis of the aircraft is called quarter chord sweep(C/4). And finally, the angle between the wing 50 percentchord line andthe y-axis of the aircraft is 50percent chord sweep (C/2).

If the angle is greater than zero (i.e. wing is inclinedtoward tail), it is called aft sweep or simply sweep; otherwiseit is referred to as forward sweep. Figure 5.37 shows fivewings with various sweep angles. Figure 5.37a illustrates awing without sweep, while figures 5.37b through5.37d show four swept wing. The leading edge sweep is depictedin the wing of figure 5.37b, while trailing edge sweep is shownin the wing of figure 5.37e. In addition, the quarter chordsweep is illustrated in the wing of figure 5.37d, and the 50percent chord sweep is illustrated in the wing of figure 5.37c.Most high-speed airplanes designed since the middle 1940s – suchas North American F-86 Saber - have swept wings. On sweptbacktapered wing, typical of almost all high speed aircraft, theleading edge has more sweep than the trailing edge.
With reference to the definition of sweep angle, aparticular wing may have aft leading edge sweep, while it hasforward trailing edge sweep. Among four types of sweep angles,the quarter chord sweep and leading edge sweep are the mostimportant ones. The subsonic lift due angle of attack normallyacts at the quarter chord. In addition, the crest is usuallyclose to the quarter chord. The discussion in this sectionregarding the characteristics (advantages and disadvantages) ofsweep angle is mostly about leading edge sweep angle, unlessotherwise stated. Basically, a wing is being swept for thefollowing five design goals:
1. Improving the wing aerodynamic features (lift, drag, pitching moment) at transonic, supersonic and hypersonic speeds by delaying the compressibility effects.
2. Adjusting the aircraft center of gravity.3. Improving static lateral stability.4. Impacting longitudinal and directional stability.5. Increasing pilot view (especially for fighter pilots).
These items will be described in more details in this section.For more information, the reader needs to refer to technicaltextbooks that are listed at the end of this chapter. Thepractical influence of the sweep angle on various flight

features are as follows:
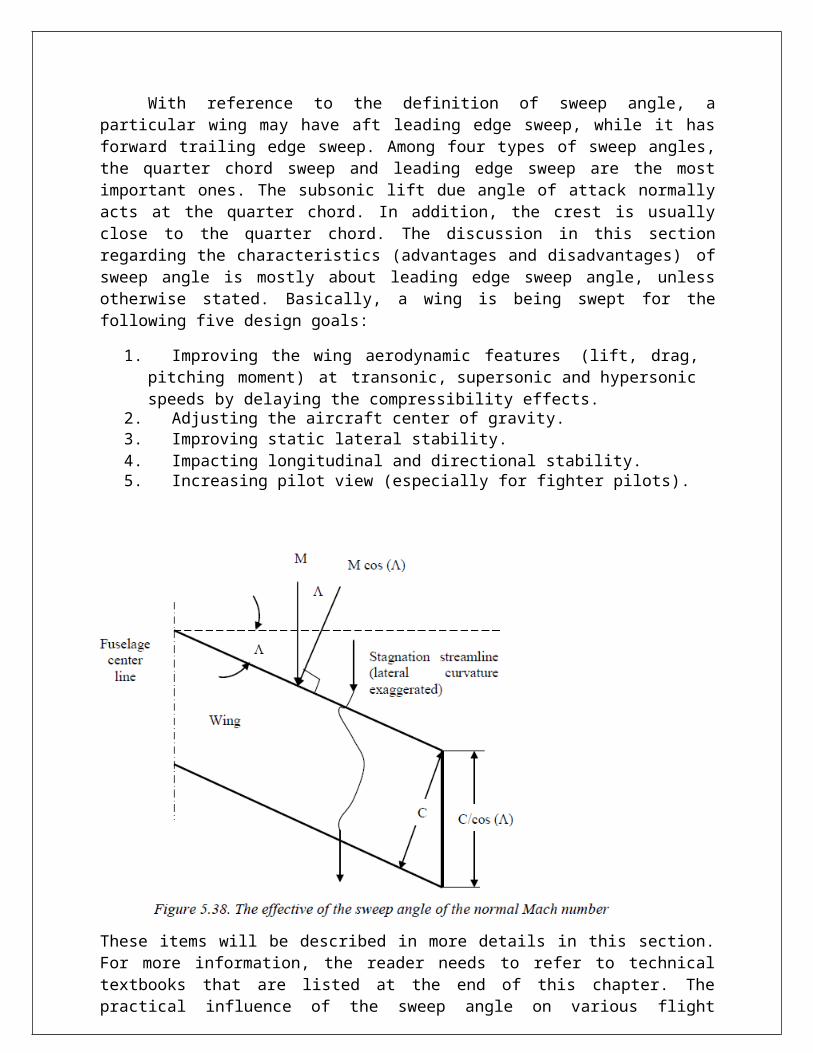
1. The sweep angle, in practice, tends to increase thedistance between leading edge and trailing edge.Accordingly, the pressure distribution will vary.
2. The effective chord length of a swept wing is longer(see Figure 5.38) by a factor of 1/cos (). This makes theeffective thickness-to-chord ratio thinner, since thethickness remains constant.
3. Item 2 can be also translated into the reduction of Machnumber (Mn) normal to the wing leading edge to M cos ().Hence, by sweeping the wing, the flow behaves as if theairfoil section is thinner, with a consequent increase inthe critical Mach number of the wing. For this reason, aclassic design feature used to increase Mcr is to sweep thewing [6].
4. The effect of the swept wing is to curve the streamlineflow over the wing as shown in figure 5.38. The curvatureis due to the deceleration and acceleration of flow in theplane perpendicular to the quarter chord line. Near thewing tip the flow around the tip from the lower surface tothe upper surface obviously alters the effect of sweep.The effect is to unsweep the spanwise constant-pressurelines; isobar. To compensate, the wing tip may be givenadditional structural sweep.
5. The wing aerodynamic center (ac) is moved aft by thewing aft sweep at about few percent. The aft movement ofthe ac with increase in sweptback angle occurs because theeffect of the downwash pattern associated with a swept wingis to raise the lift coefficient on the outer wing panelrelative to the inboard lift coefficient. Since sweepmovers the outer panel aft relative to the inner portionof the wing, the effect on the center of lift is an aftward movement. The effect of wing sweep on ac position isshown in figure 5.39 for aspect ratios of 7 and 10 and fortaper ratios of 0.25 and 0.5.

6. The effective dynamic pressure is reduced, although not by as much as in cruise.
7. The sweep angle tends to change the lift distributionas sketched in figure 5.40. The reason becomes clear bylooking at the explanations in item 5. As the sweep angleis increased, the Oswald efficiency factor (e) will decrease(Equation 5.25).
The Oswald span efficiency for a straight wing and swept wing are given respectively by equation 5.27a and 5.27b [12].
e 1.781 0.045AR0.68

LE
0.64e 4.611 0.045AR0.68
cos0.15 3.1
(5.27a)
(5.27b)
Equation 5.27a is for a straight wing and Equation 5.27b isfor a swept wing where sweep angle is more than 30 degrees.When the Oswald span efficiency is equal to 1, it indicatesthat the lift distribution is elliptical, otherwise it isnon-elliptic. Equation 5.27 is not valid for low aspect ratiowings (AR less than 6).
8. The wing maximum lift coefficient can actually increase with increasing sweep angle.
However, the maximum useful lift coefficient actuallydecreases with increasing sweep angle, due to loss ofcontrol in pitch up situation. Whether or not pitch upoccurs depends not only on the combination of sweep angleand aspect ratio, but also an airfoil type, twist angle,and taper ratio. Thus, the sweep angle tends to increasestall speed (Vs). The maximum lift coefficient of the basicwing without high lift device is governed bythe following semi-empiricalrelationship [13]Clmax( not eql zero) Cl max
0.86 0.002()where sweep angle () is in degrees and Clmax denotes the maximum lift coefficient for the outer panel airfoil section.
9. Wing sweep tends to reduce the wing lift curve slope (CL). A modified equation based on Prandtl-Glauert approximation is introduced by [13] as follows:
CL 2
2ARAR 2 1 tan 2 M 2 4
(5.29)
10. The aircraft pitching moment will be increased,provided the aircraft cg is forward of aircraft ac. Thereason is that wing aerodynamic center is moving aft withincrease in sweep angle.
11. An aft swept wing tends to have tip stall because ofthe tendency toward outboard, spanwise flow. This causesthe boundary layer to thicken as it approaches the tips.For the similar reason, a swept forward wing would tendtoward root stall. This tends to have an influence opposite
to that of wing twist.12. On most aft swept wing aircraft, the wing tips are
located behind the aircraft center of gravity. Therefore,any loss of lift at the wing tips causes the wing centerof pressure to move forward. This in turn will cause theaircraft nose to pitch up. This pitch up tendency can causethe aircraft angle of attack to increase even further.This may result in a loss of aircraft longitudinal control.For the similar reason, a forward swept wing aircraft wouldexhibit a pitch down tendency in a similar situation.
13. Tip stall on a swept wing is very serious. If theoutboard section of a swept wing stalls, the lift loss isbehind the wing aerodynamic center. The inboard portionof the wing ahead of the aerodynamic center maintainsits lift and produces a strong pitch-up moment,tending to throw the aircraft deeper into the stall.Combined with the effect of tip stall on the pitchingmoment produced by the tail, this effect is very dangerousand must be avoided by options such as wing twist.
14. A swept wing produce a negative rolling moment becauseof a difference in velocity components normal to theleading edge between the left and right wing sections [14].The rolling moment due to aft sweep is proportional to thesine of twice the leading edge sweep angle.

Clβ sin(2 LE )This makes the dihedral effect(Clβ) more negative and itmeans that a swept wing has aninherent dihedral effect. Hence, a swept wing may not needa dihedral or anhedral to satisfy lateral-directionalstability requirements. Thus, the sweep angle tends toreinforcethe dihedral effect. It is interesting to note that makingthe dihedral effect (Clβ) morenegative will make an aircraft more spirally stable. At thesame time, the dutch-roll damping ratio tends to decrease.This presents a design conflict [14] which must be resolvedthrough some compromise.
15. In supersonic flight, the sweep angle tends to reducethe shock wave drag. The drag generated by the obliqueshock wave is referred to as wave drag, which is inherentlyrelated to the loss of total pressure and increase ofentropy across the oblique shock waves created by thewing. For this purpose, the sweep angle must be greater(see figure5.41) than Mach angle,
sin-(1M)
1.2 90 where M is the aircraft cruising Mach number. A 20

percent higher sweep angle will guarantee the low wave dragat supersonic speeds.
16. A wing with high wing loading (W/S) and high quarter-chord sweep (c/4) exhibits a good ride in turbulence.
At hypersonic speeds (e.g. Space Shuttle), if the oblique shockwave is very close to the wing leading edge; due to a low sweepangle; it generates very high temperature due to aerodynamicheating (about 3000 oF) such that the wing leading edge surfacemay be melted. Thus, the sweep angle must be such that wingleading edge surface survive very high temperature. This ensuresthat the wing is located inside Mach cone

17. With the application of the sweep angle, the wingeffective span (beff) with be shorter than originaltheoretical span. This results in a lower wing mass momentof inertia about x-axis, which increases the lateralcontrollability of the aircraft. Hence, the higher the sweepangle, allows for better maneuverability.
SWEPT BACK WING PARAMETERS: 1.In supersonic flight, the sweep angle tends to reduce
the shock wave drag. The drag generated by the obliqueshock wave is referred to as wave drag, which is inherentlyrelated to the loss of total pressure and increase ofentropy across the oblique shock waves created by thewing. For this purpose, the sweep angle must be greater(see figure5.41) than Mach angle,
sin-1(1M)
1.2 90 Where, M=1.67Mach angle(),sin-1(1 /1.67)
sweep angle()=1.2 90 from above eqn swept back wing angle is ()=63.850
2.effective chord length of swept wing (Ceff)= 1/cos(
Ceff
= 2.26 3.leading edge sweptback(LE)= tan-
1[tan(AR)*((1- ʎ¿ /(1+ʎ)¿¿ Where, AR=3.44 ʎ=0.3 substitute all the values in above eqn. LE= tan-1(2.19)

LE=65.480
4.sweep angle at a reference or half of the chord c/4 = tan-
1[tan(AR)*((1- ʎ¿ /(1+ʎ)¿¿ c/4= tan-1(1.72)
c/
4=59.860
5.The rolling moment due to aft sweep is proportional tothe sine of twice the leading edge sweepangle
Clβ sin(2 LE )
EFFECTIVE SPAN (beff)
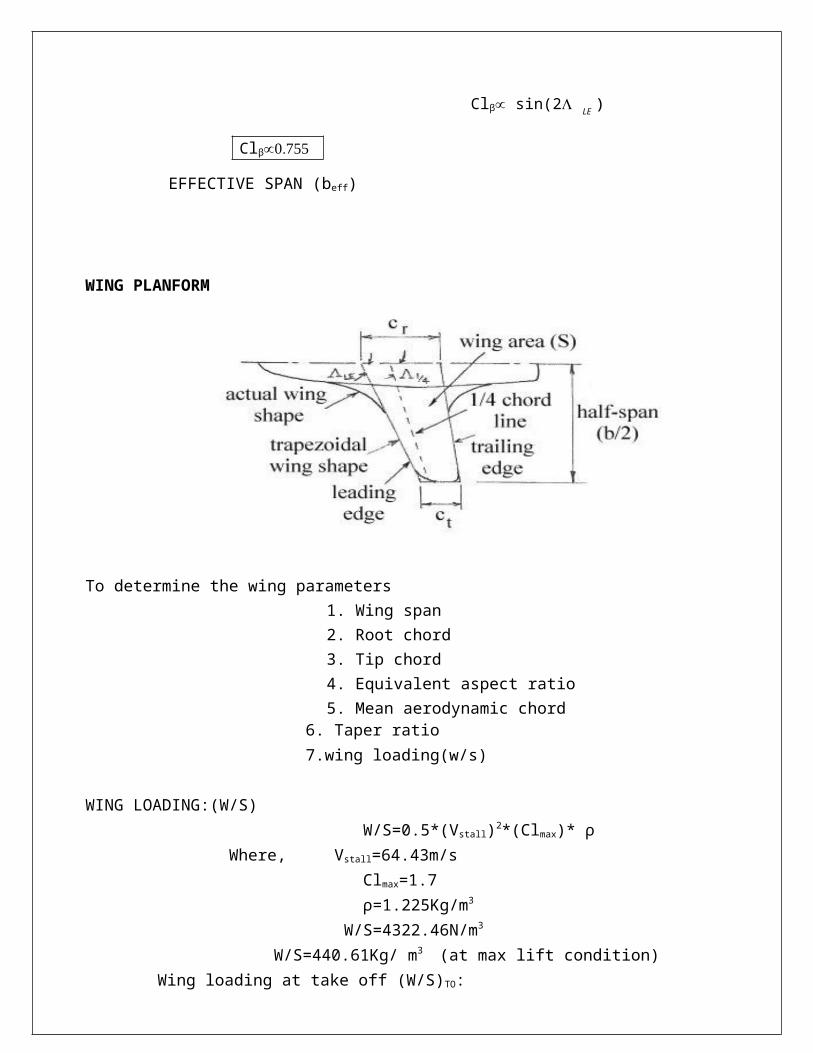
WING PLANFORM
To determine the wing parameters 1. Wing span 2. Root chord 3. Tip chord 4. Equivalent aspect ratio 5. Mean aerodynamic chord 6. Taper ratio 7.wing loading(w/s)
WING LOADING:(W/S) W/S=0.5*(Vstall)2*(Clmax)* ⍴ Where, Vstall=64.43m/s Clmax=1.7 ⍴=1.225Kg/m3
W/S=4322.46N/m3
W/S=440.61Kg/ m3 (at max lift condition) Wing loading at take off (W/S)TO:
Clβ

(W/S)TO =0.5*(VTO)2*(Clmax (gross))* ⍴
Where, VTO=1.2Vstall VTO=77.31m/s ⍴=1.225Kg/m3 Clmax
(gross)=2.2 (Flap down) (W/S)TO=8053.78kg/m3
Wing loading at landing (W/S)L: (W/S)L =0.85 (W/S)TO From, for fighter aircraft WL=0.85WTO Where, (W/S)TO=8053.78kg/m3
(W/S)L=6845.71 kg/m3
WING AREA (S): S=W0/(W/S) S=18920/(440.61) S=42.93m2
WING SPAN(b): b=(AR*S)0.5
Where aspect ratio is AR=3.44 (from retrived data) b=12.15m
ROOT CHORD:
Croot = 2S
b(1+(ʎ ))
where taper ratio(ʎ¿ is 0.3 in the order of aspect ratio 3.44
Croot = 2∗42.93
12.15(1+(0.3 ))
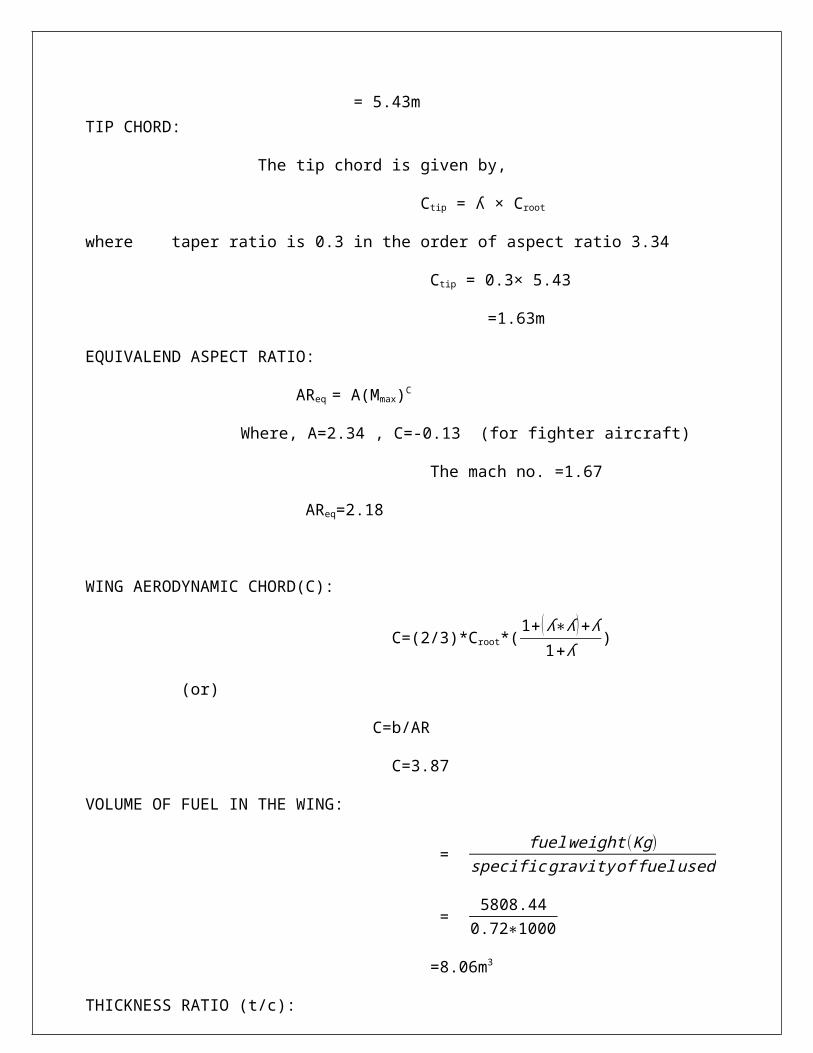
= 5.43mTIP CHORD:
The tip chord is given by,
Ctip = ʎ × Croot
where taper ratio is 0.3 in the order of aspect ratio 3.34
Ctip = 0.3× 5.43
=1.63m
EQUIVALEND ASPECT RATIO:
AReq = A(Mmax)C
Where, A=2.34 , C=-0.13 (for fighter aircraft)
The mach no. =1.67
AReq=2.18
WING AERODYNAMIC CHORD(C):
C=(2/3)*Croot*(1+(ʎ∗ʎ)+ʎ
1+ʎ )
(or)
C=b/AR
C=3.87
VOLUME OF FUEL IN THE WING:
= fuelweight (Kg)specificgravityoffuelused
= 5808.440.72∗1000
=8.06m3
THICKNESS RATIO (t/c):
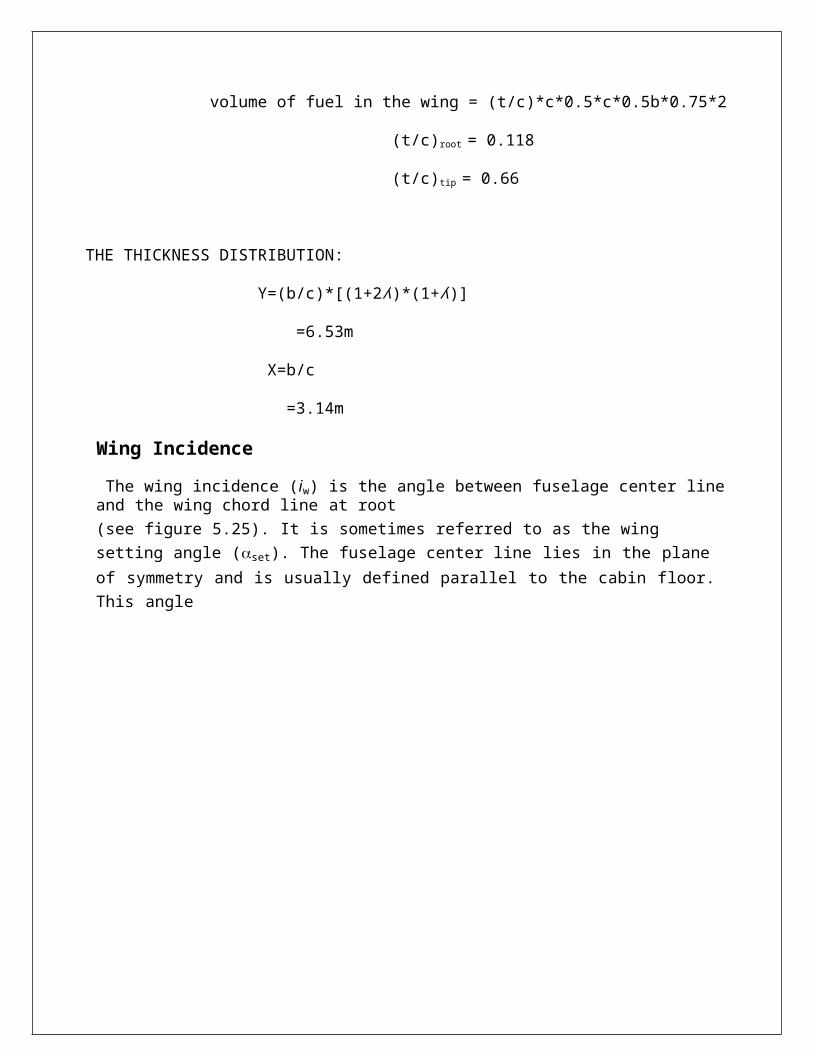
volume of fuel in the wing = (t/c)*c*0.5*c*0.5b*0.75*2
(t/c)root = 0.118
(t/c)tip = 0.66
THE THICKNESS DISTRIBUTION:
Y=(b/c)*[(1+2ʎ)*(1+ʎ)]
=6.53m
X=b/c
=3.14m
Wing Incidence The wing incidence (iw) is the angle between fuselage center lineand the wing chord line at root(see figure 5.25). It is sometimes referred to as the wing setting angle (set). The fuselage center line lies in the plane of symmetry and is usually defined parallel to the cabin floor.This angle

could be selected to be variable during a flight operation, or beconstant throughout all flight operations. If it is selected tovary during flight, there is no need to determine wing settingangle for the purpose of the aircraft manufacture. However, inthis case, the mechanism to vary the wing incidence duringflight phases must be designed. Thus the required wingincidence for every flight phase must be calculated. Thevariable wing incidence is not recommended, since there is ahuge safety and operational concerns. To allow for the wing tohave a variable setting angle, there must be a single shaftaround which the wing is rotated by pilot control. Such amechanism is not 100% reliable for aviation purposes, due tofatigue, weight, and stress concentration concerns. In thehistory of aviation, there is only one aircraft (Vought f 8 uCrusader) whose wing had variable incidence. A flying wing;such as Northrop Grumman B-2Spirit (Figure 6.8) has no wing incidence, since there is nofuselage, however the wing angle ofattack must be determined foroperational purposes.
Wing chord line atroot
iw
Fuselage center line
Figure 5.25. Wing setting (incidence) angle
A second, very convenient option is to have a constant wingsetting angle. The wing can be attached to the fuselage viawelding, screw, or other manufacturing technique at the specifiedsetting angle. This is much safer compared with variable settingangle. For this option, the designer must determine the angle atwhich the wing is attached to the fuselage. The wing incidencemust satisfy the following design requirements:
1. The wing must be able to generate the desired lift

coefficient during cruising flight.2. The wing must produce minimum drag during cruising flight.3. The wing setting angle must be such that the wing angle of attack could be safely varied
(in fact increased) during take-off operation.4. The wing setting angle must be such that the fuselage
generates minimum drag during cruising flight (i.e. the fuselage angle of attack must be zero in cruise).
These design requirements naturally match with thewing airfoil angle of attack corresponding to the airfoilideal lift coefficient (see figure 5.26). Therefore, as soon asthe wing ideal lift coefficient is determined, a reference to Cl- graph demonstrates the wing setting angle. Table 5.7illustrates the wing incidence for several aircraft.

l
cl
ci
set
Figure 5.26. Wing setting angle corresponds with ideal lift coefficient
The typical number for wing incidence for majority ofaircraft is between 0 to 4 degrees. As a general guidance, thewing setting angle in supersonic fighters, is between 0 to 1degrees; in GA aircraft, between 2 to 4 degrees; and in jettransport aircraft is between 3 to 5 degrees. It is very hard tohave the exact same incidence on both left and right wingsections. Due to this fact, when there is an inboard stall, theaircraft will roll. The wing outboard stall is unacceptable; if atransport aircraft is at approach, and an outboard stall occurs,it is a disaster. The reason is that the ailerons are noteffective to apply roll control.
No Aircraft
Type Winginciden
Cruisingspeed(kno1 Airbus 310 Jet transport 5o 30' Mach 0.8
2 Fokker 50 Prop-driven transport
3o 30' 2823 Sukhoi Su-27 Jet fighter 0o Mach 2.354 Embraer FMB-120
BrasiliaProp-driven transport
2o 2725 Embraer Tucano Turbo-Prop
Trainer1o 25' 222
6 Antonov An-26 Turbo-prop Transport
3o 2357 BAe Jetstream 31 Turbo-prop
Business3o 282
8 BAe Harrier V/STOL close support
1o 45' 5709 Lockheed P-3C Orion Prop-driven
transport3o 328
10 Rockwell/DASA X-31A Jet combat research
0o 148511 Kawasaki Prop-driven
transport0o 560
12 ATR 42 Prop-driven transport
2o 26513 Beech Super King Air
B200Turbo-prop Transport
3o 48' 28914 SAAB 340B Turbo-prop
Transport2o 250
15 AVRO RJ Jet Transport 3o 6' 41216 McDonnell MD-11 Jet Transport 5o 51’ Mach 0.8717 F-15J Eagle Fighter 0 > Mach
2.2Table 5.7. Wing setting angle for several aircraft [5]

The wing setting angle may be modified as the design process progresses. For instance, a fuselage with large unsweep over the rear portion to accept aft cargo doors may have their
minimum drag at a small positive angle of attack. In such cases, thewing incidence will be reduced accordingly. Another, lesfundamental, consideration is that stopping performance duringlanding operation to get as much weight on the braked wheels aspossible. Thus, there is a benefit to reduce the wing incidenceslightly to the extent that the change is not felt significantly in thecabin. Reducing the nose gear length will do the same thing. Thistechnique is limited in passenger aircraft because a level cabin flooris desirable on the ground. But, for fighter aircraft, the level flooris not a design consideration.
POWER PLANT SELECTION:
An aircraft engine is the component of the propulsion system for an
aircraft that generates mechanical power. Aircraft engines are almost
always either lightweight piston engines or gas turbines. This article
is an overview of the basic types of aircraft engines and the design
concepts employed in engine development for aircraft.
There are several types among this they are as follows:
Shaft Engine
- Incline Engine
- Rotary Engine
- V-type Engine
- Radial Engine
- Horizontally opposed engine
Jet Engine
- Turbojet
- Turbofan
- Turboprop
THRUST REQUIRED TO PROPEL THE ENGINE:

Thrust is one of the four aerodynamic forces acting on the aircraft in flight. it is the force that pushes an aircraft through the air. Thrust must be greater than drag to achieve the forward acceleration needed for take off and to increases an aircraft speed in level flight. an aircraft flying at constant speed will have thrust equal to drag.
the generalized thrust equation is given by,
T= (ma){(1+f)Ue-Ua}+ (Pe-Pa)Ae
The formula used for the thrust calculation is given by
T = Take off weight * Thrust loading
T = W0 *(T/W0)
Where, W0 = 18920 Kg
T/W = 0.73
T = 18920 * 0.73
T = 13811.6 Kg
T = 135.49kN
For TWIN ENGINE fighter aircraft (2) = 135.49KN
That means one engine producing the thrust of 67.45KN (with after burner)
The corresponding rang engine selected is given by (power plant)
S.NO
Engine name Dry thrust(KN)
Wet thrust(afterburner)(KN)
1 General electric F414 55.6 752 Kaveri engine(k-9) 45 753 M52-P2 64 954 M88-2 50 75
SELECTED ENGINE: KAVERI (K-9)
History:

program:
In 1896 the Indian defence ministry’s defence research and developed organization(DRDO) was authorized to launch a programmed to develop an indigenous power plant for the light combat aircraft. It had already been decided early in the LCA programmed to equip the prototype aircraft with the general electric F404-GE-F2J3 afterburning turbofan engine , but if this parallel program was successful, it was intended to equip the production aircraft with this indigenous engine.
the DRDO assigned the lead development responsibilityto its gas turbine research establishment (GTRE), which had some experience in develop in jet engines. It had developed the GTX37-14U afterburning turbojet, which first jet engine to be designed entirely inIndia.
A turbofan derivative, the GT37-14UB, followed. the GTRE Returned to turbojet technology with the greatly redesigned, but unsatisfactory, GTX-35.
For the LCA programmed the GTRE would again take up a turbofan design which it designated the GTX-35VS “KAVERI” (Named afterthe kaveri river). Full scale development was authorized in April 1989 in what was then expected to be a 93 month programmed projected to cost 3.82 billion (taller ). A new engine typically cost up to 2(taller)billion to develop, according to engine industry executives.
DEVELOPMENT:
The original plans called for 17 prototype test engines to be built. Thefirst test engine consisted of only the core module (named "Kabini"), while the third engine was the first example fitted with variable inlet guide vanes (IGV) on the first three compressor stages. The Kabini core engine first ran in March 1995. Test runs of the first complete prototype Kaveri began in 1996 and all five ground-test examples were intesting by 1998; the initial flight tests were planned for the end of 1999, with its first test flight in an LCA prototype to follow the next year. However, progress in the Kaveri development programme was slowed by both political and technical difficulties.
In 2002, little information had been publicly released concerning the nature of the Kaveri's technical challenges, but it was known that the

Kaveri had a tendency to "throw" turbine blades, which required securingblades from SNECMA (as well as digital engine control systems).
Continuing development snags with the Kaveri resulted in the 2003 decision to procure the uprated F404-GE-IN20 engine for the eight pre-production Limited Series Production (LSP) aircraft and two naval prototypes. The ADA awarded General Electric a US$105 million contract in February 2004 for development engineering and production of 17 F404-IN20 engines, delivery of which is to begin in 2006.which is to begin in2006.
In mid-2004, the Kaveri failed its high-altitude tests in Russia, endingthe last hopes of introducing it with the first production Tejas aircraft.[7] This unfortunate development led the Indian Ministry of Defence (MoD) to order 40 more IN20 engines in 2005 for the first 20 production aircraft, and to openly appeal for international participation in completing development of the Kaveri. In February 2006,the ADA awarded a contract to SNECMA for technical assistance in workingout the Kaveri's problems.
In Dec. 2004, it was revealed that the GTRE had spent over 13 billion (US$211.9 million) on developing the Kaveri. Furthermore, the Cabinet Committee on Security judged that the Kaveri would not be installed on the LCA before 2012, and revised its estimate for the projected total development cost to 28.39 billion (US$463 million).
In April 2005, "There is good progress" on the development of the Kaveriengine, M. Natarajan, Scientific Adviser to the Defence Minister told The Hindu. "We are planning to integrate a prototype Kaveri engine into one of the LCA prototypes sometime in 2007 to understand the nuances of such a complex powerpack," he further told The Hindu.[10]In Feb. 2006, the US experts told pti that "Kaveri is truly a world-class engine." "Weare ready to join in partnership with the Defence Research and Development Organisation to make Kaveri work," General William J Begert of Pratt and Whitney, told PTI. But DRDO secretary Natrajan told PTI that "But Kaveri is and would remain an Indian project.”
On 5 February 2007, Scientific Advisor to Defence Minister M Natarajan said nearly 90 to 93 per cent of the expected performance had been realised and the government had recently floated an expression of interest to seek partners to move the programme further.Till 11 February2008, Kaveri had undergone 1,700 hours of tests and has been sent twice

to Russia to undergo high-altitude tests for which India has no facility. The engine is also being tested to power the next generation of Unmanned Aerial Vehicles.
In July 2007, GTRE divided Kaveri program into two separate programs. They are K9+ Program and K 10 Program. K9+ Program is a program to proveconcept of complete design and gain hand-on experience of aircraft engine integration and flight trials to cover a defined truncated flightenvelope prior to the launch of production version of K10 Standard engine. While K 10 Program is a Joint Venture (JV) partnership with a foreign engine manufacturer. K 10 program engine will be final production standard Kaveri engine and shall have less weight and more reheat thrust along with certain other changes to meet the original design intent.
In September 2008, it was announced that the Kaveri would not be ready in time for the Tejas, and that an in-production powerplant would have to selected. Development of the Kaveri by the GTRE would continue for other future applications. It was announced in November 2008 that the Kaveri engine will be installed on LCA by December 2009,apparently for tests only.[citation needed]
In February 2009, it was published in flightglobal that the GTRE had spent 20 billion (US$326.0 million) in developing the Kaveri engine since 1989, but the powerplant is still overweight and does not have the21,000-22,500 lb of thrust (93-100 kN) that its customer requires. Natarajan told Flightglobal that the programme will not be scrapped. "A team of air force engineers is working with GTRE and ADA in addressing the issues. As an ongoing project, the air force will be involved at thepoint of integrating the upgraded version of the engine with the aircraft," he told Flightglobal. "Discussions with Snecma have been going on for two years," he further adds. "Development and flight-testing of the new engine will take at least five to six years."
In December 2009, Kaveri-Snecma JV was trying Back-door Entry In LCA. The People's Post reported that GTRE has agreed to de-link Kaveri from LCA, but has put in a proposal that when the first 40 GE 404 engines in the initial two squadrons of the LCA for the IAF, get phased out should be replaced by the Kaveri-Snecma engine, in future.
On 3 May 2010, about 1880 hrs of engine test had been completed on various prototypes of Kaveri Engine. A total of eight Kaveri Engines and
four core engines have been manufactured, assembled and tested. High Altitude testing on core engine has been completed successfully.
In June 2010, the Kaveri engine based on Snecma’s new core, an uprated derivative of the M88-2 engine that powers the French Rafale fighter, providing 83-85 Kilonewtons (KN) of maximum thrust is being considered an option by DRDO.In July 2010, according to Vinayak shetty, Tejas aircraft will be Integrated with Kaveri engine and will be flying on board a Tejas Air frame by early 2011 or some time later in the year.
A press release in August 2010, stated that GTRE with the help of Central Institute of Aviation Motors (CIAM) of Russia is trying to matchobjective of fine tuning of Kaveri engine performance. Until August 2010, one major milestone which is altitude testing, simulating Kaveri engine performance at different altitude and achieving speed of Mach 1 had been completed successfully. One of Kaveri prototype (K9) was successfully flight tested at Gromov Flight Research Institute in Moscow, on 4 November 2010.
The test was conducted at the Flying Test Bed at Gromov, with the enginerunning right from the take-off to landing, flying for a period of over one hour up to an altitude of 6,000 metres. The engine helped the IL-76 aircraft test bed fly at speeds of 0.6 mach in its maiden flight, according to the Defence Research and Development Organisation (DRDO).
"The engine control, performance and health during the flight were foundto be excellent. With this test, Kaveri engine has completed a major milestone of development programme," it added. After completing these milestone Kaveri engine is flight-worthy.[21][22] The Kaveri engine was tested for the first time on a flying testbed and the trials were a success.
Till April 2011, the first phase of Kaveri engine FTB trials have been completed successfully and further tests will continue from May 2011 onwards. The flight tests successfully carried out so far are up to 12 km maximum altitude and a maximum forward speed of 0.7 Mach No
In its annual report for 2010-11, The Comptroller and Auditor General ofIndia noted that 18.92 billion (US$308.4 million) had been spent on development, with only two out of the six milestones prescribed having been met. Among its deficiencies, CAG says the engine weight was higher than the design specifications (1235 kg against 1100 kg) and there was
no progress on developing the compressor, turbine and engine control systems.
On 21 December 2011, "9 prototypes of Kaveri engines and 4 prototypes ofKabini (Core) engines have been developed" told Defence Minister Shri AKAntony in Rajya Sabha. Further on, 2050 hours of test flight of engines has been taken place so far. 27 flights for 55 hours duration have been completed on testbed IL-76 aircraft as well as 12 km maximum forward altitude and a maximum forward speed of 0.7 Mach No had been recorded
CURRENT STATUS:
The DRDO currently hopes to have the Kaveri engine ready for use on the Tejas in the latter half of the 2010s decade and according to latest news still research on it is going on and date to complete its research has been extended to 2011-2012.
“In recent times, the engine has been able to produce thrust of 82 Kilo Newton but what the IAF and other stake-holders desire is power between 90—95 KN", senior officials told The Hindu. "On using the Kaveri for theLCA, they said the engine would be fitted on the first 40 LCAs to be supplied to the IAF when they come for upgrades to the DRDO in the latter half of the decade." Article further adds that in 2011,50-60 testflights will be carried out to mature the engine in terms of reliability, safety and airworthiness.
India's Gas Turbine Research Establishment (GTRE) aims to integrate the Kaveri powerplant with the Hindustan Aeronautics Ltd (HAL) Tejas fighterwithin the next nine months. A test aircraft operated by India's Aeronautical Development Agency will be used for the integration, says an industry source familiar with the programme. If the integration is successful, the GTRE hopes to see a Tejas fly with a Kaveri powerplant by the end of 2013.
In Lok Sabha on 10 December. 2012 Defence Minister A K Antony gave an update on the progress made by the Kaveri Engine Development Project as follows:
So far, 9 prototypes of Kaveri Engine and 4 prototypes of Kabani (Core) Engine have been developed.

2200 hours of test (ground and altitude conditions) has been
conducted. The following two major milestones have been achieved: Successful completion of Official Altitude Testing (OAT) ; and Demonstration of First Block of flight of Kaveri Engine in Flying
Test Bed (FTB). Kaveri Engine was integrated with IL-76 Aircraft at Gromov Flight
Research Institute (GFRI), Russia and flight test was successfully carried out up to 12 km maximum altitude and maximum forward speed of 0.7 Mach No. Twenty Seven flights for 57 hours duration have been completed.
DRDO demonstrated its technological capability in aero-engine technology. This has been a great achievement in the aerospace communityof the country, when the first ever indigenously developed fighter aircraft engine was subjected to flight testing. Tacit knowledge acquired by the DRDO scientists during this project will also be appliedfor further aerospace technology. Kaveri spin-off engine can be used as propulsion system for Indian Unmanned Strike Air Vehicle (USAV).
In January 2013, the GTRE director said that they are abandoning the plan for co-development with Snecma, but they still need an overseas partner, which will be selected through competitive bidding.
APPLICATION:
Plans are also already under way for derivatives of the Kaveri, including a non-afterburning version for an advanced jet trainer and a high-bypass-ratio turbofan based on the Kaveri core, named asKabini.[31]GTX-35VS Kaveri:HAL Tejas (planned for production models)Kaveri Engine for LCAName of the Project / Programme -- Kaveri Engine for LCA[18]Date of Sanction—30 Mar 1989[18]Original Probable Date of Completion (PDC) -- 31 Dec 1996[18]Revised PDC—31 Dec 2010[18]Technologies / Products developed and status of Projects / Programmes on 3 May 2010—About 1880 hrs on engine test has been completed on various prototypes of Kaveri Engine. A total of eight Kaveri Engines and four core engines have been manufactured,
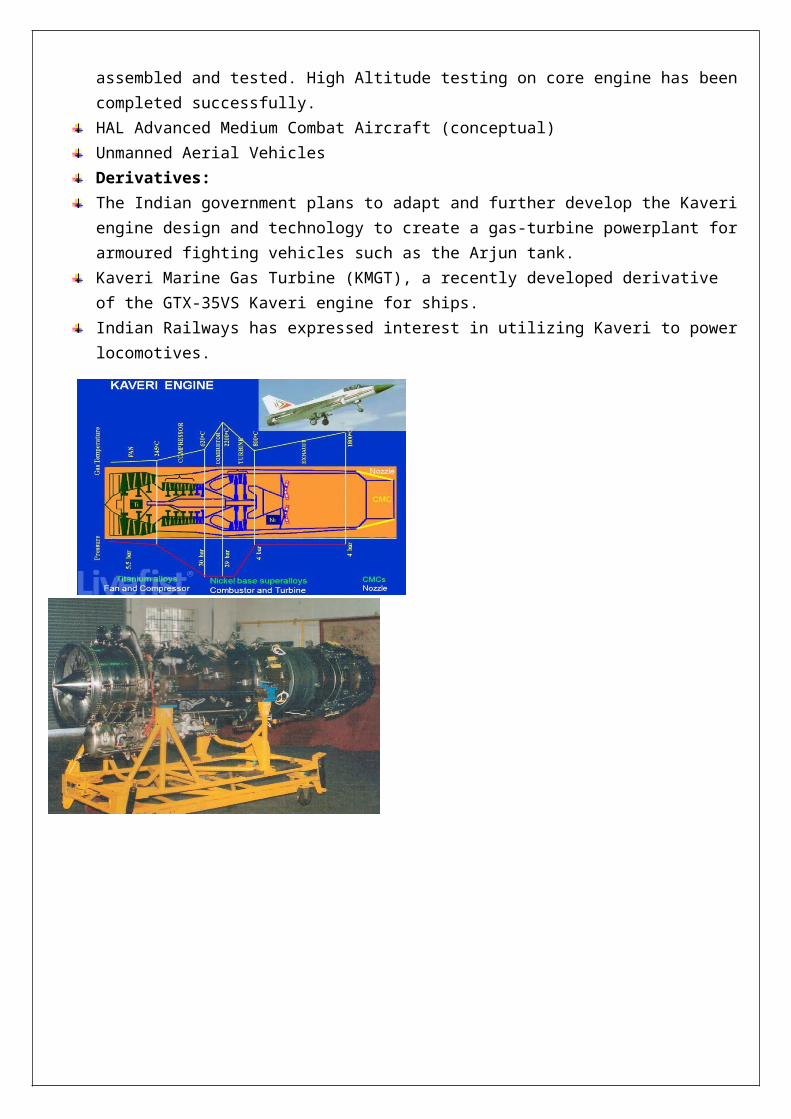
assembled and tested. High Altitude testing on core engine has beencompleted successfully.HAL Advanced Medium Combat Aircraft (conceptual)Unmanned Aerial VehiclesDerivatives:The Indian government plans to adapt and further develop the Kaveriengine design and technology to create a gas-turbine powerplant forarmoured fighting vehicles such as the Arjun tank.Kaveri Marine Gas Turbine (KMGT), a recently developed derivative of the GTX-35VS Kaveri engine for ships.Indian Railways has expressed interest in utilizing Kaveri to powerlocomotives.
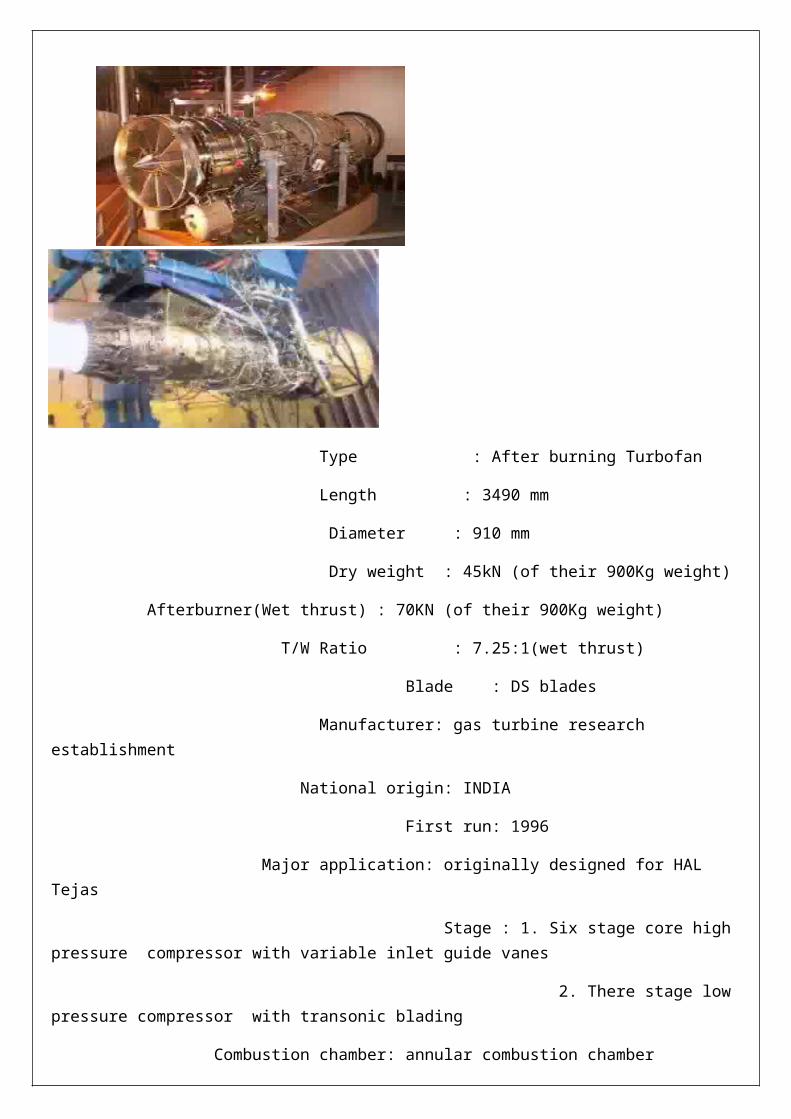
Type : After burning Turbofan
Length : 3490 mm
Diameter : 910 mm
Dry weight : 45kN (of their 900Kg weight)
Afterburner(Wet thrust) : 70KN (of their 900Kg weight)
T/W Ratio : 7.25:1(wet thrust)
Blade : DS blades
Manufacturer: gas turbine research establishment
National origin: INDIA
First run: 1996
Major application: originally designed for HAL Tejas
Stage : 1. Six stage core high pressure compressor with variable inlet guide vanes
2. There stage low pressure compressor with transonic blading
Combustion chamber: annular combustion chamber
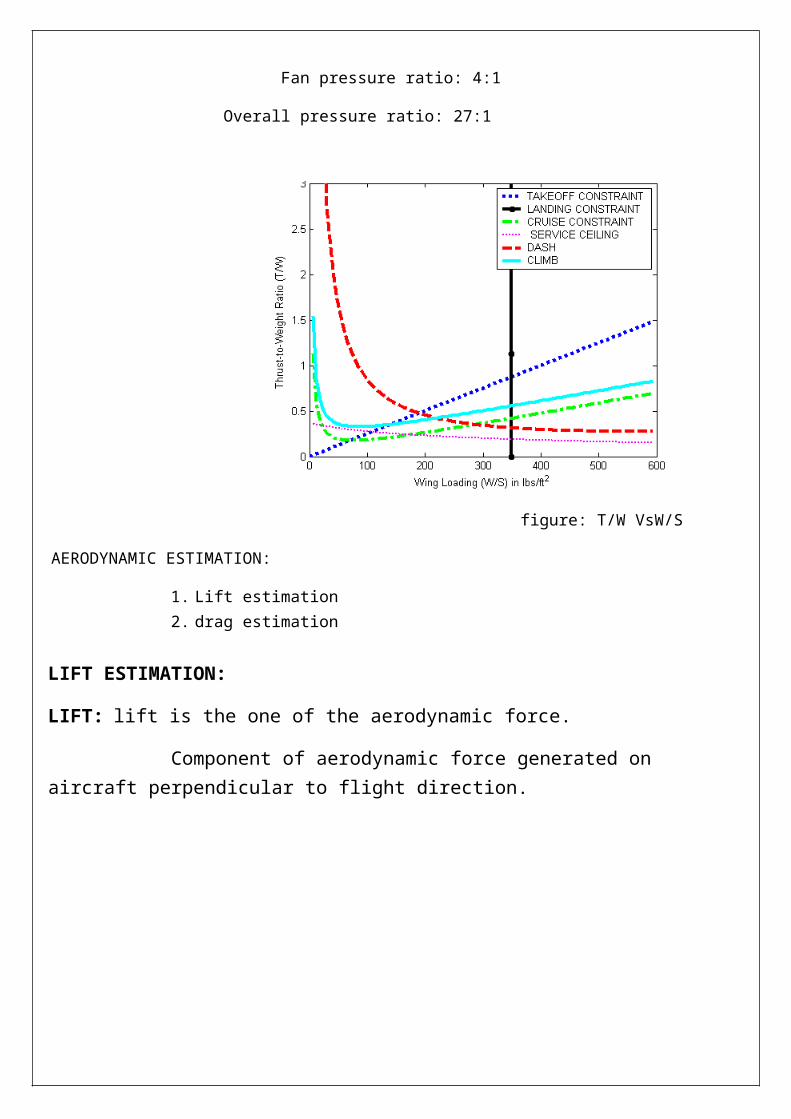
Fan pressure ratio: 4:1
Overall pressure ratio: 27:1
figure: T/W VsW/S
AERODYNAMIC ESTIMATION:
1. Lift estimation2. drag estimation
LIFT ESTIMATION:
LIFT: lift is the one of the aerodynamic force.
Component of aerodynamic force generated on aircraft perpendicular to flight direction.
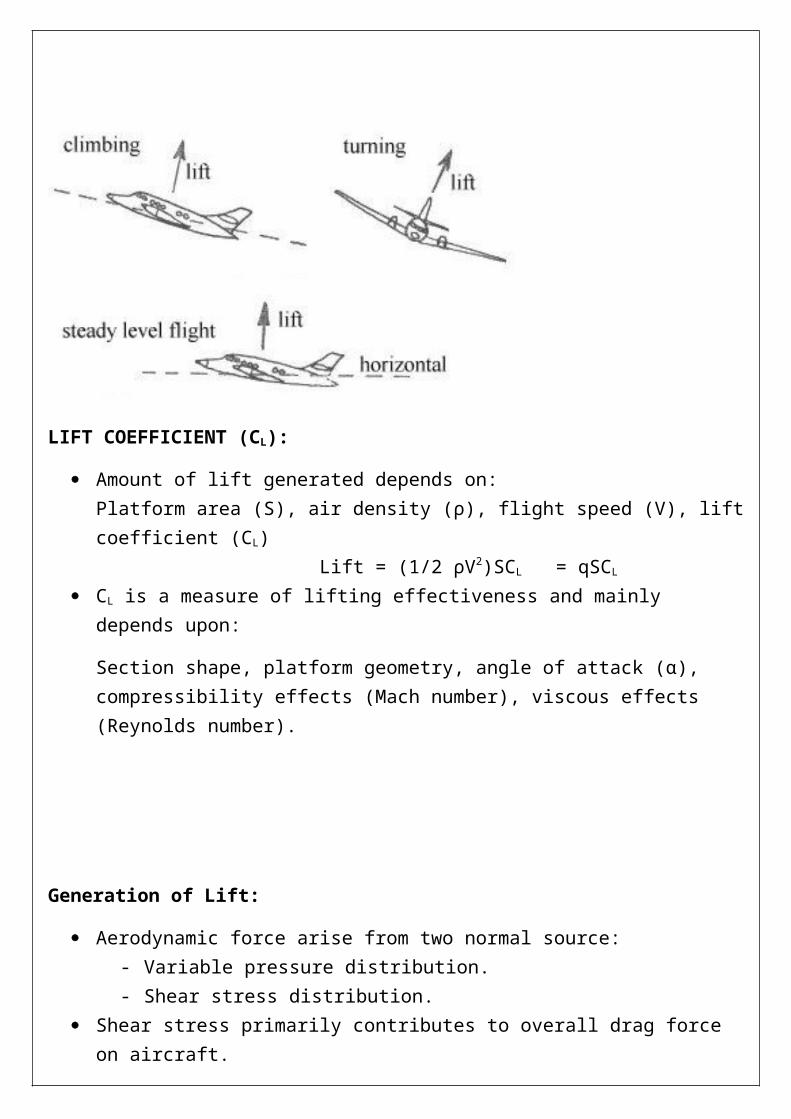
LIFT COEFFICIENT (CL):
Amount of lift generated depends on:Platform area (S), air density (ρ), flight speed (V), liftcoefficient (CL) Lift = (1/2 ρV2)SCL = qSCL
CL is a measure of lifting effectiveness and mainly depends upon:
Section shape, platform geometry, angle of attack (α), compressibility effects (Mach number), viscous effects (Reynolds number).
Generation of Lift:
Aerodynamic force arise from two normal source:- Variable pressure distribution.- Shear stress distribution.
Shear stress primarily contributes to overall drag force on aircraft.
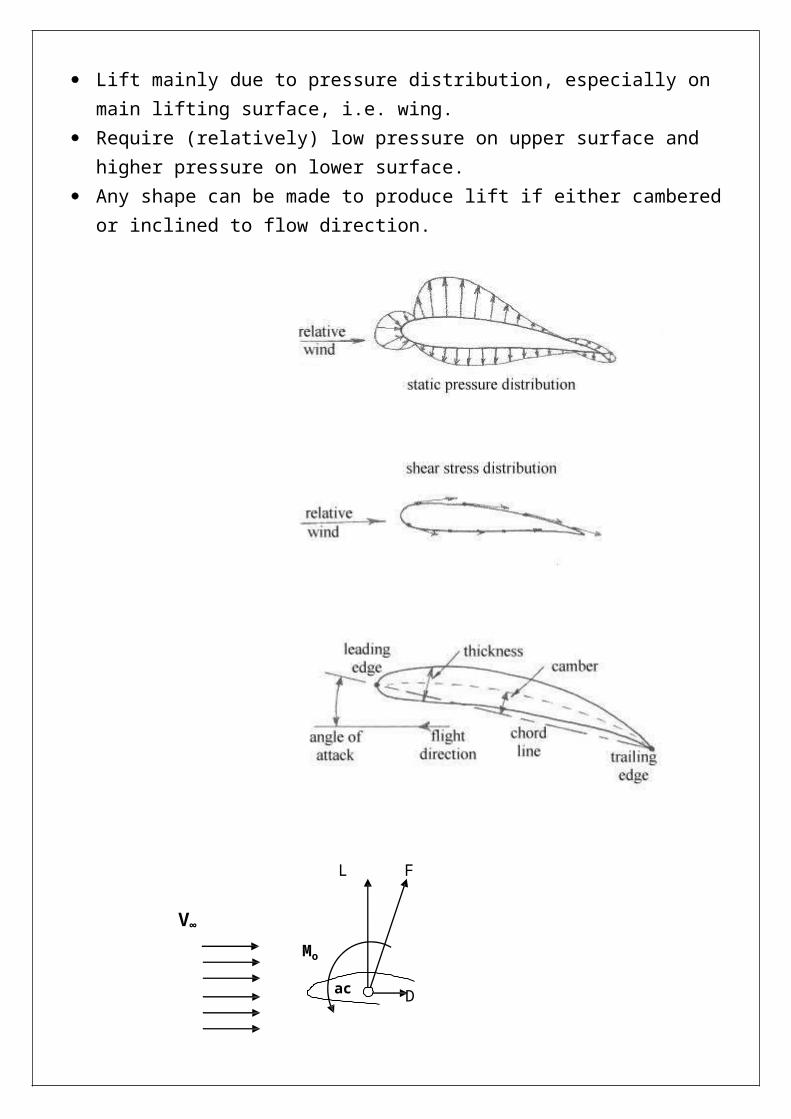
Lift mainly due to pressure distribution, especially on
main lifting surface, i.e. wing. Require (relatively) low pressure on upper surface and
higher pressure on lower surface. Any shape can be made to produce lift if either cambered
or inclined to flow direction.
L F
V∞Mo
ac D

The lift equation is given by, L=0.5*⍴*V2*S*Cl
LIFT AT CRUISE: Where, at cruise speed Density (⍴)=2.7975 slug/ft3=0.144 kg/m3
wing area S=42.93m2
velocity=568.91m/s coefficiend of lift= 1.7 therefore, L=1.7 MNLIFT AT TAKE-OFF: Where, at take off Density (⍴) = 1.225kg/m3
wing area S=42.93m2
velocity (VTO) = 1.1*Vstall
Vstall = 70.87m/s VTO=77.31 coefficient of lift at take off (Clmaxgross) = 2.2 (flap extended and kept at take off position of 20o)
Therefore L = 345.74 KN With, gear down flap take off power is maximumLIFT AT LANDING: Where, at landing condition wing area S= 42.93m2
Density(⍴)=1.225kg/m3 coefficient of lift at landing: Clmax(L) = Clmax(TO)/(Velocity take off coefficient)2

Velocity take off coefficient = 1.2
Clmax(L)=1.52 Velocity at landing(VL)= {(W/S)L/(0.5*⍴* Clmax(L))}0.5
Where (W/S)L= 6845.11 kg/m3
VL=85.75m/s
Therefore, L=293.88KN With, gear up flap landing power is minimum
DRAG ESTIMATION
DRAG:
Drag is the revolved component of the complete aerodynamicforce which is parallel to the flight direction (or relative on coming airflow).
It always acts to oppose the direction of motion. It is undesirable component of the aerodynamic force while
lift is the desirable component.
Drag coefficient (CD):
Amount of drag generated depends on: platform area (S), air density (ρ), flight speed (V),
drag coefficient(CD)
CD is a measure of aerodynamic efficiency and mainly depends upon:

Section shape, platform geometry, angle of attack
(α), compressibility effect (Mach number), viscous effects (Reynolds number).
Drag components:
Skin friction:
Due to shear stresses produced in boundary layer. Significantly more for turbulent than laminar types
of boundary layers.
Form(pressure) Drag:
Due to static pressure distribution around body – component resolving in direction of motion.
o Sometimes considered separately as forebody and rear (base) drag components
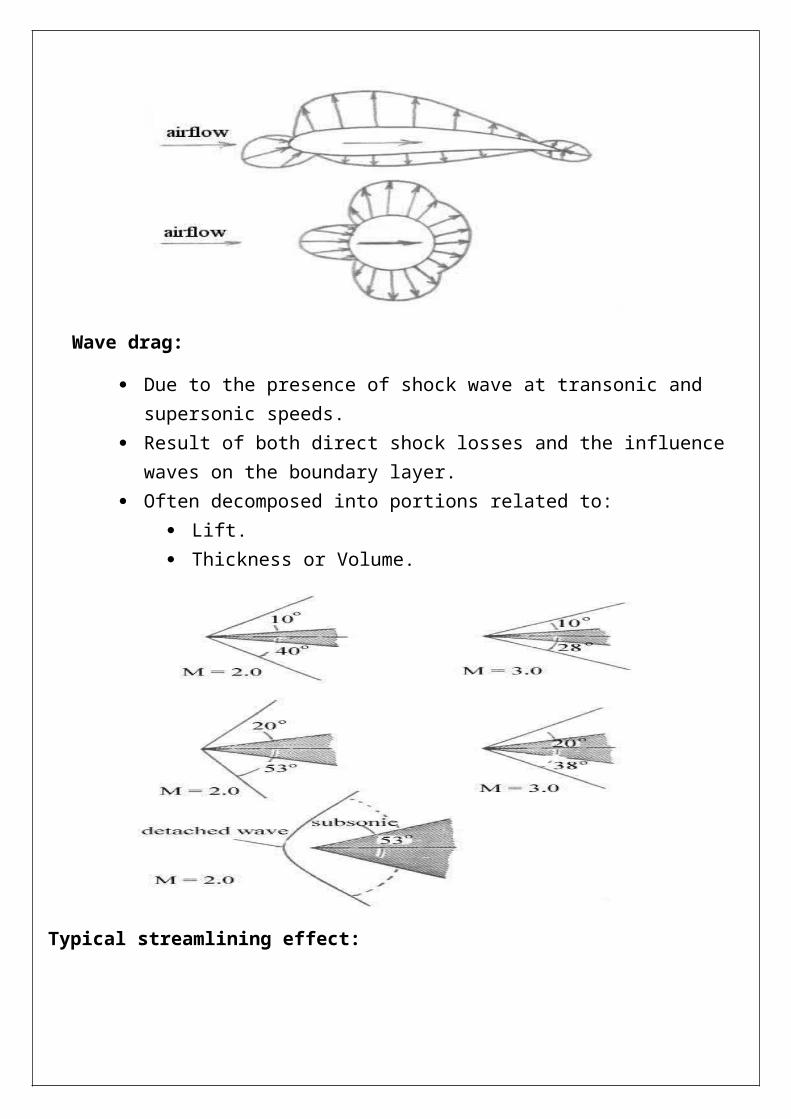
Wave drag:
Due to the presence of shock wave at transonic and supersonic speeds.
Result of both direct shock losses and the influence waves on the boundary layer.
Often decomposed into portions related to: Lift. Thickness or Volume.
Typical streamlining effect:

Lift induced (or) trailing vortex drag:
The lift induced drag is the component which has the included to account for the 3-D nature of the flow (finite span) and generation of the wing lift.
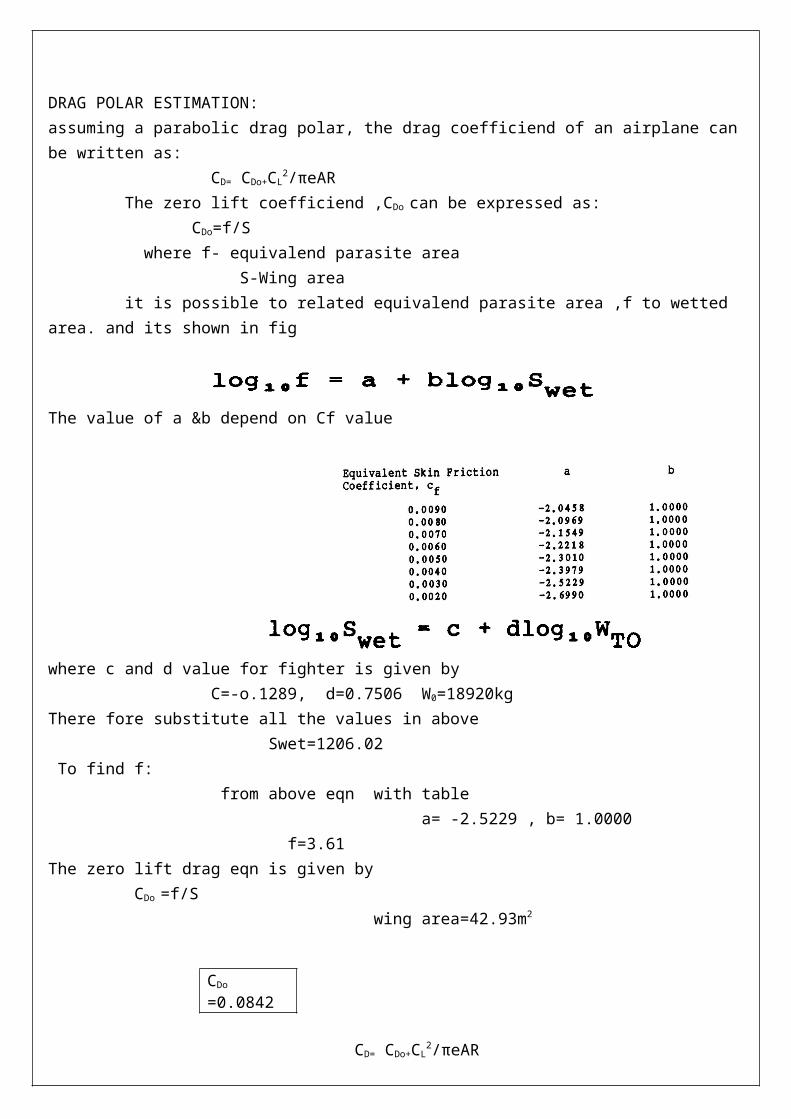
DRAG POLAR ESTIMATION:assuming a parabolic drag polar, the drag coefficiend of an airplane canbe written as: CD= CDo+CL
2/πeAR The zero lift coefficiend ,CDo can be expressed as: CDo=f/S where f- equivalend parasite area S-Wing area it is possible to related equivalend parasite area ,f to wetted area. and its shown in fig
The value of a &b depend on Cf value
where c and d value for fighter is given by C=-o.1289, d=0.7506 W0=18920kgThere fore substitute all the values in above Swet=1206.02 To find f: from above eqn with table a= -2.5229 , b= 1.0000 f=3.61The zero lift drag eqn is given by CDo =f/S wing area=42.93m2
CDo
=0.0842
CD= CDo+CL2/πeAR

Where , 1/ πeAR=K K= 1/π*0.7*3.44 [assuming e=0.7] K=0.132 The above eqn become
CD=0.0842+0.132CL2


CALCULATION:
The general drag equation is given by,
D=(1/2) ⍴*V*S*CD
CD=CD0+K(Cl)2
The drag polar is given by
CD=0.0842+0.132CL2
Therefore above equation become
D=((1/2)pV2S)( 0.0842+0.132CL2)
Drag at Crusie:
P=0.144kg/m3 (at cruising altitude of 16870m)
V=568.91m/s
S=42.93kg/m2
CL(Cruise)=1.7(from the wing and aerofoil estimation)
Substituting all the values in the general drag equation,
D=((1/2)0.144x568.912x42.93)( 0.0842+0.132(1.7)2)
Drag at Cruise D=465.87KN
Drag at Take-off:
Where, at take off Density (⍴) = 1.225kg/m3
wing area S=42.93m2
velocity (VTO) = 1.2*Vstall
Vstall = 64.43m/s VTO=77.31
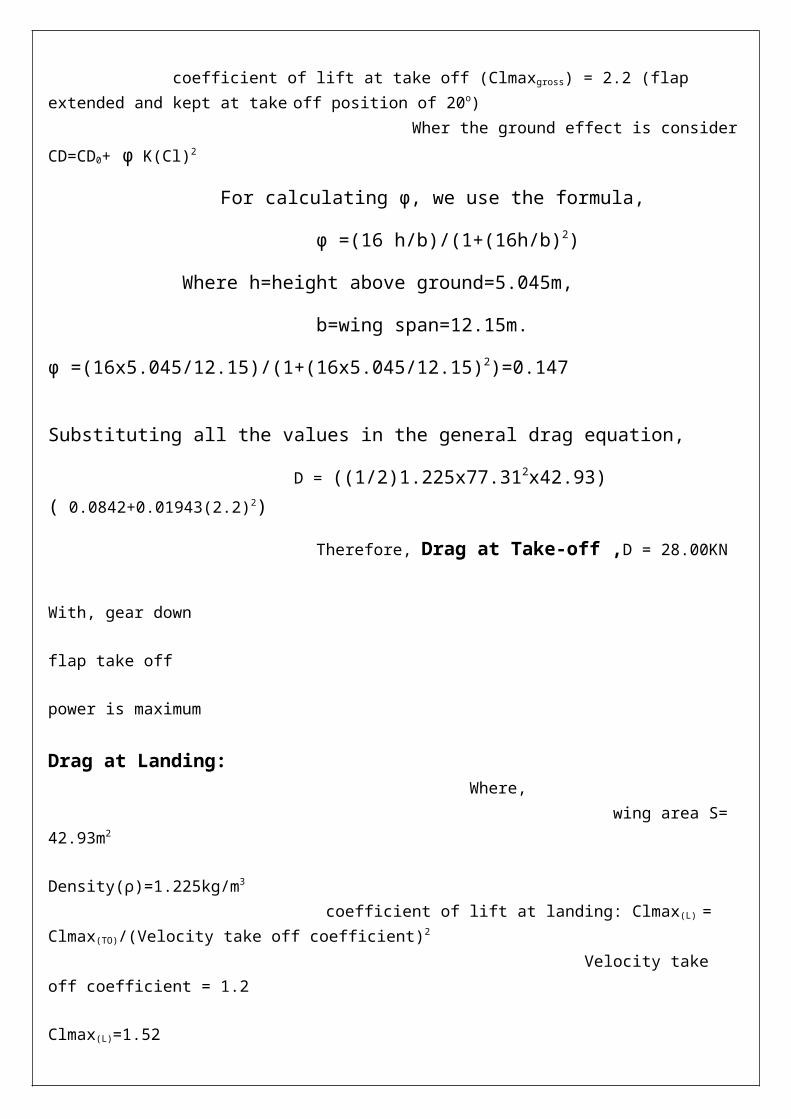
coefficient of lift at take off (Clmaxgross) = 2.2 (flap extended and kept at take off position of 20o)
Wher the ground effect is considerCD=CD0+ φ K(Cl)2
For calculating φ, we use the formula,
φ =(16 h/b)/(1+(16h/b)2)
Where h=height above ground=5.045m,
b=wing span=12.15m.
φ =(16x5.045/12.15)/(1+(16x5.045/12.15)2)=0.147
Substituting all the values in the general drag equation,
D = ((1/2)1.225x77.312x42.93)( 0.0842+0.01943(2.2)2)
Therefore, Drag at Take-off ,D = 28.00KN
With, gear down flap take off power is maximum
Drag at Landing: Where, wing area S= 42.93m2
Density(⍴)=1.225kg/m3 coefficient of lift at landing: Clmax(L) = Clmax(TO)/(Velocity take off coefficient)2
Velocity take off coefficient = 1.2
Clmax(L)=1.52

Velocity at landing(VL)= {(W/S)L/(0.5*⍴* Clmax(L))}0.5
Where (W/S)L= 6845.11 kg/m3
VL=85.75m/s Therefore, Substituting all the values in the general drag equation,
D = ((1/2)1.225x85.752x42.93)(0.0842+0.132(1.52)2)
Drag at Landing, D=75.24 KN With, gear up
flap landing
power is minimum
CRUISING FLIGHT PERFORMANCE:
CALCULATION OF VELOCITY AT MINIMUM THRUST REQUIRED:
VTR(min)= {(2/ ⍴)(k/ CD0)0.5(W/S)}0.5
Where ⍴= 0.144kg/m3
CD0=0.0842
W/S=4322.46N/m3
W/S=440.61Kg/ m3 (at max lift condition) K=0.132 VTR(min) = {(2/ 0.144)(0.132/ 0.0842)0.5(440.16)}0.5
VTR(min)= (7654.38)0.5
VTR(min)=87.48m/sCALCULATION OF MAX LIFT TO DRAG RATIO (L/D)max: (L/D)max={1/(4* CD0*K)}0.5
(L/D)max={1/(4* 0.0842*0.132)}0.5
(L/D)max= 4.74CALCULATION OF VELOCITY AT MAX LIFT TO DRAG RATIO V(L/D)max: V(L/D)max= VTR(min)
Therefore V(L/D)max=87.48m/sTHRUST REQUIRED MINIMUM(TR)min:

(TR)min =W0/(L/D)max whrer, W0=18920kg (TR)min= 39.15 KNPOWER REQUIRED MINIMUM(Pr): for level unaccelerated flight power = Energy/time =force*(distance/time) =F*V Pr=TRmin*V Where V = 568.91m/s TRmin= 39.15 KN Pr=39.15*568.91 Pr= 22.27 MN m/s
THRUST AVILABLE: TA=135.39KN (from engine selection)
POWER AVAILABLE PA: PA = TA*V Where TA=135.49KN , V=568.91 PA = 135.49*103
*568.91 PA = 77.08MN m/s
MAX RATE OF CLIMB (R/C)max:
(R/C)max={(W/S)Z/3*⍴*CD0}0.5{T/W}3/2{1-(Z/6)-(3/(2*(T/W)2(L/D)2Z))} Where, z=1+{1+[3/(L/D)2
max(T/W)2]}0.5
(L/D)max= 4.7 T/W = 0.73 ⍴=1.225Kg/m3
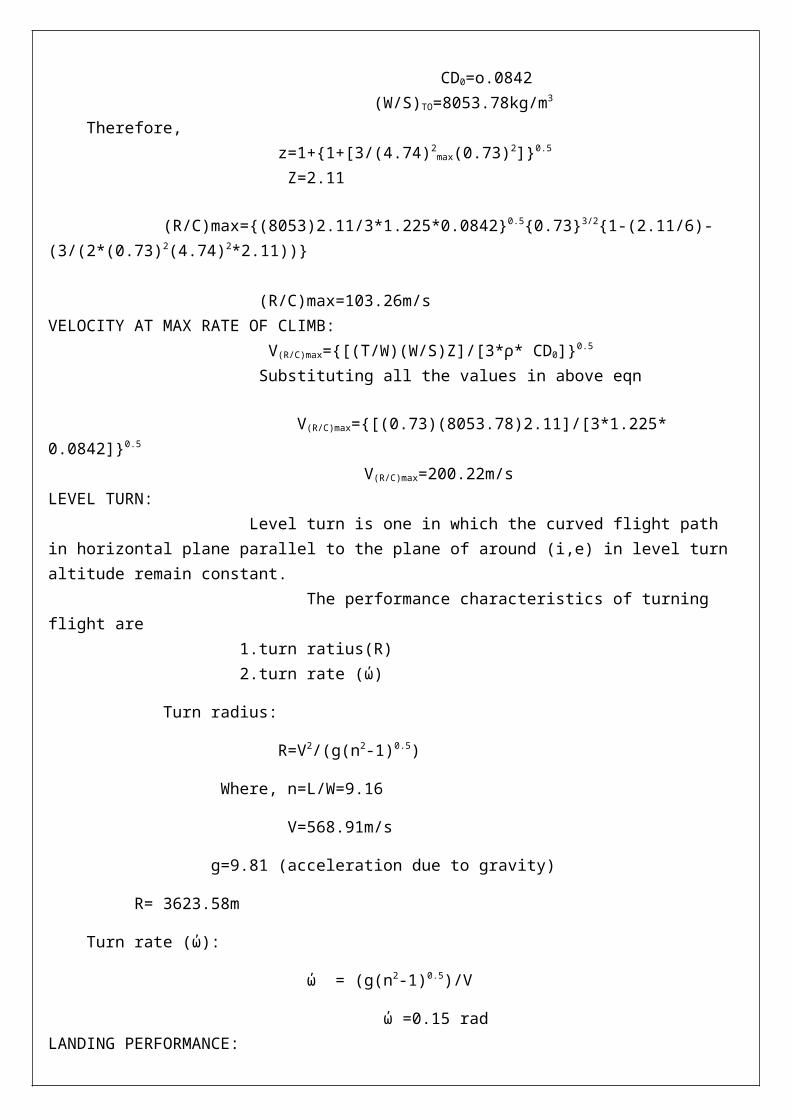
CD0=o.0842 (W/S)TO=8053.78kg/m3
Therefore, z=1+{1+[3/(4.74)2
max(0.73)2]}0.5
Z=2.11 (R/C)max={(8053)2.11/3*1.225*0.0842}0.5{0.73}3/2{1-(2.11/6)-(3/(2*(0.73)2(4.74)2*2.11))}
(R/C)max=103.26m/sVELOCITY AT MAX RATE OF CLIMB: V(R/C)max={[(T/W)(W/S)Z]/[3*⍴* CD0]}0.5
Substituting all the values in above eqn V(R/C)max={[(0.73)(8053.78)2.11]/[3*1.225* 0.0842]}0.5
V(R/C)max=200.22m/sLEVEL TURN: Level turn is one in which the curved flight path in horizontal plane parallel to the plane of around (i,e) in level turn altitude remain constant. The performance characteristics of turning flight are
1.turn ratius(R)2.turn rate (ώ)
Turn radius:
R=V2/(g(n2-1)0.5)
Where, n=L/W=9.16
V=568.91m/s
g=9.81 (acceleration due to gravity)
R= 3623.58m
Turn rate (ώ):
ώ = (g(n2-1)0.5)/V
ώ =0.15 radLANDING PERFORMANCE:
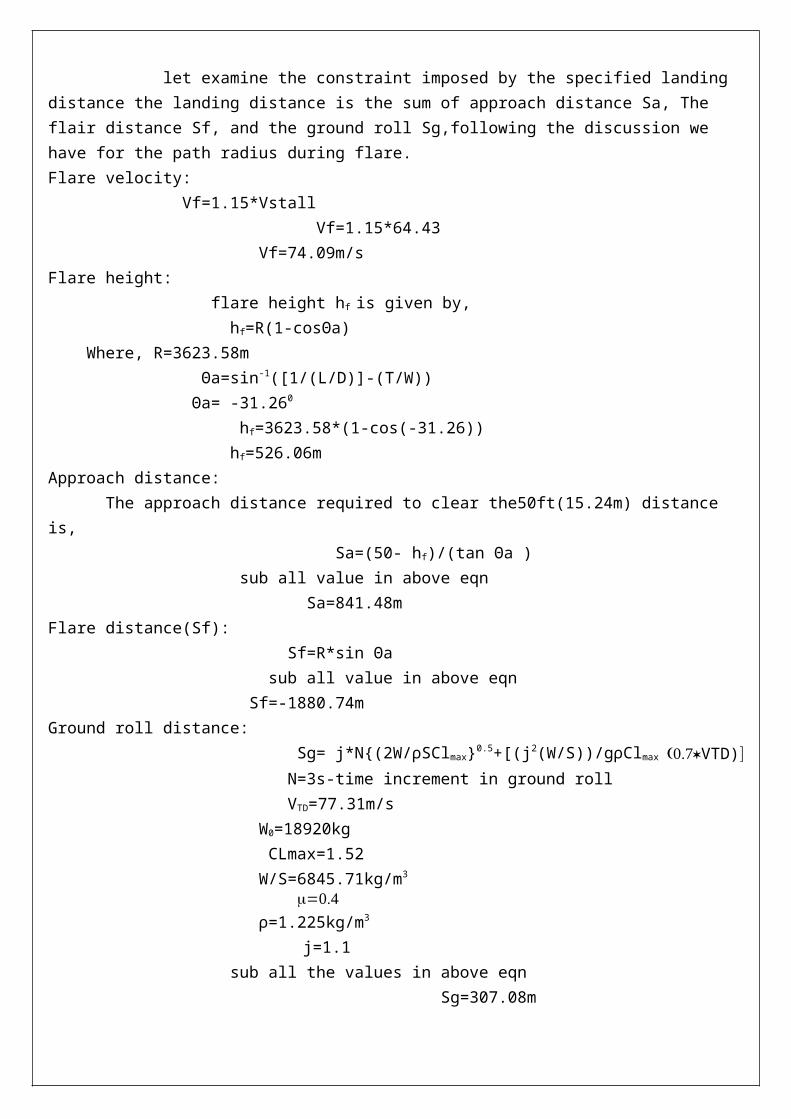
let examine the constraint imposed by the specified landing distance the landing distance is the sum of approach distance Sa, The flair distance Sf, and the ground roll Sg,following the discussion we have for the path radius during flare.Flare velocity: Vf=1.15*Vstall Vf=1.15*64.43 Vf=74.09m/sFlare height: flare height hf is given by, hf=R(1-cosϴa) Where, R=3623.58m ϴa=sin-1([1/(L/D)]-(T/W)) ϴa= -31.260
hf=3623.58*(1-cos(-31.26)) hf=526.06mApproach distance: The approach distance required to clear the50ft(15.24m) distance is, Sa=(50- hf)/(tan ϴa ) sub all value in above eqn Sa=841.48mFlare distance(Sf): Sf=R*sin ϴa sub all value in above eqn Sf=-1880.74mGround roll distance: Sg= j*N{(2W/⍴SClmax}0.5+[(j2(W/S))/g⍴ClmaxVTD) N=3s-time increment in ground roll VTD=77.31m/s W0=18920kg CLmax=1.52 W/S=6845.71kg/m3
⍴=1.225kg/m3
j=1.1 sub all the values in above eqn Sg=307.08m

The total landing distance Ld=Sa+Sg+Sf Ld = 307-1880+841.48 Ld=-732.18m [negative sign indicate the direction of landing(fighter-return)] Ld=732.18m
PERFORMANCE CURVES: 1.Velocity Vs Thrust required 2.Velocity Vs power required 3.Velocity Vs rate of climb 4.Velocity Vs L/D ratio 5.Cl Vs Cd 6.Velocity Vs Thrust available 7.Velocity Vs power available 8.Velocity Vs Cl 9.Velocity Vs Cd VELOCITY Vs THRUST AVIALABLE: V = 568.91m/s Vs TA=135.49KN
VELOCITY (m/s)
THRUST AVAILABLE(KN)
56.891 135.4 113.787 121.86 170.673 108.32 277.564 94.78 284.455 81.24 341.346 67.70 398.232 54.169 455.128 40.629 512.09 27.09 568.91 13.549

0 100 200 300 400 500 600050100150
Velocity Vs Thrust available
velocity (m/s)Thru
st a
vailab
le (
KN)
VELOCITY VS THRUST REQUIRED: V = 568.91m/s Vs TR=39.15KN
VELOCITY (m/s)
THRUST REQUIRED (KN)
56.891 3.915 113.787 7.83 170.673 11.745 277.564 15.66 284.455 19.575 341.346 23.49 398.232 27.405 455.128 31.32 512.09 35.23 568.91 39.15

0 100 200 300 400 500 6000
100
200
Velocity Vs Thrust required
velocity (m/s)Th
rust r
equi
red
(KN)
VELOCITY Vs POWER AVIALABLE: V = 568.91m/s Vs PA=77.08(MN)m/s
VELOCITY (m/s)
POWER AVIALABLE (MN)m/s
56.891 77.08 113.787 69.372 170.673 61.664 277.564 53.956 284.455 46.248 341.346 38.54 398.232 30.832 455.128 23.124 512.09 15.416 568.91 7.708
0 100 200 300 400 500 6000
100
200
Velocity Vs power available
velocity (m/s)
powe
r av
ialabl
e (MN)
m/s
VELOCITY Vs POWER REQUIRED V = 568.91m/s Vs PR=22.27 (MN)m/s
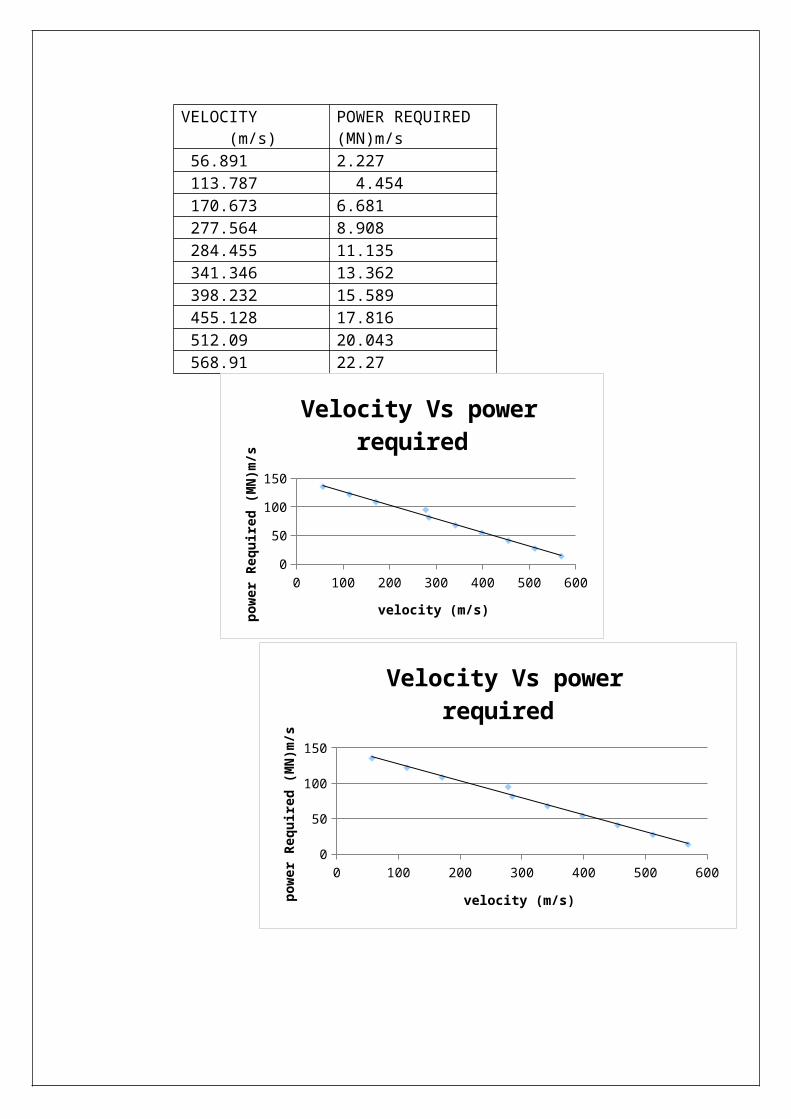
VELOCITY (m/s)
POWER REQUIRED (MN)m/s
56.891 2.227 113.787 4.454 170.673 6.681 277.564 8.908 284.455 11.135 341.346 13.362 398.232 15.589 455.128 17.816 512.09 20.043 568.91 22.27
0 100 200 300 400 500 6000
50
100
150
Velocity Vs power required
velocity (m/s)powe
r Re
quired
(MN)m
/s
0 100 200 300 400 500 6000
50
100
150
Velocity Vs power required
velocity (m/s)powe
r Re
quir
ed (
MN)m/s
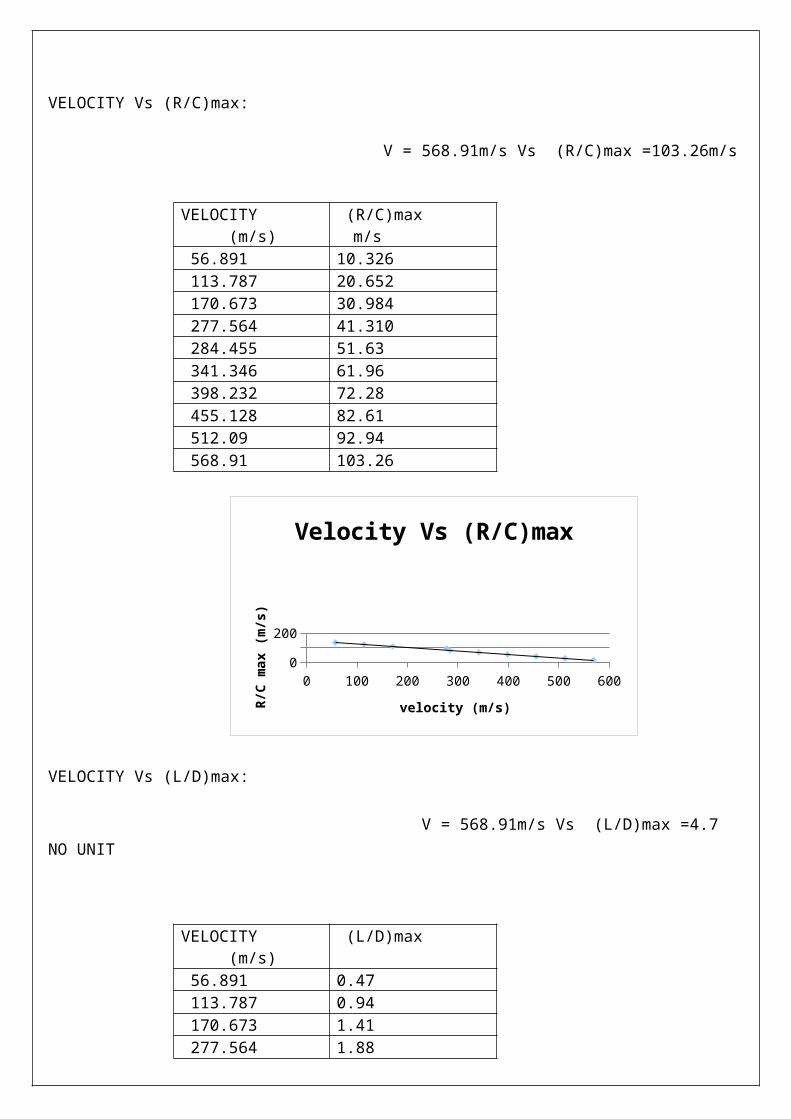
VELOCITY Vs (R/C)max: V = 568.91m/s Vs (R/C)max =103.26m/s
VELOCITY (m/s)
(R/C)max m/s
56.891 10.326 113.787 20.652 170.673 30.984 277.564 41.310 284.455 51.63 341.346 61.96 398.232 72.28 455.128 82.61 512.09 92.94 568.91 103.26
0 100 200 300 400 500 6000
200
Velocity Vs (R/C)max
velocity (m/s)R/C
max
(m/s)
VELOCITY Vs (L/D)max: V = 568.91m/s Vs (L/D)max =4.7 NO UNIT
VELOCITY (m/s)
(L/D)max
56.891 0.47 113.787 0.94 170.673 1.41 277.564 1.88

284.455 2.34 341.346 2.82 398.232 3.29 455.128 3.76 512.09 4.23 568.91 4.7
0 100 200 300 400 500 6000
100
200
Velocity Vs (L/D)max
velocity (m/s)
L/D
max
COEFFICIENT OF LIFT VS DRAG [CL Vs CD]max: CL=1.7 Vs CD=0.46
CL CD 0.34 0.093 0.88 0.18 1.02 0.27 1.36 0.37 1.7 0.46
0 100 200 300 400 500 6000
5
(CL)Vs (CD) max
CLmax
(CD)max
VELOCITY Vs CLmax:
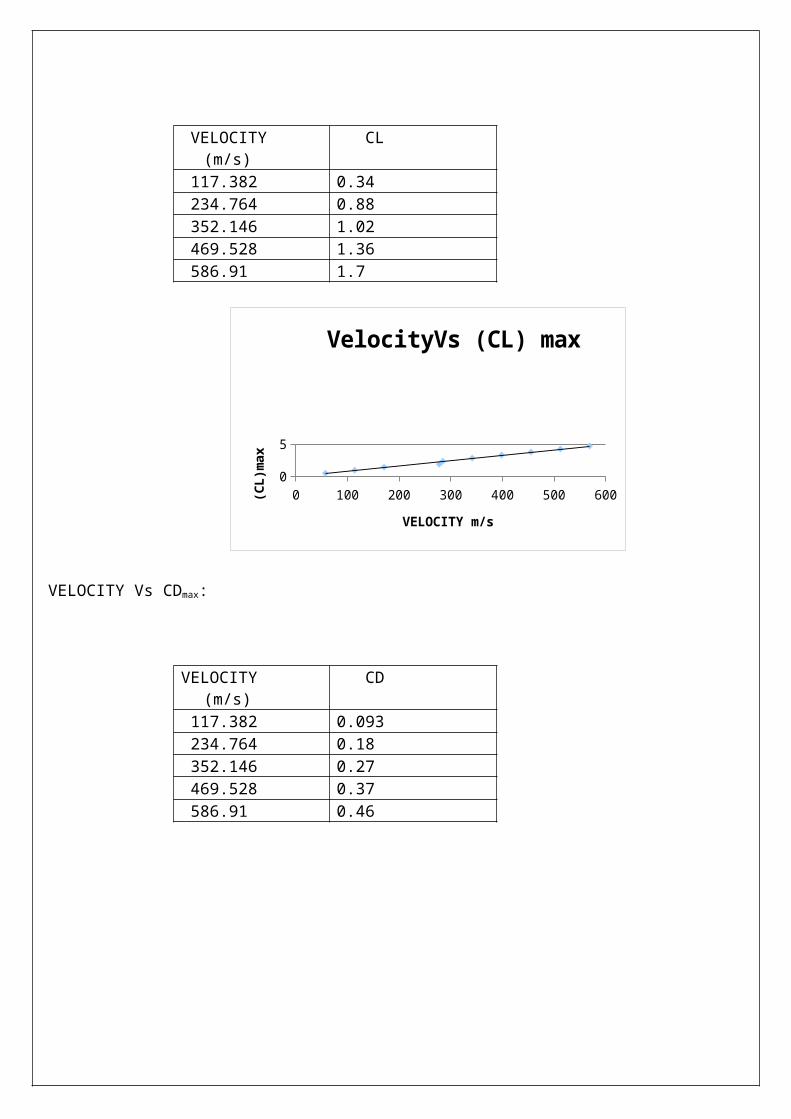
VELOCITY (m/s)
CL
117.382 0.34 234.764 0.88 352.146 1.02 469.528 1.36 586.91 1.7
0 100 200 300 400 500 6000
5
VelocityVs (CL) max
VELOCITY m/s
(CL)max
VELOCITY Vs CDmax:
VELOCITY (m/s)
CD
117.382 0.093 234.764 0.18 352.146 0.27 469.528 0.37 586.91 0.46

0 100 200 300 400 500 6000246
VelocityVs (CD) max
VELOCITY m/s
(CD)max
CENTRA OF GRAVITY CALCULATION:
The c.g. calculation of an aircraft is very important. This c.g. must be properly located so that the airplane will be stable during its operation over different loading schedules. Initially for fully loaded condition, the c.g. of the individual component in the fuselage and the wing is found out. From that the c.g. of the fuselage and the wings are estimated. The c.g. of the aircraft is generally fixed at 0.3c by adjusting the location of the wing on the fuselage. After fixing the wing the c.g. is calculated for different configurations. The c.g. calculation is done to see how much the c.g. shifts either forward or backward. The allowable shifts are only ±5% over the basic value of 30% mach.
The length of fighter L=17.67m
S.No Components Weight (W)
Arm(X) Moment(WX)
1
2
3
4
Crew
Fuel
Armmaments
Engine
1785.42
56980.79
39240
63000
1.7
8.23
11
8.23
3035.214
468951.90
431640
518490

161006.21 1422117.11
4
Using the above tabulation values, we obtain the location of the centre of gravity of the fuselage section from the nose of the airplane
WX/W=8.835m∑
Centre of Gravity is 8.835m
Copyright © 2022 FDOKUMEN