Oil-Based Mud Cuttings as Additional Raw Material in Clinker ...
212
School of Civil Engineering Faculty of Engineering Final Thesis Submitted in partial fulfilment of the requirements for a degree of Doctor of Philosophy Oil-Based Mud Cuttings as Additional Raw Material in Clinker and Cement Production by Hilal Saif Rashid Al Dhamri October 2019
-
Upload
khangminh22 -
Category
Documents
-
view
2 -
download
0
Transcript of Oil-Based Mud Cuttings as Additional Raw Material in Clinker ...

School of Civil Engineering Faculty of Engineering
Final Thesis Submitted in partial fulfilment of the requirements for a degree of
Doctor of Philosophy
Oil-Based Mud Cuttings as Additional Raw Material in Clinker and Cement Production
by
Hilal Saif Rashid Al Dhamri
October 2019

i
Hilal Saif Al Dhamri 200676958
This copy has been supplied on the understanding that it is copyright material and that no quotation from the thesis may be published without proper acknowledgment. © 2019 The University of Leeds Hilal Saif Al Dhamri The right of Hilal Saif Al Dhamri to be identified as Author of this work has been asserted by his in accordance with Copyright, Designs and Patents Act 1988.

ii
Hilal Saif Al Dhamri 200676958
Publication Statements
The candidate confirms that the work submitted is his own, except where work which has
formed part of jointly-authored publications has been included. The contribution of the
candidate and other authors to this work has been explicitly indicated below. The candidate
confirms that appropriate credit has been given within the thesis where reference has been
made to the work of others. Part of the work has been published in the following journals and
proceedings of conferences:
i. H. Al Dhamri et al (2020) published
Hilal Al-Dhamri, Sabah A. Abdul-Wahab, Costas Velis, Leon Black
“Oil-Based Mud Cutting as an Additional Raw Material in Clinker Production”,
Journal of Hazardous Materials, Volume 384, 121022, 2020
Doi.org/10.1016/j.jhazmat.2019.121022
ii. S. Abdul-Wahab et al (2020) published
Sabah A. Abdul-Wahab, Hilal Al-Dhamri, Ganesh Ram, Leon Black
“The use of oil-based mud cuttings as an alternative raw material to produce high
sulfate-resistant oil well cement”,
Journal of Cleaner Production, available on line 25 May 2020, 269, 122207.
Doi.org/10.1016/j.jclepro.2020.122207
iii. H. Al Dhamri et al (2019) published
Hilal Al-Dhamri, Sabah A. Abdul-Wahab, Ganesh Ram, Abdulaziz Al-Moqbali, Leon
Black
“Microstructure of Clinker prepared using different ratio of OBM cutting as raw material”
Proceedings of the 15th International Congress of the Chemistry of Cement, Prague
September 2019.

iii
Hilal Saif Al Dhamri 200676958
iv. H. Al-Dhamri et al (2015) published
Hilal Al-Dhamri, Leon Black, Sabah A. Abdul-Wahab,
“Oil-Based Mud Cutting as an Additional Raw Materials in Clinker Production: The
Impact on Phase Composition”,
Proceedings of the 14th International Congress of the Chemistry of Cement, Beijing
2015.
v. Al-Dhamri and L. Black (2014) published
H. Saif Al-Dhamri and Leon Black
“Use of Oil-Based Mud Cutting Waste in Cement Clinker Manufacturing”
In: Bernal, SA and Provis, JL, (eds.) 34th Cement and Concrete Science Conference.
34th Cement and Concrete Science Conference, 14-17 Sep 2014, Sheffield, UK. , pp.
427-430, 2014.

iv
Hilal Saif Al Dhamri 200676958
Acknowledgements
First of all, I am grateful to Allah, who granted me the ability, patience and strength to
accomplish this research, which contributes to completing my PhD degree.
I would like to express my deep appreciation and gratitude to my supervisor, Prof.
Leon Black, for his guidance, assistance and supervision. His continuous support,
help and valuable suggestions have helped lead to the successful completion of this
thesis.
As local supervisor, I would like to express my gratitude to, Prof. Sabah Abdul-Wahab
from Sultan Qaboos University, for her guidance and supervision.
Special thanks are extended to Oman Cement Company for providing a fund to further
my postgraduate at the University of Leeds. Without the generous supply of raw
materials, and use the company laboratory facilities, this research project would have
been very difficult to accomplish. I would also like to thank Petroleum Development
Oman (PDO) and The Research Council (TRC) for supporting and facilitating aspects
of the research and organising site visits.
It gives me great pleasure to thank my family, including my father and mother, my 13
brothers and sisters, and my lovely children (Ayah, Ala’a, Rashid and Talyah). A
special thanks go to my lovely wife, Mrs. Nehad Al-Harthi who has believed in me and
stood by me throughout my doctoral studies.
v
Hilal Saif Al Dhamri 200676958
Abstract
Oil-based mud (OBM) cuttings are a waste generated during the process of oil well
drilling. The drilled rocks are removed from deep within the drilled well and pumped to
the surface. These ‘cuttings’ are a mixture of rocks, mud, water, and oil. Most drilling
companies store this waste in open yards without specific treatment. The
environmental regulations in Oman specify that cutting storage should involve isolation
to prevent contamination of the surface and underground water. This has made OBM
cutting waste an environmental problem with an associated cost for oil companies.
OBM cuttings, being rich in calcium oxide, silicon oxide, and aluminum oxide, may be
a suitable raw material in cement manufacture. Furthermore, the oil content may help
to reduce fuel use during the calcination and clinkerisation process. In this research,
OBM cutting waste was analysed and used as a constituent of raw meal in cement
clinker production. Raw meal mixtures were prepared with increasing OBM content.
The impact of adding OBM to the resultant clinker was investigated using analytical
techniques such as XRF, XRD, SEM-EDX, and DSC-TGA, and burnability test.
OBM cuttings contain dolomite, which increases the rate of carbonate dissociation
and, hence, contributes to lowering the calcination temperature. However, it also leads
to a higher free lime content in the resultant clinker, which is a result of the presence
of trace elements, such as barium. Clinker can be prepared by simply heating OBM
cuttings at 1200 oC without any additives, with the resulting clinker containing belite
and a very low free lime content and no alite. Clinker prepared using 12% and 55%
OBM cuttings had very similar microstructures, chemical composition and properties
to clinker prepared from the limestone normally used in cement production. However,
the addition of OBM cutting to the raw meal led to acceptable higher free lime content
in the resultant clinker. There are many reasons for this, including the role of trace
elements, especially barium, in destabilizing alite, as demonstrated in this study.
The hydration behaviour of the prepared cement was studied by many techniques
such as ICC, STA and mechanical properties. XRD plus SEM-EDX analysis of
polished cross-sections enabled study of the major hydrate phases. SEM and optical
microscopy of the clinker was undertaken to understand if there were any significant
changes to the main phases which may influence the cement hydration behaviour.
The degree of hydration was obtained and the main hydrated products such as C-S-
H and CH were identified. Hydration behaviour was normal with no significant changes
observed and no significant differences between the reference sample and industrial
cement. Thus, OBM cuttings could be used in the manufacture of Portland cement
clinker, providing a cost-effective, environmentally-friendly way to manage OBM
cuttings derived from the oil drilling sector.

vi
Hilal Saif Al Dhamri 200676958
Table of content
Chapter 1: Introduction ................................................................................................................ 1
Chapter 2: Literature Review ........................................................................................................ 5
2.1 Industrial Hazardous waste in Oman ...................................................................................... 5
2.2 OBM waste generated from Oil Drilling Process .................................................................... 7
2.3 Shifting from WBM to OBM in Oman ................................................................................... 16
2.4 Waste as raw materials for clinker production ..................................................................... 16
Chapter 3: Description of the problem ........................................................................................ 22
3.1 The impact of OBM cutting generated in Oman ................................................................... 22
3.1.1 Economic impact ........................................................................................................... 22
3.1.2 Environmental impact ................................................................................................... 23
3.2 Possible solutions for disposal of OBM cutting in cement industries ................................... 24
3.3 Use of OBM cuttings as raw materials in clinker manufacturing .......................................... 25
3.4 Chemistry of the cement manufacturing process ................................................................ 30
3.5 Common cement types used in Oman .................................................................................. 34
3.5.1 Ordinary Portland cement (OPC) and sulfate-resisting cement (SRC) .......................... 34
3.5.2 Oil Well Cement (OWC) ................................................................................................. 34
Chapter 4: Materials and methods ............................................................................................. 36
4.1 Overview of experimental programme ................................................................................ 36
4.2 Raw materials ........................................................................................................................ 38
4.2.1 Limestone (Ls) ............................................................................................................... 38
4.2.2 Quartzo-phillite (QPh) ................................................................................................... 39
4.2.3 Iron ore and kaolin ........................................................................................................ 39
4.2.4 Oil-Based Mud cuttings ................................................................................................. 39
4.3 Mix design and samples preparation .................................................................................... 41
4.3.1 Mix design ..................................................................................................................... 41
4.3.2 Raw meal samples (Rm) ................................................................................................ 45
4.3.3 Clinker samples (Ck) ...................................................................................................... 46
Publication statements ………………………………………………………………...………..... ii
Acknowledgements ………..………………………………………………………….…….…..... iv
Abstract …………………………………………………………………………………………..... v
Table of contents …………………………………………………………………….………….... vi
List of figures …………………………………………………………………………………........ xi
List of tables …………………..…………………………………………………...…………….... xii
List appendices ………………………………………………………..…………….………....... xiii
List of abbreviations ………………………………………………………………………..….... xiv

vii
Hilal Saif Al Dhamri 200676958
4.3.4 Cement samples (Cm) ................................................................................................... 48
4.3.5 Hydrated cement samples (HCm) ................................................................................. 49
4.4 Characterization and testing techniques .............................................................................. 51
4.4.1 XRF and XRD .................................................................................................................. 51
4.4.2 Loss on ignition (LOI) and Free lime test ....................................................................... 51
4.4.3 Inductively Coupled Plasma (ICP-OES) .......................................................................... 52
4.4.4 SEM-EDX ........................................................................................................................ 52
4.4.5 DSC-TGA ........................................................................................................................ 53
4.4.6 Burnability test .............................................................................................................. 53
4.4.7 Petrographic analysis .................................................................................................... 54
4.4.8 Degree of hydration (DoH) ............................................................................................ 54
4.4.9 Physical and mechanical testing ................................................................................... 55
4.4.10 Isothermal Conduction Calorimetry .............................................................................. 57
Chapter 5: Characterisation of OBM and OBM cuttings ............................................................... 59
5.1 What is in OBM? ................................................................................................................... 59
5.2 What is in OBM cuttings? ...................................................................................................... 61
Chapter 6: The effect of OBM cuttings on the clinkerisation process ............................................ 67
6.1 Clinker phase formation ........................................................................................................ 67
6.2 CaCO3 decomposition ........................................................................................................... 70
6.3 Burnability ............................................................................................................................. 75
6.4 The XRD and TGA .................................................................................................................. 84
6.5 The Effect of Barium on Clinkerization ................................................................................. 87
6.6 Clinker morphology ............................................................................................................... 88
6.7 Petrography Study of the Clinker .......................................................................................... 94
Chapter 7: The effect of OBM cutting on cement properties and hydration .................................. 99
7.1 Physical and mechanical properties...................................................................................... 99
7.2 Hydration and microstructure ............................................................................................ 107
7.3 Thermal Analysis (STA) ........................................................................................................ 116
7.4 Heat of hydration by ICC ..................................................................................................... 119
7.5 Degree of hydration (DoH) .................................................................................................. 123
Chapter 8: Impact of using OBM cutting in cement industry ...................................................... 126
8.1 Recycling in non-cement industry ....................................................................................... 126
8.2 Oman Cement Company case ............................................................................................. 131
8.3 Impact of introducing OBM cutting to Oman Cement Company as additional raw material 134
Chapter 9 Summary discussion ................................................................................................ 137
9.1 Introduction ........................................................................................................................ 137
9.2 OBM cutting ........................................................................................................................ 137

viii
Hilal Saif Al Dhamri 200676958
9.3 The effect of OBM cutting on the clinkerization process ................................................... 138
9.4 The effect of OBM cutting on the cement properties and hydration ................................. 140
9.5 Impact of using OBM cutting in cement industries ............................................................ 143
Chapter 10: Conclusions and further work ................................................................................ 146
10.1 Conclusions ......................................................................................................................... 146
10.2 Further work ....................................................................................................................... 147
Appendices .............................................................................................................................. 160

ix
Hilal Saif Al Dhamri 200676958
List of Figures
List of Figures Figure 1 Industrial hazardous waste generation in Oman. ................................................... 6
Figure 2 The major functions of OBM during the oil-drilling process37................................... 7
Figure 3 Schematic diagram of an oil well drilling operation. ................................................ 8
Figure 4 Crude oil production in Oman from 1980 to 2018 ................................................. 16
Figure 5 CO2 emission concentrations calculated by atmospheric modelling7. ................... 20
Figure 6 CO2 emissions from energy consumption in Oman55,56 ........................................ 23
Figure 7 Gross natural gas production in Oman55,56 ............................................................ 24
Figure 8 A schematic of the OBM and OBM cutting disposal cycle as raw material in
cement manufacturing74 ...................................................................................................... 27
Figure 9 Storage sites for OBM cuttings. ........................................................................... 29
Figure 10 Cement manufacturing process .......................................................................... 31
Figure 11 Estimated clinker chemical reactions91,92 ............................................................ 33
Figure 12 A schematic diagram showing the overall stages of sample preparation and
the testing methods used at each stage. ............................................................................. 37
Figure 13 Diagram illustrating the sampling points (black points) for the raw materials
obtained from the cement industry ...................................................................................... 38
Figure 14 The oil well drilling operation diagram ................................................................ 40
Figure 15 The mix design program in MS Excel sheet ........................................................ 43
Figure 16 Theoretical C3S and C2S contents as a function of OBM cuttings content in
raw meal. ............................................................................................................................ 44
Figure 17 The preparation steps of the Portland clinker and Portland cement in the
laboratory ............................................................................................................................ 47
Figure 18 Hydrated cement samples and isopropanol hydration stopping .......................... 50
Figure 19 SEM Micrograph of hydrated cement. ................................................................ 55
Figure 20 Overview of the calorimeter setup ...................................................................... 57
Figure 21 Schematic mineral structure of clay .................................................................... 60
Figure 22 X-ray diffraction pattern of OBM cutting .............................................................. 62
Figure 23 The chemical composition (major oxides) of OBM cuttings ................................. 65
Figure 24 The trace and heavy elements content of OBM cutting....................................... 65
Figure 25 XRD patterns of the prepared clinkers. .............................................................. 67
Figure 26 Clinker phase contents derived from Rietveld analysis and Bogue
calculations. ........................................................................................................................ 68
Figure 27 Limestone and OBM cutting petrography analysis ............................................. 72

x
Hilal Saif Al Dhamri 200676958
Figure 28 Particle-size distribution (top) and decomposition temperature (below) of
fine-limestone, limestone, and OBM cutting. ....................................................................... 74
Figure 29 Activation energy values of CaCO3 decomposition reactions in limestone
and OBM cutting. ................................................................................................................ 75
Figure 30 The burnability tests of the raw meal at different burning temperatures. ............. 77
Figure 31 XRD pattern of the different raw meal samples burned at different
temperatures. ...................................................................................................................... 78
Figure 32 100% OBM cuttings clinker. .............................................................................. 78
Figure 33 The SEM analysis of RmRef burned at four different temperatures. ..................... 79
Figure 34 The SEM analysis of Rm-12 burned at four different temperatures..................... 80
Figure 35 The SEM analysis of Rm-55 burned at four different temperatures..................... 81
Figure 36 EDX analysis for RmInd showing clinker microstructure development with
increasing temperature. ...................................................................................................... 82
Figure 37 EDX analysis for RmRef showing clinker microstructure development with
increasing temperature. ...................................................................................................... 82
Figure 38 EDX analysis for Rm-12 showing clinker microstructure development with
increasing temperature. ...................................................................................................... 83
Figure 39 EDX analysis for Rm-55 showing clinker microstructure development with
increasing temperature. ...................................................................................................... 83
Figure 40 EDX analysis for Rm-100 showing clinker microstructure development with
increasing temperature. ...................................................................................................... 84
Figure 41 Temperatures of calcite decomposition and major phase formation with
increasing OBM cuttings content. ........................................................................................ 85
Figure 42 Minor oxide contents in prepared raw meal ........................................................ 86
Figure 43 The free lime content for each clinker sample .................................................... 88
Figure 44 SEM-EDX microstructural analysis of clinker samples burned at 1180 oC. ......... 90
Figure 45 SEM-EDX microstructural analysis of clinker samples burned from 100%
OBM. .................................................................................................................................. 91
Figure 46 XRD of OBM cutting when heated to different temperatures............................... 92
Figure 47 SEM-EDX microstructural analysis of clinker samples prepared by adding
12% and 55% OBM cutting. ................................................................................................ 93
Figure 48 Photomicrographs of clinker CkRef. ..................................................................... 95
Figure 49 Photomicrographs of clinker Ck12 ..................................................................... 96
Figure 50 Photomicrographs of clinker Ck55 ..................................................................... 97
Figure 51 SEM images and EDS spectra of clinker samples containing 30% (a, b & d)
and 55% (d, e & f) OBM cuttings. ...................................................................................... 103
Figure 52 Compressive strength development over time of the prepared cement. ........... 105

xi
Hilal Saif Al Dhamri 200676958
Figure 53 Blaine fineness vs compressive strength. ......................................................... 106
Figure 54 SEM image of CmtInd hydrated for 2, 7 and 28 days ......................................... 109
Figure 55 SEM image of CmtRef hydrated for 2, 7 and 28 days ......................................... 110
Figure 56 SEM image of Cmt12% hydrated for 2, 7 and 28 days ..................................... 111
Figure 57 SEM image of Cmt55% hydrated for 2, 7 and 28 days ..................................... 112
Figure 58 XRD analysis of anhydrous CmInd and up to 28 days. ....................................... 113
Figure 59 SEM and XRD analysis of anhydrous CmRef. and up to 28 days. ..................... 113
Figure 60 SEM and XRD analysis of anhydrous Cm-12% and up to 28 days. .................. 114
Figure 61 SEM and XRD analysis of anhydrous Cm-55% and up to 28 days. .................. 114
Figure 62 XRD Patterns from 8 to14o 2θ showing ettringite formation and the C4AF
peak. ................................................................................................................................. 116
Figure 63 XRD Patterns from 31 to 35o 2θ. ..................................................................... 116
Figure 64 DTA plots from 20 to 950 oC for 2, 7 and 28 day pastes. .................................. 118
Figure 65 An example of different stages of cement hydration based on heat
evolution. .......................................................................................................................... 119
Figure 66 Isothermal Calorimetry results showing rate of heat evolution and total
cumulative heat to 21 days ............................................................................................... 122
Figure 67 Degree of hydration obtained by SEM BSE vs time .......................................... 124
Figure 68 Aero Thermal Dissolution Unit (ATDU) for thermal treatment of OBM
cuttings. ............................................................................................................................ 127
Figure 69 Two types of OBM cuttings collected from storage yard. .................................. 128
Figure 70 Quantities of treated OBM cutting using ATDU and oil recovered29 .................. 130
Figure 71 Main source of emissions from the cement kiln system. ................................... 133
Figure 72 Proposed feeding points of OBM cutting........................................................... 134
Figure 73 Arrangement for feeding OBM cutting at the calciner. ...................................... 134

xii
Hilal Saif Al Dhamri 200676958
List of Tables
Table 1 Pollutant concentration in exhaust gas+ from waste-based clinker62 in mg/Nm3. .... 18
Table 2 Total CO2 emissions from plant sources after the addition of OBM7. ...................... 19
Table 3 Calculation of CO2 emissions from cement-plant sources before and after the
addition of OBM7. ................................................................................................................ 19
Table 4 The chemical composition of limestone, quartzo-phillite, and OBM cuttings71 ........ 25
Table 5 Major chemical phases in clinker and cement ....................................................... 32
Table 6 Chemical composition of the raw materials used in this study. ............................... 45
Table 7 Composition of the raw meal mixes for the preparation of Portland clinkers ........... 46
Table 8 The cement grinding condition ............................................................................... 48
Table 9 OBM cuttings major and minor chemical composition from different sources
(%wt.) ................................................................................................................................. 64
Table 10 OBM cuttings trace & heavy elements analysis (mg/Kg, dry solid) 44,52,54 ............. 64
Table 11 Chemical oxide and clinker phase composition of the prepared clinker ................ 69
Table 12 The effect of calcite grain size on the dissociation of limestone ............................ 73
Table 13 BaO content of each phase in each experimental clinker .................................... 87
Table 14 The granulomteric composition analysis of the prepared clinker ......................... 94
Table 15 Summary for the OPC standards: Oman Standard105, BS EN191 and ASTM192 ... 100
Table 16 Physical test results for the prepared cement ..................................................... 104
Table 17 The main heat results from ICC test. ................................................................. 121
Table 18 Cost calculation for OBM cutting recycling options ............................................. 129
Table 19 The estimated OBM cutting production and the rate of growth ........................... 131

xiii
Hilal Saif Al Dhamri 200676958
List of Appendices
Appendix 1 Percentage mixing of the raw materials for the preparation of raw meal ........ 160
Appendix 2 The clinker prepared chemical analysis and calculated mineral
composition ....................................................................................................................... 161
Appendix 3 Free lime in % (wt./wt.) repeated test of the clinker samples ................................. 162
Appendix 4 Burnability test for raw mix prepared with OBM cutting ................................... 163
Appendix 5 Calculations of activation energy of decomposition of limestone and OBM
cutting ............................................................................................................................... 164
Appendix 6 TGA of OBM cutting and limestone in four different heating rates .................. 165
Appendix 7 Particle size distribution for the cement samples ............................................ 166
Appendix 8 Cement density measurement ........................................................................ 167
Appendix 9 Cement Blaine measurement ......................................................................... 168
Appendix 10 Degree of hydration % (DoH) obtained by SEM BSE .................................... 168
Appendix 11 Compressive strength measurement for the CmInd ....................................... 169
Appendix 12 STA analysis of hydrated cement ................................................................. 170
Appendix 14 The hydration product obtained from STA analysis...................................... 172
Appendix 15 Clinker preparation photos............................................................................ 173
Appendix 16 Raw materials chemical analysis .................................................................. 176
Appendix 17 Agreement between Oman Cement Company and Petroleum
Development Oman Company as a result of this study. .................................................... 181
Appendix 18 Photos for the sit to oil drilling site ................................................................ 182

xiv
Hilal Saif Al Dhamri 200676958
List of Abbreviations Cement Nomenclature
C : CaO S : SiO2 H : H2O F : Fe2O3 A : Al2O3
CH : Ca(OH)2 (Portlandite) C-S-H : Calcium silicate hydrate
AFt : Alumina Ferric oxide tri-sulfate (Ettringite) AFm : Alumina Ferric oxide mono-sulfate
Clinker Phases and Hydrates
Alite (Tricalcium silicate) : 3CaO.SiO2 / Ca3SiO5 / C3S Alumina ferric oxide mono-sulfate : CaO.Al2O3.CaSO4.12H2O / C3A.CaSO4.12H2O Alumina Ferric Oxide tri-sulfate : 3CaO.Al2O3.3CaSO4.32H2O / C3A.3CaSO4.32H2O Aluminate (Tricalcium aluminate) : 3CaO.Al2O3 / Ca3Al2O6 / C3A Belite (Dicalcium silicate) : 2CaO.SiO2 / Ca2SiO4 / C2S Brucite : Mg(OH)2 Calcium silicate hydrate : CaO-SiO2-H2O Ferrite (Tetracalcium aluminate) : 4CaO.Al2O3.Fe2O3 / C4AF Gypsum (calcium sulfate dihydrate) : CaSO4.2H2O / CaH4O6S Periclase : MgO Portlandite : Ca(OH)2
Testing Techniques
BSE : Back Scattered Electron DoH : Degree of hydration DTA : Differential Thermal Analysis EDX : Energy Dispersive X-Ray Spectroscopy ICC : Isothermal Conduction Calorimetry ICP : Inductively coupled plasma LOI : Loss on ignition SEM : Scanning Electron Microscopy STA : Simultaneous Thermal Analysis TGA : Thermogravimetric analysis XRD : X-Ray Diffraction XRF : X-Ray Fluorescence

xv
Hilal Saif Al Dhamri 200676958
Elements and compounds Al2O3 : Aluminium oxide As : Arsenic CaO : Calcium oxide Cd : Cadmium Cl : Chloride CO : Carbon monoxide Co : Cobalt CO2 : Carbon dioxide Cr : Chromium Cu : Copper Fe2O3 : Iron oxide Hg : Mercury K2O : Potassium oxide Na2O : Sodium oxide Ni : Nickel NOx : Nitrogen oxide P2O5 : Phosphorous pentoxide Pb : Lead Sb : Antimony Se : Selenium SiO2 : Silicate Sn : Tin SO2 : Sulfur dioxide SO3 : Sulfite TiO2 : Titanium dioxide V : Vanadium

xvi
Hilal Saif Al Dhamri 200676958
Other abbreviations
µm : micrometre AM : Alumina module API : American Petroleum Institute ASTM : American Society for Testing and Materials BS : British Standards Ck : Clinker Cm : Cement cm : Centimetre EN : European Norms (European Standards) g : Gram (unit for mass) GCC : Gulf Cooperation Council GHG : Greenhouse gas GPA : Gross Domestic Product H/C : Hydrocarbon HCm : Hydrated cement hr : Hour IR : Insoluble Residue Kg : Kilogram KL : Kaolin LC50 : Lethal concentration 50 Ls. : Limestone LSF : Lime Saturation Factor max : Maximum min : Minimum mint : minute mL : Millilitre mm : Millimetre mmBtu : million British Thermal Units MPa : Mega Pascal (unit for pressure) N : Newton OBM : Oil-Based Mud OS : Omani Standard QPh : Quartzo-phillite RM : Raw meal RPM : Revolutions per minute SM : Silica module T : Tonne (long tonne) TOC : Total Organic Compounds TSP : Total Suspended Particulate (in exhaust gas) USD : Untied State Dollar (currency) w/c : Water to cement ratio WEEE : Waste Electrical and Electronic Equipment Wt./wt. : Weight / weight as concentration

Chapter 1
Introduction

1
Hilal Saif Al Dhamri 200676958
1 Chapter 1: Introduction
Worldwide cement production was 4.1 billion tonnes in 2017 rising from 1.5 billion
tonnes 20 years earlier1,2. The vast majority of this cement is produced in Asia,
specifically China followed by India, with this region accounting for over 80% of global
production. Furthermore, growth is predicted rise by at least 4% in 20193.
Gulf Cooperation Council (GCC) countries consist of six countries namely: the
Kingdom of Saudi Arabia, State of Kuwait, Kingdom of Bahrain, State of Qatar, United
Arab Emirates, and Sultanate of Oman. In the GCC region, the cement sector has
grown sharply as a reflection of increasing construction activity in the region. The value
of current and planned construction projects in the GCC region is approximately 2.41
Trillion USD4,5.
The Sultanate of Oman, which has a population of approximately 4 million people6,
announced a 116 billion USD construction project in 20134. The sustained economic
activities within the GCC, including considerable infrastructure investment are an
indication of the size of the cement needed in the GCC region and specifically, in
Oman.
Therefore, there is a need to increase cement production capacity, but, it needs to be
done within the context of increasing environmental awareness. The cement industry
contributes about 7% to global GHG emissions7,8,9. Furthermore, producing one tonne
of cement requires the consumption of approximately 1.6 tonnes of raw materials.
Thus, there is a need to increase the use of waste materials and industrial by-products.
There has been much research into how the cement industry can utilise such materials
and much of the research is implemented successfully in the cement industry.
However, the recycling concept is still not widely implemented in the GCC region. Most
cement plants in the region are operated with virgin raw materials and fuel. Only a few
of the region’s cement plants use alternative fuels because fuels such as natural gas,
diesel, and petcoke are cheap and widely subsidised by the government. However,
when the price of crude oil fell in 2013, some governments, such as that of Oman,
began raising the price of natural gas. For example, the price of 1 mmBtu of natural
gas was fixed at 1.5 USD from 1985 to 2014 and then doubled to 3 USD in 201710,11,
which led to a reappraisal of energy and raw material use in the GCC’s cement
industry.

2
Hilal Saif Al Dhamri 200676958
Several types of industrial waste are not yet utilised, for example, Oil-Based Mud
(OBM) cuttings12–19. OBM cuttings are produced during the oil well drilling process and
contain oil, heavy metals, organic matter and soils. Drilling a single well can produce
thousands of cubic metres of OBM cuttings20.OBM is classified as a hazardous
material in Oman21, with special storage specifications enforced by the environmental
authority7.
OBM, also known as drilling fluid mud12,13,22, is defined as the carrier of rock cuttings
from the ground during the drilling process and comes in many forms. The fluid mud’s
main role is lifting the cuttings to the surface during the drilling process, allowing the
drilling operation to go deeper into the earth 23–25. Once the cuttings are collected at
the surface, this mixture of drilling fluid and earth cuttings undergoes a segregation
process to remove the cuttings so the fluid can be reused in the drilling process. This
segregation step is repeated until the fluid can no longer be treated and is discarded.
The discarded fluid is known as fluid-based mud cuttings, the composition of which
depends on the type of fluid used. The type of selected fluid depends on the geological
formation of the underground rocks. In many cases, water-based Mud26 is used with
the addition of oil to enhance the properties of the drilling fluid and optimise the drilling
process. This fluid is known as oil-based fluid or oil-based mud. The mud discarded
from this process is known as OBM cuttings and is collected in mud waste pits. The
OBM cuttings are contaminated with oil, which makes them a potentially hazardous
waste that should not be released into the environment.
OBM cuttings have several characteristics that could be utilised in the cement
industry27. The cuttings all contain calcium, silica, and alumina, which are essential in
cement manufacturing. Also, the oil content gives the cuttings a calorific value and
could help reduce fuel demand. From the perspective of the oil industry, using cuttings
in cement manufacturing will provide an environmentally friendly waste management
solution for this potentially hazardous waste. This is a welcome solution given the
estimated 115,000 tonnes of OBM cuttings stored across Oman 28. The reported
production rate and disposal of OBM cuttings are in the range of 300-500 tonnes per
day and are expected to grow in coming years29.
The objective of this study is to establish the effect of using OBM cuttings as raw
material in cement manufacture, examining the impact on clinker and subsequent
cement performance. The study provides knowledge of the primary factors that may

3
Hilal Saif Al Dhamri 200676958
disturb or enhance the operation and performance of burning during the course of
clinker preparation. Moreover, this study provides momentum for the oil drilling and
cement manufacturing sectors to seize a recycling opportunity and maximise the
utilisation of resources and by-products, such as OBM cuttings.
The scale of a cement plant means that this study has focussed on laboratory-scale
production rather than on-site studies at a cement plant scale i.e. typically 60–150
tonnes per hour. A laboratory investigation allowed for clinker preparation using
different mix ratios. The obtained clinker was tested via XRD, XRF, SEM-EDX, and
free lime determination, as well as ground with gypsum using a tube ball mill to
produce cement. The cement was tested according to appropriate standards (i.e.,
mechanical, physical, and chemical testing).

4
Hilal Saif Al Dhamri 200676958
Chapter 2
Literature Review

5
Hilal Saif Al Dhamri 200676958
Chapter 2: Literature Review
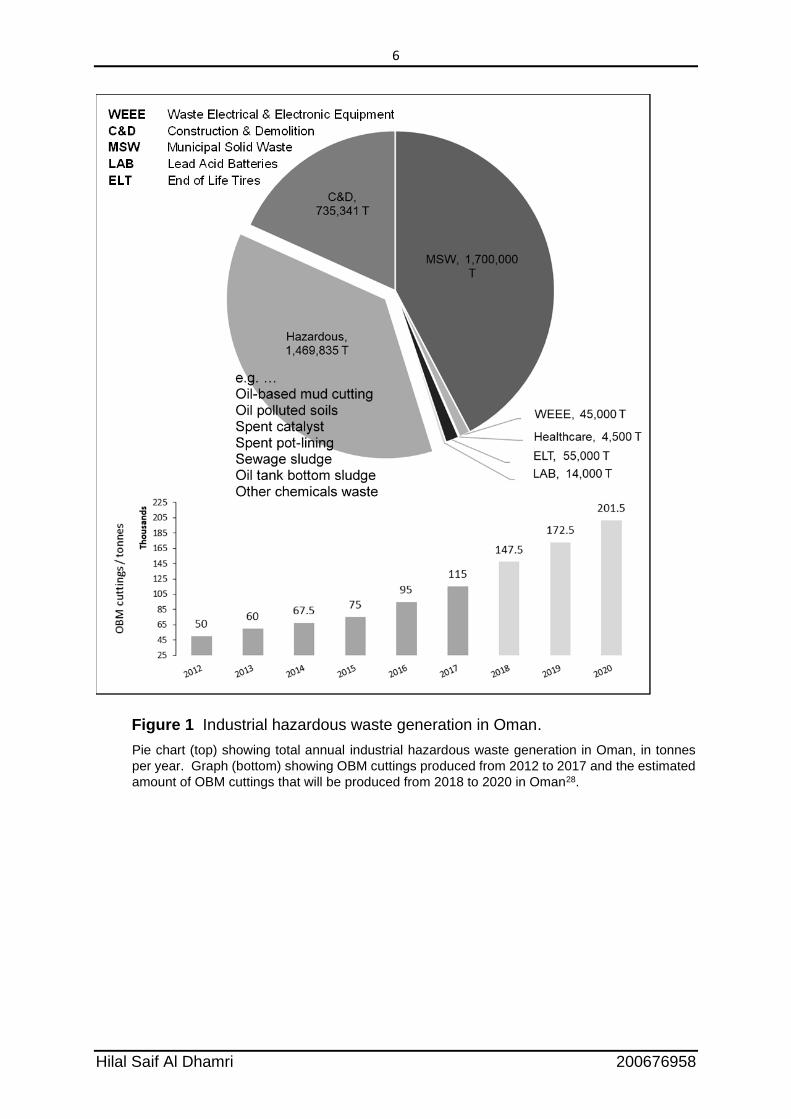
2.1 Industrial Hazardous waste in Oman
The annual rates of hazardous waste generation in the Sultanate of Oman, including
industrial waste, healthcare waste, lubricant waste oil, lead acids batteries, Waste
Electrical and Electronic Equipment (WEEE), and mineral waste, for 2012–2020 are
presented in Figure 1. Different industrial waste materials are generated in Oman,
however, although Oman has many environmental regulations, recycling of industrial
wastes is not practiced in economic scale30.
The forecast reveals that mineral waste generation is expected to increase sharply to
more than 200,000 tonnes per year due to the high expectation of planned oil and gas
exploration projects by Oman Government in the coming years31. Oman's economy is
highly dependent on the oil and gas sector which comprises about 88% of the country
GPA. The second large sector is the industrial sector, at 11% of the GPA32. Thus, as
a result of the industrial activities, more waste generated.
The pie chart reveals that the four major waste types comprise 86% of Oman’s total
hazardous industrial waste generation. Each year, 115,000 tonnes of ‘mineral waste’
(33%), 98,000 tonnes of ‘oil-waste–liquid and solid’ (28%) 45,000 tonnes of ‘waste
electrical and electronic equipment’ (WEEE) (13%), and 43,000 tonnes of ‘fly ash dust
from miscellaneous filter sources’ (12%) are produced. Industrial mineral waste is the
major waste source in Oman, with approximately 117,000 tonnes per year produced
by petroleum companies, of which the major content is OBM cutting waste, consisting
of drilling cuttings, natural sands, and clay contaminated with oil products. It is
produced as a result of oil well drilling. Currently, OBM cuttings are stored at a site
with a special storage arrangement without any further treatment or recycling.
6
Hilal Saif Al Dhamri 200676958
Figure 1 Industrial hazardous waste generation in Oman.
Pie chart (top) showing total annual industrial hazardous waste generation in Oman, in tonnes
per year. Graph (bottom) showing OBM cuttings produced from 2012 to 2017 and the estimated
amount of OBM cuttings that will be produced from 2018 to 2020 in Oman28.

7
Hilal Saif Al Dhamri 200676958
2.2 OBM waste generated from Oil Drilling Process
Various types of drilling fluid muds are produced by petroleum and oil drilling
companies, and they are used as a carrier of rock cuttings from the ground during the
drilling process. The main role of this fluid mud, as summarised in Figure 2, is lifting
cuttings to the surface for disposal during the drilling process, which allows the drilling
operation to go deeper. Once the cuttings are collected at the surface, this mixture of
drilling fluid and earth cuttings undergoes a segregation process to remove the
cuttings and allow the fluid to be reused in the drilling process. This segregation step
is repeated until the fluid can no more be treated and can be discarded. At this stage,
the fluid is known as fluid-based mud cuttings, the composition of which depends on
the type. Several types of drilling fluid are used, and in some types, the mixture is used
along with clay water, seawater or brine. In this case, it is known as water-based mud
(WBM) or water-fluid mud (WFM). The type of fluid depends on the geological
formation of the underground rocks. In many cases, WBM is used with the addition of
oil to enhance the properties of the drilling fluid and optimise the drilling process. This
fluid is known as oil-based fluid or oil-based mud. The disposed mud from this process
is known as OBM cuttings, which are collected in a mud waste pit as depicted in Figure
3. OBM cuttings are contaminated with oil, making them a hazardous waste that
should not be released into the environment without treatment and purification 33–36.
Figure 2 The major functions of OBM during the oil-drilling process37.
- Act as a carrier of cuttings from the hole that permits their separation at the surface.
- Maintain the stability of the well bore. - Is non-damaging to the producing formation. - Is cool and cleans the bit. - Prevents the inflow of fluids from the well bore. - Be non-hazardous to the environment and personal. - Reduce friction between the drill pipe and well bore or casing.
- Form a thin, low-permeable filter cake.

8
Hilal Saif Al Dhamri 200676958
Figure 3 Schematic diagram of an oil well drilling operation.
Breuer et al.38 reviewed the potential accumulation of OBM cuttings produced in the
Northern and Central North Sea as a result of drilling operations in this area. The
review emphasises that hydrocarbon concentrations in the drilling cuttings remain
relatively unchanged over time, and the oil content of the cuttings is about 1%. Caen
et. al.12 describe the replacement of OBM, including synthetic-based fluids and water-
based muds. Approximately 5–10% of the wells drilled worldwide use oil muds.
However, new drilling fluids have been formulated to replace OBM, including
polyalphaolefines, glycols, glycerines, and glucosides. These fluids have the
characterisation of oil-based mud, but less handling is required when compared to
water-based mud due to their biodegradability. Nevertheless, these fluids have some

9
Hilal Saif Al Dhamri 200676958
limitations depending on the well’s conditions and type of formation faced during the
drilling process.
Al-Ansary et al.12 conducted an experiment involving the pre-treatment of drilling
cuttings using a stabilisation/solidification method before the discarded cuttings were
sent to landfill or re-used in construction projects; the 92/2 and 2000/3 Oslo and Paris
Commission Decisions prohibit drill cuttings containing more than 1% oil from being
discharged at sea. Samples of drilling cuttings were collected from the North Sea,
where an estimated 50,000–80,000 tonnes of drilling cuttings are produced annually.
The researchers prepared several samples of drill cuttings mixed with binders,
including Portland cement, lime and blast-furnace slag, microsilica, and magnesium
oxide cement, to remove the oil content and reduce leachability. The leachability
results showed a decrease in release of the synthetic drill cuttings to produce a stable,
inert hazardous waste which was found to meet the United Kingdom’s specifications
for non-hazardous landfills. Furthermore, the 30% blast-furnace slag with Portland
cement binder successfully reduced the leached oil concentration.
Khanpour, et al.39 studied an extraction method using supercritical CO2 to remove the
oil from OBM. It was found that the best conditions for removing the oil were at a
temperature of 333 K, pressure of 180 bars, flow rate lower than 0.1 cm3/s, and static
time of 110 min. SEM and XRD testing confirmed the successful removal of
contaminants from the drilling mud without significant crystalline modification.
Eldridge, R.B.33 conducted pilot-plant experiments and separated oil from OBM using
HFC 134a, which is the commercial name for 1,1,12-tetrafluoroethane, and propane
for supercritical solvent extraction. The objective of the trial was to reuse the
contaminated OBM in the drilling operation and provide an economical,
environmentally friendly recycling solution. The results reveal that the technique is
technically sound and economically viable.
Hou et al.40 and Jiang et al.41 successfully used a separation technique to recover oil
from OBM cuttings using an oil recovery agent consisting of a demulsifier compound
(15% of the demulsifier AE136 + 15% of the demulsifier AP113) (30%), a coagulant,
such as CaCl2 or AlCl3 (1.5%), and the flocculant PAM at a concentration of 0.1%
(2%). The rate of recovery was found to be greater than 90%, producing recovered oil

10
Hilal Saif Al Dhamri 200676958
that met China’s diesel fuel quality standard specifications42 (i.e., GB252-2000 and
GB/T 19147-2003).
Amani et al.43 conducted a comparative study of OBM and WBM produced by drilling
oil wells using high pressure and high-temperature conditions. OBM and WBM both
have several characteristics that meet the requirements for high pressure and high
temperature well drilling. This establishes engineering guidelines that could be used
to decide the most suitable mud for a drilling operation. High temperature and high-
pressure conditions arise when the drilling depth is greater than 4,000 metres, where
the temperature is about 150 oC and the pressure is 69 MPa. These conditions can
impact the rheological properties of the mud. Amani et al. suggest using OBM for
HPHT drilling conditions with temperatures up to 205 oC based on the laboratory
experiment conducted.
Young et al.36 used the rotary retort distillation technique for the removal of oil from oil-
based mud (OBM) to facilitate onsite disposal of the waste in offshore oil rigs after
reducing the oil in the cuttings to environmentally acceptable and safe limits. The
treatment process was established to process 15 t/h of oil-based cuttings. The
resultant products were tested for toxicity and metal leachates. The energy
consumption for an offshore rotary retort distillation unit was estimated; moreover, the
reliability, minimum environmental impact, wear rate, and safety of the operations were
analysed. To determine the required specifications for improved operation, a bed
temperature of 427 ℃ using natural gas fuel was calculated based on the plot of the
weight ratio of the solids (in percentage) versus the bed temperature of the cuttings.
A two-stage vapour-recovery system was used to recover the evaporated
hydrocarbons by means of purging with nitrogen sweep gas to ensure oxygen-free
atmosphere. Heavier oil and particulates were collected in the first condenser, while
light oils and water were collected during the second stage. The treated solid waste
was disposed of directly to the ocean floor after ensuring that it met the environmental
requirements. The author concluded that this rotary retort distillation process provided
a mature and highly dependable method with lower energy use for the treatment of
OBM waste36.
Abbe et al.44 used a vitrification and sintering/crystallisation process to convert dried
drill cuttings into amorphous glass. A mixture of dried drill cuttings, sodium, and
calcium oxide in a weight ratio of 8:1:1 was blended and thermally treated at

11
Hilal Saif Al Dhamri 200676958
approximately 1300 ℃ for 5 h, and subsequently cooled to obtain an intermediate
amorphous solid. This amorphous solids were further treated thermally at
approximately 750 to 800℃ to produce glass-ceramic. The drill cutting waste used
contained 60% to 80% solid rocks, 8% organic matter, 6% minerals, and clay with
used drilling liquids. This vitrification process immobilised the waste owing to the
melting process favouring the entrainment of potentially hazardous components,
thereby preventing these from leaching out. The authors tested the properties of the
produced glass-ceramic for its potential use by studying the hardness, fracture
strength, fracture toughness, and stability towards leaching. It was concluded that the
glass-ceramic had almost zero porosity, with attractive mechanical properties for
possible applications as building material44.
Oreshkin et al.45 investigated the disposal of drilling waste sludge to produce building
materials. The mineral composition of the studied drilling sludge mainly consisted of
quartz and minor quantities of carbonates including calcite, aragonite, dolomite, and
aragonite. The average particle size was in the range of 20 to 30 mm and constituted
50% to 60% of the total weight. The introduction of sorbents and cement along with
drilling sludge rendered harmless building material that could be used in the production
of brick and small building products. The cement, sorbent, and drilling sludge mixed
with water could support the system with a high pH (up to 12). Furthermore, the heavy
metal ions from the drilling sludge passed into insoluble compounds, leading to the
binding and neutralisation of environmentally toxic heavy metals following subsequent
curing. This disposal technique enables ecological improvement and can aid in the
restoration of the natural environment45.
Hou et al.40 used coagulants and flocculants for oil recovery to enable useful recycling
and the safe disposal of oil-based drilling fluids containing oil, heavy metals, and
organic pollutants. A recovery rate of over 90% was achieved, and the quality of the
recycled oil met the requirement of –10# diesel. In the experiment, the authors used
compound demulsifier mixtures that were mainly composed of polyoxyethylene poly-
oxypropylene ethyleredi-amines (AE) and polyoxypropylene polyoxyethylene
polyoxypropylene- five ethylenes six amines (AP) demulsifiers, along with industrial
coagulants and flocculants. The composition of the oil-recovering agent formula
recommended by the author was 30% demulsifier compound, 1.5% coagulant, and
2% flocculant. The residual sludge was used in the construction of a well-site

12
Hilal Saif Al Dhamri 200676958
cofferdam and the roads of the well site. The concentrations of the oil, chemical oxygen
demand (COD), and heavy metals were tested in the processed mud and confirmed
to be within the accepted range. The water used for the treatment process was tested
after the operation and was found to meet the requirements of general emission levels
for sewage40.
Nahmad et al.46 used a combination of chemical, physical, and biological processes
to treat non-aqueous fluids such as OBM and synthetic-based muds. Total petroleum
hydrocarbons (TPH) of up to 22% were used for the testing, in which the TPH was
reduced to less than 1% as per the country regulations for disposal. The team named
the process Free-RAD© and demonstrated it as an economically superior process for
dealing with wastes. By using highly reactive free radicals, the complex hydrocarbons
and organic compounds could be decomposed into lighter molecules such as CO2 and
H2O. The steps involved in the process comprised hydrocarbon decomposition into
CO2 and H2O by introducing free radicals, followed by the addition of UV-receptive
minerals to promote rapid photodecomposition, and finally, the addition of organic
compost to promote bioaugmentation. The authors concluded that the final threshold
period for this decontamination process was 22 weeks, and conducted final tests as a
remediation process to be used for bearing crops46.
Gogan et al.47 studied the properties of carbonate OBM cuttings (COBMC) as
activated mineral powder when used as an asphaltic concrete mix for road
construction following thermal treatment at 340 °C (Gogan et al., 2014). The
physicochemical properties such as the water content, hydrocarbons, ash, pH,
density, flash point, and COD were determined for the thermally treated COBMC, and
based on the results, their suitability for the project was confirmed. According to the
specified density and strength of the asphaltic concrete mix, the mineral powder
COBMC was mixed with bitumen in varying proportions, and the team confirmed 7
wt.% of COBMC as optimal for use. Using the mix, a motor road was laid with a layer
of 5 cm thick and 6 m wide by means of conventional methods. After one month of
regular inspection, the team recommend the use of COBMC as a mineral component
for road construction, which may provide a solution to critical environmental
problems47.
A case report by Helmy and Kardena48 discussed significant problems faced by
Indonesian oil and gas industries regarding environmental management systems

13
Hilal Saif Al Dhamri 200676958
towards effective and responsible waste handling, disposal, and the minimisation of
waste generation to reduce potential harm to health and environmental problems.
Among the generated wastes, crude oil-contaminated soil, bottom sludge, abandoned
sludge pits, burial oil sludge, and produced water were considered as the most
abundant by these authors. Bioremediation and co-processing techniques applied for
treating oil sludge and produced water included the common practice of gravity-based
separation and discharge into water bodies. The oil sludge types were characterised
as oil sludge and oil-contaminated soil, with the standard practice for treatment
identified as landfarming bioremediation. Laboratory-level data were studied for the
oily sludge with oil contents up to 320 g TPH/kg soil using different treatment steps
such as soil washing, biodegradation, and biosurfactant treatments. A significant TPH
reduction was achieved, with the highest removal efficiency reaching 85%. The
authors concluded that the lack of established waste management facilities restricts
proper waste disposal, which can be addressed by constructing the necessary
facilities. Although this approach is expensive for oil and gas industries in the short
term, it can minimise long-term liabilities48.
Mostavi et al.49 investigated the use of drill cuttings as a partial replacement for cement
in concrete structures. The study considered this approach to be not only cost-
effective, but also as offering the potential to reduce environmental impacts caused by
waste. Laboratory-level studies were carried out by the team based on the
compressive strengths of concrete samples and the chemical compositions of the drill
cuttings used. The results indicated that the replacement of 5% of cement with drill
cuttings reduced the concrete compressive strength by 10%. A further increase in the
drill cuttings in the cement concrete by 10%, 15%, and 20% resulted in a strength
reduction of 20%. Moreover, the effects of additives such as fly ash and silica fume in
this cement mix were studied, and it was concluded that these materials had a
significant influence on the compressive strength. The drill cutting particle size
distribution was studied, and it was found that the maximum grain size was less than
6 mm, while the coefficients of uniformity and curvature were 8.63 and 1.22,
respectively, which classified the particles as fine aggregates in accordance with
ASTM C330 for cement concrete mixes. The test specimens used in the study were
obtained from five separate batches of concrete, including one control sample and four
different combinations containing drill cuttings, fly ash, silica fume, and a mixture of

14
Hilal Saif Al Dhamri 200676958
silica fume and fly ash. Crushed limestone passed at 100% in No. 3/8-inch sieves was
used as the coarse aggregate for the study. The authors concluded the optimal mix
proportion was 20% drill cuttings with 7.5% silica fume and fly ash, which could
increase the compressive strength by 40%49.
Shon et al.50 used modified drilling waste material (MDWM) with cement in the
laboratory as the base-course material in roadway construction. The production of the
MDWM from drilling waste mud (DWM) involved various steps. In the first step, water
was separated from the drilling mud, following which centrifuges were used for the
additional removal of oil contaminants. The second step involved the stabilisation and
solidification processes using cement as a binder, which reduced the free movement
and minimised the mobility of the pollutants in the waste. The preferred aggregate-to-
dried DWM ratio for producing the MDWM was 3:1, with 12% of cement kiln dust added
to the mixture. The laboratory-level investigation, in which the MDWM mixture was
treated with 3% cement, demonstrated that the material satisfied the requirements for
Class M base, with 7-day compressive strength and a minimum of 1225 kPa50.
Drilling waste from oil companies that contains toxic polyaromatic hydrocarbons and
that was treated using the thermal desorption technique was studied by Piazza et al.
(2017)51. The drill cuttings treatment using this technique was investigated and
recommended as the most effective, economical, and environmentally friendly. The
indirect thermal desorption treatment was not only found to be safer, minimising the
pollution compared to direct heating, but also allowed for recovery without destroying
hydrocarbons owing to controlled heating, and the recovered oil was reused for
producing fresh OBM. The recovery of hydrocarbons and recycling could reduce the
stress on the environment and avoidable economic loss. Approximately 20,000 bbl of
oil was recovered using the process, and the endeavour was selected for the Six
Sigma Green Belt project51.
Benlamoudi and Abdul Kadir 52 studied the role of petroleum sludge (PS) as a setting
retarder in cement, replacing conventional gypsum. The CaO and SO3 percentages of
the PS used in the study were 25.05% and 38.41%, respectively, which aided in
delaying the flash setting of the cement. Four different samples were prepared by the
team with PS percentages of 0%, 1%, 3.5% and 5%, along with gypsum and cement
clinker. Prior to the trial study, the PS collected from the oil drilling field was burned in
an industrial kiln to eliminate the organic hydrocarbons and then grinded to pass

15
Hilal Saif Al Dhamri 200676958
through a 1 mm diameter sieve. As per the guidelines for using inductively coupled
plasma mass spectroscopy for the leaching behaviour of heavy metals from PS, the
results did not exceed the regulatory limits for cement, except for the lead, which
exhibited 149.02 ppm for the maximum percentage of cement produced against the
statutory limit of 75 ppm. The study concluded that the addition of 5% PS to cement
could achieve effective results, and can be used as a replacement for gypsum in
cement grinding52.
Shon and Estakhri53 used MDWMs and seashells as a base material for road
construction, and compared the performance with conventional gravel base-course
material. Experiments were carried out on field-cored samples using non-destructive
tests including ground penetration radar, falling weight deflectometry, dynamic cone
penetration, and rusting tests to evaluate the performance. For the cored samples,
further properties such as the moisture content, dry and wet density, stiffness and
seismic modulus, unconfined compressive strength, and modulus of rupture were
evaluated. Using the MDWM waste materials, 91.44 m of roadway was paved for the
study, and based on the field performance, the author recommended the materials for
use as embankments, subbase materials, patching materials, base materials for low-
volume roadways, shoulders, and bases for maintenance activities53.
In their research, Ayati et al.54 investigated the technical feasibility of waste drilling oil
cuttings into lightweight aggregate (LWA) for construction work. Pre-treated drill
cuttings were pelletised with the addition of 25 ± 2 wt.% water and formed into
spherical pellets of 7 and 14 mm in size. Owing to the high concentration of chloride,
the author recommended washing the pre-treated oil drillings prior to the heat
treatment process to reduce the leaching effects. The green pellets were then
subjected to thermal treatment at temperatures between 1160 and 1190 ℃ in a muffle
furnace at a rate of 10 ℃/min. The produced LWAs were tested for physical properties
including their water absorption capacity and compressive strength, and a
mineralogical study was conducted using optical microscopy and X-ray diffractometry.
The results were compared with the properties of existing commercial products,
demonstrating a particle density of 1.29 g/cm3, water absorption of 3.6%, and
compressive strength of 4.4 MPa. The mineralogical study of the LWA confirmed that
the main composition following thermal treatment was CaMgSi2O6. The authors

16
Hilal Saif Al Dhamri 200676958
concluded that an industrial-scale study would be required for commercial
production54.
2.3 Shifting from WBM to OBM in Oman
In Oman, oil production declined gradually from 970,000 barrels per day in 2000 to
710,000 barrels per day in 200755,56 due to many technical issues encountered during
the well drilling process. The vertical depth of the well was about 4,500–4,800 metres,
where tight sandstone and dolomitic limestone with thick mudstone were encountered,
which caused the bore hole to become unstable57–60. Furthermore, drilling these
complex formations takes longer, slowing the production rate. After intensive studies,
the drilling companies implemented several measures to improve the situation,
including switching from WBM to OBM because this type of geological formation and
drilling conditions require a higher mud weight to maintain the overbalanced drilling 59–
61. As a result, the drilling time was reduced by 25 days, which saved about 1.25 million
USD per well 57.
Figure 4 Crude oil production in Oman from 1980 to 2018
(USEIA and BP 55,56)
2.4 Waste as raw materials for clinker production
Bernardo et al.62 tested the burnability of kiln feed using OBM cuttings as additives,
partially replacing limestone and clay in the kiln feed. The test was conducted at the

17
Hilal Saif Al Dhamri 200676958
plant scale by preparing two types of kiln feed mixtures and making comparisons to
clinker produced without OBM cuttings. The kiln was run for 10 days for each mixture.
The researchers successfully achieved a replacement of 30% of limestone (mixture 1)
and 44% of clay (mixture 2). The burnability indices (BI*) were 10.7 (mixture 1), 44.2
(mixture 2), and 19.8 (the reference mixture). According to Bernardo and et al.62, BI
values lower than 60 indicate very satisfactory burning behaviour. The phase
composition of the prepared clinker, calculated according to the Bogue formulae, was
found to be within the range expected for conventional clinker phase composition. In
addition, the mechanical, physical, and chemical parameters of Portland cement were
also found within the specified range in the European standard for cement:
EN197-1:2011. The Bogue formulae calculate approximate clinker contents based on
chemical analysis. Other methods, such as X-ray diffraction, provide more precise
results. Nevertheless, Bogue formulae afford fast, easy estimates which may be used
in the preparation of the mix in clinker preparation. Most cement plants depend highly
on this calculation.
The testing of cement properties (mechanical, physical and chemical) are necessary
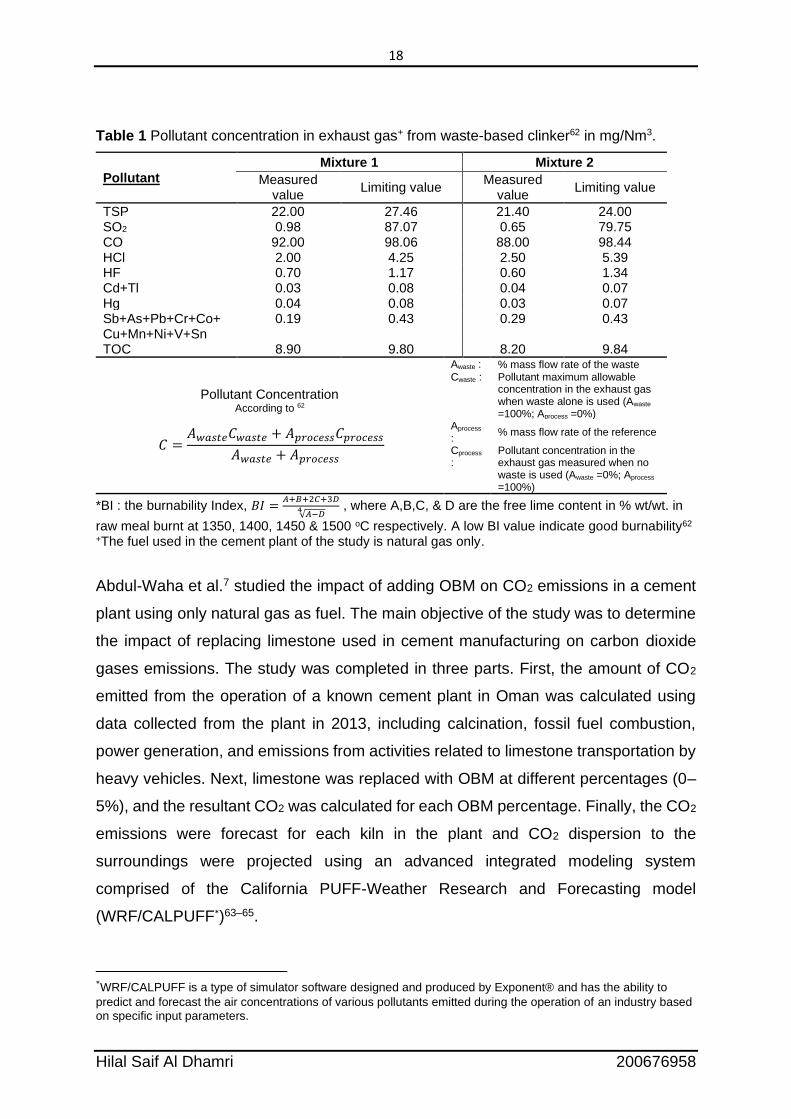
to ascertain cement quality, with testing in accordance with standards such as ASTM
and BS/EN, as presented in Chapter 7 Table 15. During the trial test, the pollutant
concentration in the exhaust gas for waste-based clinkers was measured and
compared to the calculated limiting value according to the formula stated in Table 1.
18
Hilal Saif Al Dhamri 200676958
Table 1 Pollutant concentration in exhaust gas+ from waste-based clinker62 in mg/Nm3.
Pollutant Mixture 1 Mixture 2
Measured value
Limiting value Measured
value Limiting value
TSP 22.00 27.46 21.40 24.00 SO2 0.98 87.07 0.65 79.75 CO 92.00 98.06 88.00 98.44 HCl 2.00 4.25 2.50 5.39 HF 0.70 1.17 0.60 1.34 Cd+Tl 0.03 0.08 0.04 0.07 Hg 0.04 0.08 0.03 0.07 Sb+As+Pb+Cr+Co+Cu+Mn+Ni+V+Sn
0.19 0.43 0.29 0.43
TOC 8.90 9.80 8.20 9.84
Pollutant Concentration According to 62
𝐶 =𝐴𝑤𝑎𝑠𝑡𝑒𝐶𝑤𝑎𝑠𝑡𝑒 + 𝐴𝑝𝑟𝑜𝑐𝑒𝑠𝑠𝐶𝑝𝑟𝑜𝑐𝑒𝑠𝑠
𝐴𝑤𝑎𝑠𝑡𝑒 + 𝐴𝑝𝑟𝑜𝑐𝑒𝑠𝑠
Awaste : % mass flow rate of the waste Cwaste : Pollutant maximum allowable
concentration in the exhaust gas when waste alone is used (Awaste =100%; Aprocess =0%)
Aprocess :
% mass flow rate of the reference
Cprocess :
Pollutant concentration in the exhaust gas measured when no waste is used (Awaste =0%; Aprocess =100%)
*BI : the burnability Index, 𝐵𝐼 =𝐴+𝐵+2𝐶+3𝐷
√𝐴−𝐷4 , where A,B,C, & D are the free lime content in % wt/wt. in
raw meal burnt at 1350, 1400, 1450 & 1500 oC respectively. A low BI value indicate good burnability62 +The fuel used in the cement plant of the study is natural gas only.
Abdul-Waha et al.7 studied the impact of adding OBM on CO2 emissions in a cement
plant using only natural gas as fuel. The main objective of the study was to determine
the impact of replacing limestone used in cement manufacturing on carbon dioxide
gases emissions. The study was completed in three parts. First, the amount of CO2
emitted from the operation of a known cement plant in Oman was calculated using
data collected from the plant in 2013, including calcination, fossil fuel combustion,
power generation, and emissions from activities related to limestone transportation by
heavy vehicles. Next, limestone was replaced with OBM at different percentages (0–
5%), and the resultant CO2 was calculated for each OBM percentage. Finally, the CO2
emissions were forecast for each kiln in the plant and CO2 dispersion to the
surroundings were projected using an advanced integrated modeling system
comprised of the California PUFF-Weather Research and Forecasting model
(WRF/CALPUFF*)63–65.
*WRF/CALPUFF is a type of simulator software designed and produced by Exponent® and has the ability to
predict and forecast the air concentrations of various pollutants emitted during the operation of an industry based on specific input parameters.

19
Hilal Saif Al Dhamri 200676958
Table 2 Total CO2 emissions from plant sources after the addition of OBM7.
OBM % 0% 1% 2% 3% 4% 5%
CO2 emissions per tonne cement (Kg/ tonne)
Calcination 442.84 437.47 432.11 426.74 421.38 416.01 Fuel combustion 181.62 181.62 181.62 181.62 181.62 181.62 Power plant 47.29 47.29 47.29 47.29 47.29 47.29 Vehicular 1.92 1.92 1.92 1.92 1.92 1.92
Total* 673.67 668.30 662.94 657.57 652.21 646.84
*The CO2 emissions are lower than in many reported studies because the cement plant uses only natural gas as fuel.
CO2 emissions before and after the OBM cutting addition are shown in Table 2 and
Table 3. The total amount of CO2 emitted was 673.67 Kg CO2/tonne of produced
cement. The major source of CO2 emissions (442.84 Kg CO2 /tonne cement, 65.74%
of other sources) was the calcination step of the raw meal which consists of
approximately 82.54% limestone. The CO2 emitted due to calcination decreased as
the OBM percentage increased (Table 2).
The lowest CO2 emissions were at 5% OBM with 416.01 Kg CO2 per tonne cement.
The result obtained from the modelled CO2 concentrations in the calcination step using
the WRF/CALPUFF simulator showed a decrease in CO2 emissions as a result of
adding OBM cuttings (Figure 5). They concluded that due to high CO2 emissions from
the cement manufacturing process, mainly from the calcination reaction, adding OBM
to raw materials in the cement plant could be a viable way to safely dispose of OBM
cuttings without reducing cement quality7.
Table 3 Calculation of CO2 emissions from cement-plant sources before and after the addition of OBM7.
OBM cutting
Limestone consumption
Clinker production
CO2 from raw meal
CO2 per tonne of clinker
CO2 per tonne of cement
(T per year) (T per year) (T per year) (Kg per T) (Kg per T)
0% 2,542,301ii 1,875,901 889,805 474.33 442.84
1% 2,511,502 1,875,901 879,026 468.59 437.47
2% 2,480,702 1,875,901 868,246 462.84 432.11
3% 2,449,903 1,875,901 857,466 457.10 426.74
4% 2,419,103 1,875,901 846,686 451.35 421.38
5% 2,388,304 1,875,901 835,906 445.60 416.01
i Loss on ignition at 950 oC is 35%. ii This figure is the actual limestone consumption during 2013 collected from Oman Cement Company.

20
Hilal Saif Al Dhamri 200676958
Figure 5 CO2 emission concentrations calculated by atmospheric modelling7.
(Using the WRF/CALPUFF modelling system)

21
Hilal Saif Al Dhamri 200676958
Chapter 3
Description of the problem

22
Hilal Saif Al Dhamri 200676958
Chapter 3: Description of the problem
3.1 The impact of OBM cutting generated in Oman
Currently, the options for treating OBM cutting waste are very limited, and it is often
simply stored in a lined pit, awaiting further treatment. Because OBM cuttings are
classified as a hazardous waste, the Government of Oman is keen to find a suitable
waste management solution. Fortunately, the mineralogical composition of OBM
cutting waste and the presence of organic residues from the crude oil make it
potentially useful in cement clinker production. In fact, the challenges of cement
manufacturing in Oman is the raw materials’ chemistry, specifically, the availability of
raw materials rich in silica. The limestone is high-grade, which means its silica content
is very low. However, raw meal must be approximately 14% silica, and effective raw
meal preparation in the cement factory requires silica additives. The most common
silica-containing raw material used in most cement plants is sand. Quartz is another
option, widely used in many countries, including Oman. However, the quartz (quartzo-
phillite rock) reserves in Oman are very limited and have very high free silica content,
and making it reactive requires increased energy consumption. It may also lead to
operational problems during pyroprocessing due to the higher concentrations of alkalis
and chloride compared to other raw materials.
When OBM cuttings, are analysed, they are found to contain significant quantities of
calcium oxide (CaO) and silicon dioxide (SiO2). They are also saturated with oil and
residual crude oil. The presence of these inorganic constituents makes drilling waste
a suitable material for cement manufacturing as they are also the basic oxides required
in the cement industry, where the cement clinker is made from raw materials of
limestone (CaCO3) that is rich in calcium oxide (CaO). Hence, theoretically, OBM
cutting waste can be used as an alternative to lime-based materials for clinker
production.
3.1.1 Economic impact
As predicted by Be`ah Oman 66, it is projected that oil and gas exploration in Oman
will increase sharply in the coming years, at least until 203067,68. This will cause more
OBM to be produced, which will lead to more OBM cutting generation. Handling OBM
cutting is very expensive, requiring special isolated pits. The cost of one pit is about

23
Hilal Saif Al Dhamri 200676958
260,000 USD for the storage of about 10,000 tonnes of OBM cuttings29. Treating of
OBM cutting to remove the contaminated oil is also very expensive. The cost of this
treatment is in the range of 150–200 USD per tonne, which is too expensive compared
to disposal in cement manufacture, which only costs 8 USD per tonne10. To date, there
are no disposal facilities or treatment plants for hazardous materials in Oman.
3.1.2 Environmental impact
The emission of greenhouse gases (GHG) is one of the major serious environmental
pressures on industry to improve operational processes. In Oman, the major source
of GHG is from the oil and natural gases activities, mainly the result of energy
extraction, oil drilling, and electricity generation69,70.
The fast growth of oil and gas activities, rapid industrial growth, and construction
development in Oman have contributed significantly to increased GHG emissions as
shown in Figures 6 and 7. Estimated GHG emissions due to natural gas consumption
or related activities are in the range of 50–400 million m3. However, because of a rapid
increase in activity involving natural gas, emissions have also increased, beginning in
1989 and increasing progressively until 2018. Correspondingly, GHG emissions
associated with oil production and consumption have increased annually as can be
seen in Figure 6. Consequently, the increase in GHG emissions has impacted daily
life in Oman. Furthermore, climate change, which is causing more severe heat waves,
and poorer air quality due to population density are hazardous to the population’s
general health 70.
Figure 6 CO2 emissions from energy consumption in Oman55,56

24
Hilal Saif Al Dhamri 200676958
Figure 7 Gross natural gas production in Oman55,56
3.2 Possible solutions for disposal of OBM cutting in cement
industries
The disposal of such a large quantity of this solid drilling waste is expensive as it
requires a lot of land and causes a number of serious environmental problems. The
waste can easily contaminate soil and groundwater when the hydrocarbons and other
chemicals leach into the earth. One promising strategy to reduce the threat of
hazardous waste and diminish its accumulation in disposal sites is utilising it in other
industries. From the viewpoint of recycling, this can be considered a sustainable
approach to waste management and may reduce the amount sent to final disposal.
The experimental findings of this project are anticipated to play a primary role in
recycling drilling waste and eliminate the cost of its disposal and, thus, avoid the
contamination of soil and groundwater in Oman. Therefore, specific attention is paid
to the use of OBM cutting waste in cement manufacturing as additional raw materials.
Furthermore, this will result in reducing the consumption of a considerable amount of
natural resources, such as limestone and natural mineral additives, in Oman. It will be
a change towards diverting drilling waste from landfills and nil waste disposals, as well
as a chance to develop cement manufacturing processes that are more sustainable
and less damaging to the environment.

25
Hilal Saif Al Dhamri 200676958
Different types of waste materials can replace primary raw materials in the cement
industry. This will contribute to economic goals in reducing cost, reducing
environmental impact and saving natural resources. The economic aspect is reflected
in reducing the need for additional construction of costly new engineering storage
areas that have high environmental regulation standards. Other costs are also
reduced, such as handling, transportation and environmental monitoring. The
accumulation of OBM cuttings with increasing oil exploration and production will lead
to increased requirements for constructing new storage facilities. In general, industrial
waste may be accepted as fuel; additional raw materials must add value to the cement
manufacturing by generating caloric value as fuel to replace expensive energy or as
feedstock to replace the raw materials in the cement industry.
3.3 Use of OBM cuttings as raw materials in clinker manufacturing
Utilising this drilling waste as a partial substitution for limestone in cement
manufacturing will reduce the consumption of limestone considerably, thus reducing
abiotic depletion. Due to the chemical composition of OBM cutting waste, it could,
theoretically, be used to replace limestone (Table 4) and supplement some of the
principal elements in the process of clinker phase formation, such as calcium, silicon,
and aluminum. The calorific value of OBM cutting waste also makes it a valuable
component in reducing the thermal energy requirement of clinkerisation, which
reduces the amount of fuel used during clinker manufacturing.
Table 4 The chemical composition of limestone, quartzo-phillite, and OBM cuttings71
Oxide
Limestone* Quartzo-phillite# OBM Cutting+
Wt./Wt. % Wt./Wt. % Wt./Wt. %
SiO2 5.94 ±1.69 74.25 ±4.84 19.00 ±15.11
Al203 0.62 ±0.19 5.49 ±0.97 3.66 ±1.96
Fe2O3 0.51 ±0.18 5.53 ±1.15 1.67 ±0.54
CaO 50.86 ±0.95 4.01 ±0.95 34.06 ±10.47
MgO 0.48 ±0.14 4.09 ±1.67 2.94 ±1.07
SO3 0.13 ±0.10 0.03 ±0.01 1.92 ±0.83
Na2O 0.05 ±0.01 1.22 ±0.22 0.89 ±0.36
K2O 0.07 ±0.04 0.68 ±0.16 0.61 ±0.19
LOI @950 39.51 ±0.93 3.99 ±1.96 34.07 ± 1.10
* #
+
Average 10 samples, Mn2O3 0.02%, TiO2 0.04±0.01% Average 13 samples, Mn2O3 0.19 ±0.08%, TiO2 0.51±0.11% Average 20 samples, 5.96±3.23 % moisture.

26
Hilal Saif Al Dhamri 200676958
The formation of the major clinker phases, such as alite and belite, are controlled by
the heat conditions, as well as the raw meal chemicals and their physical properties.
In this study, the raw meal is prepared with different percentages of OBM to investigate
the effect on clinker quality after replacing raw meal with OBM. Using drilling waste to
replace a major raw material in cement production is an ideal solution, especially since
the consumption of limestone is high. For example, the cement plant in Oman has
been designed for the consumption of approximately 13,000 tonnes of raw materials
per day. If 1% of the raw material is replaced by drilling waste, then the rate of
consumption of this waste is approximately 130 tonnes per day, or about 39,000
tonnes per year, assuming 300 operational days per year.
The main objective of the proposed research is to study the effect of using drilling
waste as partial replacements of natural raw materials in a cement plant. The study
focuses on the use of drilling waste (OBM cuttings) to replace a portion of the raw
materials used in cement manufacturing. Figure 8 shows the steps involved in
producing OBM and demonstrates the proposed recycling process in the manufacture
of different types of cement. In this work, OBM cuttings will be mixed, at different
proportions, with the raw materials used to produce cement. The effects of this addition
can be studied by designing and conducting laboratory experiments that will help
detect how cement performance is impacted by adding this type of waste during the
manufacturing process.
This research is based on manufacturing cement in the lab. Drilling waste will be
added, at varying proportions, that are proportional with the operations and conditions
of the cement plant in Oman. The influence of this waste addition will be investigated
to examine its effects on cement products and determine how much OBM cutting
waste can be added to the raw materials used in the cement industry without affecting
the product’s quality. Figure 8 shows different process activities involved in operating
an oil drilling rig, as well as the generation and handling of OBM cutting72 and the
cement and concrete manufacturing process73. Three different areas have been
identified after OBM cutting generation to recycle the waste and facilitate a proper
environment for processing OBM cuttings and, subsequently, convert it to a product
as presented in Figure 8.

27
Hilal Saif Al Dhamri 200676958
Figure 8 A schematic of the OBM and OBM cuttings disposal cycle as raw material in cement manufacturing74
OBM cutting landfill
6 months One year Three years
12 – 15 % H2O
8 – 12% H2O
5 – 7 % H2O

28
Hilal Saif Al Dhamri 200676958
After OBM cuttings are generated by an oil well rig, they are transferred to an
engineered landfill20,16. The landfill is open, exposed to direct sunlight, and is typically
located in the desert. OBM cuttings are wet because they contain a significant amount
of oil and water, as shown in Figure 9. At this stage, storage is used to dry OBM
cuttings and remove the water content by means of the sun and high temperatures in
the desert. Another option, to accelerate the drying process, is using a drying unit
where heat is applied to the wet OBM cuttings. This process produces vapor and could
recover the oil content from OBM cuttings.
Dry OBM cuttings could be shipped to a cement factory to produce cement clinker. In
the cement factory, OBM cuttings are added to limestone, as a replacement, at a level
that produces raw meal within an acceptable range of quality. The first step, after
mixing them with the raw materials, is grinding. Two common types of raw mill grinding
are used in cement technology: ball mill grinding and vertical roller mill grinding75,76.
Ball mill grinding employs dry raw materials. If the raw materials contain moisture
above 3%, hot dry gas is applied during the grinding step. The maximum water content
of the raw materials in ball mill grinding is 3–8%77. However, in the vertical roller mill,
grinding can occur even when the moisture level is high (up to 20%78,79). If OBM
cuttings are shipped to a cement plant that has a vertical mill, the drying process is
eliminated or reduced to conserve time and energy. After the grinding step, the
produced powder, known as raw meal, is homogenised in a homo silo and then
preheated and calcined in a preheater tower. Next, the calcined raw meal is burned in
a rotary kiln at 1450 oC and then cooled to yield the clinker. In the final step, the clinker
is ground with 5% gypsum to produce the final product, Portland cement.
There are many types of cement with different applications in construction80,79. For
example, ordinary Portland cement (OPC) and sulfate-resistant cement (SRC) are
used in the construction industry by mixing cement with different aggregates,
additives, and water as shown in Figure 8 (v). Buildings are also recycled in cement
manufacturing; many studies have demonstrated the successful use of raw materials
derived from demolished buildings in the cement industry 81,82,83,84.

29
Hilal Saif Al Dhamri 200676958
Figure 9 Storage sites for OBM cuttings.
Another type of cement, known as Oil Well Cement (OWC) 85,86–88,is a special
cement89 used for oil well construction. It has different physical properties and
chemical content compared to construction cement. Is also has greater compressive

30
Hilal Saif Al Dhamri 200676958
strength and a longer setting time to meet specific requirements, such as being
pumped deep in an oil well while drilling and finalising the oil rig. OWC quality plays a
major role in the oil rig process. The American Petroleum Institute (API) has
established international specifications and standards for producing OWC suitable for
the construction of durable casing that supports oil and gas extraction89.
Linking all the steps—beginning with the process of generating OBM cuttings in the oil
and gas sector and ending where OBM cuttings are generated—helps provide a full,
closed-cycle process for recycling the hazardous waste and eliminating the generation
of by-products. Additionally, the closed cycle provides effective environmental and
economic solutions where the three different sectors (oil and gas, the cement industry,
and the concrete sector) are integrated so that an output from one sector becomes an
input for another sector.
3.4 Chemistry of the cement manufacturing process
The Portland cement clinker may be defined as follows, "at least two-thirds of it consist
of the two calcium silicates, namely tri- and di-calcium silicate, which are richest in
CaO and can react when mixed with water and harden reasonably rapidly. It is,
therefore, a hydraulic substance"90.
Cement is made by mixing four raw materials, specifically, limestone (80%), quartzo-
phyllite (12%), iron ore (5%), and bauxite or kaolin (3%). The raw materials are
crushed and homogenised using a mixed-bed method, transferred to a raw mill, and
ground to a fine powder to produce raw meal. The raw meal is stored in a
homogenising silo in which it is homogenised using air blowers. Figure 10 shows the
process schematically.
Next, the raw meal is introduced to a heating tower known as preheater tower, which
consists of multistage cyclones. The meal is introduced to the top preheater and flows
into the bottom by gravity against a hot gas flow from the bottom, coming from the
rotary kiln. The meal is heated gradually through the heat exchange process. In the
preheater, the calcination of CaCO3 occurs, and CO2 gas is released at about 650 oC
by the exothermic reaction producing CaO. The calcined meal is taken to the rotary
kiln and classified into different zones according to the temperature profile of the rotary
kiln. The first zone is in the range of 900–1100 oC, where the liquid phase is formed,

31
Hilal Saif Al Dhamri 200676958
followed by the transition and burning zones, where some other clinker phases, such
as belite (dicalcium Silicate, C2S) and alite (tricalcium silicate, C3S), are formed at
about 1400 oC. The output from the rotary kiln falls into the cooler, where the material
is cooled using air blowers to reduce the temperature of the burned raw meal from
1400 oC to about 200 oC within one h. The product is called Portland cement clinker,
and it is stored in large silos. In the next step, the clinker is mixed with 5% gypsum
(CaSO4.2H2O) and ground in a cement ball mill. The particle size of the resultant
cement is classified according to the Blaine results. The coarser material is returned
to the mill for further grinding, and the finer material is transferred to the cement
storage silos.
Figure 10 Cement manufacturing process

32
Hilal Saif Al Dhamri 200676958
Table 5 Major chemical phases in clinker and cement
Clinker Phase Approximate
Chemical Formula
Cement
Industry
Abbreviation
Alite Tricalcium silicate 3CaO.SiO2 C3S
Belite Dicalcium silicate 2CaO.SiO2 C2S
Aluminate Tricalcium aluminate (Aluminate) 3CaO.Al2O3 C3A
Ferrite Tetracalcium aluminuoferrite (Aluminoferrite)
4CaO.Al2O3.Fe2O3 C4AF
Free Lime CaO CaO CaOf
Figure 11 describes the chain of reactions in the pyro-process and illustrates the
stages of clinker phase formation, beginning with the raw materials. The first four steps
mainly concern calcination of the raw meal associated with the release of CO2 and the
production of reactive lime CaO. At about 1000 oC, which is normally at the first rotary
kiln portion, C3A is produced, along with a small amount of C2S. As the material
proceeds along the kiln, the temperature rises, and at about 1280 oC, the iron and
alumina form the liquid phase, which facilitates the conditions for further C2S formation
and helps the martial flow smoothly inside the kiln. The liquid phase is also important
because it establishes a stable coating inside the kiln, which protects the kiln shell in
the higher temperature zone. Finally, the C2S combines with unreacted lime CaO at a
high temperature of 1450 oC to form the major clinker phase C3S.

33
Hilal Saif Al Dhamri 200676958
Figure 11 Estimated clinker chemical reactions91,92

34
Hilal Saif Al Dhamri 200676958
3.5 Common cement types used in Oman
3.5.1 Ordinary Portland cement (OPC) and sulfate-resisting cement
(SRC)
OPC and SRC are two types of construction cement commonly used in Oman.
Although both cement types undergo the same manufacturing steps, SRC clinker is
prepared using raw materials with a lower alumina content to maintain a C3A level
below 5% and meet the ASTM standard for this type of cement. This can be achieved
by reducing the alumina modulus (AM) while the raw meal is mixed.
3.5.2 Oil Well Cement (OWC)
OWC is defined as being based on coarsely ground sulfate-resisting Portland cement
clinker with one or more retarders (gypsum or lignosulfonates) to give it a long enough
thickening time to pump cement out at high temperatures and pressures. The amount
and type of retarder used are dependent on the oil well’s depth93.
This type of cement is used to construct a hard layer between the oil well casing and
the surrounding geological formation to prevent the well bore from collapsing. The well
bore is deep, possibly reaching 6,000 metres, with very high pressure (200 MPa) and
temperatures (up to 205 oC)94. There are a number of significant roles for OWC in the
process of oil well production. It protects oil-producing zones from salt water flow
coming from underground water, prevents collapses, and provides stability to the bore
hole. Moreover, it protects the well by, for example, preventing corrosion, reducing
groundwater contamination, having a strong bond, and acting as a secondary
casing86,87.
Cement slurry designed for well cementing is a function of various factors that should
be optimised for successful well operation. These factors include the well bore
geometry, casing type, formation geography, and specification of the drilling mud
used86.
OWC is manufactured the same as conventional types of cement, OPC and SRC.
However, the quality of the raw materials, in term of chemical composition, is
controlled to produce the raw meal and specific clinker design.

35
Hilal Saif Al Dhamri 200676958
Chapter 4
Experimental Section: Materials and Methods

36
Hilal Saif Al Dhamri 200676958
Chapter 4: Materials and methods
4.1 Overview of experimental programme
This investigation, which was planned as described in Figure 12, can be divided into
five major steps:
(1) collecting the raw materials,
(2) preparing the raw meal (Rm),
(3) preparing and characterising the clinker (Ck),
(4) preparing the cement (Cm), and
(5) characterising the hydrated cement (HCm).
These steps were defined as such because they follow the same material life cycle
experienced in the cement industry and cement applications. Appropriate analyses
and characterisations were performed at each step. Some of the techniques used, for
example, XRF, XRD, and SEM, were repeated in more than one stage, but the
operating conditions and sample preparation procedures remained the same. All of
the samples were not investigated at each stage; instead, the focus gradually
progressed through each stage (see Figure 12).
Because this project has a strong industrial focus, the focus was on practical samples
that could be made by the cement industry, from an economic standpoint and with a
chemical composition that meets cement quality specifications. Samples with different
amounts of OBM cuttings were chosen to observe the changes that occurred with
increasing OBM content.

37
Hilal Saif Al Dhamri 200676958
Figure 12 A schematic diagram showing the overall stages of sample preparation and the testing methods used at each stage.

38
Hilal Saif Al Dhamri 200676958
4.2 Raw materials
The raw materials used in the investigation were limestone, quartz-phyllite, iron ore,
kaolin and oil-based mud cutting (OBM cutting). All raw materials used in this
investigation apart from kaolin were sampled from Oman Cement whose source is the
quarry next to the factory. Kaolin was sourced from a quarry located 400 km away
from cement plant95. All raw materials were sampled after the initial homogenization
stage (blending beds) where the raw materials went through all the steps of quarrying,
crushing and stacking (see Figure 13).
The stacking underwent the usual industrial quality control procedures to ensure
consistent homogenization of the raw materials before the grinding stage. As a result,
the particle size of the collected samples was below 25 mm. All raw materials were
characterized by XRF and XRD when they were received. The OBM cutting was also
characterized by ICO-OES for the heavy and trace metals, plus moisture and organic
content determination. For further investigation of OBM cutting, thermogravimetric
analysis and XRD were performed.
4.2.1 Limestone (Ls)
Limestone is a major component in cement production due to its CaCO3 content which
is essential for the formation of the principal clinker component, alite. Oman is rich in
high-grade limestone, with a CaCO3 content above 95%. This is significant for the
cement industry since the higher the CaCO3 content, the more flexible can be the mix-
Additive quarry (QPh & Irone ore)
Limestone quarry
Kaolin quarry
Limestone mixbed
QPh mixbed
Iron ore mixbed
Kaolin mixbed
Crusher
Quality control
Cross-belt on-line
analyser
Stacker Re-claimer
Sampling points
To
mix
ing
an
d g
rin
din
g
Figure 13 Diagram illustrating the sampling points (black points) for the raw materials obtained from the cement industry

39
Hilal Saif Al Dhamri 200676958
design to meet the targeted specifications of cement e.g. chemical and physical
properties.
4.2.2 Quartzo-phillite (QPh)
An additional raw material essential for cement making is one with a high silica (SiO2)
content - quartz is one such material. The silica is important for the kiln reactions since
it will be combined with CaO to form different clinker phases. The Qurtzo-phillite (QPh)
materials located near the factory in Oman has a silica content which varies from 75%
to 85% SiO2.
4.2.3 Iron ore and kaolin
Iron ore and kaolin are additive materials used to correct the chemistry of raw mix.
Furthermore, a certain amount of Al2O3 and Fe2O3 are needed to enhance the reaction
in the kiln, by forming the flux (melting phase) during clinkerization and phase
formation in the kiln. Iron ore is available in commercial quantities next to the factory
with medium grade (Fe2O3 content range 40 – 45% wt/wt.).
Kaolin is transported by trucks to the factory and crushed in the same way as the other
raw materials. It is an essential source of Al2O3, ranging from 32% to 36% wt/wt95. This
low content of Al2O3 compared with bauxite would normally not be favored. However,
because bauxite is not available in Oman, and is therefore more expensive, kaolin is
used as a replacement96,97.
In fact, the shift from imported bauxite to kaolin has been shown to be advantageous
in this application economically and also chemically because of its high silica content
(40 – 47% wt./wt.)98.
4.2.4 Oil-Based Mud cutting
The OBM cutting was obtained from a drilling company in Oman (Petroleum
Development of Oman, PDO29). The cuttings were sampled from the PDO storage
yard of OBM cutting storage facility in Qaran Al-Alam (Qran Al-Alam oil field, oil field
no. 52, operated by Halliburton© Oman) as shown in Figure 9 and Figure 14.
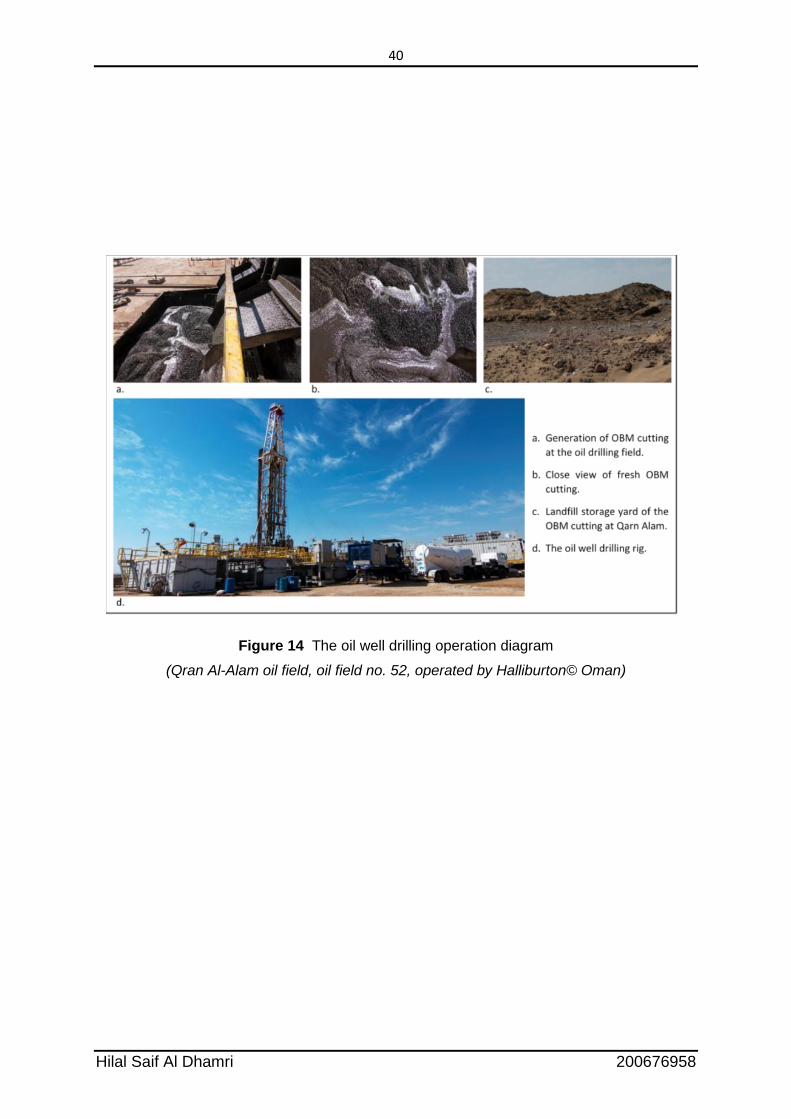
40
Hilal Saif Al Dhamri 200676958
Figure 14 The oil well drilling operation diagram
(Qran Al-Alam oil field, oil field no. 52, operated by Halliburton© Oman)

41
Hilal Saif Al Dhamri 200676958
4.3 Mix design and samples preparation
Samples were prepared from dried OBM cutting blended with a number of raw
materials used in the preparation of raw meal, namely; limestone, quartzo-phillite, iron
ore and kaolin. The chemical composition of these materials is given in Table 6. These
compositions of the blends were calculated to give the same phase composition as a
real Portland cement clinker. Using the Bogue’s calculation, the amount of C3S, C2S,
C3A and C4AF in raw meal after the heating process were calculated 99,100.
4.3.1 Mix design
The aim of the study was to investigate the effect of adding OBM cutting on clinker
composition and cement performance. The aim was to maximize the OBM content e.g.
10% and above. The mix design was cautiously made considering the following points:
- Maximum OBM cutting that could be added to produce clinker meeting standard
cement specification chemistry and physical properties.
- Preparing raw meal with lower burnability, or at least the same as the industrial raw
meal, and so does not required extra fuel to burn considering the overall heavy
metal content.
- Use minimum additives in the raw mix design such as iron ore and kaolin. This is
will contribute on reducing the cost of production as those materials are 30 to 50%
more expensive than limestone.
- Use minimum quartzo-phillite (QPh) which is the source of free silica (quartz).
Quartz is hard to burn101 and needs a higher temperature compared with silica
coming from other raw materials such as kaolin (clay).
- Maintain the heavy metal content in the prepared cement.
For raw material selection for preparation of the right chemistry of the raw mix for the
clinker production process, a mix calculation was required to get the optimal portion of
OBM cutting used together with the raw materials. For this, an Excel sheet was used,
as shown in Figure 15. The composition of the clinker was calculated to provide the
same phases as the main phases of a real Portland clinker. Using the Bogue’s
calculation, see below, the theoretical amount of C3S, C2S, C3A and C4AF in raw meal
after the heating process was calculated102,90.
The theoretical calculation shows OBM cutting could be added to a maximum 55% to
produce clinker with the correct OPC specification. The advantage of this mix (RM55%

42
Hilal Saif Al Dhamri 200676958
as stated in Table 7) is that it was prepared using only 4 raw materials namely;
limestone, kaolin, iron ore and OBM cutting. There was zero quartzo-phillite in the mix
and silica supply could be provided by other raw materials.
Bogue’s equations:
C3S (%) = 4.071·(CaO) – 7.602·(SiO2) – 6.718·(Al2O3) – 1.43·(Fe2O3) Equation 1
C2S (%) = 2.87·(SiO2) – 0.754·(C3S) Equation 2
C3A (%) = 2.65·(Al2O3) – 1.692·(Fe2O3) Equation 3
C4AF (%) = 3.043·(Fe2O3) Equation 4
To ensure the clinker quality, the following composition parameters were controlled.
Typically, the lime saturation factor (LSF) was defined as 0.92 to 0.96, the silica ratio
was set to 2.35 to 2.6 and the alumina modului (AM) was set to 0.69 – 1.25 depending
on the type of clinker to be produced (OPC has AM greater than 1.00, SRC has AM
0.85 and OWC has AM less than 0.69)103.

43
Hilal Saif Al Dhamri 200676958
Figure 15 The mix design program in MS Excel sheet
𝐿𝑆𝐹 =𝐶𝑎𝑂
2.8 ∙ 𝑆𝑖𝑂2 + 1.18 ∙ 𝐴𝑙2𝑂3 + 0.65 ∙ 𝐹𝑒2𝑂3 Equation 5
𝑆𝑀 =𝑆𝑖𝑂2
𝐴𝑙2𝑂3 + 𝐹𝑒2𝑂3 Equation 6
𝐴𝑀 =𝐴𝑙2𝑂3
𝐹𝑒2𝑂3 Equation 7

44
Hilal Saif Al Dhamri 200676958
Figure 16 Theoretical C3S and C2S contents as a function of OBM cuttings content in raw meal.
Note: The two figures show theoretical predicted C3S and C2S contents derived from Bogue’s equations. The two graphs were established by changing the % OBM cutting in the raw mix. The two grey shadows highlight the % range acceptable and practically possible to achieve. This range is the target in cement manufacture known to produce clinker meeting the necessary standard specifications and in accordance with Oman Cement Company’s operating quality control setpoints.
50
60
70
80
90
100
110
120
130
140
150
160
170
180
Th
eore
tical
C3S
% in
Clin
ker
0
5
10
15
20
25
30
35
40
0.0
0 4 8
12
16
20
24
28
32
36
40
44
48
52
56
60
64
68
72
76
80
84
88
92
96
10
0
Th
eore
tical
C2S
% in
Clin
ker
% of OBM added in Raw Meal
The % range acceptable and
practical possible to achieve. This
concentration range is the
targeted in cement manufacturing
to produce clinker that can
perform and meet the
specification cement standard.

45
Hilal Saif Al Dhamri 200676958
Table 6 Chemical composition of the raw materials used in this study.
Limestone QPH Kaolin Iron Ore OBM cutting
Main & minor oxides (% wt./wt.)
SiO2 3.60 76.30 41.28 18.28 20.90
Al2O3 0.55 9.20 33.27 10.32 4.74
Fe2O3 0.40 6.69 6.69 54.00 2.35
CaO 52.25 5.90 2.18 0.48 31.85
MgO 0.19 1.46 1.46 1.98 2.22
SO3 0.04 0.26 0.18 0.12 1.81
K2O 0.92 0.32 0.28 0.14 0.41
Na2O 0.06 0.12 0.21 0.18 0.89
LOI @ 950 oC 41.59 2.42 14.15 9.98 32.70
Trace oxides (mg/kg)
BaO - - - - 5500
Cr2O3 100 200 37000 100 100
MnO 100 1500 7600 100 300
Mn2O3 100 - - 100 300
P2O5 600 900 200 200 1100
TiO2 100 5400 4300 500 100
Table 6 shows the chemical composition of the raw materials used in this study. The
trace BaO content in OBM cutting is high compared to that in other raw materials. This
could be because of the oil content. Also it is noticed that the P2O5 content is high in
OBM cutting. In addition, kaolin shows high concentrations of Cr2O3 and MnO.
4.3.2 Raw meal samples (Rm)
Five raw meal mixtures were prepared by mixing different ratios of raw materials
according to theoretical mix-design calculations. Raw meal samples were prepared
with OBM cutting contents from zero (as a control sample) to 55%. A final sample was
prepared from 100% OBM, with no raw materials added. The samples prepared are
referred to as RmRef., Rm12, Rm55 and Rm100% respectively. In addition, one sample
of raw meal was obtained direct from a cement plant. This sample contained no OBM
cutting and was identified as Rmind and later Ckind. Selected raw meal mixtures are
given in Table 7.
The raw meals were prepared and homoginized by grinding the mixture in laboratory
drum mill (model TNS-50, Siebtechnik). The material fed into the drum mill was

46
Hilal Saif Al Dhamri 200676958
pulverized by the freely moving grinding media (steel balls ranging in size from 5–50
mm). As well as size reduction, the grinding process also aided material
homogenization. The machine has a volume of 55 dm3, runs at 50 rpm, and has a
grinding media weight capacity of 92 kg.
In addition to the aforementioned prepared raw meal, and to study the thermal
behaviour and understand the formation of clinker phases with temperature as a
function of OBM cutting content, fourteen additional raw meal mixtures (Table 7) were
prepared by mixing different ratios of raw materials according to the theoretical mix-
design calculation, increasing OBM cutting contents, from zero percent (as control
sample) up to 55%. A final sample was used comprising 100% OBM, with no raw
materials added.
Table 7 Composition of the raw meal mixes for the preparation of Portland clinkers
Raw meal Limestone Quartzo-phillite Kaolin Iron OBM cutting Total
RmRef.-0% 80.90 11.35 5.65 2.10 0.00 100.00
Rm0.5% 80.00 12.70 4.70 2.10 0.50 100.00
Rm1% 80.00 12.70 4.20 2.10 1.00 100.00
Rm2% 80.00 12.10 3.80 2.10 2.00 100.00
Rm3% 79.10 10.15 5.65 2.10 3.00 100.00
Rm5% 77.25 10.00 5.65 2.10 5.00 100.00
Rm7% 76.60 10.00 4.00 2.40 7.00 100.00
Rm10% 74.40 9.80 3.70 2.10 10.00 100.00
Rm12% 72.60 8.60 4.70 2.10 12.00 100.00
Rm15% 70.40 8.50 4.00 2.10 15.00 100.00
Rm20% 67.00 6.25 4.65 2.10 20.00 100.00
Rm30% 60.00 4.50 3.40 2.10 30.00 100.00
Rm55% 43.00 0.00 0.50 1.50 55.00 100.00
Rm100% - - - - 100.00 100.00
4.3.3 Clinker samples (Ck)
Nodules 5-8 mm in diameter were prepared from the raw meal by adding water. After
drying overnight at 120 oC, the dried raw meals specimens were fired using a platinum

47
Hilal Saif Al Dhamri 200676958
dish104 in a static air high-temperature furnace (Carbolite, model RHF 16/3). The
clinker was prepared according to Al-Dhamri and Melghit97 (Figure 17). The heating
rate was set at 10 oC/min. The sintering temperature was kept at 1450 oC for 45
minutes. Immediately after, the samples were cooled to below 100 oC using an air
blower.
Figure 17 The preparation steps of the Portland clinker and Portland cement in the laboratory
(after Al-Dhamri and Melghitt97)
The heating time of lab clinker preparation was based on the procedure followed for clinker
preparation in the Oman Cement Company10 laboratory, which is established with accordance
with the best optimum heating temperature for obtaining complete clinker formation.

48
Hilal Saif Al Dhamri 200676958
4.3.4 Cement samples (Cm)
Cement was prepared by grinding the clinker with gypsum. The grinding time varied
according to the clinker composition. The known cement standards such as Cement
Omani Standard105 (OS 7/2001), as well as British and European standards do not
specify fineness. However, the ASTM (ASTM C 150-99a Type I) does specify the
minimum requirement106. However, the cement was ground so that the Blaine fineness
fell within a specified range of 320 ± 50 cm2/g, as followed by the cement industry in
Oman. All samples were ground to fit the Blaine fineness close to this value.
The ratio of clinker to gypsum was rounded 6%, as shown in Table 8. The 6% added
gypsum was calculated using Equation 8, which is the difference between the desired
% SO3 content of the cement and the % SO3 in the clinker used divided by the % SO3
content in the gypsum added. The grinding was carried out using laboratory tube ball
mill (NETZSCH, D-8672, 3Kg grinding capacity). The milling of different clinker
samples was performed batch wise under identical conditions, which are shown in
Table 8.
Table 8 The cement grinding condition
Sample ID
Cumulative grinding time
Time Blaine Final
Blaine Particle size
Gypsum added
Minutes cm2/g cm2/g 45 µm 90 µm %
CmInd.-0%* - - 318 14.9% 1.5% 5.57 6.00
CmRef.-0%
21 280
335 13.3% 1.4% 6.02 6.00 29 303
34 335
Cm-12%
15 216
329 14.6% 1.3% 5.97 6.00 25 296
30 329
Cm-55%
15 227
324 14.1% 1.6% 6.07 6.00 20 256
30 324
*This sample was sampled from the cement plant.
The percentage gypsum required for desired SO3 in cement was calculated according
to the following formula107:

49
Hilal Saif Al Dhamri 200676958
𝑥 =𝑎 − 𝑐
𝑏× 100 Equation 8
Where:
x = % gypsum to be added to clinker
a = desired % SO3 in cement (2.60%)
b = % SO3 in gypsum (41.86%)
c = % SO3 in clinker
(0.08%, 0.10% & 0.06%, CkRef., Ck-12% & Ck-55% respectively)
4.3.5 Hydrated cement samples (HCm)
The reactivity of the cement powders was investigated by preparing pastes with
water/cement ratios of 0.45 to 0.55. The samples were cast in polyethylene vials where
they underwent curing for 2, 7 and 28 days in a water bath at a temperature of 20o C.
After the desired hydration time, the hydrated cement samples were cut into ½ mm
discs using a rotary saw. Hydration was stopped by immersion in isopropanol108 for 24
hours. The powdered samples were then collected and stored under vacuum until they
were taken for analysis.
The ½ mm disks were used for SEM analysis (Figure 18), as described in section
4.3.4. The powdered portion of the sample was ground further for XRD and DSC-TGA
analysis.

50
Hilal Saif Al Dhamri 200676958
Figure 18 Hydrated cement samples and isopropanol hydration stopping
Hydrated cement after 7 days curing, cut by saw to ½ mm disk, and the remainder ground for hydration stopping.
→ Hydrated cement hydration stopped using isopropanol, for cement cured for 28 days
½ mm disk

51
Hilal Saif Al Dhamri 200676958
4.4 Characterization and testing techniques
4.4.1 XRF and XRD
A small portion of this sample was weighed into a platinum crucible and lithium
metaborate / tetraborate flux added and mixed. The mixture was melted on a fusion
machine to get a solution which automatically poured to a platinum moulded where it
was cooled slowly to form a glass bead. The resultant glass bead was used for
analysis by X-Ray fluorescence (XRF).
XRF analysis was carried out using a PANalytical Axios Fast spectrometer to
determine the composition of the main oxides. XRF was performed with fixed detector
channels working at Argon and Methane gases with 9:1 ratio consecutively. The
radiation tube is Rhodium (SST-mAX) having power of 50 kV and 40 mA. The samples
were analysed at vacuum pressure of less than 10 Pascals.
For powder X-ray diffraction (XRD), the samples were analyzed at room temperature
using a CubiX3 PANalytical diffractometer, with Cu K radiation operating at 45kV and
40 mA. The measurements were carried out by step wise scanning method (2 range
from 10o to 65o) with scanning rate of 0.021o per second and a step time of 14 seconds
with full run lasting for 50 minutes. The crystalline phases were identified and refined
using Rietveld refinement available with the HighScore© program from PANalytical.
4.4.2 Loss on ignition (LOI) and Free lime test
LOI was determined in an oxidizing atmosphere by igniting a known mass of the
sample at 950 oC in a platinum crucible in an electrical muffle furnace109.
The free lime test measures the quantity of residual CaO after heating the raw meal
to the clinkerisation temperature (1450 oC). However, it is also an indication of the
burnability of the raw meal when measured at different temperatures - between 1100o
C and 1550o C. For example, hard burning raw meal has higher free lime content when
compared with another raw meal sample of different composition110. The free lime
content in any sample, either clinker or heated raw meal above 1100o C, could be
measured by XRD. Another method is by titration using the ethylene glycol testing
method, which is used in cement industries111. In this method, the percentage of free
lime is obtained by refluxing a known quantity of ground clinker (about 1 g) in an

52
Hilal Saif Al Dhamri 200676958
alcoholic solution of ammonium acetate under slow heating to boiling temperature.
The mixture is filtered and titrated with 0.04 M EDTA to the endpoint112,113.
4.4.3 Inductively Coupled Plasma (ICP-OES)
The raw materials (limestone, quartzo-phillite, iorn ore, kaolin and OBM cutting) and
the prepared clinker samples were tested for determination of the trace and heavy
elements. A small portion of the sample was weighed into a digestion vessel, to which
concentrated nitric acid, followed by concentrated hydrochloric acid was then carefully
added. The mixture was heated at 110 °C for 90 minutes to digest the sample and,
after cooling, diluted with deionized water. The mixture was filtered to separate any
remaining solid material, and the supernatant liquid decanted off for analysis. The
digested sample was analysed for metals using an inductively coupled plasma optical
emission spectrophotometer (ICP-OES) analytical instrument (Agilent 5110 SVDV)
with nebulizer flow of 0.70 L/min, plasma flow 12.0 L/min, Stabilization time 6 seconds
and RF power 1.20 kW.
The sample was sprayed into an argon plasma at approximately 10000 oC, at which
temperature of the sample atoms and ions emit light at particular wavelengths
dependent on the element and the intensity of which is proportional to the
concentration. Quantification was achieved by comparison of the emission signal for
each element with prepared metal standards. The concentration of the metals was
reported in mg/kg.
4.4.4 SEM-EDX
The prepared samples such as heated RMs (section 4.3.2), Clinker (CK section 4.3.3),
and hydrated cement (HCM section 4.3.5) were analysed by SEM-EDX. The aim of
the SEM analysis was different in each case. The SEM for RMs and clinker samples
was to identify the formation temperature of various clinker phases by scanning the
samples that had been burned at different temperatures from 1180 oC up to 1500 oC.
Also, the method was used to detect the presence of any trace elements.
SEM of the hydrated cement however was performed to observe the hydration of the
cement at different time periods (2, 7 and 28 days).
Polished section specimens were prepared by impregnating samples in epoxy resin
(mixing ratio 25:3) which was hardened at 40o C for 48 hours. The specimens were
ground on a rotating wheel with 10 Newton load and 90 RPM using silicon carbide
53
Hilal Saif Al Dhamri 200676958
paper (SiC) 600, 1200 and 2500 µm. Next, the specimens were polished using
diamond paste to 0.25 µm roughness. As a final point before investigation by SEM,
the specimens were exposed to carbon coating to prevent charging of the sample114.
The polished sections of the samples were studied in backscattered scanning electron
(BSE) mode using Carl Zeiss EVO MA15 SEM. The back scattered images of the area
of interest were obtained at a beam voltage of 15 kV with a working distance of 8 mm,
while 20 kV was used for the elemental maps.
4.4.5 DSC-TGA
The differential scanning calorimetry & thermogravimetric analysis (DSC-TGA) of the
raw meals (RMind, RMRef., ….. RM100%) was performed using DSC-TGA Universal
V4.5A TA Instrument (Simultaneous DSC-TGA). The samples were manually ground
to fine particles and 35 – 36 mg were analyzed using an alumina crucible. The heating
rate was 10 oC/min, under normal atmospheric condition from 20o C to 1450 oC 115.
4.4.6 Burnability test
The term burnability describes the nature of the raw meal and the ease with which the
principal clinker phases are formed at temperatures of 1450 or 1500 oC 110. It is an
indication of the mass transfer properties of the constituents of the raw meal.
Burnability is a function of time and temperature and it is measured by determining the
free lime content after heating the raw meal for time (t) at temperature (T)116,117.
CaOf % = f (t,T)
Burnability can be determined in a number of ways. Firstly, the free lime content can
be determined with a constant burning time and variable temperatures. Here, rising
free lime contents equate to low burnability. Alternatively, it can be defined by the time
taken at constant temperature to achieve a free lime content below 1.5 - 2.0%.
Increasing times correspond to low burnability. The former method was used in this
study. The burnability test was conducted for the samples Rmind, RmRef., Rm12%,
Rm55% and Rm100% by sintering them in laboratory furnace for 45 minutes at five
different temperatures (1300, 1350, 1400, 1450 and 1500 oC). After sintering, the
samples were cooled, ground and analyzed by the standard ethylene glycol testing
method to determine the free lime content 111,118.

54
Hilal Saif Al Dhamri 200676958
4.4.7 Petrographic analysis
Clinker samples were also investigated by optical microscopy. There are various
approaches to sampling clinker for examination by optical microscopy, and these vary
according to the purpose of the examination, such as studying kiln operation,
identifying problems, improving fuel consumption etc. One well known method of
sampling is that of Hofmänner (1973)119 who recommends sampling in intervals of five
minutes or less, taking three 2-kg samples, mixing, and quartering down to 500 g.
However, this step was skipped, as there was insufficient clinker produced in this
study, and it was judged sufficient to apply the following steps. The clinker sample was
crushed to 5-mm particles and quartered until an adequate amount remained for resin
encapsulation in a 25-mm-diameter. Particles were then randomly select from the
clinker subsequently exposed upon polishing. Each clinker nodule surfaces was first
flattened by coarse grinding, before the flattened nodule was placed in a plastic vial,
resting on its flattened surface. The vial was filled with 1:5 araldite mix (one part
hardener – HY951 and five parts resin CY-230). Next, the vial was placed in a
desiccator and evacuated, by means of a vacuum pump, for 30-40 minutes. Finally, it
was put in an oven at 50 ºC for 10 minutes and allowed to cool at room temperature.
The sample was ready for coarse grinding after breaking the plastic vial120.
An Ecomat III polisher and grinder, along with automat lapping oil and 120 to 200 mesh
carborundum powder were used for coarse grinding on a diamond grinding disc – 70
μm. The final grinding was done by using 600 to 1500 mesh carborundum powder on
a glass disc. The polishing was done on Metadi II polisher using 9, 6 and 3 micron
diamond polishing compound on a diamond grinding disc. Polished clinker samples
were etched to distinguish alite from belite using HF-vapour by cooling the sample to
10 oC below etching temperature prior to etching121. For viewing the aluminate phase,
samples were etched using 10% NaOH solution119,122. Polished clinker sections were
examined using a reflected light microscope (Olympus BX 60).
4.4.8 Degree of hydration (DoH)
The ½ mm disks prepared in section 4.3.5 were used to study the degree of hydration
by SEM-EDS analysis. The polished specimens were prepared using resin
impregnation method as described in section 4.4.4. The degree of hydration was
measured by acquiring 30 images at 400x magnification with a working distance of 8
mm and an acceleration voltage of 15 KeV using SEM Carl Zeiss EVO MA15. The

55
Hilal Saif Al Dhamri 200676958
maps were collected using Oxford Xmax SDD detector with 80 mm2 detector. The
grey-level histogram analysis was done using ImageJ software.
(a)
(b)
Figure 19 SEM Micrograph of hydrated cement.
(a) Cured for 7 days, and its (b) associated grey level histogram
4.4.9 Physical and mechanical testing
The specific gravity of cement was measured according to the Standard test method
for density of cement: ASTM C188-16123. The empty dry Le Chatelier flask was filled
to the mark between 0 and 1 mL with kerosene (recorded as Vi). Then, about 64 g of
dry cement sample was placed into the flask. The flask was half-filled with kerosene
and the mixture was stirred with a glass rod. The mixture was being continually stirred,
adding more kerosene until the flask was filled (recorded as Vf). For each sample, the

56
Hilal Saif Al Dhamri 200676958
measurement was repeated four times. The density of cement was calculated
according to the following equation:
P = M/Vd Equation 9
where:
P = Density of cement, g/cm3 M = Mass of cement, g Vd = Displaced volume of liquid, cm3 Vd= Vf - Vi where Vf is final volume and Vi is initial volume
The surface area of prepared cement samples was measured, as fineness by air
permeability (Blaine method), by obtaining the time taken for a known amount of air to
flow through a compressed cement sample bed of specified dimensions and porosity.
The test was carried under standard conditions at 20o C and humidity not exceeding
65%, the specific surface of the sample was correlated to t1/2 where ‘t’ was the time
taken for a known air volume to flow through the pressed cement bed124.
The setting time and the soundness of the cement pastes (cement-water ratio being
500 g: 125 ml) were determined according to the European Standard EN 196-3. Vicat
apparatus was used to determine the setting time by noting the penetration of a needle
into cement paste until it reached the specified depth. The soundness is determined
using Le Chatelier apparatus by noting the volume expansion of cement paste as
indicated by the relative movement of two needles125.
The compressive strength development of the various cement samples (Cmind, CmRef.,
Cm-12% and Cm-55%) was conducted using mortar samples according to the
European Standard for Portland cement testing. The cement mortars were prepared
by mixing cement, standard sand and distilled water with the ratio of 1:3:0.5
respectively. The standard sand used was supplied by Normensand, conforming to
ISO 679, EN 196-1 Germany. The cement mortars were prepared by mechanical
mixing and then compacted in a standard steel mold (dimensions 40 mm x 40 mm x
160 mm). The specimens in the mold were stored in a moist atmosphere overnight.
Demolded specimens were stored in a water bath for periods of 2, 7 and 28 days at
98% relative humidity and 20o C ± 2. After each period, the specimens were tested for
compressive strength using the compressive machine (made ELE, model ADR-1500)
with a lab temperature of 22o C ± 2o C and lab humidity of 55% ± 3%. Each strength
result was an average of three measured data126.

57
Hilal Saif Al Dhamri 200676958
4.4.10 Isothermal Conduction Calorimetry
Isothermal conduction calorimetry (50), ICC, was used to study the hydration process
of cement by measuring the heat given off by the hydrating cement as a function of
time. The heat given off by a sample is compared to a reference sample. The reference
used had the same thermal properties of the sample. Quartz has close specific heat
capacity to cement (quartz = 0.8 J.g-1.K-1, cement = 0.75 J.g-1.K-1). Six grams of dry
cement sample were mixed with three ml of distilled water, keeping the water to
cement ratio of 0.5. The mixing was performed outside the calorimeter. The mix was
placed in a 20 mL disposable polyethylene ampoule and the measurement was
performed using TAM Air with eight channel isothermal heat flow calorimeter. The
container was placed in a chamber which was then placed in water bath at constant
temperature of 20o C. All samples were prepared after each other and then loaded into
ATM Air at the same time. The determination testing was set for measuring heat of
hydration over 28 days. The data obtained was used to establish two type of graphs,
first heat of flow rate evolved from the cement hydration against the time. And second,
graph that showing total heat resulted from the hydration against the time127.
Figure 20 Overview of the calorimeter setup
showing two sets of samples: one containing 9g of sample paste and the reference sample containing 9g of a quartz analogue.

58
Hilal Saif Al Dhamri 200676958
Chapter 5
Characterisation of OBM and OBM cuttings

59
Hilal Saif Al Dhamri 200676958
Chapter 5: Characterisation of OBM and OBM cuttings
5.1 What is in OBM?
OBM is a fluid prepared to be used in the oil drilling process. There are several types
of OBM, and the specific type used depends on different factors, such as the well’s
depth, geological formation, and ground composition. The ground and geological
conditions are the basic principles for decision-making regarding the specific type of
fluid to be used. Some areas, where the shell is an active type that reacts with water
and unlike condition are formed, which cause the damage to the well during the drilling
process. In critical conditions, oil is used to replace the water in the fluid. The major
components of OBM are oil, water, mud, and an additive. It is used because it
facilitates drilling underground where the temperature and pressure are excessively
high.
The basic components of OBM:
1- Basic fluids, such as oil or diesel.
2- Mud, a solid part of the fluid, which consists of water, clay, and sand.
3- Additives, which control the properties of OBM, such as weight (specific gravity
or density), viscosity, fluid loss, and chemical reactivities.
Diesel is banned from use in Oman by law 46 to meet the environmental rules and
regulations agreed to in the 1980s regarding the use of oil containing aromatic
compounds, such as oil-based drilling fluids 128,129. Diesel is 5–10% polyaromatic
hydrocarbons (PAH)130 so falls under the hazardous waste category and has a highly
toxic impact. Low-toxicity oil synthetics are formulated and known as nonaqueous
drilling fluids. The reported lethal concentration (LC50) for the aquatic toxicity of
nonaqueous-based fluids is 1560 – 7131131 mg/L, tested on an amphipod species
called Corophium volutator. Diesel-based OBM’s LC50 is 840132 mg/L when tested on
the same species and, according to the United States’ Environmental Protection
Agency (EPA), its drops to 639133 mg/L when tested on Leptocheirus plumulosus,
another amphipod species.
A few examples of base oils used in Oman in the preparation of OBM and their toxicity
are as follows:

60
Hilal Saif Al Dhamri 200676958
- Mineral oil of alkanes (paraffin) is oil that has carbon-hydrogen single bonds with
a carbon chain link of C10 to C22. This type of oil has lower toxicity and higher
viscosity, but it is costly.
- Mineral oil of Alkenes (olefins) is oil that has a double bond between carbon and
hydrogen and a carbon chain length of C15 to C18 (linear, iso or blends). This type
of oil is moderately viscous and moderately cost134. It is also less toxic than diesel-
based OBM.
The mud in OBM is comprised of inorganic colloids, which are active clay ingredients,
and has different particles sizes depending on its design. In Oman, the particle size
used is fine, in the range of 44–74 µm in sieve size 325135 with a large surface area.
The mud’s properties are important when selecting the type of OBM. It plays a major
role in stabilising the well during the drilling process, which depends largely on the
interaction between OBM and the exposed shale formation. The colloids in the mud
can be classified into two categories: (1) clay minerals and (2) organic colloids. Clays
consist of a heterogeneous blend of very fine minerals, such as quartz, feldspars,
calcite, and pyrites136, and have a mica-type structure in which the flakes are
composed of small crystal platelets stacked together and facing each other to form a
unit layer. Each unit layer consists of an octahedral sheet and one or two sheets of
silica tetrahedra137 as shown in Figure 21.
Figure 21 Schematic mineral structure of clay
(Grim137 and Darley et al.136)

61
Hilal Saif Al Dhamri 200676958
Most drilling companies in Oman use Barite as an additive to control the properties of
OBM, such as its weight (specific gravity or density), viscosity, fluid loss, and chemical
reactivities. Barite (BaSO4) is chemically inert and insoluble. Adding Barite gives OBM
a specific gravity of 4.2–4.5 g/cm3, meeting the API’s specifications138, so its role is a
weighting agent used to increase the density of OBM as desired based on the well
conditions. OBM’s density is important because well bore fluid must have an adequate
density to convey the cuttings to the surface, and it contributes to the stability of the
bore hole 139 by increasing the pressure exercised by the well bore fluid against the
surface of the hole140. In addition, higher density results in a higher penetration rate
during the drilling process141. Other additives are used very infrequently, such as
calcium carbonate, hematite, ilmenite, and manganese tetroxide. However, barite is
widely used because it is the most effective and economically feasible.
5.2 What is in OBM cuttings?
OBM cuttings are a mixture of OBM and the drilling cuttings produced during the oil
well drilling process. The variation in chemical analysis of OBM cuttings is very high
compared to regular raw material obtained from a specific quarry. This is due to the
nature of the oil drilling location. OBM cutting analyses obtained from different
literature are summarised inTables 9 and 10.
The chemical analysis of the major and minor oxides show some consistency on
oxides important to the cement industry. The concentrations of SiO2 and calcium
carbonate (as CaO) fall within the cement raw materials specification as additional
additives rather than major constituents.
The XRD analysis of the OBM cuttings obtained and shown in Figure 22 concludes
that the OBM contains mainly calcite (CaCO3), dolomite (CaMg(CO3)2), quartz (SiO2),
iron oxide (Fe2O3) and Barite (BaSO3).
In the XRD and chemical composition, most analyses show that the OBM cuttings are
a heterogeneous mixed material composed of a few major types: gravel, limestone,
clay and shale. The gravel and limestone are cuttings from the oil drilling process that
contaminate the circulated material and become part of the OBM cutting. Limestone
(calcite) and clay are added during the preparation of the OBM. Shale is of low CaO
content (below 40%) and high SiO2 content (above 20%)76. The alumina content in

62
Hilal Saif Al Dhamri 200676958
OBM cuttings is probably coming from the clay that used in OBM preparation. The
major mineral in clay is alumina in the form of aluminium silicates. In some cases, as
shown in Table 9, this content is above 10%. Alumina is present in many forms, such
as bauxite, gibbsite and kaolinite 142. However, the OBM cutting used in this study has
a lower alumina content (4.47% wt.).
Figure 22 X-ray diffraction pattern of OBM cutting
The XRD (Figure 22) and chemical analysis also showed the presence of Barium in the
OBM cuttings in a form of barite (barium sulphate, BaSO4). The major source of barite
is the preparation of the OBM used during the oil well drilling process. It is used as an
additive (known in drilling engineering as weight material or a weighting agent) and
has a major role in the drilling process. The weight material is added in the preparation
of OBM to develop a mud system that yields good well stability. Density, or mass per
unit volume, is one factor controlled by this material during the well engineer’s mix
design. The wellbore OBM must have adequate density to transfer the cuttings to the
surface during the drilling process140. Besides increasing density, the weight material

63
Hilal Saif Al Dhamri 200676958
also creates sufficient hydrostatic pressure in the hole and minimizes OBM slurry loss
by forming a thick filter cake on the walls of the well.
Example of economic weight material are powdered minerals of barite, calcite or
hematite. Barite is an inert and insoluble chemical compound with a specific gravity of
4.2–4.4 and hardness 2.3–3.5. It is the most economic material widely used as
weighting material in the well drilling process140,143.
OBM cuttings also contain heavy and trace metals from several sources in very low
concentrations. These are mainly from the additives used or from the cutting and the
crude oil. PDO specifies the maximum permissible metal concentration in by-products
(drilling waste) generated as a result of oil drilling operations. These include
contaminated sludge, soil, WBM cuttings and OBM cuttings144,145. The metal
concentration must be within the specified limits in order for the material to be disposed
of in engineered landfills or other facilities subject to approval from the environmental
authority in Oman. When comparing the limits of the PDO and API guidelines, few
metals are not specified by PDO, such as As and Ba; only the metal Se is not specified
in API. The limits given in the PDO specifications and API guidelines are similar. The
OBM cuttings obtained in this study have metal contents that fall below the limits
specified by PDO.
The trace element content (also known as potentially toxic elements, PTE146) in OBM
cuttings is reported in Table 10 and presented in Figure 24. Because barite is a
common minerals in the OBM used, BaO levels were high in the OBM cuttings. These
were much higher than when compared with other results reported for OBM cuttings
in the literature44,52,54 as could be seen in Table 10.Other trace elements could result
from contamination by the oil used to replace the water base in the preparation of the
OBM slurry before pumping the mud in the drilling hole.
API has developed criteria for drilling waste based on well-developed scientific
information147, stated in Table 10. trace metals in the studied OBM cuttings were much
lower than the limits specified by the API guidelines147. The concentrations of As, Cd,
Cu and Ni are 9.8, 1, 18 and 3.3 mg/Kg respectively, which indicates that the OBM
used meets the environmental requirement for use of oil-based fluid, and thus reflects
lower trace elements that threaten the environment. In addition, the highest
concentrated trace element is barium, which still shows a lower concentration than the

64
Hilal Saif Al Dhamri 200676958
stated limits of API at only 5,500 mg/Kg, against the 180,000 mg/Kg maximum limit
from API. Other elements of environmental concern, zinc and lead, are 107.6 and 32.8
mg/Kg, respectively. This was similar to the conclusion of many studies of OBM
cutting, which reported 102.4 mg/Kg (Ayati et al. 54) and 125 mg/Kg (Abbe et al. 44) for
zinc and 38.5 mg/Kg (Ayati et al. 54) for lead. In addition, P2O5 is known to retard
cement and potentially, in combination with SO3, to stabilize belite148.
Table 9 OBM cuttings major and minor chemical composition from different sources (%wt.)
Reference 45 54 52 27 71 44 This study
SiO2 44.85 41.18 5.47 38.5 17.64 47.60 20.90
Al2O3 14.19 12.75 1.29 9.9 2.36 13.54 4.74
Fe2O3 7.49 3.29 0.56 4.1 1.23 6.34 2.35
CaO 17.51 14.95 25.05 13.0 28.17 2.78 31.85
MgO 1.76 7.34 3.47 3.6 3.64 2.31 2.22
SO3 3.11 - 38.41 5.0 3.96 - 1.81
K2O 2.69 2.53 0.27 1.7 0.56 2.33 0.41
Na2O 1.05 17.32 3.29 1.1 1.48 1.17 0.89
Cl 1.29 0.31 1.23 0.01
LOI 8.2 22.9 19.35 11.63 32.70
Moisture 14.5 2.30 17
NCV* 633 633 -
BaO 4.98 11.39
TiO2 1.08 0.65 0.10
*Net caloric value in kcal/kg OBM cutting
Table 10 OBM cuttings trace & heavy elements analysis (mg/Kg, dry solid) 44,52,54
Refe
rence
54 52 44 This study
PDO specification145 API
guidline147 Maximum permissible
concentration
As 11.8 - 11.8 9.8 NS* 41
Ba 32.02 - - 5500 NS 180,000
Cd - 0.44 0.3 1 20 26
Cr 74.3 0.48 116 100 1000 1,500
Cu 23.9 3.43 32.9 18 1000 750
Hg - - - 0.2 10 17
Ni 36.0 0.34 65 3.3 300 210
Pb 38.5 149.02 11.2 32.8 1000 300
Se - - - 3.4 50 NS
Zn 102.4 0.20 125 107.6 3000 1,400
*NS: not specified

65
Hilal Saif Al Dhamri 200676958
Figure 23 The chemical composition (major oxides) of OBM cuttings
(average of 20 samples)
Figure 24 The trace and heavy elements content of OBM cuttings
(average of 20 samples)

66
Hilal Saif Al Dhamri 200676958
Chapter 6
The effect of OBM cuttings on the clinkerisation process

67
Hilal Saif Al Dhamri 200676958
Chapter 6: The effect of OBM cuttings on the clinkerisation process
6.1 Clinker phase formation
XRD patterns reveal changes in clinker phase composition as a function of the OBM
cutting content. The main phases in all the investigated clinkers are reported in Figure
25, namely alite (C3S), belite (C2S), tricalcium aluminate (C3A) and ferrite (C4AF). The
concentrations of alite and belite versus OBM cutting content are reported in Figure
26. This figure shows the results from both the Rietveld refinement of the XRD patterns
and theoretical calculations based on Bogue equations Table 11.
Figure 25 XRD patterns of the prepared clinkers.
There were no discernible changes in the alite or belite polymorph with OBM cutting
content (Figure 25). However, the levels of alite and belite formed were dependent on
the OBM cutting content (Figure 26). This result was not predicted by the Bogue

68
Hilal Saif Al Dhamri 200676958
calculations, but the Rietveld refinement data showed a gradually decreasing alite
content (and corresponding increasing belite content) with increasing OBM cutting
content. Indeed, it is noteworthy that the Bogue calculations underestimated the alite
content and overestimated the belite content at OBM cutting content up to 5%.
While the industrial clinker showed the highest levels of alite, adding OBM cuttings to
the reference raw meal led to increased alite content. It was not until the OBM cutting
level was over 15% that the alite content dropped below that observed for Ckref. These
differences could be explained while exploring the other parameters, such as the
influence of trace element content, raw material characterisations, and OBM cuttings’
behaviour. However, the reference clinker sintering conditions were likely different to
those of the industrial clinker produced in a real cement kiln, for example the absence
of mixing under lab conditions.
Figure 26 Clinker phase contents derived from Rietveld analysis and Bogue calculations.
Rietveld analysis (thick, black line) Bogue calculations (grey, dotted line)

69
Hilal Saif Al Dhamri 200676958
Table 11 Chemical oxide and clinker phase composition of the prepared clinker
Ckind. CkRef. Ck-12% Ck-55% Ck-100%
Major oxides (% wt./wt.)
SiO2 22.19 22.58 21.79 21.88 32.49
CaO 65.45 65.32 65.87 65.68 51.55
Al2O3 4.06 5.46 5.37 5.02 7.82
Fe2O3 4.07 3.86 3.82 3.88 3.88
LOI @950 oC 0.25 0.12 0.07 0.06 0.04
Minor oxides (% wt./wt.)
MgO 0.78 0.81 1.24 1.43 1.66
SO3 1.40 0.30 0.83 1.57 0.33
Na2O 0.25 0.32 0.35 0.34 0.20
K2O 0.39 0.25 0.07 0.02 0.11
Trace oxides (×100 mg/kg)
BaO - - 23 85 115
Cr2O3 12 11 7 6 5
MnO 4 5 4 4 4
P2O5 9 12 11 12 12
TiO2 24 32 28 20 20
Clinker Module factors
LSF 92.53 90.5 94.33 94.22 48.45
SM 2.46 2.42 2.37 2.46 2.95
AM 1.22 1.41 1.41 1.29 2.02
Clinker main phases (%) by Bogue149,93
C3S 64.66 52.06 60.97 61.78 -
C2S 14.93 25.55 16.57 16.21 <36.63
C3A 3.87 7.94 7.77 6.74 14.16
C4AF 12.39 11.75 11.62 11.81 11.80

70
Hilal Saif Al Dhamri 200676958
6.2 CaCO3 decomposition
Thermal analyses of various raw meal samples showed that the calcination
temperature decreased with OBM cutting content increases. Calcite decomposition
occurred at 817 oC when no OBM was in the sample, falling consistently with
increasing OBM cutting content until the OBM cutting alone (Rm100%) showed
decomposition at 763 oC. The greater than 50 oC decomposition temperature
difference between limestone and OBM cuttings is of interest. To understand why the
addition of OBM cutting reduces the calcination temperature, it is important to study
the nature of the calcite in OBM cuttings and compare it with that in the limestone.
Many studies150–154 have reported limestone reactivity and linked it to the calcite
structure. Different grain sizes155 and impurities within the limestone can cause
variations in the limestone’s textural and mineralogical properties and, subsequently,
influence the calcination temperature156. This may also influence both the
crystallisation temperature in different phases of the clinker formation and free lime
content in the produced clinker117,157. It has also been reported that the presence of
dolomite in limestone helps speed up the calcite decomposition rate157.
In 1962, Dunham158 established a systematic classification scheme for carbonate
sedimentary rocks. Initially known as the ‘Dunham Classification’, it was later modified
by Embry and Kloven159–161 to include coarse-grained limestone and became known
as the ‘modified Dunham Classification’. It has become the most commonly used
classification in petrographic thin sections for identifying and distinguishing different
types of limestone based on the grain-size, ratio, shape and microstructure.
The Dunham classification divides limestone into six sub-classes based on the
presence or absence of mud supporting the carbonate grains, the grain content, and
nature of the matrix during deposition. Limestone may be further defined by two sub-
groups: (1) grain-supported limestone and (2) mud-supported limestone. This division
depends on the percentage of the grains (known as allochems) or mud matrix (known
as orthochems). Grain-supported limestone is characterised by a texture with little or
no lime mud but an abundant framework of grains that support each other, while the
mud-supported limestone consists of grains floating in a muddy, mainly calcitic
matrix162.

71
Hilal Saif Al Dhamri 200676958
Analyses of petrographic thin sections of the limestone used here shows calcite
crystals of a depositional texture, with no regular shape and unevenly distributed
without common direction, (Figure 27). The grains are coarse (>3mm) and compact
with no void space between calcite crystals, appearing flat and with some fractures.
This limestone can be classified as crystalline limestone according to the Dunham
classification158.
The OBM cuttings, meanwhile, show different petrography, with the calcite being mud-
supported with loosely packed grains and high porosity. The clay grains are mostly
present as developed clusters and immersed in oil. Lath-shaped plagioclase grains
with sharp grain margins are also present as shown in Figure 27 (c) & (d). The calcite
show round sub-millimetre grains, which are highly brittle and fragile in nature. Later
XRD analyses of OBM cuttings show the presence of dolomite. Therefore, the OBM
cuttings’ classification can be considered be a mix between two or three types of
limestone, falling between mudstone and Wake stone. However, the classification is
certainly different from the limestone used in this research.
These differences help explain the lower decomposition temperature of OBM cuttings
compared to limestone. First, OBM cuttings contain dolomite, while none is present in
the limestone. Dolomite in limestone lowers the decomposition temperature of the
calcination process. Marinoni163 showed that limestone decomposition starts with the
rapid dissociation of dolomite in the first few min, followed by calcite decomposition.
Dolomite dissociation occurs in a single step without a calcite intermediate phase. This
suggests that the presence of dolomite reduces the calcination activation
energy117,157,163. Marinoni157 proposed that limestone dissociation starts with dolomite
decomposition, resulting in the formation of grain cracks due to the CaMg(CO3)2
structure, increasing the surface area, allowing CO2 diffusion157,153,164.
The lower decomposition temperature in OBM cuttings may also be related to the
calcite texture therein, which differs from the calcite in limestone as explained above.
Finally, OBM cuttings are more porous than limestone, allowing more surface area for
heat transfer. As seen petrographically, the calcite grains float in the mud, with larger
spaces between grains than in the limestone (Figures 28 [c] & [d]).
Similar results were obtained by Marinoni et al157 and Galimberti et al117 when studying
the thermal decomposition and burnability of limestone used to manufacture industrial

72
Hilal Saif Al Dhamri 200676958
cement clinker. Using different limestone sources revealed that the texture of mud-
supported limestone had a strong impact on the calcite decomposition temperature
and its decomposition rate. According to the Dunham calcite classification160,161, raw
meal where the limestone is of grain-supported origin is more reactive.
Figure 27 Limestone and OBM cutting petrography analysis
The calcite grain size also has an effect on both the rate of decomposition and the
temperature at which decomposition occurs. Coarser grains show higher
decomposition temperatures and lower rates of decomposition91, as illustrated in
Table 12.

73
Hilal Saif Al Dhamri 200676958
Table 12 The effect of calcite grain size on the dissociation of limestone (according to Chatterjee 91)
The effect of particle size was confirmed by grinding the limestone for 5 min and then
obtaining two fractions: one passing a 212-micron sieve and one passing a 63-micron
sieve. These two fractions were compared against ground OBM cuttings passing
through a 212-micron sieve. The particle size distributions of the three resultant
materials are comparable to materials used in a cement plant and are shown in Figure
28, along with thermogravimetric analysis (TGA) of the three samples. The finer
limestone decomposed at a lower temperature than the standard limestone, with OBM
cuttings decomposing at an even lower temperature. Thus, the lower decomposition
temperature of OBM cuttings may be explained by the finer calcite grains (Figures 28
[c] & [d]) and the presence of dolomite. The calculated activation energies (Ea) of
CaCO3 decomposition for limestone and OBM cutting are 154.43 J.mol-1 and 181.46
J.mol-1 respectively (Figure 29), confirming the observations made by Chatterjee et
al.91.
Crystallinity Grain size, mm Relative rate of
dissociation
Relative dissociation temperature
Very coarse grained > 1.00 Lowest Highest Coarse grained 1.00 – 0.50 Medium grained 0.5 – 0.25 Fine grained 0.25 – 0.10 Very fine grained 0.10 – 0.01 Microcrystalline < 0.01 Highest Lowest

74
Hilal Saif Al Dhamri 200676958
Figure 28 Particle-size distribution (top) and decomposition temperature (below) of fine-limestone, limestone, and OBM cutting.

75
Hilal Saif Al Dhamri 200676958
Figure 29 Activation energy values of CaCO3 decomposition reactions in limestone and OBM cutting.
6.3 Burnability
Figure 30 shows the burnability data obtained in this study. Figure 30 (a) shows the
data obtained from cement industry raw meal (RmInd.) and the reference raw meal
prepared in the laboratory (RmRef.). The free lime content for both mixes fell with
increasing temperature. However, the free lime content of RmInd was always greater
than that of RmRef, with the difference between the two decreasing with increasing
temperature, until the difference was minimal at 1400 oC and above. The higher free
lime content for RmInd could be due to its higher LSF, i.e. 92.53 compared to 90.50 for
RmRef. Thus, there is more CaO to be consumed during clinkering. This is supported
by the convergence of the two data sets with increasing temperature. Both mixes
showing similar burnability behavior validates the use of the reference raw meal in
comparisons with raw meal prepared using OBM cutting.
Figure 30 (b) shows the burnability results for RmRef plus raw meal prepared using
12%, 55% and 100% OBM cuttings. Despite the falling free lime contents with
increasing temperature, there was an increase in free lime with increasing OBM cutting
content, suggesting harder burnability. However, this did not apply to the sample

76
Hilal Saif Al Dhamri 200676958
prepared from 100% OBM cutting. This sample showed very easy burning behaviour
(Figure 30 c). The free lime dropped significantly, even at 1300 oC (0.2% free lime),
then showing only 0.02% free lime content when heating at 1500 oC. However, as
shown by XRD analysis (Figure 31), when burned at 1200 oC, the 100% OBM cutting
showed belite formation and a very low free lime content. Higher temperatures still led
to no alite formation due to there being no CaO remaining, as shown in Figure 31. This
was confirmed by SEM-EDX analysis (Figure 32), where no alite was observed. The
absence of alite can easily be understood in terms of the LSF, which at 48.45 was
considerably lower than for all of the other samples.
The consumption of calcium oxide to form C2S at temperatures below 1300 oC
explains the low free lime concentrations in the Ck-100. While Clk-55 contains more
calcium oxide (e.g. higher LSF factor), part of it reacts to form C2S while some remains
to react with C2S to form C3S at higher temperatures (above 1450 oC). This
thermodynamic chemical reaction is reversible, meaning that when the temperature
drops, the C3S decomposes to free lime and C2S, especially if the cooling process is
slow, resulting in increased the free lime content in the clinker burned at a higher
temperature if the clinker is not quenched (rapid cooling).
Figures 34 to 36 show the SEM analysis of raw meal burned at different temperatures
to study clinker phase formation at each temperature (e.g. 1200 to 1500 oC). The
observation of each SEM images are presented within the figure. Also the EDX images
of corresponding SEM images are shown in Figures 37 to 41.

77
Hilal Saif Al Dhamri 200676958
Figure 30 The burnability tests of the raw meal at different burning temperatures. Top: reference sample vs. industrial raw meal Bottom: reference sample vs. raw meals with 12%, 55% and 100% OBM cuttings
11.88
3.01
1.15
0.630.19
8.54
1.95
0.990.5 0.17
8.77
3.85
2.462.4
1.04
9.52
6.55
5.17
3.22
2.59
0
2
4
6
8
10
12
1300 1350 1400 1450 1500
Fre
e lim
e
% w
t./w
t.
Temprature, oC
RMind-0%
RMRef.-0%
RM12%
RM55%
±0.54 ±0.83 ±1.09 ±0.33
±0.34 ±0.13 ±0.07 ±0.72
±0.4 ±0.06 ±0.18 ±0.1
±0.35 ±0.14 ±0.07 ±0.49
±0.08 ±0 ±0.04 ±0.38
±0.54 ±0.83 ±1.09 ±0.33
±0.34 ±0.13 ±0.07 ±0.72
±0.4 ±0.06 ±0.18 ±0.1
±0.35 ±0.14 ±0.07 ±0.49
±0.08 ±0 ±0.04 ±0.38
±0.54 ±0.83 ±1.09 ±0.33
±0.34 ±0.13 ±0.07 ±0.72
±0.4 ±0.06 ±0.18 ±0.1
±0.35 ±0.14 ±0.07 ±0.49
±0.08 ±0 ±0.04 ±0.38
±0.54 ±0.83 ±1.09 ±0.33
±0.34 ±0.13 ±0.07 ±0.72
±0.4 ±0.06 ±0.18 ±0.1
±0.35 ±0.14 ±0.07 ±0.49
±0.08 ±0 ±0.04 ±0.38
±0.54 ±0.83 ±1.09 ±0.33
±0.34 ±0.13 ±0.07 ±0.72
±0.4 ±0.06 ±0.18 ±0.1
±0.35 ±0.14 ±0.07 ±0.49
±0.08 ±0 ±0.04 ±0.38
±0.54 ±0.83 ±1.09 ±0.33
±0.34 ±0.13 ±0.07 ±0.72
±0.4 ±0.06 ±0.18 ±0.1
±0.35 ±0.14 ±0.07 ±0.49
±0.08 ±0 ±0.04 ±0.38
±0.54 ±0.83 ±1.09 ±0.33
±0.34 ±0.13 ±0.07 ±0.72
±0.4 ±0.06 ±0.18 ±0.1
±0.35 ±0.14 ±0.07 ±0.49
±0.08 ±0 ±0.04 ±0.38
±0.54 ±0.83 ±1.09 ±0.33
±0.34 ±0.13 ±0.07 ±0.72
±0.4 ±0.06 ±0.18 ±0.1
±0.35 ±0.14 ±0.07 ±0.49
±0.08 ±0 ±0.04 ±0.38
±0.54 ±0.83 ±1.09 ±0.33
±0.34 ±0.13 ±0.07 ±0.72
±0.4 ±0.06 ±0.18 ±0.1
±0.35 ±0.14 ±0.07 ±0.49
±0.08 ±0 ±0.04 ±0.38
±0.54 ±0.83 ±1.09 ±0.33
±0.34 ±0.13 ±0.07 ±0.72
±0.4 ±0.06 ±0.18 ±0.1
±0.35 ±0.14 ±0.07 ±0.49
±0.08 ±0 ±0.04 ±0.38
±0.54 ±0.83 ±1.09 ±0.33
±0.34 ±0.13 ±0.07 ±0.72
±0.4 ±0.06 ±0.18 ±0.1
±0.35 ±0.14 ±0.07 ±0.49
±0.08 ±0 ±0.04 ±0.38
±0.54 ±0.83 ±1.09 ±0.33
±0.34 ±0.13 ±0.07 ±0.72
±0.4 ±0.06 ±0.18 ±0.1
±0.35 ±0.14 ±0.07 ±0.49
±0.08 ±0 ±0.04 ±0.38
±0.54 ±0.83 ±1.09 ±0.33
±0.34 ±0.13 ±0.07 ±0.72
±0.4 ±0.06 ±0.18 ±0.1
±0.35 ±0.14 ±0.07 ±0.49
±0.08 ±0 ±0.04 ±0.38
±0.54 ±0.83 ±1.09 ±0.33
±0.34 ±0.13 ±0.07 ±0.72
±0.4 ±0.06 ±0.18 ±0.1
±0.35 ±0.14 ±0.07 ±0.49
±0.08 ±0 ±0.04 ±0.38
±0.54 ±0.83 ±1.09 ±0.33
±0.34 ±0.13 ±0.07 ±0.72
±0.4 ±0.06 ±0.18 ±0.1
±0.35 ±0.14 ±0.07 ±0.49
±0.08 ±0 ±0.04 ±0.38
±0.54 ±0.83 ±1.09 ±0.33
±0.34 ±0.13 ±0.07 ±0.72
±0.4 ±0.06 ±0.18 ±0.1
±0.35 ±0.14 ±0.07 ±0.49
±0.08 ±0 ±0.04 ±0.38
±0.54 ±0.83 ±1.09 ±0.33
±0.34 ±0.13 ±0.07 ±0.72
±0.4 ±0.06 ±0.18 ±0.1
±0.35 ±0.14 ±0.07 ±0.49
±0.08 ±0 ±0.04 ±0.38
±0.54 ±0.83 ±1.09 ±0.33
±0.34 ±0.13 ±0.07 ±0.72
±0.4 ±0.06 ±0.18 ±0.1
±0.35 ±0.14 ±0.07 ±0.49
±0.08 ±0 ±0.04 ±0.38
±0.54 ±0.83 ±1.09 ±0.33
±0.34 ±0.13 ±0.07 ±0.72
±0.4 ±0.06 ±0.18 ±0.1
±0.35 ±0.14 ±0.07 ±0.49
±0.08 ±0 ±0.04 ±0.38
±0.54 ±0.83 ±1.09 ±0.33
±0.34 ±0.13 ±0.07 ±0.72
±0.4 ±0.06 ±0.18 ±0.1
±0.35 ±0.14 ±0.07 ±0.49
±0.08 ±0 ±0.04 ±0.38
0.20
0.13
0.06
0.03 0.02
0.00
0.05
0.10
0.15
0.20
0.25
1300 1350 1400 1450 1500
Fre
e lim
e %
w
t./w
t.
Temperature, oC
RM100%
±0.01
±0.02
±0.01
±0.00
±0.00
±0.01
±0.02
±0.01
±0.00
±0.00
±0.01
±0.02
±0.01
±0.00
±0.00
±0.01
±0.02
±0.01
±0.00
±0.00
±0.01
±0.02
±0.01
±0.00
±0.00

78
Hilal Saif Al Dhamri 200676958
Figure 31 XRD pattern of the different raw meal samples burned at different temperatures.
The arrows show the free lime peak at 2theta =37.36 o, the highest intensity when calcined at 1450 oC is for the raw meal prepared with 55% OBM cutting.
Figure 32 100% OBM cuttings clinker.
Left: Clinker sample (100% OBM cutting) after burning at 1450 oC in platinum crucible for 30 minutes.
Right: SEM image analysis of the same clinker sample.

79
Hilal Saif Al Dhamri 200676958
Figure 33 The SEM analysis of RmRef burned at four different temperatures.

80
Hilal Saif Al Dhamri 200676958
Figure 34 The SEM analysis of Rm-12 burned at four different temperatures.

81
Hilal Saif Al Dhamri 200676958
Figure 35 The SEM analysis of Rm-55 burned at four different temperatures.

82
Hilal Saif Al Dhamri 200676958
Figure 36 EDX analysis for RmInd showing clinker microstructure development with increasing temperature.
Figure 37 EDX analysis for RmRef showing clinker microstructure development with
increasing temperature.
Temperature, oC
CaO
SiO2
Al2O3
MgO
BaO
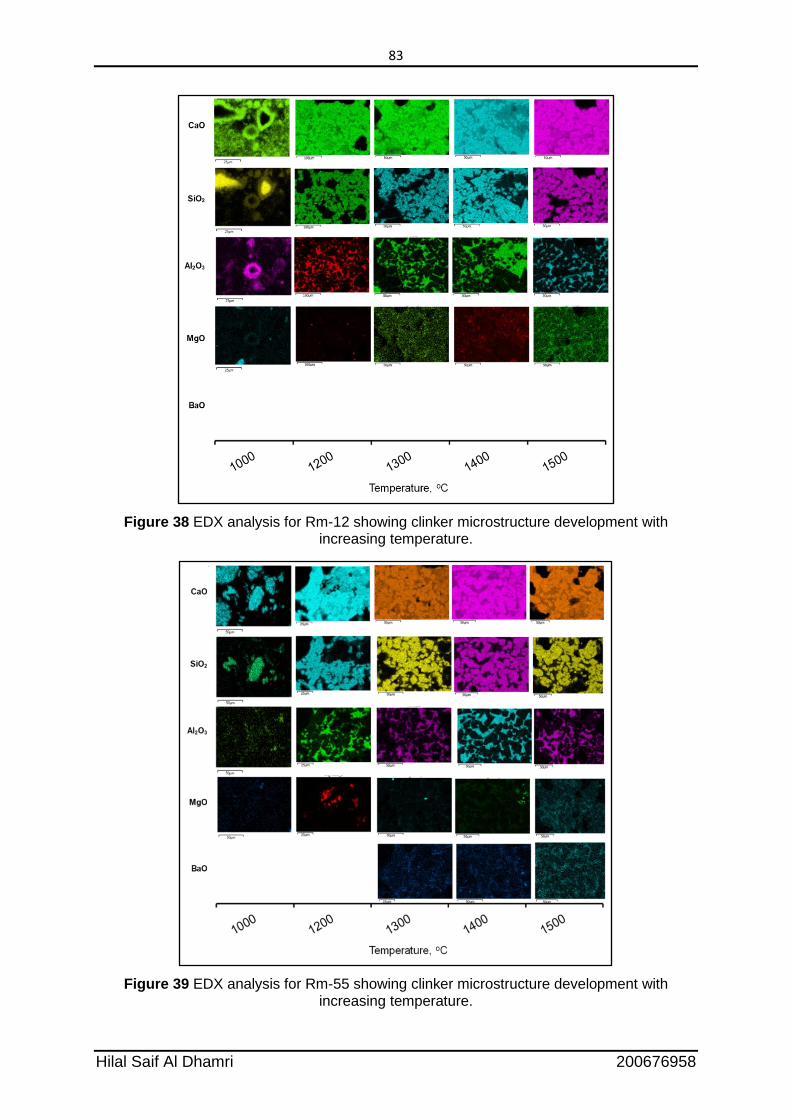
83
Hilal Saif Al Dhamri 200676958
Figure 38 EDX analysis for Rm-12 showing clinker microstructure development with increasing temperature.
Figure 39 EDX analysis for Rm-55 showing clinker microstructure development with increasing temperature.

84
Hilal Saif Al Dhamri 200676958
Figure 40 EDX analysis for Rm-100 showing clinker microstructure development with increasing temperature.
6.4 The XRD and TGA
XRD and TGA were used to measure clinker phase composition and obtain
information on the changes in clinkerization during the heating process. Thermal
analysis (Figure 41) showed that all of the changes occurring during the heating
process, including CaCO3 decomposition, belite formation, liquid phase and alite
formation (liquid phase sintering) shifted to lower temperatures as the OBM cutting
content of the raw meal increased.
The effect of OBM cutting on CaCO3 decomposition temperature was described
earlier, but the effect on other phases is described below. At higher temperature
(above 1338 oC)165 the liquid phase develops. This comprises mainly Al2O3 and Fe2O3
bearing phases. These are essential fluxes, lowering the energy required for
completing the clinkerization process. When melting commences, the liquid content
can increase significantly, up to 15 – 25% 165. The presence of other minor oxides
such as SO3, MgO and alkalis can have an influence by lowering the energy required
to form the flux. In this study RMInd showed the presence of a liquid phase from 1334

85
Hilal Saif Al Dhamri 200676958
oC, very close to temperature of liquid phase reported in the literature 165. However,
RMRef showed temperature of formation of the liquid phase from 1331 oC which also
close to industrial sample. However, with increasing OBM cutting content, the liquid
phase formed at ever lower temperatures, decreasing to 1320 oC with 55% OBM
cutting and 1263 oC when 100% OBM cutting was clinkerised. This could be attributed
to the present of minor oxides from the OBM cutting, as shown in Figure 42.
Additionally, periclase was found in the liquid phase when 100% OBM was used, with
10.75% MgO determined in the liquid phase (Figure 33).
Figure 41 Temperatures of calcite decomposition and major phase formation with increasing OBM cuttings content.
The temperatures were determined by DTA. The trend lines are moving averages.
CaCO3 decomposition
1422
1427
1432
Liquid phase sintering
760
820
880
940
1000
1060
1120
1180
1240
1300
1360
0 20 40 60 80 100
Tem
pera
ture
, oC
% of OBM Cutting in raw mix
Belite Formation
Liquid phase formation
760
780
800
820
CaCO3 Decomposition

86
Hilal Saif Al Dhamri 200676958
Figure 42 Minor oxide contents in prepared raw meal
The decreasing temperature for the onset of liquid phase formation with increasing
OBM cutting content also influenced the sintering temperature. The role of the liquid
phase at this stage is very important and critical to the clinkerization mechanism. The
liquid wets the solid grains, forming an interpenetrating film 165. This has two main
functions: 1) its surface tension pulls the solid grains together, serving to form clinker
nodules. 2) It also eases transport of the main oxides in the liquid phase during the
sintering stage and aids formation of alite and belite. The lower temperature for the
onset of liquid phase formation, due to the presence of the minor oxides, impacts also
on the sintering temperature, which were too close for RmRef and Rm12 at 1434 oC
and 1431 oC respectively. However, the sintering temperature felling to 1424 oC for
Rm55. The liquid phase (flux) plays a major role in facilitating the chemical reactions
to form the major clinker phases such as C2S and C3S. Sufficient liquid phase is
required to wet reactants and thereafter the rate of formation of desired clinker phases
is limited largely by liquid phase diffusion165.
The clinker sample made with 100% OBM cutting, CK100%, showed formation of
belite at 1200 oC, as indicated by XRD and SEM-EDX analysis. At higher
temperatures, no further new phases were formed. The CK-100% at 1450 oC showed

87
Hilal Saif Al Dhamri 200676958
belite grains swimming in a high melt content (Figure 32), a result of the high
concentration of Al2O3 and Fe2O3 % in the mix.
6.5 The Effect of Barium on Clinkerization
As shown above, the incorporation of OBM cutting had a slight, yet noticeable effect
on clinker composition. Initial elemental analysis of the raw materials showed that a
number of trace elements were present in the OBM cuttings (Table 6), while the
presence of some trace elements plays a major role on clinker phase formation166–173.
This was thus investigated further, with particular focus on the barium content which
was present in high quantities in the OBM cuttings and subsequently in clinkers
prepared with higher levels of OBM cuttings.
In RmRef, the belite and liquid phase formation temperature was 1284 and 1331 oC
respectively, but these fell upon incorporation of OBM cutting. SEM-EDX and and ICP
analysis (Table 13) both showed an increase in barium content with increasing OBM
cutting content. Furthermore, SEM-EDX analysis revealed the distribution of barium
through the clinker phases. The highest barium concentration was found in the liquid
phase.
Table 13 BaO content of each phase in each experimental clinker
Sample CkInd CkRef. Ck12 Ck55 Ck100
Alite - - 0.35 0.42 -*
Belite - - 0.25 1.98 6.40
Liquid phases - - 2.57 2.46 14.32
*no alite observed in Ck100.
The effect of barium on phase composition is related to the free lime content. An
increased free lime content indicates reduced burnability and incomplete formation of
the main clinker phases. This is due either to alite formation being discouraged or
decomposition to CaO and belite being promoted. As stated earlier, the addition of
OBM cuttings decreased burnability and the free lime contents increased (Figure 43).
With the OBM cuttings containing 0.85 wt% BaO, the barium content of the clinker

88
Hilal Saif Al Dhamri 200676958
increases with increasing OBM cutting content. It has repeatedly been shown that BaO
has a negative influence on alite formation, thus increasing the free lime content.
Kolovos et al.168,174 studied the effect of raw meal BaO content on the reactivity of the
CaO-SiO2-Al2O3-Fe2O3 system. They noticed that the addition of 1% BaO to the raw
meal then sintering at 1200 oC and 1450 oC led to an increase in free lime compared
with the reference sample. This BaO was then shown, by SEM analysis, to concentrate
in the melting phase of the clinker.
Other studies175,176,177,168,148 have also reported on the impact of barium on
clinkerisation reactions. These mostly confirm that the free lime content increases with
barium content, and that barium is mainly concentrated in the melting phase.
Furthermore, Zezulova et al.175, in addition to showing high BaO contents in the
melting phase, also reported higher concentrations of BaO in belite than alite. This is
possibly caused by the crystal lattices of alite and belite, with the belite structure being
more accommodating of foreign ions175,178.
Figure 43 The free lime content for each clinker sample
6.6 Clinker morphology
Clinker morphology and chemical composition was then studied by SEM/BSE imaging
and EDX analysis. Below 1250 oC, clinkerization proceeded through solid-solid
reactions, in the absence of the liquid phases. These reactions occurred at the original
phase boundary between the solids179, leading to the formation of belite, see Figure
44 A1. This happens through diffusion of the CaO on the SiO2 surface as could be
0.76
0.45
1.07
1.54
0.00
0.50
1.00
1.50
2.00
Ckind. 0% CkRef. 0% Ck-12% Ck-55%
Fre
e L
ime
, %
wt.
0.08
0.21
0.18
0.26

89
Hilal Saif Al Dhamri 200676958
seen in the SEM-EDX in the reference clinker sample CkRef. and the industrial sample
CkInd which are shown in Figure 44 A1 and B1. EDX analysis revealed a cluster of SiO2
surrounded by the CaO. This led to belite formation, which is known to form between
900 oC and 1250 oC 180,181 with the precise formation temperature defined by a number
of factors, such as minor compounds166,168,170,173,182,183, particle sizes184 and retention
time104.
The raw meal containing 12% OBM cutting showed some formation of alite at 1350 oC
(Figure 44 A1). Free lime was present in clusters, but belite was not observed. The
co-existence of alite and free lime without belite suggest that no further alite could be
formed, irrespective of temperature, because no belite is available to react with any
free lime. Figure 45 shows the SEM images with EDX mapping for Ck100% heated at
three different temperatures; 1300, 1350 and 1400 oC. At all temperatures, belite was
the dominant phase, showing rounded to regular edges. XRD patterns from Ck100%
heated to 1000 oC showed formation predominantly of belite, plus free lime (Figure
46). However, upon heating to 1300 oC there was no evidence of free lime in either
the XRD patterns nor the SEM images. The same was observed when the temperature
was raised further, to 1350oC. While temperatures above 1400 oC would normally be
expected to yield alite, the lack of free lime in the Ck100% sample meant that alite
formation was not expected. XRD analysis confirmed the absence of alite. Finally,
EDX mapping revealed the concentration of magnesium and barium in the liquid
phase, at all temperatures (Figure 47 B1 & B2), with the formation of C3A and ferrite.

90
Hilal Saif Al Dhamri 200676958
Figure 44 SEM-EDX microstructural analysis of clinker samples burned at 1180 oC.
a) CaO, b) SiO2 c) Fe2O3, Formation of belite by solid-solid reactions.

91
Hilal Saif Al Dhamri 200676958
Figure 45 SEM-EDX microstructural analysis of clinker samples burned from 100% OBM.

92
Hilal Saif Al Dhamri 200676958
Figure 46 XRD of OBM cutting when heated to different temperatures.
Q Q
Belite
D
C
C C C
C C
FL
1450 oC
1350 oC
1300 oC
1000 oC
300 oC
RT oC
C: Calcite
D: Dolomite
FL: Free lime
Q: Quartz,
RT: Room-temperature

93
Hilal Saif Al Dhamri 200676958
Figure 47 SEM-EDX microstructural analysis of clinker samples prepared by adding 12%
and 55% OBM cutting.

94
Hilal Saif Al Dhamri 200676958
6.7 Petrography Study of the Clinker
The clinker samples were also analysed by optical microscopy. Table 14 summarises
the data obtained from the petrographic thin sections. As observed by optical
microscopy, increased OBM cutting content led to an increased liquid phase content
and a slight reduction in alite content. Changes were also seen in both maximum and
average grain sizes. With increasing OBM cutting content there was a clear decrease
in belite grain size, while conversely free lime grains increased in size. There was also
a slight reduction in the size of the C4AF grains with increasing OBM cutting content.
The granulomteric composition analysis is clearly indicate that the raw mix of all the
samples is rich in Al and Fe component. These two components mainly participate in
the early stages of phase formation consuming the calcium Aluminate component.
Hence, in C3S phase amount, very slight variation could develop in all the three
samples.
Table 14 The granulomteric composition analysis of the prepared clinker
Phase %
Granulometry Max ( in µm)
Granulometry Average ( in µm)
CkRef. Ck12 Ck55 CkRef. Ck12 Ck55 CkRef. Ck12 Ck55
C3S 58 56 54 72 73 70 34 35 33
C2S 23 21 22 76 68 64 38 32 29
CaOfree lime 1 1 2 36 38 40 17 19 22
C3A 12 16 17 26 29 28 14 15 13
C4AF 6 6 5 20 18 16 9 8 7
The clinker phases in CkRef. were moderately developed and homogeneously
distributed. Porosity was high and the majority of alite grains were hexagonal to
pseudo hexagonal in shape, with sharp grain boundaries. Many polygonal alite grains
were also present, with numerous inclusions present in larger alite grains. Most of
these inclusions were globular belite grains.
Sub-micron alite grains were often present on the edges of alite phenocrysts in the
reference clinker sample CkRef. (Figure 48 [a]) with quite large variations in alite grain
size (Figures 49 [b], [c] and [d]). Fused alite grains were also observed (Figure 48 [b])
while the formation of sub-micron belite grains and C3A grains of various shapes and
sizes was seen (Figure 48 [b]).

95
Hilal Saif Al Dhamri 200676958
Figure 48 Photomicrographs of clinker CkRef.
Ck12 showed moderate development of the various clinker phases, with an
inhomogeneous distribution and a high porosity. There was also a marked increase in
the amount of liquid phase present compared to CkRef. The majority of the alite grains
were pseudo hexagonal with rough profiles (Figure 49 [a]). Fine grained polygonal
belite grains were commonly observed on the edges of alite grains (Figure 49 [b])
present in various polymorphic forms as small clusters and surrounded by liquid
phase. Many polygonal alite grains185 also developed in the clinker (Figure 49 [e]) with
no change in alite grain size.
Sub-micro sized grains of both alite and belite developed on the edges of alite
phenocrysts (Figure 49 [c]). Most of the belite grains were well-developed (Figure 49
[e]) with smooth grain edges. In several instances, liquid phase (Figure 49 [d] and [e])
remained on the edges of rounded belite grains. There was considerable variation in
belite grain size.

96
Hilal Saif Al Dhamri 200676958
The phases in Ck55 were moderately developed and inhomogeneously distributed,
with the majority of the alite grains being hexagonal to pseudo hexagonal180,186–188,
with sharp grain boundaries (Figures 51 [a], [b] and [c]). Numerous polygonal alite
grains189 had also developed . In addition, numerous globular190 belite inclusions
(Figure 50 [d]) were present in alite phenocrysts.
It could also be seen that the transformation of belite into alite did not reach equilibrium
(Figures 51 [e] and [f]). There were also many fused alite grains in all the nodules. This
indicates a large variation in carbonate composition in the raw mix119. Significantly, the
percentage of fused alite grains increased with increasing OBM cutting content. This
supports the observations made earlier regarding the nature of the carbonate in the
limestone and OBM cutting.
Figure 49 Photomicrographs of clinker Ck12

97
Hilal Saif Al Dhamri 200676958
Figure 50 Photomicrographs of clinker Ck55

98
Hilal Saif Al Dhamri 200676958
Chapter 7
The effect of OBM cuttings on cement properties and
hydration

99
Hilal Saif Al Dhamri 200676958
Chapter 7: The effect of OBM cutting on cement properties and hydration
The previous chapter showed that Portland cement clinker could be produced with
OBM cutting included within the raw meal. However, it is also important to understand
the cement hydration behaviour of the resultant clinker.
To obtain comparable results, the cement clinker was ground to a similar fineness and
blended with the same quality and quantity of gypsum. This allowed an understanding
as to whether OBM cutting ratio had an impact on cement hydration.
Cement hydration was studied by many techniques such as isothermal conduction
calorimetry (ICC) and simultaneous thermal analysis (STA). The mechanical strength
was determined and compared with the standard specification implemented in Oman
(OS7/2001). Also, the physical testing such as setting time, Blaine, soundness and
density were measured. Using XRD complemented with SEM-EDX analyses of
polished cross-sections, the major hydrate phases were studied. The SEM of the
clinker was also observed to understand if there were any significant changes to the
microstructure of the main phases, which may influence the cement hydration
behaviour. The degree of hydration (DoH) was obtained by applying grey level
segmentation based on the histogram of BSE images to quantify elements in polished
section of cement samples using SEM-BSE analytical technique. Finally, the main
hydrated products such as C-S-H and CH were identified and correlated to other
findings, if any.
7.1 Physical and mechanical properties
Oman has its own cement standard105 (OS 7/2001) which specify only one type of
cement, namely that used for general construction purposes and specified in many
other standards such as BS/EN 191 (197-1 for type I) and ASTM 106,192 (C 150 type I).
The cement types are defined by their chemical composition and physical/mechanical
performance which are presented in
Table 15.

100
Hilal Saif Al Dhamri 200676958
Table 15 Summary for the OPC standards: Oman Standard105, BS EN191 and ASTM192
Max Min Max Min Min
SiO2 % -- -- -- -- --
Al2O3 % -- -- -- -- --
Fe2O3 % -- -- -- -- --
CaO % -- -- -- -- --
MgO % 6.00 -- 5.00* -- --
Na2O % -- -- -- -- --
K2O % -- -- -- -- --
IR % 1.50 -- 5.00 -- --
LOI % 3.00 -- 5.00 -- 3.00+
3.50$ --
3.00 3.50C3A =< 8% C3A > 8%
Cl % 0.10 -- 0.10 -- --
Alkalies % 0.60 -- 0.60 -- --
C3S % -- -- -- -- --
C2S % -- -- -- -- --
C3A % 9.00 -- -- -- --
C4AF % -- -- -- -- --
% -- -- -- -- --
-- -- -- -- --
-- -- -- -- --
-- -- -- --
Blaine -- -- -- -- 280
Air content
volume% -- -- -- --
10 mm -- 10 mm -- --
-- 60 -- 60 45.00
600 -- -- -- --
-- -- -- -- --
-- 10.00 -- 10.00 12.002 days 2 days 3 days
-- -- -- -- 19.00
-- 42.50 62.50 42.50 --
*MgO% content in Portland clinker used for manufacturing cement
2/3 days*
0+ grinded without limestone addition
3$ grinded with limestone addition
28 days --
C h
e m
i c
a l A
n a
l y
s i s
Standard
Test
--
7 days --Co
mp
ressiv
e
Str
en
gth
Soundness 0.80 % _
N/mm2
N/mm2 MPa
Heat of Hydration
in KJ/Kg (7days)--
AM --
Physic
al T
ests
M2/Kg --
Setting
time in
Minutes
Initial --
Final 375
LSF --
SM --
--
2C3A+C4AF --
--
--
0.6
--
--
--SO3 % 3.50 -- 3.50 --
--
0.75
6.00
--
--
--
--
--
Max
OS 7/2001BS EN 197-1-2011
CEM I 42.5N
ASTM C150/150m-18
Type I

101
Hilal Saif Al Dhamri 200676958
The chemical composition limits in OS are similar to those in BS/EN standard except
regarding MgO, insoluble residue (IR), and C3A content. In addition, OS specifies the
range of cement LSF and AM factors. The OS has more restrictions when compared
to BS/EN. For example, the highest allowed IR and C3A in the cement are 1.5% and
9.00% respectively. Prescription of low IR value in OS compared to BS/EN limits the
ratio of additives such as limestone during cement grinding process to below 3%. In
contrast, 5% of additives (such as limestone) could be added during clinker grinding
in BS/EN standard. In addition, IR is essential parameter to control the quality of
gypsum. The lower quality (purity) of gypsum the higher % of IR which impacts the
strength of cement and setting time. Also, it may require high quality of clinker in term
of C3S content and low free lime content to keep the IR result within allowable values
and maintain 28 day strength above 42.5 N/mm2. Since the OBM cutting is added as
part of the raw materials, it has no effect on the ratio of clinker and additives used
during the grinding and production of cement. The cement obtained using the OBM
cutting is meeting the standard requirement and fulfilling the chemical and
physical/mechanical limits used in all samples obtained (e.g. 12 and 55%)as shown in
Table 16.
The soundness (expansion test) of the prepared cement increased as OBM cutting
content increased (Table 16). Higher expansion could be due to several reasons, such
as i) high free lime content in clinker (above 2%) or ii) high MgO content in cement
(above 3%)149. The free lime contents in all samples were kept below 2% (Figure 43),
thus this is probably not a reason for higher expansion results. Therefore, the
significant contribution for the expansion may be attributed to the presence of a high
concentration of MgO (periclase) in cement prepared with higher OBM cutting contents
in the raw meal. The prepared cement showed MgO levels below the maximum limits
in standards (OS 7/2001, BS EN 197-1 and ASTM C 150-99a Type I)
The MgO that is not combined in clinker phases appears as periclase193–195. Most
specifications limits MgO in cement in the range 3-6 %162. In some standards, including
European ones, periclase (MgO) is limited to 5% maximum because of its potential
expansive reactions with aggregates163. Higher contents in cement lead to long-term
expansion. This is because of the slow hydration companied with expansion in
concrete at late ages according to the following chemical reaction149, 197.
𝑀𝑔𝑂 (𝑝𝑒𝑟𝑖𝑐𝑙𝑎𝑠𝑒) + 𝐻2𝑂 → 𝑀𝑔(𝑂𝐻)2 (𝑏𝑟𝑢𝑐𝑖𝑡𝑒)

102
Hilal Saif Al Dhamri 200676958
The source of MgO in the cement is likely the clinker as a result of its high
concentration in the raw materials. Limestone can contain magnesium in many forms,
such as dolomite (CaMg(CO3)2. Alternatively, it may be found as magnesite
(MgCO3)193. In addition, other sources could be from the grinding media during the
grinding process in a ball mill, or MgO contamination from added additives during
cement grinding such as limestone and gypsum. Since all parameters were similar
during testing and sample preparation, the only difference is the OBM cutting % in
each sample. The MgO % in the as-received OBM cutting is 2.22%, which is the
highest of all the raw materials, as shown in Table 6. The magnesium was present as
dolomite in the OBM cutting found, as seen from the XRD analysis presented in Figure
22. The MgO content in the clinker samples increased, as shown in the previous
chapter in Figure 42.
Hence, higher soundness in the cement sample of 55 % OBM cutting is more likely
due to the higher content of MgO coming from OBM cutting. The SEM-EDX analysis
also confirms the presence of MgO in cements prepared with 30% and above OBM
cutting (Figure 51). The energy-dispersive X-ray spectroscopy (EDS) confirmed the
presence of periclase, as shown in the spectra c & f in Figure 51. Seen in the figure
as black and grey polygonal and circular clusters shape with clear borders.
According to the literature, this could be explained because Mg2+ can replace Ca2+ in
major clinker phases such as C3S and C2S when MgO concentration in the raw meal
is up to 1.5%198. Also, it has been reported that C2S, C3A, and C4AF can incorporate
in its crystal lattice up to 0.5, 2 and 4.4% MgO respectively149,199. At equilibrium, the
solubilities of MgO in the liquid phase is much higher than the concentrations of MgO
replacement, which is reported in the range of 5 - 5.5%. The highest quantity of MgO
that can be incorporated within clinker phases is dependent on the quantity of liquid
phase formed, and the clinkerization temperature. The higher the clinkerization
temperature, the more MgO is dissolved in the liquid phase and hence the higher
amount of MgO crystallising as periclase at the cooling stage114. Therefore, periclase
is formed during the clinker burning process in the thermal decomposition reaction of
magnesium-containing carbonates such as dolomite (CaMgCO3) and magnesite
(MgCO3). This partly dissolves in the liquid phase as temperature increases and some
remains within clinker phases such as C3S and C2S. In fact, the SEM EDX shows MgO
largely within the liquid phase as shown in Figure 51 d. Particles of MgO grains are

103
Hilal Saif Al Dhamri 200676958
within the liquid phase, in agreement with the literature198,149,199. The fineness of the
raw meal influences the distribution of MgO between the liquid phases and clinker
phases of the raw meal166–169.
Figure 51 SEM images and EDS spectra of clinker samples containing 30% (a, b & d) and 55% (d, e & f) OBM cuttings. The black and dark grey particles represent MgO.

104
Hilal Saif Al Dhamri 200676958
Blaine (or fineness) and particle size was purposely kept consistent during clinker lab
grinding to remain within the industry standard and meet the OS, i.e. falling in the
range 319 – 329 m2/Kg. This helped to ensure that any differences were due to
changes in hydration chemistry.
Setting time results are presented in Table 16 and show no significant change between
the samples with OBM cutting and the reference sample. The initial setting time is 137
minutes for the reference sample and 126 minutes and 131 minutes for the 12% and
55% OBM cutting, respectively. The results therefore meet the OS specification.
Density is obtained for the purpose to be used in the calculation of the hydration
degree. It is in fact, not a strictly a quality parameter in cement manufacturing. The
density of Portland cement is ranging between 3.10 – 3.25 g/mL197. The cement
prepared has the density as shown in Table 16.
Table 16 Physical test results for the prepared cement
*OS: Omani Standard for Portland cement production105

105
Hilal Saif Al Dhamri 200676958
An indirect measure of cement hydration is the development of compressive strength,
where standards stipulate mortar test specimens arranged, cured and tested
according to the testing standard. There are three factors responsible for developing
the strength. Namely formation of hydrated phases, non-hydrated residual and
porosity. Compressive strengths were measured on mortars cured at 20 oC in a
distilled water chamber.
Compressive strength increased with hydration for 2, 7 and 28 days, as shown in
Figure 52. At two days, the two reference samples (CmInd and CmRef) showed slightly
lower strengths than the OBM cutting cement ones (12% and 55%). By 7 days, the
strengths of all samples increased and the OBM-containing remained slightly stronger
than the reference samples. At 28 days, Cmt-12% was the strongest, with no
significant difference between others. With alite being the principal phase responsible
for later-age strength, given the minimal difference in alite contents Table 11between
the samples, the similarity in performance is not surprising.
Figure 52 Compressive strength development over time of the prepared cement.
It is possible that the slight variations in Blaine fineness could explain the slight
differences in strength. Fineness plays a dominant role in compressive strength
development, with higher fineness leading to higher strength due to cement grains
having more surface area exposed during hydration203.

106
Hilal Saif Al Dhamri 200676958
There was a linear correlation between 28 day compressive strength and Blaine
fineness, with an R2 of 0.9795 as shown in Figure 53. Thus, the slight difference in
strength may be explained by variations in cement fineness only and the incorporation
of OBM cutting within the clinker does not appear to affect strength development. The
cement sample with 12% and 55% OBM cutting shows 28 day compressive strength
that conforming to the Omani standard and other international cement standard such
as EN/BS.
Figure 53 Blaine fineness vs compressive strength.
There is a wide range of factors that affect the compressive strength of cement,
especially in the early period, including the fineness of cement, the ratio of gypsum
(calcium sulfate), the chemical composition, and the water-to-cement ratio. It is noted
that the reference sample CmRef is the least in compressive strength compared to other
samples, with the exception of the industrial sample CmInd. There is no apparent
reason for this difference in strength results. Still, it is noted that the results of the
examination are very close, and this difference in results may be the result of
laboratory errors.

107
Hilal Saif Al Dhamri 200676958
7.2 Hydration and microstructure
The major microstructure of hardened cement paste could be summarised as
comprising five main features197 as mentioned below and explained chemically by
the subsequent equations.
- Calcium silicate hydrate (C-S-H) comprising about 50% of the paste.
- Calcium hydroxide, Ca(OH)2 (known also as portlandite) is the second
product formed during hydration, comprising about 12% of the paste.
- Monosulfate hydrates and it is derivatives, comprising about 13%.
- Pores contributing about 20% of the paste volume.
- Anhydrous clinker phases which constitute about 5%.
3𝐶𝑎𝑂. 𝑆𝑖𝑂2 + 5.3𝐻2𝑂 → 1.7𝐶𝑎𝑂. 𝑆𝑖𝑂2. 4𝐻2𝑂 + 1.3𝐶𝑎(𝑂𝐻)2 Equation 10
2𝐶𝑎𝑂. 𝑆𝑖𝑂2 + 4.3𝐻2𝑂 → 1.7𝐶𝑎𝑂. 𝑆𝑖𝑂2. 4𝐻2𝑂 + 0.3𝐶𝑎(𝑂𝐻)2 Equation 11
The composition calcium-silicate-hydrate (C-S-H) is assumed to be
1.7CaO.SiO2.4H2O in Equation 10 and Equation 11, however, the ratio of Ca/Si varies
between 0.83 – 2.00 depend on many factors such as water ratio204.
Ettringite is a calcium sulphoaluminate hydrate complex compound,
3CaO.Al2O3.3CaSO4.32H2O, which has composition of hexagonal prismatic shape.
The octahedral column is consist of [Al(OH)6]3- linked to [Ca6.Al2(OH)12]6+.[3SO42-
.26H2O]6- while in between the columns are linked by water and sulphate. The water
between the column is lost at above 100 oC while the water from the dihydroxylation
of aluminium hydroxide is lost at temperature range from 200 – 400 oC205.
Figures 54 to 57 show the SEM images of Portland cement samples hydrated for 2, 7
and 28 days. Respective XRD plots are shown in Figures 58 to 61. The micrographs
show a combination of the features described above. Anhydrous material appears
white while pores are black. The hydrate phases appear grey. After two days the
pastes are dominated by anhydrous material and pores, although hydrates could be
seen. The most commonly observed hydrates are portlandite (CH), with a light grey
colour, and outer product C-S-H, with a dark grey colour. At later ages, namely seven
days hydration, the inner product C-S-H further increased in presence and encircled
the hydrated larger grains. With increasing hydration, the total pore is reduced.
Eventually, after 28 days hydration, all investigated cement samples showed similar

108
Hilal Saif Al Dhamri 200676958
microstructures, as illustrated by the SEM images and XRD plots. The major clinker
phases are consumed, with corresponding increases in different hydration products.
XRD showed that ettringite reduced over time, with no observation of monocarbonate
nor monosulfate formation. It is expected to observe no formation of monocarbonate
(AFm) in all hydrated cement samples including reference and industrial sample
because the monocarbonate results from the hydration of C3A with CaCO3 from
limestone that added in the cement during the grinding206. However, in this research,
the cement prepared has no limestone added. Therefore, the hydration process will
not expose to CaCO3, hence no monocarbonate formed expected during the hydration
process.
The amount of ettringite in hydrated cement is depend on the ratio of gypsum to C3A
content. At low ratio (3/2)207, AFt is formed at early hydration and then convert to
monoslfate phase (AFm). When gypsum to C3A ratio is high, the monosulfate is
unlikely to be formed208.
There was no significant effect on the crystal phases formed upon hydration at 2, 7
and 28 days, despite the greater potential of magnesite (MgCO3) formation which is
observed in samples Cm-12% and Cm-55% as shown in Figure 60 and Figure 61. In
all investigated samples the AFm (Ettringite) is formed which is visible at 2 days
hydration, while no formation observed in all investigated cement sample for Aft
(monocarboaluminate nor monosulfate) at all hydration ages. The formation of AFt is
highly depend on the C3A content in cement. With high C3A content in cement, the
monocarboaluminate appears at early age of hydration, probably is visible on 7 days
of hydration209.
The analysis by optical microscopy for the clinker phases analysis (Table 14) shows
an increase in C3A content as the OBM cutting increase. The C3A content in CkRef.,
Ck12 and Ck55 are 12, 16 and 17% respectively.

109
Hilal Saif Al Dhamri 200676958
Figure 54 SEM image of CmtInd hydrated for 2, 7 and 28 days

110
Hilal Saif Al Dhamri 200676958
Figure 55 SEM image of CmtRef hydrated for 2, 7 and 28 days

111
Hilal Saif Al Dhamri 200676958
Figure 56 SEM image of Cmt12% hydrated for 2, 7 and 28 days

112
Hilal Saif Al Dhamri 200676958
Figure 57 SEM image of Cmt55% hydrated for 2, 7 and 28 days

113
Hilal Saif Al Dhamri 200676958
Figure 58 XRD analysis of anhydrous CmInd and up to 28 days.
W/C ratio 0.45
Figure 59 SEM and XRD analysis of anhydrous CmRef. and up to 28 days.
W/C ratio 0.45

114
Hilal Saif Al Dhamri 200676958
Figure 60 SEM and XRD analysis of anhydrous Cm-12% and up to 28 days.
W/C ratio 0.45
Figure 61 SEM and XRD analysis of anhydrous Cm-55% and up to 28 days.
W/C ratio 0.45

115
Hilal Saif Al Dhamri 200676958
Figures 63 and 64 further highlight depletion of the clinker phases during hydration
and formation of new crystalline hydrate phases. In all samples AFm phases were not
detected. The XRD patterns for all hydrated cement samples showed similar
behaviour. Ettringite (AFt) and C4AF were observed with the intensity of reflections
from the latter diminishing with time. Between 2 to 28 days the intensity of the main
clinker phase reflections decrease with growth in reflections due to hydrates. The
amount of AFt formed depends on the ratio of sulphates (added during grinding) and
the C3A content of the clinker. At high ratio of C3A to CaSO3.2H2O, the AFt is unlikely
to convert to AFm208. In this investigation, the % of gypsum added during the cement
grinding of all samples are fixed at about 6% as mentioned in Table 8 in Section 4.3.4.
The XRD results is confirming that AFm is not observed in all ages of cement
hydration. The rate of reaction between calcium sulfate and C3A depends on the C3A
polymorph and concentration (C3A cubic, orthorhombic or monoclinic modification).
However, all polymorphs undergo the same reaction. The initial hydration reaction is
that between C3A and calcium sulfate in the presence of water which releases
significant heat according to the reaction below210–212.
C3A + 3CaSO3. 2H2O + 26H2O → 3CaO. Al2O3. 3CaSO4. 32H2O Equation 12
After all the calcium sulfate has been consumed, any unreacted C3A will react with the
AFt and be converted to AFm210,211.
2C3A + CaO. Al2O3. 3CaSO4. 32H2O + 4H2O
→ 3CaO. Al2O3. CaSO4. 12H2O Equation 13
As seen from Table 11, the C3A content calculated according to Bogue formula in
clinker samples Ref, 12% and 55% are 7.94, 7.77 and 6.74 % respectively. Connecting
the results obtained from XRD of hydrated cement and the C3A content in clinker which
showed no indication of AFm formation in the hydrated cement in all samples,
therefore, the C3A seems to be consumed to produce the AFt only. It is possibly that
there is no C3A left after the formation of AFt and hence no additional heat released
after the first hydration reaction completed. This is could be an explanation for the
similarity of the heat rate shown for the all samples.
The hydration reaction of C3S is associated with formation of calcium hydroxide (CH)
which precipitates in the form of portlandite and is dispersed within the hardened

116
Hilal Saif Al Dhamri 200676958
paste213. The XRD patterns for the hydrated cement (Figure 63) clearly indicates the
formation of CH in all samples, with growing intensity as the time passes.
Figure 62 XRD Patterns from 8 to14o 2θ showing ettringite formation and the C4AF peak.
Figure 63 XRD Patterns from 31 to 35o 2θ.
7.3 Thermal Analysis (STA)
Figure 64 shows the DTG of hydrated cement for 28 days. The results obtained show
two dehydroxylation reactions at around 465 oC. Brucite (Mg(OH)2) and portlandite
(Ca(OH)2) decomposes to oxide and water at about 420 and 460 oC respectively115.
The decomposition temperature seen in all hydrated cement samples could be

117
Hilal Saif Al Dhamri 200676958
recognised to decomposition of portlandite. However, the small shoulder adjust to the
portlandite peak at 460 oC is unlikely to be brucite. The XRD patterns of the cement at
all hydrated ages dose not show any present of formation of brucite. If this was brucite,
than would expect to observe a more prevalent peak with increasing OBM cutting
content in the DTA analysis at 420 oC as per the literature115. It is more likely that it is
microcrystalline formed during hydration.

118
Hilal Saif Al Dhamri 200676958
Figure 64 DTA plots from 20 to 950 oC for 2, 7 and 28 day pastes.

119
Hilal Saif Al Dhamri 200676958
7.4 Heat of hydration by ICC
As soon as water comes into contact with cement, hydration starts and heat is released
according to the reaction occurring. Different clinker phases release different amount
of heat during their hydration197,213. The most heat evolved is upon hydration of C3S.
Cement goes through five stages during the hydration, as shown in in Figure 65. There
is an initial reaction lasting a few minutes (0-15 minutes) in which the calcium ions
dissolve in water. This is followed by an induction period lasting from 15 minutes to 4
hours where the overall rate of hydration slows down there is minimal heat released.
There then follows the acceleration period (4-8 hours) where the main exothermic
peak occurs as a result of alite hydration and formation of calcium silicate hydrate (C-
S-H) and portlandite (CH). Finally, there is a deceleration period (8-24 hours) where
hydration continues, but slowly.
Figure 65 An example of different stages of cement hydration based on heat evolution.
Ra
te o
f h
eat flo
w
Time, hrs

120
Hilal Saif Al Dhamri 200676958
Isothermal calorimetry was conducted to determine the hydration kinetics. Figure 66
and Table 17 show the heat evolution over 21 days for each sample. There was
generally no significant difference in the time to onset of the acceleration period
(Figure 66). All the results showed one main peak, associated with alite hydration to
form calcium silicate hydrate (C-S-H) and portlandite (CH). The highest peak is for the
cement containing 55% OBM cutting; appearing after 11.02 hours. The second highest
peak is for Cm-12%; after 11.63 hours. Followed by CmRef. and CmInd. at 11.88 and
12.12 hours respectively. Then, the heat rate slowed down gradually and reached very
low values within few days.
It has been reported in the literature214, but not seen in this investigation, that a
shoulder can appear on the tailing edge of the main peak, due to AFt formation. A
second shoulder can also appear due to conversion of AFt to AFm213.
In terms of total heat evolution, there were very little difference between the four
cement samples. However, during the first 12 hours of hydration there were slight
differences in heat evolution, there being a more intense peak, at shorter time with
increasing OBM cutting content. Compared to CmtRef, relative heat release from
samples Cm-12% and Cm-55% were 116% and 129% respectively.
Over the next 24 hours, all samples showed a decrease in heat evolution, in line with
the literature215 as the hydration reaction entered the deceleration stage. The upper
part Figure 66 shows the total heat evolved for the 4 samples investigated. The total
heat released was in the range 247 to 256 J/g at 21 days with maximum 3% difference
with the industrial sample. There is no much to compare, since all results shows very
close values from each other and compering with the reference and industrial cement.
It is difficult to draw conclusions from the ICC analysis due to the large convergence
of results. And it seems that all the cement samples give very similar results, without
any clear differences in the heat released upon hydration. Thus, it may be concluded
that the inclusion of OBM cuttings in cement raw meal gives properties very close to
the reference cement (CmRef) and industrial cement (CmInd).

121
Hilal Saif Al Dhamri 200676958
Table 17 The main heat results from ICC test.
Cement paste
Age of hydration peak Intensity of hydration peak Total heat evolved
(after 21 days of hydration)
Measured* (hrs)
Relative value (%)
Measured* (mW/g)
Relative value (%) Measured*
(J/g) Relative values
(%)
CmRef. 11.88 ±1.47 1 1.71 ±1.47 1 256.00 ±1.47 1
CmInd 12.12 ±2.03 1.02 1.67 ±2.03 0.98 247.41 ±2.03 0.97
Cm-12% 11.63 ±1.30 0.98 1.98 ±1.30 1.16 254.33 ±1.30 0.99
Cm-55% 11.02 ±1.40 0.93 2.2 ±1.40 1.29 252.66 ±1.40 0.99
*Measurement of three independent samples, Measurement error is standard division (SD).

122
Hilal Saif Al Dhamri 200676958
Figure 66 Isothermal Calorimetry results showing rate of heat evolution and total cumulative heat to 21 days
Minutes Hours Days
Cm-55%
Cm-12%
CmRef.
-0%
CmInd.
-0%

123
Hilal Saif Al Dhamri 200676958
7.5 Degree of hydration (DoH)
Degree of hydration (DoH) can be defined as the fraction of Portland cement that has
fully reacted with water216. The volume segment of a specified phase is identical to the
average surface portion in a 2D microstructure if the number of sections analysed is
large enough to be statistically representative217. It is therefore possible to apply grey
level segmentation based on the histogram of BSE images to quantify features in
polished section of cement samples114.
Figure 67 shows the degree of hydration (DoH) calculated by measuring the variation
in area of the anhydrous component over time218. The standard error (SE) is used to
estimate the error in measurement rather than the standard deviation (SD) among the
images which are reported in Appendix 10. The SE calculated according to the
following equation.
SE =SD
√n (n = number of images measured)
At all ages up to 28 days, the Cmind samples exhibited a higher degree of hydration,
as seen in Figure 67. Except for at 2 days where hydration was lower than the
reference sample. This is expected due to that the industrial cement is prepared under
different conditions than the laboratory cement (including better homogenisation,
consistence quality, using grinding aids etc). Further, the DoH of Cm-12% and Cm-
55% after 2 days curing was found respectively 62.03 and 59.30 % which are lower
when compared with the reference sample (66.03%). The Cm-55% showed a
marginally lower degree of hydration at all ages than the other samples, while the
reference sample showed the highest degree of hydration at all ages. The cement with
OBM cutting generally showed slightly lower degrees of hydration than the reference
cement. The compressive strength and CH content are demonstrated in Figures 70
and 71.The degree of hydration, based on the compressive strength and CH results,
did not improve in cement that prepared using OBM cutting. Although, compressive
strength of Cm-12% at 28 days increase when compared with other results, still, all
DoH results at 28 days fall within 5% difference range considering the standard errors
is less than 1%. Additionally, as demonstrated earlier in section 5.3 that alite content
in clinker decreasing as the OBM cuttings content increasing (Figure 26). In parallel,
the DoH in hydrated cement is decreasing as the OBM cutting increases. This is likely

124
Hilal Saif Al Dhamri 200676958
have a direct impact of degree of hydration of the prepared cement suggesting that
continued clinker phase hydration was minimal as the OBM cutting increases.
Figure 67 Degree of hydration obtained by SEM BSE vs time

125
Hilal Saif Al Dhamri 200676958
Chapter 8
Impact of using OBM cuttings in cement industries

126
Hilal Saif Al Dhamri 200676958
Chapter 8: Impact of usings OBM cutting in cement industry
8.1 Recycling in non-cement industry
In March 2017, a treatment concept was introduced in Oman that utilized OBM cuttings
to a small degree. The OBM cuttings are treated in the Aero Thermal Dissolution Unit36
(ATDU). The treatment recovers the oil from OBM cuttings by heating the OBM
cuttings to about 400oC under atmospheric conditions, as illustrated in Figure 68. This
treatment creates three main products: oil, water and solid OBM cuttings. The
recovered oil is reused in the OBM preparation plant. About 200 Ltr. can be used in
the OBM preparation. The ATDU process can recover just under 1 wt% of OBM
cuttings as oil. This is because the optimum temperature balance between water
evaporation and oil recovery is approximately 400 oC. The water produced from the
recycling process is stored in an open lagoon. The majority of solid OBM cuttings, with
moisture below 0.01%, is stored in a special landfill without further utilization or
treatment. However, this method of treatment using the ATDU does not completely
solve the problem. The by-product of the treatment process remains the same; it
requires special handling and storing in an engineered storage yard that can protect
the ground from any spillage. It is especially harmful to the environment because the
material is extremely fine and difficult to handle, as can be seen in Figure 69. It needs
a closed handling system to prevent dust emissions. Figure 70 shows the quantities
of OBM cuttings treated in the ATDU for a period of two years with the recovered oil
quantities. The recovered oil is used again to prepare fresh OBM for drilling operations.
There are some difficulties for treating the OBM cutting using this unit, which include:
- The effort of recycling is too high compared to the output. The recovered oil is
only 1% under ideal operating conditions.
- The operating cost is too high compared with the economic value of the output.
- The by-product from this treatment is still considered a hazardous material that
must be handled in accordance with the regulations regarding environmental
and health conditions.
- The gas emissions caused by heating to a low temperature (400oC), when
compared to the burning temperature in a cement kiln, are not enough to break

127
Hilal Saif Al Dhamri 200676958
down all the hydrocarbons to CO2 and water. The exhaust gases are expected
to have higher unburned hydrocarbon contents.
Figure 68 Aero Thermal Dissolution Unit (ATDU) for thermal treatment of OBM cuttings.
OBM production plant
OBM major ingredient: - Oil
- Mud
- Water
- Chemicals
OBM cutting
storage
Treatment Plant
ATDU
Recovered oil
Water
Dry OBM cutting
OBM cutting
storage
Water storage
Heating up to 400 oC
< 1%
about 200 Ltr. per day
recovered
oil
Oil drilling operation
Other additives/chemicals added on-site
5 – 20 %
> 80%
Transported
Transported

128
Hilal Saif Al Dhamri 200676958
Figure 69 Two types of OBM cuttings collected from storage yard.
(a) Treated OBM cuttings in ATDU, and (b) untreated OBM cuttings
The cost of separating and recycling the oil is summarised in Table 18. In option one,
the OBM cutting is treated by the ATDU oil recovery method. In option two, it is used
as raw material in cement clinker manufacturing. The third option combines options
one and two so that the raw OBM cutting from drilling operations goes directly to the
ATDU unit for oil recovery. The output of the OBM cutting from the ATDU is then
recycled as raw material through the cement manufacturing process. The cost of
option one is about 195 OMR per tonne of OBM cutting to recover 1% of oil for each
tonne of treated OBM cutting. This includes the cost of transporting materials from the
drilling field to the treatment plant. The recovered oil also has costs of handling,
transporting and mixing with fresh oil.
After considering all these costs, when comparing the feasibility of recycling OBM
cuttings by the ATDU or utilizing it as raw material in cement manufacturing, the latter
is clearly more feasible and requires less effort. However, the OBM cutting produced
from the ATDU is attractive for further study as a raw material in cement manufacturing
and an additive in cement grinding. The OBM cutting contain clay that comes from the
ground during the drilling process; if thermally treated, this clay could be converted to
material that has pozzolanic behaviour in cement hydration.
(a) (b)

129
Hilal Saif Al Dhamri 200676958
Table 18 Cost calculation for OBM cuttings recycling options
(S. Al-Aghbari, personal communications, May 7th 2019)
Item
Option 1 Option 2 Options 1+2
Oil recovery As raw material
in clinker production
1) Oil recovery 2) As raw
material in cement production
Capital investment, OMR 250,000 175,000 425,000
Operation and Maintenance, OMR/T
100 15 85
Transportation OMR/T 25 15 20
Storage, OMR/T 5 - -
Cost of oil recovered*, OMR/T
-10 - -10
Storage of treated OBM cuttings, OMR/T
75 - -
Handling & feeding of OBM cuttings
High Low Moderate
Environmental monitoring High High High
Total 195 OMR/T 30 OMR/T 125 OMR/T
*Each 1 T OBM cuttings give 1% oil which is about 1 Kg oil. The price of 1Kg oil is 10 OMR. Therefore, the saving from oil recovery is 10 OMR for recycling of each tonne of OBM cuttings. The currency 1 OMR is equal to 2.6 USD at the time of calculation.

130
Hilal Saif Al Dhamri 200676958
Figure 70 Quantities of treated OBM cuttings using ATDU and oil recovered29

131
Hilal Saif Al Dhamri 200676958
8.2 Oman Cement Company case
The Oman Cement Company produces 2.6 million tonnes of cement annually. It
requires about 2.47 million tonnes of clinker (5% additives + 95% clinker). About 4.1
million tonnes of raw materials required annually for clinker consumption. Furthermore,
an extension of this factory to a new location219 in Oman will require even more raw
materials. The present factory has three production kilns line. kiln 1 and 2 is producing
2,700 and 2,000 tonne per day clinker respectively. Kiln 3 is producing 4,000 tonne
per day equivalent to 1.2 million tonne annually (considering 300 days operation
annually). The annual requirement of raw materials for kiln line 3 is about 2 million
tonne. The volume of OBM cuttings expected to be produced by 2020 (as shown in
Table 19) is double the present production rate which is sufficient to be 100 %
consumed by cement industry in Oman if 12% of OBM cutting is used to replace raw
materials.
Table 19 The estimated OBM cutting production and the rate of growth
Year Production,
×1000 T Rate growing, ×1000 TPY
% growing
2013 60 10 17%
2014 67 7.5 11%
2015 75 7.5 10%
2016 95 20 21%
2017 115 20 17%
2018* 147 32.5 22%
2019* 172 25 14%
2020* 201 29 14%
Average 109.33 18.94 15.75
*Estimated quantities
Three important aspects of handling OBM cuttings must be considered when deciding
whether to use them in cement manufacture. First, they must be transported from the
generation site at the oil well field to the cement factory. Although internationally and,
according to their OBM Safety Data Sheet, OBM cuttings are not regulated as a
dangerous good. However, in Oman, the Ministry of Environment and Climate Affairs
does classify them as a dangerous material. Hence, all aspects of managing OBM
cuttings must be performed in accordance with the procedures required for dangerous
substances. To ensure OBM cuttings are transported safely and avoid spilling them
on the ground during transportation, the truck must (1) have an open top and a

132
Hilal Saif Al Dhamri 200676958
container that is sealed without any gaps to avoid leaching and (2) carry no more than
30 tonnes of OBM cuttings at any given time. Handling the cuttings after they arrive at
the cement factory is also regulated to avoid environmental problems, such as soil and
water pollution. Once the truck arrives at the cement plant, the OBM cuttings are
unloaded onto a concreted area adjacent to the raw material feeding point.
There are several suggestions regarding feeding point of OBM cuttings in cement
plant. First, OBM cuttings should be mixed with limestone before they are sent to the
crusher (mixed with limestone and then combined with other raw materials, such as
quartzo-phillite, iron ore, and kaolin) as shown Figure 71. After being mixed, ground,
and homogenised, the OBM cuttings become raw meal that is (1) introduced to the
heating system at the pre-heater tower from the top and (2) calcined at about 850 oC
at the stage before entering the kiln. As the raw meal is falling by gravity into the pre-
heater tower, a flow of hot gases is directed against the flow of the material. These
gases are directed to the baghouse for filtration and to remove dust, and then they are
released as exhaust from the chimney Figure 72. The gases are mainly CO2 produced
during the calcination process and fuel burning. At the top of the pre-heater tower,
hydrocarbons from the OBM cuttings are initially exposed to temperatures in the range
of 280–350 oC. However, this temperature range is not hot enough for the complete
combustion of the hydrocarbons, which may lead to an increase in the amount of
unburned compounds, such as hydrocarbons, NOx, and SOx, released into the
atmosphere220.However, the concentration of unburned compounds depends on the
kiln system’s many operational conditions and the chemistry of the raw materials.
The second suggestion (introducing OBM cutting at the calciner) is an extension of the
first and has several advantages and disadvantages. For example, a higher
percentage of OBM cuttings could be utilised because the hydrocarbons can undergo
complete combustion at higher temperatures in the calciner. The release of unburned
compounds is expected to be reduced because the exhaust gases take a longer
path79. However, this step requires a special conveyor system and feeding system that
can control the amount of OBM cuttings introduced to the calciner integrated with the
quality control system. This option is expected to limit the amount of OBM cuttings that
can be utilised. In addition, technical consideration to be taken during the kiln
operation. Possible variations in several parameters during the feeding of OBM cutting
through the calciner include moisture content, flame shape changing and calciner rise

133
Hilal Saif Al Dhamri 200676958
in carbon monoxide221. The arrangement for feeding through the calciner is illustrated
in Figure 73.
Figure 71 Main source of emissions from the cement kiln system.

134
Hilal Saif Al Dhamri 200676958
Figure 72 Proposed feeding points of OBM cutting.
Figure 73 Arrangement for feeding OBM cutting at the calciner.
(after Mouayed M. 222)
8.3 Impact of introducing OBM cutting to Oman Cement Company
as additional raw material
The Oman Cement Company plant is located very close to high-quality limestone
containing 90–95% pure CaCO3 with sufficient reserves to produce cement clinker for
at least 100 years. Furthermore, the plant is adjacent to two additional raw materials,

135
Hilal Saif Al Dhamri 200676958
iron ore and quartzo-phillite (QPh). However, QPh has two limitations. First, it has a
high free silica content, which makes it difficult to grind223 and so increases the cost.
Second, the reserve of QPh is very small and insufficient for future production needs,
which will require the company to search for an alternative substitute sources. In
addition, while its purity can be considered a positive, the limestone in Oman Cement
Company quarry is deficient in alumina (Al2O3 content in limestone 0.62 %wt. ±0.19,
[Appendix 15B]), requiring the company to use an expensive alumina source material
as a corrective raw material, such as bauxite or kaolin. Bauxite does not occur naturally
in Oman, so is imported. However, kaolin is available in limited quantities, but the
reserves are located far from the plant. The cost of kaolin (mining and transportation)
is ten times the cost of limestone, which makes the raw material costly10,97.
Introducing alternative material to the Oman Cement Company plant, such as OBM
cuttings, may provide material that supports the raw material currently being used. The
chemical composition and characteristics of OBM cuttings are an advantage and could
replace QPh. The Rm-55% sample, which contains 55% OBM cuttings, would be ideal
for cement manufacturing. It has zero QPh and minimum kaolin consumption (0.50%
kaolin). The reference sample of the raw meal contains 4.70% kaolin, which means
OBM cuttings have almost 9-times less kaolin. The industrial raw meal sample
contains about 5.65% kaolin. Furthermore, the iron ore % needed in the raw mix to
prepare the Rm-55% also dropped to 1.50% (Table 7)
Table 7. This approach should be viewed favourably by the cement plant as it would
save the company operational and raw material costs. The cement prepared from raw
material that contains the highest percentage of OBM cuttings (i.e., 55%) meets the
clinker manufacturing requirements. Furthermore, the calcination temperature
required to decompose CaCO3 decreases as the OBM cuttings are added and, thus,
reduces fuel consumption. In fact, 60% of fuel consumption in the clinkerisation
process occurs during calcination224. Thus, less fuel would be needed, which would
have a direct impact on decreasing the plant’s CO2 emissions225,226 and lowering the
production cost. However, looking considering the quantity of OBM cutting produced
from the oil filed, seeing the oil operation growth in coming years, the amount of OBM
cutting is not sufficient to sustain cement production using OBM cutting at 55% level.
Consequently, 12% could be a better choice.

136
Hilal Saif Al Dhamri 200676958
Chapter 9
Summary discussion

137
Hilal Saif Al Dhamri 200676958
Chapter 9 Summary discussion
9.1 Introduction
OBM cuttings are wastes from the oil drilling process and are polluted with oil, making
them a potentially hazardous waste that should not be released into the environment.
OBM cuttings have numerous characteristics that could be utilised in the cement
industry. The cuttings all contain oxides which are essential in cement manufacture.
Utilization of cuttings in cement manufacture will provide an environmentally friendly
waste management solution for this potentially hazardous waste.
The objective of this study was to create background knowledge concerning the effect
of using OBM cuttings as raw material in cement manufacture. This study provides
momentum for the oil and cement sectors to seize a recycling opportunity and
maximise the utilisation of resources and by-products, such as OBM cuttings.
Clinker was prepared in a laboratory with different OBM cutting contents. The resultant
clinker was tested by XRD, XRF, SEM-EDX, and for free lime. The clinkers were
ground with gypsum using a tube ball mill to produce cement. The cement was tested
according to appropriate standards (i.e., mechanical, physical, and chemical testing)
and, in addition, the hydration behaviour was investigated by (ICC) and (STA).
9.2 OBM cutting
XRD analysis of the OBM cuttings found that the OBM contains mainly calcite
(CaCO3), dolomite (CaMg(CO3)2), quartz (SiO2), iron oxide (Fe2O3) and barite
(BaSO3).
In addition, the analyses showed that the OBM cuttings are a heterogeneous mixed
material composed of a few major types: gravel, limestone, clay and shale. The gravel
and limestone are cuttings from the oil drilling process that contaminate the
recirculated material and become part of the OBM cutting. Limestone (calcite) and clay
are added during the preparation of the OBM. Shale is of low CaO content (below
40%) and high SiO2 content (above 20%). The alumina content in OBM cuttings
probably arises from the clay used in OBM preparation. Clay is a major source of
aluminium in the form of aluminosilicates.

138
Hilal Saif Al Dhamri 200676958
Analysis also showed the presence of barium in the OBM cuttings as barite (barium
sulphate, BaSO4). The major source of barite is the preparation of the OBM used
during the oil well drilling process. OBM cuttings likewise contain heavy and trace
metals from several sources in very low concentrations. These are mainly from the
use of additives or from the cutting and the crude oil. The OBM cuttings obtained in
this study have metal contents that fall below the limits specified by Petroleum
Development Oman (PDO).
9.3 The effect of OBM cutting on the clinkerization process
The main phases in all the investigated clinkers were alite (C3S), belite (C2S),
tricalcium aluminate (C3A) and ferrite (C4AF). There were no noticeable changes in
the alite or belite polymorph with changes in OBM cutting content. However, the levels
of alite and belite formed were dependent on the OBM cutting content. This result was
not predicted by the Bogue calculations, but the Rietveld refinement data showed a
gradually decreasing alite content and corresponding increasing belite content with
increasing OBM cutting content.
Thermal analyses of various raw meal samples showed that the calcination
temperature (CaCO3 decomposition temperature) decreased with increasing OBM
cutting content. Calcite decomposition occurred at 817 oC when no OBM was present,
falling consistently with increasing OBM cutting content until the OBM cutting alone
(Rm100%) showed decomposition at 763 oC.
Analyses of petrographic thin sections of the limestone used here shows calcite
crystals of a depositional texture, with no regular shape and unevenly distributed
without common direction. The grains are coarse (>3mm) and compact with no void
space between calcite crystals, appearing flat and with some fractures. This limestone
can be classified as crystalline limestone according to the Dunham classification158.
The OBM cuttings, meanwhile, show different petrography, with the calcite being mud-
supported with loosely packed grains and high porosity. The clay grains are mostly
present as developed clusters and immersed in oil. Lath-shaped plagioclase grains
with sharp grain margins are also present. The calcite show round sub-millimetre
grains, which are highly brittle and fragile in nature. XRD analyses of OBM cuttings
show the presence of dolomite. Therefore, the OBM cuttings’ classification can be
considered be a mix between two or three types of limestone, falling between

139
Hilal Saif Al Dhamri 200676958
mudstone and Wake stone. However, the classification is certainly different from the
limestone used in this research.
Literature showed that limestone decomposition starts with the rapid dissociation of
dolomite in the first few min, followed by calcite decomposition. Dolomite dissociation
occurs in a single step without a calcite intermediate phase. This suggests that the
presence of dolomite reduces the calcination activation energy. It is proposed that
limestone dissociation starts with dolomite decomposition, resulting in the formation of
grain cracks due to the CaMg(CO3)2 structure, growing the surface area, allowing CO2
diffusion.
The lower decomposition temperature in OBM cuttings may also be related to the
calcite texture therein, which differs from the calcite in limestone as explained above.
Finally, OBM cuttings are more porous than limestone, allowing more surface area for
heat transfer. As seen petrographically, the calcite grains float in the mud, with larger
spaces between grains than in the limestone.
The calcite grain size also has an effect on both the rate of decomposition and the
temperature at which decomposition occurs. Coarser grains show higher
decomposition temperatures and lower rates of decomposition.
The burnability of raw meal was investigated. The results show that the free lime
content for raw meal obtained from industrial (RmInd.) and the one prepared in lab
(RmRef.) mixes fell with increasing temperature. However, the free lime content of RmInd
was always greater than that of RmRef, with the difference between the two decreasing
with increasing temperature, until the difference was minimal at 1400 oC and above.
The higher free lime content for RmInd could be due to its higher LSF, i.e. 92.53
compared to 90.50 for RmRef. Thus, there is more CaO to be consumed during
clinkering. This is supported by the convergence of the two data sets with increasing
temperature. Both mixes showing similar burnability behaviour validates the use of the
reference raw meal in comparisons with raw meal prepared using OBM cutting.
The burnability results for RmRef plus raw meal prepared using 12%, 55% and 100%
OBM cuttings showed that, despite the falling free lime contents with increasing
temperature, there was an increase in free lime with increasing OBM cutting content,
suggesting harder burnability. However, this did not apply to the sample prepared from
100% OBM cutting. This sample showed very easy burning behaviour. The free lime

140
Hilal Saif Al Dhamri 200676958
dropped significantly, even at 1300 oC (0.2% free lime), then showing only 0.02% free
lime content when heating at 1500 oC. However, when burned at 1200 oC, the 100%
OBM cutting showed belite formation and a very low free lime content. Higher
temperatures still led to no alite formation due to there being no CaO remaining.
Instead, belite grains were within a high melt content, a result of the high concentration
of Al2O3 and Fe2O3 % in the mix. The absence of alite can easily be understood in
terms of the LSF, which at 48.45 was considerably lower than for all of the other
samples.
In RmRef, the belite and liquid phase formation temperature was 1284 and 1331 oC
respectively, but these fell upon incorporation of OBM cutting. SEM-EDX and ICP
analysis both showed an increase in barium content with increasing OBM cutting
content. Furthermore, SEM-EDX analysis revealed the distribution of barium through
the clinker phases, with the highest concentration found in the liquid phase.
The effect of barium on phase composition is related to the free lime content. An
increased free lime content indicates reduced burnability and incomplete formation of
the main clinker phases. This is possibly due to alite formation being destabilized. The
addition of OBM cutting decreased burnability and the free lime contents increased.
With the OBM cutting containing 0.85 wt% BaO, the barium content of the clinker
increases with increasing OBM cutting content. BaO has a negative influence on alite
formation, thus increasing the free lime content. This is in line with many
studies175,176,177,168,148 showing that the free lime content increases with barium
content, and that barium is mainly concentrated in the melting phase.
9.4 The effect of OBM cutting on the cement properties and
hydration
Cement hydration was studied by a number of techniques. The mechanical strength
was determined and compared with the standard specification implemented in Oman
(OS7/2001). Also, the physical testing such as setting time, Blaine, soundness and
density were measured. Using XRD complemented by SEM-EDX analyses of polished
cross-sections, the major hydrate phases were studied. SEM was also used to
understand if there were any significant changes in the microstructure.
The chemical composition limits in OS are similar to those in BS/EN standard except
regarding MgO, insoluble residue (IR), and C3A content. In addition, OS specifies the

141
Hilal Saif Al Dhamri 200676958
range of cement LSF and AM factors. The cement produced using the OBM cutting
meets the standard requirement and fulfils the chemical and physical/mechanical
limits.
The soundness of the prepared cement increased as OBM cutting content increased.
Higher expansion could be due to several reasons, such as i) high free lime content in
clinker (above 2%) or ii) high MgO content in cement (above 3%). The free lime
contents in all samples were kept below 2%. The significant contribution for the
expansion may be attributed to the presence of a high concentration of MgO
(periclase) in cement prepared with higher OBM cutting contents in the raw meal.
Hence, higher soundness in the cement sample of 55 % OBM cutting is more likely
due to the higher content of MgO coming from OBM cutting. The SEM-EDX analysis
also confirms the presence of MgO in cements prepared with 30% and above OBM
cutting. Setting time results show no significant change between the samples with
OBM cutting and the reference sample.
Compressive strength results increased with hydration for 2, 7 and 28 days. At two
days, the two reference samples (CmInd and CmRef) showed slightly lower strengths
than the samples prepared with OBM cutting (12% and 55%). By 7 days, the strengths
of all samples increased and the OBM-containing samples remained slightly stronger
than the reference samples. At 28 days, Cmt-12% was the strongest, with no
significant difference between others. With alite being the principal phase responsible
for later-age strength, given the minimal difference in alite contents between the
samples, the similarity in performance is not surprising. It is possible that the slight
variations in Blaine fineness could explain the slight differences in strength. Fineness
plays a dominant role in compressive strength development, with higher fineness
leading to higher strength due to cement grains having more surface area exposed
during hydration.
There was no significant effect on the crystal phases formed upon hydration, despite
the greater potential of magnesite (MgCO3) formation. In all investigated samples AFm
(ettringite) was present at 2 days hydration, while no AFm formation was observed in
any samples. The formation of AFt is highly dependent on the C3A content in cement.
With high C3A contents, the monocarboaluminate appears at early age of hydration,
often within 7 days of hydration209.

142
Hilal Saif Al Dhamri 200676958
The optical microscopy analysis showed an increase in C3A content as the OBM
cutting increased. The C3A content in CkRef., Ck12 and Ck55 are 12, 16 and 17%
respectively. However, AFm phases were not detected. The XRD patterns for all
hydrated cement samples showed similar behaviour. Ettringite (AFt) and C4AF were
observed with the intensity of reflections from the latter diminishing with time. Between
2 to 28 days the intensity of the main clinker phase reflections decreased with growth
of reflections due to hydrates. The amount of AFt formed depends on the ratio of
sulphates (added during grinding) and the C3A content of the clinker. At high ratio of
C3A to CaSO3.2H2O, the AFt is unlikely to convert to AFm. In this investigation, the %
of gypsum added during the cement grinding was fixed at about 6% for all samples.
The C3A content calculated according to Bogue formula in clinker samples Ref, 12%
and 55% are 7.94, 7.77 and 6.74 % respectively, with no change in polymorph (which
is known to affect the rate of hydration). Therefore, the absence of AFm can be
explained by the increasing sulphate to aluminate ratio in the cement. Furthermore,
the absence of the AFt → AFm conversion means that no additional heat is released
after the first hydration reaction is completed. This is could be an explanation for the
similarity of the heat rate shown for the all samples.
The hydration reaction of C3S is associated with formation of calcium hydroxide (CH)
which precipitates in the form of portlandite and is dispersed within the hardened
paste. The XRD patterns for the hydrated cement clearly indicates the formation of CH
in all samples, with growing intensity as the time passes.
Isothermal calorimetry (ICC) was conducted to determine the hydration kinetics. There
was generally no significant difference in the time to onset of the acceleration period.
All the results showed one main peak, associated with alite hydration to form calcium
silicate hydrate (C-S-H) and portlandite (CH). The highest peak is for the cement
containing 55% OBM cutting; appearing after 11.02 hours. The second highest peak
is for Cm-12%; after 11.63 hours. Followed by CmRef. and CmInd. at 11.88 and 12.12
hours respectively. Then, the heat rate slowed down gradually and reached very low
values within few days.
The total heat released was in the range 247 to 256 J/g at 21 days with maximum 3%
difference with the industrial sample. This confirms the similarity in behaviour of the
various cements.

143
Hilal Saif Al Dhamri 200676958
At 7 and 28 days, the Cmind samples exhibited a higher degree of hydration (DoH), but
at 2 days hydration was lower than the reference sample. This is likely due to variation
in cement preparation, e.g. the use of industrial grinding with grinding aids.
Additionally, the DoH of Cm-12% and Cm-55% after 2 days curing were found
respectively 62.03 and 59.30 % which are lower when compared with the reference
sample (66.03%). The Cm-55% showed a marginally lower degree of hydration at all
ages than the other samples, while the reference sample showed the highest degree
of hydration at all ages.
9.5 Impact of using OBM cutting in cement industries
Three important aspects of handling OBM cuttings must be considered when deciding
whether to use them in cement manufacture.
i- They must be transported from the generation site at the oil well field to the
cement factory. Although internationally and, according to their OBM Safety
Data Sheet, OBM cuttings are not regulated as a dangerous good. However,
in Oman, the Ministry of Environment and Climate Affairs does classify them
as a dangerous material. Hence, all aspects of managing OBM cuttings
must be performed in accordance with the procedures required for
dangerous substances.
ii- The truck must (1) have an open top and a container that is sealed without
any gaps to avoid leaching and (2) carry no more than 30 tonnes of OBM
cuttings at any given time.
iii- Once the truck arrives at the cement plant, the OBM cuttings are unloaded
onto a concreted area adjacent to the raw material feeding point.
There are several suggestions regarding feeding point of OBM cuttings in cement plant
as following:
- OBM cuttings should be mixed with limestone before they are sent to the
crusher. After being mixed, ground, and homogenised, the OBM cuttings
become raw meal that is (1) introduced to the heating system at the pre-heater
tower from the top and (2) calcined at about 850 oC at the stage before entering
the kiln.

144
Hilal Saif Al Dhamri 200676958
- The second suggestion (introducing OBM cutting at the calciner) is an
extension of the first and has several advantages and disadvantages. For
example, a higher percentage of OBM cuttings could be utilised because the
hydrocarbons can undergo complete combustion at higher temperatures in the
calciner. The release of unburned compounds is expected to be reduced
because the exhaust gases take a longer path. This option is expected to limit
the amount of OBM cuttings that can be utilised. In addition, technical
consideration to be taken during the kiln operation. Possible variations in
several parameters during the feeding of OBM cutting through the calciner
include moisture content, flame shape changing and calciner rise in carbon
monoxide.

145
Hilal Saif Al Dhamri 200676958
Chapter 10
Conclusions and further work

146
Hilal Saif Al Dhamri 200676958
Chapter 10: Conclusions and further work
10.1 Conclusions
The hydration behaviour of the cement prepared with and without OBM cutting has
been studied by many techniques such as ICC, STA and mechanical properties. Using
XRD complemented with SEM-EDX analyses of polished sections, the major hydrate
phases were studied. The SEM and optical microscopy of the clinker was also used
to understand if there are any significant changes to the microstructure and main
phases, which may influence hydration. The degree of hydration was obtained and the
main hydration products such as C-S-H and CH were identified.
After heating and burning the raw meal of different OBM cutting ratios, and Portland
cement clinker obtained, the clinker phases formed in all samples having the required
composition of main clinker phases that essential to complete the hydration process
stages in like to normal cement. To obtained comparable results, the cement clinker
ground at similar fixed condition, physical parameters and gypsum quality and
quantity. This allow to understand if OBM cutting ratio has impact on the cement
behaviour hydration. The technique adopted in this study for the investigation, is to
understand whether OBM cutting has any substantial impact that could interrupt
manufacturing of cement using OBM cutting as an additional raw material. The results
obtained show that the hydration behaviour as normal with no significant change
observed and no distinguished change comparing to the reference sample and
industrial cement. The progress of hydration of cement prepared for the ones with
OBM cutting and comparing to the reference and industrial cement are following
similar hydration behaviour.
Clinker prepared using OBM waste had very similar properties to clinker prepared from
the limestone normally used in cement production. These results demonstrate that
OBM cutting could be recycled in the manufacture of Portland cement clinker. This
could present an opportunity for re-use of OBM cutting waste and solve an
environmental problem. This will also reduce the cost of cement production. The main
result in this study are as follows:

147
Hilal Saif Al Dhamri 200676958
- The addition of OBM cutting lowers the calcination temperature. This is
because the calcite in OBM cutting has a smaller grain size than that in the
limestone.
- Furthermore, the OBM cutting contained some dololimte (CaMg(CO3)2). This
increases the rate of carbonate dissociation and so also contributed to the
lowering of the calcination temperature.
- However, the addition of OBM cutting to the raw meal led to a higher free lime
content in the resultant clinker. There are many reasons for this, but the role of
trace elements, especially barium, in destabilizing alite has been demonstrated
here.
- While it would likely have no commercial potential, clinker could be prepared by
just heating OBM cutting at 1200 oC, without any addition. The XRD and SEM-
EDX analysis of the resultant clinker showed formation of belite with a very low
free lime content and no alite formation.
- There are several benefits that could be gained from the successful recycling
of OBM cuttings in cement manufacture. The OBM cuttings provide a source of
fuel. They also reduce the consumption of natural resources. In oil drilling
operations, the reuse of OBM cuttings in cement production provides an
environmentally-friendly waste management solution for large quantities of
OBM cuttings, reducing landfill by effective recycling of waste, without the need
for any pre-treatment.
- The inclusion of ca. 12% OBM cuttings in raw meal for cement manufacture
has no significant effect on clinker composition. Thus, this provides a cost-
effective, environmentally-friendly route for the management of OBM cuttings
derived from the oil industry.
- Introducing alternative material to the Oman Cement Company plant, such as
OBM cuttings, may provide material that supports the raw material currently
being used.
10.2 Further work
The results of this thesis can help to improve the quality control of the cement
production using OBM cutting as an additional raw material. The lower burnability
behaviour of the raw meal that contain OBM cutting could be further explored to

148
Hilal Saif Al Dhamri 200676958
produce clinker with less fuel consumption. However, the impurities present in OBM
cutting could be additional studied to explore the method and ways for preparing the
raw meal that fit to be used in cement manufacturing. A pilot investigation at cement
kiln plant is essential to study the actual characteristic of the clinker produced using
OBM cuttings and likewise to measure the main stack gaseous emissions, i.e. carbon
monoxide (CO), sulphur oxides (SOx), nitrogen oxides (NOx), hydrocarbons (H/C),
hydrogen sulphide (H2S), volatile organic compounds (VOCs), particulate matter
(PMs) and substances of environmental concern (e.g. Hg, Cd, Pb, etc)
The pilot investigation could extend to test the produced clinker and cement. Similarly,
it is worth comparing the differences between the clinker and cement prepared in the
laboratory with that produced from a real-kiln. This would highlight potential
differernces between the different scales of production, for example in the duration of
the clinkering process.
Furthermore, it would be worth studying the potential of using OBM cuttings lfor other
purposes in the cement industry such as to replace additives (e.g. pozzlana and fly
ash). Also, to study thermal treatment of OBM cuttings and observe the effect on it is
properties.

149
Hilal Saif Al Dhamri 200676958
References 1. U.S. Geological Survey, Mineral Commodity Summaries, January 2018 ,
https://minerals.usgs.gov/minerals/pubs/commodity/cement/mcs-2018-cemen.pdf. 2. Fitch Solutions MBI, on-Line Database, Http:\\fitchsolutions.Com. 3. Portland Cement Association. World Cement Consumption. World Cem. 2013. 4. Deloitte. GCC of Construction 2014 in Construction Sector Overview.; 2014. 5. Cement G. Global Research Sector - Cement. Glob Invest House. 2013;March. 6. National Centre for Statistics and Information, Oman, website: www.ncsi.gov.om. 7. Abdul-Wahab SA, Al-Rawas GA, Ali S, Al-Dhamri H. Impact of the addition of oil-based mud on
carbon dioxide emissions in a cement plant. J Clean Prod. 2016;112:4214-4225. doi:10.1016/j.jclepro.2015.06.062
8. Gao T, Shen L, Shen M, Liu L, Chen F, Gao L. Evolution and projection of CO2emissions for China’s cement industry from 1980 to 2020. Renew Sustain Energy Rev. 2017;74(December 2016):522-537. doi:10.1016/j.rser.2017.02.006
9. Imbabi MS, Carrigan C, McKenna S. Trends and developments in green cement and concrete technology. Int J Sustain Built Environ. 2012;1(2):194-216. doi:10.1016/j.ijsbe.2013.05.001
10. Oman Cement Company SAOG. Production Department. Oman. www.occ.om. Published 2018. Accessed November 1, 2018.
11. Bites N. Oman Cement : Natural Gas Price increase. 2014:1-2. 12. Caenn R, Chillingar G V. Drilling fluids: State of the art. J Pet Sci Eng. 1996;14(3-4):221-230.
doi:10.1016/0920-4105(95)00051-8 13. Al-Ansary MS, Al-Tabbaa A. Stabilisation/solidification of synthetic petroleum drill cuttings. J
Hazard Mater. 2007;141(2):410-421. doi:10.1016/j.jhazmat.2006.05.079 14. Leonard SA, Stegemann JA. Stabilization/solidification of petroleum drill cuttings: Leaching
studies. J Hazard Mater. 2010;174(1-3):484-491. doi:10.1016/j.jhazmat.2009.09.078 15. Davies JM, Addy JM, Blackman RA, et al. Environmental effects of the use of oil-based drilling
muds in the North Sea. Mar Pollut Bull. 1984;15(10):363-370. doi:10.1016/0025-326X(84)90169-3
16. Almudhhi SM. Environmental impact of disposal of oil-based mud waste in Kuwait. Pet Sci Technol. 2016;34(1):91-96. doi:10.1080/10916466.2015.1122630
17. Robinson JP, Kingman SW, Snape CE, et al. Remediation of oil-contaminated drill cuttings using continuous microwave heating. Chem Eng J. 2009;152(2-3):458-463. doi:10.1016/j.cej.2009.05.008
18. Xie SX, Jiang GC, Chen M, et al. Harmless treatment technology of waste oil-based drilling fluids. Pet Sci Technol. 2014;32(9):1043-1049. doi:10.1080/10916466.2011.638691
19. Henry LA, Harries D, Kingston P, Roberts JM. Historic scale and persistence of drill cuttings impacts on North Sea benthos. Mar Environ Res. 2017;129:219-228. doi:10.1016/j.marenvres.2017.05.008
20. Ghazi M, Quaranta G, Duplay J, et al. Life-Cycle Impact Assessment of oil drilling mud system in Algerian arid area. Resour Conserv Recycl. 2011;55(12):1222-1231. doi:10.1016/j.resconrec.2011.05.016
21. Ministry of Environment & Claimt afferias. MD 18-93 Regulations for the Management of Hazardous Waste. 1993.
22. Cripps SJ. Disposal of Oil-Based Cuttings.; 1998. 23. Strachan MF. Studies on the impact of a water-based drilling mud weighting agent (Barite) on
some Benthic invertebrates. 2010:13-17. file:///C:/Users/em0899/Desktop/hilal2017/Journals 2018/OBM/studies on the impact of a water-based drilling mud in North Sea.pdf.
24. Fakoya MF, Ahmed RM. A generalized model for apparent viscosity of oil-based muds. J Pet Sci Eng. 2018;165(December 2017):777-785. doi:10.1016/j.petrol.2018.03.029

150
Hilal Saif Al Dhamri 200676958
25. Agwu OE, Okon AN, Udoh FD. A Comparative Study of Diesel Oil and Soybean Oil as Oil-Based Drilling Mud. J Pet Eng. 2015. doi:10.1155/2015/828451
26. Abduo MI, Dahab AS, Abuseda H, AbdulAziz AM, Elhossieny MS. Comparative study of using Water-Based mud containing Multiwall Carbon Nanotubes versus Oil-Based mud in HPHT fields. Egypt J Pet. 2016;25(4):459-464. doi:10.1016/j.ejpe.2015.10.008
27. Lechtenberg D, Diller H. Alternative Fuels and Raw Materials (AFR) review “oil mud drillings.” In: Alternative Fuels and Raw Materials Handbook for the Cement and Lime Industry, Volume 2. Dusseldorf: MVW Lechtenberg & Partner; 2012:303-320.
28. Industrail and Hazardous Waste Survey Summery Report. Oman: Oman Environmental Service Holding Company S.A.O.C (be’ah), 2018.
29. Petroleum Development Oman. Department of Chemistry. https://www.pdo.om. Published 2019. Accessed February 1, 2019.
30. Taha R, Al-Rawas A, Al-Jabri K, Al-Harthy A, Hassan H, Al-Oraimi S. An overview of waste materials recycling in the Sultanate of Oman. Resour Conserv Recycl. 2004;41(4):293-306. doi:10.1016/j.resconrec.2003.10.005
31. Zacks Investment Research: BP Commences Natural Gas Production in Oman’s Khazzan Field. Newstex Financ Account Resour. 2017.
32. Oman Supreme Council for Planning. The National Program for Enhancing Economic Diversification: TANFEEDH Handbook. Tnafeeth. 2017;(July):71. http://www.tanfeedh.gov.om/en/handbook.php.
33. Eldridge RB. Oil Contaminant Removal from Drill Cuttings by Supercritical Extraction. Industerial Eng Chem Res. 1996;5885(95):1901-1905.
34. Khanpour R, Sheikhi-kouhsar MR, Esmaeilzadeh F. Removal of contaminants from polluted drilling mud using supercritical carbon dioxide extraction. J Supercrit Fluids. 2014;88:1-7. doi:10.1016/j.supflu.2014.01.004
35. Mcdonald JA, Portier RJ. Feasibility studies on in-situ biological treatment of drilling muds at an abandoned site in Sicily. 2003;716(May 2002):709-716. doi:10.1002/jctb.847
36. Young GA, Growcock FB, Talbot KJ, Lees J, Allis B, Worrell B. Elements of Thermally Treating Oil-Base Mud Cuttings. In: SPE/IADC Drilling Conference. Amsterdam; 1991:365-374.
37. Erickson P, Fowler B, Thomas D. Oil-Based Drilling Muds: Off Structure Monitoring, Beaufort Sea.; 1988. https://books.google.com.sa/books/about/Oil_based_Drilling_Muds.html?id=gPwaAQAAIAAJ&pgis=1.
38. Breuer E, Stevenson AG, Howe JA, Carroll J, Shimmield GB. Drill cutting accumulations in the Northern and Central North Sea: A review of environmental interactions and chemical fate. Mar Pollut Bull. 2004;48(1-2):12-25. doi:10.1016/j.marpolbul.2003.08.009
39. Khanpour R, Sheikhi-Kouhsar MR, Esmaeilzadeh F, Dariush Mowla. Removal of contaminants from polluted drilling mud using supercritical carbon dioxide extraction. J Supercrit Fluids. 2014;88:1-7. doi:doi.org/10.1016/j.supflu.2014.01.004
40. Hou B, Chen M, Liu M, Xiong Q. Safe disposal technology of waste oil-based drilling fluids. J Japan Pet Inst. 2013;56(4):221-229. doi:10.1627/jpi.56.221
41. Qin X, Lu H, Li Y, et al. Preparation and Evaluation of a Profile Control Agent Base on Waste Drilling Fluid. J Chem. 2017;(1). doi:https://doi.org/10.1002/ep.10568
42. International Council on Clean Transportation. China V - gasoline and disel fuel quality standards. 2014. http://www.theicct.org/sites/default/files/publications/ICCTupdate_ChinaVfuelquality_jan2014.pdf.
43. Amani M, Al-Jubouri M, Shadravan A. Comparative Study of Using Oil-Based Mud Versus Water-Based Mud in HPHT Fields. Adv Pet Explor Dev. 2012. doi:10.3968/j.aped.1925543820120402.987
44. Abbe OE, Grimes SM, Fowler GD, Boccaccini AR. Novel sintered glass-ceramics from vitrified

151
Hilal Saif Al Dhamri 200676958
oil well drill cuttings. J Mater Sci. 2009;44(16):4296-4302. doi:10.1007/s10853-009-3637-y 45. Oreshkin D V., Chebotaev AN, Perfilov VA. Disposal of drilling sludge in the production of
building materials. Procedia Eng. 2015;111:607-611. doi:10.1016/j.proeng.2015.07.053 46. Nahmad D, Lepe A, Environmental E, Group RAYI, Rasheed R. Treatment of Contaminated
Synthetic Based Muds ( SBM ) Drilling Waste in Block 47 Oman. In: Abu Dhabi International Petroleum Exhibition and Conference. Abu Dhabi; 2014:1-15.
47. Gogan R, Operating KP, Mendalieva DK, Kunasheva ZK. Usage of Oil Based Carbonate Mud Drilling Cuttings Post Thermo-treatment as Secondary Raw Mineral Materials. In: SPE Annual Caspian Technical Conference and Exhibition. Astana; 2014:1-6.
48. Edwan Kardena QH. Petroleum Oil and Gas Industry Waste Treatment; Common Practice in Indonesia. J Pet Environ Biotechnol. 2015;06(05). doi:10.4172/2157-7463.1000241
49. Mostavi E, Asadi S, Ugochukwu E. Feasibility Study of the Potential Use of Drill Cuttings in Concrete. Procedia Eng. 2015;118(2):1015-1023. doi:10.1016/j.proeng.2015.08.543
50. Shon CS, Estakhri CK, Lee D, Zhang D. Evaluating feasibility of modified drilling waste materials in flexible base course construction. Constr Build Mater. 2016;116:79-86. doi:10.1016/j.conbuildmat.2016.04.100
51. Piazza, D., Pelegrini, K., Dra RNB. Recyclability of polypropylene (PP) and polyethylene (PE) waste from the Hawaii coastline. Int J Waste Resour. 2017;7(5211). doi:doi.org/10.4172/2252-5211-c1-006
52. Aeslina AK, Ali B. Petroleum sludge treatment and reuse for cement production as setting retarder. IOP Conf Ser Mater Sci Eng. 2017;203(1). doi:10.1088/1757-899X/203/1/012010
53. Shon CS, Estakhri CK. In-situ and laboratory investigation of modified drilling waste materials applied on base-course construction. Int J Pavement Res Technol. 2018;11(3):225-235. doi:10.1016/j.ijprt.2017.11.001
54. Ayati B, Molineux C, Newport D, Cheeseman C. Manufacture and performance of lightweight aggregate from waste drill cuttings. J Clean Prod. 2019;208:252-260. doi:10.1016/j.jclepro.2018.10.134
55. U.S. Energy Information Administration. Www.Eia.Gov [Accessed on 1 Feb. 2019]. 56. British Petroleum. Statistical Review of World Energy 2018.; 2018. 57. Al Naamani, M.: Al Sharafi M. Drilling optimization benchmark set for deep HP/HT wells in
Oman. E&P Mag. 2013;(1 August 2013). 58. Al Sharafi M, Al Naamani M, Al Shidhani I, Thani YA, Hariri N. Drilling optimization in deep
tight gas field. In: SPE/IADC Drilling Conference and Exhibition 2013. Amsterdam; 2013. 59. Al Salmi A, Al Haji Y, Al-Hamhami S, Sabhi I, Al Fadhli A. New technique to sidetrack across
hard formation in north Oman. In: 17th Middle East Oil and Gas Show and Conference 2011. Manama; 2011.
60. Sanchez F, Turki M, Nabhani Y, Cruz M, Houqani S. Casing while Drilling (CwD); A new approach drilling FIQA formation in the Sultanate of Oman. A success story. In: 14th Abu Dhabi International Petroleum Exhibition and Conference 2010, ADIPEC 2010. ; 2010.
61. Khalil M, Rumhi H, Randrianavony M, Cig K, Mullins OC, Godefroy S. Downhole fluid analysis integrating insitu density and viscosity measurements - Field test from an Oman sandstone formation. In: 14th Abu Dhabi International Petroleum Exhibition and Conference 2010, ADIPEC 2010. Abu Dhabi; 2014:231-244.
62. Bernardo G, Marroccoli M, Nobili M, Telesca A, Valenti GL. The use of oil well-derived drilling waste and electric arc furnace slag as alternative raw materials in clinker production. Resour Conserv Recycl. 2007;52:95-102. doi:10.1016/j.resconrec.2007.02.004
63. Scire JS, Escoffier-Czaja C, Phadnis MJ. Application of MM5 and CALPUFF to a complex terrain environment in eastern Iceland. In: The 11th Harmonization within Atmospheric Dispersion Modeling for Regulatory Purposes, Cambridge, United Kingdom, July 2-5. Cambridge; 2007.
64. Scire JS, Robe FR, Strimaitis D. A. User’s guide for the CALMET meteorological model (Version 5). 2000.

152
Hilal Saif Al Dhamri 200676958
65. Lee H-D, Yoo J-W, Kang M-K, Kang J-S, Jung J-H, Oh K-J. Evaluation of concentrations and source contribution of PM10 and SO2 emitted from industrial complexes in Ulsan, Korea: Interfacing of the WRF-CALPUFF modeling tools. Atmos Pollut Res. 2014;5:664-676. doi:10.5094/APR.2014.076
66. Oman Environmental Services Holding Company (Be’ah). Transformation of waste management in Oman. In: ISWA Energy Recovery WG Meeting, 25th May 2016, West Palm Beach, Florida. Be’ah; Oman. ; 2016.
67. Oil & Gas Journal. Worldwide Look at Reserves and Production. 2017. 68. Central Bank of Oman. Annual Report 2017. Muscat; 2017. 69. Hatmi Y Al, Tan CS, Badi A Al, Charabi Y. Assessment of the consciousness levels on renewable
energy resources in the Sultanate of Oman. Renew Sustain Energy Rev. 2014;40:1081-1089. doi:10.1016/j.rser.2014.08.012
70. Abdul-wahab SA, Charabi Y, Al-rawas GA, Al-maamari R. Greenhouse gas (GHG) emissions in the Sultanate of Oman. 2016;17(4):338-354. doi:10.1002/ghg
71. Al-Dhamri H, Black L. Use of Oil-Based Mud Cutting waste in Cement Clinker Manufacturing. In: 34th Cement and Concrete Science Conference, 14-17 September 2014, University of Sheffield. Sheffield; 2014.
72. Oman Petroleum Development. Environmental Assessment of Nimr Asset - 2002 Review and Update Petroleum Development Oman. Muscat; 2002. doi:10.1111/jonm.12011
73. Al Dhamri HS, Abdul-wahab SA, Velis C, Black L. Oil-based mud cutting as an additional raw material in clinker production. J Hazard Mater. 2020;384(121022). doi:org/10.1016/j.jhazmat.2019.121022
74. Al Dhamri HS, Abdul-wahab SA, Velis C, Black L, G OCCSAO. Oil-based mud cutting as an additional raw material in clinker production. J Hazard Mater. 2020;384(121022):1-17. doi:10.1016/j.jhazmat.2019.121022
75. Chatterjee TK. Clinker grinding and cement making. In: Cement Production Technology. 1st ed. Taylor & Francis; 2018:175-212.
76. Cretaceous TV. Raw materials. In: Portland Cement. London: Thomas Telford; 1999:15-29. 77. Philip A. Alsop. Cement Plant Operation Handbook. 3rd Editio. UK: David Hargreaves,
Tradeship Publication; 2001. file:///C:/Users/em0899/OneDrive - Oman Cement Company SAOG/Desktop/Officials/cement studies/Books/3. Cement Manufacturing/Cement Plant Operation Hand Book-Phillip/Cement Plant Operation Handbook.pdf.
78. Alsop PA. The Cement Plant Operations Handbook. 3rd Ed. UK: International Cement Review; 2001.
79. Walter H. Duda. Cement-Data-Book: International Process Engineering in the Cement Industry. Wiesbaden: Bauverlag GmbH; 1975.
80. Basheer PAM, Barbhuiya S. Different types of cement used in concrete. In: ICE Manual of Construction Materials. ; 2009:61-68. doi:10.1680/mocm.35973.0061
81. Galbenis CT, Tsimas S. Use of construction and demolition wastes as raw materials in cement clinker production. China Particuology. 2006;4(2):83-85. doi:10.1016/S1672-2515(07)60241-3
82. Schoon J, De Buysser K, Van Driessche I, De Belie N. Fines extracted from recycled concrete as alternative raw material for Portland cement clinker production. Cem Concr Compos. 2015;58:70-80. doi:10.1016/j.cemconcomp.2015.01.003
83. Aranda Usón A, López-Sabirón AM, Ferreira G, Llera Sastresa E. Uses of alternative fuels and raw materials in the cement industry as sustainable waste management options. Renew Sustain Energy Rev. 2013;23:242-260. doi:10.1016/j.rser.2013.02.024
84. Schepper M De, Buysser K De, Driessche I Van, Belie N De. The Regeneration of Cement out of Completely Recyclable Concrete: Clinker Production Evaluation. Vol 38.; 2013. doi:10.1561/2200000016
85. Shahriar A. Investigation on Rheology of Oil Well Cement Slurries. 2011;(April). http://ir.lib.uwo.ca/etd.

153
Hilal Saif Al Dhamri 200676958
86. de Paula JN, Calixto JM, Ladeira LO, et al. Mechanical and rheological behavior of oil-well cement slurries produced with clinker containing carbon nanotubes. J Pet Sci Eng. 2014;122:274-279. doi:10.1016/j.petrol.2014.07.020
87. Kuzielová E, Žemlička M, Másilko J, Palou MT. Pore structure development of blended G-oil well cement submitted to hydrothermal curing conditions. Geothermics. 2017;68:86-93. doi:10.1016/j.geothermics.2017.03.001
88. Arbelaez C. THE PRODUCTION OF API CLASS H OILWELL CEMENT. file:///C:/Users/em0899/AppData/Local/Mendeley Ltd./Mendeley Desktop/Downloaded/Arbelaez - Unknown - THE PRODUCTION OF API CLASS H OILWELL CEMENT.pdf.
89. American Petroluem Institute. Specification 10A, Specification for Cements and Materials for Well Cementing. 2010.
90. Jackson PJ. Portland Cement: Classification and Manufacture. In: Lea’s Chemistry of Cement and Concrete. Fourth Edi. Elsevier Ltd.; 2003:25-94. doi:10.1016/B978-075066256-7/50014-X
91. Chatterjee AK. Chemico-Mineralogical Characteristics of Raw Materials. In: GHOSH SNBT-A in CT, ed. Advances in Cement Technology. 1st Editio. Pergamon Press; 1983:39-68. doi:https://doi.org/10.1016/B978-0-08-028670-9.50008-9
92. Chatterjee TK. Pyroprocessing and clinker cooling. In: Cement Production Technology. 1st ed. Taylor & Francis; 2018:141-173.
93. Bensted J. Special Cements. In: Lea’s Chemistry of Cement and Concrete. Fourth Edi. Elsevier Ltd.; 2003:783-840. doi:10.1016/B978-075066256-7/50026-6
94. Adamson K, Birch G, Gao E, et al. High-Pressure, High-Temperature Well Construction. Schlumberger Oilf Rev. 1998;Summer 199:36-49. http://www.slb.com/resources/publications/industry_articles/oilfield_review/1998/or1998sum03_hpht_wellconstruction.aspx%5Cnhttps://www.slb.com/~/media/Files/resources/oilfield_review/ors98/sum98/pgs_36_49.pdf.
95. Al-dhamri HS. Use of kaolin and spent catalyst (Spent Alumina & RFCC from refinery) to substitute Bauxite in the preparation of Portland cement clinker, Sultan Qaboos University, PhD thesis. 2010.
96. AL-Dhamri H, Melghit K, Taha R, Ram G. Utilization of by-product from petroleum refinery in Portland clinker and cement manufacturing. In: 13th International Congress on the Chemistry of Cement. ; 2011:1-7.
97. Al-Dhamri H, Melghit K. Use of alumina spent catalyst and RFCC wastes from petroleum refinery to substitute bauxite in the preparation of Portland clinker. J Hazard Mater. 2010;179(1-3):852-859. doi:10.1016/j.jhazmat.2010.03.083
98. Al-Dhamri HS. Towards Sustainable Production. World Cem. February 2012:35-39. 99. Hewlett P. Lea" s Chemistry of Cement and Concrete. Vol 58.; 2004. doi:10.1016/B978-0-
7506-6256-7.50031-X 100. Stutzman P, Heckert A, Tebbe A, Leigh S. Uncertainty in Bogue-calculated phase composition
of hydraulic cements. Cem Concr Res. 2014;61-62:40-48. doi:10.1016/j.cemconres.2014.03.007
101. Alemayehu F, Omprakash Sahu. Minimization of variation in clinker quality. Adv Mater. 2013;2(2):23-28. doi:10.11648/j.am.20130202.12
102. Taylor H. The chemistry of portland cement. Cem Chem. 1997:55-87. doi:10.1016/0016-0032(48)90024-6
103. Taylor HFW. Portland cement and its major constituent phases. Cem Chem. 1997:1-28. 104. Both D, The S. High-temperature chemistry. 105. Directorate General of Standards & Metrology. Omani Standard (OS 7/2001). Muscat, Oman;
2001. 106. ASTM. ASTM C 150-99a Type I. 107. Kurt E. Peray. Cement Manufacture Handbook. New York: Chemical Publishing Co.; 1979.

154
Hilal Saif Al Dhamri 200676958
file:///C:/Users/em0899/OneDrive - Oman Cement Company SAOG/Desktop/Officials/cement studies/Books/3. Cement Manufacturing/Cement Manufacturing Hand Book-Kurt E. Peray/Cement Manufacture Handbook(Kurt E. Peray).pdf.
108. Scrivener K, Snellings R, Lothenbach B. Sample Preparation. In: A Practical Guide to Microstructural Analysis of Cementitious Materials. Taylor & Francis; :1-35. doi:10.1007/978-3-540-71951-9_4
109. European Standard, EN 196-2, Methods of Testing Cement-Part 2: Chemical Analysis of Cement, Determination of Loss on Ignition.; 2005.
110. Chatterjee TK. Burnability and Clinkerization of Cement Raw Mixes. In: GHOSH SNBT-A in CT, ed. Pergamon; 1983:69-113. doi:https://doi.org/10.1016/B978-0-08-028670-9.50009-0
111. European Standard. EN 451-1, Methods for Portland Cement Testing, Methods of Testing Fly Ash-Part:1 Determination of Free Calcium Oxide Content.; 2005.
112. ASTM International. Extraction of Free Lime in Portland Cement and Clinker by Ethylene Glycol. In: Rapid Methods for Chemical Analysis of Hydraulic Cement. ; 1988. doi:10.1520/STP34297S
113. Delimi R. Determination of Free Lime in Industrial Products. 1991:593-600. 114. Scrivener K, Bazzoni A, Mota B, John E. Rossen. Electron Microscopy. In: A Practical Guide to
Microstructural Analysis of Cementitious Materials. Taylor & Francis; 2015:351-417. doi:10.1021/ac60237a015
115. Lothenbach B, Durdzinski P, Klaartje De Weerdt. Thermogravimetric Analysis. In: A Practical Guide to Microstructural Analysis of Cementitious Materials. Taylor & Francis; 2015. doi:10.1038/1731011b0
116. T. K. Chatterjee. Burnability and clinkerization of cement raw-mixes. In: Cement and Concrete Science and Technology. New Delhi: ABI Books Ovt. Ltd. India; 1991:10-57.
117. Galimberti M, Marinoni N, Della Porta G, Marchi M, Dapiaggi M. Effects of limestone petrography and calcite microstructure on OPC clinker raw meals burnability. Mineral Petrol. 2017;111(5):793-806. doi:10.1007/s00710-016-0485-8
118. Al-Maqbali A, Feroz S, Ram G, Hilal Al-Dhamri. Feasibility Study on Spent Pot Lining ( SPL ) as Raw Material in Cement Manufacture Process. Int J Environ Chem. 2016;2(2):18-26.
119. H. Donald. Microscopical Examination and Interpretation of Portland Cement and Clinker. 2nd Editio. (Natalie C. Holz, ed.). Portland Cement Association; 1999.
120. C1356-07. Standard Test Method for Quantitative Determination of Phases in Portland Cement Clinker by Microscopical Point-Count Procedure. Annu B ASTM Stand ASTM Int West Conshohocken, PA. 2007;07(Reapproved 2012):1-6. doi:10.1520/C1356-07.2
121. Robert E. Carver. Procedures in Sedimentary Petrology. California: Wiley-Interscience; 1971. 122. ASTM. Petrography of Cementitious Materials: Petrographic Methods for Analysis of Cement
Clinker and Concrete Microstructure. USA; 1994. doi:10.1520/STP1215-EB 123. ASTM. C188-16 Standard Test Method for Density of Cement.; 2016. 124. Eurpean Standard. EN 196-6, Methods of Testing Cement-Part 6: Determination of Fineness.;
2005. 125. European Standard. EN 196-3, Methods of Testing Cement-Part 3: Determination of Setting
Time and Soundness.; 2005. 126. European Standard. EN 196-1, Methods of Testing Cement-Part 1: Determination of Strength.;
2005. 127. Wadsö L, Winnefeld F, Riding K, Sandberg P. Calorimetry. In: A Practical Guide to
Microstructural Analysis of Cementitious Materials. Taylor & Francis; 2015:37-74. 128. Ayers R. C., Sauer T. C., Anderson R. W. The generic mud concept for NPDES permitting of
offshore drilling discharges. J Pet Technol. 1985;37:475-480. 129. Bennett RB. New drilling fluid technology-mineral oil mud. J Pet Technol. 1984:975-981. 130. Yousef K, AlQallaf Y, Fouzy HA. Oil based mud drill cutting (OBM) treatment and management
at KOC. Int J waste Resour Resour. 2017;7(3):5211. doi:10.4172/2252-5211-C1-006

155
Hilal Saif Al Dhamri 200676958
131. J.E. F, H.L. C. Second generation synthetic fluids in the North Sea: are they better? In: IAD/SPE Drilling Conference. New Orleans; 1996.
132. Candler J., Hebert R., A.J. L. Effectiveness of a 10 day ASTM amphipod sediment test to screen drilling mud base fluids for benthic. In: SPE/EPA Exploration and Production Environmental Conference. Dallas TX: Society of Petroleum Engineers; 1997.
133. Caenn R, Darley HCH, Gray GR. Drilling and Drilling Fluids Waste Management. In: Composition and Properties of Drilling and Completion Fluids. ; 2011:617-654. doi:10.1016/B978-0-12-383858-2.00012-3
134. Caenn R, Darley† HCH, Gray† GR. Drilling Fluid Components. In: Composition and Properties of Drilling and Completion Fluids. ; 2017:537-595. doi:10.1016/B978-0-12-804751-4.00013-4
135. Fluids C. Evaluating Drilling Fluid Performance. In: Composition and Properties of Drilling and Completion Fluids. 7th ed. Joe Hayton; 2017.
136. Darley HCH, Gray GR. Clay Mineralogy and the Colloid Chemistry of Drilling Fluids. In: Composition and Properties of Drilling and Completion Fluids. 7th ed. ; 1988:140-183. doi:10.1016/B978-0-08-050241-0.50008-4
137. Grim Ralph E. Clay Mineralogy. 2nd ed. New York, London: McGraw-Hill; 1968. 138. American Petroluem Institute. API Specification 13A. Washington D.C.; 1979. www.api.org. 139. Cheatham Jr. JB. Wellbore Stability. In: ; 1984. doi:10.2118/13340-PA 140. Abdou MI, Ahmed HE, Fadl AM. Impact of barite and ilmenite mixture on enhancing the
drilling mud weight. Egypt J Pet. 2018;27(4):955-967. doi:10.1016/j.ejpe.2018.02.004 141. Drilling Fluids Manual. USA; 1998. 142. Peray KE. Chapter4: Chemical and physical properties of materials used in cement
manufacturing. In: Cement Manufacture Handbook. New York: Chemical Publishing Co. Inc.; 1979. file:///C:/Users/em0899/OneDrive - Oman Cement Company SAOG/Desktop/Officials/cement studies/Books/3. Cement Manufacturing/Cement Manufacturing Hand Book-Kurt E. Peray/Cement Manufacture Handbook(Kurt E. Peray).pdf.
143. MOhamed Al-Bagoury. Chris Steel March. In: IADC/SPE Drilling Conference and Exhibition. San Diego, California, USA; 2012:6-8.
144. PDO. Health, Safety and Environment Guideline - Environmental Assessment GU 195. Muscat; 2002.
145. PDO. SP-1009 & SP-1010:Specification for Waste Management. Muscat; 1995. 146. Deng R, Huang D, Wan J, Xue W, Wen X. Recent advances of biochar materials for typical
potentially toxic elements management in aquatic environments : A review. J Clean Prod. 2020;255:119523. doi:10.1016/j.jclepro.2019.119523
147. American Petroleum Institute. API E5 Environmental guidance document: waste amangement in exploration and production operations. 1997.
148. Bhatty JI. Role of Minor Elements in Cement Manufacture and Use.; 1995. 149. C. David Lawrence. The Constitution and Specification of Portland Cement. In: Lea´s
Chemistry of Cement and Concret (4th Edition). Fourth Edi. Elsevier Ltd.; 1998:131-193. doi:10.1016/B978-0-7506-6256-7.50016-3
150. Soltan AMM, Kahl WA, Hazem MM, Wendschuh M, Fischer RX. Thermal microstructural changes of grain-supported limestones. Mineral Petrol. 2011;103(1-4):9-17. doi:10.1007/s00710-011-0151-0
151. Soltan AM, Kahl W-A, Wendschuh M, Hazem M. Microstructure and reactivity of calcined mud supported limestones. Miner Process Extr Metall. 2012;121(1):5-11. doi:10.1179/1743285511Y.0000000024
152. Allegretta I, Pinto D, Eramo G. Effects of grain size on the reactivity of limestone temper in a kaolinitic clay. Appl Clay Sci. 2016;126:223-234. doi:10.1016/j.clay.2016.03.020
153. Hills AWD. The mechanism of the thermal decomposition of calcium carbonate. Chem Eng Sci. 1968;23(4):297-320. doi:10.1016/0009-2509(68)87002-2
154. Lin S, Kiga T, Wang Y, Nakayama K. Energy analysis of CaCO3calcination with CO2capture.

156
Hilal Saif Al Dhamri 200676958
Energy Procedia. 2011;4:356-361. doi:10.1016/j.egypro.2011.01.062 155. Criado JM, Ortega A. A study of the influence of particle size on the thermal decomposition of
CaCO3 by means of constant rate thermal analysis. Thermochim Acta. 1992;195:163-167. doi:10.1016/0040-6031(92)80059-6
156. Beruto DT, Botter R, Cabella R, Lagazzo A. A consecutive decomposition-sintering dilatometer method to study the effect of limestone impurities on lime microstructure and its water reactivity. J Eur Ceram Soc. 2010;30(6):1277-1286. doi:10.1016/j.jeurceramsoc.2009.12.012
157. Marinoni N, Bernasconi A, Della Porta G, Marchi M, Pavese A. The role of petrography on the thermal decomposition and burnability of limestones used in industrial cement clinker. Mineral Petrol. 2015;109(6):719-731. doi:10.1007/s00710-015-0398-y
158. Dunham RJ. Classification of carbonate rocks according to depositional texture. In: Classification of Carbonate Rocks. Am. Assoc. Pet. Geol. Mem.; 1962:108–121.
159. Embry AF, Klovan JE. A Late Devonian reef tract on northeastern Banks Island, NWT. Bull Can Pet Geol. 1971;19(4):730-781. doi:10.5072/PRISM/22817
160. Lokier SW, Al Junaibi M. The petrographic description of carbonate facies: are we all speaking the same language? Sedimentology. 2016;63(7):1843-1885. doi:10.1111/sed.12293
161. Wright VP. A revised classification of limestones. Sediment Geol. 1992;76(3-4):177-185. doi:10.1016/0037-0738(92)90082-3
162. Scholle PA, Ulmer-Scholle DS. A Color Guide to the Petrography of Carbonate Rocks: Grains, Textures, Porosity, Diagenesis. AAPG Memoir; 2003.
163. Marinoni N, Allevi S, Marchi M, Dapiaggi M. A kinetic study of thermal decomposition of limestone using in situ high temperature X-ray powder diffraction. J Am Ceram Soc. 2012;95(8):2491-2498. doi:10.1111/j.1551-2916.2012.05207.x
164. Escardino A, García-Ten J, Feliu C, Moreno A. Calcium carbonate thermal decomposition in white-body wall tile during firing. I. Kinetic study. J Eur Ceram Soc. 2010;30(10):1989-2001. doi:10.1016/j.jeurceramsoc.2010.04.014
165. Fredrik P. Glasser. The Burning of Portland Cement. In: Hewlett PC, ed. Lea’s Chemistry of Cement and Concrete. Fourth Edi. Butterworth Heinemann; 1998:195-240. doi:10.1016/B978-0-7506-6256-7.50017-5
166. Kakali G, Kolovos K, Tsivilis S. Incorporation of minor elements in clinker: their effect on the reactivity of the raw mix and the microstructure of clinker. In: 11th International Congress on the Chemistry of Cement. Durban, South Africa; 2003:2885-2897.
167. Kurdowski W. Influence of Minor Components on Hydraulic Activity of Portland Cement Clinker. In: Congress of Chemistry of Cement. Moscow; 1974:1-4.
168. Kolovos K, Tsivilis S, Kakali G. The effect of foreign ions on the reactivity of the CaO-SiO2-Al2O3-Fe2O3 system II : Cations. 2001;32:463-469.
169. De Noirfontaine MN, Tusseau-nenez S, Signes-frehel M, Gasecki G, Girod-labianca C. Effect of Phosphorus Impurity on Tricalcium Silicate T 1 : From Synthesis to Structural Characterization. J Am Ceram Soc. 2009;2344:1-8. doi:10.1111/j.1551-2916.2009.03092.x
170. Stephan D, Mallmann R, Knöfel D, Härdtl R. High intakes of Cr, Ni, and Zn in clinker Part I. Influence on burning process and formation of phases. Cem Concr Res. 1999;29(12):1949-1957. doi:10.1016/S0008-8846(99)00195-7
171. Stephan D, Mallmann R, Knöfel D, Härdtl R. High intakes of Cr, Ni, and Zn in clinker Part II. Influence on the hydration properties. Cem Concr Res. 1999;29(12):1959-1967. doi:10.1016/S0008-8846(99)00198-2
172. Stephan D, Maleki H, Knöfel D, Eber B, Härdtl R. Influence of Cr, Ni, and Zn on the properties of pure clinker phases Part I. C3S. Cem Concr Res. 1999;29(4):545-552. doi:10.1016/S0008-8846(99)00009-5
173. Stephan D, Maleki H, Knöfel D, Eber B, Härdtl R. Influence of Cr , Ni , and Zn on the properties of pure clinker phases Part II . C 3 A and C 4 AF. Cem Concr Res. 1999;29:651-657. doi:10.1007/s11595-013-0724-3

157
Hilal Saif Al Dhamri 200676958
174. Kolovos K, Tsivilis S, Kakali G. SEM examination of clinkers containing foreign elements. Cem Concr Compos. 2005;27(2):163-170. doi:10.1016/j.cemconcomp.2004.02.003
175. Zezulová A, Staněk T, Opravil T. Influence of barium oxide additions on Portland clinker. Ceram - Silikaty. 2017;61(1):20-25. doi:10.13168/cs.2016.0055
176. Guo X, Wang S, Lu L, Wang H. Influence of barium oxide on the composition and performance of alite-rich Portland cement. Adv Cem Res. 2012;24(3):139-144. doi:10.1680/adcr.10.00033
177. Katyal NK, Ahluwalia SC, Parkash R. Effect of barium on the formation of tricalcium silicate. Cem Concr Res. 1999;29(11):1857-1862. doi:10.1016/S0008-8846(99)00172-6
178. Kakali G, Kolovos K, Tsivilis S. Incorporation of minor elements in clinker: their effect on the reactivity of the raw mix and the microstructure of clinker. In: 11th International Congress on the Chemistry of Cement. Durban, South Africa; 2003:2885-2897.
179. Cohn J. Reactions in solid state. Cem Rev. 1948;42:527. 180. Li X, Shen X, Tang M, Li X. Stability of tricalcium silicate and other primary phases in portland
cement clinker. Ind Eng Chem Res. 2014;53(5):1954-1964. doi:10.1021/ie4034076 181. Ma S, Snellings R, Li X, Shen X, Scrivener KL. Alite-ye’elimite cement: Synthesis and
mineralogical analysis. Cem Concr Res. 2013;45(1):15-20. doi:10.1016/j.cemconres.2012.10.020
182. Zhang J, Gong C, Wang S, Lu L, Cheng X. Effect of strontium oxide on the formation mechanism of dicalcium silicate with barium oxide and sulfur trioxide. Adv Cem Res. 2015;27(7):381-387. doi:10.1680/adcr.14.00021
183. Li X, Xu W, Wang S, Tang M, Shen X. Effect of SO3and MgO on Portland cement clinker: Formation of clinker phases and alite polymorphism. Constr Build Mater. 2014;58:182-192. doi:10.1016/j.conbuildmat.2014.02.029
184. Christensen NH, F.L. Smidth and Co. Burnability of cement raw mixes at 1400°C II the effect of the fineness. Cem Concr Res. 1979;9(3):285-294. doi:10.1016/0008-8846(79)90120-0
185. Wieslaw Kurdowski. Portland Cement Clinker. In: Cement and Concrete Chemistry. Poland: Springer; 2014:21-123.
186. Dunstetter F, De Noirfontaine MN, Courtial M. Polymorphism of tricalcium silicate, the major compound of Portland cement clinker: 1. Structural data: Review and unified analysis. Cem Concr Res. 2006;36(1):39-53. doi:10.1016/j.cemconres.2004.12.003
187. De Noirfontaine MN, Courtial M, Noirfontaine M De, Dunstetter F, Gasecki G, Signes-Frehel M. Tricalcium silicate Ca3SiO5 superstructure analysis: a route towards the structure of the M1 polymorph. Zeitschrift für Krist. 2012;227(2):102-112. doi:10.1524/zkri.2011.1425
188. Nicoleau L, Nonat A, Perrey D. The di- and tricalcium silicate dissolutions. Cem Concr Res. 2013;47:14-30. doi:10.1016/j.cemconres.2013.01.017
189. Kakali G. Use of secondary mineralizing raw materials in cement production . A case study of a wolframite – stibnite ore. 2005;27:155-161. doi:10.1016/j.cemconcomp.2004.02.037
190. Zapata A, Bosch P. Low temperature preparation of belitic cement clinker. J Eur Ceram Soc. 2009;29(10):1879-1885. doi:10.1016/j.jeurceramsoc.2008.11.004
191. BS:EN:413-1:2011. BSI Standards Publication Masonry cement Part 1 : Composition , specifications and conformity criteria. BSI Stand Publ. 2011;(November).
192. ASTM International. C 150/ C150M - Standard Specification for Portland Cement. Annu B ASTM Stand. 2017;i:1-8. doi:10.1520/C0150
193. Yan M, Deng M, Wang C, Chen Z. Effect of Particle Size of Periclase on the Periclase Hydration and Expansion of Low-Heat Portland Cement Pastes. Adv Mater Sci Eng. 2018;2018:1-8. doi:10.1155/2018/1307185
194. Zhang R, Bassim N, Panesar DK. Characterization of Mg components in reactive MgO - Portland cement blends during hydration and carbonation. J CO2 Util. 2018;27(July):518-527. doi:10.1016/j.jcou.2018.08.025
195. Mikhailova O, Yakovlev G, Maeva I, Senkov S. Effect of dolomite limestone powder on the compressive strength of concrete. Procedia Eng. 2013;57:775-780.

158
Hilal Saif Al Dhamri 200676958
doi:10.1016/j.proeng.2013.04.098 196. Ruan S, Unluer C. Comparative life cycle assessment of reactive MgO and Portland cement
production. J Clean Prod. 2016;137(x):258-273. doi:10.1016/j.jclepro.2016.07.071 197. Chatterjee TK. Composition and properties of Portland cements. In: Cement Production
Technology. 1st ed. Taylor & Francis; 2018:213-250. 198. Taylor H. Properties of Portland clinker and cement. Cem Chem. 1997:89-112.
doi:10.1680/cc.25929.0004 199. Midgley H. The mnior elements in alite (tricalcium silicate) and belite (dicalcium silicate) from
some Portland cement clinkers. In: 5th International Symposium on the Chemistry of Cement. Tokyo; 1968:226-233.
200. Dreisler I, Knofel D. Effect of magnesium oxide on the properties of cement. Zement-Kalk-Gips. 1982;35:537-550.
201. GR G, Bayles J. How the cooling process affects the distribution and particle size of periclase crystals. In: 3rd International Conference on Cement Microscopy. Houston; 1981:89-98.
202. Nikiforov Y, Zosoulia R. Crystallization of periclase and soundness of cements. In: The 7th International Congress on the Chemistry of Cement. Paris; 1980:Theme I, II:I-34-36.
203. Shondeep L. Sarkar. Effect of blaine fineness reversal on strength and hydration of cement. Cem Concr Res. 1990;20:398-406.
204. Brown P. Hydration of cementitious materials. In: ICE Manual of Construction Materials. ; 2009:69-75. doi:10.1680/mocm.35973.0069
205. Zajac M, Bremseth SK, Whitehead M, Ben Haha M. Effect of CaMg(CO3)2 on hydrate assemblages and mechanical properties of hydrated cement pastes at 40 °c and 60 °c. Cem Concr Res. 2014;65:21-29. doi:10.1016/j.cemconres.2014.07.002
206. Whittaker MJ. The Impact of Slag Composition on the Microstructure of Composite Slag Cements Exposed to Sulfate Attack. Civ Eng. 2014;PhD(November). http://etheses.whiterose.ac.uk/id/eprint/9307.
207. Black L, Breen C, Yarwood J, Deng CS, Phipps J, Maitland G. Hydration of tricalcium aluminate (C3A) in the presence and absence of gypsum - Studied by Raman spectroscopy and X-ray diffraction. J Mater Chem. 2006;16(13):1263-1272. doi:10.1039/b509904h
208. Merlini M, Artioli G, Cerulli T, Cella F, Bravo A. Tricalcium aluminate hydration in additivated systems. A crystallographic study by SR-XRPD. Cem Concr Res. 2008;38(4):477-486. doi:10.1016/j.cemconres.2007.11.011
209. Chowaniec O. Limestone Addition in Cement. 2012. doi:10.5075/epfl-thesis-5335 210. Collepardi M, Baldini G, Pauri M CM. Tricalcium aluminate hydration in the presence of lime,
gypsum or sodium sulphate. Cem Concr Res. 1978;8:571-580. 211. Kuzel HJ PHC. Hydration of C3S in the presence of Ca(OH)2, CaSO4 2H2O and CaCO3. Cem
Concr Res. 1991;21:885-895. 212. Grandet J OJ. Effect of Selected Compounds on Cement Hydration. In: Proceedings of the 7th
International Congress on the Chemistry of Cement. Paris; 1980:vol. 3: VI1-63. 213. Odler I. Hydration, Setting and Hardening of Portland Cement. In: Lea’s Chemistry of Cement
and Concrete. Fourth Edi. Elsevier Ltd.; 2003:241-297. doi:10.1016/B978-075066256-7/50018-7
214. Taylor H. Hydrated aluminate, ferrite and sulfate phases. Cem Chem. 1997;2:157-186. doi:10.1680/cc.25929.0006
215. Lagier F, Kurtis KE. Influence of Portland cement composition on early age reactions with metakaolin. Cem Concr Res. 2007;37(10):1411-1417. doi:10.1016/j.cemconres.2007.07.002
216. Fagerlund G. Chemically Bound Water as Measure of Degree of Hydration: Method and Potential Errors. (Report TV. Division of Building Materials, LTH, Lund University.; 2009.
217. Chayes F. The Theory of Thin-Section Analysis. J Geol. 1954;62(1):92-101. 218. Whittaker M. Relationship between early stage microstructure and long term durability of
slag-containing cements. In: Muller HS, Haist M, Acosta F, eds. The 9th Fib International PhD

159
Hilal Saif Al Dhamri 200676958
Symposium in Civil Engineering. Karlsruhe, Germany: Scientific Publishing; 2012:487-492. 219. Oman cement: Setting up of new company. News Bites - Construction. Aug 16 2016. Available
from: http://0-search.proquest.com.wam.leeds.ac.uk/docview/1811542044?accountid=14664., Bites N. No Title.2016.
220. Ghosh SN, Kamal Kumar. Modernisation & Technology Upgradation in Cement Plants. 1st ed. New Delhi: Akademia Books International; 1999.
221. Mouayed Makhlouf. Unlocking Value: Alternative Fuels For Egypt’s Cement Industry.; 2016. http://alinement.net/home/142?Itemid=35.
222. Mouayed Makhlouf. Unlocking Value: Alternative Fuels For Egypt’s Cement Industry.; 2016. 223. Locher FW. Cement clinker. In: Cement-Principles of Production and Use. 1st ed. Dusseldorf:
Verlag Bau+Technik GmbH; 2006:32-88. 224. Telschow S. Clinker Burning Kinetics and Mechanism. 2012.
https://orbit.dtu.dk/files/51216918/PhD_thesis_Samira_Telschow..PDF. 225. Abdul-Wahab S, Al-Rawas G, Ali S, Fadlallah S, Al-Dhamri H. Atmospheric dispersion modeling
of CO2 emissions from a cement plant’s sources. Clean Technol Environ Policy. 2017;19(6):1621-1638. doi:10.1007/s10098-017-1352-y
226. Abdul-Wahab SA, Al-Rawas GA, Ali S, Al-Dhamri H. Assessment of greenhouse CO2 emissions associated with the cement manufacturing process. Environ Forensics. 2016;17(4):338-354. doi:10.1080/15275922.2016.1177752

160
Hilal Saif Al Dhamri 200676958
Appendices
Appendix 1 Percentage mixing of the raw materials for preparation of raw meal Appendix 1 Percentage mixing of the raw materials for the preparation of raw meal
Raw meal Limestone Quartzo-phillite Kaolin Iron OBM cuttings Total
RmRef.-0% 80.90 11.35 5.65 2.10 - 100.00
Rm½% 80.00 12.70 4.70 2.10 0.50 100.00
Rm1% 80.00 12.70 4.20 2.10 1.00 100.00
Rm2% 80.00 12.10 3.80 2.10 2.00 100.00
Rm3% 79.10 10.15 5.65 2.10 3.00 100.00
Rm5% 77.25 10.00 5.65 2.10 5.00 100.00
Rm7% 76.60 10.00 4.00 2.40 7.00 100.00
Rm10% 74.40 9.80 3.70 2.10 10.00 100.00
Rm12% 72.60 8.60 4.70 2.10 12.00 100.00
Rm15% 70.40 8.50 4.00 2.10 15.00 100.00
Rm20% 67.00 6.25 4.65 2.10 20.00 100.00
Rm30% 60.00 4.50 3.40 2.10 30.00 100.00
Rm55% 43.00 0.00 0.50 1.50 55.00 100.00
Rm100% - - - - 100.00 100.00

161
Hilal Saif Al Dhamri 200676958
Appendix 2 The clinker prepared chemical analysis and calculated mineral composition Appendix 2 The clinker prepared chemical analysis and calculated mineral composition
OBM
cuttings%
CKind CKRef. CK½ CK1 CK2 CK3 CK5 CK7 CK10 CK12 CK15 CK20 CK30 CK55 CK100
0 0 0.5 1 2 3 5 7 10 12 15 20 30 55 100
SiO2 23.50 24.49 24.67 24.49 23.81 23.50 23.50 22.90 23.27 23.03 23.33 22.46 22.43 22.24 34.49
Al2O3 5.82 5.51 5.55 5.32 5.82 5.82 5.82 5.30 5.27 5.76 5.59 5.95 5.74 5.21 7.82
Fe2O3 4.71 4.77 4.79 4.77 4.71 4.71 4.71 5.01 4.71 4.74 4.77 4.75 4.78 4.19 3.88
CaO 71.08 70.40 70.66 70.91 71.08 71.08 71.08 70.86 70.51 69.93 69.57 69.07 68.07 66.01 52.55
MgO 0.62 0.65 0.67 0.68 0.62 0.62 0.62 0.84 0.92 0.97 1.06 1.18 1.48 2.20 3.66
K2O 1.31 1.30 1.31 1.31 1.31 1.31 1.31 1.28 1.27 1.25 1.23 1.21 1.15 1.03 0.68
Na2O 0.14 0.14 0.15 0.15 0.14 0.14 0.14 0.23 0.27 0.30 0.34 0.41 0.54 0.86 1.47
LOI 57.52 56.75 57.02 57.18 57.52 57.52 57.52 57.99 57.98 57.98 57.94 58.35 58.61 59.54 53.96
LSF 93.71 89.92 89.63 90.82 92.66 93.71 93.71 96.11 94.58 93.89 92.62 94.46 93.50 92.65 48.45
SM 2.23 2.38 2.39 2.43 2.26 2.23 2.23 2.22 2.33 2.19 2.25 2.10 2.13 2.36 2.95
AM 1.23 1.15 1.16 1.12 1.23 1.23 1.23 1.06 1.12 1.22 1.17 1.25 1.20 1.24 2.02
Calculated mineral composition using Bogue equations
C3S 64.56 56.23 55.65 59.47 62.21 64.56 64.56 70.77 66.87 62.84 60.02 61.73 58.47 53.92 0.00
C2S 18.67 27.80 28.73 25.36 21.32 18.67 18.67 12.26 16.27 18.62 21.60 17.83 20.21 23.08 <36.63
C3A 7.44 6.53 6.60 6.04 7.44 7.44 7.44 5.56 5.99 7.25 6.74 7.74 7.12 6.72 14.16
C4AF 14.34 14.52 14.58 14.51 14.34 14.34 14.34 15.24 14.35 14.41 14.50 14.44 14.56 12.76 11.80
LP 29.61 28.85 29.03 28.33 29.61 29.61 29.61 28.99 28.37 29.93 29.60 30.79 30.62 28.69 37.41

162
Hilal Saif Al Dhamri 200676958
Appendix 3 Free lime content in % (wt./wt.) repeated test of the prepared clinker samples Appendix 3 Free lime in % (wt./wt.) repeated test of the clinker samples
analysis 1 analysis 2 analysis 3 analysis 4 analysis 5 analysis 6 Average
Ckind. 0.78 0.70 0.64 0.89 0.76 0.77 0.76 ±0.08
CkRef. 0.31 0.71 0.64 0.28 0.22 0.54 0.45 ±0.21
Ck -12% 1.10 1.20 1.01 1.05 0.76 1.30 1.07 ±0.18
Ck -55% 1.33 1.29 1.47 1.96 1.75 1.41 1.54 ±0.26

163
Hilal Saif Al Dhamri 200676958
Appendix 4 Burnability test for Raw mix prepared with OBM cuttings Appendix 4 Burnability test for raw mix prepared with OBM cutting
RMind-0% RMRef.-0% RM12%
oC* Record-1 Record-2 Average Record-1 Record-2 Average Record-1 Record-2 Average
1300 11.5 12.26 11.88 ±0.54 7.95 9.13 8.54 ±0.83 8.00 9.54 8.77 ±1.09
1350 2.77 3.25 3.01 ±0.34 2.04 1.86 1.95 ±0.13 3.80 3.9 3.85 ±0.07
1400 1.43 0.87 1.15 ±0.40 1.03 0.95 0.99 ±0.06 2.33 2.59 2.46 ±0.18
1450 0.88 0.38 0.63 ±0.35 0.60 0.40 0.50 ±0.14 2.45 2.35 2.40 ±0.07
1500 0.25 0.13 0.19 ±0.08 0.17 0.17 0.17 ±0.00 1.01 1.07 1.04 ±0.04
*heating the raw meal for 45 minutes
RM55% RM100%
oC* Record-1 Record-2 Average Record-1 Record-2 Average
1300 9.75 9.29 9.52 ±0.33 0.19 0.20 0.20 ±0.01
1350 7.06 6.04 6.55 ±0.72 0.14 0.11 0.13 ±0.02
1400 5.10 5.24 5.17 ±0.10 0.05 0.06 0.06 ±0.01
1450 3.57 2.87 3.22 ±0.49 0.03 0.03 0.03 ±0.00
1500 2.32 2.86 2.59 ±0.38 0.02 0.02 0.02 ±0.00
*heating the raw meal for 45 minutes

164
Hilal Saif Al Dhamri 200676958
Appendix 5 Calculations of activation energy of decomposition of limestone and OBM cuttings Appendix 5 Calculations of activation energy of decomposition of limestone and OBM cutting
Temperature (oC/min)
Temperature (K/min)
Temperature (oC) Temperature (K) 1/Temperature
(K) 1/Temperature
x103 ln K in oC
Limestone
5 278.15 765.60 1038.75 0.000962696 0.962695548 1.609
10 283.15 804.14 1077.29 0.000928255 0.928255159 2.303
15 288.15 829.50 1102.65 0.000906906 0.906906090 2.708
20 293.15 853.96 1127.11 0.000887225 0.887224849 2.996
OBM cuttings
5 278.15 730.30 1003.45 0.000996562 0.996561862 1.609
10 283.15 763.84 1036.99 0.000964329 0.964329454 2.303
15 288.15 776.79 1049.94 0.000952435 0.952435377 2.708
20 293.15 800.75 1273.15 0.003660992 3.660992129 2.996

165
Hilal Saif Al Dhamri 200676958
Appendix 6 TGA of OBM cuttings and limestone in four different heating rates (5, 10, 15 and 20 oC/mint.) Top graph: OMB cuttings and below graph: limestone Appendix 6 TGA of OBM cutting and limestone in four different heating rates

166
Hilal Saif Al Dhamri 200676958
Appendix 7 Particle size distribution for the cement samples Appendix 7 Particle size distribution for the cement samples
More particle sizes in the range 100 – 200 µm in the order CmRef. > Cm-12% > Cm-55%.

167
Hilal Saif Al Dhamri 200676958
Appendix 8 Cement density measurement Appendix 8 Cement density measurement
Standard test method for density of Cement: ASTM C188-16
Cmind.
Test No. Vi Vf Vd D Sample weight = 64 grams
1 0.300 20.700 20.400 3.137 Vi Initial volume in mL
2 0.400 20.900 20.500 3.122 Vf Final volume in mL
3 0.800 21.200 20.400 3.137 Vd (Vf-Vi), Volume displacement in mL
4 0.000 20.400 20.400 3.137 D =
Weight of sample in grams
Vd
Average 3.133
CmRef. (zero OBM cutting)
Test No. Vi Vf Vd D
1 0.800 21.200 20.400 3.137
2 0.000 20.400 20.400 3.137
3 0.600 21.000 20.400 3.137
4 0.300 20.800 20.500 3.122
Average 3.133
Cm12
Test No. Vi Vf Vd D
1 0.300 20.800 20.500 3.122
2 0.400 20.900 20.500 3.122
3 0.900 21.400 20.500 3.122 Le Chatelier flask
4 0.300 20.900 20.600 3.107
Ave 3.118
Cm55
Test No. Vi Vf Vd D
1 0.400 21.000 20.600 3.107
2 0.200 20.800 20.600 3.107
3 0.400 21.000 20.600 3.107
4 0.200 20.700 20.500 3.122
Average 3.111
Density, g/ml
Cmind.-0% 3.133 ±0.008
CmRef.-0% 3.133 ±0.008
Cm12% 3.118 ±0.008
Cm55% 3.111 ±0.008

168
Hilal Saif Al Dhamri 200676958
Appendix 9 Cement Blaine test measurement Appendix 9 Cement Blaine measurement
Blaine Fineness, m2/Kg
Analysis 1
Analysis 2
Analysis 3
Analysis 4
Analysis 5
Analysis 6
Average
Cmind.-0% Industrial 319 319 318 320 319 317 319 ±1.03
CmRef.-0% Zero OBM
326 325 323 324 322 327 325 ±1.87
Cm12% 12 % OBM
327 328 329 329 329 329 329 ±0.84
Cm55% 55 % OBM
324 324 324 323 325 325 324 ±0.75
Appendix 10 Degree of hydration obtained by SEM BSE
Appendix 10 Degree of hydration % (DoH) obtained by SEM BSE

169
Hilal Saif Al Dhamri 200676958
Appendix 10 Compressive strength measurement for the cement sample obtained from cement industry CmInd Appendix 11 Compressive strength measurement for the CmInd
Table 10A For 2 days strength
Ana
lysis
1
Ana
lysis
2
Ana
lysis
3
Ana
lysis
4
Ana
lysis
5
Ana
lysis
6
Average
Machine reading, N
32.00 31.00 30.00 32.00 32.00 31.00 31.50 ±0.71
Compressive strength*,
N/mm2 20.00 19.38 18.75 20.00 20.00 19.38 19.69 ±0.44
Table 10B For 7 days strength
Ana
lysis
1
Ana
lysis
2
Ana
lysis
3
Ana
lysis
4
Ana
lysis
5
Ana
lysis
6
Average
Machine reading, N
56 57 54 54 51 50 50.50 ±0.71
Compressive strength*,
N/mm2 35.00 35.63 33.75 33.75 31.88 31.25 31.56 ±0.44
Table 10C For 28 days strength
Ana
lysis
1
Ana
lysis
2
Ana
lysis
3
Ana
lysis
4
Ana
lysis
5
Ana
lysis
6
Average
Machine reading, N
75 74 75 76 76 75 75.67 ±0.58
Compressive strength*,
N/mm2 46.88 46.25 46.88 47.50 47.50 46.88 47.29 ±0.36
* Compressive strength calculated as per the equation below:
Compressive strength =maximum load applied to the cube (N)
cube surface area (1.6mm2)

170
Hilal Saif Al Dhamri 200676958
Appendix 11 STA analysis of hydrated cement Appendix 12 STA analysis of hydrated cement
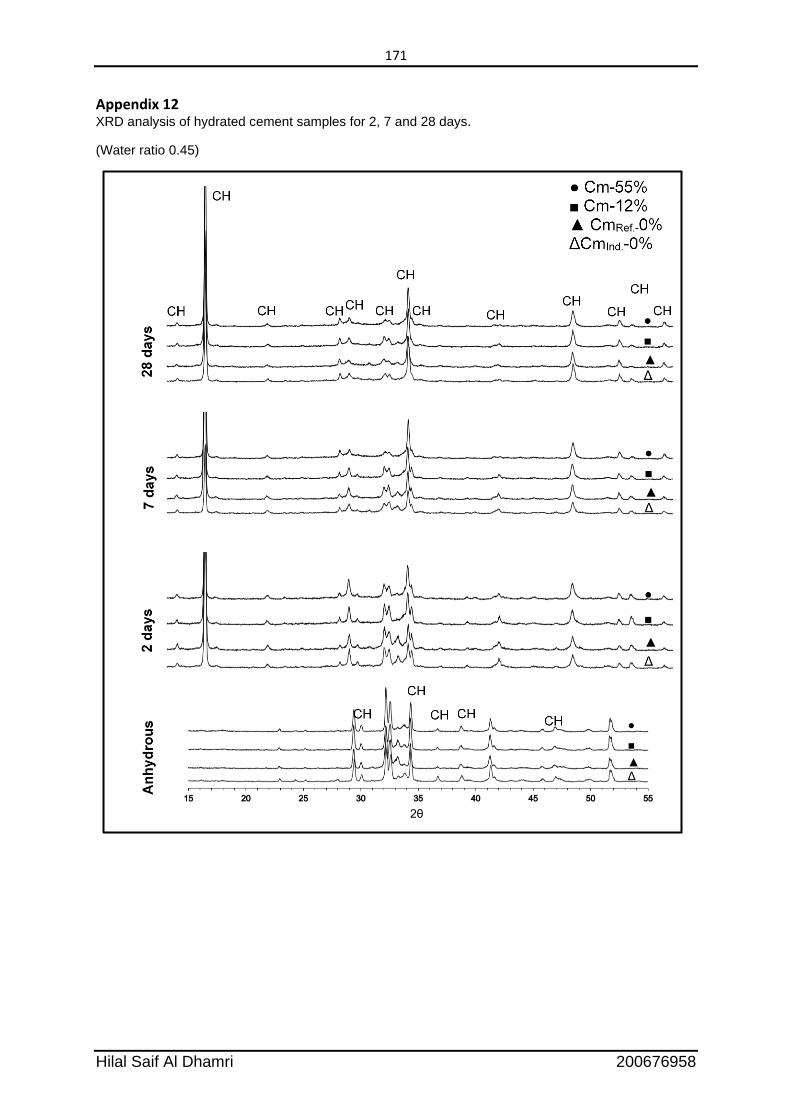
171
Hilal Saif Al Dhamri 200676958
Appendix 12 XRD analysis of hydrated cement samples for 2, 7 and 28 days.
(Water ratio 0.45)
A

172
Hilal Saif Al Dhamri 200676958
Appendix 13 Raw mix design of the prepared raw meal Appendix 13 The hydration product obtained from STA analysis

173
Hilal Saif Al Dhamri 200676958
Appendix 14A Clinker preparation in lab Appendix 14 Clinker preparation photos

174
Hilal Saif Al Dhamri 200676958
Appendix 14B Clinker preparation in lab
The prepared clinker after burning in the furnace and placed in a tray for cooling
under ambient lab temperature.
Safety procuration: Must ware:
- safety google that suitable for watching material at 1450 oC.
- Heat resistance long sleeve gloves. - Safety shoes.

175
Hilal Saif Al Dhamri 200676958
Appendix 14C Clinker preparation in lab (continuo)
Raw meal before
burning
Clinker prepared by
burning the raw
meal

176
Hilal Saif Al Dhamri 200676958
Appendix 15 Chemical analysis of raw materials Appendix 15 Raw materials chemical analysis
Appendix 15A: Chemical analysis of Quartzo-phillite %wt./wt, (repeated 13 independent samples)
Ana
lysis
1
Ana
lysis
2
Ana
lysis
3
Ana
lysis
4
Ana
lysis
5
Ana
lysis
6
Ana
lysis
7
Ana
lysis
8
Ana
lysis
9
Ana
lysis
10
Ana
lysis
11
Ana
lysis
12
Ana
lysis
13
Average
SiO2 81.97 74.50 68.64 71.68 81.23 69.66 82.01 74.08 71.27 74.43 75.83 71.63 68.30 74.25 ±4.84
Al2O3 3.09 5.88 6.71 6.42 4.86 6.57 4.97 5.61 6.14 5.87 4.90 5.01 5.39 5.49 ±0.97
Fe2O3 2.62 5.79 6.65 6.28 4.48 6.92 4.61 5.41 5.93 5.55 5.12 5.93 6.56 5.53 ±1.15
CaO 5.47 4.37 5.12 4.55 2.69 4.73 3.28 4.52 4.24 4.00 2.23 3.20 3.78 4.01 ±0.95
MgO 3.99 3.26 3.42 3.37 2.66 3.50 2.37 3.12 3.62 3.22 6.43 6.73 7.55 4.09 ±1.67
SO3 0.02 0.02 0.05 0.02 0.02 0.03 0.02 0.02 0.03 0.04 0.02 0.03 0.02 0.03 ±0.01
Na2O 0.87 1.33 1.54 1.53 1.07 1.57 1.20 1.25 1.29 1.20 1.03 0.98 1.07 1.22 ±0.22
K2O 0.18 0.70 0.75 0.76 0.71 0.62 0.59 0.71 0.76 0.76 0.80 0.77 0.75 0.68 ±0.16
Mn2O3 0.43 0.18 0.15 0.15 0.17 0.15 0.23 0.18 0.22 0.16 0.16 0.18 0.17 0.19 ±0.08
TiO2 0.27 0.56 0.64 0.61 0.40 0.65 0.45 0.53 0.57 0.54 0.42 0.50 0.55 0.51 ±0.11
LOI @950 1.104 3.419 6.344 4.624 1.716 5.623 0.273 4.565 5.946 4.239 3.059 5.052 5.866 3.99 ±1.96

177
Hilal Saif Al Dhamri 200676958
Appendix 15B: Chemical analysis of limestone %wt./wt, (repeated 10 independent samples)
Ana
lysis
1
Ana
lysis
2
Ana
lysis
3
Ana
lysis
4
Ana
lysis
5
Ana
lysis
6
Ana
lysis
7
Ana
lysis
8
Ana
lysis
9
Ana
lysis
10
Average
SiO2 5.18 6.28 3.25 4.71 8.57 5.41 6.89 8.59 4.91 5.56 5.94 ±1.69
Al2O3 0.48 0.99 0.58 0.65 0.89 0.38 0.57 0.45 0.54 0.64 0.62 ±0.19
Fe2O3 0.51 0.86 0.64 0.50 0.66 0.32 0.31 0.30 0.49 0.47 0.51 ±0.18
CaO 50.97 50.10 52.05 51.55 49.05 50.70 50.84 49.97 51.92 51.47 50.86 ±0.95
MgO 0.46 0.63 0.45 0.42 0.50 0.37 0.32 0.38 0.48 0.80 0.48 ±0.14
SO3 0.10 0.39 0.13 0.07 0.13 0.08 0.08 0.08 0.11 0.09 0.13 ±0.10
Na2O 0.04 0.05 0.04 0.03 0.04 0.04 0.04 0.05 0.05 0.08 0.05 ±0.01
K2O 0.03 0.13 0.09 0.10 0.11 0.03 0.03 0.04 0.04 0.08 0.07 ±0.04
Mn2O3 0.02 0.02 0.02 0.02 0.02 0.02 0.02 0.02 0.02 0.02 0.02 ±0.00
TiO2 0.03 0.06 0.03 0.04 0.07 0.03 0.04 0.03 0.04 0.04 0.04 ±0.01
LOI@950 oC 42.18 40.48 42.72 41.9 39.96 42.61 40.86 40.09 41.4 40.75 41.295 ±1.02

178
Hilal Saif Al Dhamri 200676958
Appendix 15C: Chemical analysis of OBM cutting %wt./wt, (repeated 20 independent samples)
An
aly
sis
1
An
aly
sis
2
An
aly
sis
3
An
aly
sis
4
An
aly
sis
5
An
aly
sis
6
An
aly
sis
7
An
aly
sis
8
An
aly
sis
9
An
aly
sis
10
An
aly
sis
11
An
aly
sis
12
An
aly
sis
13
An
aly
sis
14
An
aly
sis
15
An
aly
sis
16
SiO2 9.75 15.71 1.2 42.85 21.46 12.56 18.99 25.74 57.42 54.84 10.91 11.12 10.84 12.16 11.94 11.62
Al2O3 2.45 4.58 0.57 3.17 7.65 4.56 6.25 8.83 4.02 4.27 2.59 2.51 2.52 2.59 2.65 2.6
Fe2O3 1.42 1.8 0.72 1.13 1.45 1.02 1.69 3.55 1.52 1.67 1.62 1.71 1.68 1.65 1.91 1.81
CaO 38.74 34 47.18 25.23 35.56 41.56 32.35 25.19 7.19 7.08 39.11 37.92 39.14 38.81 39.05 38.92
MgO 3.45 4.4 1.89 1.42 1.99 1.25 3.25 2.19 1.01 1.37 3.81 3.65 3.55 3.45 3.62 3.69
SO3 2.19 1.34 2.17 0.45 0.86 2.15 1.85 2.32 0.18 0.24 2.42 2.52 2.66 2.41 2.25 2.32
Na2O 0.86 0.82 0.98 0.89 0.78 0.87 0.9 0.88 2.3 1.22 0.81 0.77 0.69 0.65 0.74 0.78
K2O 0.72 0.7 0.26 0.24 0.42 0.46 0.39 0.53 0.93 0.91 0.76 0.74 0.55 0.65 0.59 0.59
LOI@950 oC 39.48 36.4 44.15 23.5 28.85 34.56 33.29 30.03 22.06 22.91 37.24 37.92 37.65 36.76 36.51 36.75
H2O 4.35 1.78 15.6 9.35 4.99 6.25 5.55 5.24 0.90 1.04 7.40 7.12 9.80 6.50 5.20 6.80
An
aly
sis
17
An
aly
sis
18
An
aly
sis
19
An
aly
sis
20
Average
SiO2 12.49 12.35 13.01 13.12 19.00 ±15.11
Al2O3 2.65 2.55 2.71 3.42 3.66 ±1.96
Fe2O3 1.79 1.82 1.95 1.47 1.67 ±0.54
CaO 38.61 38.95 39.42 37.12 34.06 ±10.47
MgO 3.58 3.66 3.78 3.77 2.94 ±1.07
SO3 2.58 2.65 2.56 2.21 1.92 ±0.83
Na2O 0.7 0.68 0.87 0.68 0.89 ±0.36
K2O 0.65 0.6 0.78 0.69 0.61 ±0.19
LOI@950 oC 36.01 35.95 34.29 37.04 34.07 ±5.78
H2O 5.20 5.10 6.12 4.98 5.96 ±3.23

179
Hilal Saif Al Dhamri 200676958
Appendix 15D: Chemical analysis of iron ore %wt./wt, (repeated 11 independent samples)
Ana
lysis
1
Ana
lysis
2
Ana
lysis
3
Ana
lysis
4
Ana
lysis
5
Ana
lysis
6
Ana
lysis
7
Ana
lysis
8
Ana
lysis
9
Ana
lysis
10
Ana
lysis
11
Average
SiO2 25.91 28.44 19.54 17.46 12.24 15.89 10.21 19.43 13.23 24.39 11.61 18.03 ±6.16
Al2O3 7.10 7.57 8.60 6.93 6.57 5.64 6.75 6.24 6.54 6.81 5.96 6.79 ±0.80
Fe2O3 47.33 43.44 50.82 51.76 54.24 51.21 57.14 53.97 59.29 47.44 53.35 51.82 ±4.56
CaO 2.14 1.78 1.72 1.96 1.82 2.32 1.55 1.24 1.01 2.73 1.81 1.83 ±0.48
MgO 2.75 2.59 1.91 2.15 1.47 1.53 1.26 2.05 1.32 2.29 1.39 1.88 ±0.53
SO3 0.11 0.09 0.08 0.1 0.08 0.18 0.12 0.07 0.08 0.27 0.13 0.12 ±0.06
Na2O 0.42 0.44 0.38 0.36 0.34 0.34 0.32 0.37 0.31 0.44 0.32 0.37 ±0.05
K2O 0.25 0.27 0.31 0.26 0.19 0.15 0.09 0.17 0.11 0.32 0.14 0.21 ±0.08
Mn2O3 0.15 0.15 0.15 0.15 0.15 0.15 0.15 0.15 0.15 0.15 0.15 0.15 ±0.00
TiO2 0.15 0.16 0.17 0.15 0.15 0.12 0.17 0.13 0.13 0.15 0.14 0.15 ±0.02
LOI@950 oC 13.69 15.07 16.72 18.72 22.75 22.47 22.24 16.18 17.83 15.01 25.00 18.66 ±3.84

180
Hilal Saif Al Dhamri 200676958
Appendix 15E: Chemical analysis of kaolin %wt./wt, (repeated 13 independent samples)
Ana
lysis
1
Ana
lysis
2
Ana
lysis
3
Ana
lysis
4
Ana
lysis
5
Ana
lysis
6
Ana
lysis
7
Ana
lysis
8
Ana
lysis
9
Ana
lysis
10
Ana
lysis
11
Ana
lysis
12
Ana
lysis
13
Average
SiO2 42.10 40.77 42.66 41.355 42.138 42.439 42.728 42.332 41.805 42.501 42.997 42.684 42.541 42.24 ±0.61
Al2O3 33.81 32.60 32.11 33.078 33.53 32.788 34.074 33.671 33.05 32.275 32.491 33.256 32.19 33.00 ±0.65
Fe2O3 8.35 6.95 6.186 8.598 8.016 6.755 6.453 8.011 8.267 5.789 8.39 7.71 9.51 7.61 ±1.09
CaO 1.06 3.64 3.102 2.202 0.756 2.213 1.507 0.743 1.302 2.507 1.271 1.568 0.614 1.73 ±0.94
MgO 0.43 0.39 0.643 0.45 0.532 0.469 0.6 0.488 0.44 0.777 0.555 0.432 0.443 0.51 ±0.11
SO3 0.06 0.06 0.15 0.075 0.083 0.117 0.173 0.126 0.11 0.207 0.078 0.051 0.032 0.10 ±0.05
Na2O 0.33 0.32 0.363 0.383 0.397 0.324 0.362 0.369 0.371 0.355 0.351 0.329 0.328 0.35 ±0.02
K2O 0.18 0.17 0.217 0.187 0.182 0.186 0.203 0.185 0.186 0.195 0.193 0.19 0.192 0.19 ±0.01
LOI 13.50 14.92 14.415 13.523 14.217 14.567 13.756 13.929 14.321 15.249 13.532 13.638 14.007 14.12 ±0.56

181
Hilal Saif Al Dhamri 200676958
Appendix 16 Agreement between Oman Cement Company and OBM cuttings generator company in Oman Appendix 16 Agreement between Oman Cement Company and Petroleum Development Oman Company as a result of this study.
Agreement has been sign between Petroleum Development Oman, PDO
(OBM cuttings generator) and Oman Cement Company, OCC (OBM
cuttings disposer) for conducting a plant pilot trail after considering the
results and endorsement obtained in this thesis study.
(Source: https://www.omandaily.om/?p=708518 )
Phototgraph: Front left : Musalam Al-Mandhry – Production Chemistry Manager, PDO Front right: Hilal Al Dhamri – General Manager Manufacturing, OCC Back from left: Said Al Adwai, Nasser Al-Alwai, Dr. Sultan Al-Shethani, Salim Al-Hajri, Shwket Bahat, Nasser Al Amri.

182
Hilal Saif Al Dhamri 200676958
Appendix 17 Photos for the visit to oil drilling field (Qaran Al-Alam, Oman) Appendix 17 Photos for the sit to oil drilling site
Oil drilling filed visit and collection of information about the OBM cuttings at each generation step.

183
Hilal Saif Al Dhamri 200676958
Appendix 18 Published papers, conferences papers and posters Hilal S. Al Dhamri, Sabah A. Abdul-Wahab, Costas Velis, Leon Black, Oil-based mud cutting as an additional raw material in clinker production, Journal of Hazardous Materials, Volume 384, 2020, 121022, doi.org/10.1016/j.jhazmat.2019.121022.

184
Hilal Saif Al Dhamri 200676958
Sabah A. Abdul-Wahab, Hilal Al-Dhamri, Ganesh Ram, Leon Black, The use of oil-based mud cuttings as an alternative raw material to produce high sulfate-resistant oil well cement, Journal of Cleaner Production, 2020, 122207, doi.org/10.1016/j.jclepro.2020.122207.

185
Hilal Saif Al Dhamri 200676958
Hilal Al-Dhamri, Sabah A. Abdul-Wahab, Ganesh Ram, Abdulaziz Al-Moqbali, Leon Black “Microstructure of Clinker prepared using different ratio of OBM cutting as raw material” Proceedings of the 15th International Congress of the Chemistry of Cement, Prague September 2019.

186
Hilal Saif Al Dhamri 200676958
Hilal Al-Dhamri, Leon Black, Sabah A. Abdul-Wahab, “Oil-Based Mud Cutting as an Additional Raw Materials in Clinker Production: The Impact on Phase Composition”, Proceedings of the 14th International Congress of the Chemistry of Cement, Beijing 2015.

187
Hilal Saif Al Dhamri 200676958
H. Saif Al-Dhamri and Leon Black “Use of Oil-Based Mud Cutting Waste in Cement Clinker Manufacturing” In: Bernal, SA and Provis, JL, (eds.) 34th Cement and Concrete Science Conference, 14-17 Sep 2014, Sheffield, UK., pp. 427-430, 2014.
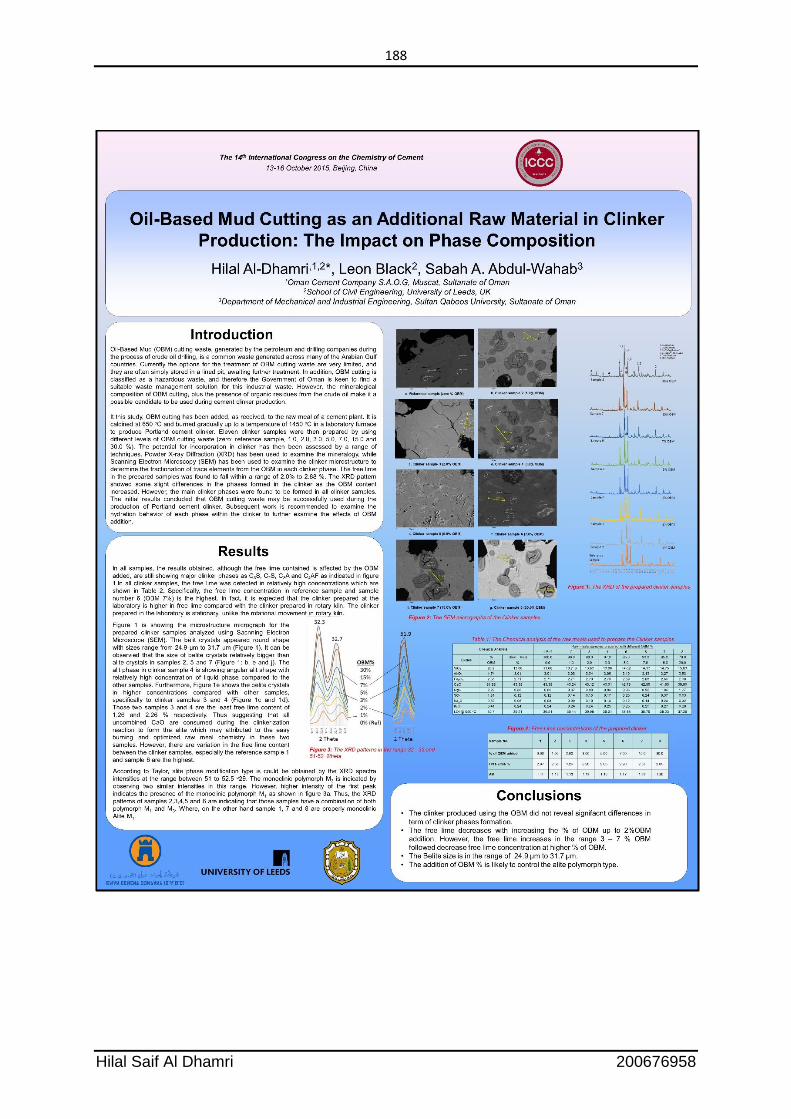
188
Hilal Saif Al Dhamri 200676958

189
Hilal Saif Al Dhamri 200676958

190
Hilal Saif Al Dhamri 200676958
Appendix 19 Photos during the PhD study at University of Leeds
Oil drilling field during collecting OBM cuttings in Oman

191
Hilal Saif Al Dhamri 200676958
Competing for Adam Neville Prize for the best national PhD in the field
of cement and concrete. 30 Oct 2019
Source: https://eps.leeds.ac.uk/faculty-engineering-physical-sciences/news/article/5597/the-adam-neville-prize-awarded-for-best-phd-in-cement-and-concrete

192
Hilal Saif Al Dhamri 200676958
Proceedings of the 15th International Congress of the Chemistry of
Cement, Prague September 2019.
Proceedings of the 14th International Congress of the Chemistry of
Cement, Beijing 2015.
34th Cement and Concrete Science Conference, 14-17 Sep 2014, Sheffield, UK.

193
Hilal Saif Al Dhamri 200676958
With Professor Fredrik Glasser at University of Sheffield during the 34th Cement & Concrete Science Conference.
With Prof. Leon Black, my PhD supervisor. Picture during the Congress of the Chemistry of Cement, Prague September 2019.

194
Hilal Saif Al Dhamri 200676958