Off-Grid Solar Market Assessment & Private Sector ... - ECREEE
194
ECREEE: OFF-GRID SOLAR MARKET ASSESSMENT AND PRIVATE SECTOR SUPPORT FACILITY DESIGN CAMEROON REPORT 1 REGIONAL OFF-GRID ELECTRIFICATION PROJECT Off-Grid Solar Market Assessment & Private Sector Support Facility Design CAMEROON REPORT JULY 2019
-
Upload
khangminh22 -
Category
Documents
-
view
2 -
download
0
Transcript of Off-Grid Solar Market Assessment & Private Sector ... - ECREEE

ECREEE: OFF-GRID SOLAR MARKET ASSESSMENT AND PRIVATE SECTOR SUPPORT FACILITY DESIGN
CAMEROON REPORT 1
REGIONAL OFF-GRID ELECTRIFICATION PROJECT
Off-Grid Solar Market Assessment & Private Sector Support Facility Design
CAMEROON REPORT
JULY 2019
ECREEE: OFF-GRID SOLAR MARKET ASSESSMENT AND PRIVATE SECTOR SUPPORT FACILITY DESIGN
CAMEROON REPORT 2
TABLE OF CONTENTS
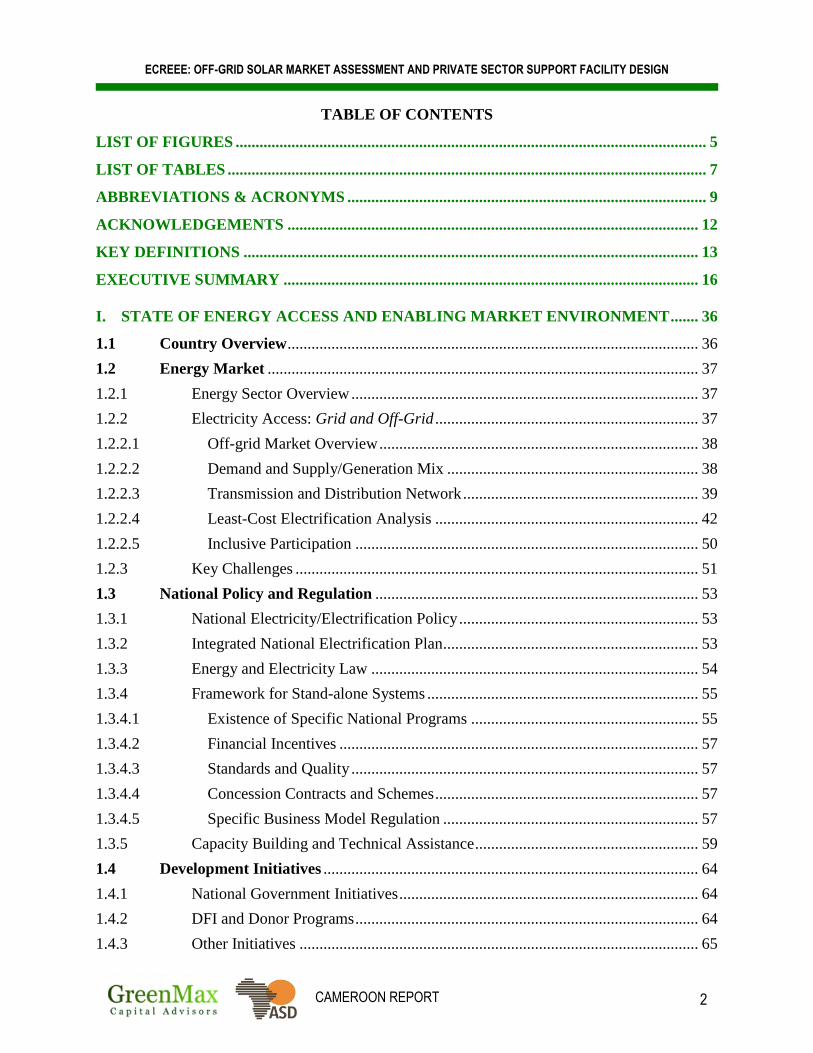
LIST OF FIGURES ...................................................................................................................... 5
LIST OF TABLES ........................................................................................................................ 7
ABBREVIATIONS & ACRONYMS .......................................................................................... 9
ACKNOWLEDGEMENTS ....................................................................................................... 12
KEY DEFINITIONS .................................................................................................................. 13
EXECUTIVE SUMMARY ........................................................................................................ 16
I. STATE OF ENERGY ACCESS AND ENABLING MARKET ENVIRONMENT ....... 36
1.1 Country Overview ....................................................................................................... 36
1.2 Energy Market ............................................................................................................ 37
1.2.1 Energy Sector Overview ....................................................................................... 37
1.2.2 Electricity Access: Grid and Off-Grid .................................................................. 37
1.2.2.1 Off-grid Market Overview ................................................................................ 38
1.2.2.2 Demand and Supply/Generation Mix ............................................................... 38
1.2.2.3 Transmission and Distribution Network ........................................................... 39
1.2.2.4 Least-Cost Electrification Analysis .................................................................. 42
1.2.2.5 Inclusive Participation ...................................................................................... 50
1.2.3 Key Challenges ..................................................................................................... 51
1.3 National Policy and Regulation ................................................................................. 53
1.3.1 National Electricity/Electrification Policy ............................................................ 53
1.3.2 Integrated National Electrification Plan ................................................................ 53
1.3.3 Energy and Electricity Law .................................................................................. 54
1.3.4 Framework for Stand-alone Systems .................................................................... 55
1.3.4.1 Existence of Specific National Programs ......................................................... 55
1.3.4.2 Financial Incentives .......................................................................................... 57
1.3.4.3 Standards and Quality ....................................................................................... 57
1.3.4.4 Concession Contracts and Schemes .................................................................. 57
1.3.4.5 Specific Business Model Regulation ................................................................ 57
1.3.5 Capacity Building and Technical Assistance ........................................................ 59
1.4 Development Initiatives .............................................................................................. 64
1.4.1 National Government Initiatives ........................................................................... 64
1.4.2 DFI and Donor Programs ...................................................................................... 64
1.4.3 Other Initiatives .................................................................................................... 65

ECREEE: OFF-GRID SOLAR MARKET ASSESSMENT AND PRIVATE SECTOR SUPPORT FACILITY DESIGN
CAMEROON REPORT 3
II. OFF-GRID SOLAR PV MARKET ASSESSMENT ......................................................... 66
2.1 Demand – Households ................................................................................................ 67
2.1.1 Overview of Household Market Segment............................................................. 67
2.1.2 Analysis of Household Market Segment Demand ................................................ 73
2.1.3 The Market for Household Devices without Consumer Finance .......................... 81
2.1.4 The Financed Market for Off-Grid Solutions ....................................................... 84
2.1.5 Consumer Perceptions, Interest and Awareness ................................................... 88
2.2 Demand – Institutional ............................................................................................... 90
2.2.1 Overview of Institutional Market Segment........................................................... 90
2.2.2 Analysis of Institutional Market Segment Demand .............................................. 90
2.2.3 Ability to Pay and Access to Finance ................................................................... 95
2.3 Demand – Productive Use .......................................................................................... 96
2.3.1 Overview of Productive Use Market Segment ..................................................... 96
2.3.2 Analysis of Productive Use Market Segment Demand ......................................... 99
2.3.3 Ability to Pay and Access to Finance ................................................................. 110
2.4 Supply Chain ............................................................................................................. 111
2.4.1 Overview of Commercial Market for Solar PV Equipment ............................... 111
2.4.2 Overview of OGS Companies in Africa and Level of Interest in the Region .... 113
2.4.3 Solar Market, Products and Companies in Cameroon ........................................ 115
2.4.4 Overview of Business Models ............................................................................ 119
2.4.5 The Role of Non-Standard Players in the Market ............................................... 122
2.4.6 Equipment Quality and the Impact of Uncertified Equipment ........................... 123
2.4.7 Local Capacity to Manage Business Development, Installation and Maintenance .. 123
2.4.8 Capacity Building Needs of the Supplier Market Segment ................................ 124
2.5 Key Market Characteristics ..................................................................................... 127
2.5.1 Barriers to Off-Grid Solar Market Growth ......................................................... 127
2.5.2 Drivers of Off-Grid Solar Market Growth .......................................................... 128
2.5.3 Inclusive Participation ........................................................................................ 129

ECREEE: OFF-GRID SOLAR MARKET ASSESSMENT AND PRIVATE SECTOR SUPPORT FACILITY DESIGN
CAMEROON REPORT 4
III. ANALYSIS OF THE ROLE OF FINANCIAL INSTITUTIONS ................................. 131
3.1 Introduction to Financial Products for the Off-Grid Sector ................................ 131
3.1.1 Financial Products for End-Users ....................................................................... 131
3.1.2 Financial Products for Suppliers/Service Providers ........................................... 132
3.2 Financial Market Overview ..................................................................................... 134
3.2.1 Market Structure ................................................................................................. 134
3.2.2 Financial Inclusion .............................................................................................. 137
3.2.3 Commercial Lending Environment..................................................................... 144
3.2.4 Lending to the Off-Grid Solar Sector ................................................................. 148
3.2.5 Key Barriers to Off-Grid Solar Lending ............................................................. 148
3.3 Financial Institutions ................................................................................................ 149
3.3.1 Development Finance Institutions ...................................................................... 149
3.3.2 Microfinance Institutions .................................................................................... 150
3.3.3 Informal Financial Institutions ............................................................................ 151
3.4 Summary of Findings ............................................................................................... 153
ANNEX 1: TASK 1 METHODOLOGY ................................................................................. 158
ANNEX 2: TASK 2 METHODOLOGY ................................................................................. 162
ANNEX 3: TASK 3 METHODOLOGY ................................................................................. 179
ANNEX 4: GENDER ASSESSMENT .................................................................................... 181
REFERENCES .......................................................................................................................... 188
ECREEE: OFF-GRID SOLAR MARKET ASSESSMENT AND PRIVATE SECTOR SUPPORT FACILITY DESIGN
CAMEROON REPORT 5
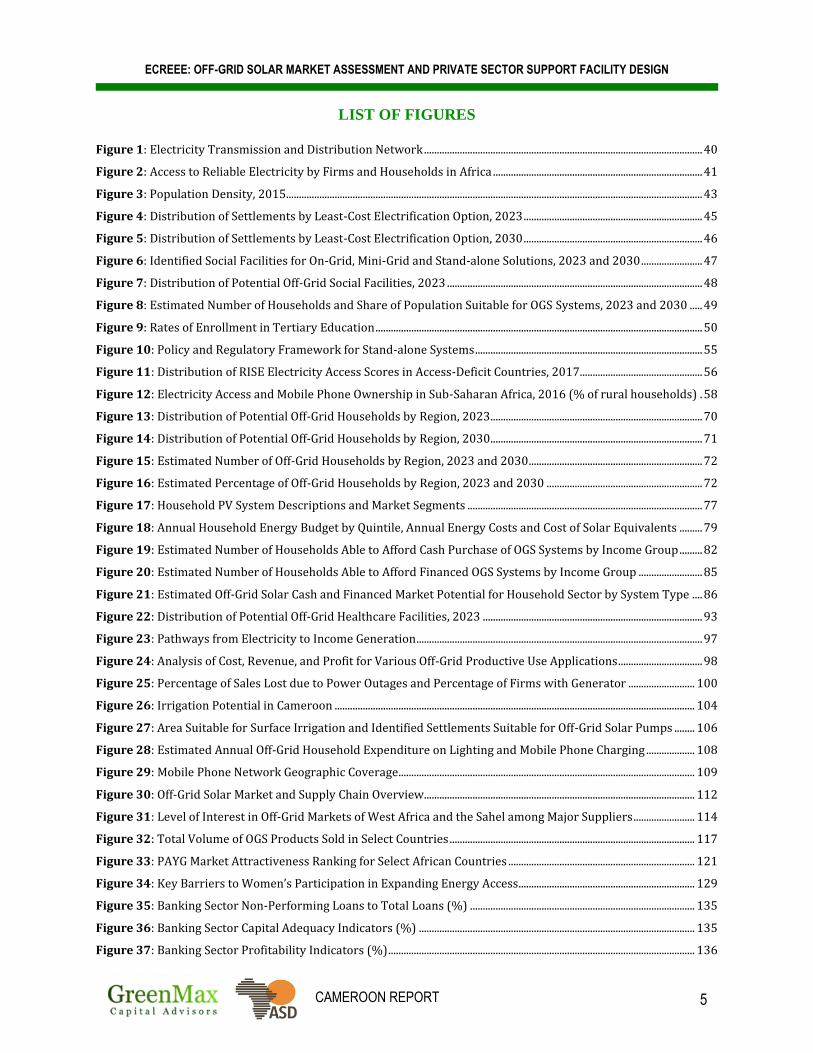
LIST OF FIGURES
Figure 1: Electricity Transmission and Distribution Network ............................................................................................................. 40
Figure 2: Access to Reliable Electricity by Firms and Households in Africa .................................................................................. 41
Figure 3: Population Density, 2015................................................................................................................................................................... 43
Figure 4: Distribution of Settlements by Least-Cost Electrification Option, 2023 ...................................................................... 45
Figure 5: Distribution of Settlements by Least-Cost Electrification Option, 2030 ...................................................................... 46
Figure 6: Identified Social Facilities for On-Grid, Mini-Grid and Stand-alone Solutions, 2023 and 2030 ........................ 47
Figure 7: Distribution of Potential Off-Grid Social Facilities, 2023 .................................................................................................... 48
Figure 8: Estimated Number of Households and Share of Population Suitable for OGS Systems, 2023 and 2030 ..... 49
Figure 9: Rates of Enrollment in Tertiary Education ................................................................................................................................ 50
Figure 10: Policy and Regulatory Framework for Stand-alone Systems ......................................................................................... 55
Figure 11: Distribution of RISE Electricity Access Scores in Access-Deficit Countries, 2017................................................ 56
Figure 12: Electricity Access and Mobile Phone Ownership in Sub-Saharan Africa, 2016 (% of rural households) . 58
Figure 13: Distribution of Potential Off-Grid Households by Region, 2023................................................................................... 70
Figure 14: Distribution of Potential Off-Grid Households by Region, 2030................................................................................... 71
Figure 15: Estimated Number of Off-Grid Households by Region, 2023 and 2030 .................................................................... 72
Figure 16: Estimated Percentage of Off-Grid Households by Region, 2023 and 2030 ............................................................. 72
Figure 17: Household PV System Descriptions and Market Segments ............................................................................................ 77
Figure 18: Annual Household Energy Budget by Quintile, Annual Energy Costs and Cost of Solar Equivalents ......... 79
Figure 19: Estimated Number of Households Able to Afford Cash Purchase of OGS Systems by Income Group ......... 82
Figure 20: Estimated Number of Households Able to Afford Financed OGS Systems by Income Group ......................... 85
Figure 21: Estimated Off-Grid Solar Cash and Financed Market Potential for Household Sector by System Type .... 86
Figure 22: Distribution of Potential Off-Grid Healthcare Facilities, 2023 ...................................................................................... 93
Figure 23: Pathways from Electricity to Income Generation ................................................................................................................ 97
Figure 24: Analysis of Cost, Revenue, and Profit for Various Off-Grid Productive Use Applications ................................. 98
Figure 25: Percentage of Sales Lost due to Power Outages and Percentage of Firms with Generator .......................... 100
Figure 26: Irrigation Potential in Cameroon ............................................................................................................................................. 104
Figure 27: Area Suitable for Surface Irrigation and Identified Settlements Suitable for Off-Grid Solar Pumps ........ 106
Figure 28: Estimated Annual Off-Grid Household Expenditure on Lighting and Mobile Phone Charging ................... 108
Figure 29: Mobile Phone Network Geographic Coverage.................................................................................................................... 109
Figure 30: Off-Grid Solar Market and Supply Chain Overview.......................................................................................................... 112
Figure 31: Level of Interest in Off-Grid Markets of West Africa and the Sahel among Major Suppliers ........................ 114
Figure 32: Total Volume of OGS Products Sold in Select Countries ................................................................................................ 117
Figure 33: PAYG Market Attractiveness Ranking for Select African Countries ......................................................................... 121
Figure 34: Key Barriers to Women’s Participation in Expanding Energy Access..................................................................... 129
Figure 35: Banking Sector Non-Performing Loans to Total Loans (%) ........................................................................................ 135
Figure 36: Banking Sector Capital Adequacy Indicators (%) ............................................................................................................ 135
Figure 37: Banking Sector Profitability Indicators (%) ........................................................................................................................ 136

ECREEE: OFF-GRID SOLAR MARKET ASSESSMENT AND PRIVATE SECTOR SUPPORT FACILITY DESIGN
CAMEROON REPORT 6
Figure 38: ATMs and Branches of Commercial Banks per 100,000 Adults in West Africa and the Sahel, 2017 ....... 138
Figure 39: Share of Adults with a Mobile Money Account in West Africa and the Sahel (%), 2014 and 2017 ........... 139
Figure 40: Mobile Money Transactions per 1,000 Adults in West Africa and the Sahel, 2014 and 2017 ..................... 140
Figure 41: Share of Adults with Access to Financial Services in West Africa and the Sahel (%), 2011 and 2017 .... 141
Figure 42: Financial Inclusion Gender Gap in Cameroon .................................................................................................................... 143
Figure 43: Gender Gap in Mobile Money, 2017 ........................................................................................................................................ 144
Figure 44: Interest Rates on Deposits (%) ................................................................................................................................................. 145
Figure 45: Benchmark Interest Rates (%) .................................................................................................................................................. 145
Figure 46: Real and Nominal Effective Exchange Rates in CEMAC ................................................................................................. 147
Figure 47: Distribution of AfDB Energy Access Financing in Sub-Saharan Africa, 2014-2017 ......................................... 149
Figure 48: Share of Adults Saving in the Past Year (%), 2017 .......................................................................................................... 152

ECREEE: OFF-GRID SOLAR MARKET ASSESSMENT AND PRIVATE SECTOR SUPPORT FACILITY DESIGN
CAMEROON REPORT 7
LIST OF TABLES
Table 1: Selected Macroeconomic and Social Indicators ........................................................................................................................ 36
Table 2: Institutional and Market Actors in the Energy Sector ............................................................................................................ 37
Table 3: Electricity Sector Indicators, 2017 .................................................................................................................................................. 39
Table 4: Results of Least-Cost Electrification Analysis ............................................................................................................................ 44
Table 5: Gaps in the Off-Grid Policy and Regulatory Framework ....................................................................................................... 59
Table 6: DFI and Donor-Funded Off-Grid Development Programs .................................................................................................... 64
Table 7: Indicative Total Cash Potential Market for Off-Grid Solar PV Products in Cameroon, 2018 ................................ 66
Table 8: Household Consumer Market Segments....................................................................................................................................... 68
Table 9: Poverty Headcount in Cameroon, 2014 ........................................................................................................................................ 69
Table 10: Rural Energy Technology and Costsin ........................................................................................................................................ 74
Table 11: Typical Tier-Based Energy Costs................................................................................................................................................... 75
Table 12: Energy Expenditure of Different Income Groups .................................................................................................................. 78
Table 13: Estimated Cash Market Potential for Household Sector .................................................................................................... 83
Table 14: Estimated Financed Market Potential for Household Sector ........................................................................................... 87
Table 15: Indicative Total Cash Market Potential for Institutional Sector .................................................................................... 90
Table 16: Key Assumptions for Water Supply Sector Analysis ........................................................................................................... 91
Table 17: Estimated Cash Market Potential for Water Supply ............................................................................................................ 91
Table 18: Key Assumptions for Healthcare Sector Analysis ................................................................................................................. 91
Table 19: Health Center Categorization and Electricity Demand ....................................................................................................... 92
Table 20: Estimated Cash Market Potential for Healthcare Facilities ............................................................................................. 92
Table 21: Key Assumptions for Education Sector Analysis ................................................................................................................... 94
Table 22: Education Center Categorization and Electricity Demand ................................................................................................ 94
Table 23: Estimated Cash Market Potential for Primary and Secondary Schools ...................................................................... 94
Table 24: Key Assumptions for Public Lighting Sector Analysis ......................................................................................................... 95
Table 25: Estimated Cash Market Potential for Public Lighting ......................................................................................................... 95
Table 26: Overview of Productive Use Applications ................................................................................................................................. 98
Table 27: Indicative Total Cash Market Potential for Productive Use Sector .............................................................................. 99
Table 28: Estimated Cash Market Potential for SMEs – Barbers and Tailors ............................................................................. 101
Table 29: Areas Equipped for Irrigation in Cameroon ......................................................................................................................... 103
Table 30: Estimated Cash Market Potential for Value-Added Applications – Irrigation ....................................................... 105
Table 31: Estimated Cash Market Potential for Value-Added Applications – Milling ........................................................... 107
Table 32: Estimated Cash Market POtential for Value-Added Applications – Refrigeration .............................................. 107
Table 33: Estimated Cash Market Potential for Mobile Phone Charging Enterprises ........................................................... 110
Table 34: Solar Company Tier Classification ............................................................................................................................................. 111
Table 35: Total Sales Volume and Cash Revenue for Stand-alone Systems in Cameroon, 2016-17 ................................ 116
Table 36: Cash and PAYG Sales Volume and Revenue for Pico Solar Products, H1 2018 ..................................................... 116

ECREEE: OFF-GRID SOLAR MARKET ASSESSMENT AND PRIVATE SECTOR SUPPORT FACILITY DESIGN
CAMEROON REPORT 8
Table 37: Off-Grid Solar Products and Components in Cameroon .................................................................................................. 118
Table 38: Estimated Prices of Solar Systems and Components in Cameroon ............................................................................ 118
Table 39: Overview of Off-Grid Solar Business Models ........................................................................................................................ 120
Table 40: Evolving Off-Grid Solar Business Models ............................................................................................................................... 122
Table 41: Capacity Buildings and Technical Assistance for the OGS Supply Chain in Cameroon ..................................... 126
Table 42: Key Barriers to Off-Grid Solar Market Growth in Cameroon ........................................................................................ 127
Table 43: Key Drivers of Off-Grid Solar Market Growth in Cameroon .......................................................................................... 128
Table 44: Banking Sector Assets, 2017 ........................................................................................................................................................ 134
Table 45: Distribution of Credit by Sector (FCFA billion) ................................................................................................................... 136
Table 46: Financial Access Indicators ........................................................................................................................................................... 142
Table 47: Official Exchange Rate, (FCFA-USD) ......................................................................................................................................... 146
Table 48: Categories of MFIs in Cameroon ................................................................................................................................................. 150

ECREEE: OFF-GRID SOLAR MARKET ASSESSMENT AND PRIVATE SECTOR SUPPORT FACILITY DESIGN
CAMEROON REPORT 9
ABBREVIATIONS & ACRONYMS
ACREST Africa Center for Renewable Energy and Sustainable Technologies
AFD Agence Française de Développement (French Development Agency)
AfDB African Development Bank
ADEID Action Pour Un Développement Équitable Intégré et Durable (Action for
Equitable, Integrated and Sustainable Development)
AER Agence d’Électrification Rurale (Rural Electrification Agency)
ANOR Agence des Normes et de la Qualité (Standards and Quality Agency)
ARSEL Agence de Régulation du Secteur de l’Electricité (Regulatory Agency of the
Electricity Sector)
ASD African Solar Designs
BEAC Banque des États de l'Afrique Centrale (Bank of Central African States)
BOAD Banque Ouest Africaine de Développement (West African Development Bank)
C&I Commercial and Industrial
CAPEX Capital Expenditure
CAPP Central African Power Pool
CAR Capital Adequacy Ratio
CCIME Chambre de Commerce, de l’Industrie, des Mines et de l’Artisanat
CEMAC Communauté Economique et Monétaire de l’Afrique Centrale (Central African
Economic and Monetary Community)
CFA Communauté Financière Africaine (African Financial Community)
COBAC Commission Bancaire de l'Afrique Centrale (Central African Banking
Commission)
COD Cash-on-Delivery
DERME Direction des Energies Renouvelables et de la Maîtrise de l’Energie (Renewable
Energy and Energy Efficiency Directorate)
DFI Development Finance Institution
DSCE Document de Stratégie de Croissance et d'Emploi (Strategy Document for Growth
and Employment)
EBID ECOWAS Bank for Investment and Development
ECA Export Credit Agencies
ECCAS Economic Community of Central African States
ECOWAS Economic Community of West African States
ECREEE ECOWAS Center for Renewable Energy and Energy Efficiency
EDC Electricity Development Corporation
ESMAP Energy Sector Management Assistance Program
EU European Union
EUR Euro
EVA Energio Verda Africa
FAO Food and Agriculture Organization
FCFA Central African franc
FEI Facility for Energy Inclusion
FER Fonds d'Energie Rurale (Rural Energy Fund)
FGD Focus Group Discussion
FI Financial Institution
FX Foreign Exchange
GDP Gross Domestic Product
GEF Global Environment Facility
GICAM Groupement Interpatronal du Cameroun

ECREEE: OFF-GRID SOLAR MARKET ASSESSMENT AND PRIVATE SECTOR SUPPORT FACILITY DESIGN
CAMEROON REPORT 10
GIS Geographic Information System
GNI Gross National Income
GoC Government of Cameroon
GOGLA Global Off-Grid Lighting Association
GSMA Groupe Spéciale Mobile Association (Global System for Mobile Communications)
HC Health Center
HDI Human Development Index
HH Household
ICT Information and Communications Technology
IDA International Development Association
IEA International Energy Agency
IEC International Electrotechnical Commission
IFAD International Fund for Agriculture and Development
IFC International Finance Corporation
IMF International Monetary Fund
IPP Independent Power Producer
IRENA International Renewable Energy Agency
kW Kilowatt
kWh Kilowatt-hour
LTO Lease-To-Own
MIFED Microfinance et Développement
MINEE Ministère de l’Eau et de l’Energie (Ministry of Water and Energy)
MFI Microfinance Institution
MTF Multi-Tier Energy Access Framework
MW Megawatt
NDC Nationally Determined Contribution
NGO Non-Governmental Organization
NPL Non-Performing Loan
O&M Operations and Maintenance
OGS Off-Grid Solar
OHADA L’Organisation pour l’Harmonisation en Afrique du Droit des Affaires
(Organization for the Harmonization Business Laws in Africa)
PAMIGA Participatory Microfinance Group for Africa
PANERP Plan d'Action National Energie pour la Réduction de la Pauvreté (National Energy
Action Plan for Poverty Reduction)
PAYG Pay-As-You-Go
PDER Plan Directeur d’Electrification Rurale (Rural Electrification Master Plan)
PDSE Plan de Développement du Secteur de l’Électricité (Electricity Master Plan)
PUE Productive Use of Energy
PV Photovoltaic
RE Renewable Energy
REFELA Réseau des femmes élues locales du Cameroun (Rural women and sustainable
energy program in Cameroon)
RESCO Renewable Energy Service Company
RIN Northern Interconnected Grid
RIS Southern Interconnected Grid
RISE Regulatory Indicators for Sustainable Energy
ROA Return on Assets
ROE Return on Equity
ROGEP Regional Off-Grid Electrification Program

ECREEE: OFF-GRID SOLAR MARKET ASSESSMENT AND PRIVATE SECTOR SUPPORT FACILITY DESIGN
CAMEROON REPORT 11
SEforALL Sustainable Energy for All
SEFA Sustainable Energy Fund for Africa
SHS Solar Home System
SME Small and Medium Enterprise
SPV Special Purpose Vehicle
SSA Sub-Saharan Africa
SONATREL Société Nationale de Transport de l’Electricité
TA Technical Assistance
UNDP United Nations Development Programme
UNIDO United Nations Industrial Development Organization
USD United States Dollar
VAT Value Added Tax
WAPP West Africa Power Pool
WAEMU West Africa Economic and Monetary Union
WB World Bank
WEC World Energy Council
Wh Watt-hour
Wp Watt peak
ECREEE: OFF-GRID SOLAR MARKET ASSESSMENT AND PRIVATE SECTOR SUPPORT FACILITY DESIGN
CAMEROON REPORT 12
ACKNOWLEDGEMENTS
The consortium of GreenMax Capital Advisors (GreenMax), African Solar Designs (ASD) and Energio
Verda Africa (EVA) would like to thank the ECOWAS Center for Renewable Energy and Energy
Efficiency (ECREEE), including Mahama Kappiah, Executive Director, ECREEE; Festus William Lartey
Amoyaw, ROGEP Project Coordinator; and the entire ROGEP Expert and Technical Specialist team:
Hamadou Tchiemogo, Kwabena Adom-Opare, Nouhou Amadou Seini, Daniel Paco, Ermelinda Tavares
Lima, Sire Abdoul Diallo and Collins Osae for their leadership and guidance. We would also like to thank
Nicola Bugatti and Yuri Handem for their support.
In addition, we would like to acknowledge the following individuals and organizations in Cameroon for
their assistance:
Ministry of Water Resources and Energy (particularly the Direction of Renewable Energy and The Rural
Electrification Agency); Dr. Maxime Kamdem, UNIDO, Yaoundé Office; Dr. Mbiake, University of
Douala; Dr. Blaise Bignom; Ranece Ndjeudja; Sabrina Mandeng, Jean Raphael Hei Djob; and all focus
group and survey participants in Cameroon. This report would not have been possible without their support.
We would especially like to thank Herve Azemtsa and Durando Ndongsok for their significant contributions
to this research effort.
NOTE: The findings, analysis, conclusions and recommendations expressed in this report are those of the authors –
they do not necessarily represent the views of ECREEE, the World Bank, or any of the individuals and organizations
that contributed to this study.
ECREEE: OFF-GRID SOLAR MARKET ASSESSMENT AND PRIVATE SECTOR SUPPORT FACILITY DESIGN
CAMEROON REPORT 13
KEY DEFINITIONS
ELECTRICITY ACCESS
For the purpose of this analysis, figures on national, urban and rural electrification rates are from the International
Energy Agency (IEA) Energy Access Outlook Report, 2017.1 Although local government authorities (energy
ministries, rural electrification agencies, utilities etc.) may have different or more up-to-date electrification data,
one single, uniformly-accepted source was necessary as a baseline to assess electricity access figures across all
19 of the countries analyzed under this regional market assessment.
There is no single internationally-accepted and internationally-adopted definition of modern energy access. The
IEA defines energy access as “a household having reliable and affordable access to both clean cooking facilities
and to electricity, which is enough to supply a basic bundle of energy services initially, and then an increasing
level of electricity over time to reach the regional average.”2 A “basic bundle of energy services” means, at a
minimum, several lightbulbs, task lighting (such as a flashlight or lantern), phone charging and a radio. This
definition of energy access serves as a benchmark to measure progress towards UN Sustainable Development
Goal 7.3 The IEA electricity access statistics presented in this report include household connections, either from
a grid connection or from a renewable energy-based off-grid source; the approach excludes illegal connections.
The data is sourced wherever possible from governments, supplemented by data from multilateral development
banks, various international organizations and other publicly available statistics.
The Multi-Tier Energy Access Framework (MTF) is also used as a key reference throughout this report. Rather
than measuring electricity access as a household connection to an electricity grid, the MTF views electricity
access along a continuum of service levels (tiers) and according to a series of indicators, including capacity,
availability/duration of supply, reliability, quality, affordability, legality and health/safety.4
OFF-GRID / STAND-ALONE SOLAR The term “off-grid” as it is widely used throughout this report (e.g. “off-grid sector”) refers to both mini-grids
and stand-alone systems. When “off-grid solar” or its acronym “OGS” are used, this refers only to stand-alone
solar systems and does not include mini-grids. The main focus of this market assessment is the stand-alone solar
sector. While micro/mini-grids typically provide a small community with electricity, stand-alone solar systems
are not connected to an electricity distribution system and typically include a battery, but may also be used in
conjunction with a diesel generator, wind turbine etc. Stand-alone solar technology broadly includes the
following:
Pico solar/solar lanterns5
Single module solar systems (DC)6
Multiple module solar systems (AC)7
Large solar systems (AC)8
In addition to providing electricity access, stand-alone solar products/systems also support a wide range of
productive applications (e.g. solar water pumping, agricultural processing, milling equipment, refrigeration etc.).
1 https://www.iea.org/publications/freepublications/publication/WEO2017SpecialReport_EnergyAccessOutlook.pdf 2 https://www.iea.org/energyaccess/methodology/ 3 https://sustainabledevelopment.un.org/sdg7 4 “Multi-Tier Framework for Measuring Energy Access,” World Bank ESMAP: https://www.esmap.org/node/55526 5 Typically less than 10 Wp; all-in-one lighting and/or phone charging; enables partial or full Tier 1 electricity access 6 Typically 11-100 Wp; capable of powering a few appliances (lights, mobile phone charging, TV, radio, fan etc.); often referred to as a “plug-and-play” solar home system when components are sold as a set; enables full Tier 1 or higher electricity access 7 Typically 101-500 Wp; capable of powering multiple appliances; requires small inverter 8 Typically greater than 500 Wp; most often used to power a large home; requires large inverter

ECREEE: OFF-GRID SOLAR MARKET ASSESSMENT AND PRIVATE SECTOR SUPPORT FACILITY DESIGN
CAMEROON REPORT 14
Source: World Bank Energy Sector Management Assistance Program (ESMAP)

ECREEE: OFF-GRID SOLAR MARKET ASSESSMENT AND PRIVATE SECTOR SUPPORT FACILITY DESIGN
CAMEROON REPORT 15
WEST AFRICA AND THE SAHEL
The term “West Africa and the Sahel” as it is used to throughout this report refers to the 19 countries covered
by the first phase of the Regional Off-Grid Electrification Project (ROGEP). The countries include the 15
member states of the Economic Community of West African States (ECOWAS) – Benin, Burkina Faso, Cabo
Verde, Côte d’Ivoire, The Gambia, Ghana, Guinea, Guinea-Bissau, Liberia, Mali, Niger, Nigeria, Sierra Leone,
Senegal and Togo – plus Cameroon, Central African Republic, Chad and Mauritania.
ECREEE: OFF-GRID SOLAR MARKET ASSESSMENT AND PRIVATE SECTOR SUPPORT FACILITY DESIGN
CAMEROON REPORT 16
EXECUTIVE SUMMARY
I. INTRODUCTION
Access to electricity in Sub-Saharan Africa has improved significantly over the past decade. The number of
people without access to electricity in the region stopped increasing for the first time in 2013 and has since
declined.9 Although grid connections continue to be the primary method of electrification, access to
electricity through off-grid renewable energy systems has grown considerably. The use of off-grid solar
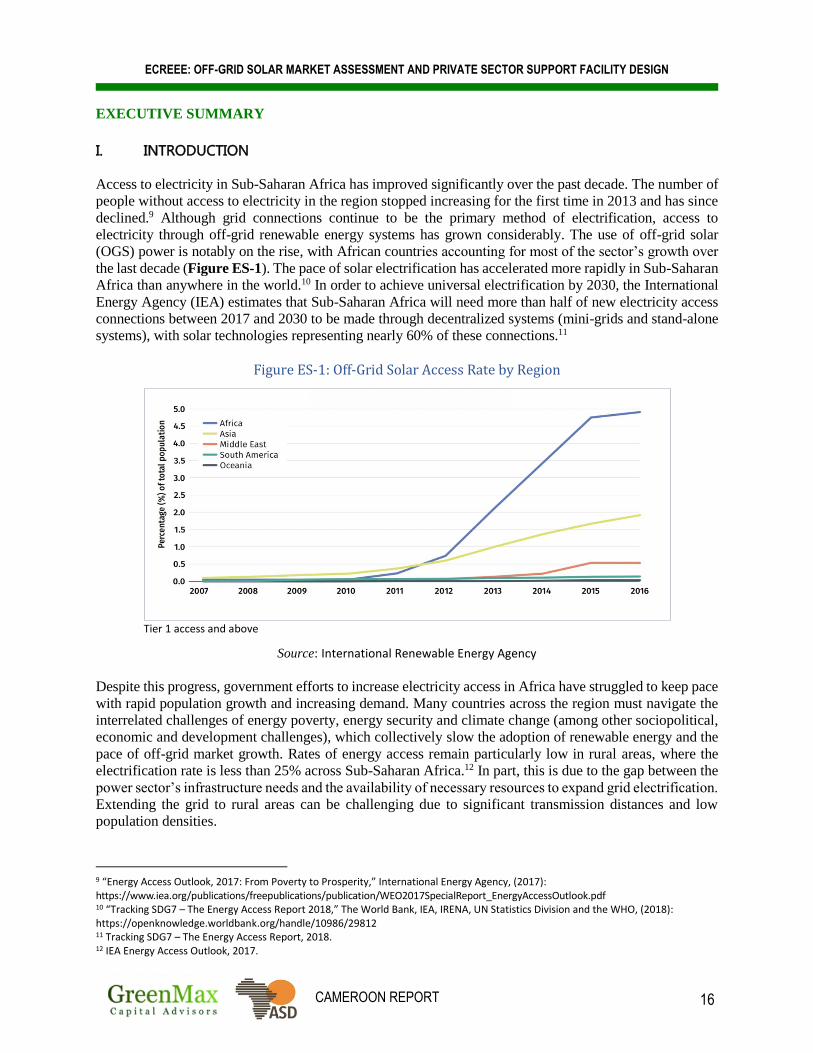
(OGS) power is notably on the rise, with African countries accounting for most of the sector’s growth over
the last decade (Figure ES-1). The pace of solar electrification has accelerated more rapidly in Sub-Saharan
Africa than anywhere in the world.10 In order to achieve universal electrification by 2030, the International
Energy Agency (IEA) estimates that Sub-Saharan Africa will need more than half of new electricity access
connections between 2017 and 2030 to be made through decentralized systems (mini-grids and stand-alone
systems), with solar technologies representing nearly 60% of these connections.11
Figure ES-1: Off-Grid Solar Access Rate by Region
Tier 1 access and above
Source: International Renewable Energy Agency
Despite this progress, government efforts to increase electricity access in Africa have struggled to keep pace
with rapid population growth and increasing demand. Many countries across the region must navigate the
interrelated challenges of energy poverty, energy security and climate change (among other sociopolitical,
economic and development challenges), which collectively slow the adoption of renewable energy and the
pace of off-grid market growth. Rates of energy access remain particularly low in rural areas, where the
electrification rate is less than 25% across Sub-Saharan Africa.12 In part, this is due to the gap between the
power sector’s infrastructure needs and the availability of necessary resources to expand grid electrification.
Extending the grid to rural areas can be challenging due to significant transmission distances and low
population densities.
9 “Energy Access Outlook, 2017: From Poverty to Prosperity,” International Energy Agency, (2017): https://www.iea.org/publications/freepublications/publication/WEO2017SpecialReport_EnergyAccessOutlook.pdf 10 “Tracking SDG7 – The Energy Access Report 2018,” The World Bank, IEA, IRENA, UN Statistics Division and the WHO, (2018): https://openknowledge.worldbank.org/handle/10986/29812 11 Tracking SDG7 – The Energy Access Report, 2018. 12 IEA Energy Access Outlook, 2017.

ECREEE: OFF-GRID SOLAR MARKET ASSESSMENT AND PRIVATE SECTOR SUPPORT FACILITY DESIGN
CAMEROON REPORT 17
As of 2016, over 200 million people in West Africa and the Sahel – more than half of the region’s population
– lacked access to electricity. This figure represents nearly one-third of Africa’s total unelectrified
population. Rates of urban and rural electrification vary widely across the region, with the average rate of
access nearly three times higher in urban areas.13
Despite these access deficits, the region is generously endowed with renewable energy resources –
including hydropower, solar, wind and bioenergy. These resources are largely untapped, however, as
investments in the power sector remain high-risk due to market instability, as well as a variety of political
and regulatory risks. Other energy sector challenges include inter alia limited institutional capacity, poor
utility financial performance, a shortage of local technical expertise and a lack of support from local
financial institutions (FIs).
Until recently, diesel generators largely served as the expensive alternative both for rural electrification and
for urban and peri-urban “bad grid” areas, where electricity was unreliable or only available for part of the
day. However, the advent of decentralized renewable energy technologies, particularly stand-alone solar
and mini-grid systems, offers opportunities to deliver clean and cost-effective off-grid solutions.
Accordingly, policymakers are increasingly utilizing these options in electrification planning as they offer
a reliable, flexible and relatively affordable complement to grid extension initiatives.
Solar energy is the most promising technology in the off-grid space, with three key trends converging to
drive the industry’s growth: first, continued reductions in hardware and balance of system costs (solar
modules, batteries, inverters, appliances etc.); second, a digital revolution, with mobile communication
technology facilitating payments and monitoring; and third, innovation in private sector business models,
such as pay-as-you go (PAYG) and third-party ownership of solar home systems (SHS), which offer energy
as a service and remove previously prohibitive up-front costs for households.14 As a result of these
developments, the off-grid solar market is rapidly evolving and expanding.
In 2016, the OGS market reported global revenues of approximately USD 1 billion. This figure is expected
to increase to USD 8 billion by 2022, with SHS representing the majority of this revenue growth and an
increasing share of unit sales (Figure ES-2). Investments in the off-grid solar sector doubled annually
between 2012 and 2016, increasing by 98% over this period. Between 2013 and 2017, East Africa
represented 86% of the global PAYG market in terms of cumulative unit sales, followed by West Africa at
12% and Asia at 2%.15 As the East African market becomes more crowded and solar companies expand
their operations into West Africa, the region will account for a larger geographic share of the burgeoning
global OGS market. Although the sector’s investment trends remain volatile, there is some preliminary
evidence to suggest that this transition is already underway: in 2016, West Africa accounted for 34% of
total funds raised, up from 9% in 2015, while East Africa’s share of funding decreased from 77% to 47%
over the same period.16
13 IEA Energy Access Outlook, 2017. 14 “Derisking Renewable Energy Investment: Off-Grid Electrification,” United Nations Development Programme (UNDP) and ETH Zurich, (December 2018): https://www.undp.org/content/dam/undp/library/Environment%20and%20Energy/Climate%20Strategies/DREI%20Off-Grid%20Electrification%20-%20Full%20Report%20(20181210).pdf 15 “Off-Grid Solar Market Trends Report 2018,” Dahlberg Advisors, Lighting Global, GOGLA and World Bank ESMAP, (January 2018): https://www.lightingafrica.org/wp-content/uploads/2018/02/2018_Off_Grid_Solar_Market_Trends_Report_Full.pdf 16 Ibid.

ECREEE: OFF-GRID SOLAR MARKET ASSESSMENT AND PRIVATE SECTOR SUPPORT FACILITY DESIGN
CAMEROON REPORT 18
Figure ES-2: Global Off-Grid Solar Market Forecast (million units sold)
NOTE: Left axis = annual sales volume; Right axis = cumulative sales volume; PnP SHS = Plug-and-Play Solar Home System
Source: Dahlberg Advisors, Lighting Global, GOGLA and World Bank ESMAP
Many international off-grid solar companies, including most of the industry’s leading players – BBOXX,
Greenlight Planet, Azuri, d.light, Off-Grid Electric, M-KOPA Solar, Fenix International, and French
utilities EDF and Engie among others – have recently entered markets in West Africa, joining international
pioneers such as PEG and Lumos, which launched originally in Ghana and Nigeria, respectively, and both
expanded into Côte d’Ivoire and Togo.17 While these large international companies are well capitalized,
there is a dearth of financing for smaller, early-stage companies that operate in nascent markets across West
Africa and the Sahel. In fact, the top 10 global off-grid solar companies have received nearly 90% of
investment capital since 2012, while early-stage companies often struggle to raise the necessary capital to
accelerate growth.18
In order to scale off-grid electrification, OGS companies will need to access large volumes of commercial
debt financing. In the longer term, partnerships with local commercial banks and microfinance institutions
(MFIs) will also be necessary in order to develop domestic, local-currency sources of financing and reduce
foreign exchange risk.19 Partnerships with local FIs, whose understanding of the credit risk of local
populations, may also reduce financing costs more rapidly compared to other methods (e.g. using debt from
securitized receivables).20 Although most financing currently comes from non-commercial sources (i.e. the
17 Bavier, J., “Off-grid power pioneers pour into West Africa,” Reuters, (February 20, 2018): https://www.reuters.com/article/us-africa-power-insight/off-grid-power-pioneers-pour-into-west-africa-idUSKCN1G41PE 18 “Accelerating Energy Access: The Role of Patient Capital,” Acumen, (2018): https://acumen.org/wp-content/uploads/Accelerating-Access-Role-of-Patient-Capital-Report.pdf 19 UNDP and ETH Zurich, 2018. 20 “How can Pay-As-You-Go Solar Be Financed?” Bloomberg New Energy Finance, (7 October 2016): https://www.bbhub.io/bnef/sites/4/2016/10/BNEF_WP_2016_10_07-Pay-as-you-go-solar.pdf

ECREEE: OFF-GRID SOLAR MARKET ASSESSMENT AND PRIVATE SECTOR SUPPORT FACILITY DESIGN
CAMEROON REPORT 19
international development community), global capital markets have the size and depth necessary to meet
this investment challenge. Nevertheless, small investment sizes and other early-stage market investment
risks are currently holding back abundant and low-cost private capital flows to the off-grid sector.21
In order to mitigate risks and spur investment, the OGS sector requires substantial policy and regulatory
support. It is therefore important that governments send a clear signal to the private sector by integrating
off-grid technologies into national development programs, electrification plans and electricity access
targets. Governments should also adopt favorable policies, laws and regulations to boost private sector
participation, including procurement and tax incentives, grants and subsidies, concession schemes,
streamlined licensing and permitting procedures, and quality standards for equipment. Additional measures
include public awareness raising, encouraging inclusive gender participation, and building local capacity
at all levels (e.g. solar PV vocational training and technical certification programs, training for FIs to
address unfamiliarity of lenders with off-grid solar sector, corporate and consumer financing needs etc.).
In addition, solar companies increasingly rely on mobile money platforms to scale their business, as mobile
payments allow them to offer low-income customers new ways to access and pay for electricity through
innovative business models such as PAYG. Mobile money services, however, are only just beginning to be
deployed in West Africa and the Sahel. Solar companies are therefore limited by low levels of penetration
and in some cases by country-specific regulatory restrictions.22 Governments can take action to foster
linkages between the off-grid solar, telecommunications and mobile money sectors to expedite the uptake
of market-transforming technology platforms and business models.
Governments across West Africa and the Sahel have implemented a range of policies and approaches to
support off-grid market development, including private concessions, Public Private Partnerships (PPPs),
Rural Electrification Agencies (REAs) and Rural Electrification Funds (REFs), among other measures.
Some countries like Senegal and Mali have adopted private concessions to scale up mini-grids in rural
areas, while others, such as Nigeria and Ghana, have improved rural electrification largely through public
investment.
To support these initiatives, the Economic Community of West African States (ECOWAS) adopted the
ECOWAS Renewable Energy Policy (EREP) in 2013, which intends to achieve universal electricity access
in the region by 2030. The EREP also aims to increase the share of the region’s rural population served by
decentralized renewable energy services (mini-grids and stand-alone systems) to 25% by 2030. The
ECOWAS Center for Renewable Energy and Energy Efficiency (ECREEE) is working with member states
to develop and implement national policies and strategies with electrification targets through 2030 in line
with the EREP, including Sustainable Energy for All (SEforALL) Action Agendas and National Renewable
Energy Action Plans (NREAP), among other programs in support of renewable energy and off-grid market
development.23
21 UNDP and ETH Zurich, 2018. 22 “Scaling Access to Energy in Africa: 20 Million Off-Grid Connections by 2030,” Scaling Off-Grid Energy: A Grand Challenge for Development, USAID, UK DFID, Shell Foundation, (2018): https://static.globalinnovationexchange.org/s3fs-public/asset/document/SOGE%20YIR_FINAL.pdf?uwUDTyB3ghxOrV2gqvsO_r0L5OhWPZZb 23 ECOWAS Renewable Energy Policy, 2013: http://www.ecreee.org/sites/default/files/documents/ecowas_renewable_energy_policy.pdf

ECREEE: OFF-GRID SOLAR MARKET ASSESSMENT AND PRIVATE SECTOR SUPPORT FACILITY DESIGN
CAMEROON REPORT 20
II. BACKGROUND AND CONTEXT OF THE ASSIGNMENT
In this context, with funding from the World Bank, ECREEE launched the Regional Off-Grid
Electrification Project (ROGEP) in 19 countries in West Africa and the Sahel. The project aims to enhance
shared capacity, institutions and knowledge in order to increase electricity access of households, businesses
and public institutions using modern stand-alone solar systems through a harmonized regional approach.
ROGEP has two main components/objectives:
Component 1: Accelerate development of a regional off-grid solar market:
(1A) Foster regional collaboration and promote a supportive enabling environment for the OGS sector;
(1B) Provide entrepreneurship technical support to OGS companies at various stages of development
(training to accelerate business growth and/or facilitate market entry);
(1C) Provide entrepreneurship financial support to OGS companies at various stages of development
(matching grants);
(1D) Provide financing to remove barriers in challenging markets (market entry grants and performance
grants to OGS companies operating in challenging markets)
Component 2: Facilitate access to financing for off-grid solar businesses:
(2A) Provide line of credit for OGS businesses via the West African Development Bank (Banque Ouest
Africaine de Développement, BOAD) to be extended to local FIs for on-lending to local entrepreneurs
(working capital for companies to finance equipment imports, receivables from PAYG schemes etc.)
(2B) Implement contingent grant facility via BOAD to share risks with local FIs and encourage lending
to OGS businesses.
In addition, the project intends to support a range of capacity building activities targeting public and private
sector stakeholders to address existing policy, regulatory, institutional, financial, economic, business,
technology and capacity related barriers. ECREEE will also assist each country with development and
implementation of national programs and initiatives in the areas of renewable energy, rural electrification
and energy access in line with the regional focus of the assignment.
Under the first phase of the project, an initial assessment of the off-grid solar market was undertaken in
each of the 19 countries. The study focused exclusively on the stand-alone solar PV market and did not
assess mini-grids (see Key Definitions). The scope of work was broadly divided into the following tasks:
(1) Review the current enabling policy and market environment for the off-grid solar sector
(2) Analyze the market for off-grid solar products and systems, including an estimate of demand from
the household, institutional and productive use market segments and analysis of the supply chain;
(3) Assess the willingness and capacity of national and regional financial institutions to provide
commercial and/or consumer financing to the off-grid solar sector; and
(4) Propose models to incentivize the private sector and financial institutions to support off-grid solar
market development and to harmonize a regional market to achieve universal access.
Available geographic information system (GIS) data for each country supported the Task 1 and Task 2
analyses. A least-cost electrification analysis was undertaken utilizing geospatial mapping to assess the
potential development of electricity access and grid coverage in each country through 2023 and 2030. The
study estimated the total number of potential settlements, people and households electrified by on-grid,
mini-grid or off-grid stand-alone solutions under each timeframe based on a series of indicators, including
national electricity grid proximity, population density and nodes of economic growth. The assessment was

ECREEE: OFF-GRID SOLAR MARKET ASSESSMENT AND PRIVATE SECTOR SUPPORT FACILITY DESIGN
CAMEROON REPORT 21
also performed for health facilities and education centers (although the analysis was limited by the
availability and/or quality of GIS data for these market segments). The results of the analysis were used to
estimate the share of the population suitable for off-grid stand-alone solar solutions over the analyzed
periods and to assess corresponding potential demand from the household sector under the Task 2 market
sizing.
Within the context of this assignment, a gender-focused analysis was also implemented in order to assess
the level of female participation in each country’s off-grid energy sector. Each stage of the market study
therefore analyzed inclusive participation and gender implications. A comprehensive gender profile is
presented in Annex 4, including a summary of findings, as well as recommendations to improve gender
equality and enhance women’s engagement in development of the off-grid sector.
To carry out these tasks, the project team utilized a combination of desk research, input from local country
experts and feedback from engagement with a wide range of stakeholders at the country and regional levels.
Interviews were conducted with policymakers, industry experts, and representatives from solar companies
and financial institutions. Focus group discussions were also held in each country with key stakeholders
from the four market segments analyzed under Task 2 (household, institutional, productive use and
supplier). Focus group participants included representatives from government, the donor community,
NGOs, solar companies, business and industry associations, academia, community groups, and women’s
groups. In addition to the focus group meetings, surveys were administered in order to collect additional
Task 2 market data, including (i) a survey of international solar companies to gauge their level of interest
in the region; (ii) a survey of local solar companies and retail suppliers in each country to inform the supply
chain analysis; and (iii) an assessment of an off-grid village in each country to better understand how solar
is being utilized for productive uses. Under Task 3, a survey was administered to local and regional FIs to
determine their level of capacity and interest in lending to the off-grid solar sector. A detailed description
of the methodology used to carry out these tasks is presented in Annexes 1-3.
This report is organized into three sections that correspond to Tasks 1-3 described in the scope of work
above (Task 4 was prepared in a separate report). Section 1 covers the enabling policy and market
environment for the OGS sector. This includes an overview of the status of the on-grid and off-grid markets,
an analysis of off-grid energy policy and regulation and gaps in the existing framework, and a summary of
off-grid development initiatives. The results of the least-cost electrification analysis are also included in
this section.
Section 2 estimates the potential market for off-grid solar products and systems by assessing potential
demand from the household, institutional and productive use market segments (Figure ES-3), followed by
an analysis of the supply chain. The household market sizing utilizes results from the least-cost
electrification analysis, along with data on household income and energy expenditure, in order to estimate
potential demand based on the number of households able to afford various OGS systems. Both the cash
and financed market potential were estimated for 2018, 2023 and 2030.
The institutional sector analysis combines available GIS data with secondary research to estimate potential
demand based on assumptions about the electricity needs, usage patterns and associated costs of solar
electrification of four public/institutional markets – water supply for off-grid communities, healthcare
facilities, education centers (primary and secondary schools) and public lighting. Where GIS data was
unavailable, per capita comparisons were made using data from similar countries to estimate off-grid solar
demand by market segment (see Annex 2 for country categorization). The productive use of energy (PUE)
market sizing estimates potential off-grid solar demand for SME, value-added and connectivity
applications. Feedback from stakeholder interviews and focus group discussions informed the analysis and

ECREEE: OFF-GRID SOLAR MARKET ASSESSMENT AND PRIVATE SECTOR SUPPORT FACILITY DESIGN
CAMEROON REPORT 22
helped characterize each market segment’s consumer perceptions, interest, awareness, ability to pay and
access to finance.
The Task 2 supply chain analysis presents an overview of key market actors, solar products and services,
sales figures and business models, and includes a discussion of the role of informal market players and the
impact of uncertified products. The analysis also addresses the capacity needs of the supply chain and
describes specific areas of support where technical assistance is needed to accelerate market growth.
Section 3 assesses the willingness and capability of national and regional financial institutions (FIs) to
provide commercial and/or consumer financing to the off-grid solar sector in each country. This section
includes a summary of financial products for the off-grid sector, a comprehensive overview of each
country’s financial market and commercial lending environment (including analysis of commercial banks,
microfinance institutions and other non-bank financial institutions) and any programs supporting off-grid
solar lending. This section also examines the scope of financial inclusion in each country and the impact of
digital financial services and mobile money on access to finance. It concludes with the results of surveys
that were administered to financial institutions in each country across the region.
Figure ES-3: Analyzed Off-Grid Market Segments
NOTE: SHS = Solar Home System; ICT = Information Communication Technology

ECREEE: OFF-GRID SOLAR MARKET ASSESSMENT AND PRIVATE SECTOR SUPPORT FACILITY DESIGN
CAMEROON REPORT 23
III. EXECUTIVE SUMMARY
Cameroon has the strongest and most diversified economy in the Central African Economic and Monetary
Community (Communauté Economique et Monétaire de l’Afrique Centrale, CEMAC). Petroleum products
account for nearly 40% of the country’s exports, which leaves the economy vulnerable to price fluctuations
and external shocks. The country’s macroeconomic conditions have not translated into improvements for
the majority of the population, as poverty is widespread, particularly in rural areas, where about half of the
population lives.
Access to electricity remains an ongoing challenge. In 2016, approximately 37% of the overall population
in Cameroon – an estimated 9 million people – lacked access to electricity, with a significant disparity
between rates of access in urban (94%) and rural (21%) areas.24 Even where grid connections exist, power
supply is often unreliable, with fewer than one-fifth of firms and about half of households reporting reliable
access to electricity when surveyed.25 Off-grid electrification is a policy priority for the Government of
Cameroon (GoC), which has set a target of increasing the national electrification rate to 98% by 2035.26
Currently, the Government’s efforts to establish a supportive policy and regulatory framework for the off-
grid sector are progressing well, as evidenced by the country’s strong performance in the World Bank
Regulatory Indicators for Sustainable Energy (RISE) energy access scoring. In the 2017 RISE evaluation,
Cameroon ranked first in West Africa and the Sahel and was among the highest scoring countries in
Africa.27
Several off-policies and programs are in various stages of implementation by the GoC, with funding and
support from development partners. The Government’s electrification plans are outlined in the Cameroon
Electricity Master Plan (Plan d’ Développement du Secteur de l’Électricité, PDSE) and the Rural
Electrification Master Plan (Plan Directeur d Electrification Rurale, PDER). The Rural Electrification
Agency (Agence d'Électrification Rurale, AER) is managing implementation of both the PDSE and PDER
strategies. Under the PDSE, the Government plans to increase the country’s rate of electricity access
through a combination of grid extensions and development of off-grid areas utilizing solar PV, diesel and
mini-hydro technologies. The PDER encourages the use of renewable energy in the electrification of rural
areas as well as for the development of productive sectors. The plan intends to make 50,000 power supply
connections per year in rural areas over a 20-year period, electrifying a total of 10,000 additional localities
by 2035.
This report assesses the market opportunity for off-grid solar products and systems by estimating demand
from the household, institutional, and productive use sectors in Cameroon (Figure ES-4). According to the
assessment, there is a significant OGS market opportunity, with the annualized cash market potential in
2018 estimated to be USD 72.8 million. The productive use sector (USD 43.8M) makes up the majority of
estimated demand, followed by the household (USD 18.8M) and institutional (USD 10.3M) sectors.
24 IEA Energy Access Outlook, 2017. 25 Blimpo, M., and Cosgrove-Davies, M., “Electricity Access in Sub-Saharan Africa: Uptake, Reliability, and Complementary Factors for Economic Impact,” AFD and World Bank, Africa Development Forum, (2019): https://openknowledge.worldbank.org/bitstream/handle/10986/31333/9781464813610.pdf?sequence=6&isAllowed=y 26 “A Study for Establishment of the Master Plan of Renewable Energy in Cameroon,” Ministry of Water Resources and Energy of the Republic of Cameroon, (2017). 27 “Policy Matters: Regulatory Indicators for Sustainable Energy,” World Bank ESMAP, (2018): http://documents.worldbank.org/curated/en/553071544206394642/pdf/132782-replacement-PUBLIC-RiseReport-HighRes.pdf

ECREEE: OFF-GRID SOLAR MARKET ASSESSMENT AND PRIVATE SECTOR SUPPORT FACILITY DESIGN
CAMEROON REPORT 24
Figure ES-4: Indicative Total Cash Market Potential for Off-Grid Solar Products in Cameroon, 2018
Source: African Solar Designs analysis
The least-cost electrification analysis found that by 2023, 5,075 settlements across Cameroon (3,412,245
households) will be connected to the main grid, representing 66.5% of the population. By 2030, this figure
will increase to 12,595 settlements (5,931,858 households), equivalent to 96.6% of the population. These
estimates are based on the assumption that all planned grid extensions will be completed by 2030.
In the off-grid sector, the analysis identified 7,188 settlements (1,478,136 households) and 28.8% of the
population in 2023, decreasing to 357 settlements (136,854 households) and 2.2% of the population in 2030
(Figure ES-5). Currently, the largest number of off-grid households are found in the Extreme North region,
where the incidence of poverty is also quite high. However, there is an extensive plan for grid extension to
this region, which could change the off-grid household distribution in the country significantly by 2030.
More research is needed to understand if the many small villages in this region can be effectively reached
by the national grid.
ECREEE: OFF-GRID SOLAR MARKET ASSESSMENT AND PRIVATE SECTOR SUPPORT FACILITY DESIGN
CAMEROON REPORT 25
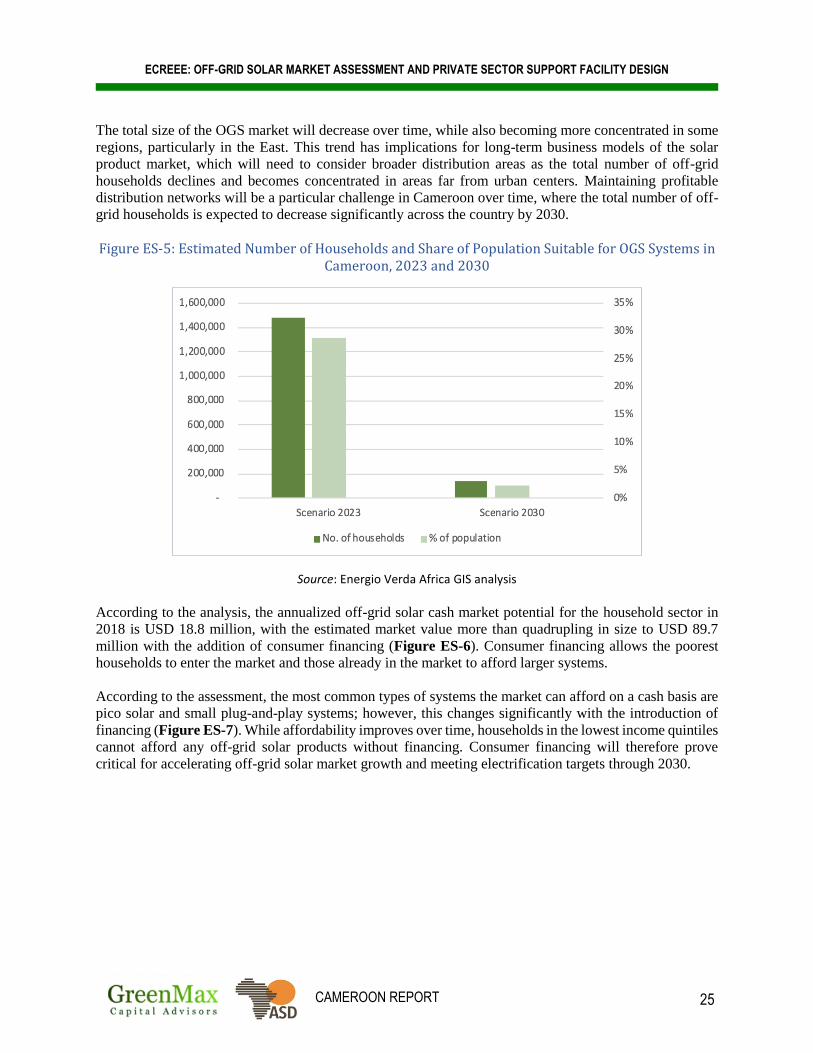
The total size of the OGS market will decrease over time, while also becoming more concentrated in some
regions, particularly in the East. This trend has implications for long-term business models of the solar
product market, which will need to consider broader distribution areas as the total number of off-grid
households declines and becomes concentrated in areas far from urban centers. Maintaining profitable
distribution networks will be a particular challenge in Cameroon over time, where the total number of off-
grid households is expected to decrease significantly across the country by 2030.
Figure ES-5: Estimated Number of Households and Share of Population Suitable for OGS Systems in Cameroon, 2023 and 2030
Source: Energio Verda Africa GIS analysis
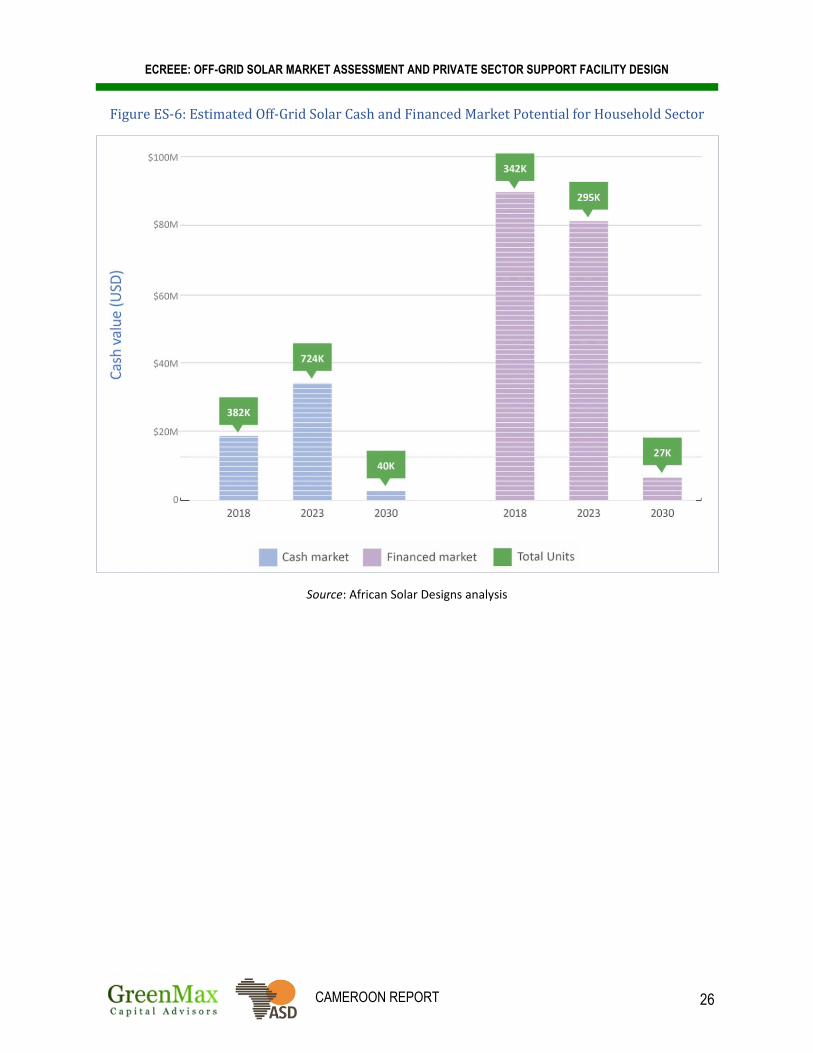
According to the analysis, the annualized off-grid solar cash market potential for the household sector in
2018 is USD 18.8 million, with the estimated market value more than quadrupling in size to USD 89.7
million with the addition of consumer financing (Figure ES-6). Consumer financing allows the poorest
households to enter the market and those already in the market to afford larger systems.
According to the assessment, the most common types of systems the market can afford on a cash basis are
pico solar and small plug-and-play systems; however, this changes significantly with the introduction of
financing (Figure ES-7). While affordability improves over time, households in the lowest income quintiles
cannot afford any off-grid solar products without financing. Consumer financing will therefore prove
critical for accelerating off-grid solar market growth and meeting electrification targets through 2030.
ECREEE: OFF-GRID SOLAR MARKET ASSESSMENT AND PRIVATE SECTOR SUPPORT FACILITY DESIGN
CAMEROON REPORT 26
Figure ES-6: Estimated Off-Grid Solar Cash and Financed Market Potential for Household Sector
Source: African Solar Designs analysis

ECREEE: OFF-GRID SOLAR MARKET ASSESSMENT AND PRIVATE SECTOR SUPPORT FACILITY DESIGN
CAMEROON REPORT 27
Figure ES-7: Estimated Off-Grid Solar Cash and Financed Market Potential for Household Sector by System Type
Source: African Solar Designs analysis
$0
$10 000 000
$20 000 000
$30 000 000
$40 000 000
$50 000 000
$60 000 000
$70 000 000
$80 000 000
$90 000 000
$100 000 000
2018 PotentialCash Purchase
Market
2018 PotentialFinancedMarket
2023 PotentialCash Purchase
Market
2023 PotentialFinancedMarket
2030 PotentialCash Purchase
Market
2030 PotentialFinancedMarket
Medium HH solar system
Small HH solar system
Basic Plug and Play
Pico Solar
ECREEE: OFF-GRID SOLAR MARKET ASSESSMENT AND PRIVATE SECTOR SUPPORT FACILITY DESIGN
CAMEROON REPORT 28
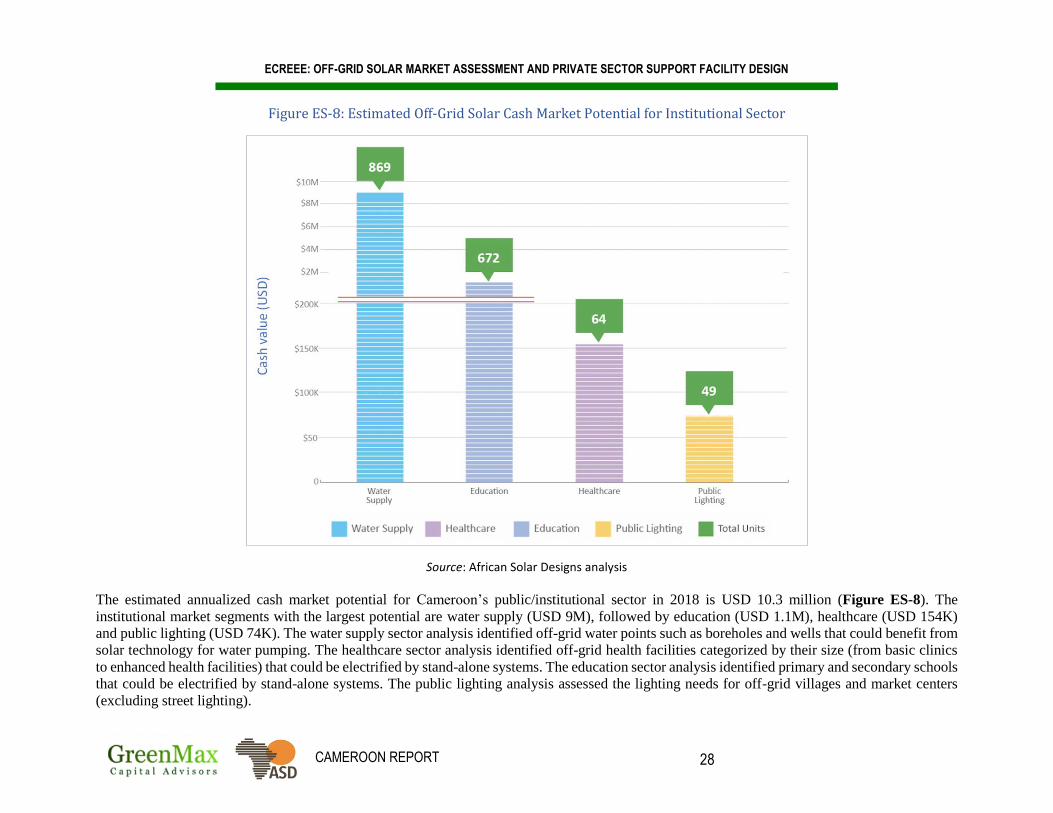
Figure ES-8: Estimated Off-Grid Solar Cash Market Potential for Institutional Sector
Source: African Solar Designs analysis
The estimated annualized cash market potential for Cameroon’s public/institutional sector in 2018 is USD 10.3 million (Figure ES-8). The
institutional market segments with the largest potential are water supply (USD 9M), followed by education (USD 1.1M), healthcare (USD 154K)
and public lighting (USD 74K). The water supply sector analysis identified off-grid water points such as boreholes and wells that could benefit from
solar technology for water pumping. The healthcare sector analysis identified off-grid health facilities categorized by their size (from basic clinics
to enhanced health facilities) that could be electrified by stand-alone systems. The education sector analysis identified primary and secondary schools
that could be electrified by stand-alone systems. The public lighting analysis assessed the lighting needs for off-grid villages and market centers
(excluding street lighting).

ECREEE: OFF-GRID SOLAR MARKET ASSESSMENT AND PRIVATE SECTOR SUPPORT FACILITY DESIGN
CAMEROON REPORT 29
According to the analysis, the annualized off-grid solar cash market potential for the productive use sector
in 2018 is USD 43.8 million (Figure ES-9). The estimated demand from value-added applications
represents most of the PUE market potential (USD 34.2M), followed by applications for connectivity (USD
7.5M) and SMEs (USD 2M).
Figure ES-9: Estimated Off-Grid Solar Cash Market Potential for Productive Use Sector
Source: African Solar Designs analysis
The value-added applications that were analyzed include solar pumping for agricultural irrigation, solar
powered milling and solar powered refrigeration. The assessment utilized a series of inputs, including data
from the UN’s Food and Agriculture Organization on national agricultural production, as well as applicable
solar technologies to support income generation for small shareholder farmers (i.e. solar pumps, mills, and
refrigeration systems). Access to energy for agriculture is critical for the country’s economic development,
particularly given the sector’s importance to GDP.
Off-grid solar power supports a wide range of connectivity applications, including mobile phone charging,
wi-fi servers, banks, mobile money kiosks, and telecommunications towers. Mobile phone and internet
connectivity are also necessary pre-cursors to mobile money and PAYG solutions in the off-grid solar
sector. The market sizing examined mobile phone network coverage as well as rates of mobile phone

ECREEE: OFF-GRID SOLAR MARKET ASSESSMENT AND PRIVATE SECTOR SUPPORT FACILITY DESIGN
CAMEROON REPORT 30
ownership and mobile internet penetration to estimate the market potential for mobile phone charging
enterprises (stations/kiosks).
The calculation of the estimated off-grid solar market for SMEs focused only on barbering and tailoring
appliances, which comprises a small portion of overall SME sector demand. These two microenterprises
are indicative of the service-based SME off-grid solar market, as they benefit significantly from extended
working hours and the use of modern appliances/machinery. The estimated demand for this market segment
is therefore intended to provide a baseline for future research, as a more robust analysis would be necessary
to assess realistic demand from all SMEs.
It should be noted that the Task 2 market sizing assesses the total potential demand for off-grid solar, as
well as variables that affect demand, such as changes in population density, household income, expansion
of national grids and access to finance, among other factors. This data will support policymakers and
practitioners as they assess market potential over time. However, the quantitative demand estimate has not
been revised to reflect realistic market potential. Many other factors and market failures will prevent the
full realization of this total market potential, and these will vary by market segment.
For household demand, the off-grid solar market is already tangible. Still, many factors will affect
household demand for solar products, such as distribution realties, consumer education, competing
economic priorities for households, financial shocks, etc. The institutional market will be affected largely
by government and donor budget allocations along with the potential for community-based finance. The
productive use market is perhaps the least concrete. Considered a relatively new market segment for the
off-grid solar industry, productive use market dynamics are not yet well understood. The ability to realize
potential productive use market demand will also be affected by many of the factors that commonly
determine enterprise prospects in the country, including infrastructure, rural distribution, marketing, access
to finance, insecurity, regulation, etc. The data presented in this report is intended to provide a baseline for
future research.
Following the estimates of market demand, this report analyzes the supply chain for off-grid solar products
and services in Cameroon, which includes a wide range of stakeholders, including importers, distributors,
wholesalers, retailers and end-users (Figure ES-10). Cameroon’s solar market is in a period of rapid growth
as it is among the largest markets in Central Africa. The supply chain is made up of both formal and informal
companies that offer a variety of solar products and systems and deploy several business models. Rural
households make up the main market for OGS products in the country, as the demand for lighting products
and household electrical appliances is growing. Nevertheless, urban households, both electrified and non-
electrified, are also a key consumer market, as they may have greater ability to afford solar products and
systems.
The off-grid solar supply chain faces several barriers, including competition from the informal market. The
widespread sale of low-quality, uncertified products undermines consumer confidence in solar equipment,
undercuts the prices of sellers of quality-verified products and hinders overall OGS market growth. There
are also a number of interrelated challenges and capacity building needs of the supply chain, including
financial, capacity, awareness and regulatory challenges.
Cameroon’s nascent solar market is poised to grow if requisite technical assistance is provided to the supply
chain. To operate effectively, companies need a significant amount of both local and international technical
and financial expertise, as well as an ability to make practical decisions about their operations. Companies
must manage a number of technical competency requirements, including the selection of business models,
importation and distribution channels, solar PV technologies, as well as the design and implementation of
associated marketing instruments and related initiatives.

ECREEE: OFF-GRID SOLAR MARKET ASSESSMENT AND PRIVATE SECTOR SUPPORT FACILITY DESIGN
CAMEROON REPORT 31
Figure ES-10: Off-Grid Solar Market and Supply Chain Overview
Source: GreenMax Capital Advisors
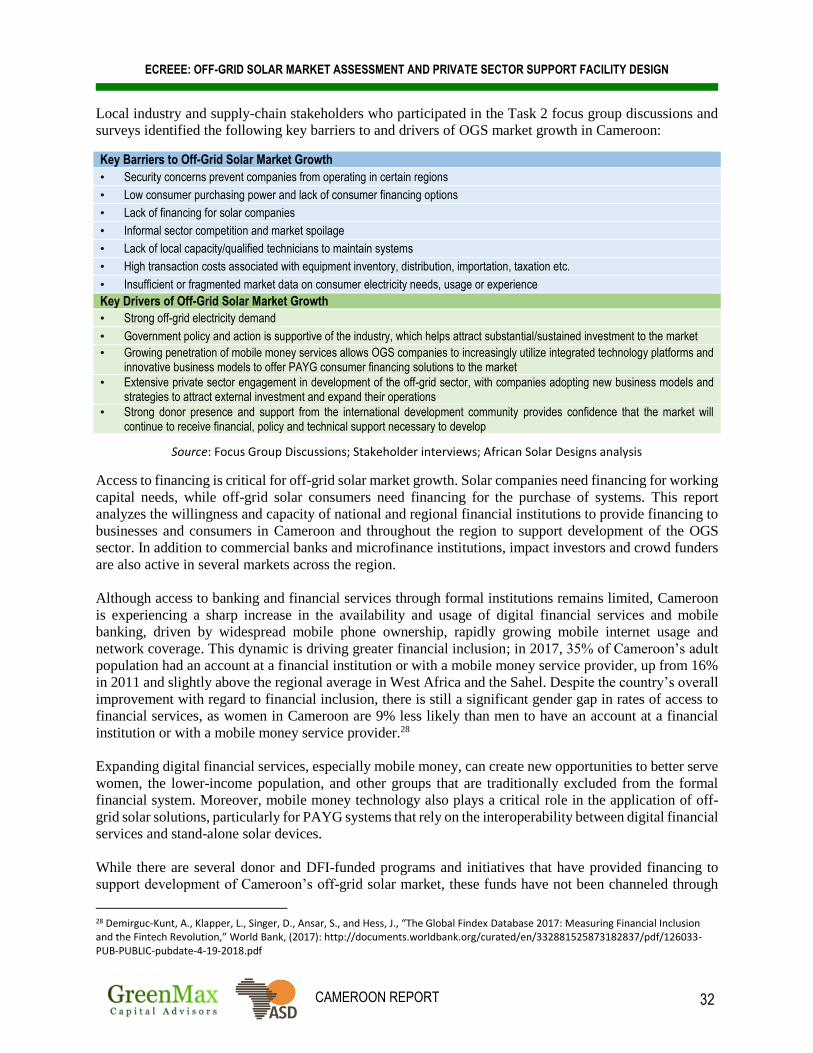
ECREEE: OFF-GRID SOLAR MARKET ASSESSMENT AND PRIVATE SECTOR SUPPORT FACILITY DESIGN
CAMEROON REPORT 32
Local industry and supply-chain stakeholders who participated in the Task 2 focus group discussions and
surveys identified the following key barriers to and drivers of OGS market growth in Cameroon:
Key Barriers to Off-Grid Solar Market Growth
• Security concerns prevent companies from operating in certain regions
• Low consumer purchasing power and lack of consumer financing options
• Lack of financing for solar companies
• Informal sector competition and market spoilage
• Lack of local capacity/qualified technicians to maintain systems
• High transaction costs associated with equipment inventory, distribution, importation, taxation etc.
• Insufficient or fragmented market data on consumer electricity needs, usage or experience
Key Drivers of Off-Grid Solar Market Growth
• Strong off-grid electricity demand
• Government policy and action is supportive of the industry, which helps attract substantial/sustained investment to the market
• Growing penetration of mobile money services allows OGS companies to increasingly utilize integrated technology platforms and innovative business models to offer PAYG consumer financing solutions to the market
• Extensive private sector engagement in development of the off-grid sector, with companies adopting new business models and strategies to attract external investment and expand their operations
• Strong donor presence and support from the international development community provides confidence that the market will continue to receive financial, policy and technical support necessary to develop
Source: Focus Group Discussions; Stakeholder interviews; African Solar Designs analysis
Access to financing is critical for off-grid solar market growth. Solar companies need financing for working
capital needs, while off-grid solar consumers need financing for the purchase of systems. This report
analyzes the willingness and capacity of national and regional financial institutions to provide financing to
businesses and consumers in Cameroon and throughout the region to support development of the OGS
sector. In addition to commercial banks and microfinance institutions, impact investors and crowd funders
are also active in several markets across the region.
Although access to banking and financial services through formal institutions remains limited, Cameroon
is experiencing a sharp increase in the availability and usage of digital financial services and mobile
banking, driven by widespread mobile phone ownership, rapidly growing mobile internet usage and
network coverage. This dynamic is driving greater financial inclusion; in 2017, 35% of Cameroon’s adult
population had an account at a financial institution or with a mobile money service provider, up from 16%
in 2011 and slightly above the regional average in West Africa and the Sahel. Despite the country’s overall
improvement with regard to financial inclusion, there is still a significant gender gap in rates of access to
financial services, as women in Cameroon are 9% less likely than men to have an account at a financial
institution or with a mobile money service provider.28
Expanding digital financial services, especially mobile money, can create new opportunities to better serve
women, the lower-income population, and other groups that are traditionally excluded from the formal
financial system. Moreover, mobile money technology also plays a critical role in the application of off-
grid solar solutions, particularly for PAYG systems that rely on the interoperability between digital financial
services and stand-alone solar devices.
While there are several donor and DFI-funded programs and initiatives that have provided financing to
support development of Cameroon’s off-grid solar market, these funds have not been channeled through
28 Demirguc-Kunt, A., Klapper, L., Singer, D., Ansar, S., and Hess, J., “The Global Findex Database 2017: Measuring Financial Inclusion and the Fintech Revolution,” World Bank, (2017): http://documents.worldbank.org/curated/en/332881525873182837/pdf/126033-PUB-PUBLIC-pubdate-4-19-2018.pdf

ECREEE: OFF-GRID SOLAR MARKET ASSESSMENT AND PRIVATE SECTOR SUPPORT FACILITY DESIGN
CAMEROON REPORT 33
local commercial banks or MFIs. ROGEP is therefore a pioneering initiative in the country, as it endeavors
to boost OGS lending via engagement with local financial partners. Local FIs are increasingly becoming
more aware of the opportunities in the off-grid space, and interviews FIs revealed a willingness to
participate in providing financing to the sector.
According to the Task 3 survey of financial institutions in Cameroon and across the region,29 there is strong
interest to provide financing to the off-grid solar sector. Respondents identified loan guarantees and credit
lines as the most important measures to reduce market entry risks for lenders and stimulate FI engagement
in the sector. Surveyed FIs also identified several areas of internal capacity that require improvement in
order to lend (or increase lending) to the OGS sector (Figure ES-11). The most common need among FIs
was training for bank staff, which includes inter alia assistance to originate deals and appropriately assess
the credit risk of off-grid solar firms and projects, due diligence support to qualify products and approve
vendors, and targeted support for new lenders to the sector with product structuring and development as
well as building deal-flow. Technical assistance for solar enterprises (as is envisioned under Component
1B of ROGEP) will also be necessary, as entrepreneurs often do not have proper financial management and
accounting systems in place, are unable to present quality financial models and lack the expertise required
to structure their companies to take on debt obligations.
Figure ES-11: Financial Institution Needs to Increase Off-Grid Solar Lending
Source: Financial Institution survey; Stakeholder interviews; GreenMax Capital Advisors analysis
29 The results are based on feedback from a total of 121 FIs (including commercial banks, microfinance institutions and other non-bank FIs) that were interviewed across the 19 countries.

ECREEE: OFF-GRID SOLAR MARKET ASSESSMENT AND PRIVATE SECTOR SUPPORT FACILITY DESIGN
CAMEROON REPORT 34
Gender inclusiveness is also a key component of this market assessment, and the key findings of the gender
analysis are presented throughout this report. Given that the off-grid market is only beginning to emerge in
Cameroon, women are not yet highly engaged in the sector. The overall lack of inclusive participation in
the off-grid space is attributable to a wide range of factors. A 2018 survey conducted by IRENA found that
nearly three-quarters of respondents cited cultural and social norms as the most common barrier to women’s
participation in expanding energy access, which reflects the need for gender mainstreaming (Figure ES-
12). More than half of the women surveyed in Africa identified a lack of skills and training as the most
critical barrier, compared to just one-third of respondents globally.30
The same survey found that access to necessary technical, business or leadership skills development
programs was the single most important measure that could be taken to improve women’s engagement in
energy access. Over half of survey respondents also highlighted the need to integrate gender perspectives
in energy access programs, mainstream gender in energy policies and to enhance access to financing for
women (Figure ES-13).31
30 “Renewable Energy: A Gender Perspective,” International Renewable Energy Agency, (2019): https://irena.org/-/media/Files/IRENA/Agency/Publication/2019/Jan/IRENA_Gender_perspective_2019.pdf 31 Ibid.
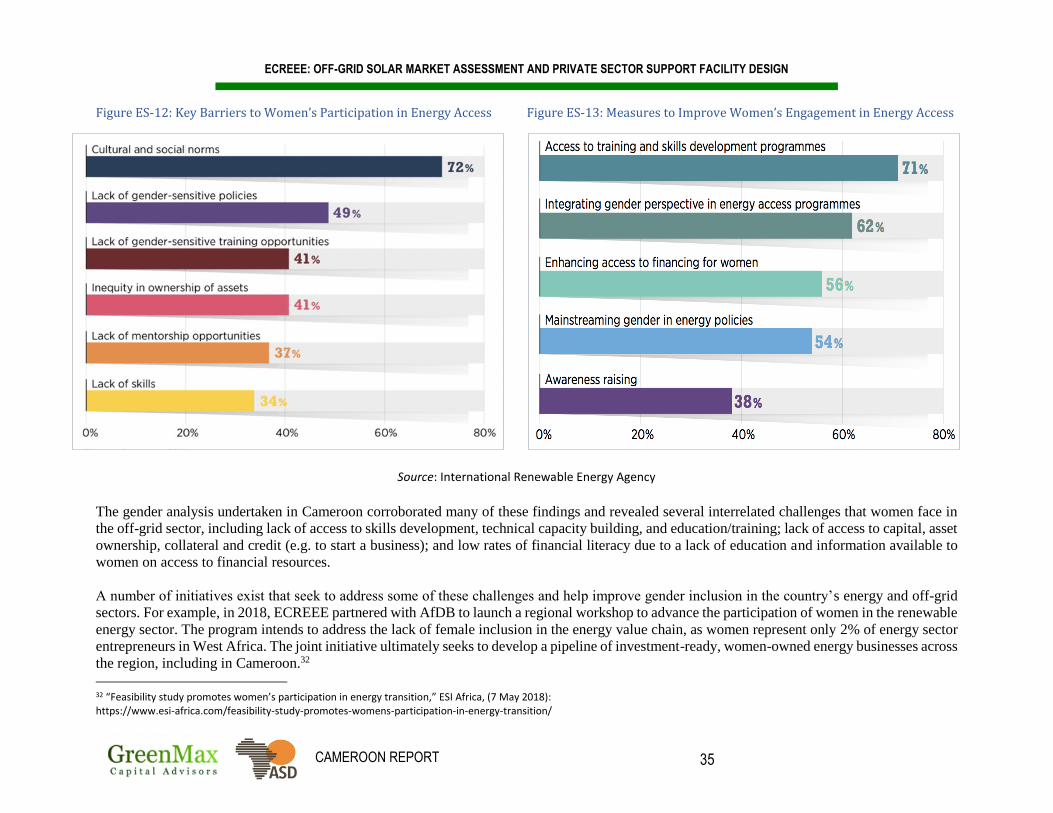
ECREEE: OFF-GRID SOLAR MARKET ASSESSMENT AND PRIVATE SECTOR SUPPORT FACILITY DESIGN
CAMEROON REPORT 35
Figure ES-12: Key Barriers to Women’s Participation in Energy Access Figure ES-13: Measures to Improve Women’s Engagement in Energy Access
Source: International Renewable Energy Agency
The gender analysis undertaken in Cameroon corroborated many of these findings and revealed several interrelated challenges that women face in
the off-grid sector, including lack of access to skills development, technical capacity building, and education/training; lack of access to capital, asset
ownership, collateral and credit (e.g. to start a business); and low rates of financial literacy due to a lack of education and information available to
women on access to financial resources.
A number of initiatives exist that seek to address some of these challenges and help improve gender inclusion in the country’s energy and off-grid
sectors. For example, in 2018, ECREEE partnered with AfDB to launch a regional workshop to advance the participation of women in the renewable
energy sector. The program intends to address the lack of female inclusion in the energy value chain, as women represent only 2% of energy sector
entrepreneurs in West Africa. The joint initiative ultimately seeks to develop a pipeline of investment-ready, women-owned energy businesses across
the region, including in Cameroon.32
32 “Feasibility study promotes women’s participation in energy transition,” ESI Africa, (7 May 2018): https://www.esi-africa.com/feasibility-study-promotes-womens-participation-in-energy-transition/

ECREEE: OFF-GRID SOLAR MARKET ASSESSMENT AND PRIVATE SECTOR SUPPORT FACILITY DESIGN
CAMEROON REPORT
36
I. STATE OF ENERGY ACCESS AND ENABLING MARKET ENVIRONMENT
This section begins with a brief introduction of key macroeconomic and social indicators in Cameroon
(Section 1.1). This is followed by an overview of the country’s existing energy sector (Section 1.2), with
a focus on the status of energy access, including an assessment of both the on-grid and off-grid markets, a
least-cost electrification analysis and a review of gender policies. Section 1.3 examines national energy
policy and regulation vis-à-vis the off-grid solar market, including detailed analysis of the existing
framework for stand-alone systems33 in Cameroon as well as gaps in the framework. Section 1.4 is a
summary of all relevant national and donor-funded development initiatives in the off-grid sector. Annex 1
provides an overview of the Task 1 methodology.
1.1 Country Overview
Cameroon has the strongest and most diversified economy in the Central African Economic and Monetary
Community (Communauté Economique et Monétaire de l’Afrique Centrale, CEMAC). Petroleum products
account for nearly 40% of the country’s exports, which leaves the economy vulnerable to price fluctuations
and external shocks. Reduced investment in the country’s extractive industry led to a slowdown in the
economy, with GDP growth expected to be 3.4% in 2017. However, the outlook beyond remains positive,
with growth projected to increase to 4.1% in 2018 and 4.8% in 2019, spurred by higher exports to the
European Union following an Economic Partnership Agreement (EPA).34 The country’s macroeconomic
conditions have not translated into improvements for the majority of the population, as poverty is
widespread, particularly in rural areas, where about half of the population lives.
Table 1: Selected Macroeconomic and Social Indicators
* World Bank Atlas method (current USD)36
All figures from 2017 unless otherwise indicated Source: AfDB, World Bank and IMF37
33 NOTE: The term “off-grid” as it is widely used throughout this report (e.g. “off-grid sector”) refers to both mini-grids and stand-alone systems. When “off-grid solar” or its acronym “OGS” are used, this refers only to stand-alone systems and does not include mini-grids 34 “Cameroon Economic Outlook,” African Development Bank, (2017): https://www.afdb.org/en/countries/central-africa/cameroon/cameroon-economic-outlook/ 35 50.05 % male/49.95% female 36 “World Bank Open Data: Cameroon,” World Bank, (2017): https://data.worldbank.org/country/cameroon 37 “Cameroon Country and Program Report,” International Monetary Fund, (2018): https://www.imf.org/en/Publications/CR/Issues/2018/01/16/Cameroon-First-Review-Under-the-Extended-Credit-Facility-Arrangement-Requests-for-Waiver-of-45560
Population 24 million35
Urban Population 55% of total
GDP USD 34.9 billion
GDP growth rate 3.4%
GNI per capita USD 1370
Unemployment rate 4.25%
Poverty rate 37.5% (2014)
Urban 8.9%
Rural 56.8%
Currency Central African CFA franc (FCFA)
Official language French
Natural resources Hydrocarbons (crude oil and petroleum products); agricultural (cocoa, coffee, cotton); ores (aluminum)

ECREEE: OFF-GRID SOLAR MARKET ASSESSMENT AND PRIVATE SECTOR SUPPORT FACILITY DESIGN
CAMEROON REPORT
37
1.2 Energy Market
1.2.1 Energy Sector Overview
The energy sector in Cameroon has been undergoing a long and gradual process of liberalization. In 1998,
the Government of Cameroon (GoC or “the Government”) introduced measures to improve governance and
efficiency of the power sector. In 2001, the Government passed an electricity law that led to the privatization
of the state-owned utility AES-Sonel, which was renamed ENEO Cameroon S.A. in 2014 after the British
private equity investment firm, Actis Capital, took over all assets of the American company AES. In 2011,
a new law mandated the separation of the generation, transmission and distribution segments to help foster
competition in the sector. Electricity distribution as well as a significant portion of the power generation is
managed by ENEO. ENEO has exclusivity over the country’s distribution concession, which covers over
70% of the communes in Cameroon. In 2018, the Government transferred assets and employees from ENEO
to the country’s newly established state-owned transmission operator – Société Nationale de Transport de
l’Electricité (SONATREL).38
Table 2: Institutional and Market Actors in the Energy Sector
Institution / Company Role in the Energy Sector Ministry of Water Resources and Energy (Ministère de l’Eau et de l’Energie, MINEE)
Ministry responsible for policy formulation, implementation and monitoring in the energy sector.
ENEO Cameroun S.A Private utility company that engages in the generation, transmission, and distribution of electricity that also operates a significant portion of the country’s installed capacity, including hydro, thermal, and isolated power plants.
National Electricity Transport Corporation (Société nationale de transport d'électricité, SONATREL)
State-owned company responsible for electricity transmission
Electricity Sector Regulatory Agency (Agence de Regulation du Secteur de l’Electricite, ARSEL)
Agency responsible for monitoring and implementation of national electrification programs. ARSEL is also responsible for energy sector regulation and setting of tariffs.
Agency of Rural Electrification (Agence d’Electrification Rurale, “AER”)
Agency responsible for provision of technical and financial assistance to rural operators and end-users and manages Rural Energy Fund.
Electricity Development Corporation (EDC) Public institution created under MINEE to operate and manage publicly owned electricity infrastructures, support and implement infrastructure projects and participate in the development and promotion of private and public investments in the electricity sector.
Cameroon Committee of the World Energy Council (CC of WEC)
Committee responsible for analysis, survey, case studies, and strategy studies on all types of energy.
Source: ECOWAS Center for Renewable Energy and Energy Efficiency
1.2.2 Electricity Access: Grid and Off-Grid
Energy access remains a significant challenge in Cameroon. In 2016, 37% of the population –
approximately 9 million people – did not have access to electricity, with a significant disparity in rates of
access between urban (94%) and rural (21%) areas.39 The Government has set a target of increasing the
national electrification rate to 98% by 2035.40
38 “SONATREL takes of electricity transmission network,” ESI-Africa, (May 10, 2018): https://www.esi-africa.com/cameroon-sonatrel-takes-over-the-electricity-transmission-network/ 39 “Energy Access Outlook, 2017: From Poverty to Prosperity,” International Energy Agency, (2017): https://www.iea.org/publications/freepublications/publication/WEO2017SpecialReport_EnergyAccessOutlook.pdf 40 “A Study for Establishment of the Master Plan of Renewable Energy in Cameroon,” Ministry of Water Resources and Energy of the Republic of Cameroon, (2017).
ECREEE: OFF-GRID SOLAR MARKET ASSESSMENT AND PRIVATE SECTOR SUPPORT FACILITY DESIGN
CAMEROON REPORT
38
1.2.2.1 Off-Grid Market Overview
The GoC intends to increase the country’s low rates of energy access through a combination of grid
extension and development of off-grid areas utilizing solar PV, diesel and mini-hydro technologies. The
Government’s plans are outlined in the Cameroon Electricity Master Plan (Plan d’ Développement du
Secteur de l’Électricité, PDSE) and the Rural Electrification Master Plan (Plan Directeur d Electrification
Rurale, PDER). PDER encourages the use of renewable energy in the electrification of rural areas as well
as for the development of productive sectors. The plan intends to make 50,000 power supply connections
per year in rural areas over a 20-year period, electrifying a total of 10,000 additional localities by 2035.
The Rural Electrification Agency (Agence d'Électrification Rurale, AER) manages the Rural Energy Fund
which was implemented to promote rural electrification in Cameroon. The fund has been under-financed,
as the government is constrained in making capital intensive infrastructure investments. Nonetheless, the
AER has been implementing both the PDSE and PDER strategies in order to significantly advance its rural
electrification targets. The government’s long-term electricity sector policy document outlines the
government’s strategy to increase installed capacity through various hydropower and thermal power plants.
The PDER, the GoC rural electrification strategy document, aims to facilitate improved electricity access
in 660 rural localities before 2035 through a combination of grid extension, new diesel and mini-hydro
plants, and the installation of solar PV mini-grids with provisions for connecting these to the main grid in
the future. In addition to public sector initiatives, several private solar companies are also operating in the
country’s off-grid market (see Section 2.4.3).
1.2.2.2 Demand and Supply/Generation Mix
In 2017, Cameroon had an installed generation capacity of 2,328 MW with nearly 70% of electricity coming
from thermal sources. Hydropower makes up the largest source of energy at 732 MW, mainly coming from
three power plants: Lagdo (72 MW) in the North, and Songloulou (384 MW) and Edea (265 MW) in the
South. Another 255 MW of hydropower is under development.41 With an estimated potential of nearly 20
GW, hydropower will continue to contribute to a significant portion of installed capacity in the future.42
Energy access remains a consistent challenge in Cameroon, particularly in the rural areas of the country.43
With per capita consumption nearly doubling over the last 20 years, continued expansion of the country’s
hydropower resources will be needed to help meet increasing demand and close the energy access gap in
grid-connected areas of the country.44 Off-grid solutions will also be necessary to reach population centers
that will remain outside of grid-extension plans.
Electricity tariffs are set by the Ministry of Water and Energy (Ministère de l’Eau et de l’Energie, MINEE)
under the direction of the sector’s regulatory authority, Regulatory Agency of the Electricity Sector (Agence
de Régulation du Secteur de l’Electricité, ARSEL), and are typically reviewed every five years. The
Government subsidizes electricity tariffs for low-income consumers. The average electricity tariff for all
41 “A study for Establishment of the Master Plan of Renewable Energy in Cameroon,” Ministry of Water Resources & Energy Cameroon,” (December 2017). 42 “Cameroon Rapid Assessment Gap Analysis,” SEforALL, (2015): https://www.SEforALL-africa.org/fileadmin/uploads/SEforALL/Documents/Country_RAGAs/Cameroon_RAGA_FR_Released.pdf 43 “State of Electricity Production and Distribution in Cameroon,” Konrad Adenauer-Stiftung, (2017): http://www.kas.de/climate-energy-africa/en/publications/50984/ 44 “World Bank Open Data: Cameroon,” World Bank, (2017): https://data.worldbank.org/indicator/EG.USE.ELEC.KH.PC?locations=CM

ECREEE: OFF-GRID SOLAR MARKET ASSESSMENT AND PRIVATE SECTOR SUPPORT FACILITY DESIGN
CAMEROON REPORT
39
end users ($0.12/kWh)45 is not cost-reflective. Tariffs have remained largely at the same level and the GoC
continues to compensate concessionaires for the deficit.46
Table 3: Electricity Sector Indicators, 201747
Source: IEA, Ministry of Water Resources and Energy, World Bank
1.2.2.3 Transmission and Distribution Network
The electricity transmission and distribution infrastructure in Cameroon (Figure 1) is in need of investment
and maintenance, as power is often unreliable (Figure 2). The existing grid experiences frequent load
shedding and transmission losses, which are estimated to be as high as 40%.48
The unbundling of the transmission network is underway. Transmission projects that are presently carried
out by ENEO Cameroun S.A, the main public utility company, will be transferred to the new public
transmission system operator, SONATREL. Distribution activities are exclusively performed by ENEO.
The company remains the sole entity authorized to sell electricity to the public. It currently operates the
following three independent transport and distribution networks:
• The Southern Interconnected Grid (RIS): 225 kV network connecting the major hydropower stations
(Edea and Songloulou) and six main thermal plants to supply the main consumption areas around
Yaoundé and Douala (90% consumption).
• The Northern Interconnected Grid (RIN): 110 kV and 90 kV structure dispatching the power generated
by Lagdo power station to cover the region’s demand.
• The Eastern Isolated Grid (EIE): low voltage distribution grid of 30 kV, supplied mainly by isolated
diesel power plants with a capacity of 43 MW.49
Under Cameroon Vision 2035, the Government aims to increase electricity production and extend the
transmission and distribution facilities and grids. This policy prioritizes investments that contribute to
strengthening the electricity sector.50
45 “Regulatory Indicators for Sustainable Energy, Cameroon,” World Bank RISE, (2016): http://rise.worldbank.org/country/cameroon 46 “Evaluation of Rural Electrification Concessions in sub-Saharan Africa, Detailed Case Study: Cameroon,” World Bank, (2015): http://documents.worldbank.org/curated/en/361311498151364762/pdf/116642-WP-PUBLIC-P150241-20p-Detailed-Case-Study-Cameroon-20151204-No-Logo.pdf 47 See Section 2.1 for more details on households/population without access to electricity. 48 “SONATREL takes over electricity transmission network,” ESI Africa, (May 10, 2018): https://www.esi-africa.com/industry-sectors/business-and-markets/cameroon-sonatrel-takes-over-the-electricity-transmission-network/ 49 “Evaluation of Rural Electrification Concessions in sub-Saharan Africa, Detailed Case Study: Cameroon,” World Bank, (2015): http://documents.worldbank.org/curated/en/361311498151364762/pdf/116642-WP-PUBLIC-P150241-20p-Detailed-Case-Study-Cameroon-20151204-No-Logo.pdf 50 “Cameroon Vision 2035,” UN, (2018): http://cm.one.un.org/content/unct/cameroon/en/home/about/vision-2035.html
Installed Capacity 2,327 MW
Thermal 1,592 MW
Hydropower 732 MW
Renewable (non-hydro) 3 MW
National electrification rate (2016) Urban electrification rate Rural electrification rate
63% 94% 21%
Population without access 8.9 million
Households without access 1.7 million
National electrification target 98% by 2035

ECREEE: OFF-GRID SOLAR MARKET ASSESSMENT AND PRIVATE SECTOR SUPPORT FACILITY DESIGN
CAMEROON REPORT
40
Figure 1: Electricity Transmission and Distribution Network51
Source: Energio Verda Africa GIS analysis
51 See Annex 1 for more details, including data sources.

ECREEE: OFF-GRID SOLAR MARKET ASSESSMENT AND PRIVATE SECTOR SUPPORT FACILITY DESIGN
CAMEROON REPORT 41
Figure 2: Access to Reliable Electricity by Firms and Households in Africa52
Source: World Bank Enterprise Surveys, 2013-2017 and Afrobarometer Household Surveys, 2014-2015
The maps in Figure 2 illustrate the share of firms (Panel a) and households (Panel b) reporting access to a reliable supply of electricity. In Cameroon, fewer than one-fifth of surveyed firms and about half of surveyed households reported having reliable access to electricity.
52 Blimpo, M., and Cosgrove-Davies, M., “Electricity Access in Sub-Saharan Africa: Uptake, Reliability, and Complementary Factors for Economic Impact,” AFD and World Bank, Africa Development Forum, (2019): https://openknowledge.worldbank.org/bitstream/handle/10986/31333/9781464813610.pdf?sequence=6&isAllowed=y

ECREEE: OFF-GRID SOLAR MARKET ASSESSMENT AND PRIVATE SECTOR SUPPORT FACILITY DESIGN
CAMEROON REPORT 42
1.2.2.4 Least-Cost Electrification Analysis
A least-cost electrification analysis has been performed to assess the potential development of electricity
access in Cameroon through 2023 and through 2030 (“Scenario 2023” and “Scenario 2030”).53 The analysis
identifies the scale of market opportunities for off-grid stand-alone solar electrification. A brief summary
of the approach and methods used, main assumptions and key results of the analysis in Cameroon are
outlined below. Additional geographic information system (GIS) information, including categorizations,
key definitions, and datasets are included in Annex 1.
Methodology
This analysis used geospatial techniques to determine the least-cost electrification options for settlements
across Cameroon based on their proximity to electrical infrastructure, population density or nodes of
economic growth.
For the scenario 2023 analysis, it is assumed that widespread densification of the existing electrical grid
will enable settlements within 5 km of existing grid lines to connect to the grid.54 Beyond this area, the
likely candidates for electrification by mini-grid systems are settlements that are relatively dense (above
350 people/km2) and have active local economies, evidenced by the presence of social facilities and by their
proximity to other settlements already with electricity access (i.e. within 15 km of night-lights areas). All
remaining settlements – those in areas of lower population density (below 350 people/km2) or far from the
national grid – are considered candidates for off-grid stand-alone systems.
For the scenario 2030 analysis, it is assumed that the grid and the reach of grid densification efforts will
extend far beyond the existing network. Hence, settlements that are within 15 km of current lines (average
densification distance announced by utilities across West Africa in a 10-year timeline in personal
interviews) and 5 km of future planned line extensions are assumed to be connected. For mini-grids, future
economic development – which will allow new settlements to grow sufficiently to become candidates for
mini-grids – is assumed to occur in settlements within 1 km of mini-grid settlements (average distance of
mini-grid coverage of different developers) identified in the scenario 2023 analysis, as well as within 15
km of economic growth centers – airports, mines and urban areas. All other settlements are considered
candidates for off-grid stand-alone systems.
Given the lack of low voltage distribution line data, it is necessary to approximate areas where un-electrified
settlements in close proximity to the grid exist. The analysis therefore focuses on settlements that are within
5 km of the high and medium voltage network, but that are located beyond 15 km of areas with night-time
light emissions (indicative of electrification). Settlements in areas of low population density (below 350
people/km2) that met the above criteria are identified as both being currently un-electrified and unlikely to
be electrified within the scenario 2023.55
Additional analysis was undertaken to estimate the population within each settlement. The current annual
national population growth rate of 2.6%56 was applied to the geospatial analysis to project population
figures for the scenario 2023 & 2030 analyses.57 Figure 3 shows population density across the country,
which served as the basis for this analysis.
53 NOTE: Rather than presenting a 10-year projection through 2028, the analysis conforms to GoC electrification targets for 2030 54 NOTE: No information for Cameroon was available on the distance for densification; therefore, West African Power Pool (WAPP) densification plans were used in the analysis. Low-voltage distribution lines were not considered in this analysis (data was unavailable). 55 Note that this analysis was performed for the five-year scenario but not for the year 2030 scenario due to uncertainties regarding population densities being too high over such a long timeframe 56 “World Bank Open Data: Cameroon,” World Bank, (2017): https://data.worldbank.org/indicator/SP.POP.GROW?locations=SL 57 See Annex 1 for the results of this analysis and more details on the approach and methods used

ECREEE: OFF-GRID SOLAR MARKET ASSESSMENT AND PRIVATE SECTOR SUPPORT FACILITY DESIGN
CAMEROON REPORT 43
Figure 3: Population Density, 201558
Source: Energio Verda Africa GIS analysis
58 See Annex 1 for more details, including data sources.

ECREEE: OFF-GRID SOLAR MARKET ASSESSMENT AND PRIVATE SECTOR SUPPORT FACILITY DESIGN
CAMEROON REPORT 44
Results
Table 4 summarizes the results of the least cost electrification analysis. Figure 4 and Figure 5 illustrate the distribution of settlements according to
least-cost electrification options under scenarios 2023 and 2030, respectively. The number of households was estimated by using the average
household size for the country (5.2 persons/household).59
Table 4: Results of Least-Cost Electrification Analysis
Scenario Indicator
Least-Cost Electrification Option Grid Vicinity
Grid extension Mini-grid Off-grid stand-alone systems
Under-grid un-served
Total under-grid Total outside grid vicinity
Scenario 2023 Number of settlements 5,075 837 7,188 2,683 7,758 5,342
% of settlements 38.7% 6.4% 54.9% 34.6% 59.2% 40.8%
Total population 17,743,672 1,255,908 7,686,306 2,604,112 20,347,784 6,338,102
% of population 66.5% 4.7% 28.8% 12.8% 63.7% 19.8%
Number of households 3,412,245 241,521 1,478,136 500,791 3,913,035 1,218,866
Scenario 2030 Number of settlements 12,595 148 357 Not calculated 12,595 505
% of settlements 96% 1% 3% Not calculated 96.1% 3.9%
Total population 30,845,660 381,096 711,643 Not calculated 30,845,660 1,092,740
% of population 96.6% 1.2% 2.2% Not calculated 96.6% 3.4%
Number of households 5,931,858 73,288 136,854 Not calculated 5,931,858 210,142
Source: Energio Verda Africa GIS analysis
59 “Household Size and Composition Around the World,” United Nations, (2017): http://www.un.org/en/development/desa/population/publications/pdf/ageing/household_size_and_composition_around_the_world_2017_data_booklet.pdf

ECREEE: OFF-GRID SOLAR MARKET ASSESSMENT AND PRIVATE SECTOR SUPPORT FACILITY DESIGN
CAMEROON REPORT 45
Figure 4: Distribution of Settlements by Least-Cost Electrification Option, 202360
Source: Energio Verda Africa GIS analysis
60 Displaying identified settlements with known location (given coordinates) only; see Annex 1 for more details, including data sources.

ECREEE: OFF-GRID SOLAR MARKET ASSESSMENT AND PRIVATE SECTOR SUPPORT FACILITY DESIGN
CAMEROON REPORT 46
Figure 5: Distribution of Settlements by Least-Cost Electrification Option, 203061
Source: Energio Verda Africa GIS analysis
61 Displaying identified settlements with known location (given coordinates) only; see Annex 1 for more details, including data sources.

ECREEE: OFF-GRID SOLAR MARKET ASSESSMENT AND PRIVATE SECTOR SUPPORT FACILITY DESIGN
CAMEROON REPORT 47
The analysis also covered the education centers and health facilities that will remain off-grid during the
analyzed timeframes. The number of education centers and health facilities cannot be seen as
comprehensive as not all were available for the geospatial analysis (institutions with known coordinates);
a total of 1,026 education centers and 677 health facilities were analyzed.
Figure 6 summarizes the number of education centers and health facilities that may be electrified (on-grid
and mini-grid) or suitable for off-grid stand-alone solutions in scenarios 2023 and 2030. None of the
identified institutions are remaining off-grid in Scenario 2030. Figure 7 illustrates the distribution of
potential off-grid facilities across the country under Scenario 2023.
Figure 6: Identified Social Facilities for On-Grid, Mini-Grid and Stand-alone Solutions, 2023 and 2030
Source: Energio Verda Africa GIS analysis
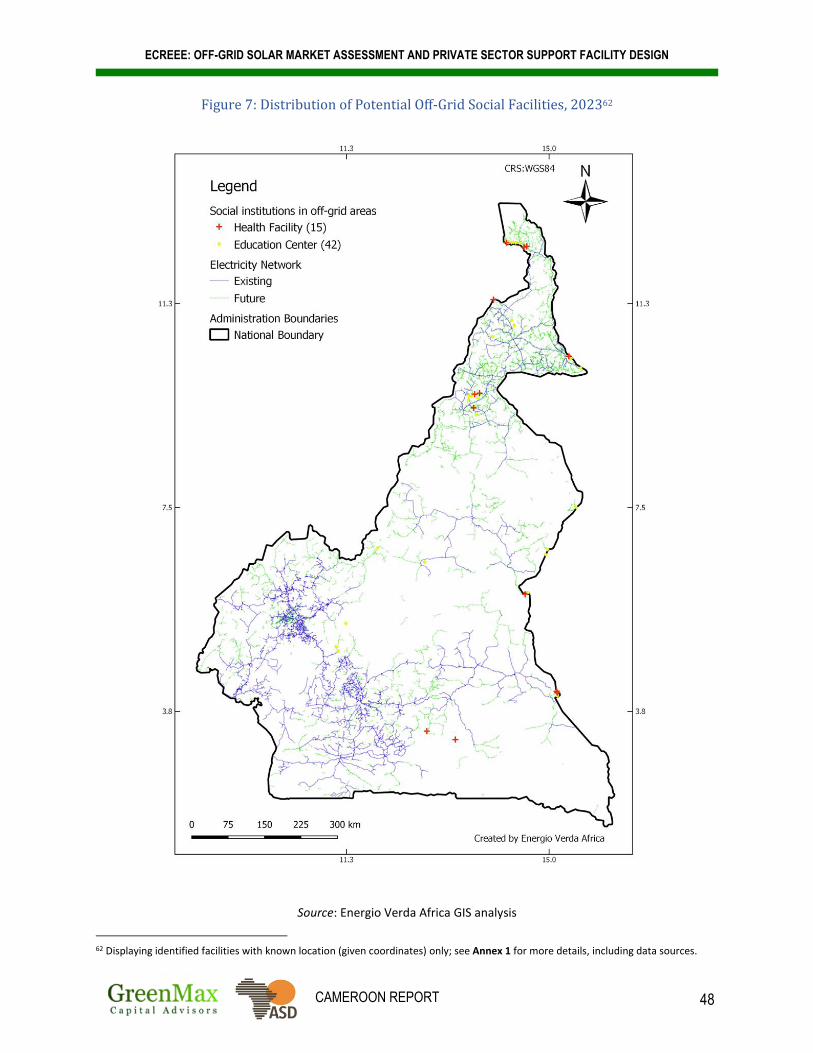
ECREEE: OFF-GRID SOLAR MARKET ASSESSMENT AND PRIVATE SECTOR SUPPORT FACILITY DESIGN
CAMEROON REPORT 48
Figure 7: Distribution of Potential Off-Grid Social Facilities, 202362
Source: Energio Verda Africa GIS analysis
62 Displaying identified facilities with known location (given coordinates) only; see Annex 1 for more details, including data sources.
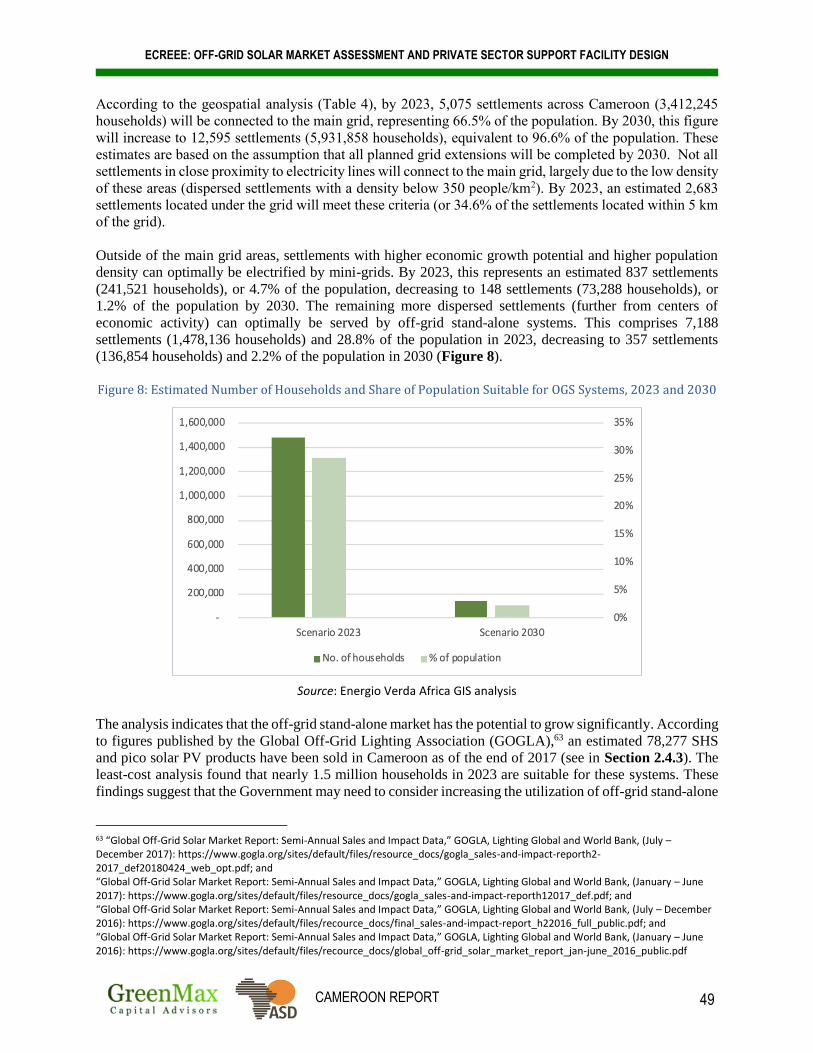
ECREEE: OFF-GRID SOLAR MARKET ASSESSMENT AND PRIVATE SECTOR SUPPORT FACILITY DESIGN
CAMEROON REPORT 49
According to the geospatial analysis (Table 4), by 2023, 5,075 settlements across Cameroon (3,412,245
households) will be connected to the main grid, representing 66.5% of the population. By 2030, this figure
will increase to 12,595 settlements (5,931,858 households), equivalent to 96.6% of the population. These
estimates are based on the assumption that all planned grid extensions will be completed by 2030. Not all
settlements in close proximity to electricity lines will connect to the main grid, largely due to the low density
of these areas (dispersed settlements with a density below 350 people/km2). By 2023, an estimated 2,683
settlements located under the grid will meet these criteria (or 34.6% of the settlements located within 5 km
of the grid).
Outside of the main grid areas, settlements with higher economic growth potential and higher population
density can optimally be electrified by mini-grids. By 2023, this represents an estimated 837 settlements
(241,521 households), or 4.7% of the population, decreasing to 148 settlements (73,288 households), or
1.2% of the population by 2030. The remaining more dispersed settlements (further from centers of
economic activity) can optimally be served by off-grid stand-alone systems. This comprises 7,188
settlements (1,478,136 households) and 28.8% of the population in 2023, decreasing to 357 settlements
(136,854 households) and 2.2% of the population in 2030 (Figure 8).
Figure 8: Estimated Number of Households and Share of Population Suitable for OGS Systems, 2023 and 2030
Source: Energio Verda Africa GIS analysis
The analysis indicates that the off-grid stand-alone market has the potential to grow significantly. According
to figures published by the Global Off-Grid Lighting Association (GOGLA),63 an estimated 78,277 SHS
and pico solar PV products have been sold in Cameroon as of the end of 2017 (see in Section 2.4.3). The
least-cost analysis found that nearly 1.5 million households in 2023 are suitable for these systems. These
findings suggest that the Government may need to consider increasing the utilization of off-grid stand-alone
63 “Global Off-Grid Solar Market Report: Semi-Annual Sales and Impact Data,” GOGLA, Lighting Global and World Bank, (July – December 2017): https://www.gogla.org/sites/default/files/resource_docs/gogla_sales-and-impact-reporth2-2017_def20180424_web_opt.pdf; and “Global Off-Grid Solar Market Report: Semi-Annual Sales and Impact Data,” GOGLA, Lighting Global and World Bank, (January – June 2017): https://www.gogla.org/sites/default/files/resource_docs/gogla_sales-and-impact-reporth12017_def.pdf; and “Global Off-Grid Solar Market Report: Semi-Annual Sales and Impact Data,” GOGLA, Lighting Global and World Bank, (July – December 2016): https://www.gogla.org/sites/default/files/recource_docs/final_sales-and-impact-report_h22016_full_public.pdf; and “Global Off-Grid Solar Market Report: Semi-Annual Sales and Impact Data,” GOGLA, Lighting Global and World Bank, (January – June 2016): https://www.gogla.org/sites/default/files/recource_docs/global_off-grid_solar_market_report_jan-june_2016_public.pdf
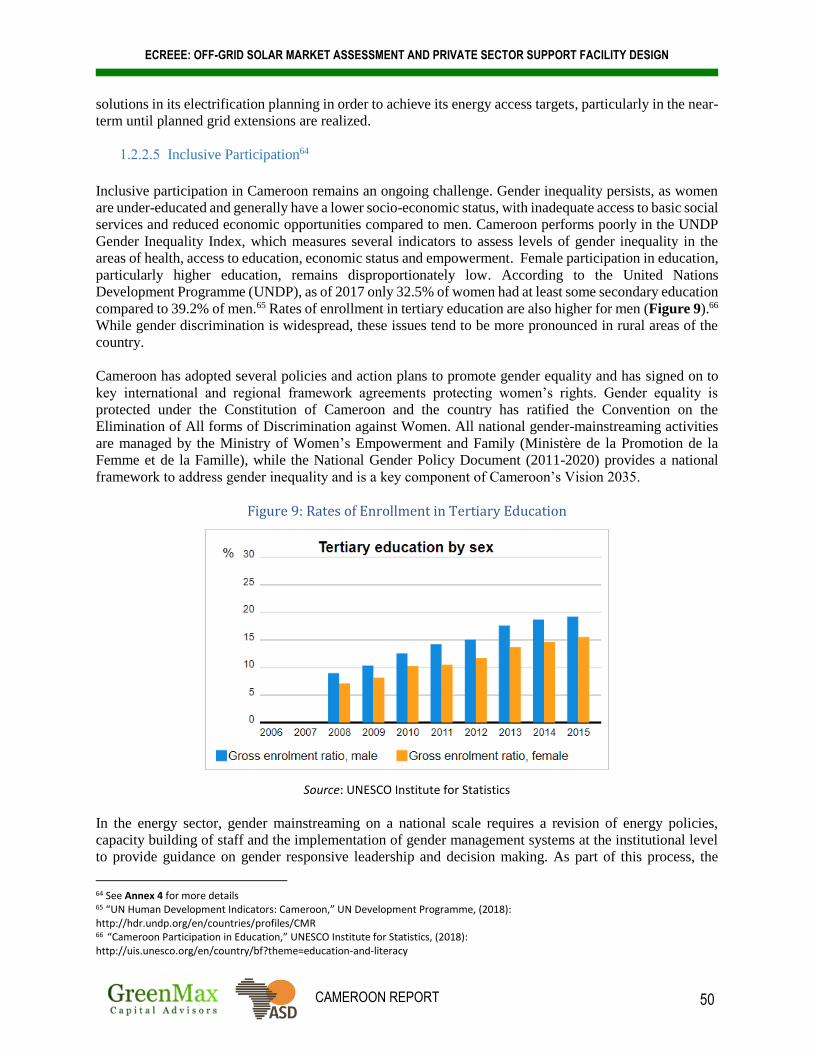
ECREEE: OFF-GRID SOLAR MARKET ASSESSMENT AND PRIVATE SECTOR SUPPORT FACILITY DESIGN
CAMEROON REPORT 50
solutions in its electrification planning in order to achieve its energy access targets, particularly in the near-
term until planned grid extensions are realized.
1.2.2.5 Inclusive Participation64
Inclusive participation in Cameroon remains an ongoing challenge. Gender inequality persists, as women
are under-educated and generally have a lower socio-economic status, with inadequate access to basic social
services and reduced economic opportunities compared to men. Cameroon performs poorly in the UNDP
Gender Inequality Index, which measures several indicators to assess levels of gender inequality in the
areas of health, access to education, economic status and empowerment. Female participation in education,
particularly higher education, remains disproportionately low. According to the United Nations
Development Programme (UNDP), as of 2017 only 32.5% of women had at least some secondary education
compared to 39.2% of men.65 Rates of enrollment in tertiary education are also higher for men (Figure 9).66
While gender discrimination is widespread, these issues tend to be more pronounced in rural areas of the
country.
Cameroon has adopted several policies and action plans to promote gender equality and has signed on to
key international and regional framework agreements protecting women’s rights. Gender equality is
protected under the Constitution of Cameroon and the country has ratified the Convention on the
Elimination of All forms of Discrimination against Women. All national gender-mainstreaming activities
are managed by the Ministry of Women’s Empowerment and Family (Ministère de la Promotion de la
Femme et de la Famille), while the National Gender Policy Document (2011-2020) provides a national
framework to address gender inequality and is a key component of Cameroon’s Vision 2035.
Figure 9: Rates of Enrollment in Tertiary Education
Source: UNESCO Institute for Statistics
In the energy sector, gender mainstreaming on a national scale requires a revision of energy policies,
capacity building of staff and the implementation of gender management systems at the institutional level
to provide guidance on gender responsive leadership and decision making. As part of this process, the
64 See Annex 4 for more details 65 “UN Human Development Indicators: Cameroon,” UN Development Programme, (2018): http://hdr.undp.org/en/countries/profiles/CMR 66 “Cameroon Participation in Education,” UNESCO Institute for Statistics, (2018): http://uis.unesco.org/en/country/bf?theme=education-and-literacy

ECREEE: OFF-GRID SOLAR MARKET ASSESSMENT AND PRIVATE SECTOR SUPPORT FACILITY DESIGN
CAMEROON REPORT 51
Government has established an Inter-ministerial Committee on Gender that is headed by the Prime Minister.
Each ministry has a gender focal point to support mainstreaming of gender policies and projects to promote
inclusive participation for women. Although Cameroon is not a member of the Economic Community of
West African States (ECOWAS), these gender policy measures are consistent with the regional ECOWAS
Policy for Gender Mainstreaming in Energy Access, which provides a roadmap for inclusive participation
of women in the energy sector.
1.2.3 Key Challenges
Some of the key energy sector challenges facing Cameroon include (but are not limited to) the following:
• Investment in Grid Extension and Maintenance: Increasing electricity demand is putting pressure
on power supply – a mismatch that will continue to burden the electricity transmission and distribution
network that needs maintenance and investment to reduce losses and expand access.
• Electricity Tariffs / Utility Financial Performance: The average electricity tariff for all end users
($0.12/kWh)67 does not reflect the cost of production.68 Cameroon subsidizes electricity tariffs for low-
income consumers, providing electricity to poorer households below the cost of supply with funds from
the GoC and the utility (ENEO) through a range of residential and commercial consumers who pay
higher electricity rates. Without cost-reflective tariffs in place, ENEO does not generate enough
revenue to adequately invest in the country’s power infrastructure. The utility continues to demonstrate
poor operational performance, including high levels of technical and commercial losses, as well as
liquidity problems resulting from major payment delays of electricity bills.69
• Imbalanced Energy Mix: The country’s power mix is overly reliant upon imported oil and large
hydropower, two technologies that are susceptible to price volatilities and climatic conditions,
respectively. While investment continues to support these projects, there is comparatively very little
investment in non-hydro renewable energy, which cannot compete economically with cheaper baseload
power in the country’s existing regulatory environment.
• Rural Electrification: While a number of extensions to the grid are being planned, the GoC and AER
are currently revising and updating the Rural Electrification Master Plan, which will clarify the
framework that will be put in place to engage the private sector in development of off-grid areas through
stand-alone solar and mini-grid solutions.
• Local Financial Institutions:70 Local financial institutions (FIs) and microfinance institutions (MFIs)
lack sufficient internal capacity and credit appetite to invest in the renewable energy/off-grid sectors.
This challenge is complicated as it arises mainly from the risk perceptions of FIs, which influence
whether efforts should be made to develop strategies and customize financial products to target a
nascent market, where there is often limited knowledge of technologies, market characteristics and
historical data on portfolio credit performance. There are also likely misperceptions about the potential
size of these markets as well as doubts about the profitability of offering financial products in rural off-
grid areas, where the creditworthiness of potential clients may be an issue. The renewable energy/off-
67 “Regulatory Indicators for Sustainable Energy: Cameroon,” World Bank RISE, (2018): http://rise.worldbank.org/country/cameroon 68 Akitoby, B., Coorey, S., “Oil Wealth in Central Africa: Policies for Inclusive Growth,” International Monetary Fund, Washington, D.C., (2012). 69 “Electricity Transmission and Reform Project Cameroon,” World Bank, (2016): http://www.worldbank.org/en/country/cameroon/projects/all?status_exact=Active&qterm=§or_exact=Energy+Transmission+and+Distribution&lang_exact=English 70 The role of FIs is examined in further detail in Section 3.

ECREEE: OFF-GRID SOLAR MARKET ASSESSMENT AND PRIVATE SECTOR SUPPORT FACILITY DESIGN
CAMEROON REPORT 52
grid space is particularly complicated given relatively high transaction costs and a comparatively
unfavorable regulatory environment that exists in the country.71
• Other Challenges: Successful development of the off-grid sector will require more than just a financial
support mechanism – the Government and its supporting agencies will also need to develop and
implement a range of measures to expedite growth of the market, including a robust technical assistance
(TA) platform to supplement ROGEP’s objectives. This platform should address inter alia (i)
awareness raising, education and training for consumers, including organization of appropriate
community management structures; (ii) solar PV system supply chain and operations and maintenance
(O&M) services, including training of local technicians to ensure that the cost of maintenance is
affordable and sustainable; and (iii) standards for equipment and service providers (i.e. installers,
technicians) to guide customers to companies providing the best value for their money. These measures
should be part of a national rural electrification sector strategy to inform decision-making of key
stakeholders surrounding development and regulation of the country’s stand-alone solar PV market.
All of the above will need to be clarified in the new PDER.
71 One notable exception to this is the commercial and industrial (C&I) market segment, where systems are larger, and off-takers are often companies with large enough balance sheets to borrow. This has been one of the stand-alone market segments where there has been some lending to date in Africa (e.g. AFD’s Sunref program)
ECREEE: OFF-GRID SOLAR MARKET ASSESSMENT AND PRIVATE SECTOR SUPPORT FACILITY DESIGN
CAMEROON REPORT 53
1.3 National Policy and Regulation
1.3.1 National Electricity/Electrification Policy
In both the Growth and Employment Strategy Paper (Document de Stratégie de Croissance et d'Emploi,
DSCE) and in the National Energy Action Plan for Poverty Reduction (Plan d'Action National Energie pour
la Réduction de la Pauvreté, PANERP) launched in 2007, the GoC outlines plans to strengthen electricity
supply and improve access for public social facilities, namely health centers and schools in off-grid areas.72
The Cameroon Electricity Master Plan, (Plan de Développement du Secteur de l’Électricité, PDSE), is the
GoC’s main electrification plan and gives priority to increasing large-scale hydro and fossil fuel generation
capacity, increasing the national grid network, and increasing the share of renewables. In its Nationally
Determined Contribution (NDC) submitted to the UN under the 2015 Paris Agreement, the GoC targets
25% total electricity generation coming from renewable energy sources by 2035.73 In Cameroon’s
Renewable Energy Master Plan (PDER), there are plans to develop and implement a renewable energy law
and to create a national Renewable Energy Agency to support the sector’s growth and help the country
meeting its sustainable energy targets.74
1.3.2 Integrated National Electrification Plan
The PDER sets an objective to enable access to electricity for 98% of the population by 2035. The plan
aims to deploy renewable energy primarily for small localities which are located more than 10 km from the
grid, and with less than 500 inhabitants. The PDER also recommended the creation of a Renewable Energy
Service Company (RESCO) as an agency focused on off-grid rural communities. The PDER also seeks to
enhance energy access for people in rural areas. One of the three renewable energy priorities in Cameroon
is to build a sustainable national energy supply system by replacing fossil energy sources with utility-scale
renewable energy by constructing small-scale electricity distribution network for the off-grid areas.75
The PDER also suggests that a RESCO should be responsible for the launch of a RE rural off-grid
deployment program for the period 2015-2020 (with a pilot phase in 2018-19). The program would aim to
provide: (i) lighting and cooking equipment in off-grid areas, (ii) promote self-consumption and distributed
generation development in home and villages, while providing maintenance services by attracting private
operators.76 This program would have three components, based on different business models:
• Home Rental: Rentals of solar-powered lanterns or cooking equipment. Under this business model,
RESCO off-grid solar suppliers would conclude contracts with consumers to provide them solar
equipment against a fee. Two types of contracts can be adopted: (i) the lease, where consumers pay a
monthly fee without any upfront charges and equipment belongs to the supplier and (ii) the Pay-as-
you-Go (PAYG) model where consumers pay an initial fee and a monthly installment, but solar
equipment becomes the property of consumers at the end of the contract.
• O&M Model: Maintenance and management of installed solar. Under this business model, RESCO
oversees O&M services of solar equipment installed for communities (under donor programs/grants)
and receive compensation from GoC, which in turn charges fees to community members.
72 “Green Mini-Grid Market Development Programme, Mini-Grid Market Opportunity Assessment: Cameroon,” SEforALL Africa Hub and African Development Bank, (April 2017): https://greenminigrid.se4all-africa.org/file/179/download 73 “Cameroon Governmental Framework,” Africa EU Renewables, (2015): https://www.africa-eu-renewables.org/market-information/cameroon/governmental-framework/ 74 “Study for the Establishment of the Master Plan of Renewable Energy in Cameroon,” Korea Energy Economics Institute (KEEI), (2017). 75 Ibid. 76 Ibid.

ECREEE: OFF-GRID SOLAR MARKET ASSESSMENT AND PRIVATE SECTOR SUPPORT FACILITY DESIGN
CAMEROON REPORT 54
• Energy Supply Model: Installation of energy supply equipment and providing homes with electricity.
Under this model, RESCO solar suppliers conclude contracts with consumers (also under a lease or
PAY-GO contract) to supply electricity to households (such as rooftop equipment) or to communities.
1.3.3 Energy and Electricity Law
The 2011 ‘New Electricity Law’ replaced Law N°98/022 of 24 December 1998 and is currently the key
policy for the electricity sector in Cameroon. It defines the organization of the electricity sector into three
separate segments including generation, transmission, and distribution, and defines the administrative
requirements for operators in each of these segments. The law includes specific provisions supporting rural
electrification and RE sources.77
The 2011 law aims to develop the RE sector, including solar, wind, hydropower (below 5 MW) and
bioenergy. The law, N°2011/022 of 14th December 2011,78 reforms and organizes the country’s electricity
sector and provides a regulatory framework with various RE provisions.79 Article 60.1 of the law grants
companies implementing RE projects concessions to sell and distribute electricity and simplify procedures
(a simple authorization is needed from the regulator).80 Additionally, the law grants independent power
producers (IPPs) access to the transmission and distribution network and obliges grid operators to buy
excess supply from RE installations if they supply electricity to rural areas. The law permits a simple
authorization from ARSEL to allow IPPs to set up a rural distribution network up to a maximum capacity
of 1 MW.
In addition, the decree of 2012 established the Renewable Energy and Energy Efficiency Directorate
(Direction des Energies Renouvelables et de la Maîtrise de l’Energie, DERME) within the MINEE. Its
mission is to support the development of RE, including the conception of policies and strategies, the transfer
of technologies, and the promotion of RE within the country. The President of the Republic of Cameroon
signed on December 10th, 2009 the Decree No. 2009/409 establishing the Rural Energy Fund (Fonds
d'Energie Rurale, FER).81 This is the mechanism for financing access to energy in rural areas. The fund
also aims to provide part of the subsidy that would be necessary to make electrification projects attractive
to potential investors. The most recent decree of 2013 defines the organization and operation of the Rural
Electrification Agency (AER). It establishes the AER as a public administration with a legal identity and
with financial independence. Its mission is to promote and develop rural electrification throughout the
country.
77 “Green Mini-Grid Market Development Programme, Mini-Grid Market Opportunity Assessment: Cameroon,” SEforALL Africa Hub and African Development Bank, (April 2017): https://greenminigrid.se4all-africa.org/file/179/download 78 “Cameroon Electricity Sector Law,” Climatescope, Bloomberg New Energy Finance, (2017): http://global-climatescope.org/en/policies/#/policy/4137 79 “Transitioning from INDCs to NDCs in Africa,” AfDB, (November 2016): https://www.afdb.org/fileadmin/uploads/afdb/Documents/Publications/AfDB-CIF-Transitioning_fromINDCs_to_NDC-report-November2016.pdf 80 “Cameroon Electricity Sector Law”, Climatescope, Bloomberg New Energy Finance, (2017): http://global-climatescope.org/en/policies/#/policy/4137 81 “Green Mini-Grid Market Development Programme, Mini-Grid Market Opportunity Assessment: Cameroon,” SEforALL Africa Hub and African Development Bank, (April 2017): https://greenminigrid.se4all-africa.org/file/179/download

ECREEE: OFF-GRID SOLAR MARKET ASSESSMENT AND PRIVATE SECTOR SUPPORT FACILITY DESIGN
CAMEROON REPORT 55
1.3.4 Framework for Stand-alone Systems
Figure 10 is an overview of the key national policies, programs, laws and regulations pertaining to
Cameroon’s framework for stand-alone systems. The gaps in this framework are addressed in Section 1.3.5.
To date, the Government’s efforts to establish a supportive policy and regulatory framework for the off-
grid sector are progressing well, as evidenced by the country’s strong performance in the World Bank
Regulatory Indicators for Sustainable Energy (RISE) energy access scoring. In the 2017 RISE evaluation,
Cameroon ranked first in West Africa and the Sahel and was among the highest scoring countries in Africa.
Figure 10: Policy and Regulatory Framework for Stand-alone Systems
= existing/implemented provisions in the current regulatory framework X = no existing provisions
[ ] = planned/under development
Source: World Bank RISE; Stakeholder interviews; GreenMax Capital Advisors analysis
1.3.4.1 Existence of Specific National Programs
The PDER is the most relevant national program related to the expansion of the off-grid energy resources
in rural Cameroon. The PDER sets a 2035 target to electrify 54% of households and connect 85% of
population centers to the grid (covering 98% of the total population), to be achieved predominantly through
grid extension. The PDER also aim to make 20,000 off-grid connections via mini-grids by 2020. The
program applies various approaches to achieve this, including utilizing regional interconnections with
neighboring countries and the construction of isolated diesel and mini-hydro plants.82
82 “Cameroon: Project to Strengthen and extend electricity transmission and Distribution networks,” AfDB, (2009): https://www.afdb.org/fileadmin/uploads/afdb/Documents/Project-and-Operations/-%20Cameroon%20-%20AR%20Electricity%20Project%20-%5B1%5D.pdf
CAMEROON
World Bank RISE 2017 Energy Access Score: 69 World Bank RISE 2015 Energy Access Score: 69
2017 ranking among West Africa and the Sahel (ROGEP) countries: 1st
Pol
icy/
Reg
ulat
ory
Sup
port
and
Fin
anci
al In
cent
ives
Specific national policies, laws and programs
National electrification policy with off-grid provisions PDSE
Integrated national electrification plan PDER
Energy/electricity law with off-grid provisions x
National programs promoting off-grid market development x
Specific target for rural electrification 98% electricity access by 2035
Financial incentives
Subsidies, tax exemptions or related incentives for solar equipment/stand-alone systems VAT exemptions for solar equipment
Standards and quality
Government-adopted international quality standards for stand-alone systems x
Government-certified program for solar equipment installers x
Consumer awareness/education programs x
Concession Contracts and Schemes PDER
Business Model Regulation x

ECREEE: OFF-GRID SOLAR MARKET ASSESSMENT AND PRIVATE SECTOR SUPPORT FACILITY DESIGN
CAMEROON REPORT 56
Figure 11: Distribution of RISE Electricity Access Scores in Access-Deficit Countries, 201783
Source: World Bank Regulatory Indicators for Sustainable Energy
83 “Policy Matters: Regulatory Indicators for Sustainable Energy,” World Bank ESMAP, (2018): http://documents.worldbank.org/curated/en/553071544206394642/pdf/132782-replacement-PUBLIC-RiseReport-HighRes.pdf
ECREEE: OFF-GRID SOLAR MARKET ASSESSMENT AND PRIVATE SECTOR SUPPORT FACILITY DESIGN
CAMEROON REPORT 57
1.3.4.2 Financial Incentives
Duty exemptions exist in Cameroon under Decree N° 366 of 2013, creating incentives for private sector
investment in Cameroon’s energy sector. As detailed in the Ministry of Finances, Circulaire N°001, of
2012, imported solar panels are exempt from the 19.25% VAT.84
1.3.4.3 Standards and Quality
For the quality of off-grid solar products and systems to meet the expectations of end-users, a set of
standards need to be in place to ensure equipment is reliable, adequately covered by warranties and post-
sale O&M. The Standards and Quality Agency (Agence des Normes et de la Qualite, ANOR) is responsible
for contributing to the government’s policies in the field of standardization and quality in Cameroon.85 It
was created by a Presidential Decree in 2009 and is in charge of certification of conformity to standards as
well as monitoring cooperation with international bodies and specialized committees in the field of
standardization and quality.
1.3.4.4 Concession Contracts and Schemes
There are currently no concession contracts and schemes in place to promote off-grid market development
in Cameroon, although it is envisioned that the PDER would establish such a framework. Currently, only
the national utility concession is set in place, giving ENEO Cameroon S.A a 20-year concession to operate
the transmission and distribution network, and to own and operate up to 1,000 MW of generation capacity.
The GoC has attempted to attract private sector participation in projects outside the ENEO concession area.
Efforts to implement mini-grid concessions for remote rural electrification using RE have not been
successful, partly because the proposed tariffs exceed the ENEO tariff by a margin that is considered
politically unacceptable.86
1.3.4.5 Specific Business Model Regulation
No specific business model regulations exist for the off-grid sector in Cameroon, although the Government
can take measures to support PAYG business models that have already been deployed by private solar
companies engaged in the market. As was demonstrated in East Africa in recent years, the proliferation of
mobile money platforms can rapidly facilitate energy access. Recent data suggests that there is an
opportunity for the GoC to bring together key stakeholders in the off-grid sector (solar providers,
telecommunications companies etc.) to take advantage of the country’s growing usage of mobile Internet
services (9.7 million subscribers and a 40% penetration rate as of 2017)87 as well as high rates of mobile
phone ownership in rural areas (Figure 12).
84 “Dispositions Relatives A L’impôt Sur Les Societes,” Ministry of Finance, (2012): https://garoua.eregulations.org/media/Circulaire_LF_2012_d%C3%A9finitive.pdf 85 “Agence des Normes et de la Qualite,” (2013): http://www.anorcameroun.info/ 86 “Rural Electrification Concessions in Africa,” World Bank, (2017): http://documents.worldbank.org/curated/en/347141498584160513/pdf/116898-WP-P018952-PUBLIC-Rural-Layout-fin-WEB.pdf 87 “The Mobile Economy: Sub-Saharan Africa,” GSMA Intelligence, (2017): https://www.gsmaintelligence.com/research/?file=7bf3592e6d750144e58d9dcfac6adfab&download

ECREEE: OFF-GRID SOLAR MARKET ASSESSMENT AND PRIVATE SECTOR SUPPORT FACILITY DESIGN
CAMEROON REPORT 58
Figure 12: Electricity Access and Mobile Phone Ownership in Sub-Saharan Africa, 2016 (% of rural households)88
Source: World Bank
88 Blimpo, M., and Cosgrove-Davies, M., “Electricity Access in Sub-Saharan Africa: Uptake Reliability and Complementary Factors for Economic Impact,” AFD and World Bank, (2019): https://openknowledge.worldbank.org/bitstream/handle/10986/31333/9781464813610.pdf?sequence=6&isAllowed=y
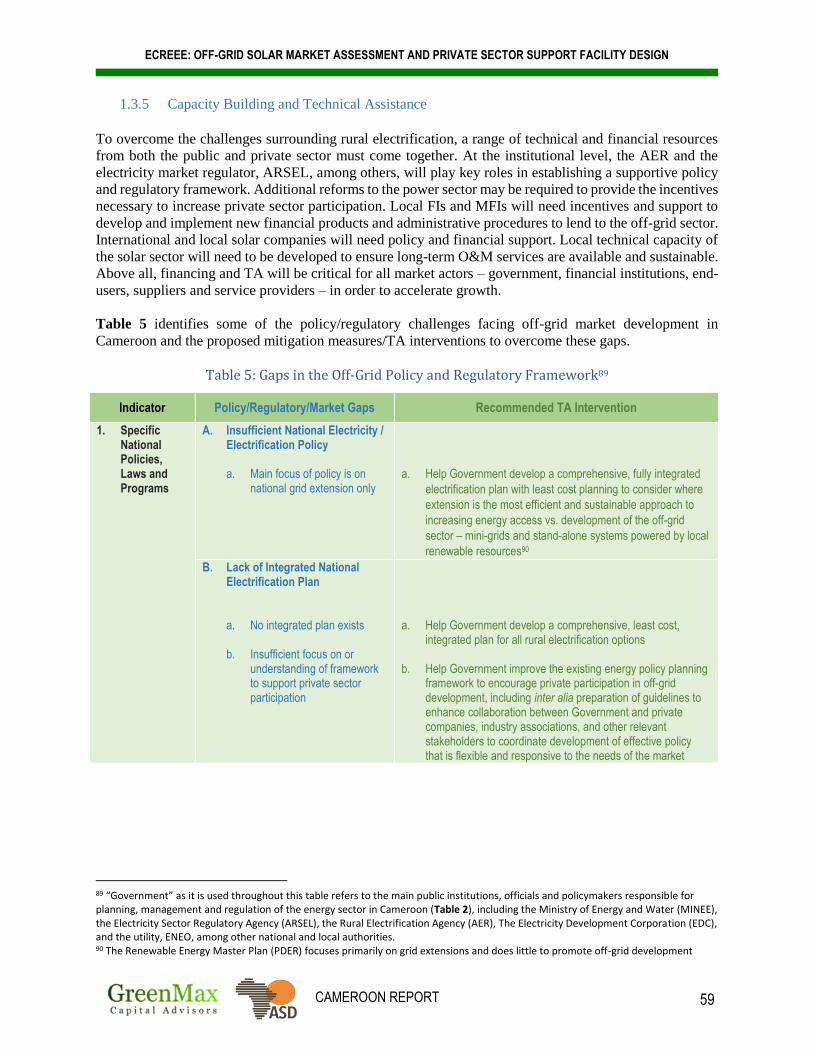
ECREEE: OFF-GRID SOLAR MARKET ASSESSMENT AND PRIVATE SECTOR SUPPORT FACILITY DESIGN
CAMEROON REPORT 59
1.3.5 Capacity Building and Technical Assistance
To overcome the challenges surrounding rural electrification, a range of technical and financial resources
from both the public and private sector must come together. At the institutional level, the AER and the
electricity market regulator, ARSEL, among others, will play key roles in establishing a supportive policy
and regulatory framework. Additional reforms to the power sector may be required to provide the incentives
necessary to increase private sector participation. Local FIs and MFIs will need incentives and support to
develop and implement new financial products and administrative procedures to lend to the off-grid sector.
International and local solar companies will need policy and financial support. Local technical capacity of
the solar sector will need to be developed to ensure long-term O&M services are available and sustainable.
Above all, financing and TA will be critical for all market actors – government, financial institutions, end-
users, suppliers and service providers – in order to accelerate growth.
Table 5 identifies some of the policy/regulatory challenges facing off-grid market development in
Cameroon and the proposed mitigation measures/TA interventions to overcome these gaps.
Table 5: Gaps in the Off-Grid Policy and Regulatory Framework89
89 “Government” as it is used throughout this table refers to the main public institutions, officials and policymakers responsible for planning, management and regulation of the energy sector in Cameroon (Table 2), including the Ministry of Energy and Water (MINEE), the Electricity Sector Regulatory Agency (ARSEL), the Rural Electrification Agency (AER), The Electricity Development Corporation (EDC), and the utility, ENEO, among other national and local authorities. 90 The Renewable Energy Master Plan (PDER) focuses primarily on grid extensions and does little to promote off-grid development
Indicator Policy/Regulatory/Market Gaps Recommended TA Intervention
1. Specific National Policies, Laws and Programs
A. Insufficient National Electricity / Electrification Policy a. Main focus of policy is on
national grid extension only
a. Help Government develop a comprehensive, fully integrated
electrification plan with least cost planning to consider where
extension is the most efficient and sustainable approach to
increasing energy access vs. development of the off-grid
sector – mini-grids and stand-alone systems powered by local
renewable resources90
B. Lack of Integrated National Electrification Plan a. No integrated plan exists
b. Insufficient focus on or
understanding of framework to support private sector participation
a. Help Government develop a comprehensive, least cost,
integrated plan for all rural electrification options
b. Help Government improve the existing energy policy planning framework to encourage private participation in off-grid development, including inter alia preparation of guidelines to enhance collaboration between Government and private companies, industry associations, and other relevant stakeholders to coordinate development of effective policy that is flexible and responsive to the needs of the market

ECREEE: OFF-GRID SOLAR MARKET ASSESSMENT AND PRIVATE SECTOR SUPPORT FACILITY DESIGN
CAMEROON REPORT 60
C. Lack of Energy and Electricity Law a. No specific Energy or
Electricity Law with off-grid provisions exists
a. Help Government develop new legal framework that is flexible
and helps create appropriate incentives for private sector participation in off-grid market development (e.g. to expedite process of electricity market liberalization)
D. Insufficient national policies, laws, programs and/or action plans targeting off-grid market development
a. Lack of specific Off-Grid
Policy, Law, or Action Plan in place
b. No Lead Agency
c. Insufficient focus on or understanding of framework to support private sector participation
a. Help Government establish the medium-long term rural
electrification strategy in the country through development and implementation of the “Off-grid Rural Electrification Master Plan”
b. Help Government establish a lead entity / Rural Electrification Agency that has a clear mandate to coordinate activities with the private sector, donor community and at national and local level in order to accelerate off-grid market growth to achieve energy access objectives
c. Help Government improve off-grid framework to create
appropriate incentives for private sector participation to expedite off-grid solar market growth, including inter alia preparation of procurement schemes and financing mechanisms designed to encourage PPP engagement in the off-grid sector
2. Financial Incentives (import duties, taxes, etc.)
A. Insufficiently supportive financial incentives / tax regime
a. Help Government develop appropriate VAT and tariff policies covering the entire off-grid / stand-alone solar product supply chain (including batteries, inverters or other system components) that would provide necessary support to the industry
b. Help Government establish a Special Task Force to (i)
mitigate potential difficulties in customs clearance and import logistics, and (ii) oversee implementation of tax exemptions by coordinating with all agencies and regulatory bodies involved
c. Help Government introduce appropriate grant and subsidy
schemes which require private funding matches and are predictable and not overly bureaucratic
d. Help Government create PPP schemes (through the PPP
Unit) to share high project development and market entry costs particularly with developers in remote areas
e. Help Government analyze where subsidies or exemptions for
non-renewable energy sources provide unfair advantage for fossil-fuels and impede development of clean energy solutions
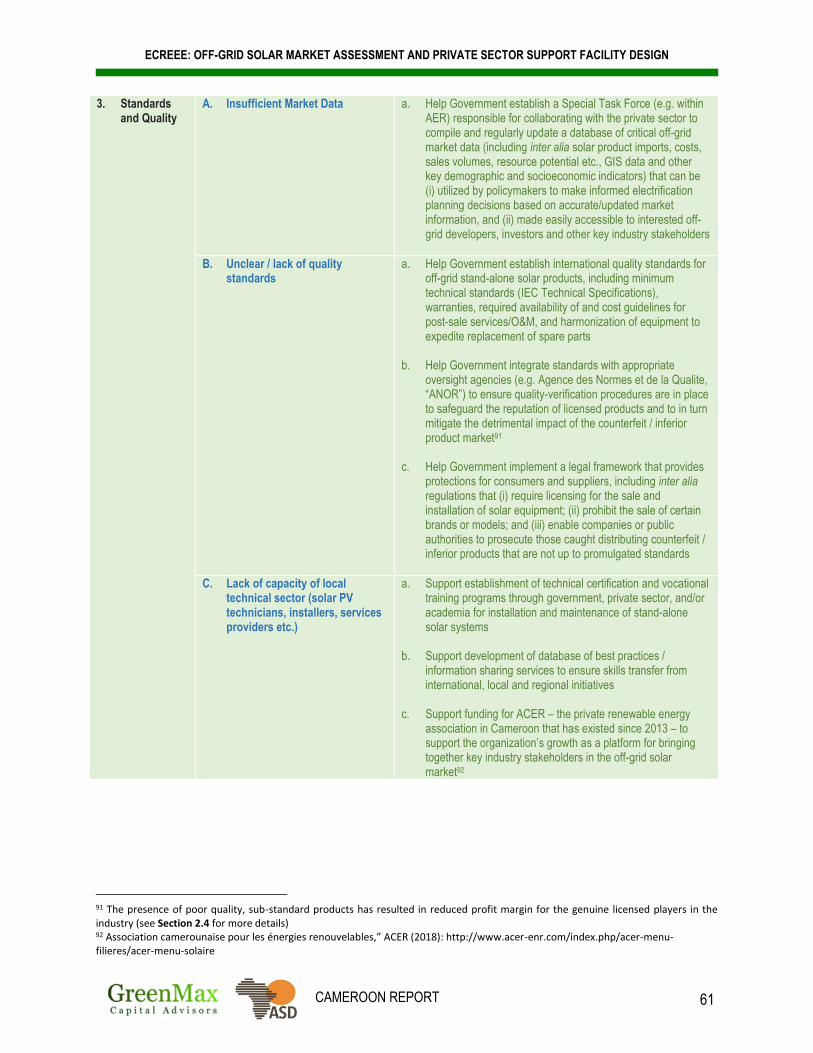
ECREEE: OFF-GRID SOLAR MARKET ASSESSMENT AND PRIVATE SECTOR SUPPORT FACILITY DESIGN
CAMEROON REPORT 61
91 The presence of poor quality, sub-standard products has resulted in reduced profit margin for the genuine licensed players in the industry (see Section 2.4 for more details) 92 Association camerounaise pour les énergies renouvelables,” ACER (2018): http://www.acer-enr.com/index.php/acer-menu-filieres/acer-menu-solaire
3. Standards and Quality
A. Insufficient Market Data a. Help Government establish a Special Task Force (e.g. within AER) responsible for collaborating with the private sector to compile and regularly update a database of critical off-grid market data (including inter alia solar product imports, costs, sales volumes, resource potential etc., GIS data and other key demographic and socioeconomic indicators) that can be (i) utilized by policymakers to make informed electrification planning decisions based on accurate/updated market information, and (ii) made easily accessible to interested off-grid developers, investors and other key industry stakeholders
B. Unclear / lack of quality standards
a. Help Government establish international quality standards for off-grid stand-alone solar products, including minimum technical standards (IEC Technical Specifications), warranties, required availability of and cost guidelines for post-sale services/O&M, and harmonization of equipment to expedite replacement of spare parts
b. Help Government integrate standards with appropriate oversight agencies (e.g. Agence des Normes et de la Qualite, “ANOR”) to ensure quality-verification procedures are in place to safeguard the reputation of licensed products and to in turn mitigate the detrimental impact of the counterfeit / inferior product market91
c. Help Government implement a legal framework that provides
protections for consumers and suppliers, including inter alia regulations that (i) require licensing for the sale and installation of solar equipment; (ii) prohibit the sale of certain brands or models; and (iii) enable companies or public authorities to prosecute those caught distributing counterfeit / inferior products that are not up to promulgated standards
C. Lack of capacity of local technical sector (solar PV technicians, installers, services providers etc.)
a. Support establishment of technical certification and vocational training programs through government, private sector, and/or academia for installation and maintenance of stand-alone solar systems
b. Support development of database of best practices /
information sharing services to ensure skills transfer from international, local and regional initiatives
c. Support funding for ACER – the private renewable energy
association in Cameroon that has existed since 2013 – to support the organization’s growth as a platform for bringing together key industry stakeholders in the off-grid solar market92
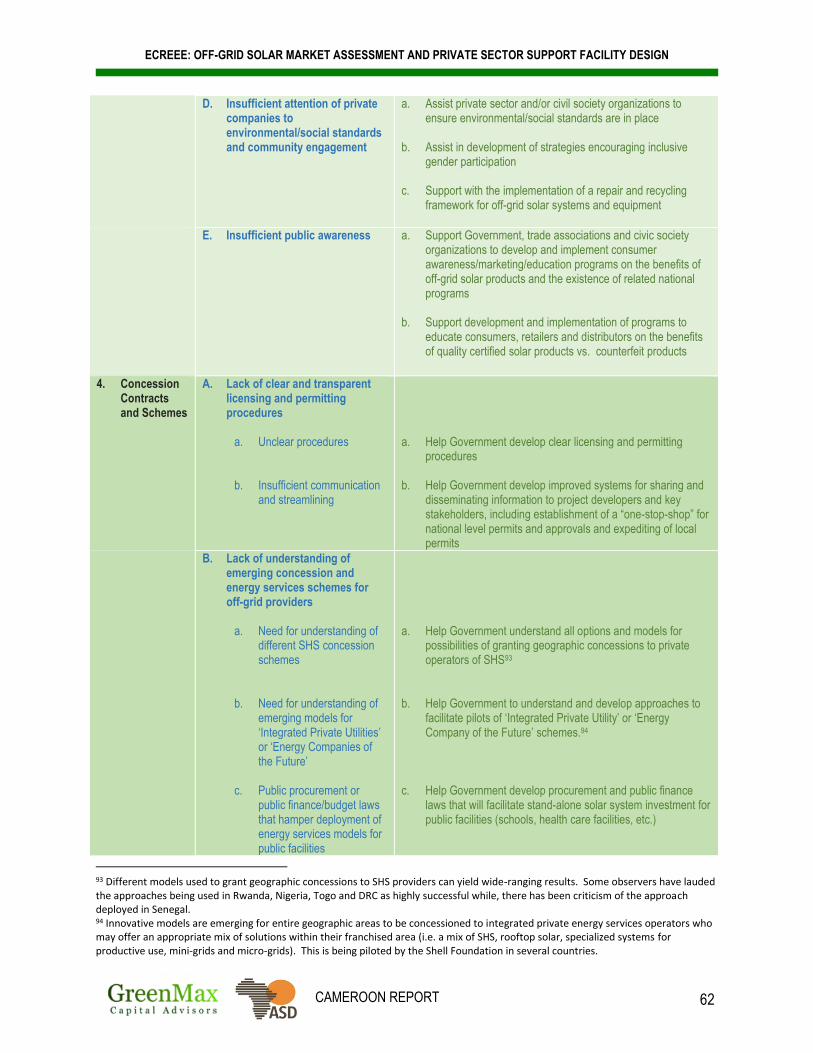
ECREEE: OFF-GRID SOLAR MARKET ASSESSMENT AND PRIVATE SECTOR SUPPORT FACILITY DESIGN
CAMEROON REPORT 62
93 Different models used to grant geographic concessions to SHS providers can yield wide-ranging results. Some observers have lauded the approaches being used in Rwanda, Nigeria, Togo and DRC as highly successful while, there has been criticism of the approach deployed in Senegal. 94 Innovative models are emerging for entire geographic areas to be concessioned to integrated private energy services operators who may offer an appropriate mix of solutions within their franchised area (i.e. a mix of SHS, rooftop solar, specialized systems for productive use, mini-grids and micro-grids). This is being piloted by the Shell Foundation in several countries.
D. Insufficient attention of private companies to environmental/social standards and community engagement
a. Assist private sector and/or civil society organizations to ensure environmental/social standards are in place
b. Assist in development of strategies encouraging inclusive gender participation
c. Support with the implementation of a repair and recycling
framework for off-grid solar systems and equipment
E. Insufficient public awareness a. Support Government, trade associations and civic society organizations to develop and implement consumer awareness/marketing/education programs on the benefits of off-grid solar products and the existence of related national programs
b. Support development and implementation of programs to educate consumers, retailers and distributors on the benefits of quality certified solar products vs. counterfeit products
4. Concession Contracts and Schemes
A. Lack of clear and transparent licensing and permitting procedures
a. Unclear procedures
b. Insufficient communication and streamlining
a. Help Government develop clear licensing and permitting
procedures
b. Help Government develop improved systems for sharing and disseminating information to project developers and key stakeholders, including establishment of a “one-stop-shop” for national level permits and approvals and expediting of local permits
B. Lack of understanding of emerging concession and energy services schemes for off-grid providers
a. Need for understanding of
different SHS concession schemes
b. Need for understanding of emerging models for ‘Integrated Private Utilities’ or ‘Energy Companies of the Future’
c. Public procurement or
public finance/budget laws that hamper deployment of energy services models for public facilities
a. Help Government understand all options and models for
possibilities of granting geographic concessions to private operators of SHS93
b. Help Government to understand and develop approaches to
facilitate pilots of ‘Integrated Private Utility’ or ‘Energy Company of the Future’ schemes.94
c. Help Government develop procurement and public finance
laws that will facilitate stand-alone solar system investment for public facilities (schools, health care facilities, etc.)

ECREEE: OFF-GRID SOLAR MARKET ASSESSMENT AND PRIVATE SECTOR SUPPORT FACILITY DESIGN
CAMEROON REPORT 63
Source: Focus Group Discussions; Stakeholder interviews; GreenMax Capital Advisors analysis
95 As the off-grid sector becomes populated by a variety of different approaches, all private operators are subject to potential stranded investments “when the grid arrives” and even SHS providers can have their assets and revenues threatened when the mini-grid arrives. 96 The term “pricing schemes” used in this context refers to pricing options offered by standalone solar system providers for SHS, productive use, rooftop solar for public facilities, solar street lighting, etc. that are new, innovative and may be difficult for stakeholders to initially well understand. Whether these are PAYG, Lease to Own, electricity sales, commodity-based pricing, time of use or block pricing, the lack of understanding can often cause stakeholders to ask Government to intervene to “protect consumers” where such regulation of the market could in fact be misguided and unwarranted. 97 The productive use segment is brand new with SHS providers, mini-grid operators and vendors specialized on a single type of SME or agricultural productive use (i.e. grain mills, water pumps, cocoa processing etc.) all grappling to arrive at attractive approaches to billing for energy services. This is an area where TA support is much needed to help all stakeholders sort out fair and practical approaches.
d. Lack of standardized
contracts for energy services provided by private system operators to public facilities
e. Insufficient protection for stranded investments
d. Help Government, trade associations or civic society
organizations develop model bilateral PPA and Energy Services Contracts for small scale IPPs and ESCOs to sell power or deliver energy services to public facilities (i.e. schools, health care facilities) or deliver solar street lighting services to municipalities
e. Help Government develop proper procedures and guidelines
to protect against stranded investments from competition among all on-grid and off-grid rural electrification approaches95
5. Business Model Regulation
A. Lack of understanding about different pricing schemes and business models offered by stand-alone solar system developers
a. Support capacity building of regulators, Government, and non-Government stakeholders about different pricing schemes96 offered by stand-alone solar system providers to improve understanding and help avoid unnecessary interventions to regulate.
b. Support regulators and off-grid enterprises to collaborate specifically on developing pricing schemes for productive use market segment97
c. Foster linkages between companies / mobile money providers
and off-grid solar companies to help roll out technology platforms and PAYG business models

ECREEE: OFF-GRID SOLAR MARKET ASSESSMENT AND PRIVATE SECTOR SUPPORT FACILITY DESIGN
CAMEROON REPORT 64
1.4 Development Initiatives
1.4.1 National Government Initiatives
The GoC hasn’t placed much emphasis on off-grid energy development to date, as most electricity sector
initiatives are geared towards grid extension and new power plant development. The Government’s master
plan for rural electrification, PDER, is currently under development / revision and is the key national
initiative to expand electricity access to the rural sector.
1.4.2 DFI and Donor Programs
Several Development Finance Institutions (DFIs) and donor agencies have been engaged in various
programs and initiatives supporting the development of the clean energy and off-grid sectors in Cameroon.
The World Bank and the AfDB are the country’s largest financing partners, focusing on providing financial
and technical support. DFI/donor programs and initiatives supporting development of the off-grid sector
are summarized in Table 6.
Table 6: DFI and Donor-Funded Off-Grid Development Programs
Project/Program Sponsor Market
Segment(s) Description
National Energy Action Plan for Poverty Reduction (PANERP)
African Development Bank
Rural electrification, Grid extension, Transmission
The African Development Bank has partnered with the GoC to strengthen and extend Cameroon’s electricity transmission and distribution networks, covering eight of the country’s ten regions.
This project stems from the PDER and the World Bank’s funded National Energy Action Plan for Poverty Reduction (PANERP).
The project aims to strengthen and extend power transmission and distribution systems to 423 new localities with almost 335,000 new customers, especially rural dwellers. 98
Access to Energy Fund
FMO Solar PV, Natural gas, Power generation
Through the Access to Energy Fund, the FMO is providing a convertible grant of around US$1 million to a 72MWp solar power plant in Cameroon.
The project is being implemented by the JCM Greenquest Solar Corporation SA (JGSC), a company wholly owned by the Canadian investment fund, JCM International Solar Development Fund.
UNDP solar kit distribution
UNDP Rural electrification
In 2018, UNDP distributed over 200 solar kits to health centers and schools in the Far-North region.99
Biomass and Small Hydro-Solutions for Productive Uses
UNIDO Rural electrification, Hydropower, Biomass
In partnership with GEF, UNIDO is currently funding the Promoting Integrated Biomass and Small Hydro Solutions for Productive Uses Project for the electrification of rural areas in West littoral. With a budget of a USD 10 million, the objective of the project is to electrify 7,000 households using solar and mini-hydropower generation.100
Electricity Transmission and Reform Project
World Bank Electricity transmission
The objective of the Electricity Transmission and Reform Project is to improve the capacity, efficiency and reliability of Cameroon’s national electricity transmission network.
98 “Project to strengthen and extend Cameroon’s electricity transmission & Distribution Network,” AfDB, (2009): https://www.afdb.org/fileadmin/uploads/afdb/Documents/Project-and-Operations/-%20Cameroon%20-%20AR%20Electricity%20Project%20-%5B1%5D.pdf 99 “Cameroon: UNDP distributes solar kits to health centers and schools in the Far-North,” Business in Cameroon, (8 March 2018): https://www.businessincameroon.com/electricity/0803-7859-cameroon-undp-distributes-solar-kits-to-health-centers-and-schools-in-the-far-north 100 “UNIDO Cameroon,” UNIDO, (2017): https://www.unido.org/who-we-are/unido-worldwide/africa/offices/cameroon
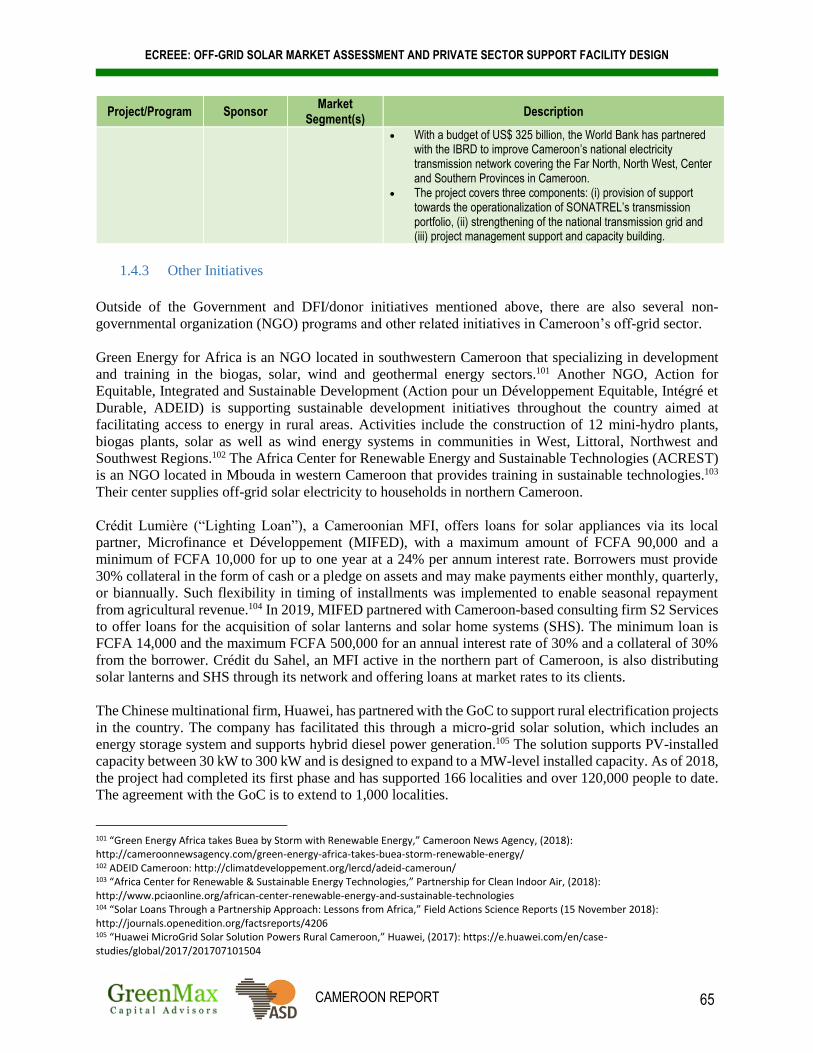
ECREEE: OFF-GRID SOLAR MARKET ASSESSMENT AND PRIVATE SECTOR SUPPORT FACILITY DESIGN
CAMEROON REPORT 65
Project/Program Sponsor Market
Segment(s) Description
With a budget of US$ 325 billion, the World Bank has partnered with the IBRD to improve Cameroon’s national electricity transmission network covering the Far North, North West, Center and Southern Provinces in Cameroon.
The project covers three components: (i) provision of support towards the operationalization of SONATREL’s transmission portfolio, (ii) strengthening of the national transmission grid and (iii) project management support and capacity building.
1.4.3 Other Initiatives
Outside of the Government and DFI/donor initiatives mentioned above, there are also several non-
governmental organization (NGO) programs and other related initiatives in Cameroon’s off-grid sector.
Green Energy for Africa is an NGO located in southwestern Cameroon that specializing in development
and training in the biogas, solar, wind and geothermal energy sectors.101 Another NGO, Action for
Equitable, Integrated and Sustainable Development (Action pour un Développement Equitable, Intégré et
Durable, ADEID) is supporting sustainable development initiatives throughout the country aimed at
facilitating access to energy in rural areas. Activities include the construction of 12 mini-hydro plants,
biogas plants, solar as well as wind energy systems in communities in West, Littoral, Northwest and
Southwest Regions.102 The Africa Center for Renewable Energy and Sustainable Technologies (ACREST)
is an NGO located in Mbouda in western Cameroon that provides training in sustainable technologies.103
Their center supplies off-grid solar electricity to households in northern Cameroon.
Crédit Lumière (“Lighting Loan”), a Cameroonian MFI, offers loans for solar appliances via its local
partner, Microfinance et Développement (MIFED), with a maximum amount of FCFA 90,000 and a
minimum of FCFA 10,000 for up to one year at a 24% per annum interest rate. Borrowers must provide
30% collateral in the form of cash or a pledge on assets and may make payments either monthly, quarterly,
or biannually. Such flexibility in timing of installments was implemented to enable seasonal repayment
from agricultural revenue.104 In 2019, MIFED partnered with Cameroon-based consulting firm S2 Services
to offer loans for the acquisition of solar lanterns and solar home systems (SHS). The minimum loan is
FCFA 14,000 and the maximum FCFA 500,000 for an annual interest rate of 30% and a collateral of 30%
from the borrower. Crédit du Sahel, an MFI active in the northern part of Cameroon, is also distributing
solar lanterns and SHS through its network and offering loans at market rates to its clients.
The Chinese multinational firm, Huawei, has partnered with the GoC to support rural electrification projects
in the country. The company has facilitated this through a micro-grid solar solution, which includes an
energy storage system and supports hybrid diesel power generation.105 The solution supports PV-installed
capacity between 30 kW to 300 kW and is designed to expand to a MW-level installed capacity. As of 2018,
the project had completed its first phase and has supported 166 localities and over 120,000 people to date.
The agreement with the GoC is to extend to 1,000 localities.
101 “Green Energy Africa takes Buea by Storm with Renewable Energy,” Cameroon News Agency, (2018): http://cameroonnewsagency.com/green-energy-africa-takes-buea-storm-renewable-energy/ 102 ADEID Cameroon: http://climatdeveloppement.org/lercd/adeid-cameroun/ 103 “Africa Center for Renewable & Sustainable Energy Technologies,” Partnership for Clean Indoor Air, (2018): http://www.pciaonline.org/african-center-renewable-energy-and-sustainable-technologies 104 “Solar Loans Through a Partnership Approach: Lessons from Africa,” Field Actions Science Reports (15 November 2018): http://journals.openedition.org/factsreports/4206 105 “Huawei MicroGrid Solar Solution Powers Rural Cameroon,” Huawei, (2017): https://e.huawei.com/en/case-studies/global/2017/201707101504
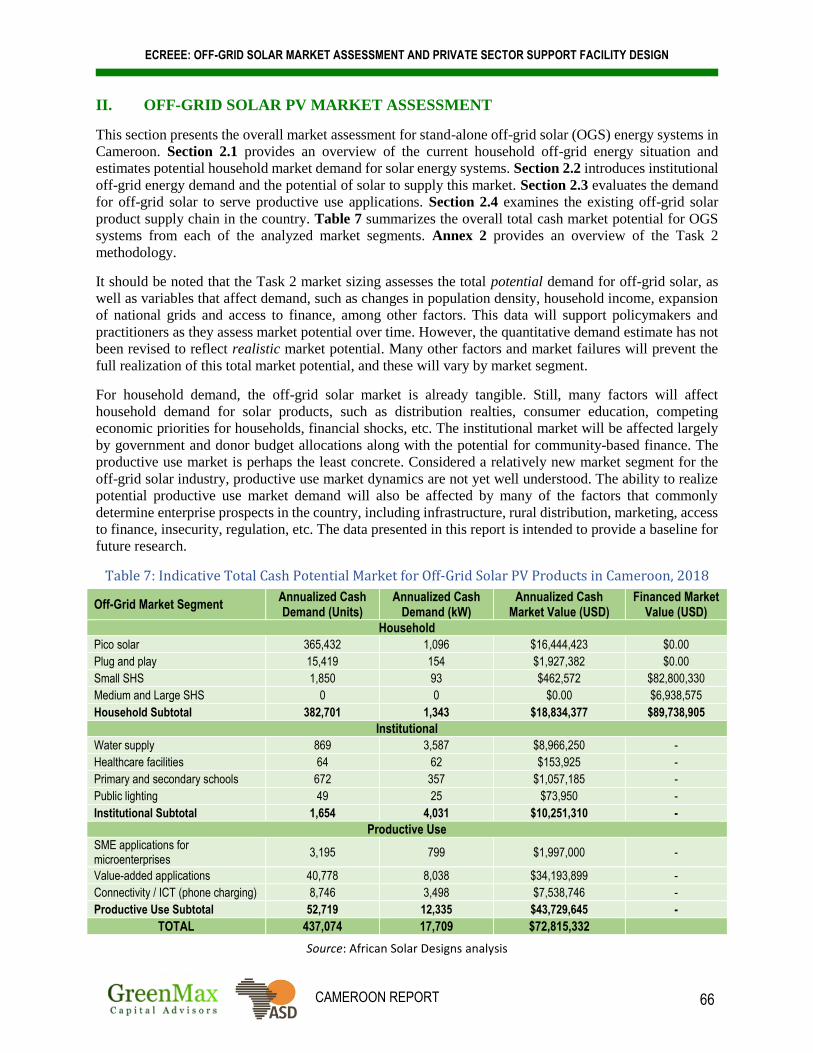
ECREEE: OFF-GRID SOLAR MARKET ASSESSMENT AND PRIVATE SECTOR SUPPORT FACILITY DESIGN
CAMEROON REPORT 66
II. OFF-GRID SOLAR PV MARKET ASSESSMENT
This section presents the overall market assessment for stand-alone off-grid solar (OGS) energy systems in
Cameroon. Section 2.1 provides an overview of the current household off-grid energy situation and
estimates potential household market demand for solar energy systems. Section 2.2 introduces institutional
off-grid energy demand and the potential of solar to supply this market. Section 2.3 evaluates the demand
for off-grid solar to serve productive use applications. Section 2.4 examines the existing off-grid solar
product supply chain in the country. Table 7 summarizes the overall total cash market potential for OGS
systems from each of the analyzed market segments. Annex 2 provides an overview of the Task 2
methodology.
It should be noted that the Task 2 market sizing assesses the total potential demand for off-grid solar, as
well as variables that affect demand, such as changes in population density, household income, expansion
of national grids and access to finance, among other factors. This data will support policymakers and
practitioners as they assess market potential over time. However, the quantitative demand estimate has not
been revised to reflect realistic market potential. Many other factors and market failures will prevent the
full realization of this total market potential, and these will vary by market segment.
For household demand, the off-grid solar market is already tangible. Still, many factors will affect
household demand for solar products, such as distribution realties, consumer education, competing
economic priorities for households, financial shocks, etc. The institutional market will be affected largely
by government and donor budget allocations along with the potential for community-based finance. The
productive use market is perhaps the least concrete. Considered a relatively new market segment for the
off-grid solar industry, productive use market dynamics are not yet well understood. The ability to realize
potential productive use market demand will also be affected by many of the factors that commonly
determine enterprise prospects in the country, including infrastructure, rural distribution, marketing, access
to finance, insecurity, regulation, etc. The data presented in this report is intended to provide a baseline for
future research.
Table 7: Indicative Total Cash Potential Market for Off-Grid Solar PV Products in Cameroon, 2018
Off-Grid Market Segment Annualized Cash Demand (Units)
Annualized Cash Demand (kW)
Annualized Cash Market Value (USD)
Financed Market Value (USD)
Household
Pico solar 365,432 1,096 $16,444,423 $0.00
Plug and play 15,419 154 $1,927,382 $0.00
Small SHS 1,850 93 $462,572 $82,800,330
Medium and Large SHS 0 0 $0.00 $6,938,575
Household Subtotal 382,701 1,343 $18,834,377 $89,738,905
Institutional
Water supply 869 3,587 $8,966,250 -
Healthcare facilities 64 62 $153,925 -
Primary and secondary schools 672 357 $1,057,185 -
Public lighting 49 25 $73,950 -
Institutional Subtotal 1,654 4,031 $10,251,310 -
Productive Use SME applications for microenterprises
3,195 799 $1,997,000 -
Value-added applications 40,778 8,038 $34,193,899 -
Connectivity / ICT (phone charging) 8,746 3,498 $7,538,746 -
Productive Use Subtotal 52,719 12,335 $43,729,645 -
TOTAL 437,074 17,709 $72,815,332
Source: African Solar Designs analysis

ECREEE: OFF-GRID SOLAR MARKET ASSESSMENT AND PRIVATE SECTOR SUPPORT FACILITY DESIGN
CAMEROON REPORT 67
2.1 Demand – Households
This section analyzes the main characteristics of the household (HH) OGS demand in Cameroon. Section
2.1.1 provides an overview of the household market segment, including its geographic components. Section
2.1.2 analyzes current household ability and willingness to pay for electricity services to estimate the total
potential household sector demand. From this data, the potential household market for off-grid solar
products is then calculated for both cash purchases (Section 2.1.3) and financed (2.1.4) purchases. Section
2.1.5 assesses consumer perceptions, interest, and awareness on OGS.
2.1.1 Overview of Household Market Segment
According to the International Energy Agency (IEA), in 2016 there were 1.7 million households (8.9
million people) in Cameroon without access to electricity.106 In that year, an estimated 63% of the
population had access to electricity, with the rate of access at 94% in urban areas and 21% in rural areas.
Over time, Cameroon’s off-grid population is expected to fall dramatically, to just 136,854 households in
2030 because of planned grid extension, particularly in the north of the country.
This section gives an introduction to household consumer market segments, their characteristics and size
(Table 8). It then discusses household sources of income and geographic distribution of off-grid
households, both presently and projected over time. This provides context for the next section, 2.1.2, which
sizes household segment potential market demand through a series of detailed analyses.
106 See Annex 2 for more details.
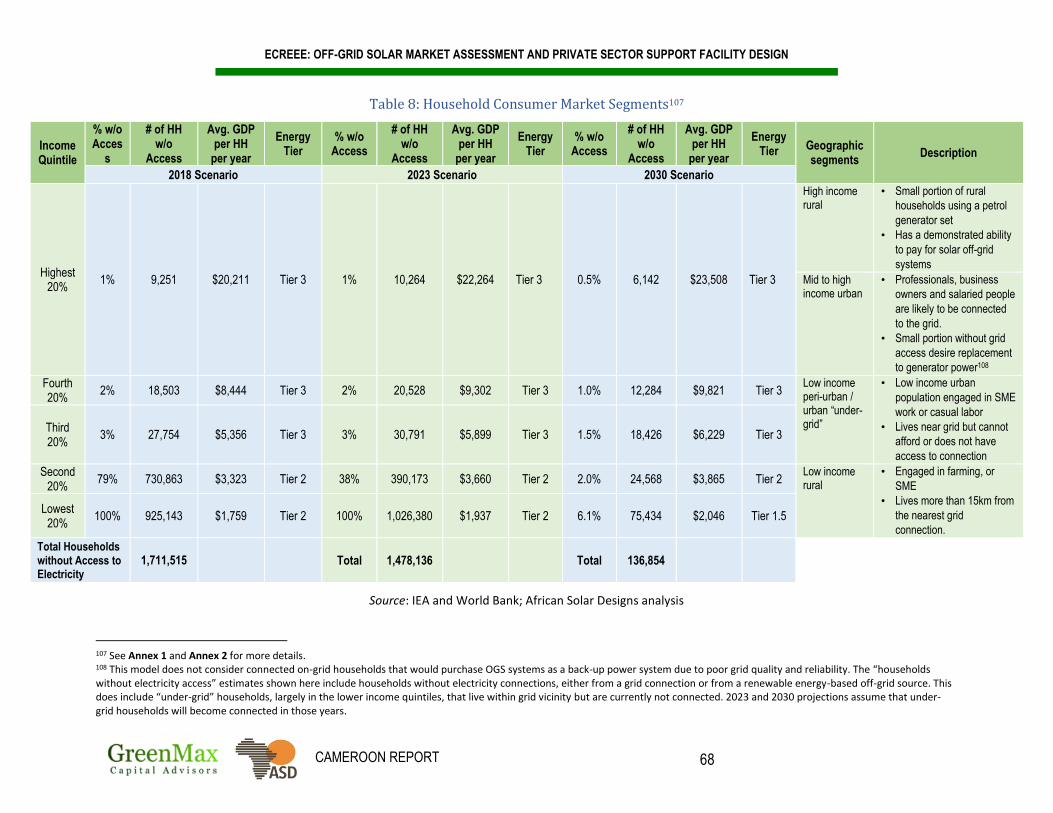
ECREEE: OFF-GRID SOLAR MARKET ASSESSMENT AND PRIVATE SECTOR SUPPORT FACILITY DESIGN
CAMEROON REPORT 68
Table 8: Household Consumer Market Segments107
Income Quintile
% w/o Acces
s
# of HH w/o
Access
Avg. GDP per HH
per year
Energy Tier
% w/o Access
# of HH w/o
Access
Avg. GDP per HH
per year
Energy Tier
% w/o Access
# of HH w/o
Access
Avg. GDP per HH
per year
Energy Tier Geographic
segments Description
2018 Scenario 2023 Scenario 2030 Scenario
Highest 20%
1% 9,251 $20,211 Tier 3 1% 10,264 $22,264 Tier 3 0.5% 6,142 $23,508 Tier 3
High income rural
• Small portion of rural
households using a petrol
generator set
• Has a demonstrated ability
to pay for solar off-grid
systems
Mid to high income urban
• Professionals, business
owners and salaried people
are likely to be connected
to the grid.
• Small portion without grid
access desire replacement
to generator power108
Fourth 20%
2% 18,503 $8,444 Tier 3 2% 20,528 $9,302 Tier 3 1.0% 12,284 $9,821 Tier 3 Low income peri-urban / urban “under-grid”
• Low income urban
population engaged in SME
work or casual labor
• Lives near grid but cannot
afford or does not have
access to connection
Third 20%
3% 27,754 $5,356 Tier 3 3% 30,791 $5,899 Tier 3 1.5% 18,426 $6,229 Tier 3
Second 20%
79% 730,863 $3,323 Tier 2 38% 390,173 $3,660 Tier 2 2.0% 24,568 $3,865 Tier 2 Low income rural
• Engaged in farming, or
SME
• Lives more than 15km from
the nearest grid
connection.
Lowest 20%
100% 925,143 $1,759 Tier 2 100% 1,026,380 $1,937 Tier 2 6.1% 75,434 $2,046 Tier 1.5
Total Households without Access to Electricity
1,711,515
Total 1,478,136 Total 136,854
Source: IEA and World Bank; African Solar Designs analysis
107 See Annex 1 and Annex 2 for more details. 108 This model does not consider connected on-grid households that would purchase OGS systems as a back-up power system due to poor grid quality and reliability. The “households without electricity access” estimates shown here include households without electricity connections, either from a grid connection or from a renewable energy-based off-grid source. This does include “under-grid” households, largely in the lower income quintiles, that live within grid vicinity but are currently not connected. 2023 and 2030 projections assume that under-grid households will become connected in those years.

ECREEE: OFF-GRID SOLAR MARKET ASSESSMENT AND PRIVATE SECTOR SUPPORT FACILITY DESIGN
CAMEROON REPORT 69
Off-grid household characteristics
Cameroon has a lower incidence of poverty than some of its neighboring countries, as shown in Table 9.
For example, 45% of the population in Nigeria lives below $1.90 a day, compared to just 24% in Cameroon.
Poverty in Cameroon is increasingly concentrated in the North and Extreme North regions, where the
majority of the country’s poor now live.109
Table 9: Poverty Headcount in Cameroon, 2014
Poverty headcount ratio % of population
Lives at or below $1.90 a day* 23.8%
Lives at or below $3.20 a day* 44.8%
Lives at or below $5.50 a day* 69.0%
*2011 PPP
Source: World Bank
As shown in Table 9, the largest household market segments for off-grid solar products in the country are
low income rural households. In rural Cameroon, household incomes are irregular and seasonal,
characterized by the main agricultural activity of different zones. Agriculture employs over half of the
country’s population, including the vast majority of rural households, most of whom are engaged in
smallholder farming. The International Fund for Agriculture and Development (IFAD) estimates there are
2 million small family farms in Cameroon.110 Important crops include coffee, cotton, cocoa and maize, as
well as timber.
Geographic Components of the Solar Market
To analyze the potential OGS market over time, GIS maps were prepared from demographic information
to present potential market areas for OGS. GIS calculations consider drivers of off-grid household market
change including grid extension around current urban and peri-urban centers, mini-grid development for
more densely populated rural areas, and population growth. Sources of information for the maps presented
below (Figures 13-16) can be found in Annex 1.
Currently, the largest number of off-grid households are found in the Extreme North region, where the
incidence of poverty is also quite high. However, there is an extensive plan for grid extension in the Extreme
North region (Figure 1). This could change the off-grid household distribution in the country significantly
by 2030. More research is needed to understand if the many small villages that can be seen on satellite
imagery in that region can be effectively reached by the national grid.
GIS maps shown below are for 2018-2023 and 2030. Data shown for 2018-2023 includes information on
existing grid lines only. The data of planned “future lines” is not broken down in enough detail to show in
which year future lines will be built, so an assumption was made that all future lines would be
built after 2023 but prior to 2030. As shown in the maps and chart summaries below (Figures 13-16), the
total size of the OGS market will decrease over time, while also becoming more concentrated in some
regions, particularly in the East. This has implications for solar product market long-term business models,
which will need to consider broader distribution areas as the total number of off-grid households declines.
Maintaining profitable distribution networks will be a particular challenge in Cameroon over time, where
the total number of off-grid households is expected to be just 137,000 across the country by 2030.
109 See World Bank poverty data <https://www.worldbank.org/en/country/cameroon/overview> 110 See IFAD project data < https://www.ifad.org/web/operations/country/id/cameroon>

ECREEE: OFF-GRID SOLAR MARKET ASSESSMENT AND PRIVATE SECTOR SUPPORT FACILITY DESIGN
CAMEROON REPORT 70
Figure 13: Distribution of Potential Off-Grid Households by Region, 2023111
Source: Energio Verda Africa GIS analysis
111 See Annex 1 for more details, including data sources.
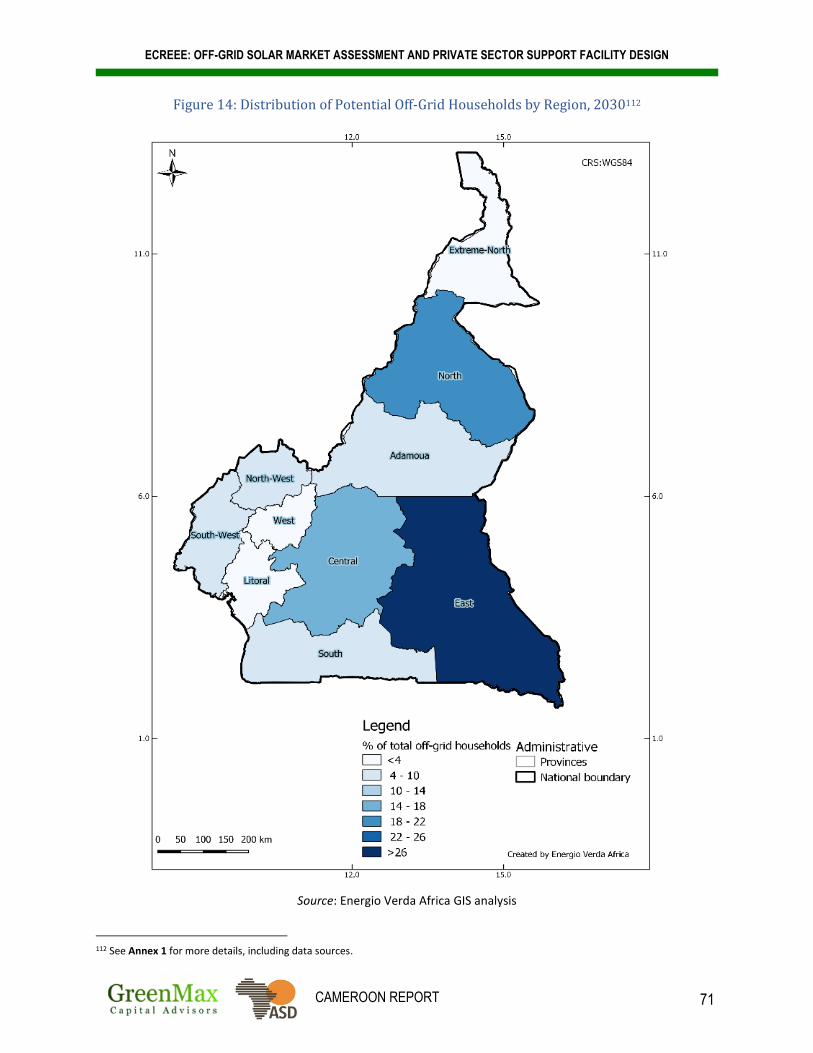
ECREEE: OFF-GRID SOLAR MARKET ASSESSMENT AND PRIVATE SECTOR SUPPORT FACILITY DESIGN
CAMEROON REPORT 71
Figure 14: Distribution of Potential Off-Grid Households by Region, 2030112
Source: Energio Verda Africa GIS analysis
112 See Annex 1 for more details, including data sources.

ECREEE: OFF-GRID SOLAR MARKET ASSESSMENT AND PRIVATE SECTOR SUPPORT FACILITY DESIGN
CAMEROON REPORT 72
Figure 15: Estimated Number of Off-Grid Households by Region, 2023 and 2030
Source: Energio Verda Africa GIS analysis
Figure 16: Estimated Percentage of Off-Grid Households by Region, 2023 and 2030
Source: Energio Verda Africa GIS analysis

ECREEE: OFF-GRID SOLAR MARKET ASSESSMENT AND PRIVATE SECTOR SUPPORT FACILITY DESIGN
CAMEROON REPORT 73
2.1.2 Analysis of Household Market Segment Demand
In order to calculate total potential household demand for off-grid solar products for the national market,
this section examines several indicators:
• Household usage and costs of typical rural energy fuels and devices (non-solar)
• How these rural energy technologies align with typical access to “energy tiers”
• Cost of off-grid solar products alternatives, by energy tier
• Household uptake of solar products thus far
• Potential household demand based on household income quintiles
From this data, the potential household market for off-grid solar products is then calculated for both cash
purchases and financed purchases.
Consumption and expenditures on typical rural energy fuels and devices (non-solar)
According to feedback from focus group discussion (FGD) participants, many households in Cameroon
still use kerosene for lighting, firewood for cooking, wood and coal from the forests and mangroves.
According to feedback from focus group discussion (FGD) participants, in rural areas, households may
purchase 1 liter of oil per week, which equates to about CFA 2,000 (USD 5) per month including the
purchase of kerosene and transportation for this purchase. In some regions, the amounts can go up to CFA
15,000 (USD 25) or even 20,000 (USD 33) for the purchase of oil.
Table 10 shows the typical monthly cost of using common rural energy technologies. Household use of
different types and amounts of energy technologies is associated with different energy access tiers, as
defined in the Multi-Tier Energy Access Framework. For example, a household using one battery powered
lantern and one charged cell phone would fall under the Tier 1 level of energy access. A household using
two lanterns, one cell phone and a radio would be in Tier 1.5.
These tiers are defined in Table 11. Establishing an average monthly household expenditure for each energy
tier using common rural technologies shows how household income level aligns with energy tiers.
Secondly, it provides a basis to compare these costs to solar products that can offer an equivalent level of
service by energy tier. This in turn reveals potential household savings by switching to solar products, as
shown in Figure 17 and Table 12.
It should be emphasized that even where households can be categorized into energy tiers by their income,
few households actually pay full typical monthly costs because they do not have the available income. In
reality, household income is highly variable throughout the year, and they simply do without service for
portions of the month and year when cash is not available. This accounts for the difference between “typical
monthly costs” (which are real) and “equivalent service costs” (which would be required to maintain the
tier-level service). For example, very few households could actually run generators for the number of hours
that would enable full tier 3 level services.

ECREEE: OFF-GRID SOLAR MARKET ASSESSMENT AND PRIVATE SECTOR SUPPORT FACILITY DESIGN
CAMEROON REPORT 74
Table 10: Rural Energy Technology and Costs113in
Source: African Solar Designs analysis
113 Data from FGDs, field surveys and various published data sources
Technology Description Average
Life (Years)
# of Units/ Month
Unit Operating
Cost (USD)
Unit Capital Cost (USD)
Typical Monthly
Cost (USD)
Unit Capital Cost (USD)
Typical Monthly
Cost (USD)
Unit Capital Cost (USD)
Typical Monthly
Cost (USD)
2018 Scenario 2023 Scenario 2030 Scenario Torch lights/Electric Lanterns
Torch lights/electric lanterns powered by D-type, AA-type or AAA-type batteries
0.5 16 $0.16 $2.00 $2.56 $2.12 $2.72 $2.44 $3.12
Cell Phone Charging
Done at a charging station - 8 $0.17 $0.00 $1.68 $0.00 $1.44 $0.00 $1.66
Smart Phone Charging
Done at a charging station - 16 $0.17 $0.00 $3.36 $0.00 $2.89 $0.00 $3.32
Battery-powered DC Radio
Radio powered by dry cells replaced two times per month
- 8 $0.16 $0.00 $1.28 $0.00 $1.36 $0.00 $1.56
Small Petrol Generator
The most popular rural generator for basic use is 0.9kW generator (for phone charging, lighting, TV, fan and music system)
2 30 $1.09 $50.00 $4.00 $106.10 $34.70 $121.90 $39.86

ECREEE: OFF-GRID SOLAR MARKET ASSESSMENT AND PRIVATE SECTOR SUPPORT FACILITY DESIGN
CAMEROON REPORT 75
Table 11: Typical Tier-Based Energy Costs
Device category and indicative energy supplied
Appliances and level of service Non-solar devices used to power tier requirement
Typical Monthly Cost (USD) 2018
Typical Monthly Cost (USD) 2023
Typical Monthly Cost (USD) 2030
Tier 0 No electricity
• Characterized by complete lack of electricity services
• Many cash-poor consumers are in this situation part of each month when they don’t have money to buy dry cells or charge phones
• Rely solely on kerosene, wood and other fuel sources for cooking and lighting
• Subsistence level of energy
• Absolute energy poverty
• Subsistence level of energy
• Absolute energy poverty
• Subsistence level of energy
• Absolute energy poverty
Tier 1 Range: 1 to 20 Wh/day
• Access to one torch powered by dry cell batteries
• One cell phone powered by charging service
• One battery-powered light requires dry cell replacement on weekly basis
• One cell phone charged 8 times per month
$3.92 $4.16 $4.78
Tier 1.5 Range: 20 to 100 Wh/day
• Access to one torch and one lantern each powered by dry cells
• One cell phone powered by charging service
• Radio powered by dry cells
• Two battery-powered light points require dry cell replacement on weekly basis
• One cell phone charged 8 times per month
• Radio dry cells replaced two times per month
$7.76 $8.23 $9.46
Tier 2 Range: 55 to 500 Wh/day
• One torch and two lanterns powered by dry cells
• One cell phone and one smart phone powered by charge service
• Radio • DC TV
• Three battery light points require dry cell replacement on weekly basis
• One cell phone charged 8 times per month and one smart phone charged 16 times per month
• TV/Radio powered by lead acid battery recharged once per week
$14.32 $15.2 $17.46
Tier 3 Range: 500 to 2500 Wh/day
• Five lighting points • Multiple cell/smart phones • AC radio and music system • AC TV
• Generator powers a set of appliances
$32.70 $34.70 $39.86
Source: African Solar Designs analysis

ECREEE: OFF-GRID SOLAR MARKET ASSESSMENT AND PRIVATE SECTOR SUPPORT FACILITY DESIGN
CAMEROON REPORT 76
Per Table 11, it can be seen that, given the purchase price of dry cells and the cost of phone charging, the
“ideal” electricity availability is extremely difficult to sustain. This is especially true where there is a high
incidence of poverty in rural areas and lack of regular incomes. In reality, households often must reduce
their energy consumption when cash is not available. This means that even a Tier 2 level family might drop
to Tier 1 for a week each month when cash is not available to pay for phone charging or dry cell purchase.
Household Solar PV System Types
Solar PV systems can provide lower cost and higher levels of service than existing dry cell, phone charging
and generator options. In order to model how solar systems can meet existing energy use categories, levels
of service and ability to pay, four types of household solar systems are configured to match the tier-based
demands of off-grid communities. The system descriptions, energy outputs, prices, tier ratings and target
consumer groups are listed in Figure 17.

ECREEE: OFF-GRID SOLAR MARKET ASSESSMENT AND PRIVATE SECTOR SUPPORT FACILITY DESIGN
CAMEROON REPORT 77
Figure 17: Household PV System Descriptions and Market Segments
Source: African Solar Designs analysis

ECREEE: OFF-GRID SOLAR MARKET ASSESSMENT AND PRIVATE SECTOR SUPPORT FACILITY DESIGN
CAMEROON REPORT 78
Current usage and procurement process for household solar products
FGD feedback indicates that in many areas that do not have access to the grid, solar equipment is used as
an alternative. For example, in the framework of the project to electrify 1000 localities executed by Huawei
in partnership with the Government of Cameroon, 166 localities have already benefited from it. And the
localities are those that are not planned to be connected to the national network.
Demand for solar includes households near to the grid. According to FGD feedback: Even in rural areas
connected to the network, people need solar power. People in some areas want to use solar because the
normal network does not allow them to have light permanently. However, the high cost of solar still
prevents many households from procuring systems.
Potential household demand for off-grid solar products
Looking beyond current use of off-grid solar products by households, this study analyzes potential for OGS
market development by estimating potential household demand based on household income. Household
income shown in Table 12 is sourced from World Bank demographic data based on household surveys,
which reports income by population quintiles. From household income, potential for energy spending is
estimated as 10% of monthly income (see methodology annex). Future scenarios project higher energy
budgets as household incomes rise with economic development over time. In all scenarios, the large
majority of off-grid households will fall under the lowest and second lowest income quintiles.
Table 12: Energy Expenditure of Different Income Groups
Population Income Quintiles Per Capita Income (USD per month)
Household Income (USD per month)
Energy as % of Income
Monthly Energy Budget (USD)
2018 Scenario
Lowest Quintile of Population $28.19 $146.59 10% $14.66
2nd Quintile of Population $53.25 $276.90 10% $27.69
3rd Quintile of Population $85.83 $446.30 10% $44.63
4th Quintile of Population $135.32 $703.65 10% $70.37
Highest Quintile of Population $323.89 $1,684.21 10% $168.42
2023 Scenario
Lowest Quintile of Population $31.06 $161.49 10% $16.15
2nd Quintile of Population $58.66 $305.03 10% $30.50
3rd Quintile of Population $94.55 $491.64 10% $49.16
4th Quintile of Population $149.07 $775.15 10% $77.51
Highest Quintile of Population $356.79 $1,855.33 10% $185.53
2030 Scenario
Lowest Quintile of Population $32.79 $170.51 10% $17.05
2nd Quintile of Population $61.94 $322.08 10% $32.21
3rd Quintile of Population $99.83 $519.11 10% $51.91
4th Quintile of Population $157.40 $818.46 10% $81.85
Highest Quintile of Population $376.73 $1,958.99 10% $195.90
Source: African Solar Designs analysis
Figure 18 summarizes the preceding data in this section by comparing household energy spending with
typical rural energy costs and their solar equivalents. This analysis presents annualized costs (not including
financing cost) of current energy technologies for each energy tier, compared with the annual cost of an
equivalent solar product. Both the annual costs of current energy technologies and equivalent solar
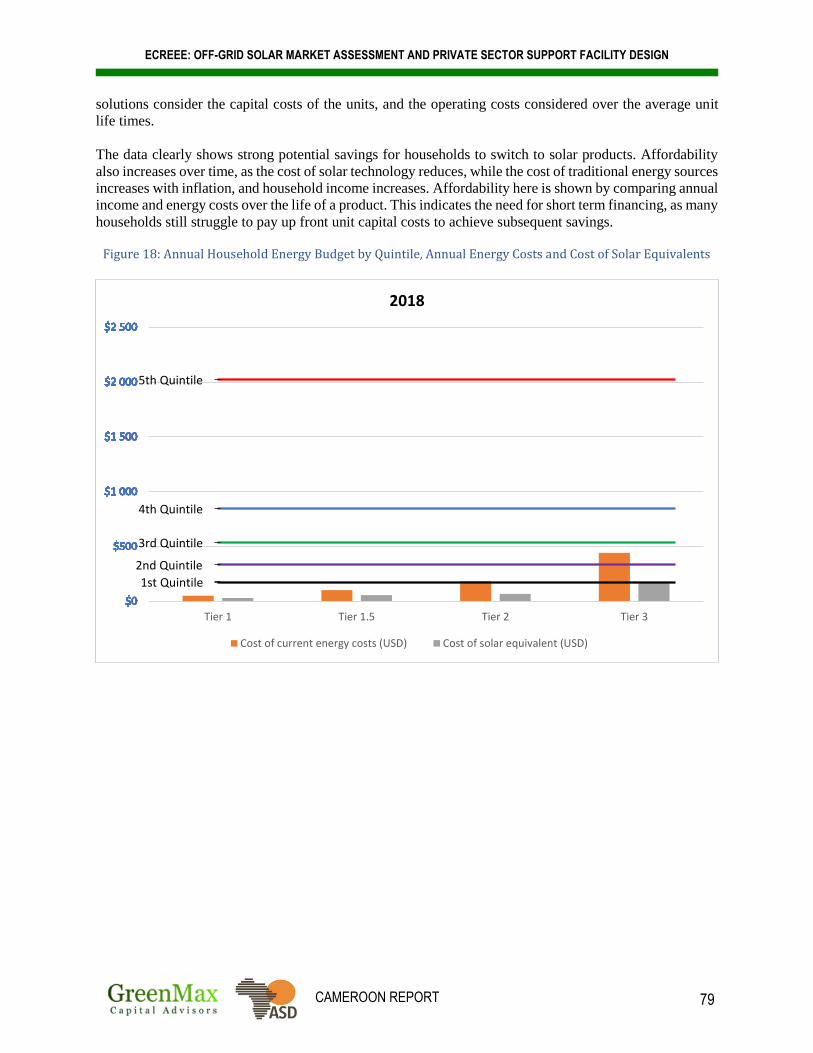
ECREEE: OFF-GRID SOLAR MARKET ASSESSMENT AND PRIVATE SECTOR SUPPORT FACILITY DESIGN
CAMEROON REPORT 79
solutions consider the capital costs of the units, and the operating costs considered over the average unit
life times.
The data clearly shows strong potential savings for households to switch to solar products. Affordability
also increases over time, as the cost of solar technology reduces, while the cost of traditional energy sources
increases with inflation, and household income increases. Affordability here is shown by comparing annual
income and energy costs over the life of a product. This indicates the need for short term financing, as many
households still struggle to pay up front unit capital costs to achieve subsequent savings.
Figure 18: Annual Household Energy Budget by Quintile, Annual Energy Costs and Cost of Solar Equivalents
1st Quintile
2nd Quintile
3rd Quintile
4th Quintile
5th Quintile
Tier 1 Tier 1.5 Tier 2 Tier 3
2018
Cost of current energy costs (USD) Cost of solar equivalent (USD)

ECREEE: OFF-GRID SOLAR MARKET ASSESSMENT AND PRIVATE SECTOR SUPPORT FACILITY DESIGN
CAMEROON REPORT 80
Source: African Solar Designs analysis
1st Quintile
2nd Quintile
3rd Quintile
4th Quintile
5th Quintile
Tier 1 Tier 1.5 Tier 2 Tier 3
2023
Cost of current energy costs (USD) Cost of solar equivalent (USD)
1st Quintile
2nd Quintile
3rd Quintile
4th Quintile
5th Quintile
Tier 1 Tier 1.5 Tier 2 Tier 3
2030
Cost of current energy costs (USD) Cost of solar equivalent (USD)

ECREEE: OFF-GRID SOLAR MARKET ASSESSMENT AND PRIVATE SECTOR SUPPORT FACILITY DESIGN
CAMEROON REPORT 81
2.1.3 The Market for Household Devices without Consumer Finance
This section analyzes the cash market for various income levels and the corresponding energy services
powered by OGS systems they can afford. Modelling of the viable market was based on income quintiles
associated with data from the World Bank. The calculations and assumptions made are presented in Table
12. It was assumed that for a cash purchase a household is willing to save three months of their current
energy expenditure to purchase the OGS system.
Based on the income quintiles and corresponding estimated current energy expenditure, in the 2018
scenario, only households without access in the higher income quintiles – 3, 4 and 5 – can afford a solar
home system unfinanced. This represents a very small number of off-grid households. Households in the
lowest quintile cannot afford even pico solar products. Affordability increases significantly over time.
However, the need for financing solutions for the lower income quintiles is clear. The vast majority of the
market without access is represented by the two lowest income quintiles.
The model assumes that each household purchases only one system. It also does not consider on-grid
households that would purchase OGS systems as a back-up power system due to poor grid quality and
reliability. This market has become a key segment of the more mature OGS markets (e.g. in East Africa),
but is not the focus of this study, which is based on sizing the current markets in West Africa, alongside a
least cost analysis for future access to energy that prioritizes reliable grid connections where possible.

ECREEE: OFF-GRID SOLAR MARKET ASSESSMENT AND PRIVATE SECTOR SUPPORT FACILITY DESIGN
CAMEROON REPORT 82
Figure 19: Estimated Number of Households Able to Afford Cash Purchase of OGS Systems by Income Group
Source: African Solar Designs analysis
-
200 000
400 000
600 000
800 000
1 000 000
1 200 000
1 400 000
1 600 000
Pico Solar Basic Plugand Play
Small HHsolar system
Medium HHsolar system
Pico Solar Basic Plugand Play
Small HHsolar system
Medium HHsolar system
Pico Solar Basic Plugand Play
Small HHsolar system
Medium HHsolar system
2018 2023 2030
5th Quintile
4th Quintile
3rd Quintile
2nd Quintile
1st Quintile

ECREEE: OFF-GRID SOLAR MARKET ASSESSMENT AND PRIVATE SECTOR SUPPORT FACILITY DESIGN
CAMEROON REPORT 83
Table 13 presents the estimated annualized cash market potential for off-grid solar product sales in the
country’s household sector.
Table 13: Estimated Cash Market Potential for Household Sector
Solar System Annualized Demand
(Units) Annualized Demand
(kW) Annualized Market
Value (USD)
2018 Scenario
Pico Solar 365,432 1,096 $16,444,423
Basic Plug and Play 15,419 154 $1,927,382
Small HH solar system 1,850 93 $462,572
Medium HH solar system 0 0 $0.00
Total 382,701 1,343 $18,834,377
2023 Scenario
Pico Solar 708,277 2,125 $31,484,673
Basic Plug and Play 10,264 103 $967,604
Small HH solar system 4,106 205 $774,083
Medium HH solar system 2,053 513 $967,604
Total 724,700 2,946 $34,193,964
2030 Scenario
Pico Solar 0 0 $0.00
Basic Plug and Play 33,334 333 $1,627,034
Small HH solar system 3,685 184 $359,748
Medium HH solar system 3,685 921 $899,370
Total 40,704 1,438 $2,886,152
Source: African Solar Designs analysis
The following considerations should also be taken into account when analyzing this data:
The most common type of systems which the market can afford on a cash basis are pico and small plug
and play systems. Based on available income figures Tier 2 and Tier 3 solutions are less viable for the
vast majority of the population in the near term. However, this picture changes significantly with the
introduction of finance, and as incomes increase over time.
The model does not adequately address highest quintile and actual sales in the market. Note that the
analysis does not predict purchases of Tier 3 equipment and it does not reflect what is happening at the
extreme high end of the market. Because the analysis divides the population into relatively wide
quintiles, it does not adequately address the very small portion of apex rural (and peri-urban) customers
that now use generators.
ECREEE: OFF-GRID SOLAR MARKET ASSESSMENT AND PRIVATE SECTOR SUPPORT FACILITY DESIGN
CAMEROON REPORT 84
2.1.4 The Financed Market for Off-Grid Solutions
Financial Model
In order to portray the effects of finance, a simple model was prepared that provides OGS system finance
with a 24% p.a. interest rate114 and a 24-month term. The financial model assumes that the households
would be willing to save for three months of their current energy expenditure to cover a small upfront
deposit of 10% of the system and their current energy expenditure would be used to pay the monthly
installments.
This model assumes that each household will purchase the system that offers the highest energy serve level
they can afford. As with the cash market model, it assumes that each household purchases one unit each.
However, this finance model greatly over-estimates the potential market for credit as both MFIs and PAYG
companies would likely be extremely cautious in approving customers. Without concrete data on the loans
given to consumers in each income quintile in the country, it is difficult to estimate what the more realistic
figures are. Nevertheless, this model does give a clear indication that long loan tenors combined with a low
upfront payment would result in significant market transformation. The results of this analysis are presented
below.
114 Ferrari, A., Masetti, O., Ren, J., “Interest Rate Caps: The Theory and the Practice,” World Bank Policy Research Working Paper, (April 2018): http://documents.worldbank.org/curated/en/244551522770775674/pdf/WPS8398.pdf
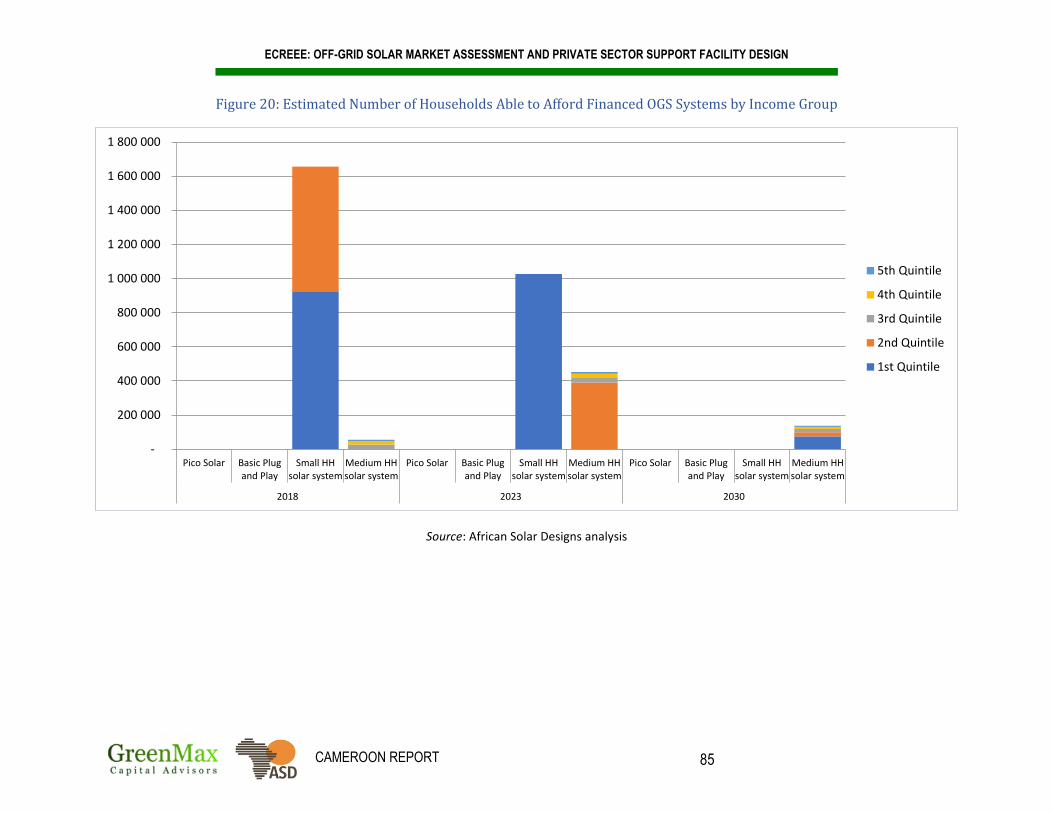
ECREEE: OFF-GRID SOLAR MARKET ASSESSMENT AND PRIVATE SECTOR SUPPORT FACILITY DESIGN
CAMEROON REPORT 85
Figure 20: Estimated Number of Households Able to Afford Financed OGS Systems by Income Group
Source: African Solar Designs analysis
-
200 000
400 000
600 000
800 000
1 000 000
1 200 000
1 400 000
1 600 000
1 800 000
Pico Solar Basic Plugand Play
Small HHsolar system
Medium HHsolar system
Pico Solar Basic Plugand Play
Small HHsolar system
Medium HHsolar system
Pico Solar Basic Plugand Play
Small HHsolar system
Medium HHsolar system
2018 2023 2030
5th Quintile
4th Quintile
3rd Quintile
2nd Quintile
1st Quintile

ECREEE: OFF-GRID SOLAR MARKET ASSESSMENT AND PRIVATE SECTOR SUPPORT FACILITY DESIGN
CAMEROON REPORT 86
Figure 21: Estimated Off-Grid Solar Cash and Financed Market Potential for Household Sector by System Type
Source: African Solar Designs analysis
$0
$10 000 000
$20 000 000
$30 000 000
$40 000 000
$50 000 000
$60 000 000
$70 000 000
$80 000 000
$90 000 000
$100 000 000
2018 PotentialCash Purchase
Market
2018 PotentialFinancedMarket
2023 PotentialCash Purchase
Market
2023 PotentialFinancedMarket
2030 PotentialCash Purchase
Market
2030 PotentialFinancedMarket
Medium HH solar system
Small HH solar system
Basic Plug and Play
Pico Solar

ECREEE: OFF-GRID SOLAR MARKET ASSESSMENT AND PRIVATE SECTOR SUPPORT FACILITY DESIGN
CAMEROON REPORT 87
In 2018, without financing, only 786,372 households (45.9% of households without access) in the country
could afford an OGS system. However, with financing, 1,711,515 households (100% of households without
access) could afford an OGS system as the 925,143 households without access in the lowest income quintile
are enabled to acquire at least one OGS system. Consequently, the annualized potential market size
increases from USD 18,834,377 to USD 89,738,905 mainly due to the fact that the households are enabled
to purchase larger systems (Figure 21).
The least-cost electrification 2023 scenario calculates that 1,478,136 households could be electrified by
stand-alone systems. Under this scenario, all the households without access have the ability to acquire at
least one OGS system, however, financing enables them to acquire the larger systems. The annualized
potential market size increases from USD 34,193,963 to USD 81,292,687 (Figure 21).
The least-cost electrification 2030 scenario calculates that the total number of households that could be
electrified by stand-alone systems would drop further to 136,854. Under this scenario as well, all the
households without access have the ability to acquire at least one OGS system, however, financing enables
them to acquire the larger systems. The annualized potential market size therefore increases from USD
2,886,152 to USD 6,679,843 (Figure 21).
Table 14 presents the estimated annualized financed market potential for off-grid solar product sales in the
country’s household sector.
Table 14: Estimated Financed Market Potential for Household Sector
Solar System Annualized Demand
(Units) Annualized Demand
(kW) Annualized Market
Value (USD)
2018 Scenario
Pico Solar 0 0 $0.00
Basic Plug and Play 0 0 $0.00
Small HH solar system 331,201 16,560 $82,800,330
Medium HH solar system 11,102 2,775 $6,938,575
Total 342,303 19,335 $89,738,905
2023 Scenario
Pico Solar 0 0 $0.00
Basic Plug and Play 0 0 $0.00
Small HH solar system 205,276 10,264 $38,704,145
Medium HH solar system 90,351 22,588 $42,588,542
Total 295,627 32,852 $81,292,687
2030 Scenario
Pico Solar 0 0 $0.00
Basic Plug and Play 0 0 $0.00
Small HH solar system 0 0 $0.00
Medium HH solar system 27,371 6,843 $6,679,843
Total 27,371 6,843 $6,679,843
Source: African Solar Designs analysis

ECREEE: OFF-GRID SOLAR MARKET ASSESSMENT AND PRIVATE SECTOR SUPPORT FACILITY DESIGN
CAMEROON REPORT 88
2.1.5 Consumer Perceptions, Interest and Awareness
Purchasers of solar are “early adopters” who tend to buy from system integrators as well as
hardware traders
• Retail purchasers: Most purchases are made over-the-counter sales in capital and major cities as
cash purchases. As with the consumer migration from kerosene to electric lights, there is a gradual
migration from low cost dry-cell electric lamps to solar PV systems. Consumers make purchases
in the same shops, and sellers are adapting to changes in demand by offering solar equipment.
• High-end consumers: As elaborated in Section 2.4, a small number of early adopting consumers
buy from specialized solar integrators who offer quality services and components. A large portion
of buyers in this segment opt for systems above 200Wp for residential and small business demand.
• PAYG: As the PAYG market segment is still in its nascent stages, detailed data of PAYG
customers is still largely unavailable, although recent experience from East Africa suggests that
these customers include both rural and peri-urban inhabitants. The PAYG business model / method
is still not widely understood; moreover, there are still questions about how to account for the
seasonality of incomes as opposed to regular monthly payment plans.
Consumers have a general awareness that solar can economically replace generators and
batteries, but they are still largely uninformed about solar electric specifics
• While knowledge is gradually improving (particularly for small/pico solar lighting systems) most
consumers are not yet educated enough to make informed decisions about solar systems.
• There are often geographic disparities in awareness levels of OGS products, as households in urban
or peri-urban areas tend to have better understanding of solar vis-à-vis rural villages.115
• Consumers are hearing “general messages” (i.e. “solar is good,” “solar can be cheap,” “solar can
be more economical”). These messages need to be translated into more specific understanding of
the technology (i.e. what are the options, what products are better than others, where to buy solar,
what is a best way to pay for solar, what suppliers are more reliable, how to manage O&M, etc.).
• Consumers often do not get fair information on the product they are buying. Marketing messages
are quite mixed and much ‘overpromising’ occurs for systems. Consumers are largely unaware of
standards and quality assurance for solar.
Perceptions of households vary according to experience they have had with solar
• Although many households recognize the benefits of solar, there is a general perception that solar
equipment is very expensive and that products are considered largely un-affordable.
• Many customers are disappointed with solar technology or mistrust it because:
- They have bought a substandard/not certified product that broke down quickly;
- There was no adequate maintenance, aftersales service when the system broke down;
- There was lack of understanding/experience on how to use the system and it broke down due
to over usage or incorrect usage.
- There is no warranty or fault management system (long-term O&M)
• Households that have a fuel-powered generator, consider them as a ‘sunk cost’ and treat solar only
as an addition to that cost.
• Solar is seen as risky by many. Since there are so many options and little information as to what
the best solution is, many people think that it is easy to make a costly mistake in choosing what is
115 Focus group participants indicated that in the South-West region, for example, the level of information on alternative energy solutions is generally lower. The forest populations (Littoral region and the south east), including the Baka indigenous communities, are also largely unaware of solar technology solutions.

ECREEE: OFF-GRID SOLAR MARKET ASSESSMENT AND PRIVATE SECTOR SUPPORT FACILITY DESIGN
CAMEROON REPORT 89
best for them. Generators are much better understood.
• Some consumers have ‘investment fatigue’ from buying multiple solar products of low or unknown
quality and are unwilling to make further investments.
Willingness to Pay is strongly associated with consumer understanding and perceptions of OGS
Although there is demonstrated ability to pay for households in higher income demographics on cash
purchase, and for many households through a financed scenario, willingness to pay is strongly
associated with consumer understanding and perceptions of OGS. Component-based Plug-and-Play
SHS are much more expensive than battery-powered alternatives and are more than what households
expect to pay for access to lighting. Consumers who purchase low-priced inferior lighting products for
which they have low expectations are less likely to be willing to purchase a relatively high priced OGS
system without fully understanding the difference between the products.
Since most of the retail-shop dry-cell battery-powered lighting products are extremely low cost (and
short-lived), conservative rural consumers are wary of expensive new products if they are unable to
assess product quality and durability. For this reason, willingness to pay presents a much larger barrier
for the development of sales than actual ability to pay. East African experience with Global Lighting-
certified products has demonstrated that consumer awareness campaigns can grow the demand for
quality products.

ECREEE: OFF-GRID SOLAR MARKET ASSESSMENT AND PRIVATE SECTOR SUPPORT FACILITY DESIGN
CAMEROON REPORT 90
2.2 Demand – Institutional
2.2.1 Overview of Institutional Market Segment
This section estimates the market potential for off-grid solar products for institutional users in Cameroon.
This market includes the following segments: (i) rural water supply, (ii) healthcare facilities, (iii) primary
and secondary schools, and (iv) public town center lighting. The following sub-sections provide an
overview of the assumptions used for each market segment along with corresponding analysis. The section
concludes with an assessment of institutional ability to pay, looking at funding sources and highest potential
market segments. Annex 2 provides an overview of the methodology, including all calculations.
2.2.2 Analysis of Institutional Market Segment Demand
Table 15 shows the estimated cash market potential for institutional users in Cameroon. This estimation is
calculated using available GIS data, secondary research, and primary source field data. The analysis is based
on available information from planned expansion of the sectors and typical usage patterns and costs of
existing systems in the country. There was insufficient GIS data available to properly estimate the market
size; as a result, per capita comparisons were made with similar countries to analyze certain sectors as
described below.116
Table 15: Indicative Total Cash Market Potential for Institutional Sector 117
Institutional Sector Units kW
Equivalent Cash Value
(USD)
Water supply Low power pumping system 355 532 $1,329,750
Medium power pumping system 347 1,390 $3,474,000
High power pumping system 167 1,665 $4,162,500
Subtotal 869 3,587 $8,966,250
Healthcare Health post (HC1) 40 10 $25,000
Basic healthcare facility (HC2) 18 27 $67,500
Enhanced healthcare facility (HC3) 6 25 $61,425
Subtotal 64 62 $153,925
Education Primary schools 657 328 $985,425
Secondary schools 15 29 $71,760
Subtotal 672 357 $1,057,185
Public lighting Public lighting (excluding street lighting) 49 25 $73,950
TOTAL 1,654 4,031 $10,251,310
Source: African Solar Designs analysis
116 See Annex 2 for more details. 117 Estimated units, kW equivalent and cash value are annualized to reflect typical lifespan of OGS systems; see Annex 2 for more details.

ECREEE: OFF-GRID SOLAR MARKET ASSESSMENT AND PRIVATE SECTOR SUPPORT FACILITY DESIGN
CAMEROON REPORT 91
Water Supply
Table 16: Key Assumptions for Water Supply Sector Analysis
Sector System Sizes Key Assumptions
Water supply • Low Power (1,500 W) • Medium Power (4,000 W) • High Power (10,000 W)
The type of pump selected is dependent on depth, yield, community need and other factors. System sizes depend on the common pump sizes used for rural applications: • Low power pumps are used for low/medium head applications.
They replace hand pumps for shallow wells • Medium power pumps have high volume low head and medium
volume medium head applications • High power pumps are used for high volume or high head
applications such as deep wells and boreholes
The water supply sector analysis considered the electricity needs for water supply for communities in off-
grid areas. Energy is only one component of this sector – a variety of factors (water quality, number of
users, yields of well, delivery system etc.) need to be considered when planning for off-grid water supply.
The supply of solar powered pumping systems for village water supply requires additional planning and
study to identify the most viable sites.
As GIS data was not available to conduct the analysis, a per capita comparison made using data from Ghana
identified 17,370 off-grid potable water points such as boreholes and wells that could be electrified by
stand-alone systems.118 Based on the analysis, the estimated cash market potential for the water supply
sector is presented in Table 17.
Table 17: Estimated Cash Market Potential for Water Supply 119
Pump Type Units Size (kW) Cash Value (USD)
Low power 355 532 $1,329,750
Medium power 347 1,390 $3,474,000
High power 167 1,665 $4,162,500
Total 869 3,587 $8,966,250
Source: African Solar Designs analysis
Healthcare
Table 18: Key Assumptions for Healthcare Sector Analysis
Sector System Sizes Key Assumptions Healthcare • HC1: Dispensary health post (300 W)
• HC2: Basic health facility (1,500 W)
• HC3: Enhanced health facility (4,200 W)
677 off-grid healthcare facilities were identified that could be electrified by stand-alone systems.
The healthcare sector analysis considered the electricity needs for off-grid health facilities in the country.
Off-grid clinics require power for lighting and various Information and Communications Technology (ICT)
needs, including phone charging, maternity, medical examinations, vaccine refrigeration, laboratory,
sterilization and staff housing. The size of a facility and number of patients served determines the amount
118 See Annex 2 for more details. 119 Estimated units, kW equivalent and cash value are annualized to reflect typical lifespan of OGS systems; see Annex 2 for more details.
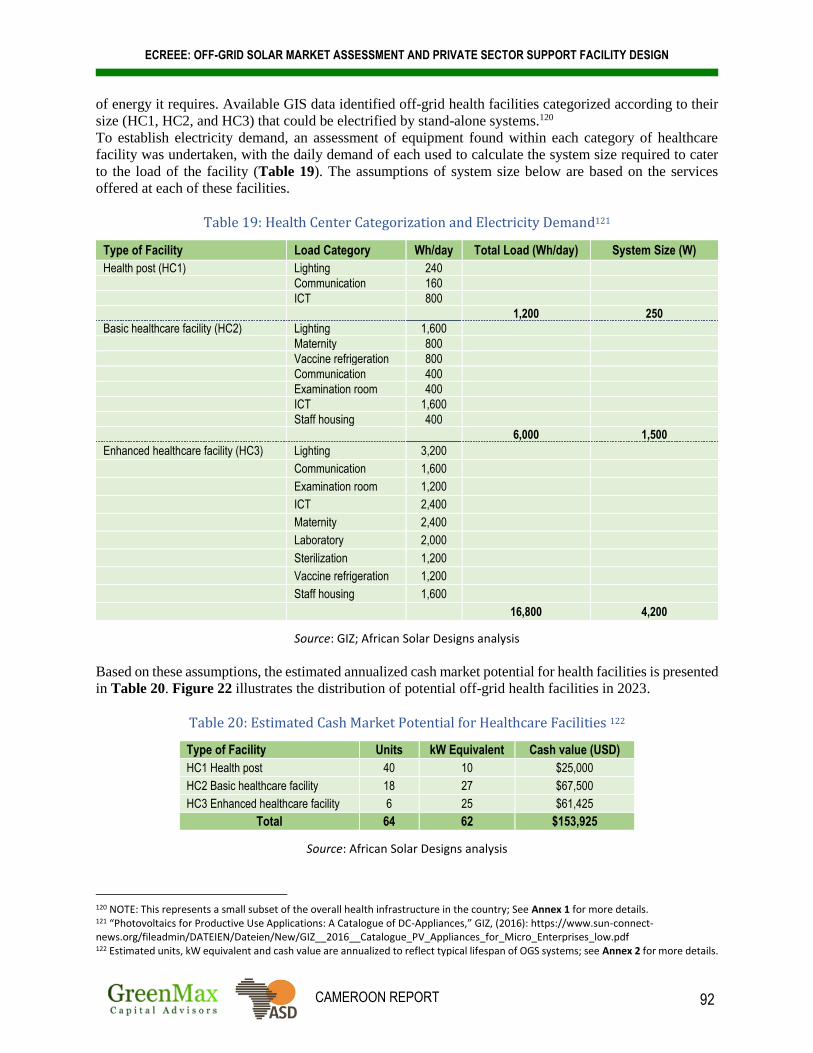
ECREEE: OFF-GRID SOLAR MARKET ASSESSMENT AND PRIVATE SECTOR SUPPORT FACILITY DESIGN
CAMEROON REPORT 92
of energy it requires. Available GIS data identified off-grid health facilities categorized according to their
size (HC1, HC2, and HC3) that could be electrified by stand-alone systems.120
To establish electricity demand, an assessment of equipment found within each category of healthcare
facility was undertaken, with the daily demand of each used to calculate the system size required to cater
to the load of the facility (Table 19). The assumptions of system size below are based on the services
offered at each of these facilities.
Table 19: Health Center Categorization and Electricity Demand121
Type of Facility Load Category Wh/day Total Load (Wh/day) System Size (W)
Health post (HC1) Lighting 240
Communication 160
ICT 800
1,200 250
Basic healthcare facility (HC2) Lighting 1,600
Maternity 800
Vaccine refrigeration 800
Communication 400
Examination room 400
ICT 1,600
Staff housing 400
6,000 1,500
Enhanced healthcare facility (HC3) Lighting 3,200
Communication 1,600
Examination room 1,200
ICT 2,400
Maternity 2,400
Laboratory 2,000
Sterilization 1,200
Vaccine refrigeration 1,200
Staff housing 1,600
16,800 4,200
Source: GIZ; African Solar Designs analysis
Based on these assumptions, the estimated annualized cash market potential for health facilities is presented
in Table 20. Figure 22 illustrates the distribution of potential off-grid health facilities in 2023.
Table 20: Estimated Cash Market Potential for Healthcare Facilities 122
Type of Facility Units kW Equivalent Cash value (USD)
HC1 Health post 40 10 $25,000
HC2 Basic healthcare facility 18 27 $67,500
HC3 Enhanced healthcare facility 6 25 $61,425
Total 64 62 $153,925
Source: African Solar Designs analysis
120 NOTE: This represents a small subset of the overall health infrastructure in the country; See Annex 1 for more details. 121 “Photovoltaics for Productive Use Applications: A Catalogue of DC-Appliances,” GIZ, (2016): https://www.sun-connect-news.org/fileadmin/DATEIEN/Dateien/New/GIZ__2016__Catalogue_PV_Appliances_for_Micro_Enterprises_low.pdf 122 Estimated units, kW equivalent and cash value are annualized to reflect typical lifespan of OGS systems; see Annex 2 for more details.

ECREEE: OFF-GRID SOLAR MARKET ASSESSMENT AND PRIVATE SECTOR SUPPORT FACILITY DESIGN
CAMEROON REPORT 93
Figure 22: Distribution of Potential Off-Grid Healthcare Facilities, 2023123
Source: Energio Verda Africa GIS analysis
123 Displaying identified facilities with known location (given coordinates) only; see Annex 1 for more details, including data sources.

ECREEE: OFF-GRID SOLAR MARKET ASSESSMENT AND PRIVATE SECTOR SUPPORT FACILITY DESIGN
CAMEROON REPORT 94
Education
Table 21: Key Assumptions for Education Sector Analysis124
Sector System Sizes Key Assumptions Education • Elementary schools (500 W)
• Secondary schools (1,920 W)
Available GIS data and a per-capita comparison identified 13,139 off-grid primary schools and 299 off-grid secondary schools that could be electrified by stand-alone systems
The education sector analysis considered the electricity needs of off-grid primary and secondary schools.125
These include lighting, ICT (computers, tablets etc.), communication (phone charging), laboratories and
staff housing. The size of a school and number of students determines the amount of energy it requires. As
available GIS data was not sufficient to conduct the analysis, a per capita comparison made using data from
Côte d’Ivoire126 identified off-grid primary and secondary schools that could be electrified by stand-alone
systems. To establish electricity demand, an assessment of equipment found within each type of school was
undertaken, with the daily demand of each used to calculate the system size required to cater to the load of
the school (Table 22).
Table 22: Education Center Categorization and Electricity Demand127
Type of Facility Load Category Wh/day Total Load (Wh/day) System Size (W)
Primary School Communication 160
Lighting 640
ICT 800
Staff house 400
2,000 500
Secondary School Communication 160
Lighting 1,920
ICT 3,200
Laboratory use 800
Staff house 1,600
7,680 1,920
Source: GIZ; African Solar Designs analysis
Based on these assumptions, the estimated annualized cash market potential for primary and secondary
schools is presented in Table 23.
Table 23: Estimated Cash Market Potential for Primary and Secondary Schools 128
Type of Facility Units kW Equivalent Cash value (USD)
Primary School 657 328 $985,425
Secondary School 15 29 $71,760
Total 672 357 $1,057,185
Source: African Solar Designs analysis
124 NOTE: While the GIS analysis in Section 1.2.2.4 covers all education centers (including nursery, pre-primary, primary, secondary, technical-vocational, universities etc.), this analysis only examines primary and secondary schools (see Annex 1 and Annex 2). 125 Primary schools encompass both primary and nursery schools. Vocational schools and universities were not considered because they tend to be in cities, which are often grid electrified. 126 Côte d’Ivoire was grouped in the same category as Cameroon; See Annex 2 for more details 127 “Photovoltaics for Productive Use Applications: A Catalogue of DC-Appliances,” GIZ, (2016): https://www.sun-connect-news.org/fileadmin/DATEIEN/Dateien/New/GIZ__2016__Catalogue_PV_Appliances_for_Micro_Enterprises_low.pdf 128 Estimated units, kW equivalent and cash value are annualized to reflect typical lifespan of OGS systems; see Annex 2 for more details.

ECREEE: OFF-GRID SOLAR MARKET ASSESSMENT AND PRIVATE SECTOR SUPPORT FACILITY DESIGN
CAMEROON REPORT 95
Public Lighting
Table 24: Key Assumptions for Public Lighting Sector Analysis
Sector System Sizes Key Assumptions Public lighting Standard system (200 W) • District population figures were used to determine the number of market centers
per district, assuming 5,000 people per market center • Each market center was assumed to have two public lighting points
Analysis of the public lighting sector considered the public lighting needs for off-grid villages and market
centers. It did not assess public street lighting, which would generally be included in road infrastructure
projects. Based on these assumptions, the estimated annualized cash market potential for the public lighting
sector is presented in Table 25.
Table 25: Estimated Cash Market Potential for Public Lighting 129
Public Lighting Network Units kW Equivalent Cash value (USD)
Village lighting (excluding street lighting) 49 25 $73,950
Source: African Solar Designs analysis
2.2.3 Ability to Pay and Access to Finance
Financing for institutional off-grid systems in Cameroon typically comes from budget allocations made
directly by relevant ministries or, more commonly, by donor-funded projects. In recent years, virtually all
institutional solar projects in the country have been financed with tender-based procurements and cash-
based contracts. Government allocations are typically made ad-hoc, depending on the needs and priorities
of the ministry, and whether funds are available. Operation, maintenance and replacement of parts in energy
systems (e.g. solar system batteries and inverters) is typically the responsibility of the institution and
community. Schools, clinics and other institutions with generators must buy fuel on a regular basis. With
the development of the renewable energy sector, NGO/donor funds increasingly design projects that ensure
that maintenance of the system is factored into its implementation. However, when there are no funds to
maintain the system any further, usage is typically discontinued, and the system falls into disrepair.
Institutional users that rely on government or donor funds for the purchase and O&M of solar systems may
be constrained by limited funds and/or competing budget priorities. Thus, local communities benefiting
from solar electrification would also have to bear some long-term costs for the maintenance of systems and
replacement of parts. In the event that public or donor funding is made available to cover the initial capital
expenditure, funds can be raised by local communities through a minimal tariff to customers of the health
facilities, water pumping stations etc. for long-term O&M. A market standard of 5-10% of the capital
expenditure is accepted as a rate for annual maintenance of systems.130
Given budgetary constraints, some institutional sectors may be prioritized for solar electrification over
others. Advanced health centers for example, could be prioritized by governments and communities given
that electricity is essential to run advanced healthcare equipment. It may be easier in this case to extract
maintenance fees from community members receiving health services or budget allocations from local
government. In contrast, off-grid schools can be run more easily without access to electricity and may
therefore present a lower priority institutional market.
129 Estimated units, kW equivalent and cash value are annualized to reflect typical lifespan of OGS systems; see Annex 2 for more details. 130 Grundfos: https://www.grundfos.com/service-support/encyclopedia-search/maintenance-and-repaircostscm.html

ECREEE: OFF-GRID SOLAR MARKET ASSESSMENT AND PRIVATE SECTOR SUPPORT FACILITY DESIGN
CAMEROON REPORT 96
2.3 Demand – Productive Use
2.3.1 Overview of Productive Use Market Segment
The section provides an overview of the main characteristics of productive use of energy (PUE) and how
off-grid solar applications have the potential to generate economic activity, increase productivity and
transform rural livelihoods in Cameroon. Focus group participants noted that productive use applications
in the agricultural, food processing and informal sectors already exist in the country, including solar
powered lighting, mobile phone charging, refrigeration and chilling, water pumping, irrigation and
agricultural processing. The PUE market sizing analyzed demand for SME applications for village
microenterprises, value-added applications for solar powered irrigation, milling and refrigeration, and
connectivity applications for mobile phone charging enterprises.
The calculation of the estimated off-grid solar market for SMEs focused only on barbering and tailoring
appliances, which comprises a small portion of overall SME sector demand. These two microenterprises
are indicative of the service-based SME off-grid solar market, as they benefit significantly from extended
working hours and the use of modern appliances/machinery. The estimated demand for this market segment
is therefore intended to provide a baseline for future research, as a more robust analysis would be necessary
to assess realistic demand from all SMEs.
The value-added applications that were analyzed include solar pumping for smallholder agricultural
irrigation, solar powered milling and solar refrigeration. Access to energy for agriculture is critical to
economic development, particularly given the sector’s importance to GDP in the country.
Off-grid solar power supports a wide range of connectivity applications, including mobile phone charging,
wi-fi servers, banks, mobile money kiosks, and telecommunications towers. Mobile phone and internet
connectivity are also necessary precursors for mobile money and PAYG solutions in the off-grid solar
sector. The market sizing examined rates of mobile phone ownership and mobile internet penetration to
estimate the market potential for mobile phone charging enterprises (stations/kiosks) in the country.
Given that the services sector makes up 47.9% of Cameroon’s GDP,131 the lack of reliable power has had a
negative impact on the profitability of firms. Nonetheless, stakeholder interviews highlighted the
importance of solar appliances to the fishing and agricultural sectors, which contribute 21.3% to GDP.132
Agriculture still employs three-quarters of the population and is the basis of the rural economy. Focus group
participants identified solar water pumping for rice and millet production and solar dryers for agricultural
processing as applications with the greatest potential in rural areas.
131 “Cameroon GDP and Economic Data, Country Report,” Global Finance, (2017): https://www.gfmag.com/global-data/country-data/cameroon-gdp-country-report 132 Ibid.

ECREEE: OFF-GRID SOLAR MARKET ASSESSMENT AND PRIVATE SECTOR SUPPORT FACILITY DESIGN
CAMEROON REPORT 97
Figure 23: Pathways from Electricity to Income Generation133
Source: EUEI PDF and GIZ: Productive Use of Energy – A Manual for Electrification Practitioners
133 “Productive Use of Energy – A Manual for Electrification Practitioners,” European Union Energy Initiative Partnership Dialogue Facility (EUEI PDF) and GIZ, (2011): https://www.giz.de/fachexpertise/downloads/giz-eueipdf-en-productive-use-manual.pdf
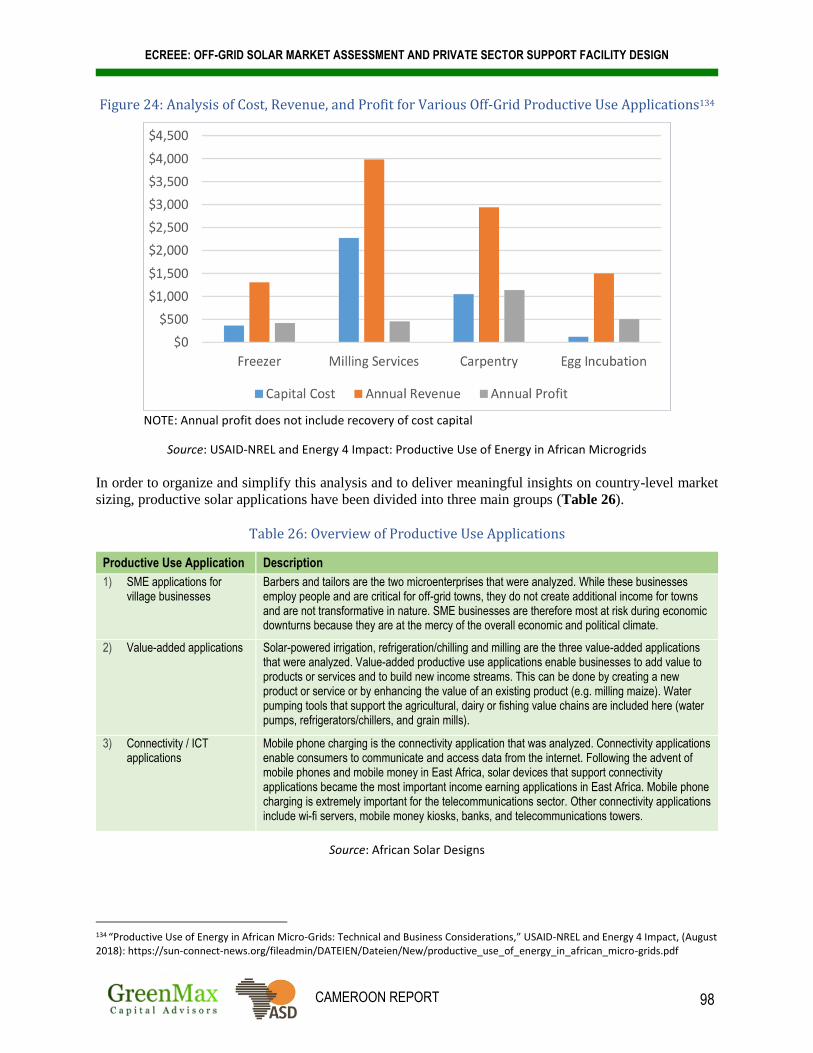
ECREEE: OFF-GRID SOLAR MARKET ASSESSMENT AND PRIVATE SECTOR SUPPORT FACILITY DESIGN
CAMEROON REPORT 98
Figure 24: Analysis of Cost, Revenue, and Profit for Various Off-Grid Productive Use Applications134
NOTE: Annual profit does not include recovery of cost capital
Source: USAID-NREL and Energy 4 Impact: Productive Use of Energy in African Microgrids
In order to organize and simplify this analysis and to deliver meaningful insights on country-level market
sizing, productive solar applications have been divided into three main groups (Table 26).
Table 26: Overview of Productive Use Applications
Productive Use Application Description
1) SME applications for village businesses
Barbers and tailors are the two microenterprises that were analyzed. While these businesses employ people and are critical for off-grid towns, they do not create additional income for towns and are not transformative in nature. SME businesses are therefore most at risk during economic downturns because they are at the mercy of the overall economic and political climate.
2) Value-added applications Solar-powered irrigation, refrigeration/chilling and milling are the three value-added applications that were analyzed. Value-added productive use applications enable businesses to add value to products or services and to build new income streams. This can be done by creating a new product or service or by enhancing the value of an existing product (e.g. milling maize). Water pumping tools that support the agricultural, dairy or fishing value chains are included here (water pumps, refrigerators/chillers, and grain mills).
3) Connectivity / ICT applications
Mobile phone charging is the connectivity application that was analyzed. Connectivity applications enable consumers to communicate and access data from the internet. Following the advent of mobile phones and mobile money in East Africa, solar devices that support connectivity applications became the most important income earning applications in East Africa. Mobile phone charging is extremely important for the telecommunications sector. Other connectivity applications include wi-fi servers, mobile money kiosks, banks, and telecommunications towers.
Source: African Solar Designs
134 “Productive Use of Energy in African Micro-Grids: Technical and Business Considerations,” USAID-NREL and Energy 4 Impact, (August 2018): https://sun-connect-news.org/fileadmin/DATEIEN/Dateien/New/productive_use_of_energy_in_african_micro-grids.pdf

ECREEE: OFF-GRID SOLAR MARKET ASSESSMENT AND PRIVATE SECTOR SUPPORT FACILITY DESIGN
CAMEROON REPORT 99
Geographic Locations
Focus group participants indicated that productive use applications have already been deployed, including
a project by SNV in the northern regions where solar PV was used to power irrigation pumps and recharge
phones. Solar Era Cameroon, a local affiliate of Africa Growth and Energy Solutions, is supporting
agricultural PUE applications in the country’s southwest region.135 In western Cameroon, mobile phone
charging and chicken egg incubation applications have been marketed with some success FGD participants
noted that more public awareness about PUE in off-grid communities could further drive rural economic
development.
2.3.2 Analysis of Productive Use Market Segment Demand
Data from the World Bank, Food and Agriculture Organization of the UN (FAO) and GSMA was used to
conduct the PUE market study. In order to conduct the analysis, several key assumptions were made about
PUE applications, which are presented in the sections below and in Annex 2 in greater detail. Table 27
presents the estimated annualized cash market potential for off-grid solar productive use applications.
Table 27: Indicative Total Cash Market Potential for Productive Use Sector 136
Source: Food and Agriculture Organization, GIZ and GSMA; African Solar Designs analysis
SME Applications for Village Businesses
Access to solar powered appliances can have a wide-ranging impact on SMEs, many of which would
otherwise rely on diesel- or petrol-powered generators to power their enterprises (Figure 2). Close to 33%
of SMEs in emerging markets use fossil fuel powered generators in order to address energy insecurity.137
A number of recent studies have utilized World Bank data and other methods to characterize the impact of
unreliable power on firm profitability, employment and GDP growth in Africa.138 One analysis found that
66% of firms in Cameroon have their own generator (Figure 25), further highlighting the potential impact
of OGS for PUE. The impact of electricity use on SMEs depends on a variety of external and internal
factors, especially access to markets, the location of the firm, supply of inputs and financial capability.
Therefore, the extent to which firms may be able to afford to invest in off-grid solar solutions is determined
largely by increases in productivity, profitability, and employment/wages from the investment in the off-
grid appliance.
135 http://agesplc.com/projects/cameroon/ 136 Estimated units, kW equivalent and cash value are annualized to reflect typical lifespan of OGS systems; see Annex 2 for more details. 137 Foster, V., and Steinbuks, J., “Paying the Price for Unreliable Power Supplies: In-House Generation of Electricity by Firms in Africa,” World Bank Policy Research Working Paper, (2009): https://openknowledge.worldbank.org/handle/10986/4116 138 “Power outages and firm performance in Sub Saharan Africa,” Matthew Cole et al, (2018); “Jobs! Electricity Shortages and Unemployment in Africa,” Justice Mensah, (2018); “The Role of Energy Capital in Accounting for Africa’s Recent Growth Resurgence,” Stephie Fried and David Lagakos, (2017).
Productive Use Sector Units kW
Equivalent Cash Value
(USD)
SME Applications for Village Businesses
Microenterprises 3,195 799 $1,997,000
Value-added Applications Irrigation 40,278 4,833 $26,180,556
Milling 451 2,934 $7,335,468
Refrigeration 49 271 $677,875
Subtotal 40,778 8,038 $34,193,899
Connectivity Applications Phone Charging 8,746 3,498 $7,538,746
TOTAL 52,719 12,335 $43,729,645
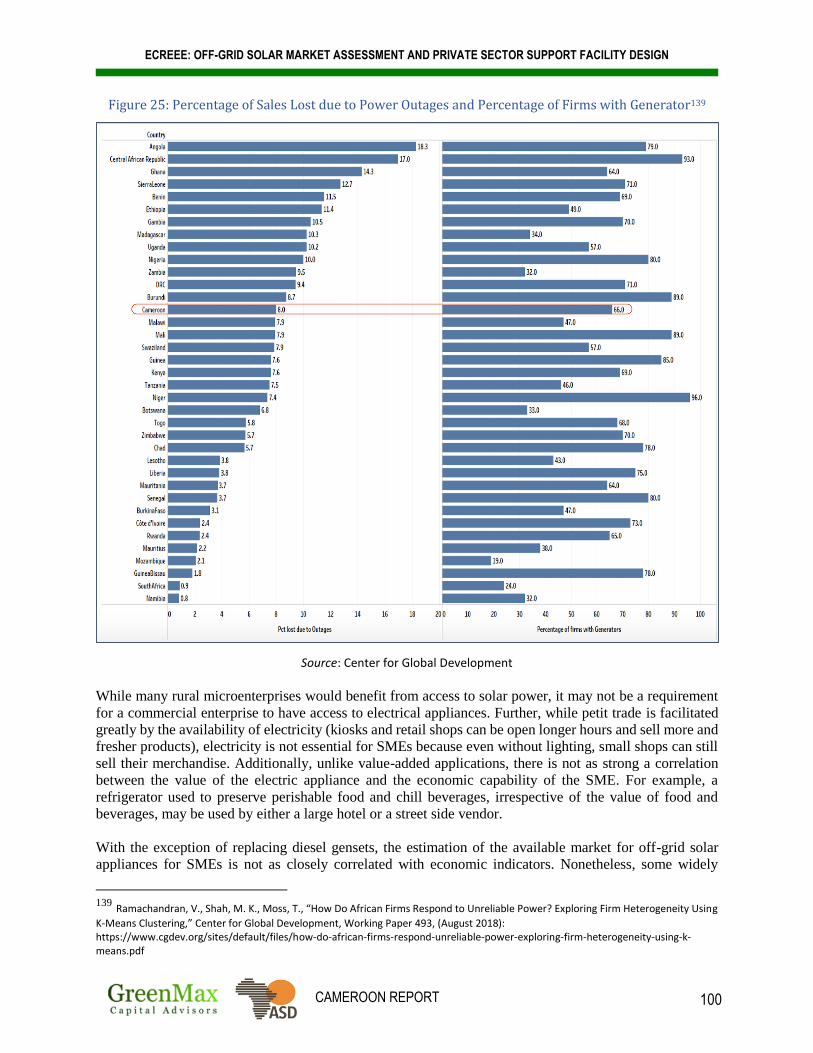
ECREEE: OFF-GRID SOLAR MARKET ASSESSMENT AND PRIVATE SECTOR SUPPORT FACILITY DESIGN
CAMEROON REPORT 100
Figure 25: Percentage of Sales Lost due to Power Outages and Percentage of Firms with Generator139
Source: Center for Global Development
While many rural microenterprises would benefit from access to solar power, it may not be a requirement
for a commercial enterprise to have access to electrical appliances. Further, while petit trade is facilitated
greatly by the availability of electricity (kiosks and retail shops can be open longer hours and sell more and
fresher products), electricity is not essential for SMEs because even without lighting, small shops can still
sell their merchandise. Additionally, unlike value-added applications, there is not as strong a correlation
between the value of the electric appliance and the economic capability of the SME. For example, a
refrigerator used to preserve perishable food and chill beverages, irrespective of the value of food and
beverages, may be used by either a large hotel or a street side vendor.
With the exception of replacing diesel gensets, the estimation of the available market for off-grid solar
appliances for SMEs is not as closely correlated with economic indicators. Nonetheless, some widely
139 Ramachandran, V., Shah, M. K., Moss, T., “How Do African Firms Respond to Unreliable Power? Exploring Firm Heterogeneity Using
K-Means Clustering,” Center for Global Development, Working Paper 493, (August 2018): https://www.cgdev.org/sites/default/files/how-do-african-firms-respond-unreliable-power-exploring-firm-heterogeneity-using-k-means.pdf

ECREEE: OFF-GRID SOLAR MARKET ASSESSMENT AND PRIVATE SECTOR SUPPORT FACILITY DESIGN
CAMEROON REPORT 101
marketed solar powered appliances are more centrally related to the revenue generation of SMEs.
Investments in such appliances in off-grid and low-income settings are more likely to be sustainable. This
study analyzed barbering and tailoring appliances (i.e. hair clippers and sewing machines designed or
marketed for off-grid solar powered settings) with respect to microenterprises that face difficulty in
accessing outside capital, as the two appliances would provide an economic opportunity for such
entrepreneurs that are demographically most likely to be in off-grid communities. A study undertaken in
West Africa that found little correlation between electricity access and a firm’s profitability did, however,
find that tailors do consistently benefit from electricity access.140
Focus group participants also highlighted the potential for solar power to support service-based industries,
specifically those participating in retail sales of fish, meat, beverages, entertainment and phone charging.
The calculation of the estimated OGS market focused only on barbering and tailoring appliances, which
comprises a small portion of overall SME sector demand. These two microenterprises are indicative of the
service-based SME off-grid solar market, as they benefit most from extended working hours and the use of
modern appliances/machinery. The quantitative demand estimate for this market segment is therefore
intended to provide a baseline for future research, as a more robust analysis would be necessary to assess
OGS demand from all SMEs.
According to the analysis, estimated annualized off-grid solar cash market potential for barbers and tailors
is USD 1.9 million (Table 28).
Table 28: Estimated Cash Market Potential for SMEs – Barbers and Tailors141
No. of SMEs with Constrained Access to Finance142
Units kW Equivalent Cash Value (USD)
15,976 3,195 799 $1,997,000
Source: World Bank; African Solar Designs analysis
Value-Added Applications
Agricultural practices, especially for smallholder farmers, can benefit from a wide range of off-grid solar
technologies. Cold rooms and ice production are valuable investments for economies engaged in
aquaculture. Solar refrigeration, cooling and processing equipment would enable traders and livestock
farmers to sell dairy products. For Cameroon in particular, solar drying of cocoa,143 and palm oil
processing144 in the Central, South, West and Littoral regions are productive use applications of off-grid
solar power that would greatly benefit rural farmers.
140 Grimm, M., Harwig, R., Lay, J., “How much does Utility Access matter for the Performance of Micro and Small Enterprises?” World Bank (2012): http://siteresources.worldbank.org/INTLM/Resources/390041-1212776476091/5078455-1398787692813/9552655-1398787856039/Grimm-Hartwig-Lay-How_Much_Does_Utility_Access_Matter_for_the_Performance_of_MSE.pdf 141 Estimated units, kW equivalent and cash value are annualized to reflect typical lifespan of OGS systems; see Annex 2 for more details. 142 “MSME Finance Gap,” SME Finance Forum: https://www.smefinanceforum.org/data-sites/msme-finance-gap 143 “The Green Cocoa Business Service Center,” SNV: http://www.snv.org/project/green-cocoa-business-service-centre. 144 “Artisanal Milling of Palm Oil in Cameroon, Working Paper,” CIFOR and IRD (2013): https://www.cifor.org/publications/pdf_files/WPapers/WP128Nchanji.pdf
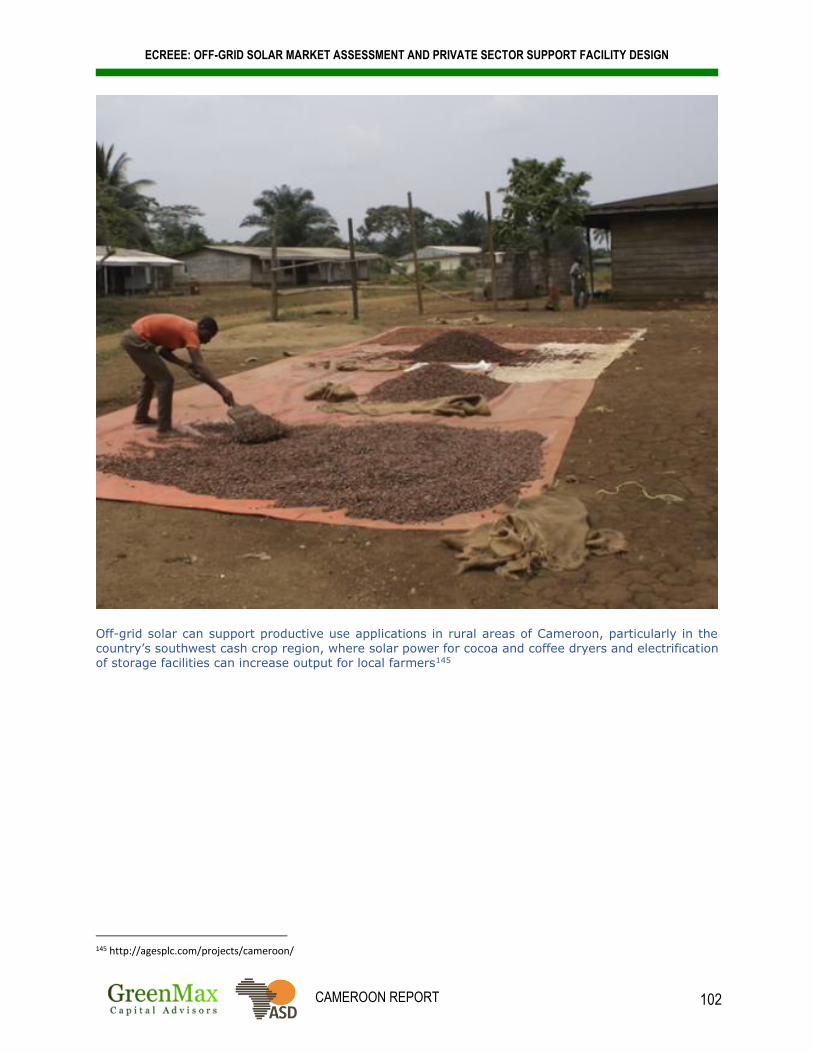
ECREEE: OFF-GRID SOLAR MARKET ASSESSMENT AND PRIVATE SECTOR SUPPORT FACILITY DESIGN
CAMEROON REPORT 102
Off-grid solar can support productive use applications in rural areas of Cameroon, particularly in the
country’s southwest cash crop region, where solar power for cocoa and coffee dryers and electrification of storage facilities can increase output for local farmers145
145 http://agesplc.com/projects/cameroon/
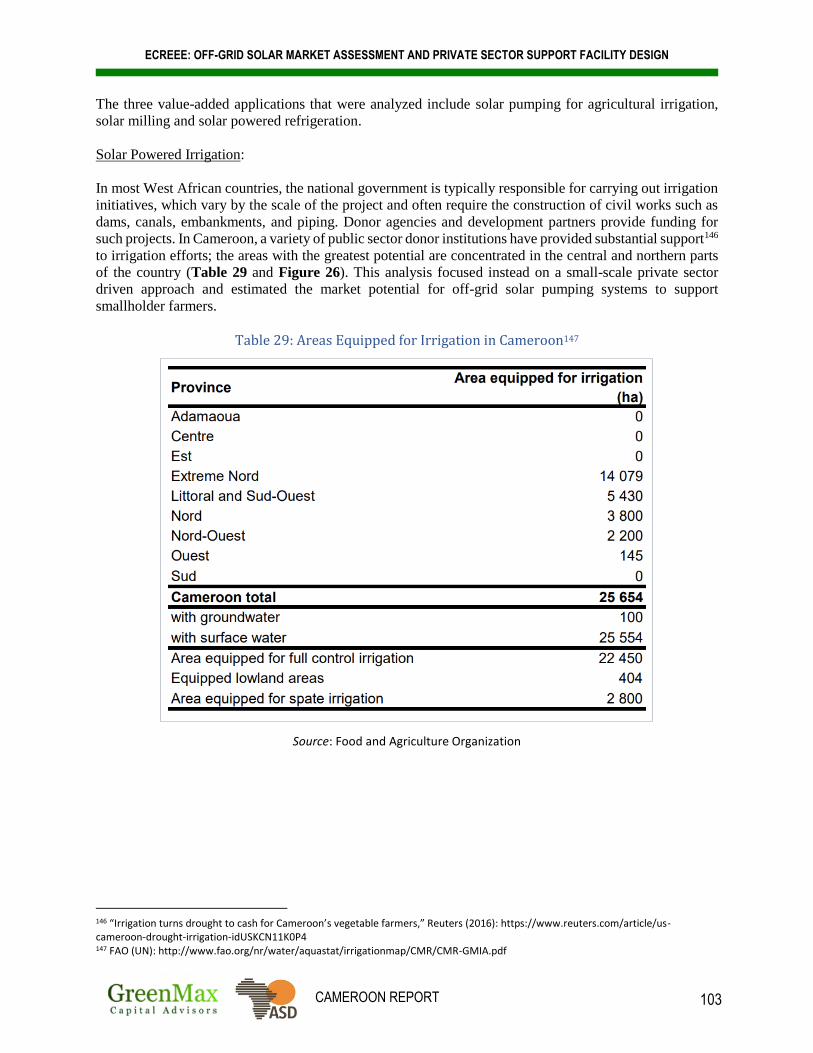
ECREEE: OFF-GRID SOLAR MARKET ASSESSMENT AND PRIVATE SECTOR SUPPORT FACILITY DESIGN
CAMEROON REPORT 103
The three value-added applications that were analyzed include solar pumping for agricultural irrigation,
solar milling and solar powered refrigeration.
Solar Powered Irrigation:
In most West African countries, the national government is typically responsible for carrying out irrigation
initiatives, which vary by the scale of the project and often require the construction of civil works such as
dams, canals, embankments, and piping. Donor agencies and development partners provide funding for
such projects. In Cameroon, a variety of public sector donor institutions have provided substantial support146
to irrigation efforts; the areas with the greatest potential are concentrated in the central and northern parts
of the country (Table 29 and Figure 26). This analysis focused instead on a small-scale private sector
driven approach and estimated the market potential for off-grid solar pumping systems to support
smallholder farmers.
Table 29: Areas Equipped for Irrigation in Cameroon147
Source: Food and Agriculture Organization
146 “Irrigation turns drought to cash for Cameroon’s vegetable farmers,” Reuters (2016): https://www.reuters.com/article/us-cameroon-drought-irrigation-idUSKCN11K0P4 147 FAO (UN): http://www.fao.org/nr/water/aquastat/irrigationmap/CMR/CMR-GMIA.pdf
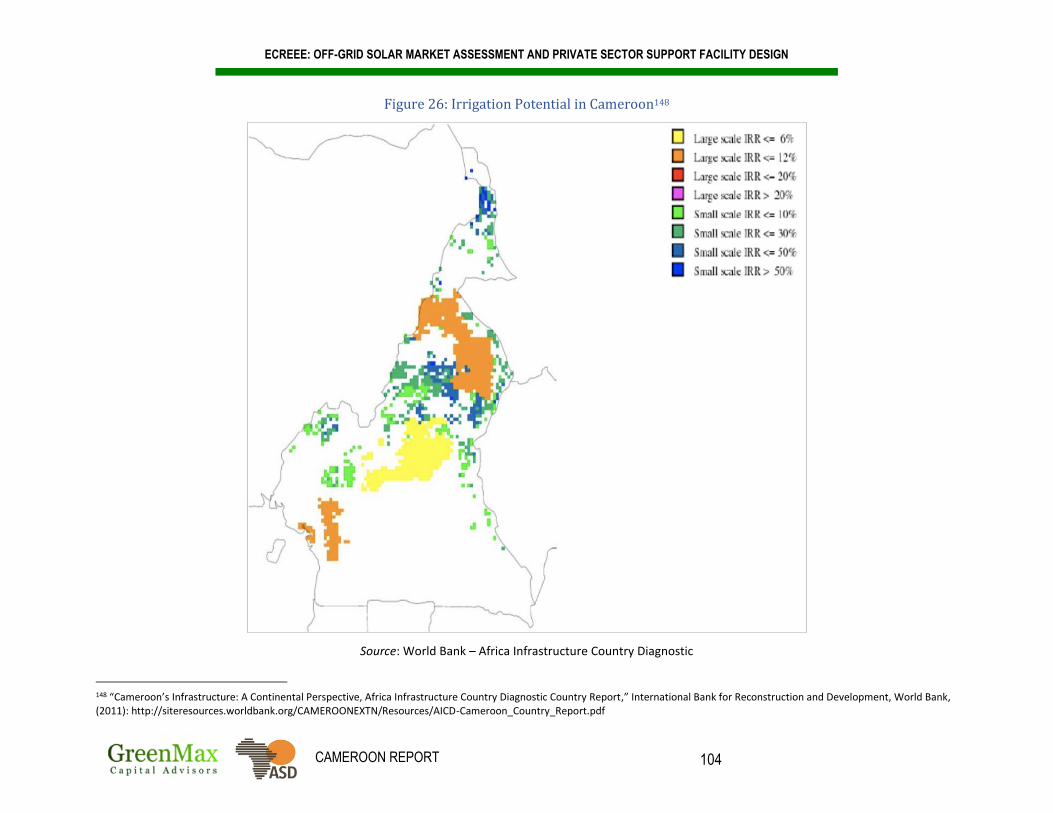
ECREEE: OFF-GRID SOLAR MARKET ASSESSMENT AND PRIVATE SECTOR SUPPORT FACILITY DESIGN
CAMEROON REPORT 104
Figure 26: Irrigation Potential in Cameroon148
Source: World Bank – Africa Infrastructure Country Diagnostic
148 “Cameroon’s Infrastructure: A Continental Perspective, Africa Infrastructure Country Diagnostic Country Report,” International Bank for Reconstruction and Development, World Bank, (2011): http://siteresources.worldbank.org/CAMEROONEXTN/Resources/AICD-Cameroon_Country_Report.pdf

ECREEE: OFF-GRID SOLAR MARKET ASSESSMENT AND PRIVATE SECTOR SUPPORT FACILITY DESIGN
CAMEROON REPORT 105
Solar pumping systems vary in their wattage depending on the area of land irrigated, the depth of water
abstracted and the quality of the soil and crops among other factors.149 In northwestern Cameroon there are
few farmers that work during the dry season, and the ones that do apply a basic canal system of irrigation,
diverting water with hand dug channels onto their the farms. While the cost of such irrigation methods is
low, it is labor-intensive and requires annually creating makeshift dams, which end up destroyed during the
rainy season. Aside from being unsustainable, only 25% of farmers in the region are able to access the canal
systems, thus severely limiting the number farmers that can cultivate crops during the dry season.150 GIS
analysis demonstrated that access to the water table and surface water is not a major determinant of the
costing of applicable solar irrigation systems, as most farming settlements in Cameroon are within close
proximity to either surface water or relatively easily extractable sources of water (Figure 27).
In analyzing the available market for solar-powered irrigation, this market scoping exercise focused
exclusively on smallholder farmers and solar water pumping irrigation technologies to address their needs.
In doing so, this analysis took into consideration the emerging experience with small-scale productive use
pumping in East Africa. Small pumps of 80 Wp-150 Wp (e.g. Futurepump and SunCulture) make up the
bulk of sales, while larger-sized pumps (e.g., Grundfos) are also frequently marketed to address differing
water access and crop conditions.
It is important to note that in Cameroon very little land is registered and most land is managed on a local
customary basis. This creates uncertainty that hinders outside investment in agricultural production and
limits access to finance for land-owners.151
Table 30 presents the estimated annualized off-grid solar cash market potential for smallholder value-added
solar irrigation applications in Cameroon, which has an estimated cash value of USD 26.1 million (see
Annex 2 for more details).
Table 30: Estimated Cash Market Potential for Value-Added Applications – Irrigation152
Estimated No. of Smallholder Farms Suitable for OGS Pumping for Irrigation
Units kW Equivalent Cash Value (USD)
241,667 40,278 4,833 $26,180,556
Source: Food and Agriculture Organization; World Bank; African Solar Designs analysis
149 See GIZ Powering Agriculture Toolbox on Solar Powered Irrigation Systems: https://energypedia.info/wiki/Toolbox_on_SPIS 150 “Why is irrigation fundamental to the inhabitants of Bambui, Cameroon?” Reignite Action for Development: https://reignite.org.uk/archives/1890 151 “Land Registration in Cameroon,” Focus on Land in Africa: http://www.focusonland.com/folal/en/countries/brief-land-registration-in-cameroon/ 152 Estimated units, kW equivalent and cash value are annualized to reflect typical lifespan of OGS systems; see Annex 2 for more details.
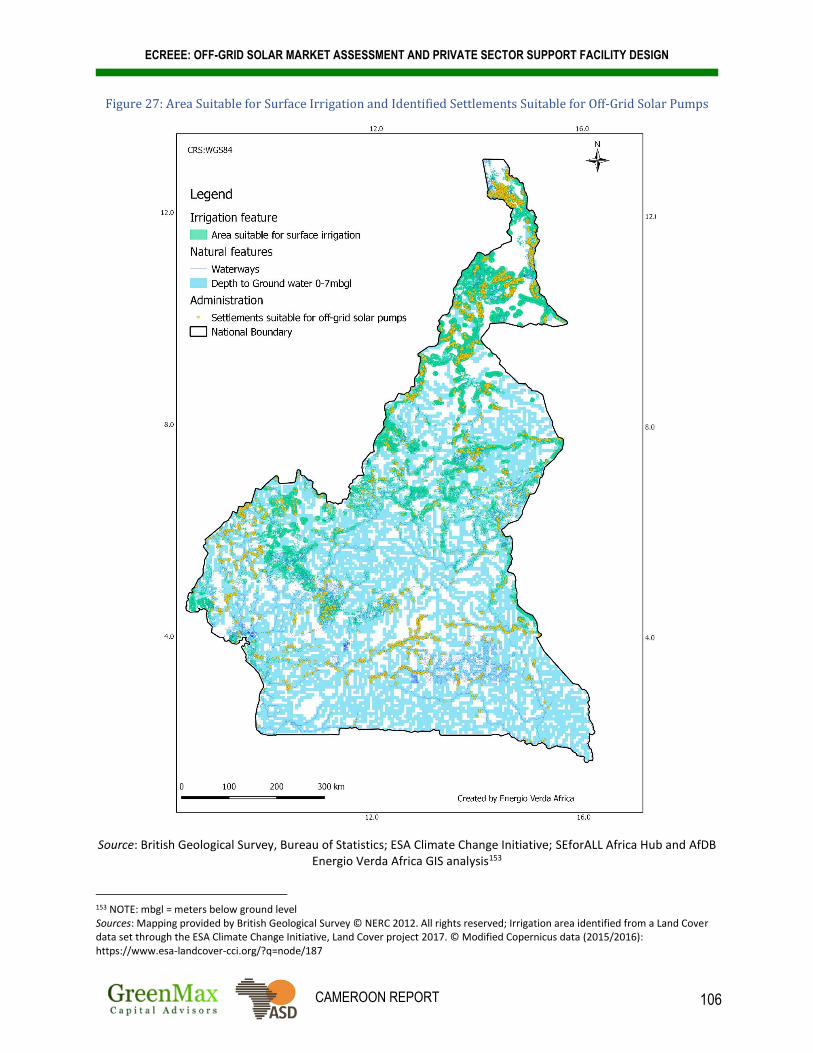
ECREEE: OFF-GRID SOLAR MARKET ASSESSMENT AND PRIVATE SECTOR SUPPORT FACILITY DESIGN
CAMEROON REPORT 106
Figure 27: Area Suitable for Surface Irrigation and Identified Settlements Suitable for Off-Grid Solar Pumps
Source: British Geological Survey, Bureau of Statistics; ESA Climate Change Initiative; SEforALL Africa Hub and AfDB Energio Verda Africa GIS analysis153
153 NOTE: mbgl = meters below ground level Sources: Mapping provided by British Geological Survey © NERC 2012. All rights reserved; Irrigation area identified from a Land Cover data set through the ESA Climate Change Initiative, Land Cover project 2017. © Modified Copernicus data (2015/2016): https://www.esa-landcover-cci.org/?q=node/187

ECREEE: OFF-GRID SOLAR MARKET ASSESSMENT AND PRIVATE SECTOR SUPPORT FACILITY DESIGN
CAMEROON REPORT 107
Solar Powered Milling:
Cereal crops like maize, sorghum, millet, and rice provide an opportunity for value addition through hulling
or milling. Off-grid communities use maize or rice milling equipment that is typically powered by diesel
generators. Discussions with off-grid community groups revealed that although many are aware of the long-
term cost savings associated with solar powered mills, the up-front cost of purchasing equipment was
viewed as too high.
Table 31 presents the estimated annualized off-grid solar market potential for smallholder value-added
solar grain milling applications in Cameroon, which has an estimated cash value of USD 7.3 million (see
Annex 2 for more details).
Table 31: Estimated Cash Market Potential for Value-Added Applications – Milling 154
Estimated No. of Solar Mills Units kW Equivalent Cash Value (USD)
9,028 451 2,934 $7,335,468
Source: Food and Agriculture Organization; African Solar Designs analysis
Solar Powered Refrigeration:
Solar-powered refrigerators and freezers in rural areas serve multiple purposes, including to store milk, fish,
meat and vegetables to extend the life of produce and reduce losses. In addition to storing produce, ice-
makers can increase the income of rural SMEs by providing ice to businesses that require cold storage
(stores, restaurants etc.). Table 32 presents the estimated annualized off-grid solar market potential for
smallholder value-added solar refrigeration applications in Cameroon, which has an estimated cash value
of USD 678 thousand (see Annex 2 for more details).
Table 32: Estimated Cash Market POtential for Value-Added Applications – Refrigeration155
Off-Grid Market Centers Units kW Equivalent Cash Value (USD)
986 49 271 $677,875
Source: Solar-Powered Cold Hubs, Nigeria; African Solar Designs analysis
Ultimately, the ability for an agricultural community to benefit from productive use applications has as
much to do with access to markets and improved crop inputs, as it has to do with the pricing and availability
of financing to purchase the equipment. Hence, the macroeconomic approach used to carry out this market
sizing does not account for country-specific cost and supply chain constraints.
Connectivity Applications
Mobile phone charging stations/kiosks make up a critical segment of off-grid solar demand, as the market
for solar phone charging is expected to grow significantly in the near-term. Household rates of mobile
phone ownership often greatly exceed rates of electricity access, while households spend a significant share
of income on lighting and phone charging (Figure 28). Increasingly, off-grid solar devices, such as lighting
devices, also include phone-charging capabilities that enable owners to engage in mobile-phone charging
businesses.
154 Estimated units, kW equivalent and cash value are annualized to reflect typical lifespan of OGS systems; see Annex 2 for more details. 155 Estimated units, kW equivalent and cash value are annualized to reflect typical lifespan of OGS systems; see Annex 2 for more details.

ECREEE: OFF-GRID SOLAR MARKET ASSESSMENT AND PRIVATE SECTOR SUPPORT FACILITY DESIGN
CAMEROON REPORT 108
Figure 28: Estimated Annual Off-Grid Household Expenditure on Lighting and Mobile Phone Charging156
NOTE: Figures in Billion USD
Source: Dahlberg Advisors, Lighting Global, GOGLA and World Bank ESMAP
Figure 29 shows the relatively broad geographic coverage of cellular signals across the region. Cellular
connectivity is essential for solar PV markets. In many African countries, mobile phone charging provides
a primary productive use application for off-grid solar. Mobile phone access – and more importantly
connectivity – helps drive commerce and employment in rural areas. The penetration of mobile money
services is also critical, as it drives greater financial inclusion, expands consumer financing options and
further increases demand for phone charging enterprises. Above all, mobile phones and connectivity are a
necessary precursor to PAYG solutions in the OGS sector. Countries with expanding mobile phone
coverage and especially broadband internet users are more attractive to PAYG solar companies.
156 “Off-Grid Solar Market Trends Report 2018,” Dahlberg Advisors, Lighting Global, GOGLA and World Bank ESMAP, (January 2018): https://www.lightingafrica.org/wp-content/uploads/2018/02/2018_Off_Grid_Solar_Market_Trends_Report_Full.pdf

ECREEE: OFF-GRID SOLAR MARKET ASSESSMENT AND PRIVATE SECTOR SUPPORT FACILITY DESIGN
CAMEROON REPORT 109
Figure 29: Mobile Phone Network Geographic Coverage157
Source: GSMA
The analysis of the potential solar-powered phone charging market was based on the country’s mobile
phone penetration rate, rural population rate, and the average costs of OGS phone charging appliances.
Table 33 presents the estimated annualized cash market potential for off-grid solar mobile phone charging
enterprises in Cameroon, which has an estimated cash value of USD 7.5 million (see Annex 2 for more
details).
157 See Annex 2 for more details
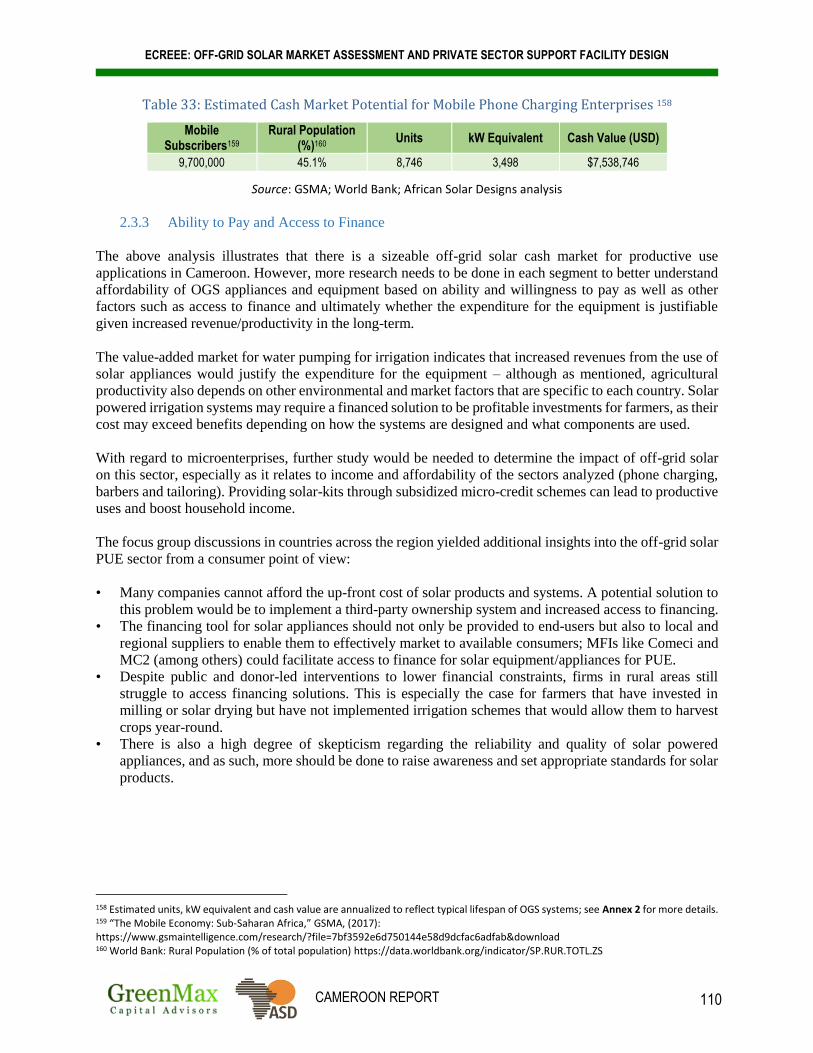
ECREEE: OFF-GRID SOLAR MARKET ASSESSMENT AND PRIVATE SECTOR SUPPORT FACILITY DESIGN
CAMEROON REPORT 110
Table 33: Estimated Cash Market Potential for Mobile Phone Charging Enterprises 158
Mobile Subscribers159
Rural Population (%)160
Units kW Equivalent Cash Value (USD)
9,700,000 45.1% 8,746 3,498 $7,538,746
Source: GSMA; World Bank; African Solar Designs analysis
2.3.3 Ability to Pay and Access to Finance
The above analysis illustrates that there is a sizeable off-grid solar cash market for productive use
applications in Cameroon. However, more research needs to be done in each segment to better understand
affordability of OGS appliances and equipment based on ability and willingness to pay as well as other
factors such as access to finance and ultimately whether the expenditure for the equipment is justifiable
given increased revenue/productivity in the long-term.
The value-added market for water pumping for irrigation indicates that increased revenues from the use of
solar appliances would justify the expenditure for the equipment – although as mentioned, agricultural
productivity also depends on other environmental and market factors that are specific to each country. Solar
powered irrigation systems may require a financed solution to be profitable investments for farmers, as their
cost may exceed benefits depending on how the systems are designed and what components are used.
With regard to microenterprises, further study would be needed to determine the impact of off-grid solar
on this sector, especially as it relates to income and affordability of the sectors analyzed (phone charging,
barbers and tailoring). Providing solar-kits through subsidized micro-credit schemes can lead to productive
uses and boost household income.
The focus group discussions in countries across the region yielded additional insights into the off-grid solar
PUE sector from a consumer point of view:
• Many companies cannot afford the up-front cost of solar products and systems. A potential solution to
this problem would be to implement a third-party ownership system and increased access to financing.
• The financing tool for solar appliances should not only be provided to end-users but also to local and
regional suppliers to enable them to effectively market to available consumers; MFIs like Comeci and
MC2 (among others) could facilitate access to finance for solar equipment/appliances for PUE.
• Despite public and donor-led interventions to lower financial constraints, firms in rural areas still
struggle to access financing solutions. This is especially the case for farmers that have invested in
milling or solar drying but have not implemented irrigation schemes that would allow them to harvest
crops year-round.
• There is also a high degree of skepticism regarding the reliability and quality of solar powered
appliances, and as such, more should be done to raise awareness and set appropriate standards for solar
products.
158 Estimated units, kW equivalent and cash value are annualized to reflect typical lifespan of OGS systems; see Annex 2 for more details. 159 “The Mobile Economy: Sub-Saharan Africa,” GSMA, (2017): https://www.gsmaintelligence.com/research/?file=7bf3592e6d750144e58d9dcfac6adfab&download 160 World Bank: Rural Population (% of total population) https://data.worldbank.org/indicator/SP.RUR.TOTL.ZS

ECREEE: OFF-GRID SOLAR MARKET ASSESSMENT AND PRIVATE SECTOR SUPPORT FACILITY DESIGN
CAMEROON REPORT 111
2.4 Supply Chain
This section reviews the off-grid solar supply chain in Cameroon, including an overview of key actors,
solar products and services, business models, and sales volumes. The section also analyzes the role of
informal market players and the impact of uncertified products. The section concludes with an assessment
of local capacity and the needs of the supplier market segment. The data presented in this section was
obtained through desk research, interviews with local officials and industry stakeholders, focus group
discussions and surveys of international and local solar companies (see Annex 2 for more details). The tier
system used to classify solar companies throughout this section is described in Table 34.
Table 34: Solar Company Tier Classification
Classification Description
Tier 1 Startup companies • Less than 3 full time employees
• Less than 300 SHS or Less than 1,500 lanterns sold
• Less than USD 100,000 annual revenues
• Does not have access to outside finance except personal loans and may have a
business account
Tier 2 Early stage companies • 3 to 25 full time employees
• 300 to 30,000 solar home systems or 1,500 to 50,000 lanterns sold
Tier 3 Growth/Mature • More than 25 full time employees
• More than 30,000 solar home systems or 50,000 lanterns sold
• More than USD 3 million annual revenues
• Has a credit line at a bank and financial statements
• Raising equity or other outside financing
Source: ECOWAS Center for Renewable Energy and Energy Efficiency
2.4.1 Overview of Commercial Market for Solar PV Equipment
The off-grid solar supply chain in Cameroon is made up of a wide range of stakeholders – importers,
distributors, wholesalers, retailers, NGOs, and end-users (Figure 30). Cameroon’s solar market is in a
period of rapid growth as it is among the largest markets in Central Africa and has one of the highest
concentrations of Tier 3 companies in West Africa and the Sahel. Despite the country’s rapid market
growth, the use of solar PV products remains relatively limited in the country, even in urban areas where
income and purchasing power are higher.161 Focus group participants also revealed that kerosene lamps are
still used widely in rural areas of the country, which suggests that there is significant potential for the pico
solar lighting and stand-alone solar product market to grow further.
Cameroon’s overall market environment and opportunity for solar companies is strong (Figure 10). A
variety of solar products and systems are offered by companies in the market (by both the formal and
informal sector) and, as examined in further detail below, there are a number of business models currently
being utilized. Rural households make up the main market for off-grid lighting products in the country, as
the demand for lighting products and household electrical appliances is growing. Nevertheless, urban
households, both electrified and non-electrified, are also a key consumer market, as they may have greater
ability to afford OGS products and systems. Moreover, despite the higher level of grid connectivity in urban
areas, power supply is often not sufficient, continuous, or reliable (Figure 2), further supporting expanded
use of solar PV equipment by this consumer segment.
161 “Policy Report Note: Cameroon,” GOGLA, Lighting Global and World Bank, (2012): https://www.lightingafrica.org/wp-content/uploads/2016/07/28_Cameroon-FINAL-August-2012_LM.pdf

ECREEE: OFF-GRID SOLAR MARKET ASSESSMENT AND PRIVATE SECTOR SUPPORT FACILITY DESIGN
CAMEROON REPORT 112
Figure 30: Off-Grid Solar Market and Supply Chain Overview
Source: GreenMax Capital Advisors

ECREEE: OFF-GRID SOLAR MARKET ASSESSMENT AND PRIVATE SECTOR SUPPORT FACILITY DESIGN
CAMEROON REPORT 113
2.4.2 Overview of OGS Companies in Africa and Level of Interest in the Region
The African off-grid solar market has experienced rapid growth over the last five years. This growth can
largely be attributed to the emergence of a progressively diverse, global pool of manufacturers and
distributors, decreased system costs and an increase in three major product categories – Pico solar, Plug-
and-Play SHS, and component based systems.162 Leading solar companies such as Greenlight Planet,
D.Light, Off-Grid Electric, M-KOPA Solar, Fenix International, and BBOXX represent the largest share
of the African off-grid solar market and are now joining other major players in West Africa and the Sahel,
including Lumos Global, PEG Africa, Barefoot Power, Yandalux, Schneider Electric, Azuri Technologies,
Solarama, AD Solar, Enertec, SmarterGrid, GoSolar, Total, Oolu Solar, EnergenWao and SunTech Power
to list a few.
Market entry into Africa began in East Africa for a majority of the leading companies, a trend that can be
attributed to advancements in mobile money transfer systems such as M-Pesa that have facilitated the
PAYG off-grid business model. As the East African market becomes more crowded and mobile money
services spread across the Continent, many international off-grid solar companies have recently entered
markets in West Africa and the Sahel. The regional market grew from being nearly non-existent in 2013 to
accounting for 9% of worldwide sales (20% of SSA) with over 2 million systems sold in 2017.163
Over 500 solar companies have been identified operating across the region, many of which are small local
players. These local distributors either operate independently or act as local affiliates of larger international
companies operating in this space. The majority of companies in the region are primarily Tier 1 and Tier 2
companies, with relatively few Tier 3 companies. The highest concentration of Tier 3 companies was
identified in Burkina Faso, Cameroon, Côte d’Ivoire, Ghana, Mali, Nigeria and Senegal.164
A survey of large international solar companies that assessed inter alia their level of interest in entering the
off-grid markets in West Africa and the Sahel is presented in Figure 31. The survey found that among
respondents, companies expressed the most interest in Nigeria, Sierra Leone, and Côte d’Ivoire, with at
least half of respondents indicating a “very high level of interest” in these markets. There was also a
relatively high level of interest in Liberia, Senegal, Burkina Faso, Mali and Togo, with at least half of
respondents indicating a “very high” or “moderate” level of interest in these markets.
162 “Off-Grid Solar Market Trends Report, 2018,” Dahlberg Advisors and Lighting Africa, (January 2018): https://www.lightingafrica.org/wp-content/uploads/2018/02/2018_Off_Grid_Solar_Market_Trends_Report_Full.pdf 163 Ibid. 164 “Insights from Interviews with Off-Grid Energy Companies,” ECREEE, (June 2018).
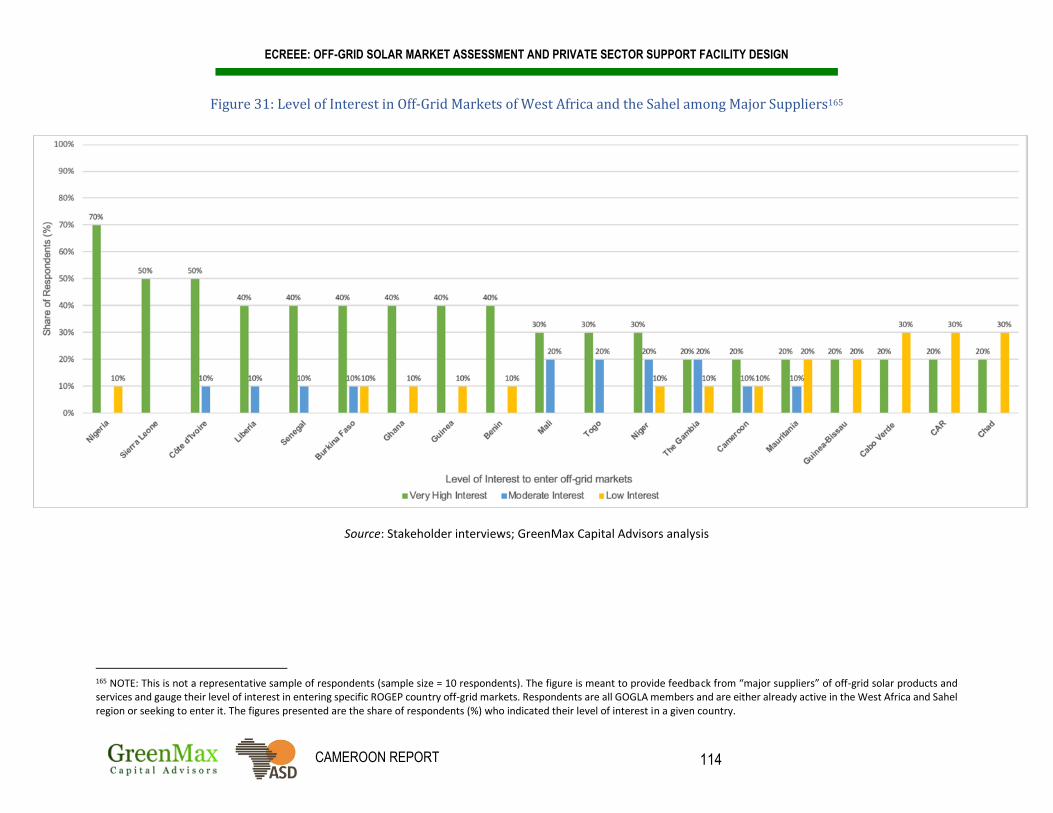
ECREEE: OFF-GRID SOLAR MARKET ASSESSMENT AND PRIVATE SECTOR SUPPORT FACILITY DESIGN
CAMEROON REPORT 114
Figure 31: Level of Interest in Off-Grid Markets of West Africa and the Sahel among Major Suppliers165
Source: Stakeholder interviews; GreenMax Capital Advisors analysis
165 NOTE: This is not a representative sample of respondents (sample size = 10 respondents). The figure is meant to provide feedback from “major suppliers” of off-grid solar products and services and gauge their level of interest in entering specific ROGEP country off-grid markets. Respondents are all GOGLA members and are either already active in the West Africa and Sahel region or seeking to enter it. The figures presented are the share of respondents (%) who indicated their level of interest in a given country.
ECREEE: OFF-GRID SOLAR MARKET ASSESSMENT AND PRIVATE SECTOR SUPPORT FACILITY DESIGN
CAMEROON REPORT 115
2.4.3 Solar Market, Products and Companies in Cameroon
This section characterizing the current formal market (local and international companies) including recent
sales trends, the main solar products, brands and prices.
The Formal Market – Local and International Companies
Focus groups and stakeholder interviews identified more than 50 companies operating in Cameroon’s solar
sector, offering a wide range of products and services to consumers throughout the country (see Annex 2
for a complete list of identified companies). Many of these companies have entered Cameroon within the
last five years, while others have been operating in the country since the 2000s (e.g. Maguysama since
2003, Haute Energy Systems since 2005, Yandalux since 2004 and Canopy Cameroon since 2008). The
newly created company, M Power, entered the market in 2019 and is prospecting in Togo. The formal
market includes many Lighting Global and GOGLA affiliated companies as well as international players
that enter the market to install systems for donor-funded projects. While there is no renewable energy
association in Cameroon, several suppliers are members of the country’s business organization, GICAM
(Groupement Interpatronal du Cameroun) and chamber of commerce, CCIME (Chambre de Commerce, de
l’Industrie, des Mines et de l’Artisanat).
Although the solar market in Cameroon is still in its early stages of development, it has a relatively high
concentration of existing and potential Tier 3 companies, with seven companies identified that meet these
characteristics (BBOXX, Total Cameroon, Schneider Electric, Fenix International, Yandalux, Canopy
Cameroon and Maguysama), compared to 16 in Mali, 11 in Senegal, 10 in Côte d’Ivoire and 9 in Nigeria.166
Some of the country’s larger Tier 3 companies (e.g. BBOXX, Fenix International) acquired longstanding
industry experience in East Africa prior to entering the Cameroonian market, while others have previous
experience in West Africa and the Sahel (e.g. Total, Yandalux). While there is no manufacturer of solar
products based in Cameroon, the largest companies in the market have formed key partnerships with global
manufacturers, mainly in East Asia. Many solar companies are also forming strategic partnerships with IT
companies to improve upon customer-relationship management by offering more payment options (i.e.
PAYG business model).167
Larger Tier 3 companies provide a wide range of solar products to consumers, as well as installation,
operation and maintenance, after sales services. Many have a regional presence in other markets across
West Africa and the Sahel, either operating in other countries or receiving inventory from them. Major Tier
3 suppliers typically operate through partnerships with manufacturers outside the country (e.g. Canopy
Cameroon with Victron) and with local or international distributors (e.g. Total). They have also formed
partnerships with telecommunications operators, mobile service providers and technology companies to
develop and launch PAYG transactions (e.g. BBOXX and Fenix International have partnered with Orange).
Still, the main business model deployed by local solar companies is cash/over-the-counter sales, while only
a few companies have started to utilize PAYG sales, as this is still an evolving business model in Cameroon.
While larger Tier 3 companies have little difficulty financing their operations, surveys of local Tier 1 and
Tier 2 companies found that financing remains a key challenge. While large companies selling certified
products play a central role in the market, the informal sector remains a key factor. Surveys of local industry
players and focus group discussions noted that a regulatory framework was necessary to address the
widespread sale of low-quality, uncertified products, which is hindering development of the OGS market.
166 “Insights from Interviews with Off-Grid Energy Companies,” ECREEE, (June 2018). 167 Stakeholder interviews, 2018.

ECREEE: OFF-GRID SOLAR MARKET ASSESSMENT AND PRIVATE SECTOR SUPPORT FACILITY DESIGN
CAMEROON REPORT 116
Sale Volumes and Revenue
Focus group participants indicated that it is challenging to assess the size of the current market due to a lack
of standardization in pricing from one company to another and a shortage of sound statistical data.
Moreover, during surveys and FGDs, companies were reluctant to share confidential data on sales volumes
and market shares. Local industry stakeholders described the market as having significant volume of sales
distributed between hundreds of larger installations (>1 kW) and tens of thousands of consumer product
sales along with institutional system market activity.
Using reports published by GOGLA, some basic market information is presented in Table 35 and Table
36; limited data was available for Cameroon. It is important to note that this data only includes figures from
GOGLA-affiliated companies and certified product sales and is therefore not fully representative of off-
grid solar market activity in Cameroon.
Table 35: Total Sales Volume and Cash Revenue for Stand-alone Systems in Cameroon, 2016-17168
Sales Volume / Revenue 2016 2017 Total
Total Volume of Products Sold (Units) Total Volume of Products Sold 45,444 32,833 78,277
Pico Solar 43,626 27,905 71,531
SHS 1,818 4,928 6,746
Total Cash Sales Revenue (USD) Total Cash Sales Revenue no data $456,294 no data
Pico Solar no data $383,287 no data
SHS no data $73,007 no data
Pico solar products categorized as 0-10W SHS products categorized as >10W
In 2016-2017, about 90% of the overall share of OGS products sold and 92% of total sales revenue in West Africa were pico solar products compared to 10% of products sold and 8% of sales revenue were SHS.
Table 36: Cash and PAYG Sales Volume and Revenue for Pico Solar Products, H1 2018169
Sales Volume / Revenue Cash Share (%) PAYG Share (%) Total
Total Sales Volume Cameroon 45,488 92% 4,227 8% 49,715 Total Sales Volume Central Africa 59,205 85% 10,322 15% 69,527
% of Total Sales Volume in Central Africa 77% - 41% - 84%
Total Sales Revenue Cameroon $690,329 59% $487,747 41% $1,178,076 Total Sales Revenue Central Africa $987,701 65% $537,501 35% $1,525,561
% of Total Sales Revenue in Central Africa 70% - 90% - 77%
NOTE: H1 = First half of year
Source (Tables 36-37): GOGLA, Lighting Global and World Bank; GreenMax Capital Advisors analysis
168 “Global Off-Grid Solar Market Report: Semi-Annual Sales and Impact Data,” GOGLA, Lighting Global and World Bank, (July – December 2017): https://www.gogla.org/sites/default/files/resource_docs/gogla_sales-and-impact-reporth2-2017_def20180424_web_opt.pdf; and “Global Off-Grid Solar Market Report: Semi-Annual Sales and Impact Data,” GOGLA, Lighting Global and World Bank, (January – June 2017): https://www.gogla.org/sites/default/files/resource_docs/gogla_sales-and-impact-reporth12017_def.pdf; and “Global Off-Grid Solar Market Report: Semi-Annual Sales and Impact Data,” GOGLA, Lighting Global and World Bank, (July – December 2016): https://www.gogla.org/sites/default/files/recource_docs/final_sales-and-impact-report_h22016_full_public.pdf; and “Global Off-Grid Solar Market Report: Semi-Annual Sales and Impact Data,” GOGLA, Lighting Global and World Bank, (January – June 2016): https://www.gogla.org/sites/default/files/recource_docs/global_off-grid_solar_market_report_jan-june_2016_public.pdf 169 “Global Off-Grid Solar Market Report: Semi-Annual Sales and Impact Data,” GOGLA, Lighting Global and World Bank, (January – June 2018): https://www.gogla.org/sites/default/files/resource_docs/global_off-grid_solar_market_report_h1_2018-opt.pdf

ECREEE: OFF-GRID SOLAR MARKET ASSESSMENT AND PRIVATE SECTOR SUPPORT FACILITY DESIGN
CAMEROON REPORT 117
• In 2016-2017, 78,277 off-grid solar products were sold in Cameroon. As only partial sales figures
were available for Cameroon, regional data from West and Central Africa was used to analyze data.
• Cameroon is among the top 10 countries in terms of volume of products sold in H1 2018. Based
on 2017 GOGLA Sales Report data, 32,833 off-grid solar products were sold in Cameroon in 2017.
There is a significant gap in sales figures between the first and second half of the year, reflecting the
highly volatile nature of the country’s nascent market. In H1 2018, sales increased by 32% compared
to H1 2017. In terms of volume of products sold in H1 2018, Cameroon ranked among the top 10
markets globally and sixth in Sub-Saharan Africa, behind Kenya, Ethiopia, Nigeria, Uganda and
Tanzania (Figure 32).
• Cash sales transactions remain the dominant model despite an increase in PAYG sales in H1
2018.170 In H1 2018, most of the products sold were cash sales, which accounted for 85% of sales
volumes and 65% of revenue, with PAYG accounting for the balance. These figures seem to
corroborate feedback received from stakeholder interviews – i.e. that the PAYG business model is still
underdeveloped in the country.
Figure 32: Total Volume of OGS Products Sold in Select Countries171
Source: GOGLA, Lighting Global and World Bank
170 In the GOGLA H1 2018 Report, the methodology has slightly changed compared to 2017. In addition of cash sales, affiliated companies also reported PAYG sales 171 “Global Off-Grid Solar Market Report: Semi-Annual Sales and Impact Data,” GOGLA, Lighting Global and World Bank, (January – June 2018): https://www.gogla.org/sites/default/files/resource_docs/global_off-grid_solar_market_report_h1_2018-opt.pdf
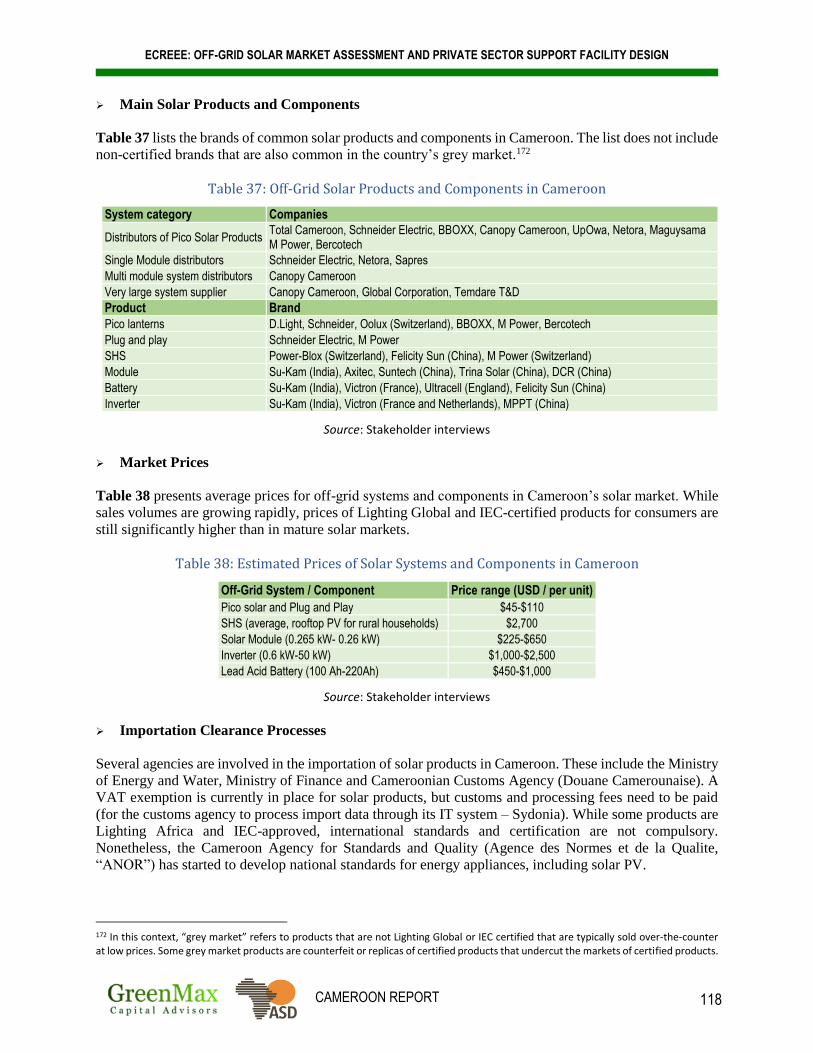
ECREEE: OFF-GRID SOLAR MARKET ASSESSMENT AND PRIVATE SECTOR SUPPORT FACILITY DESIGN
CAMEROON REPORT 118
Main Solar Products and Components
Table 37 lists the brands of common solar products and components in Cameroon. The list does not include
non-certified brands that are also common in the country’s grey market.172
Table 37: Off-Grid Solar Products and Components in Cameroon
System category Companies
Distributors of Pico Solar Products Total Cameroon, Schneider Electric, BBOXX, Canopy Cameroon, UpOwa, Netora, Maguysama M Power, Bercotech
Single Module distributors Schneider Electric, Netora, Sapres
Multi module system distributors Canopy Cameroon
Very large system supplier Canopy Cameroon, Global Corporation, Temdare T&D
Product Brand
Pico lanterns D.Light, Schneider, Oolux (Switzerland), BBOXX, M Power, Bercotech
Plug and play Schneider Electric, M Power
SHS Power-Blox (Switzerland), Felicity Sun (China), M Power (Switzerland)
Module Su-Kam (India), Axitec, Suntech (China), Trina Solar (China), DCR (China)
Battery Su-Kam (India), Victron (France), Ultracell (England), Felicity Sun (China)
Inverter Su-Kam (India), Victron (France and Netherlands), MPPT (China)
Source: Stakeholder interviews
Market Prices
Table 38 presents average prices for off-grid systems and components in Cameroon’s solar market. While
sales volumes are growing rapidly, prices of Lighting Global and IEC-certified products for consumers are
still significantly higher than in mature solar markets.
Table 38: Estimated Prices of Solar Systems and Components in Cameroon
Off-Grid System / Component Price range (USD / per unit)
Pico solar and Plug and Play $45-$110
SHS (average, rooftop PV for rural households) $2,700
Solar Module (0.265 kW- 0.26 kW) $225-$650
Inverter (0.6 kW-50 kW) $1,000-$2,500
Lead Acid Battery (100 Ah-220Ah) $450-$1,000
Source: Stakeholder interviews
Importation Clearance Processes
Several agencies are involved in the importation of solar products in Cameroon. These include the Ministry
of Energy and Water, Ministry of Finance and Cameroonian Customs Agency (Douane Camerounaise). A
VAT exemption is currently in place for solar products, but customs and processing fees need to be paid
(for the customs agency to process import data through its IT system – Sydonia). While some products are
Lighting Africa and IEC-approved, international standards and certification are not compulsory.
Nonetheless, the Cameroon Agency for Standards and Quality (Agence des Normes et de la Qualite,
“ANOR”) has started to develop national standards for energy appliances, including solar PV.
172 In this context, “grey market” refers to products that are not Lighting Global or IEC certified that are typically sold over-the-counter at low prices. Some grey market products are counterfeit or replicas of certified products that undercut the markets of certified products.

ECREEE: OFF-GRID SOLAR MARKET ASSESSMENT AND PRIVATE SECTOR SUPPORT FACILITY DESIGN
CAMEROON REPORT 119
2.4.4 Overview of Business Models
Company Approach to Market
Formal solar companies in Cameroon tend to offer a wide range of products, including solar lanterns, plug
and play solar systems and larger systems. Most companies do not specialize in a specific solar segment
but provide products and services to the entire market. The companies that were surveyed have been in
business between one and 15 years. The oldest surveyed firm has been operating in the market since 2003.
Most supply chain actors and transactions are concentrated in the cities of Yaoundé and Douala. New actors
have emerged in the market, including early-stage PAYG companies and system integrators, acting as
agents of large solar companies and distributors, while the number of local over-the-counter vendors has
also increased. While there is a relatively high number of Tier 3 companies in Cameroon, the majority of
companies operating in the country are either Tier 1 or Tier 2 companies.
For most formal solar companies, their most important clients are large institutional groups such as NGOs
and public health facilities or large high-income clients. A few firms are starting to target low-income
households as primary customers, and several are using PAYG financing to reach the base of the pyramid
(BoP) market segment. Companies that only use cash/over-the-counter sales are typically retailers selling
cheap, low-quality products without a warrantee.
Business Models
There are five primary business models utilized in the market (Table 39), although in reality solar
companies utilize a number of business models to reach a variety of clients:
• Over-the-counter cash sales include both informal and formal components. Many traders simply offer
solar products over-the-counter. Formal sector solar companies also stock modules, batteries and
balance of system and offer them over-the-counter to do-it-yourselfers and agents. In Cameroon, many
traders simply offer solar products over-the-counter, which means clients have to pay upfront. Retailers
usually prefer direct transactions with customers and are reluctant to accept installment payments,
unless they know or trust the client.
• System integrators handle large systems and projects. They design, procure and install systems which
range from high-end residential sites, to institutional power to mini-grids. Local integrators represent
international solar, inverter and battery brands with whom they partner with on projects.
• Plug and play and pico suppliers cooperate with many of the major OGS brands to distribute products
in the country.
• The PAYG sector is still in its early stages but is growing rapidly. Suppliers are building up client
bases which number in the tens of thousands and are quickly evolving to develop credit mechanisms
that fit with local income patterns. The margins are made from subscriptions of thousands of consumers
who buy systems through created accounts. The task of installation and after sales services is
undertaken by agents. Common products sold include plug and play systems that are fully designed. In
Cameroon, a few major players offer plug and play systems (e.g. Canopy Cameroon, Maguysama,
BBOXX, Fenix International).
• Consumer credit offered by suppliers through a financial institution is also utilized by some suppliers
in Cameroon; companies have partnered with the Société Camerounaise d’Équipment to recollect
monthly repayment from customers.
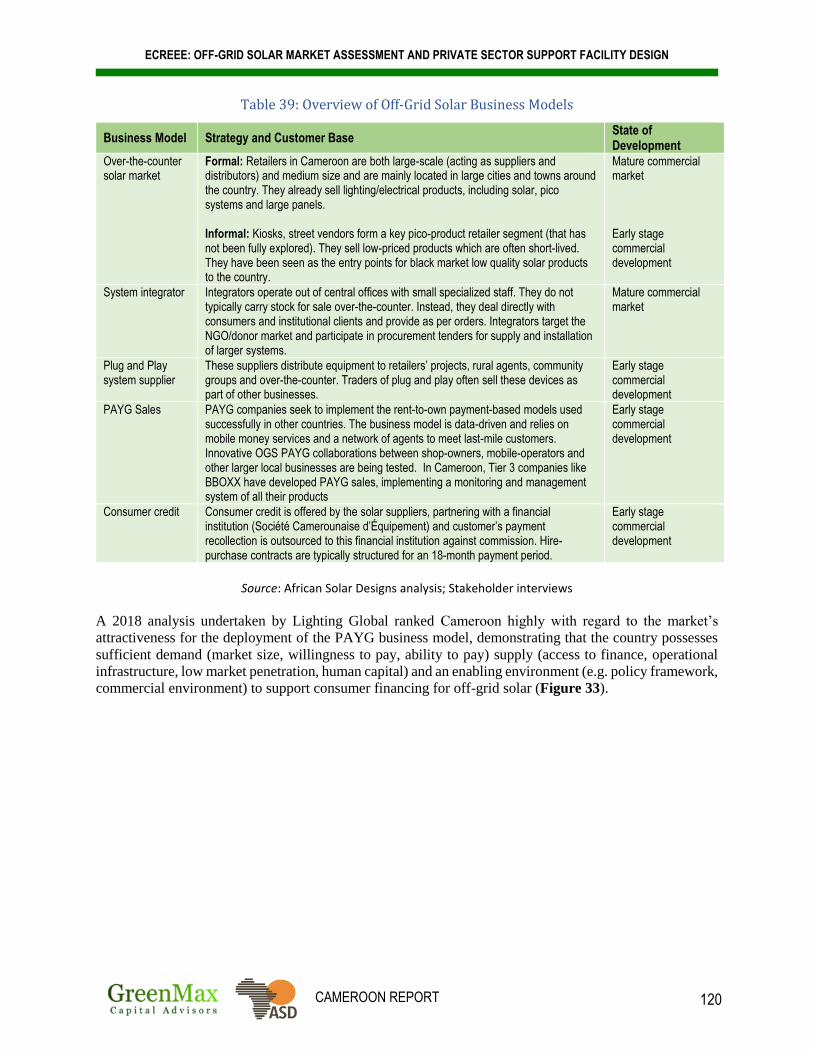
ECREEE: OFF-GRID SOLAR MARKET ASSESSMENT AND PRIVATE SECTOR SUPPORT FACILITY DESIGN
CAMEROON REPORT 120
Table 39: Overview of Off-Grid Solar Business Models
Business Model Strategy and Customer Base State of Development
Over-the-counter solar market
Formal: Retailers in Cameroon are both large-scale (acting as suppliers and distributors) and medium size and are mainly located in large cities and towns around the country. They already sell lighting/electrical products, including solar, pico systems and large panels. Informal: Kiosks, street vendors form a key pico-product retailer segment (that has not been fully explored). They sell low-priced products which are often short-lived. They have been seen as the entry points for black market low quality solar products to the country.
Mature commercial market Early stage commercial development
System integrator Integrators operate out of central offices with small specialized staff. They do not typically carry stock for sale over-the-counter. Instead, they deal directly with consumers and institutional clients and provide as per orders. Integrators target the NGO/donor market and participate in procurement tenders for supply and installation of larger systems.
Mature commercial market
Plug and Play system supplier
These suppliers distribute equipment to retailers’ projects, rural agents, community groups and over-the-counter. Traders of plug and play often sell these devices as part of other businesses.
Early stage commercial development
PAYG Sales PAYG companies seek to implement the rent-to-own payment-based models used successfully in other countries. The business model is data-driven and relies on mobile money services and a network of agents to meet last-mile customers. Innovative OGS PAYG collaborations between shop-owners, mobile-operators and other larger local businesses are being tested. In Cameroon, Tier 3 companies like BBOXX have developed PAYG sales, implementing a monitoring and management system of all their products
Early stage commercial development
Consumer credit Consumer credit is offered by the solar suppliers, partnering with a financial institution (Société Camerounaise d’Équipement) and customer’s payment recollection is outsourced to this financial institution against commission. Hire-purchase contracts are typically structured for an 18-month payment period.
Early stage commercial development
Source: African Solar Designs analysis; Stakeholder interviews
A 2018 analysis undertaken by Lighting Global ranked Cameroon highly with regard to the market’s
attractiveness for the deployment of the PAYG business model, demonstrating that the country possesses
sufficient demand (market size, willingness to pay, ability to pay) supply (access to finance, operational
infrastructure, low market penetration, human capital) and an enabling environment (e.g. policy framework,
commercial environment) to support consumer financing for off-grid solar (Figure 33).

ECREEE: OFF-GRID SOLAR MARKET ASSESSMENT AND PRIVATE SECTOR SUPPORT FACILITY DESIGN
CAMEROON REPORT 121
Figure 33: PAYG Market Attractiveness Ranking for Select African Countries173
Source: Lighting Global
Company Financing
With more companies utilizing the PAYG model to sell off-grid products and systems on credit (sometimes
with lengthy repayment periods), it can become difficult for companies to finance their operations and grow
their business. In addition to financing customer payment options, suppliers also require significant working
capital to purchase equipment, conduct marketing campaigns, and cover field costs. Distributors of
international OGS products receive basic trade finance and marketing support options, though typically
limited. More than 60% of surveyed companies in Cameroon are self-financed with cash flow covered by
shareholders and founders and from on-going business transactions. A few of the suppliers are supported
by FI/MFI loans, donor funding/grants and CSR but these resources are limited for most. FGD participants
estimated that USD 170,000 (FCFA 100 million) is necessary for large suppliers to have sufficient
inventory.
While large international companies operating in the country have access to loans, equity and other
international funds to finance their growth and development, many local companies in Cameroon are unable
to raise funds to expand their business, as bank loans are either unavailable or too expensive. Local
financiers have yet to develop an appetite for the solar sector, as local banks are extremely conservative
with regard to solar enterprises. Commercial financiers – including banks and MFIs – are not set up to
service solar distributor financing requirements. Local SME financing is not available to support businesses
in their growth phase. If it was available, companies would make use of cash-flow/credit line financing
against the signed contracts with major commercial clients, large NGOs or donors.
When importing, companies are exposed to considerable FOREX risks because they must cover costs of
equipment in foreign currency. When projects are delayed, during seasonal low-income periods or when
products are delayed in port, dealers must bear FOREX losses. The lack of consumer financing
arrangements impedes the growth of the solar market because distributors must take all finance risks and
cannot plan with commercial or MFI financing to grow their business.
173 “PAYG Market Attractiveness Index Report,” Lighting Global, World Bank Group (2018): https://www.lightingglobal.org/wp-content/uploads/2018/11/FINAL-PAYG-MAI-2018-Report.pdf

ECREEE: OFF-GRID SOLAR MARKET ASSESSMENT AND PRIVATE SECTOR SUPPORT FACILITY DESIGN
CAMEROON REPORT 122
Evolving Business Models
Cameroon presents a fertile ground for new business model innovations. New models will require
partnerships between developers, solar distributors, telecommunications companies, commercial finance
and the retail sector. One of the results of the FGD discussions was a list of potential partnerships that can
be explored to enhance existing and new business models (Table 40).
Table 40: Evolving Off-Grid Solar Business Models
Partnership Description
Solar Distributors • Improve efficiency within the supply/distribution chain, positioning them to be able to manage distribution, seek potential for long-term credit lines and capital infusions
• Develop better contract terms between large local suppliers in Cameroon with foreign manufacturers • Test new sales and distribution strategies that increase sales at minimum cost • Prove solar market potential, ultimately attracting a strong group of competing players that scale up solar
product access
Commercial financiers
• Commercial financiers are key to unlocking working capital and consumer finance and enabling the market by providing both the funds and means of transferring these funds
• Develop financial products for both distributors (financing for working capital needs) and off-grid solar consumers (consumer financing for purchase of systems)
Telecommunications companies and technology providers
• Bring together telecommunications operators, mobile service providers and technology companies and solar supplier/distributor companies to develop Pay-As-You-Go technology platforms
• Encourage telecommunications partners to distribute off-grid solar systems through their existing network of agents
Business/Retail Sector
• Comprises networks of retail stores that cover the entire country and provide all types of domestic and agriculture goods for the rural community
• Encourage linkages between specialized solar companies and these networks so as to facilitate the increase of the distribution network at a lowest cost possible
• Provide promotional tools for local retailers to promote solar products to households/SMEs • Facilitate microfinancing for the domestic market through these networks
Advocacy Bodies • Capitalize on GoC and donor efforts to (i) facilitate interagency dialogue and oversee policy proposals on new business models and (ii) enhance legislative changes to support the sector
Source: Focus Group Discussions; Stakeholder interviews; African Solar Designs analysis
2.4.5 The Role of Non-Standard Players in the Market
Stakeholder interviews and FGDs were unable to estimate the over-the-counter informal market in terms
of volumes and cash sales. Informal traders sell modules, inverters, batteries and pico-products. Given that
informal sellers are largely unregulated and do not report sales figures, very little data is available on this
sector. The sector, however, is very influential as it also controls the delivery of lighting products imported
mainly from East Asia. Informal traders understand growing consumer interest in solar solutions and sell
competitively-priced low-quality products. Informal traders do not actively cooperate with the GoC or work
on formal projects.
Informal traders play an important role in the market because they respond to consumer demand rapidly.
Many traders do provide IEC-approved components – this means knowledgeable consumers and
technicians can assemble quality systems from over-the-counter selections of components that informal
traders sell. It is notable that some informal traders are gaining skills and improving product offerings. The
presence of a large informal market, however, leads to issues with equipment quality that hamper
development of the country’s OGS market.
ECREEE: OFF-GRID SOLAR MARKET ASSESSMENT AND PRIVATE SECTOR SUPPORT FACILITY DESIGN
CAMEROON REPORT 123
2.4.6 Equipment Quality and the Impact of Uncertified Equipment
Cameroon’s solar market is largely dominated by informal market players, selling equipment through
electronics shops, hardware stores, kiosks and even street vendors. The over-the-counter sales strategies of
this group is to provide low-cost, fast moving products. As a sector, informal retailers provide widely-used
lighting products mainly from East Asia to rural customers. However, most of their product range does not
meet Lighting Global standards. Moreover, given that the most of their lighting products are low-cost and
short-lived, they also ignore and avoid regulations and their products lack warrantees.
Most of the suppliers who were surveyed cited competition from counterfeit products as a significant barrier
to market growth, despite lower prices of certified products due to tax exemption. Poor-quality and/or
counterfeit products negatively impact the entire market by creating a misperception about product quality,
which in turn undermines consumer confidence in solar equipment. Moreover, grey-market traders
significantly undercut the prices of registered businesses who are still subject to taxes and import duties.
Low prices of over-the-counter products make compliant products uncompetitive as many customers opt to
buy non-compliant goods that are cheaper.
In Cameroon, surveyed stakeholders indicated that a majority of low-quality products were illegally
imported from Nigeria. This suggests that there is a role for the agency in charge of certifying the quality
of products entering Cameroon, the Cameroon National Agency for Norms and Standards (ANOR), to assist
in enforcement of standards through mediation efforts between regulatory bodies, market players and
consumers. To date, ANOR does not require neither products entering Cameroon to have the World Bank
Lighting Africa certification or IEC quality standards. GIZ and the Fraunhofer Laboratory on Solar Energy
Systems have provided guidelines and recommendations on the general quality requirements for
products.174 One main step forward will involve putting in place standards and norms on the quality of solar
components that are compulsory.
In 2017, ANOR published “the National Program for the Elaboration of Standards in Cameroon.”175 The
program includes 18 new standards directly related to solar PV equipment, which are still under
development as of 2018. This model would be based on international standards and structured according to
European standards and French electrical regulations (UTE standards). The adoption of these new standards
and their enforcement is expected to facilitate the implementation of duty exemptions for IEC-certified
products and improve quality control and certification processes in the country. Focus group participants
highlighted the need for an agency or association to be established that could assist MINEE/AER/ANOR
with enforcement of standards through mediation efforts between regulatory bodies, market players and
consumers. GOGLA has also recommended the adoption of a legal framework that enables companies or
public authorities to prosecute distributors of counterfeit products.176
2.4.7 Local Capacity to Manage Business Development, Installation and Maintenance
Cameroon’s nascent solar market is poised to grow if requisite technical assistance (TA) is provided. The
existing market environment is challenging for solar companies. To operate effectively, companies need a
significant amount of both local and international technical and financial expertise, and an ability to make
practical decisions about their operations. Companies face a number of technical competency requirements
174 “Amélioration de la flotte de systèmes solaires UpOwa installés dans l’ouest du Cameroun et étude comparative avec d’autres systèmes pico photovoltaÏques,” Mémoire de Sophie Blandine Nkouaga Tomta, UpOwa and 2iE, (2016): http://documentation.2ie-edu.org/cdi2ie/opac_css/doc_num.php?explnum_id=2081 175 “Programme national d’élaboration des normes au Cameroon,” Agence des Normes et de la Qualité (ANOR), (2017): http://www.anorcameroun.info/documents/PNEN_FINAL.pdf 176 “Providing energy access through off-grid solar: guidance for governments,” GOGLA, Lighting Global and World Bank, (2018): https://www.gogla.org/sites/default/files/resource_docs/energy_access_through_off-grid_solar_-_guidance_for_govts.pdf
ECREEE: OFF-GRID SOLAR MARKET ASSESSMENT AND PRIVATE SECTOR SUPPORT FACILITY DESIGN
CAMEROON REPORT 124
– the selection of approaches and solar PV technologies, the design of their associated marketing
instruments and the implementation of related initiatives.
The synergy with formal training institutions has yet to be fully explored and most of the players in the
industry are not adequately equipped with the skills needed to design and assess policies, understand and
deploy technologies, grasp electricity user needs and ability to pay, and operate and maintain systems.
FGD participants acknowledged a number of initiatives undertaken by SNV, GIZ and Total to support local
capacity in the country. SNV recently undertook a study that highlighted gaps in training and capacity,
focusing on capacity building for the retail sector to develop partnerships or ventures with larger
distributors. The aim of the TA is to empower small distributors by building a strong pico solar distribution
network, selecting a marketing strategy (tailored by customers and type of products). The GIZ-Total
program (2012-2014) provided training for 169 solar lighting value chain entrepreneurs and 50
microenterprises in Cameroon to support the distribution of pico solar products. The training covered
business and technical skills, with a focus on solar lantern sales, repair and maintenance issues.177
Some of the other areas where TA and capacity building is needed to support growth of the solar market
include (but are not limited to) the following:
• Provision of TA and training to public and private partners on the development of OGS power projects.
• Support in development of vocational training curricula for solar technicians by working with education
institutions to adopt the curricula and implement training programs. This support could include
development of community training materials to raise community awareness about the importance of
solar PV technologies, the various uses ranging from household use, productive uses and institutional
uses of energy, and related safety aspects.
• In order to ensure that interaction with local communities is seamless, the collaborating partners could
develop a management training manual for villages addressing the different aspects of solar
technologies as well. This could include supporting technicians with troubleshooting posters for on-site
display that could help identify and tackle operational issues as they arise.
• Solar technicians were noted to be sparse for some areas and lacking in other areas; as a result, solar
businesses send out teams from major cities/towns for any installation and maintenance work. Training
people based locally in remote areas to support O&M of solar systems (e.g. battery replacement) could
help address this issue and expedite market uptake.
2.4.8 Capacity Building Needs of the Supplier Market Segment
An analysis of the supplier market segment revealed a number of interrelated challenges, including
financial, capacity, awareness and regulatory challenges. The focus groups and supplier surveys found that:
• While the industry’s largest players have access to various sources of financing, local financing is
largely not available (or affordable) to support the sector’s development; as a result, many companies
are self-financed and do not have the working capital they need to grow and expand their operations.
• The reluctance of banks to grant loans to solar companies is another major challenge. For solar
companies to successfully utilize the PAYG business model, they need significant working capital.
• Reasons for denied finance by FIs included lack of collateral, lack of expertise in finance, the high cost
involved in small transactions, and risk aversion; capacity building of local FIs is critical
177 “Energy-Cameroon, Improving access to solar energy through a base of the pyramid approach,” GIZ, (2013): https://energypedia.info/images/b/be/Total_Cameroon.pdf
ECREEE: OFF-GRID SOLAR MARKET ASSESSMENT AND PRIVATE SECTOR SUPPORT FACILITY DESIGN
CAMEROON REPORT 125
• The lack of finance was noted to have a major negative impact on solar companies: larger suppliers do
not have sufficient stock (and neither do the smaller distributors and vendors) and therefore they cannot
ensure the availability of products to customers.
• Consumer financing is also needed, mainly for households but also for institutional/social users due to
their need for larger and therefore more expensive systems
• Knowledge, technical capacity and expertise is possessed by a few professionals in the industry
working for large established solar companies; the majority of vendors lack the expertise or knowledge
necessary to adequately service the market. In Cameroon, FGD participants and interviewees reported
a lack of information to properly service client needs as a key barrier, expressing the need for a platform
to facilitate the sharing of information among market actors.
Table 41 presents various areas of support and associated capacity building for the OGS supply chain in
Cameroon. Attention should be given to the following:
• Importers: Provide financing to enable gradual payment to reduce high up-front cost burdens for
importers. Financing and offering a credit guarantee to large importers and suppliers will allow them
to offer better credit terms to smaller distributors and retailers, allowing them to in turn extend
repayments to customers (e.g. via PAYG).
• Over-the-counter/ System Integrators/ PAYG: Focus on growing the number of solar technicians
who are adequately skilled to support the supplier network. Unskilled technicians have connections
with solar distributors and retailers who subcontract them (these often involves unlicensed technicians.)
Formalizing this through regulation to require only licensed technicians to design and install solar PV
systems is critical. This should be complemented by equally robust efforts to build the capacity of all
stakeholders.
• Consumers: Deal with sociotechnical barriers: Although PV technology has advanced tremendously
in the last decades, there are still several sociotechnical barriers to adoption, including the local
conditions of the user’s environment, the political and financial arrangements of the market. Like most
countries in the region, various counterfeit solar PV products have infiltrated the market.
Implementation of the existing regulations on quality/standards could further boost market growth.
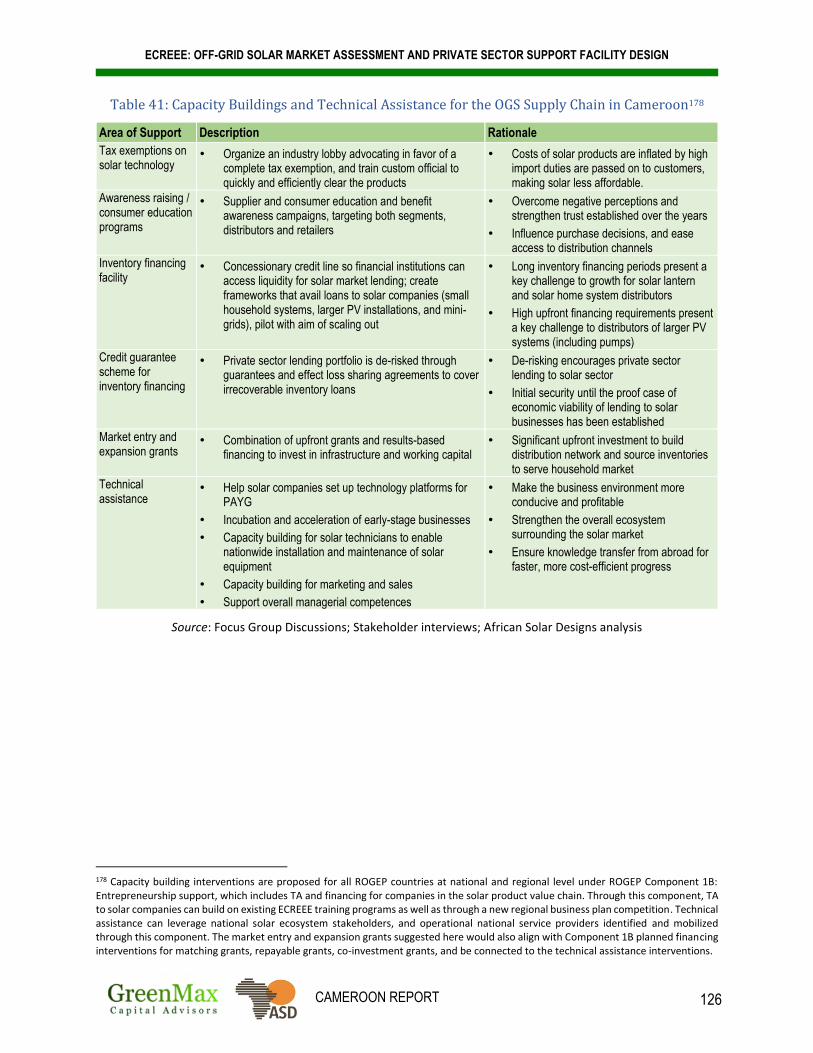
ECREEE: OFF-GRID SOLAR MARKET ASSESSMENT AND PRIVATE SECTOR SUPPORT FACILITY DESIGN
CAMEROON REPORT 126
Table 41: Capacity Buildings and Technical Assistance for the OGS Supply Chain in Cameroon178
Area of Support Description Rationale
Tax exemptions on solar technology
• Organize an industry lobby advocating in favor of a complete tax exemption, and train custom official to quickly and efficiently clear the products
• Costs of solar products are inflated by high import duties are passed on to customers, making solar less affordable.
Awareness raising / consumer education programs
• Supplier and consumer education and benefit awareness campaigns, targeting both segments, distributors and retailers
• Overcome negative perceptions and strengthen trust established over the years
• Influence purchase decisions, and ease access to distribution channels
Inventory financing facility
• Concessionary credit line so financial institutions can access liquidity for solar market lending; create frameworks that avail loans to solar companies (small household systems, larger PV installations, and mini-grids), pilot with aim of scaling out
• Long inventory financing periods present a key challenge to growth for solar lantern and solar home system distributors
• High upfront financing requirements present a key challenge to distributors of larger PV systems (including pumps)
Credit guarantee scheme for inventory financing
• Private sector lending portfolio is de-risked through guarantees and effect loss sharing agreements to cover irrecoverable inventory loans
• De-risking encourages private sector lending to solar sector
• Initial security until the proof case of economic viability of lending to solar businesses has been established
Market entry and expansion grants
• Combination of upfront grants and results-based financing to invest in infrastructure and working capital
• Significant upfront investment to build distribution network and source inventories to serve household market
Technical assistance
• Help solar companies set up technology platforms for PAYG
• Incubation and acceleration of early-stage businesses
• Capacity building for solar technicians to enable nationwide installation and maintenance of solar equipment
• Capacity building for marketing and sales
• Support overall managerial competences
• Make the business environment more conducive and profitable
• Strengthen the overall ecosystem surrounding the solar market
• Ensure knowledge transfer from abroad for faster, more cost-efficient progress
Source: Focus Group Discussions; Stakeholder interviews; African Solar Designs analysis
178 Capacity building interventions are proposed for all ROGEP countries at national and regional level under ROGEP Component 1B: Entrepreneurship support, which includes TA and financing for companies in the solar product value chain. Through this component, TA to solar companies can build on existing ECREEE training programs as well as through a new regional business plan competition. Technical assistance can leverage national solar ecosystem stakeholders, and operational national service providers identified and mobilized through this component. The market entry and expansion grants suggested here would also align with Component 1B planned financing interventions for matching grants, repayable grants, co-investment grants, and be connected to the technical assistance interventions.

ECREEE: OFF-GRID SOLAR MARKET ASSESSMENT AND PRIVATE SECTOR SUPPORT FACILITY DESIGN
CAMEROON REPORT 127
2.5 Key Market Characteristics
This section reviews the main characteristics of the off-grid solar market in Cameroon, including a summary
of key barriers to and drivers of market growth and an overview of gender considerations. The synopsis
presented below is largely based on feedback obtained from interviews with local officials and industry
stakeholders, as well as focus group discussions and surveys assessing the demand and supply side of the
market (see Annex 2).
2.5.1 Barriers to Off-Grid Solar Market Growth
Table 42 examines the key barriers to OGS market growth from the perspective of both the demand and
supply side of the market. See Section 1.3.5 for an overview of the gaps in the country’s off-grid policy
and regulatory framework.
Table 42: Key Barriers to Off-Grid Solar Market Growth in Cameroon
Market Barrier Description
Demand179
Lack of supportive financial incentives for solar
• Costs of solar products are inflated by high import duties; costs are passed on to customers, making solar less affordable
• Fossil fuel subsidies serve as an impediment to development of safe, clean energy access alternatives as diesel generators compete directly with solar technology alternatives
Consumers are unable to afford solar systems
• Low-income consumers, particularly in rural areas, lack of access to finance • Purchasing solar products of all varieties among end-consumers remains relatively low.
Lack of initial funding by HHs, businesses and institutions for the initial capital investment
• Relatively high costs of OGS systems • Consumers rather choose cheaper one-off solutions – like generators and fuel – rather than
more expensive up-front solutions that will be cheaper long-term (especially with incremental payments, e.g. PAYG)
A lack of understanding of and trust in solar solutions among consumers impedes development of the market
• There is still considerable lack of general awareness about solar solutions • There is an inability to distinguish between solar products or product quality • Consumers lack information about the most suitable design options, funding options, PAYG
benefits and options, points of sales and support, etc. • Products are still not widely available in rural areas, so consumers are unfamiliar with them • Any poor history / track record with OGS will deter consumers from taking expensive risks
Informal sector competition and market spoilage
• The non-standard / unlicensed market still accounts for a majority of OGS product sales • Consumers need to understand the quality and value issues of quality solar products vis-a-vis
inferior over-the-counter lighting products. Educated consumers drive markets.
Lack of experience in maintaining the systems and sourcing qualified technicians
• A sustainable approach to O&M is critical for long-term success
Supply Technical capacity • Technical skills lack through the supply chain within the sector, affecting both the upstream,
midstream and downstream, thus adversely affecting the ability of the sector to pick up and grow. Majority of the firms decry lack of adequate number of technicians to support the downstream side of the market
Transportation costs • High transportation costs of inventory deter new entrants; devices and equipment are shipped either from China or from Europe, creating long delivery lead times of up to three months and long inventory holding times once products have arrived in country
• Typical supplier payment terms are 30% upon placement of the production order and the remaining 70% upon shipment before any cargo has even left its port of origin.
• Transport by container would reduce the costs dramatically; however, this requires purchases in bulk, which local solar distributors aren’t able to make without financing
179 The barriers described here apply to some combination of the Household, Institutional, and SME / Productive Use market segments

ECREEE: OFF-GRID SOLAR MARKET ASSESSMENT AND PRIVATE SECTOR SUPPORT FACILITY DESIGN
CAMEROON REPORT 128
Poor sales and performance history of the sector
• A lack of investment into the sector prevents growth; this is due to perceived high risks resulting primarily from lack of track record of sales
• Solar distributors have limited alternative financing options. Solar suppliers are unwilling to provide trade financing while commercial financiers in Cameroon, including banks and MFIs, are currently not positioned to service the financing requirements of solar distributors
Company finance • Entrants into the sector require significant working capital, which is not readily available • Equity investments are needed into the local distribution/sales companies. It is quite easy to
obtain debt financing and other loans once the solar companies have sufficiently grown and reached the “level of interest” of the larger funds; however, until the number of customers and sales volumes are reached, they need some equity investors to share higher risks with the original founders of the companies
Informal sector competition and market spoilage
• Several informal entrepreneurs have taken advantage of high import duties by illegally importing low-quality solar products ranging from solar lanterns to larger home installations
• Black-market traders are able to significantly undercut the prices of registered businesses who are still subject to high taxes and import duties
• These products are largely low-grade, failure-prone knock-offs with short product lifespans (sometimes of little more than a few weeks)
• Damaged perceptions of solar systems durability and reliability hinders market uptake
Lack of data • No clear figures on the actual needs, actual usage or experience of consumers • The data for the private market players on the available opportunities is very limited and not
concise due to fragmented data
High ‘transaction costs’ for solar installations
• Cash-flow and bureaucratic hurdles for the local suppliers • Sales and O&M services in remote areas can be costly, especially for small businesses
Source: Focus Group Discussions; Stakeholder interviews; African Solar Designs analysis
2.5.2 Drivers of Off-Grid Solar Market Growth
Table 43 is a summary of the key drivers of OGS market growth in the country.
Table 43: Key Drivers of Off-Grid Solar Market Growth in Cameroon
Market Driver Description
Strong off-grid electricity demand
• Economic development and demand for electricity in Cameroon will continue to increase • Consumers from every market segment are aware of the high costs associated with energy
access and consumption and are willing to take on quality, cost-effective alternatives
Willing government to support the industry
• The Government is viewed by sector players as forward-leaning and action-oriented, creating and supporting momentum and positive attention for the solar sector, which helps attract substantial and sustained investment to the market
Increased utilization of PAYG and innovative business models
• Cameroon’s off-grid market is rapidly growing from the increased utilization of consumer financing solutions (PAYG) which are increasingly leveraging growing rates of mobile phone ownership and mobile internet usage in rural areas
Engaged and open-minded private sector
• Local OGS suppliers are actively engaged in efforts to improve / reform the sector, accept new business models and strategies and take measures to attract external investment
Strong donor/NGO presence • The presence and wide range of donor-funded activities in the country’s off-grid sector provides confidence that the market will continue to grow
Source: Focus Group Discussions; Stakeholder interviews; African Solar Designs analysis

ECREEE: OFF-GRID SOLAR MARKET ASSESSMENT AND PRIVATE SECTOR SUPPORT FACILITY DESIGN
CAMEROON REPORT 129
2.5.3 Inclusive Participation180
Given that the off-grid market is only beginning to emerge in Cameroon, women are not yet highly engaged
in the sector. The overall lack of inclusive participation in the off-grid space is attributable to a wide range
of factors. In a 2018 survey that assessed barriers to women’s participation in expanding energy access,
nearly three-quarters of respondents cited cultural and social norms as the most common barrier, which
reflects the need for gender mainstreaming (Figure 34). More than half of the women surveyed in Africa
identified a lack of skills and training as the most critical barrier, compared to just one-third of respondents
globally.181
Figure 34: Key Barriers to Women’s Participation in Expanding Energy Access
Source: International Renewable Energy Agency
As a starting point, electrification (whether grid-connected or off-grid) increases access to information,
which can help challenge gender norms and increase the autonomy of women.182 Access to electricity can
save women time and/or enable them to complete domestic activities in the evening, thus allowing them to
participate in paid work during the day. Many opportunities also exist for women in the productive use of
energy, including solar-powered machinery that can support productive applications, particularly in the
agricultural sector in the areas of irrigation, water pumping, and milling/food processing.183
Women, who are often the primary energy users in households, have a strong influence on the energy value
chain; they can take on different roles, including as engaged end-users, community mobilizers, technicians,
180 See Annex 4 for more details 181 “Renewable Energy: A Gender Perspective,” International Renewable Energy Agency, (2019): https://irena.org/-/media/Files/IRENA/Agency/Publication/2019/Jan/IRENA_Gender_perspective_2019.pdf 182 “Productive Use of Energy in African Micro-Grids: Technical and Business Considerations,” USAID-NREL and Energy 4 Impact, (August 2018): https://sun-connect-news.org/fileadmin/DATEIEN/Dateien/New/productive_use_of_energy_in_african_micro-grids.pdf 183 “Turning promises into action: Gender equality in the 2030 Agenda for Sustainable Development,” UN Women, (2018): http://www.unwomen.org/-/media/headquarters/attachments/sections/library/publications/2018/sdg-report-fact-sheet-sub-saharan-africa-en.pdf?la=en&vs=3558

ECREEE: OFF-GRID SOLAR MARKET ASSESSMENT AND PRIVATE SECTOR SUPPORT FACILITY DESIGN
CAMEROON REPORT 130
and employees and entrepreneurs.184 Women also have unique social networks that typically offer greater
access to rural households, which can be important to deploying energy access solutions.
Despite these opportunities, women are typically not part of key decision-making processes at nearly all
levels of society. Women tend to have limited access to land and capital, as these are often determined by
traditional and religious customs that remain deeply rooted in patriarchal traditions. Women also have more
difficulty accessing finance due in part to lack of collateral required to guarantee payment and often resort
to obtaining loans from money lenders who charge exorbitant interest rates.185 The gender analysis
undertaken in Cameroon corroborated many of these trends, and revealed several interrelated challenges
that women face in the off-grid sector:
• Women lack access to skills, technical capacity, and education/training
• Women broadly lack access to capital, asset ownership, collateral and credit (e.g. to start a business)186
• Extensive household responsibilities reduce their ability to generate income and service credit
• Financial literacy among women remains low and there is a lack of education and information available
to women on access to financial resources
A number of initiatives exist that seek to address some of these challenges and help improve the rate of
participation among women in Cameroon’s off-grid sector.
Green Girls is an organization established in 2016 with support from the Women’s African
Entrepreneurship Program that provides solar technology and water conservation training to schoolgirls
throughout the country.187 Through the Global Environment Facility (GEF) Small Grants Programme,
UNDP partnered with the Rural Women Development Center to provide solar-powered agricultural
processing machines to women in the southwestern region of the country for drying cocoa. The program
also sponsored associated training / workshops.188
Another related program is the “Rural women and sustainable energy program in Cameroon” (Réseau des
femmes élues locales du Cameroun, “REFELA”), which offers a wide range of services and activities,
include organization of training courses dedicated specifically to member cities of REFELA network to
strengthen energy sector skills and practical tools. The program launched pilot projects in 2016 in the cities
of Bangante and Fokoue in western Cameroon.189
The Africa Renewable Energy Access Gender Program, managed by the World Bank’s Africa Energy Unit
and funded by the World Bank Energy Sector Management Assistance Program (ESMAP) program, is
active in West Africa with plans to expand its operations into Cameroon.190
184 “Renewable Energy: A Gender Perspective,” International Renewable Energy Agency, (2019): https://irena.org/-/media/Files/IRENA/Agency/Publication/2019/Jan/IRENA_Gender_perspective_2019.pdf 185 See Section 3.2 for more details. 186 This is a huge challenge for women in the country, particularly in rural areas, where the population depends on seasonal income from the agricultural sector for their livelihood, which makes loans inaccessible or only available at extremely high interest rates. This issue is examined in further detail in Section 3.2. 187 “Green Girls Project empowers Cameroon women with skills in Renewable Energy,” (March 2017): https://observers.france24.com/en/20170328-ngo-cameroon-empowering-women-training-them-renewable-energy 188 “Empowering Communities through Solar Energy Electrification,” UNDP, https://sgp.undp.org/spacial-itemid-projects-landing-page/spacial-itemid-project-search-results/spacial-itemid-project-detailpage.html?view=projectdetail&id=15145 189 https://www.fondation.veolia.com/en/pilot-sustainable-energy-project-bangangte-and-fokoue 190 “Mapping of Energy Initiatives and Programs in Africa,” Africa-EU Energy Partnership, (May 2016): http://www.euei-pdf.org/sites/default/files/field_publication_file/annex_5_aeep_mapping_of_energy_initiatives_overview_of_initiatives_0.pdf
ECREEE: OFF-GRID SOLAR MARKET ASSESSMENT AND PRIVATE SECTOR SUPPORT FACILITY DESIGN
CAMEROON REPORT 131
III. ANALYSIS OF THE ROLE OF FINANCIAL INSTITUTIONS
This section begins with an introduction to financial products for the off-grid sector, including for end-users
and stand-alone solar companies (Section 3.1). This is followed by a comprehensive overview of the
country’s financial market and commercial lending environment (Section 3.2), including an assessment of
financial inclusion and a summary any off-grid solar lending activity/programs. Section 3.3 examines other
financial institutions (in addition to commercial banks) that are active in the country. Section 3.4 presents
a summary of key findings from the Task 3 analysis. The data presented in this section was obtained through
desk research as well as interviews with/surveys of key officials and representatives from local financial
institutions. Annex 3 provides an overview of the Task 3 methodology.
3.1 Introduction to Financial Products for the Off-Grid Sector
A wide range of financial products can be utilized to support development of the stand-alone solar sector
in West Africa and the Sahel. These may include instruments such as matching grants, contingent loans,
results-based financing (grants reimbursing cost after completion of work), equity investment (seed capital
and later stages), concessional debt (subsidized interest or forgiveness of a portion of principal repayment),
short-term commercial credits for inventory purchases and working capital, trade finance solutions (from
export credit agencies or private trade funders) and medium-term loans secured on assets or receivables
from a portfolio of installed projects. This “financial supply chain” consists of capital delivered at different
stages of stand-alone solar enterprise development, by financial sector players that have risk appetites well
matched to each specific stage. This section focuses on the roles of commercial financial institutions (FIs)
and microfinance institutions (MFIs) in providing debt financing to off-grid solar consumers and
enterprises.
3.1.1 Financial Products for End-Users
In order to determine what kinds of debt instruments are available to support stand-alone solar purchases
for end-users, it is important to identify the different end-users.
Households
Households represent the majority of end-users in the West Africa and Sahel region and the level of cash
flow this market segment has available for energy access depends heavily upon the formal and/or informal
economic activity they are engaged in. In general, the ability for households to pay from their own internal
resources declines as their distance from urban centers increases and their opportunity to participate in the
formal economy with regular cash income declines. Meanwhile, external funding is typically not available
for rural households as they remain largely off of the radar of mainstream FIs (with the exception of
households where members have regular sources of income from urban centers). MFIs in fact are generally
more appropriate sources of household finance. Most of a given country’s households can access external
funding typically only through microfinance or informal financial services such as local money lenders,
cooperative societies and rotating savings and credit associations.
Public Institutions
The main public institutional facilities that require funding for off-grid electrification are directly linked to
national, provincial or local administrations and budgets, including schools, health facilities, and other
public buildings/lighting systems. Sustainable energy finance for community facilities is typically provided
through a ministry, department or agency if the facility falls under the purview of the national or provincial

ECREEE: OFF-GRID SOLAR MARKET ASSESSMENT AND PRIVATE SECTOR SUPPORT FACILITY DESIGN
CAMEROON REPORT 132
budget. The challenge is that budget resources are severely limited and constantly face competing priorities;
as a result, many public community facilities are left without access to energy.
In order to implement financial products targeting public institutional projects, a few critical questions need
to be answered, such as who would be the borrower and whether there are sufficient financial resources
available in the budget to pay for the service over a long period of time. This question is also important if
these public community facilities end up being included alongside households as part of a local mini-grid.
Productive Use
Financial instruments for SMEs as end-users of sustainable energy represent a very important category of
products in that they tend to be commercially viable and are thus important for the long-term sustainability
of energy systems. While households and community facilities use energy primarily for consumption, often
resulting in other sources of income or budget being allocated to cover the cost of service, SMEs use energy
for income-generating activities and can therefore cover electricity costs through the income generated by
their business. An enterprise with positive cash flows gives financiers more comfort as well as an
opportunity to design financial instruments that are commercial in nature. A loan product with parameters
that match the company’s ability to service the debt would be a strong and commercially viable option.
MFIs often provide short-term loans to microenterprises on this basis while FIs often limit their lending to
SMEs with strong balance sheets and available collateral.
Commercial and Industrial
Commercial and industrial (C&I) facilities such as industrial plants, mining operations, shopping malls,
logistics and distribution centers or commercial office buildings generally have considerable power
consumption requiring energy supply from much larger solar systems that can range from several hundred
kW to several MW in capacity. Where there is particularly high cost advantage for stand-alone solar systems
over existing energy supply (i.e. vs. diesel generators), some C&I facility owners may find the payback of
these investments so attractive that they will seek to purchase the solar power plant outright, often requiring
debt financing to complete the transaction. This entails a corporate loan backed by the full faith and credit
of the company, a pledge on the installed assets and usually supplemented by additional collateral and
personal guarantees posted by the C&I facility owners. Many commercial FIs will offer credits to their
existing C&I customers for this purpose but the C&I facility loan applicants are often unable or unwilling
to post the required collateral for this specific purpose as their assets may already be encumbered for other
business needs.
3.1.2 Financial Products for Suppliers/Service Providers
The stand-alone solar sector remains nascent in most markets across West Africa and the Sahel. The
companies offering standalone solar products and energy services are therefore often at start-up or early
development stage. Overall by number of players, small indigenous entrepreneurs are well in the majority;
however, a few international companies dominate the overall market share. Most equipment is imported
with purchases denominated in hard currency, while sales to consumers – whether on a direct purchase,
Lease-to-Own (LTO) or Pay-As-You-Go (PAYG) basis – are almost always in local currency. At start-up
or early stages of operation, local entrepreneurs, although in need of funding, are usually not ready to take
on debt financing and should rely more on seed capital investment and grants until they are able to generate
an initial book of business. Once orders begin to materialize, these enterprises have growing funding needs
suitable for debt financing instruments which may include the following:
ECREEE: OFF-GRID SOLAR MARKET ASSESSMENT AND PRIVATE SECTOR SUPPORT FACILITY DESIGN
CAMEROON REPORT 133
Working Capital
All entrepreneurs need working capital to fuel their business growth and cover basic overheads for
operations, marketing and sales. Throughout West Africa and the Sahel, there is a dearth of working capital
financing for businesses in all sectors, and the situation is no different for stand-alone solar companies.
When available, working capital loans have very short tenors of 3-12 months, must be secured on
confirmable cash flows, have difficult-to-meet collateral requirements and carry high interest rates. Since
their costs and income are in local currency, local entrepreneurs are best served by working capital loans
also denominated in local currency. However, due to high cost of local currency debt, many companies will
see advantages in borrowing at much lower interest rates in hard currency as the perceived risk of currency
fluctuations across such short tenors is relatively low. Some international companies operating in the West
African off-grid solar sector may prefer hard currency financing at the offshore holding company level,
depending on how they have structured their local subsidiaries or affiliates in the region.
Inventory and Trade Finance
To fulfill orders, solar system providers need inventory on hand. Equipment suppliers to the off-grid sector
in West Africa and the Sahel are usually unwilling or unable to offer generous terms, often requiring down
payments with balance due in full at cash-on-delivery (COD). Therefore, these businesses are in dire need
of short-term loans of up to 12 months duration to finance inventory purchases. Yet, such loans are hard to
come by for developing off-grid enterprises. Since equipment purchase arrangements are usually
denominated in hard currency, loans also in hard currency over such short tenors are often acceptable. Trade
finance from export credit agencies (ECAs) and private trade funders may also provide good solutions, but
these lenders are often unwilling to finance orders under a few million USD or EUR in value.
Asset-Based or Receivables Financing
Once stand-alone solar system providers achieve a portfolio of operating PAYG or LTO installations, the
system assets and revenues from customer payments can be used to leverage debt financing to fund business
activities and expansion. Typically, a Special Purpose Vehicle (SPV) is established to house the asset
portfolio, which is sold by the solar provider to lenders. This form of financing has been widely deployed
in East Africa and is also increasingly available in West Africa through a variety of regionally focused
specialized debt funds that are focused on portfolio financings in the range of USD 1-10 million.191
Crowd Funding
Crowd funding platforms have played an important role in offering working capital, inventory financing
and smaller increment asset or receivables-backed loans to off-grid entrepreneurs. Loans of two-five years
have been provided to both locally-owned and international solar enterprises with a good number of
financings in the USD 150-500K range occurring in Nigeria, Ghana and Côte d’Ivoire.192
191 A total of 11 such specialized debt funds were identified, including those managed by: Sunfunder, responsAbility, Lendable, Sima Funds, Solar Frontier, Neot, Deutsche Bank, Triple Jump, Crossboundary, Lion’s Head, Shell and Solar Connect. Only a handful of these have vehicles that are fully funded and deploying capital but as of mid-2018 they reported expectations for financial closings that would make roughly USD 1.5 billion in off-grid focused debt available across Sub Saharan Africa by mid-2019. 192 The most active crowd funding platforms in the off-grid space have been Kiva, TRINE, Lendahand and Bettervest with the latter two most focused on West Africa.
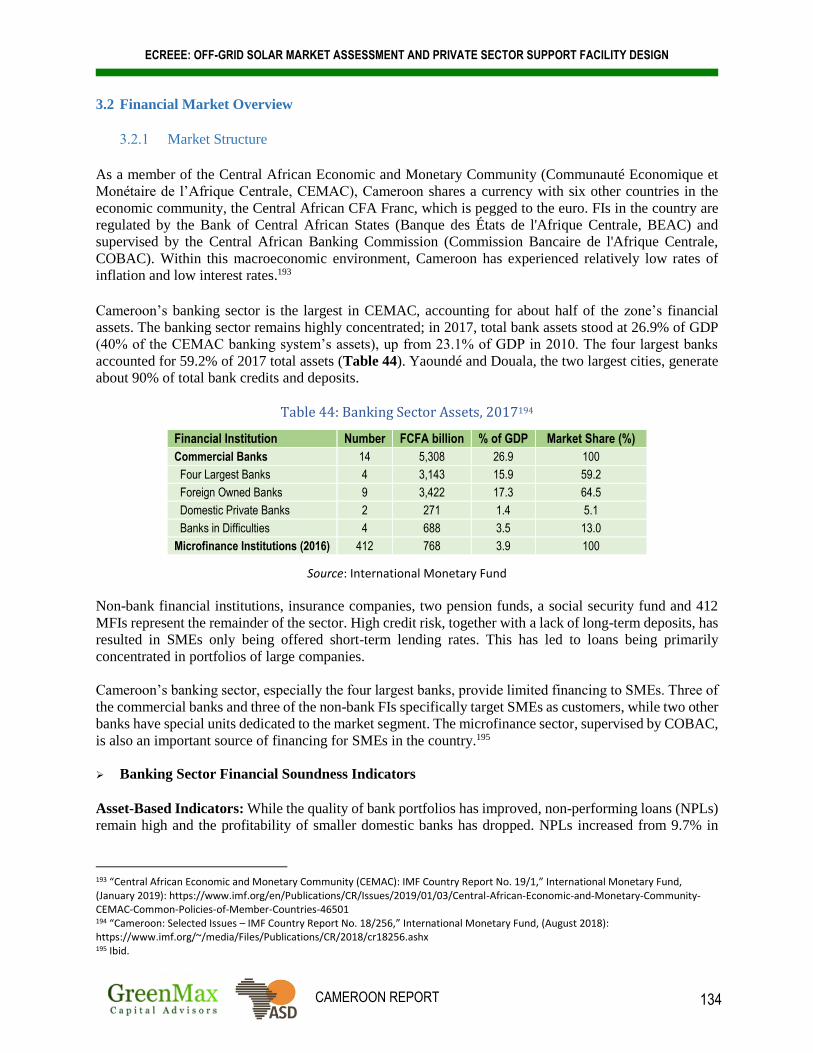
ECREEE: OFF-GRID SOLAR MARKET ASSESSMENT AND PRIVATE SECTOR SUPPORT FACILITY DESIGN
CAMEROON REPORT 134
3.2 Financial Market Overview
3.2.1 Market Structure
As a member of the Central African Economic and Monetary Community (Communauté Economique et
Monétaire de l’Afrique Centrale, CEMAC), Cameroon shares a currency with six other countries in the
economic community, the Central African CFA Franc, which is pegged to the euro. FIs in the country are
regulated by the Bank of Central African States (Banque des États de l'Afrique Centrale, BEAC) and
supervised by the Central African Banking Commission (Commission Bancaire de l'Afrique Centrale,
COBAC). Within this macroeconomic environment, Cameroon has experienced relatively low rates of
inflation and low interest rates.193
Cameroon’s banking sector is the largest in CEMAC, accounting for about half of the zone’s financial
assets. The banking sector remains highly concentrated; in 2017, total bank assets stood at 26.9% of GDP
(40% of the CEMAC banking system’s assets), up from 23.1% of GDP in 2010. The four largest banks
accounted for 59.2% of 2017 total assets (Table 44). Yaoundé and Douala, the two largest cities, generate
about 90% of total bank credits and deposits.
Table 44: Banking Sector Assets, 2017194
Financial Institution Number FCFA billion % of GDP Market Share (%)
Commercial Banks 14 5,308 26.9 100
Four Largest Banks 4 3,143 15.9 59.2
Foreign Owned Banks 9 3,422 17.3 64.5
Domestic Private Banks 2 271 1.4 5.1
Banks in Difficulties 4 688 3.5 13.0
Microfinance Institutions (2016) 412 768 3.9 100
Source: International Monetary Fund
Non-bank financial institutions, insurance companies, two pension funds, a social security fund and 412
MFIs represent the remainder of the sector. High credit risk, together with a lack of long-term deposits, has
resulted in SMEs only being offered short-term lending rates. This has led to loans being primarily
concentrated in portfolios of large companies.
Cameroon’s banking sector, especially the four largest banks, provide limited financing to SMEs. Three of
the commercial banks and three of the non-bank FIs specifically target SMEs as customers, while two other
banks have special units dedicated to the market segment. The microfinance sector, supervised by COBAC,
is also an important source of financing for SMEs in the country.195
Banking Sector Financial Soundness Indicators
Asset-Based Indicators: While the quality of bank portfolios has improved, non-performing loans (NPLs)
remain high and the profitability of smaller domestic banks has dropped. NPLs increased from 9.7% in
193 “Central African Economic and Monetary Community (CEMAC): IMF Country Report No. 19/1,” International Monetary Fund, (January 2019): https://www.imf.org/en/Publications/CR/Issues/2019/01/03/Central-African-Economic-and-Monetary-Community-CEMAC-Common-Policies-of-Member-Countries-46501 194 “Cameroon: Selected Issues – IMF Country Report No. 18/256,” International Monetary Fund, (August 2018): https://www.imf.org/~/media/Files/Publications/CR/2018/cr18256.ashx 195 Ibid.

ECREEE: OFF-GRID SOLAR MARKET ASSESSMENT AND PRIVATE SECTOR SUPPORT FACILITY DESIGN
CAMEROON REPORT 135
2014 to 11% in 2017 (Figure 35), which follows a similar trend for loans in arrears that increased from
12.3% in 2014 to 13% in 2017.196
Figure 35: Banking Sector Non-Performing Loans to Total Loans (%)197
Source: World Bank
Capital-Based Indicators: Although the banking sector is adequately capitalized, about one-third of banks
do not comply with COBAC solvency requirements, owing to higher NPLs in the country’s SME sector.
Figure 36: Banking Sector Capital Adequacy Indicators (%)198
Source: BEAC and International Monetary Fund
196 “Cameroon: Selected Issues – IMF Country Report No. 18/256,” International Monetary Fund, (August 2018): https://www.imf.org/~/media/Files/Publications/CR/2018/cr18256.ashx 197 “Bank nonperforming loans to total gross loans (%),” World Bank Open Data, (2018): https://data.worldbank.org/indicator/FB.AST.NPER.ZS?end=2017&locations=CM&start=2010&view=chart 198 “Cameroon – IMF Country Report No. 18/235,” International Monetary Fund, (July 2018): https://www.imf.org/~/media/Files/Publications/CR/2018/cr18235.ashx

ECREEE: OFF-GRID SOLAR MARKET ASSESSMENT AND PRIVATE SECTOR SUPPORT FACILITY DESIGN
CAMEROON REPORT 136
Income and Expense-Based Indicators: Key income and expense-based indicators for the
commercial banking sector are shown in Figure 37.
Figure 37: Banking Sector Profitability Indicators (%)199
Source: International Monetary Fund
Distribution of Credit by Sector
Table 45: Distribution of Credit by Sector (FCFA billion)200
Indicator 2016 2017 2018 2019 (projected)
Credit to the economy 2,853 2,925 3,054 3119
Credit to public enterprises 161 144 144 144
Credit to financial institutions 39 67 70 71
Credit to the private sector 2,653 2,714 2,840 2,904
Source: International Monetary Fund
Cameroon’s market-based economy features a diverse range of industries, although oil remains the
country’s most important commodity, accounting for nearly 40% of exports. Despite modest economic
growth, credit to the economy has been relatively limited. The tertiary sector is the main driver of growth,
expanding by more than 5%, led by the transportation, communications and financial services. In the
primary sector, economic growth is driven mainly by industrial and export-oriented agriculture, especially
the production of coffee and cotton.201
Credit to the economy in 2016 stood at FCFA 2,853 billion (USD 4.8 billion), of which FCFA 161 billion
(USD 275 million) was to public enterprises, FCFA 39 billion (USD 67 million) was to financial institutions
and FCFA 2,653 billion (USD 4.5 billion) was to the private sector. Although private sector credit growth
has been decelerating since 2016, IMF projections for credit to the economy through 2023 are optimistic.202
199 IMF Country Report No. 18/235, 2018. 200 Ibid. 201 “Cameroon Economic Update,” World Bank, (July 2013): http://documents.banquemondiale.org/curated/fr/439211468224677542/pdf/806710WP0ENGLI0Box0379812B00PUBLIC0.pdf 202 IMF Country Report No. 18/235, 2018.

ECREEE: OFF-GRID SOLAR MARKET ASSESSMENT AND PRIVATE SECTOR SUPPORT FACILITY DESIGN
CAMEROON REPORT 137
3.2.2 Financial Inclusion
Access to Financial Services
Access to financial services represents an ongoing challenge in West Africa and the Sahel. Overall, about
three-quarters of the region’s population remains financially excluded, lacking access to banking and
financial services through formal institutions (Figure 38).203 There are, however, notable signs of progress.
Between 2011 and 2017, the share of the population covered by formal financial institutions increased by
nearly 10%.204 Many countries across the region, including Cameroon, have also seen a sharp increase in
mobile money account ownership (Figure 39) and transaction volume (Figure 40).
203 “Le secteur bancaire en Afrique De l’inclusion financière a la stabilité financière,” European Investment Bank, (October 2018): https://www.eib.org/attachments/efs/economic_report_banking_africa_2018_fr.pdf 204 Demirguc-Kunt, A., Klapper, L., Singer, D., Ansar, S., and Hess, J., “The Global Findex Database 2017: Measuring Financial Inclusion and the Fintech Revolution,” World Bank, (2017): http://documents.worldbank.org/curated/en/332881525873182837/pdf/126033-PUB-PUBLIC-pubdate-4-19-2018.pdf

ECREEE: OFF-GRID SOLAR MARKET ASSESSMENT AND PRIVATE SECTOR SUPPORT FACILITY DESIGN
CAMEROON REPORT 138
Figure 38: ATMs and Branches of Commercial Banks per 100,000 Adults in West Africa and the Sahel, 2017205
Source: International Monetary Fund
Figure 38 shows the number of ATMs (left) and commercial bank branches (right) per 100,000 adults across West Africa and the Sahel. The shade of the country corresponds to the magnitude of the indicator; the darker the shade, the higher the value. As of 2017, Côte d’Ivoire, Ghana, Mauritania, Nigeria, Senegal and Togo had a relatively higher number of ATMs per 100,000 adults compared to the rest of the region, while The Gambia, Ghana, Mali, Mauritania and Togo had a relatively higher number of commercial bank branches per 100,000 adults. Cabo Verde ranked above all countries in the region on both indicators.
205 International Monetary Fund – Financial Access Survey: http://data.imf.org/?sk=E5DCAB7E-A5CA-4892-A6EA-598B5463A34C&sId=1460054136937

ECREEE: OFF-GRID SOLAR MARKET ASSESSMENT AND PRIVATE SECTOR SUPPORT FACILITY DESIGN
CAMEROON REPORT 139
Figure 39: Share of Adults with a Mobile Money Account in West Africa and the Sahel (%), 2014 and 2017206
NOTE: Maps exclude Cabo Verde (no data)
Source: World Bank Global Findex Database
Figure 39 shows the increase in the share of adults (%) owning a mobile money account across West Africa and the Sahel between 2014 and 2017. The shade of the country corresponds to the magnitude of the indicator; the darker the shade, the higher the value. As of 2017, the share of adults owning a mobile money account is about 33% in Burkina Faso, Côte d’Ivoire, and Senegal, and 39% in Ghana. Between 2014 and 2017, mobile money account ownership also increased significantly in Benin, Cameroon, Chad, Guinea, Mali, Sierra Leone and Togo, while growth in account ownership was slower in Niger, Nigeria and Mauritania. There was either no data or insufficient data available to assess account ownership in Cabo Verde, Central African Republic, The Gambia, Guinea-Bissau, and Liberia.
206 Demirguc-Kunt et al., 2017.

ECREEE: OFF-GRID SOLAR MARKET ASSESSMENT AND PRIVATE SECTOR SUPPORT FACILITY DESIGN
CAMEROON REPORT 140
Figure 40: Mobile Money Transactions per 1,000 Adults in West Africa and the Sahel, 2014 and 2017207
NOTE: Maps exclude Cabo Verde (no data)
Source: International Monetary Fund
Figure 40 shows the increase in the number of mobile money transactions across West Africa and the Sahel between 2014 and 2017. The shade of the country corresponds to the magnitude of the indicator; the darker the shade, the higher the value. Between 2014 and 2017, mobile money transaction volume increased significantly in Benin, Burkina Faso, Côte d’Ivoire, Ghana, Guinea, Mali, Niger, Senegal and Togo, while growth in transaction volume was slower in Nigeria and Chad. There was either no data or insufficient data available to assess transaction volume in Cabo Verde, Cameroon, Central African Republic, The Gambia, Guinea-Bissau, Liberia, Mauritania and Sierra Leone.
207 International Monetary Fund – Financial Access Survey: http://data.imf.org/?sk=E5DCAB7E-A5CA-4892-A6EA-598B5463A34C&sId=1460054136937

ECREEE: OFF-GRID SOLAR MARKET ASSESSMENT AND PRIVATE SECTOR SUPPORT FACILITY DESIGN
CAMEROON REPORT 141
In 2017, 35% of Cameroon’s adult population had an account at a financial institution or with a mobile money service provider, up from 16% in
2011. In 2017, the country’s rate of financial inclusion was slightly above the West Africa and Sahel region’s average, but still below the average
for Sub-Saharan Africa (Figure 41).
Figure 41: Share of Adults with Access to Financial Services in West Africa and the Sahel (%), 2011 and 2017208
NOTE: Cabo Verde, Guinea-Bissau and The Gambia excluded (no data); data for Côte d’Ivoire is from 2014 and 2017
Source: World Bank Global Findex Database
208 Demirguc-Kunt et al., 2017.

ECREEE: OFF-GRID SOLAR MARKET ASSESSMENT AND PRIVATE SECTOR SUPPORT FACILITY DESIGN
CAMEROON REPORT 142
Table 46: Financial Access Indicators209
Indicator 2010 2011 2012 2013 2014
ATMs per 100,000 adults 1.82 2.38 2.62 3.21 3.64
Branches of commercial banks per 100,000 adults 1.71 1.76 1.86 1.99 2.01
Deposit accounts with commercial banks per 1,000 adults 72.71 75.76 80.81 84.30 73.31
Loan accounts with commercial banks per 1,000 adults 18.90 31.73 35.73 42.09 34.99
Mobile money accounts: active per 1,000 adults 3.73 8.31 39.79 117.56 137.78
Mobile money transactions: number per 1,000 adults 1.86 10.99 112.91 82.07 708.78
Source: International Monetary Fund
In an effort to improve access to financial services, the Government rendered compulsory the use of banking
services to all civil servants whose salaries were at least FCFA 100,000 (USD 175). The GoC also took
measures to promote development of the country’s microfinance sector to further boost financial inclusion
among the country’s un-banked population.210
In 2016, the GoC published the “Strategic Plan for a Digital Cameroon by 2020,” which envisions
increasing the availability of electronic banking services to ultimately improve the standard of living for its
citizens.211 In addition, it intends to build on financial inclusion policies being pursued at the regional level.
In December 2016, CEMAC heads of state adopted a regional strategy that included a focus on increasing
the stability of and inclusion within the financial sector to spur economic growth, avert a financial crisis,
and preserve the current exchange rate peg. The implementation of the strategy includes long-term,
structural reforms to strengthen CEMAC regional and national institutions’ capacity to manage public
finance and to create a business-friendly environment in support of economic growth. In 2018, the World
Bank committed USD 35 million to support the overall regional strategy.212
Gender and Women’s Financial Inclusion
According to data from the World Bank’s 2017 Global Findex survey – which examines, among many
things, the extent of financial inclusion in Sub-Saharan Africa (SSA) – women in the region are about 10%
less likely to have an account at a financial institution or with a mobile money service provider than men.
In Cameroon, the gender gap is slightly less than the regional average, with 30% of women compared to
39% of men holding an account. The size of the financial inclusion gender gap has remained relatively
steady despite a rapid increase in overall financial inclusion, which is the opposite case for the region on
average. In absolute terms as of 2017, 30% of women had financial and mobile money accounts in
Cameroon, triple the percentage in 2014 (Figure 42).
Studies have found that increasing financial inclusion can significantly empower women by increasing
savings, reducing levels of inequality, and improving decision-making power in the household. Supportive
209 IMF – Financial Access Survey: http://data.imf.org/?sk=E5DCAB7E-A5CA-4892-A6EA-598B5463A34C&sId=1460054136937 210 “Global Microscope 2016: The Enabling Environment for Financial Inclusion,” Economist Intelligence Unit, (October 2016): https://publications.iadb.org/publications/english/document/Global-Microscope-2016-The-Enabling-Environment-for-Financial-Inclusion.pdf 211 “Strategic Plan: For a Digital Cameroon by 2020,” Ministry of Posts and Telecommunications, (May 2016): http://cameroundigital.com/wp-content/uploads/2017/05/Plan-stratégique-Cameroun-Numérique-2020_ANG.pdf 212 “Strengthening the Capacity of Regional Financial Institutions in the CEMAC Region,” World Bank, (27 March 2018): http://documents.worldbank.org/curated/en/390661522173803460/text/Project-Information-Document-Integrated-Safeguards-Data-Sheet-Strengthening-the-Capacity-of-Regional-Financial-Institutions-in-the-CEMAC-Region-P161368.txt

ECREEE: OFF-GRID SOLAR MARKET ASSESSMENT AND PRIVATE SECTOR SUPPORT FACILITY DESIGN
CAMEROON REPORT 143
government programs, policies, and regulations are therefore critical to overcoming the barriers that women
face and driving overall progress towards financial inclusion.213
Figure 42: Financial Inclusion Gender Gap in Cameroon214
Source: World Bank Global Findex Database
The persistent gap in financial inclusion could be related to the relatively slow uptake of digital financial
services in Cameroon’s market. Expanding these services, especially mobile money, can create new
opportunities to better serve women, the lower-income population, and other groups that are traditionally
excluded from the formal financial system. As of 2018, Cameroon’s mobile money market appears
constrained by policy requirements that only banks can provide these services, forcing mobile network
operators to work through established financial institutions.215 This bottleneck may soon be somewhat
alleviated because the government approved two new mobile money licenses in early 2018, bringing a third
mobile money operator to the market and expanding the services for two banks.216 As of 2017, 18% of adult
men and 13% of adult women had only a mobile money account, both underperforming compared to the
regional average of 24% and 18%, respectively (Figure 43).
213 El-Zoghbi, M., “Measuring Women’s Financial Inclusion: The 2017 Findex Story,” Consultative Group to Assist the Poor (CGAP), (30 April 2018): https://www.cgap.org/blog/measuring-womens-financial-inclusion-2017-findex-story 214 Demirguc-Kunt et al., 2017. 215 “Digital Financial Services in Cameroon: Sector Overview,” Mobile Money for the Poor (United Nations Capital Development Fund), (17 April 2018): https://www.uncdf.org/article/3517/digital-financial-services-in-cameroon 216 IMF Country Report No. 18/256, 2018.

ECREEE: OFF-GRID SOLAR MARKET ASSESSMENT AND PRIVATE SECTOR SUPPORT FACILITY DESIGN
CAMEROON REPORT 144
Figure 43: Gender Gap in Mobile Money, 2017217
Source: World Bank Global Findex Database
Widespread mobile phone ownership (Figure 12), rapidly growing mobile internet usage and extensive
network coverage (Figure 29), have led to the proliferation of mobile money services and platforms in the
country. These dynamics are collectively increasing usage of mobile banking services, expanding overall
access to financial services and driving financial inclusion in Cameroon. Indeed, the rate of access to
banking services in the country has increased sharply in recent years, in large part due to the introduction
of mobile money services offered by the two main mobile network operators – Orange and MTN – who
have also enabled transactions from banking accounts to mobile money accounts. According to official
figures, the two leaders in the mobile communication market in Cameroon now have close to 5 million
users of mobile money services between both of them, representing about 20% of the overall population.
3.2.3 Commercial Lending Environment
Maturity Structure of Bank Deposits and Credit
The deposit interest rate in Cameroon has been steadily decreasing since 2008 and reached 2.45% in 2016
(Figure 44). This trend has constrained banking sector activities as consumers as less incentivized to
deposit money into accounts with diminishing interest rates. This is compounded by the country’s rising
inflation rate, which was 2.2% in 2018 and is projected to increase to 2.4% in 2019.
217 Demirguc-Kunt et al., 2017.

ECREEE: OFF-GRID SOLAR MARKET ASSESSMENT AND PRIVATE SECTOR SUPPORT FACILITY DESIGN
CAMEROON REPORT 145
Figure 44: Interest Rates on Deposits (%)218
Source: Trading Economics
Interest Rates
In 2018, the benchmark interest rate in Cameroon was recorded at 2.95%. Interest rates in Cameroon
averaged 3.38% between 2009 and 2018, reaching a high of 4.25% in July 2009 and a low of 2.45% in July
2015 (Figure 45).
Figure 45: Benchmark Interest Rates (%)219
Source: Trading Economics
218 “Deposit Interest Rate in Cameroon,” Trading Economics, (2016): https://tradingeconomics.com/cameroon/deposit-interest-rate 219 “Cameroon Interest Rate,” Trading Economics, (2016): https://tradingeconomics.com/cameroon/interest-rate
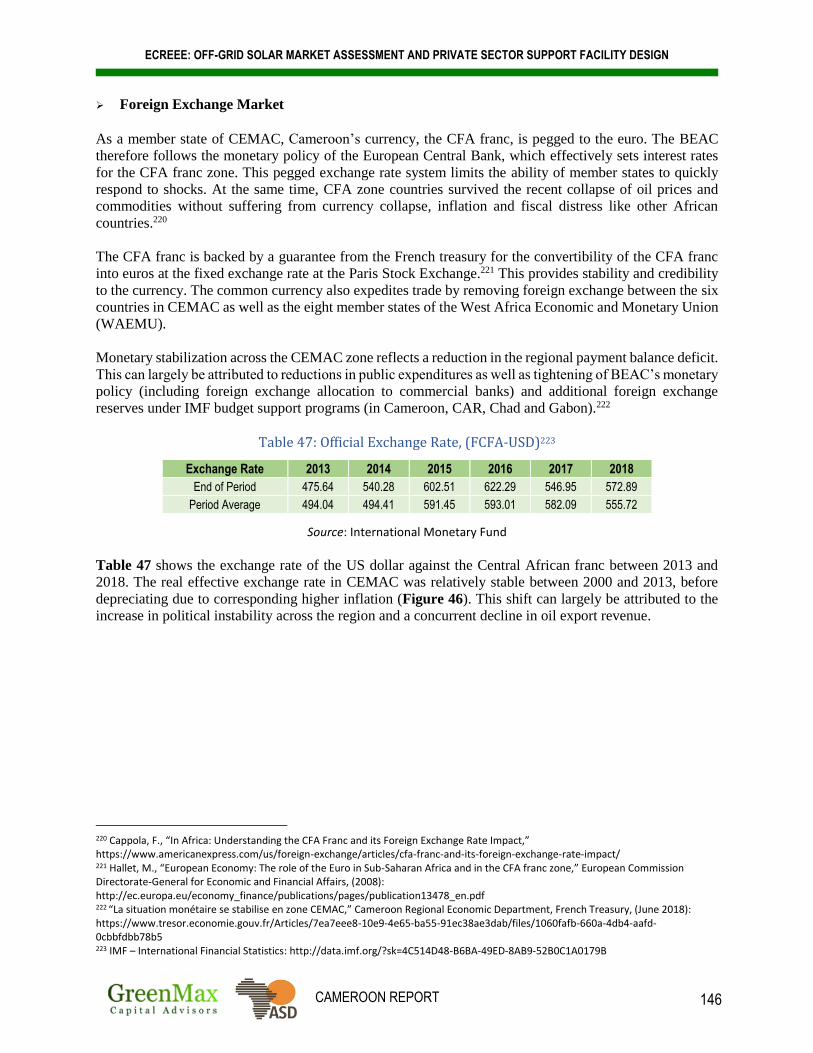
ECREEE: OFF-GRID SOLAR MARKET ASSESSMENT AND PRIVATE SECTOR SUPPORT FACILITY DESIGN
CAMEROON REPORT 146
Foreign Exchange Market
As a member state of CEMAC, Cameroon’s currency, the CFA franc, is pegged to the euro. The BEAC
therefore follows the monetary policy of the European Central Bank, which effectively sets interest rates
for the CFA franc zone. This pegged exchange rate system limits the ability of member states to quickly
respond to shocks. At the same time, CFA zone countries survived the recent collapse of oil prices and
commodities without suffering from currency collapse, inflation and fiscal distress like other African
countries.220
The CFA franc is backed by a guarantee from the French treasury for the convertibility of the CFA franc
into euros at the fixed exchange rate at the Paris Stock Exchange.221 This provides stability and credibility
to the currency. The common currency also expedites trade by removing foreign exchange between the six
countries in CEMAC as well as the eight member states of the West Africa Economic and Monetary Union
(WAEMU).
Monetary stabilization across the CEMAC zone reflects a reduction in the regional payment balance deficit.
This can largely be attributed to reductions in public expenditures as well as tightening of BEAC’s monetary
policy (including foreign exchange allocation to commercial banks) and additional foreign exchange
reserves under IMF budget support programs (in Cameroon, CAR, Chad and Gabon).222
Table 47: Official Exchange Rate, (FCFA-USD)223
Exchange Rate 2013 2014 2015 2016 2017 2018
End of Period 475.64 540.28 602.51 622.29 546.95 572.89
Period Average 494.04 494.41 591.45 593.01 582.09 555.72
Source: International Monetary Fund
Table 47 shows the exchange rate of the US dollar against the Central African franc between 2013 and
2018. The real effective exchange rate in CEMAC was relatively stable between 2000 and 2013, before
depreciating due to corresponding higher inflation (Figure 46). This shift can largely be attributed to the
increase in political instability across the region and a concurrent decline in oil export revenue.
220 Cappola, F., “In Africa: Understanding the CFA Franc and its Foreign Exchange Rate Impact,” https://www.americanexpress.com/us/foreign-exchange/articles/cfa-franc-and-its-foreign-exchange-rate-impact/ 221 Hallet, M., “European Economy: The role of the Euro in Sub-Saharan Africa and in the CFA franc zone,” European Commission Directorate-General for Economic and Financial Affairs, (2008): http://ec.europa.eu/economy_finance/publications/pages/publication13478_en.pdf 222 “La situation monétaire se stabilise en zone CEMAC,” Cameroon Regional Economic Department, French Treasury, (June 2018): https://www.tresor.economie.gouv.fr/Articles/7ea7eee8-10e9-4e65-ba55-91ec38ae3dab/files/1060fafb-660a-4db4-aafd-0cbbfdbb78b5 223 IMF – International Financial Statistics: http://data.imf.org/?sk=4C514D48-B6BA-49ED-8AB9-52B0C1A0179B
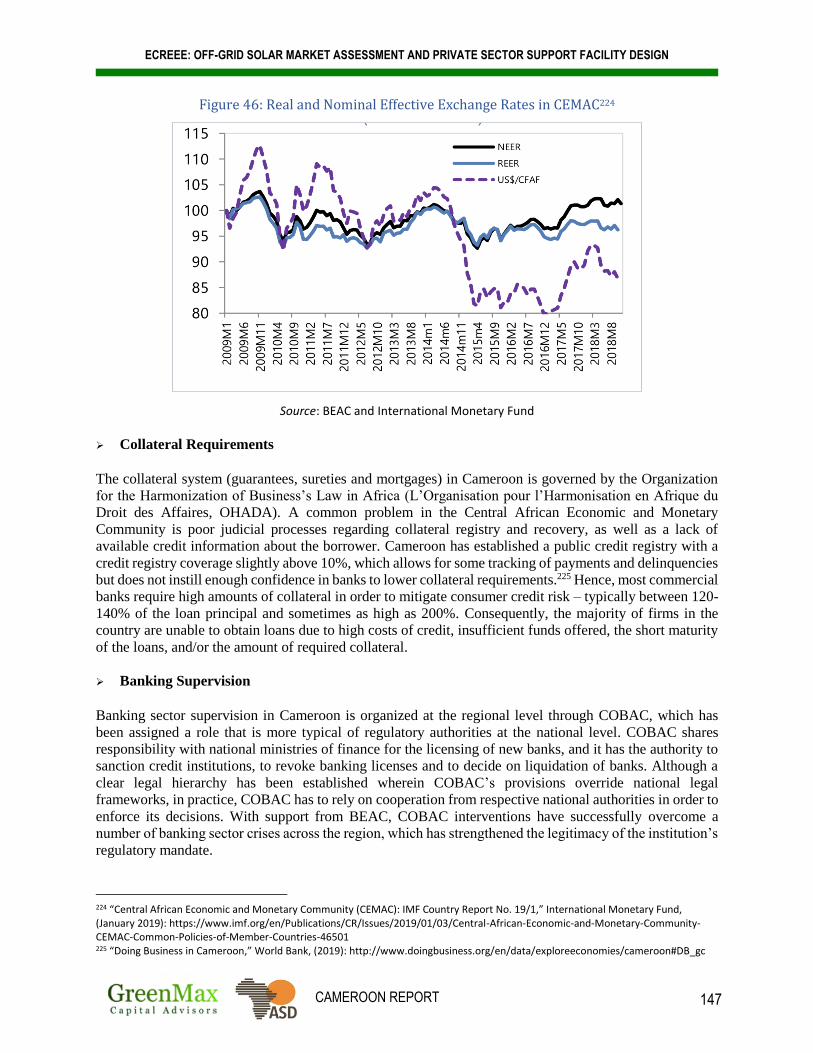
ECREEE: OFF-GRID SOLAR MARKET ASSESSMENT AND PRIVATE SECTOR SUPPORT FACILITY DESIGN
CAMEROON REPORT 147
Figure 46: Real and Nominal Effective Exchange Rates in CEMAC224
Source: BEAC and International Monetary Fund
Collateral Requirements
The collateral system (guarantees, sureties and mortgages) in Cameroon is governed by the Organization
for the Harmonization of Business’s Law in Africa (L’Organisation pour l’Harmonisation en Afrique du
Droit des Affaires, OHADA). A common problem in the Central African Economic and Monetary
Community is poor judicial processes regarding collateral registry and recovery, as well as a lack of
available credit information about the borrower. Cameroon has established a public credit registry with a
credit registry coverage slightly above 10%, which allows for some tracking of payments and delinquencies
but does not instill enough confidence in banks to lower collateral requirements.225 Hence, most commercial
banks require high amounts of collateral in order to mitigate consumer credit risk – typically between 120-
140% of the loan principal and sometimes as high as 200%. Consequently, the majority of firms in the
country are unable to obtain loans due to high costs of credit, insufficient funds offered, the short maturity
of the loans, and/or the amount of required collateral.
Banking Supervision
Banking sector supervision in Cameroon is organized at the regional level through COBAC, which has
been assigned a role that is more typical of regulatory authorities at the national level. COBAC shares
responsibility with national ministries of finance for the licensing of new banks, and it has the authority to
sanction credit institutions, to revoke banking licenses and to decide on liquidation of banks. Although a
clear legal hierarchy has been established wherein COBAC’s provisions override national legal
frameworks, in practice, COBAC has to rely on cooperation from respective national authorities in order to
enforce its decisions. With support from BEAC, COBAC interventions have successfully overcome a
number of banking sector crises across the region, which has strengthened the legitimacy of the institution’s
regulatory mandate.
224 “Central African Economic and Monetary Community (CEMAC): IMF Country Report No. 19/1,” International Monetary Fund, (January 2019): https://www.imf.org/en/Publications/CR/Issues/2019/01/03/Central-African-Economic-and-Monetary-Community-CEMAC-Common-Policies-of-Member-Countries-46501 225 “Doing Business in Cameroon,” World Bank, (2019): http://www.doingbusiness.org/en/data/exploreeconomies/cameroon#DB_gc

ECREEE: OFF-GRID SOLAR MARKET ASSESSMENT AND PRIVATE SECTOR SUPPORT FACILITY DESIGN
CAMEROON REPORT 148
Under its 2019-2021 strategic plan, COBAC has committed to strengthening the CEMAC monetary policy,
progressively adopting a risk-based banking supervision process. In response to shortfalls of regional
foreign reserves, the BEAC has tightened its monetary policy and modernized its monetary policy
framework. The overall objective is to develop an interbank market through the reduction of excess liquidity
and to better enforce prudential regulations, through improved cooperation between COBAC and the
BEAC.226
In this context, microfinance institutions have stepped in to fill the gap in demand for access to finance, as
MFIs are less constrained by COBAC legal and regulatory requirements. In 2017, a Risk Prevention Bureau
for Microfinance Institutions was instituted in Cameroon.227
3.2.4 Lending to the Off-Grid Solar Sector
While there are several donor and DFI-funded programs and initiatives that have provided financing to
support development of Cameroon’s off-grid solar market, these funds have not been channeled through
local commercial banks or MFIs. ROGEP is therefore a pioneering initiative in the country, as it endeavors
to boost OGS lending via engagement with local financial partners. Local FIs are increasingly becoming
more aware of the opportunities in the off-grid space, and interviews FIs revealed a willingness to
participate in providing financing to the sector.
3.2.5 Key Barriers to Off-Grid Solar Lending
Unfamiliarity with the Off-Grid Solar Sector
Much like other African markets, local FIs in Cameroon are unfamiliar with lending to off-grid solar
projects and companies and have a limited understanding of the nascent sector. During stakeholder
interviews, many of the FIs noted a lack of expertise in assessing OGS risks and in structuring/developing
customized products for the sector. There remains a significant gap in overall local FI capacity, as most of
the interviewed FIs stressed that technical assistance would be necessary to facilitate off-grid solar lending.
Maturity Structure of Bank’s Funding
As described in Section 3.2.3, the sizable share of short-term deposits limits the ability of banks to offer
longer-tenor consumer financing, which is necessary to accelerate off-grid solar market growth. In more
mature off-grid solar markets, Lease-to-Own, Pay-As-You-Go (PAYG) and Energy-as-a-Service payment
and business models reduce entry barriers for consumers by allowing for small, incremental payments,
which are more affordable, rather than demanding a high up-front cost for installation and service.
Lack of Credit History/High Collateral Requirements
As described in Section 3.2.3, consumers in Cameroon face very strict collateral requirements. Many
consumers also lack basic financial literacy and knowledge about the terms and conditions of financial
products and therefore struggle to obtain loans. The lack of credit history/track record and the weak balance
sheet of most off-grid solar enterprises is a critical barrier that often prevents these firms from meeting the
collateral requirements of banks. When compared to domestically-owned enterprises, foreign-owned firms
are typically more likely to obtain financing. All of the interviewed commercial banks indicated that credit
guarantees would be necessary to encourage lending to the off-grid sector.
226 IMF Country Report No. 19/1, 2019. 227 “Cameroon: Microfinance Loan Delinquency - Prevention Bureau Goes Operational,” All Africa, (June 2018): https://allafrica.com/stories/201806220609.html

ECREEE: OFF-GRID SOLAR MARKET ASSESSMENT AND PRIVATE SECTOR SUPPORT FACILITY DESIGN
CAMEROON REPORT 149
3.3 Financial Institutions228
3.3.1 Development Finance Institutions
Several DFIs are active in Cameroon, including AfDB, AFD/Proparco, IFC, and KFW/DEG among others.
The identified DFI programs relevant to the energy and off-grid solar sector in the country are described
below.
African Development Bank Sustainable Energy Fund for Africa / Facility for Energy Inclusion
The Sustainable Energy Fund for Africa (SEFA) is a USD 60 million multi-donor trust fund administered
by the African Development Bank with the objective of supporting sustainable private sector led economic
growth in African countries through the efficient utilization of clean energy resources and support small-
and medium-scale renewable energy project development.229
The Facility for Energy Inclusion (FEI) is a USD 500 million Pan-African debt facility created by the
AfDB to support the achievement of its access to energy goals by providing debt capital to SHS companies,
small independent power producers and mini-grid developers. The launch of the FEI in 2016 led to a
significant increase in AfDB financing for distributed renewable energy throughout Sub-Saharan Africa.
Cameroon received approximately USD 250 million in energy access financing from AfDB between 2014
and 2017 (Figure 47).
Figure 47: Distribution of AfDB Energy Access Financing in Sub-Saharan Africa, 2014-2017230
Source: Oil Change International and Friends of the Earth U.S.
228 Excluding commercial banks, which are reviewed in detail in Section 3.2. 229 “Sustainable Energy Fund for Africa,” African Development Bank, (2018): https://www.afdb.org/en/topics-and-sectors/initiatives-partnerships/sustainable-energy-fund-for-africa/ 230 Lee, A. Doukas, A. and DeAngelis, K., “The African Development Bank and Energy Access Finance in Sub-Saharan Africa: Trends and Insights from Recent Data,” Oil Change International and Friends of the Earth U.S., (November 2018): http://priceofoil.org/content/uploads/2018/11/AfDB-Energy-Access-Finance-report-high-quality.pdf
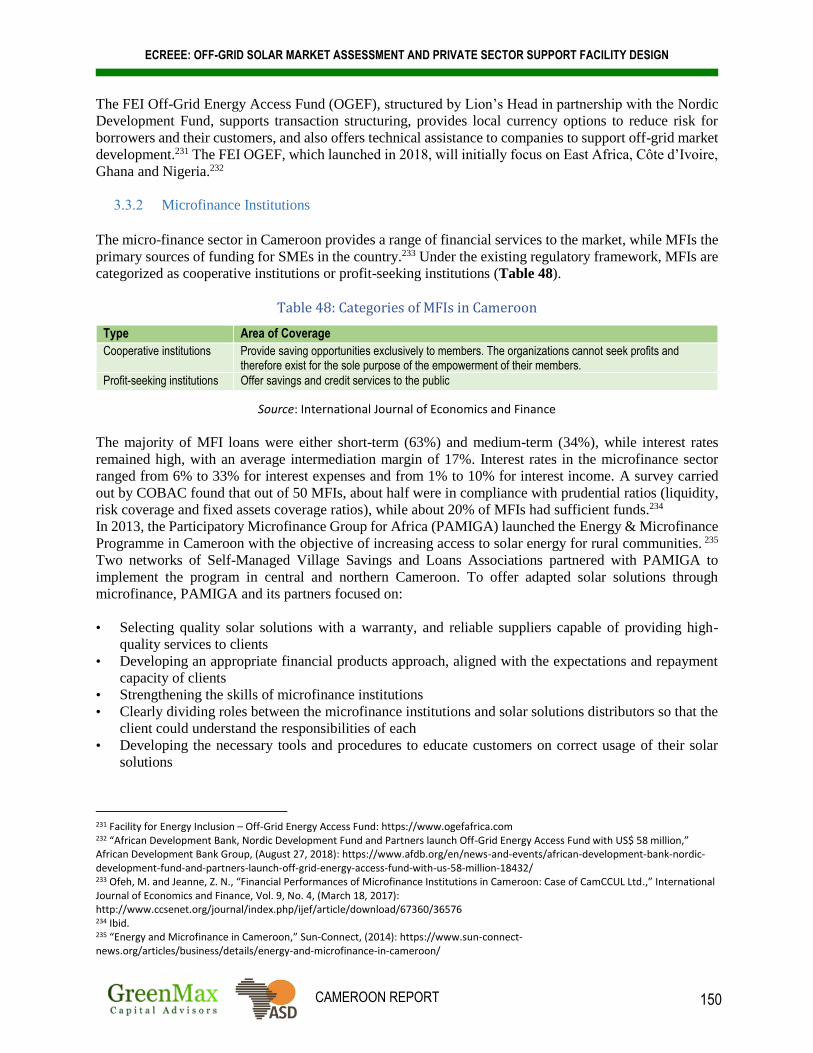
ECREEE: OFF-GRID SOLAR MARKET ASSESSMENT AND PRIVATE SECTOR SUPPORT FACILITY DESIGN
CAMEROON REPORT 150
The FEI Off-Grid Energy Access Fund (OGEF), structured by Lion’s Head in partnership with the Nordic
Development Fund, supports transaction structuring, provides local currency options to reduce risk for
borrowers and their customers, and also offers technical assistance to companies to support off-grid market
development.231 The FEI OGEF, which launched in 2018, will initially focus on East Africa, Côte d’Ivoire,
Ghana and Nigeria.232
3.3.2 Microfinance Institutions
The micro-finance sector in Cameroon provides a range of financial services to the market, while MFIs the
primary sources of funding for SMEs in the country.233 Under the existing regulatory framework, MFIs are
categorized as cooperative institutions or profit-seeking institutions (Table 48).
Table 48: Categories of MFIs in Cameroon
Type Area of Coverage
Cooperative institutions Provide saving opportunities exclusively to members. The organizations cannot seek profits and therefore exist for the sole purpose of the empowerment of their members.
Profit-seeking institutions Offer savings and credit services to the public
Source: International Journal of Economics and Finance
The majority of MFI loans were either short-term (63%) and medium-term (34%), while interest rates
remained high, with an average intermediation margin of 17%. Interest rates in the microfinance sector
ranged from 6% to 33% for interest expenses and from 1% to 10% for interest income. A survey carried
out by COBAC found that out of 50 MFIs, about half were in compliance with prudential ratios (liquidity,
risk coverage and fixed assets coverage ratios), while about 20% of MFIs had sufficient funds.234
In 2013, the Participatory Microfinance Group for Africa (PAMIGA) launched the Energy & Microfinance
Programme in Cameroon with the objective of increasing access to solar energy for rural communities. 235
Two networks of Self-Managed Village Savings and Loans Associations partnered with PAMIGA to
implement the program in central and northern Cameroon. To offer adapted solar solutions through
microfinance, PAMIGA and its partners focused on:
• Selecting quality solar solutions with a warranty, and reliable suppliers capable of providing high-
quality services to clients
• Developing an appropriate financial products approach, aligned with the expectations and repayment
capacity of clients
• Strengthening the skills of microfinance institutions
• Clearly dividing roles between the microfinance institutions and solar solutions distributors so that the
client could understand the responsibilities of each
• Developing the necessary tools and procedures to educate customers on correct usage of their solar
solutions
231 Facility for Energy Inclusion – Off-Grid Energy Access Fund: https://www.ogefafrica.com 232 “African Development Bank, Nordic Development Fund and Partners launch Off-Grid Energy Access Fund with US$ 58 million,” African Development Bank Group, (August 27, 2018): https://www.afdb.org/en/news-and-events/african-development-bank-nordic-development-fund-and-partners-launch-off-grid-energy-access-fund-with-us-58-million-18432/ 233 Ofeh, M. and Jeanne, Z. N., “Financial Performances of Microfinance Institutions in Cameroon: Case of CamCCUL Ltd.,” International Journal of Economics and Finance, Vol. 9, No. 4, (March 18, 2017): http://www.ccsenet.org/journal/index.php/ijef/article/download/67360/36576 234 Ibid. 235 “Energy and Microfinance in Cameroon,” Sun-Connect, (2014): https://www.sun-connect-news.org/articles/business/details/energy-and-microfinance-in-cameroon/
ECREEE: OFF-GRID SOLAR MARKET ASSESSMENT AND PRIVATE SECTOR SUPPORT FACILITY DESIGN
CAMEROON REPORT 151
3.3.3 Informal Financial Institutions
A 2017 World Bank study found that 38% of adults in Africa had borrowed money from an informal FI as
opposed to 5% who borrowed from a formal FI. Although informal borrowing occurs at different rates
across Africa, roughly 100 million adults in Sub-Saharan Africa use informal sources of finance.236 The
informal financial sector often serves as a major source of savings and credit services for women, the low-
income population and others who lack access to formal institutions. Informal financial institutions
typically include individual money lenders as well as collective entities such as Rotating Savings and Credit
Associations and Accumulated Savings and Credit Associations, among other groups.237
Much like in other African states, there is a large informal financial sector in Cameroon (Figure 48). Data
from this sector remains limited, as the informal nature of these institutions does not facilitate access to
information on their practices, cost standards and transaction levels. It is estimated that about half of the
population in Cameroon participates in the informal financial sector, widely known in the country as
Tontines. Tontines play an important role in the development of Cameroonian society, enabling women,
youth and the poorer segment of the population to access financing.238 The GoC recognizes the importance
of this sector and has incorporated Tontines into its National Strategy for Financial Inclusion.239
236 “Demirguc-Kunt, A., Klapper, L., and Singer, D., “Financial Inclusion and Inclusive Growth: A Review of Recent Empirical Evidence,” World Bank Policy Research Working Paper 8040, (April 2017): http://documents.worldbank.org/curated/en/403611493134249446/pdf/WPS8040.pdf 237 Klapper, L., Singer, D., “The Role of Informal Financial Services in Africa,” Journal of African Economies, (24 December 2014): https://academic.oup.com/jae/article-abstract/24/suppl_1/i12/2473408?redirectedFrom=fulltext 238 “Tontines: The Informal Financial Sector in Cameroon,” Fair Observer, (January 16, 2013): https://www.fairobserver.com/region/africa/tontines-informal-financial-sector-and-sustainable-development-cameroon/ 239 "Cameroon: Selected Issues," IMF, (August 2018): https://www.imf.org/~/media/Files/Publications/CR/2018/cr18256.ashx

ECREEE: OFF-GRID SOLAR MARKET ASSESSMENT AND PRIVATE SECTOR SUPPORT FACILITY DESIGN
CAMEROON REPORT 152
Figure 48: Share of Adults Saving in the Past Year (%), 2017240
NOTE: Maps exclude Cabo Verde (no data)
Source: World Bank Global Findex Database
Figure 48 shows how the savings behavior of adults varies in West Africa and the Sahel. The shade of the country corresponds to the magnitude of the indicator; the darker the shade, the higher the value. Saving semi-formally is much more common than saving formally across the region, including in Cameroon.
240 Demirguc-Kunt et al., 2017.

ECREEE: OFF-GRID SOLAR MARKET ASSESSMENT AND PRIVATE SECTOR SUPPORT FACILITY DESIGN
CAMEROON REPORT
153
3.4 Summary of Findings
Opportunity for ROGEP Credit Lines: Cameroonian banks lack access to funding with the interest
rates and tenors required to make off-grid solar projects attractive to end-users and SMEs. Local
currency cost of capital remains very high for FIs, which in turn results in prohibitively high pricing
for typical loans. Furthermore, loans are usually short-term, as customer deposits (mostly short-term)
remain the largest source of funding for banks. This dynamic severely constrains OGS market growth.
Stakeholder interviews revealed that there is indeed an opportunity for ROGEP credit lines to provide
liquidity to local commercial banks and MFIs to support lending to the off-grid solar sector.
Local Currency and Pricing: Most loans to off-grid enterprises and all loans for consumer purchases
of stand-alone solar devices must be denominated in local currency. However, taking up hard currency
denominated credit lines presents challenges for local lenders who would have to bear the FX risk. This
risk is somewhat mitigated in Cameroon, however, as the CFA franc is pegged to the euro, which
shields it from volatile currency fluctuations. As a result, even after pricing in a hedge to cover this
risk, many hard currency denominated credit lines can stay attractive, as the all-in cost of capital to
local FIs is manageable to provide competitive offers to borrowers.
Collateral Requirements: The collateral requirements of commercial banks in Cameroon are
extremely high, particularly for small firms. Moreover, lenders already in the space are deeply
constrained from originating loans where the borrower cannot meet these requirements. Hence, the use
of third-party pari-passu guarantees as an alternative form of collateral would enable banks to extend
loans to borrowers without such high collateral requirements. Accordingly, many of the interviewed
commercial banks emphasized the need for partial credit guarantees to encourage lending to the OGS
sector (50% coverage is helpful; 70-80% coverage could be transformative). However, pricing from
most available third-party guarantors can be in the range of 3%+ per annum, which some lenders view
as too high to remain competitive. This creates an opportunity for ROGEP to either provide low-cost
guarantees directly or to subsidize the premiums offered by existing third-party guarantors such as
GuarantCo, Afrexim and Africa Guarantee Fund.
Risk Perception of New Lenders: In order to attract additional lenders into the off-grid solar market
segment, there is need for strong, reasonably priced credit enhancement mechanisms. In order to cover
“market entry” risks for lenders unwilling to enter this market, guarantee instruments that cover first
loss are needed. However, first-loss coverage, while necessary for attracting new lenders to the off-grid
sector, does not address the key issue of collateral and is therefore likely insufficient on its own to
stimulate growth in FI engagement unless coupled with third-party guarantee coverage.
Technical Assistance: A well designed TA intervention is critical to accelerating OGS lending in the
country. Stakeholder interviews revealed the following key areas of support: training of bank credit
department and account representative personnel to originate deals and appropriately assess the credit
risk of stand-alone solar firms and projects; extensive due diligence support to qualify products and
approve vendors; and targeted support for new lenders to the sector with product structuring and
development as well as building deal-flow. Special attention should also be paid to offering advisory
services on the side of the stand-alone solar enterprises. Lenders opine that these entrepreneurs often
do not have proper financial management and accounting systems in place, are unable to present quality
financial models and lack the expertise required to structure their companies to take on debt obligations.

ECREEE: OFF-GRID SOLAR MARKET ASSESSMENT AND PRIVATE SECTOR SUPPORT FACILITY DESIGN
CAMEROON REPORT
154
Digital Financial Services: The advent of digital financial services and mobile money is one of the
most important developments in off-grid solar market development to date, as it has allowed new and
innovative business models to emerge that are now driving unprecedented growth in the sector. Mobile
communication technology facilitates payments for solar products and systems (lease-to-own, pay-as-
you-go) and/or for electricity usage (energy-as-a-service) and enables monitoring for operations and
maintenance of equipment. Expanding access to mobile money services also creates new opportunities
to better serve women, the lower-income population, and other groups that are traditionally excluded
from the formal financial system. The Government should take steps to support capacity building of
and foster linkages between off-grid solar companies operating in the market and key stakeholders from
various sectors, including energy access policymakers and regulators, financial and
telecommunications companies, mobile network operators, financial service providers (commercial
banks and microfinance institutions), mobile money service providers, international organizations,
NGOs and civil society groups involved in financial inclusion etc.

ECREEE: OFF-GRID SOLAR MARKET ASSESSMENT AND PRIVATE SECTOR SUPPORT FACILITY DESIGN
CAMEROON REPORT
155
Key findings from the Task 3 FI survey activity are presented below. The results are based on feedback from a total of 121 FIs (including commercial banks, microfinance institutions and other non-bank FIs) that were interviewed across the 19 ROGEP countries. This summary only focuses on responses from commercial banks and MFIs, which together account for 92% of all respondents. See Annex 3 for more details.
According to the survey, there is strong financial-sector interest across ROGEP countries to finance renewable energy projects, especially in off-grid solar. Commercial banks and MFIs identified loan guarantees as the most important measure that could improve their capacity to lend to the renewable energy sector. Most of the surveyed institutions also identified clear interest in credit lines.

ECREEE: OFF-GRID SOLAR MARKET ASSESSMENT AND PRIVATE SECTOR SUPPORT FACILITY DESIGN
CAMEROON REPORT
156
More than 70% of surveyed commercial banks and MFIs are interested in a credit line to finance off-grid solar projects. Commercial banks want tenors of 1-15 years and interest rates from 0.25-7%. MFIs are seeking tenors of 1-5 years with interest rates from 2-16%. On average, commercial banks want a credit line with a 5-year tenor and 3.4 % interest rate, and MFIs want a 3.1-year tenor with 5.4% interest rate.
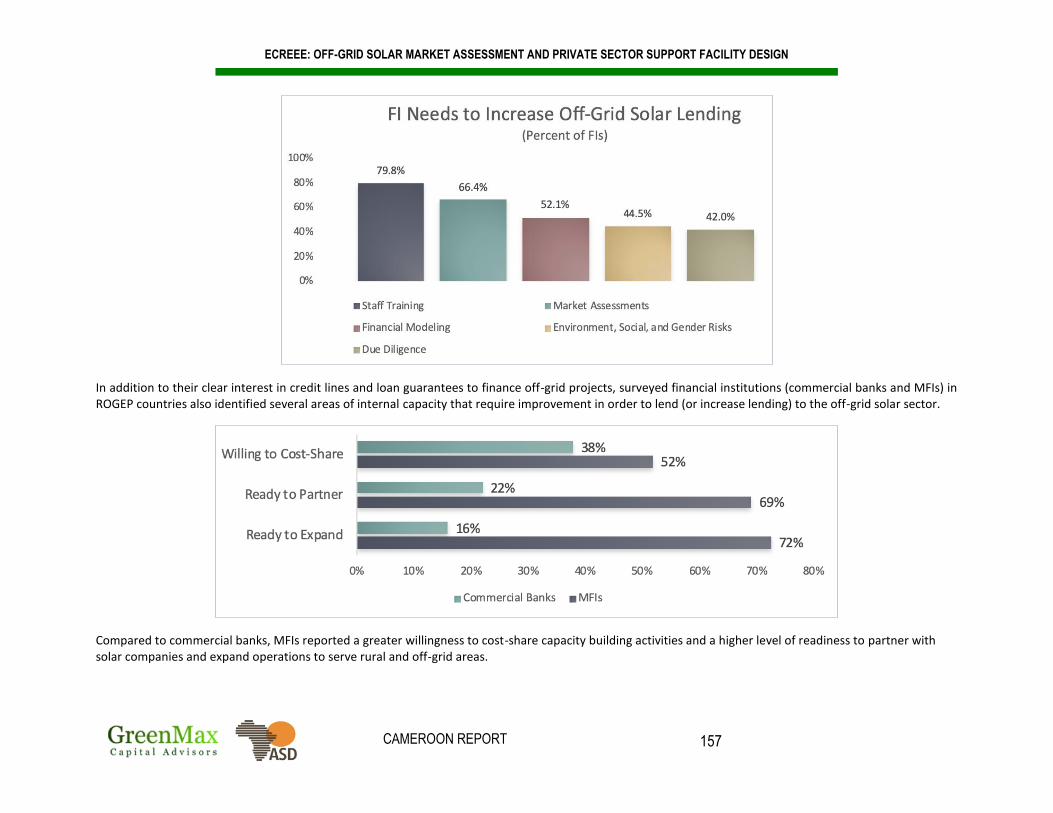
ECREEE: OFF-GRID SOLAR MARKET ASSESSMENT AND PRIVATE SECTOR SUPPORT FACILITY DESIGN
CAMEROON REPORT
157
In addition to their clear interest in credit lines and loan guarantees to finance off-grid projects, surveyed financial institutions (commercial banks and MFIs) in ROGEP countries also identified several areas of internal capacity that require improvement in order to lend (or increase lending) to the off-grid solar sector.
Compared to commercial banks, MFIs reported a greater willingness to cost-share capacity building activities and a higher level of readiness to partner with solar companies and expand operations to serve rural and off-grid areas.

ECREEE: OFF-GRID SOLAR MARKET ASSESSMENT AND PRIVATE SECTOR SUPPORT FACILITY DESIGN
CAMEROON REPORT
158
ANNEX 1: TASK 1 METHODOLOGY
STATE OF ENERGY ACCESS AND ENABLING MARKET ENVIRONMENT
Data presented in this section was collated from a range of public documents and reports as well as primary
source documents either provided by ECREEE or obtained through supplemental market research (desk
research and interviews with local public officials and industry stakeholders). These findings were
subsequently corroborated by attendees of national validation workshops held in each country at the
conclusion of the market assessment. Information obtained from the Task 2 focus group discussions and
surveys of industry stakeholders (see Annex 2) was also used to support the Task 1 analysis.
GIS DATA ANALYSIS APPROACH / METHODOLOGY
1. Categorizations, key definitions and datasets for geospatial least-cost analysis
The main steps of the GIS analysis are as follows:
(i) Categorization/definition of settlements: scenario 2023;
(ii) Categorization/definition of settlements: scenario 2030;
(iii) Definition of un-electrified settlements within grid areas; and
(iv) Determination of population per settlement
1.1. Categorization/definition of settlements: Scenario 2023
1.1.1. Electrification by grid extension – settlements which are located within 5 km of the current
electrical grid network241 (according to WAPP densification plans).
1.1.2. Electrification by mini-grid – settlements that:
• Are located within 15 km of areas that have a high night-lights value (above 50/225 on
grayscale raster)242 and outside the buffer area established for the electrification by grid
extension
• Are located within areas that have a population density of more than 350 people per
km2 (as defined by Eurostat for rural areas)243, plus an additional 50 people per km2 for
greater feasibility of mini-grids244 and are within 1 km245 of a social facility (education
center or health facility) and existing mini-grids of 2018.
1.1.3. Electrification by off-grid stand-alone systems – settlements that do not fall into the above
categories
1.2. Categorization/definition of settlements: Scenario 2030
1.2.1. Electrification by grid extension – settlements which are located within 15 km of the
current electrical grid network (average distance mentioned by energy utilities in West
Africa) or within 5 km of planned future line extensions246
241 NOTE: Low-voltage distribution lines were not considered in this analysis (data was unavailable) 242 The 50/225 classification represents the areas emitting light of the country with reduction of scattering light. The classification was first introduced in the USAID report ZAMBIA ELECTRIFICATION GEOSPATIAL MODEL and evaluated in cross-checks throughout the country. USAID: https://pdf.usaid.gov/pdf_docs/PA00T2JC.pdf 243 http://ec.europa.eu/eurostat/web/rural-development/methodology 244 Identified in discussions with different international mini-grid developer. 245 Preferred maximum distance for mini-grids from discussions with different international developer. 246 NOTE: Low-voltage distribution lines were not considered in this analysis (data was unavailable)

ECREEE: OFF-GRID SOLAR MARKET ASSESSMENT AND PRIVATE SECTOR SUPPORT FACILITY DESIGN
CAMEROON REPORT
159
1.2.2. Electrification by mini-grid – settlements that:
• Were defined as mini-grid settlements in scenario 2023
• Are located within 1 km of the above mini-grid settlements, which is the preferred
distance of mini-grid developers for their grid according to discussions with several
international developers.
• Are located within 15 km of economic growth centers – airports, mines and urban
areas; average worker distance in Africa is 10 km, a distance of 5 km is added to
include the growth of businesses in the periphery of the growth centers.247
1.2.3. Electrification by off-grid stand-alone systems – settlements that do not fall into the above
categories
1.3. Definition of un-electrified settlements within grid areas
To identify settlements that are located close to the national electrical grid but are not served by it, the
following criteria were used:
Within the main grid line zones (see buffer zones for electrification by grid extension above)
Outside 15 km night-lights of buffered areas to capture the densification within 5 years
Within areas of low population density (less than 350 people per km2)
1.4. Determination of population per settlement
A key component of the least-cost analysis was the number of people living in each settlement (city,
town, village, hamlet) of a given country. While there are different publicly available sources of
information on total population (e.g. World Bank demographic data), a more granular view of the
population distribution was necessary to perform the geospatial analysis.
Another difficulty was the identification of locations of settlements. The exact location of each
settlement (with given coordinates) was not available / accessible in many of the countries. As a result,
the least-cost analysis had to revert to other studies of population distribution – such as the population
distribution developed by WorldPop. WorldPop utilizes a range of geospatial datasets to develop
accurate population data:
“New data sources and recent methodological advances made by the WorldPop program now provide high resolution, open and contemporary data on human population distributions, allowing accurate measurement of local population distributions, compositions, characteristics, growth and dynamics, across national and regional scales. Statistical assessments suggest that the resultant maps are consistently more accurate than existing population map products, as well as the simple gridding of census data.” 248
A Voronoi polygon analysis249 was used to create boundaries for each settlement. These boundaries
were then used in combination with a population density layer to estimate total settlement population
of the given year. The current annual national population growth rate of 2.6%250 was applied to the
geospatial analysis to project populations for the scenario 2023 and 2030 analyses.
247 Lall, Somik Vinay; Henderson, J. Vernon; Venables, Anthony J. 2017. Africa's Cities: Opening Doors to the World. Washington, DC: World Bank. © World Bank. https://openknowledge.worldbank.org/handle/10986/25896 License: CC BY 3.0 IGO. 248 https://www.worldpop.org 249 To learn more about Voronoi polygons, see wikidot: http://djjr-courses.wikidot.com/soc128:qgis-voronoi-polygons 250 World Bank: https://data.worldbank.org/indicator/SP.POP.GROW?locations=CM

ECREEE: OFF-GRID SOLAR MARKET ASSESSMENT AND PRIVATE SECTOR SUPPORT FACILITY DESIGN
CAMEROON REPORT
160
2. Summary of Key Datasets
The table below summarizes the key datasets used for scenarios 2023 and 2030 as well as the criteria applied and sources used.
Overview of Key Datasets of the Least-Cost Electrification Analysis
Dataset Description
Criteria used by technology
Scenario 2023 Scenario 2030 Source and Year
On-grid Mini-grid Off-grid On-grid Mini-grid Off-grid
Electricity grid network (current)
Current national grid network (HV & MV lines)
≤ 5km distance
≥ 5km distance
≥ 5km distance
≤ 15km distance
≥ 15km distance
≥ 15km distance
GMG Market Assessment, 2017251
Electricity grid network (planned)
Future network planned to be built (HV & MV lines)
Not considered
Not considered
Not considered
≤ 5km distance
≥ 5km distance
≥ 5km distance
GMG Market Assessment, 2017
Mini-grids & Small Power Stations
Existing mini-grids and small Power Stations in 2018
Not considered
≤ 1km distance
≥ 1km distance
Not considered
≤ 1km distance from all identified mini-grids in Scenario 2023
≥ 1km distance from all identified mini-grids in Scenario 2023
REMP Report, 2017 & GMG Market Assessment, 2017
Night-lights Night-time light emissions used to identify electrified areas
Not considered
≤ 15km distance
≥ 15km distance
Not considered
Not considered
Not considered
NASA Earth Observatory, 2016
Population density
Population distribution in people per km2.
≥ 350 people per km2 252
≥ 350 people per km2
≤ 350 people per km2
Not considered
Not considered
Not considered
WorldPop, 2015
Settlements
Settlements in Cameroon, based on extrapolation of a number of sources including: Volume III tome 3 du RGPH 2005 « Projections démographiques »; Rapport de présentation des résultats définitifs du Troisième
Used Used Used Used Used Used GMG Market Assessment, 2017
251 Data from: SEforALL Africa Hub & AFDB, Green Mini-grid Market Development Programme, Mini-grid Market Opportunity Assessment: Cameroon, April 2017. 252 Based on Eurostat definition plus an additional 50 people per km2 for greater feasibility of mini-grids as identified in discussions with different international mini-grid developer. Source: http://ec.europa.eu/eurostat/web/rural-development/methodology

ECREEE: OFF-GRID SOLAR MARKET ASSESSMENT AND PRIVATE SECTOR SUPPORT FACILITY DESIGN
CAMEROON REPORT
161
Recensement Général de la Population et de l’Habitat, BUCREP.
Social facility: education centers
Schools, colleges, universities and kindergarten derived from OpenStreetMap (OSM); Indicator of active local economy
Not considered
≤ 1km distance253
≥ 1km distance
Not considered
Not considered
Not considered
Humanitarian Data Exchange (HDX), 2017
Social facility: health centers
Hospitals and clinics derived from OSM; Indicator of active local economy
Not considered
≤ 1km distance254
≥ 1km distance
Not considered
Not considered
Not considered
HDX, 2017
Growth center: airport, mines, urban areas
Economic growth centers for the analysis up to 2030 - defined for mini-grid areas; Urban areas are settlements with 5,000 inhabitants or more and with sufficient socio-economic and administrative infrastructures (official definition); Population per settlement in 2030 (calculated with the annual population growth rate of 2.6%)
Not used Not used Not used Not considered
≤ 15km distance
≥ 15km distance
airports: HDX, 2017 mines: HDX, 2015 urban areas: Populated places, GMG Market Assessment, 2017
253 Preferred maximum distance for mini-grids from discussions with different international developer. 254 Preferred maximum distance for mini-grids from discussions with different international developer.

ECREEE: OFF-GRID SOLAR MARKET ASSESSMENT AND PRIVATE SECTOR SUPPORT FACILITY DESIGN
CAMEROON REPORT
162
ANNEX 2: TASK 2 METHODOLOGY
OFF-GRID SOLAR PV MARKET ASSESSMENT METHODOLOGY
Focus Group Discussions (FGDs) were held in Yaoundé and Douala in June-July 2018 with key
stakeholders from each of the four off-grid market segments analyzed under Task 2: (i) household, (ii)
institutional, (iii) productive use, and (iv) supplier. Participants included a mix of public officials,
representatives from the private sector, donor community, NGOs, business and industry associations,
academia, community groups, and women’s groups. Each market segment had its own dedicated meeting,
although some stakeholders attended more than one discussion. Each FGD lasted approximately 90 minutes
and covered a range of topics related to demand for off-grid solar vis-à-vis each market segment.
In addition to the FGDs, three additional survey activities were undertaken to support the Task 2 analysis:
(i) a survey of large-scale international solar companies to gauge their level of interest in the country and
wider region; (ii) a survey of local small-scale retail suppliers of solar equipment; and (iii) an assessment
of an off-grid village to better understand how solar was being utilized for productive uses. The FGDs and
surveys largely yielded qualitative inputs to supplement the quantitative analysis that was undertaken.
The methodology and assumptions utilized to assess each market segment under Task 2 is presented below.
1. HOUSEHOLD DEMAND
1.1 Household market segments
1.1.1 Total population without access to electricity was calculated using World Bank total population
figures,255 multiplied by electricity access rates from the International Energy Agency (IEA),256
and translated to households using World Bank open data average household size. This method
is used to align population data throughout the report, with IEA seen as an overarching source
for energy access data and the World Bank providing important population and household
income data. See Annex 1 for more details.
1.1.2 Based on the country demographic and income data, the household solar market was broken
down into segments by income quintile, as shown in Section 2.1.1. For the purpose of this
analysis, income quintiles were aligned with energy tiers, as indicated by the Multi-Tier Energy
Access Framework, which is roughly determined by household ability to pay for tier levels of
energy. Quintiles were also aligned roughly with geographic segments.
1.1.3 World Bank demographic data used does not provide household income data broken down by
rural, urban, on-grid or off-grid. For example, the data shows the total population falling under
a certain poverty line, shows the total population that does not have access to electricity, and
shows the total population that is rural, but does not cross reference any of these indicators to
e.g. show the total rural population without access to electricity living under the poverty line.
For this reason, assumptions were made regarding the number of households per income
quintile that are off-grid (detailed in section 1.3.1 of these assumptions). It was assumed that
the majority of off-grid households are rural. The data gap prevents the presentation of an
overlapping map of the traditional poverty line income pyramid with electricity access.
255 World Bank Open Data, 2017: https://data.worldbank.org/ 256 IEA Energy Access Outlook, 2017: https://www.iea.org/publications/freepublications/publication/WEO2017SpecialReport_EnergyAccessOutlook.pdf

ECREEE: OFF-GRID SOLAR MARKET ASSESSMENT AND PRIVATE SECTOR SUPPORT FACILITY DESIGN
CAMEROON REPORT
163
1.2 Household energy expenditure and potential savings
1.2.1 Current household expenditure on energy-related items (believed to be candidates for
replacement with solar products) was estimated using information from the FGDs.
1.2.2 From the existing household expenditures, “typical” monthly costs were estimated that
households would incur in order to receive a standard level of electricity service according to
the Multi-Tier Energy Access Framework.
1.2.3 The unit monthly costs were used for each of the energy-related items identified above.
1.2.4 The cumulative monthly expenditure was then determined for each tier.
1.2.5 Monthly expenditure by tier was compared with monthly cost associated with OGS products
by tier to estimate potential household cost savings. Monthly cost for OGS products was based
on representative data from the West African and the Sahel region.
1.2.6 In the process of this analysis, the following assumptions were made:
1.2.6.1 Solar system sizes and costs:
• Cost per watt on solar systems vary greatly and have changed rapidly in the past five years.
Smaller pico and plug and play systems have a much higher per cost per watt. The
USD/Watt prices are based on sample cost ranges from Lighting Global equipment
available on the open market.
• Average system size by watts: values are chosen as representative values for solar systems
from each of the Tier values. They are intended to represent system sizes that typical
members of each group would purchase.
• Average system life values represent typical expected operating life of Lighting Global
products.
1.2.6.2 Current household energy usage:
Current Household Energy Usage (# Units/HH)
Technology Tier 1 Tier 1.5 Tier 2 Tier 3 Torch lights/Lanterns 1 2 3
Mobile Phone Charging 1 1 2
DC Radio - 1 - -
DC Music Player/Radio - - 1 -
Small Generator - - - 1
• Numbers of units of torch lights/lanterns, cell phones, dc radio, and small generator
represent the numbers of appliances that are demonstrated to be in use in typical households
of each tier based on FGDs and multiple survey documents.
1.2.6.3 Current household energy costs
• Typical purchase and operation costs of HH off-grid appliances were based on FGDs, field
energy surveys and reports.
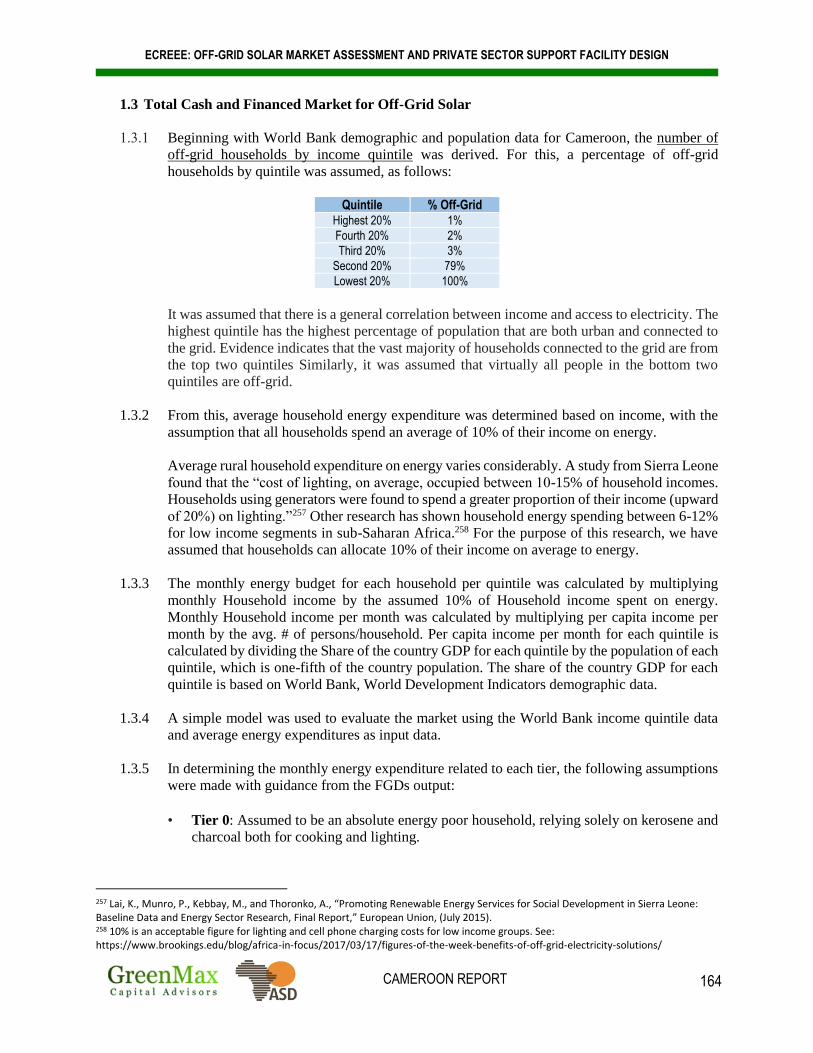
ECREEE: OFF-GRID SOLAR MARKET ASSESSMENT AND PRIVATE SECTOR SUPPORT FACILITY DESIGN
CAMEROON REPORT
164
1.3 Total Cash and Financed Market for Off-Grid Solar
1.3.1 Beginning with World Bank demographic and population data for Cameroon, the number of
off-grid households by income quintile was derived. For this, a percentage of off-grid
households by quintile was assumed, as follows:
Quintile % Off-Grid
Highest 20% 1%
Fourth 20% 2%
Third 20% 3%
Second 20% 79%
Lowest 20% 100%
It was assumed that there is a general correlation between income and access to electricity. The
highest quintile has the highest percentage of population that are both urban and connected to
the grid. Evidence indicates that the vast majority of households connected to the grid are from
the top two quintiles Similarly, it was assumed that virtually all people in the bottom two
quintiles are off-grid.
1.3.2 From this, average household energy expenditure was determined based on income, with the
assumption that all households spend an average of 10% of their income on energy.
Average rural household expenditure on energy varies considerably. A study from Sierra Leone
found that the “cost of lighting, on average, occupied between 10-15% of household incomes.
Households using generators were found to spend a greater proportion of their income (upward
of 20%) on lighting.”257 Other research has shown household energy spending between 6-12%
for low income segments in sub-Saharan Africa.258 For the purpose of this research, we have
assumed that households can allocate 10% of their income on average to energy.
1.3.3 The monthly energy budget for each household per quintile was calculated by multiplying
monthly Household income by the assumed 10% of Household income spent on energy.
Monthly Household income per month was calculated by multiplying per capita income per
month by the avg. # of persons/household. Per capita income per month for each quintile is
calculated by dividing the Share of the country GDP for each quintile by the population of each
quintile, which is one-fifth of the country population. The share of the country GDP for each
quintile is based on World Bank, World Development Indicators demographic data.
1.3.4 A simple model was used to evaluate the market using the World Bank income quintile data
and average energy expenditures as input data.
1.3.5 In determining the monthly energy expenditure related to each tier, the following assumptions
were made with guidance from the FGDs output:
• Tier 0: Assumed to be an absolute energy poor household, relying solely on kerosene and
charcoal both for cooking and lighting.
257 Lai, K., Munro, P., Kebbay, M., and Thoronko, A., “Promoting Renewable Energy Services for Social Development in Sierra Leone: Baseline Data and Energy Sector Research, Final Report,” European Union, (July 2015). 258 10% is an acceptable figure for lighting and cell phone charging costs for low income groups. See: https://www.brookings.edu/blog/africa-in-focus/2017/03/17/figures-of-the-week-benefits-of-off-grid-electricity-solutions/

ECREEE: OFF-GRID SOLAR MARKET ASSESSMENT AND PRIVATE SECTOR SUPPORT FACILITY DESIGN
CAMEROON REPORT
165
• Tier 1: The household was assumed to have access to 1 torch light/lantern powered by dry
cells, charging services for a phone charged on average 8 times a month.
• Tier 1.5: The household was assumed to have access to 1 torch light and 1 lantern each
powered by dry cells, one regular cell phone charged on average 8 times a month, and a
radio powered by dry cells (assume access to 2 low quality cells) replaced 4 times a month.
• Tier 2: The household was assumed to have access to 1 torch light and 2 lanterns each
powered by dry cells, one regular cell phone charged on average 8 times a month, and one
smart phone charged on average 16 times a month, a radio/music player powered by dry
cells (assume access to 4 low quality cells), replaced 4 times a month.
• Tier 3: The household was assumed to have access to a generator powering a number of
appliances but available only for 2-3 hours a day.
• Annualized energy costs for each of the systems = ([Capital system cost/average system
life in years]+[Monthly operating cost*12])
1.3.6 The potential market size for each solar tier was then calculated by multiplying the number
of off-grid households per quintile that will be willing to pay for each solar tier by the cost of
each system (system cost is based on representative data from Cameroon, as shown in 2.2.5).
1.3.7 In determining the number of off-grid households per quintile that will be willing to pay
for each solar tier, the key assumption of the model is that each off-grid household purchases
only one system and that they will opt for the highest solar system tier they can afford.
• For cash purchases, the assumption was that they will be willing to save (set aside) up to 3
months (number of months can be adjusted on the 'HH Assumptions' tab) of their monthly
energy budget to purchase the system.
• For PAYG/financed, the assumption was that they will be willing if their monthly energy
budget is less than or equal to the monthly PAYG payment AND if the PAYG upfront
payment is less than or equal to 3 months of their monthly energy budget.
1.3.8 The interest rate for consumer finance was estimated to be 34.8% p.a., based on information
available on the typical interest rate charged by Microfinance Institutions in Cameroon.259
2023 and 2030 Household Demand Scenario: Assumptions
1. The GIS analysis260 estimated that by 2023, 66.5% of the population will be grid connected, 4.7%
will be connected by mini-grids while 28.8% of the population will be connected by off-grid stand-
alone solutions. By 2030, the GIS analysis estimated that 96.6% of the population will be grid
connected, 1.2% will be connected by mini-grids while only 2.2% of the population will be
connected by off-grid stand-alone solutions. Based on these dynamics in the demographic patterns,
coupled with the existing government plans, the following assumptions regarding the off-grid
population based on the quintiles were made:
• In the 2023 scenario, it was assumed that as the grid gets extended and mini-grids are deployed
(based on GIS data), the households in the quintiles with the highest income will be given
priority due to their relatively higher power demand and ability to pay for power consumption.
Hence, the highest four quintiles were assumed to have only 1%, 2%, 3%, and 38% off-grid
households respectively, while the lowest quintile was assumed to have 100% off-grid
households. These assumptions have been made such that the total number of off-grid
households assumed is equal to the GIS data 2023 estimate.
259 http://www.theafricareport.com/West-Africa/cameroon-what-business-wants.html 260 See Annex 1 for GIS methodology.

ECREEE: OFF-GRID SOLAR MARKET ASSESSMENT AND PRIVATE SECTOR SUPPORT FACILITY DESIGN
CAMEROON REPORT
166
• Similarly, in the 2030 scenario, it was assumed that the higher income quintiles will be
prioritized for electrification, based on economic considerations, above the lower quintiles.
Hence, the highest four quintiles were assumed to have only 0.5%, 1%, 1.5%, and 2% off-grid
households respectively, while the lowest quintile was assumed to have 6.1% off-grid
households. These assumptions have been made such that the total number of off-grid
households assumed is equal to the GIS data 2030 estimate.
Quintile % Off-Grid (2023) % Off-Grid (2030)
Highest 20% 1% 0.5%
Fourth 20% 2% 1%
Third 20% 3% 1.5%
Second 20% 38% 2%
Lowest 20% 100% 6.1%
2. Inflation rates for Cameroon: According to the IMF World Economic Outlook data, inflation in
Cameroon is estimated to be at 2% in 2023. It was assumed that the rate will remain the same
through 2030. Based on this assumption, the expected prices of the current household energy
technologies and the solar alternatives were estimated using an annual price escalation factor of
1.02.
3. Based on a 2.6% population growth rate from the World Bank261 and the population density dataset
used in the study, the estimated total population will be 26,685,886 in 2023 and 31,938,400 in 2030.
4. The least-cost electrification analysis found that the share of the population with access to
electricity via the national grid and mini-grids will be 71.2% in 2023 and 97.8% in 2030.
5. To estimate GDP, it was assumed that the current annual GDP growth rate of 3.4% will be
maintained through 2023 and 2030: Parameter 2023 2030
Population 26,685,886 (GIS estimate) 31,938,400 (GIS estimate)
GDP (constant 2010 USD) $44,199,670,873 $ 55,855,096,535
6. According to the Lighting Global Off-Grid Solar Market Trends Report 2018,262 the price of pico
solar products is expected to fall to USD 10.60 in 2020 and USD 10.10 in 2022 down from USD
10.90 in 2016. Based on these 2020 and 2022 figures, the average annual decrease in prices from
2020 was estimated at 2.36%. It was assumed that the annual price decrease will be maintained at
this rate through 2030 (annual cost reduction factor of 0.98).
7. According to the same report, the price of small SHS components is expected to fall to
USD 60.40 in 2020 and USD 47.40 in 2022, down from USD 77.80 in 2016. Based on
these 2020 and 2022 figures, the average annual decrease in prices from 2020 was
estimated at 10.76%. It was assumed that the annual price decrease will be maintained at
this level through 2030 (annual cost reduction factor of 0.89).
8. It was assumed the interest rates in Cameroon will stagnate at the current rate of 34.8% or possibly
decline.
261 https://data.worldbank.org/indicator/SP.POP.GROW?locations=BJ 262 “Off-Grid Solar Market Trends Report 2018,” Dahlberg Advisors, Lighting Global, GOGLA and World Bank ESMAP, (January 2018): https://www.lightingafrica.org/wp-content/uploads/2018/02/2018_Off_Grid_Solar_Market_Trends_Report_Full.pdf

ECREEE: OFF-GRID SOLAR MARKET ASSESSMENT AND PRIVATE SECTOR SUPPORT FACILITY DESIGN
CAMEROON REPORT
167
Household Cost Savings and Affordability Calculation
Annual Household Energy Budget by Quintile, Annual Energy Costs and Annual Costs of Solar Equivalents
• This analysis presents annualized costs (not including financing cost) of current energy
technologies for each energy tier, compared with the annual cost of an equivalent solar product.
The same analysis was also completed for the 2023 and 2030 scenarios.
• Both the annual costs of current energy technologies and equivalent solar solutions considered the
capital cost of each unit as well as the operating cost over the average lifetime of a unit.
• These costs were compared with a 10% monthly energy budget for households of different income
quintiles. The analysis did not assess affordability for a cash vs. financed purchase over time.
1st Quintile
2nd Quintile
3rd Quintile
4th Quintile
5th Quintile
Tier 1 Tier 1.5 Tier 2 Tier 3
2018
Cost of current energy costs (USD) Cost of solar equivalent (USD)
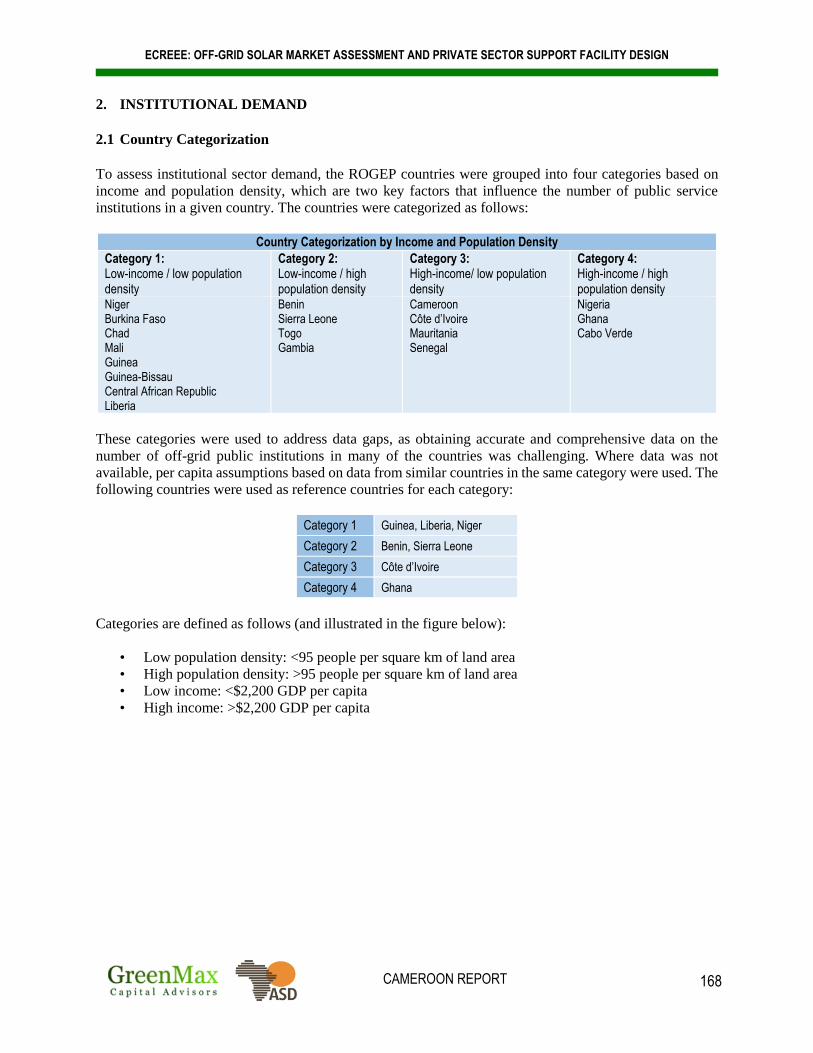
ECREEE: OFF-GRID SOLAR MARKET ASSESSMENT AND PRIVATE SECTOR SUPPORT FACILITY DESIGN
CAMEROON REPORT
168
2. INSTITUTIONAL DEMAND
2.1 Country Categorization
To assess institutional sector demand, the ROGEP countries were grouped into four categories based on
income and population density, which are two key factors that influence the number of public service
institutions in a given country. The countries were categorized as follows:
Country Categorization by Income and Population Density
Category 1: Low-income / low population density
Category 2: Low-income / high population density
Category 3: High-income/ low population density
Category 4: High-income / high population density
Niger Burkina Faso Chad Mali Guinea Guinea-Bissau Central African Republic Liberia
Benin Sierra Leone Togo Gambia
Cameroon Côte d’Ivoire Mauritania Senegal
Nigeria Ghana Cabo Verde
These categories were used to address data gaps, as obtaining accurate and comprehensive data on the
number of off-grid public institutions in many of the countries was challenging. Where data was not
available, per capita assumptions based on data from similar countries in the same category were used. The
following countries were used as reference countries for each category:
Category 1 Guinea, Liberia, Niger
Category 2 Benin, Sierra Leone
Category 3 Côte d’Ivoire
Category 4 Ghana
Categories are defined as follows (and illustrated in the figure below):
• Low population density: <95 people per square km of land area
• High population density: >95 people per square km of land area
• Low income: <$2,200 GDP per capita
• High income: >$2,200 GDP per capita

ECREEE: OFF-GRID SOLAR MARKET ASSESSMENT AND PRIVATE SECTOR SUPPORT FACILITY DESIGN
CAMEROON REPORT
169
Source: African Solar Designs analysis

ECREEE: OFF-GRID SOLAR MARKET ASSESSMENT AND PRIVATE SECTOR SUPPORT FACILITY DESIGN
CAMEROON REPORT
170
2.2 Energy Needs by Institutional Market Segment
Source: The estimates in the table above are based on data obtained from local experts, interviews with solar industry stakeholders and corroborated by secondary desk research.
CALCULATIONS: Rating of systems is based on data for sizes of the appliances from a 2016 GIZ solar PV catalogue.263 The solar PV sizing factor is based on the peak sun hours available across most of Africa.
263 “Photovoltaics for Productive Use Applications: A Catalogue of DC-Appliances,” GIZ, (2016): https://www.sun-connect-news.org/fileadmin/DATEIEN/Dateien/New/GIZ__2016__Catalogue_PV_Appliances_for_Micro_Enterprises_low.pdf
Institutional Sector Description Rating (W) Time of use (hrs) Total Wh/day Total Load Recommended system (W)
Water Pumping
Low power 1,500 6 9,000 1,500
Medium power 4,000 6 24,000 4,000
High power 10,000 6 60,000 10,000
Healthcare
HC1 Health post Lighting 30 8 240
Communication 20 8 160
ICT 100 8 800 1,200 250
HC2 Basic healthcare facility Lighting 200 8 1,600
Maternity 200 4 800
Vaccine refrigeration 100 8 800
Communication 100 4 400
Medical exams 200 2 400
ICT 200 8 1,600
Staff housing 50 8 400 6,000 1,500
HC3 Enhanced healthcare facility Lighting 400 8 3,200
Communication 200 8 1,600
Medical exams 600 2 1,200
ICT 300 8 2,400
Maternity 600 4 2,400
Laboratory 1,000 2 2,000
Sterilization 1,200 1 1,200
Vaccine refrigeration 150 8 1,200
Staff housing 200 8 1,600 16,800 4,200
Education
Primary school Communication 20 8 160
Lighting 80 8 640
ICT 100 8 800
Staff house 50 8 400 2,000 500
Secondary school Communication 20 8 160
Lighting 240 8 1,920
ICT 400 8 3,200
Laboratory use 100 8 800
Staff house 200 8 1,600 7,680 1,920
Public Lighting
Street lighting Lights 200 8 1,600 1,600 500

ECREEE: OFF-GRID SOLAR MARKET ASSESSMENT AND PRIVATE SECTOR SUPPORT FACILITY DESIGN
CAMEROON REPORT
171
Energy Needs Assumptions:
Water Supply: Power requirements (low, medium, high) are based on the type of water point:
• Borehole: 40% low power pumps; 40% medium power; 20% high power
• Protected dug well: 80% no pump; 10% low power pumps; 10% medium power; no high-power
• Unprotected dug well: No pump
• Protected spring: No pump
• Unprotected spring: No pump
• Public tap/standpipe (stand-alone or water kiosk): No pump
• Sand/Sub-surface dam (with well or standpipe): No pump
• Piped water into dwelling/plot/yard: No pump
• Rainwater harvesting: No pump
Healthcare: The size of the healthcare facility (HC1, HC2, HC3) determines the amount of energy each
facility requires.
Education: The size of the school and number of students determines the amount of energy each school
requires.
Public lighting: The electricity needs of a given town/market center (assuming two [2] public lighting
points per market center)
2.3 Institutional Market Sizing Calculations
Household systems, cost and price per watt:
System Type Tier Rating USD/Watt264 Average Size (Watts) Total Cost (USD)
Pico solar system Tier 1 $15.00 3 $45.00
Basic Plug and Play system Tier 1.5 $12.50 10 $125.00
Small HH solar system Tier 2 $5.00 50 $250.00
Medium HH solar system Tier 3 $2.50 250 $625.00
Size of systems used in institutional sector market sizing calculation:
Sector Description Size (corrected for time of use) HH systems
Water Supply Low Power 1,500 N/A
Medium Power 4,000 N/A
High power 10,000 N/A
Healthcare HC1 250 Tier 3
HC2 1,500 N/A
HC3 4,200 N/A
Education Primary 500 N/A
Secondary 1,920 N/A
Public lighting 500 N/A
264 Cost per watt derived from African Solar Designs analysis and from IRENA: https://www.irena.org/publications/2016/Sep/Solar-PV-in-Africa-Costs-and-Markets

ECREEE: OFF-GRID SOLAR MARKET ASSESSMENT AND PRIVATE SECTOR SUPPORT FACILITY DESIGN
CAMEROON REPORT
172
Institutional Sector Market Sizing Calculations:
NOTE: Prices cover only solar components (except for the HC1 tier 3 system, which comes with lighting)
Water Supply
# of water pumps X Size of solar system (watts) (low, medium, high power)
X
Cost per watt for pumping ($2.50)
divided by system lifetime of 20 years
= Estimated Annualized Off-Grid
Solar Market Potential for Water Supply Sector
Healthcare
# of healthcare facilities
X
X
= Estimated Annualized Off-Grid
Solar Market Potential for Healthcare Sector
HC 1 Cost per tier 3 system ($625) Divided by system lifetime of 5 years
HC 2 Size of solar system in Watts
(1500W)
Cost per watt ($2.50) divided by system lifetime of
20 years
HC 3 Size of solar system in Watts
(4200W)
Cost per watt ($2.50) divided by system lifetime of
20 years
Education
# of schools
X
X
= Estimated Annualized Off-Grid
Solar Market Potential for Education Sector
Primary Size of solar system in
Watts (500W)
Cost per watt ($3) divided by system lifetime of 20 years
Secondary Size of solar system in
Watts (1920W)
Cost per watt ($2.50) divided by system lifetime of
20 years
Public Lighting
# of off-grid market centers
X Size of solar system in
Watts (500W) X
Cost per watt ($3) divided by system lifetime of 20 years
= Estimated Annualized Off-Grid
Solar Market Potential for Public Lighting Sector
2.4 Data Collection Approach by Institutional Market Segment
CAMEROON
Water Supply Healthcare Education Public Lighting
Per capita assumption GIS data + local stakeholder interviews Per capita assumption Per capita assumption
Data was collected on the total number of off-grid institutions by institutional market segment for Cameroon
rom a combination of available GIS data, input from local experts, stakeholder interviews and desk
research. Where there were gaps in available data, per capita assumptions were made (see Section 2.2).
Assumptions:
Water Supply: Of the identified potable water points, it was assumed that 50% would be equipped with a
solar-powered water pump. Of the equipped water sources, the division of pumps between low, medium
and high-powered pumps was: 50%, 35% and 15%, respectively. The lower cost of the low power pumps
is the driving factor for this assumption. Where this information was not available, a per capita comparison
ECREEE: OFF-GRID SOLAR MARKET ASSESSMENT AND PRIVATE SECTOR SUPPORT FACILITY DESIGN
CAMEROON REPORT
173
was made with a country in the same category.265
Healthcare: Wherever possible, specific data on the number of off-grid healthcare facilities by size was
used (i.e. HC1, HC2, HC3). Where this information was not available, a per capita comparison was made
with a country in the same category.
Education: Wherever possible, specific data on the number of off-grid primary and secondary schools was
used. Primary schools encompass both primary and nursery schools. Vocational schools and universities
were not considered because they tend to be in cities, which are often grid-electrified. Where this
information was not available, a per capita comparison was made with a country in the same category. The
following per-capita assumptions were made:266
• Primary school: Per capita calculation using the off-grid population that is 0-14 years
• Secondary school: Per capita calculation using the off-grid population that is 15-19 years
Public lighting: Using population figures by region, and assuming that the population per market center
was 5,000 people, the number of market centers was calculated. An assumption of two [2] public lighting
points per market center was used in the calculation. No data on street lighting was included, as it was
assumed that street lighting projects are linked to road infrastructure rather than institutions.
2.5 Ability to Pay Analysis (Strongest Potential Market Segment)
Data was not available to estimate the monthly energy expenditures of institutional users. Secondary data
was available through government and donor program annual budgets for public services but was not
comprehensive. A rudimentary analysis was undertaken based on these funding sources and compared to
the total solar product market estimate for each institutional market segment in order to discuss the realistic
potential market outlook based on the ability to pay. Due to a lack of data, the analysis was not able to take
into account other potential sources of funding, such as funds pooled at the national or local level, fees for
services etc.
265 For Cameroon, since there was no comprehensive water GIS information available for any of the category 3 countries, a per capita comparison was made using water data from Ghana. 266 Population without access to electricity: https://www.iea.org/publications/freepublications/publication/WEO2017SpecialReport_EnergyAccessOutlook.pdf Population ages 0-14: https://data.worldbank.org/indicator/SP.POP.0014.TO Population ages 15-19: https://data.worldbank.org/indicator/SP.POP.1519.MA.5Y; https://data.worldbank.org/indicator/SP.POP.1519.FE.5Y

ECREEE: OFF-GRID SOLAR MARKET ASSESSMENT AND PRIVATE SECTOR SUPPORT FACILITY DESIGN
CAMEROON REPORT
174
3. PRODUCTIVE USE DEMAND
3.1 PUE Applications for Off-Grid Microenterprises (barbers and tailors)
The market sizing calculation for the barbers and tailors sector assumed that hair cutting and sewing
appliances will be retrofitted to be powered by a Tier 3 DC solar system (5-year system life). By using a
single price for all of the ROGEP countries, this methodology does not take into account country-specific
cost and supply chain constraints.
Microenterprises
# of financially
constrained SMEs267
X Cost per tier 3 system
($625) Divided by system lifetime of 5 years
= Estimated Annualized Off-Grid Solar
Market Potential for SMEs
3.2 Value-Added PUE Applications
Available data from various sources such as the World Bank, the UN’s Food and Agriculture Organization
and GSMA was used to estimate the potential OGS market for productive use applications in each of the
analyzed market segments – solar pumping for agricultural irrigation, solar powered milling and solar
powered refrigeration.
3.2.1 Irrigation
The market sizing calculation for solar-powered irrigation was based on smallholder irrigation potential
(i.e. the amount of irrigable land suitable for smallholder farmers) that could benefit from a solar pumping
system ($650, 6-year system life, 120 W system). This methodology does not take into account affordability
(ability to pay) nor does it account for country-specific cost and supply chain constraints.
Value-Added PUE Applications – Solar Irrigation
Irrigation Potential
(hectare)268
X 25%
=
Smallholder Irrigation Potential
(hectare)269
Divided by 0.3270
=
Estimated No. of Smallholder Farms Suitable for Solar
Irrigation
X
$650 (cost of solar
pumping kit)271
Divided by 6 year
(life of system)
=
Estimated Annualized Off-
Grid Solar Market Potential
for irrigation
Methodology for identifying areas suitable for irrigation activities on farms:
The areas for potential irrigation activities were calculated using the visible cropland272 adjacent to
permanent surface water sources. As identified by experts in a study in Zambia273 and based on other expert
consultations, beyond a 5 km distance from surface water, the returns are not economically feasible. Figure
27 is a map of the cropland within a 5 km distance from permanent surface water.
267 “MSME Finance Gap,” SME Finance Forum: https://www.smefinanceforum.org/data-sites/msme-finance-gap 268 AQUASTAT – Food and Agriculture Organization: http://www.fao.org/nr/water/aquastat/data/query/index.html?lang=en 269 Assumption that 25% of irrigable land irrigated by smallholder farmers; See: “Lessons Learned in the Development of Smallholder Private Irrigation for High Value Crops in West Africa,” World Bank, (2011): http://siteresources.worldbank.org/INTARD/Resources/West_Africa_web_fc.pdf 270 Assumption that smallholder private irrigation consists of small farms (0.3 hectare); See: “Off-grid Solar Market Assessment in Niger and Design of Market-based Solutions,” World Bank, (December 2017): https://www.lightingafrica.org/publication/off-grid-solar-market-assessment-niger-design-market-based-solutions/ 271 120W solar pumping kit: https://futurepump.com/futures-bright-farmers-kenya/ 272 “Prototype Land Cover Map over Africa at 20m Released,” Esa, (February 2018): https://www.esa-landcover-cci.org/?q=node/187 273 “Zambia Electrification Geospatial Model,” USAID and Power Africa, (April 2018): https://pdf.usaid.gov/pdf_docs/PA00T2JC.pdf

ECREEE: OFF-GRID SOLAR MARKET ASSESSMENT AND PRIVATE SECTOR SUPPORT FACILITY DESIGN
CAMEROON REPORT
175
3.2.2 Milling
The market sizing calculation for solar-powered milling utilized a series of inputs from the UN Food and
Agriculture Organization to estimate the smallholder milling potential that could benefit from a 6.5 kW
solar powered milling system (20-year system life). Cereals (e.g. rice, maize, millet and sorghum) as well
as roots and tuber crops (e.g. cassava, yams and potatoes) were analyzed, as they provide an opportunity
for value addition through hulling or milling.
Value-Added PUE Applications – Solar Milling
Cereals, roots tuber
crops (tons)274
X 70%
275 X 50%276 =
Smallholder Milling
Potential (tons)
Divided by 2 tons per day X 70%
capacity factor277
= Estimated
No. of Solar Mills
X
6,500 W x $2.50 per watt
Divided by system lifetime
of 20 years
=
Estimated Annualized
Off-Grid Solar Market
Potential for Milling
Ultimately, the ability for an agricultural community to benefit from productive use applications has as
much to do with access to markets and improved crop inputs, as it has to do with the pricing and availability
of financing to purchase the equipment. Hence, the macroeconomic approach used to carry out this market
sizing does not account for country-specific cost and supply chain constraints.
3.2.3 Refrigeration
The market sizing calculation for solar-powered refrigeration utilized the estimated number of off-grid
market centers in each country to estimate the number that could benefit from a 5.5 kW solar refrigeration
system (20-year system life).
Value-Added PUE Applications – Solar Refrigeration
# Off-Grid Market Centers by country278
X 5,500 W279 X $2.50 per
watt Divided by system lifetime of 20 years
= Estimated Annualized Off-Grid
Solar Market Potential for Refrigeration
3.3 PUE Applications for Connectivity/Mobile Phone Charging Enterprises
The market sizing calculation for solar-powered phone charging enterprises was based on each country’s
mobile phone penetration rate (number of unique subscribers), rural population rate, and the average costs
of OGS phone charging appliances ($862, 5-year system life, 400 W system).
Mobile Phone Charging Enterprises
# of Mobile Phone Subscribers in 2017280
X % rural
population
Cost of solar phone charging appliances* divided by
lifetime of 5 years X
0.01 (assuming 1 phone charger per 100 mobile phone users)
=
Estimated Annualized Off-Grid Solar Market Potential for Phone
Charging Enterprises
274 Food and Agriculture Organization: http://www.fao.org/faostat/en/#data/RF 275 Assumption that 70% of crops are milled 276 Assumption that 50% of milled crops are processed at smallholder farmer level 277 Solar mill (6.5 kW system) can mill 2 tons of produce per day; assume capacity factor of 70% (for maintenance/seasonality) See: “Off-grid Solar Market Assessment in Niger and Design of Market-based Solutions,” World Bank, (December 2017): https://www.lightingafrica.org/publication/off-grid-solar-market-assessment-niger-design-market-based-solutions/ 278 https://www.citypopulation.de 279 5.5kW solar powered refrigeration system – See: https://www.deutschland.de/en/solar-powered-coldhubs-nigeria 280 “The Mobile Economy, Sub-Saharan Africa,” GSMA Intelligence, (2017): https://www.gsmaintelligence.com/research/?file=7bf3592e6d750144e58d9dcfac6adfab&download
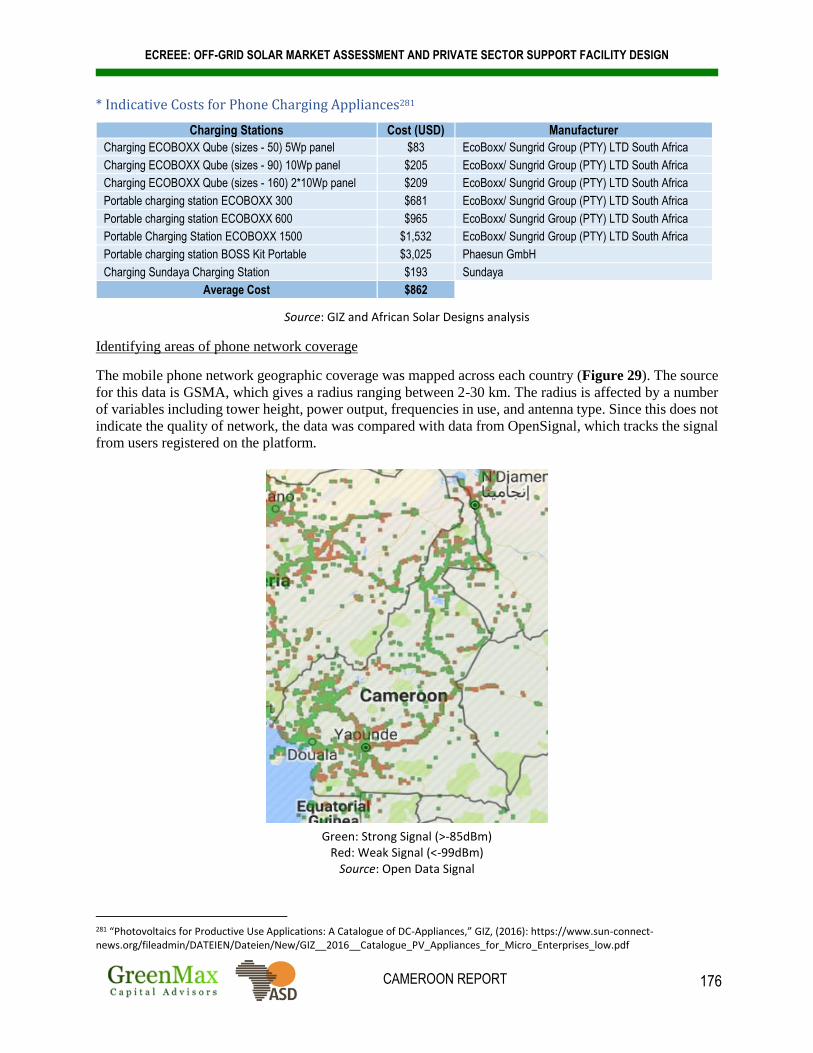
ECREEE: OFF-GRID SOLAR MARKET ASSESSMENT AND PRIVATE SECTOR SUPPORT FACILITY DESIGN
CAMEROON REPORT
176
* Indicative Costs for Phone Charging Appliances281
Charging Stations Cost (USD) Manufacturer
Charging ECOBOXX Qube (sizes - 50) 5Wp panel $83 EcoBoxx/ Sungrid Group (PTY) LTD South Africa
Charging ECOBOXX Qube (sizes - 90) 10Wp panel $205 EcoBoxx/ Sungrid Group (PTY) LTD South Africa
Charging ECOBOXX Qube (sizes - 160) 2*10Wp panel $209 EcoBoxx/ Sungrid Group (PTY) LTD South Africa
Portable charging station ECOBOXX 300 $681 EcoBoxx/ Sungrid Group (PTY) LTD South Africa
Portable charging station ECOBOXX 600 $965 EcoBoxx/ Sungrid Group (PTY) LTD South Africa
Portable Charging Station ECOBOXX 1500 $1,532 EcoBoxx/ Sungrid Group (PTY) LTD South Africa
Portable charging station BOSS Kit Portable $3,025 Phaesun GmbH
Charging Sundaya Charging Station $193 Sundaya
Average Cost $862
Source: GIZ and African Solar Designs analysis
Identifying areas of phone network coverage
The mobile phone network geographic coverage was mapped across each country (Figure 29). The source
for this data is GSMA, which gives a radius ranging between 2-30 km. The radius is affected by a number
of variables including tower height, power output, frequencies in use, and antenna type. Since this does not
indicate the quality of network, the data was compared with data from OpenSignal, which tracks the signal
from users registered on the platform.
Green: Strong Signal (>-85dBm) Red: Weak Signal (<-99dBm)
Source: Open Data Signal
281 “Photovoltaics for Productive Use Applications: A Catalogue of DC-Appliances,” GIZ, (2016): https://www.sun-connect-news.org/fileadmin/DATEIEN/Dateien/New/GIZ__2016__Catalogue_PV_Appliances_for_Micro_Enterprises_low.pdf

ECREEE: OFF-GRID SOLAR MARKET ASSESSMENT AND PRIVATE SECTOR SUPPORT FACILITY DESIGN
CAMEROON REPORT
177
4. SUPPLY CHAIN ANALYSIS
The Task 2 supply chain analysis was based on the following key sources of data:
• Supplier focus group discussions held in Yaoundé and Douala in June-July 2018
• Survey of 8 locally-based solar companies/suppliers in the country
• Survey of 10 larger international solar product suppliers
• ECREEE supplier database
• GOGLA semi-annual sales reports282
• Additional supplemental desk research and solar industry stakeholder interviews
These findings were subsequently corroborated by attendees of national validation workshops held in each
country at the conclusion of the market assessment.
A list of identified solar companies that are active in Cameroon is included below:
1 Africa Tech Solar
2 Afrique Energies Nouvelles
3 Aself
4 Asteven Cameroun
5 BBOXX
6 Bercotech
7 Biopelec Electronics
8 Bonus Consulting
9 Camsolar
10 Canopy Cameroun
11 CPF Mbouo
12 CPLC
13 Demtare T&D
14 Eco-Energy
15 Eliora Solar
16 Enhy
17 Fenix Int’l
18 Global Corporation
19 Global International Energie (Gie)
20 Gloco
21 Green Energy 4 Africa
22 Groupe Netora
23 Groupe Nkah
282 “Global Off-Grid Solar Market Report: Semi-Annual Sales and Impact Data,” GOGLA, Lighting Global and World Bank, (January – June 2018): https://www.gogla.org/sites/default/files/resource_docs/global_off-grid_solar_market_report_h1_2018-opt.pdf “Global Off-Grid Solar Market Report: Semi-Annual Sales and Impact Data,” GOGLA, Lighting Global and World Bank, (July – December 2017): https://www.gogla.org/sites/default/files/resource_docs/gogla_sales-and-impact-reporth2-2017_def20180424_web_opt.pdf “Global Off-Grid Solar Market Report: Semi-Annual Sales and Impact Data,” GOGLA, Lighting Global and World Bank, (January – June 2017): https://www.gogla.org/sites/default/files/resource_docs/gogla_sales-and-impact-reporth12017_def.pdf “Global Off-Grid Solar Market Report: Semi-Annual Sales and Impact Data,” GOGLA, Lighting Global and World Bank, (July – December 2016): https://www.gogla.org/sites/default/files/recource_docs/final_sales-and-impact-report_h22016_full_public.pdf “Global Off-Grid Solar Market Report: Semi-Annual Sales and Impact Data,” GOGLA, Lighting Global and World Bank, (January – June 2016): https://www.gogla.org/sites/default/files/recource_docs/global_off-grid_solar_market_report_jan-june_2016_public.pdf

ECREEE: OFF-GRID SOLAR MARKET ASSESSMENT AND PRIVATE SECTOR SUPPORT FACILITY DESIGN
CAMEROON REPORT
178
24 Haute Energy Systems
25 High Tech Engineering Services
26 Huawei
27 Ingenium Solar Energy
28 Instrumelec Cameroun
29 La Centrale Informatique
30 Les Compagnons Batisseurs
31 Maguysama Technologies Solaires
32 Mire World
33 Netora
34 Nztechnology Solar
35 Omnium Sira
36 Photovoltaic Cameroon
37 Repma Cameroon
38 Saf Solair Afric
39 Safenet
40 SAPRES
41 Schneider Electric
42 Solartek
43 Sotec
44 Sun Bio Technology
45 Sun Energy
46 Sunny Gals Technologies
47 Symposium Engineering Systems
48 Total
49 Tuna Group C°
50 2f Energie Services
51 Universal Sces C°
52 Upowa
53 Wilmosolar
54 Yandalux
Source: ECREEE, Focus Group Discussions; Stakeholder interviews

ECREEE: OFF-GRID SOLAR MARKET ASSESSMENT AND PRIVATE SECTOR SUPPORT FACILITY DESIGN
CAMEROON REPORT
179
ANNEX 3: TASK 3 METHODOLOGY
FINANCIAL INSTITUTION ASSESSMENT
Data collection under Task 3 included a combination of desk research, collaboration with local experts, and
extensive stakeholder engagement with key officials and representatives from local and regional
commercial banks, microfinance institutions and other development banks and agencies in Cameroon.
Interviews were also conducted with regional development banks (namely BOAD and EBID) and other
financiers active in the African off-grid solar sector, including export credit agencies, trade funders, crowd
funders and impact investors.
The stakeholder engagement activity, which included both phone interviews as well as in-person meetings
with key representatives from each FI, was undertaken across the 19 countries with extensive support from
ECREEE. As a follow up to each interview/meeting, a questionnaire was administered in order to gather
critical data on each institution, including inter alia their level of experience and capabilities with off-grid
sector lending, SME and consumer lending, relationships with local and international partners etc. Feedback
from the interviews and questionnaire, as well as quantitative data from each bank’s published annual
reports, was compiled and analyzed in order to assess which FIs could be most suitable local partners /
implementing agents for the proposed ROGEP facility.283
The questionnaire that was administered to FIs in the country and across the ROGEP region is included
below.284 The results of the survey are summarized in Section 3.4.
• Has the bank provided any loans to any segment of the off-grid sector? If so, please describe. • Has the bank received any inquiries from any segment of the off-grid sector? How many inquiries? • Did the bank engage in serious discussions or dismiss the inquiry(ies) as not within the bank’s area of lending or
not interesting as a new business line? If dismissed, please provide the bank’s reasons. • If the bank engaged in serious review/discussions and rejected the opportunity, please describe the bank’s due
diligence approach and reasons for rejection. • Is the bank interested to pursue lending to any segment of the off-grid sector? Which segment and which of
the bank’s departments and existing products apply? • Describe the bank’s current loan products and lending activity for the SME, Corporate, Consumer and Agri
markets. Please provide rough figures on volumes in number of loans and value in each category. For each category please provide average margins, pricing, loan tenors to borrowers, collateral requirements.
• Does the bank have a structured finance department? Has the bank provided financing to any IPPs? If so, please provide details on the transactions (location, technology, size, maturity, portion of bank engagement in the total financing)
• Does the bank have a trade finance department? What are standard terms and conditions? What are the volumes in number of loans and values?
• Does the bank operate nationwide or only in certain regions? Does the bank have a presence in rural areas and is rural consumer and SME and Agri lending a key business focus?
• Does the bank have experience with managing DFI credit lines? In which sectors/departments? Which DFIs? What volumes? Were the lines fully committed and disbursed? What was the bank’s overall experience with these credit lines?
• Has the bank had dealings with the ECOWAS Bank for Investment and Development (EBID)? What type of relationship? Credit lines? Co-lending? Credit enhancement? Have the experiences been positive?
• What is the bank’s view on accepting hard currency credit lines and on-lending in hard currency? Would the bank hedge hard currency credit lines and on-lend in local currency?
283 The results of this assessment and corresponding recommendations were prepared for ECREEE in a separate, confidential report. 284 The survey was adapted based on the type of FI that was being interviewed (commercial banks, MFIs, Regional Development Banks)

ECREEE: OFF-GRID SOLAR MARKET ASSESSMENT AND PRIVATE SECTOR SUPPORT FACILITY DESIGN
CAMEROON REPORT
180
• Is the bank interested to explore a credit line with ROGEP? What size of credit line would the bank be comfortable launching with initially?
• Does the bank feel that it would need a third-party guarantee in order to reduce risk enough to make loans to off-grid enterprises? If so, would it be enough if a guarantor were to cover 50% of losses on par with the bank? Or will the bank need the guarantor to take the first 10-20% of losses in an off-gird loan portfolio?
• What pricing does the bank consider to be fair and affordable for third party pari-passu guarantees? For first loss coverage?
• Has the bank had experience with any of the following as guarantors on the bank’s loans: Africa Guarantee Fund, Africa Trade Insurers, Afrexim Bank, GuarantCo, IFC, USAID DCA? Has their pricing been fair and affordable? Does the bank have any preference in working with one over the others?
• To engage in lending to the off-grid market segments, would Technical Assistance be helpful? What types of TA would be most useful? Outside consultants to help design specific loan products and underwriting guidelines for the off-grid sector? Outside consultants to develop deal flow and conduct due diligence? Training of bank credit department and account representative personnel? Direct funding to the bank to develop marketing and promotional materials and hire staff?
• Does the bank adhere to and is in compliance with all aspects of the Basel II and III accords? • Does the bank adhere to and have implemented controls for the Equator Principals and the World Bank/IFC
Environmental and Social Standards?

ECREEE: OFF-GRID SOLAR MARKET ASSESSMENT AND PRIVATE SECTOR SUPPORT FACILITY DESIGN
CAMEROON REPORT
181
ANNEX 4: GENDER ASSESSMENT
1. Context and Purpose of the Gender Analysis
Within the context of this assignment, a gender-focused analysis was undertaken to assess the level of
participation of women in each country’s off-grid energy sector. This analysis is critical to the overall
market assessment given the clear linkages between energy and gender, namely different rates of access and
use as well as the impacts of energy sources and appliances in the home, community and wider society.
Energy sector studies often fail to obtain gender-disaggregated data, which is necessary to inform
policymakers and better understand the needs and priorities of women in the context of sustainable
development.
Women in energy-poor households are at substantially higher risk of illness attributable to indoor air
pollution and solid fuel (biomass) use.285 Moreover, the significant time burdens that women and girls face
in collecting fuel and water, cooking and processing food often keep girls from attending school; there is
evidence that electrified milling equipment and water pumps can significantly reduce this burden. Lack of
access to electricity also means that women do not have access to information and communication
technologies that could improve their lives.286
As a region, West Africa and the Sahel has remained traditionally gender-stratified whereby males on
average have greater access to resources, are more empowered by society and have more opportunities than
women.287 To address these challenges, governments across the region have adopted a range of policies to
improve gender equality and promote gender mainstreaming. Member states of ECOWAS have adopted a
Policy for Gender Mainstreaming in Energy Access, an initiative committed to promoting favorable policies
and frameworks and mobilizing resources to more fully engage women in all areas of energy access,
including as energy suppliers, planners, financiers, educators and customers.288 ECREEE, the agency that
is administering this policy throughout the region, is supporting implementation of regulatory and
institutional measures that aim to improve inclusive energy access in each country by 2030. ECREEE has
also partnered with AfDB to launch a separate regional initiative to advance the participation of women
entrepreneurs in the renewable energy sector.289
Outside of ECOWAS, Cameroon, Chad and Central African Republic are pursuing gender mainstreaming
at a regional level through the Economic Community of Central African States (ECCAS) Regional Policy
for universal access to modern energy services and economic and social development (2014-2030).290
Mauritania is also implementing a national policy to address this issue – the National Strategy of
Institutionalization of Gender (la Stratégie Nationale d’institutionalisation du genre).
285 “The Energy Access Situation in Developing Countries: A Review Focusing on the Least Developed Countries and Sub-Saharan Africa,” UNDP and World Health Organization, (2009): http://www.undp.org/content/dam/undp/library/Environment%20and%20Energy/Sustainable%20Energy/energy-access-situation-in-developing-countries.pdf 286 Rewald, R., “Energy and Women and Girls: Analyzing the needs, uses, and impacts of energy on women and girls in the developing world,” Oxfam, (2017): https://www.oxfamamerica.org/static/media/files/energy-women-girls.pdf 287 “Situation Analysis of Energy and Gender Issues in ECOWAS Member States,” ECREEE, National Energy Laboratory, (2015): https://www.seforall.org/sites/default/files/Situation-Analysis-of-Energy-and-Gender-Issues.pdf 288 Ibid. 289 “Feasibility study promotes women’s participation in energy transition,” ESI Africa, (May 7, 2018): https://www.esi-africa.com/feasibility-study-promotes-womens-participation-in-energy-transition/ 290 “Central Africa Regional Integration Strategy Paper,” African Development Bank, (2011-2015): https://www.afdb.org/fileadmin/uploads/afdb/Documents/Policy-Documents/RISP%20CENTRAL%20AFRICA-ECCAS%20English%20FINAL.pdf

ECREEE: OFF-GRID SOLAR MARKET ASSESSMENT AND PRIVATE SECTOR SUPPORT FACILITY DESIGN
CAMEROON REPORT
182
Description of Approach / Methodology
While the data collection for this assignment was not sex dis-aggregated (which was beyond the scope of
work), a gender-focused perspective was applied to the overall analysis. The methodology adopted to carry
out this exercise included a combination of desk research, literature review, focus group discussions (FGDs)
and face-to-face interviews with key gender “focal points” identified by ECREEE in each country.
Representatives from women’s groups, female-led businesses and energy sector organizations attended the
focus group meetings that were held in Douala and Yaoundé in June-July 2018 to share their insights and
inform the overall market study. A gender questionnaire was also distributed to key stakeholders in
Cameroon to assess the main barriers/constraints for inclusive participation in the country. The survey
examined a number of key gender issues, including inter alia access to credit, access to education and
information, entrepreneurial and income-generating activities for women (including productive use of
energy), representation of women in leadership positions in business and government.
Gender Questionnaire
The following questionnaire was administered to key stakeholders in each country. Respondents were asked
to reply Yes/No to each question and elaborate as needed. HOUSEHOLD Are women generally involved in influencing decisions on household energy use/services? Are off-grid solar solutions (E.g. solar lanterns, solar home systems) largely accessible/made available to the household sector, particularly women-headed households? Are there any related programs and initiatives (donor, government, private sector, NGO etc.) that are specifically targeting energy access for women in the household sector? Are off-grid solar products and services generally affordable for households headed by women? If not, are Microfinance Institutions or other organizations in the country providing credit/financing (grants/loans) to the household sector, particularly women-headed households to increase energy access? Are women aware of the health impact of unclean energy (e.g. fuel-wood for cookstoves) and the solutions (i.e. solar) to address it? COMMUNITY/INSTITUTIONAL Are women represented in any high-level energy sector positions? Please provide names/examples, if available, of women in senior management positions in government, committees, boards etc. Is the mobility and safety of women constrained due to poor energy services (e.g., unavailability of streetlights due to unreliable electricity supply)? PRODUCTIVE USE What kind of productive use activities do women engage in and what women-led productive use activities can be supported by off-grid solar solutions?
Agriculture (irrigation, water pumping etc.)
Shops (retail, artisanal/handicrafts, grocery, salons etc.)
Restaurants (bar, cafe etc.)
Kiosks (e.g. mobile money etc.)
Tourism
Other
SUPPLIER Please describe the level of engagement that women have in in the off-grid energy services sector. Are women highly employed in this area (e.g. is there data collected on the number of women-owned businesses/SMEs)?
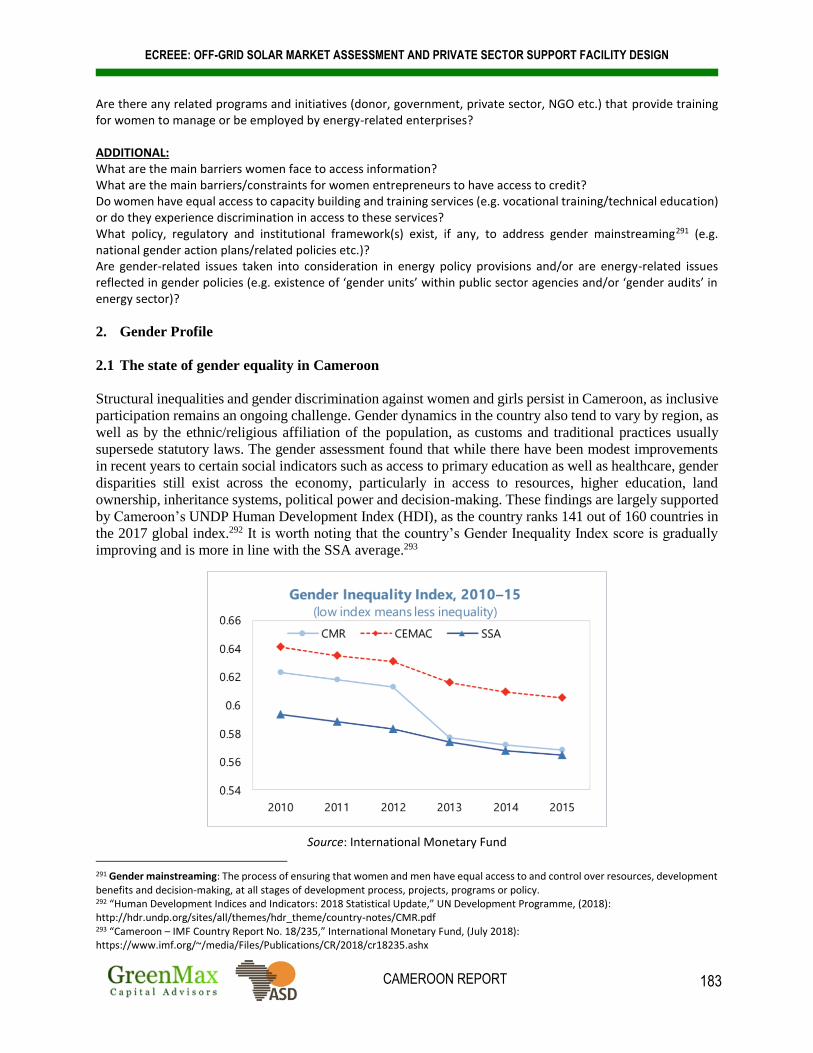
ECREEE: OFF-GRID SOLAR MARKET ASSESSMENT AND PRIVATE SECTOR SUPPORT FACILITY DESIGN
CAMEROON REPORT
183
Are there any related programs and initiatives (donor, government, private sector, NGO etc.) that provide training for women to manage or be employed by energy-related enterprises? ADDITIONAL: What are the main barriers women face to access information? What are the main barriers/constraints for women entrepreneurs to have access to credit? Do women have equal access to capacity building and training services (e.g. vocational training/technical education) or do they experience discrimination in access to these services? What policy, regulatory and institutional framework(s) exist, if any, to address gender mainstreaming291 (e.g. national gender action plans/related policies etc.)? Are gender-related issues taken into consideration in energy policy provisions and/or are energy-related issues reflected in gender policies (e.g. existence of ‘gender units’ within public sector agencies and/or ‘gender audits’ in energy sector)?
2. Gender Profile
2.1 The state of gender equality in Cameroon
Structural inequalities and gender discrimination against women and girls persist in Cameroon, as inclusive
participation remains an ongoing challenge. Gender dynamics in the country also tend to vary by region, as
well as by the ethnic/religious affiliation of the population, as customs and traditional practices usually
supersede statutory laws. The gender assessment found that while there have been modest improvements
in recent years to certain social indicators such as access to primary education as well as healthcare, gender
disparities still exist across the economy, particularly in access to resources, higher education, land
ownership, inheritance systems, political power and decision-making. These findings are largely supported
by Cameroon’s UNDP Human Development Index (HDI), as the country ranks 141 out of 160 countries in
the 2017 global index.292 It is worth noting that the country’s Gender Inequality Index score is gradually
improving and is more in line with the SSA average.293
Source: International Monetary Fund
291 Gender mainstreaming: The process of ensuring that women and men have equal access to and control over resources, development benefits and decision-making, at all stages of development process, projects, programs or policy. 292 “Human Development Indices and Indicators: 2018 Statistical Update,” UN Development Programme, (2018): http://hdr.undp.org/sites/all/themes/hdr_theme/country-notes/CMR.pdf 293 “Cameroon – IMF Country Report No. 18/235,” International Monetary Fund, (July 2018): https://www.imf.org/~/media/Files/Publications/CR/2018/cr18235.ashx

ECREEE: OFF-GRID SOLAR MARKET ASSESSMENT AND PRIVATE SECTOR SUPPORT FACILITY DESIGN
CAMEROON REPORT
184
2.2 Gender and poverty
Poverty remains widespread in Cameroon, particularly in the country’s northern regions and in rural areas,
where more than half of the country’s poor live.294 It is estimated that about 40% of the population lives in
poverty; about half of the people living in poor households are women and children under the age of 15.295
An estimated 38% of the labor force is considered working poor at PPP USD 3.10/day.296
2.3 Gender, Human Capital and Economic Empowerment
2.3.1 Education, Skills Development and Training
In Cameroon, two separate systems of education are used – one based on the French model and the other
on the British model. Primary school education is free, but families must pay for uniforms, and book fees
for pupils. Tuition and fees for secondary school are high and remain unaffordable for many families. The
UN estimates that 32.5% of adult women have some secondary education compared to 39.2% of men.297
Female access to education and rates of enrollment in higher education in Cameroon are low compared to
men (Figure 9).
There is also a strong rural-urban divide in access to education and education performance. In rural areas,
primary school attendance for girls is only about 65%, compared to 79% for boys; in urban areas, where
school attendance is high for all children, the gender gap is narrower. Once enrolled, fewer girls complete
primary education than boys. The gender parity index for primary completion rate is the ratio of female
primary education completion rate compared to male primary education completion rate (a value of 1
indicates gender parity). In Cameroon, the value of this index was at 0.86 in 2011 – nearly unchanged from
where the country was 20 years ago.298
Cameroon Gender Parity Index for Primary School Completion Rate
Source: UNESCO Institute for Statistics
294 Cameroon Overview: https://www.worldbank.org/en/country/cameroon/overview 295 Heifer International: https://www.heifer.org/ending-hunger/our-work/countries/africa/cameroon.html 296 “UN Human Development Indicators: Cameroon,” UN Development Programme, (2018): http://hdr.undp.org/en/countries/profiles/CMR 297 Ibid. 298 “Cameroon Economic Update: Revisiting the Sources of Growth and the Quality of Basic Education,” World Bank, (January 2014): http://www.worldbank.org/content/dam/Worldbank/document/Africa/Cameroon/Report/cameroon-economic-update-vol7.pdf

ECREEE: OFF-GRID SOLAR MARKET ASSESSMENT AND PRIVATE SECTOR SUPPORT FACILITY DESIGN
CAMEROON REPORT
185
Source: African Development Bank
According to the UN, as of 2017, only 30% of women in Cameroon had an account at a financial institution
or with a mobile money service provider.299 This can be attributed to the country’s elevated levels of
poverty, low or irregular sources of income, low rates of financial literacy, and a perceived lack of need.
This is also a result of the fact that most banks are focused on serving the formal sector, while many women
remain engaged in informal economic activities – especially subsistence agriculture, which has consistently
employed over 70% of the country’s female labor force over the last two decades.300
2.3.2 Fertility Rates and Reproductive Health
The demand for healthcare in Cameroon is high as existing facilities and services are inadequate. As of
2017, the fertility rate in Cameroon was about five children per woman. The maternal mortality rate is high;
for every 100,000 live births, 596 women die from pregnancy-related complications. The infant mortality
rate is also high at 52.8 per 1,000 births. As of 2017, 18% of women had an unmet need for family
planning.301
2.3.3 Participation and Decision-Making
Socio-cultural perspectives in Cameroon remain male-dominated, as conventional gender roles continue to
hold women back. Household decision-making often plays a critical role in restricting the rights and
empowerment of women. These dynamics are also reflected in the rates of representation of women in the
labor market as well as in leadership positions in business and government. Female participation in the
labor market is 10 percentage points lower than men (71% vs. 81%).302
In an effort to improve female participation, Cameroon has implemented quotas in its political party
platforms. Two political parties – the Cameroon People’s Democratic Movement (CPDM) and Social
299 “Human Development Indices and Indicators: 2018 Statistical Update,” UN Development Programme, (2018): http://hdr.undp.org/sites/default/files/2018_human_development_statistical_update.pdf 300 “Indicators on Gender, Poverty the Environment and Progress toward the Sustainable Development Goals in African Countries,” African Development Bank, (2017): https://www.afdb.org/fileadmin/uploads/afdb/Documents/Publications/GENDER_Poverty_and_Environmental_Indicators_on_African_Countries-2017.pdf 301 “Human Development Indices and Indicators: 2018 Statistical Update,” UN Development Programme, (2018): http://hdr.undp.org/sites/default/files/2018_human_development_statistical_update.pdf 302 “Human Development Indices and Indicators: 2018 Statistical Update,” UN Development Programme, (2018): http://hdr.undp.org/sites/all/themes/hdr_theme/country-notes/CMR.pdf
ECREEE: OFF-GRID SOLAR MARKET ASSESSMENT AND PRIVATE SECTOR SUPPORT FACILITY DESIGN
CAMEROON REPORT
186
Democratic Front (SDF) – both introduced a 25% quota for women on electoral lists.303 As of 2017, women
hold 27.1% of the country’s seats in parliament, which is relatively high compared to other countries in the
region, but still ranks poorly globally.304 Female representation in both the public and private sector remains
an ongoing challenge, with relatively few women in high-level positions.
2.4 Gender Policy, Institutional and Legal Framework in Cameroon
2.4.1 Gender Mainstreaming initiatives by the Government
Gender equality has gained widespread attention in Cameroon’s development plans. The GoC adopted
gender mainstreaming as a pathway to achieve not only equality between the sexes, but also to address
poverty reduction, economic growth, and sustainable development. Cameroon’s policy framework for
promoting gender equality and women’s empowerment is guided mainly by its National Gender Policy
Document (2011-2020), which was implemented in 2009 and under “Cameroon’s Vision 2035” initiative.
The country’s 1996 Constitution stipulates basic human rights and gender equality. The GoC has since
enacted a number of laws to ensure protection and promotion of the rights of women and to create an
enabling environment to ensure inclusive participation in the country’s development. Some of these policies
include Law 2000 National Commission on Human Rights and Freedoms and 2005 Law against trafficking
in children and slavery. The Ministry of Women’s Empowerment and Family (Ministère de la Promotion
de la Femme et de la Famille: MINPROFF) is another agency mandated to formulate gender-responsive
policies and to coordinate and monitor their implementation within different sectors of the society. The
MINPROFF participates in gender committees of each ministry and checks the progress of the ministry’s
policies and projects from a gender perspective. MINPROFF’s budget is 5% of the national budget. Each
ministry is responsible for obtaining budget for its gender-related activities. MINPROFF conducts gender
training for staff to ensure that gender perspectives are incorporated into program and project designs.
2.4.2 Gaps in the Gender Policy/Legal Framework
Despite the Government’s policy initiatives and legislative reforms, gender inequality remains an ongoing
challenge across the country’s political, economic and socio-cultural landscape, as women still face many
barriers to inclusive participation. Women are often curtailed in their access to information and decision-
making. Moreover, Cameroon’s legal system is based on the French civil law system, with English common
law influence; the legal system includes both national law and customary law. Customary law is applied
alongside statutory law, creating contradictions and inconsistencies.
2.5 Summary of Recommendations
Given the increased attention that gender inclusion has received in development planning, there are a
number of tools that are now available to policymakers that can be utilized to support gender mainstreaming
and encourage women’s participation in the energy sector. Despite encouraging progress in the discourse
on gender and energy access, substantial efforts are still needed, especially in enabling women’s
participation in the sector in different roles, including as energy entrepreneurs and in leadership positions.305
303 Women participation in Politics, www.iknowpolitics.org 304 ““Human Development Indices and Indicators: 2018 Statistical Update,” UN Development Programme, (2018): http://hdr.undp.org/sites/default/files/2018_human_development_statistical_update.pdf 305 “Renewable Energy: A Gender Perspective,” International Renewable Energy Agency, (2019): https://irena.org/-/media/Files/IRENA/Agency/Publication/2019/Jan/IRENA_Gender_perspective_2019.pdf

ECREEE: OFF-GRID SOLAR MARKET ASSESSMENT AND PRIVATE SECTOR SUPPORT FACILITY DESIGN
CAMEROON REPORT
187
In seeking solutions to improve women’s engagement in energy access, a 2018 IRENA survey found that
access to necessary technical, business or leadership skills development programs was the single most
important measure that could be taken. Over half of survey respondents also highlighted the need to
integrate gender perspectives in energy access programs as well as enhanced access to finance.
Measures to Improve Women’s Engagement in Energy Access
Source: International Renewable Energy Agency
In addition to the measures highlighted in the figure above, below is a list of additional policy
recommendations that could further improve gender equality in Cameroon’s energy sector:306
• Take measures to close the gender gap in access to education, particularly in higher levels of education
• Implement a quota system to increase the number of women employed in government’s energy ministry
and ensure that women are part of decision-making processes in the energy sector
• Implement policy and budgetary measures to support programs that aim to raise awareness and promote
opportunities for women as energy customers, suppliers, financiers, and educators
• Commission studies to collect, synthesize and publish gender-specific/sex-disaggregated data on
women’s energy access and usage to inform (i) public policy development to improve rates of access
for women; and (ii) private sector on potential customer needs (e.g. clean cooking technologies,
productive use of energy applications etc.)
• Undertake a “gender audit” of the energy sector and develop an action plan to inform policy objectives
targeting gaps in the existing framework and promoting inclusive participation (e.g. by adding gender
components to policies/projects and accounting for gender impacts in strategic planning).
• Establish a Gender Focal Point or Unit within key national and local institutions in order to administer
targeted gender policies and programs
• Raise awareness / provide training and technical support to private sector businesses / SMEs on (i) the
benefits of gender inclusion and in viewing business decisions through a gender lens; (ii) the value of
gender-disaggregated data; and (iii) how to develop and implement gender strategies to encourage
inclusive participation.307
306 NOTE: This is not an exhaustive list of recommendations as it is only intended to address inclusive participation in the energy sector; there are many gender-related challenges that warrant further study and attention within the context of the country’s complex economic and social structures that are beyond the scope of this analysis 307 “ECOWAS-CTCN Project on Mainstreaming Gender for a Climate Resilient Energy System in ECOWAS Countries: Final Report,” ECREEE and CTCN, (May 2018): https://www.ctc-n.org/system/files/dossier/3b/180627_final_report-uk.pdf

ECREEE: OFF-GRID SOLAR MARKET ASSESSMENT AND PRIVATE SECTOR SUPPORT FACILITY DESIGN
CAMEROON REPORT
188
REFERENCES Acumen, 2018, “Accelerating Energy Access: The Role of Patient Capital,” https://acumen.org/wp-content/uploads/Accelerating-Access-Role-of-Patient-Capital-Report.pdf Africa-EU Energy Partnership, 2016, “Mapping of Energy Initiatives and Programs in Africa,” http://www.euei-pdf.org/sites/default/files/field_publication_file/annex_5_aeep_mapping_of_energy_initiatives_overview_of_initiatives_0.pdf Africa-EU Renewables, 2015, “Cameroon Governmental Framework,” https://www.africa-eu-renewables.org/market-information/cameroon/governmental-framework/ African Development Bank, 2009, “Cameroon- Project to Strengthen and extend electricity transmission and Distribution networks,” https://www.afdb.org/fileadmin/uploads/afdb/Documents/Project-and-Operations/-%20Cameroon%20-%20AR%20Electricity%20Project%20-%5B1%5D.pdf African Development Bank, 2017, “Indicators on Gender, Poverty the Environment and Progress toward the Sustainable Development Goals in African Countries,” https://www.afdb.org/fileadmin/uploads/afdb/Documents/Publications/GENDER_Poverty_and_Environmental_Indicators_on_African_Countries-2017.pdf African Development Bank, 2018, “Cameroon Economic Outlook,” https://www.afdb.org/en/countries/central-africa/cameroon/cameroon-economic-outlook/ African Development Bank, 2018, “Sustainable Energy Fund for Africa,” https://www.afdb.org/en/topics-and-sectors/initiatives-partnerships/sustainable-energy-fund-for-africa/ African Development Bank Group, 2018, “African Development Bank, Nordic Development Fund and Partners launch Off-Grid Energy Access Fund with US$ 58 million,” https://www.afdb.org/en/news-and-events/african-development-bank-nordic-development-fund-and-partners-launch-off-grid-energy-access-fund-with-us-58-million-18432/ African Development Bank SEforALL Africa Hub, 2017, “Green Mini Grid Market Development Programme – Mini Grid Market Opportunity Assessment: Cameroon.” Agence des Normes et de la Qualité (ANOR), 2017, “Programme national d’élaboration des normes au Cameroon,” http://www.anorcameroun.info/documents/PNEN_FINAL.pdf Akitoby, B., Coorey, S., 2012, “Oil Wealth in Central Africa: Policies for Inclusive Growth” International Monetary Fund, Washington, D.C. Bavier, J., 2018, “Off-grid power pioneers pour into West Africa,” Reuters, https://www.reuters.com/article/us-africa-power-insight/off-grid-power-pioneers-pour-into-west-africa-idUSKCN1G41PE Blimpo, M., and Cosgrove-Davies, M., 2019, “Electricity Access in Sub-Saharan Africa: Uptake Reliability and Complementary Factors for Economic Impact,” AFD and World Bank, https://openknowledge.worldbank.org/bitstream/handle/10986/31333/9781464813610.pdf?sequence=6&isAllowed=y Bloomberg New Energy Finance, 2016, “How can Pay-As-You-Go Solar Be Financed?” https://www.bbhub.io/bnef/sites/4/2016/10/BNEF_WP_2016_10_07-Pay-as-you-go-solar.pdf

ECREEE: OFF-GRID SOLAR MARKET ASSESSMENT AND PRIVATE SECTOR SUPPORT FACILITY DESIGN
CAMEROON REPORT
189
Business in Cameroon, 2018, “Cameroon: UNDP distributes solar kits to health centers and schools in the Far-North,” https://www.businessincameroon.com/electricity/0803-7859-cameroon-undp-distributes-solar-kits-to-health-centers-and-schools-in-the-far-north Cameroon News Agency, 2018, “Green Energy Africa takes Buea by Storm with Renewable Energy,” http://cameroonnewsagency.com/green-energy-africa-takes-buea-storm-renewable-energy/ Cameroon Regional Economic Department, French Treasury, 2018, “La situation monétaire se stabilise en zone CEMAC,” https://www.tresor.economie.gouv.fr/Articles/7ea7eee8-10e9-4e65-ba55-91ec38ae3dab/files/1060fafb-660a-4db4-aafd-0cbbfdbb78b5 Cappola, F., American Express, “In Africa: Understanding the CFA Franc and its Foreign Exchange Rate Impact,” https://www.americanexpress.com/us/foreign-exchange/articles/cfa-franc-and-its-foreign-exchange-rate-impact/ Climatescope, 2017, “Cameroon Electricity Sector Law,” Bloomberg New Energy Finance, http://global-climatescope.org/en/policies/#/policy/4137 Dahlberg Advisors and Lighting Africa, 2018, “Off-Grid Solar Market Trends Report, 2018,” https://www.lightingafrica.org/wp-content/uploads/2018/02/2018_Off_Grid_Solar_Market_Trends_Report_Full.pdf Demirguc-Kunt, A., Klapper, L., and Singer, D., World Bank Policy Research Working Paper 8040, 2017, “Financial Inclusion and Inclusive Growth: A Review of Recent Empirical Evidence,” http://documents.worldbank.org/curated/en/403611493134249446/pdf/WPS8040.pdf Demirguc-Kunt, A., Klapper, L., Singer, D., Ansar, S., and Hess, J., 2018, “The Global Findex Database 2017: Measuring Financial Inclusion and the Fintech Revolution,” World Bank, Washington, DC. http://documents.worldbank.org/curated/en/332881525873182837/pdf/126033-PUB-PUBLIC-pubdate-4-19-2018.pdf Deutsche Gesellschaft für Internationale Zusammenarbeit (GIZ), 2011, “Productive Use of Energy – A Manual for Electrification Practitioners,” https://www.giz.de/fachexpertise/downloads/giz-eueipdf-en-productive-use-manual.pdf Deutsche Gesellschaft für Internationale Zusammenarbeit (GIZ), 2013, “Energy-Cameroon, Improving access to solar energy through a base of the pyramid approach,” https://energypedia.info/images/b/be/Total_Cameroon.pdf Deutsche Gesellschaft für Internationale Zusammenarbeit (GIZ), 2016, “Photovoltaics for Productive Use Applications: A Catalogue of DC-Appliances,” https://www.sun-connect-news.org/fileadmin/DATEIEN/Dateien/New/GIZ__2016__Catalogue_PV_Appliances_for_Micro_Enterprises_low.pdf Economist Intelligence Unit, 2016, “Global Microscope 2016: The Enabling Environment for Financial Inclusion,” https://publications.iadb.org/publications/english/document/Global-Microscope-2016-The-Enabling-Environment-for-Financial-Inclusion.pdf ECOWAS Center for Renewable Energy and Energy Efficiency and National Renewable Energy Laboratory, 2015, “Situation Analysis of Energy and Gender Issues in ECOWAS Member States,” https://www.seforall.org/sites/default/files/Situation-Analysis-of-Energy-and-Gender-Issues.pdf
ECREEE: OFF-GRID SOLAR MARKET ASSESSMENT AND PRIVATE SECTOR SUPPORT FACILITY DESIGN
CAMEROON REPORT
190
El-Zoghbi, M., Consultative Group to Assist the Poor (CGAP), 2018, “Measuring Women’s Financial Inclusion: The 2017 Findex Story,”: https://www.cgap.org/blog/measuring-womens-financial-inclusion-2017-findex-story ESI Africa, 2018, “Feasibility study promotes women’s participation in energy transition,” https://www.esi-africa.com/feasibility-study-promotes-womens-participation-in-energy-transition/ ESI-Africa, 2018, “SONATREL takes over of electricity transmission network,” https://www.esi-africa.com/cameroon-sonatrel-takes-over-the-electricity-transmission-network/ European Investment Bank, 2018, “Le secteur bancaire en Afrique De l’inclusion financière a la stabilité financière,” https://www.eib.org/attachments/efs/economic_report_banking_africa_2018_fr.pdf Fair Observer, 2013, “Tontines: The Informal Financial Sector in Cameroon,” https://www.fairobserver.com/region/africa/tontines-informal-financial-sector-and-sustainable-development-cameroon/ Ferrari, A., Masetti, O., Ren, J., 2018, “Interest Rate Caps: The Theory and the Practice,” World Bank Policy Research Working Paper, http://documents.worldbank.org/curated/en/244551522770775674/pdf/WPS8398.pdf Field Actions Science Reports, 2018, “Solar Loans Through a Partnership Approach: Lessons from Africa,” http://journals.openedition.org/factsreports/4206 Food and Agriculture Organization of the United Nations, “Family Farming Knowledge Platform, Smallholders DataPortrait,” http://www.fao.org/family-farming/data-sources/dataportrait/farm-size/en/ Foster, V., and Steinbuks, J., World Bank Policy Research Working Paper, 2009, “Paying the Price for Unreliable Power Supplies: In-House Generation of Electricity by Firms in Africa,” https://openknowledge.worldbank.org/handle/10986/4116 Global Finance, 2017, “Cameroon GDP and Economic Data, Country Report,” https://www.gfmag.com/global-data/country-data/cameroon-gdp-country-report Global Off-Grid Lighting Association, Lighting Global and World Bank, 2012, “Policy Report Note: Cameroon,” https://www.lightingafrica.org/wp-content/uploads/2016/07/28_Cameroon-FINAL-August-2012_LM.pdf Global Off-Grid Lighting Association, Lighting Global and World Bank, 2016, “Global Off-Grid Solar Market Report: Semi-Annual Sales and Impact Data (January-June 2016),” https://www.gogla.org/sites/default/files/recource_docs/global_off-grid_solar_market_report_jan-june_2016_public.pdf Global Off-Grid Lighting Association, Lighting Global and World Bank, 2016, “Global Off-Grid Solar Market Report: Semi-Annual Sales and Impact Data (July-December 2016),” https://www.gogla.org/sites/default/files/recource_docs/final_sales-and-impact-report_h22016_full_public.pdf Global Off-Grid Lighting Association, Lighting Global and World Bank, 2017, “Global Off-Grid Solar Market Report: Semi-Annual Sales and Impact Data (January-June 2017),” https://www.gogla.org/sites/default/files/resource_docs/gogla_sales-and-impact-reporth12017_def.pdf Global Off-Grid Lighting Association, Lighting Global and World Bank, 2017, “Global Off-Grid Solar Market Report: Semi-Annual Sales and Impact Data (July-December 2017),” https://www.gogla.org/sites/default/files/resource_docs/gogla_sales-and-impact-reporth2-2017_def20180424_web_opt.pdf
ECREEE: OFF-GRID SOLAR MARKET ASSESSMENT AND PRIVATE SECTOR SUPPORT FACILITY DESIGN
CAMEROON REPORT
191
Global Off-Grid Lighting Association, Lighting Global and World Bank, 2018, “Global Off-Grid Solar Market Report: Semi-Annual Sales and Impact Data (January-June 2018),” https://www.gogla.org/sites/default/files/resource_docs/global_off-grid_solar_market_report_h1_2018-opt.pdf Global Off-Grid Lighting Association, Lighting Global and World Bank, 2018, “Providing Energy Access through Off-Grid Solar: Guidance for Governments,” https://www.gogla.org/sites/default/files/resource_docs/energy_access_through_off-grid_solar_-_guidance_for_govts.pdf Grimm, M., Harwig, R., Lay, J., 2012, “How much does Utility Access matter for the Performance of Micro and Small Enterprises?” World Bank, http://siteresources.worldbank.org/INTLM/Resources/390041-1212776476091/5078455-1398787692813/9552655-1398787856039/Grimm-Hartwig-Lay-How_Much_Does_Utility_Access_Matter_for_the_Performance_of_MSE.pdf GSMA Intelligence, 2017, “The Mobile Economy: Sub-Saharan Africa,” https://www.gsmaintelligence.com/research/?file=7bf3592e6d750144e58d9dcfac6adfab&download Hallet, M., European Commission Directorate-General for Economic and Financial Affairs, 2008, “European Economy: The role of the Euro in Sub-Saharan Africa and in the CFA franc zone,” http://ec.europa.eu/economy_finance/publications/pages/publication13478_en.pdf Huawei, 2017, “Huawei MicroGrid Solar Solution Powers Rural Cameroon,” https://e.huawei.com/en/case-studies/global/2017/201707101504 IndexMundi, “Power outages in firms in a typical month (number) – Africa,” https://www.indexmundi.com/facts/indicators/ic.elc.outg/map/africa International Energy Agency, 2017, “Energy Access Outlook, 2017: From Poverty to Prosperity,” https://www.iea.org/publications/freepublications/publication/WEO2017SpecialReport_EnergyAccessOutlook.pdf International Finance Corporation, 2018, “PAYG Market Attractiveness Index – 2018 Report,” https://www.lightingglobal.org/wp-content/uploads/2018/11/FINAL-PAYG-MAI-2018-Report.pdf International Finance Corporation, 2018, “Unlocking Private Investment: A Roadmap to achieve Côte d’Ivoire’s 42 percent renewable energy target by 2030,” https://www.ifc.org/wps/wcm/connect/25885390-8a37-464f-bfc3-9e34aadc01b4/IFC-Côte_dIvoire-report-v11-FINAL.PDF?MOD=AJPERES International Monetary Fund, 2016, “Financial Access Survey,” http://data.imf.org/?sk=E5DCAB7E-A5CA-4892-A6EA-598B5463A34C&sId=1460054136937 International Monetary Fund, 2018, “Cameroon – IMF Country Report No. 18/235,” https://www.imf.org/~/media/Files/Publications/CR/2018/cr18235.ashx International Monetary Fund, 2018, “Cameroon Country and Program Report,” https://www.imf.org/en/Publications/CR/Issues/2018/01/16/Cameroon-First-Review-Under-the-Extended-Credit-Facility-Arrangement-Requests-for-Waiver-of-45560 International Monetary Fund, 2018, “Cameroon: Selected Issues – IMF Country Report No. 18/256,” https://www.imf.org/~/media/Files/Publications/CR/2018/cr18256.ashx

ECREEE: OFF-GRID SOLAR MARKET ASSESSMENT AND PRIVATE SECTOR SUPPORT FACILITY DESIGN
CAMEROON REPORT
192
International Monetary Fund, 2019,“Central African Economic and Monetary Community (CEMAC): IMF Country Report No. 19/1,” https://www.imf.org/en/Publications/CR/Issues/2019/01/03/Central-African-Economic-and-Monetary-Community-CEMAC-Common-Policies-of-Member-Countries-46501 International Renewable Energy Agency, 2016, “Solar PV in Africa: Costs and Markets,” http://www.irena.org/-/media/Files/IRENA/Agency/Publication/2016/IRENA_Solar_PV_Costs_Africa_2016.pdf International Renewable Energy Agency, 2019, “Renewable Energy: A Gender Perspective,” https://irena.org/-/media/Files/IRENA/Agency/Publication/2019/Jan/IRENA_Gender_perspective_2019.pdf Jeanne, Z. N., 2017, “Financial Performances of Microfinance Institutions in Cameroon: Case of CamCCUL Ltd.,” International Journal of Economics and Finance, Vol. 9, No. 4, 2017, http://www.ccsenet.org/journal/index.php/ijef/article/download/67360/36576 Klapper, L., Singer, D., Journal of African Economies, 2014, “The Role of Informal Financial Services in Africa,” https://academic.oup.com/jae/article-abstract/24/suppl_1/i12/2473408?redirectedFrom=fulltext Konrad Adenauer-Stiftung, 2017, “State of Electricity Production and Distribution in Cameroon,” http://www.kas.de/climate-energy-africa/en/publications/50984/ Korea Energy Economics Institute (KEEI), 2017, “Study for the Establishment of the Master Plan of Renewable Energy in Cameroon.” Lee, A. Doukas, A. and DeAngelis, K., Oil Change International and Friends of the Earth U.S., 2018, “The African Development Bank and Energy Access Finance in Sub-Saharan Africa: Trends and Insights from Recent Data,” http://priceofoil.org/content/uploads/2018/11/AfDB-Energy-Access-Finance-report-high-quality.pdf Ministry of Posts and Telecommunications, 2016, “Strategic Plan: For a Digital Cameroon by 2020,”, http://cameroundigital.com/wp-content/uploads/2017/05/Plan-stratégique-Cameroun-Numérique-2020_ANG.pdf The Observers, 2017, “Green Girls Project empowers Cameroon women with skills in Renewable Energy,” https://observers.france24.com/en/20170328-ngo-cameroon-empowering-women-training-them-renewable-energy Participatory Microfinance Group for Africa (PAMIGA), 2014, “Energy and Microfinance: The cases of A3C and UCCGN in Cameroon,” https://www.microfinancegateway.org/sites/default/files/publication_files/pamiga_cameroun_eng_web.pdf Partnership for Clean Indoor Air, 2018, “African Center Renewable energy and sustainable technologies,” http://www.pciaonline.org/african-center-renewable-energy-and-sustainable-technologies Ramachandran, V., Shah, M. K., Moss, T., 2018, “How Do African Firms Respond to Unreliable Power? Exploring Firm Heterogeneity Using K-Means Clustering,” Center for Global Development, Working Paper 493, https://www.cgdev.org/sites/default/files/how-do-african-firms-respond-unreliable-power-exploring-firm-heterogeneity-using-k-means.pdf Reuters, 2016, “Irrigation turns drought to cash for Cameroon’s vegetable farmers,” https://www.reuters.com/article/us-cameroon-drought-irrigation-idUSKCN11K0P4 Rewald, R., “Energy and Women and Girls: Analyzing the needs, uses, and impacts of energy on women and girls in the developing world,” Oxfam, (2017): https://www.oxfamamerica.org/static/media/files/energy-women-girls.pdf
ECREEE: OFF-GRID SOLAR MARKET ASSESSMENT AND PRIVATE SECTOR SUPPORT FACILITY DESIGN
CAMEROON REPORT
193
Scaling Off-Grid Energy: A Grand Challenge for Development, 2018, “Scaling Access to Energy in Africa: 20 Million Off-Grid Connections by 2030,” US Agency for International Development, UK Department for International Development and Shell Foundation, https://static.globalinnovationexchange.org/s3fs-public/asset/document/SOGE%20YIR_FINAL.pdf?uwUDTyB3ghxOrV2gqvsO_r0L5OhWPZZb Sustainable Energy for All Africa Hub and African Development Bank, 2017, “Green Mini-Grid Market Development Programme, Mini-Grid Market Opportunity Assessment: Cameroon,” https://greenminigrid.se4all-africa.org/file/179/download Sustainable Energy for All, 2015, “Cameroon Rapid Assessment Gap Analysis,” https://www.SEforALL-africa.org/fileadmin/uploads/SEforALL/Documents/Country_RAGAs/Cameroon_RAGA_FR_Released.pdf SNV and S2 Services, 2012, “Value chain analysis of lighting and telephone recharging options in off-grid Cameroon,” http://www.light4allcameroun.org/uploads/File/Conference%20SNV%20Research%20Pico%20PV%20Cameroon.pdf Sun-Connect, 2014, “Energy and Microfinance in Cameroon,” https://www.sun-connect-news.org/articles/business/details/energy-and-microfinance-in-cameroon/ United Nations Development Programme, “Empowering Communities through Solar Energy Electrification,” https://sgp.undp.org/spacial-itemid-projects-landing-page/spacial-itemid-project-search-results/spacial-itemid-project-detailpage.html?view=projectdetail&id=15145 United Nations Development Programme, 2018, “UN Human Development Indicators: Cameroon,” http://hdr.undp.org/en/countries/profiles/CMR United Nations Development Programme and ETH Zurich, 2018, “Derisking Renewable Energy Investment: Off-Grid Electrification,” https://www.undp.org/content/dam/undp/library/Environment%20and%20Energy/Climate%20Strategies/DREI%20Off-Grid%20Electrification%20-%20Full%20Report%20(20181210).pdf United National Development Programme and World Health Organization, 2009, “The Energy Access Situation in Developing Countries: A Review Focusing on the Least Developed Countries and Sub-Saharan Africa,” http://www.undp.org/content/dam/undp/library/Environment%20and%20Energy/Sustainable%20Energy/energy-access-situation-in-developing-countries.pdf United Nations Educational, Scientific and Cultural Organization, Institute for Statistics, 2018, “Cameroon Participation in Education,” http://uis.unesco.org/en/country/bf?theme=education-and-literacy United Nations Industrial Development Organization, 2017, “UNIDO Cameroon,” https://www.unido.org/who-we-are/unido-worldwide/africa/offices/cameroon United Nations Women, 2018, “Turning promises into action: Gender equality in the 2030 Agenda for Sustainable Development,” http://www.unwomen.org/-/media/headquarters/attachments/sections/library/publications/2018/sdg-report-fact-sheet-sub-saharan-africa-en.pdf?la=en&vs=3558 United Nations, 2017, “Household Size and Composition Around the World,” http://www.un.org/en/development/desa/population/publications/pdf/ageing/household_size_and_composition_around_the_world_2017_data_booklet.pdf
http://www.light4allcameroun.org/uploads/File/Conference%20SNV%20Research%20Pico%20PV%20Cameroon.pdf
ECREEE: OFF-GRID SOLAR MARKET ASSESSMENT AND PRIVATE SECTOR SUPPORT FACILITY DESIGN
CAMEROON REPORT
194
United Nations, 2018, “Cameroon Vision 2035,” http://cm.one.un.org/content/unct/cameroon/en/home/about/vision-2035.html United States Agency for International Development-National Renewable Energy Laboratory and Energy 4 Impact, August 2018, “Productive Use of Energy in African Micro-Grids: Technical and Business Considerations,” https://sun-connect-news.org/fileadmin/DATEIEN/Dateien/New/productive_use_of_energy_in_african_micro-grids.pdf World Bank, 2011, “Cameroon’s Infrastructure: A Continental Perspective, Africa Infrastructure Country Diagnostic Country Report,” International Bank for Reconstruction and Development, http://siteresources.worldbank.org/CAMEROONEXTN/Resources/AICD-Cameroon_Country_Report.pdf World Bank, 2011, “Lessons Learned in the Development of Smallholder Private Irrigation for High Value Crops in West Africa,” http://siteresources.worldbank.org/INTARD/Resources/West_Africa_web_fc.pdf World Bank, 2014, “Cameroon Economic Update: Revisiting the Sources of Growth and the Quality of Basic Education,” http://www.worldbank.org/content/dam/Worldbank/document/Africa/Cameroon/Report/cameroon-economic-update-vol7.pdf World Bank, 2015, “Evaluation of Rural Electrification Concessions in sub-Saharan Africa, Detailed Case Study: Cameroon,” http://documents.worldbank.org/curated/en/361311498151364762/pdf/116642-WP-PUBLIC-P150241-20p-Detailed-Case-Study-Cameroon-20151204-No-Logo.pdf World Bank, 2016, “Electricity Transmission and Reform Project Cameroon,” http://www.worldbank.org/en/country/cameroon/projects/all?status_exact=Active&qterm=§or_exact=Energy+Transmission+and+Distribution&lang_exact=English World Bank, 2017, “Rural Electrification Concessions in Africa,” http://documents.worldbank.org/curated/en/347141498584160513/pdf/116898-WP-P018952-PUBLIC-Rural-Layout-fin-WEB.pdf World Bank, 2017, “Sahel Irrigation Initiative Support Project,” Project Appraisal Document, http://documents.worldbank.org/curated/en/515131512702151121/pdf/WESTERN-AFRICA-PADnew-11142017.pdf World Bank, 2019, “Doing Business in Cameroon,” http://www.doingbusiness.org/en/data/exploreeconomies/cameroon#DB_gc World Bank, 2018, “Policy Matters: Regulatory Indicators for Sustainable Energy,” http://documents.worldbank.org/curated/en/553071544206394642/pdf/132782-replacement-PUBLIC-RiseReport-HighRes.pdf World Bank, 2018, “Strengthening the Capacity of Regional Financial Institutions in the CEMAC Region,” http://documents.worldbank.org/curated/en/390661522173803460/text/Project-Information-Document-Integrated-Safeguards-Data-Sheet-Strengthening-the-Capacity-of-Regional-Financial-Institutions-in-the-CEMAC-Region-P161368.txt