Off-Grid Electricity Access and its Impact on Micro-Enterprises
154
Off-Grid Electricity Access and its Impact on Micro-Enterprises: Evidence from Rural Uganda by Peter N. Muhoro A dissertation submitted in partial fulfillment of the requirements for the degree of Doctor of Philosophy (Applied Physics) in The University of Michigan 2010 Doctoral Committee: Emeritus Professor Marc H. Ross, Co-Chair Professor Bradford G. Orr, Co-Chair Professor Roy Clarke Professor Jean P. Krisch
-
Upload
khangminh22 -
Category
Documents
-
view
1 -
download
0
Transcript of Off-Grid Electricity Access and its Impact on Micro-Enterprises

Off-Grid Electricity Access and its Impact on
Micro-Enterprises: Evidence from Rural Uganda
by
Peter N. Muhoro
A dissertation submitted in partial fulfillmentof the requirements for the degree of
Doctor of Philosophy(Applied Physics)
in The University of Michigan2010
Doctoral Committee:
Emeritus Professor Marc H. Ross, Co-ChairProfessor Bradford G. Orr, Co-ChairProfessor Roy ClarkeProfessor Jean P. Krisch

c� Peter N. Muhoro
All Rights Reserved2010

“History will be kind to me, for I intend to write it!”Sir Winston Chuchill (1874-1965)
ii

ACKNOWLEDGEMENTS
Foremost I’m thankful to God for the path set in my life, granting me the serenity
to accept the things I cannot change; courage to change the things I can; and wisdom
to know the difference. There were many times that I questioned if I could make it
to this point, but every time I remembered that they that wait upon Him, He shall
renew their strength.
To the late Mr. Isaiah Muhoro and Mrs. Roslyn Gichuki, thank you for being
great parents and giving me a chance to be who I am today. Leaving a legacy to be
admired. To my siblings Anne and Daniel, thank you for setting such a great path.
I hated the fact that you always excelled, which meant that I had to follow in the
same footsteps. Now I look back, I’m glad you did, and that I took the challenge to
even go further than you have. I’m glad to have a family that has accepted me as
a trail blazer, even though I happened to be the youngest. I don’t know if I would
be where I am if it wasn’t for the fact that you challenged me beyond my thinking.
Thank you so much for the constant support.
To Professor Marc Ross, a great and patient mentor, and a prudent advisor,
thank you for your guidance. The light you shed, the many times you challenged
me, inspired me, believed in me, took time to explain the most simple and also
difficult concepts, reminding me that there’s no need to talk of a problem, without
thinking of a solution, and always willing to read my work and edit it over and over
again until it made sense. Your wisdom is beyond what words could describe.
iii

Special thanks to what I refer to as the A team. Professors Bradford Orr, Roy
Clarke, Jean Krisch, Duncan Steel, Alec Gallimore and Ramon Torres-Isea. Not only
were you professors but even more strongly mentors and encouraged me, gave me a
chance and showed me that it really was all in me all along. Thanks for seeing what
I could not see. Thank you for looking at me, not just as a number, but as a success.
Thank you for always having time to talk with me, always making time for me made
a difference through my graduate school days. Your efforts will never be forgotten.
To my all my friends, especially Mitaire Ojaruega, Anette Casiano, Divine Kumah
and Charles Sutton, who became a true family, thanks for being such great support
over the past five years. I always felt your strength when I was weak, and knew that
you were always there if I needed anything.
To special families, the Pittmans, the Das’, the Whites, and the McDonalds,
thank you for your tremendous support. Taking me in as one of your own children
and caring for me in so many ways, thank you. Special thanks to Barbara J. Yoder
who mentored and brought me from one level to another, and always willing push
me further than I even want to go. Thank you so much.
Lastly, to the wonderful doctors, therapists, and counselors at the University of
Michigan Health Systems (Michelle, Beth, Rachel, Pat, Lizette and Amanda); thank
you for seeing me through a tragic accident and making me realize that life after
a brain injury is all about hope and belief. Thanks to all who saw me beyond a
statistic and realized I could emerge and succeed despite the difficulties.
I made it this far only because I stand on the shoulders of great giants.
Shukran Jazeelan!
iv

TABLE OF CONTENTS
DEDICATION . . . . . . . . . . . . . . . . . . . . . . . . . . . . . . . . . . . . . . . . . . ii
ACKNOWLEDGEMENTS . . . . . . . . . . . . . . . . . . . . . . . . . . . . . . . . . . iii
LIST OF TABLES . . . . . . . . . . . . . . . . . . . . . . . . . . . . . . . . . . . . . . . vii
LIST OF FIGURES . . . . . . . . . . . . . . . . . . . . . . . . . . . . . . . . . . . . . . ix
LIST OF APPENDICES . . . . . . . . . . . . . . . . . . . . . . . . . . . . . . . . . . . xii
ABSTRACT . . . . . . . . . . . . . . . . . . . . . . . . . . . . . . . . . . . . . . . . . . . xiii
CHAPTER
I. Introduction . . . . . . . . . . . . . . . . . . . . . . . . . . . . . . . . . . . . . . . 1
1.1 Modern Energy Services as a Basis for Development . . . . . . . . . . . . . . 1
1.2 Defining the Research Question . . . . . . . . . . . . . . . . . . . . . . . . . 3
1.3 Research Approach . . . . . . . . . . . . . . . . . . . . . . . . . . . . . . . . 5
1.4 Evidence from Rural Uganda . . . . . . . . . . . . . . . . . . . . . . . . . . . 7
1.5 Guide to the structure of thesis . . . . . . . . . . . . . . . . . . . . . . . . . 13
II. Background and Literature Review . . . . . . . . . . . . . . . . . . . . . . . . . 15
2.1 Introduction . . . . . . . . . . . . . . . . . . . . . . . . . . . . . . . . . . . . 15
2.2 Role of Energy in Poverty Alleviation . . . . . . . . . . . . . . . . . . . . . . 18
2.3 Electricity and the Human Development Index . . . . . . . . . . . . . . . . . 21
2.4 Power Generation and Distribution in Uganda . . . . . . . . . . . . . . . . . 26
2.5 Triangulation: Turning Qualitative into Quantitative Evidence . . . . . . . . 31
III. Micro-Enterprises in Uganda . . . . . . . . . . . . . . . . . . . . . . . . . . . . . 35
3.1 Introduction . . . . . . . . . . . . . . . . . . . . . . . . . . . . . . . . . . . . 35
3.2 The Sources Electricity for Micro-Enterprise Use . . . . . . . . . . . . . . . . 42
3.2.1 Solar Photovoltaic Systems . . . . . . . . . . . . . . . . . . . . . . 46
3.2.2 Petrol and Diesel Generator Systems . . . . . . . . . . . . . . . . . 51
3.2.3 Battery Systems . . . . . . . . . . . . . . . . . . . . . . . . . . . . 55
3.3 Electricity Use . . . . . . . . . . . . . . . . . . . . . . . . . . . . . . . . . . . 59
3.4 The Economic Approach . . . . . . . . . . . . . . . . . . . . . . . . . . . . . 61
3.4.1 Cost of Accessing Electricity . . . . . . . . . . . . . . . . . . . . . . 62
3.4.2 Income Generation and Profit Analysis . . . . . . . . . . . . . . . . 65
3.5 Impacts of Access to Electricity on the Micro-Enterprises . . . . . . . . . . . 67
v

IV. Barriers to Electricity Access . . . . . . . . . . . . . . . . . . . . . . . . . . . . 71
4.1 Introduction . . . . . . . . . . . . . . . . . . . . . . . . . . . . . . . . . . . . 714.2 Access to Capital and Financial Support . . . . . . . . . . . . . . . . . . . . 734.3 Adoption: Equipment and Appliances . . . . . . . . . . . . . . . . . . . . . . 834.4 Infrastructure and Weather Constraints . . . . . . . . . . . . . . . . . . . . . 854.5 Education . . . . . . . . . . . . . . . . . . . . . . . . . . . . . . . . . . . . . 88
V. Feasible Solutions and Recommendations . . . . . . . . . . . . . . . . . . . . . 92
5.1 Studies Across the Globe . . . . . . . . . . . . . . . . . . . . . . . . . . . . . 925.2 Sustainable Scalable Solutions . . . . . . . . . . . . . . . . . . . . . . . . . . 93
5.2.1 Case 1: Independent Power Producer Nexus . . . . . . . . . . . . . 935.2.2 Case 2: The Bicycle Generator, Improving Access in Kenya . . . . 95
5.3 Role of Local Governance . . . . . . . . . . . . . . . . . . . . . . . . . . . . . 985.4 Donors: A Sustainable Solution? . . . . . . . . . . . . . . . . . . . . . . . . . 100
VI. Conclusion . . . . . . . . . . . . . . . . . . . . . . . . . . . . . . . . . . . . . . . . 102
6.1 Main Findings . . . . . . . . . . . . . . . . . . . . . . . . . . . . . . . . . . . 1026.2 Lessons and Policy Implications from the Uganda Experience . . . . . . . . . 105
6.2.1 Access and Impacts of Electricity Access . . . . . . . . . . . . . . . 1056.2.2 e of the Characteristics of Electricity Supply . . . . . . . . 106
6.3 Answering the Research Question . . . . . . . . . . . . . . . . . . . . . . . . 1076.4 s and Recommendations . . . . . . . . . . . . . . . . . . . . . . . . 108
APPENDICES . . . . . . . . . . . . . . . . . . . . . . . . . . . . . . . . . . . . . . . . . . 110
BIBLIOGRAPHY . . . . . . . . . . . . . . . . . . . . . . . . . . . . . . . . . . . . . . . . 135
vi

LIST OF TABLES
Table
3.1 List of Business Categories and Number of Micro-Enterprises Interviewed . . . . . 38
3.2 Distribution of Micro-Enterprises Using Solar PV Systems . . . . . . . . . . . . . . 48
3.3 Electricity Appliances at Video Hall in Bigodi . . . . . . . . . . . . . . . . . . . . . 49
3.4 Distribution of Micro-Enterprises Using Petrol (Gasoline) Generators . . . . . . . . 53
3.5 Distribution of Micro-Enterprises Using Diesel Generators . . . . . . . . . . . . . . 54
3.6 Distribution of Micro-Enterprises Using Automotive Batteries . . . . . . . . . . . . 57
3.7 Number of Micro-Enterprises based on the category of use . . . . . . . . . . . . . . 59
3.8 Basic costs as viewed from the entrepreneurs perspective . . . . . . . . . . . . . . . 62
3.9 Distribution of Cellphone Charging Stations showing each town and the associatedcosts of accessing electricity. The figures in the tables are estimates given by theentrepreneurs, some have accurate numbers that they document, while others justgave an estimate off the top of their head. . . . . . . . . . . . . . . . . . . . . . . . 63
3.10 Distribution of General Stores showing each town and the associated costs of access-ing electricity. The figures in the tables are estimates given by the entrepreneurs,some have accurate numbers that they document, while others just gave an estimateoff the top of their head. . . . . . . . . . . . . . . . . . . . . . . . . . . . . . . . . . 64
3.11 Table showing income generation from sales of goods at general stores on a weeklybasis. . . . . . . . . . . . . . . . . . . . . . . . . . . . . . . . . . . . . . . . . . . . . 65
3.12 Table showing income generation from sales of services at cellphone charging sta-tions on a weekly basis. . . . . . . . . . . . . . . . . . . . . . . . . . . . . . . . . . 66
3.13 Table showing approximate number of customers during each visit. . . . . . . . . . 69
4.1 Distribution of Cellphone Charging Stations showing each town, state of equipmentat purchase, the funding mechanisms and if regular maintenance is conducted or not 81
4.2 Distribution of General Stores showing each town, state of equipment at purchase,the funding mechanisms and if regular maintenance is conducted or not . . . . . . 81
4.3 Distribution of micro-enterprises based on the decision making for purchase . . . . 84
vii

4.4 Level of education attained by the entrepreneurs and the english spoken. . . . . . . 90
6.1 Power consumption averaged out through the cellphone charging stations and gen-eral stores . . . . . . . . . . . . . . . . . . . . . . . . . . . . . . . . . . . . . . . . . 103
viii

LIST OF FIGURES
Figure
1.1 Number of people (actual and projected) without electricity, 1970-2030, by region[UN 2005] . . . . . . . . . . . . . . . . . . . . . . . . . . . . . . . . . . . . . . . . . 2
1.2 Data Triangulation Method . . . . . . . . . . . . . . . . . . . . . . . . . . . . . . . 6
1.3 Map of Uganda [UN 2003] . . . . . . . . . . . . . . . . . . . . . . . . . . . . . . . . 8
1.4 Distribution of Businesses in Rural Western Uganda with key showing each of thebusinesses in each town. . . . . . . . . . . . . . . . . . . . . . . . . . . . . . . . . . 9
1.5 Distribution of Existing Generation Capacity [ERA Doc]. Most of the power gen-erated is not distributed through the grid but rather on small scale generation likethe micro-enterprises in this research . . . . . . . . . . . . . . . . . . . . . . . . . . 10
1.6 The Steps from Electricity Supply Infrastructure to Change in Poverty Status . . . 11
2.1 GDP Growth Rate in Uganda [UBS, 2008] . . . . . . . . . . . . . . . . . . . . . . . 16
2.2 Economic Sector Distribution in Uganda for the year 1992 with agriculture havingthe highest portion compared to other sectors [UBS, 2008] . . . . . . . . . . . . . . 16
2.3 Economic Sector Distribution in Uganda for the year 2008, showing very smallincrease in the electricity and water supply sectors [UBS, 2008] . . . . . . . . . . . 16
2.4 The vicious cycle of energy and poverty . . . . . . . . . . . . . . . . . . . . . . . . 20
2.5 Macro level correlation between electricity and human development . . . . . . . . . 22
2.6 The difference of electrification between Europe and Africa is clearly seen in thisphoto taken by NASA. Africa with over 1 Billion people is poorly lit overall, andthe brightest areas are the most urbanized, not necessarily the most populated.[NASA 2008] . . . . . . . . . . . . . . . . . . . . . . . . . . . . . . . . . . . . . . . 25
2.7 Electricity Production Showing Growth and Decline Over the Years [World Bank2009a] . . . . . . . . . . . . . . . . . . . . . . . . . . . . . . . . . . . . . . . . . . . 28
2.8 The electricity grid/transmission network in Uganda including proposed extensions[Kaijuka, 2007] . . . . . . . . . . . . . . . . . . . . . . . . . . . . . . . . . . . . . . 29
2.9 The electricity grid roughly follows the road network; under full coverage, theyshould ideally match [Kaijuka, 2007] . . . . . . . . . . . . . . . . . . . . . . . . . . 29
ix

2.10 Population density is highest along the electricity grid; there are still many highlypopulated areas that are out of reach [Kaijuka, 2007] . . . . . . . . . . . . . . . . . 30
2.11 Data Triangulation Method Showing Each Method Used for the Specific Triangles 33
3.1 Schematic Diagram of theVillage Towns in the Three Districts of Western Uganda 37
3.2 Distribution of Micro-Enterprises in the Rural Western Uganda. . . . . . . . . . . . 38
3.3 Typical Micro-Enterprise in Rural Uganda . . . . . . . . . . . . . . . . . . . . . . . 39
3.4 Climbing the energy ladder towards more modern methods is a challenge that mostpoor people in developing countries face if they are to improve their overall standardof living. [WEA, 2002] . . . . . . . . . . . . . . . . . . . . . . . . . . . . . . . . . . 42
3.5 Graphical Distribution of Electricity Generating and Storage Equipment . . . . . . 44
3.6 Map Distribution of Electricity Generating Equipment . . . . . . . . . . . . . . . . 45
3.7 How solar systems work [Photo credit: Tmayhu, 2006 Courtesy of Photobucket] . . 47
3.8 Petrol Generator . . . . . . . . . . . . . . . . . . . . . . . . . . . . . . . . . . . . . 53
3.9 Diesel Generator . . . . . . . . . . . . . . . . . . . . . . . . . . . . . . . . . . . . . 54
3.10 An automotive battery setup . . . . . . . . . . . . . . . . . . . . . . . . . . . . . . 58
3.11 A battery system connected directly to a CFL . . . . . . . . . . . . . . . . . . . . . 58
3.12 Ideal environment, operation and flow of the micro-enterprises should be showingthe access to electricity and its impacts . . . . . . . . . . . . . . . . . . . . . . . . . 67
3.13 Actual environment, operation and flow of the micro-enterprises should be showingthe access to electricity and its impacts . . . . . . . . . . . . . . . . . . . . . . . . . 68
3.14 Daily number of customers for the Cellphone Charging Stations showing growth inthose that increased their access to electricity . . . . . . . . . . . . . . . . . . . . . 70
4.1 Distribution of the State of Electricity Generating Equipment at the Time of Pur-chase Among the Micro-Enterprises . . . . . . . . . . . . . . . . . . . . . . . . . . . 75
4.2 Distribution of Funding Mechanisms Among the Micro-Enterprises . . . . . . . . . 80
4.3 A graph of Everett Rogers Technology Adoption Lifecycle model [Rogers, 1962] . . 83
4.4 An example of good transportation and what would be referred to as a very goodroad . . . . . . . . . . . . . . . . . . . . . . . . . . . . . . . . . . . . . . . . . . . . 86
4.5 An example of a situation due to a combination of poor infrastructure and inclementweather . . . . . . . . . . . . . . . . . . . . . . . . . . . . . . . . . . . . . . . . . . 87
4.6 Link between energy and other development sections . . . . . . . . . . . . . . . . . 89
x

5.1 A schematic diagram showing the flow of usage among the different ventures basedon the need at the time. [Special thanks to Abigail Mechtenberg for working withme on this model and a more detailed model is listed in Appendix D.2 . . . . . . . 94
5.2 Outside of a Banda [Photo: Courtesy of MWF] . . . . . . . . . . . . . . . . . . . . 96
5.3 Outside of a Banda [Photo: Courtesy of MWF] . . . . . . . . . . . . . . . . . . . . 96
5.4 Initial stages of building the bicycle generator . . . . . . . . . . . . . . . . . . . . . 97
5.5 Final product charging a battery . . . . . . . . . . . . . . . . . . . . . . . . . . . . 97
6.1 Macro level correlation between electricity and human development . . . . . . . . . 104
D.1 A basic energy model. . . . . . . . . . . . . . . . . . . . . . . . . . . . . . . . . . . 125
D.2 A more detailed schematic diagram showing the flow of usage among the differentventures based on the need at the time. [Special thanks to Abigail Mechtenberg] . 126
D.3 A simple proposed layout of MPALA’s energy scheme . . . . . . . . . . . . . . . . 128
D.4 Diesel Generator at MPALA . . . . . . . . . . . . . . . . . . . . . . . . . . . . . . . 129
D.5 Petrol Generator at MPALA . . . . . . . . . . . . . . . . . . . . . . . . . . . . . . . 129
E.1 Bicycle generator lighting up a bulb. Built by the local technicians at St. Joseph’sTechnical School . . . . . . . . . . . . . . . . . . . . . . . . . . . . . . . . . . . . . 130
E.2 Appliances at a video hall . . . . . . . . . . . . . . . . . . . . . . . . . . . . . . . . 131
E.3 Appliances at a barber shop . . . . . . . . . . . . . . . . . . . . . . . . . . . . . . . 131
E.4 Appliances at a general store . . . . . . . . . . . . . . . . . . . . . . . . . . . . . . 132
E.5 Appliances at a cellphone charging station . . . . . . . . . . . . . . . . . . . . . . . 132
F.1 Inside a General Store . . . . . . . . . . . . . . . . . . . . . . . . . . . . . . . . . . 134
F.2 Outside View of a Restaurant . . . . . . . . . . . . . . . . . . . . . . . . . . . . . . 134
xi
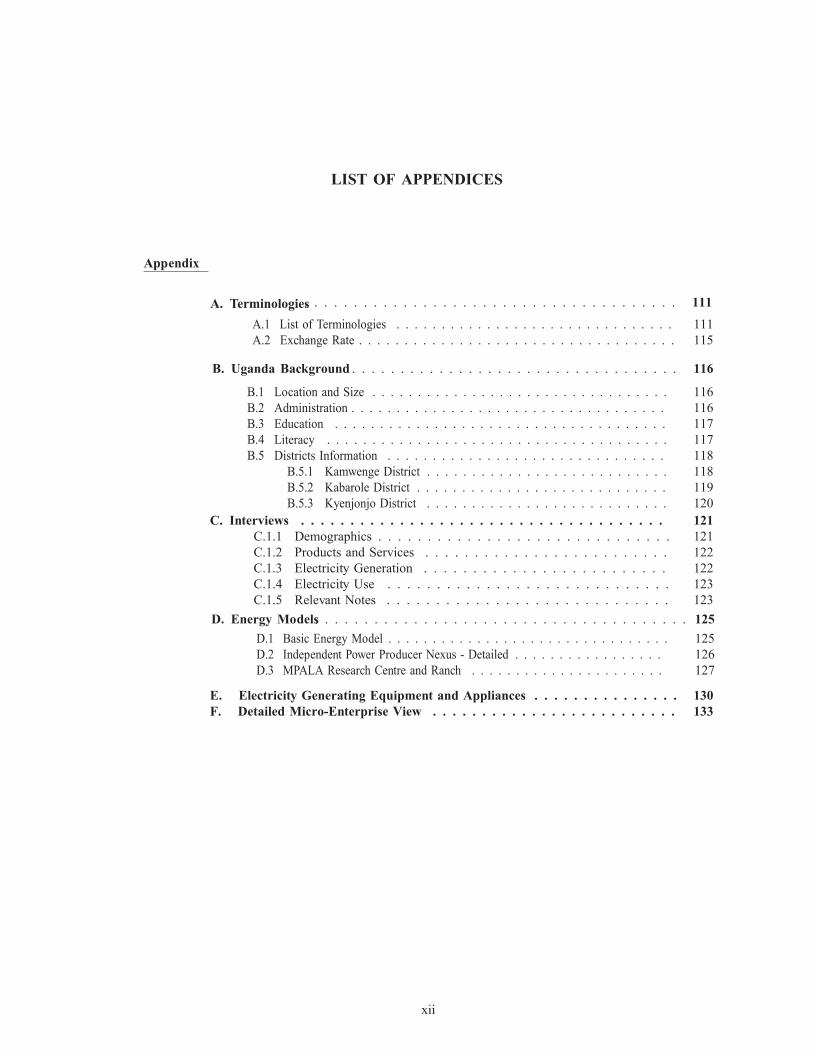
LIST OF APPENDICES
Appendix
A.1 List of Terminologies . . . . . . . . . . . . . . . . . . . . . . . . . . . . . . . 111A.2 Exchange Rate . . . . . . . . . . . . . . . . . . . . . . . . . . . . . . . . . . . 115
B.1 Location and Size . . . . . . . . . . . . . . . . . . . . . . . . . . . . . . . . . 116B.2 Administration . . . . . . . . . . . . . . . . . . . . . . . . . . . . . . . . . . . 116B.3 Education . . . . . . . . . . . . . . . . . . . . . . . . . . . . . . . . . . . . . 117B.4 Literacy . . . . . . . . . . . . . . . . . . . . . . . . . . . . . . . . . . . . . . 117B.5 Districts Information . . . . . . . . . . . . . . . . . . . . . . . . . . . . . . . 118
B.5.1 Kamwenge District . . . . . . . . . . . . . . . . . . . . . . . . . . . 118B.5.2 Kabarole District . . . . . . . . . . . . . . . . . . . . . . . . . . . . 119B.5.3 Kyenjonjo District . . . . . . . . . . . . . . . . . . . . . . . . . . . 120
C. Interviews . . . . . . . . . . . . . . . . . . . . . . . . . . . . . . . . . . . . . 121C.1.1 Demographics . . . . . . . . . . . . . . . . . . . . . . . . . . . . . . 121C.1.2 Products and Services . . . . . . . . . . . . . . . . . . . . . . . . . 122C.1.3 Electricity Generation . . . . . . . . . . . . . . . . . . . . . . . . . 122C.1.4 Electricity Use . . . . . . . . . . . . . . . . . . . . . . . . . . . . . 123C.1.5 Relevant Notes . . . . . . . . . . . . . . . . . . . . . . . . . . . . . 123
D.1 Basic Energy Model . . . . . . . . . . . . . . . . . . . . . . . . . . . . . . . . 125D.2 Independent Power Producer Nexus - Detailed . . . . . . . . . . . . . . . . . 126D.3 MPALA Research Centre and Ranch . . . . . . . . . . . . . . . . . . . . . . 127
E. Electricity Generating Equipment and Appliances . . . . . . . . . . . . . . . 130F. Detailed Micro-Enterprise View . . . . . . . . . . . . . . . . . . . . . . . . . 133
xii
A. Terminologies. . . . . . . . . . . . . . . . . . . . . . . . . . . . . . . . . . . . . . 111
B. Uganda Background . . . . . . . . . . . . . . . . . . . . . . . . . . . . . . . . . . 116
D. Energy Models. . . . . . . . . . . . . . . . . . . . . . . . . . . . . . . . . . . . . . 125

ABSTRACT
The history of development shows convincingly that no country has substantially
reduced poverty without massively increasing the use of electricity. The development
of micro-enterprises in rural areas of Uganda is linked with increased access and use
of electricity services.
In this study, I combine quantitative and qualitative methods, including informal
surveys, intra-business energy allocation studies and historical analysis, to analyze
off-grid electricity access among micro-enterprises in rural western Uganda. I explore
the linkages between off-grid electricity access and the influence it has on micro-
enterprises. Data is obtained from 56 micro-enterprises located in 11 village-towns
within 3 districts in Uganda. In studying the micro-enterprises, the focus is on the
services that are provided by electricity from modern energy carriers. The type of
equipment used, forms of transportation, technical support, level of understanding
and education of the entrepreneur, financing for energy equipment, and the role of
donors are discussed in this thesis. Qualitative methods are used to allow for new
insights and prioritization of concepts to emerge from the field rather than from
theory.
Micro-enterprises in rural Uganda create income for the poor; they are resources
for poverty reduction. With price adjustments, it becomes possible for those who
live below the poverty line, nominally less than $1 a day, to afford the products and
services and therefore mitigating the vicious cycle of poverty. Energy consumption
xiii

among the micro-enterprises is at an average of 0.13kWh/day. The cost of access-
ing this amount of electricity attributes to about 50% of total revenue. I find that
the “practices” used in off-grid electricity access lead to situations where the en-
trepreneurs have to evaluate pricing and output of products and services to generate
higher profits. Such numbers indicate the need for appropriate technologies and
profitable policies to be implemented.
The data indicates that without subsidies, credit-based sales and better financing
options, it is unlikely that access to electricity will increase beyond the levels estab-
lished in the existing cash market. Concerns about equity and other social issues
indicate a need for careful attention to the implications of policy choices and the
processes that influence the use of technology.
xiv

CHAPTER I
Introduction
1.1 Modern Energy Services as a Basis for Development
It is well known today that technological, industrial and economic progress is heav-
ily dependent on the readily available energy; the enormous technological, industrial
and economic advancement of the so-called developed countries was primarily made
through exploitation of Earths vast reservoir of inexpensive fossil fuels. These fossil
fuels, often imported from countries that lack the science and technology required for
their effective utilization, helped the developed countries to attain affluence. They
also help to control the destinies of less developed countries of the world. Today,
developed nations, with one fifth of world’s population consume four-fifths of world’s
fossil fuels.
In many of the poorest countries, a large fraction of the population is unable to
access modern energy services such as grid-electricity, solar photovoltaics, fuel-based
generation and the like. A substantial fraction of the population relies on biomass or
dung for cooking fuel and heat; on kerosene wick lamps, battery-operated flash lights,
or candles for lighting; and on human or animal energy-based mechanical power
for tilling and weeding land, grinding and crushing, agro-processing, or transport.
The poorest of households spend a large portion of their total income and human
1

2
resources on energy because some forms of energy are absolutely essential to meeting
such basic needs as cooked food and transportation. Those who do have access often
pay dearly for less modern energy services of much lower quality - meaning that the
services are erratic and unreliable. Insufficient and unreliable electricity limits the
ability of enterprises to expand their activities, to be competitive or to create new
activities or jobs. The largest concentrations of the energy poor are currently in
sub-Saharan Africa and South Asia as shown in figure 1.1, projecting to the year
2030.
Figure 1.1: Number of people (actual and projected) without electricity, 1970-2030, by region [UN2005]
Even urban areas where there is access to grid electricity, supply is often unreliable,
hence services which are best derived from electricity may remain inaccessible. In
addition to generation or supply shortfall, and insufficient distribution infrastructure,
the lack of access to electricity further hampers the use of electricity services, affecting
economic development.

3
1.2 Defining the Research Question
Micro-enterprises are important in their role as contributors to the economy. In
this research, the objective is to understand off-grid electricity access and its impacts
on micro-enterprises in rural areas. Aggravating this process is the fact that the topic
of electricity is nearly always assessed from a supply perspective, which perceives
electricity as a product rather than a service [Ramani and Heijndermans, 2003].
Therefore attention both from policy and project practice hardly reaches beyond
supply. Understanding the linkages between increased access to off-grid electricity
proves important in the development of the micro-enterprise.
The research question seeks to identify off-grid electricity access strategies in fa-
cilitating and supporting the micro-enterprise in rural areas of Uganda that are not
connected to the grid. In order to provide the answers to the general question, the
research addresses the following specific research questions:
• What are the methods of electricity access by the micro-enterprises?
– What are the methods in electricity generation? (petrol generators, diesel
generators, solar photovoltaics, etc.)
– What equipment/devices are used for generation and storage of electricity?
(Discussion of devices such as generators, inverters, batteries)
• What is the distribution of the micro-enterprises and their dependence on elec-
tricity services?
– Distribution based on use such as lighting, refrigeration, customer services,
forms of access etc
4
• What is the role of energy-economics in the micro-enterprise?
– Access to capital for investment - financing options, micro-financing, donors,
sellers of equipment, credit-based sales, etc
– Cost of electricity access
– Affordability for electricity and the capacity-to-pay
• What are the constraints to electricity access? Distance and transportation,
weather, education, theft, tribalism, and other unknown factors
• What influence on social and economic empowerment does access to electricity
have? Influence on assets, characteristics on the micro-enterprise and livelihoods
of the entrepreneurs.
The complexities of answering these questions provides a basis for detailing the
mechanisms that stimulate the understanding of the linkages between access to elec-
tricity and micro-enterprise development, allowing policy makers and stakeholders to
take actions, increasing awareness for the entrepreneurs on the impact of electricity
on income generating activities and finally reducing poverty.

5
1.3 Research Approach
Since this research is set up to gain deeper insights into the practices of the micro-
enterprises in accessing off-grid electricity, empirical data collection and analysis
form the core of the study. Qualitative methods are used to allow new insight and
prioritization of concepts to emerge from the field work rather than from theory.
While the analysis focuses on the process of electricity access, its impacts on the
micro-enterprise are also as important. Comparisons of micro-enterprises (within and
between the village towns) are used to analyze markets, energy access and supply,
and institutional context. Research locations are selected based on accessibility of
towns and knowledge of the areas by interpreters.
Literature based on electricity supply practice in combination with pilot studies
done in the Himalayas [Kooijman-van, 2008] guide the selection and review of theory,
which is used to deepen insights, provide and refine concepts and propositions to be
tested in the field and to structure both data collection and analysis; thereby form-
ing a cyclic deductive and inductive approach of fieldwork and theoretical reflection.
The approach is a combination of the methodologies suggested by [Yin, 2003] and
[Eisenhardt, 1989]. Yin’s approach of selecting case studies, based on propositions
from literature and comparing cases to build internal validity of findings is combined
with Eisenhardt’s suggestion to base the selection of theory and literature on find-
ings that emerge from field research. Such an approach allows a well prepared and
guided selection of case studies while at the same time keeping an open attitude to
findings from the field. Comparisons of micro-enterprises are an extension of Yin’s
search for rival explanations, and are used to analyze markets, electricity access and
institutional context.

6
The perspective of the entrepreneur is used not only to gain deeper insights into
motivation for electricity access and benefits but also on the motivation or per-
ceived barriers against the access, key lessons learned from the field. The empirical
data collection is based on qualitative and quantitative research techniques. Further
semi-structured interviews and open discussion with key informants, as well as ob-
servations, serve to improve internal validity of data through triangulation of data.
The triangulation method is used, as shown in figure 1.2 for data validation and is
explained in detail in Chapter II.
Figure 1.2: Data Triangulation Method

7
1.4 Evidence from Rural Uganda
Uganda, referred to as the Pearl of Africa, is endowed with significant natural
resources, including ample fertile land, regular rainfall, and mineral deposits. How-
ever, the electricity demands have historically been higher than supply, despite the
considerable unexploited renewable energy sources for energy provision and provision
of energy services.
The fieldwork data is obtained from fifty six off-grid micro-enterprises, located
in eleven village-towns within three districts (Kabarole, Kamwenge and Kyenjonjo)
of western Uganda, as indicated in Figure 1.4. Other micro-enterprises are studied
but not included in the data due to several factors such as they do not offer any
services dependent on electricity, or are in the Fort Portal area where grid electricity
is available intermittently. The selection of trips for the fieldwork varies with the
different seasons as so have a better understanding on how weather affects access to
electricity. The fieldwork was conducted during the following periods: May 2008,
October-November 2008, April-June 2009, and October-December 2009.
Figure 1.3 shows a map of Uganda, with the areas covered highlighted. Statistics
as given by the United Nations indicate that Uganda is classified as a mid-HDI
country(Human Develop Index - described in the definitions page).

8
Figure 1.3: Map of Uganda [UN 2003]Area: 241, 000 KM2, Population: 30 Million, Population Growth Rate: 3.4% p.a.
GDP Per Capita: US $1454, GDP Growth Rate: 6% p.a.. HDI Value: 0.505Population Without Grid Electricity: 24.6 Million

9
The geographical distribution of micro-enterprises proves to be challenging due
to the poor infrastructure (roads) and the frequent rains which makes it impossible
to travel thus being immobile for 2-3 days before being able to move to the next
village town. The following map shows the different micro-enterprises in each of
the different towns which include Bigodi, Bishese, Ibanda, Kabujogera, Kahunge,
Kichwamba, Kihura, Kyakatara, Kyenjonjo, Kyegegwa, Rwehamba. The categories
of micro-enterprises include the following: Bar, Barber, Battery Charging Station,
Cell Phone Charging Station, General Store, Hair Salon, Hotel/Resort, Pharmacy,
Restaurant, Tailor and Video Hall. The roads are unpaved, or only paved with gravel
known as ”murram” in East Africa, with some rocks bigger than a human’s fist.
Figure 1.4: Distribution of Businesses in Rural Western Uganda with key showing each of thebusinesses in each town.

10
To understand the complexity of electricity access, it is important to understand
the current generation capacity. For a long time, Uganda’s hydropower generation
from the Owen Falls Dam was the sole source of grid electricity. Whereas the in-
stalled capacity of the complex is 380 MW (180 MW at Nalubaale and 200 MW at
Kiira power plants), the effective capacity of the complex has been as low as 100
MW in 2004/2005, and is up to around 140 MW today. This decline is due to the
reduced level of Lake Victoria as a result of a drought in the region since 2003. As
a consequence, Uganda has suffered chronic power shortages since 2005.
Figure 1.5: Distribution of Existing Generation Capacity [ERA Doc]. Most of the power generatedis not distributed through the grid but rather on small scale generation like the micro-enterprisesin this research

11
Progress toward providing greater access to electricity has been slow due to a
combination of interrelated circumstance. To understand this from interviews with
different stakeholders, a chain of related steps would have to occur in order to have
sustainable impacts from the access to off-grid electricity, as shown in figure 1.6.
Figure 1.6: The Steps from Electricity Supply Infrastructure to Change in Poverty Status
This chain shows that insights into actual use provide a different picture from
the daily expansion of working hours, which is commonly assumed. Despite the fact
that the fifty six micro-enterprises have lighting as one of the main uses of electricity,
thirty five of them only occasionally remained open in the evening, with only fifteen
regularly doing so.

12
The following quotations are from some of the entrepreneurs indicating the need
of such steps to happen.
“I have owned this shop for 15 years and recently bought a battery and bulb
to provide lighting rather than using a kerosene lamp. I have seen so many
changes including more people attracted to my business in the evenings.
I even decided to open later at night and have seen customers who would
otherwise have not gone out that late to buy an item. Unfortunately, even
though I have electricity, I don’t have the capital to buy a small refrigerator
to cool the sodas and keep milk longer.”
“When my cell phone battery dies, I usually walk about 7 kilometers one-
way to the nearest charging station. I usually pay UGX 500 (USD 0.25)
to charge it but sometimes it may cost me up to UGX 1500 (USD 0.75),
depending on the weather, number of customers, or how fast I want my cell
phone charged . This puts me out of communication for a while and I never
know if there is someone interested in buying my bananas. I use my cell
phone for communication with buyers who are interested in my produce.”
A central question for policy makers and analysts is whether these micro-enterprises
hold the potential for income growth for their owners, or whether they merely rep-
resent a source of subsistence income for low-productivity individuals unable to find
alternative work. The ability to assess the extent to which a lack of capital to access
electricity is a constraint on business profitability is complicated, finding that most
of the entrepreneurs depend on a ‘cash market.’ Access to capital has shown to be a
limiting factor to development thus most micro-enterprises may go beyond the first
step in the chain but cannot go past the second due to a lack of financing to acquire
electricity generating equipment.

13
1.5 Guide to the structure of thesis
The objective of this research is to provide the reader with insights into the prac-
tices of micro-enterprise entrepreneurs in accessing electricity and how this impacts
the dynamics of the micro-enterprise. This overview shows how the structure of
the thesis follows from the research questions, and thereby also provides a guide for
focused or selective reading into specific subtopics.
Chapter II provides a critical review of literature on the topics that form the
heart of this research: energy and poverty reduction, electricity as an innovation
for micro-enterprises, micro-enterprises and poverty reduction. This review is used
to gain understanding of existing knowledge, and to identify needs for research.
The concepts and terms used are also introduced here and the definitions discussed.
Also discussed in this chapter is the planning process for rural electrification in
off-grid locations through the Rural Electrification Agency (REA) and the Uganda
Electricity Board (UEB) which are the two government agencies responsible for the
achievements. The aim is to identify patterns of demand and priority areas of need.
By creating a demand-side scenario, grid electricity can then be supplied to targeted
areas. This chapter covers the current generation capacity, the supply network, the
served and unserved, and the future goals of electrification in Uganda.
Sustainable development is literally driven by the electricity sector. In Uganda,
the electricity sector has experienced dramatic market liberalization changes in recent
years. Chapter III introduces the context in which micro-enterprises operate and the
methods used in accessing electricity. This chapter introduces the reader to the data
collected forming a reference and basis for the analysis in the next chapters. The
impacts of electricity services and growth (profits) and decline (losses) dynamics

14
of the micro-enterprises based on electricity access are also discussed here. Key
energy-economics, socioeconomic and the policy and institutional setting in Uganda.
While much of this description is found in the literature, findings from the fieldwork
indicated that the typical principles of economics in relation to off-grid electricity do
not necessarily apply in the rural settings.
Chapter IV covers the constraints experienced by the entrepreneurs in accessing
electricity and how this impacts the growth and development of the micro-enterprise.
Several constraints show that off-grid situations face many availability (or the lack
there of) and reliability issues that can impede the development and growth progress
of the micro-enterprise.
The practices on off-grid electricity access play an important role on the micro-
enterprise. These practices determine either growth or stagnancy in the micro-
enterprise. In Chapter V, I discuss those practices, the impacts they have and the
influence on the assets and characteristics of the micro-enterprise. This chapter fo-
cuses on feasible solutions and the recommendations that could be used in off-grid
electricity access.
This thesis concludes with Chapter VI which presents a summary discussion on
the results of the fieldwork, highlighting aspects of this research and the insights
that these have led to. By answering the research questions, links are made to rec-
ommendations for interventions to improve the access to electricity and the impacts
it has on poverty reduction. The recommendations are positioned in a wider scope
such that they can be applied to any developing country.

CHAPTER II
Background and Literature Review
2.1 Introduction
This research looks at the experiences by the entrepreneurs and not so much
from other researchers and consultants in the field of rural energy. The reason for
this approach is because most research is based on assumptions and advocacy that
modern electricity equipment and appliances is good for poverty reduction, but it’s
more important to understand the processes from energy to poverty reduction and
if they actually succeed. Understanding the social and economic aspects of the
entrepreneurs serves a crucial component for the success of the study.
This chapter presents a review of a selection of existing literature on the topics
of energy and micro-enterprises. The literature reviewed provides a background on
the basis of being illustrative for streams of thought, status of knowledge, types of
research and relevance to my research as it emerged through the cyclic process of
fieldwork and analysis. Impacts of access to off-grid electricity and increase in income
generation are closely related to the functioning of the micro-enterprise. Selected
indicators and concepts will be used to structure and deepen the empirical data
collection and analysis.
15

16
Uganda is well endowed with both renewable and non-renewable resources includ-
ing good climate. Although GDP has increased positively in the last two decades,
the positive benefit of GDP growth have not been felt by every household in Uganda.
Figure 2.1: GDP Growth Rate in Uganda [UBS, 2008]
Figure 2.2: Economic Sector Distribution inUganda for the year 1992 with agriculture hav-ing the highest portion compared to other sectors[UBS, 2008]
Figure 2.3: Economic Sector Distribution inUganda for the year 2008, showing very small in-crease in the electricity and water supply sectors[UBS, 2008]
17
Poverty and inequality continue to prevail albeit at a reducing level. Lack of
electricity access is one of the leading causes of the persistent poverty and inequality.
Looking at the economic sector growth, figure 2.2 and 2.3, it is clear that there is a
large increase in services and construction which both rely on electricity, but yet the
growth in electricity and water supply is minimal.
18
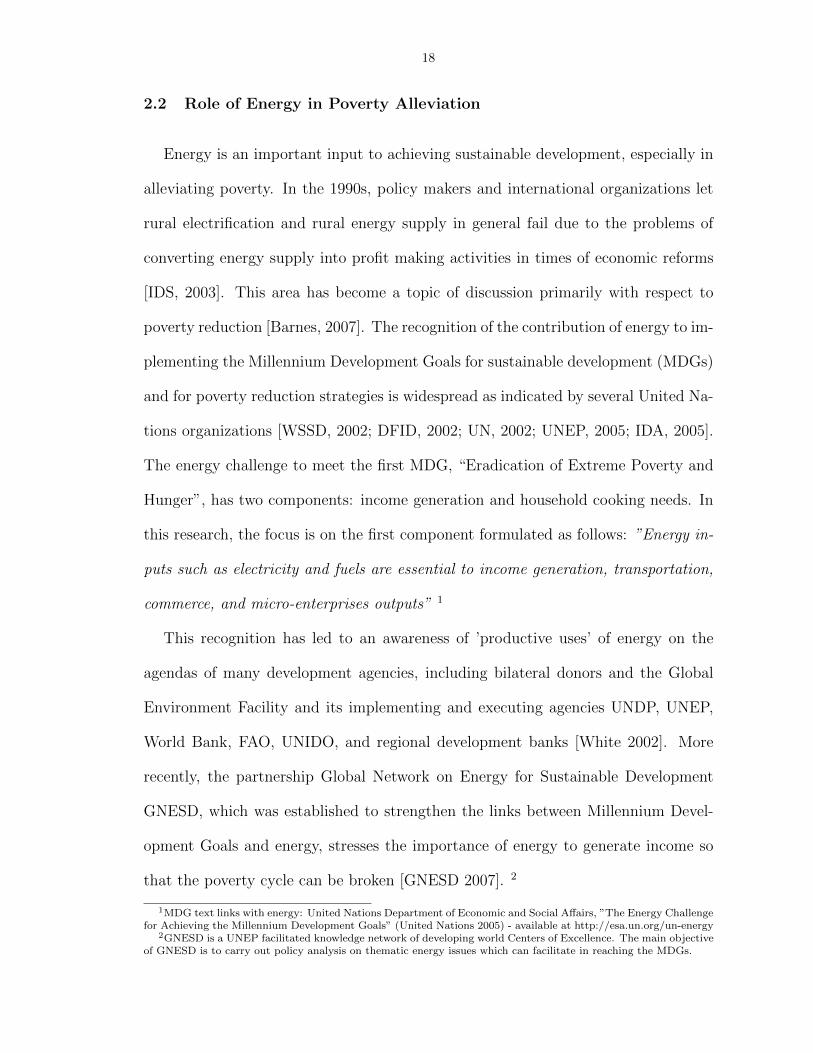
2.2 Role of Energy in Poverty Alleviation
Energy is an important input to achieving sustainable development, especially in
alleviating poverty. In the 1990s, policy makers and international organizations let
rural electrification and rural energy supply in general fail due to the problems of
converting energy supply into profit making activities in times of economic reforms
[IDS, 2003]. This area has become a topic of discussion primarily with respect to
poverty reduction [Barnes, 2007]. The recognition of the contribution of energy to im-
plementing the Millennium Development Goals for sustainable development (MDGs)
and for poverty reduction strategies is widespread as indicated by several United Na-
tions organizations [WSSD, 2002; DFID, 2002; UN, 2002; UNEP, 2005; IDA, 2005].
The energy challenge to meet the first MDG, “Eradication of Extreme Poverty and
Hunger”, has two components: income generation and household cooking needs. In
this research, the focus is on the first component formulated as follows: ”Energy in-
puts such as electricity and fuels are essential to income generation, transportation,
commerce, and micro-enterprises outputs” 1
This recognition has led to an awareness of ’productive uses’ of energy on the
agendas of many development agencies, including bilateral donors and the Global
Environment Facility and its implementing and executing agencies UNDP, UNEP,
World Bank, FAO, UNIDO, and regional development banks [White 2002]. More
recently, the partnership Global Network on Energy for Sustainable Development
GNESD, which was established to strengthen the links between Millennium Devel-
opment Goals and energy, stresses the importance of energy to generate income so
that the poverty cycle can be broken [GNESD 2007]. 2
1MDG text links with energy: United Nations Department of Economic and Social Affairs, ”The Energy Challengefor Achieving the Millennium Development Goals” (United Nations 2005) - available at http://esa.un.org/un-energy
2GNESD is a UNEP facilitated knowledge network of developing world Centers of Excellence. The main objectiveof GNESD is to carry out policy analysis on thematic energy issues which can facilitate in reaching the MDGs.

19
Now that poverty reduction through income generation (through impacts of ac-
cess to modern energy services) is recognized as a topic by policy makers, the policy
requirements for understanding of the mechanisms behind this process have become
even more urgent, especially in meeting the MDGs. Additional knowledge on in-
come generation specifically is of interest to energy policy in a development context:
economic development, the efficiency and economic viability of supplying energy, es-
pecially to rural areas, and the effectiveness of pro-poor interventions. This research
has the objective to provide the necessary insights from these different motivations.
Rural energy projects have generally not had the impacts on economic growth
and income generation that they were anticipated to provide [World Bank OED
1995; Matly 2003]. This is true for large projects based on grid extension [Schramm
1993; Meadows 2003; Aitken et al. 2008]. Policy makers and project implementers
either seem to ignore the impacts of the projects on income generation, operating
under assumptions that in order to achieve desired outcomes (for example, greater
income-generating opportunities) it is sufficient to produce outputs [Winrock Inter-
national et al. 2003]. More recently, it has been recognized that a change of focus is
required to meet specific demands set by productive uses [Etcheverry 2003; Barnes
2007]. However, understanding which specific inputs or conditions are required is
still lacking, as is illustrated later in this review.
The efficiency and economic viability of modern energy supply infrastructure can
be increased through local uses of energy for income generation, or the adaptation
of energy appliances. In rural areas where low population densities and low energy
demand from micro-enteprises, result in high costs of establishment and operation
of energy supply infrastructure, an increase in energy demand following from the
use of energy for income generation can benefit the economic viability of energy

20
projects [Barnes 2007; Kapadia 2004], or, as formulated more strongly by [Lamech
and O’Sullivan 2002]: ”Investment in rural electrification is economically justified
only when the emerging uses of electricity are strong enough to ensure sufficient
growth in demand to produce a reasonable economic rate of return on investment.”
A purely economic approach to improving economic viability of rural electrifica-
tion is introducing a distinction between areas with economic growth potential for
electrification through centralized grid, and areas that will (initially) be provided
with lower cost decentralized alternatives, would reduce waste of infrastructure in-
vestments [Schramm 1993; World Bank OED 1995]. Currently only 10-50% of the
costs of rural electrification are generally recovered, leading to high levels of subsi-
dization [Lamech and O’Sullivan 2002]. A further aspect of improving feasibility of
energy projects by productive uses is through the ability to pay for energy services:
if energy use does lead to an increase in income generation, the consumers ability
to pay for energy services is improved, thereby breaking the vicious cycle of energy
poverty and financial poverty [Barnett 2000; Kapadia 2004; IDS 2003].
Figure 2.4: The vicious cycle of energy and poverty

21
2.3 Electricity and the Human Development Index
Macro-level research on the role of energy in poverty reduction has been performed
by economists, both from academic and consultancy backgrounds. Micro-level re-
search on this topic has been performed mainly by energy consultants. The literature
review, especially for the micro perspective, will therefore be mainly based on the
so-called grey literature, which consists of non-peer reviewed reports and publica-
tions. As many authors in this field write from an advocacy perspective supporting
the role of energy, a positive presentation of findings can be expected.
The bulk of research on energy impacts on poverty takes a macro economic per-
spective. At a macro-economic level, indeed, there is a correlation between commer-
cial energy consumption and economic growth (GDP), and also between commercial
energy consumption and the Human Development Index (HDI). Illustrations of such
correlations often appear in discussions on the energy contribution to development
and poverty reduction.
The Human Development Index (HDI) is a summary measure of human devel-
opment that is published by the United Nations Development Programme (UNDP).
The HDI provides an alternative to the common practice of evaluating a country’s
progress in development based on per capita Gross Domestic Product (GDP) . The
HDI is the trademark of the Human Development Report (HDR), an independent re-
port commissioned by the UNDP that is written by a team of scholars, development
practitioners and members of the Human Development Report Office of UNDP. The
HDI has had a significant impact on drawing the attention of governments, corpo-
rations and international organizations to aspects of development that focus on the
expansion of choices and freedoms, not only income.

22
The HDI measures the average achievements in a country in three basic dimensions
of human development: 3
• A long and healthy life, as measured by life expectancy at birth (longevity)
• Knowledge, as measured by the adult literacy rate (with two-thirds weight)
and the combined primary, secondary and tertiary gross enrollment ratio (with
one-third weight)
• A decent standard of living, as measured by purchasing power, based on real
Gross Domestic Product per capita adjusted for the local cost of living in pur-
chasing power parity (PPP) terms in US dollars
Figure 2.5 is an example of a graph based on electricity, as a form of commercial
energy, and the Human Development Index.
Figure 2.5: Macro level correlation between electricity and human development
3The Human Development Report (HDR) was first launched in 1990 with the single goal of putting people back atthe center of the development process in terms of economic debate, policy and advocacy; bringing about developmentof the people, by the people, and for the people, and emphasizing that the goals of development are choices andfreedoms. The report is available online: http://hdr.undp.org/en/

23
However, data shown on figure 2.5 has come to be used as a proof that electric-
ity leads to improvement in human development. An example can be seen in the
GEF-FAO workshop report which places the graph under the header Human devel-
opment responds dramatically to initial electricity additions [White 2002]. [Shiu and
Lam 2004] show that 21 separate studies on these correlations in the Asian region
provide all possible conclusions: in some cases causal relationships were found to
be bidirectional, in others, relationships were non existent, while some found causal
relationships from increased modern energy or electricity consumption use to Gross
Domestic Product (GDP) and others found the reverse.
Many macro-economic studies emphasize the impacts of modern electricity on
industrialization which automatically focuses on large scale and electricity intensive
industries rather than the impacts of modern electricity access on small enterprises.
[Prasad and Dieden 2007] specifically study the impacts of grid extension on the
establishment of small enterprises in South Africa. This study, which is based on
nationwide survey data for the number of micro-enterprises using and those not us-
ing electricity, attributes the growth of micro-enterprises to the increase in electricity
uptake in electrified areas and to the extension of the grid into new areas. However,
it provides no information for understanding the factors that motivate the estab-
lishment of micro-enterprises and the choice whether or not to take up electricity,
and whether the electricity activities are out of opportunity or out of necessity. Fur-
ther, comprehension of how grid access may have contributed to establishment of
enterprises is lacking.
At the local level, research in the field of electricity access for income generation
shows consensus on improved opportunities, but that the evidence is often anec-
dotal [Fluitman 1983; Rogerson 1997; Fishbein 2003; Meadows 2003; Ramani and

24
Heijndermans 2003], or measured by tracking use of electricity before and after an
intervention, rural electrification projects, rather than the impact on poverty itself
[Barnett 2000].
Understanding how and under which circumstances or conditions electricity sup-
ply does lead to income generation is essential for the identification of complemen-
tary conditions, which may or may not be influenced through targeted interventions.
Such understanding can be used in policy and projects for energy policy and ru-
ral development or poverty reduction, as it facilitates choices with regard to rural
electrification, justification or targeting of financial support with the objective to
achieve poverty reduction, and the identification of interventions to contribute to
such impacts. The lack of comprehension of the conditions, both regarding context
factors, and characteristics of entrepreneurs, has led to recommendations that a large
range of conditions need to be in place before energy can have an impact on income
generation [UN, 2002;UNEP, 2005; IDA, 2005] .
Progress toward providing greater access to modern energy has been slow due to
a combination of interrelated circumstance. These include low-income levels among
the un-served population; lack of financial resources for service providers to build the
necessary infrastructure and reduce first-cost barriers to access; weak institutional,
financial and legal structures that could otherwise encourage private investment;
and lack of long-term vision and political commitment to scale up. At the United
Nations Millennium Summit in September 2000, world leaders place development
at the heart of the global agenda by adopting the Millennium Declaration from
which the Millennium Development Goals (MDGs) were later extracted. The MDGs
provide concrete, time-bound objectives for dramatically reducing extreme poverty
in its man dimensions by 2015.

25
This research provides a linkage with the first goal which is to ”eradicate extreme
poverty and hunger” by showing the impacts of electricity access on increased income
generation. Data collected will determine whether some circumstances or comple-
mentary inputs are found to have more influence, or form a stronger condition for
positive impacts of electricity on income generation than others. As this research
focuses on impacts of electricity access on the micro-enterprise, the areas for field-
work have been selected where the quality electricity access is poor and that would
conceal potential positive impacts of electricity access. Indications of the influence
of access to electricity are provided through the sampling method. 4
Figure 2.6: The difference of electrification between Europe and Africa is clearly seen in this phototaken by NASA. Africa with over 1 Billion people is poorly lit overall, and the brightest areas arethe most urbanized, not necessarily the most populated. [NASA 2008]
4Meeting the targets of MDG 1 is a shared responsibility of rich and poor nations. Strategies for reaching theMDGs must by tailored to individual countries, but certain general elements are critical for success. Access toelectricity is a key factor for promoting social progress and economic growth both of which are closely linked tosustainable reduction of poverty. Lack of access to affordable, reliable, safe and environmentally friendly energy isa serious barrier to sustainable development. This has serious implications for Africa which displays the lowest percapita consumption of electricity with an average of approximately 400 kWh per capita per year in the Sub-Saharanregion. [Blyden et. al. 2008]

26
2.4 Power Generation and Distribution in Uganda
Like any other country, the energy sector plays a central role in the economy.
Energy is the engine for economic growth and development, and a vital input into all
the productive and social sectors of the economy. The sector is a major component
of a country’s infrastructure and supports economic and social development. It also
contributes significantly to financing public expenditure.
Uganda’s energy sector, like most other sectors of the economy is largely informal
and under developed. It is characterized by a very low level of consumption of total
modern energy is estimated at 2 toe per capita, one of the lowest not only in the sub-
Saharan Africa but also in the world. There is over dependence on low-grade forms
of energy especially traditional biomass fuels which accounts for more than 96% of
the total energy consumption. The level of electrification is very low and only about
8% of the entire population are connected to national grid. In rural areas, where
more than 85% of population lives, only about 1% are connected to grid electricity,
while the remainder comes from diesel generators, batteries and solar photovoltaic
[MNR, 2006].
Meeting the energy demand of a growing economy on a sustainable and efficient
basis and improving the living standards of the people is a priority of the Ugandan
government. The main challenge in the energy sector, therefore, is how to develop
Ugandas considerable electric potential. The overall policy objective of Government
for the energy sector, as stated in the ministrys policy statement, is to continue
to improve the quality and quantity of energy supplies at least cost to the national
economy, while also promoting efficiency and conservation of energy resources [MNR,
1996].
27
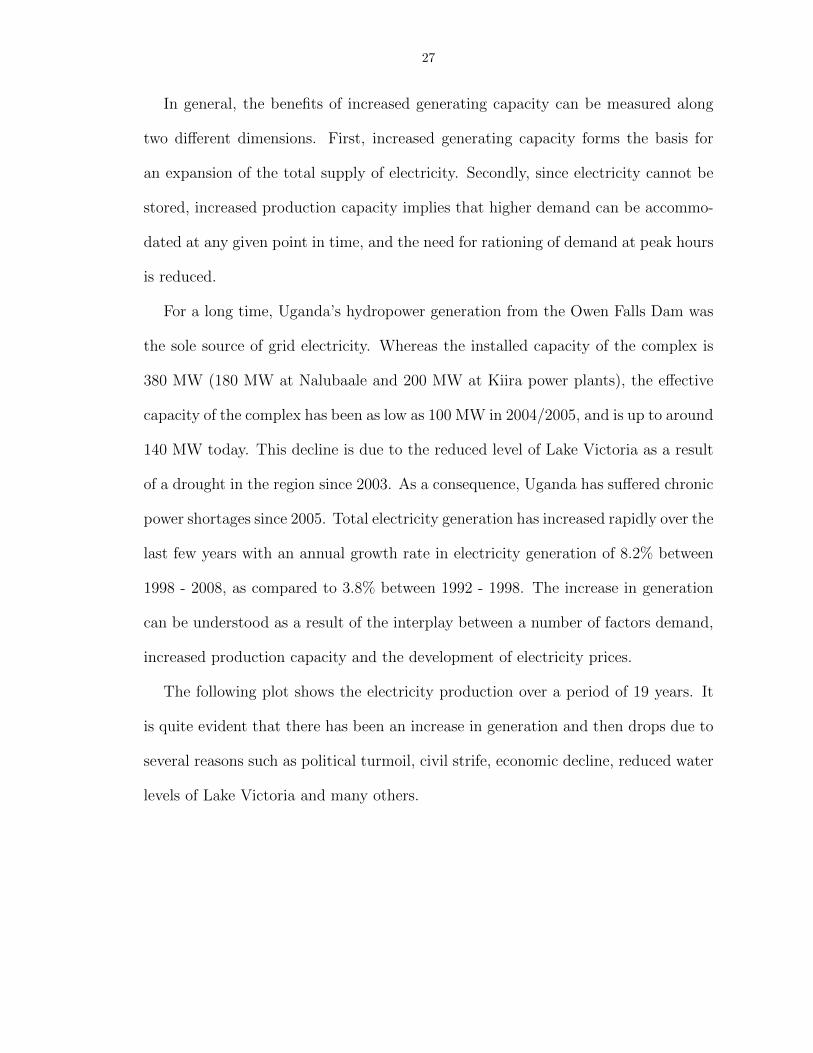
In general, the benefits of increased generating capacity can be measured along
two different dimensions. First, increased generating capacity forms the basis for
an expansion of the total supply of electricity. Secondly, since electricity cannot be
stored, increased production capacity implies that higher demand can be accommo-
dated at any given point in time, and the need for rationing of demand at peak hours
is reduced.
For a long time, Uganda’s hydropower generation from the Owen Falls Dam was
the sole source of grid electricity. Whereas the installed capacity of the complex is
380 MW (180 MW at Nalubaale and 200 MW at Kiira power plants), the effective
capacity of the complex has been as low as 100 MW in 2004/2005, and is up to around
140 MW today. This decline is due to the reduced level of Lake Victoria as a result
of a drought in the region since 2003. As a consequence, Uganda has suffered chronic
power shortages since 2005. Total electricity generation has increased rapidly over the
last few years with an annual growth rate in electricity generation of 8.2% between
1998 - 2008, as compared to 3.8% between 1992 - 1998. The increase in generation
can be understood as a result of the interplay between a number of factors demand,
increased production capacity and the development of electricity prices.
The following plot shows the electricity production over a period of 19 years. It
is quite evident that there has been an increase in generation and then drops due to
several reasons such as political turmoil, civil strife, economic decline, reduced water
levels of Lake Victoria and many others.

28
Figure 2.7: Electricity Production Showing Growth and Decline Over the Years [World Bank 2009a]Electricity Production: This entry is the annual electricity generated expressed in kilowatt-hours.The discrepancy between the amount of electricity generated and/or imported and the amount
consumed and/or exported is accounted for as loss in transmission and distribution.
Going by the definition of energy poverty as “the absence of sufficient choice in
access to adequate, affordable, reliable, quality, safe and environmentally benign
energy services to support economic and human development” [UN MDG, 2009], it
is apparent that there exists energy poverty at all levels of consumption in Uganda,
particularly in the rural areas. If economic prosperity is to be achieved, sustained and
standards of living for Ugandans improved, a paradigm shift in policy and planning
for electricity supply and consumption is necessary. In the past, electricity planning
has emphasized on addressing the supply side (primarily for commercial use) more
than the demand side. The approach has tendered to favor the urban population
while marginalizing the needs of the majority of the population, who live in rural
areas and under the poverty line.

29
At present, there are approximately 400,000 connections to the electricity grid in
Uganda. This is an increase from about 150,000 in 1999. Umeme is the principal
power distribution company in Uganda. Formerly state-owned, Umeme’s network
covers a significant proportion of Uganda and includes 230,000 poles and 17,000 km
of overhead cable. A World Bank study states, “No more than 7% of the total
population in Uganda can afford unsubsidized electricity. It is unrealistic to think
that more than a fraction of the rural population could be reached by a conventional,
extend-the-grid approach. A more promising course is to rely instead on ’alternative
and non-conventional’ approaches to electrification.” [Worldbank, 2007]
Figure 2.8: The electricity grid/transmission net-work in Uganda including proposed extensions[Kaijuka, 2007]
Figure 2.9: The electricity grid roughly followsthe road network; under full coverage, they shouldideally match [Kaijuka, 2007]

30
The continuous demand for electricity exceeds actual consumption, hindered by
limited supply. The situation is exasperated further by recurring load-shedding im-
posed almost on a daily basis on urban consumers, mostly those in Kampala, where
the demand is greatest. Despite the rationing, tariffs are on the increase, thus forcing
customers to pay more for a lesser service [UMEME, 2009]. With a goal to kick-
start development, provision towards service providing institutions such as micro-
enterprises should stimulate improved services and social welfare, thus attracting
greater business opportunities, and less urban migration.
Figure 2.10: Population density is highest along the electricity grid; there are still many highlypopulated areas that are out of reach [Kaijuka, 2007]

31
2.5 Triangulation: Turning Qualitative into Quantitative Evidence
The significance of qualitative research comes from the role it plays in investi-
gating the reasons and processes leading to certain results. Qualitative research has
been described as work done to understand ”meaning that is socially constructed by
individuals with their world. The world, or reality, is not the fixed, single, agreed-
upon, or measurable phenomenon that is assumed to be in positivist, quantitative
research.” [Merriam 2002] In this research, data collection methods include field
notes, journals, semi-formal interviews surveys and interviews. Although large vol-
umes of data are collected, drawing conclusions from a wide range of information
often becomes a challenging task as experienced in this research.
Many recent advances in understanding have been achieved by deriving quanti-
tative evidence from qualitative evidence, using the two dialectically, and indexing
them against other quantitative findings from the same population. In so doing,
one can use the triangulation method extending it to many apparently qualitative
sources. Triangulation involves the careful reviewing of data collected through dif-
ferent methods in order to achieve a more accurate and valid estimate of qualitative
results for a particular construct.
The idea of triangulation is associated with measurement practices in social and
behavioral research. An early reference to triangulation is in relation to the idea pro-
posed by [Webb et al. 1966], suggesting, ”once a proposition has been confirmed by
two or more independent measurement processes, the uncertainty of its interpreta-
tion is greatly reduced. The most persuasive evidence comes through a triangulation
of measurement processes.”
32
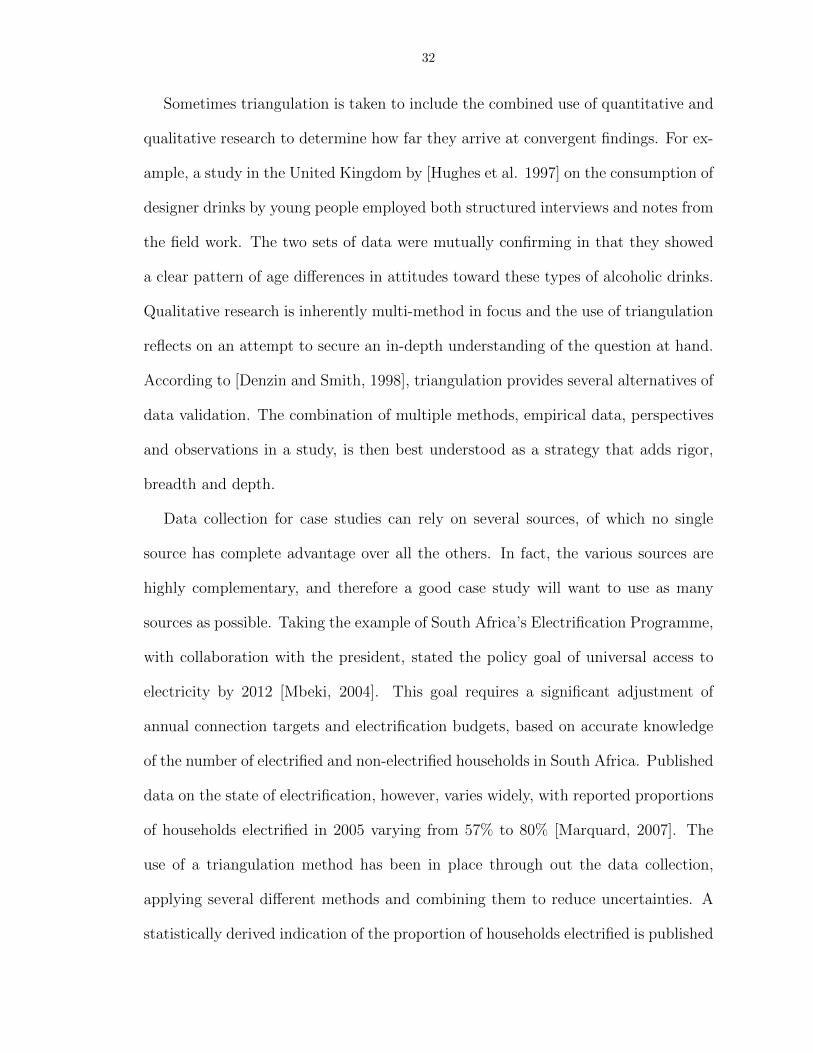
Sometimes triangulation is taken to include the combined use of quantitative and
qualitative research to determine how far they arrive at convergent findings. For ex-
ample, a study in the United Kingdom by [Hughes et al. 1997] on the consumption of
designer drinks by young people employed both structured interviews and notes from
the field work. The two sets of data were mutually confirming in that they showed
a clear pattern of age differences in attitudes toward these types of alcoholic drinks.
Qualitative research is inherently multi-method in focus and the use of triangulation
reflects on an attempt to secure an in-depth understanding of the question at hand.
According to [Denzin and Smith, 1998], triangulation provides several alternatives of
data validation. The combination of multiple methods, empirical data, perspectives
and observations in a study, is then best understood as a strategy that adds rigor,
breadth and depth.
Data collection for case studies can rely on several sources, of which no single
source has complete advantage over all the others. In fact, the various sources are
highly complementary, and therefore a good case study will want to use as many
sources as possible. Taking the example of South Africa’s Electrification Programme,
with collaboration with the president, stated the policy goal of universal access to
electricity by 2012 [Mbeki, 2004]. This goal requires a significant adjustment of
annual connection targets and electrification budgets, based on accurate knowledge
of the number of electrified and non-electrified households in South Africa. Published
data on the state of electrification, however, varies widely, with reported proportions
of households electrified in 2005 varying from 57% to 80% [Marquard, 2007]. The
use of a triangulation method has been in place through out the data collection,
applying several different methods and combining them to reduce uncertainties. A
statistically derived indication of the proportion of households electrified is published

33
in Stats SA’s annual household surveys and national census, which report the number
of households in South Africa that use electricity for lighting. As lighting is typically
the most basic application of electricity in a household, statistics on its utilization are
taken as an indication of the households electrified [NERS, 2003]. A second data set
is obtained from the ’Electricity Supply Statistics’ report which identifies the number
of domestic electricity customers in South Africa. The Department of Minerals and
Energy base the electrification data in these reports on data submitted to it on
a monthly basis by Eskom (South Africa’s primary utility company), municipalities
and non-grid service providers licensed to distribute electricity, in a format prescribed
by the Division of Revenue Act [NERS, 2005]. Eskom’s annual reports also publish
electrification data, but these relate only to connections made by Eskom and therefore
do not reflect the state of electrification in South Africa as a whole. A combination
of both qualitative and quantitative sources enables this data to be more accurate
and provides validation.
Figure 2.11: Data Triangulation Method Showing Each Method Used for the Specific Triangles
In my research, I use the method referred to as data triangulation, which entails

34
gathering data through several sampling strategies, so that slices of data at different
times and social situations, as well as on a variety of people, are gathered. As seen in
the diagram, I use journals and field notes to gather data from key informants which
include general customers, government officials such as chiefs, electricity production
managers and the like; semi-formal surveys and interviews are then used to collect
data from the entrepreneurs. Both those sets of data are then used to compare with
that historical data.

CHAPTER III
Micro-Enterprises in Uganda
3.1 Introduction
Uganda has progressed well in many of the economic and social indicators over
the past decade as a consequence of the policy and institutional reforms undertaken
within the context of the Ugandan Government’s Poverty Eradication Action Plan
(PEAP) 5. However, despite this progress, the country’s competitiveness when com-
pared globally and regionally remains low. Recent evidence shows that Micro, Small
and Medium-Sized Enterprises (MSMEs) 6 form the bulk of Uganda’s private sector
[UBS, 2008]. If Uganda is to become competitive through growth of the private sec-
tor, more attention must be paid to addressing the key bottlenecks to MSME growth
and competitiveness.
This research is undertaken to better understand access to electricity by off-grid
micro-enterprises; to identify the main sources of electricity used by the micro-
enterprises; assess the effectiveness of the current access framework and mecha-5The PEAP provides an over-arching framework to guide public action to eradicate poverty. It has been prepared
through a consultative process involving central and local Government, Parliament, Donors and Civil Society. In orderto achieve middle-income status, Uganda needs to industrialize by enhancing its competitiveness. Industrializationin Uganda will depend on using the resource base and hence on equipping farmers to understand the technical andquality requirements of commercial production. Government will therefore ensure the provision of public goods tosupport both agriculture and industry. In order to reverse the recent marked increase in inequality, Governmentwill aim to increase the ability of the poorer households to participate in economic growth through self-employmentinside and outside agriculture and wage employment.
6Enterprises qualify as micro, small and medium-sized enterprises (MSMEs) if they fulfill the following criteria inheadcount: medium sized < 250, small < 50 and micro < 10
35

36
nisms; and to make recommendations for scalable sustainable solutions to support the
growth of the micro-enterprise. Micro-Enterprises have been defined by the Uganda
Bureau of Statistics (UBS) to mean firms/small businesses that have 1-20 employ-
ees. Using a stratified random sample 7, 135 micro-enterprises are interviewed. This
research focuses on the 56 micro-enterprises that responded to all questions and had
some form of access to electricity other than a connection to the grid.
The Republic of Uganda is a landlocked country in East Africa. It is bordered on
the east by Kenya, on the north by Sudan, on the west by the Democratic Republic
of the Congo, on the southwest by Rwanda, and on the south by Tanzania. The
southern part of the country includes a substantial portion of Lake Victoria, which
is also bordered by Kenya and Tanzania. Currently, 51% of the population of the
country lives slightly below the poverty line (see definition in list of terminologies)
and is currently subject to a severe food crisis. Uganda is home to many different
ethnic groups, none of whom forms a majority of the population. Around forty
different languages are regularly and currently in use in the country. English became
the official language of Uganda after independence. Swahili, a widely used language
throughout eastern and central east Africa, was approved as the country’s second
official national language in 2005,[Constitution (Amendment) Act of 2005] though
this is somewhat politically sensitive. The current estimated population of Uganda
is 32.4 million. Uganda has a very young population, with a median age of 15 years
[UBS, 2009].
Three districts (Kabarole, Kamwenge and Kyenjonjo) in Western Uganda are
selected for this research. Centralized around Fort Portal, an important market town,
the area is situated between the Rwenzori Mountains, Kibale National Park and7A method of sampling, which involves the division of a population into smaller groups, known as strata. In
stratified random sampling, the strata are formed based on their members sharing a specific attribute or characteristic.In this research, the common attribute is those that do have access to grid electricity.

37
Queen Elizabeth National Park. This spectacular town overlooking the mountains
of the moon is the seat of both the Kabarole district and the Toro kingdom. The
towns surrounding it are very rural 8, with very poor infrastructure and are difficult
to access especially during the rainy season. From the sample, eleven towns are
selected for this research, providing several business categories for each town. Figure
3.1 shows the different towns distributed in three districts.
Figure 3.1: Schematic Diagram of theVillage Towns in the Three Districts of Western Uganda
8Rural in this case refers to a locality outside of areas that are administratively managed by urban authorities.Rural areas are relatively deprived in terms of modern energy infrastructure. They are not connected to gridelectricity. Rural areas are sparsely settled places away from the influence of large cities and towns. They are remotefrom the national grid and have no chance of accessing the grid in the near future. Some of the towns may roughlybe close to a grid connection (30 or more kilometers) but even then due to poverty issues cannot get connected.

38
The categories and number of micro-enterprises interviewed is as follows, as shown
in the table as well as the map in the figure below:
Category Number Interviewed
Bar 7Barber 7Battery Charging Station 3Cellphone Charging Station 11General Store 11Pharmacy 2Restaurant 2Tailor 6Video Hall 7
Table 3.1: List of Business Categories and Number of Micro-Enterprises Interviewed
Figure 3.2: Distribution of Micro-Enterprises in the Rural Western Uganda.

39
Although rurality, especially in developing countries, is associated with agriculture
as the primary means of income generation, the role of non-farm income generation
is increasing [Liedholm and Mead, 1999; Rigg 2006]. 9 Micro-enterprises contribute
greatly to the economies of all countries, regardless of their level of development. In
2001, Uganda was estimated to have approximately 1 million enterprises classified
as MSMEs, forming 90% of Uganda’s private sector. In Uganda, MSMEs employ
approximately 1.5 million people, 90% of total non-farm private sector workers. The
business sector, which is dominated by micro-enterprises, only contributes less than
20% to the GDP. From 1997 to 2006, the manufacturing sector’s annual growth
rate was only 1.3% [UBS, 2008]. The sector’s efficiency has been decreasing, and
its technical efficiency 10 is much lower (that is, 0.19) than that of manufacturers in
Cameroon, Ghana, Kenya, and Zimbabwe [Gauthier 2001].
Figure 3.3: Typical Micro-Enterprise in Rural Uganda
9Empirical research shows that non-farm income including remittances has a similar or even higher contributionto rural household income, with findings at 40% - 60% of the households in South Asia and sub-Saharan Africa [Ellisand Biggs 2001] and 58% in India, and 60% - 80% in six African countries and increasing by over 50% over the twodecades since the 1980s [Rigg 2006].
10Technical efficiency (using stochastic production frontier models) is the ratio between actual and potential output[Soderbom and Teal 2004b; Gauthier 2001].

40
Micro-enterprises represent one of the most viable vehicles for sustainable grass-
roots economic growth. Attention needs to be focused on identifying how best to
support such an important activity, i.e. the micro-enterprises, enabling them to
have a catalytic role in the development process by creating jobs, reducing poverty,
generating tax revenue and, above all, enhancing household incomes.
This study investigates both the qualitative and quantitative impacts of off-grid
electricity access on the growth of the micro-enterprises in the selected region. Ob-
servations are made and questions asked to elicit data on the entrepreneur and the
business in general; the products and services offered, including number of customers
and sales; the methods of generating and accessing electricity; the cost of accessing
electricity; the different uses of electricity; and the constraints faced in the process.
Using this criterion, the selected micro-enterprises provide a comparative assessment
of the impact of electricity on the productivity of micro- enterprises. The questions
asked are categorized in the following sections:
• Micro-Enterprise Information:
– Name of the Entrepreneur
– Age
– Sex
– Business Name
– Length of Ownership
– Daily Operating Hours
– Number of Employees
• Product and Services:
– Product and/or Services Provided
– Buying Price (if product)
– Selling Price (applies to both products and/or services)
– Quantity sold per day
– Number of customers per day
– Daily Operating Hours
– Number of Employees
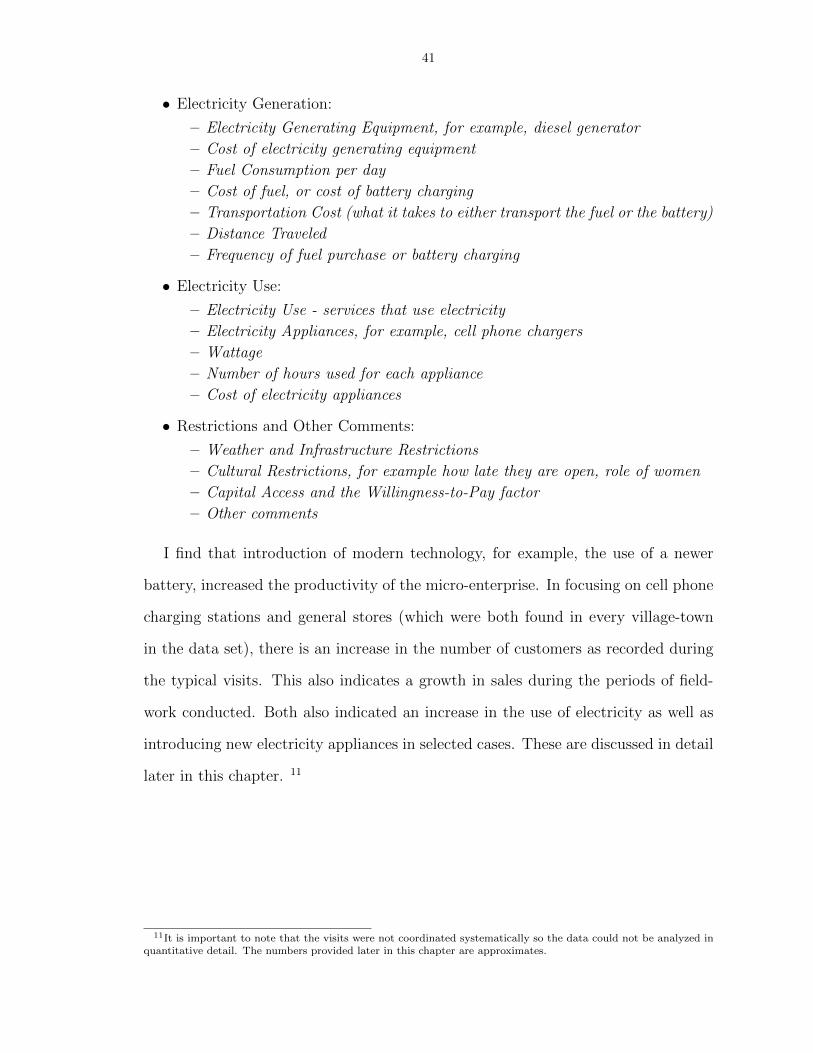
41
• Electricity Generation:
– Electricity Generating Equipment, for example, diesel generator
– Cost of electricity generating equipment
– Fuel Consumption per day
– Cost of fuel, or cost of battery charging
– Transportation Cost (what it takes to either transport the fuel or the battery)
– Distance Traveled
– Frequency of fuel purchase or battery charging
• Electricity Use:
– Electricity Use - services that use electricity
– Electricity Appliances, for example, cell phone chargers
– Wattage
– Number of hours used for each appliance
– Cost of electricity appliances
• Restrictions and Other Comments:
– Weather and Infrastructure Restrictions
– Cultural Restrictions, for example how late they are open, role of women
– Capital Access and the Willingness-to-Pay factor
– Other comments
I find that introduction of modern technology, for example, the use of a newer
battery, increased the productivity of the micro-enterprise. In focusing on cell phone
charging stations and general stores (which were both found in every village-town
in the data set), there is an increase in the number of customers as recorded during
the typical visits. This also indicates a growth in sales during the periods of field-
work conducted. Both also indicated an increase in the use of electricity as well as
introducing new electricity appliances in selected cases. These are discussed in detail
later in this chapter. 11
11It is important to note that the visits were not coordinated systematically so the data could not be analyzed inquantitative detail. The numbers provided later in this chapter are approximates.

42
3.2 The Sources Electricity for Micro-Enterprise Use
Access to electricity services for everyone is a reasonable goal for global society,
with development benefits very clear. There are many obstacles that would need
to be overcome and no one single solutions fits all. Today’s forecasts would require
huge power-infrastructure investment in developing countries in the coming decades
[Tester, 2005]. The proportion of the global population to be connected will rise and
higher capacity and reliable supply needed. In parallel, such improvements allow
for industrial (primarily agricultural in Uganda) expansion, increased productivity
and economies to grow. However, looking at absolute figures, the number of people
relying on traditional fuels will remain at an almost constant level. Unless policies
are changed and scalable sustainable solutions for generating off-grid electricity are
implemented, progress will not reach the most deprived. Starting the climb up the
energy ladder becomes difficult [WEA, 2002].
Figure 3.4: Climbing the energy ladder towards more modern methods is a challenge that most poorpeople in developing countries face if they are to improve their overall standard of living. [WEA,2002]
Energy models were first developed in the 1970s as a result of the increasing avail-
ability of the computer and the first oil crisis. Most of the energy models were built
and used in industrialized countries, so that the assumptions about energy systems of
developing countries were mainly based on experiences from those in industrialized

43
countries. It was therefore assumed that the energy systems of developing coun-
tries would behave like those of the industrialized ones [Shukla, 1995]. For energy
modeling, trends for developing countries were derived from those of industrialized
countries and extrapolated to low-income ranges. This approach sounds great but
may nevertheless result in models biased towards industrialized countries, possibly
leading to incorrect interpretation of energy systems of developing countries.
The push to privatize electricity generation and distribution in developing coun-
tries during the 1990s has, in some ways, exacerbated the problem of reaching those
living in off-grid areas. Private distribution utilities, driven by bottom-line consid-
erations, have concession contracts that limit their service obligation to households
located a relatively short distance from the grid. Utilities have little incentive to con-
nect customers located beyond this limit because unit connection costs are higher
and customers, who are generally poorer, can only be charged tariffs that are below
the marginal cost of service.
Most poor households in developing countries lack access to modern energy, in
this case, electricity. They instead rely on traditional biomass fuels like crop waste,
dung, and wood to meet their energy needs. The order of fuels on the energy ladder
corresponds to their efficiency and cleanliness at the end use. Although modern en-
ergy tends to be more costly - at least from a monetary perspective - than traditional
methods, it provides people with a far greater opportunity for income generation for
the micro-enterprise.
Determination of power output for the different off-grid electrical technologies
proves to be difficult in most of the cases interviewed for several reasons, primarily
because there is little to no data on the actual electricity generating equipment or
on the electricity appliances. Despite the strong efforts made by researchers and
utility companies to decouple the concepts of electricity sales measured in pennies
per kilowatt-hour from fee-for service monthly payments, many of the rural customers

44
are paying high rates for basic services, with costs some times taking up over half
of their daily income. There are two major stand-alone electricity sources that are
considered at the micro-enterprises:
• Electricity Generation System: converts heat energy into kinetic energy and
then into electric power, or directly into electric power (in the case of Solar PV)
• Electricity Storage System: Rechargeable lead-acid batteries that store electric-
ity to provide energy on-demand, a controller that manages the storage to the
battery and deliver power to the load, and the structure required to mount or
install the system
In this research, the most common stand-alone source of electricity at the micro-
enterprises is automotive (car) batteries (stored charge); commonly transported to
specific charging stations where they are charged and then used again. Figure 3.5
shows the graphical distribution of the electricity generating and storage equipment
in the region studied while figure 3.6 shows a map with the distribution of the
electricity generating and storage equipment.
Figure 3.5: Graphical Distribution of Electricity Generating and Storage Equipment

45
Figure 3.6: Map Distribution of Electricity Generating Equipment
Regions and communities without grid electricity often suffer from extreme poverty,
limited freedom of choice and opportunities of accessing electricity, and very high
costs of access. Raising capital to meet those needs often becomes a task that is
difficult to deal with both for the government and the local people. Distortion of
commercial incentives often worsens an already difficult situation, and in many cases,
this is combined with a policy environment and institutional structure that is not
conducive to private sector investments.
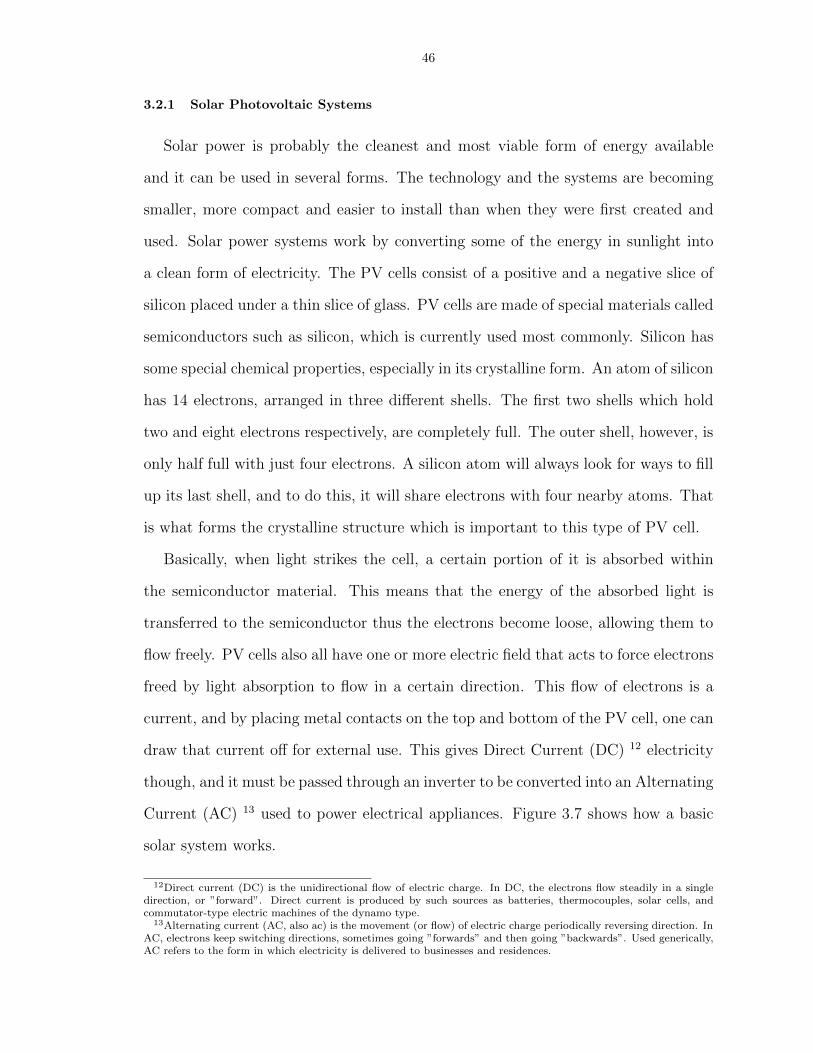
46
3.2.1 Solar Photovoltaic Systems
Solar power is probably the cleanest and most viable form of energy available
and it can be used in several forms. The technology and the systems are becoming
smaller, more compact and easier to install than when they were first created and
used. Solar power systems work by converting some of the energy in sunlight into
a clean form of electricity. The PV cells consist of a positive and a negative slice of
silicon placed under a thin slice of glass. PV cells are made of special materials called
semiconductors such as silicon, which is currently used most commonly. Silicon has
some special chemical properties, especially in its crystalline form. An atom of silicon
has 14 electrons, arranged in three different shells. The first two shells which hold
two and eight electrons respectively, are completely full. The outer shell, however, is
only half full with just four electrons. A silicon atom will always look for ways to fill
up its last shell, and to do this, it will share electrons with four nearby atoms. That
is what forms the crystalline structure which is important to this type of PV cell.
Basically, when light strikes the cell, a certain portion of it is absorbed within
the semiconductor material. This means that the energy of the absorbed light is
transferred to the semiconductor thus the electrons become loose, allowing them to
flow freely. PV cells also all have one or more electric field that acts to force electrons
freed by light absorption to flow in a certain direction. This flow of electrons is a
current, and by placing metal contacts on the top and bottom of the PV cell, one can
draw that current off for external use. This gives Direct Current (DC) 12 electricity
though, and it must be passed through an inverter to be converted into an Alternating
Current (AC) 13 used to power electrical appliances. Figure 3.7 shows how a basic
solar system works.
12Direct current (DC) is the unidirectional flow of electric charge. In DC, the electrons flow steadily in a singledirection, or ”forward”. Direct current is produced by such sources as batteries, thermocouples, solar cells, andcommutator-type electric machines of the dynamo type.
13Alternating current (AC, also ac) is the movement (or flow) of electric charge periodically reversing direction. InAC, electrons keep switching directions, sometimes going ”forwards” and then going ”backwards”. Used generically,AC refers to the form in which electricity is delivered to businesses and residences.

47
Figure 3.7: How solar systems work [Photo credit: Tmayhu, 2006 Courtesy of Photobucket]
The output of Solar Photovoltaic Systems strongly depends on the average diurnal
solar radiation incident upon the module, which sequentially depends on the tilt and
orientation. It is assumed that the standard tilted angle for the PV module is equal
to the latitude of the location where the module is installed. This is the slope, which
maximizes the annual radiation in the plane of the PV module and consequently its
power output. The estimation of energy output annually then follows:
E = ηWp(Q
Q0)X365 (3.1)
where η is the average system efficiency (battery, charge controller and loss in wiring);
Wp is the peak capacity of the PV module; Q is the annual average daily solar
radiation (Wm2
day ); Q0 is the standard solar radiation (1000 Wm2 ); and 365 represents the
number of days per year.

48
The number of micro-enterprises that use solar PV systems in this study is only
five out of the fifty six, approximately 10% which is somewhat representative due to
the high cost of the modules and installation. Better technology through advanced
materials can reduce the cost and improve both the performance and reliability of the
system. Unfortunately, this is not the case in rural Uganda. The number of people
trained to do such installations, with precision and understanding how to maximize
output it typically unheard of in the region. Most technicians may have to travel
as far as coming from Fort Portal (approximately 50km or more, depending on the
village town). The five distribution of the micro-enterprises is as follows:
Village Town Micro-Enterprise
BigodiCell Phone Charging StationVideo Hall
Ibanda Bar
KyenjonjoBarberGeneral Store
Table 3.2: Distribution of Micro-Enterprises Using Solar PV Systems
The modules installed are on a small scale, with very basic installations, most
of which are not configured and optimized for maximum energy output. One of
the systems studied (Video Hall in Bigodi) involved the use of a high-efficiency
crystalline solar cell, a charge controller and a locally 14 made 24V 100 amp-hours
(Ah) deep-cycle battery. 15 The battery then provides power for a simple video
system containing of a VCR, a DVD and a TV. The battery is also used to provide
lighting for the moments just before they start the showing and briefly after it is
over.
14The term ’locally-made’ is used loosely here representing the East Africa Community as one local entity ratherthan just viewing Uganda as the local entity. This is primarily because Uganda depends on most of it’s products tocome from Kenya and Tanzania because it is landlocked (no access to the Indian Ocean)
15Chloride Exide, East Africa’s biggest and most reliable provider of solar and battery solutions, was establishedin Kenya in 1963 as part of the Chloride Group PLC in UK, with its core business as distribution of automotivebatteries to end users. Chloride Group PLC UK, sold its interests to indigenous Kenyans in 1993, and CEKL becamepart of the NAS Group of Companies, with 100% share holding by Kenyans. CEKL has a countrywide network of 11branches in Kenya. Chloride Exide Tanzania is a registered company in Dar-es-salaam, Tanzania, and has a branchin Arusha.

49
To calculate the usage of the appliances, we begin by the definition of power
which is the rate at which work is performed or energy is converted. We follow
simple electricity formulation:
P = V I (3.2)
where P is the Power (Watts), V is the Voltage (Volts) and I is the current (Amperes).
Once we know the Power, we then can calculate the Energy by taking the Power and
multiplying it by the time (hours) that the appliance is used for
Energy(E) = Pt (3.3)
We can therefore find the usage by taking the Energy (Wh) and dividing it by the
Voltage (V) of the battery and this will give us the usage in Ampere hours (Ah).
Usage =E
V(3.4)
For this system, the battery is usually sufficient to run the video hall for the a
short period in the evening without draining it completely. Issues arise when there are
football (soccer) matches. The length of the games, and the fact that other appliances
such as speakers are installed and watching with lights on, to maintain order, because
most people are probably drinking. The owner does not have a measuring device to
know if the battery is charged or not, so relies on not running any other appliances
until the time of the match. There have been cases where towards the end the battery
would die and of course, the efficiency decreases over time.
Appliance Wattage (W) Quantity Duration Used (h) Usage (Ah)
Kyocera DVD 45 1 2 3.75Kyocera VCR 35 1 2 2.92Phillips 25” TV 250 1 4 41.7CFL 25 3 4 12.5
Table 3.3: Electricity Appliances at Video Hall in Bigodi
In a brief interview/conversation with the owner, several factors are highlighted
in regards to obtaining the equipment and usage:

50
Q: “How did you develop the idea of the video hall?”
A: “I have an Irish friend who wanted to watch the football match and
could not find anywhere to watch it nearby. He suggested to me that I start
something like that but I had no finances to begin it. All the initial equip-
ment (solar panel, charge controller, inverter and battery) was bought by
him (the friend) from Kampala, then I hired a technician from Fort Portal
to come and set it up. The rest of the equipment has been bought recently
with the little profits that come from the business.”
Q: “How often have you had the system serviced?”
A: “Why fix it if there’s nothing wrong? I don’t see anything wrong with it
and so no need to fix it. Only thing is that the battery does not use acid 16
and the people here do not know how to work on it.”
Solar systems in the other towns follow a similar trend of installation and initial
investment. A different case is the general store in Kyenjonjo (a growing and thriving
town located on the Kampala-Fort Portal Road). The owner indicates that because
of the constant traffic on the road, it made sense to have brighter lighting and be able
to open later hours. The customers increased quickly using brighter lights compared
to using a kerosene (paraffin) lantern.
“People in developing countries want a clean environment, but we are too
poor to invest in systems like solar that are clean and reliable. It’s not just
a matter of charity or solidarity: It is self-interest. We are now sources
of growth and importers of capital goods and developed countries services.
We need improvement in capital, I could only afford a very small system,
but would prefer something better.” – Kyenjonjo Barber16It is important to note that the subject did not realize that the battery is sealed so as to prevent the common
practice of replacing the acid in it. In his perception, it just makes sense that the battery does not use acid, whichis another indication on the lack of education as one of the barriers towards accessing and efficient use of electricityin rural areas

51
Small, simple, solar electric systems can be a part of the solution, increasing the
quality of life, and are often at a cost that is less than what is presently being spent for
the petrol, diesel and/or recharging of automotive batteries that must be lugged to
the nearest battery charging station on a weekly basis or even more frequently. The
success of solar systems in this areas depends not only on the competitive cost, but
also on the human infrastructure needed to deploy and maintain the systems (even
though we can loosely say that most solar PV systems are almost ‘maintenance-free’)
for effective cost-effectiveness and reliability.
3.2.2 Petrol and Diesel Generator Systems
The internal combustion (IC) engine has been used for many decades in devel-
oping countries playing a very important role in providing off-grid power for rural
communities. Many stand-alone units are used for milling, small-scale electricity
production, water pumping, etc. They are readily available, off-the-shelf in most
major towns and cities in a range of sizes to suit various applications. Generators
work by changing mechanical energy to electrical energy. It can be done by spinning
an armature (one of the electrical components of a motor that contains conductors)
through a magnetic field. Generators are based on the principle of electromagnetic
induction, which was introduced by Michael Faraday in 1831. This electromagnetic
effect induces voltage or electric current into the moving conductors.There are two
main types of IC engines defined by the type of fuel used; petrol (gasoline) or diesel.
The petrol engine is widely used for small vehicles and light applications whereas
diesel engines are more suited to continuous running for lengthy periods at higher
load ratings and are therefore used more widely for stationary applications.
The combustion process in the petrol engine and the diesel engine differ in the
following ways. In the petrol engine the petrol and air mixture is drawn into the
cylinder, compressed (compression ratio ranging from 4:1 to 10:1), and ignited by
a spark introduced by an electrical system. In the diesel engine, air alone is drawn

52
into the cylinder and is compressed to a much higher ratio (14:1 to 25:1) than in the
petrol engine. As a result of this compression the air is heated to a temperature of
700 - 900 ◦C. Only then is a certain quantity of diesel fuel injected into the cylinder
and the fuel ignites because of the high temperature. Hence the petrol engine is
often referred to as the spark ignition (SI) engine and the diesel as the compression
ignition (CI) engine. Secondly, there is the sub-division according to cycle type; the
two stroke or four stroke cycle. This means that engines have an ignition phase on
every revolution of the crankshaft or every other revolution.
Diesel generating sets come in a wide range of commercially available sizes, from
about 5 kW up to 30 MW (30,000 kW). Petrol generator sets come in smaller sizes -
from 500W up to several kW - and tend to have a much shorter lifespan (5000 hours
running time) than their diesel counterparts. They are more suited to mobile, very
small scale electricity needs [Tester et al, 2005].
There are two main costs to consider when discussing the generators - the invest-
ment cost and the running costs. For diesel systems the investment costs tend to
be relatively low compared with renewable energy technologies such as solar photo-
voltaics, while the running costs will be high. Running costs will also vary widely
as there are many factors which will determine the actual cost of the power supplied
- generating capacity, load factor, efficiency, fuel costs, etc. It is worth bearing in
mind that, in the long term, the fuel costs for a diesel or petrol engine will be high
compared with the capital cost and this often causes problems where there are no
guaranteed funds or income for fuel purchase.
The number of micro-enterprises that use fuel generator systems is twenty one out
of the fifty six, approximately 40% almost half of the number of micro-enterprises.
The distribution between those twenty one is such that eight use petrol (gasoline)
generators and thirteen use diesel for fuel. With the exception of two generators
(both diesel), all the rest were obtained as used equipment, or more like ‘hand-

53
me-downs’.17. Tables 3.4 and 3.5 and figures 3.8 and 3.9 show the distribution of
the micro-enterprises using petrol (gasoline) generators and diesel generators respec-
tively.
Village Town Micro-Enterprise
Ibanda BarKabujogera General StoreKichwamba Barber
KihuraBarRestaurant
Kyenjonjo Video Hall
KyegegwaBarBattery Charging StationVideo Hall
Table 3.4: Distribution of Micro-Enterprises Using Petrol (Gasoline) Generators
Figure 3.8: Petrol Generator
17Something (commonly used to describe an article of clothing) which is used and then passed along to someoneelse either free or at a very minimal cost.

54
Village Town Micro-Enterprise
Bigodi Barber
BisheseBarCell Phone Charging StationVideo Hall
IbandaBattery Charging StationVideo Hall
KabujogeraBarVideo Hall
KahungeBarBattery Charging Station
RwehambaBarGeneral StoreVideo Hall
Table 3.5: Distribution of Micro-Enterprises Using Diesel Generators
Figure 3.9: Diesel Generator

55
3.2.3 Battery Systems
In the case of battery systems, the electricity is generated away from the site
where the micro-enterprise is located and transported in a battery. Battery charging
stations are a common business and are typically located roughly 10-20 km away
from the micro-enterprise site.
A battery, by definition, consists of a group of two or more primary or secondary
battery cells, which convert chemical energy into electrical energy. A portion of
the chemical energy a cell produces is transformed into heat, and a portion into an
electric current. A cell is just the working chemical unit inside a battery; one battery
can contain any number of cells. A cell has three main parts: a positive electrode
(terminal), a negative electrode, and a liquid or solid separating them called the
electrolyte. When a battery is connected to an electric circuit, a chemical reaction
takes place in the electrolyte causing ions (in this case, atoms with a positive electrical
charge) to flow through it one way, with electrons (particles with a negative charge)
flowing through the outer circuit in the other direction. This movement of electric
charge makes an electric current flow through the cell and through the circuit it is
connected to.
The specifications and ratings of batteries are vital in comparing different types of
batteries and recognizing how they will perform in different situations. A battery’s
ampere-hour (Ah) rating is extremely useful in the analysis of battery usage. The
ampere-hour rating is defined as how long a battery can operate when certain am-
perage is being drawn from it. The voltage of the battery is useful when determining
what types of devices it can power based on what voltage that is required for the
device.
An important consideration is how often batteries need to be charged. This
translates into how long they will be able to power a device. Two factors come into
play when considering how long a device can operate on a battery: the ampere-hour

56
rating of the battery and the current drawn by the device. A main consideration for
the amount of current drawn by the device is how much resistance it has.
The amount of current drawn in amperes will be based upon the equation (3.5)
I =V
R(3.5)
where I is the current (Amperes), V is the voltage supplied (Volts) and R is the
resistance of the device (Ohms). Once the current is determined, the amount of
time until discharge can be determined from the ampere-hours of the battery using
equation (3.6)
h =rating(Ah)
current(A)(3.6)
where h is the number of hours available for use in the battery, battering rating is
in ampere-hour (Ah), and the current drawn from the circuit in amperes (A) and
determined using equation (3.5). In this way it can be determined how long a charge
on a battery can last, and therefore, how often it needs to be charged. A battery
will lose its recharging ability over its life. This is addressed when dealing with the
batterys state of charge and its state of health.
Approximately 55% of the micro-enterprises interviewed use automotive batteries
(that are charged elsewhere) to power small electrical appliances such as lights, tele-
vision, and radio. Most of the battery charging stations do not consider the above
calculations when charging the batteries and most likely have faulty multimeters
when measuring the charge of the battery. It is common to find that the batter-
ies never get a full charge. Consequently, there are high rates of battery servicing,
which often means dumping out the old sulphuric acid in a hazardous method, not
to mention the lack of safety in the actual handling of the acid. My assumption is
that the use of automotive batteries has discrete disadvantages to the entrepreneur
that need to be determined on a local basis which is not a focus of this research. 18
18The focus of this study did not cover the environmental impacts of the use of automotive batteries.

57
The distribution of the micro-enterprises using battery systems is as follows:
Village Town Micro-Enterprise
Bigodi General Store
BisheseGeneral StorePharmacy
Ibanda
BarberCell Phone Charging StationGeneral StoreTailorRestaurant
KabujogeraCell Phone Charging StationTailor
Kahunge
BarberCell Phone Charging StationGeneral StorePharmacyTailor
KichwambaCell Phone Charging StationGeneral Store
KihuraCell Phone Charging StationGeneral Store
KyakataraCell Phone Charging StationGeneral StoreTailor
Kyegegwa
BarberCell Phone Charging StationGeneral StoreTailor
RwehambaBarberCell Phone Charging StationRestaurant
Table 3.6: Distribution of Micro-Enterprises Using Automotive Batteries
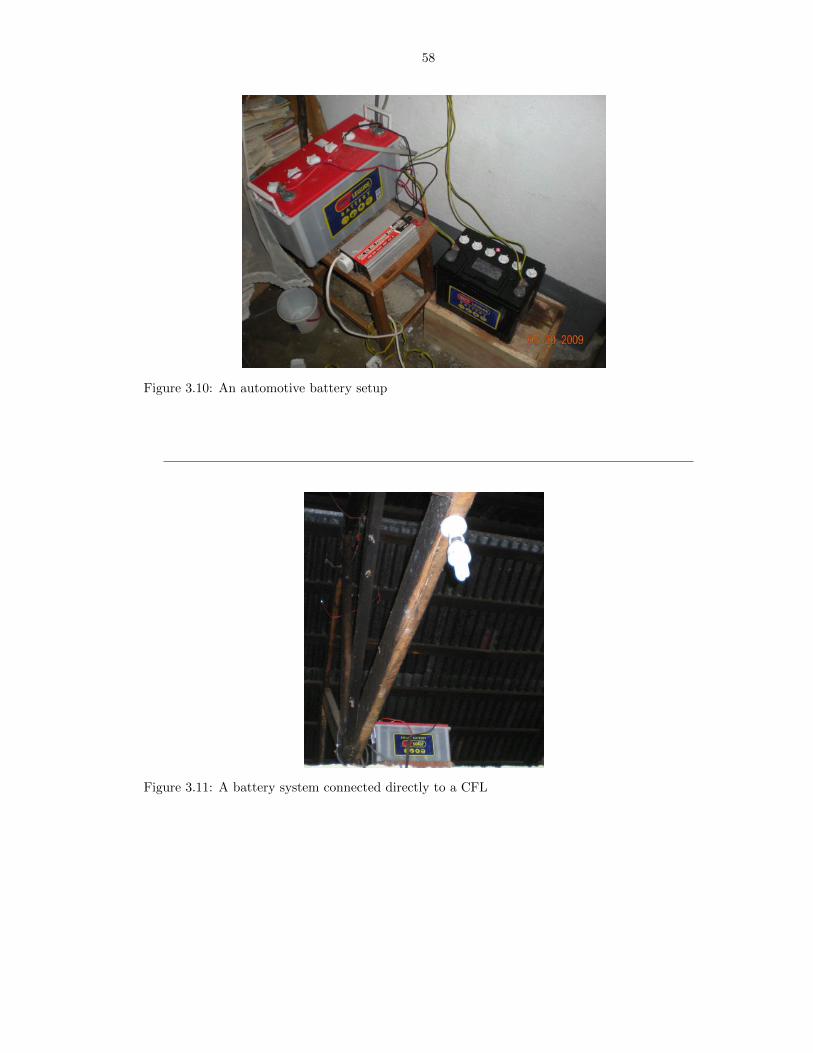
58
Figure 3.10: An automotive battery setup
Figure 3.11: A battery system connected directly to a CFL

59
3.3 Electricity Use
From the perspective of the entrepreneur, the choice of access to electricity is made
in relation to available alternatives. Therefore, in order to understand the decisions
for the choice made, it is important to understand what the uses are. The perception
of alternatives may be related to the physical presence of alternatives, or to more
diffuse expectations which are influenced by entrepreneurs assets and motivations.
For the analysis of impacts of electricity access, it is useful to distinguish between
the functions of electricity use within the micro-enterprises. This is an important
distinction to make, as not all electricity services have the potential or are intended to
contribute to income generation in the micro-enterprise. The electricity services have
been categorized into three categories: lighting, entertainment (TVs and Radios) and
micro-enterprise services 19.
Category for Electricity Use Number of Micro-Enterprises
Electricity for Lighting 56Electricity for Entertainment 14Electricity for Other Micro-Enterprise Services 31
Table 3.7: Number of Micro-Enterprises based on the category of use
Table 3.7 provides an overview of how many micro-enterprises of the total sample
of 56 micro-enterprises are making use of electricity for different categories of elec-
tricity services. Despite the fact that the 56 micro-enterprises have lighting as one
of the main uses of electricity, 35 of them (about 63%) only occasionally remained
open in the evening, with only fifteen regularly doing so.
The perceptions about electricity are also related to social status of the en-
trepreneur, which may form an implicit but strong argument to take up electric
lighting regardless of economic calculations. The field research also showed, how-
ever, that having electric light or not is often not an outcome of a conscious or19Entertainment consists of the use of media appliances such as TVs and Radios. Micro-enterprise services primarily
consist of communication needs and refrigeration.

60
strategic decision made by entrepreneur. Firstly, 42 of the micro-enterprises run
inside or right next to the entrepreneur’s home (for instance cellphone charging sta-
tions are commonly a room in the home, or the general stores are typically the home
with a window opening for the entrepreneur to conduct business), which in turn
makes the access for the home and the micro-enterprise inseparable. Secondly, most
entrepreneurs who do have electric lighting have some form of back-up light, usually
a kerosene lamp or candles, for use when they cannot afford access to lighting.
An observation that most developed countries could learn from developing coun-
tries is the use of Compact Fluorescent Lamps (CFL). 20 Of the total number of
micro-enterprises, 52 of them used CFLs, a 93% success rate; most of them leap-
frogged the technology and never used incandescent bulbs. It is the hope that LED
lamps will eventually replace the CFL due to their low energy consumption.
20A compact fluorescent lamp (CFL), also known as a compact fluorescent light or energy saving light (or lesscommonly as a compact fluorescent tube), is a type of fluorescent lamp. Many CFLs are designed to replace anincandescent lamp and can fit into most existing light fixtures formerly used for incandescents. Compared to generalservice incandescent lamps giving the same amount of visible light, CFLs use less power and have a longer rated life.In the United States, a CFL has a higher purchase price than an incandescent lamp, but can save over in electricitycosts over the lamp’s life time. CFLs radiate a different light spectrum from that of incandescent lamps. Improvedphosphor formulations have improved the subjective color of the light emitted by CFLs such that some sources ratethe best ’soft white’ CFLs as subjectively similar in color to standard incandescent lamps. [Phillips, 2007]

61
3.4 The Economic Approach
Although we know that electricity problems are multidimensional, one critical
unifying thread runs through all the proposed solutions - the economic factor. In
many cases, when examining the case of the micro-enterprise in relation to access to
electricity and the provision of electricity services, economic factors are at the heart
of the decisions that at first sight appear non-economic. Underlying realities are
surely mirrored in the decision that emerges from the methods to access electricity.
The sociological character of the micro-enterprise and the entrepreneur also reflects
the economic factors, whether they have the capacity-to-pay, the environmental con-
ditions, possibilities of increased income and the adaptation of technology by the
entrepreneur.
One of the principal achievements of economics has been in the development of
a particular way of looking at the world and analyzing economic phenomena. The
embodiment of this approach is theoretical economics. Methodologically, there is a
great deal of commonality in the way economists approach problems even though
their conclusions may differ. The theoretical models of economics have been studied
for many years but it is important to note that from this study, output of a theoretical
model is not reality and most basic economic models are difficult to apply due to
several barriers as will be discussed in Chapter 4. Due to this fact, forecasting
becomes a highly uncertain task as most of the entrepreneurs live on a day-to-day
basis. 21 Validation of economic models by testing them against the measuring
rod of the real world empirical data proves to be difficult because the entrepreneurs
understanding of economics is limited and most operational costs are factored in
with several other social factors, making it complex to define the variables.21The differences between day-to-day life in developing countries and the U.S. are huge and can be very difficult
for us to comprehend. Virtually everything what people own, what they do for a living, what they do in their leisuretime, what they expect out of life for themselves and their children, the way they think about themselves and others,the things they take for granted, and more differs dramatically in rural Uganda versus a typical U.S. neighborhood.Most of the developing world’s population are living in extreme economic poverty defined as living on less than$1.25 per day; thus planning for the future becomes a concept not easily understood. They mainly live on the basisof what I make today decides what I invest in tomorrow.

62
3.4.1 Cost of Accessing Electricity
Essentially, cost is the burden sustained in order to perform a certain activity,
to carry out a certain production, to achieve certain goals. Total cost is in two
main categories, fixed cost (the part of the budget that stays the same regardless of
whether you produce a lot, a little bit, or even if you produce zero), and variable cost
(the part that varies as you produce more or less. Producing more adds to Variable
Cost. Producing less reduces it) Therefore, it is trivial to calculate to Total Cost,
TC(i) = FC + V C(i) (3.7)
where TC is the total cost, FC is the fixed cost, VC is the variable cost and i is the
variable for production.
In this study, the basic costs are categorized as follows:22
Cost Item Cost Category
Electricity Generating Equipment FixedElectricity Appliances FixedGoods/Services in sales VariableSpace (if rented) FixedSpace (if owned) NoneFuel/Charge VariableTransportation Variable
Table 3.8: Basic costs as viewed from the entrepreneurs perspective
There are many ways in which electricity has influenced growth in Africa. In
this study, data from the sample shows that the two categories of micro-enterprises
were common across all the towns interviewed: Cellphone Charging Stations 23 and
General Stores 24.22The cost calculations in this study are very similar to the basic costs that a family-run small shop pays in the
U.S.23Much of Uganda’s population is not served by landlines ( 100k telephones for a population of over 30 million) and
likely not be in the foreseeable future.Todays obvious choice for network deployment is wireless mobile networks. Asingle base station (which itself requires several kW) can provide coverage over 60km if the terrain allows. This resultsin mobile phone coverage in areas without grid electricity. The mobile phones are charged at stalls on the street.Essentially, you deposit your phone with the stall holder in exchange for a receipt detailing the unique identificationnumbers of both the phone and the battery, the phone is locked in the cupboard and after several hours can becollected fully charged.
24General Stores, often referred to as ’duka’, a Swahili word for shop, are establishments that sell general merchan-dise needed by the locals on a daily basis. You find a range of items such as soap, milk, bread, sodas, candy, snacks,candles, mostly non-perishable goods. Usually, they also serve the purpose of the entrepreneurs home. Typically,they will take one room and stock it with some items, open the window and conduct business through the window.

63
Distinctive electricity access choices can be observed through analysis of both the
categories. Much has been written about the cellphone revolution sweeping Africa
and its potential to spur development. Uganda’s ICT 25 Minister states that the
number of wireless subscribers rose to 8.2 million at the end of 2008. The mobile
penetration stood at around 25% [UBS, 2009]. Despite the growth in subscribers,
there has not been an equivalent growth in access to electricity, thus the case for
cellphone charging stations almost in every town. 26
Town Equipment Fuel Costa Transportation Cost Frequencyb
Bigodi Solar PV 0 0 0Bishese Diesel Gen. 25000 8000 2Ibanda Battery 12000 6000 3Kabujogera Battery 4000 2000 1Kahunge Battery 9000 4500 3Kichwamba Battery 5000 1000c 2Kihura Battery 3500 2500 1Kyakatara Battery 7000 1500 1Kyegegwa Battery 7000 0d 2Kyenjonjo Battery 10000 4000 4Rwehamba Battery 9000 3000 3a While the amount of fuel consumed in liters was not given, it is easy to calculate it using theapproximate costs of fuel.
b Frequency here is determined on a weekly basisc Entrepreneur indicated that they often send a family member to walk the battery to the chargingplace and only estimates paying for the transportation maybe once a week
d There is a battery charging station within a very short walking distance
Table 3.9: Distribution of Cellphone Charging Stations showing each town and the associated costsof accessing electricity. The figures in the tables are estimates given by the entrepreneurs, somehave accurate numbers that they document, while others just gave an estimate off the top of theirhead.
The general stores have approximately the same costs for access as the cellphone
charging stations, especially for those using battery systems. 27 The question of
operating costs such as wages, maintenance of equipment, advertising and the like
is not addressed in this research because the data is difficult to attain for micro-
enterprises. Most of the micro-enterprises hardly keep any records of expenses they
incur, bookkeeping being a somewhat foreign concept.25Information and Communication Technologies26The costs indicated in the table are all in UGX (Uganda Shillings). See preface for exchange rates.27Some important data to note: Petrol: 1L = UGX 3000; Diesel: 1L = UGX 2800. The prices in the rural areas
are increased because the vendors are not actual petrol stations, just those acting as middle men.
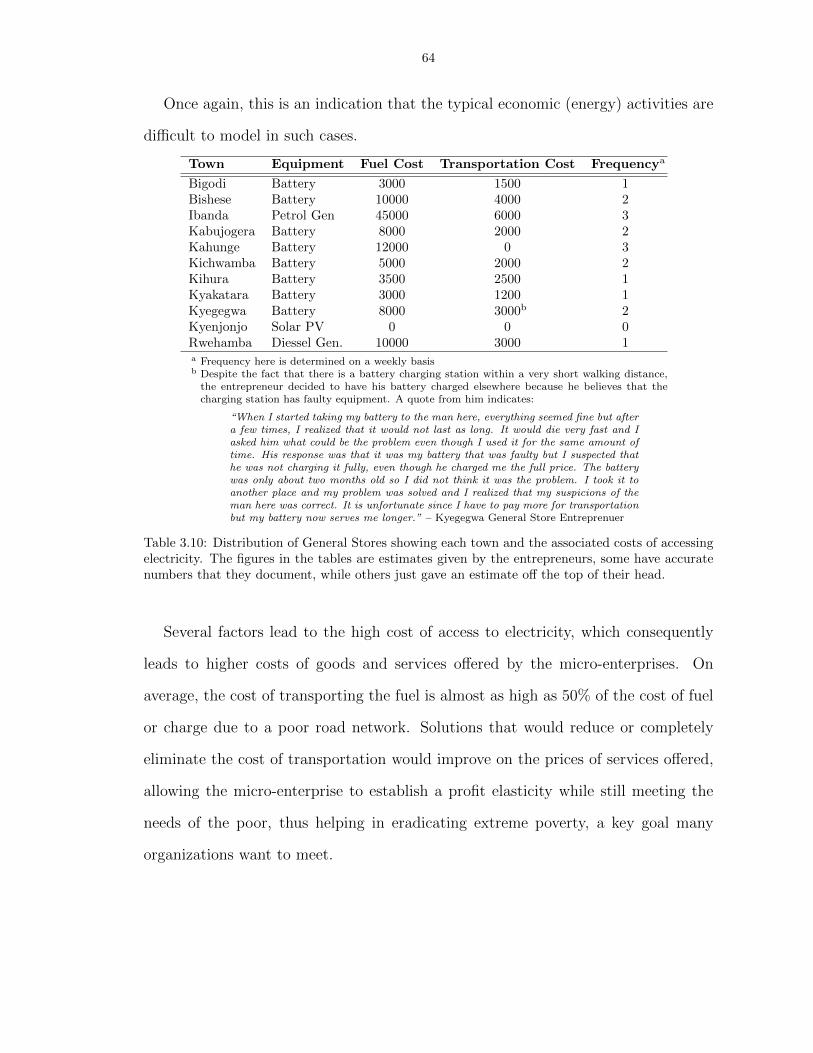
64
Once again, this is an indication that the typical economic (energy) activities are
difficult to model in such cases.
Town Equipment Fuel Cost Transportation Cost Frequencya
Bigodi Battery 3000 1500 1Bishese Battery 10000 4000 2Ibanda Petrol Gen 45000 6000 3Kabujogera Battery 8000 2000 2Kahunge Battery 12000 0 3Kichwamba Battery 5000 2000 2Kihura Battery 3500 2500 1Kyakatara Battery 3000 1200 1Kyegegwa Battery 8000 3000b 2Kyenjonjo Solar PV 0 0 0Rwehamba Diessel Gen. 10000 3000 1a Frequency here is determined on a weekly basisb Despite the fact that there is a battery charging station within a very short walking distance,the entrepreneur decided to have his battery charged elsewhere because he believes that thecharging station has faulty equipment. A quote from him indicates:
“When I started taking my battery to the man here, everything seemed fine but after
a few times, I realized that it would not last as long. It would die very fast and I
asked him what could be the problem even though I used it for the same amount of
time. His response was that it was my battery that was faulty but I suspected that
he was not charging it fully, even though he charged me the full price. The battery
was only about two months old so I did not think it was the problem. I took it to
another place and my problem was solved and I realized that my suspicions of the
man here was correct. It is unfortunate since I have to pay more for transportation
but my battery now serves me longer.” – Kyegegwa General Store Entreprenuer
Table 3.10: Distribution of General Stores showing each town and the associated costs of accessingelectricity. The figures in the tables are estimates given by the entrepreneurs, some have accuratenumbers that they document, while others just gave an estimate off the top of their head.
Several factors lead to the high cost of access to electricity, which consequently
leads to higher costs of goods and services offered by the micro-enterprises. On
average, the cost of transporting the fuel is almost as high as 50% of the cost of fuel
or charge due to a poor road network. Solutions that would reduce or completely
eliminate the cost of transportation would improve on the prices of services offered,
allowing the micro-enterprise to establish a profit elasticity while still meeting the
needs of the poor, thus helping in eradicating extreme poverty, a key goal many
organizations want to meet.
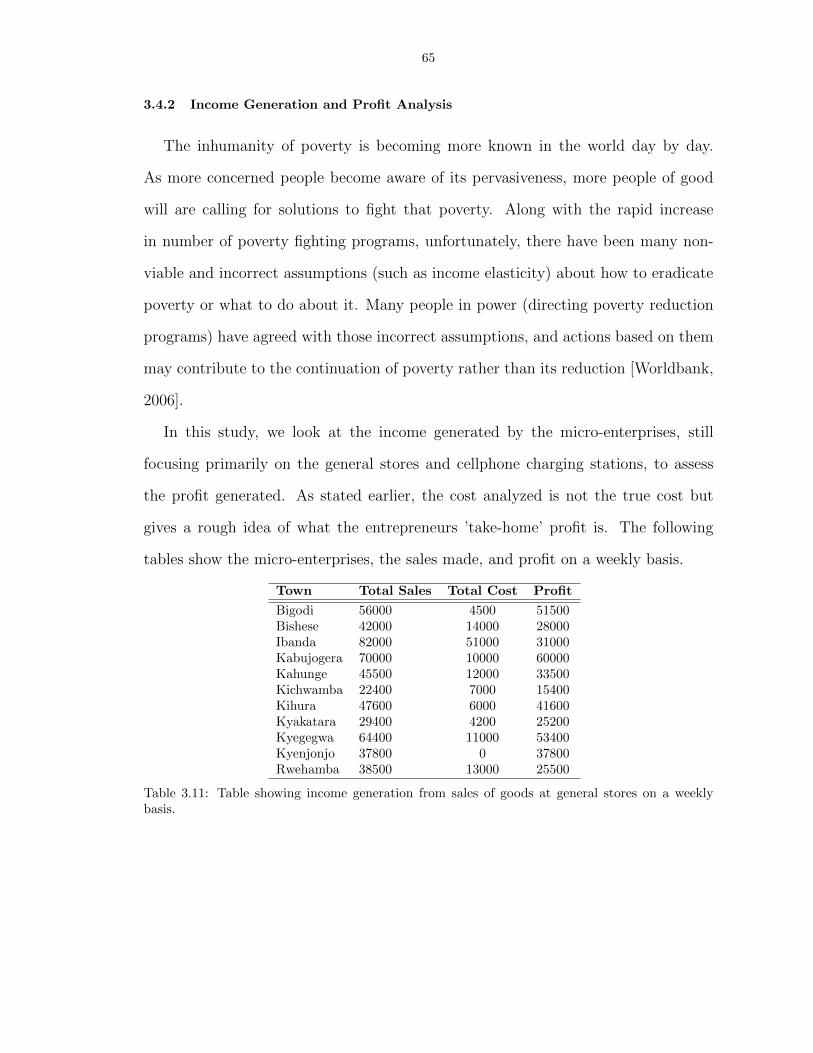
65
3.4.2 Income Generation and Profit Analysis
The inhumanity of poverty is becoming more known in the world day by day.
As more concerned people become aware of its pervasiveness, more people of good
will are calling for solutions to fight that poverty. Along with the rapid increase
in number of poverty fighting programs, unfortunately, there have been many non-
viable and incorrect assumptions (such as income elasticity) about how to eradicate
poverty or what to do about it. Many people in power (directing poverty reduction
programs) have agreed with those incorrect assumptions, and actions based on them
may contribute to the continuation of poverty rather than its reduction [Worldbank,
2006].
In this study, we look at the income generated by the micro-enterprises, still
focusing primarily on the general stores and cellphone charging stations, to assess
the profit generated. As stated earlier, the cost analyzed is not the true cost but
gives a rough idea of what the entrepreneurs ’take-home’ profit is. The following
tables show the micro-enterprises, the sales made, and profit on a weekly basis.
Town Total Sales Total Cost Profit
Bigodi 56000 4500 51500Bishese 42000 14000 28000Ibanda 82000 51000 31000Kabujogera 70000 10000 60000Kahunge 45500 12000 33500Kichwamba 22400 7000 15400Kihura 47600 6000 41600Kyakatara 29400 4200 25200Kyegegwa 64400 11000 53400Kyenjonjo 37800 0 37800Rwehamba 38500 13000 25500
Table 3.11: Table showing income generation from sales of goods at general stores on a weeklybasis.
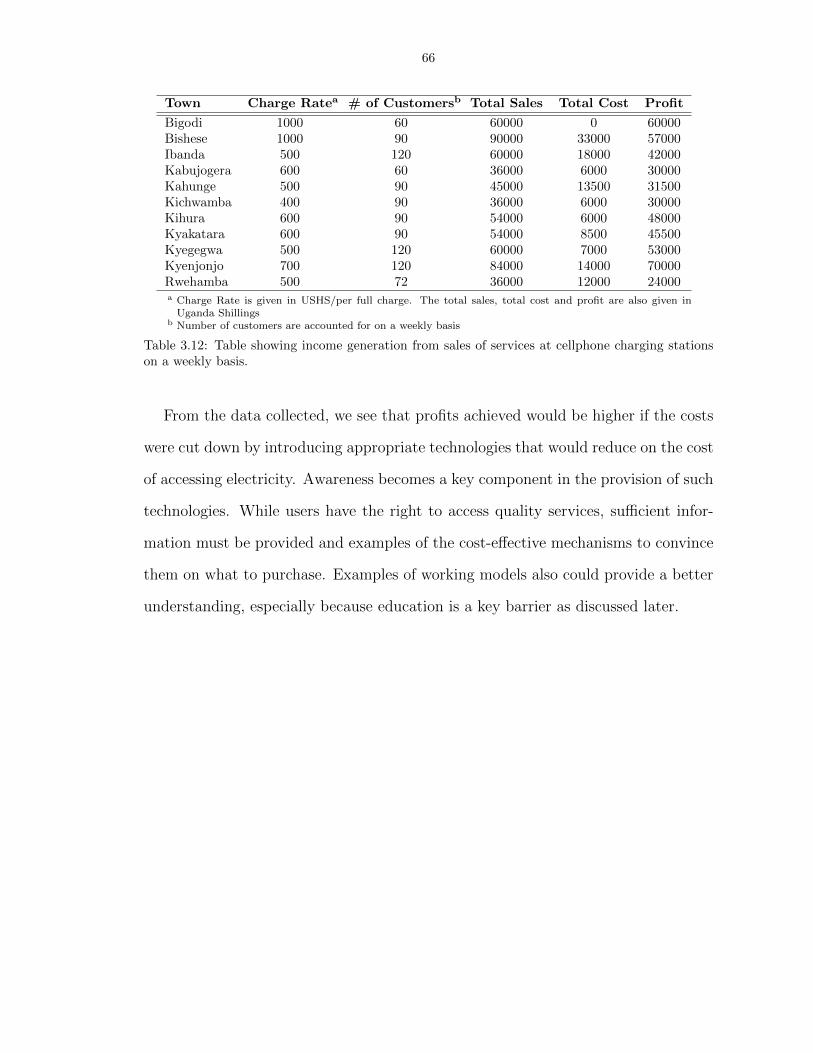
66
Town Charge Ratea # of Customersb Total Sales Total Cost Profit
Bigodi 1000 60 60000 0 60000Bishese 1000 90 90000 33000 57000Ibanda 500 120 60000 18000 42000Kabujogera 600 60 36000 6000 30000Kahunge 500 90 45000 13500 31500Kichwamba 400 90 36000 6000 30000Kihura 600 90 54000 6000 48000Kyakatara 600 90 54000 8500 45500Kyegegwa 500 120 60000 7000 53000Kyenjonjo 700 120 84000 14000 70000Rwehamba 500 72 36000 12000 24000a Charge Rate is given in USHS/per full charge. The total sales, total cost and profit are also given inUganda Shillings
b Number of customers are accounted for on a weekly basis
Table 3.12: Table showing income generation from sales of services at cellphone charging stationson a weekly basis.
From the data collected, we see that profits achieved would be higher if the costs
were cut down by introducing appropriate technologies that would reduce on the cost
of accessing electricity. Awareness becomes a key component in the provision of such
technologies. While users have the right to access quality services, sufficient infor-
mation must be provided and examples of the cost-effective mechanisms to convince
them on what to purchase. Examples of working models also could provide a better
understanding, especially because education is a key barrier as discussed later.

67
3.5 Impacts of Access to Electricity on the Micro-Enterprises
Production is the process of combining inputs to make outputs. While we do
not focus on production in the context of manufacturing or the like, it is impor-
tant to consider that a micro-enterprise is an organization, owned and operated by
private individuals (entrepreneurs), that specializes in production. Essentially, an
entrepreneur will have inputs, where they receive some kind of goods or tangible
product that can be used to generate a service, sells its output to customers and
receives revenue in return. Understanding the process from the inputs to attaining
revenue gives a good perspective as to the impacts of access to electricity. Figure
3.12 shows what the ideal environment, operation and flow of the micro-enterprises
should be, showing the access to electricity and its impacts.
Figure 3.12: Ideal environment, operation and flow of the micro-enterprises should be showing theaccess to electricity and its impacts

68
As in most systems, ideal configurations hardly function as expected and this is the
case with the micro-enterprises interviewed. Success of policies to assist development
of the micro-enterprise sector will have to consider the actual performance of the
business and how to resolve the areas that are not functioning ideally. Figure 3.13
shows what the actual performance of the micro-enterprises was.
Figure 3.13: Actual environment, operation and flow of the micro-enterprises should be showingthe access to electricity and its impacts
Diffusion theory 28 shows a pattern of diffusion starting with adoption of a new
technology by so-called innovators, followed by a period of fast diffusion where the28The diffusion theory, also known as the diffusion of innovations theory, is a theory concerning the spread of inno-
vation, ideas, and technology through a culture or cultures. The theory has been extensively studied by sociologists,psychologists, and anthropologists. Diffusion theory states that there are many qualities in different people thatcause them to accept or not to accept an innovation. There are also many qualities of innovations that can causepeople to readily accept them or to resist them. According to diffusion theory, there are five stages to the process ofadopting an innovation. The first stage is knowledge, in which an individual becomes aware of an innovation but hasno information about it. Next is persuasion, in which the individual becomes actively interested in seeking knowledgeabout the innovation. In the third stage, decision, the individual weighs the advantages and disadvantages of theinnovation and decides whether or not to adopt it.After the decision comes implementation, in which the individualactually does adopt and use the innovation. Confirmation is the final stage. After making adopting the innovation,the individual makes a final decision about whether or not to continue using it based on his own personal experiencewith it [Hall and Lieberman, 2006].

69
innovation catches on, and finally a period of low growth as the group of so- called
laggards finally adopt the technology. In this study, we consider the diffusion theory
to look at how many micro-enterprises recognize the impacts of access to electric-
ity and the influence it has on their micro-enterprise. The overviews and specific
examples in Chapter 3 indicate that adoption of electricity generating equipment
and appliances is not 100%. Therefore, it appears that the diffusion process is still
ongoing, or will not reach 100%. According to a diffusion perspective, once energy
infrastructure is in place, it may be mainly a matter of time for the modern energy
carriers and appliances to diffuse. For the analysis of impacts of electricity over
time, it is necessary to have insight into the time span since the electricity supply
became available. However, the fieldwork shows that it is not easy to demarcate the
timing of introduction and also longer periods are needed to show full impacts on
the micro-enterprise.
The following analysis will give an indication on the time dimension of the adop-
tion process as it is taking place in the research area.29
Town Visit 1 Visit 2 Visit 3 Visit 4 Average
Bigodi * 10 7 12 11 10Bishese 15 15 20 10 15Ibanda * 15 15 22 28 20Kabujogera 10 5 15 10 10Kahunge * 10 10 20 20 15Kichwamba 15 15 15 15 15Kihura 15 12 15 18 15Kyakatara 15 15 15 15 15Kyegegwa * 20 20 20 20 20Kyenjonjo 10 20 22 28 20Rwehamba 10 8 15 15 12* The cellphone charging station interviewed in this town increased their ca-pacity by purchasing an additional battery thus avoiding down times whenthey cannot get the battery charged in a day or less.
Table 3.13: Table showing approximate number of customers during each visit.
29The visits correspond to the following dates: Visit 1: May 2008; Visit 2: October-November 2008; Visit 3:April-June 2009; Visit 4: October-December 2009

70
Figure 3.14: Daily number of customers for the Cellphone Charging Stations showing growth inthose that increased their access to electricity
As shown in both table 3.13 and figure 3.14, there is a marginal increase in the
number of customers for those that increased or improved their electricity access
compared to those that did not. While the thought of an increase of 3 customers
may not seem significant, it is important to note that the daily incomes are generally
low and therefore an increase, as low as it may seem, turns out to be an important
growth for the micro-enterprise.

CHAPTER IV
Barriers to Electricity Access
4.1 Introduction
There are about 1.6 billion people in developing countries without access to grid
electricity and 2.5 billion people who are dependent on traditional biomass fuels for
cooking and heating [IEA, 2002]. This severely limits their development possibilities
and may negatively impact their health. Rural development is an integral part of
national development policy in these countries. Building basic rural infrastructure
and improving transportation and access to markets is vital. Decentralized energy
systems can improve the availability, particularly to the poor, of reliable, affordable,
economically viable, socially acceptable and environmentally sound energy.
There is no universally applicable prescription to the problem of access to off-grid
electricity in rural areas. Lack of access to electricity and rural poverty are closely
correlated. Not only is electricity a pre-requisite for ameliorating living standards, it
is also an indispensable input for productive and economic activities. For rural popu-
lations, the positive impacts of electricity inputs for basic activities such as pumping
water for drinking and irrigation; lighting for extending working and learning hours;
and powering small-scale rural industry have considerably great socioeconomic ben-
efits
71

72
Lack of access to information has been manifested by end users and decision-
makers alike. In India, for example, knowledge about various renewable energy tech-
nologies has at times proved a considerable barrier in the implementation of off-grid
electrification and energy technology programs [Chaurey et al, 2004]. Policy makers
are not always aware about the costs and savings of alternative energy technologies
while the micro-enterprise owners also have low awareness levels. 30 There is also lack
of knowledge on appropriate policies that are required for the penetration of energy
technologies. Thus, an important barrier to overcome when establishing alternative
solutions in areas with available resources is the dissemination of information among
decision/policy makers and final users of off-grid electricity.
This chapter characterizes the main barriers that have negative impacts on off-
grid electricity access to low-income consumers in rural areas of western Uganda.
Low consumption per unit significantly reduces the recovery period for initial in-
vestments. 31 This is aggravated in the case of rural markets by high dispersion,
which requires higher initial investments. This situation has become more serious
after the privatization process, which maximizes the value of assets to be sold and to
minimize obligations to future concessionaires. Once private distribution companies
are in place, weaknesses in the framework become evident. In particular there is a
lack of incentives and obligations to implement off-grid electricity access ventures to
improve and sustain access to electricity to low-income consumers. Also discussed
are the difficulties related serving the low income and the typical domino-effect 32 it
has on the community.
30Several entrepreneurs indicated that they were not aware of newer technologies that could cut down on theircost of accessing electricity.
31The recovery period is marked by rising sales and production, improved consumer confidence, and in many cases,rising interest rates. This is the period that would take for the investment to repay itself.
32Domino effect is a chain reaction that occurs when a small change causes a similar change nearby, which thenwill cause another similar change, and so on in linear sequence. The term is used as an analogy to a falling row ofdominoes. It typically refers to a linked sequence of events where time between successive events is small.

73
4.2 Access to Capital and Financial Support
Global poverty exists today at a startling scale; while the exact numbers are
debated, some estimate that four billion people worldwide live on less than two
dollars a day [Prahalad, 2002]. According to Prahalad and Hart, profitable corpo-
rations should not ignore these traditionally overlooked people, collectively dubbed
the ”Bottom of the Pyramid” 33 because of their considerable combined purchasing
power. Thus, if companies are innovative enough to create or tailor their products
to the economic realities and life needs of these people, a significant profit can be
won. At the same time, this groups entry into the market would hopefully better
their quality of life and aid in regional economic development.
As a consequence of technological change, globalization and market integration
in the micro-enterprise sector of the rural economy has become notably important.
High poverty rates have resulted in increasing pressure to diversify production into
value-adding, market-oriented products and the development of alternative sources
of income. Capturing the benefit of globalization calls for a competitive, market
oriented production and service. Profitability is further limited by lack of working
capital and very basic entrepreneurial skills. This is partly explained by the fact
that off-grid solutions in developing countries often have to involve small companies
that are prepared to serve small rural markets; evidently, the lower the average firm
size, the more easily it gets into financial difficulties and the less the likelihood of it
having access to private funding at favorable terms.
The lack of financial capital has broad implications for micro-enterprise growth
as well as the effectiveness of other input factors. Standard growth theories have
explored the importance of input factors such as capital and labor in the production
function of firms and countries. At the micro level empirical studies have estimated33In economics, the bottom of the pyramid is the largest, but poorest socio-economic group. In global terms, this
is the 4 billion people who live on less than $ 2 per day [Prahalad, 2002]. The phrase bottom of the pyramid is usedin particular by people developing new models of doing business that deliberately target that demographic, oftenusing new technology.

74
the impact of access to finance for capital constrained micro-enterprises [Suresh et
al, 2008; Barnejee et al, 2009; Karlan et al, 2009]
Access to financial capital is a rather obvious input in business development.
However, response from the interviews in this research shows is that it is not sim-
ply a matter of providing micro-credit to enterprises for rural development to take
off, with the use of electric appliances. One aspect of this is that the objective of
entrepreneurs in rural areas is not necessarily growth of enterprises, and that if in-
vestments were made, priorities would be in goods or in the building rather than
in electric appliances [Sologuren, 2006]. Secondly, the cost of some of the equip-
ment to operate on off-grid electricity (such as more advanced carpentry machines
or grain mills for larger than village scale operation) is beyond the level of micro-
credit. This implies that microcredit, the commonly promoted financial instrument
to promote enterprise establishment and enterprise upgrading, is insufficient for the
entrepreneurs who typically cannot access mainstream credit infrastructure to move
beyond small scale appliances. A third limitation of formal credit infrastructures is
that they often do not match the way rural entrepreneurs work (especially in informal
enterprises), their attitudes to borrowing money and their motivations for running a
business. Although micro-credit schemes are available, entrepreneurs prefer to draw
on family sources such as loans from a relative as seen later in this chapter. In
part, providing the right type of financing mechanisms means understanding gender
issues. Rural small scale enterprises are often the domain of women who have dif-
ferent motivations and assets to men which influence their attitudes to and capacity
for borrowing money. Understanding these aspects will ensure that micro-credit is
targeted appropriately.
In Uganda, inequities cut across, gender, socio-economic and tribal groups and
are reflected in the poor micro-enterprises using less energy than the wealthier ones,
the latter having more choices and capacity to afford better electricity generating

75
equipment and appliances, which often translates in savings per unit of electricity
consumed. From the data collected, we see that 62% of the fifty-six micro-enterprises
purchased used electricity generating equipment compared to 38% who purchased
them as new.
Figure 4.1: Distribution of the State of Electricity Generating Equipment at the Time of PurchaseAmong the Micro-Enterprises
While the private sector is a key player in financing energy for development, it
is essential to remember that conventional private investors focusing on maximizing
returns would hardly be attracted to the idea of providing access to electricity to the
poor - unless subsidies or other financial incentives are in place and clear policies are
set in advance. Therefore, besides the existing funding mechanisms, other innovative
mechanisms are required which can attract different sources of capital targeted to
meeting the needs of the poor and don’t stress the economies of the area even further.

76
The funding mechanisms revealed through the interviews included the following:
• Personal Savings: Defined as income not used for current consumption. A se-
rious problem confronting many developing countries is the savings gap, which
essentially means that these countries find it difficult to finance investments
needed for growth from domestic saving. Since saving depends on income, low
levels of income that characterize developing countries translate into low lev-
els of saving. Moreover, in developing countries, the majority of the people
are poor and the distribution of income is skewed in favor of a small group of
businessmen, workers in the government bureaucracies, and the elite whose con-
sumption behavior tends to mimic the consumption behavior of their Western
counterparts [Miracle, 1973]. Interviews from this research indicate that there
are deleterious effects of low income on saving, therefore, there is difficultly in
purchasing of equipment or appliances due to the lack of finances.
• Loans from Family/Friends: Person-to-person lending (social lending) is, in
its broadest sense, the name given to a certain breed of financial transaction
(primarily lending and borrowing, though other more complicated transactions
can be facilitated) which occurs directly between individuals without the inter-
mediation of a traditional financial institution. The ”family and friend” model
concentrates on borrowers and lenders who already know one another, as with
two (or more) friends or business colleagues formalizing a personal loan. The
family and friend model emphasizes collaboration, loan formalization and ser-
vicing. In Uganda, it is a common practice, especially due to the fact that most
of the villages are comprised of a few big families and trust relationships strong
with the fear of one being ’ex-communicated’ 34 from the family.
34Ex-communication is a religious censure used to deprive or suspend membership in a religious community. Theword literally means putting someone out of communion. We use the same definition in regards to someone beingput out of the village.

77
• Bank Loan: Commercial banks in Uganda have shunned lending to micro-
enterprises for a long time and there is limited expertise in the industry to make
a good assessment when it comes to micro-enterprises. Issues like availability
of market for the product or even the ability of the micro-enterprise to sustain
quality production and meet orders after getting the loan are often difficult for
the bank to assess. When faced with unanswered questions or given answers
that cannot be verified, the bank will not give a loan. From the bank’s point of
view, any loan given is a business transaction which has fit into a tight system
of evaluation before being disbursed. For a banker to make a valid assessment
for a small business loan, it is necessary that he or she understands the micro-
enterprise the same way the entrepreneur does. This is not easy and most
micro-enterprises miss loans they deserve because bankers fail to understand
their businesses. A small number of entrepreneurs in the case study have access
to bank loans, primarily due to the lack of collateral and also inability to create
a solid and promising business plan. 35
• Micro-Finance Institution Loan: By definition, micro-finance means mak-
ing very small loans to people who need business capital but can’t qualify
through banks. These loans are typically less than $500 and might be used
to purchase a battery or a small generator. Micro-finance is not a long-term
funding option for entrepreneurs and can be considered more as ”lenders of last
resort” - and it is not an alternative to private equity or ’angel money’. 36 Effec-
tive delivery of micro-financial services is challenging under any circumstance.
Due to the fact that the loans are typically in such small amounts, collateral35While banks may seem extremely difficult to obtain a loan for a micro-enterprise startup or development, a
few banks have reviewed their processes and methods of allocating loans with goals of reaching the common man.Two banks that were interviewed were Equity Bank and Kenya Commercial Bank, both in Fort Portal. Both bankshave special loans promoting micro-enterprises, especially women-owned businesses. This is following in the modelestablished by Muhammad Yunus and the Grameen Bank in which they made efforts to create economic and socialdevelopment from below, liberating those who could not receive any kind of loan. They show that lending to womenhad a 99% payback rate and society developed [Yunus, 2005].
36Angel money is funds provided by an affluent individual for a business start-up, usually in exchange for convertibledebt or ownership equity.

78
is not much of a condition expected and most of the borrowers do not have
collateral. Other factors that face the borrowers are such that they do not have
formalized documents showing ownership of land, but the micro-financing insti-
tutions tend to work with them because of different relationships established in
the community. The disadvantage of the micro-finance loans is that the interest
is typically high, at times up to 40% and payback period is short, thus making
the entrepreneur focus all the income on paying back the loan.
• Donations: While donations may be viewed from different perspectives, it
is one of the strong supporting arms of most micro-enterprises. Obtaining a
generator in Uganda may be anywhere from about $80, which in most cases
is very expensive for entrepreneurs but not a costly gift from a tourist. Many
entrepreneurs have attempted this as a strategy in obtaining equipment and
appliances. In some aspects, it complicates things because it is hard to assign
a value to an item given and unsure whether it was purchased new or used.
A brief interview with the managing director of Umeme Limited 37, Uganda’s
electricity distribution company, shows the importance of small donations to
the micro-enterprises:
Q: “In regards to short-term solutions for those in the rural areas, what
do you think can be done in assisting them?”
A: “The only thing that is suitable for such a case is individual invest-
ment on the small-scale electricity generation. A solar panel installed at
a small business can create great impact and generate more income for
the owner. They have to attempt to acquire capital from banks or micro-37Umeme is Uganda’s grid-electricity distribution company under the regulation of the Electricity Regulation
Authority (ERA). Currently, there are approximately 2M customers through out the country with infrastructureinstalled through most of the main cities in Uganda. In 2009 Umeme has invested approximately USD 30M inexpanding the infrastructure through out the country. Umeme is wholly owned by the Commonwealth DevelopmentCorporation (CDC) of the United Kingdom. CDC is a UK government-owned company, based in the United Kingdom,with investment assets mainly in the emerging markets of Africa, Asia, Latin America. It has an asset base of USD4B of which approximately 8% is currently in the energy sector. Umeme is its first investment in the distribution endof the power sector but is actively pursuing acquisitions seeking to increase its investments in the emerging markets.

79
financing companies. Individual donors at small amounts can also con-
tribute in making this a success. For example, one giving USD100 to a
small business owner can assist in the purchase of a 30W solar panel,
battery and installation costs. That is roughly USH 200,000. That goes
a long way for them. I dont encourage the giving of money, because its
not always used in the right ways; I encourage one to go and purchase
the equipment for the business owner, thus once knows it was put into
good use. I also encourage that full amounts are not given. Have the
person pay a portion of it. It gives them a sense of ownership. Utility
companies are more interested in the long-term benefits so we dont play
a role as much for the short-term solutions. The solutions that you are
seeing taking place now are those that were planned years ago.”
In areas where there is grid electricity, current costs for people to access electricity
are pretty high. One has to pay approximately USH 450,000 (USD 225) if there is
no pole close to the micro-enterprise, and USH USD 150,000 (USD 75) if there is
a pole close by, so one only pay for pulling the line. With such costs, most people
without a pole find it hard to get access. The areas covered in this study are not in
close proximity to the grid, but important to note that even if they were, it would
be difficult for most to have access to electricity due to such high costs. Therefore,
funding mechanisms play a major role in decision making on the equipment that will
be purchased. Figure 4.2 shows the distribution of funding mechanisms among the
micro-enterprises interviewed.

80
Figure 4.2: Distribution of Funding Mechanisms Among the Micro-Enterprises
To further understand the issue of capital, we looked at both the Cellphone Charg-
ing Stations and General Store. The important factors to consider are the purchase
status, initial investment and maintenance. Over 60% did not do a regular main-
tenance on the equipment, and applied a theory of waiting till it is broken before
taking it in. The problem with this is that there turns out to be a long wait period
during which they would loose customers. Tables 4.1 and 4.2 show the distribution
of the funding mechanisms through the different towns.

81
Town Equipment Purchase Status Initial Investment Maintenancea
Bigodi Solar PV New Donation NoBishese Diesel Gen. Used Personal Savings NoIbanda Battery Used Personal Savings YesKabujogera Battery Used Donation NoKahunge Battery New Donation YesKichwamba Battery Used Personal Savings YesKihura Battery Used Personal Savings NoKyakatara Battery New Loans from Family/Friends NoKyegegwa Battery New Micro-Finance Loan NoKyenjonjo Battery Used Donation YesRwehamba Battery Used Personal Savings Noa Maintenance here refers to regular servicing of the equipment rather than just the typical repairs once there’s aproblem.
Table 4.1: Distribution of Cellphone Charging Stations showing each town, state of equipment atpurchase, the funding mechanisms and if regular maintenance is conducted or not
Town Equipment Purchase Status Initial Investment Maintenancea
Bigodi Battery Used Personal Savings NoBishese Battery New Loans from Family/Friends NoIbanda Petrol Gen Used Loans from Family/Friends YesKabujogera Battery Used Personal Savings NoKahunge Battery New Donation YesKichwamba Battery Used Loans from Family/Friends NoKihura Battery Used Personal Savings NoKyakatara Battery Used Donation NoKyegegwa Battery Used Loans from Family/Friends YesKyenjonjo Solar PV Used Donation NoRwehamba Diesel Gen. Used Personal Savings Noa Maintenance here refers to regular servicing of the equipment rather than just the typical repairs once there’s aproblem.
Table 4.2: Distribution of General Stores showing each town, state of equipment at purchase, thefunding mechanisms and if regular maintenance is conducted or not

82
Literature and field experience shows that the poor require small amounts of en-
ergy to meet their basic energy needs. While this is clear, access to capital forms
a great barrier to accessing electricity for many and needs to be addressed. World-
wide, economic barriers to electricity access include high initial costs and small-scale
production of equipment to meet the needs of low consumers. Moreover, responding
to the entrepreneurs’ capacity and willingness to pay 38 is essential. High costs of
access to off-grid electricity otherwise serve as an excuse not to provide the electricity-
dependent services. In fact, the capacity and willingness to pay of the entrepreneur
may surprise lending institutions, especially once communities are more educated on
the advantages of using electricity and it’s services. While addressing capital, un-
derstanding capacity and the willingness to pay of the entrepreneurs will help policy
makes and investors in gauging consumption subsidies and the like.
The local financial sector is weak overall, and the banks and other financial inter-
mediaries have no experience with project financing in electrification. The pay-back
period on previous investments corresponded to the two to three years maturity of
the loans [UBS, 2008]. To finance off-grid electricity access projects with long pay-
back periods, where revenue depends on uncertain demand forecasts about the ability
of the entrepreneurs to access electricity in sufficient quantities and at cost-coverage
prices will be considered as a high risk lending activity. Once confidence has been
gained over the years from the successful implementation of electrification projects,
this barrier will be reduced. Initially, there may be need to facilitate financing to
project sponsors.
38Willingness-To-Pay (WTP) is the maximum amount a person would be willing to pay, sacrifice or exchange fora good or service.

83
4.3 Adoption: Equipment and Appliances
The adoption and usage of electricity generating equipment and appliances can
change micro-enterprise processes, and the way people live and work. The technology
adoption lifecycle method describes the adoption or acceptance of a new product or
innovation, according to the demographic and psychological characteristics of defined
adopter groups [Rogers, 1962].
Figure 4.3: A graph of Everett Rogers Technology Adoption Lifecycle model [Rogers, 1962]
While this research does not necessarily consider new products, I probe the en-
trepreneurs to understand how they adopt different technologies in electricity gener-
ation as well as appliances. Lack of access to information has been manifested by the
entrepreneurs showing indications of a lack of understanding on the benefits of newer
technologies and the savings in expenses for electricity generation. Since a high per-
centage of the micro-enterprises purchase used equipment and appliances (see figure
4.1), inappropriate technology choices were evident through the case study. There is
poor effort in selecting technologies that will best fit the need of the micro-enterprise,
and the training and ability to understand the maintenance needs lacks thereof. Ta-
ble 4.3 shows the distribution of the micro-enterprises based on two main categories
that assist in the decision making of the purchase.

84
Decision Making Influencea Number of Micro-Enterprises
Purchase After Research Done 18Purchase Based on Recommendation 38a While this is the information collected during the interviews, in is unclear if all theentrepreneurs were aware as to how they came around to a decision in purchasing.It isdifficult to completely distinguish if the understanding of researching a product priorto purchasing was done. As noted earlier, this is a preliminary study and more datawould need to be collected for verification.
Table 4.3: Distribution of micro-enterprises based on the decision making for purchase
An issue of trust became evident in discussions with the entrepreneurs. It was clear
that many would prefer to purchase an item that someone else recommends rather
than actually investigating what the need is and how the equipment or appliance
will fit the needs of the micro-enterprise. There is a strong push by the sales people
to develop trust in a community and sell the technologies to the locals. Some of the
sales people also have collaborations with local micro-financing institutions to help
the entrepreneurs purchase expensive equipment. The following quotes from some of
the entrepreneurs show how adoption of technology is slow and does not necessarily
follow the model described by Rogers in this case.
To address the barriers relating to inappropriate technologies, several financing
institutions could ensure that they can assist the entrepreneurs in selecting the right
product to meet the needs. A critical influence will also have to come from those
selling the products to assist the buyers on what they actually need. A final, and
yet very important intervention has to come from the education of the entrepreneur,
another barrier to electricity access as discussed in section 4.5.

85
4.4 Infrastructure and Weather Constraints
Uganda lags well behind many other developing regions in access to infrastructure
services [UN, 2008]. Limited gains made in the 1990s continued in the early 2000s,
and there is now clear evidence that many countries are failing to expand services
fast enough to keep up with rapid demographic growth and even faster urbanization
[Banerjee, 2008] If present trends prevail, Uganda is likely to fall even further behind
other developing regions, delaying much needed development.
Access to infrastructure services 39 is limited in Uganda. Access to improved roads
is impaired with lack of proper development planning and distribution of funds to
reach the very poor. From tables 3.9 and 3.10, information on the cellphone charging
stations and general stores, we see that over 50% of the costs of accessing electricity
are spent on transportation. Typically, the distance will be approximately 6-10km
of total travel, of which some times they have to walk or ride a bicycle to get the
battery to the charging station or purchase fuel for example.
Driving in Uganda is a wonderful experience full of stunning landscapes and often
quiet roads that can really be enjoyed. As long as you are properly prepared and
have taken the time to learn the local road rules 40 Driving on ‘murram’ 41 roads
is challenging and requires additional skills when compared to sealed or ’tarmac’
roads. While a certain trip, say 10 km would average a few minutes, depending on
the state of the road, such a trip could even last as long as 45 minutes because of
the need to drive at very slow speeds and avoiding potholes. For such reasons, the39In this research, I only consider the term infrastructure to be defined as the road system and how it affects
transportation, one of the key components in electricity access for most of the micro-enterprises.40While we would expect typical road rules to be those that accommodate for the all drivers, the experience proves
to be different and understand signals even makes one appreciate traffic laws in developed nations. A good example,learned from experience, is the turning on your indicator while another car is approaching you, this enables them togauge how far you are on your side, typically because there are not demarkations on the road
41In Africa and parts of Asia, laterite soils are used to build dirt roads. However laterite, called murram in EastAfrica, varies considerably in the proportion of stones (which are usually very small) to earth and sand. It rangesfrom a hard gravel to a softer earth embedded with small stones. Not all laterite and murram roads are thereforestrictly gravel roads. Laterite and murram which contains a significant proportion of clay becomes very slipperywhen wet, and in the rainy season, it may be difficult even for four-wheel drive vehicles to avoid slipping off verycambered roads into the drainage ditches at the side of the road. As it dries out, such laterite can become very hard,like sun-dried bricks.

86
cost of transporting something from one town to another is usually high and most of
the entrepreneurs indicate that when they need to purchase fuel for example, they
would rather do it at a time when they need to purchase something else from the
other town. This leads to a situation where they may go a day or two without
accessing electricity. Figure 4.4 is an example of what typical transportation in the
area is. While this may seem extreme, such a road is considered as one of the best
and commonly used.
Figure 4.4: An example of good transportation and what would be referred to as a very good road
While we can see that infrastructure can be a barrier to electricity access, weather
goes hand-in-hand as a barrier as well. Situated on the equator, Uganda enjoys a
pleasant and warm climate throughout the year, with plenty of sunshine. Conditions
can vary however, owing to the high altitude of some regions. For example, the
Rwenzori Mountain range - at an altitude of 3,000 m, which is part of the area we
studied, can expect rain throughout the year and evenings can be chilly. The hottest
months are between December and February, with an average daily temperature in
Western Uganda of 29 ◦C. Western Uganda receives approximately 1,500 mm of
rainfall a year and there are two distinct rainy seasons: April - June and October
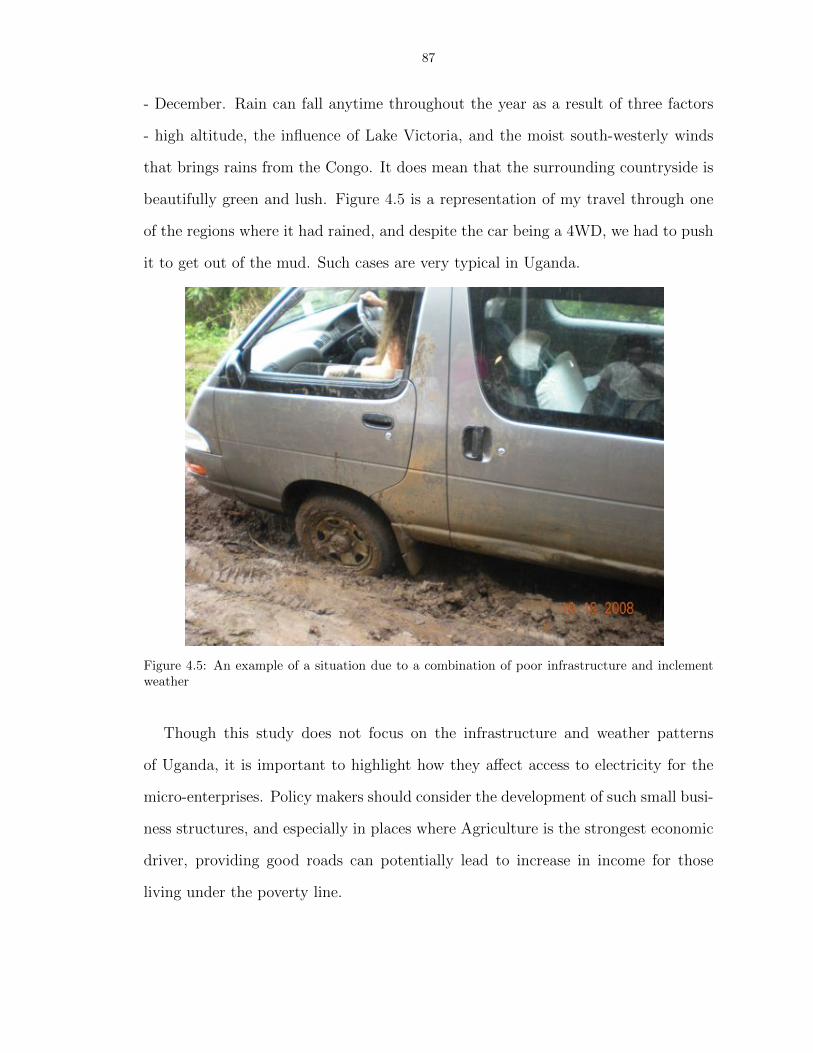
87
- December. Rain can fall anytime throughout the year as a result of three factors
- high altitude, the influence of Lake Victoria, and the moist south-westerly winds
that brings rains from the Congo. It does mean that the surrounding countryside is
beautifully green and lush. Figure 4.5 is a representation of my travel through one
of the regions where it had rained, and despite the car being a 4WD, we had to push
it to get out of the mud. Such cases are very typical in Uganda.
Figure 4.5: An example of a situation due to a combination of poor infrastructure and inclementweather
Though this study does not focus on the infrastructure and weather patterns
of Uganda, it is important to highlight how they affect access to electricity for the
micro-enterprises. Policy makers should consider the development of such small busi-
ness structures, and especially in places where Agriculture is the strongest economic
driver, providing good roads can potentially lead to increase in income for those
living under the poverty line.

88
4.5 Education
Improving access to electricity services is a growing concern for governments in
developing countries, as well as for bilateral donor agencies, international organiza-
tions, and the multilateral development banks. An important part of this mission
is expanding access to electricity services for an estimated two billion people who
still lack such services [World Bank 1996, ESMAP 2000c]. Expanded access to elec-
tricity services is inexorably linked to today’s transforming of the economic sector.
Although ongoing reforms are showing success and being replicated, there is growing
concern about their social and environmental sustainability. One of the key factors
that may lead to this problems is the lack of education for those two billion people.
THE 2002WORLD SUMMIT ON SUSTAINABLE DEvELOPMENT CALLED
ON WORLD LEADERS TO: ”Take joint actions and improve ef-
forts to work together at all levels to improve access to reliable
and affordable energy services for sustainable development suf-
ficient to facilitate the achievement of the Millennium Devel-
opment Goals, including the goal of halving the proportion of
people in poverty by 2015, and as a means to generate other
important services that mitigate poverty, bearing in mind that
access to energy facilitates the eradication of poverty.” 42
Many barriers hamper service providers ability to provide electricity to the rural
poor. Figure 4.6, inspired by the United Nations and the United States Agency
for International Development, shows energy (and in our case we view it directly as
electricity) as the center piece, or the missing link in achieving those development
goals.
42World Summit on Sustainable Development. 2002. ”Plan of Implementation of the World Summit on SustainableDevelopment.” New York: United Nations, p. 5.

89
Powering and Empowering Development: Increasing Access to Electricity in Angola 32
DEVELOPMENT LINKS
Source: U.S. Agency for International Development. For additional information on the link between energy and other development sectors, see: Empowering Development at: http://pdf.usaid.gov/pdf_docs/PNADJ569.PDF
energy
Agriculture
Economic Growth
Democracy and
Governance
Environment
Humanitarian Assistance
Education
Population, Health,
and Nutrition
The Challenge of Peri-Urban ElectrificationImproving the urban poor’s access to energy services is a growing concern for governments in developing countries, as well as for bilateral donor agencies, international organizations, and the multilateral development banks. In 2005, 3.1 billion people lived in urban areas, nearly half of the world’s population.3 By 2025, a projected 4.5 billion people—nearly two-thirds of the world’s population—are expected to live in urban areas. As urbanization rates steadily increase, governments are realizing that providing modern infrastructure services, including electricity, is a high priority. Without electricity, much of this urban population will not be able to keep pace with the changing world and will lack opportunities to increase their skills and education, which will limit their employment opportunities.
THE 2002 WORLD SUMMIT ON SUSTAINABLE DEVELOPMENT CALLED ON WORLD LEADERS TO:
Take joint actions and improve efforts to work together at all levels to improve access to reliable and affordable energy services for sustainable development sufficient to facilitate the achievement of the Millennium Development Goals,
including the goal of halving the proportion of people in poverty by 2015, and as a means to generate other important services that mitigate poverty, bearing in
mind that access to energy facilitates the eradication of poverty.2
Many barriers hamper service providers’
ability to provide electricity to the urban poor.
Access to capital to extend the electricity grid
can be an insurmountable barrier for a cash-
strapped utility or state-owned enterprise
with many competing investment demands.
Distance from the electricity generation source
is sometimes a problem, since the cost of
extending the electricity network to serve far-
flung peri-urban areas may be prohibitive. In
recent years, urban areas have grown quickly
as people move into the cities in search of
employment opportunities. Since these areas
are typically settled in an unplanned, ad hoc
manner, the peri-urban areas (sometimes
called slums) contain elements that can
seriously hamper access to electricity, such
as the lack of a uniform system of street
and property numbering, unclear land and
housing records, and inadequate safeguards
to prevent widespread electricity theft.
ILLEGAL CONNECTIONS. In most urban areas of the
developing world, it is not uncommon to see
snarled and entangled mazes of wires leading
from electricity poles to makeshift and illegal
household electricity connections. This is as
dangerous as it is common. People are injured
regularly, electrocuted while trying to connect
their homes or businesses illegally, or as a result
of fires caused by unsafe connections. Yet,
people are eager to connect to the electricity
network because they want the improved
standard of living that accompanies access to
electricity. Thus, they are willing to take the
safety risk that is part of an illegal connection.
ELECTRICITY THEFT. In addition to direct illegal
connections to the electricity network, illegal
intermediaries sometimes provide electricity in
urban and peri-urban areas. An intermediary
is a person in the neighborhood who has legal
access to electricity from the power company,
but who sells electricity illegally to neighboring
2. World Summit on Sustainable Development. 2002. “Plan of Implementation of the World Summit on Sustainable
Development.” New York: United Nations, p. 5.
3. United Nations. 2006. “World Population Prospects: The 2006 Revision Population Database.” Accessed from http://esa.un.org/unpp/
Figure 4.6: Link between energy and other development sections
Because education is an important part of it, during the interviews, I asked the
entrepreneurs as to their level of education. The response show signs of what can
turn out to be a vicious cycle because lack of electricity in schools (and consequently
at home) leads to an undesired level of education that cannot compete with other
enterprenuers at the same level. In today’s society, where computing is becoming
necessary to achieve productivity, most of the students would not have access to
such exposure and at the point where they may intend on having their own micro-
enterprise, they find it difficult to make educated decisions. Table 4.4 shows the
responses from the entrepreneurs.

90
Level of Education Attaineda English Fluency b Number of Entrepreneurs
Never Attended School 1 7Attended Primary School - Graduated 3 15Attended Primary School - Never Graduated 2 22Attended Secondary School - Graduated 4 4Attended Secondary School - Never Graduated 3 8a Primary School is from P1-P7 (analogous to 1st - 7th grade here in the U.S.). Secondary School is from S1-S6 (analogousto 8th - 12th grade here in the U.S. Uganda still operates under the British ’O’ (Ordinary) and ’A’ (Advanced) levelsystem and typically, not everyone goes to S5-S6 as it is considered somewhat optional. At completion of S4 they doreceive a high school diploma)
b This measurement is an approximation based on how they responded to my questions. English fluency level is dividedinto the following categories: 1 - Poor; 2 - Average; 3 - Above Average; 4 - Native. The measurement is not veryaccurate due to factors like some being shy and afraid that their english is not good enough. It’s a rough idea of wheremost of them would be rated (Uganda was a British Protectorate and therefore English is spoken by many)
Table 4.4: Level of education attained by the entrepreneurs and the english spoken.
It is commonly assumed that education has an important positive effect on eco-
nomic growth, but to date the evidence for this assumption has been surprisingly
weak. Evidence shows that, at the individual level, more years of schooling lead
to higher income [Lutz, 2007]. Even then, empirical evidence relating changes in
education measures to economic growth has so far been ambiguous. From the data
obtained, only 7% of the entrepreneurs graduated from high school. Better educa-
tion leads not only to higher individual income but is also a necessary (although
not always sufficient) precondition for long-term economic growth. To make sound
decision on what kind of equipment and appliances to purchase, sound education
plays a key role and a lack of it is an indication as to why most may not understand
the benefits of certain systems.
Investment in secondary education provides a clear boost to economic develop-
ment, much more than can be achieved by universal primary education alone. Hence,
the current focus of the United Nations Millennium Development Goals on univer-
sal primary education is important but insufficient. Universal primary education
must be complemented with the goal of giving broad segments of the population at
least a completed junior secondary education. While the role of this study is not
to assess the level of education, we realize that it hampers the development of the
micro-enterprises and measure need to be taken in ensuring that despite the level of

91
education, some amount of training is given in methods of electricity access in the
rural areas. Enabling an entrepreneur to understand that despite a high initial cost
of a Solar PV system, the reduction in costs is high and potential increase in income,
reaching a goal of alleviating poverty.
CHAPTER V
Feasible Solutions and Recommendations
5.1 Studies Across the Globe
While this is a preliminary study, with further investigations needed, providing
solutions that are feasible across the globe is essential the goal of projects as such.
While we study very rural areas, an important aspect to mention is the migration
towards urban areas. In 2005, 3.1 billion people lived in urban areas, nearly half of
the world’s population. By 2025, a projected 4.5 billion peoplenearly two- thirds of
the worlds populationare expected to live in urban areas [UN ESA, 2006]43.
As urbanization rates steadily increase, governments are realizing that providing
modern infrastructure services, especially electricity, is a high priority. Without elec-
tricity, much of this urban population will not be able to keep pace with the changing
world and will lack opportunities to increase their skills and education, which will
limit their employment opportunities. By taking the perspective of the entrepreneurs
in the micro-enterprises in rural areas, small sustainable scalable solutions can be
uncovered. The understanding of such solutions, the factors and mechanisms in-
volved, leads to recommendation for policy development in the field of energy, as
well as a support for business initiatives, to increase the impacts of electricity on
income generation by the poor. In Section 5.2 I discuss two potential solutions in
eradicating extreme poverty.
43United Nations. 2006. ’World Population Prospects: The 2006 Revision Population Database.’ Accessed fromhttp://esa.un.org/unpp/
92

93
5.2 Sustainable Scalable Solutions
Electricity access in itself is not a panacea to rural poverty issues. A successful
intervention has the potential to stimulate development by modernizing existing
needs and introducing new services. However the long term success of any project
requires social sustainability to play a central role which can only be achieved by
starting from the context of the users rather than the technology. Technology in
itself is not the cure-all to rural development issues. In fact, installation of the same
technology within different contexts can often yield contrasting results. There is no
best-fit solution to energy needs, and carriers must be weighed carefully against the
local situation, capabilities and preferences.
5.2.1 Case 1: Independent Power Producer Nexus
Different sizes of micro-enterprises can benefit from sustainable, efficient electricity
services. While access to capital seems to be a barrier, there are several locals who
are well-off and can afford to promote different ways of accessing electricity. In a case
examined by a wealthy business owner in Kyenjonjo, I learned of several methods
used to help other business owners access electricity in order to offer services. The
owner has several businesses that provide the following services: cellphone charging,
automotive battery charging, hair salon, video hall, electrical repair services and
other services that may be needed such as dvd and cd duplication. The electricity
generating equipment that he has is: 1 small solar PV, 1 Petrol Generator, 2 Diesel
Generators and several car batteries. Depending on the service needed, he turns on
the appropriate generator. The PV and batteries are primarily used for lighting and
cellphone charging. The rest of the services are dependent on the customers that
come in and when enough, then he can run the generator and typically will try to
have more than one service at the time. Figure 5.1 is an example of a schematic
diagram showing the flow of usage among the different ventures.

94
Figure 5.1: A schematic diagram showing the flow of usage among the different ventures based onthe need at the time. [Special thanks to Abigail Mechtenberg for working with me on this modeland a more detailed model is listed in Appendix D.2
While such a solution is functional (he does not run every single one of the busi-
nesses, just collects a percentage from each at the end of the day and small fee for
overhead), it is important to note that one needs capital in order to achieve such a
goal. Here the entrepreneur is able to purchase both the electricity generating equip-
ment and the different appliances that provide the services. This could be a model
that could be used in other areas where there is someone able to access capital.

95
5.2.2 Case 2: The Bicycle Generator, Improving Access in Kenya
In many developing countries, human energy is most commonly used to propel
bicycles, but can also be used to generate electricity and power hand-crank tools.
Human (mechanical) energy is converted into electrical current by means of a Direct
Current (DC) generator that is connected by a fan belt to a bicycle flywheel. The
electricity created by the DC generator can be stored in various types of lead-acid
batteries. Tests at Oxford University showed that 75 watts of power is possible to
be generated by an average rider at road speed in a one hour time frame. Wilson
also found that at 18 mph it is possible to achieve 200 watts for short periods, while
750 watts is possible only for a second or so, under extreme load [McCullagh, 1977].
These calculations show that human/mechanical energy, if harnessed could add to
existing battery banks, or could be set up alone to run appliances. Appliances that
could be powered include radios, televisions, lights, power tools and other appliances
that pull relatively low amounts of energy for their usage.
As an attempt to see the importance of such electricity generating devices in
the most rural areas, I worked with technicians at MPALA Research Centre 44 in
building a bicycle generator that would assist the employees at the center to charge
the batteries they use in their homes. While not possible to show the residences of
the villagers, figures 5.2 and 5.3 show the outside and inside of a ’banda’ 45 which
are very similar to those of the employees. The Mpala Wildlife Foundation 46 has44Mpala is located on the Laikipia Plateau in north central Kenya, just north of the equator, northwest of Mt.
Kenya and at an elevation between 1700-2000M above sea level. Mpala covers 49,107 acres of savannah and drywoodland habitats and is bordered by the Ewaso Ngiro and the Ewaso Narok rivers. There are vast expanses oflow lying plains, covered with thorny scrub where unique rocky kopjes (a small usually rocky hill especially on theAfrican veld) majestically rise above the skyline. Fifteen dams have been constructed on Mpala, and there are morethat 250KM of internal roads.
45A hut-like accommodation, typically common in camp sites because they usually have amenities needed by mostpeople
46The Mpala properties in Laikipia, Kenya were purchased by Sam Small in 1952 and bequeathed to his brotherGeorge in 1969. George Small focused his energies and resources on conserving the habitats and wildlife of Mpalaand providing healthy livelihoods for Mpalas employees and families. In 1989 George created the Mpala WildlifeFoundation and the Mpala Research Trust to fund the activities necessary to achieve his vision. In accordance withGeorge Small’s mission, the Foundation supports the wildlife conservancy, a primary school for employees children,a community outreach program which includes the Mpala Mobile Clinic, as well as a working cattle ranch thatsuccessfully coexists with an abundance of wildlife. The Foundation contributes to the Mpala Research Trust thatsupports and directs the Mpala Research Centre, a well respected, international research facility located on the Mpalaproperty.

96
made it a priority to make sure that all it’s employees live in good conditions and
that their children are educated.
Figure 5.2: Outside of a Banda [Photo: Courtesyof MWF]
Figure 5.3: Outside of a Banda [Photo: Courtesyof MWF]
To understand the need for such devices, the location to the closest grid connection
is an important factor to consider. Mpala is located about 75KM from Nanyuki town,
the closest to grid electricity. While they have funds that help to run a 30KVA diesel
generator, a 22KVA petrol generator and several solar panel installed on the different
buildings, those that suffer tremendously are the employees living at the MPALA
village. They rely on batteries which have to be brought to the charging station,
where the priority is charging batteries for the researchers. Thus finding a solution
to meet the needs of the employees is likely to have a profound effect on success and
efficiency during the work hours. Figure 5.4 show the initial stages of building the
bicycle generator while figure 5.5 shows the final product charging a battery.
Initially, the bicycle generator did not show much interest among the villagers
but after a site visit by the Board Directors, and the realization that one doesn’t
have to put too much into getting a full charge, it has become a popular electricity
generating device. The locals rely on it more than they do at the charging station as
they can go almost a week or two without a chance of getting their battery charged.
Such small solutions have created interest in building a gym that will be generating
electricity as people exercise, which is a facility lacking at the site.

97
Figure 5.4: Initial stages of building the bicycle generator
Figure 5.5: Final product charging a battery
The experience from Mpala, which continues to show success is an indication that
as the villagers earn more income, they can potentially purchase such a device and
find a way of creating more income by providing services that depend on electricity.
Despite the fact that this example shows an improvement in the lives of the villagers,
much more work is needed overall to dramatically address this issue through out the
developing world by finding small simple solutions that can easily be applied.

98
5.3 Role of Local Governance
Local governments have a natural advantage in knowing and understanding the
needs and resources of their own territories and so they can provide better local
public goods to meet the demands of their populations. However, while the debate
on governance has focused on the institutions of the national state less attention
has been given to sub-national governments. While decentralization reforms cross
the developing world have advanced, their implementation continue to face criti-
cal challenges. The budgets are limited or have grown beyond their competencies
and opportunities for sustainable economic development have not accompanied new
political accountability at the local level.
One important way that the local government can contribute in the role of elec-
tricity in economic development is by providing resources and material on different
and appropriate technologies that can be used for different services. While most
people may not trust a new salesman in town, it is more likely that they can find
confidence in them if they had information from the local government. Typically, the
experience sought in Uganda did show that prior to approaching the communities,
one had to in-fact have discussions with the local chief on what the intentions of
the study were. Dissemination of information would therefore be prevalent through
the use of the chief’s office. Methods in which the local government can achieve the
results are:
1. Improve understanding of the importance and role of local governments for com-
munity development and the use of electricity for alleviating poverty through
income generation
2. Disseminate and compare lessons learned, best practices, and tools generated
from working with technicians, researchers, sales people and financing institu-
tions.

99
3. Facilitate the exchange and comparison of experiences and approaches among
practitioners from a cross-regional perspective
The challenge for developing countries, given their situation of extremely low
incomes, is that of how to encourage the poor to participate in programs provided
by the local government. Most poor populations are quick to agitate for participation
but when it reaches the level of participating in the financing they still want some
donor or central government to foot the whole bill. Central government on its part
gets money from taxes paid by the people. But however efficient and effective a tax
system is (which in Uganda it is not), if it is taxing a poor population, it will yield
poor revenues.
There is a limit beyond which a hungry person can not milk a hungry cow. The
fundamental problem with most African societies is that they suffer from double
weakness. The local governments are weak while at the same time the private and
civil society sectors are also weak. This double weakness is not only in terms of
resources, human, material and financial, it is also in terms of institutions, systems,
information, networking and many more. Their financial difficulties stem from this
fundamental double weakness. Such weaknesses are the reason why the local gov-
ernance find it difficult in implementing policies to assist the people with solutions
and the benefits of using electricity for alleviating poverty.

100
5.4 Donors: A Sustainable Solution?
In developing countries the challenge of increasing electricity access in a sustain-
able manner is a problem of balancing the need to set prices to cover cost while
keeping them low enough for the poor majority to afford. These are not easy ob-
jectives to achieve because they are inherently contradictory where the achievement
of one objective is often at the expense of the other. Provision of modern energy
service is crucial to the overall social and economic development and as such it forms
a platform without which the MDGs cannot be attained. Lack of access to electricity
in itself remains the clearest indicator of Energy Poverty and, indeed, of poverty in
general. It is, therefore important that that donors can assess the methods of giving
to implement the enhancement rural electricity access.
The energy needs of the poor are small, but small amounts of energy can make
a significant difference to their lives. However, the great majority of people without
adequate access to electricity live on less than US $2 per day, making it difficult for
them to access good services, including access to modern energy services. Electric-
ity access is not without cost and the initial expenditure on connections or better
technologies can be high. There is a large funding gap in providing electricity access
for the poor which has not been seriously addressed by existing financial mecha-
nisms and financing institutions. An estimated US $435 billion would be required to
provide electricity to all of the population presently unserved. Compared to current
energy sector spending, the cost of delivering energy to meet the needs of poor people
is only about 2.85% of total global energy investment [Worldbank, 2009]. This has
to be funded by international aid, multilateral financing, climate change financial
mechanisms, governments and local private sector investment.
While the private sector will definitely be one of the key players in financing
electricity for development, it is essential to remember that private investors aiming
to maximize returns would not be attracted by the idea of providing electricity

101
access to the poor unless subsidies or other financial incentives are in place and
unless clear policies on tariffs and risks are set in advance. Over the past 30 years
the international community has continually failed to make headway to reduce the
number of energy poor. The approach has either not focused on actually delivering
the needs of the poor, so the benefits have gone to wealthier groups, or has been
unsustainable and driven by short term donor requirements.
”Receiving assistance from my American friend has been very
helpful for my business. Initially, they bought be a battery and
a small inverter and then told me that I would have to buy my
own clippers to cut hair. It was great but I still did not have
enough money to buy everything I needed. I then realized that it
would be a disappointment when they return to Uganda and see
that I have not made any progress in opening up a barbershop.
I borrowed some money from my uncle and bought one set.
When they returned, they were happy to see that I have taken
the initiative and they helped me to install lights and purchase
a second battery. Now with the little money I make, I have
been able to buy more clippers and hire someone else to help
me because we get a lot of customers in the evening!”
It is therefore clear that depending on donors for the improvement of electricity
access will not serve as a viable sustainable solution but could be used for short term
goals such as providing batteries to the micro-enterprises, but also teaching them on
the usage and maintenance. Donations will have to go hand-in-hand with education,
lest the gift becomes worthless if the user does not know how to maintain it.

CHAPTER VI
Conclusion
6.1 Main Findings
The main purpose of this thesis is to build understanding on how and under which
circumstances rural entrepreneurs access electricity in off-grid locations and the in-
fluence that has on micro-enterprises. Although the topic of energy and poverty
reduction is relevant from a policy perspective, empirical evidence needed to un-
derstand the mechanisms through which electricity can contribute to the economic
development of micro-enterprises is lacking. The questions raised from the perspec-
tive of energy policy (especially regarding the access to electricity with the objective
of poverty reduction or rural development) were refined by making use of concepts
from literature that related to innovations and rural micro-enterprises.
Access to electricity can impact micro-enterprises by enabling the use of electric
appliances, thus increasing productivity. Potentially, an increase in productivity
(for example, ability to charge more cellphones) can result in more sales, thereby
boosting business revenues. Even though lack of reliable data made it difficult to
determine the cost of electricity in units of kilowatt-hours, detailed interviews with
the entrepreneurs revealed that the volume of customers increased with an increase
in electricity access.
102

103
From equation 3.2 and equation 3.4, power drawn and energy consumed can be
calculated. There are two instances in calculating both power and energy, that is,
the peak and the average. To calculate the peak power:
Ppeak = (P )(Nmax) (6.1)
where P is the Power (Watts), Nmax is the maximum number of cellphones (or
lightbulbs) that they have on a given day. To calculate the peak energy consumption:
Epeak = (E)(Nmax) (6.2)
where E is the energy consumed (Watts-Hours), Nmax is the maximum number of
cellphones (or lightbulbs) that they have on a given day. The average power (Pavg)
and average energy (Eavg) are calculated using the same equations as equation 6.1
and equation 6.2 respectively with the variable Nmax replaced with Navg, the in the
average number of cellphones (or lightbulbs) that they have on a given day.
Pavg = (P )(Navg) (6.3)
Eavg = (E)(Navg) (6.4)
Category Power (W) Ppeak (W) Epeak(kWh) Pavg(W) Eavg(kWh)
CCSa 7.2 216 0.64 109 0.13GSb 25 100 0.5 50 0.13a Refers to Cellphone Charging Stations. The maximum number of cellphones charged on a givenday were 30 while the average was 15. Peak usage was 3 hours while average usage was 1.2 hours.
b Refers to General Stores. The maximum number of light bulbs used on a given day were 4 whilethe average was 2. Peak usage was 5 hours while average usage was 2.6 hours.
Table 6.1: Power consumption averaged out through the cellphone charging stations and generalstores

104
Though these are very rough calculations and approximate numbers based on the
responses from the entrepreneurs, it is clear that the electricity consumption of the
micro-enterprises is very low thus low-power solutions could essentially give a very
big difference. Compared to consumption of those connected to the grid, the average
daily energy consumption in Uganda is approximately 1kWh while that of the micro-
enterprises is only approximately 0.13kWh. This goes to show that with low power
solutions, access to electricity can bring impact to the poor.
Figure 6.1: Macro level correlation between electricity and human development
From figure 6.1, if the correlation between electricity and human development was
to assume a linear form, there would need to be a large increase in power production
to meet a small change in the HDI. It is evident that with low power devices, the
needs can be met at a very small scale and dramatically increase the HDI, thus
growth and development for rural areas.

105
6.2 Lessons and Policy Implications from the Uganda Experience
This study helps clarify the mechanisms through which off-grid rural electrifica-
tion can contribute to rural development. Access to electricity enables the use of
electric equipment and appliances by the micro-enterprises, boosting productivity
and revenues in clear and compelling ways. Simultaneously, access to electricity en-
ables and improves the delivery of social and business services from a wide range of
village-level infrastructure such as schools, financial institutions, and farming tools.
Increased productivity and growth in revenues within the context of better deliv-
ery of social and business support services contribute to achieving higher social and
economic benefits for rural communities. Another key finding relates to cost re-
covery. The micro-enterprises demonstrated very high costs of accessing electricity
which could potentially be recovered with the implementation of more appropriate
technologies.
6.2.1 Access and Impacts of Electricity Access
In this research, the segregation of the steps between access to electricity and
impacts has shown that attainment of electricity generating equipment is only a first
step towards impacts, and that impacts on income generation are related to the use
of electricity appliances. This fact is not only relevant for the evaluation of impacts,
but also directly for the entrepreneurs decisions on purchasing the equipment, which
depend largely on the perceptions of benefits. As impacts can hardly be predicted,
decisions for purchasing electricity generating equipment and appliances are based
on experiences and intangible influences of other entrepreneurs.
The example of lighting shows that insights into actual use provide a very differ-
ent picture from a daily expansion of working hours, which is commonly assumed.
Despite the fact that the fifty six micro-enterprises have lighting as one of the main
uses of electricity, thirty five of them only occasionally remained open in the evening,

106
with only fifteen regularly doing so. Light is also used during the day to improve
comfort of operation. For many entrepreneurs, impacts are on wellbeing rather than
on income. Therefore it can be considered that the use of electric light does bring
benefits, in income for some entrepreneurs, and in other aspects for others. How-
ever, the ability to pay for such electricity services does not increase by a predictable
quantity of extra daily income earned through the micro-enterprise activities, as such
impacts depend on the micro-enterprise context and on assets of the entrepreneur.
6.2.2 Influence of the Characteristics of Electricity Supply
Once investment in electricity generating equipment has taken place, the costs of
electricity can still have major impacts on the micro-enterprise operation. Therefore
the financial capability to purchase fuel, infrastructure, and weather play a role in
the impacts on the micro-enterprise. As the diffusion process of electric appliances
can follow at a pace independent of access to electricity, it is likely that for many
appliances, saturation has not yet been reached, as new appliances are introduced,
market demands change and there is development of newer technologies.
The role of electricity in income generation can be differentiated between ’sur-
vivalist’ and ’growth’ micro-enterprises. For those micro-enterprises that function as
survivalist, reduced cost of access to electricity contributes to the aspects crucial for
generation. For those in growth category, investments in electricity equipment and
appliances that can contribute to increased volumes of production are beneficial, as
far as the entrepreneur has the assets to be able to access or create markets for the
micro-enterprise products and services.
107
6.3 Answering the Research Question
The guiding question to this research was stated as: What are the practices
in off-grid electricity access and how does this impact micro-enterprises
in rural areas?
The main findings above indicate the complexity of the answer to this question.
The what aspect of the question has been answered by detailing the mechanisms
that play a role in off-grid access to electricity. In viewing the ’how’ part, different
perspectives must be further studied. Assessing a more detailed economic analysis of
the micro-enterprises could provide a better answer to the question. While it was evi-
dent that an increase in access to electricity led to increased number of customers, we
cannot deduce strongly the impacts towards poverty alleviation. To achieve poverty
reduction related to increase in income, the key to these mechanisms is formed by
the opportunities to access affordable and reliable access to off-grid electricity and
use of appropriate appliances.
From an economic perspective, poverty impacts for the entrepreneurs became ev-
ident as most likely to be non-monetary benefits, especially because trust in the
community and influence from sales people. Factors that can be influenced to im-
prove the impacts of off-grid electricity may constitute small steps, by increasing the
uptake of low-risk beneficial electricity generating equipment and appliances, and by
improving the micro-enterprise operation.
The benefits of the use of electricity can be improved for all entrepreneurs through
the characteristics of the off-grid electricity supply. Reliability of supply is important
for both use and impacts on the micro-enterprises. As social assets currently play
a large role in access to electricity, and the poor typically lack the necessary assets,
control of equitable access for all would improve the choices available to the poor, and
thereby improve opportunities to increase income from micro-enterprise activities.

108
6.4 Reflections and Recommendations
As the topic of energy in poverty reduction was revived as a policy interest follow-
ing the formulation of the Millennium Development Goals and the recognition of the
role of energy in reaching these, motivation to pursue this research was established
so as to create insights into the role of energy on poverty reduction through income
generation from a small scale micro-enterprise.
The qualitative methodology in combination with an entrepreneur perspective
chosen for this research was found not only to be essential for raising issues as they
emerge from practice as relevant for the study, but also to allow continuous check-
ing of the meaning of findings. As seen through this dissertation, the meaning of
the findings presented in tables and plots often emerged through discussions based
on the information behind the numbers. Knowledge of the micro-enterprises and
entrepreneurs, and insights into the mechanisms between access to off-grid electric-
ity and impacts proved to be an essential component of refining and adjusting the
findings.
Several objectives have been identified from policy but fall in two categories:
• Increase access to capital for investments in electricity generating equipment
and appliances
• Improvement of income for the poor through access to electricity and further
improvement in well-being
Synthesizing the findings on the access to electricity and impacts as they influ-
enced the several characteristics of the entrepreneur and the micro-enterprise, a short
list of explicit recommendations is made.
1. Rural electricity access projects should focus on micro-credit provision, allowing
the poor to purchase direct-use electricity generating equipment and appliances
2. Subsidies (from the local government) and credit based sales need to be provided
109
to the micro-enterprises encouraging them to purchase equipment to increase
development in the village towns
3. Financing those already accessing electricity and providing services such that
they can improve their productivity and expand their markets
4. Institute education for the micro-enterprise owners on effective use of the equip-
ment, maintenance and ability to plan ahead for upgrades, focusing on long-term
economic benefits
5. Priority on enabling and assisting women-owned micro-enterprises in accessing
electricity due to a gender inequality
6. Improve income-generation by use of modern and appropriate technology such
that there is efficiency and avoid the vicious cycle of poverty that is prominent
in developing countries.
An overall recommendation is that there are no one-size fits all models of rec-
ommendations that will benefit the poor, but rather the influencing factors and the
mechanisms encountered in this field research should be closely evaluated in a local
context in community development. It must be taken into account that a blanket
approach 47 in electricity access to reaching the poor based on an income criteria
is unlikely to reach many of the poorest groups. Understanding of local micro-
enterprises needs to electricity access and support using appropriate technology is
the first step in support. Furthermore, demands in regard to support for finance,
marketing or skills development is a another step to be considered. Institutional
support in this field would benefit from creating sustainable and open contacts with
entrepreneurs, and adapting business development support to identified needs.
47The Blanket Approach is about creating something from nothing to help those with nothing.

APPENDICES
110

APPENDIX A
Terminologies
A.1 List of Terminologies
Developed countries (industrial countries, industrially advanced coun-
tries): High-income countries, in which most people have a high standard of living.
Sometimes also defined as countries with a large stock of physical capital, in which
most people undertake highly specialized activities. Developed countries contain
about 15 percent of the world’s population.
Developing countries: According to the World Bank classification, countries with
low or middle levels of GNP per capita. More than 80 percent of the world’s popu-
lation lives in the more than 100 developing countries.
Economic development: This is the qualitative change and restructuring in a
country’s economy in connection with technological and social progress. The main
indicator of economic development is increasing GNP per capita (or GDP per capita),
reflecting an increase in the economic productivity and average material wellbeing
of a country’s population. Economic development is closely linked with economic
growth.
111

112
Economic growth: Quantitative change or expansion in a country’s economy. Eco-
nomic growth is conventionally measured as the percentage increase in gross domestic
product (GDP) during one year. Economic growth comes in two forms: an economy
can either grow ”extensively” by using more resources or ”intensively” by using the
same amount of resources more efficiently (productively). When achieved by using
more labor, it does not result in per capita income growth; when achieved through
more productive use of all resources, including labor, it results in higher per capita
income and improvement in people’s average standard of living.
Electricity Appliance: Transforms an electricity carrier into an electricity service
(for example a light bulb transforms electricity into lighting)
Electricity Generating Equipment: Transforms an energy source (such as sun-
light, or diesel) into a useful electricity carrier. For example solar electricity, or a
diesel generator.
Electricity Sector: The group of public and private companies, activities and
installations used for the production, transmission and distribution of electricity, in-
cluding the import and export of electricity.
Electricity Services: Electricity services are the functions provided through use
of electricity, usually in combination with an electricity appliance. Examples of
electricity services are lighting, refrigeration, processing, and communication, not
necessarily involving grid electricity.
Energy Access: The following aspects are in place: Infrastructure within vicinity,
connection to the location of micro-enterprise and supply is operational.

113
Energy Poor: Refers to those who have very little or no access to energy access,
or those who do have mediocre access.
Household: A household is a social group, which resides in the same compound,
share the same meals, and make joint or coordinated decisions over resource alloca-
tion and income pooling.
Human Development Index: a composite index measuring average achievement
in three basic dimensions of human development: a relatively long and healthy life,
knowledge and a decent standard of living. The HDI is produced by the UNDP and
presented in annual Human Development Reports.
Market liberalization: Removing and abstaining from using state controls that
impede the normal functioning of a market economy - for example, lifting price and
wage controls and import quotas or lowering taxes and import tariffs. Market liberal-
ization usually does not mean that a government completely abstains from interfering
with market processes.
Micro-Enterprises (MEs): This term is used to refer to a very small business
that produces goods or services for cash income. There is no universally accepted
definition of MEs, different countries use various measures of size depending on their
level of development. The commonly used yardsticks are total number of employees,
total investment and sales turnover. In the context of Uganda, micro-enterprises are
those engaging up to four people, in most cases family members.

114
Modern Energy: Refers to a variety of energy carriers including LPG, petroleum
and electricity, either grid or off-grid electricity (generated by burning fossil fuels or
by using alternative, renewable sources such as solar, biomass, hydro or wind).
Poverty line (national): The income level below which people are defined as poor.
The definition is based on the income level people require to buy lifes basic necessi-
tiesfood, clothing, housing and satisfy their most important sociocultural needs.The
poverty line changes over time and varies by region.
Poverty line (International): An income level established by the World Bank to
determine which people in the world are poor - set at $1 a day per person in 1985
international purchasing power parity (PPP) prices(equivalent to $1.08 in 1993 PPP
prices). A person is considered poor if he or she lives in a household whose daily
income or consumption is less than $1 per person.
Quality of life: People’s overall well-being. Quality of life is difficult to mea-
sure (whether for an individual, group, or nation) because in addition to material
well-being it includes such intangible components as the quality of the environment,
national security, personal safety, and political and economic freedoms.
Rural Area: Refers to a locality outside of areas that are administratively managed
by urban authorities. Rural areas are relatively deprived in terms of modern energy
infrastructure. They are not connected to grid electricity. Rural areas are sparsely
settled places away from the influence of large cities and towns. They are remote
from the national grid and have no chances of accessing the grid in the near future.

115
Sustainable development: According to the United Nations World Commission
on Environment and Development (1987), sustainable development is ”development
that meets the needs of the present without compromising the ability of future genera-
tions to meet their own needs.” According to the more operational (practice-oriented)
definition used by the World Bank, sustainable development is ”a process of man-
aging a portfolio of assets to preserve and enhance the opportunities people face.”
Sustainable development includes economic, environmental, and social sustainability,
which can be achieved by rationally managing physical, natural, and human capital.
Village Town: This term is used in the context of the micro-enterprises located in
the rural areas. Primarily, the village town will consist of small buildings approxi-
mately twenty by forty feet divided into two sections. Usually the rear section is the
living quarters of the entrepreneur and the front is the business center.
A.2 Exchange Rate
Ugandan Shillings: Exchange rate in the research period: 09/01/2007 to 12/31/2009
USD: average 1928 UGX/USD
EURO: average 2785 UGX/EUR

APPENDIX B
Uganda Background
B.1 Location and Size
Uganda is located in East Africa and lies across the equator, about 800 kilometers
inland from the Indian Ocean. It lies between 1 ◦ 29’ South and 4 ◦ 12’ North latitude,
29 ◦ 34’ East and 35 ◦ 0’ East longitude. The country is landlocked, bordered by
Kenya in the East; Sudan in the North; Democratic Republic of Congo in the West;
Tanzania in the South; and Rwanda in South West. It has an area of 241,038 square
kilometers, of which the land area covers 197,323 square kilometers.
The country enjoys equatorial climate with plenty of rain and sunshine moderated
by the relatively high altitude. In most parts of the country, the mean annual
temperatures range from 16 ◦C to 30 ◦C. Nevertheless, the Northern and Eastern
regions sometimes experience relatively high temperatures exceeding 30 ◦C and the
South Western region sometimes has temperatures below 16 ◦C.
B.2 Administration
The country is currently divided into 80 districts. The districts are sub divided
into lower administrative units. These are counties, sub-counties and parishes. Over-
time, the numbers of districts and lower level administrative units have continuously
increased with the aim of making administration easier. The total number of districts
increased from 56 districts in 2002 to 80 in 2007. [UBS, 2008]
116

117
B.3 Education
Uganda’s education system is both formal and informal. Under the formal sys-
tem, the four tier educational model is followed. This has seven years of primary
education, four years of ordinary level secondary education, two years of advanced
level secondary education and the tertiary level of education. Each level is nation-
ally examined and certificates are awarded. University education is offered by both
public and private institutions.
The Universal Primary Education (UPE) program was introduced in 1997 to offer
free education at the primary level while Universal Secondary Education (USE) was
introduced in 2007. The government also sponsors about 4,000 students every year
through the public universities. The private sponsorship scheme is also operational
in the public universities. University education can also be obtained from any of the
private universities in the country. In addition, a large number of institutions both
private and public also offer tertiary education.
B.4 Literacy
More than two thirds of the population aged 10 years and above in 2002 were
literate, that is, could write or read with understanding in any language. However,
wide sex disparities still exist in the literacy rates with 76% of the males being literate
compared to 61% of the females. Despite the high levels of literacy, in absolute terms,
over 5 million Ugandans aged 10 years and above are illiterate.

118
B.5 Districts Information
Uganda is divided into 80 districts across four administrative regions, Central,
Eastern, Northern and Western. Most districts are named after their main commer-
cial and administrative towns. This research covers an areas bounded by 3 districts,
Kamwenge, Kabarole and Kyenjonjo.
B.5.1 Kamwenge District
Kamwenge District is a district in western Uganda. Like several other Ugandan
districts, it is named after its ‘main town’, Kamwenge, where the district headquar-
ters are located. Kamwenge District is part of the Kingdom of Toro, one of the
ancient traditional monarchies in Uganda. It is bordered by Kabarole District to the
north, Kyenjojo District to the northeast, Kiruhura District to the southeast, Ibanda
District to the south, Bushenyi District to the southwest and Kasese District to the
west. Kamwenge, the district headquarters lies 300 kilometers (190 miles), by road,
west of Uganda’s capital, Kampala.
The district covers an area of approximately 2,304 square kilometers (890 square
miles). Of this, 64.1 square kilometers (24.7 square miles) is covered by open wa-
ter. It is predominantly a rural district with some of the worst poverty levels in
the country. The district does not have a hospital. The 2002 national census esti-
mated the population of Kamwenge District at about 295,300, of whom 51.5% were
female and 48.5% were female.[2] The annual population growth rate of the district
is approximately 3.2%. It is estimated that in 2010, the population of the district is
approximately 380,000. [UBS, 2008]
Agriculture is the mainstay of the district economy. In the Kitagwenda area of
the district, there is fishing, some of it for commercial purposes.

119
B.5.2 Kabarole District
Kabarole District is a district in western Uganda. Kabarole District is part of
the Kingdom of Toro, one of the traditional monarchies that are constitutionally
recognized in modern-day Uganda. The district is bordered by Kyenjojo District
to the east, Kamwenge District to the southeast, Kasese District to the south, the
Democratic Republic of the Congo to the southwest and Bundibugyo District to the
west and to the north. The biggest and busiest towns in the district in Fort Portal.
The district lies within an altitude range of 915 meters at Lake Kyoga to 3,556
meters above sea level. It has a total area of 8,318.2 square kilometers of which
only 0.87% is covered by open water (mostly Lake George), making the district the
least endowed with surface water resources in the region.In 2002, the population of
Kabarole District was estimated at 359,200 with a population growth rate of 3.0%
annually. It is estimated that in 2010, the population of will be approximately
455,000.
Subsistence agriculture and animal husbandry are the main economic activities in
Kabarole District. The district is one of the five districts in Uganda where wheat can
be grown. Livestock is the second economic activity and is concentrated in the coun-
ties of Kyaka, Kibale, Burahya, Mwenge, Bunyangabu and Kitagwenda. Commercial
fishing occurs on about 30 of the 52 crater lakes, scattered in Kabarole District. The
main fish species harvested from the crater lakes is the small Haplochromines (Nke-
jje). Fishing, mainly of Protopterus aethiopicus (Lung fish), is also carried out in
a number of wetlands. Aquaculture is practiced with increasing frequency in the
district and in 2005 there were over 300 fish ponds stocked with tilapia and mirror
carp species. [UBS, 2008]

120
B.5.3 Kyenjonjo District
Kyenjojo District is a district in western Uganda. Like most other Ugandan dis-
tricts, it is named after its ‘main town’, Kyenjojo, where the district headquarters
are located. It is bordered by Kibale District to the north, Mubende District to
the east, Kiruhura District to the southeast, Kamwenge District to the south and
Kabarole District to the west. The district headquarters at Kyenjojo are located ap-
proximately 274 kilometers (170 miles), by road, west of Kampala, Uganda’s capital
and largest city.
The district covers an area of approximately 4,000 square kilometers. About 912
square kilometers of land is forest; 414.6 square kilometers under wetlands and the
remaining under cultivation or available for cultivation. The 2002 national census
estimated the population of the district at about 380,400. The annual population
growth rate of the district is estimated at 3.0%. It is estimated that the population
of Kyenjojo District in 2010 will be approximately 481,000. [UBS, 2008]
Agriculture is the main economic activity in the district, with growth of many
different crops. Chimpanzee tracking is common in Kyenjonjo district and a good
source of income from tourism.

APPENDIX C
Interviews
C.1 Interviews
In this study, I combine quantitative and qualitative methods, including informal
surveys, intra-business energy allocation studies and historical (stories told) analysis,
to analyze the impact of practices in off-grid electricity access among micro- enter-
prises in rural western Uganda. The data collected is compiled into a database for
later analysis. The interview questions are divided into six sections.
C.1.1 Demographics
The following information is collected by asking direct questions regarding the
micro-enterprise:
• Location (District and Village Town)
• Micro-Enterprise Identifier (Generated Sequentially as an identifier)
• Micro-Enterprise Name
• Business Category
• Years in Business
• Number of Employees
• Hours of Operation
121

122
The following information is collected by asking direct questions regarding the
entrepreneur:
• Entrepreneur’s Name
• Entrepreneur’s Age
• Entrepreneur’s Sex
• Entrepreneur’s Phone Number
• Entrepreneur’s Level of Education
C.1.2 Products and Services
The following information is collected by asking direct questions regarding the
products and services offered by the micro-enterprise:
• Product and/or Service Provided
• Buying Price
• Selling Price
• Quantity (per day)
• Number of Customers (per day)
C.1.3 Electricity Generation
The following information is collected by asking direct questions regarding the
generation of electricity for the micro-enterprises, which occurs either at the site, or
at a different site:
• Generation Equipment (Only 4 types noted, diesel generators, petrol generators,
solar PV and battery systems)
• Fuel Type
• Fuel Consumed Per Day (in Liters, depending on the type of generator)
• Status at Purchase (New or Used)

123
• Maintenance (Regular)
• Length of Ownerships
• Length of Battery before next charge
• Fuel Cost (Per liter)
• Frequency of Fuel Purchase (how many times in a week do they purchase fuel)
• Transportation Method
• Transportation Cost (round trip)
• Other notes relevant
C.1.4 Electricity Use
The following information is collected by asking direct questions regarding the
use of electricity within the micro-enterprises:
• Electricity Use
• Electrical Appliance
• Wattage (Ratings)
• Duration of Use (daily)
• Length of Ownership
• Status at Purchase (New or Used)
• Maintenance (Regular)
• Other notes relevant
C.1.5 Relevant Notes
The following information is collected by asking direct and indirect questions
regarding different factors that affect the micro-enterprises and the entrepreneur:
• Weather and Environmental Restrictions
• Infrastructure

124
• Cultural Awareness and Restrictions
• Willingness to Pay for Electricity Access
• Importance of Electricity
• Sources of Capital
• Purchasing Strategies
• Other Comments

APPENDIX D
Energy Models
D.1 Basic Energy Model
In thinking through most of the research, a basic energy model was created to
help in idealizing solutions for off-grid electricity access.
Figure D.1: A basic energy model.
125

126
D.2 Independent Power Producer Nexus - Detailed
Figure D.2: A more detailed schematic diagram showing the flow of usage among the differentventures based on the need at the time. [Special thanks to Abigail Mechtenberg]
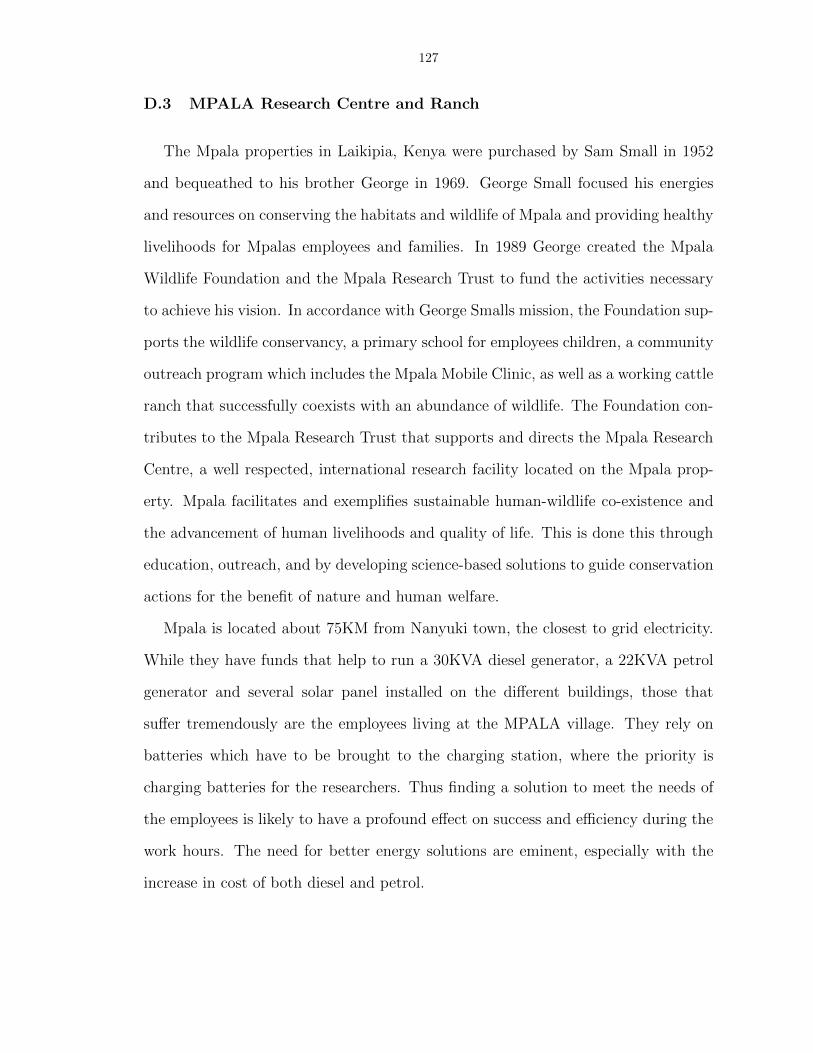
127
D.3 MPALA Research Centre and Ranch
The Mpala properties in Laikipia, Kenya were purchased by Sam Small in 1952
and bequeathed to his brother George in 1969. George Small focused his energies
and resources on conserving the habitats and wildlife of Mpala and providing healthy
livelihoods for Mpalas employees and families. In 1989 George created the Mpala
Wildlife Foundation and the Mpala Research Trust to fund the activities necessary
to achieve his vision. In accordance with George Smalls mission, the Foundation sup-
ports the wildlife conservancy, a primary school for employees children, a community
outreach program which includes the Mpala Mobile Clinic, as well as a working cattle
ranch that successfully coexists with an abundance of wildlife. The Foundation con-
tributes to the Mpala Research Trust that supports and directs the Mpala Research
Centre, a well respected, international research facility located on the Mpala prop-
erty. Mpala facilitates and exemplifies sustainable human-wildlife co-existence and
the advancement of human livelihoods and quality of life. This is done this through
education, outreach, and by developing science-based solutions to guide conservation
actions for the benefit of nature and human welfare.
Mpala is located about 75KM from Nanyuki town, the closest to grid electricity.
While they have funds that help to run a 30KVA diesel generator, a 22KVA petrol
generator and several solar panel installed on the different buildings, those that
suffer tremendously are the employees living at the MPALA village. They rely on
batteries which have to be brought to the charging station, where the priority is
charging batteries for the researchers. Thus finding a solution to meet the needs of
the employees is likely to have a profound effect on success and efficiency during the
work hours. The need for better energy solutions are eminent, especially with the
increase in cost of both diesel and petrol.

128
Figure D.3: A simple proposed layout of MPALA’s energy scheme

129
Figure D.4: Diesel Generator at MPALA
Figure D.5: Petrol Generator at MPALA

APPENDIX E
Equipment and Appliances
E.1 Electricity Generating Equipment and Appliances
Figure E.1: Bicycle generator lighting up a bulb. Built by the local technicians at St. Joseph’sTechnical School
130

131
The following is a representation of innovation, where a barber shop and video
hall are both in the same place, typically hair is cut when they are watching the TV.
Figure E.2: Appliances at a video hall
Figure E.3: Appliances at a barber shop

132
Figure E.4: Appliances at a general store
Figure E.5: Appliances at a cellphone charging station

APPENDIX F
Micro-Enterprise Views
F.1 Detailed Micro-Enterprise View
Small and Medium Enterprises (SMEs) contribute greatly to the economy of
Uganda, regardless of their level of development. In 2001, Uganda was estimated to
have about 1 million enterprises classified as MSMEs and forming 90% of Uganda’s
private sector. MSMEs employ approximately 1.5 million people equivalent to 90%
of total non-farm private sector workers [UBS, 2007].
SMEs suffer difficulty in accessing (i) appropriate technology, (ii) skills and edu-
cation, (iii) financing, (iv) business information and (v) land. The constraints make
it difficult for MSMEs in Uganda to develop their productive capacities, maximize
their competitiveness and contribute to sustainable economic growth. Furthermore,
appropriate technology, skills, education and information, are essential for the sus-
tainable growth of micro-enterprises.
133

134
Figure F.1: Inside a General Store
Figure F.2: Outside View of a Restaurant

BIBLIOGRAPHY
135

136
BIBLIOGRAPHY
[1] Allerdice A and Rogers J. Renewable energy for microenterprise. National Renewable EnergyLaboratory (NREL), Colorado, USA, 2000.
[2] Alvarez A., Clancy J., Lumampao F., and Maduka J. O. Gender, energy and urban poverty.ENERGIA News, 9(1), 2006.
[3] Barnett A. Energy and the fight against poverty (presented at iss), 2000.
[4] Chaureya A., Ranganathana M., and Mohanty P. Electricity access for geographically dis-advantaged rural communities-technology and policy insights. Energy Policy, 32:1693–1705,2004.
[5] Jacobson A. Connective Power: Solar electrification and social change in Kenya. PhD thesis,Energy and Resources, University of California Berkeley, 2004.
[6] Jacobson A. Connective power: Solar electrification and social change in kenya. World Devel-opment, 35(1):144–162, 2007.
[7] Kumar A., Mohanty P., Palit D., and Chaurey A. Approach for standardization of off-gridelectrification projects. Renewable and Sustainable Energy Reviews, pages 1–11, 2009.
[8] Practical Action. Europe’s chance to help light africa: Energising poverty reduction inafrica. Practical Action, The Schumacher Centre for Technology and Development, UKwww.practicalaction.org, 2005.
[9] Nooteboom B. Innovation and diffusion in small firms: Theory and evidence. Small BusinessEconomics, 6:327–347, 1994.
[10] World Bank. Rural electrification: A hard look at costs and benefits. Washington, DC: WorldBank, 1995.
[11] World Bank. World development report (wdr) 2000/2001: Attacking poverty.http://web.worldbank.org/WBSITE/EXTERNAL/TOPICS/EXTPOVERTY/0,,contentMDK:
20194762~pagePK:148956~piPK:216618~theSitePK:336992~isCURL:Y~isCURL:Y,00.html,2001. Last Checked: 22nd December 2008.
[12] Bhattacharyya S. C. Energy access problem of the poor in india: Is rural electrification aremedy? Energy Policy, 34:3387–3397, 2006.
[13] Karger C. and Hennings W. Sustainability evaluation of decentralized electricity generation.Renewable and Sustainable Energy Reviews, 13(3):583–593, 2009.
[14] Kirubi C. How important is modern energy for micro-enterprises? evidence from rural kenya.Master’s thesis, University of California Berkeley, 2006.
[15] Kirubi C. and Jacobson A. Community-based electric micro-grids can contribute to ruraldevelopment: Evidence from kenya. World Development, pages 1–14, 2009.

137
[16] Sharma D. C. Transforming rural lives through decentralized green power. Futures, 39:583–596, 2007.
[17] Kittelson D., editor. Productive uses of electricity: country experiences. World Bank Head-quarters, Washington D.C, National Rural Electric Cooperative Association (NRECA) Inter-national Ltd., 1998.
[18] Pearce D. and Webb M. Rural electrification in developing countries – a reappraisal. EnergyPolicy, 15(4):329–338, 1987.
[19] Rio P. D. Encouraging the implementation of small renewable electricity cdm projects: Aneconomic analysis of different options. Renewable and Sustainable Energy Reviews, 11(7):1361–1387, 2007.
[20] DFID. Sustainable Livelihoods Guidance Sheets, 2001.
[21] DFID. Energy for the Poor, underpinning the Millennium Development Goals. DepartmentFor International Development, UK., 2002.
[22] Barnes D. F. Electric power for rural growth: How electricity affects rural life in developingcountries. Boulder: Westview Press, 1998.
[23] Barnes D. F. The challenge of rural electrification, strategies for developing countries. Wash-ington: Resources for the Future, 1:1–18, 2007.
[24] Barnes D. F. and Foley G. Rural electrification in the developing world: A summary of lessonsfrom successful programs. Washington, DC: World Bank., 2004.
[25] Barnes D. F., Gujarathi P. M., and P. Narayana. Energy strategies for rural india: evidencefrom six states: Esm 258/02. Washington, D.C.: ESMAP, The World Bank., 2002.
[26] ESD (Energy for Sustainable Development). Fuel substitution: poverty impacts on biomassfuel suppliers. DFID/KAR R8019, UK, 2003.
[27] Foley G. Rural electrification in the developing world. Energy Policy, 20(2):145–152, 1992.
[28] GNESD. Renewable Energy Technologies and Poverty Alleviation: Overcoming Barriers andUnlocking Potentials. 2007.
[29] HEDON. Productive uses of renewable energy (puresig), 2008.
[30] IBRD. The economic development of Uganda. Baltimore: Johns Hopkins Press, 1962.
[31] IDS. Energy, poverty and gender in rural china. Draft final report may 2001, Institute ofDevelopment Studies at the University of Sussex, UK, 2001.
[32] IDS. A review of the evidence and case studies in rural china. Washington, D.C.: The WorldBank, ASTAE, 2002.
[33] IEG. Books, buildings, and learning outcomes: An impact evaluation of World Bank supportto basic education in Ghana. Washington, DC: World Bank, 2004.
[34] IEG. The welfare impact of rural electrification: A reassessment of the costs and benefits.Washington, DC: Independent Evaluation Group, World Bank, 2008.
[35] Cust J., Singh A., and Neuhoff K. Rural Electrification in India: Economic and Institutionalaspects of Renewables. Faculty of Economics, University of Cambridge, 2007a.
[36] Mellor J. The new economics: A strategy for India and the developing world. Ithaca, NY:Cornell University Press, 1976.

138
[37] Tester J., Drake E., Driscoll M., Golay M., and Peters W. Sustainable Energy: ChoosingAmong Options. MIT Press, 2005.
[38] Alanne K. and Saari A. Distributed energy generation and sustainable development. Renewableand Sustainable Energy, pages 539–558, 2006.
[39] Prahalad C. K. Fortune at the Bottom of the Pyramid, The: Eradicating Poverty ThroughProfits. Wharton School Publishing, 2004.
[40] Prahalad C. K. and Hamel G. Competing for the Future. Harvard Business Review, 1994.
[41] Prahalad C. K. and Ramaswamy V. The Future of Competition. Harvard Business Review,2004.
[42] Reiche K., Covarrubias A., and Martinot E. Expanding electricity access to remote areas:Off-grid rural electrification in developing countries. [Electronic Version], pages 1–60, 2000.
[43] Yin R. K. Case Study Research, design and methods (Third Edition). Thousand Oaks: SagePublications, Inc, 2003.
[44] Eisenhardt K. M. Building theories from case study research. Academy of Management Review,14(4):532–550, 1989.
[45] Kanagawa M. and Nakata T. Assessment of access to electricity and the socio-economic impactsin rural areas of developing countries. Energy Policy, 36:2016–2029, 2008.
[46] Mapako M. and Mbewe A. Renewables and energy for rural development in sub-saharan africa.African Energy Policy Research Network (AFREPREN), Nairobi, 2004.
[47] Rogerson C. M. Rural electrification and the small medium and micro enterprises economy insouth africa. Energy Research Center, University of Cape Town, 1997.
[48] Ross M., Barker J., Everest D., and Keoleian G. Energy Demand and Energy Engineering.University of Michigan, 1999.
[49] Takada M. and Charles N. A. Energizing poverty reduction: A review of the energy-povertynexus. Poverty Reduction Strategy Papers, 2007.
[50] Balla P. Development of community electrification in kenya: A case of small-scale-hydro forrural energy. Master’s thesis, Lund University, Sweden, 2003.
[51] UNDP Small Grants Programme. Community-based alternative energy systems, 2002.
[52] Banerjee R. Comparison of options for distributed generation in india. Energy Policy, 34:101–111, 2006.
[53] Gordon R. Macroeconomics. Addison-Wesley, 2000.
[54] Hall R. and Lieberman M. Economics: Principles and Applications. South Western CollegePublishing, 1998.
[55] Pirog R. and Stamos S. Energy Economics, Theory and Policy. Prentice Hall, 1987.
[56] Adler P. S. and Kwon S. W. Social capital: prospects for a new concept. Academy of Man-agement Review,, 27(1):17–40, 2002.
[57] Karekezi S. and Majoro L. Improving modern energy services for african’s urban poor. EnergyPolicy, 30:1015–1028, 2002.
[58] Schurr. S and Sonenblum. S. Electricity Use, Productive Efficiency and Economic Growth.Electric Power Institute, 1986.

139
[59] UBS. Number of electricity consumers by type. http://www.ubos.org/onlinefiles/
uploads/ubos/pdf%20documents/TEN22010.pdf, 2005, 2009. Last Checked: 15th March2009.
[60] UBS. Uganda business register. http://www.ubos.org/onlinefiles/uploads/ubos/pdf%
20documents/20067UBR%20report.pdf, 2006. Last Checked: 8th January 2010.
[61] UBS. Nature, distribution and evolution of poverty and inequality in uganda.http://www.ubos.org/onlinefiles/uploads/ubos/pdf%20documents/ILRI%20Poverty%
20Report%202007.pdf, 2007. Last Checked: 8th January 2010.
[62] UBS. Installed electricity capacity. http://www.ubos.org/onlinefiles/uploads/ubos/
pdf%20documents/TEN12010.pdf, 2009. Last Checked: 15th March 2009.
[63] UBS. The population and social statistics. http://www.ubos.org/index.php?
st=pagerelations&id=16&p=related%20pages:Demographic%20Statistics, 2010. LastChecked: 8th April 2010.
[64] UN-Energy. The energy challenge for achieving the millennium development goals. UnitedNations, 2005.
[65] UNDESA. World summit on sustainable development: Plan of implementation. United Na-tions, 2002.
[66] UNDP. Achieving the millennium development goals: The role of energy services, case stud-ies from brazil, mali and philippines. http://www.energyandenvironment.undp.org/undp/
index.cfm?module=Library&page=Document&DocumentID=5109, 2005. Last Checked: 12thFebruary 2008.
[67] UNDP. Gender and energy for sustainable development. http://www.undp.org/energy/
genenergykit/, 2009. Last Checked: 6th June 2009.
[68] UNDP and GTZ. Scaling up modern energy services in east africa: To alleviate poverty andmeet the millennium development goals. http://www.energyandenvironment.undp.org/
undp/index.cfm?module=Library&page=Document&DocumentID=5490, 2005. Last Checked:12th February 2008.
[69] UNEP Headquarters Complex, Nairobi, Kenya. The role of energy in achieving and sustain-ing millennium development goals (MDGs). Paper presented at Africa Regional Workshop onElectricity and Development in Africa, 2005.
[70] Ramani K. V. and Heijndermans E. Energy, poverty and gender: A synthesis. WashingtonD.C.: The World Bank, ASTAE, 2003.
[71] XE. International currency converter. http://www.xe.com/ucc/, 2010. Last Checked: 10thJanuary 2010.