
Occupier focused, Opportunity led. - AnnualReports.com
140
Occupier focused, Opportunity led. Picton Property Income Limited Annual Report 2021
-
Upload
khangminh22 -
Category
Documents
-
view
3 -
download
0
Transcript of Occupier focused, Opportunity led. - AnnualReports.com

Occupier focused, Opportunity led.
Picton Property Income Limited Annual Report 2021
Picton Property Income Lim
ited Annual Report 2021
Business OverviewWelcome
2021 Highlights 2
Picton at a Glance 4
Chair’s Statement 8
Strategic ReportBusiness Model 12
Our Marketplace 14
Our Strategy 20
Chief Executive’s Review 22
Key Performance Indicators 30
Portfolio Review 34
Financial Review 44
Principal Risks 47
TCFD Statement 52
Being Responsible 54
Section 172 Statement 62
Governance Chair’s Introduction 64
Board of Directors 66
Our Team 68
Corporate Governance Report 70
Nomination Committee Report 74
Audit and Risk Committee Report 76
Remuneration Report 79
Property Valuation Committee Report 98
Directors’ Report 99
Financial Statements Independent Auditor’s Report 102
Consolidated Statement of Comprehensive Income� 106
Consolidated Statement of�Changes�in Equity� 107
Consolidated Balance Sheet 108
Consolidated Statement of Cash Flows 109
Notes to the Consolidated Financial Statements 110
Additional InformationSupplementary Disclosures 127
Property Portfolio 131
Five Year Financial Summary 132
Glossary 133
Financial Calendar 134
Shareholder Information 135
Through our occupier focused, opportunity led approach, we aim to be one of the consistently best performing diversified UK REITs.
To us this means being a responsible owner of commercial real estate, helping our occupiers succeed and being valued by all our stakeholders.
Welcome to our 2021 Annual Report
Contents
Visit our website www.picton.co.uk
Business OverviewWelcome

01
Strategic ReportG
overnanceFinancial Statem
entsB
usiness Overview
Picton Property Income Lim
ited Annual Report 2021Additional Inform
ation
Stanford Building London
50 Farringdon Road London
Parkbury Industrial EstateRadlett
What makes us different? Visit our website for more
information on why to invest www.picton.co.uk
1Our long-term track record of upper quartile outperformanceWe have outperformed the MSCI UK Quarterly Property�Index�over�one,�three,�five�and�ten�years, and since inception.
2Diversified exposure to the UK commercial property market with flexibility to adapt to changing market conditionsOur�diversified�property�portfolio�generates�income�from around 350 occupiers across a wide range of businesses, providing the opportunity for income and capital growth.
3Our occupier focused and responsible approach to businessOur occupier focused approach ensures we actively manage�our�assets,�maintain�high�occupancy�and create space for our occupiers to succeed. Sustainability is integrated within our business model and corporate strategy and in the way we and our occupiers operate.
Read more on pages 6–7
Read more on pages 54–61
Read more on pages 34–43

02
Picton Property Income Lim
ited Annual Report 2021
Business Overview2021 Highlights
HighlightsPositive results underlining the resilience of the business and our continued long-term track record of outperformance.
Resilient financial performance ӱ Profit�after�tax�of�£33.8�million,�an�increase�of over�50%�on�the�prior�year�results�
ӱ Net�assets�of�£528�million,�or�97p�per�share,�an increase�of�3.7%
ӱ Earnings per share of 6.2p ӱ Total�return�of�6.6% ӱ Received�92%�of�rental�income�over�the�financial�year,�with�a�further�1%�deferred�
ӱ Combined�reduction�of�6%�in�property,�operating�and�finance�costs�over�the�year
ӱ Total�dividends�paid�of�£15.0�million,�with�dividend�cover�of�134%
ӱ Loan�to�value�ratio�reduced�to�21%�with�significant�headroom�against�loan�covenants
ӱ New�£50�million�revolving�credit�facility�completed
Outperforming property portfolio ӱ Total�property�return�of�7.3%,�outperforming�MSCI�UK�Quarterly�Property�Index�of�1.2%
ӱ Upper�quartile�outperformance�against�MSCI over�one,�three,�five�and�ten�years,�and�since inception
ӱ Well-positioned portfolio comprising: Industrial�53%,�Office�36%,�Retail�and�Leisure 11%
ӱ Like-for-like�valuation�increase�of�3.2% ӱ Like-for-like�increase�in�passing�rent�of�1.9% ӱ Like-for-like estimated rental value increase of 1.1%
ӱ One�retail�asset�disposal�for�£4.0�million,�30% ahead�of�March�2020�valuation
Improving occupancy through asset management
ӱ Increased�occupancy�to�91% ӱ Occupier�retention�of�88% ӱ 90 asset management transactions
completed including:– 17�rent�reviews,�7%�ahead�of�ERV– 30�lease�renewals�or�regears,�10%�ahead of ERV
– 25 lettings or agreements to lease, 3% ahead of�ERV
ӱ £5�million�invested�into�asset�refurbishment�and repositioning projects
Supporting our stakeholders ӱ Provided assistance to over 90 occupiers
during the Covid-19 pandemic ӱ Increased dividends twice during the year,
with payments almost back to pre-pandemic levels
ӱ Reduction in property running costs to assist our occupiers
ӱ Improvement�in�annual�GRESB score�achieving two Green star status
ӱ Pathway to net zero carbon to be in place by March�2022
See Financial Review for more highlights on pages 44–46

03
Strategic ReportG
overnanceFinancial Statem
entsAdditional Inform
ationB
usiness Overview
Picton Property Income Lim
ited Annual Report 2021
The European Public Real Estate Association’s (EPRA) mission is to promote, develop and represent the European public real estate sector. As an�EPRA�member,�we�fully�support the�EPRA�Best�Practices�Recommendations which recognise the key performance measures, as detailed�above.�Specific�EPRA�metrics�can be found within the KPIs and Financial Review sections of this Report with further disclosures and supporting calculations on pages 127 to 129. We use a number of Alternative Performance Measures and these are discussed in more detail in the Financial Review on page 45.
97pEPRA NTA per share (2020: 93p)(2019: 93p)
93pEPRA NDV per share (2020: 88p) (2019: 88p)
105pEPRA NRV per share (2020: 102p)(2019: 101p)
£20.1mEPRA earnings (2020:�£19.9m)(2019:�£22.9m)
3.7pEPRA earningsper share (2020: 3.7p) (2019: 4.3p)
4.8%EPRA net initial yield (2020:�4.8%)(2019:�4.9%)
5.5%EPRA ‘topped-up’ net initial yield(2020:�5.4%)(2019:�5.3%)
8.8%EPRA vacancy rate (2020:�11.5%)(2019:�10.3%)
26.9%EPRA cost ratio1(2020:�28.3%)(2019:�22.9%)
20.8%EPRA cost ratio2(2020:�20.2%)(2019:�19.5%)
EPRA measures
£34mProfit after tax (2020:�£23m)(2019:�£31m)
£528mNet assets (2020:�£509m)(2019:�£499m)
£682mProperty valuation (2020:�£665m)(2019:�£685m)
6.6%Total return (2020:�4.5%)(2019:�6.5%)
0.0%Total shareholder return (2020:�3.6%)(2019:�10.1%)
97pNAV per share(2020: 93p)(2019: 93p)
6.2pEarnings per share(2020: 4.1p)(2019: 5.7p)
2.8pDividends per share (2020: 3.5p)(2019: 3.5p)
134%Dividend cover (2020:�105%)(2019:�122%)
Financial highlights
Read more on pages 30-33 and 44-51
Covid-19 The effects of the Covid-19 pandemic have been widespread, impacting the�UK�economy,�businesses�and�people’s�everyday�lives.�Our response to the pandemic is set out throughout this Report. In the Marketplace�section�we�look�at�its�impact�on�the�commercial�property market and how we are responding. In Managing Risks we have�described�the�impact�on�our�principal�and�emerging�risks.�We have�also�described�how�we�have�engaged�and�supported�our�occupiers and other stakeholders, in the Portfolio Review and Being Responsible sections.
Our Covid-19 response
1 Including direct vacancy costs2 Excluding direct vacancy costs

04
Picton Property Income Lim
ited Annual Report 2021
Business OverviewPicton at a Glance
Occupier focused, Opportunity led.We are an award-winning Real Estate Investment Trust (REIT) investing in UK commercial property. Our diversified property portfolio consists of 46 assets with over 50% invested in the industrial sector.
Our businessWe�acquire,�create�and�manage�buildings for around 350 commercial occupiers across a wide range of businesses. By applying insight, agility and a personalised service, we provide attractive, well-located spaces to help our occupiers’ businesses succeed and in turn enhance value for our shareholders. We have a long-term track record and have outperformed the MSCI UK Quarterly Property Index, producing upper�quartile�returns�over�one,�three,�five�and�ten�years,�and�since�inception.�
Our purposeThrough our occupier focused, opportunity led approach, we aim to be one of the consistently best performing�diversified�UK�REITs.�To us this means being a responsible owner of commercial real estate, helping our occupiers succeed and being valued by all our stakeholders.
Our values
PrincipledWe are professional, diligent and strategic.Demonstrated through our transparent reporting, occupier focused approach, alignment with shareholders, delivery of our Picton Promise, commitment to sustainability and positive environmental initiatives.
PerceptiveWe are insightful, thoughtful and intuitive.Demonstrated through our long-term track record, our gearing strategy, diverse sector allocation and engagement with our occupiers.
ProgressiveWe are forward-thinking, enterprising, and continually advancing. Demonstrated through our culture, work ethic and proactive asset management.
Corporate summary
£528mNet assets
£468mMarket capitalisation
£166mBorrowings
3.7%Dividend yield
1.0%Cost ratio
21%Loan to value
Portfolio summary
46Number of assets
£682mValue
4.8%Net initial yield
6.3% Reversionary yield
91%Occupancy
4.1m sq ftArea
Read more on pages 12–13

Annualised total property return (%)10.0
8.0
6.0
4.0
2.0
0
Picton MSCI
1 Year 3 Year annualised
5 Year annualised
10 Year annualised
Since inception
Picton All Property MSCI UK Quarterly Property Index15.0
(15.0)
(10.0)
(5.0)
0.0
5.0
10.0
Mar
20
06
Mar
20
07
Mar
20
08
Mar
20
09
Mar
20
10
Mar
20
11
Mar
20
12
Mar
20
13
Mar
20
14
Mar
20
15
Mar
20
16
Mar
20
17
Mar
20
18
Mar
20
19
Mar
20
20
Mar
20
21Picton All Property MSCI UK Quarterly Property Index300.0
0.0
50.0
100.0
150.0
200.0
250.0
Mar
20
07
Mar
20
08
Mar
20
09
Mar
20
10
Mar
20
11
Mar
20
12
Mar
20
13
Mar
20
14
Mar
20
15
Mar
20
16
Mar
20
17
Mar
20
18
Mar
20
19
Mar
20
20
Mar
20
21
05
Strategic ReportG
overnanceFinancial Statem
entsAdditional Inform
ationB
usiness Overview
Picton Property Income Lim
ited Annual Report 2021
Office weighting
36%South East 16%Rest of UK 11%City and West End 9%
Retail and Leisure weighting
11%Retail Warehouse 7%High Street Rest of UK 3%Leisure 1%
Top five occupiers
OccupierContracted rent
(£m)% of total
contracted rent
Public sector 2.1 5.0Whistl UK Limited 1.6 3.9B&Q Plc 1.2 3.0The Random House Group Limited 1.2 2.8Snorkel Europe Limited 1.2 2.8Total 7.3 17.5
Top five assetsAssets Property type Capital value (£m)
Parkbury Industrial Estate, Radlett, Herts. Industrial >60River Way Industrial Estate, Harlow, Essex Industrial 50-60Angel Gate, City Road, London EC1 Office 30-40Stanford Building, Long Acre, London WC2 Office 30-40Datapoint, Cody Road, London E16 Industrial 20-30
Industrial weighting
53%South East 40%Rest of UK 13%
Read more on pages 38–39
Read more on pages 40–41
Read more on pages 42–43
Indexed total property returns (Picton vs MSCI)
Outperformance track record
Total property return (%) (Picton vs MSCI)

06
Picton Property Income Lim
ited Annual Report 2021
Business OverviewPicton at a Glance continued
15 years of outperformanceOur occupier focused, opportunity led approach continues to deliver long-term shareholder value.
2005• The Company was
successfully launched as ING�UK�Real�Estate�Income Trust Limited on the�London�Stock�Exchange
2006• �Acquisition�of�£125�million�
portfolio, increasing the Company’s property assets
2010• �Acquisition�of�Rugby�
Estates Investment Trust� plc��
• Decision taken to internalise the Company’s management
2011 Name changed to Picton Property Income Limited
2008• Used the IPD (now MSCI)
Environmental Code for the collection, measurement and analysis of environmental information�on�our�office�properties to implement improvements
2009• During the global financial�crisis,�successful�renegotiation of loan covenants for nil cost
2012 • Internalisation is effective
from 1 January, with significant�saving�in�costs
• Company’s debt facilities refinanced
• Introduction of covered dividend policy
2013 • New�equity�raised�to�fund� property�acquisitions
2014 • Placing Programme initiated�to�raise�£100� million�of�new�equity
• £81�million�of�new�property�assets�acquired
• Acquired�Parkbury�Industrial Estate, Radlett, our largest industrial asset, through property swap
07
Strategic ReportG
overnanceFinancial Statem
entsAdditional Inform
ationB
usiness Overview
Picton Property Income Lim
ited Annual Report 2021
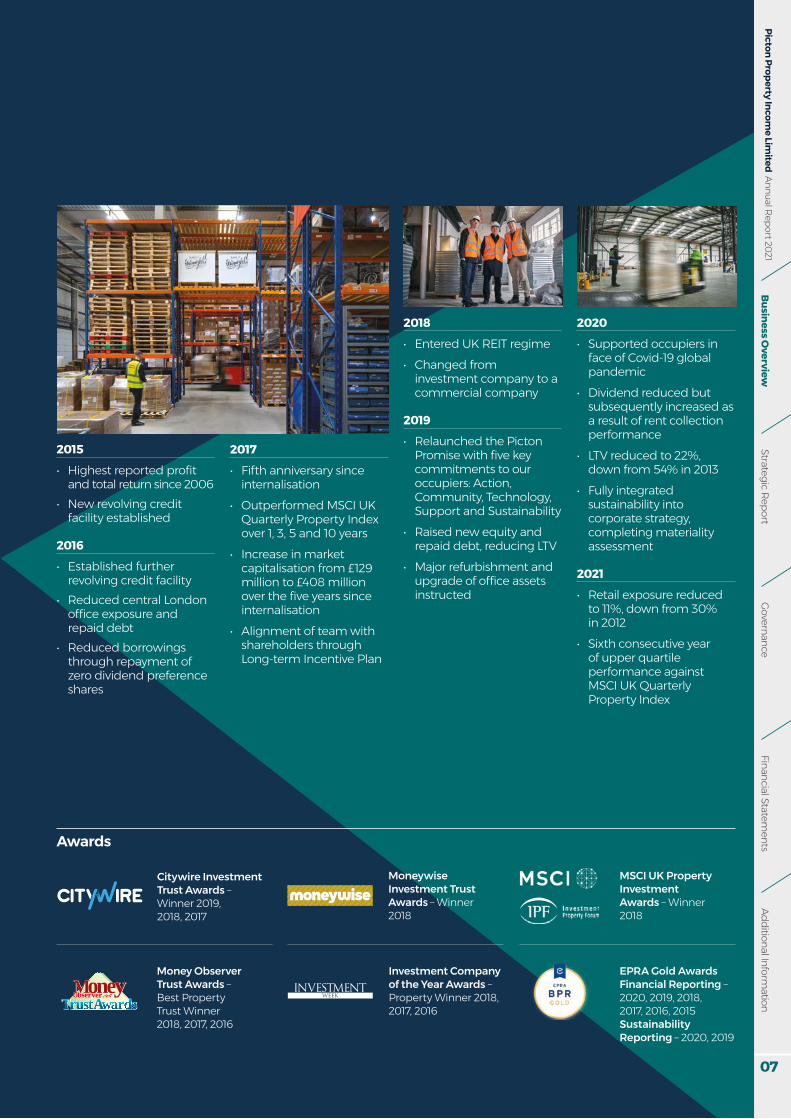
2018• Entered UK REIT regime• Changed from
investment company to a commercial company
2019• Relaunched the Picton Promise�with�five�key�commitments to our occupiers: Action, Community, Technology, Support and Sustainability
• Raised�new�equity�and�repaid debt, reducing LTV
• Major refurbishment and upgrade�of�office�assets�instructed
2020 • Supported occupiers in
face of Covid-19 global pandemic
• Dividend reduced but subsequently�increased�as�a result of rent collection performance
• LTV�reduced�to�22%,�down�from�54%�in�2013
• Fully integrated sustainability into corporate strategy, completing materiality assessment
2021• Retail exposure reduced to�11%,�down�from�30%�in 2012
• Sixth consecutive year of upper�quartile�performance against MSCI UK Quarterly Property Index
2015• Highest�reported�profit�
and total return since 2006• New revolving credit
facility established
2016 • Established further
revolving credit facility• Reduced central London office�exposure�and�repaid debt
• Reduced borrowings through repayment of zero dividend preference shares
2017 • Fifth anniversary since
internalisation • Outperformed MSCI UK
Quarterly Property Index over 1, 3, 5 and 10 years
• Increase in market capitalisation�from�£129�million�to�£408�million�over�the�five�years�since�internalisation
• Alignment of team with shareholders through Long-term Incentive Plan
Awards
Citywire Investment Trust Awards – Winner 2019, 2018, 2017
Investment Company of the Year Awards – Property Winner 2018, 2017, 2016
Moneywise Investment Trust Awards – Winner 2018
Money Observer Trust Awards – Best Property Trust Winner 2018, 2017, 2016
MSCI UK Property Investment Awards – Winner 2018
EPRA Gold Awards Financial Reporting – 2020, 2019, 2018, 2017, 2016, 2015 Sustainability Reporting – 2020, 2019

08
Picton Property Income Lim
ited Annual Report 2021
Business OverviewChair’s Statement
In my first year as Chair of Picton, I am pleased to be able to share with you the results for the 12-month period to 31 March 2021.
This has been an unprecedented year, with�significant�disruption�to�businesses, livelihoods, family and day-to-day life. During the year, we have remained focused on our three strategic pillars of Portfolio Performance, Operational Excellence and Acting Responsibly. As such, it gives me pleasure to be able to report that the business is in good shape,�delivering�a�profit�for�the�year�of�£34�million,�an�increase�of�over�50%�compared with the preceding year. This has been achieved during a period where we have also provided significant�assistance�and�support�to�help our occupiers cope with the disruption caused by the Covid-19 pandemic. This demonstrates the strength of our business model, our position entering the pandemic and our hands-on approach which has even led to growing occupancy over the year.
PerformanceWe�delivered�a�total�return�of�6.6%�over the year driven by portfolio growth in the latter half of the year. We have maintained our EPRA earnings despite being impacted by lower rent collection during the year, and have offset this with additional income generated through asset management transactions and�a�reduction�in�finance,�property and operating costs.
At a property level, the portfolio has again outperformed the MSCI UK Quarterly Property Index continuing our�track�record�of�upper�quartile�outperformance which spans the period since inception. Our share price has been more volatile over the period but has responded well to the increases in dividend that we have announced through the year. The share price still does not fully reflect�the�net�asset�value�of�the�business, but is currently in a better position than for many of our real estate peers.
Property portfolio The outperformance at a property level has been driven by our exposure to the industrial sector, which now accounts�for�53%�of�the�portfolio.�Also,�our retail and leisure exposure has reduced,�now�accounting�for�only�11%.�The combination of these two factors has been helpful alongside some key lettings and retaining many occupiers at or prior to lease-end. Broadly, rent collection for the year stands�at�92%�of�income�demanded,�and we expect this to continue to rise, but have made appropriate provisions to�reflect�the�likelihood�of�not�making�a full recovery.
These results show an improvement on the preceding year and underline the resilience of the business. Lena Wilson CBEChair
09
Strategic ReportG
overnanceFinancial Statem
entsAdditional Inform
ationB
usiness Overview
Picton Property Income Lim
ited Annual Report 2021
Capital structureWe are conservatively positioned with a Group loan to value ratio of 21%.�We�have�£50�million�available�through our revolving credit facility and assuming the economic recovery strengthens we will be seeking to deploy this, at least in part during the forthcoming year. We recognise that the current market cost of debt is lower than our own and where opportunities arise to reduce this on attractive terms, they will be pursued.
GovernanceWe continue to maintain strong corporate governance and during the year several changes to the Board have been made including my own appointment as Chair and that of Richard Jones as Chair of the Property Valuation Committee. I would like to thank�my�predecessor,�Nicholas�Thompson, for his years of service and similarly Roger Lewis who also stood down in the year.Despite not being able to meet physically due to the constraints of lockdown, I am pleased to have been able to spend time virtually with the Picton team and a number of larger shareholders. I look forward to continuing open and constructive engagement as we return to some degree of normality.
DividendsOur initial response to the pandemic was to introduce a more conservative distribution policy, recognising the uncertainty around the severity and impact�of�the�pandemic�on�our cash�flow.Since then, and based on robust performance, we have been able to increase�the�dividend�in�both�November and February such that the current�distribution�is�91%�of pre-pandemic�levels.�We�will�continue to work hard to further improve occupancy and income in order to get back to pre-pandemic levels, hopefully during the forthcoming year.
SustainabilityWe continue to make good progress on multiple fronts in respect of sustainability issues and during the year we joined the Better Buildings Partnership, a collaboration of the UK’s leading commercial property owners. Our focus for the coming year will be on establishing our pathway to achieving net zero carbon. We are mindful of the need to do this in a way�that�benefits�all�our�stakeholders.During the year we celebrated our fifteenth�anniversary�by�supporting�grassroots charities, helping support the work they do in this particularly difficult�period.
Outlook It is clear that we are well positioned and have built up an impressive track record over the years. What is more important is that this is maintained, and that we can innovate and position the business to ensure that we capture the positive opportunities that are likely to arise following this long period of disruption. Thankfully there is now light at the end�of�the�tunnel,�but�we�are�mindful of the changing landscape and longer-term impacts that the pandemic might have on both the economy and how real estate is used. Along�with�my�fellow�Board�members, I am excited about the potential ahead.
Lena Wilson CBEChair26 May 2021

10
Picton Property Income Lim
ited Annual Report 2021
Q&A with Lena Wilson CBEThe Picton team had the opportunity to conduct a virtual Q&A with Lena Wilson, our new Chair.
Business OverviewChair’s Statement continued
Q
What attracted you to Picton? A As I carried out my research for the role it was clear to me that Picton was an understated jewel in the crown as far as the sector is concerned. I was impressed with Picton’s track record and how the Company has dealt with the challenges of the past year. I believe in the business and it is a sector that is important to the economy. In particular, I also think I can add value given my experience.
Q
What are your first impressions of the Company? A I’m pleased to say that I am very glad I joined!�I�think�Picton�is�at�an�inflection�point in terms of opportunity, building on its long-term performance. I am looking forward to being part of the team and the journey.
Q&A

11
Strategic ReportG
overnanceFinancial Statem
entsAdditional Inform
ationB
usiness Overview
Picton Property Income Lim
ited Annual Report 2021
Q
What do you think are Picton’s core strengths? A As part of my due diligence before joining the team I reached out to a range of stakeholders, and they all told me what Picton’s core strengths are - and it’s the team and the culture.�With�a�terrific�track�record�to be proud of, Picton has made a series of very sound decisions, controlled its costs and pursued the right opportunities. For the business to be in the position it is in after the last 12 months is remarkable, a view shared by stakeholders.
Q
What are the key priorities for the business next year? A In the short-term, planning and preparing for an end of lockdown recovery and working closely with all stakeholders, as companies start to reoccupy their buildings, but also to assess longer-term opportunities for growth.While good progress has been made against a number of sustainability priorities over the course of this year, a key focus will also be developing our net zero carbon pathway.
Q
What in your view is the biggest challenge facing the business and the real estate sector? A The biggest challenge facing all businesses at the moment is economic uncertainty and the real estate sector is no exception. The economy has been described as a tightly wound spring that is ready to bounce back post vaccine, but there�are�significant�challenges�too. The slower vaccine rollout across Europe will have an effect across a range of sectors, as will how we return to workplaces and what the future of work, leisure, hospitality and retail look like.Having good networks, insights and market knowledge will be key for the real estate sector and those who can access capital, be adaptive�and�have�the�confidence�to seize opportunities will prosper.
Q
What do you do when you are not at work? A I try to really enjoy life and that includes work. I am very fortunate to have worked in so many countries and I still love to travel. Friendships and family are also very important to me. I am a big consumer of broad culture, live music, theatre and art and�I�read�widely.�I�like�to�keep�fit�and�used�to�be�quite�a�competitive�runner, but now walk a lot, do some high intensity workouts and try to make time for daily yoga practice and meditation. I realised a while back that overall wellness means more than�just�physical�fitness�and�I�believe�that approach has served me well across a range of high-pressure roles.
Picton Property Income Lim
ited Annual Report 2021
12
Strategic ReportBusiness Model
Our Business Model
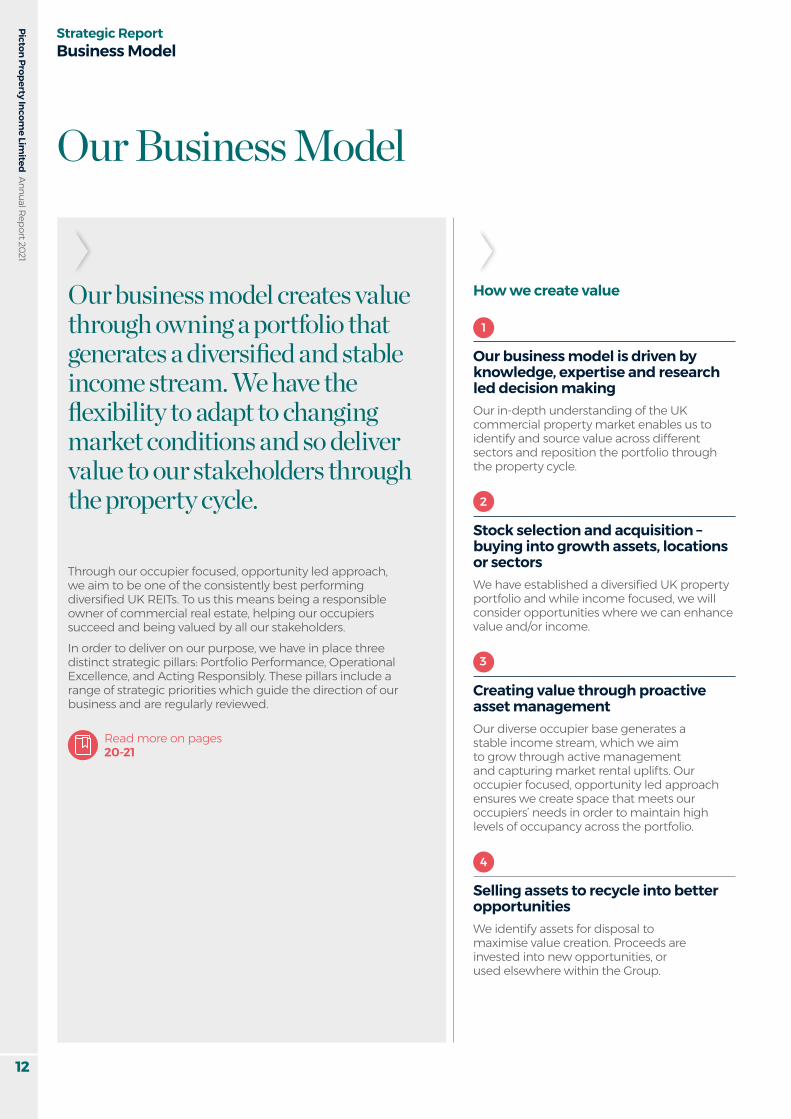
Our business model creates value through owning a portfolio that generates a diversified and stable income stream. We have the flexibility to adapt to changing market conditions and so deliver value to our stakeholders through the property cycle.
Through our occupier focused, opportunity led approach, we aim to be one of the consistently best performing diversified�UK�REITs.�To�us�this�means�being�a�responsible�owner of commercial real estate, helping our occupiers succeed and being valued by all our stakeholders. In order to deliver on our purpose, we have in place three distinct strategic pillars: Portfolio Performance, Operational Excellence, and Acting Responsibly. These pillars include a range of strategic priorities which guide the direction of our business and are regularly reviewed.
Read more on pages 20-21
1
Our business model is driven by knowledge, expertise and research led decision makingOur in-depth understanding of the UK commercial property market enables us to identify and source value across different sectors and reposition the portfolio through the property cycle.
2
Stock selection and acquisition – buying into growth assets, locations or sectorsWe�have�established�a�diversified�UK�property�portfolio and while income focused, we will consider opportunities where we can enhance value and/or income.
3
Creating value through proactive asset management Our diverse occupier base generates a stable income stream, which we aim to grow through active management and capturing market rental uplifts. Our occupier focused, opportunity led approach ensures we create space that meets our occupiers’ needs in order to maintain high levels of occupancy across the portfolio.
4
Selling assets to recycle into better opportunities We identify assets for disposal to maximise value creation. Proceeds are invested into new opportunities, or used elsewhere within the Group.
How we create value

Governance
Financial Statements
Additional Information
Picton Property Income Lim
ited Annual Report 2021Strategic Report
Business Overview
13
This is underpinned by:
Risk managementOur diverse portfolio and occupier base spreads risk and generates a stable income stream throughout the property cycle. We will adapt our capital structure and use debt effectively to achieve enhanced returns. We will maintain a covered dividend policy, to generate surplus cash and allow us to invest back into the portfolio.
Responsible stewardshipWe have a responsible and ethical approach to business and sustainability is embedded within our corporate strategy. We understand the impact of our business on the environment and are committed to creating and delivering value for the�benefit�of�all�our�stakeholders.�
Selli
ng a
sset
s to
recy
cle
into
bet
ter
oppo
rtun
ities
4
Stock selection
and acquisition
2
Creating value throughproactive asset management3
Our business model is driven by knowledge, expertise and research
led decision making
1
Creating and delivering value for our stakeholders:
Shareholders
£34mProfit�after�tax�
Occupiers
88%Retention rate
Communities
£29,000Charitable donations
Our people
85%Employee satisfaction score
The environment
92%EPC ratings A-D
For more detailed information on our stakeholders, see our Section 172 statement on pages 62-63

14
Picton Property Income Lim
ited Annual Report 2021
Strategic ReportOur Marketplace
Our MarketplaceSince the Covid-19 pandemic took hold its effects have been far reaching and dramatic; however, the UK Government’s comprehensive stimulus package has helped to protect livelihoods and provided much-needed support for households and businesses.
Economic backdropThe UK’s vaccination programme has been one of the most well-executed globally. We are close to restrictions being fully lifted and there is a much-anticipated economic recovery starting to emerge. During the year the UK left the European Union, however there remain several matters to be resolved, such as financial�passporting�rights.�Pending�any major Brexit-related disruption or problematic new coronavirus variants, the outlook for the UK economy looks considerably brighter than it did this time last year.During 2020, GDP contracted by -9.8%,�marking�the�largest�annual�fall in UK GDP on record. The largest�quarterly�fall�was�during�the�second�quarter�of�2020�following�the�first�and�strictest�period�of�lockdown. Thankfully, a double dip recession was avoided. To mitigate the impact of the pandemic and stimulate the economy, there has been a large response both in terms of UK Government policy and measures introduced by the Bank of England, including the furlough scheme, business rates relief, a ban on commercial evictions, record ultra-low�interest�rates�(0.1%�since�March�2020) and Quantitative Easing. In stark contrast to previous periods of recession, average house prices in�the�UK�rose�7.7%�during�2020,�largely thanks to the stamp duty holiday, which has been extended in part until September 2021.The UK unemployment rate hit a five-year�peak�of�5.1%�in�November�2020,�1.3%�higher�than�a�year�earlier.�The furlough and self-employed support schemes were extended to September 2021 and this plus the easing of restrictions is hoped will keep a lid on rising unemployment.
Stanford BuildingLondon
SwiftboxRugby

Governance
Financial Statements
Additional Information
Picton Property Income Lim
ited Annual Report 2021Strategic Report
Business Overview
15
year was a result of a smaller decline in capital values; capital growth was -3.2%�in�the�year�to�March�2021,�better�than�the�-4.7%�recorded�for�the�previous year. The income return was 4.5%,�the�same�as�the�preceding�year.The industrial sector had a strong year and was the top performing sector�for�the�fifth�consecutive�year.�The industrial total return for the year�ending�March�2021�was�14.3%,�with capital growth at a three-year high�at�9.6%�and�an�income�return�of�4.3%.�Industrial�ERV�growth�for�the�period�was�2.8%,�with�a�sub-sector�range�of�2.2%�to�3.8%.�Capital�growth�ranged�from�6.1%�to�13.0%�within�sub-sectors.�Equivalent�yields for industrial property now stand�at�5.0%�(March�2020:�5.3%).�The�office�sector�faced�a�degree�of�uncertainty this year, as the success of working from home has provoked thought�over�future�office�space�requirements�for�many�occupiers.�The�office�sector�produced�a�total�return�of�-0.8%�for�the�year�to�March�2021,�comprising�-4.5%�capital�growth�and�3.8%�income�return.�All�Office�annual�rental�growth�was�-1.0%�ranging�from�-2.1%�to�1.2%�within�sub-sectors.�Office�capital�growth was negative across all sub-sectors,�ranging�from�-6.7%�to�-1.7%.�Equivalent�yields�for�office�property�now�stand�at�5.8%�(March�2020:�5.6%).�It was an extraordinarily challenging time for the retail sector, with three national lockdowns resulting in the closure of all non-essential shops for much of the year. Months of lost trading and dramatically reduced footfall due to Covid-19 exacerbated an already tough environment for retailers, which has led to a high number of CVAs and administrations during the year. The retail sector produced�a�total�return�of�-8.1%�for the year to March 2021. This
comprised�capital�growth�of�-12.9%�and�income�return�of�5.5%.�Rental�values�fell�-9.0%�over�the�period�and�were negative across all sub-sectors, ranging�from�-20.1%�to�-1.4%.�Retail�sub-sector capital growth ranged from�-27.4%�to�3.6%.�Supermarkets�were the only retail sub-sector to record positive capital growth. Equivalent�yields�for�retail�property�now�stand�at�6.7%�(March�2020:�6.4%).According to Property Data, the total investment volume for the year to�March�2021�was�£41.5�billion,�a�-28%�decrease�on�the�year�to�March�2020. The volume of investment by overseas investors in the year to�March�2021�was�£19.5�billion,�accounting�for�47%�of�all�transactions.�When looking at average returns at the All Property level, the year to March 2021 was disappointing but not surprising given the plight some sectors faced during the pandemic. However as always, the devil is in the detail as there was a marked range of returns across sectors. At the March 2021 year end the difference between the highest and lowest performing sectors has never been more polarised. There are risks and heightened uncertainty to navigate but also opportunity and optimism regarding the speed and strength of recovery in the latter half of 2021. Low interest rates and low returns from Government bond yields make investment into well-let commercial property with a secure income stream an attractive proposition.
The annual percentage change in the consumer price index has been at�or�below�1%�since�April�2020�and�in�March�2021�stood�at�0.7%.In March 2021 retail sales rose higher than pre-pandemic levels, even before non-essential shops reopened. Online retail reached a record proportion of total retail sales in January�2021�of�36.4%,�as�consumers�were restricted from using physical stores. Of course, whilst some retail sectors have struggled, others have thrived.�As�people�were�confined�to their local area, businesses still able�to�trade�benefitted�from�this�additional footfall at the expense of retailers situated at transport hubs or in central business districts. Many companies with an established online offering had a strong year. Many households were fortunate to see income levels maintained and outgoings reduced, contributing to a record increase in the household savings ratio, which reached a peak of�25.9%�in�the�second�quarter�of 2020. As restrictions are eased and retail and leisure businesses reopen, it is expected that this elevated savings ratio will contribute to an economic recovery.The recovery has begun to gather pace. It is anticipated that healthy consumer spending and interest rates staying lower for longer will contribute to a rapid rebound in the second half�of�2021.�The�Office�for�Budget�Responsibility has forecast GDP growth�of�4.0%�for�2021�and�a�recovery�to pre-pandemic levels by mid-2022.
UK property marketAccording to the MSCI UK Quarterly Property Index, commercial property delivered�a�total�return�of�1.2%�for�the year ended March 2021, which compares�to�-0.4%�for�the�year�ending�March 2020. The increase on last

Picton Property Income Lim
ited Annual Report 2021
16
Market drivers and impactsMarket driver Impact
Covid-19 ӱ Economic, social, environmental and health ramifications�will�be�felt�throughout�the�world�for�many years to come.
ӱ For the property sector, the accelerated changes in the way we live, work, socialise and shop are likely to have a lasting impact on the built environment.
The�Covid-19�pandemic�has�been�a�significant�disruptor�to�many�aspects�of�life�since�the�first�lockdown began in March 2020. The legacy of the pandemic will be far reaching and is yet to be fully realised. The impact of the pandemic affects the economic, property, technology and environmental market drivers described below and is referenced throughout this Report.The vaccine rollout is now well underway and we are following the UK Government’s roadmap to post-Covid normality.
Economy ӱ The Government reportedly plans to invest in infrastructure,�the green�economy�and�support�ailing�towns in order to stimulate economic growth.
ӱ Interest rates are expected to stay lower for longer. ӱ The household savings ratio has remained at an
elevated level, with the potential to boost consumer spending when restrictions are lifted.
ӱ Due to the stimulus package, UK Government borrowing has reached the highest levels since World War�II.�Necessary�tax�increases�will�impact�UK businesses�and�households�in�the�medium-term.�There�is�an�increased�risk�of�inflationary�pressure.
Since�March�2020�and�the�first�national�lockdown,�the UK has been on a pathway of increased understanding, adaptation and coping with the Covid-19�pandemic.�Subsequent�lockdowns�were�less severe on the economy, allowing the UK to avoid a double dip recession. There has been extensive Government stimulus to protect businesses and livelihoods. Not all parts of the�economy�have�been�equally�affected.�The�success of the UK’s vaccination programme is expected to allow a strong and rapid recovery during�the�second�half�of 2021.There are some elements of the Brexit transition process still underway. Amongst issues still to be determined�are�passporting�rights�for�financial services.
Property cycles ӱ The retail sector has been operating within a very challenging environment, with declining rents and capital values. There has been a recent improvement in retail capital value growth, particularly for retail warehouses and supermarkets, however it is yet to be known if all sub-sectors have reached a nadir.
ӱ The impact of working from home during the pandemic�on�offices�has�caused�uncertainty�within the�sector�and�led�to�a�decline�in�capital�values. There is increased�polarisation�between�Grade A and�other�offices,�with�many�occupiers�pursuing a�flight�to�quality.�
ӱ There is high demand from both occupiers and investors within the industrial sector leading to further price rises.
The property market is cyclical, with performance linked to economic growth. The balance of supply and demand in the investment and occupier markets impact pricing and rental growth respectively. Historically, all property sectors have moved through cycles broadly in unison; however, more recently there is a greater divergence between sectors. The declines in property values as result of Covid-19 were more strongly felt in retail and leisure; periods of forced closure, increased online spending, retail failures and CVAs all blighted the sector.�Industrial property rallied during 2020 as demand for warehousing grew, helped by an acceleration in online spending.
Strategic ReportOur Marketplace continued
Our Covid-19 response

Governance
Financial Statements
Additional Information
Picton Property Income Lim
ited Annual Report 2021Strategic Report
Business Overview
17
Market drivers and impactsMarket driver Impact
Technology ӱ Remote�working,�flexible�working�and�reduced�business travel are facilitated by the advancement of online�communications�platforms.�Although�accelerated by the pandemic, these working patterns will continue in some form of hybrid model.
ӱ The Government’s agenda to ban sales of new combustion engines by 2030 will shape requirements�for�electric�vehicle�charging�where�we�live, work and shop, with implications for buildings, power supply and parking arrangements. A longer-term consideration is the rollout of the 5G network, enabling driverless vehicles.
ӱ There is a heightened need for data storage and datacentres.�Big�Data,�Artificial�Intelligence,�Machine�Learning and Cloud Computing are shaping the future�of�the�workforce�and�the�requirements�for buildings�in�which�they�operate.�Bolstering�cyber security�and�secure�data�storage�is�high�on�corporate agendas.
ӱ For retailers, investment in online platforms and fulfilment�is�paramount.�The�proportion�of�online�spending is unlikely to revert to pre-pandemic levels. Longer-term, the increased use of robotics, electric industrial vehicles and drones has the potential to impact�the�way�online�orders�are�fulfilled�and�industrial property is occupied.
The technology trends set to directly impact the property sector in the short to medium-term are wide ranging, from smart building technology, the 5G�network,�increased�adoption�of�electric�vehicles,�Artificial�Intelligence,�robotics,�Big�Data�and Cloud�Computing.�Competitiveness in a post-pandemic world will depend on a company’s ability to thrive in the digital environment. The use of analytics to make data-backed decisions provides�confidence�to�investors.�Property�sectors�are�all�uniquely�impacted�by�technological advances in multiple areas, with each facing�its�own�benefits�and�challenges.��
Environmental and social responsibility ӱ Sustainability is becoming widely and fully embedded into Government and corporate agendas.
ӱ TCFD is promoting the improvement and increased reporting�of�climate-related�financial�information�and�enabling progress to be measured against science-based targets.
ӱ The social and human cost of achieving success is increasingly considered. Society is holding Government and corporations accountable for the wider impact of investment decisions.
ӱ It is fully recognised that there are heightened costs associated with owning and occupying non-energy efficient�buildings�and�there�is�a�price�premium�on�those�which�meet�modern�requirements.�
ӱ Occupiers are increasingly considering employee wellbeing when selecting work space. Natural light, biophilia,�fitness�facilities�and�other�occupier�amenities all provide a competitive edge.
During lockdown there has been increased reflection�and�environmental�awareness,�with�particular focus on climate change. The year could be seen as the tipping point for organisations embedding climate risk into corporate strategy and considering�the�impacts�of�climate�change�on investments.�The Government has declared a target of bringing all UK greenhouse gas emissions to net zero by 2050.�With the pandemic amplifying social injustices and inequalities,�societal�value�has�also�moved�up�the�corporate agenda. There is recognition that we need to transition to a fairer and greener economy.

Picton Property Income Lim
ited Annual Report 2021
18
Strategic ReportOur Marketplace continued
What this means for Picton ӱ The accelerated structural shift towards online
retail, growth in delivery apps and increased expectation for shorter delivery times mean industrial property continues to remain in demand. The�portfolio�is�well�positioned�by�being overweight�to�the�industrial�sector.
ӱ Our occupier focused approach has enabled us to capitalise on strong demand for industrial property and grow ERVs through new lettings, renewals and rent reviews.
Our response to these trends ӱ We will continue to capture rental growth
through new lettings and proactive portfolio management.
ӱ We will strategically maintain our overweight position to the sector.
ӱ We�will�continue�to�acquire�complementary�assets where possible, whilst remaining selective given the recent increase in pricing.
ӱ We envisage only limited and selective disposals.
2020 was a strong year for the industrial sector, which saw high levels of occupational demand, particularly for logistics units, as retailers and third-party�logistics�companies�invested�in�fulfilment�of�online orders in response to the pandemic. The proportion of retail spend online reached a record high and is not expected to revert to pre-pandemic levels.�Last�mile�logistics�requirements�have�sustained upward pressure on rents, particularly in urban locations. The sector is also experiencing strong investor demand,�with�capital�values�increasing�9.6%�in�the�year to March 2021. The industrial sector accounted for�29%�of�total�investment�volumes�at�a�value�of�£12 billion.�There�is�strong�competition�to�invest�in�industrial assets which has driven yields down.The outlook for the industrial sector is a continuation of these trends. Standard industrial units in London and the South East are forecast to be amongst the top�performing�sub-sectors�in�the�short�to�medium-term.
Industrial market trends
Throughout the year the acceleration in structural changes within the main property sectors has contributed to increased polarisation of performance.
The�industrial�sector�has�benefitted�from�the�increase�in�online consumer spending to the detriment of bricks and mortar retail, whilst enforced working from home is likely to lead to a longer-term shift towards a more hybrid model of home�and�office-based�working.���
Our Covid-19 response

Governance
Financial Statements
Additional Information
Picton Property Income Lim
ited Annual Report 2021Strategic Report
Business Overview
19
What this means for Picton ӱ The�office�sector�now�brings�a�heightened�level�of�
risk, as long-term working from home continues to impact the sector.
ӱ With weaker occupier demand, the focus is on quality�of�office�space.�Our�offices�must�continue�to�go above and beyond occupiers’ expectations.
ӱ We�will�need�to�provide�more�flexible�leasing�arrangements�reflecting�the�current�market.
ӱ There is a greater emphasis on wellbeing within the�office�environment.
What this means for Picton ӱ We will continue to maintain an underweight
position to the retail and leisure sectors. ӱ We have had to provide rent holidays and
assistance on a bespoke basis to help our occupiers through the crisis.
ӱ We expect rental income in this element of the portfolio to remain reduced in the short to medium-term.
Our response to these trends ӱ We�will�continue�to�actively�manage�the�office�
portfolio and engage with existing and potential occupiers to grow occupancy and income.
ӱ We have been upgrading space, focusing on amenities, and making improvements in energy efficiency.
ӱ Due diligence and research will ensure that the office�portfolio�is�positioned�in�the�most�accessible and desirable locations.
ӱ We will be increasingly selective when considering�office�acquisitions.
Our response to these trends ӱ We will seek to maintain occupancy, even if this
means having to accept lower rental levels. ӱ We will continue to reposition retail assets and
reduce our weighting through disposals, seeking opportunities to sell to special purchasers and owner-occupiers where appropriate.
ӱ With revised pricing, we will look cautiously at potential�acquisitions�within�selective�retail�sub-sectors.
With�office�workers�proving�during�the�pandemic�that�working from home is a viable option, many companies are�likely�to�incorporate�an�element�of�flexible�and�home working post-pandemic in a hybrid model, but the�office�is�by�no�means�redundant.�Reflecting�uncertainty�surrounding�the�sector,�during�the�year�to�March�2021,�capital�values�decreased�-4.5%�and yields moved out 20 basis points. Rental values declined�-1.0%.The�role�of�the�office�is�evolving�into�a�hub�for�face-to-face interaction, collaboration and team building, and plays an important part in attracting talent, showcasing company culture, training and mentoring. The layout is likely to change, with the ratio of desk to collaborative meeting space switching, leading to less densely populated�offices�rather�than�a�dramatic�reduction�in floorspace.�Occupiers�are�seeking�higher�quality,�digitally capable, sustainable spaces with a greater emphasis on employee wellbeing. Vacancy rates have risen but remain low by historic standards, and with limited new supply in the pipeline it is not expected that rental values will suffer more than a short-term dip. London and large city centre office�markets�are�forecast�to�perform�better�than�the�All Property average.
Both the retail and leisure sectors have been severely affected by the pandemic and occupier failures. The retail sector has experienced a price correction, with capital�values�falling�-12.9%�and�rents�down�-9.0%�in�the year�to�March�2021.�Even as restrictions ease and trade improves, it looks unlikely�that�there�will�be�sufficient�demand�to�fill�the high�numbers�of�vacant�units.�The�sector�faced�oversupply and legacy issues prior to the pandemic which have only been exacerbated.The UK Government’s change in use class restrictions will gradually allow repurposing of retail space and tackle the demand/supply balance in the longer-term. Until the oversupply is addressed in town centres, we do�not�expect�to�see�any�significant�recovery�in�capital�or rental values.However, it is increasingly apparent that there is not a ‘one�size�fits�all’�outlook�for�retail�and�leisure�property.�Retail warehouses are starting to plateau and are forecast to strongly outperform shopping centres and high street retail.
Office market trends
Retail and Leisure market trends

20
Picton Property Income Lim
ited Annual Report 2021
Strategic ReportOur Strategy
We have a strategy focused on delivering our purposePurposeThrough our occupier focused, opportunity led approach, we aim to be one of the consistently best performing diversified�UK�REITs.�To�us�this�means�being�a�responsible�owner of commercial real estate, helping our occupiers succeed and being valued by all our stakeholders.
Strategy In order to deliver on our purpose, we have in place three distinct strategic pillars: Portfolio Performance, Operational Excellence and Acting Responsibly. These pillars include a range of strategic priorities which guide the direction of our business and are regularly reviewed.
Integrating sustainability into our corporate strategyWe believe that sustainability has to be fully embedded into all of our activities. A responsible and ethical approach to�business�is�essential�for�the�benefit�of�all�our�stakeholders�and understanding the long-term impact of our decisions will help us to manage risk and continue to generate value.
Portfolio Performance
1 Creating and owning a portfolio which provides income and capital growth
2 Growing occupancy and income profile
3 Enhancing asset quality, providing space that exceeds occupier expectations
Sustainable buildings See pages 54-61
4 Outperforming the MSCI UK Quarterly Property Index
Associated Risks
2 4 5 6 7 8 Connected KPIs
A C D G I J
1
2
3
Sustainabilitygovernance
Envi
ronmental
focus
Sustainable
buildings
employees
Our
engagement
Stakeholder
Read more on pages 54–61

Governance
Financial Statements
Additional Information
Picton Property Income Lim
ited Annual Report 2021Strategic Report
Business Overview
21
Operational Excellence
1 Maintaining an efficient operating platform, utilising technology as appropriate
2 Having an agile and flexible business model, adaptable to market trends
3 Delivering earnings growth
4 Having an appropriate capital structure for the market cycle
5 Growing to deliver economies of scale
Acting Responsibly
1 Ensuring we maintain our company values, positive working culture and alignment of the team
Our employees See pages 54-61
2 Working closely with our occupiers, shareholders and other stakeholders
Stakeholder engagement See pages 54-61
3 Ensuring sustainability is integrated within our business model and how we and our occupiers operate
Environmental focus See pages 54-61
1
2
3 1
2
3
Read more on pages 30-33 and pages 49-51
Associated Risks
1 3 4 10 11 Connected KPIs
E F H
Associated Risks
4 9 Connected KPIs
B K L

Picton Property Income Lim
ited Annual Report 2021
22
Strategic ReportChief Executive’s Review
Despite the challenges of this year, we have been able to successfully navigate the disruption caused by the Covid-19 pandemic and deliver positive results which highlight the strength and resilience of the business.
It has probably been one of the hardest 12-month periods in which to operate, and few could have foreseen the scale and extent of the disruption caused by lockdown rules. As a team, we have worked remotely for the whole year and have only all been able to meet in person on one socially distanced occasion. The team has pulled together incredibly well and we have been able to run the business effectively, helped to some extent by our small size and nimble approach. We have not made redundancies, furloughed any employees or needed any form of Government support. We have supported our occupiers this year and provided help where needed.�This�has�required�a�delicate�balance, but to have achieved the financial�results�we�have,�whilst�simultaneously supporting so many of our occupiers throughout the year, is an accomplishment we are particularly proud of. Set out below is a summary of our performance against our strategic priorities. Almost all our KPIs show progress against the previous year and further details are provided in that section of the Report.
Portfolio PerformanceWe have continued to outperform the MSCI UK Quarterly Property Index and�have�delivered�upper�quartile�performance for the sixth consecutive year. Over the year we ranked 24 out of the 232 portfolios in the MSCI benchmark and over the longer-term have ranked 15 out of 99 portfolios over the 15 years since inception.Despite the impact of lower rent collection, we have been able to grow income across the portfolio on a like-for-like basis through letting and asset management activity, which has generated additional income. We have had to think creatively around some of the occupier assistance that we have given this year. Despite having a short-term impact on income, this has delivered longer-term value for our investors. Examples of this are where leases have been extended, rent reviews have been agreed in advance or longer-term payment plans have been put in place. Pleasingly, the contractual passing rent and ERV of the portfolio have both grown during the year.
£34mProfit after tax
£528mNet assets
97pNAV per share
6.6%Total return
We have increased occupancy and continued to deliver upper quartile returns, whilst supporting our occupiers through an incredibly difficult period.Michael MorrisChief Executive

Governance
Financial Statements
Additional Information
Picton Property Income Lim
ited Annual Report 2021Strategic Report
Business Overview
23
We have continued to improve the portfolio and reposition assets. As we upgrade space we are also thinking about�the�quality�of�accommodation�from a wellbeing and environmental perspective. These are both themes that have become increasingly relevant during lockdown. We have converted�retail�to�office�premises�and have obtained planning consent to�convert�leisure�into�offices,�for�a�project that is due to complete this year. This will further help to reduce our overall retail and leisure exposure, which�now�stands�at�only�11%.�
Operational Excellence Our portfolio positioning and conservative gearing mean that we were in a strong position entering this crisis. At an early stage, we took the�prudent�but�difficult�decision�to reduce the dividend, because at that time it was not clear how damaging the impact of lockdown restrictions would prove to be across our occupiers’ businesses and�to�our�financial�performance.
Over the year, we have received 92%�of�the�rents�due�and�this�led�us to partially restore the dividend in November 2020 and then in February 2021, such that the current dividend�is�91%�of�the�pre-pandemic�level. We maintained a covered dividend throughout the year with our EPRA earnings remaining stable relative to last year, an outcome that was less certain 12 months ago.We have been able to reduce costs, both our own operating costs and also for our occupiers, particularly in offices�which�were�not�fully�occupied.�As we have grown occupancy during the year, this has further helped to reduce costs. Finance costs are lower, following the repayment of our revolving credit facilities at the end of last year, and further debt amortisation this year. Administrative expenses are also lower and by relocating to a former retail void within the portfolio there will be further savings in the future. We are mindful that growth will�deliver�benefits�through�the�economies of scale embedded within our internalised model. Whilst�we�have�sought�to�acquire�assets this year, the investment market has been disrupted with lower investment volumes.
We made one disposal during the year�and�no�acquisitions,�despite�considering a number of opportunities as investment markets opened up in the latter part of 2020.
Acting ResponsiblyThis is at the heart of what we do, but there has never been a year when our occupiers have needed more support. In many instances, they have not been able to fully utilise our buildings. Our occupier focused approach and commitment through the Picton Promise of - Action, Community, Technology, Support and Sustainability, has never resonated so loudly. In total over the year we have provided some form of support to nearly one third of our occupiers. The team has dealt with all occupiers personally, agreeing bespoke solutions depending on the occupier, the type of asset and lease terms. A very small proportion of our occupiers have not paid and refused to engage, but until the Government moratorium on recovery of rent arrears ends, these discussions will be postponed until a later date.
Our Covid-19 response
Read more on pages 26–27

Picton Property Income Lim
ited Annual Report 2021
24
Outlook Our portfolio structure, conservative gearing and potential to grow income and value through leasing activity put us in a strong position looking forward. We have invested in the portfolio in recent years, upgrading the�quality�of�accommodation,�giving�us�confidence�in�our�ability�to�let�it.�The pandemic and its impact are sadly not completely behind us, and there are likely to be more hurdles to overcome. The impacts of the unwinding of Government support,�the�continued�efficacy�of�the vaccine and speed in which we return to normal, including tourism, travel and even the daily commute to�the�office,�are�still�not�clear.We will continue to create opportunities from our existing portfolio and more widely as the UK gradually returns to life as normal and lockdown conditions ease.
Michael MorrisChief Executive26 May 2021
Strategic ReportChief Executive’s Review continued
For�the�year�we�wrote�off�£1.6�million�of debts, and increased the provision against�occupier�debtors�by�£0.2�million, with the total provision at 31�March�2021�standing�at�£1.6�million.�Of the occupiers we have helped, the level of assistance has varied, from allowing�a�more�flexible�payment�plan, generally in the form of monthly rather�than�quarterly�payments,�to�instances where we have agreed some form of short-term rent write-off. In some cases, these reductions have been tied into future events, e.g. future rent reviews, lease breaks and extensions or, where there has been no conditionality, based on need. We have tried to be fair in our approach and would hope that our longer-term view will be recognised in future relationships. Our Responsibility Committee has made good progress on sustainability matters and has identified�clear�targets�for�material�issues. During the year we joined the Better Buildings Partnership and our focus now is on our commitment to becoming net zero carbon. This is detailed in the Being Responsible section of this Report.As mentioned previously, the team has worked incredibly hard this year�under�difficult�circumstances.�I would hope that despite our physical remoteness we have been able to maintain the culture and values that underpin our business. We have been there for employees when needed and our employee engagement feedback supports this. Our recent move to Stanford Building�significantly�improves�the�quality�of�our�workspace�and�we�will�see�the�full�benefit�of�this�once�lockdown restrictions ease. Similarly we have engaged with shareholders virtually and have discussed activity and progress throughout the year in conjunction with our brokers and corporate advisers. We continue to maintain an ‘open door’ policy and aim to be as transparent as possible in the way we communicate.
We will continue to create opportunities from our existing portfolio. Michael MorrisChief Executive

Governance
Financial Statements
Additional Information
Picton Property Income Lim
ited Annual Report 2021Strategic Report
Business Overview
25
We have restructured the portfolio over the year to reduce our retail and leisure exposure further, through a disposal and repositioning of an asset.�We�now�have�53%�of�the�portfolio�in�industrial,�36%�in�offices�and�only�11%�in�retail�and�leisure.Bridge Street, Peterborough, a high street retail asset, was sold for�£4.0�million�in�December.�The�property comprises two retail units, with one let to TK Maxx who are vacating in June 2021 and the other vacant and previously occupied by New Look. The asset was sold to Peterborough City Council who intend to convert the building into a new city library and community hub.�The�sale�price�was�30%�ahead�of the March 2020 valuation.We completed the refurbishment of Stanford Building and enhanced the value by obtaining planning consent to�convert�the�first�floor�from�ancillary�retail�to�office�space.�The�change�of use makes the remaining retail space more appealing to potential occupiers who are seeking smaller stores,�whilst�the�first�floor�office�ERV�is�nearly double the previous retail ERV. We have now been able to reclassify this�asset�as�a�West�End�office,�being the predominant value use. Regency Wharf in Birmingham is a two-building leisure scheme located adjacent to the iconic Gas Street Basin in central Birmingham.
Our proactive approach to asset management alongside�our�operational�flexibility�provides�opportunities to restructure the portfolio as we see appropriate.
Our strategy in action
We have obtained planning consent for�a�change�of�use�to�offices�in�respect of the vacant rear building. The building will be fully refurbished this year and will provide self-contained warehouse style space overlooking�the�canal.�The�office�ERV�is�nearly double the previous leisure ERV.
Operational Excellence
1
2
3 Having an agile and flexible business model, adaptable to market trends
Stanford BuildingBreak-out space
Regency WharfProposed refurbishment
Picton Property Income Lim
ited Annual Report 2021
26
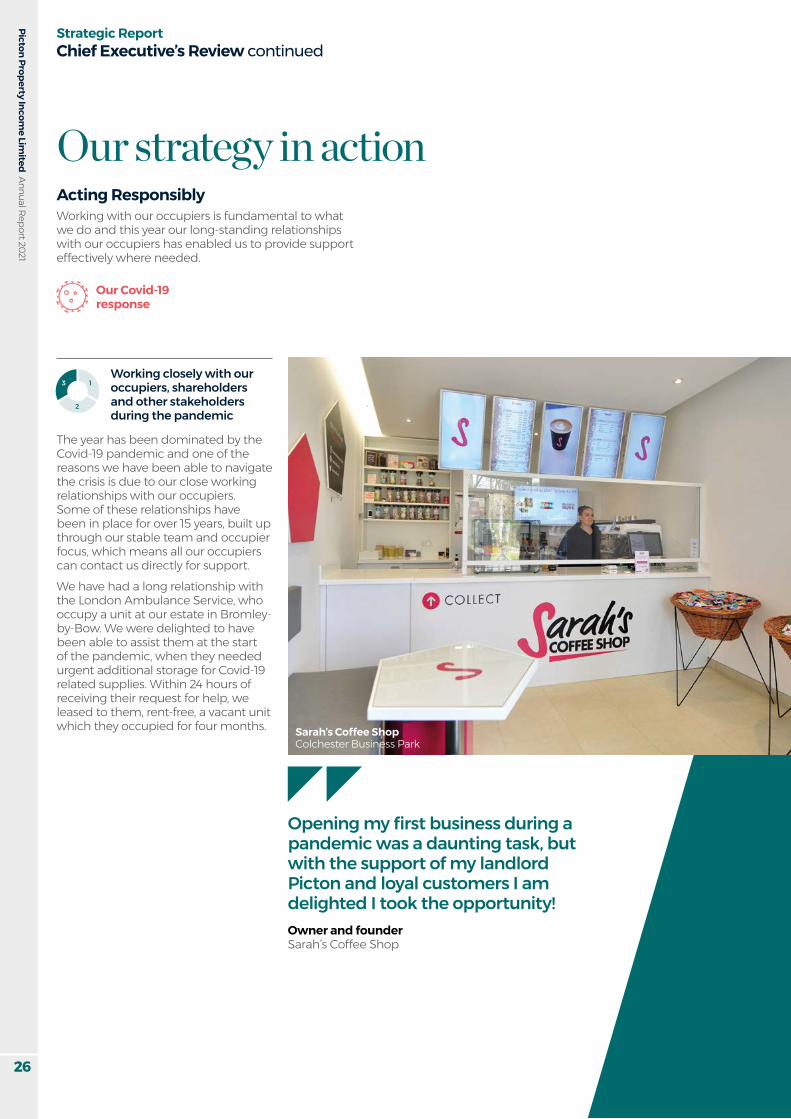
Working with our occupiers is fundamental to what we do and this year our long-standing relationships with our occupiers has enabled us to provide support effectively where needed.
The year has been dominated by the Covid-19 pandemic and one of the reasons we have been able to navigate the crisis is due to our close working relationships with our occupiers. Some of these relationships have been in place for over 15 years, built up through our stable team and occupier focus, which means all our occupiers can contact us directly for support. We have had a long relationship with the London Ambulance Service, who occupy a unit at our estate in Bromley-by-Bow. We were delighted to have been able to assist them at the start of the pandemic, when they needed urgent additional storage for Covid-19 related supplies. Within 24 hours of receiving�their�request�for�help,�we�leased to them, rent-free, a vacant unit which they occupied for four months.
Working closely with our occupiers, shareholders and other stakeholders during the pandemic
1
2
3
Strategic ReportChief Executive’s Review continued
Our strategy in actionActing Responsibly
Sarah’s Coffee ShopColchester Business Park
Our Covid-19 response
Opening my first business during a pandemic was a daunting task, but with the support of my landlord Picton and loyal customers I am delighted I took the opportunity! Owner and founder Sarah’s Coffee Shop

Governance
Financial Statements
Additional Information
Picton Property Income Lim
ited Annual Report 2021Strategic Report
Business Overview
27
We have on a case-by-case basis helped occupiers, especially small independent retailers, caterers, leisure occupiers and businesses severely affected by the lockdown restrictions, whereby we have agreed deferred rents, reduced rents and rent holidays dependent on circumstance. We have also been able to help our occupiers by providing upfront incentives�to�assist�cash�flow�during�the lockdown but improving the income�profile�in�return.�This�type�of transaction helps an occupier now and secures us a longer-term income stream, which creates value. At 50 Farringdon Road, London we removed an occupier’s 2022 break option�securing�£0.2�million�per�annum, which is subject to review until 2027 and in return provided the
occupier with a rent-free incentive. In another transaction, we surrendered a lease in return for a small premium and immediately re-let the suite to an�existing�occupier�who�required�expansion space. The building remains fully leased. We are currently replacing the air-conditioning system which will improve the EPC rating from a D to a B and reduce running costs. The replacement will also remove the natural gas supply from the building in line with our environmental targets.The restaurant at Queens House, Glasgow, was closed due to the lockdown restrictions. We let the space to the family-run business in 2006 and have a good working relationship with them.
By providing a rent-free holiday, the occupier was able to invest in a complete refurbishment of the 180-seat restaurant. We continue to work with our occupier as lockdown restrictions end and have put in place a stepped rent arrangement to assist the launch of their new concept.During the year we have upgraded our�own�office�accommodation�by�relocating to Stanford Building and ending our lease in the City. This will improve the working environment for our employees and provide us with flexibility�for�growth�going�forward.
London Ambulance Service
Ralph & FinnsQueen’s House, Glasgow
I just want to say a big thank you to Picton for your support with this unit. These are difficult and challenging times for all of us but we have managed to navigate through it in a short space of time. Programme ManagerLondon Ambulance Service NHS Trust

Picton Property Income Lim
ited Annual Report 2021
28
Strategic ReportChief Executive’s Review continued
We believe it is important to continue to invest in our assets,�to�mitigate�the�impact�of�depreciation,�improve their attractiveness in the marketplace and enhance letting prospects.
Our strategy in actionPortfolio Performance
50 Pembroke CourtChatham
At 50 Pembroke Court, Chatham, we comprehensively refurbished the ground�floor�office�suite�improving�the�EPC from a D to a B. The majority of the refurbishment cost was covered by the dilapidations claim from the outgoing occupier. The building provides some of the best space available in the local market and we were pleased to secure the Government on a ten-year lease, subject to a break, at a rent in line with ERV, for a third of the space. We have interest in the remaining space.The common areas at 401 Grafton Gate, Milton Keynes were fully refurbished including LED lighting, break-out�space,�and�new�office�entrances. The works, combined with installing LED lighting for our occupiers, has improved the EPC from an E to a C. Four lease renewals were agreed�securing�a�41%�increase�on�the�previous�passing�rent�to�£0.6�million�per annum and maintaining full occupancy of the building.
Enhancing asset quality, and providing space that exceeds occupier expectations
1
2
3
401 Grafton GateMilton Keynes

Governance
Financial Statements
Additional Information
Picton Property Income Lim
ited Annual Report 2021Strategic Report
Business Overview
29
1
2
3
Swiftbox Rugby
By working closely with our occupiers and investing in our assets, we have been able to grow occupancy and income over the period resulting in significant�outperformance�against�the MSCI UK Quarterly Property Index.At Parkbury Industrial Estate in Radlett, which is well located alongside the M25 and close to the M1, we have been able to maintain full occupancy throughout the year and drive income through active management. Two rent reviews were agreed, increasing the passing rent by 25%,�one�lease�was�renewed�for�a further�15�years,�subject�to�break,�at a rent�35%�ahead�of�the�previous�passing rent and we extended a lease by�five�years�to�2031�securing�future�income�of�£0.3�million�per�annum.�
Growing occupancy and income
Following completion of the refurbishment of Swiftbox, Rugby, in March 2020, which improved its EPC rating from an E to a B, we leased the entire�99,500�sq�ft�distribution�unit�to UPS, on a 12-month lease, with the option to extend for up to a further six months. UPS has taken up the option, so the lease now expires in March 2022. The letting immediately generated�an�annual�income�of�£0.6�million,�which�was�4%�ahead�of�ERV.We completed the refurbishment of Stanford Building in Covent Garden, London, providing Grade A space with excellent occupier amenities including showers and changing facilities. We were pleased to�welcome�our�first�occupier�to�the�second�floor�on�a five-year�lease,�subject�to�break,�5%�ahead�of�ERV.��At River Way, Harlow, we refurbished two units and agreed two rent reviews increasing the passing rent by�11%.�Two�occupiers�expanded�on�the�estate�both�taking�five-year�leases�in�line�with ERV,�with�a�further lease extended to March 2023,�increasing�rent�by 27%.�
Parkbury Industrial EstateRadlett

Total return (%)
2021
2020
2019
6.6
4.5
6.5
Total shareholder return (%)
2021
2020
2019
0.0
3.6
10.1
Picton Property Income Lim
ited Annual Report 2021
30
Strategic ReportKey Performance Indicators
We have a range of key performance indicators that we use to measure the performance and success of the business. We consider that industry standard measures, such as those calculated by MSCI, are appropriate to use alongside certain EPRA measures and others that are relevant to us. This year we have adopted the new EPRA net asset value metrics in this Report, replacing EPRA net asset value per share with EPRA net tangible assets (NTA) per share. In this regard, we consider that the EPRA NTA per share, earnings�per�share�and�vacancy�rate�are�the�most appropriate�measures�to�use�in�assessing�our performance.�Key performance indicators are also used to determine variable remuneration rewards for the Executive Directors and the rest of the Picton team. The indicators used are total return, total shareholder return, total property return and EPRA earnings per share. This is set out more fully in the Remuneration Report.
Remuneration link
Measuring the success of the business
A
1
2
3
Why we use this indicatorThe total return is the key measure of the overall performance of the Group. It is the change in the Group’s net asset value, calculated in accordance with IFRS, over the year, plus dividends paid.
The Group’s total return is used to assess whether our aim to be one of the consistently best performing diversified�UK�REITs�is�being�achieved,�and�is�a�measure used to determine the annual bonus.
Our performance in 2021Our industrial assets helped deliver strong valuation gains over the year, together with an increase in occupancy and cost reductions helping to improve EPRA earnings, which has led to a 50% increase in profit compared to the previous year.
1
2
3
B
Why we use this indicatorThe total shareholder return measures the change in our share price over the year plus dividends paid. We use this indicator because it is the return seen by investors on their shareholdings.
Our total shareholder return relative to a comparator group is a performance metric used in the�Long-term�Incentive�Plan.
Our performance in 2021Despite a strong recovery in the share price in the latter half of the year our total shareholder return was flat over the year, reflecting the discount to net asset value.
For more information on EPRA Best Practices Recommendations see pages 127-129

Total property return (%)
7.3
5.3
7.5
2021
2020
2019
Loan to value ratio (%)
20.9
21.7
24.7
2021
2020
2019
Property income return (%)
4.7
4.8
5.6
2021
2020
2019
Cost ratio (%)
1.0
1.1
1.1
2021
2020
2019
Governance
Financial Statements
Picton Property Income Lim
ited Annual Report 2021Strategic Report
Business Overview
31
Additional Information
C E
1
2
3
1
2
3
Why we use this indicatorThe total property return is the combined income and capital return from our property portfolio for the year, as calculated by MSCI. We use this indicator because it shows the success of the portfolio strategy without the impact of gearing and corporate costs.
Our total property return relative to the MSCI UK Quarterly Property Index is a performance condition for both the annual bonus and the Long-term Incentive Plan.
Why we use this indicatorThe loan to value ratio is total Group borrowings, net of cash, as a percentage of the total portfolio value. This is a recognised measure of the Company’s level of borrowings and is a measure of�financing�risk.�See�the�Supplementary�Disclosures section for further details.
Our performance in 2021We have outperformed the MSCI UK Quarterly Property Index, delivering an upper quartile return of 7.3% compared to the Index return of 1.2% for the year, and we have also outperformed on a three, five and ten year, and since inception basis.
Our performance in 2021The loan to value ratio has reduced further this year as the portfolio value has risen and there has been continued amortisation of the debt. No new borrowings were taken out in the year.
D F
Why we use this indicatorThe property income return, as calculated by MSCI, is the income return of the portfolio. Income is an important component of total return and our portfolio is biased towards income generation.
Why we use this indicatorThe cost ratio, recurring administration expenses as a proportion of the average net asset value, shows how�efficiently�the�business�is�being�run,�and�the�extent to which economies of scale are being achieved. See the Supplementary Disclosures section for further details.
Our performance in 2021The income return for the year of 4.7% was ahead of the MSCI UK Quarterly Property Index of 4.5%, and we have also outperformed on a three, five and ten year, and since inception basis.
Our performance in 2021The cost ratio has reduced to 1.0% this year as savings in administrative expenses have been made, together with the increase in net asset value.
1
2
3
1
2
3

EPRA NTA per share (pence)
97
93
93
2021
2020
2019
EPRA vacancy rate (%)
8.8
11.5
10.3
2021
2020
2019
EPRA earnings per share (pence)
3.7
3.7
4.3
2021
2020
2019
Picton Property Income Lim
ited Annual Report 2021
32
Strategic ReportKey Performance Indicators continued
G I
1
2
3 1
2
3
Why we use this indicatorThe EPRA net tangible assets (NTA) per share, calculated in accordance with EPRA, measures the�value�of�shareholders’�equity�in�the�business.�We use this to measure the growth of the business over time and regard this as the most relevant net asset metric for the business.
Why we use this indicatorThe vacancy rate measures the amount of vacant space in the portfolio at the end of each financial�period,�and�over�the�long-term,�is�an�indication of the success of asset management initiatives undertaken.
Our performance in 2021The EPRA NTA per share has increased by 3.7% this year, due to valuation gains, particularly in the industrial portfolio, and the high dividend cover achieved.
Our performance in 2021In what has been a very difficult year for the leasing market the fall in our EPRA vacancy rate highlights the success of our occupier focused approach.
H
Why we use this indicatorThe earnings per share, calculated in accordance with EPRA, represents the earnings from core operational activities and excludes investment property revaluations, gains/losses on asset disposals and any exceptional items. We use this because�it�measures�the�operating�profit�generated by the business from the core property rental business.
The growth in EPRA earnings per share is also a performance measure used for the annual bonus and the Long-term Incentive Plan.
Our performance in 2021EPRA earnings per share has remained at 3.7 pence, with the positive impact of higher occupancy and lower costs being offset by increased provisions against income receivable.
1
2
3

Retention rate (%)
88
53
49
2021
2020
2019
EPC ratings (%)
92
89
82
2021
2020
2019
Employee satisfaction (%)
85
83
N/A
2021
2020
2019
Governance
Financial Statements
Additional Information
Picton Property Income Lim
ited Annual Report 2021Strategic Report
Business Overview
33
K
1
2
3
Why we use this indicatorEnergy�Performance�Certificates�(EPC)�indicate�how�energy�efficient�a�building�is�by�assigning�a�rating�from�‘A’�(very�efficient)�to�‘G’�(very�inefficient).�A�higher�EPC�rating�is�likely�to�lead�to�lower occupational costs for occupiers.
Our performance in 2021The proportion of EPC ratings between A to D has increased on the prior year and now makes up 92% of the total portfolio. We improved the ratings of 20 EPCs during the year.
J L
Why we use this indicatorThis provides us with a measure of asset suitability and occupier satisfaction over the year.
Why we use this indicatorWe use this indicator to assess our performance against one of our strategic objectives, to nurture a positive�culture�reflecting�the�values�and�alignment�of the Picton team. The indicator is based on the employee survey carried out during the year.
Our performance in 2021This figure was significantly higher than in 2020, reflecting retention of some of our key occupiers. Total ERV at risk due to lease expiries or break options totalled £6.6 million, identical to last year. In addition a further £4.2 million of ERV was retained by either removing future breaks or extending future lease expiries ahead of the lease event.
Our performance in 2021We are pleased that there has been a small improvement in the employee satisfaction score, despite the added difficulties of the whole team working remotely throughout the year.
1
2
3
1
2
3
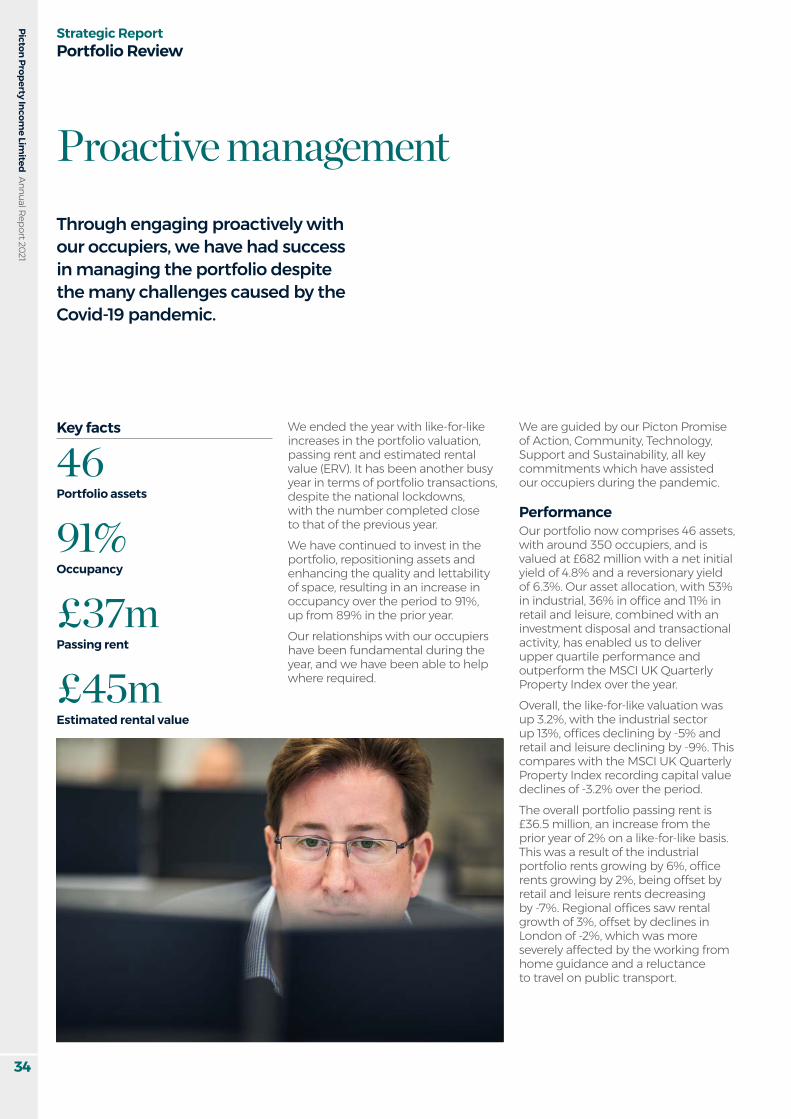
Picton Property Income Lim
ited Annual Report 2021
34
Strategic ReportPortfolio Review
Proactive managementThrough engaging proactively with our occupiers, we have had success in managing the portfolio despite the many challenges caused by the Covid-19 pandemic.
We ended the year with like-for-like increases in the portfolio valuation, passing rent and estimated rental value (ERV). It has been another busy year in terms of portfolio transactions, despite the national lockdowns, with the number completed close to that of the previous year.We have continued to invest in the portfolio, repositioning assets and enhancing�the�quality�and�lettability�of space, resulting in an increase in occupancy�over�the�period�to�91%,�up�from�89%�in�the�prior�year.�Our relationships with our occupiers have been fundamental during the year, and we have been able to help where�required.
Key facts
46Portfolio assets
91% Occupancy
£37mPassing rent
£45mEstimated rental value
We are guided by our Picton Promise of Action, Community, Technology, Support and Sustainability, all key commitments which have assisted our occupiers during the pandemic.
Performance Our portfolio now comprises 46 assets, with around 350 occupiers, and is valued�at�£682�million�with�a�net�initial�yield�of�4.8%�and�a�reversionary�yield�of�6.3%.�Our�asset�allocation,�with�53%�in�industrial,�36%�in�office�and�11%�in�retail and leisure, combined with an investment disposal and transactional activity, has enabled us to deliver upper�quartile�performance�and�outperform the MSCI UK Quarterly Property Index over the year.Overall, the like-for-like valuation was up�3.2%,�with�the�industrial�sector�up�13%,�offices�declining�by�-5%�and�retail�and�leisure�declining�by�-9%.�This�compares with the MSCI UK Quarterly Property Index recording capital value declines�of�-3.2%�over�the�period.�The overall portfolio passing rent is £36.5�million,�an�increase�from�the�prior�year�of�2%�on�a�like-for-like�basis.�This was a result of the industrial portfolio�rents�growing�by�6%,�office�rents�growing�by�2%,�being�offset�by�retail and leisure rents decreasing by�-7%.�Regional�offices�saw�rental�growth�of�3%,�offset�by�declines�in�London�of�-2%,�which�was�more�severely affected by the working from home guidance and a reluctance to travel on public transport.

Governance
Financial Statements
Additional Information
Picton Property Income Lim
ited Annual Report 2021Strategic Report
Business Overview
35
The March 2021 ERV of the portfolio is�£45.4�million,�an�increase�from�the�prior�year�of�1%�on�a�like-for-like�basis. Positive growth in the industrial sector�of�4%�was�offset�by�the�negative growth in the retail sector of�-3%,�while�the�office�portfolio�was�static over the period with increases in the regions offset by London. We have set out the principal activity in each of the sectors in which we are invested and believe our strategy and proactive occupier engagement will continue to assist us in managing the portfolio during the current business climate. The industrial sector has been the least affected by the Covid-19 pandemic, with strong occupational demand outstripping supply, especially in London and the South East�where�75%�of�our�portfolio�is�located. Investment demand has been strong with multiple buyers for well-located assets, which combined with a lack of stock has driven up pricing.The�office�sector�was�significantly�affected by the working from home guidance and although all our offices�remained�open�and�Covid-19�compliant, building occupancy was significantly�reduced.�The�change�in working patterns has made businesses�reflect�on�their�future�office�strategy and during the year demand was subdued. We are however, now seeing some encouraging signs that the market is improving following the news that vaccination is proving
effective,�with�the�number�of�enquiries�and lettings going under offer steadily increasing, albeit from a low base. Against this background, we have had letting success and we have succeeded in retaining occupiers.The retail and leisure sector has been hit hard by the forced closures, resulting in a number of well-known businesses disappearing from the high street. Government measures halting action to pursue arrears have exacerbated the problem, with some occupiers purposefully not paying. Occupier demand has been muted, with retail vacancies, especially on the high street and in shopping centres, increasing substantially. Despite this, we have been able to work with our occupiers and have fortunately not had many insolvencies, and in the majority of cases, we have been able to mitigate these.We believe the portfolio is well placed in respect of our sector allocations and,�combined�with�the�quality�of�our�assets, we will be able to continue to drive performance going forward.
Activity We have had another good year in respect of active management transactions. We completed 17 rent�reviews,�7%�ahead�of�ERV,�30�lease�renewals�or�regears,�10%�ahead of ERV and 25 lettings or agreements�to�lease,�3%�ahead�of�ERV. One retail asset was sold for gross�proceeds�of�£4.0�million,�30%�ahead of the March 2020 valuation. Over�the�year�we�have�invested�£5.0�million into the portfolio across ten key projects. These have all been aimed at enhancing space to attract occupiers, improve sustainability credentials and grow income. Major projects are currently underway at Regency Wharf, Birmingham, where we are converting leisure space�to�offices,�and�at�Longcross,�Cardiff, where we are carrying out a comprehensive refurbishment to�update�the�office�building.

Picton Property Income Lim
ited Annual Report 2021
36
Strategic ReportPortfolio Review continued
Top ten assetsThe�largest�assets�as�at�31�March�2021,�ranked�by�capital�value,�represent�55%�of�the�total�portfolio�valuation�and�are�detailed below.
AssetsAcquisition
dateProperty
type TenureApproximate
area (sq ft)No. of
occupiersOccupancy
rate (%)
Parkbury Industrial Estate, Radlett, Herts. 03/2014 Industrial Freehold 343,800 21 100River Way Industrial Estate, Harlow, Essex 12/2006 Industrial Freehold 454,800 10 100Angel Gate, City Road, London EC1 10/2005 Office Freehold 64,600 20 68Stanford Building, Long Acre, London WC2 05/2010 Office Freehold 20,100 2 33Datapoint, Cody Road, London E16 05/2010 Industrial Leasehold 55,100 6 100Tower Wharf, Cheese Lane, Bristol 08/2017 Office Freehold 70,600 5 83Shipton Way, Rushden, Northants. 07/2014 Industrial Leasehold* 312,900 1 10050 Farringdon Road, London EC1 10/2005 Office Leasehold* 31,300 4 100Lyon Business Park, Barking, Essex 09/2013 Industrial Freehold 99,400 9 100Colchester Business Park, Colchester 10/2005 Office Leasehold 150,700 22 97
*Denotes leasehold interest in excess of 950 years.
Our largest void is Stanford Building on Long Acre in Covent Garden, London,�accounting�for�over�a�quarter�of the total. The refurbishment was completed during the period. We were�pleased�to�welcome�our�first�occupier�to�the�second�floor�and�we�have�moved�into�the�first�floor,�following an expiry of our lease in the City. This move has allowed us to reduce costs and provided us with�flexibility�going�forward.�We are continually focused on futureproofing�assets�from�a�sustainability perspective, which has resulted�in�an�improvement�in�our EPCs�with�92%�now�rated�D�and above.�The average lot size of the portfolio is £14.8�million,�5%�ahead�of�last�year.�
Retention rates and occupancyOver the year, total ERV at risk due to lease expiries or break options totalled £6.6�million,�consistent�with�the�year�to�March 2020. Excluding asset disposals, we retained 88%�of�total�ERV�at�risk�in�the�year�to March�2021.�Of�leases�that�were�due to�expire�during�the�year,�93%�of�ERV was retained. Of leases that had a break�clause�in�the�year,�67%�of�ERV�was retained.In�addition,�a�further�£4.2�million�of�ERV was retained by either removing future breaks or extending future lease expiries ahead of the lease event.Occupancy has increased during the year�from�89%�to�91%,�which�is�slightly�behind the MSCI UK Quarterly Property�Index�of�92%�at�March�2021.�The�increase�primarily�reflects�the�success of the refurbishment programme in 2020, meaning we were able to attract new occupiers and that occupancy increased in all sectors of the portfolio. At the year-end, over half of our vacant buildings were being refurbished and with the rest�available�to�let�and�being�actively marketed.Of�our�total�void�of�£4.0�million�by�ERV,�85%�is�in�offices,�14%�is�in�retail�and�only�1%�is�in�industrial.
Longevity of incomeAs at 31 March 2021, expressed as a percentage of contracted rent, the average length of the leases to the first termination�was�4.9�years�(2020:�5.5�years).�This is summarised�as follows:
%
0 to 1 year 11.91 to 2 years 13.82 to 3 years 13.53 to 4 years 13.64 to 5 years 18.95 to 10 years 20.010 to 15 years 6.915 to 25 years 0.125 years and over 1.3Total 100.0

Governance
Financial Statements
Additional Information
Picton Property Income Lim
ited Annual Report 2021Strategic Report
Business Overview
37
Outlook The impact of the pandemic and consequent�lockdowns�has�led�to�a�very uncertain operating environment. We have been able to adapt to the ‘new normal’ and although occupational�requirements�have,�outside the industrial sector, been far more muted, we have secured new occupiers. We have achieved this through embracing new technologies, creating virtual tours, and thinking more laterally as to how we can market our buildings with social distancing measures in place.Our focus remains on working with our occupiers and this year has shown more than any the importance of our long-standing relationships and the benefit�of�our�approach.�This�has�enabled us to navigate through these uncertain times and to end the year in a positive position. As at 31 March 2021 the�portfolio�had�£9�million�of�reversionary income potential,
£4�million�from�letting�the�vacant�space,�£3�million�from�expiring�rent-�free�periods�and�£2�million�where�the�passing rent is below market level. Demand for our industrial properties remains robust as proven by our high occupancy and growing ERVs. With this�sector�accounting�for�53%�of�the�total portfolio by value, we believe it will continue to contribute strongly to our outperformance. Business activity is beginning to pick up�in�the�office�sector�where�36%�of�our portfolio is allocated, and we have attractive refurbished space in which we have increasing interest. We believe there is pent-up demand, especially in the regions, and this will come through as the year progresses with�demand�focusing�on�flexible�Grade A space. In addition, we are now�offering�fitted�space,�ready�to�occupy, which we believe is where the market is heading in respect of smaller suites, especially in London.
Top ten occupiersThe largest occupiers, based as a percentage of contracted rent, as at 31 March 2021, are as follows:
OccupierContracted rent
(£m) %
Public sector 2.1 5.0Whistl UK Limited 1.6 3.9B&Q Plc 1.2 3.0The Random House Group Limited 1.2 2.8Snorkel Europe Limited 1.2 2.8XMA Limited 1.0 2.3Portal Chatham LLP 0.8 1.9DHL Supply Chain Limited 0.8 1.9Canterbury Christ Church University 0.7 1.6PA Consulting Services Limited 0.6 1.5Total 11.2 26.7
The retail and leisure sector has been severely affected by the Covid-19 pandemic; however, we are more positive about retail warehousing which�makes�up�60%�of�our�retail�allocation. We have succeeded in letting retail warehouse units during the year at our two parks which were refurbished in 2020 and have strong interest in our last remaining retail warehouse void. Our high street portfolio�is�over�90%�leased�and�we�have no shopping centre exposure. We remain in a strong position with advantageous portfolio weightings, good�quality�assets�and�a�proven�occupier focused approach. Looking forward, we remain focused on continuing to grow occupancy and income, engaging with our occupiers and investing further into our assets.
Jay Cable Senior Director and Head of Asset Management26 May 2021

Picton Property Income Lim
ited Annual Report 2021
38
Industrial
Strategic ReportPortfolio Review continued
The industrial sector, which accounts for 53% of the portfolio, again had the strongest sector performance of the year producing double digit returns.
This was a result of the portfolio being almost fully let, active management extending income, securing rental uplifts and continued strong occupational demand for the smaller units, which resulted in further rental growth, especially in London and the South East. This, combined with continued strength in the investment market, has resulted in another strong year for this element of the portfolio. On a like-for-like basis, our industrial portfolio�value�increased�by�£42.4�million�or�13.3%�to�£360.7�million,�and�the annual rental income increased by�£0.9�million�or�5.6%�to�£16.9�million.�The portfolio has an average weighted lease�length�of�4.3�years�and�£2.4�million of reversionary potential. We have seen ERV growth of 3.9%�across�the�portfolio�and�are�experiencing demand across all of our�estates.�Occupancy�is�99.8%,�with the only void being one small unit in Wokingham which has recently been refurbished.
Portfolio activity Swiftbox, Rugby, was our largest void at the beginning of the year. Following completion of the refurbishment, we�leased�the�entire�99,500�sq�ft distribution unit to UPS, on a 12-month lease, with the option to extend for up to a further six months. UPS has taken up the option, so the lease now expires in March 2022. The letting immediately generated an�annual�income�of�£0.6�million,�which�was�4%�ahead�of�ERV.At Parkbury, Radlett, we have driven income though active management. Two rent reviews were agreed, increasing the passing rent by 25%,�one�lease�was�renewed�for�a�further 15 years, subject to break, at a�rent�35%�ahead�of�the�previous�passing rent and we extended a lease�by�five�years�to�2031,�securing�£0.3�million�per�annum.At Vigo 250, Washington, we were pleased to be able to provide cash flow�assistance�as�an�incentive�and�settle the June 2021 rent review, securing�a�5%�uplift�to�£1.2�million�per�annum,�12%�ahead�of�ERV.�At River Way, Harlow, we restructured a lease and secured longer income until March 2023. As part of the same transaction, the August 2021 rent review was brought forward to January 2021 and settled, securing a 27%�uplift�to�£0.8�million�per�annum,�27%�ahead�of�ERV.�Two�further�rent�reviews were agreed, increasing the passing�rent�by�11%,�one�lease�was�renewed�for�a�further�five�years,�at�a�rent�15%�ahead�of�the�previous�passing rent, and two units were leased�for�a�combined�£0.2�million�per annum, in line with ERV.At Datapoint in London E16, following the completion of a rent review, we achieved�a�68%�uplift�in�rent�to�£0.4�million�per�annum,�24%�ahead�of�ERV.�One unit was leased for a minimum term�of�five�years�at�a�rent�of�£0.1�million�per�annum,�7%�ahead�of�ERV.At Sundon Business Park, Luton, following the completion of a rent review,�we�achieved�a�57%�uplift�in�rent�to�£0.1�million�per�annum,�11%�ahead of ERV. Three leases were renewed, the passing rent increasing by�47%�to�a�combined�£0.3�million�per�annum,�10%�ahead�of�ERV.�
Outlook The Covid-19 pandemic has had a limited impact on the industrial sector, with strong demand, low vacancy rates and increasing rents, especially in respect of the smaller multi-let estates. Where occupiers have been affected by the pandemic, we have been able to work with most of them to resolve the position, and if needed, usually these units are easily re-let.We do not anticipate a slowdown in demand, and combined with limited stock availability we expect continued rental growth, especially in respect of the smaller units in Greater London and the South East, where there remains a lack of supply and a limited development pipeline. We do not expect rental growth to come through on the larger units to the same extent, due to the development pipeline, and the ability for occupiers to build bespoke space. The focus going forward is to maintain high occupancy, continue to capture rental growth, and work proactively with our occupiers to unlock asset management transactions. We have 24 lease events forecast for the coming year, and the overall ERV for these�units�is�23%�higher�than�the�current�passing�rent�of�£2.2�million.�This provides us with the opportunity to grow income and value further.

21
4
7
12
10
11
15
6
13
816 39
514
Governance
Financial Statements
Additional Information
Picton Property Income Lim
ited Annual Report 2021Strategic Report
Business Overview
39
SwiftboxRugby
Locations
Key metrics
£360.7mValuation (2020:�£318.3m)
2.6m sq ft Internal area (2020:�2.6m�sq�ft)
£16.9mAnnual rental income (2020:�£16.0m)
£19.3mEstimated rental value (2020:�£18.6m)
100%Occupancy (2020:�96%)
16Number of assets (2020: 16)
1 7 13
Parkbury Industrial Estate Radlett 343,800�sq�ft�–�Freehold
Grantham Book Services Grantham 336,100�sq�ft�–�Leasehold
Swiftbox Rugby 99,500�sq�ft�–�Freehold
2 8 14
River Way Industrial Estate Harlow 454,800�sq�ft�–�Freehold
The Business Centre Wokingham 101,000�sq�ft�–�Freehold
Western Industrial Estate Bracknell 41,200�sq�ft�–�Freehold
3 9 15
Datapoint London E16 55,100�sq�ft�–�Leasehold
Nonsuch Industrial Estate Epsom 41,400�sq�ft�–�Leasehold
Abbey Business Park Belfast 61,700�sq�ft�–�Freehold
4 10 16
Shipton Way Rushden 312,900�sq�ft�–�Leasehold
Vigo 250 Washington 246,800�sq�ft�–�Freehold
Magnet Trade Centre Reading 13,700�sq�ft�–�Freehold
5 11
Lyon Business Park Barking 99,400�sq�ft�–�Freehold
Easter Court Warrington 81,800�sq�ft�–�Freehold
6 12
Sundon Business Park Luton 127,800�sq�ft�–�Leasehold
1 & 2 Kettlestring Lane York 157,800�sq�ft�–�Freehold

Picton Property Income Lim
ited Annual Report 2021
40
Office
Strategic ReportPortfolio Review continued
The office sector, which accounts for 36% of the portfolio, delivered the second strongest performance of the year, with the regions outperforming London.
With limited occupational demand due to the Covid-19 pandemic, our focus has been occupier retention and marketing our vacant properties using virtual tours and socially distanced viewings.We have been able to lease space in�a�difficult�market,�securing�£1.1�million of income, and have worked with our occupiers to extend income and surrender leases where we can secure a premium and immediately re-lease the space. On�a�like-for-like�basis,�our�office�portfolio�value�declined�by�£13.8�million�or�-5.3%�to�£245.4�million;�however, the annual rental income increased�marginally�by�£0.3�million�or�2.0%�to�£13.1�million.�The�portfolio has an average weighted lease�length�of�3.5�years�and�£5.9�million of reversionary potential. Although occupational demand has been muted, it has been stronger in the regions than in London. The ERV of the portfolio has remained static over the year, with declines in�London�of�-2.9%�being�offset�by�increases�in�the�regions�of�0.9%.�We�invested�£4.1�million�into�our�office�assets�during�the�period�and�completed key projects, including at Tower Wharf, Bristol, 50 Pembroke Court, Chatham, and Stanford Building, London. We have had letting success at all three buildings.
On a like-for-like basis, occupancy has increased�over�the�period�to�82%.
Portfolio activity At Grafton Gate, Milton Keynes, which was comprehensively refurbished last year, we retained two occupiers on lease expiry. Four leases were renewed, enabling us to increase the passing rent�by�29%�to�a�combined�£0.6�million�per�annum,�11%�ahead�of�ERV.�At Tower Wharf, Bristol, we were pleased to welcome a new occupier to�part�of�the�first�floor�on�a�ten-year�lease subject to break, at a rent of £0.2�million�per�annum,�marginally�below ERV. We also agreed the letting of�the�whole�fourth�floor�to�a�new�occupier, with the vacating occupier paying�a�premium�of�£0.2�million�to�facilitate the transaction. We currently have two suites available, which are being refurbished. The common areas were comprehensively refurbished last year, and we believe there is occupational demand which will come through as the year progresses.At 50 Pembroke Court, Chatham, we comprehensively refurbished a vacant�floor�with�the�majority�of�the�cost being covered by the outgoing occupier’s�dilapidations.�The�floor�has been split with a third let to the Government on a ten-year lease, subject�to�break,�at�£0.1�million�per�annum, which is in line with ERV. At 50 Farringdon Road, London we surrendered a suite and immediately re-let it to an existing occupier who�required�expansion�space�at�a�rent�of�£0.2�million�per�annum,�in�line with ERV. The transaction met both�occupiers’�requirements�and�potentially will allow us to enter into a longer lease in due course. In another transaction, we removed an occupier’s 2022 break option securing�£0.2�million�per�annum,�which is subject to review, until 2027 and in return provided the occupier with a rent-free incentive, which�assisted�their�cashflow�during the Covid-19 pandemic.Our�largest�office�void�is�Stanford�Building, London. We completed the refurbishment and enhanced the value�of�the�office�floors�and�obtained�planning�to�convert�the�first�floor�from�ancillary�retail�to�office�space.�We�have�relocated�to�this�floor,�which�provides�a great working environment. We were pleased to welcome a new occupier
to�the�second�floor�on�a�five-year�lease,�subject�to�break,�5%�ahead�of�ERV.
Outlook Working from home as a result of the Covid-19 pandemic has caused a huge amount of business uncertainty; however, this is beginning to ease and the initial reaction of businesses thinking of disposing space is now being reconsidered.We�believe�the�flight�to�quality�has�been accelerated by the pandemic, with businesses wanting to provide best-in-class space to attract their staff�back�to�the�office.�Sustainability�is also now a key factor in choosing a building and older stock, where the�capital�expenditure�required�to upgrade is prohibitive, will be converted to other uses.The regions have outperformed London, primarily we believe due to people not wanting to commute on public transport. We can see a push to get people back to the office�later�this�year,�with�companies�embracing�a�more�flexible�policy�in respect of working from home. We�have�invested�£9.7�million�into�our�office�portfolio�over�the�last�three�years,�creating�high�quality�contemporary space and occupier amenities, meaning our buildings remain attractive to occupiers. We have 36 lease events forecast for the coming year, with the current ERV�for�these�units�being�1.8%�higher than the current passing rent�of�£2.5�million�and�an�18%�void,�with�an�ERV�of�£3.4�million,�providing us with the opportunity to significantly�grow�income�and�value.
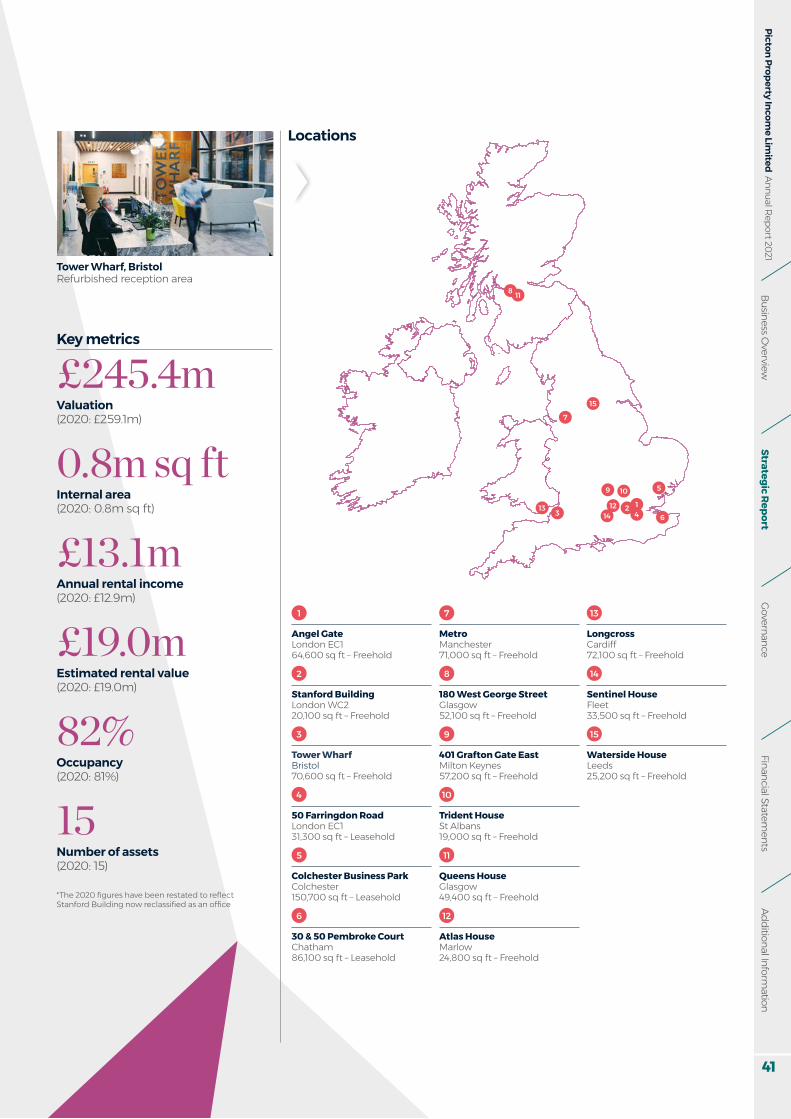
Governance
Financial Statements
Additional Information
Picton Property Income Lim
ited Annual Report 2021Strategic Report
Business Overview
41
Tower Wharf, BristolRefurbished reception area
Locations
1 7 13
Angel Gate London EC1 64,600�sq�ft�–�Freehold
Metro Manchester 71,000�sq�ft�–�Freehold
Longcross Cardiff 72,100�sq�ft�–�Freehold
2 8 14
Stanford Building London WC2 20,100�sq�ft�–�Freehold
180 West George Street Glasgow 52,100�sq�ft�–�Freehold
Sentinel House Fleet 33,500�sq�ft�–�Freehold
3 9 15
Tower Wharf Bristol 70,600�sq�ft�–�Freehold
401 Grafton Gate East Milton Keynes 57,200�sq�ft�–�Freehold
Waterside House Leeds 25,200�sq�ft�–�Freehold
4 10
50 Farringdon Road London EC1 31,300�sq�ft�–�Leasehold
Trident House St Albans 19,000�sq�ft�–�Freehold
5 11
Colchester Business Park Colchester 150,700�sq�ft�–�Leasehold
Queens House Glasgow 49,400�sq�ft�–�Freehold
6 12
30 & 50 Pembroke Court Chatham 86,100�sq�ft�–�Leasehold
Atlas House Marlow 24,800�sq�ft�–�Freehold
Key metrics
£245.4mValuation (2020:�£259.1m)
0.8m sq ft Internal area (2020:�0.8m�sq�ft)
£13.1mAnnual rental income (2020:�£12.9m)
£19.0mEstimated rental value (2020:�£19.0m)
82%Occupancy (2020:�81%)
15Number of assets (2020: 15)
*The�2020�figures�have�been�restated�to�reflect�Stanford�Building�now�reclassified�as�an�office
5
15
7
1343112
9
8 11
10
14 62

Picton Property Income Lim
ited Annual Report 2021
42
Retail and Leisure
Strategic ReportPortfolio Review continued
The retail and leisure sector, which accounts for 11% of the portfolio, delivered the weakest performance of the year.
The Covid-19 pandemic and subsequent�lockdowns�have�had a severe effect on an already weak bricks and mortar retail and leisure market, with changing shopping habits accelerating the demand for warehouse space.Against this tough backdrop, we had success at our retail warehouse parks�which�account�for�60%�of�our retail and leisure portfolio. Retail warehousing has been more resilient due to the ability of shoppers to be able to park and the size of the units being better suited to social distancing.On a like-for-like basis, our retail and leisure portfolio value decreased by�£7.8�million�or�-9.3%�to�£76.3�million, and the annual rental income decreased�by�£0.5�million�or�-7.0%�to�£6.4�million.�The�portfolio�has�an�average weighted lease length of 9.0 years�and�£0.6�million�of�reversionary�potential�to�£7.1�million�per�annum.�The retail parks in Bury and Swansea were comprehensively refurbished in 2020 and this has helped us to attract new occupiers and grow the passing rent on the retail warehouse�portfolio�by�1.3%,�with�only one vacant unit at year end in which we already have interest. We have also worked with a number of our occupiers to extend leases in exchange for upfront incentives.
Smaller independent retailers have been supported over the year to ensure they are ready to reopen, and we avoid the costs associated with vacant units.Occupational demand was very weak over the year, with vacancy rates increasing as retailers exited leases on expiries and breaks and multi-national retailers such as Debenhams and Arcadia Group disappeared from the high street, further increasing the number of vacant shops. Correspondingly, rental values have declined and retailers with requirements�have�more�choice�and�can negotiate substantial incentives. We have seen negative ERV growth of�-2.8%�across�the�portfolio;�however,�pleasingly we have been able to increase occupancy, on a like-for-like basis,�during�this�difficult�period�to�92%.�We�invested�£0.6�million�into�the�retail portfolio during the period to improve space and facilitate lettings.
Portfolio activity At Parc Tawe Retail Park, Swansea, over half of our retailers remained open during the lockdowns as they were classed as essential retailers. Both Xercise4Less and Poundstretcher were subject to insolvency proceedings; however, we were able to mitigate the effect by securing JD Gyms and Deichmann Shoes�as�new�occupiers,�with�a�13%�reduction in the passing rent and both of whom have refurbished the units. The one vacant unit, at the end of a terrace, has been put under offer via an Agreement for Lease to the Government, subject to planning, who�are�taking�a�new�five-year�lease,�subject to a break in three years, at a rent�of�£0.1�million�per�annum,�in�line�with ERV. This means the park is fully let�with�70%�of�the�income�secured�for�over�five�years�and�three�leases�benefitting�from�fixed�rental�increases.At Angouleme Way Retail Park, Bury, we assisted an occupier by removing a 2022 break option in return for a rent-free incentive, securing income until 2024. Another unit was let to JYSK on a ten-year lease, subject to a�break�in�five�years,�at�a�rent�of�£0.1�million per annum, in line with ERV. We have one unit available to lease, accounting�for�21%�of�the�park�by�floor�area�in�which�we�have�interest.�At Briggate, Leeds, where we have two high street retail properties, we
extended both leases in return for a reduced rent securing income until 2026. The combined rent was reduced by�38%�to�£0.2�million�per�annum,�which�is�still�33%�ahead�of�ERV.At Fishergate, Preston, following a comprehensive refurbishment we let�the�entire�first�floor�to�Slaters�Menswear on a new ten-year lease, subject�to�a�break�at�year�five,�at�£0.1�million�per�annum�which�is�in-line with ERV. The property is now fully leased with JD Sports and�Tessuti�on�the�ground�floor.Bridge Street, Peterborough, was sold in December. The property comprises two retail units, with one let to TK Maxx who are vacating in June 2021 and the other vacant and previously occupied by New Look.�The�asset�was�sold�for�£4.0�million,�30%�ahead�of�valuation.Our largest retail void is the unit within Stanford Building, London, (now�reclassified�as�an�office),�which has been refurbished and is being marketed. The unit is in a prime Covent Garden location and provides�unique�space�arranged�over�two�floors.�We�have�had�some interest, but expect better terms as the lockdown eases.
Outlook The retail and leisure sector has undergone a severe structural change, which has been accelerated by the Covid-19 pandemic. There is an oversupply�of�floorspace,�especially�in the shopping centre and high street sub-sectors. Demand will be�there�for�prime�well-configured�space, with secondary units being unable to attract occupiers. This stock will have to be repurposed and planning law has changed to make this easier; however, with such a severe oversupply we cannot see the position changing in the short-term. We are however more positive about the retail warehouse sector, where�we�have�60%�of�our�retail�and�leisure weighting. We have been successful in securing new occupiers over the year and our parks have remained busy. Valuations, which have moved down over the past few years, are now stabilising. With the lockdown ending and most retail and leisure having re-opened, improving consumer confidence�will�give�businesses�the�help they need to start recovering.

2 3
1510
1
5
14
11
8
13
9
12
7
4
6
Governance
Financial Statements
Additional Information
Picton Property Income Lim
ited Annual Report 2021Strategic Report
Business Overview
43
Parc Tawe North Retail ParkSwansea
Locations
1 7 13
Queens Road Sheffield� 105,600�sq�ft�–�Freehold
Crown & Mitre Complex Carlisle 25,200�sq�ft�–�Freehold
7-9 Warren Street Stockport 8,700�sq�ft�–�Freehold
2 8 14
Parc Tawe North Retail Park Swansea 116,700�sq�ft�–�Leasehold
Scots Corner Birmingham 30,000�sq�ft�–�Freehold
6-12 Parliament Row Hanley 17,300�sq�ft�–�Freehold
3 9 15
Gloucester Retail Park Gloucester 113,900�sq�ft�–�Freehold
53-57 Broadmead Bristol 13,200�sq�ft�–�Leasehold
18-28 Victoria Lane Huddersfield 14,600�sq�ft�–�Leasehold
4 10
Angouleme Retail Park Bury 76,200�sq�ft�–�Free/Leasehold
78-80 Briggate Leeds 7,700�sq�ft�–�Freehold
5 11
Thistle Express Luton 81,600�sq�ft�–�Leasehold
17-19 Fishergate Preston 59,900�sq�ft�–�Freehold
6 12
Regency Wharf Birmingham 42,500�sq�ft�–�Leasehold
72-78 Murraygate Dundee 9,700�sq�ft�–�Freehold
Key metrics
£76.3mValuation (2020:�£87.2m)
0.7m sq ft Internal area (2020:�0.8m�sq�ft)
£6.4mAnnual rental income (2020:�£7.3m)
£7.1mEstimated rental value (2020:�£7.6m)
92%Occupancy (2020:�91%)
15Number of assets (2020: 16)
*The�2020�figures�have�been�restated�to�reflect�Stanford�Building�now�reclassified�as�an�office

Picton Property Income Lim
ited Annual Report 2021
44
Strategic ReportFinancial Review
This financial year has been unparalleled as a result of the Covid-19 pandemic, with UK GDP declining by -9.8% in 2020, the largest fall on record.
Many sectors of the economy have been badly disrupted by the lockdowns and other restrictions, particularly retail, leisure and travel. We have not been immune to this, but have been fortunate in having limited exposure to the more badly hit retail and leisure sectors. Our results for the year are very positive in the context of the backdrop in which we have been operating. The�total�profit�for�the�year�was�£33.8�million,�which�is�higher than both 2020 and 2019. Our EPRA earnings increased�to�£20.1�million.�Earnings�per�share�were�6.2 pence�overall�(3.7�pence�on�an�EPRA�basis),�and�the�total�return�based�on�these�results�was�6.6%�for�the�year.
Net asset valueThe�net�assets�of�the�Group�increased�to�£528.2�million,�or�97�pence�per�share,�which�was�a�rise�of�3.7%�over�the�year.�The chart below shows the components of this increase.
£m
March 2020 net asset value 509.3Income�profit 20.1Valuation movement 12.8Profit�on�asset�disposals 0.9Share-based awards 0.7Purchase of shares (0.6)Dividends paid (15.0)March 2021 net asset value 528.2
The following table reconciles the net asset value calculated in accordance with International Financial Reporting Standards (IFRS) with that of the European Public Real Estate Association (EPRA).
2021 £m
2020£m
2019£m
Net asset value – IFRS and EPRA NTA 528.2 509.3 499.4Fair value of debt (21.0) (29.6) (24.8)EPRA NDV asset value 507.2 479.7 474.6
Net asset value per share (pence) 97 93 93EPRA net tangible asset value per share (pence) 97 93 93EPRA net disposal value per share (pence) 93 88 88
£33.8mProfit after tax
£20.1mEPRA earnings
6.2pEarnings per share
The total profit for the year was £33.8 million, up over 50% compared with 2020.Andrew DewhirstFinance Director

Governance
Financial Statements
Additional Information
Picton Property Income Lim
ited Annual Report 2021Strategic Report
Business Overview
45
Income statementAs noted above our EPRA earnings for the year have increased�compared�to�2020,�rising�0.6%�to�£20.1�million.�Within that, property revenue has reduced as expected during the pandemic, but there have been savings in both property�costs�and�administrative�expenses,�and�finance�costs are also lower.Total revenue from the property portfolio for the year was £43.3�million.�Rental�income,�at�£36.6�million,�was�lower�by�3.2%�compared�to�2020,�which�was�due�to�asset�disposals�and additional provisions made against income as a result of the pandemic despite an increase in occupancy. On a like-for-like basis, rental income increased marginally by 0.2%�compared�to�the�previous�year,�on�an�EPRA�basis.Rent collection over the year has held up well, but the variations between different business sectors have been quite�apparent.�Our�policy�of�engaging�with�occupiers�from�an�early�stage�has�been�beneficial,�and�the�amount�of�rent�concessions that we have granted has been limited, at only 4%�of�rent�due�over�the�year.�The�table�below�sets�out�a�summary of our rent collection over the last year.
Our Covid-19 response
Rent due 25 March 2020�to�24 March�2021
Industrial (%)
Office(%)
Retail and Leisure
(%)Total
(%)
Collected 91 97 85 92Deferred 1 – 4 1Concessions agreed 4 2 8 4Outstanding 4 1 3 3
For�the�year�we�wrote�off�£1.6�million�of�debts,�and�increased�the�provision�against�occupier�debtors�by�£0.2�million, with the total provision at 31 March 2021 standing at £1.6�million.�We�continue�to�engage�with�occupiers�to�resolve all amounts outstanding.Property�void�costs�reduced�by�27%�to�£2.2�million,�reflecting�both�the�increase�in�occupancy�over�the�year�and�the lower service charge costs attributable to vacant units.Administrative�expenses�for�the�year�were�£5.4�million,�again�lower�than�the�previous�year,�by�3%.�Savings�were�made against a number of corporate level costs.Interest�costs�are�also�lower�this�year�at�£8.0�million,�due�to�the loan repayments that we made towards the end of the last�financial�year.�There�were�no�drawdowns�made�under�the new revolving credit facility.Capital�gains�on�the�portfolio�were�£13.7�million�for�the�year,�with�positive�valuation�movements�during�the year.�There�was�divergence�across�the�sectors,�with�the industrial�assets�showing�significant�gains,�while�retail�and leisure�assets�were more adversely impacted by the pandemic. One disposal�was�made�during�the�year,�realising�a�30%�gain compared to the March 2020 valuation.The�total�profit�for�the�year�was�£33.8�million,�up�over�50%�compared with 2020.
Dividends At the start of the pandemic, in common with many other property companies, we reviewed the level of our dividend and concluded that a prudent approach was appropriate, reducing�the�May�2020�dividend�by�29%.�We�maintained�this�lower�rate�for�two�quarters�and�have�subsequently�increased�it�twice,�initially�by�12%�and�then�by�a�further�14%,�so�that�the�dividend�is�now�at�91%�of�the�pre-pandemic�level, as rent collection rates have remained robust. The dividend for the year was 2.75 pence per share, with total dividends�paid�out�of�£15.0�million.�Dividend�cover�for�the�full�year�was�134%.
EPRA Best Practices Recommendations The EPRA key performance measures for the year are set out on page 3 of the Report, with more detail provided in the Supplementary Disclosures section which starts on page 127. EPRA introduced updated Best Practices Recommendations effective for accounting periods starting after 1 January 2020, including new measures of net asset value. These are net tangible asset value, net disposal value and net reinstatement value. We have included these measures in this Report, and in the Supplementary Disclosures section we set out the calculations in more detail.
Alternative performance measuresWe use a number of alternative performance measures (APMs) when reporting on the performance of�the�business�and�its�financial�position.�These�do�not�always have a standard meaning and may not be comparable to those used by other entities. However, we will use industry standard measures and terminology where possible.In common with many other listed property companies we report the EPRA performance measures. We have reported these for a number of years in order to provide a consistent comparison with similar companies. In the Additional Information section of this Report we provide more detailed information and reconciliations to IFRS where appropriate.Our key performance indicators include three of the key EPRA measures but also total return, total property return, property income return, total shareholder return, loan to value ratio, cost ratio, occupier�retention�rate�and�EPC�ratings.�The�definition�of these measures, and the rationale for their use, is set out in the Key Performance Indicators section.

Picton Property Income Lim
ited Annual Report 2021
46
Strategic ReportFinancial Review continued
Investment properties The appraised value of our investment property portfolio was�£682.4�million�at�31�March�2021,�up�from�£664.6�million�a year previously. This year we have disposed of one small retail�property,�for�net�proceeds�of�£3.9�million,�realising�a�gain�of�£0.9�million�compared�to�last�year’s�valuation.�Our�programme of capital expenditure has continued, with £5.0�million�invested�back�into�the�portfolio.�The�main�project undertaken was at Stanford Building in London WC2, where a full refurbishment has now completed. The overall�revaluation�movement�across�the�portfolio�was a�gain�of�£12.8�million.At 31 March 2021 the portfolio comprised 46 assets, with an average�lot�size�of�£14.8�million.A further analysis of capital expenditure, in accordance with EPRA Best Practices Recommendations, is set out in the Supplementary Disclosures section.
Borrowings Total�borrowings�are�now�£166.2�million�at�31�March�2021,�with the loan to value ratio having reduced further to 20.9%.�The�weighted�average�interest�rate�on�our�borrowings�is�4.2%,�while�the�average�loan�duration�is now 8.9�years.�Our senior loan facility with Aviva reduced by the regular amortisation,�£1.3�million�in�the�year.�The Group remained fully compliant with the loan covenants throughout the year.During the year we completed a new single revolving credit facility with NatWest, replacing the two existing ones. The new�£50�million�facility�is�for�an�initial�term�of�three�years,�until May 2023, with two one-year extensions available. Interest is currently payable at 150 basis points over LIBOR. We are currently undrawn under this facility.The fair value of our borrowings at 31 March 2021 was £187.2 million,�higher�than�the�book�amount.�Lending�margins have remained broadly in line with the previous year, but gilt rates have fallen in comparison.A summary of our borrowings is set out below:
2021 2020 2019
Fixed�rate�loans�(£m) 166.2 167.5 168.7Drawn revolving facilities (£m) – – 26.0Total�borrowings�(£m) 166.2 167.5 194.7Borrowings net of cash (£m) 142.8 143.9 169.5Undrawn�facilities�(£m) 50.0 49.0 25.0Loan�to�value�ratio�(%) 20.9 21.7 24.7Weighted average interest rate�(%) 4.2 4.2 4.0Average duration (years) 8.9 9.9 9.8
Cash flow and liquidity The�cash�flow�from�our�operating�activities�was�£18.6 million�this�year,�ahead�of�2020.�We�invested�£5.0 million�into�the�portfolio,�largely�offset�by�£3.9�million�raised from the asset disposal. The lower dividends paid also helped to maintain cash. Our cash balance at the year-end�stood�at�£23.4�million,�very�close�to�the�balance�at 2020.
Share capitalNo new ordinary shares were issued during the year.The�Company’s�Employee�Benefit�Trust�acquired�a�further�958,000�shares,�at�a�cost�of�£0.6�million,�or�67�pence�per�share,�during�the�year.�This�was�to satisfy�the�future�vesting�of awards made under the Long-term Incentive Plan and Deferred�Bonus�Plan,�and now�holds�a�total�of�2,052,269�shares.�As�the�Trust�is consolidated�into�the�Group’s�results�these shares are effectively held in treasury and therefore have been excluded from the net asset value and earnings per�share calculations,�from�the�date�of�purchase.
Andrew DewhirstFinance Director26 May 2021

Financial Statements
Additional Information
Picton Property Income Lim
ited Annual Report 2021Strategic Report
Business Overview
47
Governance
Strategic ReportPrincipal Risks
Managing RiskThe Board recognises that there are risks and uncertainties that could have a material impact on the Group’s results.
Risk management provides a structured approach to the decision making process such that the identified�risks�can�be�mitigated�and�the uncertainty surrounding expected outcomes can be reduced. The Board has developed a risk management policy which it reviews on a regular basis. The Audit and Risk Committee carries out a detailed assessment of all risks, whether investment or operational, and considers the effectiveness of the risk management and internal control processes. The Executive Committee is responsible for implementing strategy within the agreed risk management policy, as well as identifying and assessing risk in day-to-day operational matters. The management committees support the Executive Committee in these matters. The small number of�employees�and�relatively�flat�management structure allow risks to be�quickly�identified�and�assessed.�
The Group’s risk appetite will vary over time and during the course of the property cycle. The principal risks – those with potential to have a material impact on performance and results – are set out on the following pages, together with mitigating controls. The UK Corporate Governance Code�requires�the�Board�to�make�a�Viability Statement. This considers the Company’s current position and principal and emerging risks and uncertainties combined with an assessment of the future prospects for the Company, in order that the Board can state that the Company will be able to continue its operations over the period of their assessment. The statement is set out in the Directors’ Report.
Principal risk Trend
1 Political and economic
2 Market cycle
3 Regulatory and tax
4 Climate change
5 Portfolio strategy
6 Investment
7 Asset management
8 Valuation
9 People
10 Finance strategy
11 Capital structure
Our Covid-19 response
The global Covid-19 pandemic has caused an unprecedented level of disruption to economies globally. Restrictions have been in place to varying extents since the start of the pandemic in March 2020. Some sectors of the economy have been more severely impacted, particularly retail, leisure and tourism. However, since the start of the year the vaccine programme has gathered pace and there is a planned route to easing restrictions and opening up the economy.
The risks associated with the pandemic have impacted many of the principal and emerging risks set out here. There has been an impact on the Group’s rent collection and cash�flow, although�this�has�been�less�significant�than�originally�envisaged. We have a diverse portfolio spread across the UK, with around 350 occupiers in a wide range of businesses.�The�cash�flow�arising�from our occupiers underpins our business model. We are continuing to let space, although the number of transactions�has�reduced�since�
the pandemic�began.�The�material�uncertainty clause, introduced by our valuers�in�March�2020,�was�subsequently�removed.�We have considered in our Viability Statement the potential impact of various scenarios resulting from Covid-19 on the business.
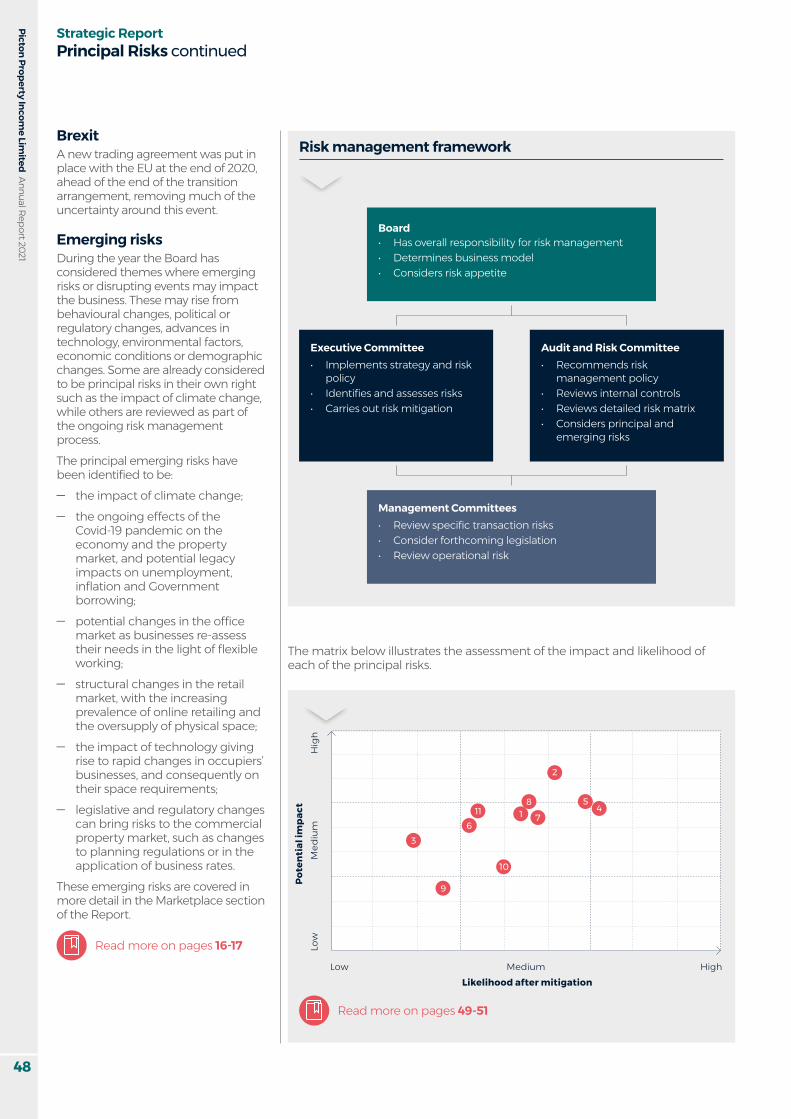
0
Picton Property Income Lim
ited Annual Report 2021
48
Strategic ReportPrincipal Risks continued
BrexitA new trading agreement was put in place with the EU at the end of 2020, ahead of the end of the transition arrangement, removing much of the uncertainty around this event.
Emerging risksDuring the year the Board has considered themes where emerging risks or disrupting events may impact the business. These may rise from behavioural changes, political or regulatory changes, advances in technology, environmental factors, economic conditions or demographic changes. Some are already considered to be principal risks in their own right such as the impact of climate change, while others are reviewed as part of the ongoing risk management process.The principal emerging risks have been�identified�to�be:
ӱ the impact of climate change; ӱ the ongoing effects of the
Covid-19 pandemic on the economy and the property market, and potential legacy impacts on unemployment, inflation�and�Government�borrowing;
ӱ potential�changes�in�the�office�market as businesses re-assess their�needs�in�the�light�of�flexible�working;
ӱ structural changes in the retail market, with the increasing prevalence of online retailing and the oversupply of physical space;
ӱ the impact of technology giving rise to rapid changes in occupiers’ businesses,�and�consequently�on�their�space�requirements;
ӱ legislative and regulatory changes can bring risks to the commercial property market, such as changes to planning regulations or in the application of business rates.
These emerging risks are covered in more detail in the Marketplace section of the Report.
Read more on pages 16-17
Board• Has overall responsibility for risk management• Determines business model• Considers risk appetite
Management Committees• Review�specific�transaction�risks• Consider forthcoming legislation• Review operational risk
Executive Committee• Implements strategy and risk
policy• Identifies�and�assesses�risks• Carries out risk mitigation
Audit and Risk Committee• Recommends risk
management policy• Reviews internal controls• Reviews detailed risk matrix• Considers principal and
emerging risks
The matrix below illustrates the assessment of the impact and likelihood of each of the principal risks.
Risk management framework
Likelihood after mitigation
Read more on pages 49-51
45
3
2
16
8
10
9
117
Low HighMedium
Low
Med
ium
Hig
hPo
tent
ial i
mp
act

Governance
Financial Statements
Additional Information
Picton Property Income Lim
ited Annual Report 2021Strategic Report
Business Overview
4949
Corporate Strategy
1
Political and economic Risk trend
RiskUncertainty in the UK economy, whether arising from political events or otherwise, brings risks to the property market and to occupiers’ businesses. This can result in lower shareholder returns, lower asset liquidity and increased occupier failure.
MitigationThe Board considers economic conditions and market uncertainty when setting strategy, considering the�financial�strategy�of�the�business�and in making investment decisions.
CommentaryThe impact of the pandemic in 2020 saw the largest ever contraction in UK GDP. A further decline occurred in�the�first�quarter�of�2021,�with�GDP�contracting�-1.5%�to�stand�at�-8.7%�below the pre-pandemic level. With the rollout of the vaccine continuing, a rebound is forecast during the latter part of 2021, although with the risk�of�inflationary�pressure.
Connected KPIs
A
B
C
G
H
Strategic Pillar
1
2
3
2
Market cycle Risk trend
RiskThe property market is cyclical and returns can be volatile. There is an ongoing risk that the Company fails to react appropriately to changing market conditions, resulting in an adverse impact on shareholder returns.
MitigationThe Board reviews the Group’s strategy and business objectives on a�regular�basis�and�considers�whether any change is needed, in light�of�current�and�forecast�market conditions.
CommentaryIt is likely that uncertainty in the property market will decline as restrictions ease.
Connected KPIs
C
D
Strategic Pillar
1
2
3
3
Regulatory and tax Risk trend
RiskThe Group could fail to comply with legal, fiscal, health and safety or regulatory matters which could lead to financial loss, reputational damage or loss of REIT status.
MitigationThe Board and senior management receive regular updates on relevant laws and regulations.
The Group is a member of the BPF and EPRA, and management attend industry�briefings.
CommentaryThere�are�no�significant�changes�expected to the regulatory environment in which the Group operates.
Connected KPIs
A
F
Strategic Pillar
1
2
3
4
Climate change Risk trend
RiskFailure to react to climate change could lead to the Group’s assets becoming obsolete and unable to attract occupiers.
MitigationSustainability is embedded within the Group’s business model and strategy.
We are committed to developing our pathway to carbon net zero over the course of the coming year.
All refurbishment projects consider environmental impact and where possible seek improvements.
CommentaryThere is an increasing momentum to the issue of addressing climate change.
Investors are putting a greater emphasis on ESG credentials and occupiers are seeking more sustainable buildings.
Connected KPIs
A
C
J
K
Strategic Pillar
1
2
3

Picton Property Income Lim
ited Annual Report 2021
50
5
Portfolio strategy Risk trend
RiskThe Group has an inappropriate portfolio strategy, as a result of poor sector or geographical allocations, or holding obsolete assets, leading to lower shareholder returns.
MitigationThe�Group�maintains�a�diversified�portfolio in order to minimise exposure to any one geographical area or market sector.
CommentaryThe pandemic continues to impact many occupiers’ businesses, particularly in the retail and leisure sectors. The longer-term impact of home�working�on�the�office�sector�is also unclear. The divergence of returns�seen�previously�across�sectors is expected to continue.
Connected KPIs
A
C
Strategic Pillar
1
2
3
6
Investment Risk trend
RiskInvestment decisions may be flawed as a result of incorrect assumptions, poor research or incomplete due diligence, leading to financial loss.
MitigationThe Executive Committee must approve all investment transactions over�a�threshold�level,�and�significant�transactions�require�Board�approval.
A formal appraisal and due diligence process is carried out for all potential purchases.
A�review�of�each�acquisition�is�performed within two years of completion.
CommentaryThere is no change to this risk.
Connected KPIs
A
C
Strategic Pillar
1
2
3
7
Asset management Risk trend
RiskFailure to properly execute asset business plans or poor asset management could lead to longer void periods, higher occupier defaults, higher arrears and low occupier retention, all having an adverse impact on earnings and cash flow.
MitigationManagement prepare business plans for each asset which are reviewed regularly.
The Executive Committee must approve all investment transactions over�a�threshold�level,�and�significant�transactions�require�Board�approval.
Management maintain close contact with occupiers and have oversight of the Group’s Property Manager.
CommentaryEffective asset management continues to be key, engaging with occupiers to provide appropriate solutions while maintaining cash flow�and�occupancy.
Connected KPIs
C
I
J
K
Strategic Pillar
1
2
3
8
Valuation Risk trend
RiskA fall in the valuation of the Group’s property assets could lead to lower investment returns and a breach of loan covenants.
MitigationThe Group’s property assets are valued�quarterly�by�an�independent�valuer with oversight by the Property Valuation Committee. Market commentary is provided regularly by the independent valuer.
The�Board�reviews�financial�forecasts�for the Group on a regular basis, including�sensitivity�and�adequate�headroom�against�financial�covenants.
CommentaryAlthough there is still some economic uncertainty, valuations are more stable with improved market evidence. Valuers have removed the material uncertainty clause that was introduced at the start of the pandemic.
Connected KPIs
A
C
E
Strategic Pillar
1
2
3
Property
Strategic ReportPrincipal Risks continued

Governance
Financial Statements
Additional Information
Picton Property Income Lim
ited Annual Report 2021Strategic Report
Business Overview
5151
Financial
Operational
9
People Risk trend
RiskThe Group relies on a small team to implement the strategy and run the day-to-day operations. Failure to retain or recruit key individuals with the right blend of skills and experience may result in poor decision making and underperformance.
MitigationThe Board has a remuneration policy in place which incentivises performance and is aligned with shareholders’ interests.
There is a Non-Executive Director responsible for employee engagement who provides regular feedback to the Board.
CommentaryNo employees were furloughed during the pandemic. The team has continued to work effectively from home, although a gradual return to the�office�is�envisaged.�Feedback�from the employee engagement survey was positive.
Connected KPIs
F
H
L
Strategic Pillar
1
2
3
10
Finance strategy Risk trend
RiskThe Group has a number of loan facilities to finance its activities. Failure to comply with covenants or to manage refinancing events could lead to a funding shortfall for operational activities.
MitigationThe Group’s property assets are valued�quarterly�by�an�independent�valuer with oversight by the Property Valuation Committee. Market commentary is provided regularly by the independent valuer.
The�Board�reviews�financial�forecasts�for the Group on a regular basis, including�sensitivity�against�financial�covenants.
The Audit and Risk Committee considers the going concern status of the Group biannually.
CommentaryThe�Group�has�significant�headroom�against its loan covenants. No additional borrowing has been incurred during the pandemic, and the Group’s revolving credit facility remains undrawn.
Connected KPIs
C
D
E
Strategic Pillar
1
2
3
11
Capital structure Risk trend
RiskThe Group operates a geared capital structure, which magnifies returns from the portfolio, both positive and negative. An inappropriate level of gearing relative to the property cycle could lead to lower investment returns.
MitigationThe Board regularly reviews its gearing strategy and debt maturity profile,�at�least�annually,�in�light�of�changing market conditions.
CommentaryThe Group’s gearing level has remained relatively low during the pandemic, and property values have been stable, reducing this risk.
Connected KPIs
A
C
E
G
H
Strategic Pillar
1
2
3

Picton Property Income Lim
ited Annual Report 2021
52
GovernanceRecommendationThe Board’s oversight of climate-related risks and opportunities
CommentaryThe Board has overall responsibility for risk management, including the consideration of climate-related risks, and for setting the Group’s risk appetite. The Audit and Risk Committee is responsible for overseeing the development, implementation and maintenance of the Group’s Risk Management Policy and its risk appetite.
Management’s role in assessing and managing climate-related risks and opportunities
Read more on pages 76-78
The Responsibility Committee meets regularly to consider all aspects of sustainability including risks and opportunities. Updates are provided to the Executive Committee which is responsible for implementing strategy within the agreed Risk Management Policy.
Strategy
RecommendationClimate-related risks and opportunities identified over the short, medium and long-term
CommentaryAn initial assessment of the climate-related risks over the short, medium and long-term�has�been�set�out�below.�Further�identification�of�risks�and�opportunities�will take place over the coming year.
Short-term (0-5 years):Stricter legislation including the implementation of new Minimum Energy Efficiency�Standards�for�commercial�property�and�tightening�of�regulations�which�will increase property costs.
Medium-term (5-10 years):Occupier�demand�for�buildings�with�higher�levels�of�efficiency,�climate�resilience�and lower carbon footprints will increase.
Long-term (15+ years): Climate change in the UK will bring more extreme weather conditions which may impact the portfolio.
TCFD Disclosure
Strategic ReportTCFD Statement
This year we have completed the review of our sustainability priorities and material issues. A key recommendation regarding one of those material issues, Climate Change Adaptation and Mitigation, was to start the journey towards net zero carbon and assess its feasibility. A related issue is to develop our reporting under the Task Force on Climate-related Financial Disclosures (TCFD) recommendations.
This�is�our�first�year�in�making�disclosures in line with the TCFD recommendations.�We expect�these�disclosures to evolve as we start to define�our�pathway�to�net�zero�carbon�and further�assess�the�risks�relating�to�climate change.

Governance
Financial Statements
Additional Information
Picton Property Income Lim
ited Annual Report 2021Strategic Report
Business Overview
53
Impact of climate-related risks and opportunities on the organisation’s businesses, strategy and financial planning
The�Board�has�identified�that�climate-related�risks�could�impact�on�the�Company�by reducing:
ӱ the desirability of its assets to occupiers where buildings are considered to be unsuitable for their purpose;
ӱ the ability to sell assets as a result of a greater focus on climate-related risks; and
ӱ its access to capital and impact on reputation due to concerns over how well the portfolio is adapted for climate change.
We are improving and adapting our assets through maintenance and energy efficiency�upgrades.�We�will�consider�the�climate-related�risks�and�energy�efficiency�of�potential�acquisitions�as�part�of�due�diligence.
Resilience of the organisation’s strategy, taking into consideration different climate-related scenarios, including a 2°C or lower scenario
Read more on pages 48–51
The Board has recognised that climate change will have an impact on the business, and we have started to develop our plan to become a net zero carbon business�and�at�the�same�time�develop�our�identification�and�disclosure�of�climate-related risks. As part of this we will consider the impact of physical and transitional risks under different scenarios, including a scenario limiting global warming to 2°C or lower.
Risk Management
RecommendationHow processes for identifying, assessing, and managing climate-related risks are integrated into the organisation’s overall risk management
Read more on pages 48–51
CommentaryThe Board, Audit and Risk Committee and Executive Committee formally review the Group’s principal risks. This includes climate-related risks, including their likelihood, impact and mitigating controls. The Board recognises that climate change is an increasingly important priority. Our risk matrix is regularly reviewed and updated to keep track of the changing nature of these risks.
Metrics and Targets
RecommendationMetrics used by the organisation to assess climate-related risks and opportunities in line with its strategy and risk management process
CommentaryWe report in line with EPRA Sustainability Best Practices Recommendations for sustainability reporting and include EPRA tables within our Sustainability Report.
Disclosure of Scope 1, Scope 2, and, if appropriate, Scope 3 greenhouse gas (GHG) emissions, and the related risks
We disclose Scope 1, 2 and 3 greenhouse gas (GHG) emissions in our Annual Report and Sustainability Report.
Targets used by the organisation to manage climate-related risks and opportunities and performance against targets
Read more on pages 54–57
As we continue our assessment of climate-related risks and opportunities over the coming year we will develop appropriate metrics and targets against which to measure our performance.
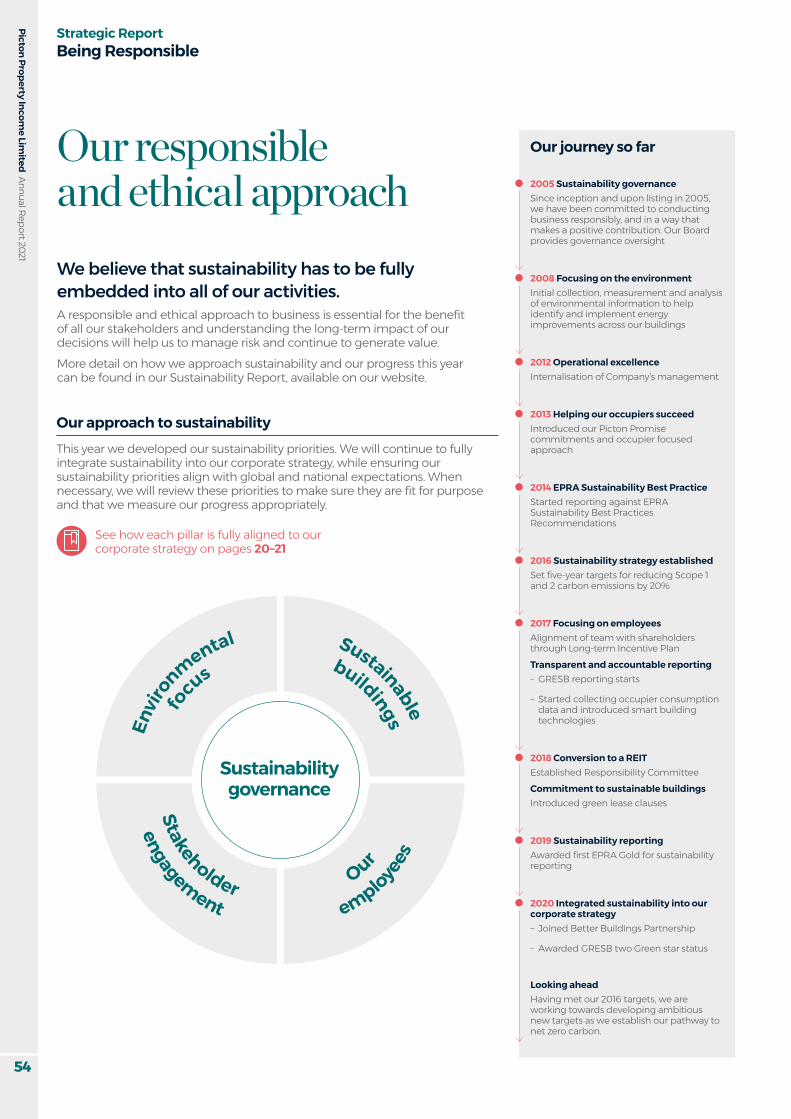
Picton Property Income Lim
ited Annual Report 2021
54
Strategic ReportBeing Responsible
Our responsibleand ethical approach
Our approach to sustainabilityThis year we developed our sustainability priorities. We will continue to fully integrate sustainability into our corporate strategy, while ensuring our sustainability priorities align with global and national expectations. When necessary,�we�will�review�these�priorities�to�make�sure�they�are�fit�for�purpose�and that we measure our progress appropriately.
See how each pillar is fully aligned to our corporate strategy on pages 20–21
We believe that sustainability has to be fully embedded into all of our activities.A�responsible�and�ethical�approach�to�business�is�essential�for�the�benefit�of all�our�stakeholders�and�understanding�the�long-term�impact�of�our�decisions will help us to manage risk and continue to generate value. More detail on how we approach sustainability and our progress this year can be found in our Sustainability Report, available on our website.
Sustainabilitygovernance
Envir
onmental
focus
Sustainable
buildings
employees
Our
engagement
Stakeholder
Our journey so far
2005 Sustainability governanceSince inception and upon listing in 2005, we have been committed to conducting business responsibly, and in a way that makes a positive contribution. Our Board provides governance oversight
2008 Focusing on the environment Initial collection, measurement and analysis of environmental information to help identify and implement energy improvements across our buildings
2012 Operational excellenceInternalisation of Company’s management
2013 Helping our occupiers succeedIntroduced our Picton Promise commitments and occupier focused approach
2014 EPRA Sustainability Best PracticeStarted reporting against EPRA Sustainability Best Practices Recommendations
2016 Sustainability strategy establishedSet�five-year�targets�for�reducing�Scope�1�and�2�carbon�emissions�by�20%
2017 Focusing on employeesAlignment of team with shareholders through Long-term Incentive Plan
Transparent and accountable reporting – GRESB reporting starts
– Started collecting occupier consumption data and introduced smart building technologies
2018 Conversion to a REIT Established Responsibility Committee
Commitment to sustainable buildings Introduced green lease clauses
2019 Sustainability reportingAwarded�first�EPRA�Gold�for�sustainability�reporting
2020 Integrated sustainability into our corporate strategy– Joined Better Buildings Partnership
– Awarded GRESB two Green star status
Looking ahead Having met our 2016 targets, we are working towards developing ambitious new targets as we establish our pathway to net zero carbon.

Governance
Financial Statements
Additional Information
Picton Property Income Lim
ited Annual Report 2021Strategic Report
Business Overview
55
line with the Better Buildings Partnership framework during the course of this year,
ESG auditsDuring 2020 four ESG audits were undertaken at Queens House, Glasgow, Metro, Manchester, 50 Farringdon Road, London and Tower Wharf, Bristol. A number of recommendations were made at each site for improvements which would result in energy and cost savings. The majority of these have now been actioned with the resulting payback starting in some cases from as soon as three months from completion�of�the�works�required�and�an�overall�annual�saving�of�£60,000.A further four surveys at 50 Pembroke Court, Chatham, Atlas House, Marlow, Longcross, Cardiff and 401 Grafton Gate, Milton Keynes have been commissioned for 2021 and we intend to review the recommendations of these and undertake further improvements where appropriate.
BiodiversityDuring 2020 we have undertaken biodiversity surveys across our portfolio at properties with landscaped areas and as a result measures such as the installation of bug hotels, bird boxes and changes to planting regimes have been put into effect at several sites including Parkbury Industrial Estate,
Radlett, Colchester Business Park, 50 Pembroke Court, Chatham, Tower Wharf, Bristol and Nonsuch Industrial Estate, Epsom. We will be undertaking further surveys across our sites during 2021 and have begun to engage with local wildlife trusts – for example Essex Wildlife Trust in Colchester – to obtain their recommendations on biodiversity measures which could be put into place.
ReportingWe recognise that it is important to be transparent on sustainability issues, so that our stakeholders can make informed decisions. We continue to report to GRESB and EPRA.For 2020 GRESB introduced a new scoring methodology, which made comparisons with earlier years more difficult.�Our�score�for�2020�was�65,�and we achieved two Green Stars, up from one Green Star in 2019. Our overall score was four points ahead of 2019. We were also ahead of our peer group average. We have�identified�areas�where�we�can�improve our score further in future. For the second year running we achieved a Gold award under the EPRA Sustainability Best Practices Recommendations.
Environmental focusWhat we have done this year
ӱ Carried out ESG audits at four office�properties
ӱ Improved our GRESB score and achieved two Green stars
ӱ Maintained EPRA Gold award for sustainability reporting
ӱ Exceeded�2016�five-year�target�with�57%�reduction�in�Scope�1�and 2 GHG emissions
ӱ Embarked on developing our net zero carbon pathway
ӱ Undertaken biodiversity surveys at a number of properties
ӱ Joined the Better Buildings Partnership
What we will do next year ӱ Aim to improve GRESB score
further ӱ Define�our�pathway�to�net�zero�
carbon ӱ Carry out a further four ESG
audits ӱ Continue to build on our
approach to biodiversity ӱ Continue to improve data
capture and increase coverage across our portfolio
Net zero carbon pathwayThis year we have completed the review of our sustainability priorities and material issues. A key recommendation regarding one of those material issues, Climate Change Adaptation and Mitigation, was to start the journey towards net zero carbon and assess its feasibility. This is a key challenge facing the real estate sector, with many companies beginning to publish their own net zero carbon pathways. A related issue is to develop our reporting under the Task Force on Climate-related Financial Disclosures recommendations. We have recognised that developing our net zero carbon pathway will require�us�to�partner�with�a�third�party�specialist, and are currently working through the selection process.We�intend�to�define�our�net�zero�carbon pathway and targets in

Picton Property Income Lim
ited Annual Report 2021
56
Strategic ReportBeing Responsible continued
Greenhouse gas emissionsThe table below provides our GHG emissions covering the last three years. Where it states ‘N/A’, this is because data was not previously collected, calculated or available. In our 2021 Sustainability Report we detail our GHG emissions for the last five�years.�In�2016�we�set�a�five-year�target to reduce our Scope 1 and Scope�2�GHG�emissions�by�20%.�Our�overall�reduction�was�57%.�
Scope 1Our absolute Scope 1 emissions fell by 31%�compared�to�the�previous�year�to 799 tCO2e. Similarly our Scope 1 intensity�also�fell�by�30%.�This�was�largely due to the impact of the lockdown restrictions on the occupancy of buildings during the year.
Scope 2Our absolute Scope 2 emissions have decreased�by�35%�this�year,�to�1,479�tCO2e, and our Scope 2 intensity also fell. As with Scope 1, the emissions reduced because of lockdown restrictions. We are also seeing the benefit�of�energy�efficiency�projects�completed in the previous year, such as at Atlas House in Marlow. This year some major refurbishment projects have been carried out incorporating further environmental initiatives, including at Stanford Building, and we expect to see the impact of these on our Scope 2 emissions in future.
Scope 3Scope 3 emissions include those of our occupiers, and this is the largest Scope 3 element. Data collection this year has been severely hampered by the pandemic, as occupiers have been unable to access buildings, and so the reported�figures�are�heavily�based�on�estimates. We will update these when we have received more accurate data. As expected, other Scope 3 emissions have also declined this year, with water consumption and waste disposal falling�by�47%,�and�business�travel�by 76%.�
MethodologyWe have reported on all the emission sources�required�under�the�core�requirements�of�EPRA’s�‘Best�Practices�Recommendations on Sustainability Reporting’ 2020, and have voluntarily disclosed business travel, occupier and own premises consumption (Scope 3) emissions. An operational control approach has been adopted and all of our properties are included. Figures presented are absolute for utility and waste consumption and relate only to landlord-obtained utilities and waste removal. Occupier-obtained consumption is included where possible. We have calculated and reported our emissions in line with the GHG Protocol Corporate Accounting and Reporting Standard (revised edition) and used emission factors from UK Government’s GHG Conversion Factors for Company Reporting 2020. Where data was unavailable in kilogrammes or tonnes for waste, we used average volumes to convert to tonnes.
Intensity measurements are based on the individual property’s Gross Internal Area�(GIA),�regardless�of�the�specific�area served by the supply. This is an accurate�way�of�covering�95%�of�our�consumption but will be less useful for our industrial vacant units; due to the comparatively low consumption and�large�floor�areas�typically�associated with vacant industrial units. We are continually improving the reporting process so that we can produce increasingly useful normalisation and intensity metrics. We have continued to voluntarily report on Scope 3 vehicle emissions. Vehicle emissions were calculated using our vehicle expenses reports and the vehicle emission factors from the UK Government GHG Conversion Factors for Company Reporting 2017. We have included occupier and own premises consumption within the Scope 3 emissions, using emission factors from UK Government’s GHG Conversion Factors for Company Reporting 2020. Year-on-year, we will continue to update previous reported�figures�if�applicable�to�remove estimates and ensure actual data is captured and reported.
Emission source
2021 2020 2019
GHG Scope
Absolute GHG
emissions (tCO2e)
GHGintensity
(tCO2e/m2)
AbsoluteGHG
emissions (tCO2e)
GHGintensity
(tCO2e/m2)
AbsoluteGHG
emissions (tCO2e)
GHGintensity
(tCO2e/m2)
Combustion of fuel and operation of facilities 1 799 0.004 1,166 0.005 1,242 0.006Electricity, heat, steam and cooling purchased for own use 2 1,479 0.007 2,282 0.010 2,679 0.015Total Scope 1 and 2 2,278 0.011 �3,448� 0.015 �3,921� 0.021Business travel 3 1 N/A 4 N/A 8 N/AOccupier data 3 2,570 0.002 3,672 0.004 5,425 0.003Office�premises 3 13 N/A 17 N/A 10 N/ALandlord water and treatment 3 28 0.000 53 0.001 55 0.001Landlord waste 3 7 0.000 13 0.000 26 0.000Total Scope 3 2,619 0.002 3,759 0.005 5,524 0.004Total all Scopes 4,897 0.013 �7,207� 0.020 �9,445� 0.025

Governance
Financial Statements
Additional Information
Picton Property Income Lim
ited Annual Report 2021Strategic Report
Business Overview
57
EPC managementOver the year we have reassessed 23 EPCs. The average newly assessed EPC�rating�improved�to�a�C�(reflecting�an average score of 64), from the previous�average�rating�of�D�(reflecting�an average score of 90). Overall we have 387 EPC units across the portfolio,�of�which�92%�are�rated�A-D.�We have one unit with an F rated EPC where we are liaising with the occupier to undertake the necessary works to improve the rating. We continue to use lease events, common area works and EPC renewals to implement improvement works with the overall aim of continually improving our EPC score and ensuring compliance with MEES.
Refurbishment checklistWe have, in partnership with our building advisers, implemented an ESG-focused refurbishment checklist. This provides a set of guidelines to ensure our refurbishment process and refurbished buildings meet the appropriate environmental, social and governance standards based on the scope and type of refurbishment works being undertaken.
Health and safetyOur health and safety record remained strong over the year with no reported accidents or health and safety related incidents. Despite the restrictions caused by the pandemic we�were�99%�compliant�in�critical�and secondary documentation.
In order to continue maintaining these high standards, we have created a new Health and Safety Committee to ensure that compliance and performance is measured appropriately for all our stakeholders; our employees, occupiers, contractors and other visitors to our buildings.We provided Covid-19 safe plans complying with the relevant health and safety regulations and guidance for�all�of�our�multi-let�offices�which�ensured they remained safely open throughout the pandemic.
Green leasesWe have continued to incorporate sustainability clauses into our leases during the year.We�have�identified�three�levels�of green lease clauses - basic, intermediate and leader.At�the�start�of�this�financial�year�we had 60 green leases in place. By 31 March 2021 this had risen to�105,�so�an�increase�of�75%�over�the year. Of this total, nearly half are at the highest leader level.
1
2
3 See how this aligns with our strategic pillars on page 20–21
Sustainable buildingsWe are committed to monitoring and enhancing the environmental performance of our buildings and aim to ensure refurbishments are carried out to the highest sustainability standards. As we look to develop our pathway to net zero carbon over the course of next year, we will be further�establishing�the�requirements�at a portfolio level to enhance the risk and resilience of our buildings.
What we have done this year ӱ Improved 20 EPC ratings ӱ Developed refurbishment
checklist ӱ Provided Covid-19 compliant guidance�for�office�re-occupation
ӱ Created a new Health and Safety Committee
ӱ Increased number of green leases�by�75%
What we will do next year ӱ Further improve the portfolio
EPC ratings ӱ Maintain high level of health
and safety compliance ӱ Consider further integration of
wellbeing initiatives for our occupiers within our refurbishment checklist

Picton Property Income Lim
ited Annual Report 2021
58
Strategic ReportBeing Responsible continued
Our employeesWe have a strong and open company culture with shared values co-created by our employees. We value the contributions made by the whole team and aim to nurture a positive working environment.
What we have done this year ӱ Carried out a further employee
survey ӱ Established regular virtual team
meetings to maintain morale during lockdowns
ӱ Held virtual meetings between the team and Non-Executive Directors
ӱ Held a socially distanced team offsite when restrictions allowed
ӱ Moved�offices,�upgraded�workplace amenities and IT
What we will do next year ӱ Return�to�the�office�with�a�flexible�working�model
ӱ Continue to build on the employee engagement survey to identify areas important to the team
ӱ Focus on upskilling the team on sustainability
Employee engagementThis year we again carried out an employee survey, which focused on the issues arising from remote working.�At�the�start�of�the�first�lockdown in March 2020 we introduced daily virtual team meetings, so that we were able to maintain communication across the whole team. The feedback from the survey was positive and that this contact was appreciated by the team and helped to maintain morale throughout the periods of lockdown.When restrictions permitted, we held a socially distanced team offsite. This included relevant training sessions with an external speaker.
Office moveOne of the key themes from last year’s employee survey and forum was the quality�of�office�accommodation.�By�moving�office�we�now�benefit�from�excellent�office�space�and�amenities.�As part of the move we upgraded our IT infrastructure and connectivity.
Diversity and inclusionWe value the contributions made by all of our employees and believe that a diverse workforce is key to maximising business effectiveness. We aim to select, recruit, develop and promote the very best people and are committed to creating a workplace where everyone is treated with dignity and respect, and where individual difference is valued. We�recognise�the�benefits�of�diversity�and the value this brings to the Group. We aim to maintain the right blend of skills, experience and knowledge within the Board and the Picton team. At the date of this Report, the number of men and women employed by the Group were:
Men Women
Board 4 2Rest of team 4 4Total 8 6
Training and developmentWe want to encourage our employees to realise their full potential by giving them access to development and training opportunities. This year the amount of training carried out by employees was 1.6%�on�a�time�spent�basis,�up�from�1.5%�last�year.Employee development is based on the following key principles:
ӱ Development should be continuous; employees should always be actively seeking to improve performance
ӱ Regular investment of time in learning is seen as an essential part of working life
ӱ Development needs are met by a mix of activities, which include internal and external training courses, structured ‘on the job’ experience and through interaction with professional colleagues
All of the Group’s employees have a formal performance appraisal on an annual basis, together with a mid-year review of their progress against objectives set at the start of the year.
Stanford BuildingLondon

Governance
Financial Statements
Additional Information
Picton Property Income Lim
ited Annual Report 2021Strategic Report
Business Overview
59
Stakeholder engagementWe have in place a framework for conducting business in a way that makes a positive contribution to society while minimising the impact on people and the environment. We are committed to engaging with our occupiers, shareholders, suppliers and wider community and the Board acts to promote the long-term success of the business for the�benefit�of�all�our�stakeholders.
What we have done this year ӱ Maintained regular
communication with shareholders, including virtual meetings
ӱ Engaged with our occupiers throughout the year to help navigate the pandemic
ӱ Developed our occupier engagement programme to improve occupier satisfaction
ӱ Carried out occupier satisfaction survey
ӱ Marked�fifteenth�anniversary�by�holding community initiative offering�£15,000�to�local�charities
ӱ Made further charitable donations�of�£14,000
What we will do next year ӱ Roll out occupier engagement
plan ӱ Act on the results of our latest
occupier survey ӱ Use�our�influence�to�drive�
environmental performance and increase adoption of green lease clauses
Our occupiersWe are always seeking to improve our occupiers’ experience, which is why we�created�the�Picton�Promise:�five�key commitments including Action, Community, Technology, Support and Sustainability. Each commitment underpins every aspect of the occupier experience we provide.
We have continued our occupier engagement programme during the pandemic, maintaining regular contact and communication with our occupiers. We have held regular virtual building management meetings�with�our�office�occupiers�and ensured buildings were accessible and Covid-compliant.This year we will aim to further develop our engagement with occupiers and act upon the results of the recent occupier survey that we have carried out. We are also preparing building�specific�re-occupation�plans to assist our occupiers when they are ready to return.
Our suppliersWe have in place a framework for conducting business across the Group, in a way that makes a positive contribution to society while minimising any negative impact on people and the environment. We expect high standards within our business and from our suppliers.Last�year�we�prepared�our�first�Supplier Code of Conduct. The Code is designed to promote safe and fair working conditions and the responsible management of social, ethical and environmental issues in our supply chain. Over the last year we have been rolling this out to all of our principal suppliers, and to new suppliers as appropriate.
Our communitiesWe are committed to supporting the local communities where we own buildings. We aim to continually improve the impact of our buildings within local communities through not only providing space to local businesses, but also through the improvement of local areas and minimising the environmental impact of buildings themselves. We have this year developed our community and social value, and charitable giving policies to provide greater focus on our initiatives.As�part�of�our�fifteenth�year�anniversary celebrations, we created a funding�award�of�£15,000�to�support�not-for-profit�community�organisations�where we own buildings. We invited applications from organisations committed to creating, delivering or expanding projects which improve community engagement.
We received many applications nominated by our occupiers and selected�five�worthwhile�projects�to�each receive an award. These were:
ӱ The Link Visiting Scheme, Wokingham
ӱ Capel Community Trust, Capel ӱ Your Sanctuary, Surrey ӱ I CAN, London ӱ Strathcarron Hospice, central
ScotlandWe continue to support a variety of charities, and this year made donations�of�over�£14,000.�With�the impact of the pandemic curtailing many charities’ fundraising activities we felt it was appropriate to increase our support. The principal charities that we have supported this year are The Funding Network, Coram and LandAid.We have maintained our occupier matched giving policy, and also offer matched giving for employees who are raising money for charity.
Parkbury Industrial EstateRadlett

Picton Property Income Lim
ited Annual Report 2021
60
Strategic ReportBeing Responsible continued
Understanding our stakeholdersWe believe that taking into account the views of our key stakeholders is critical to the long-term success of the business. We engage with all of our stakeholders to understand what is important to them. The following table sets out our key stakeholders and how we effectively engage with them.Our section 172 statement for the year ended 31 March 2021 is on pages 62 to 63 and sets out how some of the key decisions made by the Board during the year were guided by stakeholder engagement.
Stakeholder What is important to our stakeholders
How we engage What we have done this year
Our people – Fair�and�equal�treatment– Career progression– Fair pay and conditions– Good work/life balance– Positive work culture and
values
We have a small team and engage regularly with them. We have an appraisal process where each member of the team will discuss their performance and objectives with their line manager twice a year. We carry out an annual employee survey, and the results of this are discussed at a meeting held with our designated Non-Executive Director for employee engagement, Maria Bentley.
We have maintained contact with the team by holding regular virtual meetings and have held a socially distanced team offsite when restrictions allowed. The results of the employee survey showed the team remained positive and morale was good.
Local communities and charities
– Local employment opportunities
– Positive contribution to local economy
– Safe and clean environment
We are committed to improving local communities where we own buildings, whether providing space to local businesses, improvement of local areas or minimising the environmental impact of buildings themselves. We engage through our charity and community initiatives and through our occupier engagement programme.
This�year,�to�mark�our�fifteenth�anniversary, we created a funding award�of�£15,000�to�support�local�community organisations or charities where we own buildings. We received many�applications�and�selected�five�worthwhile projects to receive an award.
Our occupiers – Space suited to their needs– Fair lease terms– Well-managed,�efficiently�run�
and sustainable buildings– Good relationships
One of our key priorities is to work with our occupiers, so that we can understand their needs and aim to meet their�current�and�future�requirements.�Our asset managers maintain regular contact with occupiers and discuss with them any issues regarding the buildings and any future plans we have. Our Head of Occupier Services has developed an occupier engagement programme, and will attend occupier meetings and other events. We send out an occupier newsletter regularly with relevant and helpful information.
Our engagement with occupiers has been very important this year. We have proactively liaised with many occupiers over�the�course�of�the�year,�trying�to�find�mutually�beneficial�solutions�to�the�issues caused by the pandemic.

Governance
Financial Statements
Additional Information
Picton Property Income Lim
ited Annual Report 2021Strategic Report
Business Overview
61
Stakeholder What is important to our stakeholders
How we engage What we have done this year
Our investors – Clear strategy– Regular dividends– Financial performance– Clear and transparent
reporting
We value the views of all our shareholders and senior management hold regular meetings to update shareholders on progress and activity. We issue regular investor updates with key�financial�highlights�and�updates�on�the portfolio. Our website has been enhanced and provides investors with up-to-date information about the Group. We encourage shareholders, in normal circumstances, to attend our Annual General Meeting where they are able to ask�questions�of�the�Directors�directly.
At�the�start�of�this�financial�year�we�took�the�difficult�decision�to�reduce�the�level�of dividend, taking a conservative approach to the potential impact of the pandemic on the business. As the year has progressed and our rent collection has been maintained at a robust level we have increased the dividend on two occasions, albeit not yet back to the pre-pandemic level. After the initial fall, this has helped our share price to rise by�37%�over�the�second�half�of�the�year.
Suppliers – Prompt payment– Fair terms of business– Long-term relationships
We seek to maintain productive and long-term relationships with our business partners. We have in place a framework for conducting business across the Group in a way that makes a positive contribution to society, while minimising any negative impact on people and the environment.
We have continued to ensure that our suppliers are paid promptly and within payment terms.

Picton Property Income Lim
ited Annual Report 2021
62
Section 172
Strategic ReportSection 172 Statement
As the Company is registered in Guernsey, the UK Companies Act 2006 has no legal effect. However, in accordance with the UK Corporate Governance Code 2018 and as a matter of good governance, the Directors, individually and collectively as the Board, act as they consider most likely to promote the success of the Company for the benefit of our shareholders as a whole.
Consideration of these factors and other relevant matters is embedded into all Board decision making, strategy development and risk assessment throughout the year. We consider our key stakeholders to be our occupiers, our people, our communities, our suppliers and our shareholders. Working closely with our stakeholders falls within one of our three strategic pillars set out within our business model and strategy. The primary ways in which the Board engages directly or delegates responsibility for engagement to management is set out below.
Board engagement with stakeholdersOur shareholdersAs owners of the business we rely on the support of our shareholders and their views are important to us. The long-term success of the business will deliver value for shareholders. Senior management hold regular meetings with shareholders and feedback from these meetings is reported back to the Board. This feedback may be on operational matters, financing�strategy�or�dividend�policy,�as examples. This year, our new Chair, Lena Wilson, held virtual meetings with some of our larger shareholders to understand their views on relevant issues. The Directors normally attend the Annual General Meeting to meet with shareholders and to answer any�questions�they�may�have.�
Our occupiersOne of our key priorities is to work with our occupiers, so that we can understand their needs and aim to meet their current and future�requirements.�The�Board�has delegated responsibility for engaging with occupiers to the asset management team, who have ongoing communication with occupiers, and use this information when making proposals to the Board on investment transactions, such as refurbishment projects or leasing events. Our peopleOur people are key to our success and we want them to succeed both as individuals and as a team. One of our Non-Executive Directors, Maria Bentley, has responsibility for employee engagement. This year we again undertook an employee survey. The results of this survey were discussed at a virtual meeting attended by Maria, Richard Jones and the employees, without the Executive Directors present. The views of the employees on a number of issues, particularly the impact of remote working, were reported directly back to the rest of the Board. Local communities and EnvironmentWe are committed to improving the impact of our buildings on local communities, whether providing space to local businesses, improving local areas or minimising the environmental impact of buildings themselves. The Board has established a Responsibility Committee, which is chaired by one of the Executive Directors, to deal with sustainability policy and initiatives on its behalf. The Board reviews progress on sustainability matters and has attended relevant workshops during the year. SuppliersWe have in place a framework for conducting business across the Group in a way that makes a positive contribution to society, while minimising any negative impact on people and the environment. The Board has agreed the overall business framework and delegated its implementation to the management team.
The likely long-term consequences of decisions
Read more on pages 70-73
The interests of its employees
Read more on page 58
The Company’s relationships with its suppliers, customers and others
Read more on pages 59-61
The impact of the Company’s operations on the community and the environment
Read more on pages 54-61
The Company’s reputation and maintaining a reputation for high standards of business conduct
Read more on pages 64-73
The need to act fairly between shareholders
Read more on pages 64-73
The Directors have regard to:

Governance
Financial Statements
Additional Information
Picton Property Income Lim
ited Annual Report 2021Strategic Report
Business Overview
63
Considering stakeholders in key Board decision makingSet out below are examples of important decisions taken during the year. These are decisions that are material to the Group but
Actions
Support given to occupiers during the pandemic
The�Board�recognised�that�some�occupiers�were�experiencing�financial�difficulties�as�a�result�of�the�restrictions�imposed�during�the�pandemic,�and�consequently�their�ability�to�meet�their�rent�commitments.�Requests�from�occupiers were considered on a case-by-case basis, with the aim of providing assistance�while�minimising�the�impact�to�capital�values�and�cash�flow.�
Review and increase of dividend The Board is aware of the value of regular dividend payments to shareholders and�reviews�the�level�of�dividend�each�quarter.�At�the�start�of�the�pandemic�the�Board�took�the�difficult�but�prudent�decision�to�reduce�the�level�of�dividend.�Subsequently,�the�Board�approved�two�increases�in�dividend,�restoring much of the original reduction, as soon as it was considered appropriate.
Development of net zero carbon pathway
The Board is aware of the increasing risk of climate change to the environment and over the last year we have developed our sustainability action plan. The Board has decided that the next step is to set out our pathway�to�becoming�a�net�zero�carbon�business,�which�will�benefit�all�of�our�stakeholders.
Office move During the year the Board agreed that the business should move and upgrade�its�premises.�We�have�taken�a�floor�in�one�of�our�own�buildings,�which�was�previously�retail�space,�and�converted�to�office.�This�has�removed�the�external�lease�costs�associated�with�the�former�office�and�had�the�benefit�of reducing the Group’s retail exposure. One of the issues raised in the employee�survey�in�the�previous�year�was�the�quality�of�occupied�space,�and�the�move�to�newly�refurbished�offices�was�positively�received�by�the�team.
Consultation on Remuneration Policy
As described more fully in the Remuneration Report, we have carried out a consultation exercise with our largest shareholders regarding changes to our Directors’ Remuneration Policy, and this will be put to shareholders at this year’s Annual General Meeting.
also�significant�to�any�of�our�key�stakeholders. In its decision making the Board considered the feedback from stakeholder engagement as well as the need to act fairly between shareholders and to maintain high standards of business conduct.

Picton Property Income Lim
ited Annual Report 2021
64
GovernanceChair’s Introduction
Dear ShareholderThis year the Board and leadership team have had to adapt their way of working to comply with the restrictions imposed as a result of the Covid-19 pandemic. All of the regular Board and Committee meetings have been held virtually for the whole year, and our Annual General Meeting was unfortunately a closed event for shareholders. I very much hope that we will soon be able to meet again in person and return to our previous routines.
Visit our website www.picton.co.uk
Introduction to the Corporate Governance Report
Lena Wilson CBEChair
I am pleased to introduce our 2021 Corporate Governance Report.
This year we have completed the succession process and made some changes to the Board.Lena Wilson CBEChair

Strategic ReportG
overnanceFinancial Statem
entsAdditional Inform
ationPicton Property Incom
e Limited Annual Report 2021
Business Overview
65
PurposeIn�2019�we�redefined�our�purpose�to�include ‘being a responsible owner of commercial real estate, helping our occupiers succeed and being valued by all our stakeholders’. The events of the last year have very much emphasised the importance of this statement, and how our engagement with occupiers has not only helped them but also has been�to�the�long-term�benefit�of�Picton, and all of its stakeholders.
Our people and cultureWe have maintained our programme of employee engagement this year, despite�the�difficulties�of�working�remotely. Maria Bentley is our Non-Executive Director with responsibility for employee engagement. This year we have again carried out an employee survey, and I am pleased that�the�results�were�equally�as�positive as last year. The survey was followed up with a virtual meeting with the team and both Maria and Richard, but not the Executive Directors. The issues associated with home working were the main focus of discussion, and it was good to hear that the team had taken this in their stride, and that morale has remained high.
Our stakeholdersOur occupier focused approach is a key part of our business culture. This year our engagement with occupiers has been critical to the business, helping us to give the right support to our occupiers while maintaining income and values. 2020�marked�the�fifteenth�anniversary�of the launch of the Company. In order to mark this anniversary we created a funding�award�of�£15,000�to�support�local community organisations or charities where we own buildings. We received many applications and�selected�five�worthwhile�projects to receive an award. With charity activities and volunteering opportunities severely curtailed this year I am very pleased that we were able to provide support in this way.
ReportingThis year we have decided to use the authority in our Articles to reduce the number of printed versions of our Annual Report and instead for shareholders to view the Report online at our website. As well as the environmental�benefit�of�reducing�the amount of paper used in issuing the Report to all shareholders, there will�also�be�the�financial�benefit�to the Company from reducing costs. Shareholders who still wish to receive a hard copy will be able to do so, but I hope that most will take up the electronic option. We aim to always produce reports that are transparent and informative, and I am pleased to report that last year’s Annual Report and Sustainability Report both received an EPRA Gold award.
Board evaluationThis year the Board carried out an internal evaluation, the results of which are discussed in the following Corporate Governance Report. The conclusions reached from the evaluation will be followed up over the forthcoming year. The next Board evaluation will be carried out externally, in accordance with our policy of undertaking an external evaluation every three years.
Lena Wilson CBEChair26 May 2021
Board compositionThis year we have completed the succession process that has been a main focus of our governance activities since the Company became resident and managed in the UK in 2018. My predecessor, Nick Thompson, stepped down from the Board at the end of January this year. I would like to extend my thanks to him for his help in making my transition to Chair so smooth. On behalf of all my new colleagues at Picton I would like to thank him for all his hard work and contribution to Picton since he joined in 2005.We have also welcomed Richard Jones to the Board, who joined on 1 September 2020 and has replaced Roger Lewis. Roger served on the Board from 2010 and again I would like to thank him for his contribution to the business over many years. Richard has also taken over as Chair of the Property Valuation Committee, bringing his wealth of previous property experience to that role.The selection process for the Board appointments that have taken place this year is set out in the Nomination Committee report.
GovernanceOur Statement of Compliance with the Corporate Governance Code is set out within the Directors’ Report. I am pleased to report that we have fully complied with the Code, except for the tenure of two long-serving Directors, and this exception has now been resolved.The following reports describe the activities of each of the Board Committees in more detail, and I believe that our current Committee structure remains appropriate for the good governance of the Company.
RemunerationOur current Directors’ Remuneration Policy was put in place in 2018 and so is due to be reviewed this year to ensure it remains appropriate and in accordance with best practice. We have carried out a consultation exercise with our largest shareholders in respect of potential changes to the policy, and this is described in more detail in the Remuneration Report.

Picton Property Income Lim
ited Annual Report 2021
66
GovernanceBoard of Directors
Diversity of experience
67%Real estate
83%Corporate finance and public companies
83%Strategy and governance
33%Finance and accounting
We have the relevant skills and experience for future growth The Board is responsible for the long-term success of the business, providing leadership and direction with due regard and consideration to all�stakeholders�in�the�business.
Lena Wilson CBEChair Chair of the Nomination Committee
Appointed to the Board January 2021
Responsible for ensuring the Board is effective in setting and implementing the Company’s direction and strategy including reviewing and evaluating the performance of the CEO.Key strengths and skills– Over a decade of Non-Executive, Senior
Independent Director and Chair experience including FTSE 100 companies across the financial�and�industrial�sectors
– Multi-disciplinary global career across private and public sector
– Experienced CEO leading organisations with an international footprint
Principal external commitments– Chair of Chiene + Tait LLP– Non-Executive Director NatWest Group plc – Non-Executive Director and Senior
Independent Director Argentex Group PLC – Chair of AGS GroupPrevious experience and appointments– Chief Executive of Scottish Enterprise– Senior Investment Advisor at the World Bank – Non-Executive Director Intertek PLC– Non-Executive Director Scottish Power
Renewables
Richard JonesChair of the Property Valuation Committee
Appointed to the Board September 2020
Responsible for overseeing the review of the quarterly�valuation�process�and�making�recommendations to the Board as appropriate. Key strengths and skills– Significant�real�estate�investment�experience– Broad experience of property asset
management– Extensive experience of property valuationPrincipal external commitments– Investment Committee of Henley Secure
Income Property Unit Trust – Transport for London’s Commercial Property
Advisory Group– Special Advisor to Clearbell UK Strategic TrustPrevious experience and appointments– UK Managing Director on Aviva’s Investors’
Global Real Estate Board – Special Director of Ribston UK Industrial
Property Unit Trust– Non-Executive Director of Royal Brompton and Harefield�Hospital�NHS�Foundation�Trust

Strategic ReportG
overnanceFinancial Statem
entsAdditional Inform
ationPicton Property Incom
e Limited Annual Report 2021
Business Overview
67
Andrew DewhirstFinance Director
Appointed to the Board October 2018
Responsible�for�strategic�financial�planning�and�reporting for the Group.Key strengths and skills– Chartered accountant with extensive experience�in�financial�planning�and�reporting
– In-depth�knowledge�of�financial�services,�capital markets and real estate funds
– Expertise�in�debt�and�equity�financingPrincipal external commitmentsNonePrevious experience and appointments– Director of Client Accounting at ING Real
Estate Investment Management – Director at Hermes Administration Services
Maria BentleyChair of the Remuneration Committee
Appointed to the Board October 2018
Responsible for leading on the recommendation of remuneration policies and levels, for effective succession planning and employee engagement.Key strengths and skills– Business head leading change across global
teams– Expertise in human resources– Extensive�experience�in�financial�servicesPrincipal external commitments– Non-Executive Director of BlueBay Asset
Management LLP and Chair of the Remuneration Committee
– Non-Executive Director of Daiwa Capital Markets Europe Limited
Previous experience and appointments– Senior Managing Director & Global Head of HR,
Wholesale & Head of HR EMEA at Nomura International plc
– Group Managing Director & Global Head of HR, UBS Investment Bank
– Managing Director, Global Head of HR for Equities�and�Fixed�Income,�Goldman�Sachs�International
Michael MorrisChief Executive
Appointed to the Board October 2015
Responsible for overall strategic direction and execution of the Group’s business model.Key strengths and skills– Successful track record of driving investment
strategy and delivering results for shareholders– Proven leadership skills – In-depth�understanding�of�real�estate�equity�
capital marketsPrincipal external commitmentsNonePrevious experience and appointments– 25 years’ wide-ranging commercial real estate
market experience– Senior Director and Fund Manager at ING Real
Estate Investment Management
Mark BattenChair of the Audit and Risk Committee Senior Independent�Director
Appointed to the Board October 2017
Responsible�for�financial�reporting�and�accounting policies, audit strategy and the evaluation of internal controls and risk management systems.Key strengths and skills– Chartered Accountant and restructuring
specialist – Extensive experience in banking, insurance,
real estate, debt structuring and restructuring– Broad real estate knowledge, covering most
sub-sectorsPrincipal external commitments– Chair, Assured Guaranty UK– Non-Executive Director and Chair of the Audit
and Risk Committee – Reliance National Insurance Company (Europe)
– Non-Executive adviser and Chair of the Finance Committee,�Royal�Brompton�and�Harefield�NHS Clinical Group
– Chair, Governing Body, Westminster SchoolPrevious experience and appointments– Partner, PricewaterhouseCoopers LLP
(restructuring and corporate valuation practices)– Non-Executive Director, L&F Indemnity– Senior adviser to UK Government Investments
Business Overview
Changes to the Board
Appointed to the BoardLena Wilson CBEChair Chair of the Nomination Committee 1 January 2021
Richard Jones Chair of the Property Valuation Committee 1 September 2020
Retired from the Board Nicholas Thompson Chair 31 January 2021
Roger Lewis Chair of the Property Valuation Committee 30 September 2020
Nicholas Wiles Non-Executive Director 20 May 2020

Picton Property Income Lim
ited Annual Report 2021
68
GovernanceOur Team
01 Melissa Ricardo Office�ManagerMelissa joined in 2017 and is responsible for the day-to-day�management�of�the�office�and oversees�the�administrative�aspects�of�the Company.
02 James Forman Director of Accounting James�is�a�Certified�Accountant�and�has�worked�with the Group since its launch in 2005 and has over 20 years experience in the real estate sector. He is responsible for all the accounting and financial�reporting�for�the�Group�and�is�a�member of the Transaction and Finance Committee.
03 Mark AlderHead of Occupier ServicesMark is a Chartered Surveyor with over 35 years of property management experience. He is responsible for delivering effective property management and strengthening our relationship with our occupiers.
04 Michael Morris Chief ExecutiveMichael has over 25 years experience within the UK�commercial�property�sector�and�is�responsible for the strategic direction and effective execution of the Group’s business model.
05 Louisa McAleenanResearch AnalystLouisa has over 14 years experience of real estate research and is responsible for all aspects of research and analysis, contributing to the direction of the Group’s investment strategy and is a member of the Responsibility Committee.
06 Tim HamlinDirector of Asset ManagementTim is a Chartered Surveyor with over 13 years of real�estate�experience�and�is�responsible�for creating�and�implementing�asset�level�business plans in line with the portfolio’s strategic direction and is a member of the Responsibility Committee.
07 Andrew DewhirstFinance Director Responsible�for�the�financial�strategy�and�reporting for the Group, Andrew has over 30 years’�experience�within�the�financial�services�and real�estate�sectors.
08 Jay Cable Senior Director and Head of Asset Management A Chartered Surveyor with over 20 years of real estate experience, Jay has worked with the Group since its launch in 2005. He is responsible for the proactive asset management of the portfolio and overseeing its strategic direction, and is a member of the Executive Committee and the Transaction and Finance Committee.
09 Lucy Stearman Assistant Accountant Lucy has over nine years experience within financial�services�and�joined�the�Group�in�April 2019�to�assist�with�the�accounting�and�financial�reporting.�
With extensive experience across real estate management and financial services, our team have an in-depth knowledge and understanding of the UK commercial property market. Meet our team

Strategic ReportG
overnanceFinancial Statem
entsAdditional Inform
ationPicton Property Incom
e Limited Annual Report 2021
Business Overview
69
1
6
2
3
4
7
8
9
5

Picton Property Income Lim
ited Annual Report 2021
70
GovernanceCorporate Governance Report
Leadership structure
Audit and RiskChair: Mark BattenComprises: 3 Non-Executive Directors
Responsibilities:• Oversees�financial�
reporting• Monitors risk management• Reviews system of internal
controls• Evaluates external auditor
RemunerationChair: Maria BentleyComprises: 4 Non-Executive Directors
Responsibilities:• Determines remuneration
policy• Sets remuneration of
Executive Directors• Reviews remuneration of
whole workforce• Approves bonus and LTIP
awards
Transaction and FinanceChair: Michael MorrisComprises: 2 Executive Directors and senior management
Responsibilities:• Reviews and recommends portfolio transactions• Monitors portfolio costs• Reviews compliance with lending covenants
ResponsibilityChair: Andrew DewhirstComprises: 1 Executive Director and senior management
Responsibilities:• Determines sustainability policy and strategy• Monitors compliance with relevant standards and legislation• Oversees Health and Safety Committee• Approves ESG reporting• Employee wellbeing
Property ValuationChair: Richard JonesComprises: 4 Non-Executive Directors
Responsibilities:• Oversees the independent
valuation process• Recommends the
appointment and remuneration of the valuer
• Ensures compliance with applicable standards
NominationChair: Lena Wilson CBEComprises: 4 Non-Executive Directors
Responsibilities:• Recommends Board
appointments• Considers succession
planning• Board evaluation• Board composition and
diversity
The BoardChair: Lena Wilson CBEComprises: 2 Executive Directors and 4 Non-Executive Directors
Responsibilities:• Direction and control of the business• Overall long-term success• Sets and implements strategy • Establishes the culture and values of the business• Promotes wider stakeholder relationships
Executive CommitteeChair: Michael MorrisComprises: 2 Executive Directors and 1 senior executive
Responsibilities:• Implementation of strategy• Manages operations• Day-to-day management of the business• Employee remuneration and development
Board Committees
Management Committees

Strategic ReportG
overnanceFinancial Statem
entsAdditional Inform
ationPicton Property Incom
e Limited Annual Report 2021
Business Overview
71
Division of responsibilities
Role Responsibilities
ChairLena Wilson CBE
– Leads the Board – Responsible for overall Board effectiveness– Promotes Company culture and values– Sets the agenda and tone of Board discussions– Ensures that all Directors receive full and timely information to enable effective
decision making– Promotes open debate at meetings– Ensures effective communication with stakeholders– Builds relationships between Executive and Non-Executive Directors
Chief ExecutiveMichael Morris
– Develops and recommends strategy to the Board– Responsible for the implementation of strategy set by the Board– Manages the business on a day-to-day basis– Manages communication with shareholders and ensures that their views are
represented to the BoardSenior Independent DirectorMark Batten
– Leads the evaluation of the Chair– Available for communication with shareholders when other channels are not
appropriateNon-Executive DirectorsMark BattenMaria BentleyRichard Jones
– Bring independent judgement and scrutiny to the decisions of the Board– Bring a range of skills and experience to the deliberations of the Board– Monitor business progress against agreed strategy– Review�the�risk�management�framework�and�the�integrity�of�financial�information– Determines the remuneration policy for the Group and approves performance
targets in line with strategyExecutive DirectorAndrew Dewhirst
– Supports the Chief Executive in the formulation of strategy– Manages�the�financial�operations�of�the�Group– Develops�and�maintains�the�system�of�financial�controls�within�the�Group– Recommends the risk management framework to the Board
Composition of the Board
FunctionNumber %
Non-Executive Chair 1 17%Executive Directors 2 33%Independent Non-Executive Directors 3 50%
DiversityNumber %
Male 4 67%Female 2 33%
TenureNumber %
0 to 3 years 4 67%3 to 6 years 2 33%

Picton Property Income Lim
ited Annual Report 2021
72
GovernanceCorporate Governance Report continued
The role of the BoardThe Board is responsible for the long-term success of the business.�It�provides�leadership�and�direction,�with�due regard�to�the�views�of�all�of�the�stakeholders�in�the�business. The Board operates in an open and transparent way, and seeks to engage with its shareholders, employees, occupiers and local communities. The Board has full responsibility for the direction and control of the business, and sets and implements strategy, within a framework of strong internal controls and risk management. It establishes the culture and values of the Group.�The Board has a schedule of matters reserved for its attention.�This�includes�all�acquisitions�and�significant�disposals,�significant�leasing�transactions,�dividend�policy,�gearing and major expenditure.The Board has collectively a range of skills and experience that are complementary and relevant to the business. These are set out in the biographies of the individual Directors on pages 66 and 67.
Board meetingsThe Board has a regular schedule of meetings. The Board has�at�least�two�meetings�each�quarter;�the�first�of�which�focuses on operational matters, and the second covers strategic issues and longer-term planning. External advisers are invited to attend Board meetings on a regular basis. All meetings this year have been held remotely.
Board changesOn 1 September 2020 Richard Jones was appointed to the Board as a Non-Executive Director. Richard became Chair of the Property Valuation Committee on 1 October 2020, replacing Roger Lewis, who stepped down from the Board on 30 September 2020.Lena Wilson was appointed to the Board on 1 January 2021, and took over as Chair of the Company on 1 February 2021. Nicholas Thompson, the previous Chair, retired from the Board on 31 January 2021.Nicholas Wiles resigned from the Board on 20 May 2020.
CompositionThe Board currently comprises the Chair, two Executive Directors and three independent Non-Executive Directors. All of the Directors will stand for re-election at the forthcoming Annual General Meeting.As�at�31�March�2021�the�Board�comprised�50%�independent Non-Executive Directors.
Board CommitteesThe Board has established four Committees: Audit and Risk, Remuneration, Property Valuation and Nomination. These are�comprised�entirely�of�Non-Executive�Directors�and�operate�within�defined�terms�of�reference.�The�terms�of�reference�are available on the Company’s website. Attendance at Board and Committee meetings
Date appointed BoardAudit
and Risk RemunerationProperty
Valuation Nomination
Nicholas Thompson 15.09.2005 8/8 – 7/7 4/4 3/3Lena Wilson 01.01.2021 2/2 – 2/2 1/1 –Michael Morris 01.10.2015 9/9 – – – –Andrew Dewhirst 01.10.2018 9/9 – – – –Mark Batten 01.10.2017 9/9 3/3 8/8 4/4 3/3Maria Bentley 01.10.2018 9/9 3/3 8/8 4/4 3/3Roger Lewis 31.03.2010 5/5 1/1 3/3 2/2 2/3Richard Jones 01.09.2020 5/5 2/2 5/5 2/2 0/1Nicholas Wiles 01.01.2020 2/2 – 2/2 1/1 1/1Total number of meetings 9 3 8 4 3
The above meetings were the scheduled Board and Committee meetings. Additional meetings were held to deal with other�matters�as�required�and�are�not�included�above.�

Strategic ReportG
overnanceFinancial Statem
entsAdditional Inform
ationPicton Property Incom
e Limited Annual Report 2021
Business Overview
73
Non-Executive DirectorsExcluding the Chair, the Board includes three independent Non-Executive Directors. The Non-Executive Directors bring a variety of skills and business experience to the Board. Their role is to bring independent judgement and scrutiny�to�the�recommendations�of�the�Executive�Directors. Each of the Non-Executive Directors is considered�to�be�independent�in�character�and judgement.
Internal control and risk managementThe Directors acknowledge that they are responsible for establishing and maintaining the Group’s system of internal controls and reviewing its effectiveness. Internal control systems are designed to manage the achievement of business objectives, rather than eliminate the failure to achieve them and can only provide reasonable, and not absolute, assurance against material misstatement or loss. They have therefore established an ongoing process designed�to�meet�the�particular�needs�of the�Group�in�managing the risks to which it is exposed, consistent with the guidance provided by the Turnbull Committee. Such review procedures have been in place throughout the full financial�year,�and�up�to�the�date�of�the approval�of�the�financial�statements,�and�the�Board�is satisfied�with�their effectiveness.This process involves a review by the Board of the control environment within the Group’s service providers to ensure that�the�Group’s�requirements�are�met.The Group does not have an internal audit function. Given the�scale�of�the�Group’s�operations,�the�Board�has�determined that a separate internal audit function is unnecessary and that additional procedures carried out by the�external�auditor�in�conjunction�with�the�audit�of�the Group’s�accounts�will�provide�the�Board�with�sufficient�assurance regarding the internal control systems in place. The�Board�continues�to�place�reliance�on�the�Company’s Administrator’s internal control systems.These systems are designed to ensure effective and efficient�operations,�internal�control�and�compliance�with�laws and regulations. In establishing the systems of internal control, regard is paid to the materiality of relevant risks, the likelihood�of�costs�being�incurred�and�costs�of�control.�It follows,�therefore,�that�the�systems�of�internal�control�can only�provide�reasonable,�but�not�absolute,�assurance�against the risk of material misstatement or loss.The effectiveness of the internal control systems is reviewed annually by the Audit and Risk Committee and the Board. The Audit and Risk Committee has a discussion annually with the auditor to ensure that there are no issues of concern�in�relation�to�the�audit�opinion�on�the�financial�statements and representatives of senior management are excluded from that discussion.
Shareholder engagementIn conjunction with the Board, the Administrator keeps under review the register of members of the Company. All shareholders�are�encouraged�to�participate�in�the�Company’s Annual General Meeting. All Directors normally attend the Annual General Meeting, at which shareholders have the opportunity to ask questions�and�discuss�matters�with�the�Directors�and�senior management. Investors are able to direct any questions�for�the�Board�via�the�Secretary.The Chair has met with a number of larger shareholders as part of her onboarding process and intends to join analyst meetings where possible. Further meetings with investors will�take�place�if�requested.�The�outcome�of�investor�meetings is communicated to the rest of the Board.
Board evaluationThe Board has a policy of undertaking an external evaluation every three years, with internal evaluations in the other years. This year an internal review was carried out by the�Directors,�based�on�a�questionnaire�prepared�by�the�Company’s Administrator. The anonymised results of the evaluation were considered by the Board at its meeting in December 2020. The main conclusions of the evaluation were as follows:
ӱ The�frequency�of�meetings�will�be�reviewed ӱ There will be an increased emphasis on diversity of
external input to meetings ӱ More meetings will be held in person when conditions
allow ӱ The content of regular reports will be reviewed ӱ The Audit and Risk Committee will consider the Group’s
risk appetite, including proposed sector and geographic weightings
ӱ Sustainability issues and setting a pathway to net zero carbon will be a focus for the coming year
Conflicts of interestDirectors�are�required�to�notify�the�Company�of�any�potential�conflicts�of�interest�that�they�may�have.�Any�conflicts�are�recorded�and�reviewed�by�the�Board�at�each�meeting.�No�conflicts�have�been�recorded�during�the�year.
Employee engagementWe recognise that our employees are integral to the business, and we aim to provide a working environment where they are able to reach their potential. Maria Bentley is the designated Non-Executive Director with responsibility for employee engagement. We have again carried out an annual employee survey, covering all of the Picton team with the exception of the Directors. The results of the survey were�then�discussed�at�an�informal�meeting�attended by Maria and the employees. The feedback from the�team�was�positive,�particularly�in�the�light�of�the�challenges caused by the Covid-19 pandemic, including remote working.

Picton Property Income Lim
ited Annual Report 2021
74
Terms of referenceThe Committee’s terms of reference include consideration of the following issues:
ӱ Review and make recommendations regarding the size and composition of the Board;
ӱ Consider and make recommendations regarding succession planning for the Board and senior management;
ӱ Identify and nominate candidates to�fill�Board�vacancies�as�they�arise;
ӱ Review the results of the Board evaluation relating to composition;
ӱ Review�the�time�requirements�for�Directors; and
ӱ Recommend the membership of Board Committees.
Visit our website www.picton.co.uk
GovernanceNomination Committee Report
Nomination Committee
The members of the Nomination Committee are Lena Wilson, Richard Jones, Mark Batten and Maria Bentley.
With the appointments made this year, the current succession plan has been completed.Lena Wilson CBEChair of the Nomination Committee
Lena Wilson CBEChair of the Nomination Committee
Lena Wilson is the Chair of the Committee, having taken over this role on 31 January 2021. Maria Bentley was Chair of the Committee from 20 May 2020 until 31 January 2021, while the search and appointment of a new Company Chair took place.This Report covers the appointment and induction of Lena Wilson as a Non-Executive Director and Chair designate, and those sections of the Report were prepared by the previous Chair.The role of the Committee is to consider the size, structure and composition of the Board to ensure that it has the right balance of skills, knowledge, experience and diversity to carry out its duties and provide effective leadership. In making any new appointment the Board will consider a number of factors, but principally�the�skills�and�experience�that�will�be�relevant�to�the�specific�role�and�that will complement the existing Board members.The Committee ensures that the appointment process is formal, rigorous and transparent.

Strategic ReportG
overnanceFinancial Statem
entsAdditional Inform
ationPicton Property Incom
e Limited Annual Report 2021
Business Overview
75
Board composition and successionThe Board comprises the Chair, two Executive Directors and three independent Non-Executive Directors. With the appointments made this year the current succession plan has been completed.
Tenure and re-electionThe tenure of Non-Executive Directors, including the Chair, is limited to nine years in accordance with the Corporate Governance Code. The provisions of the Corporate Governance Code recommend that all Directors be subject to annual re-election at the Annual General Meeting. The Board will follow this recommendation at this year’s Annual General Meeting.
Diversity policyThe Company is committed to treating�all�employees�equally�and considers all aspects of diversity, including gender, when considering recruitment at any level of the business. All candidates are considered on merit but having regard to the right blend of skills, experience and knowledge at Board and Executive level, and amongst our employees generally.
InductionThe induction process for both Richard Jones and Lena Wilson was led by the Chair and supported by the other Directors. The process commenced shortly after each appointment�was�confirmed�and�comprised a number of virtual one-to-one meetings with the other Non-Executive Directors, the Chief Executive and the Finance Director. There were also virtual meetings held with the rest of the Picton team. Additional reading and reference material was provided that was specific�to�the�Group�and�its�business.
Lena Wilson CBEChair of the Nomination Committee26 May 2021
ActivityThe Committee met three times during the year ended 31 March 2021 and considered the following matters:
ӱ The selection process for the appointment of a new Director to replace Roger Lewis;
ӱ The selection process for the appointment of a new Company Chair to replace Nicholas Thompson;
ӱ The appointment of external consultants to compile lists of candidates;
ӱ The formation of a working group of the Committee to manage the recruitment process and work with the consultants; and
ӱ Consideration�of�the�final�shortlists�of candidates for both roles and final�recommendations.�
Appointments to the BoardThe Committee’s main focus during the year was on the selection and appointment of two new Non-Executive Directors, one as Company Chair designate to replace Nicholas Thompson, and the other to replace Roger Lewis, who had served on the Board since 2010.For both roles independent executive search consultants JCA Group were appointed. The Committee provided JCA with a detailed description of the roles�and�the�capabilities�required�for them. The consultants prepared lists of potential candidates, ensuring there�was�sufficient�diversity,�which�were assessed by the Committee for suitability to the roles. Short lists for each of the roles were drawn up and the candidates were interviewed initially by the Chair of the Committee and�subsequently�by�two�other�Directors. The whole Committee then considered the feedback from this process before making recommendations to the Board. The Board approved the appointments of Richard Jones from 1 September 2020 and of Lena Wilson from 1 January 2021.

Picton Property Income Lim
ited Annual Report 2021
76
Terms of referenceThe Committee’s terms of reference include consideration of the following issues:
ӱ Financial reporting, including significant�accounting�judgements�and accounting policies;
ӱ Development of a comprehensive Risk Management Policy for the adoption by the Group;
ӱ Evaluation of the Group’s risk profile�and�risk�appetite,�and�whether these are aligned with its investment objectives;
ӱ Ensuring that key risks are being effectively�identified,�measured,�managed, mitigated and reported;
ӱ Internal controls, controls testing and risk management systems;
ӱ The Group’s relationship with the external auditor, including effectiveness and independence;
ӱ Internal audit; and ӱ Reporting responsibilities.
Visit our website www.picton.co.uk
GovernanceAudit and Risk Committee Report
Audit and Risk Committee
Mark BattenChair of the Audit and Risk Committee�
The Audit and Risk Committee is chaired by Mark Batten. The other members of the Committee are Richard Jones and Maria Bentley.
The Committee has developed a comprehensive Risk Management Policy which has been adopted by the Group. Mark Batten
Chair of the Audit and Risk Committee

Strategic ReportG
overnanceFinancial Statem
entsAdditional Inform
ationPicton Property Incom
e Limited Annual Report 2021
Business Overview
77
The valuation is conducted on a quarterly�basis�by�independent�valuers, and is subject to oversight by the Property Valuation Committee. It is a key component of the annual and�half-year�financial�statements�and is inherently subjective, requiring�significant�judgement.�Members of the Property Valuation Committee, together with members of the Picton team, meet with the independent�valuer�on�a�quarterly�basis to review the valuations and underlying assumptions, including the year-end valuation process. The Chair of the Property Valuation Committee reported to the Audit and Risk Committee at its meeting in�April�2021�and�confirmed�that�the following matters had been considered in discussions with the independent valuers:
ӱ Property market conditions; ӱ Yields on properties within the
portfolio; ӱ Letting activity and vacant
properties; ӱ Covenant strength and lease
lengths; ӱ Estimated rental values; and ӱ Comparable market evidence.
The Audit and Risk Committee reviewed the Report from the Chair of the Property Valuation Committee including the assumptions applied to the valuation and considered their appropriateness, as well as considering current market trends and conditions, and valuation movements compared�to�previous�quarters.�The�Committee considered the valuation and agreed that this was appropriate for�the�financial�statements.�The�Committee�was�satisfied�that�the 2021 Annual Report is fair, balanced and understandable and included the necessary information as set out above, and it has�confirmed�this�to�the�Board.
Risk Management PolicyThe Committee has considered and developed a comprehensive Risk Management Policy which has been adopted by the Group.The purpose of the Risk Management Policy is to strengthen the proper management of risks through proactive�risk�identification,�measurement, management, mitigation and reporting in respect of all activities undertaken by the Group. The Risk Management Policy is intended to:
ӱ Ensure that major risks are reported to the Board for review;
ӱ Result in the management of those�risks�that�may�significantly�affect the pursuit of the stated strategic goals and objectives;
ӱ Embed a culture of evaluation and identify risks at multiple levels within the Group; and
ӱ Meet legal and regulatory requirements.�
Internal controlsThe Board is responsible for the Company’s internal control system and for reviewing its effectiveness. It has therefore established a process designed to meet the particular needs of the Company in managing the risks to which it is exposed.As part of this process, a risk matrix has�been�prepared�that�identifies�the Company’s key functions and the individual activities undertaken within those functions. From this, the Board�has�identified�the�Company’s�principal risks and the controls employed to manage those risks. These are reviewed at each Audit and Risk Committee meeting. Also, the Committee has agreed a programme of additional controls testing which is carried out by the external auditor, in order to provide the Board with comfort that the controls are operating as intended and have been in place throughout the year. The Board also monitors the performance of the Company against its strategy and receives regular reports from management covering all business activities.
Meetings�of�the Audit�and�Risk�Committee are attended by the Group’s Finance Director and other members�of�the�finance�team,�and�the external auditor. The external auditor is given the opportunity to discuss matters without management presence.
ActivityThe Audit and Risk Committee met three times during the year ended 31 March 2021 and considered the following matters:
ӱ External audit strategy and plan; ӱ Audit and accounting issues of significance;
ӱ The Annual and Interim Reports of the Group;
ӱ Reports from the external auditor; ӱ The effectiveness of the audit
process and the independence of KPMG Channel Islands Limited;
ӱ Review of the Group’s Risk Management Policy and appetite
ӱ Review of the risk matrix and mitigating controls; and
ӱ Stock Exchange announcements.
Financial reporting and significant reporting mattersThe Committee considers all financial�information�published�in�the�annual�and�half-year�financial�statements and considers accounting policies adopted by the Group, presentation and disclosure of the financial�information�and�the�key�judgements made by management in�preparing�the�financial�statements.The Directors are responsible for preparing the Annual Report. At�the�request�of�the�Board,�the�Committee considered whether the 2021 Annual Report was fair, balanced and understandable and whether it provided the necessary information for shareholders to assess the Group’s strategy, business model and performance. The key area of judgement that the Committee considered in reviewing�the�financial�statements�was the valuation of the Group’s investment properties.

Picton Property Income Lim
ited Annual Report 2021
78
GovernanceAudit and Risk Committee Report continued
The Committee has received and reviewed a copy of CBRE Limited’s Real Estate Accounting Services – Service Organisation Control Report as at 31 December 2020, prepared in accordance with International Standard on Assurance Engagements 3402, in respect of property management accounting services provided to Picton Property Income Limited.Given the scale of the Group’s operations, the Board has determined that a separate internal audit function is unnecessary and that additional procedures carried out by the external auditor in conjunction with the audit of the Group’s accounts will provide the Board with sufficient�assurance�regarding�the�internal control systems in place.
Independence of auditorIt is the policy of the Group that non-audit work will not be awarded to the external auditor if there is a risk their independence may be conflicted.�The�Committee�monitors�the level of fees incurred for non-audit services to ensure that this is not material,�and�obtains�confirmation,�where appropriate, that separate personnel are involved in any non-audit services provided to the Group. The Committee must approve in advance all non-audit assignments to be carried out by the external auditor.The fees payable to the Group’s auditor�and�its�member�firms�are�as follows:
2021 £000
2020 £000
Audit fees 174 159Interim review fees 16 16Non-audit fees 16 16
206 191
The�non-audit�fees�include�£16,000�for additional controls testing, carried out by KPMG Channel Islands Limited.
Annual auditor assessmentOn an annual basis, the Committee assesses�the�qualifications,�expertise�and independence of the Group’s external auditor, as well as the effectiveness of the audit process. It does this through discussion and enquiry�with�senior�management,�review of a detailed assessment questionnaire�and�confirmation�from�the external auditor. The Committee
also considers the external audit plan, setting out the auditor’s assessment of the key audit risk areas and reporting received from the external auditor in respect of both the half-year and year end reports and accounts.As part of the review of auditor independence and effectiveness, KPMG Channel Islands Limited has�confirmed�that:
ӱ They have internal procedures in place to identify any aspects of non-audit work which could compromise their role as auditor and to ensure the objectivity of the audit report;
ӱ The total fees paid by the Group during the year do not represent a material part of their total fee income; and
ӱ They consider that they have maintained their independence throughout the year.
In evaluating KPMG Channel Islands Limited the Committee completed its assessment of the external�auditor�for�the�financial�period�under�review.�It�has�satisfied�itself�as�to�their�qualifications�and�expertise�and�remains�confident�that�their objectivity and independence are not in any way impaired by reason of the non-audit services which they provide to the Group.KPMG Channel Islands Limited have been auditor to the Group since the year ended 31 December 2009. They were reappointed as the Group’s auditor following a tender process in February 2020. The current audit engagement partner, Deborah Smith, has served four years as audit partner.The Committee recommends that KPMG Channel Islands Limited are recommended for reappointment at the next Annual General Meeting.
Mark Batten Chair of the Audit and Risk Committee26 May 2021

Strategic ReportG
overnanceFinancial Statem
entsAdditional Inform
ationPicton Property Incom
e Limited Annual Report 2021
Business Overview
79
GovernanceRemuneration Report
Terms of referenceThe Committee’s terms of reference are available on the Company’s website. The principal functions of the Committee�as�set�out�in�the�terms of�reference�include�the�following matters:
ӱ Review the ongoing appropriateness and relevance of the Directors’ Remuneration Policy;
ӱ Determine the remuneration of the Chairman, Executive Directors and such members of the executive management as it is designated to consider;
ӱ Review the design of all share incentive plans for approval by the Board;�and
ӱ Appoint and set the terms of reference for any remuneration consultants.
Visit our website www.picton.co.uk
Remuneration Committee
Maria BentleyChair of the Remuneration Committee
The Remuneration Committee is chaired by Maria Bentley. The other members of the Committee are Lena Wilson, Mark Batten and Richard Jones.
We are putting forward a revised Remuneration Policy for approval by shareholders this year.Maria BentleyChair of the Remuneration Committee
AdvisersDuring the year, Deloitte LLP has provided independent advice in relation to market data, share valuations, share plan administration and content of the Remuneration Report. Total fees for the year were £43,500�(calculated�on�a�time�spent�basis). Deloitte LLP is a founding member of the Remuneration Consultants Group and, as such, voluntarily operates under the code of conduct in relation to executive remuneration consulting in the UK. In addition Deloitte also provided taxation services and advice to the Company during the year. The Committee has reviewed the nature of this additional advice and�is�satisfied�that�it�does�not�compromise the independence of the advice that it has received.Other attendees at Committee meetings during the year were Michael Morris and Andrew Dewhirst. Neither participated in discussions relating to their own remuneration.

Picton Property Income Lim
ited Annual Report 2021
80
Annual statementDear ShareholdersIntroductionOn behalf of the Board, I am pleased to introduce the Remuneration Committee report for the year ended 31 March 2021. This report comprises three sections:
ӱ This annual statement; ӱ Directors’ Remuneration Policy;
and ӱ The Annual Report on
Remuneration for the year ended 31 March 2021.
The Committee met eight times during the year and set out below is a summary of its activity.
Our Covid-19 response
GovernanceRemuneration Report continued
Covid-19 impactRemuneration is considered against the performance of the Group in the both the short and longer-terms, and against the broader economic backdrop. The Covid-19 pandemic has provided a number of challenges over�the�last�financial�year�and�is�likely to continue to do so. Picton has continued to perform well, and this is set out in the Strategic Report. The decisions that we have taken this year have been made against the backdrop of the economic conditions in the UK, market practice and investor feedback. We have not had to furlough any employees and have not taken any form of Government support. We have worked with our occupiers�through�this�difficult�period�and found solutions that have helped them but also maintained value for all our stakeholders. At the start of the�pandemic�we�took�the�difficult�decision to reduce our dividend, but�have�subsequently�increased�it�twice,�so�that�it�is�now�at�91%�of�the pre-pandemic level. Our share price, although still at a discount to net asset value, has recovered significantly�from�where�it�was�in�the early stages of the pandemic.Given the Group’s performance and returns achieved the Committee considered it appropriate that the variable elements of remuneration pay out in accordance with their respective performance conditions having been met. The Committee determined that the outcomes did represent a fair�reflection�of�the�performance�of�the Group, and that no overriding adjustment was necessary.
New Remuneration Policy and adjustments to Executive Directors’ remuneration mix and opportunityThe current Directors’ Remuneration Policy was set in 2018 and approved by shareholders at the Annual General Meeting that year. It is now approaching the end of its three-year life, and we are putting forward a revised policy for approval by shareholders this year. Our existing policy is already compliant with most aspects of the 2018 Corporate Governance Code so there are relatively few changes in the proposed new policy. The principal change is the introduction of a post-employment shareholding guideline - further details are on page 88.In parallel with the introduction of the new policy, the Committee has reviewed the Executive Directors’ remuneration arrangements.The current arrangements were set when Picton transitioned from an investment company to a UK REIT in 2018, and new Executive Director roles were established. At that time the remuneration packages for the appointed individuals were not adjusted commensurate with their new roles.Our objective is to provide straightforward remuneration packages,�justifiable�to�all�stakeholders, which are designed so as to attract and retain outstanding talent and to fairly reward delivery of strategic priorities and enhanced shareholder value. We believe we are currently failing to meet aspects of this objective:

Strategic ReportG
overnanceFinancial Statem
entsAdditional Inform
ationPicton Property Incom
e Limited Annual Report 2021
Business Overview
81
ӱ Despite consistent outperformance, our Executive Directors are being paid significantly�below�the�levels�of�most of their peers and with more at�risk�(due�to�a�more�significant�skew in their remuneration mix towards annual bonus than most of our peers). This raises an issue of fairness about the current arrangements.
ӱ The Committee is concerned that the extent of the gap between our Executive Directors and their peers enhances the risk that one of these individuals could be attracted elsewhere to receive a considerably higher pay package with the replacement cost for either most likely�to�be�considerably�higher to attract the right calibre of candidate.�
Both of these issues stem from our decision not to adjust salaries to�more�fairly�reflect�the�scale�and�responsibilities of the Executive Directors’ roles when we transitioned to a UK REIT. We, therefore, have concluded that it is the right time to make sensible adjustments to the Executive Directors’ remuneration packages to more fairly�reflect�their�responsibilities�as Directors of a listed company. We are acutely aware that this is a particularly sensitive environment in which to be making changes to pay arrangements and the planned salary transition has been structured accordingly:
ӱ The salary transition will be phased over a three-year period with changes in the second and third years being conditional on the Committee�being�satisfied�that�they remain appropriate in the context of prevailing business performance and economic circumstances.
ӱ Salaries�will�be�increased�by�15%�in 2021/22�for�both�Executive�Directors and, subject to the aforementioned Committee review,�there�will�be�further�15%�increases in 2022/23 and 2023/24. The Executive Directors received no pay rise in 2020/21.
ӱ The maximum annual bonus potential�will�be�reduced�by�10%�to 165%�of�salary�in�2021/22�with�further�10%�decreases�in�2022/23�(155%�of�salary)�and�2023/24�(145%�of salary) if the salary increases outlined above are enacted. This will result in a more market standard remuneration mix.
ӱ As�a�consequence�of�these�changes, we intend for the Executive Directors’ total remuneration potential at the end of the three-year policy period in 2023/24 to be positioned slightly below�the�2019/20�lower�quartile�of similar�sized�UK-listed�REITs�–�we believe�that�this�conservative�market positioning is appropriate in the current circumstances.
We have consulted with our major shareholders on the above proposals and we received positive responses from consultees. We have also given careful consideration as to how these proposals will be received by employees and, in my role as designated Non-Executive Director with responsibility for employee engagement, I have consulted with them as part of this stakeholder engagement process.
Group performance and alignmentWe have set out on pages 30 to 33 the key performance indicators (KPIs) that we currently use to monitor the success of the business. In order to appropriately align executive remuneration with business performance we incorporate KPIs within our incentive schemes. In both 2020/21 and 2021/22 the KPIs that we are using to determine variable remuneration are:
ӱ Total return ӱ Total property return ӱ Total shareholder return ӱ Growth in EPRA earnings per share
The precise application of these measures to both the annual bonus and the Long-term Incentive Plan is set out later in the Report.
Annual bonus awards for 2020/21The Executive Directors were set a number of challenging targets for this year, comprising a combination of�financial�measures�and�corporate�and personal objectives. The�three�financial�measures�were�total return, total property return and growth in EPRA earnings per share. The actual outcomes are set out in the Annual Remuneration Report, but the overall result was that the Directors�earned�an�estimated�77%�of the maximum award available under�these�financial�measures.

Picton Property Income Lim
ited Annual Report 2021
82
GovernanceRemuneration Report continued
The corporate objectives were set in the context of the Covid-19 pandemic. These objectives were intended to ensure that the business was able to withstand the adverse impacts of the pandemic and be well positioned for a recovery. The Committee considered that the Executive Directors had largely met the corporate objectives, evidenced by the robust results for the year. More detail is provided later in this Remuneration Report, but overall the Committee considered that outcomes of�84%�of�the�maximum�award�for�the�two Executive Directors were merited against the corporate objectives.In aggregate, annual bonus awards for the two Executive Directors are 80%�of�the�maximum�award�(2019/20�–�70%�and�73%�of�maximum).The Committee considered the formulaic bonus outcome in the context of the Group’s overall performance for the year. Performance has been discussed earlier in the Report but particular points considered by the Committee included:
ӱ The return from the property portfolio�was�upper�quartile�compared to the MSCI UK Quarterly Property Index for the year, and our long-term record of outperformance has been maintained�over�three,�five�and�ten�years.
ӱ The�Group’s�profit�for�the�year�was�£34�million,�giving�a�total�return�of�6.6%.�The�profit�was�some�50%�higher than the previous year and achieved in a very challenging market.
ӱ EPRA earnings for the year were slightly ahead of the previous year, with an increase in occupancy and lower�costs�offsetting�the�additional provisions made against income.
ӱ The loan to value ratio has fallen, and no drawdowns have been made under the revolving credit facility.
The Committee concluded that it was�satisfied�the�formulaic�bonus�outcome�was�a�fair�reflection�of overall Group performance during�the�past�financial�year.
Long-term Incentive Plan awards (performance period to 31 March 2021)The awards made under the Long-term Incentive Plan (‘LTIP’) in June 2018 were based on three performance conditions measured over the three-year period ended on 31 March 2021. The LTIP provides the link between the long-term success of the Company and the remuneration of the whole team. The Committee has assessed the extent to which these three performance conditions have been met. The�three�equally�weighted�performance conditions were total shareholder return, total property return and growth in EPRA earnings per share. The actual outcomes for these conditions are set out in the Annual Remuneration Report and give�rise�to�an�overall�award�of�67%�of�the maximum granted. As explained above, the Committee concluded that�it�was�satisfied�the�formulaic�outcome�was�a�fair�reflection�of overall Group performance over the performance period.
Salary review for 2021/22In considering the salary review for 2021/22, the Committee took into account a number of factors. They received an independent benchmarking report covering each of the roles within the Picton team and considered publicly available data and other market intelligence. The Committee’s deliberations regarding the base salaries for the Executive Directors are set out above. For the remainder of the team as a whole the Committee determined that there would be an overall�average�rise�of�6.4%�in�base�salaries with effect from 1 April 2021.
Non-Executive Director feesThe fees for the Chair and Non-Executive Directors were last reviewed in 2018, at the start of the current Remuneration Policy. In conjunction with the new Policy, a further review of the fees was carried out, incorporating an independent market data report of similar companies, and an assessment of the annual time commitment for each role, including the Committee Chairs. In light of this review, the following annual fee rates apply from 1 April 2021.
ӱ The Chair fee is increased to £116,800�from�£105,000
ӱ The Non-Executive Director fee is increased�to�£45,000�from�£40,000
ӱ The additional fee for the Chair of the Audit and Risk, Remuneration and Property Valuation Committees�is�£7,500�(increased�from�£5,000�for�the�latter�two�roles)
The new rates position the fees at the�market�lower�quartile,�which�is considered appropriate.

Strategic ReportG
overnanceFinancial Statem
entsAdditional Inform
ationPicton Property Incom
e Limited Annual Report 2021
Business Overview
83
Corporate Governance Code 2018We have considered the provisions of the 2018 Code in respect of remuneration and believe that our approach is compliant. In particular, we operate a consistent level of pension provision across our workforce; LTIP awards are only released�five�years�after�award;�and�malus and clawback provisions apply to all incentive awards. We have provisions in the rules of our remuneration share plans that prevent, other than in exceptional circumstances, accelerated vesting of awards when an employee leaves Picton. This year we introduced a post-employment shareholding guideline in the new Remuneration Policy. The remuneration arrangements provide alignment with shareholders through�the�use�of�financial�metrics�and corporate objectives. All members of the team participate in the annual bonus and LTIP, not just the Executive Directors. The Remuneration Policy and its components are clearly set out in this Report and the rules of the variable remuneration schemes are available to the whole team. We use standard performance metrics, which are also Key Performance Indicators for the business, to determine awards. There are clear target and maximum levels for each condition.The Committee believes that the variable remuneration schemes in place are fair and proportionate and align the remuneration of the team with the Group’s performance. We�are�also�satisfied�that�the�remuneration structure does not encourage inappropriate risk-taking. The Committee does retain discretion over formulaic outcomes if it considers that�these�are�not�a�fair�reflection�of the Group’s performance.
Implementation of PolicyOur remuneration structure will be in accordance with the new Policy for the year to 31 March 2022.The bonus deferral policy for Executive Directors�will�continue,�with�50%�of any annual bonus award being deferred into Picton shares for a period of two years before vesting. The maximum�annual�bonus�potential�for�2021/22�will�fall�to�165%�of�base�salary for the Executive Directors as outlined above. As in previous years the annual bonus will be determined 60%�by�financial�metrics�and�40%�by corporate objectives. For 2021/22 we�intend�to�use�two�financial�metrics, being total return, relative to a comparator group, and total property return, relative to the MSCI UK Quarterly Property Index. The Committee considered that EPRA earnings per share (previously used as a third annual bonus metric) was more appropriate as a longer-term measure.This year we have reverted to our normal level of awards under the Long-term Incentive Plan. For the awards to be made in June 2021 for the three-year period to 31 March 2024 we will retain the three performance measures used previously, being:
ӱ Total shareholder return, compared to a comparator group
ӱ Total property return, compared to the MSCI UK Quarterly Property Index
ӱ Growth in EPRA earnings per shareFor the growth in EPRA earnings per share, we intend to use an absolute range of targets based on forecasts over the performance period.
As a Committee, we are committed to ongoing dialogue with our shareholders. We look forward to receiving your continued support at the forthcoming Annual General Meeting.
Maria BentleyChair of the Remuneration Committee26 May 2021
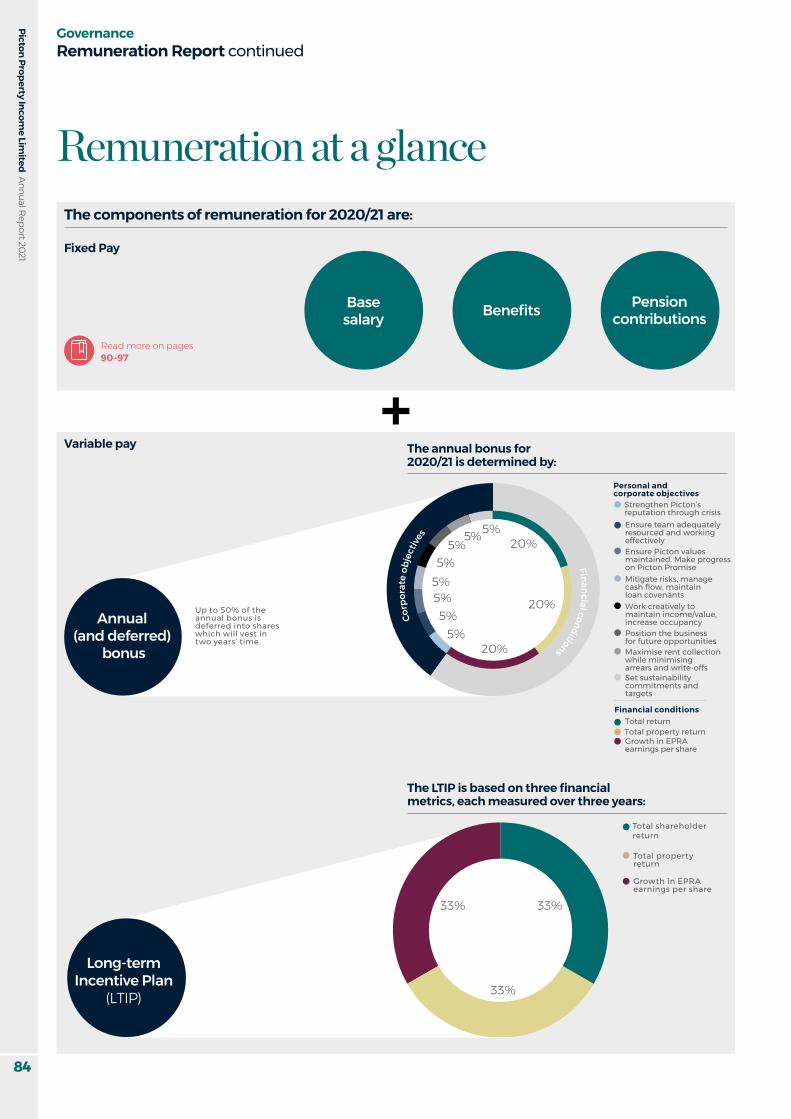
Annual (and deferred)
bonus
Strengthen Picton’s reputation through crisis
Personal and corporate objectives
Total returnTotal property returnGrowth in EPRA earnings per share
Financial conditions
Up to 50% of the annual bonus is deferred into shares which will vest in two years’ time.
Ensure team adequately resourced and working effectivelyEnsure Picton values maintained. Make progress on Picton PromiseMitigate risks, manage cash flow, maintain loan covenantsWork creatively to maintain income/value,increase occupancyPosition the business for future opportunitiesMaximise rent collection while minimising arrears and write-offsSet sustainability commitments and targets
Fina ncial conditions
Co
rpor
ate
obje
ctive
s 5% 20%
20%
20%5%
5%
5%
5%5%
5%
5%
Total shareholder return
Total property return
Growth in EPRA earnings per share
33%33%
33%
Long-termIncentive Plan
(LTIP)
Picton Property Income Lim
ited Annual Report 2021
84
Remuneration at a glance
GovernanceRemuneration Report continued
The components of remuneration for 2020/21 are:
Read more on pages 90–97
Fixed Pay
Variable pay
Base salary Benefits
The LTIP is based on three financial metrics, each measured over three years:
The annual bonus for 2020/21 is determined by:
Pension contributions

Total fixed Annual bonus LTIP Share growth
Key:
25% 35% 27% 13% £1,346K
28% 41% 31% £1,166K
50% 36% 14% £660K
100% £333K
26% 37% 25% 12% £873K
30% 42% 28% £765K
52% 36% 12% £442K
100% £227K
Total fixed Annual bonus LTIP Share growth
Key:
25% 35% 27% 13% £1,346K
28% 41% 31% £1,166K
50% 36% 14% £660K
100% £333K
26% 37% 25% 12% £873K
30% 42% 28% £765K
52% 36% 12% £442K
100% £227K
xxxx
Finance Director
26
237
122170
2
198
359
xxxx
198
Non-Executive Directors
Total fixedSalary Benefits Pension
Key:
38
348
208290
556
250
2
Chief Executive
Total variableAnnual bonus Long-term Incentive Plan
Strategic ReportG
overnanceFinancial Statem
entsAdditional Inform
ationPicton Property Incom
e Limited Annual Report 2021
Business Overview
85
The potential remuneration of the Executive Directors for the year to 31 March 2022 is:
The following charts show the composition of the Executive Directors’ remuneration at three performance levels:
– Fixed pay – this comprises base salary from 1 April 2021,�benefits�and�pension�salary�supplement�of�15% of�base�salary
– On target –�this�is�fixed�pay�plus�target�vesting�for�the annual�bonus�(at�50%�of�maximum�opportunity�for illustrative purposes) and threshold vesting for the LTIP�(at�25%�of�maximum�award)
– Maximum – Fixed pay plus maximum vesting for both�the�annual�bonus�(165%�of�base�salary)�and�the�LTIP�(125%�(Chief�Executive)�and�110%�(Finance�Director) of base salary)
– Maximum with share price growth – maximum scenario�incorporating�assumption�of�50%�share�price growth during LTIP vesting period
Other than where stated, the charts do not incorporate share�price�growth�or�dividend�equivalent�awards.
Total fixed Annual bonus LTIP Share growth
Key:
25% 35% 27% 13% £1,346K
28% 41% 31% £1,166K
50% 36% 14% £660K
100% £333K
26% 37% 25% 12% £873K
30% 42% 28% £765K
52% 36% 12% £442K
100% £227K
Remuneration in context
Relative importance of spend on payThe table below shows the expenditure and percentage change�in�staff�costs�compared�to�other�key�financial�indicators.
31 March 2021
£000
31 March 2020 £000�
%�change
Employee costs 3,219 3,273 (1.6)%Dividends 15,002 19,039 (21.2)%EPRA earnings 20,072 19,912 0.8%
Percentage change in remuneration The table below shows the percentage change in total remuneration for each of the Directors between the years ended 31 March 2020 and 31 March 2021 compared to the average remuneration of the employees of the Group.
Change from previous year
Base salary Benefits
Annual bonus
Michael Morris 0% 0.6% 14.4%Andrew Dewhirst 0% 0.8% 8.6%Nicholas Thompson 0% – –Mark Batten 0% – –Maria Bentley 0% – –Roger Lewis 0% – –Average of all other employees 4.6% 8.1% 15.4%
The table above excludes those Non-Executive Directors who joined during the year ended 31 March 2021.
The single figure of remuneration for the Directors for the year 2020/21 (in £ thousands) is:
250557846
Chief Executive Finance Director

Picton Property Income Lim
ited Annual Report 2021
86
GovernanceRemuneration Report continued
Directors’ Remuneration PolicyThe current Directors’ Remuneration Policy was approved by our shareholders at the Annual General Meeting in 2018. The Remuneration Committee has reviewed the continued appropriateness of the current policy over a series of meetings which�considered�our�strategic�priorities,�governance�requirements�and�evolving�market�practice.�Input�was�sought�from�the�Chief�Executive�and�Finance�Director�whilst�ensuring�that�conflicts�of�interest�were�suitably�mitigated.�An�external�perspective was provided by our major shareholders and our independent advisers, Deloitte.Shareholder approval will be sought at the forthcoming Annual General Meeting for the updated policy set out below. Subject to shareholder approval, the updated policy will take effect immediately after the Annual General Meeting and will�apply�to�the�2021/22�financial�year.The updated policy is essentially consistent with the policy approved in 2018 – the only changes of note are:
ӱ the�introduction�of�a�post-employment�shareholding�guideline�whereby�Executive�Directors�will�be�required�to�remain�compliant�with�their�existing�‘in�employment’�shareholding�guideline�(200%�of�salary)�for�two�years�after�stepping�down as a Director; and
ӱ the�addition�of�flexibility�to�use�ESG�measures�within�the�annual�bonus.
PrinciplesThe objective of the Group’s Remuneration Policy is to have a simple and transparent remuneration structure aligned with the Group’s strategy. The Group aims to provide a remuneration package which will retain Directors who possess the skills and experience necessary to manage the Group and maximise shareholder value on a long-term basis. The Remuneration Policy aims to incentivise Directors by rewarding performance through enhanced shareholder value.
Executive Directors’ Remuneration Policy Table Base salaryPurpose A�base�salary�to�attract�and�retain�Executives�of�appropriate�quality�to�deliver�the�Group’s�
strategy.Operation Base salaries are normally reviewed annually with changes effective on 1 April. When setting
base salaries the Committee will consider relevant market data, as well as the scope of the role and the individual’s skills and experience.
Maximum No absolute maximum has been set for Executive Director base salaries.
Any annual increase in salaries is set at the discretion of the Remuneration Committee taking into account the factors stated in this table and the following principles:
– Salaries would typically be increased at a rate consistent with the average employee salary increase.
– Larger increases may be considered appropriate in certain circumstances (including, but not limited to, a change in an individual’s responsibilities or in the scale of their role or in the size and complexity of the Group).
– Larger increases may also be considered appropriate if a Director has been initially appointed to the Board at a lower than typical salary.
Performance measures None
Clawback None
PensionPurpose Part of competitive remuneration package.
Operation The�Company�has�established�defined�contribution�pension�arrangements�for�all�employees.�For Executive Directors the Company pays a monthly salary supplement in lieu of Company pension contributions.
Maximum A�consistent�rate�of�pension�provision�(15%�of�base�salary)�applies�to�all�employees�including�Executive Directors.
Performance measures None
Clawback None

Strategic ReportG
overnanceFinancial Statem
entsAdditional Inform
ationPicton Property Incom
e Limited Annual Report 2021
Business Overview
87
BenefitsPurpose Part of a competitive remuneration package.
Operation This principally comprises:
– Private medical insurance– Life assurance– Permanent health insuranceThe�Committee�may�agree�to�provide�other�benefits�as�it�considers�appropriate.
Maximum Benefits�are�provided�at�market�rates.
Performance measures None
Clawback None
Annual bonusPurpose A short-term incentive to reward Executive Directors on meeting the Company’s annual
financial�and�strategic�targets�and�on�their�personal�performance.Operation The�Committee�may�determine�that�up�to�50%�of�the�annual�bonus�will�be�paid�in�the�
Company’s�shares�and�deferred�for�two�years.�Dividend�equivalents�will�be�paid�at�the�end�of�the deferral period (in the form of shares or cash).
Maximum The�maximum�bonus�permitted�under�the�Policy�will�be�175%�of�base�salary.�The�level�of�bonus�opportunity within this maximum will be determined by the Committee each year. In 2021/22, the�maximum�opportunity�will�be�limited�to�165%�of�base�salary�as�explained�on�page�81�of�this�Remuneration Report.
Performance measures The�annual�bonus�is�based�on�a�range�of�financial,�strategic,�ESG,�operational�and�individual�targets (measured over a period of up to one year) set by the Committee. The weightings will also be determined annually to ensure alignment with the Company’s strategic priorities although�at�least�50%�of�the�award�will�be�assessed�on�corporate�financial�measures.
For�corporate�financial�measures,�50%�of�the�maximum�bonus�opportunity�will�be�payable�for�on�target�performance�and,�if�applicable,�up�to�25%�for�threshold�performance.
Clawback Malus and clawback provisions may be applied in the event (within two years of bonus determination/grant of the deferred bonus shares) of a material misstatement of the audited financial�results,�an�error�in�assessing�a�performance�condition�applicable�to�the�award�or�in�the�information or assumptions on which the award was granted or is released, a material failure of risk management, material misconduct on the part of the award holder or a corporate failure.
Long-term Incentive PlanPurpose A long-term incentive plan to align Executive Directors’ interests with those of shareholders and
to promote the long-term success of the Company.Operation Awards are granted annually usually in the form of a conditional share award or nil cost option.
Awards will normally vest at the end of a three year period subject to meeting the performance conditions and continuing employment.
The�Remuneration�Committee�may�award�dividend�equivalents�(in�the�form�of�shares�or�cash)�on awards that vest.
The Committee will usually apply a holding period of a further two years to awards that vest.Maximum Annual�awards�with�a�maximum�value�of�up�to�150%�of�base�salary�may�be�made.
Performance measures Vesting will be subject to performance conditions, aligned to the corporate strategy, as determined by the Committee on an annual basis. There will be three performance conditions each�measured�over�a�three-year�performance�period.�Each�condition�will�be�equally�weighted,�but�the�Committee�has�the�flexibility�to�vary�this�for�each�award.
For�threshold�levels�of�performance�up�to�25%�of�the�award�vests,�rising�usually�on�a� straight-line�basis�to�100%�for�maximum�performance.
Clawback Malus�and�clawback�provisions�may�be�applied�in�the�event�(within�five�years�of�grant)�of�a�material�misstatement�of�the�audited�financial�results,�an�error�in�assessing�a�performance�condition applicable to the award or in the information or assumptions on which the award was granted or is released, a material failure of risk management, material misconduct on the part of the award holder or a corporate failure.

Picton Property Income Lim
ited Annual Report 2021
88
GovernanceRemuneration Report continued
Shareholding guidelinesPurpose To align Executive Directors with the interests of shareholders.
Operation Whilst in employment, Executive Directors are expected to build up and thereafter maintain a minimum�shareholding�equivalent�to�200%�of�basic�salary.
The Committee will review progress towards the guideline on an annual basis and has the discretion to adjust the guideline in what it feels are appropriate circumstances.
Executive Directors will also be expected to remain compliant with the above guideline for a period�of�two�years�post-employment.�This�requirement�will�apply�to�shares�from�incentive�awards due to be released from the date of adoption of the policy at the 2021 Annual General Meeting. The Committee would retain discretion to waive this guideline if it is not considered appropriate�in�the�specific�circumstances.
Maximum Not applicable
Performance measures Not applicable
Clawback Not applicable
Non-Executive Directors Policy TableFeesPurpose To provide competitive Director fees.
Operation Annual fee for the Chair, and annual base fees for other Non-Executive Directors.
Additional fees for those Directors with additional responsibilities such as chairing a Board Committee. All fees will be payable monthly in arrears in cash.
Fees will usually be reviewed independently every three years.
The independent Non-Executive Directors are not eligible to receive share options or other performance-related�elements,�or�receive�any�other�benefits�other�than�where�travel�to�the�Company’s�registered�office�is�recognised�as�taxable�benefit�in�which�case�a�Non-Executive�Director�may�receive�the�grossed-up�costs�of�travel�as�a�benefit.�Non-Executive�Directors�are�entitled to reimbursement of reasonable expenses.
Maximum The Company’s Articles set an annual limit for the total of Non-Executive Directors’ remuneration�of�£300,000.
Performance measures None
Clawback None
Notes to table:1. The Committee may amend or substitute any performance condition(s) if one or more events occur which cause it to determine that an amended or substituted performance
condition�would�be�more�appropriate,�provided�that�any�such�amended�or�substituted�performance�condition�would�not�be�materially�less�difficult�to�satisfy�than�the�original�condition�(in�its�opinion).�The�Committee�may�adjust�the�calculation�of�performance�targets�and�vesting�outcomes�(for�instance�for�material�acquisitions,�disposals�or�investments�and�events�not�foreseen�at�the�time�the�targets�were�set)�to�ensure�they�remain�a�fair�reflection�of�performance�over�the�relevant�period.�The�Committee�also�retains discretion to make downward or upward adjustments resulting from the application of the performance measures if it considers that an adjustment is appropriate (for example,�if�the�outcomes�are�not�deemed�by�the�Committee�to�be�a�fair�and�accurate�reflection�of�business�performance).�In�the�event�that�the�Committee�was�to�make�an�adjustment of this sort, a full explanation would be provided in the next Remuneration Report.
2.� Performance�measures�–�annual�bonus.�The�annual�bonus�measures�are�reviewed�annually�and�chosen�to�focus�executive�rewards�on�delivery�of�key�financial�targets�for�the�forthcoming�year�as�well�as�key�strategic�or�operational�goals�relevant�to�an�individual.�Specific�targets�for�bonus�measures�are�set�at�the�start�of�each�year�by�the�Remuneration�Committee�based�on�a�range�of�relevant�reference�points,�including�for�Group�financial�targets,�the�Company’s�business�plan�and�are�designed�to�be�appropriately�stretching.
3. The Committee may amend the terms of awards granted under the share schemes referred to above in accordance with the rules of the relevant plans. 4. Performance measures – LTIP. The LTIP performance measures will be chosen to provide alignment with our longer-term strategy of growing the business in a sustainable
manner that will be in the best interests of shareholders and other key stakeholders in the Company. Targets are considered ahead of each grant of LTIP awards by the Remuneration Committee taking into account relevant external and internal reference points and are designed to be appropriately stretching.
5.� The�Committee�reserves�the�right�to�make�any�remuneration�payments�and/or�payments�for�loss�of�office�(including�exercising�any�discretions�available�to�it�in�connection�with�such payments) notwithstanding that they are not in line with the policy set out above where the terms of the payment were agreed (i) before the policy set out above came into effect, provided that the terms of the payment were consistent with the shareholder approved Remuneration Policy in force at the time they were agreed; or (ii) at a time when the relevant individual was not a Director of the Company and, in the opinion of the Committee, the payment was not in consideration for the individual becoming a Director of the Company. For these purposes ‘payments’ includes the Committee satisfying awards of variable remuneration and, in relation to an award over shares, the terms of the payment are ‘agreed’ at the time the award is granted.
6. The Committee may make minor amendments to the Remuneration Policy for regulatory, exchange control, tax or administrative purposes or to take account of a change in legislation, without obtaining shareholder approval for that amendment.
Service contractsExecutive Directors have service contracts containing the remuneration elements set out within this policy. There is no fixed�length�of�service�and�notice�periods�do�not�exceed�12�months.�On termination the applicable payments for each element of remuneration are set out opposite.The�Executive�Director�service�contracts�are�available�for�inspection�at�the�Company’s�registered�office.

Strategic ReportG
overnanceFinancial Statem
entsAdditional Inform
ationPicton Property Incom
e Limited Annual Report 2021
Business Overview
89
Letters of appointmentEach independent Non-Executive Director has a letter of appointment which sets out the terms and conditions. They have a six-month notice period and their appointment would terminate without compensation if not re-elected at the Annual General Meeting. The independent Directors have no service contracts or interests in any material contracts with the Group.
RecruitmentThe remuneration package for a new Executive Director would follow, as far as practicable, the above Policy Table. Salaries would�reflect�the�skills�and�experience�of�the�individual,�and�may�be�set�at�a�level�to�allow�progression�and�performance�in�the�role.�The�structure�of�the�variable�remuneration�elements�would�reflect�those�in�the�Policy�Table.�However,�the�Committee�may�flex�the�balance�between�annual�and�long-term�incentives�and�the�measures�used�to�assess�performance. If appropriate, different measures and targets may be applied to a new appointment’s annual bonus and/or LTIP in their year of joining. Variable pay would be subject to the maximums set out in the Policy Table.Where�necessary�the�Committee�may�approve�the�payment�of�relocation�expenses�to�facilitate�recruitment,�and�flexibility�is retained to pay for legal fees and other costs incurred by the individual in relation to their appointment.Where an Executive Director is an internal promotion, the normal policy is that any legacy arrangements would be honoured in line with the original terms and conditions. Similarly, if an Executive Director is appointed following the Company’s�acquisition�of�or�merger�with�another�company,�legacy�terms�and�conditions�would�be�honoured.�Remuneration arrangements for a new Non-Executive Director would be consistent with the above Policy.The Committee may agree to make compensatory payments for any remuneration arrangements subject to forfeit on leaving�a�previous�employer.�This�would�be�considered�for�each�specific�case,�taking�into�account�any�relevant�factors�relating to the recruitment. There is no limit on such payments, but the Committee would not intend to pay more than the commercial value forfeited. If necessary, the Committee may grant such awards under Listing Rule 9.4.2 R.
Policy for other employeesRemuneration�for�other�employees�broadly�follows�the�same�principles�as�for�Executive�Directors.�A�significant�element�of remuneration�is�linked�to�performance�measures.�All�employees�usually�participate�in�the�Long-term�Incentive�Plan,�and in the annual bonus. The weighting of individual and corporate measures are dependent on an individual’s role.The Committee does not formally consult with employees when determining Executive Director pay. However, the Committee is kept informed of general management decisions made in relation to employee pay and is conscious of the importance�of�ensuring�that�its�pay�decisions�for�Executive�Directors�are�regarded�as�fair�and�reasonable�within�the business.
Policy for payment on loss of officeOn cessation of employment of an Executive Director the Committee will honour any contractual arrangements in place. The�Committee�may�make�any�other�payments�in�connection�with�loss�of�office�in�discharge�of�legal�obligations�or�by�way�of a compromise or settlement of any claim arising. This may include reasonable amounts for outplacement assistance and professional or legal advice.The Committee may, at its discretion, make an annual bonus payment for the year of cessation depending on the reason for leaving. The Committee will take into consideration appropriate performance measures which may include the individual’s�performance�and�contribution�during�the�year,�and�the�Group’s�financial�results.�The�bonus�would�usually�be�time pro-rated and may be settled wholly in cash.The treatment of outstanding deferred bonus and Long-term Incentive Plan awards will be governed by the relevant plan rules. In both cases unvested awards will normally lapse unless the participant is determined to be a good leaver. The vesting�date�for�a�good�leaver’s�awards�will�normally�be�the�original�vesting�date,�but�the�Committee�has�the�flexibility�to�determine that awards may vest at an earlier date. The Committee’s determination of the extent to which a good leaver’s LTIP awards should vest will take into account the extent to which performance conditions are met either at the date of cessation�of�employment�or�the�end�of�the�original�performance�period�and,�unless�the�Committee�determines�otherwise, will be adjusted on a time pro-rated basis. Where an individual leaves after the vesting date but before the end of�any�holding�period,�they�will�retain�their�LTIP�awards�unless�summarily�dismissed�with�awards�being�released�at�the normal�date�unless�the�Committee�determines�that�they�should�be�released�at�an�earlier�date.

Picton Property Income Lim
ited Annual Report 2021
90
Annual Report on Remuneration
Total remuneration for the yearThe�table�below�sets�out�the�total�remuneration�receivable�by�each�of�the�Directors�who�held�office�during�the�year�to�31�March�2021,�with�a�comparison�to�the�previous�financial�year:
Salary/fees£000
Benefits£000
Pension salary
supplement£000
Totalfixed£000
Annual bonus£000
Deferred bonus£000
Long-term incentive
plan£000
Totalvariable
£000Total£000
ExecutiveMichael Morris 2021 250 2 38 290 174 174 208 556 846
2020 250 2 38 290 153 152 174 479 769Andrew Dewhirst 2021 170 2 26 198 119 118 122 359 557
2020 170 2 26 198 109 109 102 320 518
Non-ExecutiveLena Wilson 2021 21 – – 21 – – – – 21
2020 – – – – – – – – –Nicholas Thompson 2021 82 – – 82 – – – – 82
2020 98 – – 98 – – – – 98Roger Lewis 2021 22 – – 22 – – – – 22
2020 45 – – 45 – – – – 45Mark Batten 2021 48 – – 48 – – – – 48
2020 48 – – 48 – – – – 48Maria Bentley 2021 45 – – 45 – – – – 45
2020 49 – – 49 – – – – 49Richard Jones 2021 26 – – 26 – – – – 26
2020 – – – – – – – – –Nicholas Wiles 2021 6 – – 6 – – – – 6
2020 10 – – 10 – – – – 10Total (audited) 2021 670 4 64 738 293 292 330 915 1,653
2020 670 4 64 738 262 261 276 799 1,537
Benefits�comprise�private�medical�insurance�and�life�assurance.Executive�Directors�receive�a�salary�supplement�of�15%�of�base�salary�in�lieu�of�company�pension�contributions.The value of LTIP awards is based on the number of shares to be awarded to the Executive Directors and the average share�price�over�the�quarter�ended�31�March�2021�of�84.71�pence,�and�the�estimated�value�of�dividend�equivalents.The�above�2020�LTIP�figures�for�the�Executive�Directors�have�been�restated�to�reflect�the�actual�share�price�at�vesting�(67.83�pence)�rather�than�the�average�for�the�quarter�ended�31�March�2020�(92.64�pence).�This�restatement�represents�a�reduction�in�the�value�of�the�2020�LTIP�awards�by�£55,000�for�Michael�Morris�and�by�£33,000�for�Andrew�Dewhirst.Lena Wilson joined the Board on 1 January 2021 and was appointed as Chair from 1 February 2021. Richard Jones joined the Board on 1 September 2020.Nicholas Thompson retired from the Board on 31 January 2021.Nicholas Wiles joined the Board on 1 January 2020 and resigned on 20 May 2020.
Annual bonus for 2020/21The�annual�bonus�for�the�year�ended�31�March�2021�for�the�Executive�Directors�was�based�on�a�combination�of�financial�metrics�(60%)�and�corporate�objectives�(40%).The targets set for the year ended 31 March 2021 and the assessment of actual performance achieved are set out in the table opposite.The�financial�metrics�comprised�three�equally�weighted�components:�total�return�relative�to�a�comparator�group�of�similar�companies, set out later in this Report; total property return compared to the MSCI UK Quarterly Property Index; and growth�in�EPRA�earnings�per�share�over�the�financial�year.At the date of this Report not all of the companies in the total return comparator group had announced their results to 31 March 2021 and the Committee has estimated, based on the results to date, that this condition will be met at the upper�level,�resulting�in�an�award�of�100%.�The�Committee�will�determine�the�actual�outcome�of�this�condition�once�all�companies�have�reported,�and�any�adjustment�required�between�the�estimate�and�actual�will�be�made�in�next�year’s�Remuneration�Report.�There�will�be�no�payout�of�the�bonus�until�a�finalised�result�can�be�confirmed.
GovernanceRemuneration Report continued

Strategic ReportG
overnanceFinancial Statem
entsAdditional Inform
ationPicton Property Incom
e Limited Annual Report 2021
Business Overview
91
Performance condition Basis of calculation Range Actual
Awarded�(%�of�
maximum)Awarded
(%�of�salary)
Total return versus comparator group
Bonus weighting: 20%
Less�than�median�–�0%Equal�to�median�–�50%Equal�to�upper�quartile�–�100%
Not yet available 6.6% 100%�(estimate)
35%� (estimate)
Total property return versus MSCI Index
Bonus weighting: 20%
Less�than�median�–�0%Equal�to�median�–�50%Equal�to�upper�quartile�–�100%
Median�2.6%
Upper�quartile�4.9%
7.3% (above upper
quartile)
100% 35%
Growth in EPRA EPS
Bonus weighting: 20%
Less�than�3.66p�–�0%Equal�to�3.66p�–�25%Equal�to�or�greater�than�3.84p�–�100%
3.66p to 3.84p 3.67p 31% 10.8%
The corporate objectives for the Executive Directors for the year to 31 March 2021 were determined by the Remuneration Committee�and�accounted�for�40%�of�the�maximum�award.��The corporate objectives applying to both Executives, and the assessment of performance against these, are as follows:
Performance condition AssessmentAwarded
(% of maximum)Awarded
(% of salary)
Strengthen Picton’s reputation through crisis
Bonus weighting: 5%
Throughout the pandemic there has been considerable engagement with occupiers, with positive feedback received. There has also been positive commentary from real estate analysts and from the Company’s brokers.
Although the dividend was reduced at the start of the pandemic this was a smaller reduction than many other companies in the sector, and has been followed by two subsequent�increases,�earlier�than�others�in�the�sector.�
The share price has been at a discount to net asset value, but this has narrowed over the latter half of the year, and compares favourably with the comparator group.
Dividend�cover�for�the�year�was�in�excess�of�130%.
The Group has not taken any form of Government support, nor placed any employees on furlough.
80% 7%
Ensure�team�adequately�resourced�and working effectively
Bonus weighting: 5%
The�employee�satisfaction�score�increased�to�85%�from�83%.�There�were�no�leavers�during�the�year.
There was positive feedback from the employees to the Non-Executive Directors, especially in the context of remote working.
The�office�move�to�Stanford�Building�was�successfully�completed.
80% 7%
Ensure Picton values maintained. Make progress on Picton Promise
Bonus weighting: 5%
There has been a high level of engagement with occupiers during the pandemic.
Assistance has been given to support over 90 occupiers, either through monthly payments or rental assistance.
A vacant unit was provided to London Ambulance Service during the pandemic.
80% 7%
Mitigate�risks,�manage�cash�flow,�maintain loan covenants
Bonus weighting: 5%
Loan covenants were complied with throughout the year, with no additional borrowing incurred.
Cash balances remained positive throughout the year.
Rent collection was consistently high, which enabled two dividend increases in the second half of the year.
Administrative�expenses,�property�and�finance�costs�were all lower than the preceding year.
The�cost�ratio�was�1.0%,�lower�than�the�preceding�year.
90% 7.9%
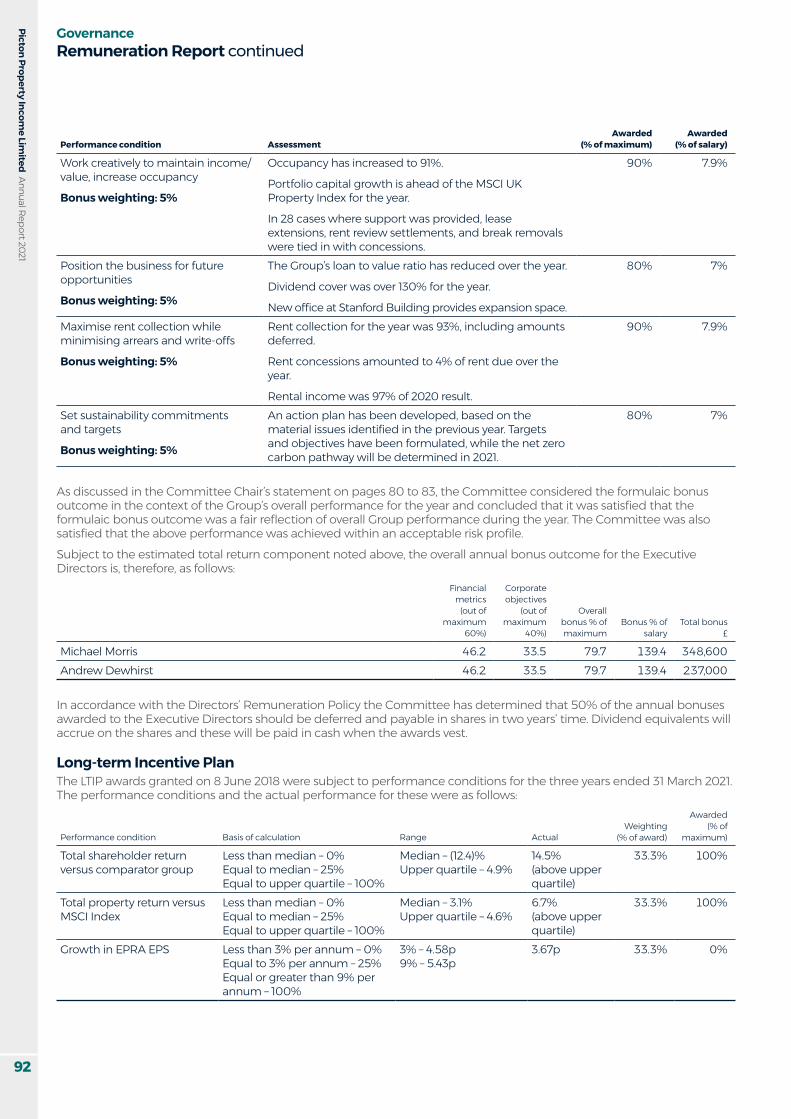
Picton Property Income Lim
ited Annual Report 2021
92
GovernanceRemuneration Report continued
Performance condition AssessmentAwarded
(% of maximum)Awarded
(% of salary)
Work creatively to maintain income/value, increase occupancy
Bonus weighting: 5%
Occupancy�has�increased�to�91%.
Portfolio capital growth is ahead of the MSCI UK Property Index for the year.
In 28 cases where support was provided, lease extensions, rent review settlements, and break removals were tied in with concessions.
90% 7.9%
Position the business for future opportunities
Bonus weighting: 5%
The Group’s loan to value ratio has reduced over the year.
Dividend�cover�was�over�130%�for�the�year.
New�office�at�Stanford�Building�provides�expansion�space.
80% 7%
Maximise rent collection while minimising arrears and write-offs
Bonus weighting: 5%
Rent�collection�for�the�year�was�93%,�including�amounts�deferred.
Rent�concessions�amounted�to�4%�of�rent�due�over�the�year.
Rental�income�was�97%�of�2020�result.
90% 7.9%
Set sustainability commitments and targets
Bonus weighting: 5%
An action plan has been developed, based on the material�issues�identified�in�the�previous�year.�Targets�and objectives have been formulated, while the net zero carbon pathway will be determined in 2021.
80% 7%
As discussed in the Committee Chair’s statement on pages 80 to 83, the Committee considered the formulaic bonus outcome�in�the�context�of�the�Group’s�overall�performance�for�the�year�and�concluded�that�it�was�satisfied�that�the�formulaic�bonus�outcome�was�a�fair�reflection�of�overall�Group�performance�during�the�year.�The�Committee�was�also�satisfied�that�the�above�performance�was�achieved�within�an�acceptable�risk�profile.Subject to the estimated total return component noted above, the overall annual bonus outcome for the Executive Directors is, therefore, as follows:
Financial metrics
(out of maximum
60%)
Corporate objectives
(out of maximum
40%)
Overall bonus�%�of�maximum
Bonus�%�of�salary
Total bonus £
Michael Morris 46.2 33.5 79.7 139.4 348,600Andrew Dewhirst 46.2 33.5 79.7 139.4 237,000
In�accordance�with�the�Directors’�Remuneration�Policy�the�Committee�has�determined�that�50%�of�the�annual�bonuses�awarded�to�the�Executive�Directors�should�be�deferred�and�payable�in�shares�in�two�years’�time.�Dividend�equivalents�will�accrue on the shares and these will be paid in cash when the awards vest.
Long-term Incentive PlanThe LTIP awards granted on 8 June 2018 were subject to performance conditions for the three years ended 31 March 2021. The performance conditions and the actual performance for these were as follows:
Performance condition Basis of calculation Range ActualWeighting
(%�of�award)
Awarded �(%�of�
maximum)
Total shareholder return versus comparator group
Less�than�median�–�0%Equal�to�median�–�25%Equal�to�upper�quartile�–�100%
Median�–�(12.4)%Upper�quartile�–�4.9%
14.5%(above upper quartile)
33.3% 100%
Total property return versus MSCI Index
Less�than�median�–�0%Equal�to�median�–�25%Equal�to�upper�quartile�–�100%
Median�–�3.1%Upper�quartile�–�4.6%
6.7%(above upper quartile)
33.3% 100%
Growth in EPRA EPS Less�than�3%�per�annum�–�0%Equal�to�3%�per�annum�–�25%Equal�or�greater�than�9%�per�annum�–�100%
3%�–�4.58p9%�–�5.43p
3.67p 33.3% 0%
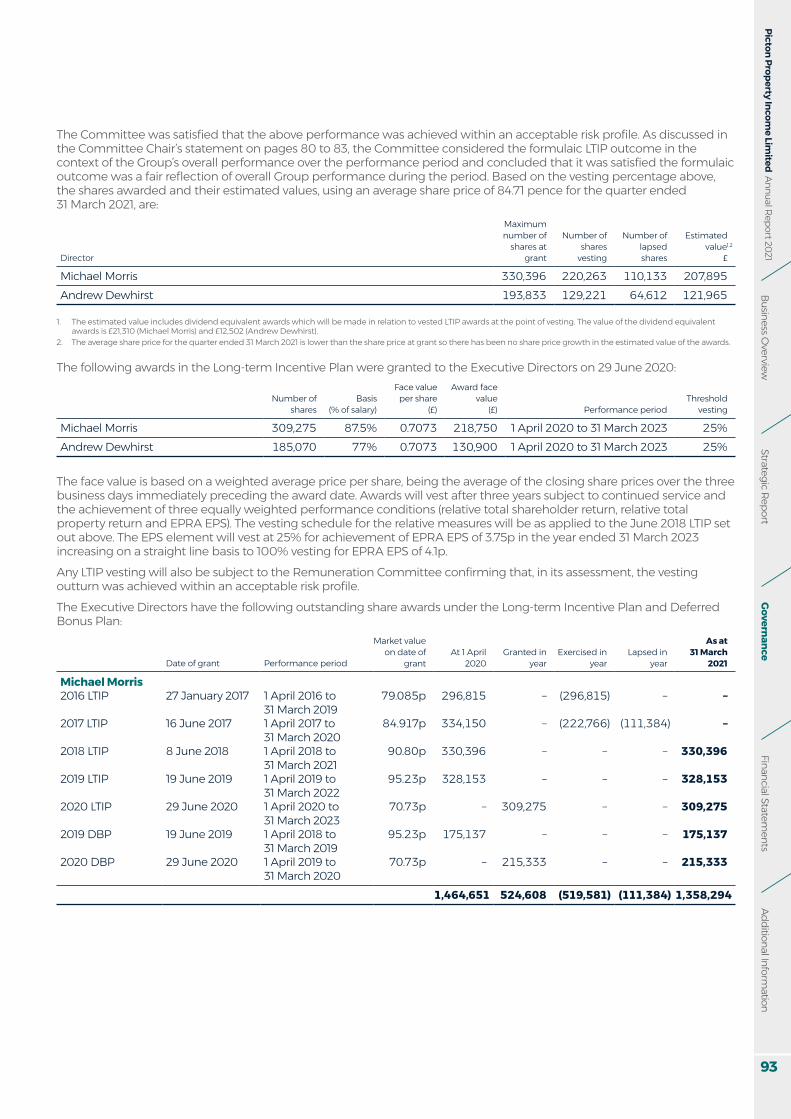
Strategic ReportG
overnanceFinancial Statem
entsAdditional Inform
ationPicton Property Incom
e Limited Annual Report 2021
Business Overview
93
The�Committee�was�satisfied�that�the�above�performance�was�achieved�within�an�acceptable�risk�profile.�As�discussed�in�the Committee Chair’s statement on pages 80 to 83, the Committee considered the formulaic LTIP outcome in the context�of�the�Group’s�overall�performance�over�the�performance�period�and�concluded�that�it�was�satisfied�the�formulaic�outcome�was�a�fair�reflection�of�overall�Group�performance�during�the�period.�Based�on�the�vesting�percentage�above,�the�shares�awarded�and�their�estimated�values,�using�an�average�share�price�of�84.71�pence�for�the�quarter�ended�31 March 2021, are:
Director
Maximum number of
shares at grant
Number of shares
vesting
Number of lapsed shares
Estimatedvalue1,2
£
Michael Morris 330,396 220,263 110,133 207,895Andrew Dewhirst 193,833 129,221 64,612 121,965
1.� The�estimated�value�includes�dividend�equivalent�awards�which�will�be�made�in�relation�to�vested�LTIP�awards�at�the�point�of�vesting.�The�value�of�the�dividend�equivalent�awards�is�£21,310�(Michael�Morris)�and�£12,502�(Andrew�Dewhirst).
2.� The�average�share�price�for�the�quarter�ended�31�March�2021�is�lower�than�the�share�price�at�grant�so�there�has�been�no�share�price�growth�in�the�estimated�value�of�the�awards.
The following awards in the Long-term Incentive Plan were granted to the Executive Directors on 29 June 2020:
Number of shares
Basis (%�of�salary)
Face value per share
(£)
Award face value
(£) Performance periodThreshold
vesting
Michael Morris 309,275 87.5% 0.7073 218,750 1 April 2020 to 31 March 2023 25%Andrew Dewhirst 185,070 77% 0.7073 130,900 1 April 2020 to 31 March 2023 25%
The face value is based on a weighted average price per share, being the average of the closing share prices over the three business days immediately preceding the award date. Awards will vest after three years subject to continued service and the�achievement�of�three�equally�weighted�performance�conditions�(relative�total�shareholder�return,�relative�total�property return and EPRA EPS). The vesting schedule for the relative measures will be as applied to the June 2018 LTIP set out�above.�The�EPS�element�will�vest�at�25%�for�achievement�of�EPRA�EPS�of�3.75p�in�the�year�ended�31�March�2023�increasing�on�a�straight�line�basis�to�100%�vesting�for�EPRA�EPS�of�4.1p.Any�LTIP�vesting�will�also�be�subject�to�the�Remuneration�Committee�confirming�that,�in�its�assessment,�the�vesting�outturn�was�achieved�within�an�acceptable�risk�profile.�The Executive Directors have the following outstanding share awards under the Long-term Incentive Plan and Deferred Bonus Plan:
Date of grant Performance period
Market value on date of
grantAt 1 April
2020Granted in
yearExercised in
yearLapsed in
year
As at 31 March
2021
Michael Morris2016 LTIP 27 January 2017 1 April 2016 to
31 March 201979.085p 296,815 – (296,815) – –
2017 LTIP 16 June 2017 1 April 2017 to 31 March 2020
84.917p 334,150 – (222,766) (111,384) –
2018 LTIP 8 June 2018 1 April 2018 to 31 March 2021
90.80p 330,396 – – – 330,396
2019 LTIP 19 June 2019 1 April 2019 to 31 March�2022
95.23p 328,153 – – – 328,153
2020 LTIP 29 June 2020 1 April 2020 to 31 March�2023
70.73p – 309,275 – – 309,275
2019 DBP 19 June 2019 1 April 2018 to 31 March�2019
95.23p 175,137 – – – 175,137
2020 DBP 29 June 2020 1 April 2019 to 31 March�2020
70.73p – 215,333 – – 215,333
1,464,651 524,608 (519,581) (111,384) 1,358,294

Picton Property Income Lim
ited Annual Report 2021
94
GovernanceRemuneration Report continued
Date of grant Performance period
Market value on date of
grantAt 1 April
2020Granted in
yearExercised in
yearLapsed in
year
As at 31 March
2021
Andrew Dewhirst2016 LTIP 27 January 2017 1 April 2016 to
31 March�201979.085p 174,899 – (174,899) – –
2017 LTIP 16 June 2017 1 April 2017 to 31 March�2020
84.917p 196,898 – (131,265) (65,633) –
2018 LTIP 8 June 2018 1 April 2018 to 31 March�2021
90.80p 193,833 – – – 193,833
2019 LTIP 19 June 2019 1 April 2019 to 31 March�2022
95.23p 214,218 – – – 214,218
2020 LTIP 29 June 2020 1 April 2020 to 31 March�2023
70.73p – 185,070 – – 185,070
2019 DBP 19 June 2019 1 April 2018 to 31 March�2019
95.23p 116,758 – – – 116,758
2020 DBP 29 June 2020 1 April 2019 to 31 March�2020
70.73p – 154,312 – – 154,312
896,606 339,382 (306,164) (65,633) 864,191
Awards under the Long-term Incentive Plan normally vest three years after the grant date. Awards from 2019 onwards are subject to a further two-year holding period. Awards under the Deferred Bonus Plan normally vest two years after the grant date.
Comparator groupThe Committee has agreed that the following companies will be used as a comparator group for the total shareholder return and total return metrics in determining variable remuneration for 2021/22 awards. A smaller group is used for the total return metric due to the different reporting periods of some companies.
Company
Total shareholder
return Total return
AEW UK REIT plcBMO Commercial Property Trust LimitedBMO UK Real Estate Investments LimitedCapital & Regional plcCustodian REIT plcEdiston Property Investment Company PLCMcKay Securities PLCNewRiver REIT PLCRegional REIT LimitedSchroder Real Estate Investment Trust LimitedStandard Life Investments Property Income Trust LimitedSupermarket Income REIT PLCUK Commercial Property REIT LimitedWarehouse REIT plc
Supermarket Income REIT and Warehouse REIT were added to the group for awards made from 2019 onwards.Hansteen Holdings plc and Mucklow (A.&J.) PLC were additionally included in the group for awards made up to and including 2019.LondonMetric Property PLC and RDI REIT plc were additionally included in the group for awards made up to and including 2020.Tritax Big Box REIT was additionally included in the group for awards made in 2017 only.
Statement of Directors’ shareholdingsDirectors and employees are encouraged to maintain a shareholding in the Company’s shares to provide alignment with investors.

Strategic ReportG
overnanceFinancial Statem
entsAdditional Inform
ationPicton Property Incom
e Limited Annual Report 2021
Business Overview
95
The�numbers�of�shares�beneficially�held�by�each�Director�(including�connected�persons)�as�at�31�March�2021,�were�as�follows:
Beneficial�holding
2021
Beneficial�holding
2020Holding as a %�of�salary
Outstanding LTIP awards
Outstanding DBP awards
Michael Morris 328,485 53,596 113 967,824 390,470Andrew Dewhirst 201,978 28,500 102 593,121 271,070Lena Wilson 30,000 N/ANicholas Thompson N/A 215,000Roger Lewis N/A 600,000Mark Batten – –Maria Bentley 74,436 74,436Richard Jones 53,845 N/A
The percentage holding for the Executive Directors is based on base salaries as at 31 March 2021 and a share price of £0.858.�The�beneficial�holdings�of�shares�include�any�held�by�connected�persons.Executive�Directors�are�required�to�maintain�a�shareholding�of�200%�of�base�salary�and�both�Directors�are�currently�in�the�process�of�building�up�to�that�level.�The�Executive�Directors�intend�to�retain�at�least�50%�of�any�share�awards�(post-tax)�until the guidelines are met.There have been no changes in these shareholdings between the year-end and the date of this report.
Payments to past Directors or payments for loss of officeThere�were�no�payments�to�past�Directors�or�payments�for�loss�of�office�to�Directors�during�the�year�ended�31�March�2021.
Historical total shareholder return performanceThe graph below shows the Company’s total shareholder return (TSR) since 31 March 2011 as represented by share price growth with dividends reinvested, against the FTSE All-Share Index and the FTSE EPRA NAREIT UK Index. These indices have been chosen as they provide comparison against relevant sectoral and pan-sectoral benchmarks.
Picton FTSE EPRA NAREIT UK FTSE All-Share
Key:
50
100
150
200
250
300
350
400
Mar 20
11
Sep 2011
Mar 20
12
Sep 2012
Mar 20
13
Sep 2013
Mar 20
14
Sep 2014
Mar 20
15
Sep 2015
Mar 20
16
Sep 2016
Mar 20
17
Sep 2017
Mar 20
18
Sep 2018
Mar 20
19
Sep 2019
Mar 20
20
Sep 2020
Mar 20
21
The table below shows the remuneration of the Chief Executive for the past three years, together with the annual bonus percentage and LTIP vesting level. The Company has only had a Chief Executive since 1 October 2018 and therefore the table below shows his remuneration for the past three years.
Total remuneration
(£000)
Annual bonus�(%�of�maximum)
LTIP vesting (%�of�
maximum award)
2021 846 80% 67%2020 769 70% 67%2019 920 79% 83%

Picton Property Income Lim
ited Annual Report 2021
96
GovernanceRemuneration Report continued
Implementation of Remuneration Policy in 2021/22Change from prior year
Executive DirectorsBase salaries Michael�Morris�(Chief�Executive)�–�£287,500
Andrew�Dewhirst�(Finance�Director)�–�£195,500
As set out in the Committee Chair’s statement base salaries for both of the Executive Directors will increase by�15%�this�year.�The�average�increase�for�the�rest�of�the�workforce�is�6.4%.
Pension and benefits
15%�salary�supplement�in�lieu�of�pension�plus�standard�other�benefits No change. All employees receive company pension contributions at the�rate�of�15%�of�base�salary�or�15%�salary supplement in lieu of company contributions.
Annual bonus* Maximum�bonus�of�165%�of�salary�with�50%�of�any�bonus�deferred�in�shares for two years
60%�of�bonus�to�be�determined�by�corporate�financial�metrics�of�relative total property return (using the same performance target ranges�as�in�2020/21)�with�the�remaining�40%�determined�by�strategic�and personal measures
As set out in the Committee Chair’s statement the maximum bonus potential for Executive Directors will decrease�from�175%�of�salary�to�165%�of�salary�this�year�and�two�financial�metrics will be used this year rather than three.
LTIP* Award of shares worth:
ӱ Michael�Morris�(Chief�Executive)�125%�of�salary
ӱ Andrew�Dewhirst�(Finance�Director)�110%�of�salary
Shares released after three-year performance and two-year holding period.�Vesting�of�shares�based�equally�on�relative�total�shareholder�return, relative total property return and growth in EPRA earnings per share measures. Target ranges for the relative measures are as set out on page 91.
Targets for the EPS measure for the year ended 31 March 2024 are:
Less�than�3.85�pence�per�share�–�0%Equal�to�3.85�pence�per�share�–�25%Greater�than�4.25�pence�per�share�–�100%
A result between 3.85 pence and 4.25 pence will be calculated on a straight-line�basis�between�25%�and�100%
Awards to the Executive Directors have been restored this year back to a normal level.
Non-Executive DirectorsFees Chair�–�£116,800
Director�–�£45,000
Supplementary�fee�for�Committee�Chairs�–�£7,500
As set out in the Committee Chair’s statement, the Chair fee has been increased�from�£105,000�to�£116,800�and the Non-Executive Director fee from�£40,000�to�£45,000�with�effect�from 1 April 2021. The supplementary fee for all Committee Chairs will be £7,500,�an�increase�from�£5,000�for�the Remuneration and Property Valuation Committee Chairs. There is no change for the Chair of the Audit and Risk Committee.
*The Remuneration Committee has discretion to override the formulaic outcomes in both the annual bonus and LTIP.
The�Committee�also�confirms�that�performance�has�been�achieved�within�an�acceptable�risk�profile�before�payouts�are�made. Incentive payouts are subject to malus and clawback provisions.

Strategic ReportG
overnanceFinancial Statem
entsAdditional Inform
ationPicton Property Incom
e Limited Annual Report 2021
Business Overview
97
Statement of voting at the last Annual General MeetingThe following table sets out the voting for the Remuneration Report, which was approved by shareholders at the Annual General�Meeting�held�on�18�November�2020,�representing�52%�of�the�issued�share�capital�of�the�Company,�and�also�for�the Remuneration Policy, which was approved by shareholders at the Annual General Meeting held on 13 September 2018,�representing�31%�of�the�issued�share�capital�of�the�Company.�
Remuneration Report Remuneration Policy
Votes cast % Votes cast %
For 287,135,654 96.81 148,636,904 94.98Against 9,476,646 3.19 7,853,028 5.02Votes cast 278,749,348 100.0 156,489,932 100.0Withheld 48,528 10,100,551
Maria Bentley Chair of the Remuneration Committee26 May 2021

Picton Property Income Lim
ited Annual Report 2021
98
ActivityThe Committee met four times during the year ended 31 March 2021. Members of the Property Valuation Committee, together with management, met with the�independent�valuer�each�quarter�to�review�the�valuations�and�considered the following matters:
ӱ Property market conditions and trends;
ӱ Movements compared to previous quarters;
ӱ Yields on properties within the portfolio;
ӱ Letting activity and vacant properties;
ӱ Covenant strength and lease lengths;
ӱ Estimated rental values; and ӱ Comparable market evidence.The�Committee�was�satisfied�with�the�valuation process throughout the year.
GovernanceProperty Valuation Committee Report
Property Valuation Committee
External valuerCBRE Limited was appointed as the external valuer to the Group, effective from 31 March 2013, and carries out a valuation of the Group’s property�assets�each�quarter,�the�results of which are incorporated into the Group’s half-year and annual�financial�statements,�and�the�quarterly�net�asset�statements.The Committee reviewed the performance of the valuer and recommended that the appointment be continued for a further 12 months.
Material uncertaintyAs a result of the Covid-19 pandemic a ‘material uncertainty’ statement was applied to the March 2020 and June 2020 valuations. From 30 September 2020 the statement was removed entirely from the valuers’ reports as there was deemed to be sufficient�market�evidence�to�render�the�qualification�unnecessary.
Richard JonesChair of the Property Valuation Committee26 May 2021
Terms of referenceThe Committee shall review the quarterly�valuation�reports�produced�by the independent valuers before their submission to the Board, looking in particular at:
ӱ Significant�adjustments�from�previous�quarters;
ӱ Individual property valuations; ӱ Commentary from management; ӱ Significant�issues�that�should�be�
raised with management; ӱ Material and unexplained
movements in the Company’s net asset value;
ӱ Compliance with applicable standards and guidelines;
ӱ Reviewing�findings�or�recommendations of the valuers; and
ӱ The appointment, remuneration and removal of the Company’s valuers, making such recommendations to the Board as appropriate.
Visit our website www.picton.co.uk
The Property Valuation Committee is chaired by Richard Jones. The other members of the Committee are Lena Wilson, Mark Batten and Maria Bentley. Richard Jones became Chair of the Committee on 1 October 2020 after Roger Lewis retired from the Board.
Richard JonesChair of the Property Valuation Committee

Strategic ReportG
overnanceFinancial Statem
entsAdditional Inform
ationPicton Property Incom
e Limited Annual Report 2021
Business Overview
99
GovernanceDirectors’ Report
Directors’ Report ӱ Roger Lewis (resigned
30 September 2020) ӱ Nicholas Wiles (resigned
20 May 2020)The Directors’ interests in the shares of the Company as at 31 March 2021 are set out in the Remuneration Report.All of the Directors will offer themselves for re-election at the forthcoming Annual General Meeting.
2018 UK Corporate Governance Code Compliance StatementThe�Board�confirms�that�for�the�year�ended 31 March 2021 the principles of good corporate governance contained in the 2018 UK Corporate Governance Code have been consistently applied, with the exception of the matter described below.As both Nicholas Thompson and Roger Lewis served on the Board for more than nine years before their retirement this year, the Company has not complied with those provisions within the Code relating to tenure for the�whole�of�the�year�ended�31 March 2021.With the changes to the Board made during the year the Company is now fully compliant with the Code.
ListingThe Company is listed on the main market of the London Stock Exchange.
Share capitalThe issued share capital of the Company as at 31 March 2021 was 547,605,596 (2020: 547,605,596) ordinary shares of no par value, including 2,052,269 ordinary shares which are held by the Trustee of the Company’s�Employee�Benefit�Trust�(2020: 2,103,683 ordinary shares). The Directors have authority to buy back�up�to�14.99%�of�the�Company’s�ordinary shares in issue, subject to the renewal of this authority from shareholders at each Annual General Meeting. Any buy-back of ordinary shares is, and will be, made subject to Guernsey law, and the making
and timing of any buy-backs are at the absolute discretion of the Board. No ordinary shares were purchased under this authority during the year.At the 2020 Annual General Meeting shareholders gave the Directors authority to issue up to 54,760,558�shares�(being�10%�of�the�Company’s issued share capital as at 14 October 2020) without having to�first�offer�those�shares�to�existing�shareholders. No ordinary shares have been issued under this authority, which expires at this year’s Annual General Meeting and resolutions will be proposed for its renewal.
Shares held in the Employee Benefit TrustThe Trustee of the Picton Property Income Limited Long-term Incentive Plan holds 2,052,269 ordinary shares in the Company in a trust to satisfy awards made under the Long-term Incentive Plan and the Deferred Bonus Plan. During the year the Trustee�acquired�958,000�ordinary�shares at 67.0 pence per share. The Trustee has waived its right to receive dividends on the shares it holds.
Statement of going concernThe Directors have focused on assessing whether the going concern basis remains appropriate for�the�preparation�of�the�financial�statements for the year ended 31 March 2021, including giving consideration to the impact of the Covid-19 pandemic on the UK economy. In making their assessment the Directors have considered the principal and emerging risks relating to the Group, its loan covenants, access�to�funding�and�liquidity�position. They have also considered a number of scenarios in particular as regards to the impact of different levels of rent collection across the portfolio and over varying timescales, and�the�potential�consequences�on�financial�performance,�asset�values, capital projects and loan covenants. Leasing and investment transactions have been assumed to be curtailed throughout the assessment period. Future lease
The Directors of Picton Property Income Limited present the Annual Report�and�audited�financial�statements for the year ended 31 March 2021.The Company is registered under the provisions�of�the�Companies�(Guernsey) Law, 2008.
Principal activityThe principal activity of the Group is commercial property investment in the United Kingdom.
Results and dividendsThe results for the year are set out in the Consolidated Statement of Comprehensive Income. The Company is a UK Real Estate Investment Trust (REIT) and must distribute to its shareholders at least 90%�of�the�profits�on�its�property�rental business for each accounting period as a Property Income Distribution (PID).As set out in Note 10 to the consolidated�financial�statements,�the Company�has�paid�four�interim�dividends in the year, two at 0.625 pence per share, one at 0.7 pence per share and one at 0.8 pence per share, making a total dividend for the year ended 31 March 2021 of 2.75 pence per share (2020: 3.5 pence). All four interim dividends were paid as PIDs.
Directors The Directors of the Company who served throughout the year are:
ӱ Lena Wilson (appointed 1 January 2021)
ӱ Nicholas Thompson (resigned 31 January 2021)
ӱ Michael Morris ӱ Andrew Dewhirst ӱ Mark Batten ӱ Maria Bentley ӱ Richard Jones (appointed
1 September 2020)

Picton Property Income Lim
ited Annual Report 2021
100
GovernanceDirectors’ Report continued
assessment. In the ordinary course of business, the Board reviews a�detailed�financial�model�on�a�quarterly�basis,�including�forecast�market returns. This model allows for different assumptions regarding lease expiries, breaks and incentives. For the purposes of the viability assessment of the Group, the model covers�a�five-year�period�and�is�stress�tested under various scenarios. In the context of the Covid-19 pandemic the Board considered a number of scenarios around its impact on the Group’s property portfolio�and�financial�position.�These�scenarios included different levels of rent collection, occupier defaults, void periods and incentives within the�portfolio,�and�the�consequential�impact on property costs and loan covenants. All lease events and assumptions were reviewed over the period under the different scenarios and their impact on revenue and cash�flow.�Future�letting�activity�was�assumed to be curtailed during the initial period of the assessment. Forecast movements in capital values were included in these scenarios including their potential impact on the Group’s loan covenants. The Group’s long-term loan facilities are in place throughout the assessment period, while the Board assumed that the Group would continue to have access to its short-term facilities. The Board considered the impact of these scenarios on its ability to continue to pay dividends at different rates over the assessment period.These matters were assessed over the period to 31 March 2026 and will continue to be assessed over�five-year�rolling�periods.The Directors consider that the stress testing performed was sufficiently�robust�that�even�under extreme conditions the Company remains viable.Based on their assessment, and in the context of the Group’s business model and strategy, the Directors expect that the Group will be able to continue in operation and meet its liabilities as they fall due over the five-year�period�to�31�March�2026.
Substantial shareholdingsBased�on�notifications�received�and on information provided by the Company’s brokers, the Company understands the following shareholders�held�a�beneficial�interest�of�3%�or�more�of�the�Company’s�issued share capital as at 20 May 2021.
%�of�issued�share capital
Investec Wealth & Investment Limited 14.2Bank of Montreal 7.3BlackRock Inc. 5.5Mattioli Woods plc 5.3Brewin Dolphin Limited 4.7The Vanguard Group Inc. 4.1Smith & Williamson Investment Management 3.8
Disclosure of information to auditorThe�Directors�who�held�office�at�the�date of approval of this Directors’ Report�confirm�that,�so�far�as�they�are each aware, there is no relevant audit information of which the Company’s auditor is unaware and each Director has taken all the steps that he or she ought to have taken as a Director to make themselves aware of any relevant audit information and to establish that the Company’s auditor is aware of that information.
AuditorKPMG Channel Islands Limited (the ‘Auditor’) has expressed its willingness to�continue�in�office�as�the�Company’s�auditor and a resolution proposing its reappointment will be submitted at the Annual General Meeting.
events over the assessment period have been considered on a case-by-case basis to determine the range of most likely outcomes. More details regarding the Group’s business activities, together with the factors affecting performance, investment activities and future development are set out in the Strategic Report. Further�information�on�the�financial�position of the Group, including its liquidity�position,�borrowing�facilities�and�debt�maturity�profile,�is�set�out�in the Financial Review and in the consolidated�financial�statements.�Under all of these scenarios the Group�has�sufficient�cash�resources�to�continue its operations, and remain within its loan covenants, for a period of at least 12 months from the date of�these�financial�statements.Based on their assessment and knowledge of the portfolio and market, the Directors have therefore continued to adopt the going�concern basis�in�preparing�the�financial�statements.
Viability assessment and statementThe UK Corporate Governance Code�requires�the�Board�to�make�a�‘viability statement’ which considers the Company’s current position and principal and emerging risks and uncertainties combined with an assessment of the future prospects for the Company, in order that the Board can state that the Company will be able to continue its operations over the period of their assessment.The Board conducted this review over a�five-year�timescale,�considered�to�be the most appropriate for long-term investment in commercial property. The assessment has been undertaken taking into account the principal and emerging risks and uncertainties faced by the Group which could impact its investment strategy, future performance, loan�covenants�and�liquidity.The�major�risks�identified�were�those�relating to the Covid-19 pandemic and its potential impact on the UK economy and commercial property market over the period of the

Strategic ReportG
overnanceFinancial Statem
entsAdditional Inform
ationPicton Property Incom
e Limited Annual Report 2021
Business Overview
101
with the Companies (Guernsey) Law, 2008. They are responsible for such internal controls as they determine are necessary to enable the preparation of�the�financial�statements�that�are�free from material misstatement, whether due to fraud or error, and have a general responsibility for taking such steps as are reasonably open to them to safeguard the assets of the Group and to prevent and detect fraud and other irregularities. The Directors are responsible for the maintenance and integrity of the corporate�and�financial�information�included on the Company’s website, and for the preparation and dissemination�of�financial�statements.�Legislation in Guernsey governing the preparation and dissemination of�financial�statements�may�differ�from legislation in other jurisdictions.
Directors’ responsibility statement in respect of the Annual Report and financial statementsWe�confirm�that�to�the�best�of�our knowledge:�
ӱ the�financial�statements,�prepared�in accordance with the applicable set of accounting standards, give a true and fair view of the assets, liabilities,�financial�position�and�profit�or�loss�of�the�Company;�and�
ӱ the Strategic Report includes a fair review of the development and performance of the business and the position of the Issuer, together with a description of the principal risks and uncertainties that they face.
We consider the Annual Report and accounts, taken as a whole, are fair, balanced and understandable and provide the information necessary for shareholders to assess the Company’s position and performance, business model and strategy.By Order of the Board
Andrew Dewhirst 26 May 2021
Statement of Directors’ responsibilitiesThe Directors are responsible for preparing the Annual Report and the financial�statements�in�accordance�with applicable law and regulations. Company�law�requires�the�Directors�to�prepare�financial�statements�for�each�financial�year.�Under�that�law�they�are�required�to�prepare�the�financial�statements�in�accordance�with International Financial Reporting Standards, as issued by the IASB, and applicable law. Under company law the Directors must�not�approve�the�financial�statements�unless�they�are�satisfied�that they give a true and fair view of the state of affairs of the Company and�of�its�profit�or�loss�for�that�period.�In�preparing�these�financial�statements, the Directors are�required�to:
ӱ select suitable accounting policies and then apply them consistently;
ӱ make judgements and estimates that are reasonable, relevant and reliable;
ӱ state whether applicable accounting standards have been followed, subject to any material departures disclosed and explained�in�the�financial�statements;
ӱ assess the Group and Company’s ability to continue as a going concern, disclosing, as applicable, matters related to going concern; and
ӱ use the going concern basis of accounting unless they either intend�to�liquidate�the�Group�or�the Company or to cease operations, or have no realistic alternative but to do so.
The Directors are responsible for keeping proper accounting records that�are�sufficient�to�show�and�explain�the Company’s transactions and disclose with reasonable accuracy at any�time�the�financial�position�of�the�Company and enable them to ensure that�its�financial�statements�comply�

Picton Property Income Lim
ited Annual Report 2021
102
Financial StatementsIndependent Auditor’s Report to the Members of Picton Property Income Limited
Our opinion is unmodifiedWe�have�audited�the�consolidated�financial�statements�of Picton�Property�Income�Limited�(the�‘Company’)�and�its subsidiaries�(together,�the�‘Group’),�which�comprise�the consolidated�balance�sheet�as�at�31�March�2021,�the�consolidated statements of comprehensive income, changes�in�equity�and�cash�flows�for�the�year�then�ended,�and�notes,�comprising�significant�accounting�policies�and�other explanatory information.In our opinion, the accompanying consolidated financial statements:
ӱ give�a�true�and�fair�view�of�the�financial�position�of�the�Group�as�at�31�March�2021,�and�of�the�Group’s�financial�performance�and�cash�flows�for�the�year�then�ended;
ӱ are prepared in accordance with International Financial Reporting Standards; and
ӱ comply with the Companies (Guernsey) Law, 2008.
Basis for opinionWe conducted our audit in accordance with International Standards on Auditing (UK) (‘ISAs (UK)’) and applicable law. Our�responsibilities�are�described�below.�We�have�fulfilled�our ethical responsibilities under, and are independent of the Company and Group in accordance with, UK ethical requirements�including�FRC�Ethical�Standards,�as�applied�to listed entities. We believe that the audit evidence we have�obtained�is�a�sufficient�and�appropriate�basis�for�our opinion.
Key audit matters: our assessment of the risks of material misstatementKey audit matters are those matters that, in our professional�judgment,�were�of�most�significance�in�the audit�of�the�consolidated�financial�statements�and�include�the�most�significant�assessed�risks�of�material�misstatement�(whether�or�not�due�to�fraud)�identified�by�us, including those which had the greatest effect on: the overall audit strategy; the allocation of resources in the audit; and directing the efforts of the engagement team. These matters were addressed in the context of our audit of�the�consolidated�financial�statements�as�a�whole,�and�in forming�our�opinion�thereon,�and�we�do�not�provide�a�separate opinion on these matters. In arriving at our audit opinion above, the key audit matter was as follows (unchanged from 2020):
Valuation of investment properties
£665.4�million�(2020:�£654.5�million)Refer to page 77 of the Audit and Risk Committee Report, Note�2�significant�accounting�policies�and�Note�13�investment�properties disclosures
The risk Our response
Basis:The Group’s investment properties accounted�for�93%�(2020:�94%)�of�the�Group’s total assets as at 31 March 2021. The fair value of investment properties at 31 March 2021 was assessed by the Board of Directors based on independent valuations prepared by the Group’s third party independent valuer (the ‘Valuer’).
Risk:The valuation of the Group’s investment properties�is�a�significant�area�of�our�audit given that it represents the majority of the total assets of the Group and in view�of�the�significance�of�the�estimates�and judgements that may be involved in the determination of their fair value.
Our audit procedures included:
Control evaluation:We assessed the design, implementation and operating effectiveness of controls over the valuation of investment properties including the capture and recording of information contained in the lease database for investment properties.
Evaluating experts engaged by management:We assessed the competence, capabilities and objectivity of the Valuer. We also assessed the independence of the Valuer by considering the scope of their work and the terms of their engagement.
Evaluating assumptions and inputs used in the valuation:With the assistance of our own Real Estate valuation specialist we assessed the valuations prepared by the Valuer by::
ӱ evaluating the appropriateness of the valuation methodologies and assumptions used
ӱ undertaking�discussions�on�key�findings�with�the�Valuer�and�challenging�the�valuations based on market information and knowledge
ӱ assessing the assumptions applied by the Valuer in relation to rental collections and void periods resulting from Covid-19
We also compared a sample of the key inputs used to calculate the valuations such as annual rent and tenancy contracts for consistency with other audit findings.
Assessing disclosures:We also considered the Group’s investment property valuation policies and their application�as�described�in�the�notes�to�the�consolidated�financial�statements�for�compliance�with�IFRS�in�addition�to�the�adequacy�of�disclosures�in�Note�13�in�relation to fair value of the investment properties including the impact of Covid-19.
103
Strategic ReportG
overnanceFinancial Statem
entsAdditional Inform
ationPicton Property Incom
e Limited Annual Report 2021
Business Overview
Our application of materiality and an overview of the scope of our auditMateriality�for�the�consolidated�financial�statements�as�a�whole�was�set�at�£7.1�million,�determined�with�reference�to�a�benchmark�of�group�total�assets�of�£712.5�million,�of�which�it�represents�approximately�1%�(2020:�1%).In line with our audit methodology, our procedures on individual account balances and disclosures were performed to a lower threshold, performance materiality, so as to reduce to an acceptable level the risk that individually immaterial misstatements in individual account balances add up to a material amount across the�financial�statements�as�a�whole.�Performance�materiality�for�the�Group�was�set�at�75%�(2020:�75%)�of�materiality�for�the�financial�statements�as�a�whole,�which�equates�to�£5.3�million.�We�applied�this�percentage�in�our�determination of performance materiality because we did not identify any factors indicating an elevated level of risk.We reported to the Audit Committee any corrected or�uncorrected�identified�misstatements�exceeding�£356,000,�in�addition�to�other�identified�misstatements�that�warranted�reporting�on�qualitative�grounds.�Our audit of the Group was undertaken to the materiality level�specified�above,�which�has�informed�our�identification�of�significant�risks�of�material�misstatement�and�the�associated audit procedures performed in those areas as detailed above. The group team performed the audit of the Group as if it was�a�single�aggregated�set�of�financial�information.�The�audit was performed using the materiality level set out above�and�covered�100%�of�total�group�revenue,�total�group�profit�before�tax,�and�total�group�assets�and�liabilities.
Going concernThe�Directors�have�prepared�the�consolidated�financial�statements on the going concern basis as they do not intend�to�liquidate�the�Group�or�the�Company�or�to�cease�their operations, and as they have concluded that the Group�and�the�Company’s�financial�position�means�that�this is realistic. They have also concluded that there are no�material�uncertainties�that�could�have�cast�significant�doubt over their ability to continue as a going concern for at least a year from the date of approval of the consolidated financial�statements�(the�‘going�concern�period’).In our evaluation of the Directors’ conclusions, we considered the inherent risks to the Group and the Company’s business model and analysed how those risks�might�affect�the�Group�and�the�Company’s�financial�resources or ability to continue operations over the going concern period. The risks that we considered most likely to�affect�the�Group�and�the�Company’s�financial�resources�or ability to continue operations over this period were:
ӱ Availability of capital to meet operating costs and other financial�commitments;
ӱ The�ability�to�successfully�refinance�or�repay�debt;�and ӱ The ability of the Company to comply with debt
covenants.We considered whether these risks could plausibly affect the�liquidity�in�the�going�concern�period�by�comparing�severe, but plausible downside scenarios that could arise
from these risks individually and collectively against the level�of�available�financial�resources�indicated�by�the�Group’s�financial�forecasts.We considered whether the going concern disclosure in Note�2�to�the�financial�statements�gives�a�full�and�accurate�description of the Directors’ assessment of going concern.Our conclusions based on this work:
ӱ we consider that the Directors’ use of the going concern basis of accounting in the preparation of the consolidated�financial�statements�is�appropriate;
ӱ we�have�not�identified,�and�concur�with�the�Directors’�assessment that there is not, a material uncertainty related to events or conditions that, individually or collectively,�may�cast�significant�doubt�on�the�Group�and the Company’s ability to continue as a going concern for the going concern period; and
ӱ we have nothing material to add or draw attention to in relation to the Directors’ statement in the notes to the consolidated�financial�statements�on�the�use�of�the�going concern basis of accounting with no material uncertainties�that�may�cast�significant�doubt�over�the�Group and the Company’s use of that basis for the going concern period, and that statement is materially consistent�with�the�consolidated�financial�statements�and our audit knowledge.
However, as we cannot predict all future events or conditions�and�as�subsequent�events�may�result�in�outcomes that are inconsistent with judgements that were reasonable�at�the�time�they�were�made,�the�above�conclusions are not a guarantee that the Group and the Company will continue in operation.
Fraud and breaches of laws and regulations – ability to detectIdentifying and responding to risks of material misstatement due to fraudTo identify risks of material misstatement due to fraud (‘fraud risks’) we assessed events or conditions that could indicate an incentive or pressure to commit fraud or provide an opportunity to commit fraud. Our risk assessment procedures included:
ӱ enquiring�of�management�as�to�the�Group’s�policies�and procedures to prevent and detect fraud as well as enquiring�whether�management�have�knowledge�of�any actual, suspected or alleged fraud;
ӱ reading minutes of meetings of those charged with governance; and
ӱ using analytical procedures to identify any unusual or unexpected relationships.
As�required�by�auditing�standards,�we�perform�procedures�to address the risk of management override of controls, in particular the risk that management may be in a position to make inappropriate accounting entries. On this audit we do�not�believe�there�is�a�fraud�risk�related�to�revenue�recognition because the Group’s revenue streams are simple in nature with respect to accounting policy choice, and�are�easily�verifiable�to�external�data�sources�or�agreements�with�little�or�no�requirement�for�estimation�from management. We did not identify any additional fraud risks.

Picton Property Income Lim
ited Annual Report 2021
104
Financial StatementsIndependent Auditor’s Report to the Members of Picton Property Income Limited continued
We performed procedures including: ӱ Identifying journal entries and other adjustments to test based�on�risk�criteria�and�comparing�any�identified�entries to supporting documentation; and
ӱ incorporating an element of unpredictability in our audit procedures.
Identifying and responding to risks of material misstatement due to non-compliance with laws and regulationsWe�identified�areas�of�laws�and�regulations�that�could�reasonably be expected to have a material effect on the consolidated�financial�statements�from�our�sector�experience and through discussion with management (as required�by�auditing�standards),�and�from�inspection�of the�Group’s�regulatory�and�legal�correspondence,�if�any, and�discussed�with�management�the�policies�and procedures�regarding�compliance�with�laws�and�regulations. As the Group is regulated, our assessment of risks involved gaining an understanding of the control environment including the entity’s procedures for complying�with�regulatory�requirements.The Group is subject to laws and regulations that directly affect�the�consolidated�financial�statements�including�financial�reporting�legislation�and�taxation�legislation�and�we assessed the extent of compliance with these laws and regulations as part of our procedures on the related financial�statement�items.The Group is subject to other laws and regulations where�the�consequences�of�non-compliance�could�have a material effect on amounts or disclosures in the consolidated�financial�statements,�for�instance�through�the�imposition�of�fines�or�litigation�or�impacts�on�the�Group�and�the�Company’s�ability�to�operate.�We�identified�financial�services�regulation�as�being�the�area�most�likely�to have such an effect, recognising the regulated nature of the Group’s activities and its legal form. Auditing standards limit�the�required�audit�procedures�to�identify�non-compliance�with�these�laws�and�regulations�to�enquiry�of management and inspection of regulatory and legal correspondence, if any. Therefore if a breach of operational regulations is not disclosed to us or evident from relevant correspondence, an audit will not detect that breach.Context of the ability of the audit to detect fraud or breaches of law or regulationOwing to the inherent limitations of an audit, there is an unavoidable risk that we may not have detected some material�misstatements�in�the�consolidated�financial�statements, even though we have properly planned and performed our audit in accordance with auditing standards. For example, the further removed non-compliance with laws and regulations is from the events and�transactions�reflected�in�the�consolidated�financial�statements, the less likely the inherently limited procedures required�by�auditing�standards�would�identify�it.�In addition, as with any audit, there remains a higher risk of non-detection�of�fraud,�as�this�may�involve�collusion,�forgery, intentional omissions, misrepresentations, or the override of internal controls. Our audit procedures are designed to detect material misstatement. We are not responsible for preventing non-compliance or fraud and cannot be expected to detect non-compliance with all laws and regulations.
Other informationThe Directors are responsible for the other information. The other information comprises the information included in the annual report but does not include the consolidated financial�statements�and�our�auditor’s�report�thereon.�Our�opinion�on�the�consolidated�financial�statements�does�not cover the other information and we do not express an audit opinion or any form of assurance conclusion thereon.In�connection�with�our�audit�of�the�consolidated�financial�statements, our responsibility is to read the other information and, in doing so, consider whether the other information is materially inconsistent with the consolidated financial�statements�or�our�knowledge�obtained�in�the�audit, or otherwise appears to be materially misstated. If, based on the work we have performed, we conclude that there is a material misstatement of this other information, we�are�required�to�report�that�fact.�We�have�nothing�to�report in this regard.
Disclosures of emerging and principal risks and longer term viabilityWe�are�required�to�perform�procedures�to�identify�whether�there is a material inconsistency between the Directors’ disclosures in respect of emerging and principal risks and the�viability�statement,�and�the�consolidated�financial�statements and our audit knowledge. We have nothing material to add or draw attention to in relation to:
ӱ the�Directors’�confirmation�within�the�Viability�assessment and statement (page 100) that they have carried out a robust assessment of the emerging and principal risks facing the Group, including those that would threaten its business model, future performance, solvency�or�liquidity;
ӱ the disclosures describing these emerging and principal risks and explaining how they are being managed or mitigated;
ӱ the Directors’ explanation in the Viability assessment and statement (page 100) as to how they have assessed the prospects of the Group, over what period they have done so and why they consider that period to be appropriate, and their statement as to whether they have a reasonable expectation that the Group will be able to continue in operation and meet its liabilities as they fall due over the period of their assessment, including any related disclosures drawing attention to any�necessary�qualifications�or�assumptions
We�are�also�required�to�review�the�Viability�assessment�and statement,�set�out�on�page�100�under�the�Listing�Rules. Based on the above procedures, we have concluded that the above disclosures are materially consistent with the�consolidated�financial�statements�and�our�audit�knowledge.
Corporate governance disclosuresWe�are�required�to�perform�procedures�to�identify�whether�there is a material inconsistency between the Directors’ corporate governance disclosures and the consolidated financial�statements�and�our�audit�knowledge.
105
Strategic ReportG
overnanceFinancial Statem
entsAdditional Inform
ationPicton Property Incom
e Limited Annual Report 2021
Business Overview
Based on those procedures, we have concluded that each of�the�following�is�materially�consistent�with�the�consolidated�financial�statements�and�our�audit�knowledge:
ӱ the Directors’ statement that they consider that the Annual�Report�and�consolidated�financial�statements�taken as a whole is fair, balanced and understandable, and provides the information necessary for shareholders to assess the Company’s position and performance, business model and strategy;
ӱ the section of the Annual Report describing the work of the�Audit�Committee,�including�the�significant�issues that�the�audit�committee�considered�in�relation�to�the�financial�statements,�and�how�these�issues�were�addressed; and
ӱ the section of the Annual Report that describes the review of the effectiveness of the Company’s risk management and internal control systems.
We�are�required�to�review�the�part�of�Corporate�Governance Statement relating to the Company’s compliance with the provisions of the UK Corporate Governance�Code�specified�by�the�Listing�Rules�for�our�review. We have nothing to report in this respect.
We have nothing to report on other matters on which we are required to report by exceptionWe have nothing to report in respect of the following matters where the Companies (Guernsey) Law, 2008 requires�us�to�report�to�you�if,�in�our�opinion:
ӱ the Company has not kept proper accounting records; or
ӱ the�consolidated�financial�statements�are�not�in�agreement with the accounting records; or
ӱ we have not received all the information and explanations, which to the best of our knowledge and belief are necessary for the purpose of our audit.
Respective responsibilitiesDirectors’ responsibilitiesAs explained more fully in their statement set out on page 101, the Directors are responsible for: the preparation of the�consolidated�financial�statements�including�being�satisfied�that�they�give�a�true�and�fair�view;�such�internal�control as they determine is necessary to enable the preparation�of�consolidated�financial�statements�that�are�free from material misstatement, whether due to fraud or error; assessing the Group and Company’s ability to continue as a going concern, disclosing, as applicable, matters related to going concern; and using the going concern basis of accounting unless they either intend to�liquidate�the�Group�or�the�Company�or�to�cease�operations, or have no realistic alternative but to do so.
Auditor’s responsibilitiesOur objectives are to obtain reasonable assurance about whether�the�consolidated�financial�statements�as�a�whole�are free from material misstatement, whether due to fraud or error, and to issue our opinion in an auditor’s report. Reasonable assurance is a high level of assurance, but does not guarantee that an audit conducted in accordance with ISAs (UK) will always detect a material misstatement when it exists. Misstatements can arise from fraud or error and are considered material if, individually or in aggregate, they could�reasonably�be�expected�to�influence�the�economic�decisions of users taken on the basis of the consolidated financial�statements.�A fuller description of our responsibilities is provided on the FRC’s website at www.frc.org.uk/auditorsresponsibilities.
The purpose of this report and restrictions on its use by persons other than the Company’s members as a bodyThis report is made solely to the Company’s members, as a body,�in�accordance�with�section�262�of�the�Companies�(Guernsey) Law, 2008. Our audit work has been undertaken so that we might state to the Company’s members those matters�we�are�required�to�state�to�them�in�an�auditor’s report and for no other purpose. To the fullest extent permitted by law, we do not accept or assume responsibility to anyone other than the Company and the Company’s members, as a body, for our audit work, for this report,�or�for�the�opinions�we�have�formed.
Deborah SmithFor and on behalf of KPMG Channel Islands Limited Chartered Accountants and Recognised Auditors, Guernsey26 May 2021

Picton Property Income Lim
ited Annual Report 2021
106
Notes
2021 Total £000
2020 Total £000
IncomeRevenue from properties 3 43,331 45,664Property expenses 4 (9,877) (12,027)
Net property income 33,454 33,637
ExpensesAdministrative expenses 6 (5,388) (5,563)
Total operating expenses (5,388) (5,563)
Operating profit before movement on investments 28,066 28,074
InvestmentsProfit�on�disposal�of�investment�properties 13 868 3,478Investment property valuation movements 13 12,861 (882)
Total profit on investments 13,729 2,596
Operating profit 41,795 30,670
FinancingInterest received 5 9Interest paid 8 (7,999) (8,295)
Total finance costs (7,994) (8,286)
Profit before tax 33,801 22,384Tax 9 – 124
Profit and total comprehensive income for the period 33,801 22,508
Earnings per shareBasic 11 6.2p 4.1pDiluted 11 6.2p 4.1p
All items in the above statement derive from continuing operations.
All�of�the�profit�and�total�comprehensive�income�for�the�year�is�attributable�to�the�equity�holders�of�the�Company.Notes�1�to�27�form�part�of�these�consolidated�financial�statements.
Financial StatementsConsolidated statement of comprehensive incomefor the year ended 31 March 2021

107
Strategic ReportG
overnanceFinancial Statem
entsAdditional Inform
ationPicton Property Incom
e Limited Annual Report 2021
Business Overview
Financial StatementsConsolidated statement of changes in equityfor the year ended 31 March 2021
Notes
Share capital £000
Retained earnings
£000
Other reserves £000
Total £000
Balance as at 31 March 2019 157,449 342,252 (286) 499,415Profit�for�the�year – 22,508 – 22,508Dividends paid 10 – (19,039) – (19,039)Issue of ordinary shares 20 7,137 – – 7,137Issue costs of shares (186) – – (186)Vesting of shares held in trust – (54) 54 –Share-based awards 7 – – 292 292Purchase of shares held in trust 7 – – (844) (844)
Balance as at 31 March 2020 164,400 345,667 (784) 509,283Profit�for�the�year – 33,801 – 33,801Dividends paid 10 – (15,002) – (15,002)Share-based awards 7 – – 758 758Purchase of shares held in trust 7 – – (643) (643)
Balance as at 31 March 2021 164,400 364,466 (669) 528,197
Notes�1�to�27�form�part�of�these�consolidated�financial�statements.

Picton Property Income Lim
ited Annual Report 2021
108
Financial StatementsConsolidated balance sheetas at 31 March 2021
Notes2021
£0002020 £000
Non-current assets Investment properties 13 665,418 654,486Property,�plant�and�equipment 14 4,111 20
Total non-current assets 669,529 654,506
Current assets Accounts receivable 15 19,584 17,601Cash�and�cash�equivalents 16 23,358 23,567
Total current assets 42,942 41,168
Total assets 712,471 695,674
Current liabilitiesAccounts payable and accruals 17 (18,805) (19,438)Loans and borrowings 18 (944) (888)Obligations under leases 22 (107) (108)
Total current liabilities (19,856) (20,434)
Non-current liabilities Loans and borrowings 18 (162,711) (164,248)Obligations under leases 22 (1,707) (1,709)
Total non-current liabilities (164,418) (165,957)
Total liabilities (184,274) (186,391)
Net assets 528,197 509,283
EquityShare capital 20 164,400 164,400Retained earnings 364,466 345,667Other reserves (669) (784)
Total equity 528,197 509,283
Net asset value per share 23 97p 93p
These�consolidated�financial�statements�were�approved�by�the�Board�of�Directors�on�26�May�2021�and�signed�on�its�behalf by:
Andrew DewhirstDirector26 May 2021
Notes�1�to�27�form�part�of�these�consolidated�financial�statements.

109
Strategic ReportG
overnanceFinancial Statem
entsAdditional Inform
ationPicton Property Incom
e Limited Annual Report 2021
Business Overview
Financial StatementsConsolidated statement of cash flowsfor the year ended 31 March 2021
Notes2021
£0002020 £000
Operating activitiesOperating�profit 41,795 30,670Adjustments for non-cash items 21 (12,964) (2,295)Interest received 5 9Interest paid (7,515) (7,952)Tax received 56 123Increase in accounts receivable (1,983) (4,078)Decrease in accounts payable and accruals (825) (2,936)
Cash inflows from operating activities 18,569 13,541
Investing activitiesCapital expenditure on investment properties 13 (4,961) (8,861)Disposal of investment properties 3,928 33,859Purchase of tangible assets (268) (4)
Cash (outflows)/inflows from investing activities (1,301) 24,994
Financing activitiesBorrowings repaid 18 (1,258) (33,204)Borrowings drawn 18 – 6,000Financing costs 18 (574) –Issue of ordinary shares 20 – 7,137Issue costs of ordinary shares – (186)Purchase of shares held in trust 7 (643) (844)Dividends paid 10 (15,002) (19,039)
Cash outflows from financing activities (17,477) (40,136)
Net decrease in cash and cash equivalents (209) (1,601)Cash�and�cash�equivalents�at�beginning�of�year 23,567 25,168
Cash and cash equivalents at end of year 16 23,358 23,567
Notes�1�to�27�form�part�of�these�consolidated�financial�statements.
Picton Property Income Lim
ited Annual Report 2021
110
1. General informationPicton Property Income Limited (the ‘Company’ and together with its subsidiaries the ‘Group’) was established on 15 September 2005 as a closed ended Guernsey domiciled investment company and entered the UK REIT regime on 1�October�2018.�The�consolidated�financial�statements�are�prepared�for�the�year�ended�31�March�2021�with�comparatives�for�the�year ended�31�March�2020.
2. Significant accounting policiesBasis of accountingThe�financial�statements�have�been�prepared�on�a�going�concern�basis�and�adopt�the�historical�cost�basis,�except�for�the revaluation�of�investment�properties.�Historical�cost�is�generally�based�on�the�fair�value�of�the�consideration�given�in exchange�for�the�assets.�The�financial�statements,�which�give�a�true�and�fair�view,�are�prepared�in�accordance�with�International Financial Reporting Standards (IFRS) as issued by the IASB and are in compliance with the Companies (Guernsey) Law, 2008.The�Directors�have�assessed�whether�the�going�concern�basis�remains�appropriate�for�the�preparation�of�the�financial�statements, including giving consideration to the continuing impact of the Covid-19 pandemic on the UK economy. They have reviewed the Group’s principal and emerging risks, recent levels of rent collection, existing loan facilities, access to funding�and�liquidity�position�and�then�considered�a�number�of�scenarios�around�different�levels�of�rent�collection,�(and�the�potential�consequences�on�financial�performance),�asset�values,�capital�projects�and�loan�covenants.�Under�all�of�these�scenarios�the�Group�has�sufficient�resources�to�continue�its�operations,�and�remain�within�its�loan�covenants,�for�a�period�of�at�least�12�months�from�the�date�of�these�financial�statements.Based on their assessment and knowledge of the portfolio and market, the Directors have therefore continued to adopt the�going�concern�basis�in�preparing�the�financial�statements.The�financial�statements�are�presented�in�pounds�sterling,�which�is�the�Company’s�functional�currency.�All�financial�information presented in pounds sterling has been rounded to the nearest thousand, except when otherwise indicated.New or amended standards issuedThe�accounting�policies�adopted�are�consistent�with�those�of�the�previous�financial�period,�as�amended�to�reflect�the�adoption of new standards, amendments and interpretations which became effective in the year as shown below.
ӱ Business Combinations, Amendments to IFRS 3 ӱ Interest Rate Benchmark Reform, Amendments to IFRS 9, IAS 39 and IFRS 7 ӱ Definition�of�Material,�Amendments�to�IAS�1�and�IAS�8The�adoption�of�these�standards�has�had�no�material�effect�on�the�consolidated�financial�statements�of�the�Group.At�the�date�of�approval�of�these�financial�statements�there�are�a�number�of�new�and�amended�standards�in�issue�but�not yet�effective�for�the�financial�year�ended�31�March�2021�and�thus�have�not�been�applied�by�the�Group.
ӱ Interest Rate Benchmark Reform – Phase 2 ӱ Onerous�Contracts�–�Cost�of�fulfilling�a�Contract�(Amendments�to�IAS�37) ӱ Classification�of�liabilities�as�current�or�non-current�(Amendments�to�IAS�1) ӱ Annual Improvements to IFRS Standards 2018-2020
The adoption of these new and amended standards, together with any other IFRSs or IFRIC interpretations that are not yet�effective,�are�not�expected�to�have�a�material�impact�on�the�financial�statements�of�the�Group.Use of estimates and judgementsThe�preparation�of�financial�statements�in�conformity�with�IFRS�requires�management�to�make�judgements,�estimates�and assumptions that affect the application of policies and the reported amounts of assets, liabilities, income and expenses. The estimates and associated assumptions are based on historical experience and various other factors that are believed�to�be�reasonable�under�the�circumstances,�the�results�of�which�form�the�basis�of�making�estimates�about�the carrying�values�of�assets�and�liabilities�that�are�not�readily�apparent�from�other�sources.�Actual�results�may�differ�from�these estimates. The estimates and underlying assumptions are reviewed on an ongoing basis.Significant judgements and estimatesJudgements�made�by�management�in�the�application�of�IFRSs�that�have�a�significant�effect�on�the�financial�statements�and major sources of estimation uncertainty are disclosed in Note 13.The critical estimates and assumptions relate to the investment property and owner-occupied property valuations applied by the Group’s independent valuer. Revisions to accounting estimates are recognised in the year in which the estimate is revised if the revision affects only that year, or in the year of the revision and future years if the revision affects both current and future years.
Financial StatementsNotes to the consolidated financial statementsfor the year ended 31 March 2021

111
Strategic ReportG
overnanceFinancial Statem
entsAdditional Inform
ationPicton Property Incom
e Limited Annual Report 2021
Business Overview
Basis of consolidationThe�consolidated�financial�statements�incorporate�the�financial�statements�of�the�Company�and�entities�controlled�by�the�Company at the reporting date. The Group controls an entity when it is exposed to, or has rights to, variable returns from its involvement with the entity and has the ability to affect these returns through its power over the entity.Subsidiaries are consolidated from the date on which control is transferred to the Group and cease to be consolidated from�the�date�on�which�control�is�transferred�out�of�the�Group.�These�financial�statements�include�the�results�of�the�subsidiaries disclosed in Note 12. All intra-group transactions, balances, income and expenses are eliminated on consolidation.Fair value hierarchyThe fair value measurement for the assets and liabilities are categorised into different levels in the fair value hierarchy based�on�the�inputs�to�valuation�techniques�used.�The�different�levels�have�been�defined�as�follows:Level�1:�quoted�prices�(unadjusted)�in�active�markets�for�identical�assets�or�liabilities�that�the�Group�can�access�at�the�measurement date.Level�2:�inputs�other�than�quoted�prices�included�within�Level�1�that�are�observable�for�the�asset�or�liability,�either�directly�or indirectly.Level 3: unobservable inputs for the asset or liability.The Group recognises transfers between levels of the fair value hierarchy as of the end of the reporting period during which the transfer has occurred.Investment propertiesFreehold�property�held�by�the�Group�to�earn�income�or�for�capital�appreciation,�or�both,�is�classified�as�investment�property in accordance with IAS 40 ‘Investment Property’. Property held under head leases for similar purposes is also classified�as�investment�property.�Investment�property�is�initially�recognised�at�purchase�cost�plus�directly�attributable�acquisition�expenses�and�subsequently�measured�at�fair�value.�The�fair�value�of�investment�property�is�based�on�a�valuation�by�an�independent�valuer�who�holds�a�recognised�and�relevant�professional�qualification�and�who�has�recent�experience in the location and category of the investment property being valued.The fair value of investment properties is measured based on each property’s highest and best use from a market participant’s perspective and considers the potential uses of the property that are physically possible, legally permissible and�financially�feasible.The fair value of investment property generally involves consideration of:
ӱ Market evidence on comparable transactions for similar properties; ӱ The actual current market for that type of property in that type of location at the reporting date and current market
expectations; ӱ Rental income from leases and market expectations regarding possible future lease terms; ӱ Hypothetical sellers and buyers, who are reasonably informed about the current market and who are motivated, but
not compelled, to transact in that market on an arm’s length basis; and ӱ Investor expectations on matters such as future enhancement of rental income or market conditions.
Gains and losses arising from changes in fair value are included in the Consolidated Statement of Comprehensive Income in the year in which they arise. Purchases and sales of investment property are recognised when contracts have been unconditionally�exchanged�and�the�significant�risks�and�rewards�of�ownership�have�been�transferred.An�investment�property�is�derecognised�for�accounting�purposes�upon�disposal�or�when�no�future�economic�benefits�are�expected to arise from the continued use of the asset. Any gain or loss arising on derecognition of the asset (calculated as the difference between the net disposal proceeds and the carrying amount of the item) is included in the Consolidated Statement of Comprehensive Income in the year the asset is derecognised. Investment properties are not depreciated.The�majority�of�the�investment�properties�are�charged�by�way�of�a�first�ranking�mortgage�as�security�for�the�loans�made�to�the Group; see Note 18.Property, plant and equipmentOwner-occupied propertyOwner-occupied property is stated at its revalued amount, which is determined in the same manner as investment property. It is depreciated over its remaining useful life (40 years) with the depreciation included in administrative expenses. On revaluation, any accumulated depreciation is eliminated against the gross carrying amount of the property concerned,�and�the�net�amount�restated�to�the�revalued�amount.�Subsequent�depreciation�charges�are�adjusted�based�on the revalued amount. Any difference between the depreciation charge on the revalued amount and that which would have been charged under historic cost is transferred between the revaluation reserve and retained earnings as the property�is�utilised.�Any�gain�arising�on�this�remeasurement�is�recognised�in�profit�or�loss�to�the�extent�that�it�reverses�a�previous�impairment�loss�on�the�specific�property,�with�any�remaining�gain�recognised�in�other�comprehensive�income�and�presented�in�the�revaluation�reserve.�Any�loss�is�recognised�in�profit�or�loss.�However,�to�the�extent�that�an�amount�is�included in the revaluation surplus for that property, the loss is recognised in other comprehensive income and reduces the�revaluation�surplus�within�equity.
Picton Property Income Lim
ited Annual Report 2021
112
2. Significant accounting policies continuedPlant and equipmentPlant�and�equipment�is�depreciated�on�a�straight-line�basis�over�the�estimated�useful�lives�of�each�item�of�plant�and�equipment.�The�estimated�useful�lives�are�between�three�and�five�years.�LeasesWhere�investment�properties�are�held�under�operating�leases,�the�leasehold�interest�is�classified�as�if�it�were�held�under�a�finance�lease,�which�is�recognised�at�its�fair�value�on�the�balance�sheet,�within�the�investment�property�carrying�value.�Upon�initial�recognition,�a�corresponding�liability�is�included�as�a�finance�lease�liability.�Minimum�lease�payments�are�apportioned�between�the�finance�charge�and�the�reduction�of�the�outstanding�liability�so�as�to�produce�a�constant�periodic�rate�of�interest�on�the�remaining�finance�lease�liability.�Contingent�rent�payable,�being�the�difference�between�the rent currently payable and the minimum lease payments when the lease liability was originally calculated, are charged as expenses within property expenditure in the years in which they are payable.Lease�income�arises�from�operating�leases�granted�to�tenants.�An�operating�lease�is�a�lease�other�than�a�finance�lease.�A�finance�lease�is�one�whereby�substantially�all�the�risks�and�rewards�of�ownership�are�passed�to�the�lessee.�Lease�income�is�recognised as income on a straight-line basis over the lease term. Direct costs incurred in negotiating and arranging an operating lease are added to the carrying amount of the leased asset and recognised as an expense over the lease term on the same basis as the lease income. Premiums received on the surrender of leases are recorded as income immediately on surrender if there are no relevant conditions attached to the surrender.Cash and cash equivalentsCash�includes�cash�in�hand�and�cash�with�banks.�Cash�equivalents�are�short-term,�highly�liquid�investments�that�are�readily convertible to known amounts of cash with original maturities in three months or less and that are subject to an insignificant�risk�of�change�in�value.Income and expensesIncome and expenses are included in the Consolidated Statement of Comprehensive Income on an accruals basis. All of the Group’s income and expenses are derived from continuing operations.Lease incentive payments are amortised on a straight-line basis over the period from the date of lease inception to the end of the lease term and presented within accounts receivable. Lease incentives granted are recognised as a reduction of the total rental income, over the term of the lease. Upon receipt of a surrender premium for the early termination of a lease,�the�profit,�net�of�dilapidations�and�non-recoverable�outgoings�relating�to�the�lease�concerned,�is�immediately�reflected�in�revenue�from�properties.Property operating costs include the costs of professional fees on letting and other non-recoverable costs.The income charged to occupiers for property service charges and the costs associated with such service charges are shown�separately�in�Notes�3�and�4�to�reflect�that,�notwithstanding�this�money�is�held�on�behalf�of�occupiers,�the�ultimate�risk for paying and recovering these costs rests with the property owner.Employee benefitsDefined contribution plansA�defined�contribution�plan�is�a�post-employment�benefit�plan�under�which�the�Company�pays�fixed�contributions�into�a separate�entity�and�will�have�no�legal�or�constructive�obligation�to�pay�further�amounts.�Obligations�for�contributions�to defined�contribution�pension�plans�are�recognised�as�an�expense�in�the�Consolidated�Statement�of�Comprehensive�Income in the periods during which services are rendered by employees.Short-term benefitsShort-term�employee�benefit�obligations�are�measured�on�an�undiscounted�basis�and�are�expensed�as�the�related�service�is�provided.�A�liability�is�recognised�for�the�amount�expected�to�be�paid�under�short-term�cash�bonus�or�profit-sharing�plans if the Company has a present legal or constructive obligation to pay this amount as a result of past service provided by the employee and the obligation can be estimated reliably.Share-based paymentsThe fair value of the amounts payable to employees in respect of the Deferred Bonus Plan, when these are to be settled in cash, is recognised as an expense with a corresponding increase in liabilities, over the period that the employees become�unconditionally�entitled�to�payment.�Where�the�awards�are�equity�settled,�the�fair�value�is�recognised�as�an�expense,�with�a�corresponding�increase�in�equity.�The�liability�is�remeasured�at�each�reporting�date�and�at�settlement�date. Any changes in the fair value of the liability are recognised under the category staff costs in the Consolidated Statement of Comprehensive Income.
Financial StatementsNotes to the consolidated financial statements continuedfor the year ended 31 March 2021

113
Strategic ReportG
overnanceFinancial Statem
entsAdditional Inform
ationPicton Property Incom
e Limited Annual Report 2021
Business Overview
The grant date fair value of awards to employees made under the Long-term Incentive Plan is recognised as an expense, with�a�corresponding�increase�in�equity,�over�the�vesting�period�of�the�awards.�The�amount�recognised�as�an�expense�is�adjusted�to�reflect�the�number�of�awards�for�which�the�related�non-market�performance�conditions�are�expected�to�be�met, such that the amount ultimately recognised is based on the number of awards that meet the related non-market performance conditions at the vesting date. For share-based payment awards with market conditions, the grant date fair value�of�the�share-based�awards�is�measured�to�reflect�such�conditions�and�there�is�no�adjustment�between�expected�and actual outcomes.The�cost�of�the�Company’s�shares�held�by�the�Employee�Benefit�Trust�is�deducted�from�equity�in�the�Group�Balance�Sheet. Any shares held by the Trust are not included in the calculation of earnings or net assets per share.DividendsDividends are recognised in the period in which they are declared.Accounts receivableAccounts receivable are stated at their nominal amount as reduced by appropriate allowances for estimated irrecoverable amounts.�The�Group�applies�the�IFRS�9�simplified�approach�to�measuring�expected�credit�losses,�which�uses�a�lifetime�expected�impairment�provision�for�all�applicable�accounts�receivable.�Bad�debts�are�written�off�when�identified.Loans and borrowingsAll loans and borrowings are initially recognised at cost, being the fair value of the consideration received net of issue costs associated�with�the�borrowing.�After�initial�recognition,�loans�and�borrowings�are�subsequently�measured�at�amortised�cost using the effective interest method. Amortised cost is calculated by taking into account any issue costs, and any discount�or�premium�on�settlement.�Gains�and�losses�are�recognised�in�profit�or�loss�in�the�Consolidated�Statement�of�Comprehensive Income when the liabilities are derecognised for accounting purposes, as well as through the amortisation process.Assets classified as held for saleAny investment properties on which contracts for sale have been exchanged but which had not completed at the period end are disclosed as properties held for sale. Investment properties included in the held for sale category continue to be measured in accordance with the accounting policy for investment properties.Other assets and liabilitiesOther assets and liabilities, including trade creditors and accruals, other creditors, and deferred rental income, which are not interest bearing are stated at their nominal value.Share capitalOrdinary�shares�are�classified�as�equity.�Revaluation reserveAny�surplus�or�deficit�arising�from�the�revaluation�of�owner-occupied�property�is�taken�to�the�revaluation�reserve.TaxationThe�Group�elected�to�be�treated�as�a�UK�REIT�with�effect�from�1�October�2018.�The�UK�REIT�rules�exempt�the�profits�of�the�Group’s UK property rental business from UK corporation and income tax. Gains on UK properties are also exempt from tax, provided they are not held for trading. The Group is otherwise subject to UK corporation tax.As�a�REIT,�the�Company�is�required�to�pay�Property�Income�Distributions�equal�to�at�least�90%�of�the�Group’s�exempted�net income. To remain a UK REIT there are a number of conditions to be met in respect of the principal company of the Group,�the�Group’s�qualifying�activity�and�its�balance�of�business.�The�Group�continues�to�meet�these�conditions.Principles for the Consolidated Statement of Cash FlowsThe Consolidated Statement of Cash Flows has been drawn up according to the indirect method, separating the cash flows�from�operating�activities,�investing�activities�and�financing�activities.�The�net�result�has�been�adjusted�for�amounts�in�the Consolidated Statement of Comprehensive Income and movements in the Consolidated Balance Sheet which have not resulted in cash income or expenditure in the related period.The cash amounts in the Consolidated Statement of Cash Flows include those assets that can be converted into cash without any restrictions and without any material risk of decreases in value as a result of the transaction.
3. Revenue from properties2021
£0002020 £000
Rents receivable (adjusted for lease incentives) 36,558 37,780Surrender premiums 202 603Dilapidation receipts 1,195 471Other income 82 81Service charge income 5,294 6,729
43,331 45,664
Rents�receivable�have�been�adjusted�for�lease�incentives�recognised�of�£2.0�million�(2020:�£1.3�million).

Picton Property Income Lim
ited Annual Report 2021
114
4. Property expenses2021
£0002020 £000
Property operating costs 2,384 2,293Property void costs 2,199 3,005Recoverable service charge costs 5,294 6,729
9,877 12,027
5. Operating segmentsThe Board is responsible for setting the Group’s strategy and business model. The key measure of performance used by the Board to assess the Group’s performance is the total return of the Group’s net asset value. As the total return on the Group’s net asset value is calculated based on the net asset value per share calculated under IFRS as shown at the foot of the�Consolidated�Balance�Sheet,�assuming�dividends�are�reinvested,�the�key�performance�measure�is�that�prepared�under�IFRS.�Therefore,�no�reconciliation�is�required�between�the�measure�of�profit�or�loss�used�by�the�Board�and�that�contained�in�the financial�statements.The�Board�has�considered�the�requirements�of�IFRS�8�‘Operating�Segments’.�The�Board�is�of�the�opinion�that�the�Group,�through its subsidiary undertakings, operates in one reportable industry segment, namely real estate investment, and across�one�primary�geographical�area,�namely�the�United�Kingdom,�and�therefore�no�segmental�reporting�is�required.�The�portfolio�consists�of�46�commercial�properties,�which�are�in�the�industrial,�office,�retail�and�leisure�sectors.
6. Administrative expenses2021
£0002020 £000
Director and staff costs 3,219 3,273Auditor’s remuneration 206 191Other administrative expenses 1,963 2,099
5,388 5,563
Auditor’s remuneration comprises:2021
£0002020 £000
Audit fees:Audit�of�Group�financial�statements 92 92Audit�of�subsidiaries’�financial�statements 82 67
Audit-related fees:Review�of�half-year�financial�statements 16 16
190 175Non-audit fees:Additional controls testing 16 16
16 16206 191
7. Director and staff costs2021
£0002020 £000
Wages and salaries 1,724 1,688Non-Executive Directors’ fees 250 250Social security costs 358 394Other pension costs 28 45Share-based payments – cash settled 166 473Share-based�payments�–�equity�settled 693 423
3,219 3,273
The emoluments of the Directors are set out in detail within the Remuneration Committee report, including the audited totals on page 90.Employees participate in two share-based remuneration arrangements: the Deferred Bonus Plan and the Long-term Incentive Plan (the ‘LTIP’).For all employees, a proportion of any discretionary annual bonus will be an award under the Deferred Bonus Plan.
Financial StatementsNotes to the consolidated financial statements continuedfor the year ended 31 March 2021

115
Strategic ReportG
overnanceFinancial Statem
entsAdditional Inform
ationPicton Property Incom
e Limited Annual Report 2021
Business Overview
With the�exception�of�Executive�Directors,�awards�are�cash�settled�and�vest�after�two�years.�The�final�value�of�awards�is�determined by the movement in the Company’s share price and dividends paid over the vesting period. For Executive Directors,�awards�are�equity�settled�and�also�vest�after�two�years.�On�29�June�2020�awards�of�599,534�notional�shares�were made�which�vest�in�June�2022�(2020:�441,322�notional�shares).�The�next�awards�are�due�to�be�made�in�June�2021�for�vesting in June 2023.The table below summarises the awards made under the Deferred Bonus Plan. Employees have the option to defer the vesting date of their awards for a maximum of seven years.
Vesting date
Units at 31 March
2019
Units granted
in the year
Units cancelled
in the year
Units redeemed in the year
Units at 31 March
2020
Units granted
in the year
Units cancelled
in the year
Units redeemed in the year
Units at 31 March
2021
31 March 2020 564,604 – (2,616) (319,479) 242,509 – – (242,509) –19 June 2021 – 441,322 (2,415) – 438,907 – – – 438,90729 June 2022 – – – – – 599,534 – – 599,534
564,604 441,322 (5,031) (319,479) 681,416 599,534 – (242,509) 1,038,441
The�Group�also�has�a�Long-term�Incentive�Plan�for�all�employees�which�is�equity�settled.�Awards�are�made�annually�and�vest three years from the grant date. Vesting is conditional on three performance metrics measured over each three-year period. Awards to Executive Directors are also subject to a further two-year holding period. On 29 June 2020 awards for a maximum of 860,740 shares were granted to employees in respect of the three-year period ending on 31 March 2023. In the previous year, awards of 878,164 shares were made on 19 June 2019 for the period ending 31 March 2022.The three performance metrics are:
ӱ Total shareholder return (TSR) of Picton Property Income Limited, compared to a comparator group of similar listed companies;
ӱ Total property return (TPR) of the property assets held within the Group, compared to the MSCI UK Quarterly Property Index; and
ӱ Growth in EPRA earnings per share (EPS) of the Group.The fair value of share grants is measured using a combination of a Monte Carlo model for the market conditions (TSR) and a Black-Scholes model for the non-market conditions (TPR and EPS). The fair value is recognised over the expected vesting period. For the awards made during this year and the previous year the main inputs and assumptions of the models, and the resulting fair values, are:Assumptions
Grant date 29 June 2020 19 June 2019Share price at date of grant 68.4p 95.0pExercise price Nil NilExpected term 3 years 3 yearsRisk-free rate – TSR condition (0.05)% 0.84%Share price volatility – TSR condition 24.2% 18.7%Median volatility of comparator group – TSR condition 24.5% 18.1%Correlation – TSR condition 37.8% 27.1%TSR performance at grant date – TSR condition (11.4)% 7.5%Median TSR performance of comparator group at grant date – TSR condition (10.7)% 3.0%Fair value – TSR condition (Monte Carlo method) 26.7p 51.5pFair value – TPR condition (Black-Scholes model) 68.4p 95.0pFair value – EPS condition (Black-Scholes model) 68.4p 95.0p
The�Trustee�of�the�Company’s�Employee�Benefit�Trust�acquired�958,000�ordinary�shares�during�the�year�for�£643,000�(2020:�954,000�shares�for�£844,000).The Group employed ten members of staff at 31 March 2021 (2020: nine). The average number of people employed by the Group for the year ended 31 March 2021 was nine (2020: ten).
8. Interest paid2021
£0002020 £000
Interest payable on loans 7,574 7,933Interest�on�obligations�under�finance�leases 114 114Non-utilisation fees 311 248
7,999 8,295
The�loan�arrangement�costs�incurred�to�31�March�2021�are�£4,590,000�(2020:�£4,534,000).�These�are�amortised�over�the�duration�of�the�loans�with�£531,000�amortised�in�the�year�ended�31�March�2021�and�included�in�interest�payable�on�loans�(2020:�£371,000).

Picton Property Income Lim
ited Annual Report 2021
116
9. TaxThe charge for the year is:
2021 £000
2020 £000
Tax expense in year – –Tax adjustment to provision for prior year – (124)Total tax charge/(credit) – (124)
A reconciliation of the tax charge applicable to the results at the statutory tax rate to the charge for the year is as follows:2021
£0002020 £000
Profit�before�taxation 33,801 22,384Expected�tax�charge�on�ordinary�activities�at�the�standard�rate�of�taxation�of�19%�(2020:�19%) 6,422 4,253Less:UK REIT exemption on net income (3,813) (3,760)Revaluation movement not taxable (2,444) 168Gains on disposal not taxable (165) (661)Total tax charge – –
As�a�UK�REIT,�the�income�profits�of�the�Group’s�UK�property�rental�business�are�exempt�from�corporation�tax,�as�are�any�gains it makes from the disposal of its properties, provided they are not held for trading. The Group is otherwise subject to UK corporation tax at the prevailing rate.As�the�principal�company�of�the�REIT,�the�Company�is�required�to�distribute�at�least�90%�of�the�income�profits�of�the�Group’s�UK�property�rental�business.�There�are�a�number�of�other�conditions�that�are�also�required�to�be�met�by�the�Company and the Group to maintain REIT tax status. These conditions were met in the year and the Board intends to conduct the Group’s affairs such that these conditions continue to be met for the foreseeable future. Accordingly, deferred tax is no longer recognised on temporary differences relating to the property rental business.The Group is exempt from Guernsey taxation under the Income Tax (Exempt Bodies) (Guernsey) Ordinance, 1989.
10. Dividends2021
£0002020 £000
Declared and paid:Interim dividend for the period ended 31 March 2019: 0.875 pence – 4,712Interim dividend for the period ended 30 June 2019: 0.875 pence – 4,781Interim dividend for the period ended 30 September 2019: 0.875 pence – 4,773Interim dividend for the period ended 31 December 2019: 0.875 pence – 4,773Interim dividend for the period ended 31 March 2020: 0.625 pence 3,409 –Interim dividend for the period ended 30 June 2020: 0.625 pence 3,410 –Interim dividend for the period ended 30 September 2020: 0.7 pence 3,819 –Interim dividend for the period ended 31 December 2020: 0.8 pence 4,364 –
15,002 19,039
The interim dividend of 0.8 pence per ordinary share in respect of the period ended 31 March 2021 has not been recognised�as�a�liability�as�it�was�declared�after�the�year�end.�This�dividend�of�£4,364,000�will�be�paid�on�28�May�2021.
11. Earnings per shareBasic�and�diluted�earnings�per�share�is�calculated�by�dividing�the�net�profit�for�the�year�attributable�to�ordinary�shareholders of the Company by the weighted average number of ordinary shares in issue during the year, excluding the average�number�of�shares�held�by�the�Employee�Benefit�Trust�for�the�year.�The�diluted�number�of�shares�also�reflects�the�contingent shares to be issued under the Long-term Incentive Plan.The�following�reflects�the�profit�and�share�data�used�in�the�basic�and�diluted�profit�per�share�calculation:
2021 2020
Net�profit�attributable�to�ordinary�shareholders�of�the�Company� from�continuing�operations�(£000) 33,801 22,508Weighted�average�number�of�ordinary�shares�for�basic�profit�per�share 545,590,722 544,192,866Weighted�average�number�of�ordinary�shares�for�diluted�profit�per�share 546,793,381 546,227,914
Financial StatementsNotes to the consolidated financial statements continuedfor the year ended 31 March 2021

117
Strategic ReportG
overnanceFinancial Statem
entsAdditional Inform
ationPicton Property Incom
e Limited Annual Report 2021
Business Overview
12. Investments in subsidiariesThe Company had the following principal subsidiaries as at 31 March 2021 and 31 March 2020:
Name Place of incorporationOwnership proportion
Picton UK Real Estate Trust (Property) Limited Guernsey 100%Picton (UK) REIT (SPV) Limited Guernsey 100%Picton (UK) Listed Real Estate Guernsey 100%Picton UK Real Estate (Property) No 2 Limited Guernsey 100%Picton (UK) REIT (SPV No 2) Limited Guernsey 100%Picton Capital Limited England & Wales 100%Picton (General Partner) No 2 Limited Guernsey 100%Picton (General Partner) No 3 Limited Guernsey 100%Picton No 2 Limited Partnership England & Wales 100%Picton No 3 Limited Partnership England & Wales 100%Picton Financing UK Limited England & Wales 100%Picton Property No 3 Limited Guernsey 100%
The�results�of�the�above�entities�are�consolidated�within�the�Group�financial�statements.Picton�UK�Real�Estate�Trust�(Property)�Limited�and�Picton�(UK)�REIT�(SPV)�Limited�own�100%�of�the�units�in�Picton�(UK)�Listed�Real�Estate,�a�Guernsey�Unit�Trust�(the�‘GPUT’).�The�GPUT�holds�a�99.9%�interest�in�both�Picton�No�2�Limited�Partnership and Picton No 3 Limited Partnership, the remaining balances are held by Picton (General Partner) No 2 Limited and Picton (General Partner) No 3 Limited respectively.
13. Investment propertiesThe�following�table�provides�a�reconciliation�of�the�opening�and�closing�amounts�of�investment�properties�classified�as�Level 3 recorded at fair value.
2021 £000
2020 £000
Fair value at start of year 654,486 676,102Capital expenditure on investment properties 4,961 8,861Disposals (3,928) (33,073)Transfer to owner-occupied property (3,830) – Realised gains on disposal 868 3,478Unrealised movement on investment properties 12,861 (882)Fair value at the end of the year 665,418 654,486Historic cost at the end of the year 625,359 629,932
The fair value of investment properties reconciles to the appraised value as follows:2021
£0002020 £000
Appraised value 682,410 664,615Valuation of assets held under head leases 1,313 1,489Owner-occupied property (3,830) –Lease incentives held as debtors (14,475) (11,618)Fair value at the end of the year 665,418 654,486
The investment properties were valued by independent valuers, CBRE Limited, Chartered Surveyors, as at 31 March 2021 and 31 March 2020 on the basis of fair value in accordance with the version of the RICS Valuation – Global Standards (incorporating the International Valuation Standards) and the UK national supplement (the Red Book) current as at the valuation�date.�The�total�fees�earned�by�CBRE�Limited�from�the�Group�are�less�than�5%�of�their�total�UK�revenue.The�fair�value�of�the�Group’s�investment�properties�has�been�determined�using�an�income�capitalisation�technique,�whereby contracted and market rental values are capitalised with a market capitalisation rate. The resulting valuations are cross-checked�against�the�equivalent�yields�and�the�fair�market�values�per�square�foot�derived�from�comparable�market�transactions on an arm’s length basis.In�addition,�the�Group’s�investment�properties�are�valued�quarterly�by�CBRE�Limited.�The�valuations�are�based�on:
ӱ Information provided by the Group including rents, lease terms, revenue and capital expenditure. Such information is derived�from�the�Group’s�financial�and�property�systems�and�is�subject�to�the�Group’s�overall�control�environment.
ӱ Valuation models used by the valuers, including market-related assumptions are based on their professional judgement and market observation.

Picton Property Income Lim
ited Annual Report 2021
118
13. Investment properties continuedThe assumptions and valuation models used by the valuers, and supporting information, are reviewed by senior management and the Board through the Property Valuation Committee. Members of the Property Valuation Committee, together�with�senior�management,�meet�with�the�independent�valuer�on�a�quarterly�basis�to�review�the�valuations�and�underlying assumptions, including considering current market trends and conditions, and changes from previous quarters.�The�Board�will�also�consider�whether�circumstances�at�specific�investment�properties,�such�as�alternative�uses�and�issues�with�occupational�tenants,�are�appropriately�reflected�in�the�valuations.�The�fair�value�of�investment�properties�is measured based on each property’s highest and best use from a market participant’s perspective and considers the potential�uses�of�the�property�that�are�physically�possible,�legally�permissible�and�financially�feasible.The outbreak of Covid-19, declared by the World Health Organization as a ‘global pandemic’ on 11 March 2020, has had a significant�impact�on�many�aspects�of�daily�life�and�the�global�economy�–�with�some�real�estate�markets�having�experienced�lower�levels�of�transactional�activity�and�liquidity.�Travel�restrictions�are�in�place�and�lockdowns�have�been�applied both nationally and at a local level. Whilst restrictions are currently being eased in the UK, following the successful rollout of the vaccination programme local lockdowns may continue to be deployed as necessary and the emergence of significant�further�outbreaks�or�a�‘further�wave’�is�possible.The pandemic and the measures taken to tackle Covid-19 continue to affect economies and real estate markets globally. Nevertheless, as at the valuation date some property markets have started to function again, with transaction volumes and properties�on�the�market�returning�to�levels�where�in�general�an�adequate�quantum�of�market�evidence�exists�upon�which�to base opinions of value. Accordingly, and in contrast to the year ended 31 March 2020, the valuation is not reported as being�subject�to�‘material�valuation�uncertainty’�as�defined�by�VPS�3�and�VPGA�10�of�the�RICS�Valuation�–�Global�Standards.As at 31 March 2021 and 31 March 2020 all of the Group’s properties, including owner-occupied property, are Level 3 in the fair�value�hierarchy�as�it�involves�use�of�significant�judgement.�There�were�no�transfers�between�levels�during�the�year�and�the prior year. Level 3 inputs used in valuing the properties are those which are unobservable, as opposed to Level 1 (inputs from�quoted�prices)�and�Level�2�(observable�inputs�either�directly,�i.e.�as�prices,�or�indirectly,�i.e.�derived�from�prices).Information�on�these�significant�unobservable�inputs�per�sector�of�investment�properties�is�disclosed�as�follows:
2021 2020
Office IndustrialRetail and
Leisure Office IndustrialRetail and
Leisure
Appraised�value�(£000) 245,385 360,740 76,285 224,620 318,330 121,665Area�(sq�ft,�000s) 828 2,570 706 808 2,570 829Range of unobservable inputs:Gross ERV (sq ft per annum)– range £11.00 to
£78.05£3.75 to
£21.18£3.46 to
£29.65£11.00�to�£53.59
£3.54�to�£19.58
£3.46�to�£81.77
– weighted average £34.10 £10.39 £11.84 £27.92 £9.79 £32.13Net initial yield– range 0.00% to
7.98%2.79% to
7.63%3.07% to
29.58%0.00%�to�
7.59%–2.54%�to�
8.16%–0.18%�to�25.27%
– weighted average 4.35% 4.38% 7.64% 4.89% 4.63% 5.25%Reversionary yield– range 4.34% to
10.83%3.68% to
8.59%7.01% to 26.95%
5.47%�to�10.80%
4.46%�to�10.17%
4.36%�to�11.97%
– weighted average 7.02% 4.97% 7.95% 7.04% 5.40% 6.63%True equivalent yield– range 4.42% to
9.95%3.73% to
8.39%7.80% to
14.03%5.33%�to�9.80%
4.39%�to�9.65%
3.97%�to�11.95%
– weighted average 6.82% 5.02% 8.99% 6.97% 5.40% 7.17%
The�property�valuations�reflect�the�external�valuers’�assessment�of�the�impact�of�Covid-19�at�the�valuation�date.�An�increase/decrease in ERV will increase/decrease valuations, while an increase/decrease to yield decreases/increases valuations. We have reviewed the ranges used in assessing the impact of changes in unobservable inputs on the fair value of the Group’s property portfolio and concluded these were still reasonable. The table below sets out the sensitivity of the valuation to changes of 50 basis points in yield.Sector Movement 2021 Impact on valuation 2020 Impact on valuation
Industrial Increase of 50 basis points Decrease of £36.3m Decrease�of�£29.3mDecrease of 50 basis points Increase of £45.4m Increase�of�£36.1m
Office Increase of 50 basis points Decrease of £20.3m Decrease�of�£17.5mDecrease of 50 basis points Increase of £24.5m Increase�of�£20.5m
Retail and Leisure Increase of 50 basis points Decrease of £5.2m Decrease�of�£10.9mDecrease of 50 basis points Increase of £6.7m Increase�of�£13.9m
Financial StatementsNotes to the consolidated financial statements continuedfor the year ended 31 March 2021

119
Strategic ReportG
overnanceFinancial Statem
entsAdditional Inform
ationPicton Property Incom
e Limited Annual Report 2021
Business Overview
14. Property, plant and equipmentProperty,�plant�and�equipment�principally�comprises�the�fair�value�of�owner-occupied�property.�On�11�March�2021�the�Group moved to premises at one of its own buildings. The fair value of these premises is based on the appraised value at 31�March�2021�which�approximates�to�the�fair�value�at�11�March�2021.�Consequently�there�has�been�no�transfer�to�revaluation reserve for the year.
15. Accounts receivable2021
£0002020 £000
Tenant debtors (net of provisions for bad debts) 4,326 5,197Lease incentives 14,475 11,618Other debtors 783 786
19,584 17,601
The�estimated�fair�values�of�receivables�are�the�discounted�amount�of�the�estimated�future�cash�flows�expected�to�be�received and the approximate value of their carrying amounts.Amounts are considered impaired using the lifetime expected credit loss method. Movement in the balance considered to be impaired has been included in the Consolidated Statement of Comprehensive Income. As at 31 March 2021, tenant debtors�of�£1,874,000�(2020:�£1,676,000)�were�considered�impaired�and�provided�for.
16. Cash and cash equivalents2021
£0002020 £000
Cash at bank and in hand 23,353 23,564Short-term deposits 5 3
23,358 23,567
Cash�at�bank�and�in�hand�earns�interest�at�floating�rates�based�on�daily�bank�deposit�rates.�Short-term�deposits�are�made�for�varying�periods�of�between�one�day�and�one�month�depending�on�the�immediate�cash�requirements�of�the�Group,�and�earn interest at the respective short-term deposit rates. The carrying amounts of these assets approximate their fair value.
17. Accounts payable and accruals2021
£0002020 £000
Accruals 4,496 5,263Deferred rental income 7,596 7,817VAT liability 1,780 1,685Trade creditors 596 1,058Other creditors 4,337 3,615
18,805 19,438
18. Loans and borrowings
Maturity2021
£0002020 £000
CurrentAviva facility – 1,314 1,258Capitalised�finance�costs – (370) (370)
944 888
Non-currentCanada Life facility 24 July 2027 80,000 80,000Aviva facility 24 July 2032 84,894 86,207Capitalised�finance�costs – (2,183) (1,959)
162,711 164,248163,655 165,136

Picton Property Income Lim
ited Annual Report 2021
120
18. Loans and borrowings continuedThe�following�table�provides�a�reconciliation�of�the�movement�in�loans�and�borrowings�to�cash�flows�arising�from�financing�activities.
2021 £000
2020 £000
Balance as at 1 April 165,136 191,969
Changes from financing cash flowsProceeds from loans and borrowings – 6,000Repayment of loans and borrowings (1,258) (33,204)Financing costs paid (574) –
(1,832) (27,204)Other changesAmortisation�of�financing�costs 531 371Accrued�financing�costs (180) –
351 371Balance as at 31 March 163,655 165,136
The�Group�has�an�£80�million�term�loan�facility�with�Canada�Life�Limited�which�matures�in�July�2027.�Interest�is�fixed�at�4.08%�over�the�life�of�the�loan.�The�loan�agreement�has�a�loan�to�value�covenant�of�65%�and�an�interest�cover�test�of�1.75.�The loan is secured over the Group’s properties held by Picton No 2 Limited Partnership and Picton UK Real Estate Trust (Property)�No�2�Limited,�valued�at�£330.0�million�(2020:�£307.5�million).Additionally,�the�Group�has�a�£95.3�million�term�loan�facility�with�Aviva�Commercial�Finance�Limited�which�matures�in�July�2032. The loan is for a term of 20 years and was fully drawn on 24 July 2012 with approximately one-third repayable over the�life�of�the�loan�in�accordance�with�a�scheduled�amortisation�profile.�The�Group�has�repaid�£1.3�million�in�the�year�(2020:�£1.2�million).�Interest�on�the�loan�is�fixed�at�4.38%�over�the�life�of�the�loan.�The�facility�has�a�loan�to�value�covenant�of�65%�and�a�debt�service�cover�ratio�of�1.4.�The�facility�is�secured�over�the�Group’s�properties�held�by�Picton�No�3�Limited�Partnership�and�Picton�Property�No�3�Limited,�valued�at�£184.9�million�(2020:�£189.0�million).In�May�2020�the�Group�entered�into�a�new�£50�million�revolving�credit�facility�(‘RCF’)�with�National�Westminster�Bank�Plc;�this replaces the facilities held with Santander Corporate & Commercial Banking which have been cancelled. The new facility is for an initial term of three years with the option of two, one-year extensions. Currently undrawn, the RCF will incur interest at 150 basis points over LIBOR on drawn balances and an undrawn commitment fee of 60 basis points. The facility�is�secured�on�properties�held�by�Picton�UK�Real�Estate�Trust�(Property)�Limited,�valued�at�£131.7�million.The�fair�value�of�the�drawn�loan�facilities�at�31�March�2021,�estimated�as�the�present�value�of�future�cash�flows�discounted�at�the�market�rate�of�interest�at�that�date,�was�£187.2�million�(2020:�£197.0�million).�The�fair�value�of�the�secured�loan�facilities�is�classified�as�Level�2�under�the�hierarchy�of�fair�value�measurements.There were no transfers between levels of the fair value hierarchy during the current or prior years.The�weighted�average�interest�rate�on�the�Group’s�borrowings�as�at�31�March�2021�was�4.2%�(2020:�4.2%).
19. Contingencies and capital commitmentsThe Group has entered into contracts for the refurbishment of 11 properties with commitments outstanding at 31 March 2021�of�approximately�£6.7�million�(2020:�£4.5�million).�No�further�obligations�to�construct�or�develop�investment�property�or�for�repairs,�maintenance�or�enhancements�were�in�place�as�at�31�March�2021�(2020:�£nil).
20. Share capital and other reserves2021
£0002020 £000
Authorised:Unlimited number of ordinary shares of no par value – –
Issued and fully paid:547,605,596 ordinary shares of no par value (31 March 2020: 547,605,596) – –Share premium 164,400 164,400
The Company has 547,605,596 ordinary shares in issue of no par value (2020: 547,605,596).
Financial StatementsNotes to the consolidated financial statements continuedfor the year ended 31 March 2021

121
Strategic ReportG
overnanceFinancial Statem
entsAdditional Inform
ationPicton Property Incom
e Limited Annual Report 2021
Business Overview
On�21�June�2019�the�Company�raised�£7.1�million�through�the�issue�of�7,551,936�new�ordinary�share�of�no�par�value�at�94.5�pence per share. No new ordinary shares were issued during the year ended 31 March 2021.
2021 Number of shares
2020 Number of shares
Ordinary share capital 547,605,596 547,605,596Number�of�shares�held�in�Employee�Benefit�Trust (2,052,269) (2,103,683)Number of ordinary shares 545,553,327 545,501,913
The fair value of awards made under the Long-term Incentive Plan is recognised in other reserves.Subject�to�the�solvency�test�contained�in�the�Companies�(Guernsey)�Law,�2008�being�satisfied,�ordinary�shareholders�are�entitled to all dividends declared by the Company and to all of the Company’s assets after repayment of its borrowings and�ordinary�creditors.�The�Trustee�of�the�Company’s�Employee�Benefit�Trust�has�waived�its�right�to�receive�dividends�on�the 2,052,269 shares it holds but continues to hold the right to vote. Ordinary shareholders have the right to vote at meetings�of�the�Company.�All�ordinary�shares�carry�equal�voting�rights.The�Directors�have�authority�to�buy�back�up�to�14.99%�of�the�Company’s�ordinary�shares�in�issue,�subject�to�the�annual�renewal of the authority from shareholders. Any buy-back of ordinary shares will be made subject to Guernsey law, and the making and timing of any buy-backs will be at the absolute discretion of the Board.
21. Adjustment for non-cash movements in the cash flow statement2021
£0002020 £000
Profit�on�disposal�of�investment�properties (868) (3,478)Movement in investment property valuation (12,861) 882Share-based provisions 758 292Depreciation of tangible assets 7 9
(12,964) (2,295)
22. Obligations under leasesThe�Group�has�entered�into�a�number�of�head�leases�in�relation�to�its�investment�properties.�These�leases�are�for�fixed�terms and subject to regular rent reviews. They contain no material provisions for contingent rents, renewal or purchase options nor any restrictions outside of the normal lease terms.Lease liabilities in respect of rents payable on leasehold properties were payable as follows:
2021 £000
2020 £000
Future minimum payments due:Within one year 116 117In�the�second�to�fifth�years�inclusive 466 466After�five�years 7,150 7,266
7,732 7,849Less:�finance�charges�allocated�to�future�periods (5,918) (6,032)Present value of minimum lease payments 1,814 1,817
The present value of minimum lease payments is analysed as follows:2021
£0002020 £000
CurrentWithin one year 107 108
107 108
Non-currentIn�the�second�to�fifth�years�inclusive 379 388After�five�years 1,328 1,321
1,707 1,7091,814 1,817

Picton Property Income Lim
ited Annual Report 2021
122
22. Obligations under leases continuedOperating leases where the Group is lessorThe Group leases its investment properties under commercial property leases which are held as operating leases.At the reporting date, the Group’s future income based on the unexpired lease length was as follows (based on annual rentals):
2021 £000
2020 £000
Within one year 37,744 38,296One to two years 33,954 35,665Two to three years 32,008 32,356Three to four years 27,937 30,342Four�to�five�years 23,235 26,322After�five�years 91,294 111,711
246,172 274,692
These properties are measured under the fair value model as the properties are held to earn rentals. Commercial property leases�typically�have�lease�terms�between�five�and�ten�years�and�include�clauses�to�enable�periodic�upward�revision�of�the rental�charge�according�to�prevailing�market�conditions.�Some�leases�contain�options�to�break�before�the�end�of�the�lease term.
23. Net asset valueThe net asset value per share calculation uses the number of shares in issue at the year-end and excludes the actual number�of�shares�held�by�the�Employee�Benefit�Trust�at�the�year-end;�see�Note�20.
24. Financial instrumentsThe�Group’s�financial�instruments�comprise�cash�and�cash�equivalents,�accounts�receivable,�secured�loans,�obligations�under head leases and accounts payable that arise from its operations. The Group does not have exposure to any derivative�financial�instruments.�Apart�from�the�secured�loans,�as�disclosed�in�Note�18,�the�fair�value�of�the�financial�assets�and�liabilities�is�not�materially�different�from�their�carrying�value�in�the�financial�statements.Categories of financial instruments
31 March 2021 Note
Held at fair value
through profit or
loss £000
Financial assets and
liabilities at amortised
cost £000
Total £000
Financial assetsDebtors 15 – 5,109 5,109Cash�and�cash�equivalents 16 – 23,358 23,358
– 28,467 28,467
Financial liabilitiesLoans and borrowings 18 – 163,655 163,655Obligations under head leases 22 – 1,814 1,814Creditors and accruals 17 – 9,429 9,429
– 174,898 174,898
Financial StatementsNotes to the consolidated financial statements continuedfor the year ended 31 March 2021

123
Strategic ReportG
overnanceFinancial Statem
entsAdditional Inform
ationPicton Property Incom
e Limited Annual Report 2021
Business Overview
31 March 2020 Note
Held at fair value through
profit�or�loss�£000
Financial assets and liabilities at amortised
cost £000
Total £000
Financial assetsDebtors 15 – 5,983 5,983Cash�and�cash�equivalents 16 – 23,567 23,567
– 29,550 29,550
Financial liabilitiesLoans and borrowings 18 – 165,136 165,136Obligations under head leases 22 – 1,817 1,817Creditors and accruals 17 – 9,936 9,936
– 176,889 176,889
25. Risk managementThe Group invests in commercial properties in the United Kingdom. The following describes the risks involved and the risk management framework applied by the Group. Senior management reports regularly both verbally and formally to the Board, and its relevant committees, to allow them to monitor and review all the risks noted below.Capital risk managementThe Group aims to manage its capital to ensure that the entities in the Group will be able to continue as a going concern while maximising the return to stakeholders through optimising its capital structure. The Board’s policy is to maintain a strong�capital�base�so�as�to�maintain�investor,�creditor�and�market�confidence�and�to�sustain�future�development�of�the business.The�capital�structure�of�the�Group�consists�of�debt,�as�disclosed�in�Note�18,�cash�and�cash�equivalents�and�equity�attributable�to�equity�holders�of�the�Company,�comprising�issued�capital,�reserves�and�retained�earnings.�The�Group�is not subject�to�any�external�capital�requirements.The Group monitors capital on the basis of its gearing ratio. This ratio is calculated as the principal borrowings outstanding,�as�detailed�under�Note�18,�divided�by�the�gross�assets.�There�is�a�limit�of�65%�as�set�out�in�the�Articles�of�Association of the Company. Gross assets are calculated as non-current and current assets, as shown in the Consolidated Balance Sheet.At the reporting date the gearing ratios were as follows:
2021 £000
2020 £000
Total borrowings 166,208 167,465Gross assets 712,471 695,674Gearing ratio (must not exceed 65%) 23.3% 24.1%
The Board of Directors monitors the return on capital as well as the level of dividends to ordinary shareholders. The Group has managed its capital risk by entering into long-term loan arrangements which will enable the Group to manage its borrowings in an orderly manner over the long-term. The Group also has a revolving credit facility which provides greater flexibility�in�managing�the�level�of�borrowings.The�Group’s�net�debt�to�equity�ratio�at�the�reporting�date�was�as�follows:
2021 £000
2020 £000
Total liabilities 184,274 186,391Less:�cash�and�cash�equivalents (23,358) (23,567)Net debt 160,916 162,824Total equity 528,197 509,283Net debt to equity ratio at end of year 0.30 0.32

Picton Property Income Lim
ited Annual Report 2021
124
25. Risk management continuedCredit riskThe following tables detail the balances held at the reporting date that may be affected by credit risk:
31 March 2021 Note
Held at fair value
through profit or
loss £000
Financial assets and
liabilities at amortised
cost £000
Total £000
Financial assetsTenant debtors 15 – 4,326 4,326Cash�and�cash�equivalents 16 – 23,358 23,358
– 27,684 27,684
31 March 2020 Note
Held at fair value through
profit�or�loss�£000
Financial assets and liabilities at amortised
cost £000
Total £000
Financial assetsTenant debtors 15 – 5,197 5,197Cash�and�cash�equivalents 16 – 23,567 23,567
– 28,764 28,764
Credit�risk�refers�to�the�risk�that�a�counterparty�will�default�on�its�contractual�obligations�resulting�in�financial�loss�to�the�Group.�The�Group�has�adopted�a�policy�of�only�dealing�with�creditworthy�counterparties�and�obtaining�sufficient�collateral�where�appropriate,�as�a�means�of�mitigating�the�risk�of�financial�loss�from�defaults.�The�Group’s�exposure�and�credit�ratings of its counterparties are continuously monitored and the aggregate value of transactions concluded is spread amongst approved counterparties. Tenant debtors consist of a large number of occupiers, spread across diverse industries and geographical areas. Ongoing credit�evaluations�are�performed�on�the�financial�condition�of�tenant�debtors�and,�where�appropriate,�credit�guarantees,�or�rent�deposits�are�acquired.�Rent�collection�is�outsourced�to�managing�agents�who�report�regularly�on�payment�performance�and�provide�the�Group�with�intelligence�on�the�continuing�financial�viability�of�occupiers.�The�Group�does�not�have�any�significant�credit�risk�exposure�to�any�single�counterparty�or�any�group�of�counterparties�having�similar�characteristics.�The credit�risk�on�liquid�funds�is�limited�because�the�counterparties�are�banks�with�high�credit�ratings�assigned by international credit rating agencies.The�carrying�amount�of�financial�assets�recorded�in�the�financial�statements,�net�of�any�allowances�for�losses,�represents�the Group’s maximum exposure to credit risk. The Board continues to monitor the Group’s overall exposure to credit risk.The Group has a panel of banks with which it makes deposits, based on credit ratings with set counterparty limits that are reviewed regularly. The Group’s main cash balances are held with National Westminster Bank plc (‘NatWest’), Santander plc (‘Santander’), Nationwide International Limited (‘Nationwide’) and The Royal Bank of Scotland plc (‘RBS’). Insolvency or resolution of the bank holding cash balances may cause the Group’s recovery of cash held by them to be delayed or limited.�The�Group�manages�its�risk�by�monitoring�the�credit�quality�of�its�bankers�on�an�ongoing�basis.�NatWest,�Santander,�Nationwide�and�RBS�are�rated�by�all�the�major�rating�agencies.�If�the�credit�quality�of�these�banks�deteriorates,�the Group would look to move the short-term deposits or cash to another bank. Procedures exist to ensure that cash balances are split between banks to minimise exposure. At 31 March 2021 and at 31 March 2020 Standard & Poor’s short-term credit rating for the Group’s bankers was A-1.There has been no change in the fair values of cash or receivables as a result of changes in credit risk in the current or prior periods, due to the actions taken to mitigate this risk, as stated above.
Liquidity riskUltimate�responsibility�for�liquidity�risk�management�rests�with�the�Board,�which�has�built�an�appropriate�liquidity�risk�management�framework�for�the�management�of�the�Group’s�short,�medium�and�long-term�funding�and�liquidity�management�requirements.�The�Group’s�liquidity�risk�is�managed�on�an�ongoing�basis�by�senior�management�and�monitored�on�a�quarterly�basis�by�the�Board�by�maintaining�adequate�reserves�and�loan�facilities,�continuously�monitoring�forecasts�and�actual�cash�flows�and�matching�the�maturity�profiles�of�financial�assets�and�liabilities�for�a period�of�at�least�12�months.The�table�below�has�been�drawn�up�based�on�the�undiscounted�contractual�maturities�of�the�financial�assets/(liabilities),�including interest that will accrue to maturity.
Financial StatementsNotes to the consolidated financial statements continuedfor the year ended 31 March 2021
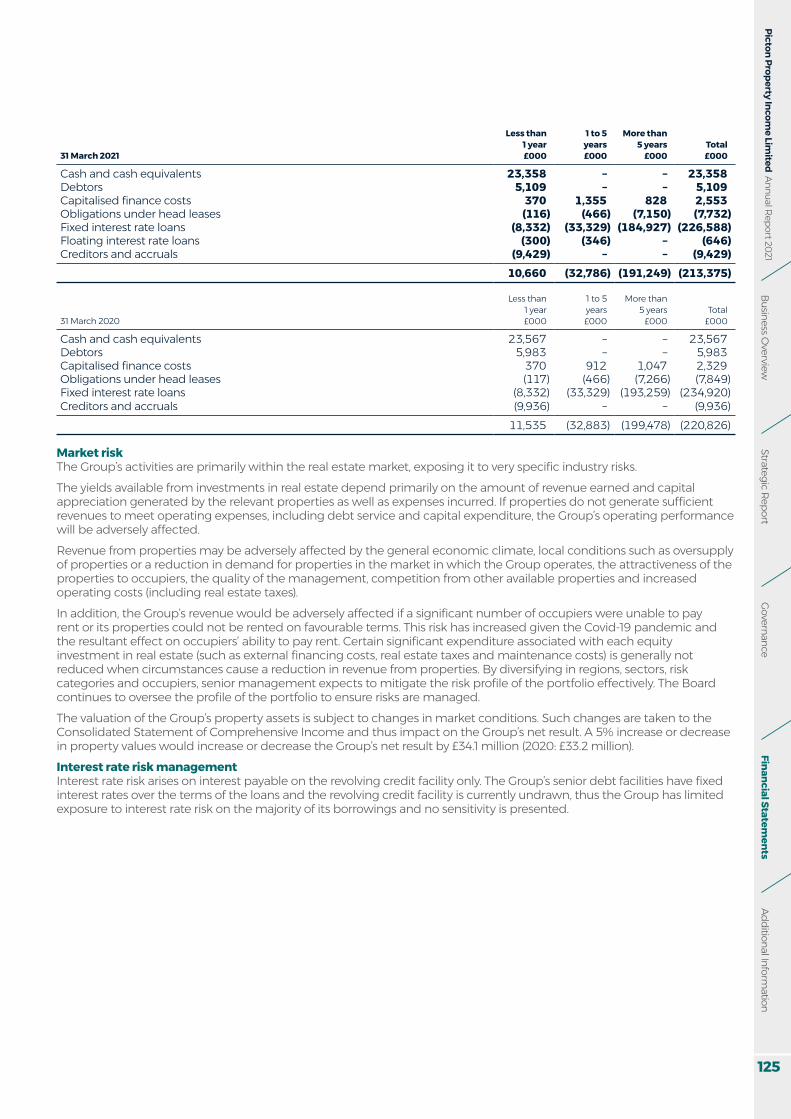
125
Strategic ReportG
overnanceFinancial Statem
entsAdditional Inform
ationPicton Property Incom
e Limited Annual Report 2021
Business Overview
31 March 2021
Less than 1 year £000
1 to 5 years £000
More than 5 years
£000Total £000
Cash�and�cash�equivalents 23,358 – – 23,358Debtors 5,109 – – 5,109Capitalised�finance�costs 370 1,355 828 2,553Obligations under head leases (116) (466) (7,150) (7,732)Fixed interest rate loans (8,332) (33,329) (184,927) (226,588)Floating interest rate loans (300) (346) – (646)Creditors and accruals (9,429) – – (9,429)
10,660 (32,786) (191,249) (213,375)
31 March 2020
Less than 1 year £000
1 to 5 years £000
More than 5 years £000
Total £000
Cash�and�cash�equivalents 23,567 – – 23,567Debtors 5,983 – – 5,983Capitalised�finance�costs 370 912 1,047 2,329Obligations under head leases (117) (466) (7,266) (7,849)Fixed interest rate loans (8,332) (33,329) (193,259) (234,920)Creditors and accruals (9,936) – – (9,936)
11,535 (32,883) (199,478) (220,826)
Market riskThe�Group’s�activities�are�primarily�within�the�real�estate�market,�exposing�it�to�very�specific�industry�risks.The yields available from investments in real estate depend primarily on the amount of revenue earned and capital appreciation�generated�by�the�relevant�properties�as�well�as�expenses�incurred.�If�properties�do�not�generate�sufficient�revenues to meet operating expenses, including debt service and capital expenditure, the Group’s operating performance will be adversely affected.Revenue from properties may be adversely affected by the general economic climate, local conditions such as oversupply of properties or a reduction in demand for properties in the market in which the Group operates, the attractiveness of the properties�to�occupiers,�the�quality�of�the�management,�competition�from�other�available�properties�and�increased�operating costs (including real estate taxes).In�addition,�the�Group’s�revenue�would�be�adversely�affected�if�a�significant�number�of�occupiers�were�unable�to�pay�rent or�its�properties�could�not�be�rented�on�favourable�terms.�This�risk�has�increased�given�the�Covid-19�pandemic�and�the�resultant�effect�on�occupiers’�ability�to�pay�rent.�Certain�significant�expenditure�associated�with�each�equity�investment�in real�estate�(such�as�external�financing�costs,�real�estate�taxes�and�maintenance�costs)�is�generally�not�reduced when circumstances cause a reduction in revenue from properties. By diversifying in regions, sectors, risk categories�and�occupiers,�senior�management�expects�to�mitigate�the�risk�profile�of�the�portfolio�effectively.�The�Board�continues�to�oversee�the�profile of�the�portfolio�to�ensure�risks�are�managed.The valuation of the Group’s property assets is subject to changes in market conditions. Such changes are taken to the Consolidated�Statement�of�Comprehensive�Income�and�thus�impact�on�the�Group’s�net�result.�A�5%�increase�or�decrease�in�property�values�would�increase�or�decrease�the�Group’s�net�result�by�£34.1�million�(2020:�£33.2�million).Interest rate risk managementInterest�rate�risk�arises�on�interest�payable�on�the�revolving�credit�facility�only.�The�Group’s�senior�debt�facilities�have�fixed�interest rates over the terms of the loans and the revolving credit facility is currently undrawn, thus the Group has limited exposure to interest rate risk on the majority of its borrowings and no sensitivity is presented.

Picton Property Income Lim
ited Annual Report 2021
126
25. Risk management continuedInterest rate riskThe�following�table�sets�out�the�carrying�amount,�by�maturity,�of�the�Group’s�financial�assets/(liabilities).
31 March 2021
Less than 1 year £000
1 to 5 years £000
More than 5 years
£000Total £000
FloatingCash�and�cash�equivalents 23,358 – – 23,358
FixedSecured loan facilities (1,314) (5,867) (159,027) (166,208)Obligations under leases (107) (379) (1,328) (1,814)
21,937 (6,246) (160,355) (144,664)
31 March 2020
Less than 1 year £000
1 to 5 years £000
More than 5 years £000
Total £000
FloatingCash�and�cash�equivalents 23,567 – – 23,567
FixedSecured loan facilities (1,258) (5,616) (160,591) (167,465)Obligations under leases (108) (388) (1,321) (1,817)
22,201 (6,004) (161,912) (145,715)
Concentration riskAs discussed above, all of the Group’s investments are in the UK and therefore it is exposed to macroeconomic changes in the UK economy. Furthermore, the Group has around 350 occupiers so does not place reliance on a limited number of occupiers�for�its�rental�income,�with�the�single�largest�occupier�accounting�for�5.0%�of�the�Group’s�annual�contracted�rental income.Currency riskThe Group has no exposure to foreign currency risk.
26. Related party transactionsThe�total�fees�earned�during�the�year�by�the�Non-Executive�Directors�of�the�Company�amounted�to�£250,000�(2020:�£250,000).�As�at�31�March�2021�the�Group�owed�£nil�to�the�Non-Executive�Directors�(2020:�£nil).�The�emoluments�of�the�Executive Directors are set out in the Remuneration Report.Picton Property Income Limited has no controlling parties.
27. Events after the balance sheet dateA�dividend�of�£4,364,000�(0.8�pence�per�share)�was�approved�by�the�Board�on�29�April�2021�and�was�paid�on�28�May�2021.The revolving credit facility held with National Westminster Bank Plc has been extended by a further 12 months to May 2024.
Financial StatementsNotes to the consolidated financial statements continuedfor the year ended 31 March 2021

127
Strategic ReportG
overnanceFinancial Statem
entsA
dditional Information
Picton Property Income Lim
ited Annual Report 2021Business O
verviewAdditional InformationSupplementary disclosures (unaudited) for the year ended 31 March 2021
The European Public Real Estate Association (EPRA) is the industry body representing listed companies in the real estate sector. EPRA publishes Best Practices Recommendations (BPR) to establish consistent reporting by European property companies. Further information on the EPRA BPR can be found at www.epra.com.As at 31 March 2021 Picton has adopted the new EPRA net asset value (NAV) metrics: net reinvestment value (NRV); net tangible�assets�(NTA);�and�net�disposal�value�(NDV).�NAV�metrics�for�the�comparative�periods�have�also�been�recalculated on the new basis to further aid comparison. The EPRA NAV set of metrics makes adjustments to the NAV per the�IFRS�financial�statements�to�provide�stakeholders�with�the�most�relevant�information�on�the�fair�value�of�the�assets�and liabilities of a REIT under different scenarios. EPRA NTA is regarded as the most relevant metric for the business as this focuses�on�reflecting�a�company’s�tangible�assets.
EPRA earnings per share EPRA earnings represents the earnings from core operational activities, excluding investment property revaluations and gains/losses on asset disposals. It demonstrates the extent to which dividend payments are underpinned by recurring operational activities.
2021 £000
2020 £000
2019 £000
Profit�for�the�year�after�taxation 33,801 22,508 30,955Exclude:Investment property valuation movement (12,861) 882 (10,909)Gains on disposal of investment properties (868) (3,478) (379)Debt prepayment fees – – 3,245EPRA earnings 20,072 19,912 22,912Weighted average number of shares in issue (000s) 545,591 544,193 538,816EPRA earnings per share 3.7p 3.7p 4.3p
EPRA NRV per share The EPRA net reinstatement value measure highlights the value of net assets on a long-term basis. Assets and liabilities that�are�not�expected�to�crystallise�in�normal�circumstances�such�as�the�fair�value�of�financial�derivatives�and�deferred�taxes�on�property�valuation�surpluses�are�therefore�excluded.�Since�the�aim�of�the�metric�is�to�also�reflect�what�would�be�needed�to�recreate�the�Company�through�the�investment�market�based�on�its�current�capital�and�financing�structure,�related costs such as real estate transfer taxes should be included.
2021 £000
2020 £000
2019 £000
Balance Sheet net assets 528,197 509,283 499,415Purchasers’ costs 46,029 44,847 46,771Fair value of debt – – –Deferred tax – – –EPRA NRV 574,226 554,130 546,186Shares in issue (000s) 545,553 545,502 538,512EPRA NRV per share 105p 102p 101p
EPRA NTA per share The EPRA net tangible assets calculation assumes entities buy and sell assets, thereby crystallising certain levels of deferred tax liability.
2021 £000
2020 £000
2019 £000
Balance Sheet net assets 528,197 509,283 499,415Fair�value�of�financial�instruments – – –Deferred tax – – –EPRA NTA 528,197 509,283 499,415Shares in issue (000s) 545,553 545,502 538,512EPRA NTA per share 97p 93p 93p
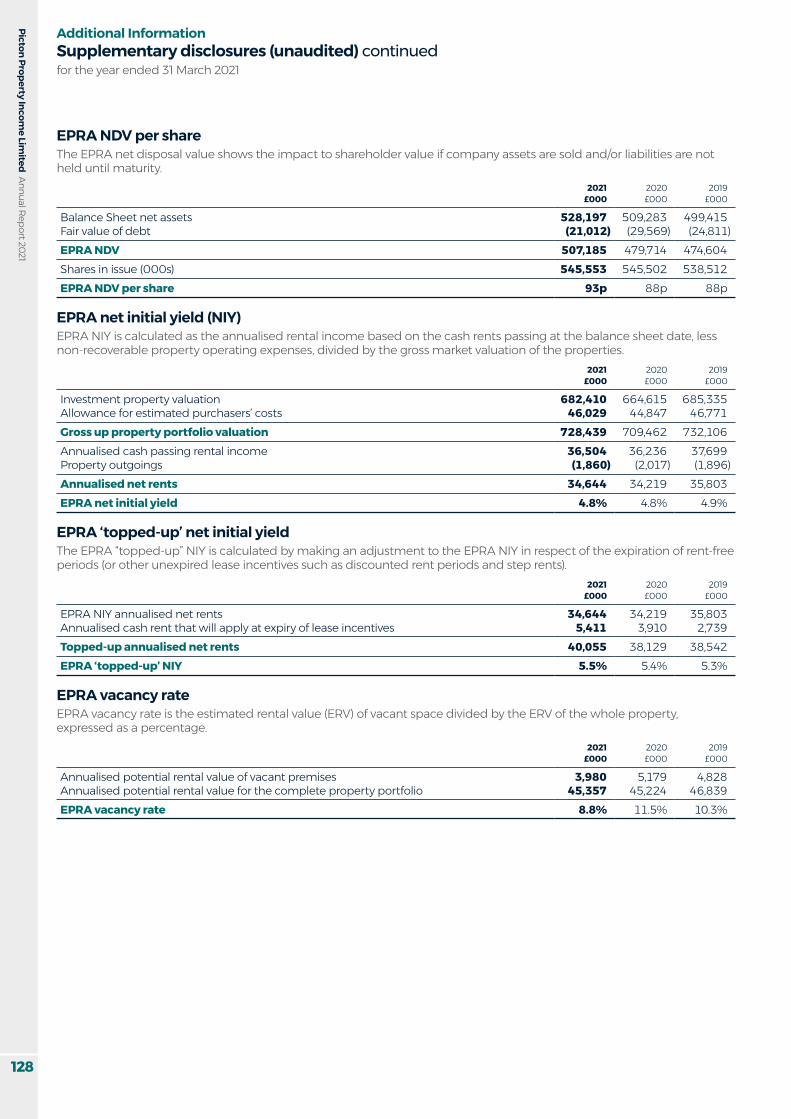
Picton Property Income Lim
ited Annual Report 2021
128
Additional InformationSupplementary disclosures (unaudited) continuedfor the year ended 31 March 2021
EPRA NDV per share The EPRA net disposal value shows the impact to shareholder value if company assets are sold and/or liabilities are not held until maturity.
2021 £000
2020 £000
2019 £000
Balance Sheet net assets 528,197 509,283 499,415Fair value of debt (21,012) (29,569) (24,811)EPRA NDV 507,185 479,714 474,604Shares in issue (000s) 545,553 545,502 538,512EPRA NDV per share 93p 88p 88p
EPRA net initial yield (NIY) EPRA NIY is calculated as the annualised rental income based on the cash rents passing at the balance sheet date, less non-recoverable property operating expenses, divided by the gross market valuation of the properties.
2021 £000
2020 £000
2019 £000
Investment property valuation 682,410 664,615 685,335Allowance for estimated purchasers’ costs 46,029 44,847 46,771Gross up property portfolio valuation 728,439 709,462 732,106Annualised cash passing rental income 36,504 36,236 37,699Property outgoings (1,860) (2,017) (1,896)Annualised net rents 34,644 34,219 35,803EPRA net initial yield 4.8% 4.8% 4.9%
EPRA ‘topped-up’ net initial yield The EPRA “topped-up” NIY is calculated by making an adjustment to the EPRA NIY in respect of the expiration of rent-free periods (or other unexpired lease incentives such as discounted rent periods and step rents).
2021 £000
2020 £000
2019 £000
EPRA NIY annualised net rents 34,644 34,219 35,803Annualised cash rent that will apply at expiry of lease incentives 5,411 3,910 2,739Topped-up annualised net rents 40,055 38,129 38,542EPRA ‘topped-up’ NIY 5.5% 5.4% 5.3%
EPRA vacancy rate EPRA vacancy rate is the estimated rental value (ERV) of vacant space divided by the ERV of the whole property, expressed as a percentage.
2021 £000
2020 £000
2019 £000
Annualised potential rental value of vacant premises 3,980 5,179 4,828Annualised potential rental value for the complete property portfolio 45,357 45,224 46,839EPRA vacancy rate 8.8% 11.5% 10.3%

129
Strategic ReportG
overnanceFinancial Statem
entsA
dditional Information
Picton Property Income Lim
ited Annual Report 2021Business O
verview
EPRA cost ratio EPRA�cost�ratio�reflects�the�overheads�and�operating�costs�as�a�percentage�of�the�gross�rental�income.
2021 £000
2020 £000
2019 £000
Property operating costs 2,384 2,293 2,342Property void costs 2,199 3,005 1,373Administrative expenses 5,388 5,563 5,842Less:Ground rent costs (207) (259) (256)EPRA costs (including direct vacancy costs) 9,764 10,602 9,301Property void costs (2,199) (3,005) (1,373)EPRA costs (excluding direct vacancy costs) 7,565 7,597 7,928Gross rental income 36,558 37,780 40,942Less ground rent costs (207) (259) (256)Gross rental income 36,351 37,521 40,686EPRA cost ratio (including direct vacancy costs) 26.9% 28.3% 22.9%EPRA cost ratio (excluding direct vacancy costs) 20.8% 20.2% 19.5%
Capital expenditureThe�table�below�sets�out�the�capital�expenditure�incurred�over�the�financial�year,�in�accordance�with�EPRA�Best�Practices�Recommendations.
2021 £000
2020 £000
Acquisitions – –Development – –Like-for-like portfolio 4,961 8,861Other – –Total capital expenditure 4,961 8,861
Like-for-like rental growthThe table below sets out the like-for-like rental growth of the portfolio, by sector, in accordance with EPRA Best Practices Recommendations.
Offices Industrial Retail and Leisure Total
2021 £000
2020 £000
2021 £000
2020 £000
2021 £000
2020 £000
2021 £000
2020 £000
Like-for-like rental income 13,720 12,894 16,254 15,738 6,303 7,589 36,277 36,221Properties�acquired – – – – – – – –Properties sold (1) 534 – 625 282 400 281 1,559
13,719 13,428 16,254 16,363 6,585 7,989 36,558 37,780

Picton Property Income Lim
ited Annual Report 2021
130
Loan to valueThe loan to value (LTV) is calculated by taking the Group’s total borrowings, net of cash, as a percentage of the total portfolio value.
2021 £000
2020 £000
2019 £000
Total borrowings 166,207 167,465 194,669Less:Cash�and�cash�equivalents (23,358) (23,567) (25,168)Total net borrowings 142,849 143,898 169,501Investment property valuation 682,410 664,615 685,335Loan to value 20.9% 21.7% 24.7%
Cost ratioThe cost ratio is based on historical information and provides shareholders with an indication of the likely level of cost of managing the Group. The cost ratio uses the annual recurring administrative expenses as a percentage of the average net asset value over the period.
2021 £000
2020 £000
2019 £000
Administrative expenses 5,388 5,563 5,842Less:REIT conversion and restructuring costs – – (215)Recurring administrative expenses 5,388 5,563 5,627Average net asset value over the year 514,574 511,868 497,304Cost ratio 1.0% 1.1% 1.1%
Additional InformationSupplementary disclosures (unaudited) continuedfor the year ended 31 March 2021

131
Strategic ReportG
overnanceFinancial Statem
entsA
dditional Information
Picton Property Income Lim
ited Annual Report 2021Business O
verviewAdditional Information Property portfolio
Properties valued in excess of £60 million ӱ Parkbury Industrial Estate, Radlett, Herts.
Properties valued between £50 million and £60 million ӱ River Way Industrial Estate, River Way, Harlow, Essex
Properties valued between £30 million and £40 million ӱ Angel Gate, City Road, London EC1 ӱ Stanford Building, Long Acre, London WC2
Properties valued between £20 million and £30 million ӱ Datapoint, Cody Road, London E16 ӱ Tower Wharf, Cheese Lane, Bristol ӱ Express Business Park, Shipton Way, Rushden,
Northants. ӱ 50 Farringdon Road, London EC1 ӱ Lyon Business Park, Barking, Essex ӱ Colchester Business Park, The Crescent, Colchester,
Essex ӱ 30 & 50 Pembroke Court, Chatham, Kent
Properties valued between £10 million and £20 million ӱ Sundon Business Park, Dencora Way, Luton, Beds. ӱ Metro, Salford Quays, Manchester ӱ Grantham Book Services, Trent Road, Grantham, Lincs. ӱ The Business Centre, Molly Millars Lane, Wokingham,
Berks. ӱ Nonsuch Industrial Estate, Kiln Lane, Epsom, Surrey ӱ 180 West George Street, Glasgow ӱ 401 Grafton Gate East, Milton Keynes, Bucks. ӱ Vigo 250, Birtley Road, Washington, Tyne and Wear ӱ B&Q,�Queens�Road,�Sheffield ӱ Parc Tawe North Retail Park, Link Road, Swansea ӱ Gloucester Retail Park, Eastern Avenue, Gloucester
Properties valued between £5 million and £10 million ӱ Easter Court, Europa Boulevard, Warrington ӱ Units 1 & 2, Kettlestring Lane, York ӱ Swiftbox, Haynes Way, Rugby, Warwickshire ӱ Units 1 & 2, Western Industrial Estate, Downmill Road,
Bracknell, Berks. ӱ Trident House, Victoria Street, St Albans, Herts. ӱ Queens House, St Vincent Place, Glasgow ӱ Angouleme Retail Park, George Street, Bury, Greater
Manchester ӱ Atlas House, Third Avenue, Marlow, Bucks. ӱ Thistle Express, The Mall, Luton, Beds. ӱ Longcross, Newport Road, Cardiff ӱ Sentinel House, Harvest Crescent, Fleet, Hants.
Properties valued under £5 million ӱ Regency Wharf, Broad Street, Birmingham ӱ Crown & Mitre Complex, English Street, Carlisle,
Cumbria ӱ Scots Corner, High Street, Kings Heath, Birmingham ӱ Waterside House, Kirkstall Road, Leeds ӱ 53-57 Broadmead, Bristol ӱ Abbey Business Park, Mill Road, Newtownabbey, Belfast ӱ 78-80 Briggate, Leeds ӱ 17-19 Fishergate, Preston, Lancs. ӱ Magnet Trade Centre, 6 Kingstreet Lane, Winnersh,
Reading ӱ 72-78 Murraygate, Dundee ӱ 7-9 Warren Street, Stockport ӱ 6-12 Parliament Row, Hanley, Staffs. ӱ 18-28�Victoria�Lane,�Huddersfield,�West�Yorks.

Picton Property Income Lim
ited Annual Report 2021
132
Additional InformationFive year financial summary
2021 2020 2019 2018 2017
Income statementsNet property income 33.5 33.6 38.3 38.5 42.3Administrative expenses (5.4) (5.6) (5.6) (5.3) (5.0)Exceptional costs – – (0.2) (0.3) (0.2)
28.1 28.0 32.5 32.9 37.1Net�finance�costs (8.0) (8.2) (9.1) (9.7) (10.8)
Income profit before tax 20.1 19.8 23.4 23.2 26.3Tax – 0.1 (0.5) (0.5) (0.5)
Income profit 20.1 19.9 22.9 22.7 25.8Property gains and losses 13.7 2.6 11.3 41.5 17.0Debt prepayment fee – – (3.2) – –
Profit/loss after tax 33.8 22.5 31.0 64.2 42.8Dividends paid 15.0 19.0 18.9 18.5 18.0
2021 2020 2019 2018 2017
Balance sheetsInvestment properties 665.4 654.5 676.1 670.7 615.2Borrowings (166.2) (167.5) (194.7) (214.0) (204.6)Other assets and liabilities 29.0 22.3 18.0 30.7 31.3
Net assets 528.2 509.3 499.4 487.4 441.9
Net asset value per share (pence) 97 93 93 90 82EPRA net tangible asset per share (pence) 97 93 93 90 82Earnings per share (pence) 6.2 4.1 5.7 11.9 7.9Dividends per share (pence) 2.8 3.5 3.5 3.4 3.3Dividend�cover�(%) 134 105 122 122 144Share price (pence) 85.8 89.0 89.2 84.3 83.8
All�figures�are�in�£�million�unless�otherwise�stated

133
Strategic ReportG
overnanceFinancial Statem
entsA
dditional Information
Picton Property Income Lim
ited Annual Report 2021Business O
verviewAdditional Information Glossary
Annual rental income Cash rents passing at the Balance Sheet date.Contracted rent The contracted gross rent receivable which becomes payable after all the occupier incentives in
the letting have expired.Cost ratio Total operating expenses, excluding one-off costs, as a percentage of the average net asset
value over the period.DTR Disclosure and Transparency Rules, issued by the United Kingdom Listing Authority.Dividend cover EPRA earnings divided by dividends paid.Earnings per share (EPS) Profit�for�the�period�attributable�to�equity�shareholders�divided�by�the�average�number�of�
shares in issue during the period.EPC Energy�performance�certificate.EPRA European Public Real Estate Association, the industry body representing listed companies in
the real estate sector.Estimated rental value (ERV) The external valuers’ opinion as to the open market rent which, on the date of the valuation,
could reasonably be expected to be obtained on a new letting or rent review of a property.Fair value The estimated amount for which a property should exchange on the valuation date between a
willing buyer and a willing seller in an arm’s length transaction after the proper marketing and where parties had each acted knowledgeably, prudently and without compulsion.
Fair value movement An accounting adjustment to change the book value of an asset or liability to its fair value.FRI lease A lease which imposes full repairing and insuring obligations on the tenant, relieving the
landlord from all liability for the cost of insurance and repairs.Group Picton Property Income Limited and its subsidiaries.IASB International Accounting Standards Board.IFRS International Financial Reporting Standards.Initial yield Annual cash rents receivable (net of head rents and the cost of vacancy), as a percentage of
gross property value, as provided by the Group’s external valuers. Rents receivable following the expiry of rent-free periods are not included.
Lease incentives Incentives offered to occupiers to enter into a lease. Typically this will be an initial rent-free period,�or�a�cash�contribution�to�fit-out.�Under�accounting�rules�the�value�of�the�lease�incentives�is amortised through the Income Statement on a straight-line basis until the lease expiry.
MSCI An organisation supplying independent market indices and portfolio benchmarks to the property industry.
NAV Net�asset�value�is�the�equity�attributable�to�shareholders�calculated�under�IFRS.Over-rented Space where the passing rent is above the ERV.Property income return The ungeared income return of the portfolio as calculated by MSCI.Reversionary yield The estimated rental value as a percentage of the gross property value.TCFD Task Force on Climate-related Financial Disclosures.Total property return Combined income and capital return from the property portfolio.Total return The change in the Group’s net asset value, in accordance with IFRS, plus dividends paid.Total shareholder return Measures the change in share price over the year plus dividends paid.Weighted average debt maturity
Each tranche of Group debt is multiplied by the remaining period to its maturity and the result is divided by total Group debt in issue at the period end.
Weighted average interest rate
The Group loan interest per annum at the period end, divided by total Group debt in issue at the period end.
Weighted average lease term
The�average�lease�term�remaining�to�first�break,�or�expiry,�across�the�portfolio�weighted�by�contracted rental income.

Picton Property Income Lim
ited Annual Report 2021
134
Additional Information Financial calendar
Annual results announced 27 May 2021Annual results posted to shareholders June 2021June 2021 NAV announcement July 2021 (provisional)Annual General Meeting November 2021 (provisional)2021 half-year results to be announced November 2021 (provisional)December 2021 NAV announcement January 2022 (provisional)Dividend payment dates August/November/February/May
135
Strategic ReportG
overnanceFinancial Statem
entsA
dditional Information
Picton Property Income Lim
ited Annual Report 2021Business O
verviewAdditional Information Shareholder information
DirectorsLena Wilson (Chair) Mark BattenMaria BentleyAndrew DewhirstRichard Jones Michael Morris
Registered officePO Box 255Trafalgar CourtLes�BanquesSt Peter PortGuernseyGY1 3QLRegistered Number: 43673
UK officeStanford Building27A Floral StreetLondonWC2E 9EZT: 020 7628 4800E:�[email protected]
Administrator and Secretary Northern Trust International Fund AdministrationServices (Guernsey) LimitedPO Box 255, Trafalgar CourtLes�BanquesSt Peter PortGuernsey GY1 3QLT: 01481 745001 E:�[email protected]
RegistrarComputershare Investor Services (Guernsey) Limited1st FloorTudor HouseLe BordageSt Peter PortGuernseyGY1 1DBT: 0370 707 4040E:�[email protected]�
Corporate brokersJP Morgan Securities Limited25 Bank StreetLondonE14 5JP
Stifel Nicolaus Europe Limited150 CheapsideLondonEC2V 6ET
Independent auditorKPMG Channel Islands LimitedGlategny CourtGlategny EsplanadeSt Peter PortGuernseyGY1 1WR
MediaTavistock Communications1 CornhillLondonEC3V 3NDT: 020 7920 3150 E:�[email protected]
Solicitors As to English lawNorton Rose Fulbright LLP3 More London RiversideLondonSE1 2AQ
As to English property lawDLA Piper UK LLPWalker HouseExchange FlagsLiverpoolL2 3YL
As to Guernsey law Carey OlsenPO Box 98Carey HouseLes�BanquesSt Peter PortGuernseyGY1 4BZ
Property valuersCBRE LimitedHenrietta HouseHenrietta PlaceLondonW1G 0NB
Tax adviserDeloitte LLPHill House1 Little New StreetLondonEC4A 3TR
Shareholder enquiriesAll�enquiries�relating�to�holdings�in�Picton�Property�Income�Limited,�including�notification�of�change�of�address,�queries�regarding�dividend�payments�or�the�loss�of�a�certificate,�should be addressed to the Company’s registrars.
WebsiteThe Company has a corporate website which contains more detailed information about the Group. www.picton.co.uk

Picton Property Income Lim
ited Annual Report 2021
136
Notes

Designed and produced by emperor /( Visit us at emperor.works �..._'

Picton Property Income Limited Stanford Building 27A Floral Street London WC2E 9EZ 020 7628 4800www.picton.co.uk