Occupational segregation by gender and ethnic group in Great Britain’s Labor market
37
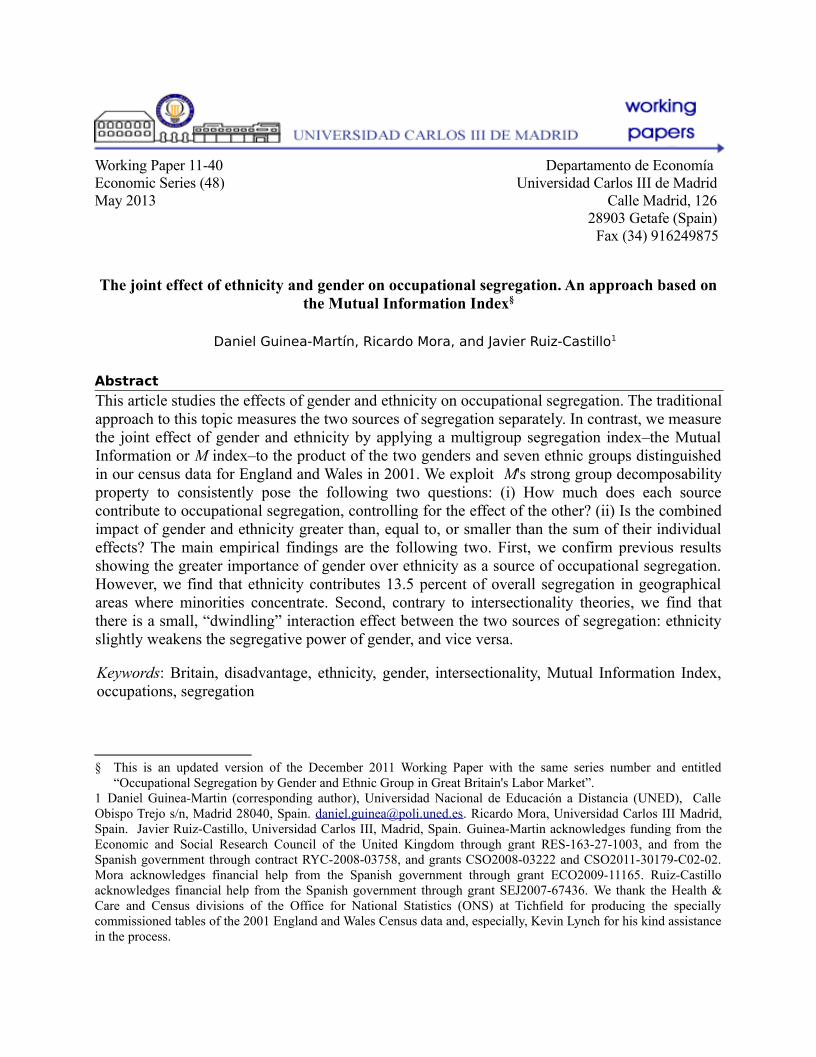
Working Paper 11-40 Departamento de Economía Economic Series (48) Universidad Carlos III de Madrid May 2013 Calle Madrid, 126 28903 Getafe (Spain) Fax (34) 916249875 The joint effect of ethnicity and gender on occupational segregation. An approach based on the Mutual Information Index § Daniel Guinea-Martín, Ricardo Mora, and Javier Ruiz-Castillo 1 Abstract This article studies the effects of gender and ethnicity on occupational segregation. The traditional approach to this topic measures the two sources of segregation separately. In contrast, we measure the joint effect of gender and ethnicity by applying a multigroup segregation index–the Mutual Information or M index–to the product of the two genders and seven ethnic groups distinguished in our census data for England and Wales in 2001. We exploit M's strong group decomposability property to consistently pose the following two questions: (i) How much does each source contribute to occupational segregation, controlling for the effect of the other? (ii) Is the combined impact of gender and ethnicity greater than, equal to, or smaller than the sum of their individual effects? The main empirical findings are the following two. First, we confirm previous results showing the greater importance of gender over ethnicity as a source of occupational segregation. However, we find that ethnicity contributes 13.5 percent of overall segregation in geographical areas where minorities concentrate. Second, contrary to intersectionality theories, we find that there is a small, “dwindling” interaction effect between the two sources of segregation: ethnicity slightly weakens the segregative power of gender, and vice versa. Keywords: Britain, disadvantage, ethnicity, gender, intersectionality, Mutual Information Index, occupations, segregation § This is an updated version of the December 2011 Working Paper with the same series number and entitled “Occupational Segregation by Gender and Ethnic Group in Great Britain's Labor Market”. 1 Daniel Guinea-Martin (corresponding author), Universidad Nacional de Educación a Distancia (UNED), Calle Obispo Trejo s/n, Madrid 28040, Spain. [email protected] . Ricardo Mora, Universidad Carlos III Madrid, Spain. Javier Ruiz-Castillo, Universidad Carlos III, Madrid, Spain. Guinea-Martin acknowledges funding from the Economic and Social Research Council of the United Kingdom through grant RES-163-27-1003, and from the Spanish government through contract RYC-2008-03758, and grants CSO2008-03222 and CSO2011-30179-C02-02. Mora acknowledges financial help from the Spanish government through grant ECO2009-11165. Ruiz-Castillo acknowledges financial help from the Spanish government through grant SEJ2007-67436. We thank the Health & Care and Census divisions of the Office for National Statistics (ONS) at Tichfield for producing the specially commissioned tables of the 2001 England and Wales Census data and, especially, Kevin Lynch for his kind assistance in the process.
-
Upload
independent -
Category
Documents
-
view
4 -
download
0
Transcript of Occupational segregation by gender and ethnic group in Great Britain’s Labor market
Working Paper 11-40 Departamento de Economía Economic Series (48) Universidad Carlos III de MadridMay 2013 Calle Madrid, 126
28903 Getafe (Spain)Fax (34) 916249875
The joint effect of ethnicity and gender on occupational segregation. An approach based on the Mutual Information Index§
Daniel Guinea-Martín, Ricardo Mora, and Javier Ruiz-Castillo1
Abstract
This article studies the effects of gender and ethnicity on occupational segregation. The traditional approach to this topic measures the two sources of segregation separately. In contrast, we measure the joint effect of gender and ethnicity by applying a multigroup segregation index–the Mutual Information or M index–to the product of the two genders and seven ethnic groups distinguished in our census data for England and Wales in 2001. We exploit M's strong group decomposability property to consistently pose the following two questions: (i) How much does each source contribute to occupational segregation, controlling for the effect of the other? (ii) Is the combined impact of gender and ethnicity greater than, equal to, or smaller than the sum of their individual effects? The main empirical findings are the following two. First, we confirm previous results showing the greater importance of gender over ethnicity as a source of occupational segregation. However, we find that ethnicity contributes 13.5 percent of overall segregation in geographical areas where minorities concentrate. Second, contrary to intersectionality theories, we find that there is a small, “dwindling” interaction effect between the two sources of segregation: ethnicity slightly weakens the segregative power of gender, and vice versa.
Keywords: Britain, disadvantage, ethnicity, gender, intersectionality, Mutual Information Index, occupations, segregation
§ This is an updated version of the December 2011 Working Paper with the same series number and entitled “Occupational Segregation by Gender and Ethnic Group in Great Britain's Labor Market”.
1 Daniel Guinea-Martin (corresponding author), Universidad Nacional de Educación a Distancia (UNED), Calle Obispo Trejo s/n, Madrid 28040, Spain. [email protected]. Ricardo Mora, Universidad Carlos III Madrid, Spain. Javier Ruiz-Castillo, Universidad Carlos III, Madrid, Spain. Guinea-Martin acknowledges funding from the Economic and Social Research Council of the United Kingdom through grant RES-163-27-1003, and from the Spanish government through contract RYC-2008-03758, and grants CSO2008-03222 and CSO2011-30179-C02-02. Mora acknowledges financial help from the Spanish government through grant ECO2009-11165. Ruiz-Castillo acknowledges financial help from the Spanish government through grant SEJ2007-67436. We thank the Health & Care and Census divisions of the Office for National Statistics (ONS) at Tichfield for producing the specially commissioned tables of the 2001 England and Wales Census data and, especially, Kevin Lynch for his kind assistance in the process.

Since the 1970s, feminist researchers have widened the scope of their interest in gender
to encompass a variety of sources of inequality. The seminal works of Beal (1969) and
Epstein (1973) introduced the idea that ethnicity and gender combine as sources of dis-
advantage for ethnic minority women. In this article we study occupational segregation,
one feature of the labor market that many authors claim contributes to disadvantages for
women and minorities (see, for example, Blau, Brinton, and Grusky 2006, and Kaufman
2010). All writers on this topic have concluded that gender is a greater source of occupa-
tional segregation than ethnicity (see, inter alia, Albelda 1986; Blackwell 2003; King 1995;
Mintz and Krymkowski 2011; Reskin and Cassirer 1996; Tomaskovic-Devey 1993; Wright
and Ellis 2000). However, one of the tenets of the so-called �theories of intersectionality,�
the idea that these two exemplars of ascribed status intertwine in producing inequality
(Browne and Misra 2003; King 1988; McCall 2001), has received much less attention in
applied research. We translate this interest to the study of occupations by asking the
following question: do the segregative e�ects of ethnicity and gender interact in the ways
proposed by intersectional theories? More generally, given the scenarios discussed in the
literature we ask whether the combined impact of ethnicity and gender on segregation is
greater than, equal to, or smaller than the sum of their individual e�ects.
The traditional approach to the e�ects of gender and ethnicity on occupational seg-
regation separately measures segregation by gender, on the one hand, and segregation
by ethnic group, on the other. We claim, in contrast, that the problem requires that
segregation by gender and ethnic group be jointly, or simultaneously, addressed. We will
show how, in this more general framework, it is possible to accomplish the two tasks at
hand: (i) the analysis of each source of segregation separately, controlling for the e�ect of
the other source of segregation, and (ii) the study of the di�erent ways in which the two
sources may interact. As we have at least two ethnic groups and two genders, for a total
of four or more categories, we require a multigroup segregation index that overcomes the
limitations of traditional dichotomous indicators such as the well-known Dissimilarity
Index originally proposed by Duncan and Duncan (1955).
Moreover, as we must isolate the two sources of segregation from each other, it is
essential that the segregation index be additively decomposable for any partition of the
population into sub-groups. Fortunately, the Mutual Information Index, M , is a multi-
group segregation index that satis�es the Strong Group Decomposability property (SGD
hereafter). Indeed, Frankel and Volij (2011) have recently shown that the M index is the
2

only segregation index that satis�es various acceptable ordinal properties and, in addi-
tion, is strongly group decomposable. Therefore, we can only conduct our analysis using
the M index.
To exemplify the usefulness of our approach, we draw on the 2001 Census of England
and Wales, countries that are among the most ethnically heterogeneous in Europe.1 Ad-
ditionally, we check the sensitivity of our results to two compositional e�ects that could
be driving them. First, a critic could note that the fact that women represent a greater
share of the labor force than ethnic minorities biases our measurement. Likewise, some
authors argue that the outcomes of ethnic minorities in the labor market are associated
with their relative weight in the population (see, for example, Clark and Drinkwater
2002; Catanzarite 2003; Durlauf 2004; Jacobs and Blair-Loy 1996; Tienda and Lii 1987).
Therefore, we explore the sensitivity of our results to the ethnic composition of Local
Authority Districts, the smallest geographical area for which information on ethnicity is
available in standard Census output.
Second, it is reasonable to think that at least some of the segregation that we attribute
to ethnicity and gender is really due to di�erences in the stock of education and potential
work experience accrued by women, men, and ethnic groups (for a similar concern, see,
among others, Carmichael and Woods 2000; Clark and Drinkwater 2007; Jacobs and
Blair-Loy 1996; Reskin and Cassirer 1996). To address this objection, we control for
di�erences in the age pro�le and educational attainment of the working population.
The remainder of this paper is organized into four sections. In the �rst section, we
brie�y review the literature on gender, ethnicity, and occupational segregation. We dis-
cuss the traditional approach to the study of gender and ethnic occupational segregation.
We then present three scenarios of interaction between gender and ethnicity, where both
sources of segregation play roles. Next, we introduce our empirical strategy based on the
M index, and afterwards, provide an illustration with British data.2 Finally, in the last
1UK Census data is Crown Copyright. We use the term �gender� throughout the article, rather than�sex� because the occupational segregation of women and men is a macro result of the social constructionof gender�a process that is entrenched in institutions such as the labor market (West and Zimmerman1987). Furthermore, we use the term �ethnicity� in lieu of �race� for two reasons. First, in the Census therespondent is asked about the ethnicity with which she identi�es. Second, we re�ect the widespread usageof the term �ethnicity� in British English, where �race� is viewed as potentially linked with �essentiallyracists theories� (Bradley and Healy 2008). When we quote other authors we respect the terms they use.Finally, for brevity we use feminine pronouns as shorthand for both women and men.
2Following the usual convention, we use the term Great Britain as shorthand for England and Wales,and British for English and Welsh. Scotland's 2001 Census is an independent statistical operation
3

section, we summarize our argument.
Traditional Notions: Ethnic Segregation and Gender
Segregation
By segregation we refer to the tendency of members of di�erent groupings (women and
men; white and ethnic minority individuals) to be distributed unevenly across organiza-
tional units. This is the so-called �evenness� dimension of segregation (Massey and Denton
1988; Reardon and Firebaugh 2002). When the organizational units are workers' occupa-
tions, most authors focus exclusively on the notion of occupational segregation by gender
for two reasons, one methodological and the other substantive. Methodologically, socio-
logical analyses have been constrained by dichotomous indexes. In the study of women
and men, the Dissimilarity Index (DI hereafter), the Gini, and the Karmel-MacLachlan
indexes, are natural alternatives (see Flückiger and Silber 1999 for a review).3 However,
such indexes are not ideal tools when there are more than two groups, as is often the case
in ethnic studies. The reason is that, for instance, Asian people are not only more or less
segregated from, say, Black people but also from all other ethnic groups (for a similar
concern, see, among others, Alonso-Villar, Del Rio, and Gradin 2012).
Nevertheless, the main reason for privileging gender over ethnicity in the study of
segregation is substantive: in modern society, gender is �the most basic divide� (Epstein
2007) along which inequality arises. Gender-based di�erences draw their legitimacy from
essentialist beliefs and stereotypes, such as the idea that women are biologically bet-
ter equipped for caring, nurturing, and servicing tasks than men (Ridgeway 2006). In
contrast, the application of essentialist beliefs to ethnic distinctions is taboo, at least in
Western societies. Except for overtly racist and marginal groups, the opinion that certain
ethnicities are better suited for performing some tasks is not normatively accepted (Jacobs
and Blair-Loy 1996). Still, ethnic prejudices appear to in�uence recruitment, job alloca-
tion, and promotion (Carmichael and Woods 2000; Castilla 2008; Catanzarite 2003; Moss
conducted by the General Register O�ce for Scotland, a part of the devolved Scottish Administration,and we do not use these data in this article.
3There are gender categories other than women and men, as gender studies and queer theory evidence.Notwithstanding, these alternative gender groups are not recorded in the British census.
4

and Tilly 2001; Reskin, McBrier, and Kmec 1999) through a variety of forms that range
from employers' explicit (Becker 1971) or implicit (Bertrand, Chugh, and Mullainathan
2005) preferences for one ethnic group over another to statistical discrimination (Phelps
1972). However, in the aggregate, there are di�erences in ethnic and gender stereotyp-
ing and in the population weight of women and minorities. Many occupations employ
women or men almost exclusively (e.g., nurses, drivers). But very few occupations, if any,
are dominated by a single ethnic minority (Cohn 1999; Jacobs and Blair-Loy 1996). In
short, in spite of the rise of gender egalitarianism since the 1960s, gender essentialism, as
Charles and Grusky (2004) calls it, reigns supreme.
If this is the case, then why worry about ethnicity at all when studying occupational
segregation? Because the few studies that consider the ethnic a�liations of workers
conclude that it shapes their occupational distribution to a noticeable degree (for two
recent contributions in this vein, see Åslund and Skans 2010, and Kaufman 2010). In
the case of Great Britain, the very ethnic makeup of the country is closely related to
the recent evolution of the British labor market. At the end of the Second World War,
signi�cant numbers of overseas workers joined British industry and the public sector. For
example, the nascent National Health Service recruited sizable numbers of Black and
Asian women (Batnitzky and McDowell 2011), while England's textile, clothing and steel
industries attracted migrants from the Caribbean and South Asia (Cross 1992; Owen and
Green 1992; Phizacklea and Wolkowitz 1995). Some of these original migrants still worked
in those occupations at the time of the 2001 Census. In addition, many of their o�spring
who grew up in Great Britain were already in the labor market at that date (Clark and
Drinkwater 2007). Certainly, the labor supply of migrants' descendants is not necessarily
tied to the occupational niches in which their forebears found work�particularly if these
niches were not very attractive or advantageous (Waldinger and Feliciano 2004) or were in
economic sectors that have declined over the years (Allen and Massey 1988; Cross 1992;
Crouch 1999). Nevertheless, many observers have concluded that there are substantial
di�erences in economic performance between people with immigrant origins and the rest
of the labor force (Berthoud 2000; Clark and Drinkwater 2007; Fernández 2010; Heath
and Yu 2005). For example, ethnic minority entrepreneurs concentrate in the retail,
catering, and transport sectors (Parker 2004) but are underrepresented in professional
and intermediate non-manual occupations (Carmichael and Woods 2000).
Some authors have, in a single study, examined occupational segregation by gender,
5
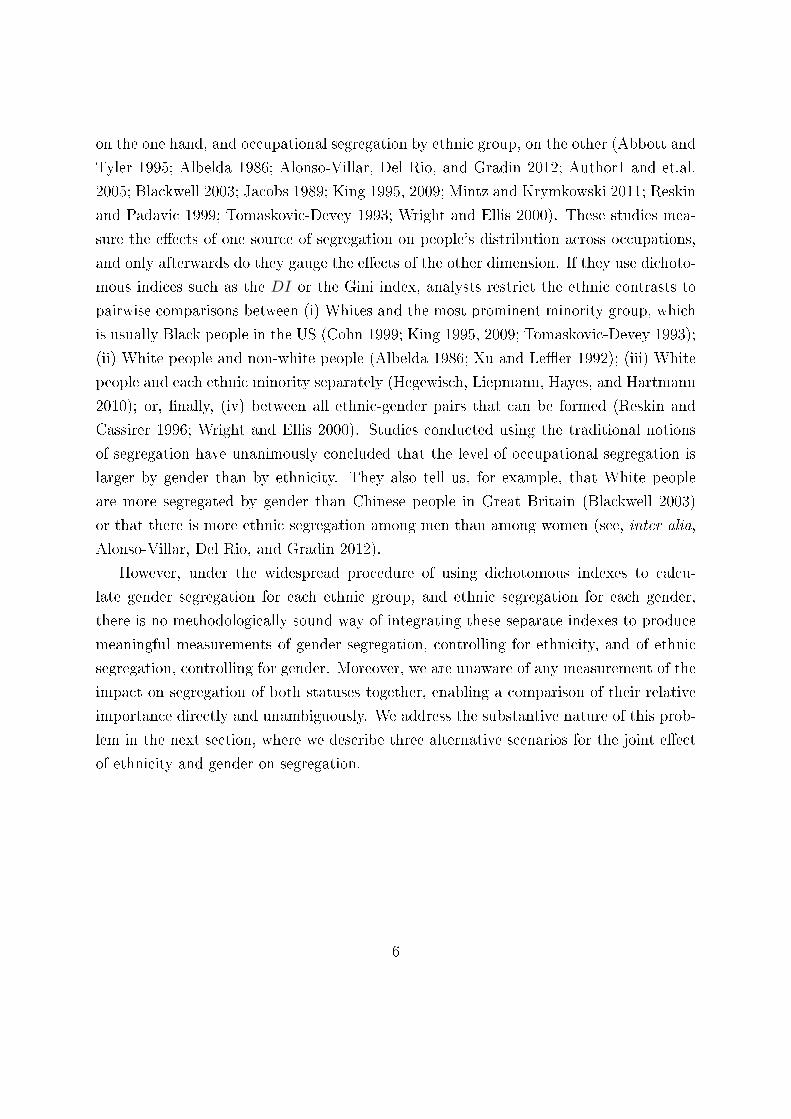
on the one hand, and occupational segregation by ethnic group, on the other (Abbott and
Tyler 1995; Albelda 1986; Alonso-Villar, Del Rio, and Gradin 2012; Author1 and et.al.
2005; Blackwell 2003; Jacobs 1989; King 1995, 2009; Mintz and Krymkowski 2011; Reskin
and Padavic 1999; Tomaskovic-Devey 1993; Wright and Ellis 2000). These studies mea-
sure the e�ects of one source of segregation on people's distribution across occupations,
and only afterwards do they gauge the e�ects of the other dimension. If they use dichoto-
mous indices such as the DI or the Gini index, analysts restrict the ethnic contrasts to
pairwise comparisons between (i) Whites and the most prominent minority group, which
is usually Black people in the US (Cohn 1999; King 1995, 2009; Tomaskovic-Devey 1993);
(ii) White people and non-white people (Albelda 1986; Xu and Le�er 1992); (iii) White
people and each ethnic minority separately (Hegewisch, Liepmann, Hayes, and Hartmann
2010); or, �nally, (iv) between all ethnic-gender pairs that can be formed (Reskin and
Cassirer 1996; Wright and Ellis 2000). Studies conducted using the traditional notions
of segregation have unanimously concluded that the level of occupational segregation is
larger by gender than by ethnicity. They also tell us, for example, that White people
are more segregated by gender than Chinese people in Great Britain (Blackwell 2003)
or that there is more ethnic segregation among men than among women (see, inter alia,
Alonso-Villar, Del Rio, and Gradin 2012).
However, under the widespread procedure of using dichotomous indexes to calcu-
late gender segregation for each ethnic group, and ethnic segregation for each gender,
there is no methodologically sound way of integrating these separate indexes to produce
meaningful measurements of gender segregation, controlling for ethnicity, and of ethnic
segregation, controlling for gender. Moreover, we are unaware of any measurement of the
impact on segregation of both statuses together, enabling a comparison of their relative
importance directly and unambiguously. We address the substantive nature of this prob-
lem in the next section, where we describe three alternative scenarios for the joint e�ect
of ethnicity and gender on segregation.
6

The Joint E�ect of Ethnic and Gender on Segregation
In ethnically heterogeneous societies, both ethnicity and gender are arguably part and
parcel of our collection of �master statuses� (Becker 1963; Hughes 1945):4 the categories
to which we are ascribed by virtue of our genitals, skin color, language and cultural
heritage (Jacobs and Blair-Loy 1996). To a large extent these are circumstances outside
individuals' control. Nevertheless, upon visual and auditive perception of these features,
everyone is classi�ed almost immediately as adept or inept in certain tasks and as free
of, or subject to, certain norms, duties and expectations. Everyone�including, certainly,
employers and employees�knows this, if only unwittingly (Chugh 2004). People carry a
wealth of social knowledge triggered by the physical cues of their phenotype.
We all belong to one gender and one ethnic group at the same time (Reskin 1993) and
are easily perceived as members of these groups in the labor market.5 Hence, the tradi-
tional approach, which appraises each dimension separately, makes sense only if workers'
ascribed characteristics have an additive relationship. Ethnicity puts minority women at
a disadvantage. Simultaneously, but independent of ethnic discrimination, these women
also su�er the consequences of sexism. Abbott and Tyler (1995) and Blackwell (2003)
�nd evidence of this segregation pattern in Britain.
Few authors, however, argue on theoretical grounds in favor of the additivity of the
e�ect of ethnicity and gender. In particular, social scientists advocating an intersectional
perspective (see, inter alia, Bradley and Healy 2008; Misra 2012) aim to prove that eth-
nicity and gender �are not independent analytic categories that can simply be added
together� and �have separate (. . . ) in�uences� (Browne and Misra 2003). Instead, they
seek �evidence to demonstrate that race and gender intersect in the labor market.� This
second scenario corresponds to what King (1988) calls the �multiple jeopardy hypothesis�:
the general outcome of being oppressed on various accounts exceeds the sum of the out-
comes of being disadvantaged on each dimension separately. With regard to occupational
segregation, the evidence most often o�ered in favor of the intersection of ethnicity and
4It could be argued that this set also includes the major age groups that we successively occupyduring the life cycle: childhood, teenage years, young adulthood, adulthood, seniority (Collins 2000).This is another argument for checking the robustness of our results with a proxy for work experiencethat includes age among its component parts, as we argue later in the article.
5This is also the case of people who could, in principle, claim many ethnic identities. For example,in the British Census contains various mixed options that we do not consider in this article for reasonsdiscussed in the Data section.
7
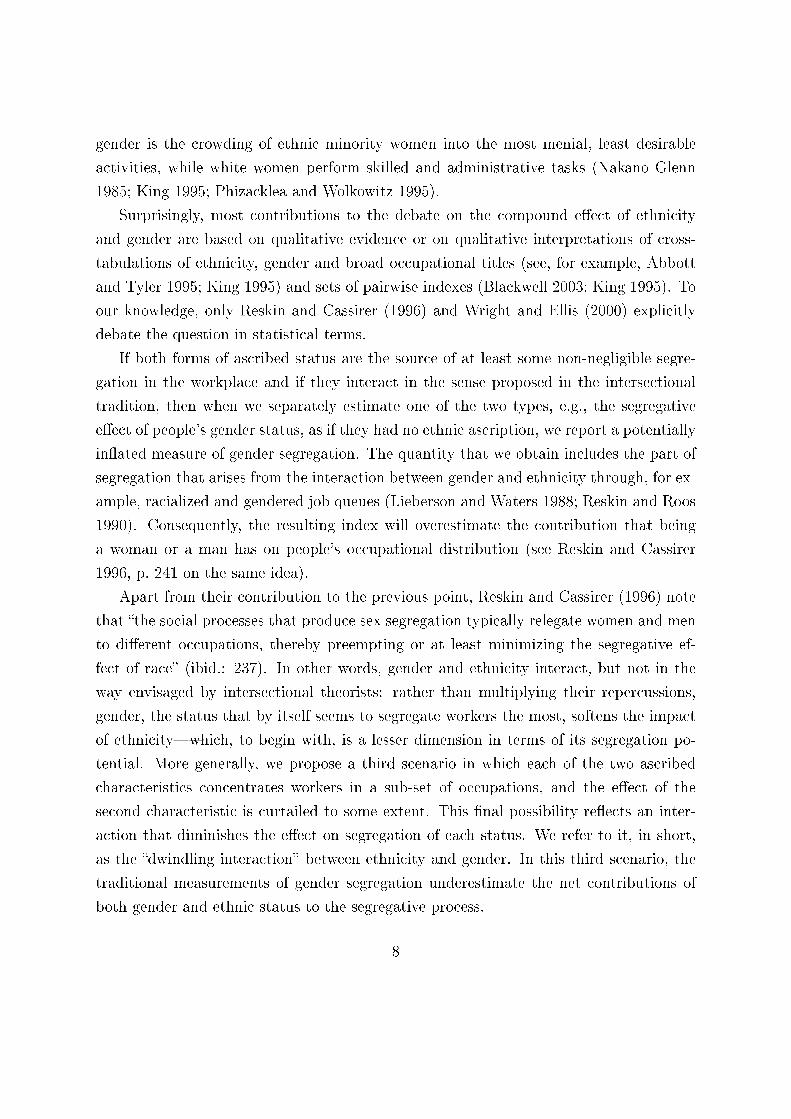
gender is the crowding of ethnic minority women into the most menial, least desirable
activities, while white women perform skilled and administrative tasks (Nakano Glenn
1985; King 1995; Phizacklea and Wolkowitz 1995).
Surprisingly, most contributions to the debate on the compound e�ect of ethnicity
and gender are based on qualitative evidence or on qualitative interpretations of cross-
tabulations of ethnicity, gender and broad occupational titles (see, for example, Abbott
and Tyler 1995; King 1995) and sets of pairwise indexes (Blackwell 2003; King 1995). To
our knowledge, only Reskin and Cassirer (1996) and Wright and Ellis (2000) explicitly
debate the question in statistical terms.
If both forms of ascribed status are the source of at least some non-negligible segre-
gation in the workplace and if they interact in the sense proposed in the intersectional
tradition, then when we separately estimate one of the two types, e.g., the segregative
e�ect of people's gender status, as if they had no ethnic ascription, we report a potentially
in�ated measure of gender segregation. The quantity that we obtain includes the part of
segregation that arises from the interaction between gender and ethnicity through, for ex-
ample, racialized and gendered job queues (Lieberson and Waters 1988; Reskin and Roos
1990). Consequently, the resulting index will overestimate the contribution that being
a woman or a man has on people's occupational distribution (see Reskin and Cassirer
1996, p. 241 on the same idea).
Apart from their contribution to the previous point, Reskin and Cassirer (1996) note
that �the social processes that produce sex segregation typically relegate women and men
to di�erent occupations, thereby preempting or at least minimizing the segregative ef-
fect of race� (ibid.: 237). In other words, gender and ethnicity interact, but not in the
way envisaged by intersectional theorists: rather than multiplying their repercussions,
gender, the status that by itself seems to segregate workers the most, softens the impact
of ethnicity�which, to begin with, is a lesser dimension in terms of its segregation po-
tential. More generally, we propose a third scenario in which each of the two ascribed
characteristics concentrates workers in a sub-set of occupations, and the e�ect of the
second characteristic is curtailed to some extent. This �nal possibility re�ects an inter-
action that diminishes the e�ect on segregation of each status. We refer to it, in short,
as the �dwindling interaction� between ethnicity and gender. In this third scenario, the
traditional measurements of gender segregation underestimate the net contributions of
both gender and ethnic status to the segregative process.
8

An Approach Based on the Mutual Information Index
The starting point of our empirical strategy is simple. People belong to one of two genders
and, in our data, one of seven ethnic groups: White, Indian, Pakistani, Bangladeshi, Black
Caribbean, Black African, and Chinese (see Data section). Hence, the segregation that
we measure stems from the uneven distribution of 2x7 = 14 groupings across occupations.
To avoid the need to constantly repeat �ethnic and gender,� we also refer to this notion as
�total� or �overall� segregation. To conduct an analysis that combines ethnic and gender
categories, we must employ a multigroup index of segregation.
We must also employ an index of segregation that satis�es the property of Strong
Group Decomposability (SGD) de�ned by Frankel and Volij (2011). The reasons are
twofold. First, an index that satis�es SGD allows us to identify the proportion of occu-
pational segregation by ethnicity and gender that can be attributed exclusively to either
ethnicity or gender (Author2 and Author3 2011). Second, once we can compute the pro-
portion of segregation attributable to each source, controlling for the other, we can study
whether the sum of these two quantities is greater than, equal to, or smaller than total
segregation. In the �rst case, gender and ethnicity interact in a multiplicative way; in
the second case, they do not interact; and in the third case, they interact in a dwindling
way.
As indicated in the Introduction, Frankel and Volij (2011) have shown that the M
index is the only segregation index that, in addition to possessing other desirable prop-
erties, satis�es the SGD property.6 Therefore, the remainder of this Section is devoted
to a brief presentation of the M index and its properties relevant to this study. However,
before we do so, we must de�ne the entropy of a distribution (see Hamming 1991 for an
overview).
Consider a variable X which takes a value q with probability pq. In Information
Theory, log(
1pq
)captures the amount of information, or �surprise,� experienced when
we observe q: if q is unlikely, then pq is small; consequently, the information that q
carries, de�ned as log(
1pq
), is large. To illustrate, consider the distribution of British
workers by ethnicity (see the last column of Table 1 below). An overwhelming 94.5
6One normalized version of theM index, known as Theil's H index, satis�es a weaker decomposabilityproperty than SGD (Frankel and Volij 2011; Reardon and Firebaugh 2002). However, Author2 andAuthor3 (2011) have demonstrated the shortcomings of the H index and the weaker decomposabilityproperty that it satis�es.
9

percent of this population is White. Therefore, if we sampled one person in the working
population and she happened to be White, we would not be very surprised. In more
technical terms, the information gained would be small: log(
10.945
)= 0.06, to be precise.
If we sampled an Indian person, a less likely event, the amount of information obtained
is log(
10.021
)= 3.86, or 3.86
0.06= 64 times larger than in the case of a white person. The
entropy of the distribution of pq is the expected value of the information attained with the
variable X: E(P ) =∑
pqlog(
1pq
), where P = {pq} denotes the probability distribution
of X. In our example, E(P ) = 0.30.
Let Pocc and Pocc|e,g be the unconditional and conditional distribution of occupations,
respectively. Suppose we sample a worker randomly. The entropy of Pocc, E (Pocc), is
de�ned as the expected information obtained from learning the worker's occupation. If
we were also informed about the worker's ethnicity and gender, the expected information
from learning the worker's occupation would now be measured by the entropy of the
distribution conditional on ethnicity and gender, E(Pocc|e,g
). The M index of total or
overall segregation, denoted by M∗, is the average increase in the information we have
about the worker's occupation that comes from learning her or his ethnicity and gender:
M∗ =∑e,g
we,g
[E (Pocc)− E
(Pocc|e,g
)](1)
where we,g is the demographic weight of workers of ethnic group e and gender g. If all
groups are equally distributed across occupations, then M∗ attains its minimum at 0.
Conversely, M∗ reaches its maximum if groups do not mix together in occupations and
all groups have identical demographic weights. This quantity is equal to the smaller
value of either the logarithm of the number of groups or the logarithm of the number of
occupations.7
A crucial property: Strong Group Decomposability
The SGD property states that for any partition of the population into subgroups, M∗
equals the sum of the segregation between subgroups and a weighted average of within-
subgroup segregation levels, where the weights are the population shares of each subgroup.
We can study the segregation induced by a given source, e.g., gender, in two ways. In
7See Frankel and Volij (2011) for a motivating example of this requirement.
10

the �rst case we have the �between-term� denoted by M g, which is called thus because
it gauges the segregation that arises from distinguishing between women and men in
the overall population. This term is equivalent to traditional measurements of gender
segregation.
In the second case, theM index of gender segregation within an ethnic group e,M g(e),
captures the average increase in information that arises from learning the worker's gender,
given that the ethnicity is e, with e = 1, . . . , E. The weighted average of these indexes,∑e peM
g(e), is the �within-term� in the decomposition ofM∗, which is called thus because
it measures the central tendency of gender segregation within an ethnic group. Similarly,
we can study segregation between ethnic groups in the population, M e, and also within
gender groups, M e(g). The corresponding within-term is∑
g pgMe(g).
As the M index ful�lls the SGD property, the overall index M∗ de�ned in equation
(1) satis�es the following two decompositions:8
M∗ = M g +∑g
pgMe(g) = M e +
∑e
peMg(e). (2)
The �rst equality in equation (2) states that M∗ can be decomposed into segregation
by gender, M g, and ethnicity's contribution to segregation after controlling for gender,∑g pgM
e(g). Alternatively, M∗ can be decomposed into occupational segregation by
ethnic group,M e, and the e�ect that gender has on segregation once ethnicity is controlled
for,∑
e peMg(e).
Equation (2) is important because it quanti�es how much of ethnic and gender segre-
gation is exclusively due to either ethnicity or gender. More precisely, the within-terms
answer the following question: how much of the overall segregation would disappear if
gender (in the case of∑
e peMg(e)) or ethnicity (in the case of
∑g pgM
e(g)) played no
role in the segregative process? Hence, each within-term singles out the contribution to
overall segregation that can be attributed to one dimension on its own, once we control
for the other (Author2 and Author3 2011). As these contributions do not contain the
segregation that arises from the interaction between ethnicity and gender, the within-
terms can be considered the �marginal� e�ects of either ethnicity or gender on overall
segregation.9
8See Author2 and Author3 (2011) for the proof of this result in the case with only two groups andFrankel and Volij (2011) for the multigroup case.
9See also Puyenbroeck, Bruyne, and Sels 2012 for an alternative decomposition in the analysis of the
11
The three scenarios for the joint e�ect of ethnicity and gender and
a single analytical framework
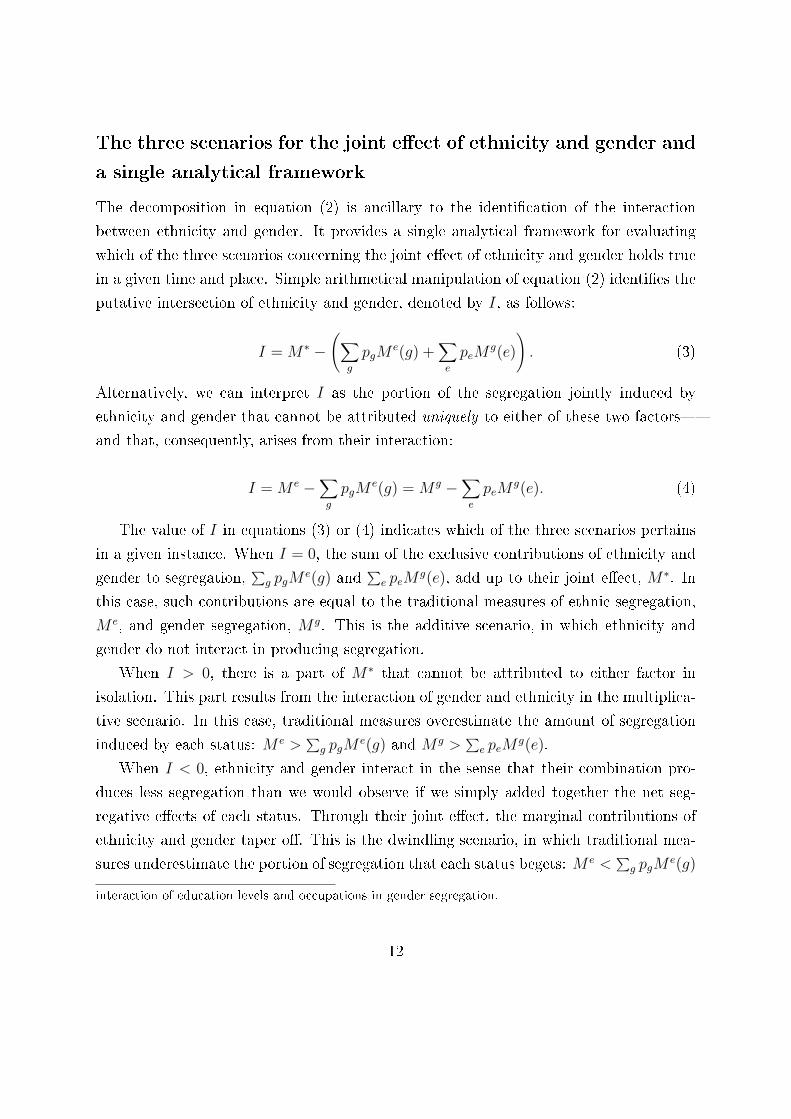
The decomposition in equation (2) is ancillary to the identi�cation of the interaction
between ethnicity and gender. It provides a single analytical framework for evaluating
which of the three scenarios concerning the joint e�ect of ethnicity and gender holds true
in a given time and place. Simple arithmetical manipulation of equation (2) identi�es the
putative intersection of ethnicity and gender, denoted by I, as follows:
I = M∗ −(∑
g
pgMe(g) +
∑e
peMg(e)
). (3)
Alternatively, we can interpret I as the portion of the segregation jointly induced by
ethnicity and gender that cannot be attributed uniquely to either of these two factors�
and that, consequently, arises from their interaction:
I = M e −∑g
pgMe(g) = M g −
∑e
peMg(e). (4)
The value of I in equations (3) or (4) indicates which of the three scenarios pertains
in a given instance. When I = 0, the sum of the exclusive contributions of ethnicity and
gender to segregation,∑
g pgMe(g) and
∑e peM
g(e), add up to their joint e�ect, M∗. In
this case, such contributions are equal to the traditional measures of ethnic segregation,
M e, and gender segregation, M g. This is the additive scenario, in which ethnicity and
gender do not interact in producing segregation.
When I > 0, there is a part of M∗ that cannot be attributed to either factor in
isolation. This part results from the interaction of gender and ethnicity in the multiplica-
tive scenario. In this case, traditional measures overestimate the amount of segregation
induced by each status: M e >∑
g pgMe(g) and M g >
∑e peM
g(e).
When I < 0, ethnicity and gender interact in the sense that their combination pro-
duces less segregation than we would observe if we simply added together the net seg-
regative e�ects of each status. Through their joint e�ect, the marginal contributions of
ethnicity and gender taper o�. This is the dwindling scenario, in which traditional mea-
sures underestimate the portion of segregation that each status begets: M e <∑
g pgMe(g)
interaction of education levels and occupations in gender segregation.
12

and M g <∑
e peMg(e).
Robustness checks
To this point, we have argued that traditional indexes measure the strength of the as-
sociation between one variable, normally gender or ethnicity, and occupation. As an
alternative, we have proposed an approach in which a multigroup index of segregation
jointly applies to both dimensions. We now wish to consider two possible objections to
our research design. These objections concern the so-called �compositional e�ects.�
In the �rst place, we know that minorities are not distributed evenly and randomly
across a given geographical area (Jacobs and Blair-Loy 1996). In Great Britain, for ex-
ample, they cluster in certain areas, mostly urban, as a result of labor demands at certain
points in history (Clark and Drinkwater 2002; Cross 1992). To assess the sensitivity of
our results to the percentage of the population that belongs to a minority, we have created
two �sub-countries� in our data. One is composed of the geographical areas in which mi-
norities concentrate. In the other areas, minorities represent only a negligible proportion
of the overall population. (We present the details in the Data section.) If our measures
are robust to the ethnic composition of the areas, the amount of ethnic segregation, its
joint e�ect with gender, and the intersection of ethnicity and gender, should be roughly
equal, independently of the ethnic mix of the area.
Second, we should bear in mind that economists' main supply-side explanation of
di�erences between women and men in occupational outcomes relies on the notion of
human capital, i.e., the acquired stock of competences to work and produce economic
value. The nub of the theory is that people accrue education and work experience as
a result of investment decisions that a�ect their future earnings and occupations (Ben-
Porath, 1967). Consequently, observed occupational segregation must be associated, at
least partly, with group di�erences in levels of human capital. Hence, as a robustness
check on our �ndings, we evaluate to what extent ethnic and gender di�erences in human
capital characteristics account for occupational segregation. How do we expect segre-
gation levels and the intersection of ethnicity and gender to vary, once we control for
the human capital characteristics of the working population? From the literature, we
can think of two possible outcomes. The �rst responds to the meritocratic ideal and the
second to the specialization of population subgroups in certain types of occupations. We
13

review each in turn.
One of the main �ndings regarding the link between human capital and gender segre-
gation indicates that many women with college degrees and continuous work histories are
employed in male and integrated occupations, thereby decreasing the overall level of seg-
regation (Cotter, Hermsen, and Vanneman 2004; Hakim 2004). In the case of ethnicity,
the role of human capital is less clear-cut because it depends, to some extent, on where it
was acquired. Customarily, employers in migrants' countries of destination either do not
recognize or somewhat devalue the education achieved in migrants' countries of origin,
particularly if the language is di�erent (Heath and Yu 2005; Platt 2005). However, for
ethnic minority people who earned their educational credentials in the country where they
work, the consequences of human capital should be similar, in principle, to the outcomes
observed among women and men: the higher the education level achieved, the greater
the potential for making inroads into jobs with meritocratic points of entry. In summary,
if achieved status and merit bu�er some of the discrimination brought about by ascribed
status (Carmichael and Woods 2000; Mintz and Krymkowski 2011; Reskin, McBrier, and
Kmec 1999), we should observe that segregation jointly induced by ethnicity and gender,
as well as any multiplicative interaction between these two dimensions, diminishes once
we control for human capital.
The alternative outcome concerns specialization: at any level of human capital, women
pursue distinctive occupational careers (Jarman, Blackburn, and Racko, 2012; Shauman,
2006). For example, in Scandinavian countries, where many women have tertiary educa-
tion, women follow feminized career ladders in the public sector (Hansen 1997; Mandel
2012). Likewise, highly quali�ed members of certain minorities tend to avoid the �ethnic
penalty� (Heath, McMahon, and Roberts 2000) that they might endure in the broader
labor market by carving out occupational niches in which they achieve a certain critical
mass (Lieberson 1988) or serve a co-ethnic clientele (Aldrich, Cater, Jones, Evoy, and
Velleman 1985). In Great Britain, Indian and Black African men have Medical practi-
tioners and Software analysts among their most common occupations and, together with
the Chinese, often work in professional and business services (Author1 and et.al. 2005;
Clark and Drinkwater 2009; Modood and Berthoud 1997; Pang and Lau 1998).
The specialization story is likely most often referenced in the cases of workers in the
lowest echelons of human capital formation. Women without tertiary education who join
the labor market intermittently are often employed in female, �working class� occupations
14

or in service occupations with �exible schedules (Cotter, Hermsen, and Vanneman 2004;
Hakim 2004), while minorities with few quali�cations concentrate in the least desirable
occupations. For example, South Asian women in the North of England have traditionally
worked as sewers in the textile and clothing industry (many at home) and South Asian
men in taxi driving (Author1 and et.al. 2005; Clark and Drinkwater 2009; Green, Owen,
and Wilson 2005; Modood and Berthoud 1997; Phizacklea and Wolkowitz 1995). In the
US, Catanzarite (2000) has found that recent immigrant Latinos, who have a limited stock
of human capital (Wright and Ellis 2000), concentrate in �brown-collar� occupations in
the agriculture, construction, manufacturing, and low-level service sectors. In summary,
the specialization argument posits that women and minorities with high and low levels
of human capital concentrate heavily in subsets of occupations, thereby increasing the
overall level of segregation. If this is the case, then we should observe that segregation
increases once we control for human capital. Moreover, the �ndings should attest to the
existence of a multiplicative interaction between ethnicity and gender.
To our knowledge, no contribution to the literature would lead us to expect any
particular pattern in the way in which the dwindling interaction between ethnicity and
gender, if any, might behave, once we account for the human capital characteristics of
women and men and of each ethnic group. Under this scenario, such control will simply
help us assess the robustness of the �ndings to the possible confounding e�ect of human
capital.
To assess the sensitivity of our results to human capital characteristics, we exploit the
information available in the Census related to educational achievement and age, which
together can be considered proxies of education and potential work experience. First, we
classify workers into occupations and H human capital proxy categories. We denote by
M∗∗ the M index of segregation by ethnicity and gender in terms of human capital and
occupational categories. We can decompose M∗∗ as follows:
M∗∗ = MHC +Mocc(HC) (5)
where MHC is a between-term that captures the segregation induced by human capital
levels and is of little interest for our purposes. Mocc(HC) averages the ethnic and gender
segregation that exists for each level of human capital. In particular,
15
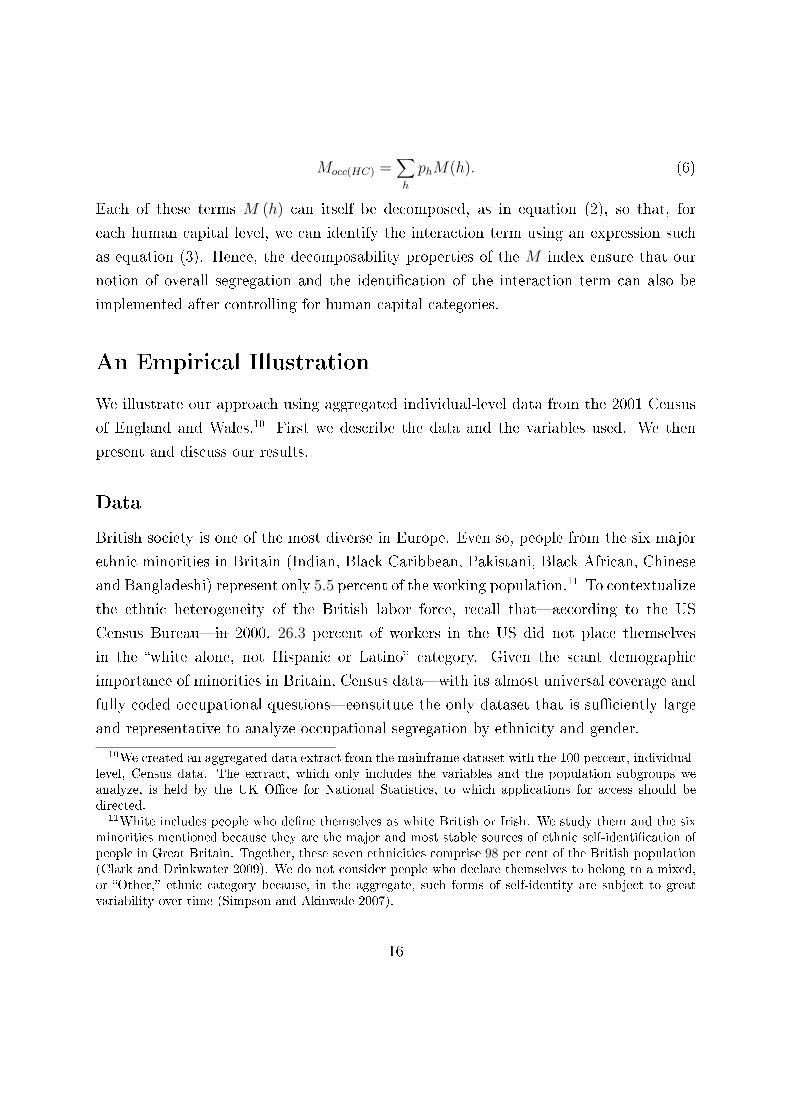
Mocc(HC) =∑h
phM(h). (6)
Each of these terms M (h) can itself be decomposed, as in equation (2), so that, for
each human capital level, we can identify the interaction term using an expression such
as equation (3). Hence, the decomposability properties of the M index ensure that our
notion of overall segregation and the identi�cation of the interaction term can also be
implemented after controlling for human capital categories.
An Empirical Illustration
We illustrate our approach using aggregated individual-level data from the 2001 Census
of England and Wales.10 First we describe the data and the variables used. We then
present and discuss our results.
Data
British society is one of the most diverse in Europe. Even so, people from the six major
ethnic minorities in Britain (Indian, Black Caribbean, Pakistani, Black African, Chinese
and Bangladeshi) represent only 5.5 percent of the working population.11 To contextualize
the ethnic heterogeneity of the British labor force, recall that�according to the US
Census Bureau�in 2000, 26.3 percent of workers in the US did not place themselves
in the �white alone, not Hispanic or Latino� category. Given the scant demographic
importance of minorities in Britain, Census data�with its almost universal coverage and
fully coded occupational questions�constitute the only dataset that is su�ciently large
and representative to analyze occupational segregation by ethnicity and gender.
10We created an aggregated data extract from the mainframe dataset with the 100 percent, individual-level, Census data. The extract, which only includes the variables and the population subgroups weanalyze, is held by the UK O�ce for National Statistics, to which applications for access should bedirected.
11White includes people who de�ne themselves as white British or Irish. We study them and the sixminorities mentioned because they are the major and most stable sources of ethnic self-identi�cation ofpeople in Great Britain. Together, these seven ethnicities comprise 98 per cent of the British population(Clark and Drinkwater 2009). We do not consider people who declare themselves to belong to a mixed,or �Other,� ethnic category because, in the aggregate, such forms of self-identity are subject to greatvariability over time (Simpson and Akinwale 2007).
16

However, as noted above, minorities are unequally distributed throughout Britain
(Clark and Drinkwater 2002). Local Authority Districts (LADs) are the lowest level
of geographical information in our data. On average, each LAD has a population of
around 140, 000 individuals (Clark and Drinkwater 2010). Casting a broad net, we de�ne
areas where �ve percent or more of the population declare themselves to be members
of an ethnic minority as ethnically heterogeneous areas��Mixed� for short. This �gure
rounds o� the 5.5 percent of the ethnic minority people in the overall British labor force.
Additionally, it divides the country neatly by grouping together all metropolitan areas
in the Mixed group: from Portsmouth, with a 5 percent ethnic minority population, to
Newham, a borough of East London where 60 percent of the population belongs to an
ethnic minority. In total there are 113 Mixed LADs.12 Below the �ve percent benchmark,
there are 408 LADs, which we call Non-mixed areas.
Tables 1 and 2 provide basic descriptive statistics of the dataset. Minority workers
concentrate in Mixed areas: 86.5 percent of them, but only 37.6 percent of white workers,
are found there. Women and men are similarly distributed, both across and within Mixed
and Non-mixed areas. On average, 11.9 percent of workers in Mixed areas belong to a
minority, in contrast to the 1.2 percent in Non-Mixed areas.
We use the 2000 Standard Occupational Classi�cation, which has 81 categories at the
three-digit level (ONS 2000). This is the most detailed classi�cation available in British
Census data when used in conjunction with variables such as ethnicity. Many researchers
have noted that the more occupations existing in a classi�cation, the higher the measure
of segregation. Baron and Bielby (1980) have argued that the numerous jobs that o�cial
classi�cations subsume under the same occupational title are segregated by gender and,
possibly, ethnicity. From this perspective, segregation indexes that use occupational-level
information systematically under-report the degree of segregation (Reskin 1993).
Nonetheless, comparisons of segregation levels measured at di�erent degrees of oc-
cupational detail report that most segregation is visible at a surprisingly high level of
aggregation (Author2, Author3, and Other 2005; Charles and Grusky 2004). The rea-
12See Lupton and Power (2004) for the full list of LADs by percentage of ethnic minorities. See alsoClark and Drinkwater (2002) for a discussion of the economic consequences of minority concentration inrelatively deprived areas. These economists use the �ve percent �gure as one of their basic benchmarks.Nonetheless, it is obvious that this number is not set in stone. Instead, it should be argued case bycase, depending on the overall representativeness of the subpopulation of interest. For example, in herstudy of recent immigrant Latinos, Catanzarite (2003) uses a one percent criterion in her classi�cationof metropolitan areas.
17
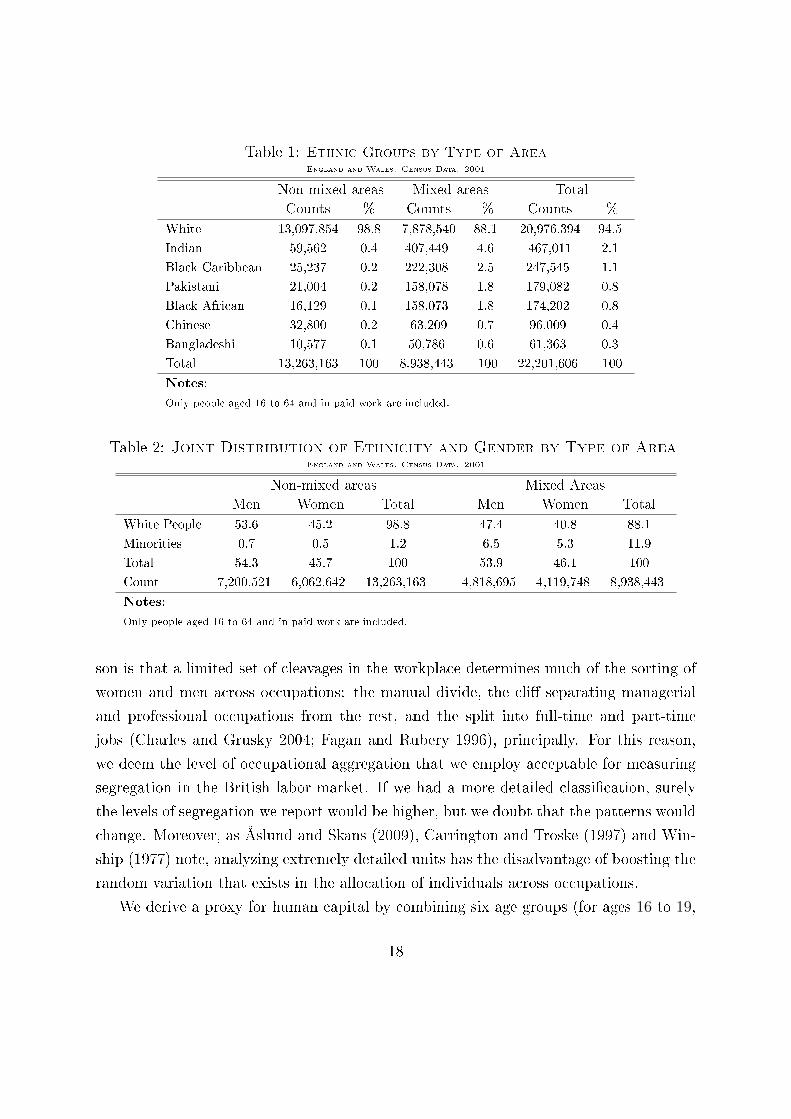
Table 1: Ethnic Groups by Type of Area
England and Wales. Census Data. 2001
Non-mixed areas Mixed areas Total
Counts % Counts % Counts %
White 13,097,854 98.8 7,878,540 88.1 20,976,394 94.5
Indian 59,562 0.4 407,449 4.6 467,011 2.1
Black Caribbean 25,237 0.2 222,308 2.5 247,545 1.1
Pakistani 21,004 0.2 158,078 1.8 179,082 0.8
Black African 16,129 0.1 158,073 1.8 174,202 0.8
Chinese 32,800 0.2 63,209 0.7 96,009 0.4
Bangladeshi 10,577 0.1 50,786 0.6 61,363 0.3
Total 13,263,163 100 8,938,443 100 22,201,606 100
Notes:
Only people aged 16 to 64 and in paid work are included.
Table 2: Joint Distribution of Ethnicity and Gender by Type of AreaEngland and Wales. Census Data. 2001
Non-mixed areas Mixed Areas
Men Women Total Men Women Total
White People 53.6 45.2 98.8 47.4 40.8 88.1
Minorities 0.7 0.5 1.2 6.5 5.3 11.9
Total 54.3 45.7 100 53.9 46.1 100
Count 7,200,521 6,062,642 13,263,163 4,818,695 4,119,748 8,938,443
Notes:
Only people aged 16 to 64 and in paid work are included.
son is that a limited set of cleavages in the workplace determines much of the sorting of
women and men across occupations: the manual divide, the cli� separating managerial
and professional occupations from the rest, and the split into full-time and part-time
jobs (Charles and Grusky 2004; Fagan and Rubery 1996), principally. For this reason,
we deem the level of occupational aggregation that we employ acceptable for measuring
segregation in the British labor market. If we had a more detailed classi�cation, surely
the levels of segregation we report would be higher, but we doubt that the patterns would
change. Moreover, as Åslund and Skans (2009), Carrington and Troske (1997) and Win-
ship (1977) note, analyzing extremely detailed units has the disadvantage of boosting the
random variation that exists in the allocation of individuals across occupations.
We derive a proxy for human capital by combining six age groups (for ages 16 to 19,
18

20 to 29, 30 to 39, 40 to 49, 50 to 59 and 60 to 64), and three levels of educational at-
tainment (without academic or professional quali�cations, with secondary or professional
quali�cations, and with tertiary quali�cations). The resulting 18 categories tap into the
di�erent work experiences and educational attainments of women and men in each ethnic
group (see Clark and Drinkwater 2009, for a similar operationalization of human capital).
Ethnic minorities have a younger age structure and higher levels of educational quali�-
cations (a point that Leslie, Drinkwater, and O'Leary 1998, and Clark and Drinkwater
2007, have noted already). For example, the percentage of people aged between 20 and
29 years is around 28 percent for minorities and only 19 percent for White people. A
larger percentage of ethnic minorities under 40 have more tertiary education than do
White peoples, with the only exceptions being Caribbean men and Bangladeshi people.
In summary, White people have an older age pro�le and lower levels of education among
the youngest age group. Hence, overall, the potential for having accrued work experience
is greater among white workers than among minorities.
Results and discussion
In Table 3, we report, separately, the M indexes based on the traditional notions of
occupational segregation by ethnicity, M e, and by gender, M g. The value for ethnic
segregation, 1.4, is very small. To appreciate this, the possible maximum value that
ethnic segregation can reach is 194.6 (the natural logarithm of 7 times 100). In addition,
of a maximum of 69.3 (the natural logarithm of 2 times 100), gender segregation stands
at 20.1.13
However, we cannot bluntly collate measures of gender segregation with measures
of ethnic segregation because they are scaled di�erently. The standard practice is to
normalize both. Most authors juxtapose normalized values of the DI index ranging from
0 to 100. In our case, we would conclude that gender induces 21.769.3
x100 = 29.05 percent
of the maximum it could reach, while ethnicity originates a meager 1.4194.6
x100 = 0.71
percent of its maximum. However, as discussed above, to directly compare the role of
gender segregation and ethnic segregation, we must apply the SGD property of the M
index shown in equation (2), to the partition of the population into 14 subgroups (2
13For clarity, we report the indexes multiplied by 100 and rounded to the �rst decimal point. Ad-ditionally, we report the results obtained with seven signi�cant digits. For example, the value 20.1 forgender segregation found in Table 3 is the result of rounding 0.2013721x100.
19
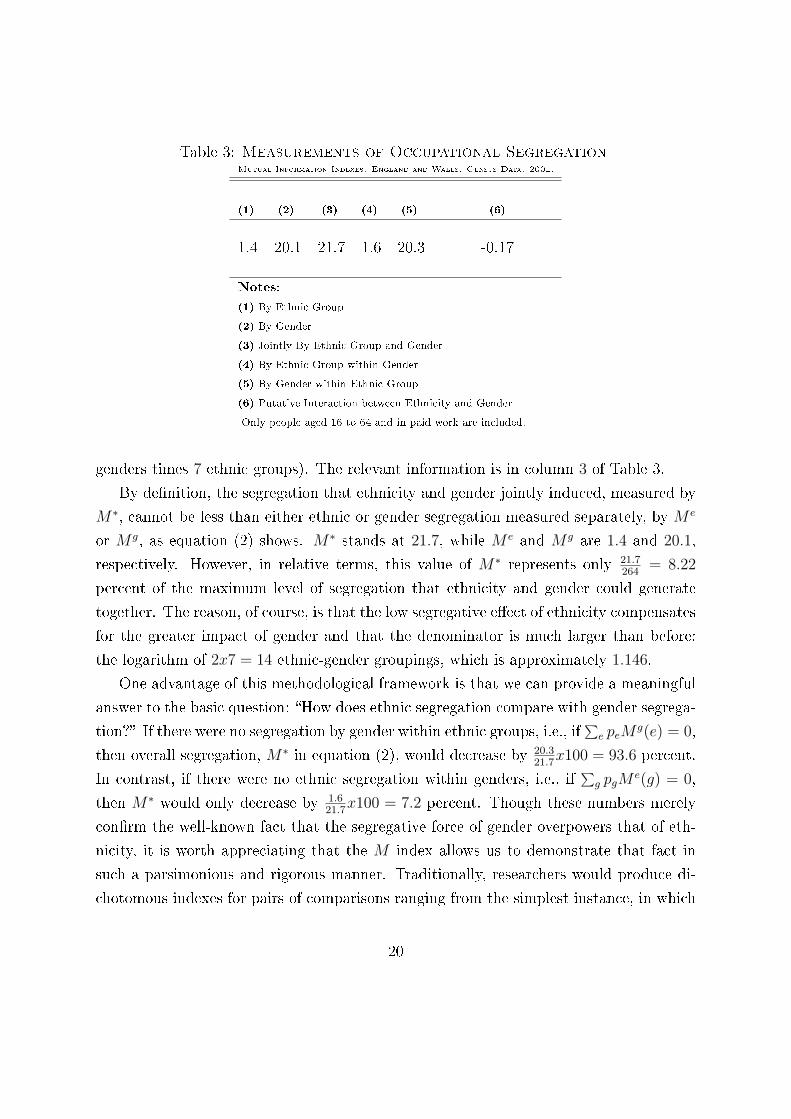
Table 3: Measurements of Occupational SegregationMutual Information Indexes. England and Wales. Census Data. 2001.
(1) (2) (3) (4) (5) (6)
1.4 20.1 21.7 1.6 20.3 -0.17
Notes:
(1) By Ethnic Group
(2) By Gender
(3) Jointly By Ethnic Group and Gender
(4) By Ethnic Group within Gender
(5) By Gender within Ethnic Group
(6) Putative Interaction between Ethnicity and Gender
Only people aged 16 to 64 and in paid work are included.
genders times 7 ethnic groups). The relevant information is in column 3 of Table 3.
By de�nition, the segregation that ethnicity and gender jointly induced, measured by
M∗, cannot be less than either ethnic or gender segregation measured separately, by M e
or M g, as equation (2) shows. M∗ stands at 21.7, while M e and M g are 1.4 and 20.1,
respectively. However, in relative terms, this value of M∗ represents only 21.7264
= 8.22
percent of the maximum level of segregation that ethnicity and gender could generate
together. The reason, of course, is that the low segregative e�ect of ethnicity compensates
for the greater impact of gender and that the denominator is much larger than before:
the logarithm of 2x7 = 14 ethnic-gender groupings, which is approximately 1.146.
One advantage of this methodological framework is that we can provide a meaningful
answer to the basic question: �How does ethnic segregation compare with gender segrega-
tion?� If there were no segregation by gender within ethnic groups, i.e., if∑
e peMg(e) = 0,
then overall segregation, M∗ in equation (2), would decrease by 20.321.7
x100 = 93.6 percent.
In contrast, if there were no ethnic segregation within genders, i.e., if∑
g pgMe(g) = 0,
then M∗ would only decrease by 1.621.7
x100 = 7.2 percent. Though these numbers merely
con�rm the well-known fact that the segregative force of gender overpowers that of eth-
nicity, it is worth appreciating that the M index allows us to demonstrate that fact in
such a parsimonious and rigorous manner. Traditionally, researchers would produce di-
chotomous indexes for pairs of comparisons ranging from the simplest instance, in which
20

there are only 2 ethnicities and 2 genders, to the 52 ethnic-race-gender groupings studied
by Reskin and Cassirer (1996). In the �rst case, there is a manageable set of(42
)= 6
pairs. However, in the second situation, the output,(522
)= 1, 326 pairs, is so unwieldy
that analysts face �a complexity that does not lend itself to easy summarization� (ibid.:
234).
For comparative purposes, we could calculate(142
)= 91 local M indexes, one for each
pair of our 14 ethnic-gender groupings. Nevertheless, sensu stricto, we cannot set side-by-
side pairwise indexes of, say, gender segregation in a given ethnic group with the indexes
of ethnic segregation for each gender because they do not lie along a common scale of
ethnic and gender segregation. Moreover, using traditional indexes in our comparison
would be very limited because, under the latter approach, local indexes�of ethnic seg-
regation for each gender and of gender segregation for each ethnicity�cannot be added
together, nor can the exclusive contribution of each variable to segregation be isolated.
As explained above in the presentation of the M index, these two latter measurements
are the auxiliary terms needed to identify interactions between ethnicity and gender, as
well as their additive e�ects on segregation. This question is at the core of our inquiry.
We turn our attention to it in the next subsection.
How do gender and ethnicity interact?
To determine how ethnicity and gender combine as sources of occupational segregation,
we can compute intersection I using equation (3), i.e., we subtract fromM∗ the net inputs
of each variable. The result is −0.17 (column 6 in Table 3).14 Therefore, we conclude
that the action of one dimension somehow diminishes the segregative potential of the
other. Thus, the joint e�ect of ethnicity and gender on segregation produces a dwindling
interaction between the two dimensions. Reskin's and Cassirer's (1996) intuition is borne
out by our identi�cation strategy.
Still, we must recognize that the interaction is small. It represents a scant 0.1721.7
x100 =
0.78 percent of the segregation that ethnicity and gender together produce. We can
examine the issue from two perspectives. First, let us focus on ethnic segregation once
we control for gender (column 4 in Table 3). In this case, the index is 1.6. When we do
not exert this control and simply measure ethnic segregation in terms of M e, the �gure14Again, we report the rounded results of calculations with seven signi�cant digits. Hence, we calculate
[0.2168989− (0.0155268 + 0.2030584)]x100 = −0.17
21

is similar, though slightly lower: 1.4 (column 1 in Table 3). In other words, the added
information that we gain by knowing someone's gender does not signi�cantly alter the
occupational distribution predicted on the basis of ethnicity.
Second, let us turn to gender. Because interactions are commutative and because
we already know that ethnic segregation does not vary once we control for gender, after
controlling for ethnicity, gender segregation should remain roughly equal to what it was on
its own. The comparison between columns 5 and 2 of Table 3 con�rms this presumption.
The level of gender segregation increases somewhat, from its value of M g = 20.1 to 20.3
when we control for ethnicity. In brief, conditioning on ethnicity hardly in�uences the
distribution of women and men across occupations. Gender induces more occupational
segregation than ethnicity does, and each factor reduces, very slightly, the impact of the
other on segregation. Altogether, however, each ascribed characteristic segregates workers
independently of the segregation induced, simultaneously, by the other dimension.
This conclusion may surprise theorists of intersectionality.15 Therefore, it is fair to
ask whether it is also surprising in the context of the literature on ethnic and gender
occupational segregation in Great Britain. This corpus is small and recent because o�-
cial statistics have included data on ethnicity only since the 1980s. In particular, three
studies have posed the question of whether ethnicity interacts with gender multiplica-
tively, such that the two statuses reinforce each other in creating segregation for ethnic
minority women. To address this multiplicative conjecture, the three studies have relied
on contingency tables showing the occupational distributions of women and men of var-
ious ethnic groups. However, the authors di�er in the number of ethnicities considered,
the data used, and the degree of detail employed in their occupational classi�cations.
King (1995) analyzes the 1989 Labour Force Survey (LFS), the British equivalent of the
US Current Population Survey, and concentrates on the contrast between the White and
Black categories. In contrast, Abbott and Tyler (1995) and Blackwell (2003) draw on the
1991 Census data, which was the �rst Census to ask for ethnic information. Moreover,
Abbott, Tyler and Blackwell include in their tables all of the ethnic groups that we use
in this article.
These researchers draw very di�erent conclusions. King argues for the intersection of
15Nevertheless, we should recall that our measurements are rooted in quantitative, hypothesis-testingresearch. Consequently, we do not and cannot say anything about the painful, subjective experiences thatensue from the double burden of racism and sexism that minority women experience in their everydaylives (Browne and Misra 2003; McCall 2005).
22
ethnicity and gender in the manner to which we alluded in the literature review section:
�Black women are even more concentrated in `women's jobs' than are white women�
(1995, 26). Abbott and Tyler, conversely, cannot �con�rm any tendency for non-white
women to be segregated uniformly in the `lower' employment grades� (Abbott and Tyler
1995, 339). For her part, Blackwell �nds that Other Asian, Black African, and Chinese
people are more likely to be in the most advantageous occupations than White people.
On these grounds, she concludes that �ethnicity and gender do not combine to create
double disadvantage for minority women in the labor market� (Blackwell 2003, 713).
Surely, to a certain extent, these disparate conclusions are due to the di�erent data
used and to the relatively small sample size of the LFS in comparison to the Census. Ar-
guably, another reason for the discrepancy lies in King's merging of the Black African and
Black Caribbean categories into a single �Black� group. As Blackwell notes, Black people
of African origins are more successful in terms of occupational attainment than Black
people from the Caribbean. Nevertheless, none of these authors employ a systematic
method of identifying the joint e�ect of ethnicity and gender. They rely on contingency
tables of workers' distribution across major occupational titles by ethnicity and gender.
In addition, Blackwell (2003) and Author1 and et.al. (2005) make pairwise comparisons
using the Gini index. In contrast, the method that we propose o�ers a single metric by
which we can conclude, unambiguously, that the dependence between ethnic and gender
segregation is minimal.
Sensitivity of the results to compositional e�ects
The M index is not �margin free�: it is sensitive to the shares of each ethnic-gender group
in the population and to the overall occupational mix. Intuitively, if the proportion of
minority workers varied, our initial uncertainty about a worker's ethnicity would change.
Furthermore, after learning her or his occupation, our ethnic uncertainty would also
adjust to the new proportion. As Frankel and Volij (2011) state, this fact makes the
index �unsuitable for judging whether di�erent (...) groups are becoming more similarly
distributed� across di�erent organizational units over time.
Our research covers one year only. Nevertheless, the violation of the margin free
property could entail that our conclusions regarding intersectionality are driven by the
ethnic composition of the population. Is the observed, but tiny, dwindling e�ect an
23

outcome of the small proportion of minorities in Britain? We explore the consequences
for our results of measuring ethnic and gender segregation in Mixed areas, where the
average percentage of minority workers (11.9) is almost ten times larger than the average
percentage in Non-mixed areas (1.2). Perhaps unsurprisingly, according to the M∗ index,there is more ethnic segregation and a stronger interaction between ethnicity and gender
in areas of the country with sizable ethnic minorities. However, though 88.1 percent of
the working population in the Mixed areas is white, overall segregation would decrease by
a non-negligible 2.820.8
= 13.5 percent if ethnicity played no role in the segregative process
(see columns 3 and 4 of Panel 1, Table 4). Moreover, in column 4 of Table 4, Panel 1, the
net contribution of ethnicity is 2.80.7
x100 = 4.1 times larger than in Non-Mixed areas; and,
�nally, in the column 6, the magnitude of the dwindling interaction is 0.280.05
= 5.9 times
larger.
We conclude that a) the ethnic composition of Local Authority Areas in�uences our
measurements to some extent but that b) it does not alter the main �nding: ethnicity and
gender interact slightly in a dwindling way; on the whole, they bring about segregative
processes that are independent of each other.
The second robustness check involves controlling for a proxy of human capital. Earlier
in the article, we discussed the literature and summarized its expectations in the form
of two arguments. One vision posits that workers are not segregated on account of their
ethnicity and gender but because they have di�erent degrees of work experience due to
their age and educational quali�cations. Leaving aside the possibility of age discrimina-
tion and the fact that investment in education, to a large extent, re�ects class di�erences
(Breen and Jonsson 2005), this picture comes close to the meritocratic ideal: an occupa-
tion for everyone in accordance with one's own merits. If this interpretation is correct,
then ethnic and gender segregation should disappear or, at least, shrink drastically once
di�erences in age and educational attainment are controlled for. Moreover, under these
circumstances, there should be no interaction whatsoever between ethnicity and gender.
Alternatively, each ethnic-cum-gender population subgroup may specialize occupa-
tionally at any given level of human capital: members of each of these subgroups with
minimal quali�cations concentrate in a set of low-level, low-paying occupations with lit-
tle prestige, while the members who obtain educational credentials concentrate in certain
occupations at the top end of the classi�cation. In any case, the outcome in terms of
segregation would be that there is a multiplicative interaction between ethnicity and
24

Table 4: Measurements of Segregation by Human Capital and AreaMutual Information Indexes. England and Wales. Census Data. 2001.
Panel 1: Without controlling for human capital
(1) (2) (3) (4) (5) (6)
Non-mixed areas 0.6 21.7 22.4 0.7 21.7 -0.05Mixed areas 2.5 18.0 20.8 2.8 18.3 -0.28
Panel 2: Controlling for human capital
(1) (2) (3) (4) (5) (6)
Non-mixed areas 0.7 22.8 23.5 0.7 22.8 -0.07Mixed areas 3.2 19.1 22.6 3.5 19.3 -0.28
Notes:
(1) By Ethnic Group
(2) By Gender
(3) Jointly By Ethnic Group and Gender
(4) By Ethnic Group within Gender
(5) By Gender within Ethnic Group
(6) Putative Interaction between Ethnicity and Gender
Only people aged 16 to 64 and in paid work are included.
25

gender�the women and men of each ethnic group are located in di�erent occupational
niches�and such interaction, together with overall segregation, rises once we compare
people of like age and education.
What is the verdict? When we control for human capital, ethnic and gender seg-
regation increases somewhat by 23.5−22.423.5
x100 = 4.7 percent in Non-mixed areas and by22.6−20.8
22.6x100 = 8.0 percent in Mixed areas (column 3 in Table 4). These results bear
out the specialization interpretation to a certain degree: women and minorities follow
relatively di�erentiated occupational careers at each level of human capital, and our
measurement is sensitive to the compositional e�ect that is unveiled once we compare
people of similar age and educational level with each other rather than with the whole
population. This �nding echoes the well-known fact that in spite of the trend towards
gender equalization in education starting in the 1960s (Jacobs 1989), segregation persists
over time at remarkably stable levels. It is reasonable to expect that better proxies for
work experience and education (such as actual years employed and �eld of study; see
Charles and Bradley 2002; England 2010; Shauman 2006) will accentuate the e�ects of
occupational specialization among women and minorities.16
However, the interaction remains �dwindling� rather than multiplicative, and the
change is minimal (column 6 of Table 4). Hence, our major conclusion with regard
to the joint e�ect of ethnicity and gender is robust to this sensitivity check: even given
the occupational specialization that controlling for human capital reveals, each ascribed
characteristic slightly lessens the impact of the other characteristic on segregation. On
the whole each status prompts independent segregative processes.
Conclusions
Fifteen years ago, Le�er and Xu (1996) wrote that �although everyone can be charac-
terized in terms of both a sex and a race, relatively little research explores the e�ects of
the two factors simultaneously on people's work fates.� Likewise, Reskin and co-authors
have called for further research on �the joint e�ects of race and `sex' and for `race' to be
de�ned beyond the Black/white dichotomy� (Reskin, McBrier, and Kmec 1999). In light
16Moreover, as we noted above, the place where people were educated is a factor that may in�uenceoccupational outcomes (Heath and Yu 2005; Platt 2005). Unfortunately, Census data have limitedinformation on �elds of study and none at all on the countries where people obtained their education.
26

of the increasing ethnic diversity of Western labor markets and their enduring gender
inequalities, any sociologist would agree with such a research agenda. What stopped us
then?
In the matter of occupational segregation, it turns out that the limits lay in the com-
forts of our old methodological tool: the DI index. There is no doubt that this index has
contributed much to social research since its introduction in 1955. However, it is striking
that �fty years later, when quantitative articles routinely employ far more sophisticated
models than in the 1950s, most segregation research still relies on a dichotomous measure
that restricts comparisons to men vs. women, white vs. Black, and white vs. Nonwhite,
among others. However, ethnic and gender categories are not mutually exclusive. People
belong to one gender and to one ethnic group at the same time. Moreover, in any given
setting, there are typically more than two ethnic groups. In fact, there are seven in our
data.
The �rst contribution of this article has been to tailor the M index to address Lef-
fer's, Reskin's, Xu's and many others' calls for the joint study of ethnicity and gender
in relation to occupational segregation. We exploit the fact that the M index can be
applied to analyze any partition of the population into as many groups as dictated by the
researcher's goals (which, in our case, are 2x7 = 14 ethnic-cum-gender categories). Up-
dating the sociologists' toolkit in this manner, we have compared, rigorously, the relative
importance of ethnicity and gender to occupational segregation. We have substantiated
the claim that most ethnic and gender segregation would disappear if the share of women
and men in each occupation were equal to their proportion in the overall working popu-
lation. Nevertheless, ethnicity contributes up to 13.5 per cent of all segregation in Mixed
areas, where minorities concentrate. In settings where ethnic groups have similar demo-
graphic weights, and/or where the segregative force of ethnicity is heightened (through,
for example, exacerbated discrimination, an upsurge of occupational specialization among
minorities, or blunt racial apartheid), the gap in the relative importance of ethnicity and
gender may narrow.
However, the main purpose of a methodological framework that isolates the exclusive
contribution of each status to segregation, net of any e�ects due to the other dimension,
lies elsewhere; namely, in the identi�cation of how the two statuses interact. We have
found that there is a small �dwindling� interactive e�ect: ethnicity weakens the segregative
power of gender, and vice versa. But the curtailment is minimal. By and large, the
27

e�ects of ethnicity and gender on segregation are independent of each other. Minority
women su�er segregation on account of both their ethnicity and their gender, but the
consequences of belonging to both statuses overlap almost not at all. In King's terms
(1988), altogether there is double, but not multiple, jeopardy in being an ethnic minority
woman. Such an identi�cation strategy relies on M 's Strong Group Decomposability
property.
Finally, we have conducted two robustness analyses. First, by splitting the population
into two areas de�ned by proportions of ethnic minorities, we have assessed to what extent
our main result is driven by the low presence of minorities in Britain. Second, we have
explored the sensitivity of our results to controlling for age and educational levels. In the
�rst place, unsurprisingly, we have corroborated that, as measured by the M index, there
is more ethnic segregation in ethnically mixed areas than in ethnically homogeneous ones.
In the second place, our results support the specialization rendering of the human capital
theory to a certain extent: women, men and ethnic groups are slightly more segregated
from people of like educational levels and work experience than from the overall working
population because each subgroup specializes occupationally. However, although each
of these two compositional e�ects adds richness to the segregation story, they do not
alter our fundamental �nding: the dwindling, but tiny, interaction between ethnicity and
gender.
References
Åslund, O., and O. N. Skans (2009): �How to measure segregation conditional on the
distribution of covariates,� Journal of Population Economics, 22, 971�981.
(2010): �Will I see you at work? Ethnic workplace segregation in Sweden,
1985-2002,� Industrial and labor relations review, 63(3), pp. 471�493.
Abbott, P., and M. Tyler (1995): �Ethnic Variation in the Female Labour Force: A
Research Note,� The British Journal of Sociology, 46(2), pp. 339�353.
Albelda, R. P. (1986): �Occupational segregation by race and gender, 1958-1981,�
Industrial and Labor Relations Review, 39, 404�411.
28

Aldrich, H., J. Cater, T. Jones, D. M. Evoy, and P. Velleman (1985): �Ethnic
Residential Concentration and the Protected Market Hypothesis,� Social Forces, 63(4),
pp. 996�1009.
Allen, J., and D. Massey (eds.) (1988): The economy in question. Oxford University
Press, Oxford.
Alonso-Villar, O., C. Del Rio, and C. Gradin (2012): �The extent of occupational
segregation in the United States: Di�erences by race, ethnicity, and gender,� Industrial
relations: a journal of economy and society, 51(2), 179�212.
Author1, and et.al. (2005): �Anonymous,� .
Author2, and Author3 (2011): �Anonymous,� .
Author2, Author3, and Other (2005): �An algorithm to reduce the occupational
space in gender segregation studies,� Journal of Applied Econometrics, 20(1), 25�37.
Baron, J. N., and W. T. Bielby (1980): �Bringing the �rms back in: strati�cation,
segmentation, and the organization of work,� American Sociological Review, 45(5), pp.
737�765.
Batnitzky, A., and L. McDowell (2011): �Migration, nursing, institutional discrim-
ination and emotional/a�ective labour: ethnicity and labour strati�cation in the UK
National Health Service,� Social & Cultural Geography, 12(2), 181�201.
Beal, F. M. (1969): �Double Jeopardy: To Be Black and Female,� Hartford Web
Publishing. http://www.hartford-hwp.com/archives/45a/196.html. (Date of retrieval:
6 August 2012).
Becker, G. S. (1971): The Economics of discrimination. The University of Chicago
Press, Chicago.
Becker, H. S. (1963): Outsiders: Studies in the Sociology of Deviance. The Free Press,
New York.
Ben-Porath, Y. (1967): �The Production of Human Capital and the Life Cycle of
Earnings,� Journal of Political Economy, 75(4), pp. 352�365.
29

Berthoud, R. (2000): �Ethnic employment penalties in Britain,� Journal of Ethnic and
Migration Studies, 26(3), 389�416.
Bertrand, M., D. Chugh, and S. Mullainathan (2005): �Implicit Discrimination,�
The American Economic Review, 95(2), pp. 94�98.
Blackwell, L. (2003): �Gender and ethnicity at work: occupational segregation and
disadvantage in the 1991 British Census,� Sociology, 37(4), 713�731.
Blau, F. D., M. C. Brinton, and D. B. Grusky (eds.) (2006): The Declining
Signi�cance of Gender? Russell Sage Foundation, New York.
Bradley, H., and G. Healy (2008): Ethnicity and Gender at Work. Inequalities,
Careers and Employment Relations . Palgrave Macmillan.
Breen, R., and J. O. Jonsson (2005): �Inequality of Opportunity in Comparative
Perspective: Recent Research on Educational Attainment and Social Mobility,� Annual
Review of Sociology, 31(1), 223�243.
Browne, I., and J. Misra (2003): �The intersection of gender and race in the labor
market,� Annual Review of Sociology, 29(1), 487�513.
Carmichael, F., and R. Woods (2000): �Ethnic Penalties in Unemployment and
Occupational Attainment: Evidence for Britain,� International Review of Applied Eco-
nomics, 14(1), 71�98.
Carrington, W. J., and K. R. Troske (1997): �On Measuring Segregation in Sam-
ples with Small Units,� Journal of Business & Economic Statistics, 15(4), pp. 402�409.
Castilla, E. J. (2008): �Gender, race, and meritocracy in organizational careers,�
American journal of sociology, 113(6), pp. 1479�1526.
Catanzarite, L. (2000): �Brown-Collar Jobs: Occupational Segregation and Earnings
of Recent-Immigrant Latinos,� Sociological Perspectives, 43(1), pp. 45�75.
(2003): �Occupational context and wage competition of new immigrant latinos
with minorities and whites,� The Review of Black Political Economy, 31(1-2), 77�94.
30
Charles, M., and K. Bradley (2002): �Equal but Separate? A Cross-National Study
of Sex Segregation in Higher Education,� American Sociological Review, 67(4), pp.
573�599.
Charles, M., and D. Grusky (2004): Occupational ghettos: The worldwide segregation
of women and men. Stanford Univ Press.
Chugh, D. (2004): �Societal and Managerial Implications of Implicit Social Cognition:
Why Milliseconds Matter,� Social Justice Research, 17, 203�222.
Clark, K., and S. Drinkwater (2002): �Enclaves, neighbourhood e�ects and em-
ployment outcomes: Ethnic minorities in England and Wales,� Journal of Population
Economics, 15(1), 5�29.
Clark, K., and S. Drinkwater (2007): Ethnic minorities in the labour market. Dy-
namics and diversity. The Policy Press.
(2009): �Immigrant self-employment adjustment: Ethnic groups in the UK,�
International Journal of Manpower, 30(1/2), 163�175.
(2010): �Patterns of ethnic self-employment in time and space: evidence from
British Census microdata,� Small business economics, 34(3), 323�338.
Cohn, S. (1999): Race, Gender, And Discrimination At Work. Westview Press.
Collins, R. (2000): �Social strati�cation: A micro-macro theory of inequality,� Socio-
logical Theory, 18(1), 17�43.
Cotter, D. A., J. M. Hermsen, and R. Vanneman (2004): �Gender inequality at
work,� Discussion paper, Russell Sage Foundation and Population Reference Bureau.
Cross, M. (ed.) (1992): Ethnic minorities and industrial change in Europe and North
America. Cambridge University Press, Cambridge.
Crouch, C. (1999): Social change in Western Europe. Oxford University Press, Oxford.
Durlauf, S. N. (2004): �Neighborhood e�ects,� in Handbook of Regional and Urban
Economics, ed. by J. V. Henderson, and J.-F. Thisse, vol. 4 of Handbook of Regional
and Urban Economics, chap. 50, pp. 2173�2242. Elsevier.
31

England, P. (2010): �The Gender Revolution,� Gender & Society, 24(2), 149 �166.
Epstein, C. F. (1973): �Positive E�ects of the Multiple Negative: Explaining the Suc-
cess of Black Professional Women,� American Journal of Sociology, 78(4), pp. 912�935.
(2007): �Great Divides: The Cultural, Cognitive, and Social Bases of the Global
Subordination of Women,� American Sociological Review, 72(1), 1�22.
Fagan, C., and J. Rubery (1996): �The salience of the part-time divide in the Euro-
pean Union,� European Sociological Review, 12(3), 227�250.
Fernández, R. (2010): �Does Culture Matter?,� Working Paper 16277, National Bureau
of Economic Research.
Flückiger, Y., and J. Silber (1999): The Measurement of Segregation in the Labor
Force. Physica-Verlag HD.
Frankel, D. M., and O. Volij (2011): �Measuring school segregation,� Journal of
Economic Theory, 146(1), 1�38.
Green, A., D. Owen, and R. A. Wilson (2005): �Changing patterns of employment
by ethnic group and for migrant workers,� Discussion paper, Warwick.
Hakim, C. (2004): Key Issues in Women's Work: Female Diversity and the Polarisation
of Women's Employment. The GlassHouse Press.
Hamming, R. W. (1991): The art of probability for scientists and engineers. Addison-
Wesley Publishing Company.
Hansen, M. N. (1997): �The Scandinavian Welfare State Model: The Impact of the
Public Sector on Segregation and Gender Equality,� Work, Employment & Society,
11(1), 83�99.
Heath, A., D. McMahon, and J. Roberts (2000): �Ethnic di�erences in the labour
market: a comparison of the samples of anonymized records and Labour Force Survey,�
Journal of the Royal Statistical Society: Series A (Statistics in Society), 163(3), 303�
339.
32

Heath, A., and S. Yu (2005): �Explaining ethnic minority disadvantage,� in Under-
standing social change, ed. by A. Heath, J. Ermisch, and D. Gallie, pp. 187�224. Oxford
University Press, Oxford.
Hegewisch, A., H. Liepmann, J. Hayes, and H. Hartmann (2010): �Separate and
Not Equal? Gender Segregation in the Labor Market and the Gender Wage Gap,�
Discussion paper, Institute for Women's Policy Research, http://www.iwpr.org.
Hughes, E. C. (1945): �Dilemmas and contradictions of status,� The American Journal
of Sociology, 50(5), 353�359.
Jacobs, J. A. (1989): �Long-term trends in occupational segregation by sex,� American
Journal of Sociology, 95(1), 160�173.
Jacobs, J. A., and M. Blair-Loy (1996): �Gender, race, local labor markets, and
occupational devaluation,� Sociological Focus, 29(3), 209�230.
Jarman, J., R. M. Blackburn, and G. Racko (2012): �The Dimensions of Occupa-
tional Gender Segregation in Industrial Countries,� Sociology, 46(6), 1003�1019.
Kaufman, R. L. (2010): Race, gender, and the labor market: Inequalities at work. Lynne
Rienner Publishers, Boulder, CO.
King, D. K. (1988): �Multiple Jeopardy, Multiple Consciousness: The Context of a
Black Feminist Ideology,� Signs, 14, 42�73.
King, M. (1995): �Black women's labor market status: Occupational segregation in
the United States and Great Britain,� The Review of Black Political Economy, 24(1),
23�43.
King, M. C. (2009): �Occupational Segregation by Race and Sex in Brazil, 1989-2001,�
The review of black political economy, 36, 113�125.
Leffler, A., and W. Xu (1996): �Gender and race impacts on occupational segrega-
tion, prestige and earnings,� in Women and work. A handbook, ed. by P. J. Dudeck,
and K. Borman. Garland Publishing, Inc., New York.
33

Leslie, D., S. Drinkwater, and N. O'Leary (1998): �Unemployment and earnins
among Britain's ethnic minorities: some signs for optimism,� Ethnic and Racial Studies,
25, 489�506.
Lieberson, S. (1988): A Piece of the Pie: Blacks and White Immigrants Since 1880.
University of California Press.
Lieberson, S., and M. C. Waters (1988): From many strands. Ethnic and racial
groups in contemporary America. Russell Sage Foundation, New York.
Lupton, R., and A. Power (2004): �Minority ethnic groups in Britain,� CASE-
Brookings Census Briefs, 2.
Mandel, H. (2012): �Winners and Losers: The Consequences of Welfare State Policies
for Gender Wage Inequality,� European Sociological Review, 28(2), 241�241.
Massey, D. S., and N. A. Denton (1988): �The Dimensions of Residential Segrega-
tion,� Social Forces, 67(2), pp. 281�315.
McCall, L. (2001): Complex inequality: Gender, class and race in the new economy.
Routledge, New York.
McCall, L. (2005): �The Complexity of Intersectionality,� Signs, 30(3), 1171�1800.
Mintz, B., and D. H. Krymkowski (2011): �The intersection of race/ethnicity and
gender in occupational segregation. Changes over time in the contemporary United
States,� International Journal of Sociology, 40(4), 31�58.
Misra, J. (2012): �Introduction,� Gender & Society, 26(1), 5�13.
Modood, T., and R. Berthoud (1997): Ethnic minorities in Britain. Policy Studies
Institute, London.
Moss, P., and C. Tilly (2001): Stories employers tell: Race, skill, and hiring in
America. Russell Sage Foundation, New York.
Nakano Glenn, E. (1985): �Racial Ethnic Women's Labor: The Intersection of Race,
Gender and Class Oppression,� Review of Radical Political Economics, 17(3), 86�108.
34

ONS (2000): �Standard Occupational Classi�cation 2000. Volume 1: Structure and Def-
inition of the Unit Groups,� .
Owen, D., and A. Green (1992): �Labour market experience and occupational change
amongst ethnic groups in Great Britain,� Journal of Ethnic and Migration Studies,
19(1), 7�29.
Pang, M., and A. Lau (1998): �The Chinese in Britain: working towards success?,�
The International Journal of Human Resource Management, 9(5), 862�874.
Parker, S. C. (2004): The economics of self-employment and entrepreneurship. Cam-
bridge University Press, Cambridge.
Phelps, E. S. (1972): �The Statistical Theory of Racism and Sexism,� The American
Economic Review, 62(4), pp. 659�661.
Phizacklea, A., and C. Wolkowitz (1995): Homeworking Women: Gender, Racism
and Class at Work. Sage Publications Ltd, London.
Platt, L. (2005): Migration and social mobility. The life chances of Britain's minority
ethnic communities. The Policy Press, Bristol.
Puyenbroeck, T. V., K. D. Bruyne, and L. Sels (2012): �More than `Mutual
Information': Educational and sectoral gender segregation and their interaction on the
Flemish labor market,� Labour Economics, 19(1), 1 � 8.
Reardon, S. F., and G. Firebaugh (2002): �Measures of Multigroup Segregation,�
Sociological Methodology, 32, pp. 33�67.
Reskin, B. (1993): �Sex segregation in the workplace,� Annual Review of Sociology, 19,
241�270.
Reskin, B., and N. Cassirer (1996): �Occupational segregation by gender, race and
ethnicity,� Sociological Focus, 29(3), 231�243.
Reskin, B. F., D. B. McBrier, and J. A. Kmec (1999): �The determinants and
consequences of workplace sex and race composition,� Annual Review of Sociology,
25(1), 335�361.
35
Reskin, B. F., and I. Padavic (1999): �Sex, race, and ethnic inequality in United
States workplaces,� in Handbook of the Sociology of Gender, ed. by J. S. Chafetz.
Kluwer Academic/Plenum Publishers, New York.
Reskin, B. F., and P. A. Roos (1990): Job Queues, Gender Queues. Explaining
Women's Inroads into Male Occupations. Temple University Press.
Ridgeway, C. L. (2006): �Gender as an organizing force in social relations: Implications
for the future of inequality,� in The declining signi�cance of gender?, ed. by F. D. Blau,
M. C. Brinton, and D. B. Grusky. Russell Sage Foundation.
Shauman, K. A. (2006): �Occupational sex segregation and the earnings of occupations:
What causes the link among college-educated workers?,� Social Science Research, 35(3),
577 � 619.
Simpson, L., and B. Akinwale (2007): �Quantifying stability and change in ethnic
group,� Journal of O�cial Statistics, 23(2), 185.
Tienda, M., and D.-T. Lii (1987): �Minority concentration and earnings inequality:
Blacks, Hispanics, and Asians compared,� American Journal of Sociology, 93(1), 141�
165.
Tomaskovic-Devey, D. (1993): Gender and Racial Inequality at Work: The Sources
and Consequences of Job Segregation. ILR Press, Ithaca, New York.
Waldinger, R., and C. Feliciano (2004): �Will the new second generation experi-
ence `downward assimilation'? Segmented assimilation re-assessed,� Ethnic and Racial
Studies, 27(3), 376�402.
West, C., and D. Zimmerman (1987): �Doing gender,� Gender & society, 1(2), 125�
151.
Winship, C. (1977): �A Revaluation of Indexes of Residential Segregation,� Social Forces,
55(4), pp. 1058�1066.
Wright, R., and M. Ellis (2000): �The Ethnic and Gender Division of Labor Com-
pared Among Immigrants to Los Angeles,� International Journal of Urban and Regional
Research, 24(3), 583�600.
36

Xu, W., and A. Leffler (1992): �Gender and race e�ects on occupational prestige,
segregation, and earnings,� Gender & Society, 6(3), 376�392.
37