Observations of the thermal environment on Red Sea platform reefs: a heat budget analysis
12
REPORT Observations of the thermal environment on Red Sea platform reefs: a heat budget analysis K. A. Davis • S. J. Lentz • J. Pineda • J. T. Farrar • V. R. Starczak • J. H. Churchill Received: 31 October 2010 / Accepted: 21 February 2011 / Published online: 11 March 2011 Ó Springer-Verlag 2011 Abstract Hydrographic measurements were collected on nine offshore reef platforms in the eastern Red Sea shelf region, north of Jeddah, Saudi Arabia. The data were analyzed for spatial and temporal patterns of temperature variation, and a simple heat budget analysis was performed with the goal of advancing our understanding of the physical processes that control temperature variability on the reef. In 2009 and 2010, temperature variability on Red Sea reef platforms was dominated by diurnal variability. The daily temperature range on the reefs, at times, excee- ded 5°C—as large as the annual range of water temperature on the shelf. Additionally, our observations reveal the proximity of distinct thermal microclimates within the bounds of one reef platform. Circulation on the reef flat is largely wave driven. The greatest diurnal variation in water temperature occurs in the center of larger reef flats and on reefs protected from direct wave forcing, while smaller knolls or sites on the edges of the reef flat tend to experi- ence less diurnal temperature variability. We found that both the temporal and spatial variability in water temper- ature on the reef platforms is well predicted by a heat budget model that includes the transfer of heat at the air–water interface and the advection of heat by currents flowing over the reef. Using this simple model, we predicted the temperature across three different reefs to within 0.4°C on the outer shelf using only information about bathymetry, surface heat flux, and offshore wave conditions. Keywords Heat budget Temperature variability Red Sea Platform reef Reef circulation Introduction Coral reefs typically thrive in environments characterized by a high degree of thermal stability (Hoegh-Guldberg 1999). Rising sea surface temperatures due to global cli- mate change are a severe threat to coral reefs, as reef corals live near their upper thermal limits (Goreau et al. 2000; Guinotte et al. 2003; Cantin et al. 2010). Coral bleaching is the loss of pigmentation due to the breakdown of symbiosis between reef-building corals and their symbiotic algae (zooxanthellae). Elevated temperature is the primary cause of mass coral bleaching events (Glynn 1993), but recent work also suggests that organismal response to temperature variation is complex; it can depend on other biological and physiochemical factors such as the history of thermal exposure, ability to adapt or acclimate to thermal changes, short-term temperature variability, water flow, heterotro- phic feeding, and light (Nakamura and van Woesik 2001; Berkelmans 2002; Lesser et al. 2004; McClanahan et al. 2005; Sammarco et al. 2006; Palardy et al. 2008; Weller et al. 2008). These factors contribute to the high degree of spatial variability in coral bleaching observed at global, regional, and even individual reef scales (Riegl and Piller 2003; McClanahan et al. 2005). The work presented here was inspired by observations revealing distinct thermal microclimates on table reef plat- forms on the Saudi coast of the Red Sea during a shelf-wide Communicated by Guest Editor Dr. Clifford Hearn K. A. Davis S. J. Lentz J. T. Farrar J. H. Churchill Department of Physical Oceanography, Woods Hole Oceanographic Institution, Woods Hole, MA 02543, USA K. A. Davis (&) J. Pineda V. R. Starczak Biology Department, Woods Hole Oceanographic Institution, Woods Hole, MA 02543, USA e-mail: [email protected] 123 Coral Reefs (2011) 30:25–36 DOI 10.1007/s00338-011-0740-8
-
Upload
independent -
Category
Documents
-
view
2 -
download
0
Transcript of Observations of the thermal environment on Red Sea platform reefs: a heat budget analysis

REPORT
Observations of the thermal environment on Red Sea platformreefs: a heat budget analysis
K. A. Davis • S. J. Lentz • J. Pineda •
J. T. Farrar • V. R. Starczak • J. H. Churchill
Received: 31 October 2010 / Accepted: 21 February 2011 / Published online: 11 March 2011
� Springer-Verlag 2011
Abstract Hydrographic measurements were collected on
nine offshore reef platforms in the eastern Red Sea shelf
region, north of Jeddah, Saudi Arabia. The data were
analyzed for spatial and temporal patterns of temperature
variation, and a simple heat budget analysis was performed
with the goal of advancing our understanding of the
physical processes that control temperature variability on
the reef. In 2009 and 2010, temperature variability on Red
Sea reef platforms was dominated by diurnal variability.
The daily temperature range on the reefs, at times, excee-
ded 5�C—as large as the annual range of water temperature
on the shelf. Additionally, our observations reveal the
proximity of distinct thermal microclimates within the
bounds of one reef platform. Circulation on the reef flat is
largely wave driven. The greatest diurnal variation in water
temperature occurs in the center of larger reef flats and on
reefs protected from direct wave forcing, while smaller
knolls or sites on the edges of the reef flat tend to experi-
ence less diurnal temperature variability. We found that
both the temporal and spatial variability in water temper-
ature on the reef platforms is well predicted by a heat
budget model that includes the transfer of heat at the
air–water interface and the advection of heat by
currents flowing over the reef. Using this simple model, we
predicted the temperature across three different reefs to
within 0.4�C on the outer shelf using only information
about bathymetry, surface heat flux, and offshore wave
conditions.
Keywords Heat budget � Temperature variability �Red Sea � Platform reef � Reef circulation
Introduction
Coral reefs typically thrive in environments characterized
by a high degree of thermal stability (Hoegh-Guldberg
1999). Rising sea surface temperatures due to global cli-
mate change are a severe threat to coral reefs, as reef corals
live near their upper thermal limits (Goreau et al. 2000;
Guinotte et al. 2003; Cantin et al. 2010). Coral bleaching is
the loss of pigmentation due to the breakdown of symbiosis
between reef-building corals and their symbiotic algae
(zooxanthellae). Elevated temperature is the primary cause
of mass coral bleaching events (Glynn 1993), but recent
work also suggests that organismal response to temperature
variation is complex; it can depend on other biological and
physiochemical factors such as the history of thermal
exposure, ability to adapt or acclimate to thermal changes,
short-term temperature variability, water flow, heterotro-
phic feeding, and light (Nakamura and van Woesik 2001;
Berkelmans 2002; Lesser et al. 2004; McClanahan et al.
2005; Sammarco et al. 2006; Palardy et al. 2008; Weller
et al. 2008). These factors contribute to the high degree of
spatial variability in coral bleaching observed at global,
regional, and even individual reef scales (Riegl and Piller
2003; McClanahan et al. 2005).
The work presented here was inspired by observations
revealing distinct thermal microclimates on table reef plat-
forms on the Saudi coast of the Red Sea during a shelf-wide
Communicated by Guest Editor Dr. Clifford Hearn
K. A. Davis � S. J. Lentz � J. T. Farrar � J. H. Churchill
Department of Physical Oceanography, Woods Hole
Oceanographic Institution, Woods Hole, MA 02543, USA
K. A. Davis (&) � J. Pineda � V. R. Starczak
Biology Department, Woods Hole Oceanographic Institution,
Woods Hole, MA 02543, USA
e-mail: [email protected]
123
Coral Reefs (2011) 30:25–36
DOI 10.1007/s00338-011-0740-8

circulation study from October 2008 to May 2010. Tem-
perature variability on the Red Sea reef platforms is strongly
diurnal, and as we show below, the daily temperature range
can vary drastically across the reef. For example, a coral on
the wave-exposed side of the reef, which is regularly flushed
with water from the shelf, may experience a diurnal water
temperature range of 0.5–1.5�C, while colonies of the same
species in the interior or wave-protected side of the reef
platform, approximately 200 m away, experience a 2–5�C
diurnal range. Spatial patterns in temperature variation on
reefs have been shown to influence the distribution of stress-
tolerant coral symbionts (Glynn et al. 2001) and, recently,
much attention has focused on the potential for corals to
increase their thermal tolerance through a shift to more
stress-tolerant symbiont assemblages (Buddemeier and
Fautin 1993; Jones et al. 2008a, b; Oliver and Palumbi
2009). The history of local environmental conditions on a
reef can influence the acclimation and adaptation of corals to
extreme thermal events (Riegl and Piller 2003). To improve
our understanding of the role that local environmental con-
ditions play in coral bleaching and mortality, it is crucial to
have a detailed understanding of the physical processes that
shape the hydrodynamic and thermal environment on reefs.
Nadaoka et al. (2001) conducted a month-long obser-
vational study on a fringing reef in Okinawa and found that
spatial variability in water temperature was influenced by
atmospheric conditions and the horizontal advection of
water from a river plume and from offshore of the reef.
Similar results were found by Smith (2001) in a study of
heat fluxes on a Bahamian reef during a bleaching event in
July and August 1990. Smith (2001) found that anoma-
lously high water temperature during the bleaching episode
was due to a combination of low winds, which reduced
evaporative cooling, and the advection of warm water onto
the reef from both along- and across-shelf currents. Schiller
et al. (2009) used ocean reanalysis data to examine the
dynamical drivers of sea surface temperature (SST) anom-
alies in the Coral Sea and Great Barrier Reef. The authors
found that mean horizontal advection largely controls SST
in the region for most of the year, but that eddy-induced heat
flux becomes important during extreme SST anomalies.
In a study of coral health and recovery after the
worldwide 1998 coral bleaching event, Riegl and Piller
(2003) suggested that the upwelling of cool, deep water
onto reefs in the Bahamas and South Africa may be
responsible for the reduced bleaching observed at these
locations. Vertical mixing driven by wind stress and tidal
flows around reefs can also act to cool down surface water
and may be another factor responsible for the spatial var-
iability observed in thermal stress on reefs (Bird 2005;
Skirving et al. 2006).
These studies identify several mechanisms that influence
the thermal environment on reefs, but observational work
in this area is limited to studies with relatively short time
series (Nadaoka et al. 2001; Smith 2001) or those without
local meteorological measurements (Bird 2005) forcing
them to rely on surface heat fluxes calculated from distant
meteorological data or from model or satellite-derived
products which can have large uncertainties. Here, we use a
20-month record of meteorological conditions, currents,
and water temperatures to examine temporal and spatial
patterns of temperature variation on Red Sea platform reefs
and the surrounding shelf and to perform a simple heat
budget analysis with the goal of advancing our under-
standing of the physical processes that shape the thermal
environment on the reef. Additionally, these measurements
are of value because there are few time series of oceano-
graphic and meteorological properties in this region that
can be used to characterize the physical conditions on the
Red Sea reef systems.
Measurements and methodology
Field site description
Hydrographic measurements were collected on offshore
reef platforms in the eastern Red Sea shelf region, north of
Jeddah, Saudi Arabia (Fig. 1a). The climate in this region is
arid, with strong evaporation (*2 m year-1) and very little
precipitation or river runoff (Sofianos and Johns 2002). In
the northern part of the Red Sea (north of 19–20�N), winds
are primarily from the northwest throughout the year
(Fig. 1a), modified by a strong diurnal land–sea breeze
cycle in the coastal regions and, in the winter, by a series of
westward-blowing mountain gap wind jets along the Saudi
Arabian coast (Jiang et al. 2009). Tidal currents in the
central and northern Red Sea are mixed semi-diurnal and
are weak (Sofianos and Johns 2007).
The coral reefs in the vicinity of Jeddah are classified as
either fringing reefs or offshore reef platforms (Montag-
gioni et al. 1986). Fringing reefs line the shore and typi-
cally have a reef flat and steep reef slope area on the
offshore side but can also have shallow lagoons between
the reef and shore with coral knobs and patches. Farther
offshore, reef platforms rise from the sandy shelf bottom
(depth *20–50 m) to within a meter of the surface with
reef flats composed of coral rubble and scattered live coral
colonies (predominantly Stylophora pistillata) and steeply
sloping flanks on all sides that are more densely populated
with a diverse assemblage of corals including Pocillopora
spp., Porites spp., Acropora spp., Millepora spp., and
Platygyra spp. and coralline algae. The offshore reef
platforms can vary in size and shape from submerged coral
patches (*10 m2) to coral knolls (*103 m2) to elongate or
crescentic table reefs (*105–106 m2) (Montaggioni et al.
26 Coral Reefs (2011) 30:25–36
123

1986). The four northern reefs instrumented in this study
(Shi’b Nazar, Tahala, Al Degaig, and Abu Madafi, Fig. 1b)
are best classified as table reefs, elongated in the along-
shore dimension with a cross-shore scale of 100–500 m.
The reefs in the Qita Dukais system are smaller, knoll-like
platforms that are round or elliptical in shape and have no
preferred orientation to the shoreline. Sea surface height
fluctuates seasonally with wind patterns over the Red Sea
(Sofianos and Johns 2001). Average water depth on the reef
flat during the winter is approximately 1 and 0.5 m in the
summer.
Experiment
The observations presented here are part of a larger, multi-
year study of coral ecology, shelf-scale circulation, and
air–sea dynamics in the Red Sea. We restrict our focus to
measurements of meteorological conditions, currents, and
water temperatures on nine offshore reef platforms (Tahala,
Shi’b Nazar, Al Degaig, Abu Madafi, and five reefs in the
Qita Dukais system) and the surrounding shelf (see
Fig. 1b) collected from October 2008 to May 2010.
Temperature was measured on all reef flats, with the
exception of Shi’b Nazar, using Onset Computer Corpo-
ration’s HOBO U22 Water Temp Pro sensors attached to a
small lead weight and placed on the bottom by a snorkler.
Onset Temp Pros have a stated accuracy of 0.2�C; how-
ever, with careful calibration in the laboratory, in situ
comparisons to more accurate temperature sensors have
shown that accuracy can be improved to 0.02�C. Table 1
details the number of sensors distributed on each reef. On
Tahala, Al Degaig, and Abu Madafi reefs, two temperature
sensors were placed on the offshore or wave-exposed side
of the reef flat with two further sensors on the onshore or
wave-protected side. Within the Qita Dukais reef system,
temperature sensors were concentrated on two of the
largest coral knolls (‘‘QD1’’ and ‘‘QD2’’) and a few sensors
were also placed on smaller reefs (see Fig. 6 for sensor
distribution in the Qita Dukais reef system). In addition to
temperature sensors, a 2-MHz Nortek AquaDopp Profiler
and Seabird SBE-37 Microcat were placed on reef QD1
and later on QD2 to measure currents, temperature, and
conductivity.
To characterize the environmental conditions on the
shelf surrounding the reefs, vertical arrays of temperature
sensors, including Seabird SBE-39s, Seabird SBE-37s,
RBR-1060s, RBR-2050s (all measuring temperature to
±0.002�C), and Onset Temp Pros, were deployed on taut-
line moorings on the forereefs of Shi’b Nazar, Tahala, Al
Degaig, and Qita Dukais and on the outer shelf at Mooring
K2, at which conductivity was also measured using SBE-
37s. Vertical profiles of water velocity were measured with
an upward-looking Teledyne RDI Acoustic Doppler Cur-
rent Profiler (ADCP) mounted on a bottom tripod at the K2
site (Fig. 1; see mooring details in Table 1). Tidal analysis
was performed using the MATLAB toolbox T_TIDE
(Pawlowicz et al. 2002).
The meteorological data used in this study are taken
from a surface buoy deployed in 700 m of water (about
30 km offshore of Abu Madafi) and a 9-m coastal meteo-
rological tower located on the campus of the King
Abdullah University of Science and Technology (KAUST).
Both the surface buoy and tower carry improved meteo-
rological (IMET) sensor suites for measuring wind speed
and direction, air temperature, relative humidity, baro-
metric pressure, incoming shortwave radiation, incoming
longwave radiation, and precipitation, which allow for
estimates of the air–sea exchange of heat, freshwater, and
momentum (Hosom et al. 1995; Colbo and Weller 2009).
22°00
Shi’bNazar
Qita Dukais
Abu Madafi
Al Degaig
Tahala22°15
38°45 39°00
30°N
20°N
10°N 54°E 42°E 30°E
Sea
Red
Jeddah
K2
Met.Tower
10 km
5%
10%
W E
S
N
0 − 2 2 − 4 4 − 6 6 − 8 8 − 10 10 − 12
Wind speed (m s-1)
(a) (b)Fig. 1 a Regional map of study
location and windrose showing
the direction (from which wind
blows) and magnitude of winds
measured from October 2008
through October 2009 at the
meteorological buoy and
b USGS LandSAT image of
study area. Mooring locations
are indicated with red circles,
and the meteorological tower is
indicated with a yellow circle.
The meteorological buoy is
approximately 30 km offshore
of Abu Madafi and is not shown
Coral Reefs (2011) 30:25–36 27
123
Additionally, SST (at 0.6 m depth) and surface wave
height were measured at the buoy.
Heat budget analysis
Here, we present the equations and define the coordinate
system for a heat budget analysis on a reef platform. The
coordinate system is aligned with the shape of the reef plat-
form, which can be approximated as an ellipse. The temper-
ature balance on the reef can be represented as follows:
oT
otþ ui
oT
oxi¼ � o
oxiu0iT0 þ S ð1Þ
where we use the summation convention with the index
i = 1–3 and a right-handed coordinate system is adopted
with the principle axes defined by xi: x, aligned with the
minor axis of the elliptical reef shape and positive toward
the back reef, y, aligned with the major axis of the reef, and
z, positive upward. ui represents the corresponding velocity
components u, v, and w, and T is water temperature.
Overbars denote time-averaged quantities (in the case of
our calculations, 1-h averages), and primed values are the
fluctuating components ui ¼ ui þ u0i; T ¼ T þ T 0� �
: The
terms on the left-hand side of Eq. 1 represent the rate of
change of temperature and the divergence of the advective
heat flux. The terms on the right-hand side represent
turbulent heat flux (including unresolved heat fluxes—
anything with time scales of less than an hour) and sources
or sinks of heat (S), respectively. Current measurements
were only collected at one location on top of the reef, and
Table 1 Details of moored instrumentation
Mooring type Location Water
depth
Sensors
Shi’b Nazar Reef
Vertical taut-line mooring
on the forereef
22�19.8530N
38�51.1170E
16.7 m Eight temperature sensors on vertical array from 1.8 to 15.7 meters depth
Tahala Reef
Vertical taut-line mooring
on the forereef
22�15.6880N
39�02.8240E
19.0 m Five temperature sensors on vertical array from 2.1 to 18 meters depth
Reef platform instruments 22�15.7720N
39�03.0930E
0.8–1.0 m Four Onset Temp Pro sensors spread across reef platform from April to October 2009
Al Degaig Reef
Reef platform instruments 22�12.9600N
38�59.2020E
0.6–0.9 m Four Onset Temp Pro sensors spread across reef platform from October 2008 to October
2009
Abu Madafi Reef
Vertical taut-line mooring
on the forereef
22�04.4850N
38�46.2260E
16.6 m Six temperature sensors on vertical array from 2.2 to 16 meters depth
1,200 kHz ADCP, upward looking from a tripod
Reef platform instruments 22�04.3120N
38�46.2380E
0.7–0.9 m Four Onset Temp Pro sensors spread across reef platform from April to October 2009
Qita Dukais Reef System
Vertical taut-line mooring
on the forereef
21�57.5750N
38�50.2000E
19.6 m 10 temperature sensors on vertical array from 0.6 to 9.8 meters depth
Reef platform instruments 21�58.0420N
38�50.1690E
1.3 m
0.6–2.1 m
2 MHz Nortek AquaDopp Profiler and a Seabird SBE-37 MicroCat
14 Onset Temp Pro sensors spread across five reef platforms from Oct. 2008 to April
2009 increased to 25 sensors from April 2009 to May 2010.
K2 (Outer shelf)
Vertical taut-line mooring
and current meter
21�56.7290N
38�46.8270E
48.3 m 17 temperature sensors on vertical array from 0.6 to 47.3 meters depth
600 kHz ADCP, mounted on a tripod, looking upward from the bed
Meteorological Measurements
Meteorological Buoy 22�09.6380N
38�30.0690E
697 m Measurements: barometric pressure, air temperature, relative humidity, wind speed and
direction, shortwave radiation, longwave radiation, precipitation, sea surface
temperature and salinity, wave height, period, and direction
Meteorological tower 22�17.8230N
39�05.5670E
On land Measurements: barometric pressure, air temperature, relative humidity, wind speed and
direction, shortwave radiation, and longwave radiation
For Reef Platform moorings, the location given is in the center of the reef platform and the depth represents the range of water depths in which
the reef-top sensors were deployed
28 Coral Reefs (2011) 30:25–36
123

thus we cannot directly calculate spatial gradients in the
turbulent transport of heat. However, this term can be
estimated from a gradient diffusion-type model:
o
oxiu0iT0i �
o
oxi�Ki
oT
oxi
� �� � Ki
o2T
ox2i
; ð2Þ
where Ki is the turbulent diffusivity.
Using the parameterization in Eq. 2, Ki * 0.1–1 m2 s-1
(Sundermeyer and Ledwell 2001; Jones et al. 2008b),
and an estimate of spatial gradients in temperature across
the reef derived from observations on the most densely
instrumented reef platforms in the Qita Dukais system, we
estimate turbulent heat flux to be more than an order of
magnitude smaller than the advective or surface heat flux.
This is not sufficient justification for neglect of this term,
especially since it seems likely that there will be times
when turbulent heat flux will be of first-order importance.
However, due to our inability to directly calculate turbulent
heat flux, or alternatively, to have a better estimate of Ki,
we will not include this term in the heat budget.
Vertically averaging Eq. 1 over the water column,
Th i ¼ 1
h
Zh
0
Tdz; uih i ¼1
h
Zh
0
uidz; ð3Þ
neglecting the turbulent flux term, and multiplying by the
heat capacity per unit volume (qcp; assumed constant and
equal to 4.1 9 106 W s m-3�C-1), gives an expression for
the heat balance within a volume of water of unit length
and width, with the top defined by the water surface
(z = h) and bottom defined by the bed (z = 0):
qcpho Th iot¼ �qcph uih i
o Th ioxiþ QN þ Qbed: ð4Þ
In the derivation of Eq. 4, we assume that water
temperature is vertically uniform in the water column
above the reef. Over a very rough coral bed, the vertical
turbulent mixing is likely to be strong enough to maintain a
nearly uniform temperature under most conditions. We
tested this assumption using two temperature sensors on the
reef flat separated vertically by 0.5 m and horizontally by
2 m, and they typically agreed to within the calibration
uncertainty of the instruments. Eq. 4 also assumes that h
does not vary spatially over the unit area or in time over the
period of the calculation of these terms (1 h, in this case).
The left-hand side of Eq. 4 represents the rate of change of
heat storage within the volume (QT). The terms on the
right-hand side of Eq. 4 are the advection of heat through
the sides of the volume (DF) and the flux of heat through
the water surface and the bed, respectively, and can be
written as follows:
QT ¼ DF þ QN þ Qbed: ð5Þ
In this study, we assume that vertical advective heat flux
due to groundwater movement and direct thermal conduction,
Qbed, is negligible, so that
QT ¼ DF þ QN : ð6Þ
Net heat flux between the ocean and atmosphere, QN, is
calculated as follows:
QN ¼ QE þ QH þ QS þ QL ð7Þ
where the terms on the right-hand side of Eq. 7 represent
latent, sensible, net shortwave, and net longwave heat flux,
respectively. Incoming shortwave radiation was corrected
for surface reflection using an albedo that accounts for
atmospheric transmittance (Payne 1972), plus an additional
albedo (10%) to account for the reflectance of the coral bed in
shallow water (Maritorena et al. 1994). Longwave, latent,
and sensible heat fluxes were computed using a modified
version 2.5 TOGA (Tropical Oceans Global Atmosphere)
COARE (Coupled Ocean–Atmosphere Response Experi-
ment) bulk algorithm (Fairall et al. 1996, 2003). Cool skin
and warm layer corrections were not applied. DF is estimated
from currents measured by the AquaDopp profiler on the reef
flat and across-reef and along-reef temperature gradients,
which are approximated by the centered difference of three
reef-top temperature sensors aligned in each direction.
Results
Water temperature on the Red Sea reef platforms is
spatially and temporally variable. Figure 2 illustrates the
differences in water temperature on the wave-exposed and
wave-protected sides of Abu Madafi reef, on the outer
shelf, and Tahala reef, on the inner shelf, for a week in
August 2009. This time series represents a period with
some of the largest temperature variability in our obser-
vations. Water temperature on the side of the reefs pro-
tected from direct wave forcing has a larger diurnal range
than on the wave-exposed side. For example, a coral on the
wave-exposed side of the reef, which is regularly flushed
with water from the shelf, may experience a diurnal tem-
perature range of 0.5–1.5�C, while the same species on
wave-protected side of the reef platform, approximately
200 m away, experiences a 2–5�C diurnal range.
Temperature variability across the shelf
Water temperature on the shelf surrounding the Red Sea
reef platforms varied seasonally in 2009, with minimum
temperatures near 25�C occurring between January and
March and maximum temperatures above 32�C in late
Coral Reefs (2011) 30:25–36 29
123

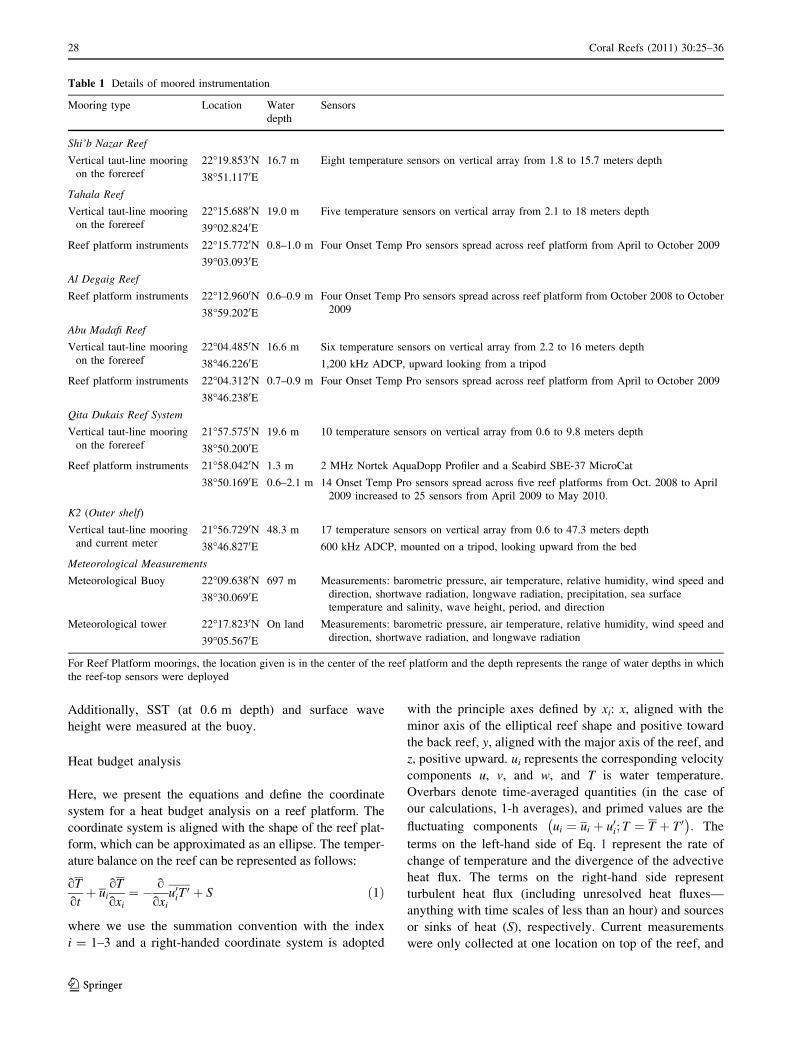
August (Fig. 3). In late fall and winter, shelf water tem-
perature decreases and there is relatively little stratification
(N2 = 2 9 10-5 s-2 on the forereef of Abu Madafi, where
N ¼ffiffiffiffiffiffiffiffiffiffiffi� g
q0
oqoz
q; q is potential density, q0 is a reference
density, g represents gravitational acceleration). During a
period of steady cooling, from November 2008 to January
2009 (Fig. 3), inner shelf waters at Tahala are approxi-
mately a degree cooler than middle and outer shelf waters
(Qita Dukais, Abu Madafi, Shi’b Nazar). In late spring and
summer, shelf waters warm, stratification strengthens
(N2 = 2 9 10-4 s-2), and inner shelf waters at Tahala are
warmer than middle and outer shelf waters. Periods of
cooling water temperatures, 1 to 3 weeks in duration, are
superimposed on the annual temperature variation at all
sites and may be due to wind-forced coastal upwelling on
the eastern Red Sea shelf. An empirical orthogonal function
(EOF) analysis of 33-h low-pass-filtered, depth-averaged
water temperature on the forereefs of Shi’b Nazar, Tahala,
Abu Madafi, and Qita Dukais reveals the spatial structure of
the dominant mode, accounting for 97% of temperature
variance, to be approximately uniform between the sites
(not shown), suggesting that sub-diurnal frequency tem-
perature variability is generally similar across the shelf.
While sub-diurnal temperature variability is fairly
uniform across the shelf, diurnal oscillations in water
temperature can look very different between sites. As an
example, Fig. 4 presents week-long time series of water
temperature at 0.6-m depth at the meteorological buoy and
on the reef flat of QD1 in the Qita Dukais reef system for
both winter and summer seasons. Temperatures on the reef
have larger diurnal variations than surface temperature
offshore. In the winter, the diurnal temperature variation on
the reef can be fairly small, on the order of a 0.25–0.5�C,
but in the summer, it can approach 6�C, when offshore
surface waters vary only by 1.5–2�C. In the following
section, we will show that there can be a significant amount
of spatial variability in the thermal environment within the
bounds of one reef platform.
Temperature variability on the reef platforms
The temperature of water on the reef platforms is influ-
enced by seasonal cycles and synoptic wind-forcing events
but also by small-scale circulation over and around the reef
platforms, which controls the exchange of water with the
surrounding shelf. Reef platforms rise sharply from the
shelf to within a meter of the surface, and this inhomoge-
neity can lead to a high degree of spatial variability in the
temperature field and the creation of thermal microclimates
on the reef platform.
Circulation on the reef flat is largely wave-driven, with
currents primarily to the southeast, in the direction of pre-
vailing wind and waves. Previous studies have shown that
waves break on the steeply sloping flanks of the reef, cre-
ating a spatial gradient in wave radiation stress and a super-
elevation of water level above the mean sea level (wave
‘‘setup’’), driving flow over the shallow reef flat, from the
reef crest to the backreef (Longuet-Higgins and Stewart
1964; Tait 1972; Symonds et al. 1995; Hearn 1999; Coro-
nado et al. 2007; Hench et al. 2008). Significant wave height
measured at the meteorological buoy ranged from less than
0.1–4.5 m with mean 0.94 ± 0.54 m. Currents measured
on reef QD1 in the Qita Dukais reef system had a maximum
speed of 25 cm s-1 and mean 8.8 ± 5.4 cm s-1. Cross-reef
currents on the reef were strongly correlated with offshore
wave height (r = 0.87, P-value \ 0.0001) but less corre-
lated with eastward wind stress (approximately directed
across the reef, r = 0.50, P-value \ 0.0001) or wind stress
magnitude (r = 0.60, P-value \ 0.0001). While wave
height is strongly coupled to wind stress magnitude in this
region (r = 0.80, P-value \ 0.0001), direct wind forcing
on the reef, estimated from a simple balance between bot-
tom stress and total wind stress (not shown), only accounts
for reef currents on the order of a few cm s-1. The tidal
amplitude of sea surface height is 5–20 cm; however, a tidal
analysis of currents measured in the center of the reef
demonstrates that the tide explains less than 5% of the reef-
top velocity variance.
An approximate estimate of the residence time of water
on the reef can be calculated as RT = V/Q, where V is the
volume of water on the reef and Q is the volumetric flow
rate. V was estimated by approximating the reef as a 200-
by 600-m rectangle with an average water depth of 1 m,
and the volumetric flow rate was estimated from the
4 6 8 1030
31
32
33
34
35
36
Abu Madafi Exposed
Abu Madafi Protected
Tahala Exposed
Tahala Protected
Days in August 2009
11975
T (
C)
°
Fig. 2 Time series of water temperature on the wave-exposed and
wave-protected sides of Abu Madafi and Tahala reefs during a week
in summer 2009
30 Coral Reefs (2011) 30:25–36
123
velocity measured in the center of the reef (assumed to be
representative of flow over the entire reef platform) and the
cross-sectional area of the rectangular ‘‘reef’’. The average
residence time of water on QD1 was approximately
100 min; however, depending on flow conditions, it can
range from 10 min to several hours.
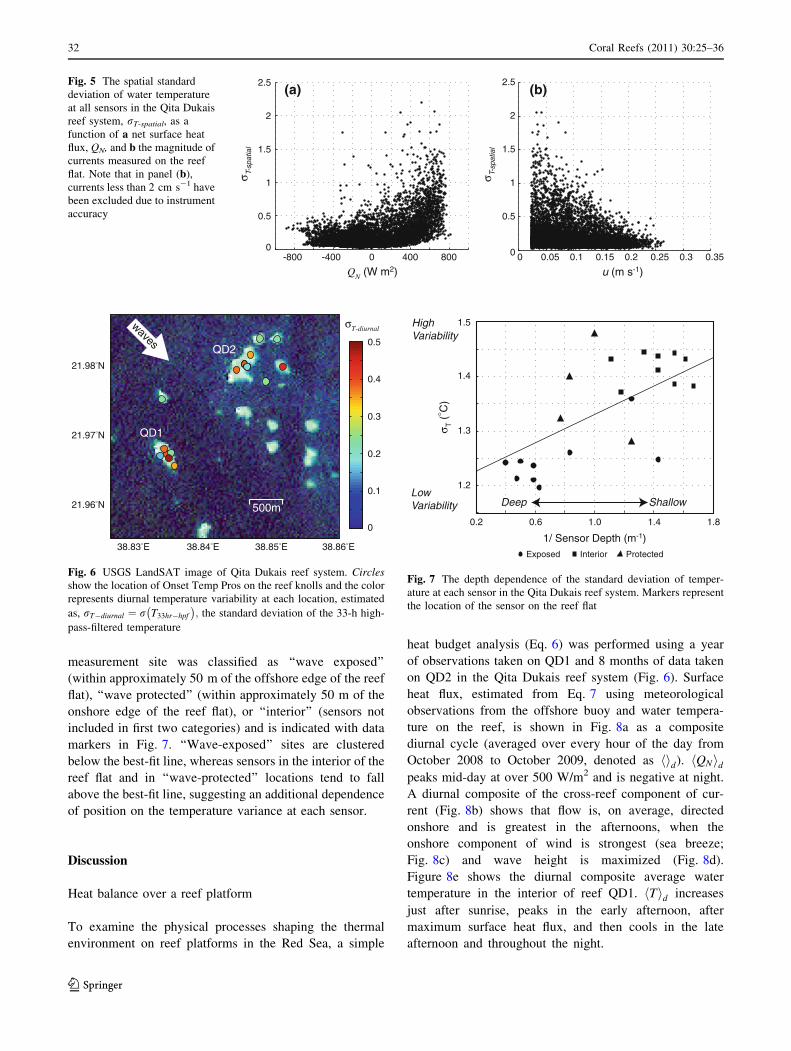
The simplified heat budget represented by Eq. 6 states
that water temperature on the reef flat is determined by a
balance between the transfer of heat at the air–water
interface and the advection of heat by currents flowing over
the reef. Thus, it is not surprising to find that the spatial
variability of water temperature on the reef platforms, rT-
spatial, calculated as the standard deviation of hour-averaged
water temperature measured at all sensors on Qita Dukais
at particular point in time, is related to the net surface heat
flux, QN (Fig. 5a), as well as the magnitude of currents
across the reef (Fig. 5b). rT-spatial is maximized during
periods of large, positive net surface heat flux and low
currents. The strongest thermal gradients across the reef flat
would be expected in the middle of the day during low-
flow conditions, when both the surface heating potential
and the residence time of water on the reef flat are maxi-
mized. While low-flow conditions are of great interest for
the question of temperature variance on the reef flat, we do
not include times when the flow is less than 2 cm s-1 in
Fig. 5b, as this is approaching the uncertainty of the Nortek
Aquadopp instrument. Moreover, we believe that in very
sluggish flows, it is difficult to assume that flow measured
at one point in the center of the reef is representative of
flow across the entire reef platform.
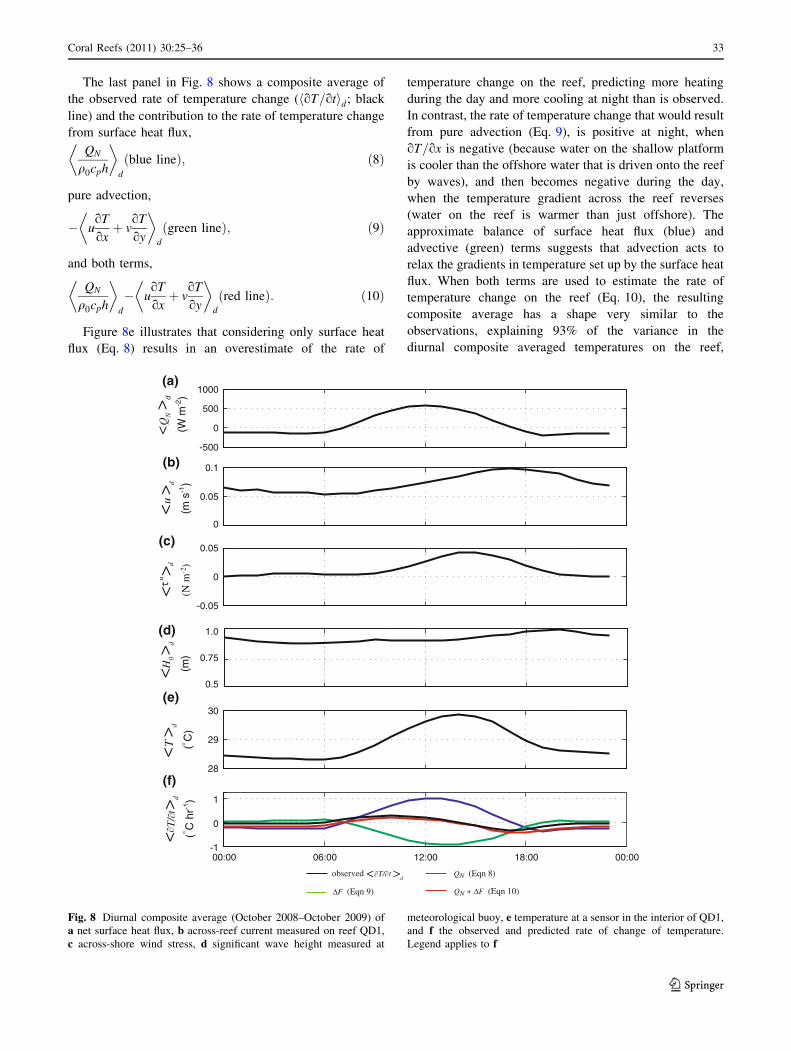
Figure 6 shows the daily variability in water temperature
at several sensors in the Qita Dukais reef system, estimated
as the standard deviation of the 33-hr high-pass-filtered
water temperature from June 2009 to May 2010, denoted by
rT-diurnal. The greatest diurnal variation in water tempera-
ture occurs at sensors located in the center of the larger reef
flats and on reefs protected from direct wave forcing, while
sensors on smaller knolls or on the edges of the reef flat tend
to experience less diurnal temperature variance.
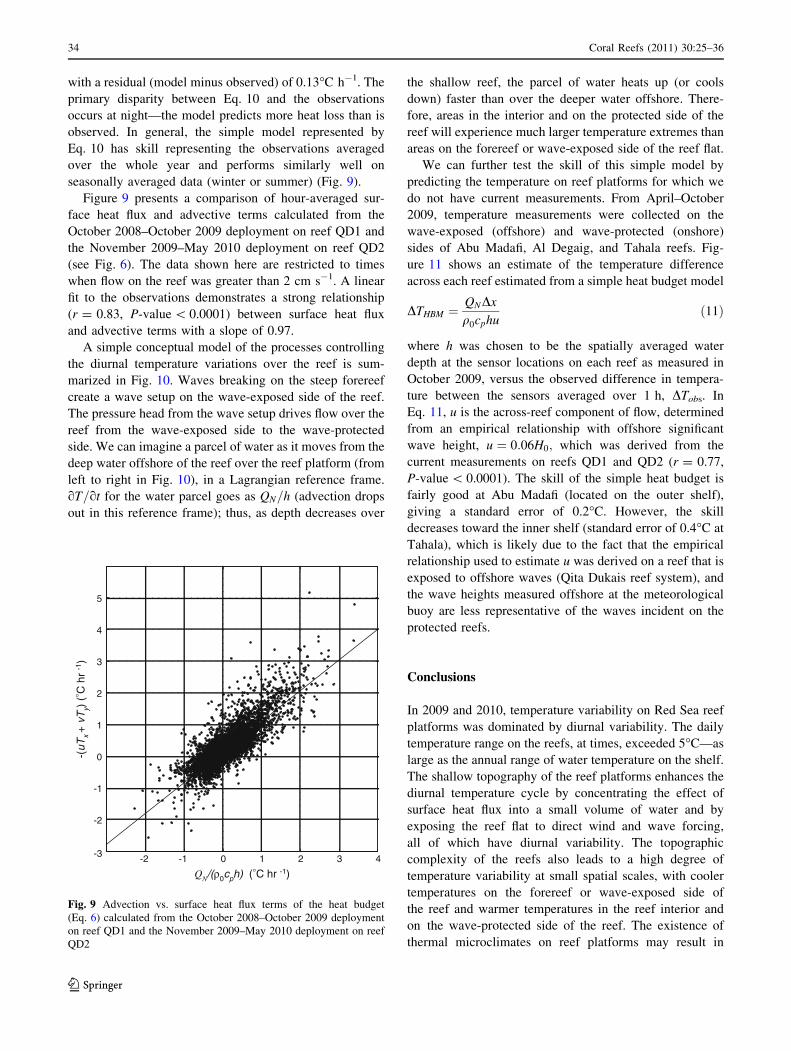
A complicating factor in considering the spatial depen-
dence of temperature variability across the reef is the
dependence of the heat budget on water depth (seen
explicitly in Eq. 4). Even on the reef flat, bathymetry is
spatially variable. If we consider a situation in which there
is no flow over the reef, for a given amount of surface heat
flux acting on a unit area, a shallow site will heat faster
during the day (QN [ 0) and cool faster at night (QN \ 0)
than a deeper site. The maximum difference between the
depths of temperature sensors on the reef bed was 1.9 m.
Figure 7 illustrates a clear dependence of temperature
variability on water depth for sensors on Qita Dukais,
where the line represents the best fit to the observations. In
addition to this depth dependence, however, a positional
dependence is evident. The location of each reef flat
Oct 2008
Nov Dec Jan2009
Feb Mar Apr May Jun Jul Aug Sep Oct Nov
25
27
29
31
33
Abu MadafiTahala Shi’b Nazar Qita Dukais W
ater
Tem
pera
ture
(°C
)Fig. 3 Time series of depth-
averaged water temperature,
low-pass-filtered at a frequency
corresponding to twice the local
inertial period (32 h) at selected
forereef moorings
1 3 5 7
24
26
28
30
SS
T (
°C)
19 21 23 25
30
32
34
36(a) (b)
Qita Dukais Reef Flat Meteorological Buoy
Days in January 2009
2 4 6 8
Days in July 2009
26242220
Fig. 4 Time series of water
temperature at 0.6 m depth on
Qita Dukais reef flat and at the
Meteorological buoy offshore
for a week in a winter–January
2009 and b summer–July 2009
Coral Reefs (2011) 30:25–36 31
123
measurement site was classified as ‘‘wave exposed’’
(within approximately 50 m of the offshore edge of the reef
flat), ‘‘wave protected’’ (within approximately 50 m of the
onshore edge of the reef flat), or ‘‘interior’’ (sensors not
included in first two categories) and is indicated with data
markers in Fig. 7. ‘‘Wave-exposed’’ sites are clustered
below the best-fit line, whereas sensors in the interior of the
reef flat and in ‘‘wave-protected’’ locations tend to fall
above the best-fit line, suggesting an additional dependence
of position on the temperature variance at each sensor.
Discussion
Heat balance over a reef platform
To examine the physical processes shaping the thermal
environment on reef platforms in the Red Sea, a simple
heat budget analysis (Eq. 6) was performed using a year
of observations taken on QD1 and 8 months of data taken
on QD2 in the Qita Dukais reef system (Fig. 6). Surface
heat flux, estimated from Eq. 7 using meteorological
observations from the offshore buoy and water tempera-
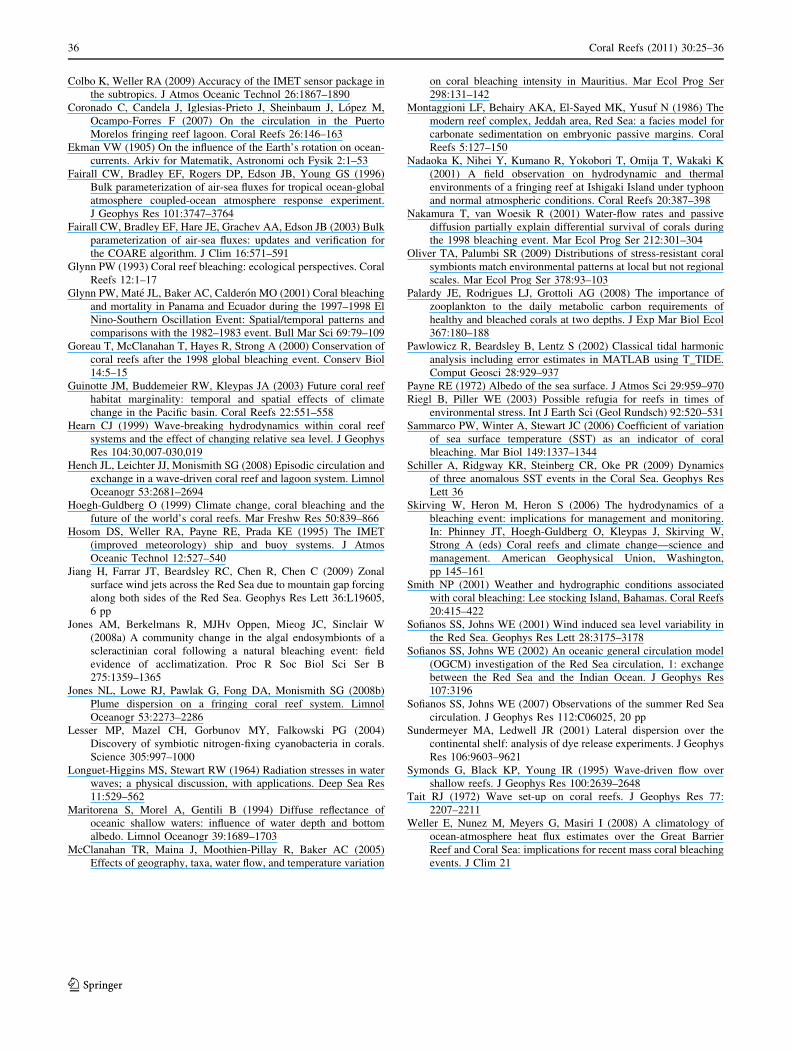
ture on the reef, is shown in Fig. 8a as a composite
diurnal cycle (averaged over every hour of the day from
October 2008 to October 2009, denoted as hid). QNh idpeaks mid-day at over 500 W/m2 and is negative at night.
A diurnal composite of the cross-reef component of cur-
rent (Fig. 8b) shows that flow is, on average, directed
onshore and is greatest in the afternoons, when the
onshore component of wind is strongest (sea breeze;
Fig. 8c) and wave height is maximized (Fig. 8d).
Figure 8e shows the diurnal composite average water
temperature in the interior of reef QD1. Th id increases
just after sunrise, peaks in the early afternoon, after
maximum surface heat flux, and then cools in the late
afternoon and throughout the night.
0 0.05 0.1 0.15 0.2 0.25 0.3 0.350
0.5
1
1.5
2
2.5
u (m s-1)-800 -400 0 400 800
0
0.5
1
1.5
2
2.5
QN (W m2)
σ T-sp
atia
l
σ T-sp
atia
l
(a) (b)Fig. 5 The spatial standard
deviation of water temperature
at all sensors in the Qita Dukais
reef system, rT-spatial, as a
function of a net surface heat
flux, QN, and b the magnitude of
currents measured on the reef
flat. Note that in panel (b),
currents less than 2 cm s-1 have
been excluded due to instrument
accuracy
38.83°E 38.84°E 38.85°E 38.86°E
21.98°N
0
0.1
0.5
0.4
0.3
0.2
σT-diurnal
21.97°N
21.96°N
QD1
QD2
waves
500m
Fig. 6 USGS LandSAT image of Qita Dukais reef system. Circlesshow the location of Onset Temp Pros on the reef knolls and the color
represents diurnal temperature variability at each location, estimated
as, rT�diurnal ¼ r T33hr�hpf
� �; the standard deviation of the 33-h high-
pass-filtered temperature
0.2 0.6 1.0 1.4 1.8
1.2
1.3
1.4
1.5
1/ Sensor Depth (m-1)
σ T (
° C)
Exposed Interior Protected
Deep Shallow
HighVariability
LowVariability
Fig. 7 The depth dependence of the standard deviation of temper-
ature at each sensor in the Qita Dukais reef system. Markers represent
the location of the sensor on the reef flat
32 Coral Reefs (2011) 30:25–36
123
The last panel in Fig. 8 shows a composite average of
the observed rate of temperature change ( oT=oth id; black
line) and the contribution to the rate of temperature change
from surface heat flux,
QN
q0cph
� �
d
blue lineð Þ; ð8Þ
pure advection,
� uoT
oxþ v
oT
oy
� �
d
green lineð Þ; ð9Þ
and both terms,
QN
q0cph
� �
d
� uoT
oxþ v
oT
oy
� �
d
red lineð Þ: ð10Þ
Figure 8e illustrates that considering only surface heat
flux (Eq. 8) results in an overestimate of the rate of
temperature change on the reef, predicting more heating
during the day and more cooling at night than is observed.
In contrast, the rate of temperature change that would result
from pure advection (Eq. 9), is positive at night, when
oT=ox is negative (because water on the shallow platform
is cooler than the offshore water that is driven onto the reef
by waves), and then becomes negative during the day,
when the temperature gradient across the reef reverses
(water on the reef is warmer than just offshore). The
approximate balance of surface heat flux (blue) and
advective (green) terms suggests that advection acts to
relax the gradients in temperature set up by the surface heat
flux. When both terms are used to estimate the rate of
temperature change on the reef (Eq. 10), the resulting
composite average has a shape very similar to the
observations, explaining 93% of the variance in the
diurnal composite averaged temperatures on the reef,
-500
0
500
1000
-0.05
0
0.05
0
0.05
0.1
28
29
30
00:00 06:00 12:00 18:00 00:00-1
0
1
(a)
(f)
(e)
(c)
(b)
observed < T/ t >dQN (Eqn 8)
ΔF (Eqn 9) QN + ΔF (Eqn 10)
<τu
>d
(N m
-2)
<Q
N>
d
(W m
-2)
<u
>d
(m s
-1)
<T
>d
(° C)
<>
d
(° C h
r-1)
<H
0 >
d
(m
)
(d)
0.5
0.75
1.0
Fig. 8 Diurnal composite average (October 2008–October 2009) of
a net surface heat flux, b across-reef current measured on reef QD1,
c across-shore wind stress, d significant wave height measured at
meteorological buoy, e temperature at a sensor in the interior of QD1,
and f the observed and predicted rate of change of temperature.
Legend applies to f
Coral Reefs (2011) 30:25–36 33
123
with a residual (model minus observed) of 0.13�C h-1. The
primary disparity between Eq. 10 and the observations
occurs at night—the model predicts more heat loss than is
observed. In general, the simple model represented by
Eq. 10 has skill representing the observations averaged
over the whole year and performs similarly well on
seasonally averaged data (winter or summer) (Fig. 9).
Figure 9 presents a comparison of hour-averaged sur-
face heat flux and advective terms calculated from the
October 2008–October 2009 deployment on reef QD1 and
the November 2009–May 2010 deployment on reef QD2
(see Fig. 6). The data shown here are restricted to times
when flow on the reef was greater than 2 cm s-1. A linear
fit to the observations demonstrates a strong relationship
(r = 0.83, P-value \ 0.0001) between surface heat flux
and advective terms with a slope of 0.97.
A simple conceptual model of the processes controlling
the diurnal temperature variations over the reef is sum-
marized in Fig. 10. Waves breaking on the steep forereef
create a wave setup on the wave-exposed side of the reef.
The pressure head from the wave setup drives flow over the
reef from the wave-exposed side to the wave-protected
side. We can imagine a parcel of water as it moves from the
deep water offshore of the reef over the reef platform (from
left to right in Fig. 10), in a Lagrangian reference frame.
oT=ot for the water parcel goes as QN=h (advection drops
out in this reference frame); thus, as depth decreases over
the shallow reef, the parcel of water heats up (or cools
down) faster than over the deeper water offshore. There-
fore, areas in the interior and on the protected side of the
reef will experience much larger temperature extremes than
areas on the forereef or wave-exposed side of the reef flat.
We can further test the skill of this simple model by
predicting the temperature on reef platforms for which we
do not have current measurements. From April–October
2009, temperature measurements were collected on the
wave-exposed (offshore) and wave-protected (onshore)
sides of Abu Madafi, Al Degaig, and Tahala reefs. Fig-
ure 11 shows an estimate of the temperature difference
across each reef estimated from a simple heat budget model
DTHBM ¼QNDx
q0cphuð11Þ
where h was chosen to be the spatially averaged water
depth at the sensor locations on each reef as measured in
October 2009, versus the observed difference in tempera-
ture between the sensors averaged over 1 h, DTobs. In
Eq. 11, u is the across-reef component of flow, determined
from an empirical relationship with offshore significant
wave height, u ¼ 0:06H0; which was derived from the
current measurements on reefs QD1 and QD2 (r = 0.77,
P-value \ 0.0001). The skill of the simple heat budget is
fairly good at Abu Madafi (located on the outer shelf),
giving a standard error of 0.2�C. However, the skill
decreases toward the inner shelf (standard error of 0.4�C at
Tahala), which is likely due to the fact that the empirical
relationship used to estimate u was derived on a reef that is
exposed to offshore waves (Qita Dukais reef system), and
the wave heights measured offshore at the meteorological
buoy are less representative of the waves incident on the
protected reefs.
Conclusions
In 2009 and 2010, temperature variability on Red Sea reef
platforms was dominated by diurnal variability. The daily
temperature range on the reefs, at times, exceeded 5�C—as
large as the annual range of water temperature on the shelf.
The shallow topography of the reef platforms enhances the
diurnal temperature cycle by concentrating the effect of
surface heat flux into a small volume of water and by
exposing the reef flat to direct wind and wave forcing,
all of which have diurnal variability. The topographic
complexity of the reefs also leads to a high degree of
temperature variability at small spatial scales, with cooler
temperatures on the forereef or wave-exposed side of
the reef and warmer temperatures in the reef interior and
on the wave-protected side of the reef. The existence of
thermal microclimates on reef platforms may result in
-2 -1 0 1 2 3 4-3
-2
-1
0
1
2
3
4
5
-(uT
x +
vT
y) (
° C h
r -1
)
QN/(ρ0cph) (°C hr -1)
Fig. 9 Advection vs. surface heat flux terms of the heat budget
(Eq. 6) calculated from the October 2008–October 2009 deployment
on reef QD1 and the November 2009–May 2010 deployment on reef
QD2
34 Coral Reefs (2011) 30:25–36
123

colonies with different physiology and diverse coral sym-
biont assemblages.
We found that the temporal (Fig. 8) and spatial (Fig. 11)
variability in water temperature on the reef platforms can be
fairly well predicted by a simplified heat budget, which
includes the transfer of heat at the air–water interface and the
advection by currents flowing over the reef. With this simple
model, we predicted the temperature difference across three
reefs to within 0.4�C on the outer shelf and 0.9�C on the
inner shelf (95% confidence) using only information about
bathymetry, surface heat flux, and offshore wave conditions,
the last two of which were measured at the meteorological
buoy for this study, but could be obtained from remote
sensing products or coastal weather stations. The results of
this work have implications for improving indices of coral
bleaching, which typically have difficulty predicting the high
degree of spatial variability observed at global, regional, and
individual reef scales. The incorporation of a simple heat
budget model into the coral bleaching indices could help to
capture the effect of wave-driven circulation on the thermal
environment of reefs.
Acknowledgments The authors would like to thank A. Al Suwailem,
Y. Kattan, H. Al Jahdali, W. Moazen, and Nageeb from King Abdullah
University of Sciences and Technology (KAUST) for providing
logistical and field support, C. Marquette, S. Elgar, L. Gorrell, and
D. Ralston from WHOI for equipment and technical support, E. Paul
Oberlander for the artistic rendering of Fig. 10, as well as three anon-
ymous reviewers for their thoughtful comments. This publication is
based on work supported by Award No. USA 00002/KSA 00011 made
by King Abdulla University of Science and Technology (KAUST).
K. A. D. was supported by a USGS postdoctoral scholarship at WHOI.
References
Berkelmans R (2002) Time-integrated thermal bleaching thresholds
of reefs and their variation on the Great Barrier Reef. Mar Ecol
Prog Ser 229:73–82
Bird JC (2005) Modelling sub-reef thermodynamics to predict coral
bleaching: a case study at Scott Reef, WA. MSc Thesis, James
Cook University, p 156
Buddemeier RW, Fautin DG (1993) Coral bleaching as an adaptive
mechanism. Bioscience 43:320–326
Cantin NE, Cohen AL, Karnauskas KB, Tarrant AM, McCorkle DC
(2010) Ocean warming slows coral growth in the Central Red
Sea. Science 329:322–325
Fig. 10 Conceptual illustration of a reef platform and the physical processes that shape the thermal environment
-3 -2 -1 0 1 2 3 4-3
-2
-1
0
1
2
3
4
ΔTobs (oC)
Abu Madafi, r = 0.90
Al Degaic, r = 0.92
Tahala, r = 0.84
ΔTH
BM
(o C)
slope = 1.1
slope = 0.72
slope = 0.73
Fig. 11 Across-reef temperature gradient predicted by a simple heat
budget model (DTHBM) versus the observed temperature gradient
(DTobs) on Abu Madafi, Al Degaig, and Tahala. Regression slopes are
indicated next to best-fit lines for each reef
Coral Reefs (2011) 30:25–36 35
123
Colbo K, Weller RA (2009) Accuracy of the IMET sensor package in
the subtropics. J Atmos Oceanic Technol 26:1867–1890
Coronado C, Candela J, Iglesias-Prieto J, Sheinbaum J, Lopez M,
Ocampo-Forres F (2007) On the circulation in the Puerto
Morelos fringing reef lagoon. Coral Reefs 26:146–163
Ekman VW (1905) On the influence of the Earth’s rotation on ocean-
currents. Arkiv for Matematik, Astronomi och Fysik 2:1–53
Fairall CW, Bradley EF, Rogers DP, Edson JB, Young GS (1996)
Bulk parameterization of air-sea fluxes for tropical ocean-global
atmosphere coupled-ocean atmosphere response experiment.
J Geophys Res 101:3747–3764
Fairall CW, Bradley EF, Hare JE, Grachev AA, Edson JB (2003) Bulk
parameterization of air-sea fluxes: updates and verification for
the COARE algorithm. J Clim 16:571–591
Glynn PW (1993) Coral reef bleaching: ecological perspectives. Coral
Reefs 12:1–17
Glynn PW, Mate JL, Baker AC, Calderon MO (2001) Coral bleaching
and mortality in Panama and Ecuador during the 1997–1998 El
Nino-Southern Oscillation Event: Spatial/temporal patterns and
comparisons with the 1982–1983 event. Bull Mar Sci 69:79–109
Goreau T, McClanahan T, Hayes R, Strong A (2000) Conservation of
coral reefs after the 1998 global bleaching event. Conserv Biol
14:5–15
Guinotte JM, Buddemeier RW, Kleypas JA (2003) Future coral reef
habitat marginality: temporal and spatial effects of climate
change in the Pacific basin. Coral Reefs 22:551–558
Hearn CJ (1999) Wave-breaking hydrodynamics within coral reef
systems and the effect of changing relative sea level. J Geophys
Res 104:30,007-030,019
Hench JL, Leichter JJ, Monismith SG (2008) Episodic circulation and
exchange in a wave-driven coral reef and lagoon system. Limnol
Oceanogr 53:2681–2694
Hoegh-Guldberg O (1999) Climate change, coral bleaching and the
future of the world’s coral reefs. Mar Freshw Res 50:839–866
Hosom DS, Weller RA, Payne RE, Prada KE (1995) The IMET
(improved meteorology) ship and buoy systems. J Atmos
Oceanic Technol 12:527–540
Jiang H, Farrar JT, Beardsley RC, Chen R, Chen C (2009) Zonal
surface wind jets across the Red Sea due to mountain gap forcing
along both sides of the Red Sea. Geophys Res Lett 36:L19605,
6 pp
Jones AM, Berkelmans R, MJHv Oppen, Mieog JC, Sinclair W
(2008a) A community change in the algal endosymbionts of a
scleractinian coral following a natural bleaching event: field
evidence of acclimatization. Proc R Soc Biol Sci Ser B
275:1359–1365
Jones NL, Lowe RJ, Pawlak G, Fong DA, Monismith SG (2008b)
Plume dispersion on a fringing coral reef system. Limnol
Oceanogr 53:2273–2286
Lesser MP, Mazel CH, Gorbunov MY, Falkowski PG (2004)
Discovery of symbiotic nitrogen-fixing cyanobacteria in corals.
Science 305:997–1000
Longuet-Higgins MS, Stewart RW (1964) Radiation stresses in water
waves; a physical discussion, with applications. Deep Sea Res
11:529–562
Maritorena S, Morel A, Gentili B (1994) Diffuse reflectance of
oceanic shallow waters: influence of water depth and bottom
albedo. Limnol Oceanogr 39:1689–1703
McClanahan TR, Maina J, Moothien-Pillay R, Baker AC (2005)
Effects of geography, taxa, water flow, and temperature variation
on coral bleaching intensity in Mauritius. Mar Ecol Prog Ser
298:131–142
Montaggioni LF, Behairy AKA, El-Sayed MK, Yusuf N (1986) The
modern reef complex, Jeddah area, Red Sea: a facies model for
carbonate sedimentation on embryonic passive margins. Coral
Reefs 5:127–150
Nadaoka K, Nihei Y, Kumano R, Yokobori T, Omija T, Wakaki K
(2001) A field observation on hydrodynamic and thermal
environments of a fringing reef at Ishigaki Island under typhoon
and normal atmospheric conditions. Coral Reefs 20:387–398
Nakamura T, van Woesik R (2001) Water-flow rates and passive
diffusion partially explain differential survival of corals during
the 1998 bleaching event. Mar Ecol Prog Ser 212:301–304
Oliver TA, Palumbi SR (2009) Distributions of stress-resistant coral
symbionts match environmental patterns at local but not regional
scales. Mar Ecol Prog Ser 378:93–103
Palardy JE, Rodrigues LJ, Grottoli AG (2008) The importance of
zooplankton to the daily metabolic carbon requirements of
healthy and bleached corals at two depths. J Exp Mar Biol Ecol
367:180–188
Pawlowicz R, Beardsley B, Lentz S (2002) Classical tidal harmonic
analysis including error estimates in MATLAB using T_TIDE.
Comput Geosci 28:929–937
Payne RE (1972) Albedo of the sea surface. J Atmos Sci 29:959–970
Riegl B, Piller WE (2003) Possible refugia for reefs in times of
environmental stress. Int J Earth Sci (Geol Rundsch) 92:520–531
Sammarco PW, Winter A, Stewart JC (2006) Coefficient of variation
of sea surface temperature (SST) as an indicator of coral
bleaching. Mar Biol 149:1337–1344
Schiller A, Ridgway KR, Steinberg CR, Oke PR (2009) Dynamics
of three anomalous SST events in the Coral Sea. Geophys Res
Lett 36
Skirving W, Heron M, Heron S (2006) The hydrodynamics of a
bleaching event: implications for management and monitoring.
In: Phinney JT, Hoegh-Guldberg O, Kleypas J, Skirving W,
Strong A (eds) Coral reefs and climate change—science and
management. American Geophysical Union, Washington,
pp 145–161
Smith NP (2001) Weather and hydrographic conditions associated
with coral bleaching: Lee stocking Island, Bahamas. Coral Reefs
20:415–422
Sofianos SS, Johns WE (2001) Wind induced sea level variability in
the Red Sea. Geophys Res Lett 28:3175–3178
Sofianos SS, Johns WE (2002) An oceanic general circulation model
(OGCM) investigation of the Red Sea circulation, 1: exchange
between the Red Sea and the Indian Ocean. J Geophys Res
107:3196
Sofianos SS, Johns WE (2007) Observations of the summer Red Sea
circulation. J Geophys Res 112:C06025, 20 pp
Sundermeyer MA, Ledwell JR (2001) Lateral dispersion over the
continental shelf: analysis of dye release experiments. J Geophys
Res 106:9603–9621
Symonds G, Black KP, Young IR (1995) Wave-driven flow over
shallow reefs. J Geophys Res 100:2639–2648
Tait RJ (1972) Wave set-up on coral reefs. J Geophys Res 77:
2207–2211
Weller E, Nunez M, Meyers G, Masiri I (2008) A climatology of
ocean-atmosphere heat flux estimates over the Great Barrier
Reef and Coral Sea: implications for recent mass coral bleaching
events. J Clim 21
36 Coral Reefs (2011) 30:25–36
123