Observational studies of student errors in a distance learning environment using a remote recording...
18
Technical Report No: 2000/09 Observational studies of student errors in a distance learning environment using a remote recording and replay tool Kit Logan 2000 Department of Computing Faculty of Mathematics and Computing The Open University Walton Hall, Milton Keynes MK7 6AA United Kingdom http://computing.open.ac.uk l
Transcript of Observational studies of student errors in a distance learning environment using a remote recording...
T e c h n i c a l R e p o r t N o : 2 0 0 0 / 0 9
Observational studies of student errors in a distancelearning environment using a remote recording and
replay tool
Kit Logan
2000
Department of ComputingFaculty of Mathematics and ComputingThe Open UniversityWalton Hall, Milton Keynes MK7 6AA United Kingdom
http://computing.open.ac.uk
l
1
Technical Report
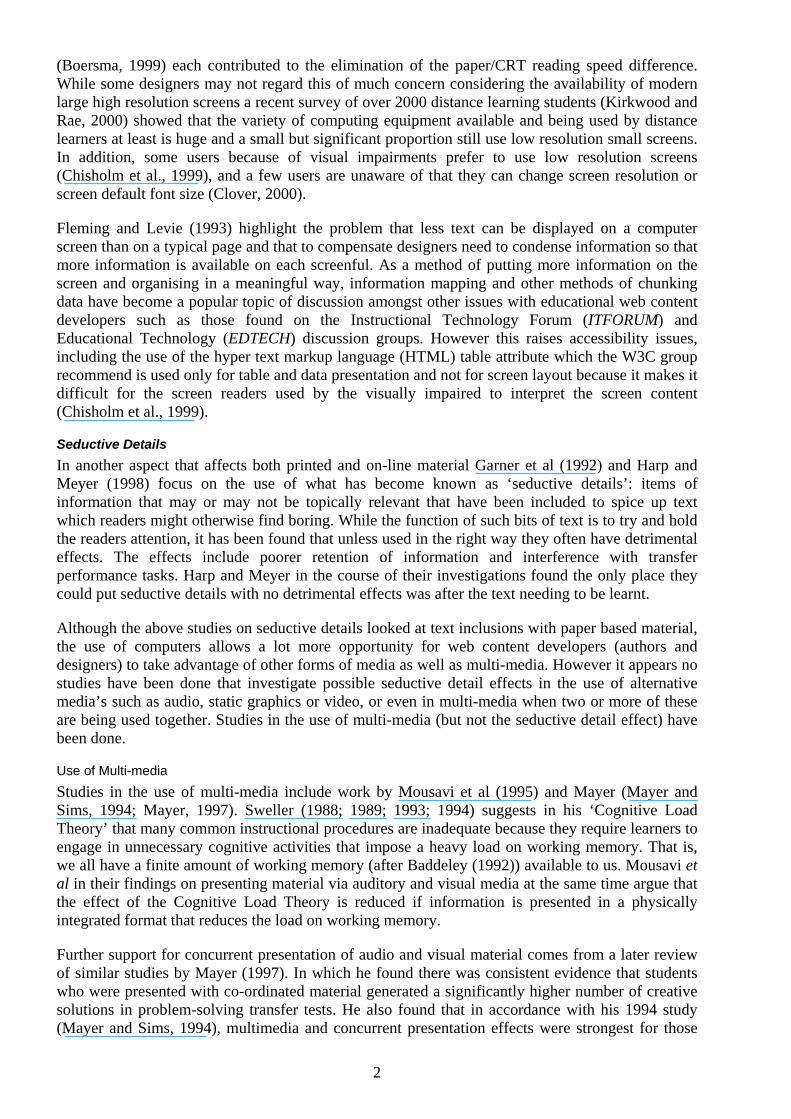
Observational studies of student errors in a distance learningenvironment using a remote recording and replay tool
Kit Logan
Abstract
AESOP is ‘An Electronic Student Observatory Project’ at the Open University, Milton Keynesconsisting of a set of tools written in Smalltalk allowing student’s activities and progress through anon-line distance education course to be remotely recorded, replayed and analysed. The followingpaper outlines some initial findings from observations made on a cross-sectional group of 368volunteers taking the course in 2000. Students observed to be using low resolution 640 x 480screens were noted as taking significantly longer to complete on-line course work (p=0.018). Nodifferences were observed between age groups taking part in the study, but some gender differenceswere found with females reporting being less comfortable at using computers and that males used agreater variety of central processing units. Some evidence indicates that female students were alsomore likely to be using lower specifications machines than males. Differences noted betweengenders in RAM and screen size specification of the machines used by the students were found tobe just outside significance level.
Introduction
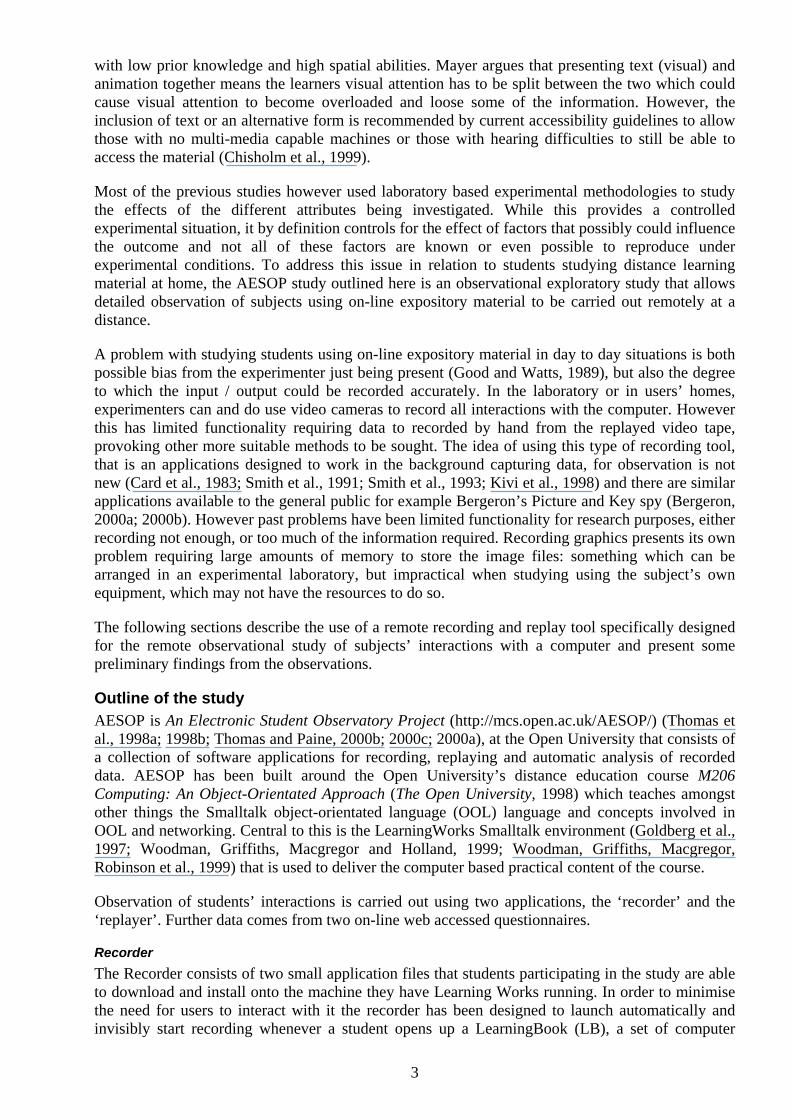
Since the development of computing technologies and particularly the advent of the World WideWeb (WWW) there have been increasing efforts to take advantage of the benefits thesetechnologies can bring to teaching. These include improved methods of course delivery combinedwith a rich multi-media environment aiding the pedagogical effectiveness of the material as well asimproved access; both for those who already have access and for those who would otherwisenormally be unable to undertake the various studies. There is also perhaps an element of wanting tobe seen to be keeping up with the times and in the United Kingdom at least, pressure to exploit thenew technologies available (Smithers, 2000; Sutherland, 2000).
Considering the wide variety of computing hardware that the general user has available to accessthese technologies, a major issue is accessibility and delivery of web based teaching or web basedinstruction (WBI) (Chisholm et al., 1999). However in addition to accessibility issues, there havebeen a number of areas identified which web content developers need to be aware of that can affectthe pedagogical effectiveness of on-line teaching material. The main areas of concern include thedisplay fonts used, screen size and resolution, use of multi-media, seductive details, quality, layoutand navigational design issues.
Display Font, Screen Size and Screen ResolutionKingery and Furuta (1997) looked at electronic newspaper headlines and compared the onscreentypefaces (fonts) of Times New Roman, Arial, Century Gothic and Book Antiqua under the variousfactors of point size, screen resolution and screen size (14 inch and 19 inch screens). They foundthat interactions existed between all these factors and that best overall legibility was achieved byusing either Times New Roman or Arial which are specially adapted for the display of text on thecomputer screen. Earlier work by Gould et al (1987; 1987) tried to identify the factors thatinfluenced reading speeds when using cathode ray tube (CRT) displays and showed that readingspeeds equivalent to reading from paper could be achieved, but this was dependent on the imagequality on the screen. They tentatively concluded that display polarity, resolution and anti-aliasing
2
(Boersma, 1999) each contributed to the elimination of the paper/CRT reading speed difference.While some designers may not regard this of much concern considering the availability of modernlarge high resolution screens a recent survey of over 2000 distance learning students (Kirkwood andRae, 2000) showed that the variety of computing equipment available and being used by distancelearners at least is huge and a small but significant proportion still use low resolution small screens.In addition, some users because of visual impairments prefer to use low resolution screens(Chisholm et al., 1999), and a few users are unaware of that they can change screen resolution orscreen default font size (Clover, 2000).
Fleming and Levie (1993) highlight the problem that less text can be displayed on a computerscreen than on a typical page and that to compensate designers need to condense information so thatmore information is available on each screenful. As a method of putting more information on thescreen and organising in a meaningful way, information mapping and other methods of chunkingdata have become a popular topic of discussion amongst other issues with educational web contentdevelopers such as those found on the Instructional Technology Forum (ITFORUM) andEducational Technology (EDTECH) discussion groups. However this raises accessibility issues,including the use of the hyper text markup language (HTML) table attribute which the W3C grouprecommend is used only for table and data presentation and not for screen layout because it makes itdifficult for the screen readers used by the visually impaired to interpret the screen content(Chisholm et al., 1999).
Seductive DetailsIn another aspect that affects both printed and on-line material Garner et al (1992) and Harp andMeyer (1998) focus on the use of what has become known as ‘seductive details’: items ofinformation that may or may not be topically relevant that have been included to spice up textwhich readers might otherwise find boring. While the function of such bits of text is to try and holdthe readers attention, it has been found that unless used in the right way they often have detrimentaleffects. The effects include poorer retention of information and interference with transferperformance tasks. Harp and Meyer in the course of their investigations found the only place theycould put seductive details with no detrimental effects was after the text needing to be learnt.
Although the above studies on seductive details looked at text inclusions with paper based material,the use of computers allows a lot more opportunity for web content developers (authors anddesigners) to take advantage of other forms of media as well as multi-media. However it appears nostudies have been done that investigate possible seductive detail effects in the use of alternativemedia’s such as audio, static graphics or video, or even in multi-media when two or more of theseare being used together. Studies in the use of multi-media (but not the seductive detail effect) havebeen done.
Use of Multi-mediaStudies in the use of multi-media include work by Mousavi et al (1995) and Mayer (Mayer andSims, 1994; Mayer, 1997). Sweller (1988; 1989; 1993; 1994) suggests in his ‘Cognitive LoadTheory’ that many common instructional procedures are inadequate because they require learners toengage in unnecessary cognitive activities that impose a heavy load on working memory. That is,we all have a finite amount of working memory (after Baddeley (1992)) available to us. Mousavi etal in their findings on presenting material via auditory and visual media at the same time argue thatthe effect of the Cognitive Load Theory is reduced if information is presented in a physicallyintegrated format that reduces the load on working memory.
Further support for concurrent presentation of audio and visual material comes from a later reviewof similar studies by Mayer (1997). In which he found there was consistent evidence that studentswho were presented with co-ordinated material generated a significantly higher number of creativesolutions in problem-solving transfer tests. He also found that in accordance with his 1994 study(Mayer and Sims, 1994), multimedia and concurrent presentation effects were strongest for those
3
with low prior knowledge and high spatial abilities. Mayer argues that presenting text (visual) andanimation together means the learners visual attention has to be split between the two which couldcause visual attention to become overloaded and loose some of the information. However, theinclusion of text or an alternative form is recommended by current accessibility guidelines to allowthose with no multi-media capable machines or those with hearing difficulties to still be able toaccess the material (Chisholm et al., 1999).
Most of the previous studies however used laboratory based experimental methodologies to studythe effects of the different attributes being investigated. While this provides a controlledexperimental situation, it by definition controls for the effect of factors that possibly could influencethe outcome and not all of these factors are known or even possible to reproduce underexperimental conditions. To address this issue in relation to students studying distance learningmaterial at home, the AESOP study outlined here is an observational exploratory study that allowsdetailed observation of subjects using on-line expository material to be carried out remotely at adistance.
A problem with studying students using on-line expository material in day to day situations is bothpossible bias from the experimenter just being present (Good and Watts, 1989), but also the degreeto which the input / output could be recorded accurately. In the laboratory or in users’ homes,experimenters can and do use video cameras to record all interactions with the computer. Howeverthis has limited functionality requiring data to recorded by hand from the replayed video tape,provoking other more suitable methods to be sought. The idea of using this type of recording tool,that is an applications designed to work in the background capturing data, for observation is notnew (Card et al., 1983; Smith et al., 1991; Smith et al., 1993; Kivi et al., 1998) and there are similarapplications available to the general public for example Bergeron’s Picture and Key spy (Bergeron,2000a; 2000b). However past problems have been limited functionality for research purposes, eitherrecording not enough, or too much of the information required. Recording graphics presents its ownproblem requiring large amounts of memory to store the image files: something which can bearranged in an experimental laboratory, but impractical when studying using the subject’s ownequipment, which may not have the resources to do so.
The following sections describe the use of a remote recording and replay tool specifically designedfor the remote observational study of subjects’ interactions with a computer and present somepreliminary findings from the observations.
Outline of the studyAESOP is An Electronic Student Observatory Project (http://mcs.open.ac.uk/AESOP/) (Thomas etal., 1998a; 1998b; Thomas and Paine, 2000b; 2000c; 2000a), at the Open University that consists ofa collection of software applications for recording, replaying and automatic analysis of recordeddata. AESOP has been built around the Open University’s distance education course M206Computing: An Object-Orientated Approach (The Open University, 1998) which teaches amongstother things the Smalltalk object-orientated language (OOL) language and concepts involved inOOL and networking. Central to this is the LearningWorks Smalltalk environment (Goldberg et al.,1997; Woodman, Griffiths, Macgregor and Holland, 1999; Woodman, Griffiths, Macgregor,Robinson et al., 1999) that is used to deliver the computer based practical content of the course.
Observation of students’ interactions is carried out using two applications, the ‘recorder’ and the‘replayer’. Further data comes from two on-line web accessed questionnaires.
RecorderThe Recorder consists of two small application files that students participating in the study are ableto download and install onto the machine they have Learning Works running. In order to minimisethe need for users to interact with it the recorder has been designed to launch automatically andinvisibly start recording whenever a student opens up a LearningBook (LB), a set of computer
4
based practicals organised into chapters. It does not record anything outside the Learning Worksenvironment when in use, but records to a text file those events occurring within each LB whichhave been defined by the AESOP team as being of interest. These include opening and closing ofLBs, opening, selection, movement and resizing and closing of windows, scrolling, button clicks,hyperlink selection and evaluation of expressions (Smalltalk program code entered by the student).In addition, each individual event is time stamped. A new file is created for each LB that is opened,but if a LB is closed and then reopened at a later time the Recorder appends any new eventsinformation to the original file.
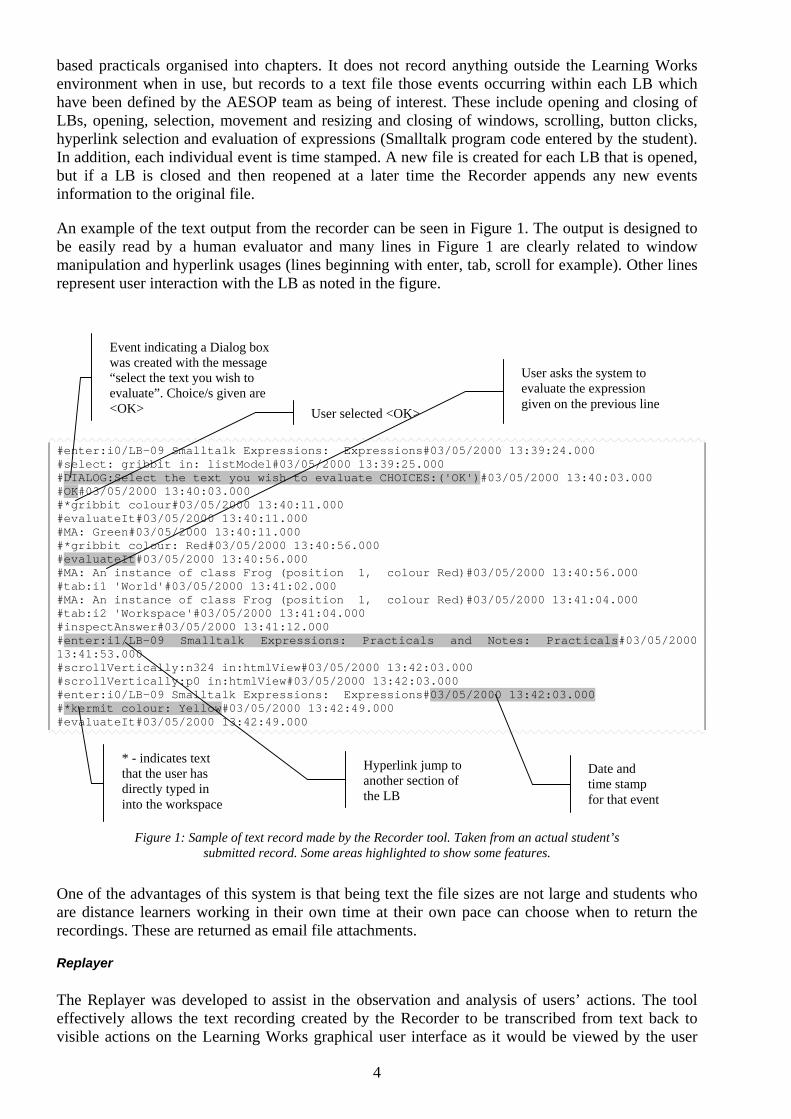
An example of the text output from the recorder can be seen in Figure 1. The output is designed tobe easily read by a human evaluator and many lines in Figure 1 are clearly related to windowmanipulation and hyperlink usages (lines beginning with enter, tab, scroll for example). Other linesrepresent user interaction with the LB as noted in the figure.
#enter:i0/LB-09 Smalltalk Expressions: Expressions#03/05/2000 13:39:24.000#select: gribbit in: listModel#03/05/2000 13:39:25.000#DIALOG:Select the text you wish to evaluate CHOICES:('OK')#03/05/2000 13:40:03.000#OK#03/05/2000 13:40:03.000#*gribbit colour#03/05/2000 13:40:11.000#evaluateIt#03/05/2000 13:40:11.000#MA: Green#03/05/2000 13:40:11.000#*gribbit colour: Red#03/05/2000 13:40:56.000#evaluateIt#03/05/2000 13:40:56.000#MA: An instance of class Frog (position 1, colour Red)#03/05/2000 13:40:56.000#tab:i1 'World'#03/05/2000 13:41:02.000#MA: An instance of class Frog (position 1, colour Red)#03/05/2000 13:41:04.000#tab:i2 'Workspace'#03/05/2000 13:41:04.000#inspectAnswer#03/05/2000 13:41:12.000#enter:i1/LB-09 Smalltalk Expressions: Practicals and Notes: Practicals#03/05/200013:41:53.000#scrollVertically:n324 in:htmlView#03/05/2000 13:42:03.000#scrollVertically:p0 in:htmlView#03/05/2000 13:42:03.000#enter:i0/LB-09 Smalltalk Expressions: Expressions#03/05/2000 13:42:03.000#*kermit colour: Yellow#03/05/2000 13:42:49.000#evaluateIt#03/05/2000 13:42:49.000
Figure 1: Sample of text record made by the Recorder tool. Taken from an actual student’ssubmitted record. Some areas highlighted to show some features.
One of the advantages of this system is that being text the file sizes are not large and students whoare distance learners working in their own time at their own pace can choose when to return therecordings. These are returned as email file attachments.
Replayer
The Replayer was developed to assist in the observation and analysis of users’ actions. The tooleffectively allows the text recording created by the Recorder to be transcribed from text back tovisible actions on the Learning Works graphical user interface as it would be viewed by the user
Date andtime stampfor that event
* - indicates textthat the user hasdirectly typed ininto the workspace
Event indicating a Dialog boxwas created with the message“select the text you wish toevaluate”. Choice/s given are<OK> User selected <OK>
Hyperlink jump toanother section ofthe LB
User asks the system toevaluate the expressiongiven on the previous line
5
who created it. This includes replaying all significant events including window selection andresizing. The text record is also presented in a scrollable resizable separate window so that the lineof text or command being carried out is by default highlighted and centred in this window. As theoriginal text record has one instruction to each line, the Replayer can carry this out in a ‘frame-by-frame’ or ‘line-by-line’ step-wise fashion or continuously at a set pace controlled by a sliding scale.The ability to manually edit text files and add a stop command gives further functionality to theReplayer, allowing files to be replayed at high speed effectively fast forwarding them to the point atwhich the stop was added and then replayed at a more convenient speed to view and analyse theuser’s actions.
The advantage of replaying text files in this fashion where students are adding new programmingcode is that the Learning Works system automatically adds any new objects or code created by thestudent to the system and will show any error messages that result from the students’ input.Unfortunately this also means you cannot start reviewing the recordings from any arbitrary point.
The replay of recordings also has to be done on a screen resolution equal or better than theresolution of the screen that the original record was made on otherwise the screen placements of theactive Learning Works windows will be a ‘best fit’ and therefore give a distorted view of what theuser actually saw.
Questionnaire Design
The inclusion of questionnaires into this study was to collate and monitor information that therecorder was not designed to or would not be able to collect. Two questionnaires were created, aPre-Study Questionnaire (Logan and Paine, 2000) designed to collect general demographic detailsabout subjects, such as age, gender, occupation, current knowledge of computers, level of comfortcarrying out various computer related tasks, as well as the specification of the computer they wereusing to study the M206 course, such as screen size and resolution, processor and speed andmemory. This questionnaire was made available to students at the start of their studies.
A slightly longer Post-Study Questionnaire was produced to collect general data looking atproblems students may have had installing and using the software, and also compare in a repeatedmeasures design any changes from the Pre-Study Questionnaire in levels of comfort and use ofcomputer. The Post-Study Questionnaire was made available to students shortly before their finalend of course exam.
Following the design of the questionnaires both were assembled using ColdFusion and deliveredvia the web, sending out by email an invitation to participants in the study to access the web pagethe questionnaire was hosted on. The problem of accessibility was taken into consideration, butusing a web interface was considered the most practical and cost effective method since web accesswas a pre-requisite of the M206 course. Both questionnaires were designed to be short to helpmaintain interest and improve response rate (Courtenay, 1978; Labaw, 1982) and be completedoffline once downloaded onto the clients web browser so that further connection to the internet wasonly required when needing to submit the completed form.
Pilot study
A small pilot study had been carried out in 1999 (MacGregor et al., 1999), using a much smallernumber of students (n=24). This highlighted some problems with the Replayer and the type ofevents that were being recorded leading to changes being made to the Recorder allowing greaterdetail to be observed while replaying students’ behaviours and refinements being made to theReplayer.
6
Subjects
All subjects were student volunteers from the Open University’s distance learning course M206.For the study on the year 2000 intake an invitation to be part of the study and to complete the Pre-Study Questionnaire was made to all students at the same time they received their course material inJanuary (n=3399). No incentive was offered to the students other than explaining the purposes ofthe study. 368 students volunteered to take part, out which 182 (49%) returned one or morerecordings and of the remaining 186, 11 (3%) are known to have dropped out of the M206 course.Data regarding other reasons for not participating are still being collected from the Post-StudyQuestionnaire
Method and Results
Because AESOP is an exploratory study it had no predetermined objectives or specific experimentsin mind other than to see whether it was possible to observe student’s on-line behaviour whileprogressing through the M206 course, at a distance and to see what behaviours and informationcould be gathered from a tool such as the Recorder and Replayer.
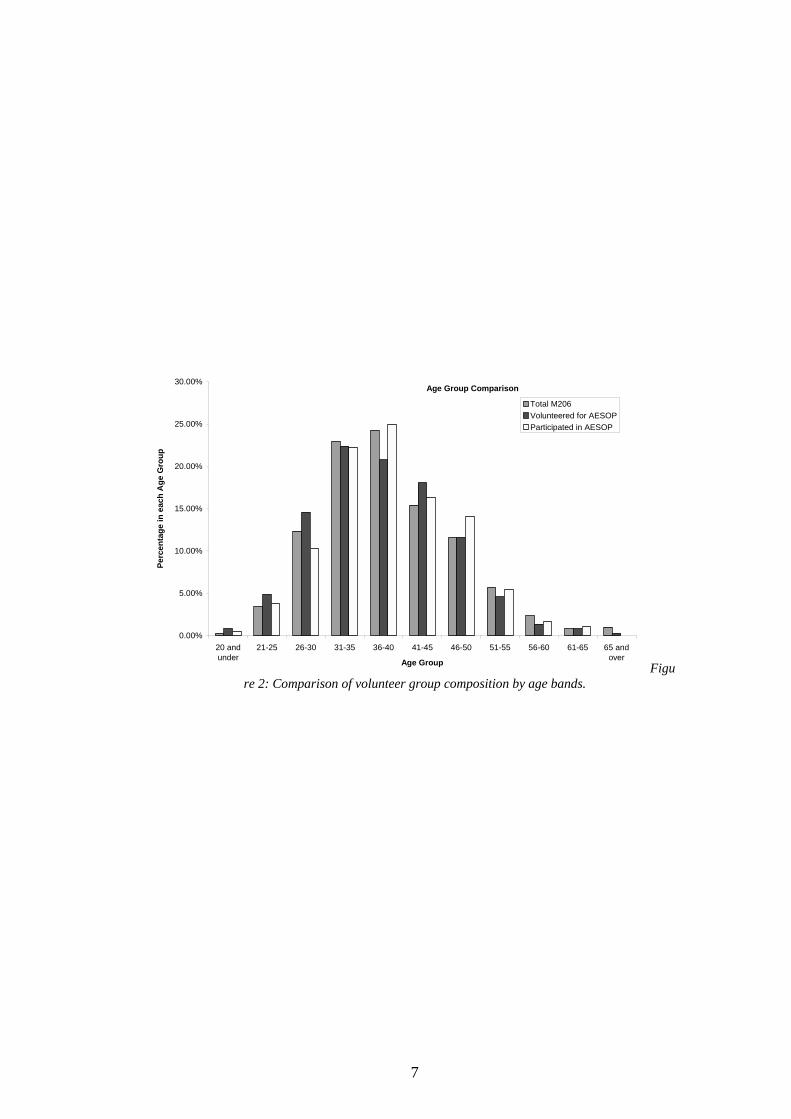
Results from the Pre-Study Questionnaire showed that both the composition of the group whovolunteered at the start to be involved in AESOP (Volunteered) and the subsection of these whocontinued to send in one or more recordings (Participated) comprised a very good cross-section ingender and age of the students on the M206 course (see Figure 2 and Figure 3).
7
Age Group Comparison
0.00%
5.00%
10.00%
15.00%
20.00%
25.00%
30.00%
20 andunder
21-25 26-30 31-35 36-40 41-45 46-50 51-55 56-60 61-65 65 andoverAge Group
Perc
enta
ge in
eac
h A
ge G
roup
Total M206Volunteered for AESOPParticipated in AESOP
Figure 2: Comparison of volunteer group composition by age bands.
8
Gender Comparison
0.00%
10.00%
20.00%
30.00%
40.00%
50.00%
60.00%
70.00%
80.00%
90.00%
M206 Total Volunteers Total Participants
Research Group
Perc
enta
ge o
f eac
h ge
nder
FEMALEMALE
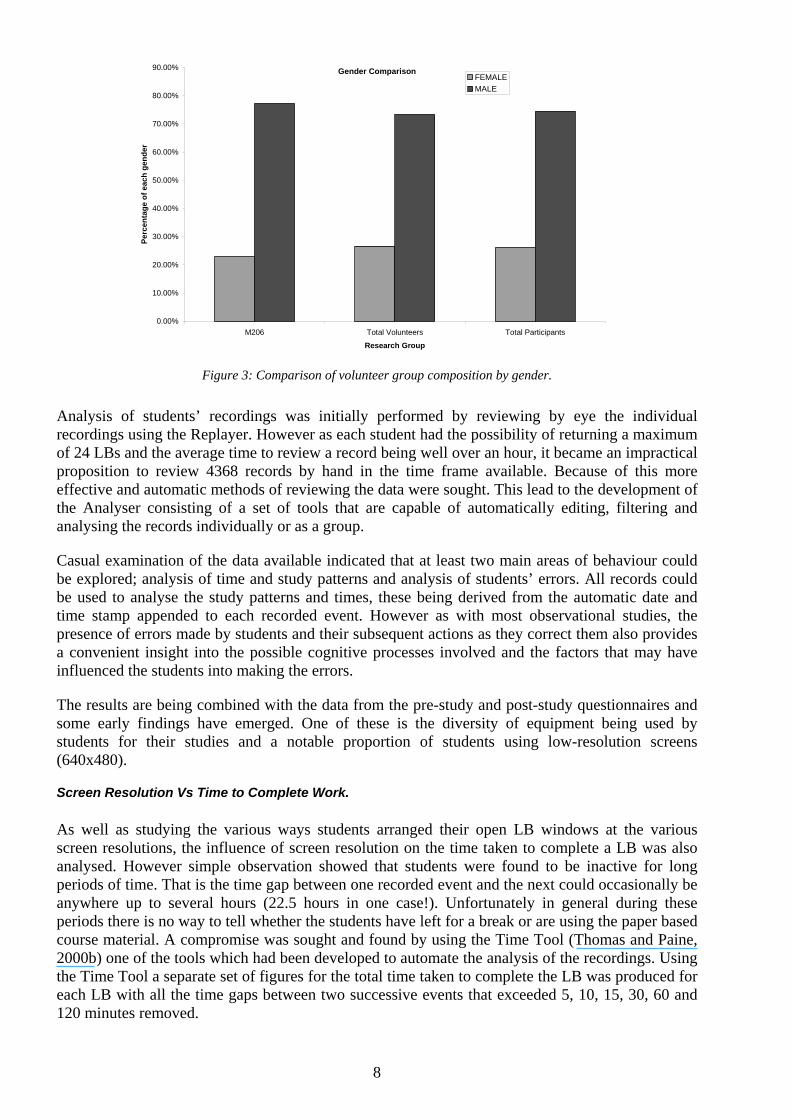
Figure 3: Comparison of volunteer group composition by gender.
Analysis of students’ recordings was initially performed by reviewing by eye the individualrecordings using the Replayer. However as each student had the possibility of returning a maximumof 24 LBs and the average time to review a record being well over an hour, it became an impracticalproposition to review 4368 records by hand in the time frame available. Because of this moreeffective and automatic methods of reviewing the data were sought. This lead to the development ofthe Analyser consisting of a set of tools that are capable of automatically editing, filtering andanalysing the records individually or as a group.
Casual examination of the data available indicated that at least two main areas of behaviour couldbe explored; analysis of time and study patterns and analysis of students’ errors. All records couldbe used to analyse the study patterns and times, these being derived from the automatic date andtime stamp appended to each recorded event. However as with most observational studies, thepresence of errors made by students and their subsequent actions as they correct them also providesa convenient insight into the possible cognitive processes involved and the factors that may haveinfluenced the students into making the errors.
The results are being combined with the data from the pre-study and post-study questionnaires andsome early findings have emerged. One of these is the diversity of equipment being used bystudents for their studies and a notable proportion of students using low-resolution screens(640x480).
Screen Resolution Vs Time to Complete Work.
As well as studying the various ways students arranged their open LB windows at the variousscreen resolutions, the influence of screen resolution on the time taken to complete a LB was alsoanalysed. However simple observation showed that students were found to be inactive for longperiods of time. That is the time gap between one recorded event and the next could occasionally beanywhere up to several hours (22.5 hours in one case!). Unfortunately in general during theseperiods there is no way to tell whether the students have left for a break or are using the paper basedcourse material. A compromise was sought and found by using the Time Tool (Thomas and Paine,2000b) one of the tools which had been developed to automate the analysis of the recordings. Usingthe Time Tool a separate set of figures for the total time taken to complete the LB was produced foreach LB with all the time gaps between two successive events that exceeded 5, 10, 15, 30, 60 and120 minutes removed.
9
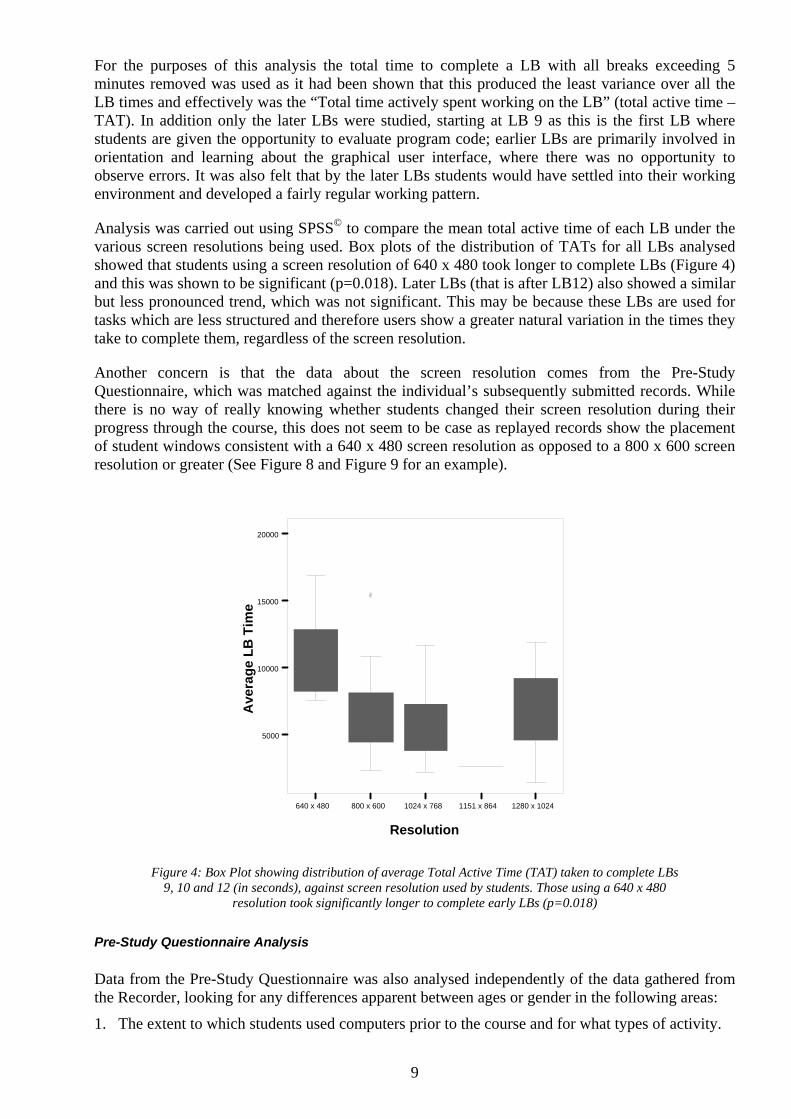
For the purposes of this analysis the total time to complete a LB with all breaks exceeding 5minutes removed was used as it had been shown that this produced the least variance over all theLB times and effectively was the “Total time actively spent working on the LB” (total active time –TAT). In addition only the later LBs were studied, starting at LB 9 as this is the first LB wherestudents are given the opportunity to evaluate program code; earlier LBs are primarily involved inorientation and learning about the graphical user interface, where there was no opportunity toobserve errors. It was also felt that by the later LBs students would have settled into their workingenvironment and developed a fairly regular working pattern.
Analysis was carried out using SPSS© to compare the mean total active time of each LB under thevarious screen resolutions being used. Box plots of the distribution of TATs for all LBs analysedshowed that students using a screen resolution of 640 x 480 took longer to complete LBs (Figure 4)and this was shown to be significant (p=0.018). Later LBs (that is after LB12) also showed a similarbut less pronounced trend, which was not significant. This may be because these LBs are used fortasks which are less structured and therefore users show a greater natural variation in the times theytake to complete them, regardless of the screen resolution.
Another concern is that the data about the screen resolution comes from the Pre-StudyQuestionnaire, which was matched against the individual’s subsequently submitted records. Whilethere is no way of really knowing whether students changed their screen resolution during theirprogress through the course, this does not seem to be case as replayed records show the placementof student windows consistent with a 640 x 480 screen resolution as opposed to a 800 x 600 screenresolution or greater (See Figure 8 and Figure 9 for an example).
640 x 480 800 x 600 1024 x 768 1151 x 864 1280 x 1024
Resolution
5000
10000
15000
20000
Ave
rage
LB
Tim
e
Figure 4: Box Plot showing distribution of average Total Active Time (TAT) taken to complete LBs9, 10 and 12 (in seconds), against screen resolution used by students. Those using a 640 x 480
resolution took significantly longer to complete early LBs (p=0.018)
Pre-Study Questionnaire Analysis
Data from the Pre-Study Questionnaire was also analysed independently of the data gathered fromthe Recorder, looking for any differences apparent between ages or gender in the following areas:
1. The extent to which students used computers prior to the course and for what types of activity.
10
2. Level of comfort that is displayed carrying out various computer related tasks.
3. The hardware configuration of the computer being used to study the course.a. Screen sizes used.b. Screen resolutions used.c. Type of processor being used.d. Clock speed being used.e. Amount of system RAM.
Apart from determining any demographic differences the purpose of looking for these varianceswas to aid in the classification of student errors and try and determine any factors which may beinfluential to the formation of such errors. Age in all the factors investigated showed no significanttrends. However some gender differences were apparent in some areas.
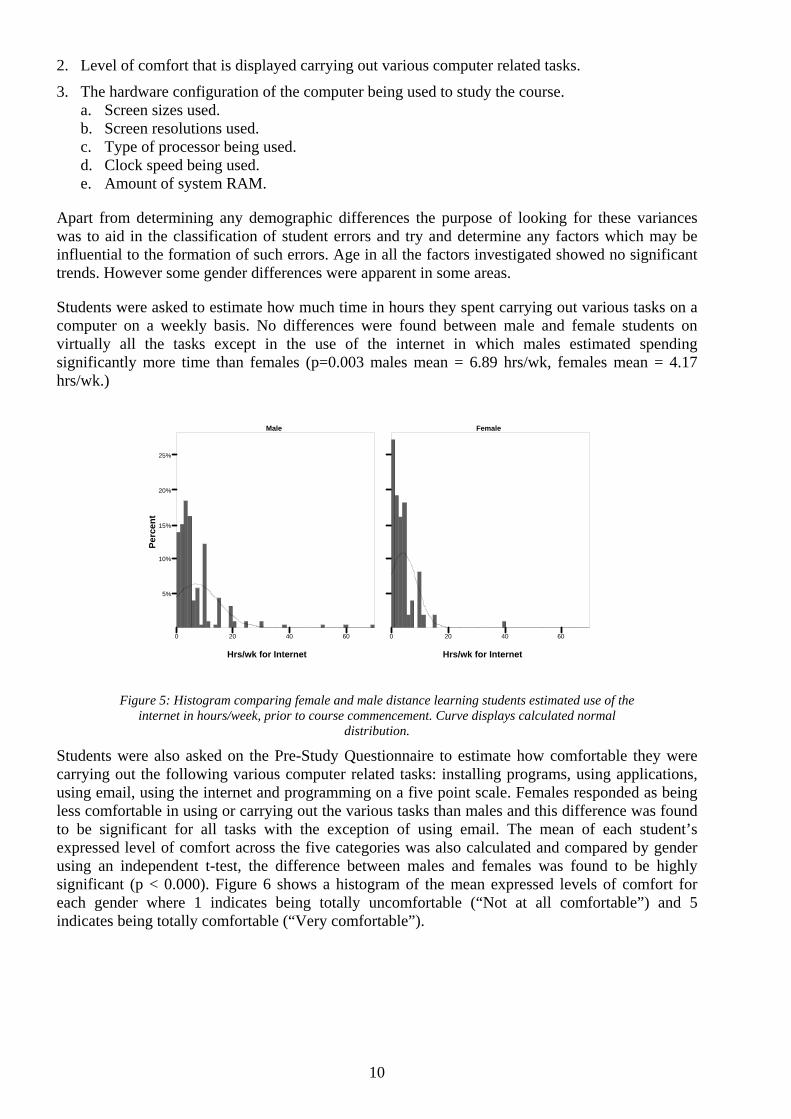
Students were asked to estimate how much time in hours they spent carrying out various tasks on acomputer on a weekly basis. No differences were found between male and female students onvirtually all the tasks except in the use of the internet in which males estimated spendingsignificantly more time than females (p=0.003 males mean = 6.89 hrs/wk, females mean = 4.17hrs/wk.)
0 20 40 60
Hrs/wk for Internet
5%
10%
15%
20%
25%
Perc
ent
Male Female
0 20 40 60
Hrs/wk for Internet
Figure 5: Histogram comparing female and male distance learning students estimated use of theinternet in hours/week, prior to course commencement. Curve displays calculated normal
distribution.
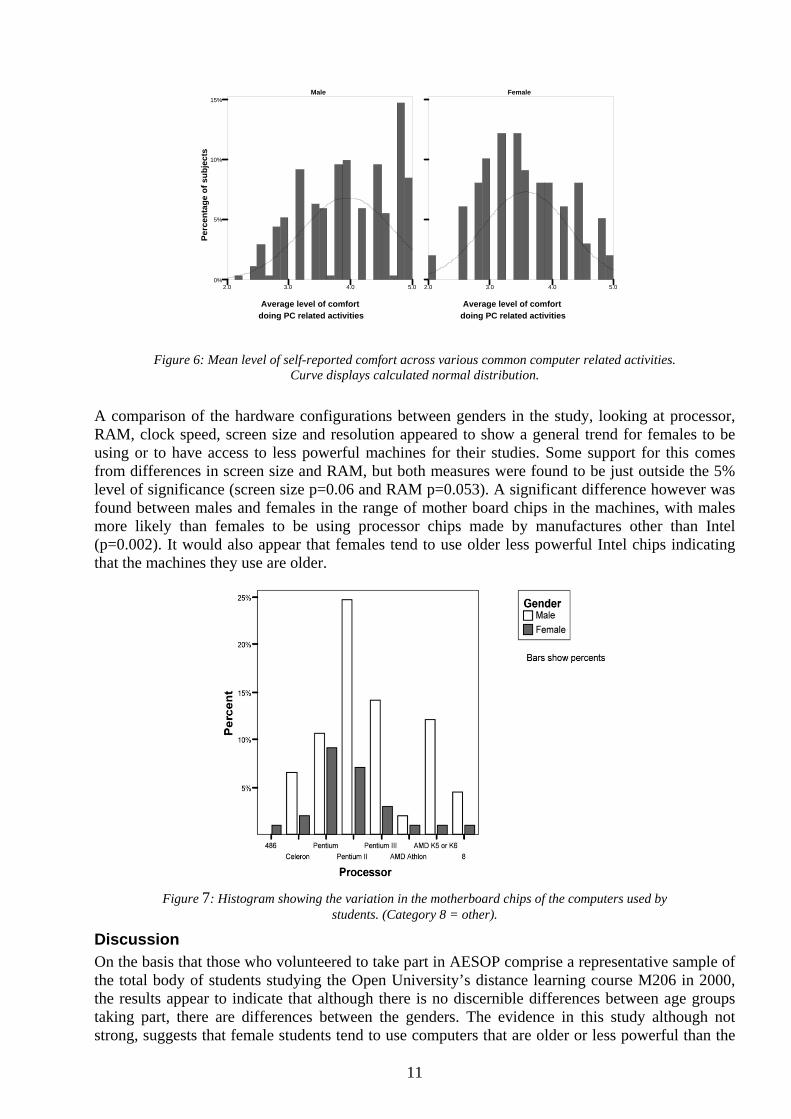
Students were also asked on the Pre-Study Questionnaire to estimate how comfortable they werecarrying out the following various computer related tasks: installing programs, using applications,using email, using the internet and programming on a five point scale. Females responded as beingless comfortable in using or carrying out the various tasks than males and this difference was foundto be significant for all tasks with the exception of using email. The mean of each student’sexpressed level of comfort across the five categories was also calculated and compared by genderusing an independent t-test, the difference between males and females was found to be highlysignificant (p < 0.000). Figure 6 shows a histogram of the mean expressed levels of comfort foreach gender where 1 indicates being totally uncomfortable (“Not at all comfortable”) and 5indicates being totally comfortable (“Very comfortable”).
11
2.0 3.0 4.0 5.0
Average level of comfortdoing PC related activities
0%
5%
10%
15%
Perc
enta
ge o
f sub
ject
s
Male Female
2.0 3.0 4.0 5.0
Average level of comfortdoing PC related activities
Figure 6: Mean level of self-reported comfort across various common computer related activities.Curve displays calculated normal distribution.
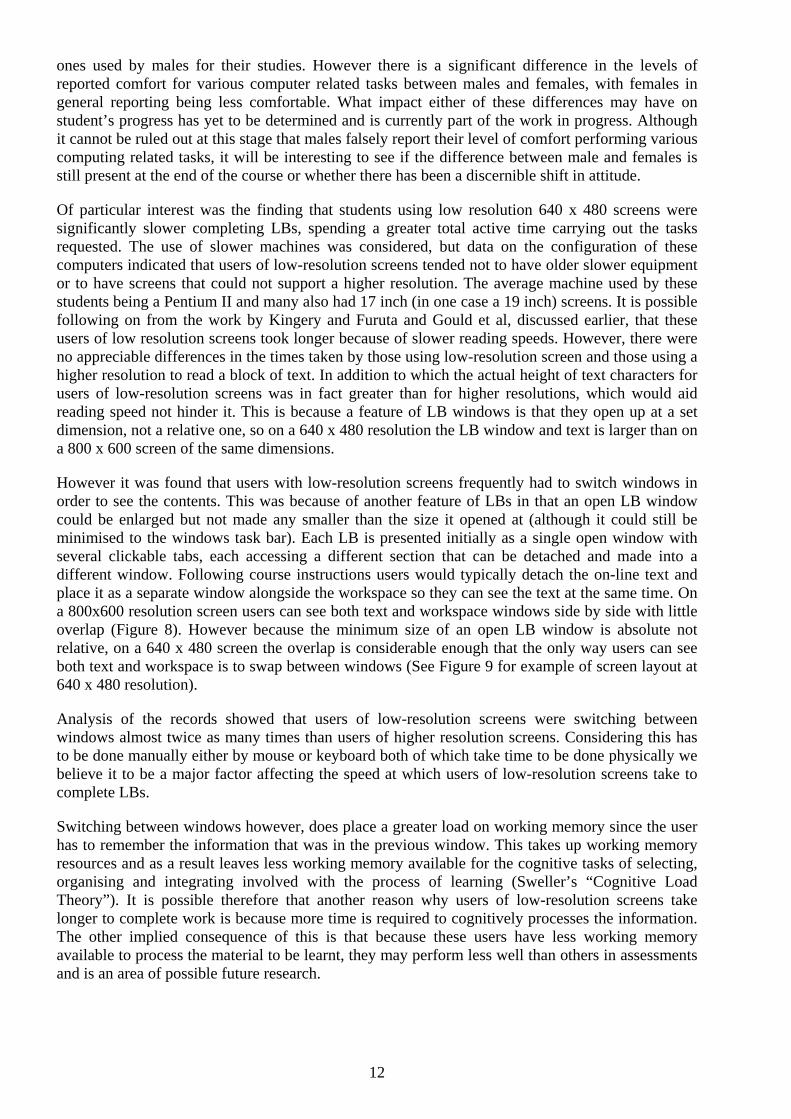
A comparison of the hardware configurations between genders in the study, looking at processor,RAM, clock speed, screen size and resolution appeared to show a general trend for females to beusing or to have access to less powerful machines for their studies. Some support for this comesfrom differences in screen size and RAM, but both measures were found to be just outside the 5%level of significance (screen size p=0.06 and RAM p=0.053). A significant difference however wasfound between males and females in the range of mother board chips in the machines, with malesmore likely than females to be using processor chips made by manufactures other than Intel(p=0.002). It would also appear that females tend to use older less powerful Intel chips indicatingthat the machines they use are older.
Figure 7: Histogram showing the variation in the motherboard chips of the computers used bystudents. (Category 8 = other).
DiscussionOn the basis that those who volunteered to take part in AESOP comprise a representative sample ofthe total body of students studying the Open University’s distance learning course M206 in 2000,the results appear to indicate that although there is no discernible differences between age groupstaking part, there are differences between the genders. The evidence in this study although notstrong, suggests that female students tend to use computers that are older or less powerful than the
12
ones used by males for their studies. However there is a significant difference in the levels ofreported comfort for various computer related tasks between males and females, with females ingeneral reporting being less comfortable. What impact either of these differences may have onstudent’s progress has yet to be determined and is currently part of the work in progress. Althoughit cannot be ruled out at this stage that males falsely report their level of comfort performing variouscomputing related tasks, it will be interesting to see if the difference between male and females isstill present at the end of the course or whether there has been a discernible shift in attitude.
Of particular interest was the finding that students using low resolution 640 x 480 screens weresignificantly slower completing LBs, spending a greater total active time carrying out the tasksrequested. The use of slower machines was considered, but data on the configuration of thesecomputers indicated that users of low-resolution screens tended not to have older slower equipmentor to have screens that could not support a higher resolution. The average machine used by thesestudents being a Pentium II and many also had 17 inch (in one case a 19 inch) screens. It is possiblefollowing on from the work by Kingery and Furuta and Gould et al, discussed earlier, that theseusers of low resolution screens took longer because of slower reading speeds. However, there wereno appreciable differences in the times taken by those using low-resolution screen and those using ahigher resolution to read a block of text. In addition to which the actual height of text characters forusers of low-resolution screens was in fact greater than for higher resolutions, which would aidreading speed not hinder it. This is because a feature of LB windows is that they open up at a setdimension, not a relative one, so on a 640 x 480 resolution the LB window and text is larger than ona 800 x 600 screen of the same dimensions.
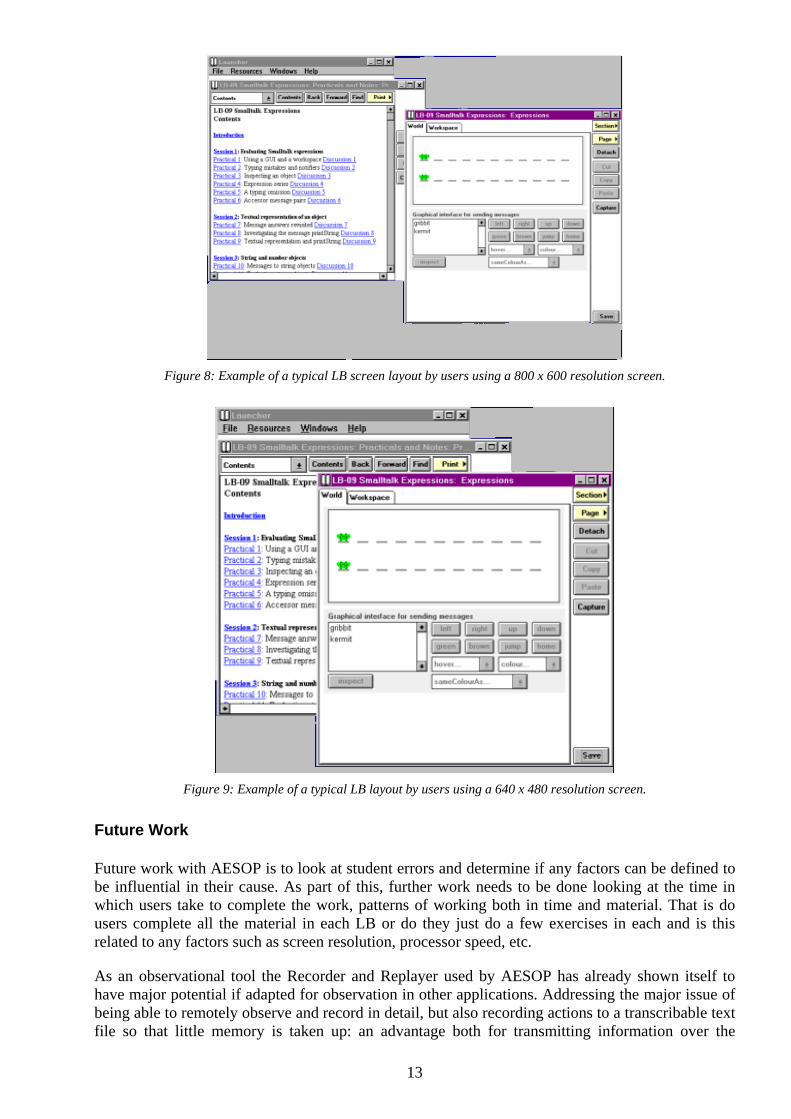
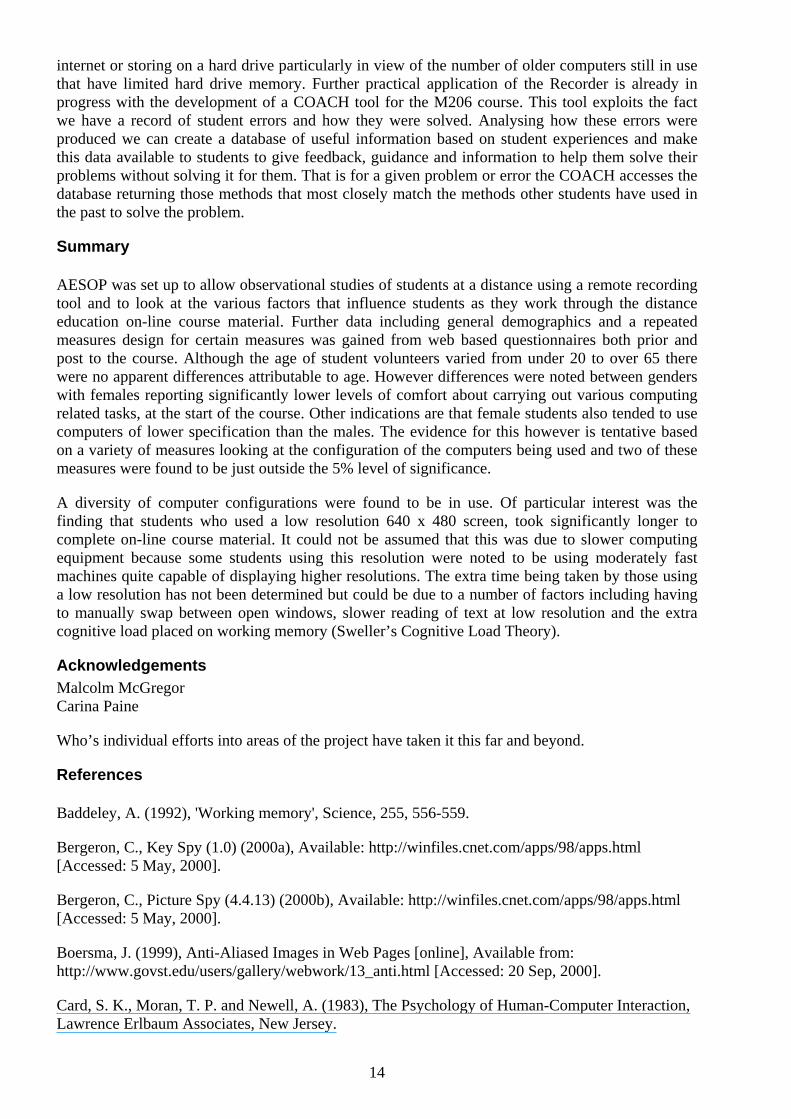
However it was found that users with low-resolution screens frequently had to switch windows inorder to see the contents. This was because of another feature of LBs in that an open LB windowcould be enlarged but not made any smaller than the size it opened at (although it could still beminimised to the windows task bar). Each LB is presented initially as a single open window withseveral clickable tabs, each accessing a different section that can be detached and made into adifferent window. Following course instructions users would typically detach the on-line text andplace it as a separate window alongside the workspace so they can see the text at the same time. Ona 800x600 resolution screen users can see both text and workspace windows side by side with littleoverlap (Figure 8). However because the minimum size of an open LB window is absolute notrelative, on a 640 x 480 screen the overlap is considerable enough that the only way users can seeboth text and workspace is to swap between windows (See Figure 9 for example of screen layout at640 x 480 resolution).
Analysis of the records showed that users of low-resolution screens were switching betweenwindows almost twice as many times than users of higher resolution screens. Considering this hasto be done manually either by mouse or keyboard both of which take time to be done physically webelieve it to be a major factor affecting the speed at which users of low-resolution screens take tocomplete LBs.
Switching between windows however, does place a greater load on working memory since the userhas to remember the information that was in the previous window. This takes up working memoryresources and as a result leaves less working memory available for the cognitive tasks of selecting,organising and integrating involved with the process of learning (Sweller’s “Cognitive LoadTheory”). It is possible therefore that another reason why users of low-resolution screens takelonger to complete work is because more time is required to cognitively processes the information.The other implied consequence of this is that because these users have less working memoryavailable to process the material to be learnt, they may perform less well than others in assessmentsand is an area of possible future research.
13
Figure 8: Example of a typical LB screen layout by users using a 800 x 600 resolution screen.
Figure 9: Example of a typical LB layout by users using a 640 x 480 resolution screen.
Future Work
Future work with AESOP is to look at student errors and determine if any factors can be defined tobe influential in their cause. As part of this, further work needs to be done looking at the time inwhich users take to complete the work, patterns of working both in time and material. That is dousers complete all the material in each LB or do they just do a few exercises in each and is thisrelated to any factors such as screen resolution, processor speed, etc.
As an observational tool the Recorder and Replayer used by AESOP has already shown itself tohave major potential if adapted for observation in other applications. Addressing the major issue ofbeing able to remotely observe and record in detail, but also recording actions to a transcribable textfile so that little memory is taken up: an advantage both for transmitting information over the
14
internet or storing on a hard drive particularly in view of the number of older computers still in usethat have limited hard drive memory. Further practical application of the Recorder is already inprogress with the development of a COACH tool for the M206 course. This tool exploits the factwe have a record of student errors and how they were solved. Analysing how these errors wereproduced we can create a database of useful information based on student experiences and makethis data available to students to give feedback, guidance and information to help them solve theirproblems without solving it for them. That is for a given problem or error the COACH accesses thedatabase returning those methods that most closely match the methods other students have used inthe past to solve the problem.
Summary
AESOP was set up to allow observational studies of students at a distance using a remote recordingtool and to look at the various factors that influence students as they work through the distanceeducation on-line course material. Further data including general demographics and a repeatedmeasures design for certain measures was gained from web based questionnaires both prior andpost to the course. Although the age of student volunteers varied from under 20 to over 65 therewere no apparent differences attributable to age. However differences were noted between genderswith females reporting significantly lower levels of comfort about carrying out various computingrelated tasks, at the start of the course. Other indications are that female students also tended to usecomputers of lower specification than the males. The evidence for this however is tentative basedon a variety of measures looking at the configuration of the computers being used and two of thesemeasures were found to be just outside the 5% level of significance.
A diversity of computer configurations were found to be in use. Of particular interest was thefinding that students who used a low resolution 640 x 480 screen, took significantly longer tocomplete on-line course material. It could not be assumed that this was due to slower computingequipment because some students using this resolution were noted to be using moderately fastmachines quite capable of displaying higher resolutions. The extra time being taken by those usinga low resolution has not been determined but could be due to a number of factors including havingto manually swap between open windows, slower reading of text at low resolution and the extracognitive load placed on working memory (Sweller’s Cognitive Load Theory).
AcknowledgementsMalcolm McGregorCarina Paine
Who’s individual efforts into areas of the project have taken it this far and beyond.
References
Baddeley, A. (1992), 'Working memory', Science, 255, 556-559.
Bergeron, C., Key Spy (1.0) (2000a), Available: http://winfiles.cnet.com/apps/98/apps.html[Accessed: 5 May, 2000].
Bergeron, C., Picture Spy (4.4.13) (2000b), Available: http://winfiles.cnet.com/apps/98/apps.html[Accessed: 5 May, 2000].
Boersma, J. (1999), Anti-Aliased Images in Web Pages [online], Available from:http://www.govst.edu/users/gallery/webwork/13_anti.html [Accessed: 20 Sep, 2000].
Card, S. K., Moran, T. P. and Newell, A. (1983), The Psychology of Human-Computer Interaction,Lawrence Erlbaum Associates, New Jersey.
15
Chisholm, W., Vanderheiden, G. and Jacobs, I. (1999), 'Web Content Accessibility Guidelines 1.0'[Online], W3C, Available: http://www.W3.org/TR/1999/WAI-WEBCONTENT-19990505[Accessed: 5 May, 1999].
Clover, D. (Department of Computing, The Open University), Nov 2000, Use of 640 x 480resolution on 19" monitor [Anecdotal], to: Logan, K. (Department of Computing, The OpenUniversity).
Courtenay, G. (1978), Questionnaire Construction, in: Survey Research Practice (Eds, Hoinville,G., Jowell, R. and associates, a.), Heinmann Educational Research, London, 27 - 54.
Educational Technology (EDTECH) [online], Available from: http://www.h-net.msu.edu/~edweb/[Accessed: 9 Sep, 2000].
Fleming, M. and Levie, W. H. (Eds.) (1993) Instructional Message Design: Principles from theBehavioural and Cognitive Sciences, Educational Technology Publications, Englewood Cliffs, NewJersey, USA.
Garner, R., Brown, R., Sanders, S. and Menke, D. (1992), "Seductive details" and Learning fromText, in: The Role of Interest in Learning and Development (Eds, Renninger, K. A., Hidi, S. andKrapp, A.), Lawrence Erlbaum Associates, Hillsdale, NJ, 239 - 254.
Goldberg, A., Abell, S. T. and Leibs, D. (1997), 'The LearningWorks Delivery and DevelopmentFramework', Communications of the ACM, 40(10), 78-81.
Good, D. and Watts, F. (1989), Qualitative Research, in: Behavioural and Mental Health Research:A Handbook of Skills and Methods (Eds, Parry, G. and Watts, F.), Lawrence Erlbaum Associates,Hove, East Sussex.
Gould, J., Alfaro, L., Barnes, V., Finn, R., Grischkowsky, N. and Minuto, A. (1987), 'Reading isSlower from CRT Displays than from Paper: Attempts to Isolate a Single-Variable Explanation',Human Factors, 29(3), 269-299.
Gould, J., Alfaro, L., Finn, R., Haupt, B. and Minuto, A. (1987), 'Reading from CRT Displays CanBe as Fast as Reading from Paper', Human Factors, 29(5), 497-517.
Harp, S. F. and Meyer, R. E. (1998), 'How seductive details do their damage: A theory of cognitiveinterest in science learning', Journal of Educational Psychology, 90(3), 414 - 434.
Instructional Technology Forum (ITFORUM) [online], Available from:http://it.coe.uga.edu/itforum/home.html [Accessed: 9 Sep, 2000].
Kingery, D. and Furuta, R. (1997), 'Skimming electronic newspaper headlines- A study of typeface,point size, screen resolution, and monitor size', Information Processing and Management, 33(5),685-696.
Kirkwood, A. and Rae, S. (2000), Students' Access to Media Technologies 2000 - interim report,The Open University, Report.
Kivi, M. R., Gronfors, T. and Koponen, A. (1998), 'MOTHER: System for continuous capturing ofdisplay stream', Behaviour and Information Technology, 17(3), 152-154.
Labaw, P. (1982), Advanced Questionnaire Design (Second Edition), Abt Books, Cambridge,Massachusetts, USA.
16
Logan, K. and Paine, C. (2000), Computing General Demographic Questionnaire, Department ofComputing, The Open University, Report: 2000/10.
M206 Computing: An Object-Oriented Approach (1998), [online], The Open University. Availablefrom: http://www3.open.ac.uk/courses/bin/p12.dll?C02M206 [Accessed: 10-Jul-03].
MacGregor, M., Thomas, P. and Woodman, M. (1999), 'Recording and Analysing User Actions in aSmalltalk Programming Environment', in Proceedings of Technology of Object-OrientedLanguages and Systems (TOOLS 30), pp. 280-289, Santa Barbara, USA.
Mayer, R. E. (1997), 'Multimedia learning: Are we asking the right questions?' EducationalPsychologist, 32(1), 1 - 19.
Mayer, R. E. and Sims, V. K. (1994), 'For whom is the picture worth a thousand words? Extensionsof dual-coding theory of multimedia learning', Journal of Educational Psychology, 86(3), 389 - 401.
Mousavi, S. Y., Low, R. and Sweller, J. (1995), 'Reducing cognitive load by mixing auditory andvisual presentation modes', Journal of Educational Psychology, 87(2), 319-334.
Smith, J. B., Smith, D. K. and Kupstas, E. (1991), Automated Protocol Analysis: Tools andMethodology, The University of North Carolina at Chapel Hill, Report: TR91-034.
Smith, J. B., Smith, D. K. and Kupstas, E. (1993), 'Automated Protocol Analysis', Human ComputerInteraction, 8, 101-145.
Smithers, R. (2000), Universities forge alliance for global teaching on net, In: The Guardian,London.
Sutherland, J. (2000), When will the e-force be with us?, In: The Guardian, London.
Sweller, J. (1988), 'Cognitive load during problem solving: Effects on learning', Cognitive Science,12, 257-285.
Sweller, J. (1989), 'Cognitive technology: Some proceedures for facilitating learning and problemsolving in mathematics and science', Journal of Educational Psychology, 81, 457-466.
Sweller, J. (1993), 'Some cognitive processes and their consequences for the organisation andpresentation of information', Australian Journal of Psychology, 45, 1-8.
Sweller, J. (1994), 'Cognitive load theory, learning difficulty and instructional design', Learning andInstruction, 4, 295-312.
Thomas, P. G., MacGregor, M. and Martin, M. (1998a), 'AESOP - An Electronic StudentObservatory Project', in Proceedings of Frontiers in Education Conference, pp. 1120, Arizona.
Thomas, P. G., MacGregor, M. and Martin, M. (1998b), Observing Students as they Learn toprogram, Department of Computing: The Open University, Report: 1998/16.
Thomas, P. G. and Paine, C. (2000a), How students learn to program: observations of practicalwork, Department of Computing: The Open University, Report: 2000/03.
Thomas, P. G. and Paine, C. (2000b), How students learn to program: observations of study timebehaviour, Computing Department: The Open University, Report: 2000/02.
17
Thomas, P. G. and Paine, C. (2000c), 'Tools for Observing Study Behaviour', in Proceedings of12th Annual Workshop of Psychology of Programming Interest Group (PPIG), 10-13 April,Cozenza, Italy, pp. 221-236.
Woodman, M., Griffiths, R., Macgregor, M. and Holland, S. (1999), 'OU LearningWorks: ACustomizable Learning Environment for Smalltalk Modules', in Proceedings of InternationalConference on Software Engineering (ICSE'99), 16-22 May, 1999, Los Angeles, California, USA,pp. 638-641, ACM, New York.
Woodman, M., Griffiths, R., Macgregor, M., Robinson, H. M. and Holland, S. (1999), 'EmployingObject Technology to Expose Fundamental Object Concepts', in Proceedings of 29th InternationalConference on Technology of Object-Oriented Languages and Systems (TOOLS EUROPE '99),June 1999, Nancy, France.