Objective evaluation of changes in left ventricular and atrial volumes during parabolic flight using...
34
1 OBJECTIVE EVALUATION OF CHANGES IN LEFT VENTRICULAR AND ATRIAL VOLUMES DURING PARABOLIC FLIGHT USING REAL-TIME THREE-DIMENSIONAL ECHOCARDIOGRAPHY E.G. Caiani 1 , L. Sugeng 2 , L. Weinert 2 , A. Capderou 3 , R.M. Lang 2 , P. Vaïda 4 1 Dipartimento di Bioingegneria, Politecnico di Milano, Milan, Italy 2 Noninvasive Cardiac Imaging Laboratory, University of Chicago, Chicago IL, USA 3 Université Paris Sud, UPRES EA 2397, CCML, Physiologie, Le Plessis Robinson, France 4 Université Bordeaux 2, Médecine Aérospatiale, Bordeaux, France Short title: RT3DE during parabolic flight Address for correspondence: Enrico G Caiani, PhD Politecnico di Milano, Dipartimento di Bioingegneria Piazza L. da Vinci, 32, 20133 Milano, Italy. Tel: +39-02-2399-3302, Fax: +39-02-2399-3360; E-mail: [email protected] Page 1 of 34 Articles in PresS. J Appl Physiol (April 6, 2006). doi:10.1152/japplphysiol.00014.2006 Copyright © 2006 by the American Physiological Society.
Transcript of Objective evaluation of changes in left ventricular and atrial volumes during parabolic flight using...

1
OBJECTIVE EVALUATION OF CHANGES IN LEFT VENTRICULAR AND ATRIAL VOLUMES DURING
PARABOLIC FLIGHT USING REAL-TIME THREE-DIMENSIONAL ECHOCARDIOGRAPHY
E.G. Caiani1, L. Sugeng2, L. Weinert2, A. Capderou3, R.M. Lang2, P. Vaïda4
1 Dipartimento di Bioingegneria, Politecnico di Milano, Milan, Italy 2 Noninvasive Cardiac Imaging Laboratory, University of Chicago, Chicago IL, USA 3 Université Paris Sud, UPRES EA 2397, CCML, Physiologie, Le Plessis Robinson, France 4 Université Bordeaux 2, Médecine Aérospatiale, Bordeaux, France
Short title: RT3DE during parabolic flight
Address for correspondence:
Enrico G Caiani, PhD
Politecnico di Milano, Dipartimento di Bioingegneria
Piazza L. da Vinci, 32, 20133 Milano, Italy.
Tel: +39-02-2399-3302, Fax: +39-02-2399-3360;
E-mail: [email protected]
Page 1 of 34 Articles in PresS. J Appl Physiol (April 6, 2006). doi:10.1152/japplphysiol.00014.2006
Copyright © 2006 by the American Physiological Society.
2
Abstract
Objectives. We tested the feasibility of real-time 3D echocardiographic (RT3DE) imaging
to measure left heart volumes at different gravity during parabolic flight and studied the effects of
lower body negative pressure (LBNP) as a countermeasure. Background. Weightlessness-
related changes in cardiac function have been previously studied during space flights using both
2D and 3D echocardiography. Several technical factors, such as inability to provide real-time
analysis and the need for laborious endocardial definition have limited its usefulness. RT3DE
imaging overcomes these limitations by acquiring real-time pyramidal datasets encompassing
the entire ventricle. Methods. RT3DE datasets were obtained (Philips 7500, X3) during breath-
hold in 16 unmedicated normal subjects in upright standing position at different gravity phases
during parabolic flight (normogravity, 1Gz; hypergravity, 1.8Gz; microgravity, 0Gz), with LBNP
applied (-50 mmHg) at 0Gz in selected parabolas. Results. RT3DE imaging during parabolic
flight was feasible in 14/16 subjects. Data were analyzed (Tomtec) to quantify left ventricular
(LV) and atrial (LA) volumes at end-diastole and end-systole, which significantly decreased at
1.8Gz and increased at 0Gz. While ejection fraction did not change with gravity, stroke volume
was reduced by 16% at 1.8Gz and increased by 20% at 0Gz, but was not significantly different
from 1Gz values with LBNP. Conclusions. RT3DE during parabolic flight is feasible and
provides the basis for accurate quantification of LV and LA volume changes with gravity. As
LBNP counteracted the increase of LV and LA volumes caused by changes in venous return, it
may be effectively used for preventing cardiac dilatation during microgravity.
Keywords: real-time three-dimensional echocardiography, weightlessness, parabolic flight,
countermeasures
Page 2 of 34
3
Introduction
During space flight, changes in gravity (Gz, head-to-foot acceleration) affect the
cardiovascular system by causing fluid shifts from the lower extremities toward the head and
thorax, thus altering central filling volumes and pressures (15; 16; 23; 31). These hemodynamic
alterations, which directly influence heart chamber dimensions and function, are responsible for
many of the adverse effects associated with the post-flight orthostatic intolerance observed in
astronauts (20-22).
The potential for commercial spaceflight has made a precise understanding of the early
cardiovascular adaptation to weightlessness important. As more individuals have the opportunity
to fly in space, standards will need to be set to decide what level of cardiovascular function is
needed to tolerate the acute headward fluid shift that occurs in weightlessness. Some individuals
with non-distensible ventricles potentially could develop pulmonary edema upon entering
weightlessness. Measurements of the expected changes in ventricular volumes, atrial volumes
and peak filling rate upon entering weightlessness are needed to help set appropriate standards.
In addition, certain countermeasures, like lower body negative pressure (LBNP) devices (24;
38), could be used to reduce the fluid shift and prevent or treat adverse events.
Moreover, the evaluation of cardiovascular physiology under different gravitational loads
may provide some crossover benefits to clinical medicine on Earth. Ground-based studies
represent an invaluable opportunity to investigate human physiology during simulated
microgravity conditions. Among them, parabolic flight presents an unique opportunity to study
the immediate physiological adaptations of the cardiovascular system to different gravity
conditions.
Two-dimensional echocardiography (2DE) has been the principal imaging modality used
in space programs to evaluate changes in the cardiovascular system, and to test the
effectiveness of countermeasures employed to alleviate these changes (34). Using 2DE,
patterns of adaptation of left ventricular (LV) dimensions to microgravity during short- and long-
Page 3 of 34

4
term missions have been previously described (3; 10; 11; 25; 37; 41). However, although 2DE is
routinely used in clinical practice to measure heart chamber dimensions, wall thickness, and
function, this imaging technique is limited because it relies on correct probe positioning to avoid
acquisition of foreshortened apical views. In addition, derivation of volumetric parameters from
multiple 2D views requires the use of geometric models which may introduce additional errors
(19; 43; 49).
In an attempt to circumvent these constraints, Zoghbi et al. have developed a non-
geometric three-dimensional echocardiographic (3DE) method by acquiring multiple short-axis
2DE images of the LV from a single pivoting point and reconstructing the volume off-line (50).
Using this approach, 3DE was previously used in space (Spacelab Life Sciences-1 and –2
missions), to measure LV volumes (8). However, this methodology is limited by several factors,
such as cumbersome data acquisition required for off-line 3D reconstruction and the need for
tedious off-line manual tracings of endocardial borders in multiple planes.
The recent development of second generation full-matrix array transducers, capable of
high spatial resolution and near real-time acquisition of wide-angled pyramidal 3D
echocardiographic datasets, has overcome many of the limitations of 2DE, and thus provided
the basis for accurate estimates of LV volumes (13; 26; 30), mass (36) and function (18).
We hypothesized that real-time 3D echocardiography (RT3DE) could be used in a
weightlessness environment for accurate quantification of the adaptations in LV and left atrial
(LA) dimensions in response to changes in gravity. Accordingly, the aims of this study were: 1)
to test the feasibility of RT3DE imaging of the left ventricle and left atrium in a weightlessness
environment; 2) to evaluate the changes in LV and LA volumes occurring with changes in gravity
during parabolic flight; 3) to test the effectiveness of the LBNP device in reducing LV and LA
volumes during microgravity by counteracting the decrease in hydrostatic pressure in the lower
body.
Page 4 of 34
5
Methods
Subjects.
Eighteen normal volunteers (13 men and 5 women, mean age 38 ± 14 years) without a
history of cardiovascular disease were enrolled in the study, after providing written informed
consent. All subjects were screened prior to participation to ensure adequate acoustic windows
even when imaging in the upright position. After completion of the preliminary screening, sixteen
out of the eighteen volunteers (12 men and 4 women, mean age 36±13 years) were selected.
None of the subjects were taking medication prior to and/or during the flights. This study was
approved by both the French (Centre National d’Etudes Spatiales - CNES) and the European
Space Agency (ESA).
Equipment and protocol.
The study was conducted during two parabolic flight campaigns (CNES - November
2004, ESA – October 2005), on board of the ESA - CNES ZeroG Airbus A300 aircraft,
performed in Bordeaux, France Each flight lasted 2.5–3 hours and included 31 parabolas.
Instantaneous gravity was continuously measured using the aircraft’s accelerometer.
Gravity variations during a parabolic flight trajectory include four consecutive phases (Figure 1,
left): normogravity (phase I: head-to-foot acceleration 1 Gz) prior to parabola initiation; mild
hypergravity (phase II: 1.8 Gz, 20 sec) during the ascending phase of the parabola; microgravity
(phase III: 0 Gz, 24 sec), at the top of the parabola; a second period of mild hypergravity (phase
IV: 1.8 Gz, 20 sec) during the descending phase of the parabola. Between consecutive
parabolas, a period of steady state (at 1 G) persisted for a minimum of two minutes.
Each subject was imaged in the upright standing position during a maximum of 12
consecutive parabolas, with the abdomen and lower extremities placed inside a LBNP chamber
(Figure 1, right). To allow the lower limbs to stay relaxed (to maximize blood and fluid movement
to/from the lower body), subjects were placed on a saddle within the LBNP chamber with the
arms secured to the structure by straps. To test the effectiveness of LBNP in counteracting the
Page 5 of 34

6
effects of microgravity by reducing venous return, a negative pressure of –50 mmHg was applied
during the 0Gz phase in selected parabolas (from 3 to 5) in random order.
Real-time 3D echocardiographic imaging
Transthoracic RT3DE was performed from the apical window, with a full-matrix array
transducer (X3, 2-4 MHz) in the harmonic mode using a SONOS 7500 (Philips Medical Systems,
Andover, MA). To avoid body movement during acquisition, both subject and sonographer were
stabilized against free floating. A second operator aided in optimizing image quality (gain and
compression) and completing data acquisition.
For each gravity phase of the parabola, one RT3DE dataset representing one cardiac
cycle (frame rate 20 Hz) was acquired during a breath-hold, while avoiding Mueller or Valsalva
manoeuvres, and thus trying to minimize changes in intrathoracic pressure. Image acquisition
was performed using the wide-angled acquisition mode, in which four wedge-shaped sub-
volumes (93°x21°) were obtained over eight cardiac cycles with ECG gating. In this mode, each
sub-volume acquisition is triggered to the R-wave of every other heart beat in order to allow
sufficient time for the probe to be recalibrated and each sub-volume stored. Particular care was
taken to include the entire left ventricle and atrium within the pyramidal 3D scan volume.
Image acquisition at 1Gz was performed 10 sec prior to the initiation of phase II, while
image acquisition at 1.8Gz, 0Gz and final 1.8Gz were performed 5 sec after the beginning of
phase II, III and IV, respectively, to avoid data acquisition during the short initial transition during
which abrupt changes in cardiac volumes and heart rate may occur.
RT3DE volume analysis
The RT3DE datasets acquired in each subject during each phase of the parabola (i.e., I,
II, III and IV) were first visually inspected. Only parabolas with proper LV and LA endocardial
visualization in each gravity phase, assessed in two orthogonal cut-planes, corresponding to
Page 6 of 34

7
apical 2- and 4-chamber views, were selected for analysis. The RT3DE datasets were analyzed
in random order by an expert reader, blinded to the subject’s identity and to the gravity phase.
To quantify LV dimensions, each dataset was analyzed off-line using commercially
available software (4D LV Analysis, TomTec), previously described in detail (30). Briefly, after
identifying the LV long-axis, six equi-angled long-axis cut-planes were automatically generated
(Figure 2, A). To define the mitral valve plane in each of these cut-planes, the mitral valve
annulus was identified in the end-diastolic (ED) and end-systolic (ES) frames. An ellipse was
then placed in the ED and ES frames in each of the six selected long-axis cut-planes, manually
adapting its shape and angular position to fit as close as possible to the endocardial border.
Following this initialization phase, the semi-automatic endocardial contour detection procedure
was applied, resulting in a detected endocardial contour for each cut-plane and for each
consecutive frame throughout the cardiac cycle (Figure 2.B). In order to verify the correctness of
the border detection, each cut-plane was then visualized in the cine mode with the detected
contour overimposed, to allow the operator to perform manual adjustments, when necessary.
Finally, for each frame, the contours of the six cut-planes were then interpolated and displayed
as a wire-frame model in the 3D space (Figure 2.C), from which the enclosed LV volume was
computed using Gaussian quadrature formulas.
Global LV volume versus time curves were obtained, from which end-diastolic (EDV) and
end-systolic (ESV) volumes, defined as the maximum and the minimum volume, respectively,
were measured. Stroke volume (SV) was computed as the difference between EDV and ESV,
and ejection fraction (EF) was derived as 100* SV/EDV. Moreover, the first derivative of LV
volume versus time was computed, and the peak filling (PFR) and peak ejection (PER) rates
calculated.
To quantify the LA volumes in the ED and ES frames, the same RT3DE datasets were
analyzed off-line using commercial software (EchoView, TomTec). After selecting the LA long
axis, 8 equi-angled 2D long-axis cut-planes were generated (Figure 3.A), and in each pair of
Page 7 of 34
8
orthogonal planes, manual tracing of the atrial endocardial borders was performed using an
interactive spline interpolation algorithm (FIgure 3.B-C). After interpolation of the traced contours
in a 3D wire-frame model (Figure 3.D), the LA cavity volume was calculated automatically (29).
The LA volume computed in the ES frame was defined as LAmax, while the LA volume
computed in the ED frame was defined as LAmin. The LA reservoir function was assessed using
filling volume (FV), defined as (LAmax − LAmin), and the expansion index (EI), defined as
100*FV/LAmin. The overall diastolic emptying index (DEI) was calculated as 100*FV
/LAmax*100 (44). Moreover, to evaluate possible asymmetries in LA shape changes with
microgravity, the LA diameters along its major (D2, antero-posterior dimension) and minor (D1,
medial-lateral dimension) axes were computed at 1Gz and 0 Gz.
Statistical analysis
LV and LA volumes and derived parameters, normalized by their value at 1Gz, were
averaged for all subjects in each gravity phase. Data were displayed as mean±SD. One-way
ANOVA with repeated measures (p<0.05, Tukey test) was used to test the differences between
gravity phases. The effectiveness of LBNP in reducing changes in LV, LA volumes and derived
parameters at 0Gz was tested by paired student’s t-test. Differences were considered significant
for p<0.05 compared with the results at 0Gz obtained without LBNP.
Results
RT3DE imaging during parabolic flight was feasible in 14/16 subjects (87.5% of success),
in which RT3DE datasets were acquired for each gravity phase (1Gz, first 1.8Gz, 0Gz, second
1.8Gz). In the remaining two subjects, adequate visualization of the LV during all gravity phases
of the parabola was difficult due to unpredictable shifting of the heart within the chest cavity. In
these subjects, repositioning of the probe required more time than the 20 sec available for image
acquisition during each phase of the parabola.
Page 8 of 34
9
Of these 14 subjects, only 10 had also the RT3DE datasets acquired during 0Gz with
LBNP activated. In the remaining 4/14 subjects, this data acquisition was non possible due to
subjects experiencing motion sickness (3/14), and due to flight interruption caused by weather
conditions (1/14).
Quantitative analysis of LV and LA chambers was feasible in all RT3DE datasets
selected for analysis. The time required to analyze a complete RT3DE dataset to compute the
LV volume was about 15 min, while the time required to analyze a single frame to measure the
LA volume was approximately 3 minutes. Results obtained from the analysis of up to three
parabolas in each subjects were averaged to take into account intra-subject variability.
Figure 4 shows LV volume versus time curves with the corresponding first derivatives
computed in a same subject during normogravity, hypergravity and microgravity. Compared to
the 1Gz curve, an upward shift of the LV volume curve was noted at 0Gz. In contrast, a
downward shift of the LV volume curve was seen at 1.8Gz. Also, an increase in PFR was
evident during microgravity. Figure 5 shows an example of the LV (top) and LA (bottom) 3D ED
and ES casts obtained in the same subject during the different phases of the parabola: during
hypergravity, a shrinking of both the left ventricle and atrium was observed compared to
normogravity, while an enlargement was seen during the microgravity phase.
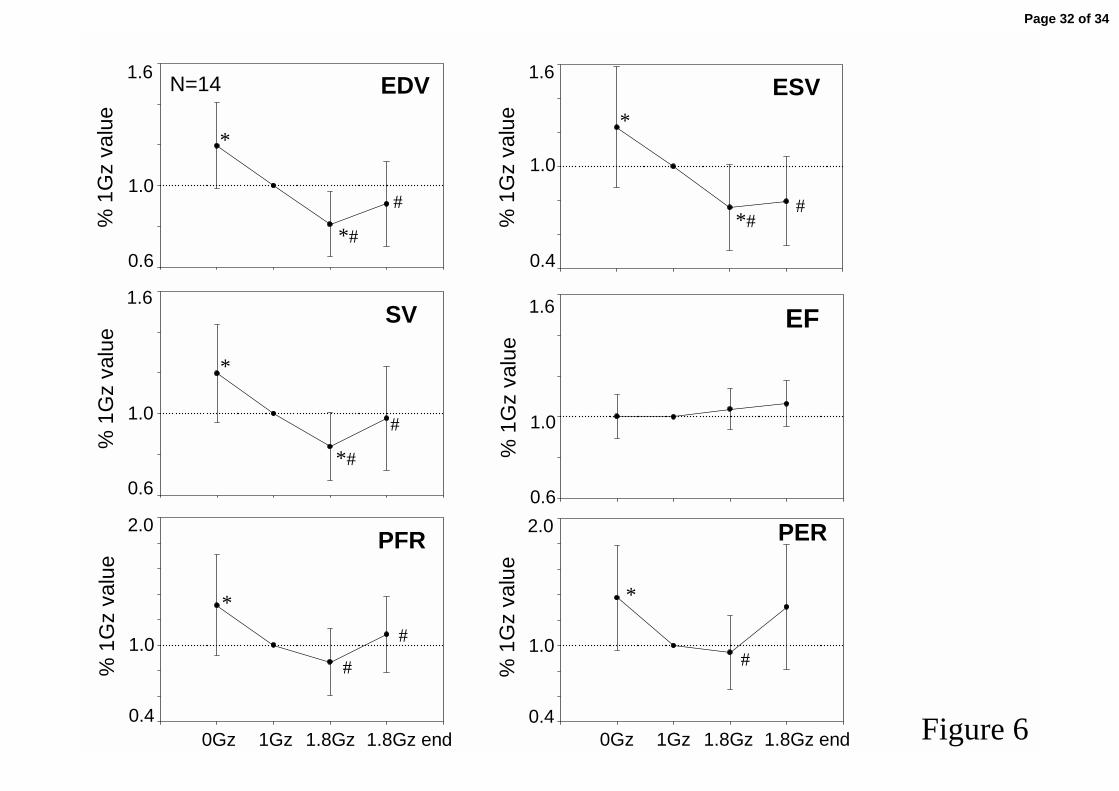
Significant changes in both LV and LA volumes were measured during the different
phases of the parabola (Table 1). Compared to 1 Gz values, both ED and ES LV volumes
decreased by 19% and 24%, respectively, during hypergravity, and increased of 19% and 23%,
respectively, during microgravity. These changes resulted in a reduction of SV of 16% during
hypergravity and an increase of 20% during 0Gz, while EF did not change with gravity. Though
PFR and PER did not change at 1.8Gz, these parameters increased by 31% and 37%,
respectively, during microgravity, compared to1Gz values (Figure 6).
Compared to normogravity, both LAmax and LAmin volumes decreased by 34% and
29%, respectively, during hypergravity, and increased by 41% and 26%, respectively, during
Page 9 of 34
10
microgravity. As a consequence, filling volumes were reduced by 36% and increased by 59% at
1.8Gz and 0Gz, respectively. Both DEI and EI increased during microgravity by 12% and 31%,
respectively (Figure 7). Left atrial D1 and D2 diameters at end-systole were increased by 28%
and 18% at 0 Gz, while at end-diastole only D2 was found augmented by 25% compared to 1 Gz
(Table 2).
With the activation of the LBNP countermeasure during microgravity, LV and LA volumes
were quantified in 10 subjects. All LV and LA parameters trended towards 1Gz values (Figure 8),
resulting in an attenuation of the changes noted at 0 Gz without LBNP. In particular, EDV and
PFR were found reduced and restored to 1Gz values. Also, LAmax, FV and DEI were reduced
and not different from their values at 1Gz.
Discussion
This study is the first to provide three-dimensional echocardiographic datasets from
complete cardiac cycles in weightlessness, allowing for the calculation of LV and LA volumes
and performance data.
Cardiac ultrasound has been the only medical imaging modality used in space to
evaluate cardiovascular function. However, its use for scientific purposes during space flights
has been limited due to operational constraints and technical factors (34). Despite these
limitations, two-dimensional echocardiography has been used to measure changes in cardiac
size and function during weightlessness (37);(5);(3), and to assess the time course of post-flight
recovery (2; 6; 10; 25; 35).
Parabolic flights are the only way to reproduce in humans the weightlessness (or free-
falling) state which characterizes space flights, thus representing a unique experimental
condition to study reversible and repeatable acute non-pharmacologically induced variations in
venous return in the same subject. We demonstrated the feasibility of acquiring 3D datasets
suitable for analysis for each gravity phase of the parabola, despite the relatively short period of
time available for image acquisition. The methodology used in this study allowed us to overcome
Page 10 of 34
11
many of the limitations of 2DE imaging. In particular, the availability of a 3D pyramidal dataset
allowed off-line selection of the anatomically correct LV long-axis, from which the equi-angled
long-axis cut-planes were obtained for endocardial contour detection. This minimized LV apical
foreshortening thus preventing the underestimation of LV volumes. Also, the frame-by-frame
analysis throughout the cardiac cycle allowed computation of LV volume versus time curves,
from which clinical parameters, such as peak filling and ejection rates, were derived. From the
same datasets, we also measured the effects of microgravity on LA volumes, to obtain new
insights into the physiology of this chamber at 0Gz.
In contrast to other studies (27; 42; 48), imaging the subjects in the standing position allowed us
both to maximize the effects of abrupt gravitational fluid shift on LV and LA volumes and to
study, for the first time during parabolic flight, the effects induced by LBNP.
Our results demonstrate that, when a subject experiences a higher gravitational stress
(phase II, 1.8 Gz), both LV and LA volumes become smaller compared to 1Gz values, due to a
decrease in venous return, resulting in a reduction of SV and left atrial FV. Interestingly, during
the second hypergravity phase (phase IV) these parameters were also significantly reduced
compared to 0 Gz but not different from 1 Gz values. Since the left heart is more dilated at the
beginning of phase IV compared to the onset of phase II, the hypergravity induced reduction in
LV and LA volumes appears to be independent from the gravity gradient (+0.8 Gz in phase II
and +1.8 Gz in phase IV) and more directly related to the magnitude of the pre-existing LV and
LA volumes when entering the hypergravity phase.
In contrast, when the subject is in 0 Gz, both ED and ES LV volumes augment
approximately by 20% compared to 1Gz values, resulting in an increase in SV, while EF remains
unchanged. These LV volume changes have been previously shown to be due to the increase in
central blood volume that occurs in weightlessness. The increase in cardiac volumes occurs
despite a decrease in central venous pressure (48), potentially due to a reduction in intrathoracic
Page 11 of 34
12
pressure and/or to the loss of compressive forces that occurs throughout the body in
weightlessness.
In a previous study, where we measured LV area changes from 2DE in the apical 4-
chamber view using a similar experimental setting, we reported an increase in LV area at 0 Gz
of only 12% (17). Compared to the current results, the underestimation found with 2DE was
probably due to apical foreshortening, caused by the difficulties in continuously acquiring the
correct anatomical 2D plane during the parabola. Our observations on LV volume changes at 0
Gz induced by parabolic flight closely resemble the short-term effects of 0 Gz on LV dimensions
occurring in astronauts during the initial 2-3 days of space flight (9). This data reinforces the
notion that parabolic flight represents a unique setting to study the short-term effects of
weightlessness on Earth.
The observed increase in the rapid LV filling during 0Gz is in agreement with our
previous observation that a significant increase in the peak mitral E wave occurs in standing
subjects during microgravity (12) due to increased LV preload. The observed increase in PER
could be explained by both increased LV ED pressure caused by the EDV augmentation, and by
probable afterload reduction due to decreased blood pressure with microgravity (7; 42).
With regard to the left atrium, we found that at 0 Gz, both the ED and ES LA volumes
increased considerably compared to 1Gz values, resulting in an increase in both the LA
reservoir function (i.e., FV and EI) and in the overall diastolic emptying index. Previously,
Videbaek and Norsk studied the end-systolic LA diameter by M-mode from the parasternal long-
axis view in subjects in the supine position during parabolic flight (48), reporting a 15% increase
at 0 Gz compared to 1 Gz. The measurement of only a single diameter of the LA represented a
limitation of that study, because it assumed that a consistent relationship is maintained between
the antero-posterior and all other LA dimensions as the atrium enlarges, which is often not the
case (32; 33). Our results obtained with RT3DE measured the true atrial volume, and
demonstrated that the magnitude of LA distension at 0 Gz appears to be larger (approximately
Page 12 of 34
13
doubled) than previously reported. Moreover, changes in LA D1 and D2 diameters at 0 Gz
evidenced a similar increase of about 7mm in D1 and D2 at end-systole, demonstrating a
symmetric distension of the LA following an abrupt increase in venous return.
These findings could be considered for the formulation of new qualification criteria for
commercial space travel. Since the increase in venous return induced by microgravity generates
a considerable increase in LA and LV volumes, a compliant LV is required to avoid any abrupt
increase in filling pressures. Non-invasive manoeuvres resulting in significant preload
augmentation (i.e., -40° head-down tilt) could be used in the future to assure LV compliance. In
fact, we can hypothesize that, when entering weightlessness, individuals with compromised LV
compliance could develop pulmonary edema, resulting in different clinical scenarios, which could
range from a reduction of in-flight performance to a life-threatening condition.
Lower body negative pressure (LBNP) has been used as a test of orthostatic tolerance
both on Earth and during long-term space flights, and as an in-flight countermeasure prior to re-
entry, associated with fluid intake, to prevent post-flight orthostatic intolerance. Although
previous studies investigated the effects of LBNP on LV dimensions in various experimental
conditions using 2DE (4; 28; 39; 45; 46), this is the first time that LBNP has been studied during
parabolic flight, to assess in a weightlessness environment its counterbalancing effects on LV
and LA volumes in a normal heart. In ground experiments, performed in subjects in the supine
position, a reduction in LV volumes and SV with LBNP at different pressures (from –10 to –40
mmHg) have been previously reported using M-mode echocardiography (28; 39). Our results
obtained in subjects in standing position during 0 Gz showed that LBNP at –50 mmHg was able
to restore LV and LA dimensions to 1 Gz values, in particular LV EDV, LAmax and LA filling
volume. Since LBNP is known to increase the pooling of blood in the lower body, leading to
decreases in both central blood volume and cardiac filling pressures (1; 14; 40; 47), and since
microgravity has been shown to increase central blood volume and atrial distension (48), the
Page 13 of 34

14
combined effect of microgravity and LBNP appear to counterbalance each other resulting in
minimal change in central blood volume.
This study had several limitations. First, 3D echocardiography using a full-matrix array
transducer has been previously described as being a “real-time” technique. However, data were
acquired in the full volume mode, which is a “near” real-time technique that requires temporal
registration of a number of sub-segments acquired from consecutive beats. Accordingly, it was
not possible to acquire datasets representative of consecutive cardiac cycles along the whole
parabola, but only one dataset for each gravity phase. However, after the short transient when
entering in a new gravity phase, the LV and LA volumes can be considered stabilized and
representative of the corresponding parabolic phase. Furthermore, in the interpretation of the
results, when the effects of 1 Gz are compared with those of weightlessness, it is important to
consider the effects of the hyper-G phase occurring in between.
The semi-automated segmentation procedure requires to manually initialize the
endocardial borders in multiple evenly rotated long axis views, which is a time-consuming and
subjective procedure. Nevertheless, this technique, applied to the left ventricle, was found to be
highly reproducible and accurate (30). As no standard analysis methods for LA volume
quantification from RT3DE data exist, our measurements of absolute LA dimensions could be
affected by biases or inaccuracies. However, as these errors should be of the same magnitude
for each gravity phase, and since results were normalized in each subject for the corresponding
1Gz values, the resulting change in LA volumes should not be affected by the method of
analysis.
In conclusion, the result of this study indicate that RT3DE imaging during parabolic flight
is feasible and provides the basis for accurate quantification of LV volume changes with gravity,
thus providing pyramidal datasets from which correct non-foreshortened apical views can be
obtained. Moreover, also LA volume changes during weightlessness can be quantified by
Page 14 of 34

15
RT3DE. In microgravity, we reported an increase of both LV and LA volumes, due to changes in
venous return, which was counteracted by low body negative pressure.
Acknowledgements
We acknowledge the support from the Centre National d'Etudes Spatiales (CNES) and the
European Space Agency (ESA). We acknowledge the dedicated collaboration of the crew of
CNES AIRBUS A300 ZERO-G operated by NOVESPACE.
The invaluable support of Steve Anderson, Heinrich Beckermann, Stephane Husson and Arnoud
Perrin from Philips Medical Systems is appreciated.
Grants
Pierre Vaïda was the recipient of grant 02/CNES/4800000039 from the CNES.
Disclosures
Philips Medical Systems provided an equipment grant as well as a grant-in-aid to support this
project.
Page 15 of 34
16
Reference List
1. Ahmad M, Blomqvist CG, Mullins CB and Willerson JT. Left ventricular function
during Lower Body Negative-Pressure. Aviat Space Environ Med 48: 512-515,
1977.
2. Arbeille P, AchaiBou F, Fomina G, Pottier JM and Porcher M. Regional blood
flow in microgravity: Adaptation and deconditioning. Med Sci Sports Exer 28: S70-
S79, 1996.
3. Arbeille P, Fomina G, Roumy J, Alferova I, Tobal N and Herault S. Adaptation
of the left heart, cerebral and femoral arteries, and jugular and femoral veins during
short- and long-term head-down tilt and space flights. Eur J Appl Physiol 86: 157-
168, 2001.
4. Arbeille P, Lebouard D, Massabuau M, Pottier JM, Patat F, Pourcelot L and
Guell A. Effect on the cardiac function of repeated LBNP during a 1-month head
down tilt. Acta Astronautica 25: 415-418, 1991.
5. Atkov O, Bednenko VS, and Fomina GA. Ultrasound techniques in space
medicine. Aviat Space Environ Med 58, A69-A73. 1987.
6. Blomqvist GC. Regulation of the systemic circulation at microgravity and during
readaptation to 1G. Med Sci Sports Exer 28: S9-S13, 1996.
7. Buckey JC. Central venous pressure. Prisk GK, West JB and Paiva M in: Gravity
and the Lung: Lessons from Microgravity. 2001. New York, Marcel Dekker.
8. Buckey JC, Gaffney FA, Lane LD, Levine BD and Blomqvist CG. Central
venous pressure in space. New Engl J Med 328: 1853-1854, 1993.
Page 16 of 34

17
9. Bungo MW, Charles JB, Riddle J, Roesch J, Wolf DA and Seddon MR. Human
echocardiographic examinations during spaceflight. Aviat Space Environ Med 57:
494, 1986.
10. Bungo MW, Goldwater DJ, Popp RL and Sandler H. Echocardiographic
evaluation of Space-Shuttle crewmembers. J Appl Physiol 62: 278-283, 1987.
11. Bungo MW and Johnson PC. Cardiovascular examinations and observations of
deconditioning during the Space-Shuttle orbital flight test program. Aviat Space
Environ Med 54: 1001-1004, 1983.
12. Caiani EG, Asquer G, Turiel M, Bailliart O, Cholley B, Capderou A, and Vaida
P. Changes in Doppler mitral inflow patterns during parabolic flight. J Gravitational
Physiol 11(2), 93-94, 2004.
13. Caiani EG, Corsi C, Zamorano J, Sugeng L, MacEneaney P, Weinert L, Battani
R, Gutierrez JL, Koch R, Perez-Isla L, Mor-Avi V, and Lang RM. Improved semi-
automated quantification of left ventricular volumes and ejection fraction using
three-dimensional echocardiography with a full-matrix array transducer:
comparison with MRI. J Am Soc Echocardiogr 18(8), 779-788, 2005.
14. Chang CM, Cassuto Y, Pendergast DR and Farhi LE. Cardiorespiratory
response to Lower-Body Negative-Pressure. Aviat Space Environ Med 65: 615-
620, 1994.
15. Charles JB and Bungo MW. Cardiovascular physiology in space-flight.
Experimental Gerontol 26: 163-168, 1991.
16. Charles JB and Lathers CM. Cardiovascular adaptation to space-flight. J Clin
Pharmacol 31: 1010-1023, 1991.
Page 17 of 34

18
17. Corsi C, Lamberti C, Cerutti S, Laulom JP, Bailliart O, Cholley B, Capderou A,
Vaida P, and Caiani EG. Level-set based technique for the quantification of left
ventricular size and function in 2-D echocardiography during parabolic flights. Med &
Biol Eng & Comp 42(5): 610-617, 2004.
18. Corsi C, Lang RM, Veronesi F, Weinert L, Caiani EG, MacEneaney P, Lamberti
C, and Mor-Avi V. Volumetric quantification of global and regional left ventricular
function from real-time three-dimensional echocardiographic images. Circulation
112(8): 1161-1170, 2005.
19. Folland ED, Parisi AF, Moynihan PF, Jones DR, Feldman CL and Tow DE.
Assessment of left ventricular ejection fraction and volumes by real-time, 2-
dimensional echocardiography. Comparison of cineangiographic and radionuclide
techniques. Circulation 60: 760-766, 1979.
20. Fritsch JM, Charles JB, Bennett BS, Jones MM and Eckberg DL. Short-duration
spaceflight impairs human carotid baroreceptor-cardiac reflex responses. J Appl
Physiol 73: 664-671, 1992.
21. Fritschyelle JM, Charles JB, Jones MM, Beightol LA and Eckberg DL.
Spaceflight alters autonomic regulation of arterial pressure in humans. J Appl
Physiol 77: 1776-1783, 1994.
22. Guell A and Braak L. Cardiovascular deconditioning syndrome during space flight.
Ann Cardiol Angeiol (Paris) 38: 499-502, 1989.
23. Hargens AR and Watenpaugh DE. Cardiovascular adaptation to spaceflight. Med
Sci Sports Exer 28: 977-982, 1996.
Page 18 of 34

19
24. Hargens AR, Whalen RT, Watenpaugh DE, Schwandt DF and Krock LP. Lower-
body negative-pressure to provide load bearing in space. Aviat Space Environ Med
62: 934-937, 1991.
25. Henry WL, Epstein SE, Griffith JM, Goldstein RE, and Redwood DR. Effect of
prolonged space flight on cardiac function and dimensions. Johnston RS and Dietlein
LF in: Biomedical results from Skylab. 366-371. 1977. Washington, DC, NASA.
26. Jenkins C, Bricknell K, Hanekom L, and Marwick TH. Reproducibility and
accuracy of echocardiographic measurements of left ventricular parameters using
real-time three-dimensional echocardiography. J Am Coll Cardiol 44(4): 878-886,
2004.
27. Johns JP, Vernalis MN, Karemaker JM and Latham RD. Doppler evaluation of
cardiac filling and ejection properties in humans during parabolic flight. J Appl
Physiol 76: 2621-2626, 1994.
28. Kitano A, Shoemaker JK, Ichinose M, Wada H and Nishiyasu T. Comparison of
cardiovascular responses between lower body negative pressure and head-up tilt. J
Appl Physiol 98: 2081-2086, 2005.
29. Kuhl HP, Franke A, Merx M, Hoffmann R, Puschmann D, and Hanrath P.
Quantification of left ventricular function and mass using transesophageal three-
dimensional echocardiography: validation of a method that uses long-axis cut-
planes. Eur J Echocardiogr 1: 213-221, 2000.
30. Kuhl HP, Schreckenberg M, Rulands D, Katoh M, Schafer W, Schummers G,
Bucker A, Hanrath P and Franke A. High-resolution transthoracic real-time three-
dimensional echocardiography - Quantitation of cardiac volumes and function using
Page 19 of 34
20
semi-automatic border detection and comparison with cardiac magnetic resonance
imaging. J Am Coll Cardiol 43: 2083-2090, 2004.
31. Lathers CM, Charles JB, Elton KF, Holt TA, Mucai C, Bennet BS, and Bungo
MW. Acute hemodynamic responses to weightlessness in humans. J Clin Pharmacol
29(7): 615-627, 1989.
32. Lester SJ, Ryan EW, Schiller NB and Foster E. Best method in clinical practice
and in research studies to determine left atrial size. Am J Cardiol 84: 829-832, 1999.
33. Loperfido F, Pennestri F, Digaetano A, Scabbia E, Santarelli P, Mongiardo R,
Schiavoni G, Coppola E and Manzoli U. Assessment of left atrial dimensions by
cross-sectional echocardiography in patients with mitral-valve disease. British
Heart J 50: 570-578, 1983.
34. Martin DS, South DA, Garcia KM and Arbeille P. Ultrasound in space.
Ultrasound Med Biol 29: 1-12, 2003.
35. Martin DS, South DA, Wood ML, Bungo MW and Meck JV. Comparison of
echocardiographic changes after short- and long-duration spaceflight. Aviat Space
Environ Med 73: 532-536, 2002.
36. Mor-Avi V, Sugeng L, Weinert L, MacEneaney P, Caiani EG, Koch R, Salgo IS,
and Lang RM. Fast measurement of left ventricular mass with real-time three-
dimensional echocardiography. Comparison with magnetic resonance imaging.
Circulation 110: 1814-1818, 2004.
37. Mulvagh SL, Charles JB, Riddle JM, Rehbein TL and Bungo MW.
Echocardiographic evaluation of the cardiovascular effects of short-duration
spaceflight. J Clin Pharmacol 31: 1024-1026, 1991.
Page 20 of 34
21
38. Murthy G, Watenpaugh DE, Ballard RE and Hargens AR. Exercise against
lower-body negative-pressure as a countermeasure for cardiovascular and
musculoskeletal deconditioning. Acta Astronautica 33: 89-96, 1994.
39. Pela G, Regolisti G, Coghi P, Cabassi A, Basile A, Cavatorta A, Manca C, and
Borghetti A. Effects of the reduction of preload on left and right ventricular
myocardial velocities analyzed by Doppler tissue echocardiography in healthy
subjects. Eur J Echocardiogr 5(4): 262-271, 2004.
40. Poliner LR, Dehmer GJ, Lewis SE, Parkey RW, Blomqvist CG and Willerson
JT. Left ventricular performance in normal subjects - A comparison of the
responses to exercise in the upright and supine positions. Circulation 62: 528-534,
1980.
41. Prisk GK, Guy HJB, Elliott AR, Deutschman RA and West JB. Pulmonary
diffusing capacity, capillary blood-volume, and cardiac-output during sustained
microgravity. J Appl Physiol 75: 15-26, 1993.
42. Pump B, Vldebaek R, Gabrielsen A and Norsk P. Arterial pressure in humans
during weightlessness induced by parabolic flights. J Appl Physiol 87: 928-932,
1999.
43. Schnittger I, Fitzgerald PJ, Daughters GT, Ingels NB, Kantrowitz NE,
Schwarzkopf A, Mead CW and Popp RL. Limitations of comparing left ventricular
volumes by 2 dimensional echocardiography, myocardial markers and
cineangiography. Am J Cardiol 50: 512-519, 1982.
44. Spencer KT, Mor-Avi V, Gorcsan J, DeMaria AN, Kimball TR, Monaghan MJ,
Perez JE, Weinert L, Bednarz J, Edelman K, Kwan OL, Glascock B, Hancock
J, Baumann C and Lang RM. Effects of aging on left atrial reservoir, conduit, and
Page 21 of 34

22
booster pump function: a multi-institution acoustic quantification study. Heart 85:
272-277, 2001.
45. Takenaka K, Suzuki Y, Kawakubo K, Haruna Y, Yanagibori R, Iwamoto S,
Igarashi M, Watanabe F, Omata M, Bonde-Petersen F, and Gunji A.
Cardiovascular response to lower body negative pressure before and after 20 days
horizontal bed rest. J Gravitational Physiol 4(1): S58-S61, 1997.
46. Takenaka K, Suzuki Y, Uno K, Sato M, Komuro T, Haruna Y, Kobayashi H,
Kawakubo K, Sonoda M, Asakawa M, Nakahara K and Gunji A. Effects of rapid
saline infusion on orthostatic intolerance and autonomic tone after 20 days bed
rest. Am J Cardiol 89: 557-561, 2002.
47. Tripathi A, Mack G and Nadel ER. Peripheral vascular reflexes elicited during
lower body negative-pressure. Aviat Space Environ Med 60: 1187-1193, 1989.
48. Videbaek R and Norsk P. Atrial distension in humans during microgravity induced
by parabolic flights. J Appl Physiol 83: 1862-1866, 1997.
49. Wyatt HL, Meerbaum S, Heng MK, Gueret P and Corday E. Cross-sectional
echocardiography .3. Analysis of mathematic models for quantifying volume of
symmetric and asymmetric left ventricles. Am Heart J 100: 821-828, 1980.
50. Zoghbi WA, Buckey JC, Massey MA and Blomqvist CG. Determination of left-
ventricular volumes with use of a new nongeometric echocardiographic method -
Clinical validation and potential application. J Am Coll Cardiol 15: 610-617, 1990.
Page 22 of 34
23
Figure legends
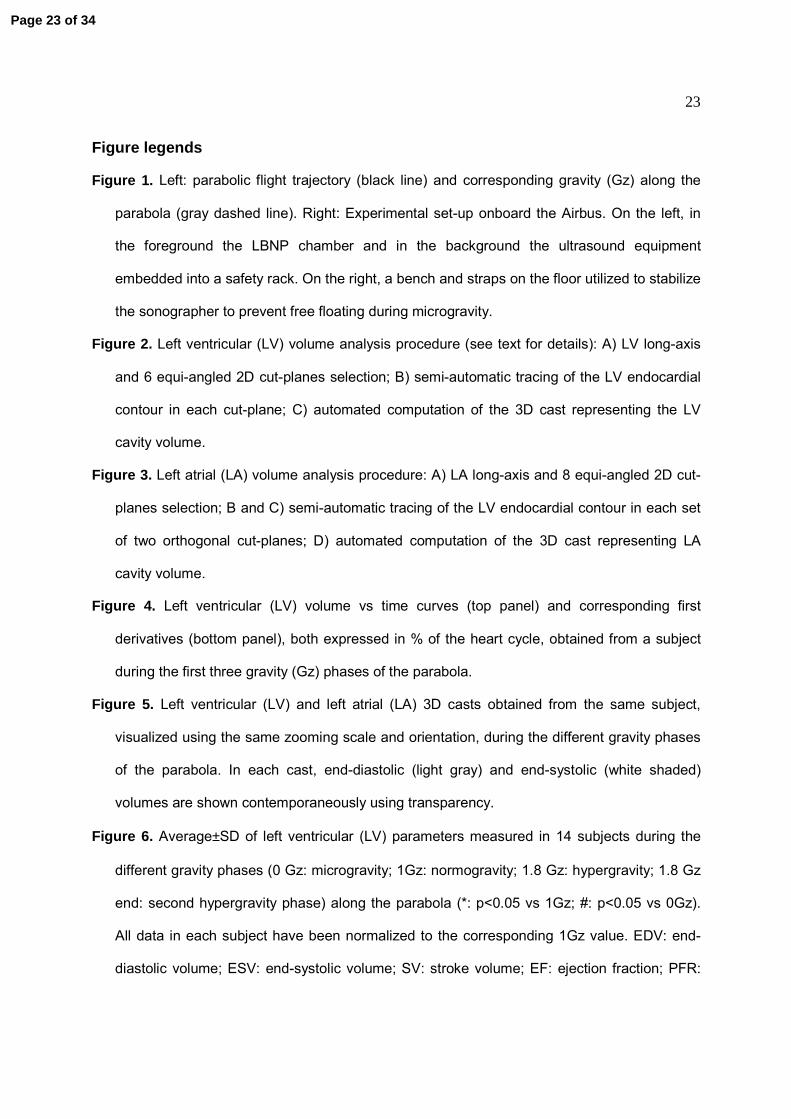
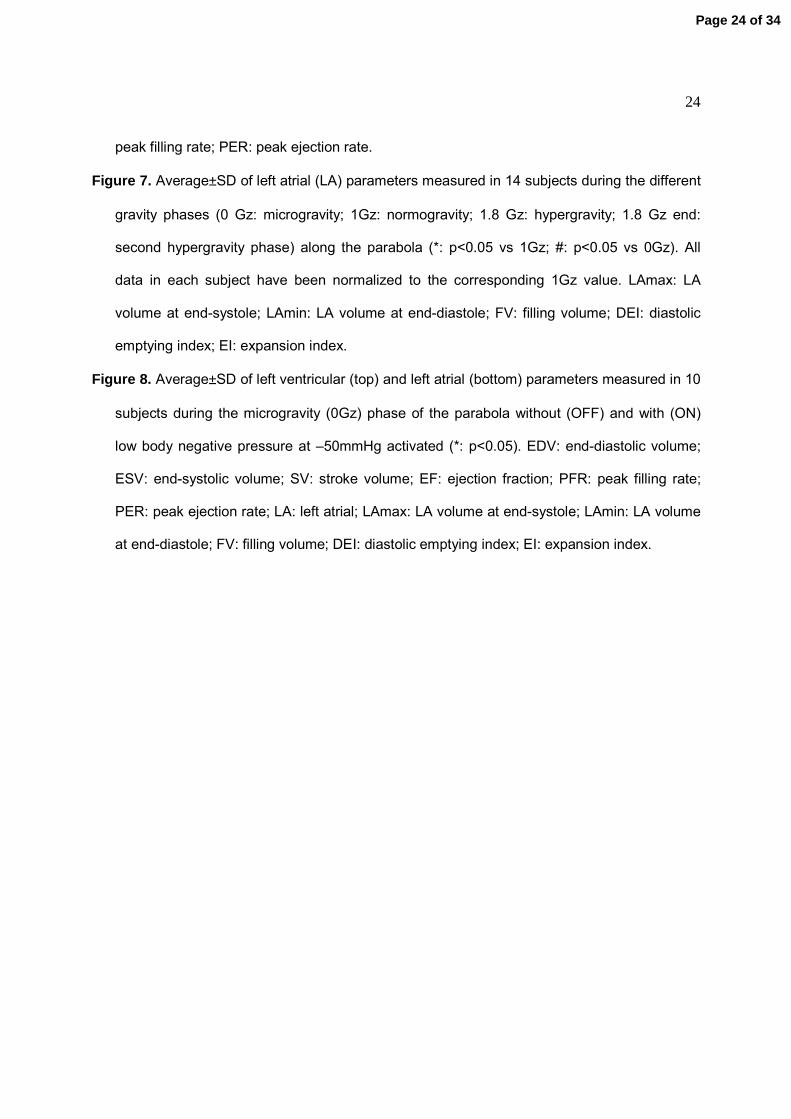
Figure 1. Left: parabolic flight trajectory (black line) and corresponding gravity (Gz) along the
parabola (gray dashed line). Right: Experimental set-up onboard the Airbus. On the left, in
the foreground the LBNP chamber and in the background the ultrasound equipment
embedded into a safety rack. On the right, a bench and straps on the floor utilized to stabilize
the sonographer to prevent free floating during microgravity.
Figure 2. Left ventricular (LV) volume analysis procedure (see text for details): A) LV long-axis
and 6 equi-angled 2D cut-planes selection; B) semi-automatic tracing of the LV endocardial
contour in each cut-plane; C) automated computation of the 3D cast representing the LV
cavity volume.
Figure 3. Left atrial (LA) volume analysis procedure: A) LA long-axis and 8 equi-angled 2D cut-
planes selection; B and C) semi-automatic tracing of the LV endocardial contour in each set
of two orthogonal cut-planes; D) automated computation of the 3D cast representing LA
cavity volume.
Figure 4. Left ventricular (LV) volume vs time curves (top panel) and corresponding first
derivatives (bottom panel), both expressed in % of the heart cycle, obtained from a subject
during the first three gravity (Gz) phases of the parabola.
Figure 5. Left ventricular (LV) and left atrial (LA) 3D casts obtained from the same subject,
visualized using the same zooming scale and orientation, during the different gravity phases
of the parabola. In each cast, end-diastolic (light gray) and end-systolic (white shaded)
volumes are shown contemporaneously using transparency.
Figure 6. Average±SD of left ventricular (LV) parameters measured in 14 subjects during the
different gravity phases (0 Gz: microgravity; 1Gz: normogravity; 1.8 Gz: hypergravity; 1.8 Gz
end: second hypergravity phase) along the parabola (*: p<0.05 vs 1Gz; #: p<0.05 vs 0Gz).
All data in each subject have been normalized to the corresponding 1Gz value. EDV: end-
diastolic volume; ESV: end-systolic volume; SV: stroke volume; EF: ejection fraction; PFR:
Page 23 of 34
24
peak filling rate; PER: peak ejection rate.
Figure 7. Average±SD of left atrial (LA) parameters measured in 14 subjects during the different
gravity phases (0 Gz: microgravity; 1Gz: normogravity; 1.8 Gz: hypergravity; 1.8 Gz end:
second hypergravity phase) along the parabola (*: p<0.05 vs 1Gz; #: p<0.05 vs 0Gz). All
data in each subject have been normalized to the corresponding 1Gz value. LAmax: LA
volume at end-systole; LAmin: LA volume at end-diastole; FV: filling volume; DEI: diastolic
emptying index; EI: expansion index.
Figure 8. Average±SD of left ventricular (top) and left atrial (bottom) parameters measured in 10
subjects during the microgravity (0Gz) phase of the parabola without (OFF) and with (ON)
low body negative pressure at –50mmHg activated (*: p<0.05). EDV: end-diastolic volume;
ESV: end-systolic volume; SV: stroke volume; EF: ejection fraction; PFR: peak filling rate;
PER: peak ejection rate; LA: left atrial; LAmax: LA volume at end-systole; LAmin: LA volume
at end-diastole; FV: filling volume; DEI: diastolic emptying index; EI: expansion index.
Page 24 of 34

25
Table 1. Mean values ±SD of the left ventricular (LV) and atrial (LA) function parameters
computed in 14 normal subjects during the four phases of the parabola. In parenthesis the mean
percentage of variation in respect of 1 Gz value is reported.
Phase I (1 Gz) Phase II (1.8 Gz) Phase III (0 Gz) Phase IV (1.8 Gz)
LV EDV (ml) 87±22 72±29** (-19%) 105±32** (+19%) 81±29 (-9%)
LV ESV (ml) 29±9 23±13* (-24%) 35±13* (+23%) 24±13 (-21%)
LV SV (ml) 58±19 49±21* (-16%) 69±25** (+20%) 57±23 (-2%)
LV EF (%) 66±8 68±10 (+4%) 66±8 (0%) 70±10 (+6%)
LV PFR (ml/sec) 255±65 221±70 (-13%) 335±102* (31%) 278±89 (+8%)
LV PER (ml/sec) -325±120 -289±122 (-5%) -417±128* (37%) -431±192 (+30%)
LAmax (ml) 40±12 26±9* (-34%) 58±14** (+41%) 34±17 (-16%)
LAmin (ml) 18±5 13±4** (-29%) 23±9** (+26%) 15±7 (-17%)
LAmax-LAmin (ml) 21±8 13±5* (-36%) 35±7** (+59%) 19±12 (-18%)
DEI (%) 53±8 49±8 (-5%) 60±7* (+16%) 51±19 (-5%)
EI (%) 117±42 101±35 (-6%) 158±44* (+31%) 133±92 (+6%)
EDV: end-diastolic volume; ESV: end-systolic volume; SV: stroke volume; EF: ejection fraction; PFR: peak filling rate; PER: peak ejection rate; LAmax: left atrial volume at ventricular end-systole; LAmin: left atrial volume at ventricular end-diastole; DEI: diastolic emptying index; EI: expansion index. *: p<0.05 vs 1 Gz; **: p<0.01 vs 1Gz #: p<0.05 vs 0 Gz
Page 25 of 34

26
Table 2. Mean values ±SD of the left atrial diameters (D1, medial-lateral dimension; D2, antero-
posterior dimension) computed in 14 normal subjects at normogravity (1 Gz) and during
microgravity (0 Gz). In parenthesis the mean percentage of increase in respect of 1 Gz value is
reported.
Phase I (1 Gz) Phase III (0 Gz)
LAmax D1 (mm) 26±5 33±6* (28%)
LAmax D2 (mm) 42±7 49±8* (22%)
LAmin D1 (mm) 18±4 21±9 (32%)
LAmin D2 (mm) 32±8 39±9* (25%)
LAmax: left atrial volume at ventricular end-systole; LAmin: left atrial volume at ventricular end-diastole; DEI: diastolic emptying index; EI: expansion index. *: p<0.05 vs 1 Gz
Page 26 of 34
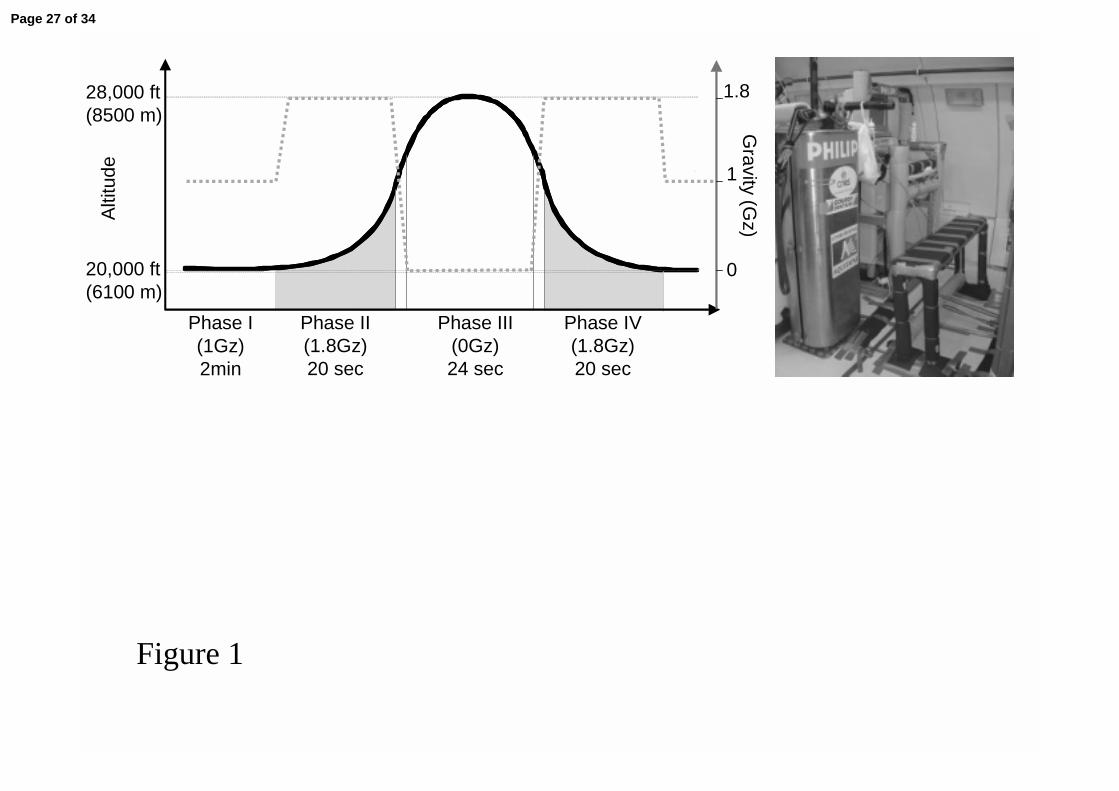
Figure 1
Phase II(1.8Gz)20 sec
Phase III(0Gz)24 sec
Phase IV(1.8Gz)20 sec
28,000 ft(8500 m)
20,000 ft(6100 m)
Phase I(1Gz)2min
Alti
tude
Gravity (G
z)
1.8
1
0
Page 27 of 34
Figure 2
Page 28 of 34
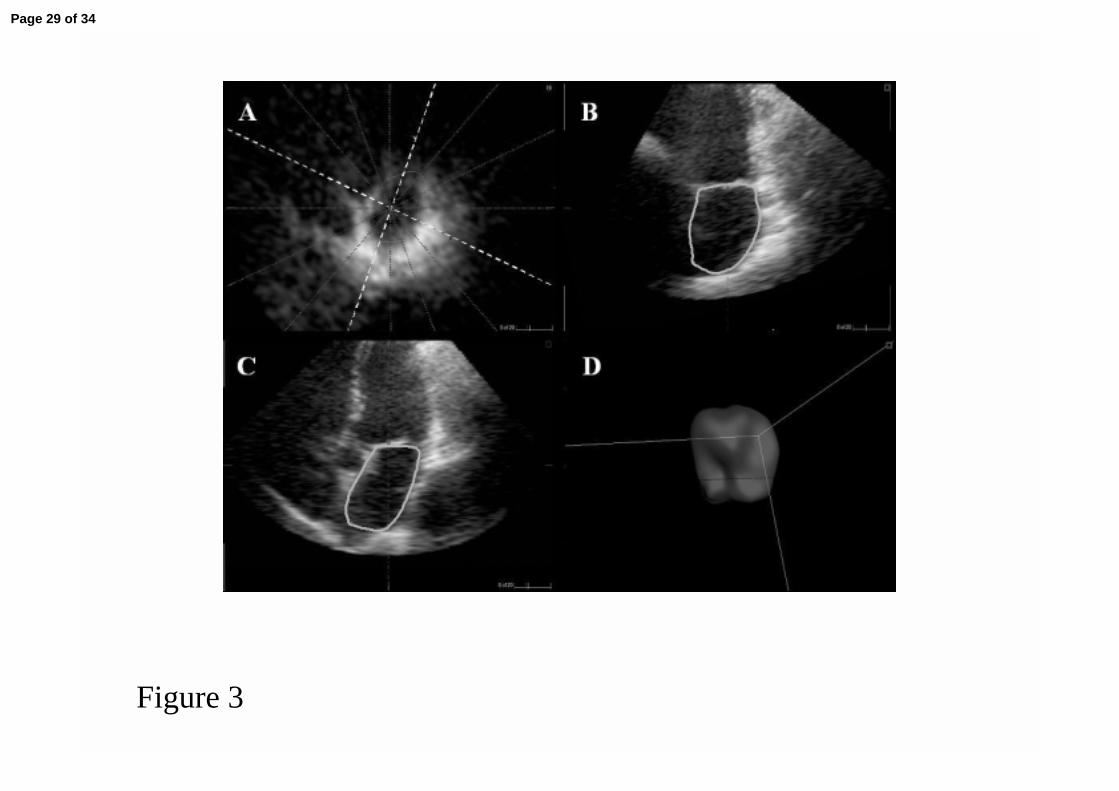
Figure 3
Page 29 of 34
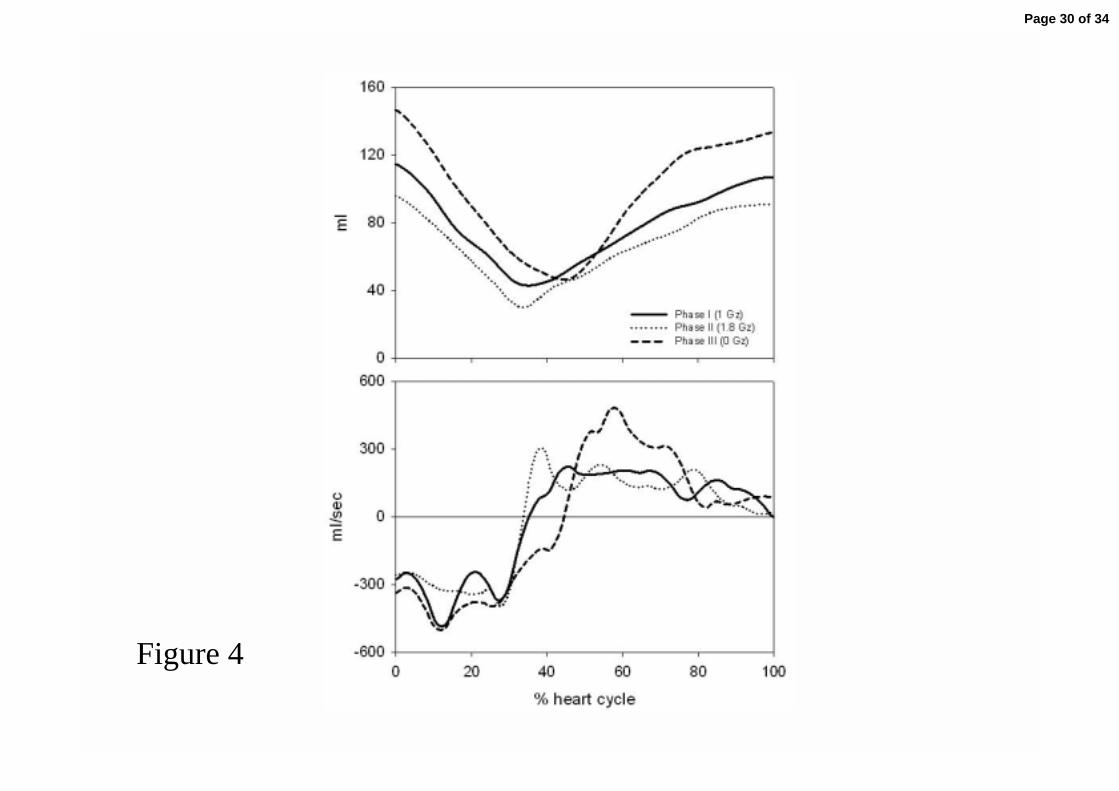
Figure 4
Page 30 of 34

Figure 5
Phase I Phase II Phase III Phase IV
LV
LA
Page 31 of 34
EDV ESV
SV EF
0Gz 1Gz 1.8Gz end1.8Gz Figure 6
*
*#
#
*
*##
*
*#
#
PFR PER
*
#
#
*
#
N=14
0.6
1.6
1.0
% 1
Gz
valu
e
0.6
1.6
1.0
% 1
Gz
valu
e
0.4
2.0
1.0
% 1
Gz
valu
e
0.4
2.0
1.0
% 1
Gz
valu
e
0Gz 1Gz 1.8Gz end1.8Gz
0.6
1.6
1.0
% 1
Gz
valu
e
0.4
1.6
1.0
% 1
Gz
valu
e
Page 32 of 34

LAmax LAmin
FV DEI
Figure 7
*
*#
#
*
*#
#
*
*##
*
EI
*
#
N=14
0.4
1.8
1.0
% 1
Gz
valu
e
0.2
2.0
1.0
% 1
Gz
valu
e
0.2
2.0
1.0
% 1
Gz
valu
e
0.2
2.0
1.0
% 1
Gz
valu
e
0.4
1.8
1.0
% 1
Gz
valu
e
0Gz 1Gz 1.8Gz end1.8Gz
0Gz 1Gz 1.8Gz end1.8Gz
Page 33 of 34

% 1
Gz
valu
e
0,4
0,6
0,8
1,0
1,2
1,4
1,6
1,8
2,0
OFF ON OFF ON OFF ON OFF ON OFF ON
* **
LAmax LAmin FV DEI EI
% 1
Gz
valu
e
0,4
0,6
0,8
1,0
1,2
1,4
1,6
1,8
2,0
OFF ON OFF ON OFF ON OFF ON OFF ON
* **
LAmax LAmin FV DEI EI
% 1
Gz
valu
e
0,4
0,6
0,8
1,0
1,2
1,4
1,6 EDV ESV
OFF ON
SV PFR PER
* *
EF
OFF ON OFF ON OFF ON OFF ON OFF ON Figure 8
N=10
N=10
Page 34 of 34