Nutritional Transition in Children under Five Years and Women of Reproductive Age: A 15-Years Trend...
10
Nutritional Transition in Children under Five Years and Women of Reproductive Age: A 15-Years Trend Analysis in Peru Christian Loret de Mola 1,2 *, Renato Quispe 1,3 , Giancarlo A. Valle 1 , Julio A. Poterico 1 1 CRONICAS Center of Excellence in Chronic Diseases, Universidad Peruana Cayetano Heredia, Lima, Peru, 2 Post-Graduate Program in Epidemiology, Federal University of Pelotas, Pelotas, Rio Grande do Sul, Brazil, 3 CONEVID Unidad de Conocimiento y Evidencia, Universidad Peruana Cayetano Heredia, Lima, Peru Abstract Background: Rapid urbanization, increase in food availability, and changes in diet and lifestyle patterns have been changing nutritional profiles in developing nations. We aimed to describe nutritional changes in children under 5 years and women of reproductive age in Peru, during a 15-year period of rapid economic development and social policy enhancement. Materials and Methods: Trend analyses of anthropometric measures in children of preschool age and women between 15– 49 years, using the Peruvian National Demographic and Family Health Surveys (DHS) from 1996 to 2011. WHO growth curves were used to define stunting, underweight, wasting and overweight in children ,5y. We employed the WHO BMI- age standardized curves for teenagers between 15–19y. In women .19 years, body mass index (BMI) was analyzed both categorically and as a continuous variable. To statistically analyze the trends, we used regression models: Linear and Poisson for continuous and binary outcomes, respectively. Results: We analyzed data from 123 642 women and 64 135 children, from 1996 to 2011. Decreases over time were evidenced for underweight (p,0.001), wasting (p,0.001), and stunting (p,0.001) in children under 5y. This effect was particularly noted in urban settings. Overweight levels in children reduced (p,0.001), however this reduction stopped, in urban settings, since 2005 (,12%). Anemia decreased in children and women (p,0.001); with higher reduction in urban (Q43%) than in rural children (Q24%). BMI in women aged 15–19 years increased (p,0.001) across time, with noticeable BMI-curve shift in women older than 30 years. Moreover, obesity doubled during this period in women more than 19y. Conclusion: Nutrition transition in Peru shows different patterns for urban and rural populations. Public policies should emphasize targeting both malnutrition conditions—undernutrition/stunting, overweight/obesity and anemia—considering age and place of residence in rapid developing societies like Peru. Citation: Loret de Mola C, Quispe R, Valle GA, Poterico JA (2014) Nutritional Transition in Children under Five Years and Women of Reproductive Age: A 15-Years Trend Analysis in Peru. PLoS ONE 9(3): e92550. doi:10.1371/journal.pone.0092550 Editor: Victor Alberto Laguna-Torres, US Naval Medical Research Center Detachment Research Unit 6, Peru Received June 10, 2013; Accepted February 24, 2014; Published March 18, 2014 Copyright: ß 2014 Loret de Mola et al. This is an open-access article distributed under the terms of the Creative Commons Attribution License, which permits unrestricted use, distribution, and reproduction in any medium, provided the original author and source are credited. Funding: The authors have no support or funding to report. Competing Interests: The authors have declared that no competing interests exist. * E-mail: [email protected] Introduction Since the 1960s, worldwide economic growth, has been accompanied by an increase in food availability, animal fat intake, less physical activity and urbanization [1]. This nutritional transition has been changing anthropometric and health patterns throughout populations, having special impact in low and middle- income countries (LMIC) [2]. Underweight and stunting have been dropping in LMIC, mainly in children under 5 years [3]; but overweight depicts diverse distribution and rates between children populations [3,4]. Since 1990, overweight rates have been raising in children from high and low-income countries. However, children from some upper-middle income societies depict a slight decrease in over- nutritional indicators, suggesting a diverse nutritional transition in children of preschool age [3]; and that country’s development and economic growth may play an important role. In the last 30 years, body mass index (BMI) in adults has been increasing in the world [5], and during this period global age- standardized obesity prevalence has nearly doubled [6] and developing countries appear to be at the forefront of this trend [7,8], and rapid nutritional changes in urban settings might explain the over-nutrition climb [2,7]. Previous studies have reported nutritional characteristics and trends of Peruvian children and adults through population-based datasets. For instance, a recent publication reported a high prevalence of over-nutrition (overweight or obesity) in Peruvians between 30–59 years (62.3%), where women had higher rates compared to males [9]. From 1991 to 2005, stunting decreased but overweight increased in children of preschool age [10]. Similar analyses from 2007 to 2010 showed that overweight in children under five years was related to: first year of life, male gender, birth weight more than 2.5 kg and living in high urbanized areas (i.e. Lima and the Coast region) [11]. However, these studies lacked of PLOS ONE | www.plosone.org 1 March 2014 | Volume 9 | Issue 3 | e92550
Transcript of Nutritional Transition in Children under Five Years and Women of Reproductive Age: A 15-Years Trend...
Nutritional Transition in Children under Five Years andWomen of Reproductive Age: A 15-Years Trend Analysisin PeruChristian Loret de Mola1,2*, Renato Quispe1,3, Giancarlo A. Valle1, Julio A. Poterico1
1 CRONICAS Center of Excellence in Chronic Diseases, Universidad Peruana Cayetano Heredia, Lima, Peru, 2 Post-Graduate Program in Epidemiology, Federal University of
Pelotas, Pelotas, Rio Grande do Sul, Brazil, 3 CONEVID Unidad de Conocimiento y Evidencia, Universidad Peruana Cayetano Heredia, Lima, Peru
Abstract
Background: Rapid urbanization, increase in food availability, and changes in diet and lifestyle patterns have been changingnutritional profiles in developing nations. We aimed to describe nutritional changes in children under 5 years and women ofreproductive age in Peru, during a 15-year period of rapid economic development and social policy enhancement.
Materials and Methods: Trend analyses of anthropometric measures in children of preschool age and women between 15–49 years, using the Peruvian National Demographic and Family Health Surveys (DHS) from 1996 to 2011. WHO growthcurves were used to define stunting, underweight, wasting and overweight in children ,5y. We employed the WHO BMI-age standardized curves for teenagers between 15–19y. In women .19 years, body mass index (BMI) was analyzed bothcategorically and as a continuous variable. To statistically analyze the trends, we used regression models: Linear and Poissonfor continuous and binary outcomes, respectively.
Results: We analyzed data from 123 642 women and 64 135 children, from 1996 to 2011. Decreases over time wereevidenced for underweight (p,0.001), wasting (p,0.001), and stunting (p,0.001) in children under 5y. This effect wasparticularly noted in urban settings. Overweight levels in children reduced (p,0.001), however this reduction stopped, inurban settings, since 2005 (,12%). Anemia decreased in children and women (p,0.001); with higher reduction in urban(Q43%) than in rural children (Q24%). BMI in women aged 15–19 years increased (p,0.001) across time, with noticeableBMI-curve shift in women older than 30 years. Moreover, obesity doubled during this period in women more than 19y.
Conclusion: Nutrition transition in Peru shows different patterns for urban and rural populations. Public policies shouldemphasize targeting both malnutrition conditions—undernutrition/stunting, overweight/obesity and anemia—consideringage and place of residence in rapid developing societies like Peru.
Citation: Loret de Mola C, Quispe R, Valle GA, Poterico JA (2014) Nutritional Transition in Children under Five Years and Women of Reproductive Age: A 15-YearsTrend Analysis in Peru. PLoS ONE 9(3): e92550. doi:10.1371/journal.pone.0092550
Editor: Victor Alberto Laguna-Torres, US Naval Medical Research Center Detachment Research Unit 6, Peru
Received June 10, 2013; Accepted February 24, 2014; Published March 18, 2014
Copyright: � 2014 Loret de Mola et al. This is an open-access article distributed under the terms of the Creative Commons Attribution License, which permitsunrestricted use, distribution, and reproduction in any medium, provided the original author and source are credited.
Funding: The authors have no support or funding to report.
Competing Interests: The authors have declared that no competing interests exist.
* E-mail: [email protected]
Introduction
Since the 1960s, worldwide economic growth, has been
accompanied by an increase in food availability, animal fat intake,
less physical activity and urbanization [1]. This nutritional
transition has been changing anthropometric and health patterns
throughout populations, having special impact in low and middle-
income countries (LMIC) [2].
Underweight and stunting have been dropping in LMIC,
mainly in children under 5 years [3]; but overweight depicts
diverse distribution and rates between children populations [3,4].
Since 1990, overweight rates have been raising in children from
high and low-income countries. However, children from some
upper-middle income societies depict a slight decrease in over-
nutritional indicators, suggesting a diverse nutritional transition in
children of preschool age [3]; and that country’s development and
economic growth may play an important role.
In the last 30 years, body mass index (BMI) in adults has been
increasing in the world [5], and during this period global age-
standardized obesity prevalence has nearly doubled [6] and
developing countries appear to be at the forefront of this trend
[7,8], and rapid nutritional changes in urban settings might
explain the over-nutrition climb [2,7].
Previous studies have reported nutritional characteristics and
trends of Peruvian children and adults through population-based
datasets. For instance, a recent publication reported a high
prevalence of over-nutrition (overweight or obesity) in Peruvians
between 30–59 years (62.3%), where women had higher rates
compared to males [9]. From 1991 to 2005, stunting decreased but
overweight increased in children of preschool age [10]. Similar
analyses from 2007 to 2010 showed that overweight in children
under five years was related to: first year of life, male gender, birth
weight more than 2.5 kg and living in high urbanized areas (i.e.
Lima and the Coast region) [11]. However, these studies lacked of
PLOS ONE | www.plosone.org 1 March 2014 | Volume 9 | Issue 3 | e92550
nutrition characterization during the entire period of economic
development and social policy enhancement in Peru.
Anemia represents another malnutrition indicator in children
and women. Global estimates show a concentration of this
condition in low socioeconomic groups, and anemia in children
correlates strongly to maternal anemia [12]. In Peru, factors
associated with anemia in children of preschool age are: lack of
prenatal care, adolescent mother and poor socioeconomic position
[13].
Peru, as other Latin-American countries, has experienced a
rapid economic growth in the last two decades. According to the
World Bank, in 1996, Peru had a Gross Domestic Product (GDP)
of $55.9 billion (current $) and a Gross National Income (GNI) per
capita of $2200; whereas, in 2011, GDP was reported as $176.9
billion and GNI per capita reached to $5150 (http://data.
worldbank.org/country/peru). Since 2006, social programs di-
rected to aiding poor populations have enhanced nutritional
programs in Peru [14]. Information of the Peruvian situation
would help to better understand how combined economic growth
with social policy targeting could affect nutritional transition in
rapid developing nations.
We aimed to analyze in this study the nutritional transition of
the Peruvian population through anthropometric measures—and
anemia levels—of children under 5 years and women in
childbearing age; using Peruvian Demographic Health Surveys
during a 15-year period and stratifying analyses by urban and
rural settings.
Methods
Ethics StatementDuring data collection, INEI was responsible for obtaining an
informed consent from all participants for the survey information,
anthropometric measures and hemoglobin test. Using an infor-
mation sheet, the research team explained to the participants the
nature of the study and what kind of question they were going to
answer as well as what kind of measure they were going to take.
For survey and anthropometric data, verbal informed consent was
obtained for all women, including adolescents, which, in addition,
required their parents’ or legal guardian’s consent. For children
under five years, verbal consent was obtained directly from their
parents or legal guardians. For hemoglobin tests a written
informed consent was required and in the case of adolescents
and children under 5 years, their parents or legal guardian had to
sign the consent and the adolescent give their assent. The consent
forms stated that this was a national survey sponsored by the
Peruvian Government and explaining its nature and importance,
that all collected information would be confidential and that the
person could stop answering the questions or reject to continue
participating in this research at any time, explained the kind of
questions they were going to answer, the measures that were going
to be taken and the time this survey would take, depending on the
amount of children under 5 and women in reproductive age living
in the house, it also explained the nature and procedures they
would use for the hemoglobin test, including a detailed explana-
tion, which included showing the materials they were going to use
for the test, as well as explaining that only one drop of blood was
going to be taken from them, in addition it explained to them what
anemia was, its signs and symptoms. The acceptance or rejection
to answer the survey, give their anthropometric measures or do the
hemoglobin test, was documented by the field worker in the
response sheet. ENDES methodological procedures were reviewed
and approved by the IRB from the Peruvian National Institute of
Health and the ‘‘Centro de Alimentacion y Nutricion’’ (CENAN).
In addition, the study protocol, specifically for this secondary
analysis, was sent to the ethics committee of the Universidad
Peruana Cayetano Heredia. They considered that this secondary
analysis and the original research did not violate any ethics
procedure, and approved further analysis and publication (SIDISI
Code 61753).
Study DesignSecondary analysis, evaluating the trends of anthropometric
measures in children under 5 years and women of reproductive
age using the Peruvian National Demographic and Family Health
Surveys (DHS), from 1996 to 2011. We also included percentages
of anemia as other malnutrition indicator in both children and
women.
DHS were cross-sectional surveys performed by the National
Institute of Statistics and Informatics (INEI) in Peru; each being a
nationally representative, multi-staged, and probabilistic study.
Each wave included participants from rural and urban areas.
These surveys formed part of the Monitoring and Evaluation to
Assess and Use Results Demographic and Health Surveys
(MEASURE DHS), until 2008. Since then, the Peruvian
government and INEI have supported, conducted and monitored
the surveys—using similar methodologies used in previous DHS
(http://www.measuredhs.com/Data/).
Participants and SettingsEach DHS recruited women between 15 to 49 years and
children aged 5 years or younger who lived in the same household.
In rural areas, villages of 500–2,000 people were the primary
sampling units, and households within each of these clusters were
the secondary sampling units. In urban areas, primary sampling
units consisted of blocks or groups of blocks with more than 2,000
people (with 100 houses on average), and secondary sampling units
were the same as in rural settings. More details about the
methodology for each survey are available publicly (http://desa.
inei.gob.pe/endes/).
For some waves, the total sampling goal was achieved in more
than one year (namely continuous DHS), but the annual-based
sample remained representative of the Peruvian population in that
specific year. We used all available surveys from 1996 to 2011,
having eight waves: 1996, 2000, 2004–2006 (which only had
children anthropometric data for 2005), 2007–2008, and 2009–
2011. Household response rates, were above 93% in all surveys.
For this analysis, we included all children under 5 years and
non-pregnant women with anthropometric and hemoglobin
information. We had available data for 93.1% of children ,5y
and 64.7% of all interviewed women. Anthropometry in 1996 was
measured in a subsample of women (29.8%), afterwards, 90% of
non-pregnant women had available data.
Measurements and VariablesAnthropometric measures were recorded by trained personnel
in all eight waves (1996, 2000, 2005, 2007, 2008, 2009, 2010, and
2011). Participants’ weight was measured using solar-powered
mother-baby scales with an accuracy of 6100 g. Since 2007, an
electric scale (SECA model 881-872) has been used, having a
maximum load of 150 kg. Previously, a similar scale (SECA model
874) was employed, which had a maximum load of 200 kg. Height
was evaluated using a wooden stadiometer—an adjustable board
calibrated in millimeters—following international standards for
DHS [15]; measuring adults and children older than 2 years in a
standing position, whereas children younger than 2 years lying
down.
Peruvian Children and Women Nutritional Transition
PLOS ONE | www.plosone.org 2 March 2014 | Volume 9 | Issue 3 | e92550
We evaluated three under-nutritional variables in children
under 5 years: stunting, wasting, and underweight. We defined
these indicators as: having a height for age, weight for height, and
weight for age in Z score less than 2 standard deviations (SD)
below the mean of the World Health Organization (WHO)
international reference standards, respectively. Overweight (in-
cluding obesity) in children ,5y was defined as having a BMI-for-
age more than 2 SD above the mean of the WHO international
standards [16].
In women between 19 and 49 years, nutritional status was based
on BMI, which was subsequently analyzed as a continuous and
categorical variable. Using WHO standards, we used the following
definitions in women older than 19y: underweight (BMI#18.5 kg/
m2), normal (18.5-,25 kg/m2), overweight (25-,30 kg/m2), and
obese ($30 kg/m2) [17]. Available information of these definitions
can be found at: http://apps.who.int/bmi/index.jsp. For women
between 15 and 19 years, we used WHO standardized growth
curves because BMI cut-off points for obesity and overweight in
this age range may differ from adults. Thus, we defined a BMI-for-
age of more than 1 SD but less than 2 SD above the mean as
overweight, and more than 2 SD as obese [18].
We also evaluated trends in women and children socio-
demographic variables: age, years of education, child sex and
place of residence—all information was asked to children’s
mothers. Anemia was defined using WHO cut-offs for non-
pregnant women (hemoglobin count ,12 g/dl) and children aged
5 to 59 months(hemoglobin count,11 g/dl)[19]. We used years of
education as a proxy for socioeconomic status (SES) because the
wealth and assets indexes constructed by INEI did not maintain
standard variables across waves, making comparability and
standardization difficult. In addition, it has been shown that for
rural populations’ assets index are not a good SES indicator [20],
so for our analysis we used women education as a proxy of SES.
Statistical AnalysisDescriptive analyses were conducted for all DHS waves
calculating prevalence and mean values for the evaluated
variables, as appropriate. Moreover, we plotted women’s BMI
curves of 1996 and 2011 to compare general BMI changes—
stratifying by age range (15–19; 20–29; 30–39; 40–49). We divided
women in age-groups due to different BMI shifts by age. Our
intention was to show the secular trend in BMI and women’s age
temporary effect modification. Children BMI curves standardized
for age and sex were plotted according to WHO growth curves
[21], in urban and rural comparing 1996 and 2011.
We performed trend analysis, stratifying by place of residence
(urban or rural), using linear regression models for continuous
variables (e.g. BMI); and Poisson regression for binary outcomes
calculating prevalence ratios (PR) [22]. We analyzed every
anthropometric variable independently in a regression model:
each category of women’s BMI (Poisson regression), continuous
BMI (linear regression), each nutritional variable in children
(Poisson regression), anemia (Poisson regression), and socio-
demographic variables.
The year of survey was employed as a continuous independent
variable, evaluating any linear increase or decrease across years.
When data showed a visual non-linear trend, we analyzed total
rise or decrease using the survey-year as a dummy variable. When
this happened, we tried to analyze smaller periods in which trends
appeared to be linear. For instance, if we evidenced a linear
decline from 1996 to 2005, but a flattened pattern since then or
inverse direction of the trend, we analyzed separately the periods
1996–2005 and 2005–2011.
We also compared in some cases differences in point prevalence
(for any specific year) between urban versus rural populations
using regression models (Poisson). Since BMI cut-off points were
different for adult (20–49 years) and adolescent (15–19 years)
women, we performed separated analyses to evaluate trends of
categorized BMI (obesity, overweight, normal, underweight).
Adolescents’ analyses were not stratified by place of residence
due to small sample sizes in some periods.
STATA version 11.2 software (STATA Corp, College Station,
TX, US) was employed for our analyses. Given surveys’ multistage
random samples, we used the svy set of commands. Accounting
sampling units and stratification of the samples, we calculated
weights of the analyzed individuals in the household and linearized
standard errors (SE). We calculated 95% confidence intervals and
p,0.05 was considered significant in our analyses.
Results
We analyzed data from 123,642 women—78,408 urban and
45,234 rural—and 64,135 children under 5 years—33,304 urban
and 30,831 rural—in all DHS waves (1996 to 2011). Table 1
shows a detailed description of populations’ socio-demographic
characteristics and sample size for each wave.
Overall, 73% of women were from urban areas maintaining this
percentage throughout years (p = 0.132). Women’s mean age,
across waves, was 30.3 years SE[0.03]; with 19.7% from 15 to 19
years old, 30.5% from 20 to 29 years, 27.3% from 30 to 39 years,
and 22% from 40 to 49 years. Mean years of education in women
increased in both settings (p,0.001), especially from 1996 to 2000
with a greater upsurge among urban women over time. Anemia
among women declined significantly from 1996 to 2011
(p,0.001), with similar reductions in rural (decrease of 48% SE
[2.7]) and urban (decrease of 43% SE [2.8]) areas. In 2011, we
found that rural women had higher prevalence of anemia
compared to their urban counterparts (p = 0.005) (Table 1).
Conversely, children from urban areas (decrease of 43%, from
1996 to 2011) depicted a higher anemia diminution compared to
rural counterparts (decrease of 24%, from 1996 to 2011,
p,0.001).
Children’s mean age, across waves, was 2.5 years SE [0.01] with
similar values across all waves and no differences between urban
and rural areas. The number of evaluated male and female
children across time was constant (,1:1 proportion). A declining
trend of anemia in children was observed in both settings
(p,0.001). Comparing 2000 to 2011, children with anemia in
the overall analysis had a 48% reduction (PR = 0.62 SE [0.02]),
decreasing more in urban (PR = 0.57 SE [0.03]) than in rural
settings (PR = 0.73 SE [0.03]). Moreover, the prevalence of
anemia among rural children was 46% higher than in their urban
counterparts (p,0.001) in 2011 (Table 1).
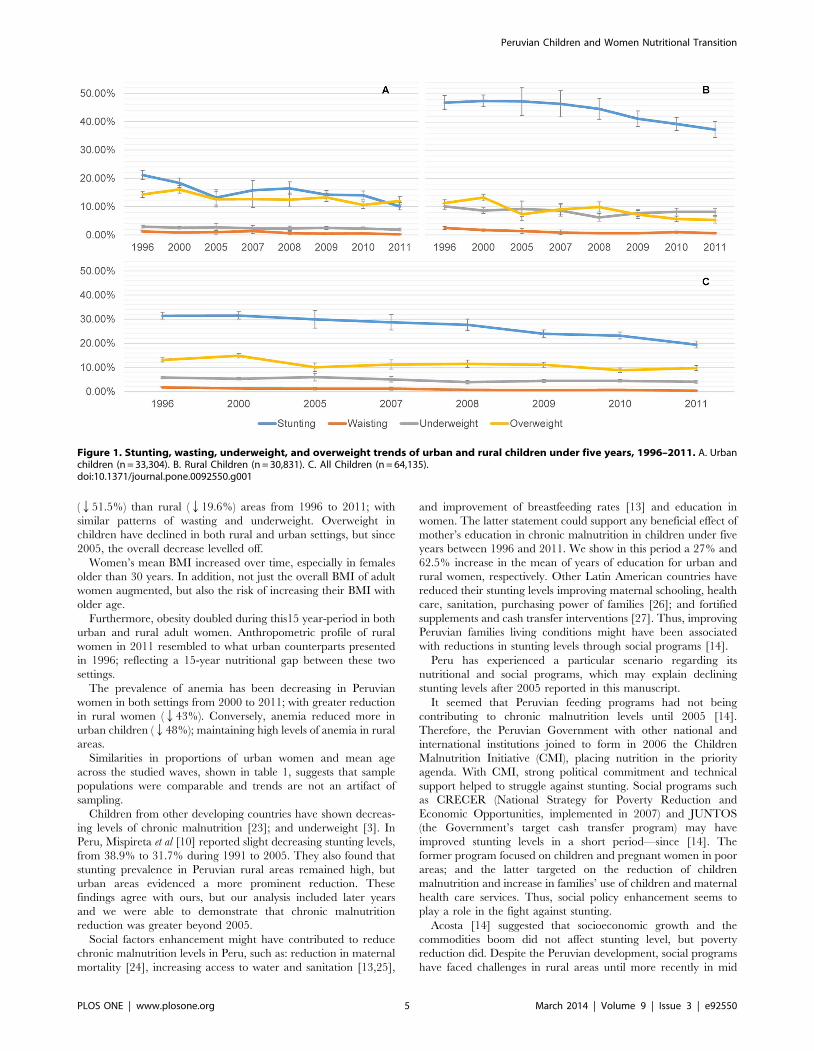
Nutritional Trends for ChildrenBetween 1996 and 2011, stunting, wasting, and underweight
decreased (p,0.001 for all three). A small decrease in overweight
prevalence was also observed (p,0.001) (Figure 1).
Stratifying by place of residence, we observe a deeper decline of
stunting in urban (51.5%) than rural (19.6%) areas (p,0.001) over
time. Figure 1 shows that stunting decrease started in 2007 for
rural children, having a significant reduction from 2007 to 2011
(p,0.001), but not from 1996 to 2007 (p = 0.973).
During the analyzed period, wasting declined in urban
(p,0.001) and rural (p,0.001) children, with no significant
reductions from 2007 to 2011 in the rural areas (p = 0.979). In
2011, wasting prevalence was 0.22% SE [0.08] and 0.64% SE
Peruvian Children and Women Nutritional Transition
PLOS ONE | www.plosone.org 3 March 2014 | Volume 9 | Issue 3 | e92550
[0.02] in urban and rural children, respectively. On the other
hand, underweight has also been dropping in both settings, having
a constant reduction in urban children, going from 2.9% to 1.9%
(p,0.001). In the rural children, underweight dropped from
10.1% to 8.2% in an irregular way (p,0.001) (Figure 1).
In urban children, overweight prevalence declined from 1996 to
2011 (p,0.001), but this trend seemed to have flattened since
2005 (p = 0.235); depicting in 2011 an overweight prevalence of
12.0% SE [0.73], surpassing stunting levels (10.3% SE [0.66]). In
rural children, overweight declined between 1996 and 2011
(p,0.001).
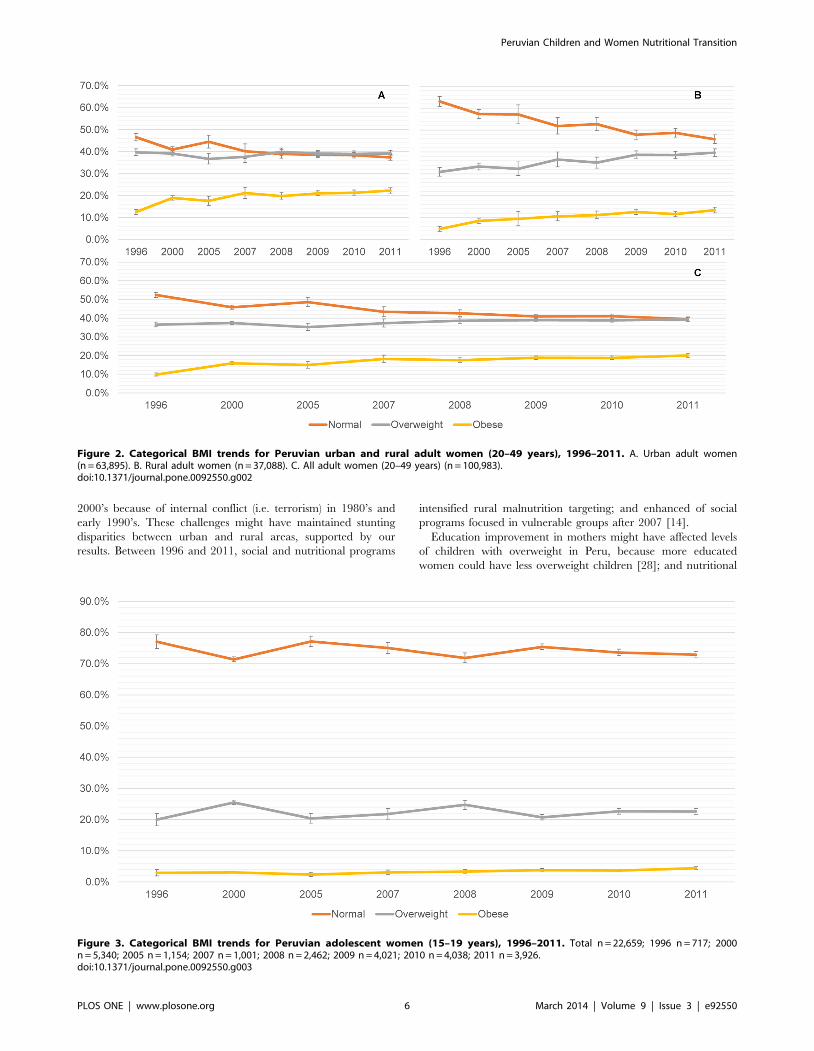
Women Nutritional TrendsWe observe an overall increase in the prevalence of overweight
from 1996 to 2011 (p,0.001), in women between 20–49 years.
However, the curve flattened since 2008. Percentages of women
with normal BMI have been declining over time (p,0.001),
especially since 2005; showing similar percentages of normal
(39.6% SE [0.56]) and overweight (39.4% SE [0.52]) women in
2011 (Figure 2).
Obesity levels depict a constant increase over time (p,0.001). In
2011, the prevalence of overweight/obese women was higher than
the normal BMI-category (p,0.001); and underweight maintained
constant across years with a prevalence of ,1% in most waves for
urban and rural settings.
Overweight did not show a clear trend in urban women
(p = 0.796), but percentages of normal women declined, especially
since 2005 (p,0.001). We evidenced for 2011 similar percentages
of overweight (39.3% SE [0.63]) and normal-BMI women (37.4%
SE [0.67]) (Figure 2). Furthermore, obesity increased 1.78 (SE
[0.09]) times in 2011 compared to 1996 (p,0.001) (increase of
0.65% points per/year). In 2011, 22.3% adult women (SE [0.06])
were obese, and 61.6% SE [1.03] had a BMI $25 kg/m2.
Rural areas depicts a decrease of normal-BMI women
(p,0.001), meanwhile overweight prevalence increased over time
(p,0.001), specially since 2005 (Figure 2). Obesity shows a
constant increase during the analyzed period (p,0.001) and its
prevalence in 2011 was 2.75 (SE [0.35]) times higher than in 1996.
On the other hand, for rural women in 2011, the prevalence of
normal-BMI (45.9%) was higher than overweight (39.7%) women
(p,0.001); but lower than obese/overweight females (53.2%)
(p,0.001).
Teenagers between 15 to 19 years, showed a slight increment in
obesity since 2005 (p = 0.020) (Figure 3).
In Table 1, we observe that women’s mean BMI has been
constantly increasing from 1996 to 2011 (p,0.001): q0.09 kg/m2
per year. Mean BMI augmented for urban and rural women
(p,0.001 in both settings), with a higher increase per year in
urban (q0.19%/year SE [0.04]) than rural (q0.09%/year SE
[0.04]) settings.
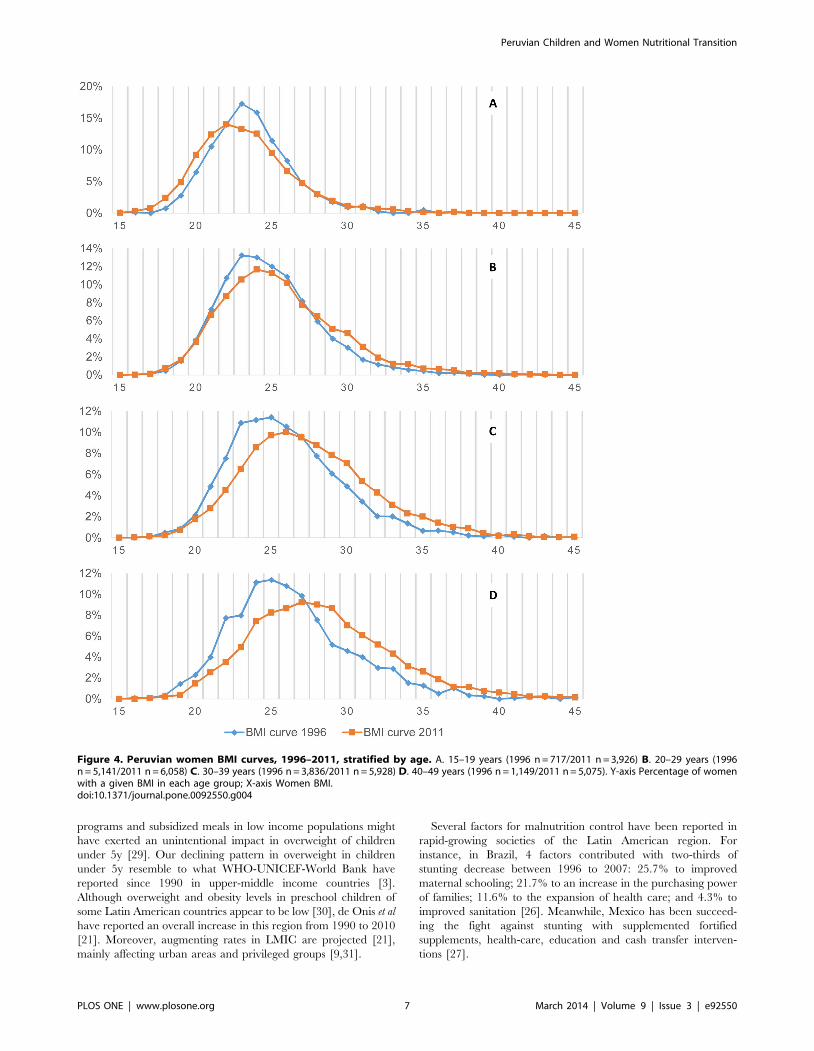
BMI CurvesIn figure 4, when comparing women’s BMI curves of 1996 and
2011, we can see a slight shift to the right and flattening of the
curve in 2011 in adult women between 30–39 and 40–49 years.
When looking only at the curves from 1996, data suggests that
older populations had very little increase in overall BMI. However,
in 2011 this changed, and we evidence that older populations tend
to increase their overall BMI more than in 1996; consequently,
women from 1996 increased their BMI in 2011 more than
expected. Women between 20–30 years in 1996 and 2011 did not
have differences in BMI curves, however, those from 1996, which
would be in the 30–40/40–49 age groups in 2011 had more
flattened BMI curves with an evident shift to the right, when
compared with the same age groups from 1996. Suggesting,
therefore, a temporary modification of the effect of age on the risk
of BMI increase.
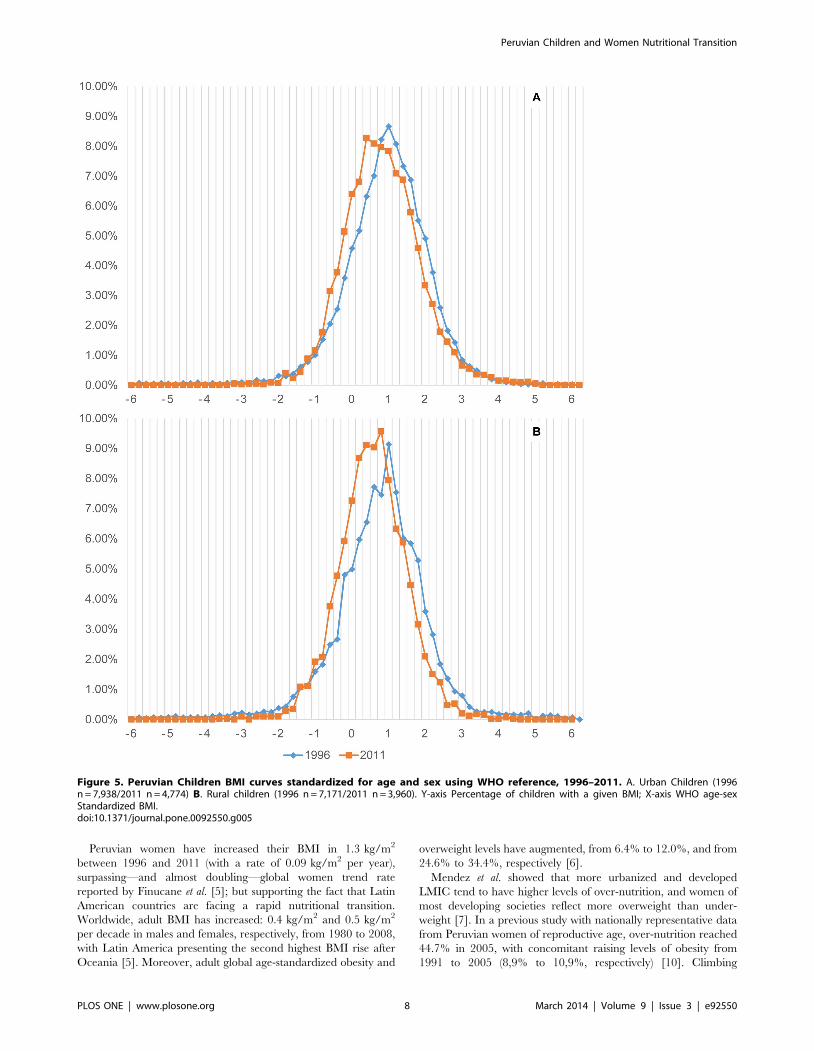
We plotted the BMI distribution for children under 5y, noticing
that rural and urban children’s curves maintained constant
between1996 to 2011 (Figure 5).
Discussion
Peru has experienced a rapid nutritional transition in a short
period of time with remaining malnutrition associated with
stunting and anemia; and increasing rates of obesity in adult
women.
We found declining levels of chronic malnutrition (stunting) in
children under 5 years since 2007, with greater reduction in urban
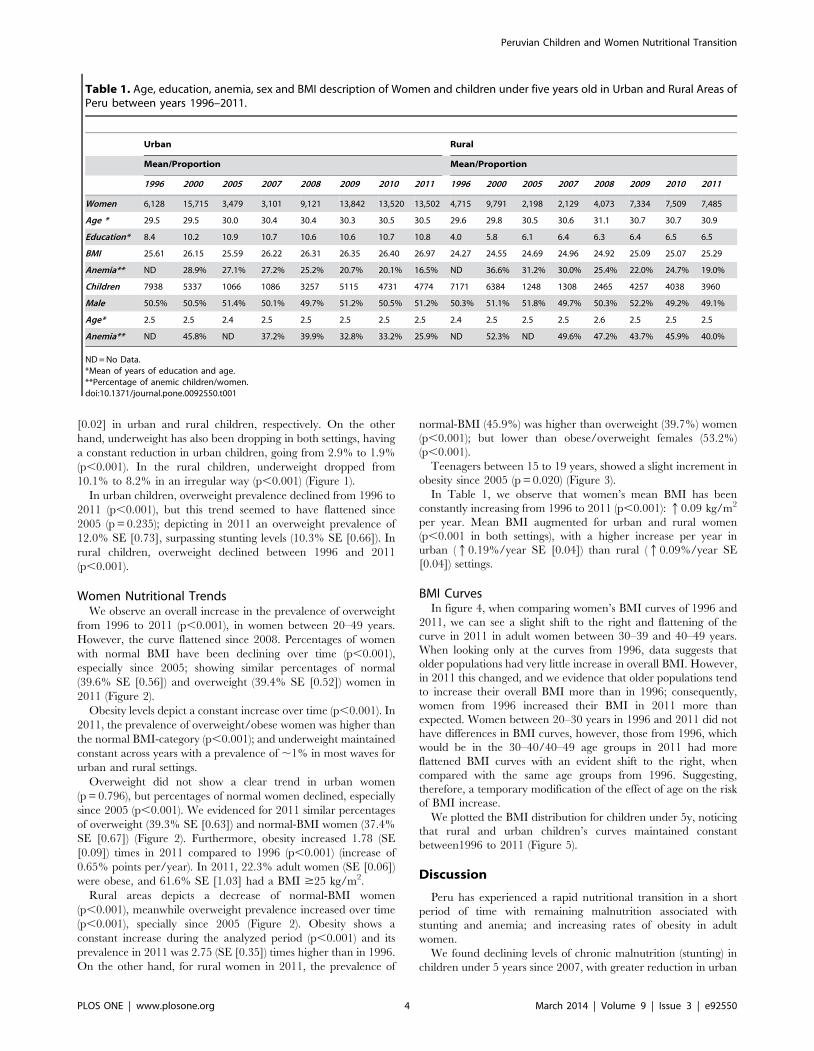
Table 1. Age, education, anemia, sex and BMI description of Women and children under five years old in Urban and Rural Areas ofPeru between years 1996–2011.
Urban Rural
Mean/Proportion Mean/Proportion
1996 2000 2005 2007 2008 2009 2010 2011 1996 2000 2005 2007 2008 2009 2010 2011
Women 6,128 15,715 3,479 3,101 9,121 13,842 13,520 13,502 4,715 9,791 2,198 2,129 4,073 7,334 7,509 7,485
Age * 29.5 29.5 30.0 30.4 30.4 30.3 30.5 30.5 29.6 29.8 30.5 30.6 31.1 30.7 30.7 30.9
Education* 8.4 10.2 10.9 10.7 10.6 10.6 10.7 10.8 4.0 5.8 6.1 6.4 6.3 6.4 6.5 6.5
BMI 25.61 26.15 25.59 26.22 26.31 26.35 26.40 26.97 24.27 24.55 24.69 24.96 24.92 25.09 25.07 25.29
Anemia** ND 28.9% 27.1% 27.2% 25.2% 20.7% 20.1% 16.5% ND 36.6% 31.2% 30.0% 25.4% 22.0% 24.7% 19.0%
Children 7938 5337 1066 1086 3257 5115 4731 4774 7171 6384 1248 1308 2465 4257 4038 3960
Male 50.5% 50.5% 51.4% 50.1% 49.7% 51.2% 50.5% 51.2% 50.3% 51.1% 51.8% 49.7% 50.3% 52.2% 49.2% 49.1%
Age* 2.5 2.5 2.4 2.5 2.5 2.5 2.5 2.5 2.4 2.5 2.5 2.5 2.6 2.5 2.5 2.5
Anemia** ND 45.8% ND 37.2% 39.9% 32.8% 33.2% 25.9% ND 52.3% ND 49.6% 47.2% 43.7% 45.9% 40.0%
ND = No Data.*Mean of years of education and age.**Percentage of anemic children/women.doi:10.1371/journal.pone.0092550.t001
Peruvian Children and Women Nutritional Transition
PLOS ONE | www.plosone.org 4 March 2014 | Volume 9 | Issue 3 | e92550
(Q51.5%) than rural (Q19.6%) areas from 1996 to 2011; with
similar patterns of wasting and underweight. Overweight in
children have declined in both rural and urban settings, but since
2005, the overall decrease levelled off.
Women’s mean BMI increased over time, especially in females
older than 30 years. In addition, not just the overall BMI of adult
women augmented, but also the risk of increasing their BMI with
older age.
Furthermore, obesity doubled during this15 year-period in both
urban and rural adult women. Anthropometric profile of rural
women in 2011 resembled to what urban counterparts presented
in 1996; reflecting a 15-year nutritional gap between these two
settings.
The prevalence of anemia has been decreasing in Peruvian
women in both settings from 2000 to 2011; with greater reduction
in rural women (Q43%). Conversely, anemia reduced more in
urban children (Q48%); maintaining high levels of anemia in rural
areas.
Similarities in proportions of urban women and mean age
across the studied waves, shown in table 1, suggests that sample
populations were comparable and trends are not an artifact of
sampling.
Children from other developing countries have shown decreas-
ing levels of chronic malnutrition [23]; and underweight [3]. In
Peru, Mispireta et al [10] reported slight decreasing stunting levels,
from 38.9% to 31.7% during 1991 to 2005. They also found that
stunting prevalence in Peruvian rural areas remained high, but
urban areas evidenced a more prominent reduction. These
findings agree with ours, but our analysis included later years
and we were able to demonstrate that chronic malnutrition
reduction was greater beyond 2005.
Social factors enhancement might have contributed to reduce
chronic malnutrition levels in Peru, such as: reduction in maternal
mortality [24], increasing access to water and sanitation [13,25],
and improvement of breastfeeding rates [13] and education in
women. The latter statement could support any beneficial effect of
mother’s education in chronic malnutrition in children under five
years between 1996 and 2011. We show in this period a 27% and
62.5% increase in the mean of years of education for urban and
rural women, respectively. Other Latin American countries have
reduced their stunting levels improving maternal schooling, health
care, sanitation, purchasing power of families [26]; and fortified
supplements and cash transfer interventions [27]. Thus, improving
Peruvian families living conditions might have been associated
with reductions in stunting levels through social programs [14].
Peru has experienced a particular scenario regarding its
nutritional and social programs, which may explain declining
stunting levels after 2005 reported in this manuscript.
It seemed that Peruvian feeding programs had not being
contributing to chronic malnutrition levels until 2005 [14].
Therefore, the Peruvian Government with other national and
international institutions joined to form in 2006 the Children
Malnutrition Initiative (CMI), placing nutrition in the priority
agenda. With CMI, strong political commitment and technical
support helped to struggle against stunting. Social programs such
as CRECER (National Strategy for Poverty Reduction and
Economic Opportunities, implemented in 2007) and JUNTOS
(the Government’s target cash transfer program) may have
improved stunting levels in a short period—since [14]. The
former program focused on children and pregnant women in poor
areas; and the latter targeted on the reduction of children
malnutrition and increase in families’ use of children and maternal
health care services. Thus, social policy enhancement seems to
play a role in the fight against stunting.
Acosta [14] suggested that socioeconomic growth and the
commodities boom did not affect stunting level, but poverty
reduction did. Despite the Peruvian development, social programs
have faced challenges in rural areas until more recently in mid
Figure 1. Stunting, wasting, underweight, and overweight trends of urban and rural children under five years, 1996–2011. A. Urbanchildren (n = 33,304). B. Rural Children (n = 30,831). C. All Children (n = 64,135).doi:10.1371/journal.pone.0092550.g001
Peruvian Children and Women Nutritional Transition
PLOS ONE | www.plosone.org 5 March 2014 | Volume 9 | Issue 3 | e92550
2000’s because of internal conflict (i.e. terrorism) in 1980’s and
early 1990’s. These challenges might have maintained stunting
disparities between urban and rural areas, supported by our
results. Between 1996 and 2011, social and nutritional programs
intensified rural malnutrition targeting; and enhanced of social
programs focused in vulnerable groups after 2007 [14].
Education improvement in mothers might have affected levels
of children with overweight in Peru, because more educated
women could have less overweight children [28]; and nutritional
Figure 2. Categorical BMI trends for Peruvian urban and rural adult women (20–49 years), 1996–2011. A. Urban adult women(n = 63,895). B. Rural adult women (n = 37,088). C. All adult women (20–49 years) (n = 100,983).doi:10.1371/journal.pone.0092550.g002
Figure 3. Categorical BMI trends for Peruvian adolescent women (15–19 years), 1996–2011. Total n = 22,659; 1996 n = 717; 2000n = 5,340; 2005 n = 1,154; 2007 n = 1,001; 2008 n = 2,462; 2009 n = 4,021; 2010 n = 4,038; 2011 n = 3,926.doi:10.1371/journal.pone.0092550.g003
Peruvian Children and Women Nutritional Transition
PLOS ONE | www.plosone.org 6 March 2014 | Volume 9 | Issue 3 | e92550
programs and subsidized meals in low income populations might
have exerted an unintentional impact in overweight of children
under 5y [29]. Our declining pattern in overweight in children
under 5y resemble to what WHO-UNICEF-World Bank have
reported since 1990 in upper-middle income countries [3].
Although overweight and obesity levels in preschool children of
some Latin American countries appear to be low [30], de Onis et al
have reported an overall increase in this region from 1990 to 2010
[21]. Moreover, augmenting rates in LMIC are projected [21],
mainly affecting urban areas and privileged groups [9,31].
Several factors for malnutrition control have been reported in
rapid-growing societies of the Latin American region. For
instance, in Brazil, 4 factors contributed with two-thirds of
stunting decrease between 1996 to 2007: 25.7% to improved
maternal schooling; 21.7% to an increase in the purchasing power
of families; 11.6% to the expansion of health care; and 4.3% to
improved sanitation [26]. Meanwhile, Mexico has been succeed-
ing the fight against stunting with supplemented fortified
supplements, health-care, education and cash transfer interven-
tions [27].
Figure 4. Peruvian women BMI curves, 1996–2011, stratified by age. A. 15–19 years (1996 n = 717/2011 n = 3,926) B. 20–29 years (1996n = 5,141/2011 n = 6,058) C. 30–39 years (1996 n = 3,836/2011 n = 5,928) D. 40–49 years (1996 n = 1,149/2011 n = 5,075). Y-axis Percentage of womenwith a given BMI in each age group; X-axis Women BMI.doi:10.1371/journal.pone.0092550.g004
Peruvian Children and Women Nutritional Transition
PLOS ONE | www.plosone.org 7 March 2014 | Volume 9 | Issue 3 | e92550
Peruvian women have increased their BMI in 1.3 kg/m2
between 1996 and 2011 (with a rate of 0.09 kg/m2 per year),
surpassing—and almost doubling—global women trend rate
reported by Finucane et al. [5]; but supporting the fact that Latin
American countries are facing a rapid nutritional transition.
Worldwide, adult BMI has increased: 0.4 kg/m2 and 0.5 kg/m2
per decade in males and females, respectively, from 1980 to 2008,
with Latin America presenting the second highest BMI rise after
Oceania [5]. Moreover, adult global age-standardized obesity and
overweight levels have augmented, from 6.4% to 12.0%, and from
24.6% to 34.4%, respectively [6].
Mendez et al. showed that more urbanized and developed
LMIC tend to have higher levels of over-nutrition, and women of
most developing societies reflect more overweight than under-
weight [7]. In a previous study with nationally representative data
from Peruvian women of reproductive age, over-nutrition reached
44.7% in 2005, with concomitant raising levels of obesity from
1991 to 2005 (8,9% to 10,9%, respectively) [10]. Climbing
Figure 5. Peruvian Children BMI curves standardized for age and sex using WHO reference, 1996–2011. A. Urban Children (1996n = 7,938/2011 n = 4,774) B. Rural children (1996 n = 7,171/2011 n = 3,960). Y-axis Percentage of children with a given BMI; X-axis WHO age-sexStandardized BMI.doi:10.1371/journal.pone.0092550.g005
Peruvian Children and Women Nutritional Transition
PLOS ONE | www.plosone.org 8 March 2014 | Volume 9 | Issue 3 | e92550
numbers of overweight and obese women in our study could be
explained by rapid nutritional transition, where changes in diet
and lifestyle pattern through years contributed to over-nutrition,
like other Latin American countries [32]. Growing economies in
Latin America have been experiencing this transition, augmenting
adult obesity rates explained by change in dietary pattern [33]:
more intake of fats and carbohydrates (including raising
consumption of refined foods), and less vegetables and fruits
consumption. In addition, sedentary lifestyles and physical
inactivity due to rapid urbanization have been contributing to
escalating levels of over-nutrition [32].
As suggested by data of the Food and Agriculture Organization
(FAO: http://faostat.fao.org/), Peruvian population increased
their caloric intake during the studied years—from 2280 kcal/
day in 1996 to 2563 kcal/day in 2009 (12% increase)—mainly
coming from refine products, animal raw fat, vegetable fat and
products rich in simple carbohydrates. Recent evidence suggests
high prevalence of physical inactivity in Peruvian urban popula-
tion [34], which added to inactive hobbies [35] and weight
underestimation [36], among other factors, might have hastened
the nutritional transition in Peru, starting in adult populations—
supported by a recent nationally representative study of the
Peruvian population, highlighting high levels of obesity in males
and females between 30 to 59 years old [9].
Obesity and overweight vary within and between countries,
reflecting social determinants in adult obesity burden [37].
Monteiro et al. [38], and Dinsa et al.[39] suggested that poor
women start suffering from the burden of obesity when a nation’s
GNI reach $2500 and $1000, respectively.
According to the World Bank, Peru has accomplished a rapid
economic development from 1996 to 2011, with a total GDP
(Constant LCU) augmentation of 104.4% and GNI per capita
(constant LCU) increase of 60.0% in this period. Moreover, Peru
declined poverty levels from 58.7% in 2004 to 27.8% in 2011.
This rapid economic growth in Peru has brought little decrease
in GNI index (e.g. 0.56 in 1998 and 0.48 in 2010), suggesting
remaining inequalities. The relationship between SES and obesity
changes according to which SES indicator is analyzed, and by
place of residence; having that wealthier rural women seem to
have more chance of being obese, with unclear association in the
urban areas [40]. Conversely, Peruvian women with more
education seem to have less odds of obesity, more noticeable in
urban settings [40]. Further evidence should address when (if
happened) obesity burden went towards people in less advantaged
SES groups—including different SES indicators—in Peru; for
understanding the effect of rapid national macroeconomic
progress on obesity inequality.
On the other hand, Latin American countries showed declining
rates of anemia, where their government entities have taken
emphasized strategies to reduce this condition in children,
including dietary supplements with ferrous sulfate and fortified
foods [41], and even when this intervention might be dubiously
effective in the short term [42], this could partially explain the
decreasing trend of anemia percentage that we present in our
manuscript for Peruvian children [13]. On the other hand, high
levels of anemia have been reported in overweight or obese
women from 3 developing countries (including Peru) [43], telling
us that individuals from LMIC can be malnourished even if they
appear in ranges of over-nutrition.
Remaining high levels of anemia in Peruvian children of
preschool age and women of reproductive age could be explained
by incomplete targeting of these vulnerable populations, mainly
affecting children of rural settings [14]. Additional explanations
may arise, such as the effect of Peruvian economic development on
anemia, but stay beyond the objective of this manuscript. Further
studies and interventions assessment should be performed to
determine why Peruvian children and women still manifest current
anemia figures.
Our study presents some limitations. First, it is a descriptive
study and any apparent relationship interpreted from figures or
tables between anthropometric measures variations and/or socio-
demographic variables would only imply an ecologic association
and readers should take this findings with precaution—since it
could reflect an ecologic fallacy [44]. We must emphasize that our
hypotheses regarding macroeconomic growth, change in diet,
and/or enhancement of social programs on nutritional transition
in Peru, represent also an ecological relation. In this manuscript
we postulate that these factors seem the more plausible reasons
behind our depicted trends. Formal studies assessing impact of
interventions should be carried out, to evaluate nutritional
programs among SES groups and settings in Peru. We were
unable to evaluate the effect of other variables like wealth, diet or
breastfeeding due to lack of comparability in measurement
methodologies across waves or because unavailable data, never-
theless data from other sources, like FAO and World Bank, has
been discussed in this section, for a better explanation of the
probable causes of the trends.
On the other hand we should point-out that population-based
surveys, used in this study, were representative of the entire
Peruvian pre-school children and women in reproductive age (15–
49 years) between1996 to 2011. We can assure with high certainty
that our results depict the nutritional transition in Peru, which
rapidly became an upper-middle income country in the last 20
years.
Our findings support the fact that Peru is on track to meet the
Millennium Development Goals (MDG) (http://www.un.org/
millenniumgoals), which include reduction of extreme poverty
and hunger. However, Peru has been facing persistent malnutri-
tion profiles, being over-nutrition dramatically escalating in adult
women.
Even when under-nutritional indicators, in children under five
have dropped, same as for overweight, and women’s obesity have
increased, the nutritional transition in Peru shows different
patterns for urban and rural populations. Public policies should
emphasize targeting both malnutrition conditions—under-nutri-
tion/stunting, overweight/obesity and anemia—considering age
and place of residence in rapid progressing societies like Peru.
Acknowledgments
We would like to thank Dr Jaime Miranda and Dr Carlos Delgado, for
their valuable comments and suggestions. We also appreciate editorial
support from Lena Shah. We appreciate the effort of the Peruvian National
Institute of Statistics and Informatics (INEI), for collecting this rich and
vital data every year and for supporting us on DHS details. We also
acknowledge the valuable participation of Peruvian women and their
children in DHS survey.
Author Contributions
Analyzed the data: CL. Contributed reagents/materials/analysis tools: CL
JAP. Wrote the paper: CL JAP GAV RQ.
Peruvian Children and Women Nutritional Transition
PLOS ONE | www.plosone.org 9 March 2014 | Volume 9 | Issue 3 | e92550
References
1. Drewnowski A, Popkin BM (1997) The nutrition transition: new trends in the
global diet. Nutr Rev 55: 31–43.2. Popkin BM, Adair LS, Ng SW (2012) Global nutrition transition and the
pandemic of obesity in developing countries. Nutr Rev 70: 3–21.3. WHO U, World Bank (2012) Level & Trends in Child Malnutrition. UNICEF-
WHO-The World Bank: Joint child malnutrition estimates - Levels and trends.
4. Wang Y, Monteiro C, Popkin BM (2002) Trends of obesity and underweight inolder children and adolescents in the United States, Brazil, China, and Russia.
Am J Clin Nutr 75: 971–977.5. Finucane MM, Stevens GA, Cowan MJ, Danaei G, Lin JK, et al. (2011)
National, regional, and global trends in body-mass index since 1980: systematic
analysis of health examination surveys and epidemiological studies with 960country-years and 9.1 million participants. Lancet 377: 557–567.
6. Stevens GA, Singh GM, Lu Y, Danaei G, Lin JK, et al. (2012) National,regional, and global trends in adult overweight and obesity prevalences. Popul
Health Metr 10: 22.7. Mendez MA, Monteiro CA, Popkin BM (2005) Overweight exceeds under-
weight among women in most developing countries. Am J Clin Nutr 81: 714–
721.8. Popkin BM, Gordon-Larsen P (2004) The nutrition transition: worldwide obesity
dynamics and their determinants. Int J Obes Relat Metab Disord 28 Suppl 3:S2–9.
9. Alvarez-Dongo D, Sanchez-Abanto J, Gomez-Guizado G, Tarqui-Mamani C
(2012) [Overweight and obesity: prevalence and determining social factors ofoverweight in the Peruvian population (2009-2010)]. Rev Peru Med Exp Salud
Publica 29: 303–313.10. Mispireta M, Rosas A, Velasquez J, Lescano A, Lanata CF (2007) [Nutrition
Transition in Peru, 1991–2005]. Rev Peru Med Exp Salud Publica 24: 129–135.11. Pajuelo-Ramirez J, Miranda-Cuadros M, Campos-Sanchez M, Sanchez-Abanto
J (2011) [Prevalence of overwight and obesity among children under five years in
Peru 2007-2010]. Rev Peru Med Exp Salud Publica 28: 222–227.12. Balarajan Y, Ramakrishnan U, Ozaltin E, Shankar AH, Subramanian SV
(2011) Anaemia in low-income and middle-income countries. Lancet 378: 2123–2135.
13. Instituto Nacional de Salud (2012) Evolucion de los Indicadores del Programa
Articulado Nutricional y los factores asociados a la Desnutricion Cronica yAnemia. In: Centro Nacional de Alimentacion y Nutricion, editor. Lima, Peru:
Ministerio de Salud.14. Acosta AM (2011) Analysing Success in the Fight against Malnutrition in Peru.
IDS Working Papers 2011: 2–49.15. Macro ORC (2006) Demographic and Health Survey interviewer’s manual.
Calverton, MD.
16. WHO Multicentre Growth Reference Study Group (2006) WHO Child GrowthStandards: Methods and development: Length/height-for-age, weight-for-age,
weight-for-length, weight-for-height and body mass index-for-age. World HealthOrganization.
17. WHO (1995) Physical status: the use and interpretation of anthropometry.
Report of a WHO Expert Committee. Geneva: World Health Organization.460 p.
18. de Onis M, Onyango AW, Borghi E, Siyam A, Nishida C, et al. (2007)Development of a WHO growth reference for school-aged children and
adolescents. Bull World Health Organ 85: 660–667.19. World Health Organization (2008) Worldwide prevalence of anemia 1993–
2005: WHO global database on anemia. Geneva.
20. Howe LD, Galobardes B, Matijasevich A, Gordon D, Johnston D, et al. (2012)Measuring socio-economic position for epidemiological studies in low- and
middle-income countries: a methods of measurement in epidemiology paper.Int J Epidemiol 41: 871–886.
21. de Onis M, Blossner M, Borghi E (2010) Global prevalence and trends of
overweight and obesity among preschool children. Am J Clin Nutr 92: 1257–1264.
22. Barros AJ, Hirakata VN (2003) Alternatives for logistic regression in cross-sectional studies: an empirical comparison of models that directly estimate the
prevalence ratio. BMC Med Res Methodol 3: 21.
23. Stevens GA, Finucane MM, Paciorek CJ, Flaxman SR, White RA, et al. (2012)
Trends in mild, moderate, and severe stunting and underweight, and progress
towards MDG 1 in 141 developing countries: a systematic analysis of population
representative data. Lancet 380: 824–834.
24. Hogan MC, Foreman KJ, Naghavi M, Ahn SY, Wang M, et al. (2010) Maternal
mortality for 181 countries, 1980–2008: a systematic analysis of progress towards
Millennium Development Goal 5. Lancet 375: 1609–1623.
25. WHO-UNICEF (2013) Progress on sanitation and drinking-water - 2013
update.
26. Monteiro CA, Benicio MH, Konno SC, Silva AC, Lima AL, et al. (2009) Causes
for the decline in child under-nutrition in Brazil, 1996-2007. Rev Saude Publica
43: 35–43.
27. Rivera JA, Sotres-Alvarez D, Habicht JP, Shamah T, Villalpando S (2004)
Impact of the Mexican program for education, health, and nutrition (Progresa)
on rates of growth and anemia in infants and young children: a randomized
effectiveness study. JAMA 291: 2563–2570.
28. Baughcum AE, Chamberlin LA, Deeks CM, Powers SW, Whitaker RC (2000)
Maternal perceptions of overweight preschool children. Pediatrics 106: 1380–
1386.
29. Kimbro RT, Rigby E (2010) Federal food policy and childhood obesity: a
solution or part of the problem? Health Aff (Millwood) 29: 411–418.
30. Kain J, Vio F, Albala C (2003) Obesity trends and determinant factors in Latin
America. Cad Saude Publica 19 Suppl 1: S77–86.
31. Adel el T, Marie-Francoise RC, Mahmud Salaheddin M, Najeeb E, Ahmed
AM, et al. (2008) Nutritional status of under-five children in libya; a national
population-based survey. Libyan J Med 3: 13–19.
32. Uauy R, Albala C, Kain J (2001) Obesity trends in Latin America: transiting
from under- to overweight. J Nutr 131: 893S–899S.
33. Bermudez OI, Tucker KL (2003) Trends in dietary patterns of Latin American
populations. Cad Saude Publica 19 Suppl 1: S87–99.
34. Masterson Creber RM, Smeeth L, Gilman RH, Miranda JJ (2010) Physical
activity and cardiovascular risk factors among rural and urban groups and rural-
to-urban migrants in Peru: a cross-sectional study. Rev Panam Salud Publica 28:
1–8.
35. Jacoby E, Goldstein J, Lopez A, Nunez E, Lopez T (2003) Social class, family,
and life-style factors associated with overweight and obesity among adults in
Peruvian cities. Prev Med 37: 396–405.
36. Loret de Mola C, Pillay TD, Diez-Canseco F, Gilman RH, Smeeth L, et al.
(2012) Body mass index and self-perception of overweight and obesity in rural,
urban and rural-to-urban migrants: PERU MIGRANT study. PLoS One 7:
e50252.
37. McLaren L (2007) Socioeconomic status and obesity. Epidemiol Rev 29: 29–48.
38. Monteiro CA, Moura EC, Conde WL, Popkin BM (2004) Socioeconomic status
and obesity in adult populations of developing countries: a review. Bull World
Health Organ 82: 940–946.
39. Dinsa GD, Goryakin Y, Fumagalli E, Suhrcke M (2012) Obesity and
socioeconomic status in developing countries: a systematic review. Obes Rev
13: 1067–1079.
40. Poterico JA, Carrillo-Larco RM, Quispe R (2012) [Obesity in Peru:
recommendations for a surveillance system]. Rev Peru Med Exp Salud Publica
29: 581.
41. World Health Organization (2001) Iron Deficiency Anemia Assessment,
Prevention and Control: A Guide for Programme Managers. Geneva: WHO;.
42. Assuncao MC, Santos IS, Barros AJ, Gigante DP, Victora CG (2007) Effect of
iron fortification of flour on anemia in preschool children in Pelotas, Brazil. Rev
Saude Publica 41: 539–548.
43. Eckhardt CL, Torheim LE, Monterrubio E, Barquera S, Ruel MT (2008) The
overlap of overweight and anaemia among women in three countries undergoing
the nutrition transition. Eur J Clin Nutr 62: 238–246.
44. Robinson WS (2009) Ecological correlations and the behavior of individuals.
Int J Epidemiol 38: 337–341.
Peruvian Children and Women Nutritional Transition
PLOS ONE | www.plosone.org 10 March 2014 | Volume 9 | Issue 3 | e92550