Nutritional risk screening in hospitalized patients in Galicia (Spain)
8
Original article Nutritional risk screening in hospitalized patients with heart failure q Kjerstin Tevik a, b , Hanne Thürmer c , Marit Inderhaug Husby a , Ann Kristin de Soysa d , Anne-Sofie Helvik b, e, * a Department of Cardiology, St. Olav’s University Hospital, Postbox 3250 Sluppen, 7006 Trondheim, Norway b Department of Public Health and General Practice, Faculty of Medicine, Norwegian University of Science and Technology (NTNU), Postbox 8905, NO-7491 Trondheim, Norway c Telemark Hospital, Medical Department, Notodden, Postbox 234 Notodden, 3672 Notodden, Norway d Department of Clinical Nutrition, St. Olav’s University Hospital, Postbox 3250 Sluppen, 7006 Trondheim, Norway e St. Olav’s University Hospital, Postbox 3250 Sluppen, 7006 Trondheim, Norway article info Article history: Received 22 October 2013 Accepted 31 March 2014 Keywords: Nutritional risk screening (NRS-2002) Disease-related malnutrition in hospital Heart failure Multivariate regression analysis Complications Length of stay summary Background & aims: Malnutrition is an important issue in patient outcome. Screening tools to find risk patients need to be evaluated. This study looks at the validity and reliability of nutritional risk screening (named NRS-2002) in hospitalized patients with chronic heart failure. Methods: In this cross-sectional study nutritional screening was performed using NRS-2002 in 131 pa- tients with chronic heart failure. The predictive validity was evaluated in relation to whether NRS-2002 predicted the incidence of complications and length of hospital stay. NRS-2002’s ability to locate nutritional risk in patients with edema was evaluated. The inter-rater reliability was measured between three investigators screening 45 patients each. Results: The prevalence of nutritional risk was 57%. The incidence of complications and the median length of hospital stay were significantly higher in patients at nutritional risk compared to patients not at nutritional risk. Only the component of severity of disease in NRS-2002 and not the component of the nutritional status was associated with increased length of hospital stay in multivariate analysis. Patients with edema were classified correctly regarding nutritional risk status by NRS-2002 in all but one occasion. The inter-rater reliability was documented, kappa >0.60. Conclusion: NRS-2002 was a reliable screening tool in an in-patient sample with chronic heart failure. The validity of NRS-2002 needs further investigation in a larger sample of hospitalized patients with chronic heart failure. Ó 2014 Elsevier Ltd and European Society for Clinical Nutrition and Metabolism. All rights reserved. 1. Introduction Patients with chronic heart failure still have high morbidity and mortality despite the progress in medical and surgical treatment. 1,2 Malnutrition might play a role in this regard, but has not been sufficiently clarified. 1,3 Prevalence of malnutrition in hospitalized patients has been found to be 34e70% in hospitalized patients with heart failure. 3e5 In the absence of a gold standard in evaluating nutritional status the prevalence of malnutrition will vary depending on diagnostic criteria and screening tools used in the study population. 6 Since malnutrition indicates an unfavorable prognosis in pa- tients with chronic heart failure, 3e5,7 nutritional intervention may prevent complications 8 and increase quality of life. 9 At hospital admission, it is important to evaluate the nutritional status of heart failure patients and to implement nutritional intervention in an early phase to malnourished patients. However, edema may complicate the nutritional assessment of heart failure patients. 6,7 According to guidelines developed by the European Society of Clinical Nutrition and Metabolism, 10 not only heart failure patients, but all patients should be screened for nutritional risk at hospital admission, and the screening tool, nutritional risk screening (NRS- 2002), is recommended in a hospital setting. 10 Nutritional Abbreviations: AMC, arm muscle circumferences; BMI, body mass index; COPD, chronic obstructive pulmonary disease; CRP, C-reactive protein; EF, ejection frac- tion; LOS, length of stay; LRA, logistic regression analysis; MAC, mid arm circum- ference; MNA, Mini Nutritional Assessment; NRS-2002, nutritional risk screening; NSD, Norwegian Social Science Data Service; NYHA, New York Heart Association; REK, Regional Research Ethics Committee; SGA, Subjective Global Assessment; TSC, triceps skin fold. q Conference presentation: Data from the study has not been presented at a congress. * Corresponding author. ISM DMF, NTNU, Postbox 8905, MTFS, 7491 Trondheim, Norway. Tel.: þ47 73 597565; fax: þ47 73 597577. E-mail address: Anne-Sofi[email protected] (A.-S. Helvik). Contents lists available at ScienceDirect Clinical Nutrition journal homepage: http://www.elsevier.com/locate/clnu http://dx.doi.org/10.1016/j.clnu.2014.03.014 0261-5614/Ó 2014 Elsevier Ltd and European Society for Clinical Nutrition and Metabolism. All rights reserved. Clinical Nutrition xxx (2014) 1e8 Please cite this article inpress as: Tevik K, et al., Nutritional risk screening in hospitalized patients with heart failure, Clinical Nutrition (2014), http://dx.doi.org/10.1016/j.clnu.2014.03.014
-
Upload
independent -
Category
Documents
-
view
0 -
download
0
Transcript of Nutritional risk screening in hospitalized patients in Galicia (Spain)
lable at ScienceDirect
Clinical Nutrition xxx (2014) 1e8
Contents lists avai
Clinical Nutrition
journal homepage: ht tp: / /www.elsevier .com/locate/c lnu
Original article
Nutritional risk screening in hospitalized patients with heart failureq
Kjerstin Tevik a,b, Hanne Thürmer c, Marit Inderhaug Husby a, Ann Kristin de Soysa d,Anne-Sofie Helvik b,e,*
aDepartment of Cardiology, St. Olav’s University Hospital, Postbox 3250 Sluppen, 7006 Trondheim, NorwaybDepartment of Public Health and General Practice, Faculty of Medicine, Norwegian University of Science and Technology (NTNU), Postbox 8905,NO-7491 Trondheim, Norwayc Telemark Hospital, Medical Department, Notodden, Postbox 234 Notodden, 3672 Notodden, NorwaydDepartment of Clinical Nutrition, St. Olav’s University Hospital, Postbox 3250 Sluppen, 7006 Trondheim, Norwaye St. Olav’s University Hospital, Postbox 3250 Sluppen, 7006 Trondheim, Norway
a r t i c l e i n f o
Article history:Received 22 October 2013Accepted 31 March 2014
Keywords:Nutritional risk screening (NRS-2002)Disease-related malnutrition in hospitalHeart failureMultivariate regression analysisComplicationsLength of stay
Abbreviations: AMC, arm muscle circumferences;chronic obstructive pulmonary disease; CRP, C-reactition; LOS, length of stay; LRA, logistic regression anaference; MNA, Mini Nutritional Assessment; NRS-200NSD, Norwegian Social Science Data Service; NYHA,REK, Regional Research Ethics Committee; SGA, Subjetriceps skin fold.q Conference presentation: Data from the study h
congress.* Corresponding author. ISM DMF, NTNU, Postbox 8
Norway. Tel.: þ47 73 597565; fax: þ47 73 597577.E-mail address: [email protected] (A.-S.
http://dx.doi.org/10.1016/j.clnu.2014.03.0140261-5614/� 2014 Elsevier Ltd and European Society
Please cite this article in press as: Tevik K, ethttp://dx.doi.org/10.1016/j.clnu.2014.03.014
s u m m a r y
Background & aims: Malnutrition is an important issue in patient outcome. Screening tools to find riskpatients need to be evaluated. This study looks at the validity and reliability of nutritional risk screening(named NRS-2002) in hospitalized patients with chronic heart failure.Methods: In this cross-sectional study nutritional screening was performed using NRS-2002 in 131 pa-tients with chronic heart failure. The predictive validity was evaluated in relation to whether NRS-2002predicted the incidence of complications and length of hospital stay. NRS-2002’s ability to locatenutritional risk in patients with edema was evaluated. The inter-rater reliability was measured betweenthree investigators screening 45 patients each.Results: The prevalence of nutritional risk was 57%. The incidence of complications and the medianlength of hospital stay were significantly higher in patients at nutritional risk compared to patients not atnutritional risk. Only the component of severity of disease in NRS-2002 and not the component of thenutritional status was associated with increased length of hospital stay in multivariate analysis. Patientswith edema were classified correctly regarding nutritional risk status by NRS-2002 in all but oneoccasion. The inter-rater reliability was documented, kappa >0.60.Conclusion: NRS-2002 was a reliable screening tool in an in-patient sample with chronic heart failure.The validity of NRS-2002 needs further investigation in a larger sample of hospitalized patients withchronic heart failure.
� 2014 Elsevier Ltd and European Society for Clinical Nutrition and Metabolism. All rights reserved.
1. Introduction
Patients with chronic heart failure still have high morbidity andmortality despite the progress in medical and surgical treatment.1,2
Malnutrition might play a role in this regard, but has not beensufficiently clarified.1,3
BMI, body mass index; COPD,ve protein; EF, ejection frac-lysis; MAC, mid arm circum-2, nutritional risk screening;New York Heart Association;ctive Global Assessment; TSC,
as not been presented at a
905, MTFS, 7491 Trondheim,
Helvik).
for Clinical Nutrition and Metabol
al., Nutritional risk screening
Prevalence of malnutrition in hospitalized patients has beenfound to be 34e70% in hospitalized patients with heart failure.3e5
In the absence of a gold standard in evaluating nutritional statusthe prevalence of malnutrition will vary depending on diagnosticcriteria and screening tools used in the study population.6
Since malnutrition indicates an unfavorable prognosis in pa-tients with chronic heart failure,3e5,7 nutritional intervention mayprevent complications8 and increase quality of life.9 At hospitaladmission, it is important to evaluate the nutritional status of heartfailure patients and to implement nutritional intervention in anearly phase to malnourished patients. However, edema maycomplicate the nutritional assessment of heart failure patients.6,7
According to guidelines developed by the European Society ofClinical Nutrition and Metabolism,10 not only heart failure patients,but all patients should be screened for nutritional risk at hospitaladmission, and the screening tool, nutritional risk screening (NRS-2002), is recommended in a hospital setting.10 Nutritional
ism. All rights reserved.
in hospitalized patients with heart failure, Clinical Nutrition (2014),
679
375
16
Available patients: heart failure as main- or
secondary diagnosis from October 2008 to February
2010
Not eligible for the study: Not directly admitted to the
department of cardiology (N = 156), newly diagnosed
heart failure or acute heart failure (N = 203), EF > 50 %
(N = 15), ≤ 18 years (N = 1)
Short length of stay/discharged before screening
288
38
34
29
27
29
131
Potential patients:
Serious co-morbidity: malignity, COPD (degree III/IV),
renal failure (creatinine > 330 μmol/L), liver failure
Not able to answer questions because the medical
condition was too poor (intensive care patient, terminal
patients)
Declined to participate
Dementia or mentally incompetent
Other reasons
Included in the study: analysis data
Excluded patients (N = 157):
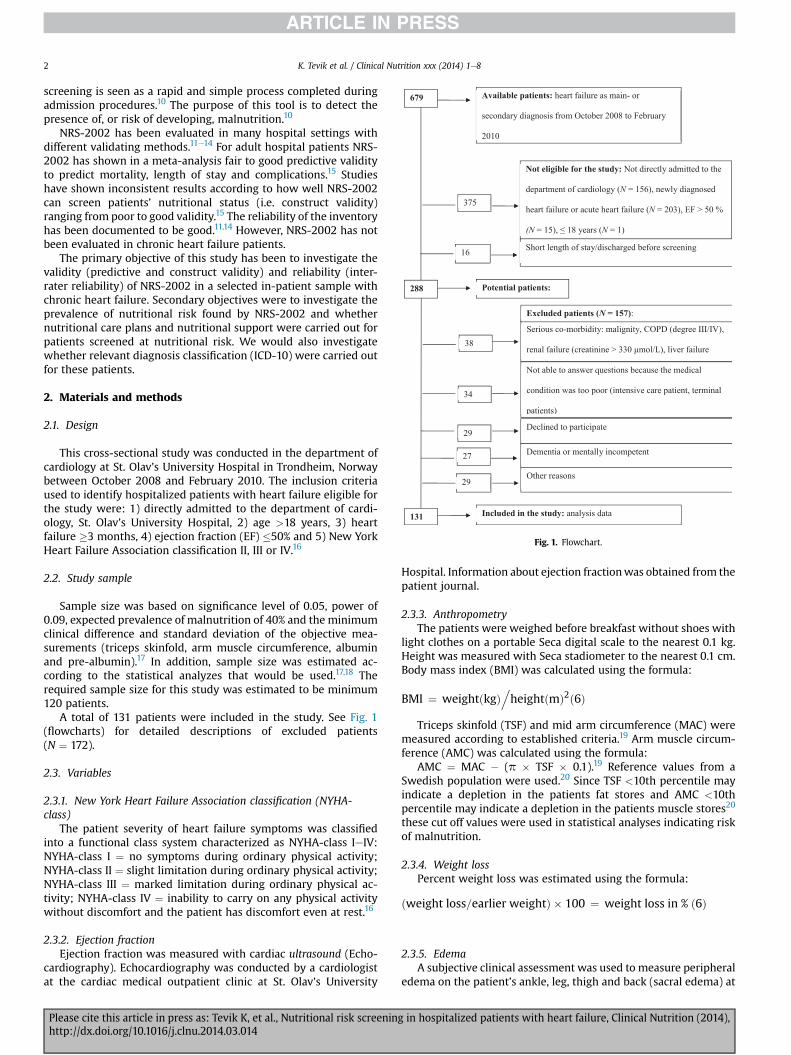
Fig. 1. Flowchart.
K. Tevik et al. / Clinical Nutrition xxx (2014) 1e82
screening is seen as a rapid and simple process completed duringadmission procedures.10 The purpose of this tool is to detect thepresence of, or risk of developing, malnutrition.10
NRS-2002 has been evaluated in many hospital settings withdifferent validating methods.11e14 For adult hospital patients NRS-2002 has shown in a meta-analysis fair to good predictive validityto predict mortality, length of stay and complications.15 Studieshave shown inconsistent results according to how well NRS-2002can screen patients’ nutritional status (i.e. construct validity)ranging from poor to good validity.15 The reliability of the inventoryhas been documented to be good.11,14 However, NRS-2002 has notbeen evaluated in chronic heart failure patients.
The primary objective of this study has been to investigate thevalidity (predictive and construct validity) and reliability (inter-rater reliability) of NRS-2002 in a selected in-patient sample withchronic heart failure. Secondary objectives were to investigate theprevalence of nutritional risk found by NRS-2002 and whethernutritional care plans and nutritional support were carried out forpatients screened at nutritional risk. We would also investigatewhether relevant diagnosis classification (ICD-10) were carried outfor these patients.
2. Materials and methods
2.1. Design
This cross-sectional study was conducted in the department ofcardiology at St. Olav’s University Hospital in Trondheim, Norwaybetween October 2008 and February 2010. The inclusion criteriaused to identify hospitalized patients with heart failure eligible forthe study were: 1) directly admitted to the department of cardi-ology, St. Olav’s University Hospital, 2) age >18 years, 3) heartfailure �3 months, 4) ejection fraction (EF) �50% and 5) New YorkHeart Failure Association classification II, III or IV.16
2.2. Study sample
Sample size was based on significance level of 0.05, power of0.09, expected prevalence of malnutrition of 40% and the minimumclinical difference and standard deviation of the objective mea-surements (triceps skinfold, arm muscle circumference, albuminand pre-albumin).17 In addition, sample size was estimated ac-cording to the statistical analyzes that would be used.17,18 Therequired sample size for this study was estimated to be minimum120 patients.
A total of 131 patients were included in the study. See Fig. 1(flowcharts) for detailed descriptions of excluded patients(N ¼ 172).
2.3. Variables
2.3.1. New York Heart Failure Association classification (NYHA-class)
The patient severity of heart failure symptoms was classifiedinto a functional class system characterized as NYHA-class IeIV:NYHA-class I ¼ no symptoms during ordinary physical activity;NYHA-class II ¼ slight limitation during ordinary physical activity;NYHA-class III ¼ marked limitation during ordinary physical ac-tivity; NYHA-class IV ¼ inability to carry on any physical activitywithout discomfort and the patient has discomfort even at rest.16
2.3.2. Ejection fractionEjection fraction was measured with cardiac ultrasound (Echo-
cardiography). Echocardiography was conducted by a cardiologistat the cardiac medical outpatient clinic at St. Olav’s University
Please cite this article in press as: Tevik K, et al., Nutritional risk screeninhttp://dx.doi.org/10.1016/j.clnu.2014.03.014
Hospital. Information about ejection fractionwas obtained from thepatient journal.
2.3.3. AnthropometryThe patients were weighed before breakfast without shoes with
light clothes on a portable Seca digital scale to the nearest 0.1 kg.Height was measured with Seca stadiometer to the nearest 0.1 cm.Body mass index (BMI) was calculated using the formula:
BMI ¼ weightðkgÞ.heightðmÞ2ð6Þ
Triceps skinfold (TSF) and mid arm circumference (MAC) weremeasured according to established criteria.19 Arm muscle circum-ference (AMC) was calculated using the formula:
AMC ¼ MAC � (p � TSF � 0.1).19 Reference values from aSwedish population were used.20 Since TSF <10th percentile mayindicate a depletion in the patients fat stores and AMC <10thpercentile may indicate a depletion in the patients muscle stores20
these cut off values were used in statistical analyses indicating riskof malnutrition.
2.3.4. Weight lossPercent weight loss was estimated using the formula:
ðweight loss=earlier weightÞ � 100 ¼ weight loss in % ð6Þ
2.3.5. EdemaA subjective clinical assessment was used to measure peripheral
edema on the patient’s ankle, leg, thigh and back (sacral edema) at
g in hospitalized patients with heart failure, Clinical Nutrition (2014),
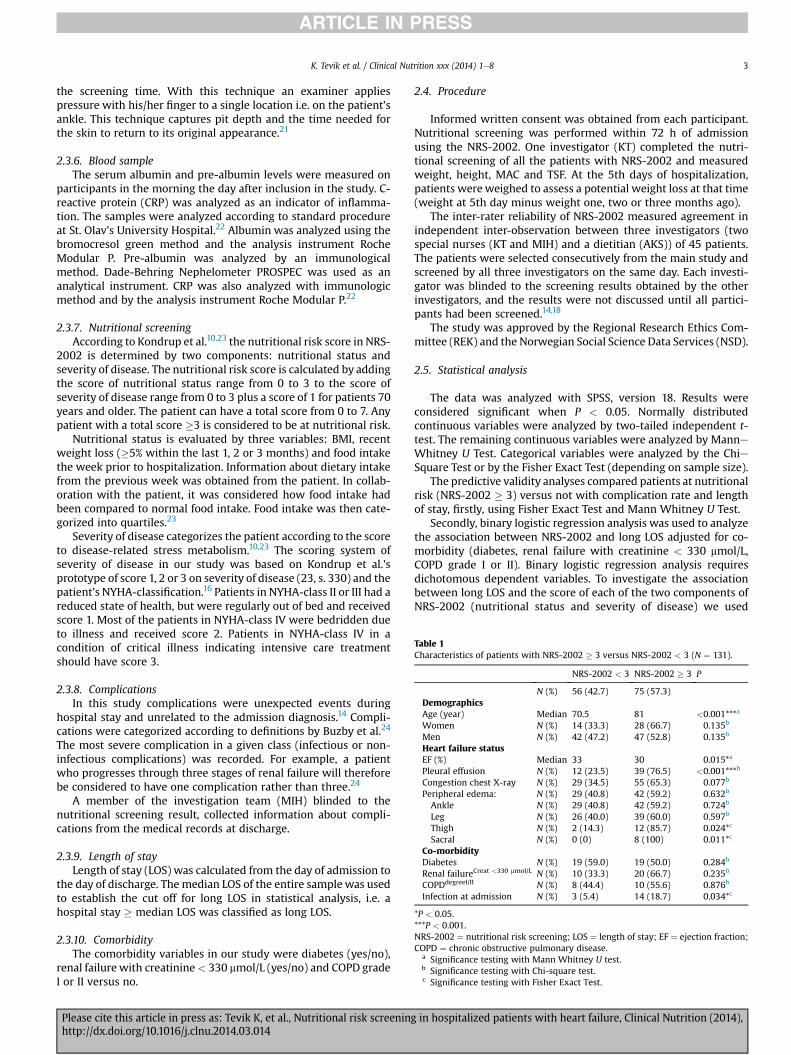
Table 1Characteristics of patients with NRS-2002 � 3 versus NRS-2002 < 3 (N ¼ 131).
NRS-2002 < 3 NRS-2002 � 3 P
N (%) 56 (42.7) 75 (57.3)DemographicsAge (year) Median 70.5 81 <0.001***a
Women N (%) 14 (33.3) 28 (66.7) 0.135b
Men N (%) 42 (47.2) 47 (52.8) 0.135b
Heart failure statusEF (%) Median 33 30 0.015*a
Pleural effusion N (%) 12 (23.5) 39 (76.5) <0.001***b
Congestion chest X-ray N (%) 29 (34.5) 55 (65.3) 0.077b
Peripheral edema: N (%) 29 (40.8) 42 (59.2) 0.632b
Ankle N (%) 29 (40.8) 42 (59.2) 0.724b
Leg N (%) 26 (40.0) 39 (60.0) 0.597b
Thigh N (%) 2 (14.3) 12 (85.7) 0.024*c
Sacral N (%) 0 (0) 8 (100) 0.011*c
Co-morbidityDiabetes N (%) 19 (59.0) 19 (50.0) 0.284b
Renal failureCreat <330 mmol/L N (%) 10 (33.3) 20 (66.7) 0.235b
COPDdegreeI/II N (%) 8 (44.4) 10 (55.6) 0.876b
Infection at admission N (%) 3 (5.4) 14 (18.7) 0.034*c
*P < 0.05.***P < 0.001.NRS-2002 ¼ nutritional risk screening; LOS ¼ length of stay; EF ¼ ejection fraction;COPD ¼ chronic obstructive pulmonary disease.
a Significance testing with Mann Whitney U test.b Significance testing with Chi-square test.c Significance testing with Fisher Exact Test.
K. Tevik et al. / Clinical Nutrition xxx (2014) 1e8 3
the screening time. With this technique an examiner appliespressure with his/her finger to a single location i.e. on the patient’sankle. This technique captures pit depth and the time needed forthe skin to return to its original appearance.21
2.3.6. Blood sampleThe serum albumin and pre-albumin levels were measured on
participants in the morning the day after inclusion in the study. C-reactive protein (CRP) was analyzed as an indicator of inflamma-tion. The samples were analyzed according to standard procedureat St. Olav’s University Hospital.22 Albumin was analyzed using thebromocresol green method and the analysis instrument RocheModular P. Pre-albumin was analyzed by an immunologicalmethod. Dade-Behring Nephelometer PROSPEC was used as ananalytical instrument. CRP was also analyzed with immunologicmethod and by the analysis instrument Roche Modular P.22
2.3.7. Nutritional screeningAccording to Kondrup et al.10,23 the nutritional risk score in NRS-
2002 is determined by two components: nutritional status andseverity of disease. The nutritional risk score is calculated by addingthe score of nutritional status range from 0 to 3 to the score ofseverity of disease range from 0 to 3 plus a score of 1 for patients 70years and older. The patient can have a total score from 0 to 7. Anypatient with a total score �3 is considered to be at nutritional risk.
Nutritional status is evaluated by three variables: BMI, recentweight loss (�5% within the last 1, 2 or 3 months) and food intakethe week prior to hospitalization. Information about dietary intakefrom the previous week was obtained from the patient. In collab-oration with the patient, it was considered how food intake hadbeen compared to normal food intake. Food intake was then cate-gorized into quartiles.23
Severity of disease categorizes the patient according to the scoreto disease-related stress metabolism.10,23 The scoring system ofseverity of disease in our study was based on Kondrup et al.’sprototype of score 1, 2 or 3 on severity of disease (23, s. 330) and thepatient’s NYHA-classification.16 Patients in NYHA-class II or III had areduced state of health, but were regularly out of bed and receivedscore 1. Most of the patients in NYHA-class IV were bedridden dueto illness and received score 2. Patients in NYHA-class IV in acondition of critical illness indicating intensive care treatmentshould have score 3.
2.3.8. ComplicationsIn this study complications were unexpected events during
hospital stay and unrelated to the admission diagnosis.14 Compli-cations were categorized according to definitions by Buzby et al.24
The most severe complication in a given class (infectious or non-infectious complications) was recorded. For example, a patientwho progresses through three stages of renal failure will thereforebe considered to have one complication rather than three.24
A member of the investigation team (MIH) blinded to thenutritional screening result, collected information about compli-cations from the medical records at discharge.
2.3.9. Length of stayLength of stay (LOS) was calculated from the day of admission to
the day of discharge. The median LOS of the entire sample was usedto establish the cut off for long LOS in statistical analysis, i.e. ahospital stay � median LOS was classified as long LOS.
2.3.10. ComorbidityThe comorbidity variables in our study were diabetes (yes/no),
renal failurewith creatinine< 330 mmol/L (yes/no) and COPD gradeI or II versus no.
Please cite this article in press as: Tevik K, et al., Nutritional risk screeninghttp://dx.doi.org/10.1016/j.clnu.2014.03.014
2.4. Procedure
Informed written consent was obtained from each participant.Nutritional screening was performed within 72 h of admissionusing the NRS-2002. One investigator (KT) completed the nutri-tional screening of all the patients with NRS-2002 and measuredweight, height, MAC and TSF. At the 5th days of hospitalization,patients wereweighed to assess a potential weight loss at that time(weight at 5th day minus weight one, two or three months ago).
The inter-rater reliability of NRS-2002 measured agreement inindependent inter-observation between three investigators (twospecial nurses (KT and MIH) and a dietitian (AKS)) of 45 patients.The patients were selected consecutively from the main study andscreened by all three investigators on the same day. Each investi-gator was blinded to the screening results obtained by the otherinvestigators, and the results were not discussed until all partici-pants had been screened.14,18
The study was approved by the Regional Research Ethics Com-mittee (REK) and the Norwegian Social Science Data Services (NSD).
2.5. Statistical analysis
The data was analyzed with SPSS, version 18. Results wereconsidered significant when P < 0.05. Normally distributedcontinuous variables were analyzed by two-tailed independent t-test. The remaining continuous variables were analyzed by ManneWhitney U Test. Categorical variables were analyzed by the ChieSquare Test or by the Fisher Exact Test (depending on sample size).
The predictive validity analyses compared patients at nutritionalrisk (NRS-2002 � 3) versus not with complication rate and lengthof stay, firstly, using Fisher Exact Test and Mann Whitney U Test.
Secondly, binary logistic regression analysis was used to analyzethe association between NRS-2002 and long LOS adjusted for co-morbidity (diabetes, renal failure with creatinine < 330 mmol/L,COPD grade I or II). Binary logistic regression analysis requiresdichotomous dependent variables. To investigate the associationbetween long LOS and the score of each of the two components ofNRS-2002 (nutritional status and severity of disease) we used
in hospitalized patients with heart failure, Clinical Nutrition (2014),
Table 2Relationship between NRS-2002, objective nutrition parameters and outcome variables.
Total NRS-2002 < 3 NRS-2002 � 3 P
N (%) 131 (100) 56 (42.7) 75 (57.3)BiochemicalAlbumin (g/L) Mean (SD) 37.0 (4.1) 38.8 (3.3) 35.6 (4.2) <0.0001***c
Pre-albumin (g/L) Mean (SD) 0.19 (0.06) 0.21 (0.56) 0.17 (0.62) <0.0001***c
CRP (mg/L) Median 16 9.5 26 <0.0001***d
AnthropometricTSF (mm) Mean (SD) 16.3 (7.7) 19.1 (8.2) 14.3 (6.7) <0.001***c
MAC (cm) Mean (SD) 30.3 (4.7) 32.7 (4.2) 28.4 (4.1) <0.0001***c
AMCa (cm) Mean (SD) 25.1 (3.4) 26.7 (3.1) 23.9 (3.1) <0.0001***c
Outcome variablesLOS Median 6 5 8 <0.001***d
Mortality rate N (%) 4 (3.1) 0 4 (100) 0.135e
Complications rateb N (%) 9 (6.9) 0 9 (100) 0.010*e
*P < 0.05.***P < 0.001.1 missing on albumin, pre-albumin, TSF, MAC and AMC.NRS-2002 ¼ nutritional risk screening; CRP ¼ C-reactive protein; TSF ¼ triceps skinfold; MAC ¼ mid arm circumference; AMC ¼ arm muscle circumference, LOS ¼ length ofstay.
a AMC ¼ MAC e (p � TSF � 0.1).b Complications were unexpected events during hospital stay and unrelated to the admission diagnosis.c Significance testing with Independent T-test.d Significance testing with Mann Whitney U Test.e Significance testing with Fisher Exact Test.
Table 3Incidence of complications (N ¼ 131).
Patients withcomplicationsa
Total number of patients with complications N 9Infectious complicationsa
Minor: Wound infection grade I N 1Moderate: Wound infection grade II N 1Major: Pneumonia N 3Non-infectious complicationsa
Minor: Renal failure grade III N 3Major: Decubitus N 1
a Severity of complications (infectious or non-infectious) graded as minor, mod-erate or major according to the study by Buzby et al.24
K. Tevik et al. / Clinical Nutrition xxx (2014) 1e84
binary logistic regression analysis adjusted for age, gender andobjective measurements of nutritional status (TSF, AMC, albumin).The variable age was dichotomized because there is not a linearrelationship between age and the outcome. Logistic regressionanalysis could not be used to investigate the association betweenNRS-2002, complication and mortality since all patients whodeveloped complications or died were at nutritional risk.
To assess if patients with edema were classified in a correctnutritional status the Fisher Exact Test was used. According toanalysis of 12 RCTs it is suggested that a MAC <25 cm correspondsto a BMI < 20.5.23 To patients with accumulation of fluid it wascarried out an assessment whether estimated BMI affected thescreening score of NRS-2002.
The construct validity analyses compared NRS-2002 to meanvalues of anthropometric (MAC, TSF and AMC) and biochemical(albumin and pre-albumin) parameters using two tailed indepen-dent t-test.
The kappa (l) statistic was used to measure inter-rater reli-ability18 and the results were interpreted using Shrout’sclassification.18,25
3. Results
3.1. Characteristics of the study sample
Of the 131 patients included in the analysis, the median age was78 years (range 37e95 years) and 42 (32.1%) patients were women.Median LOS was 6 days (range 1e33 days). Sixteen % of the patientswere classified in NYHA-class II, 64.1% in NYHA-class III and 19.9%in NYHA-class IV. In all, 71 of 131 (54.2%) patients had peripheraledema at the screening time, and chest x-ray indicated congestionand pleural effusion in 84 (64.1%) and 51 (38.9%) of 131 patients,respectively.
Excluded patients (N¼ 172) were older (median 82 years versus78 years, P < 0.05) and had higher in-hospital mortality (12.8%versus 3.1%, P < 0.01). There was no significant difference in LOS.
3.2. Prevalence and characteristics of patients at nutritional risk
According to NRS-2002, the prevalence of nutritional risk(score � 3) was 57.3% (75 of 131 patients). Table 1 shows the
Please cite this article in press as: Tevik K, et al., Nutritional risk screeninhttp://dx.doi.org/10.1016/j.clnu.2014.03.014
characteristics for at-risk patients (NRS-2002 � 3) and non-riskpatients (NRS-2002 < 3) at screening time.
3.3. Validity and reliability of NRS-2002
The incidence of complications (12.0% versus 0.0%, P ¼ 0.01)(Table 2) was significantly higher in patients at nutritional riskcompared with patients not at nutritional risk. See Table 3 forspecifications of infectious and non-infectious complications.
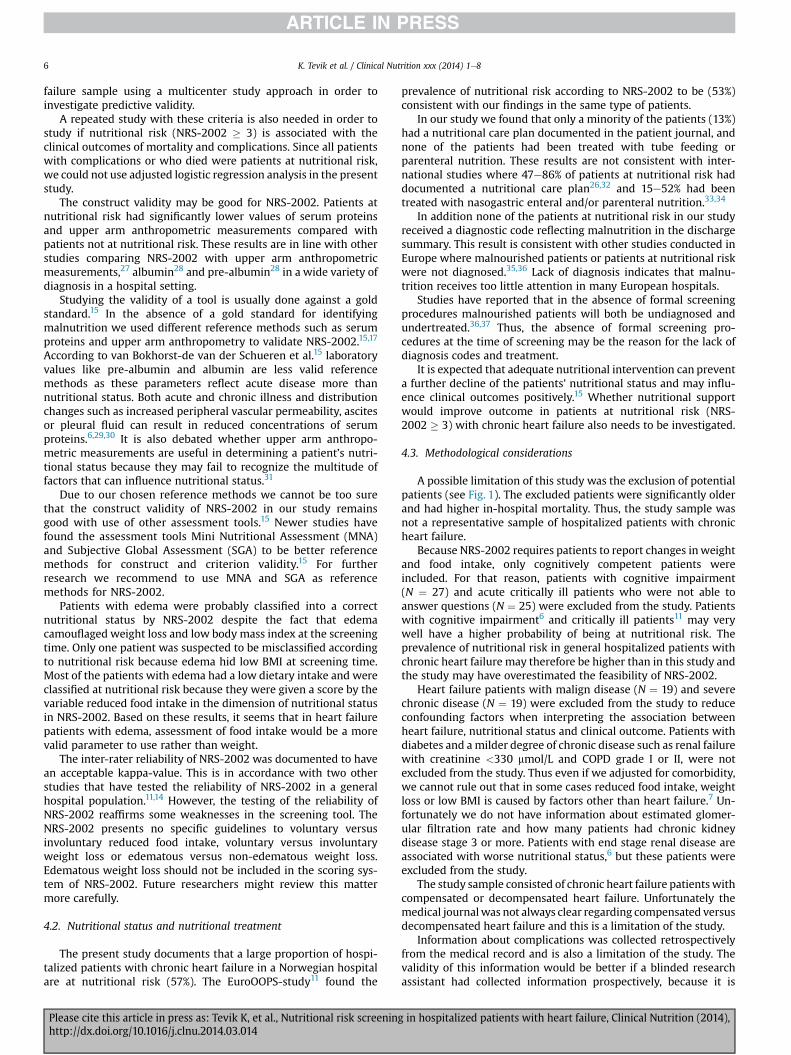
In unadjusted analysis and adjusted analysis, NRS-2002 had apredictive value for long LOS (LOS � median 6 days). In analysisadjusted for age, gender and several co-morbidity variables, theodds for long LOS were almost three fold higher in patients withNRS-2002 � 3 (OR 2.99; 95% CI 1.33e6.73). The association be-tween long LOS and the score of each of the two components ofNRS-2002 (nutritional status and severity of disease) was studied inlogistic analysis adjusted for age, gender and objective measure-ments of nutritional status (TSF, AMC, albumin) (Table 4). Theanalysis showed that the component of severity of disease (NYHA-class IV) was a predictor of LOS � 6 days (OR 11.11; 95% CI 2.40e51.43), while the component of nutritional status in NRS-2002 wasnot associated with a long LOS in adjusted logistic regressionanalyses.
Assessment of the patient’s weight at the 5th day of hospitali-zation showed that edema influenced the assessment of recentweight loss or BMI in 5 patients. The nutritional risk (NRS-
g in hospitalized patients with heart failure, Clinical Nutrition (2014),
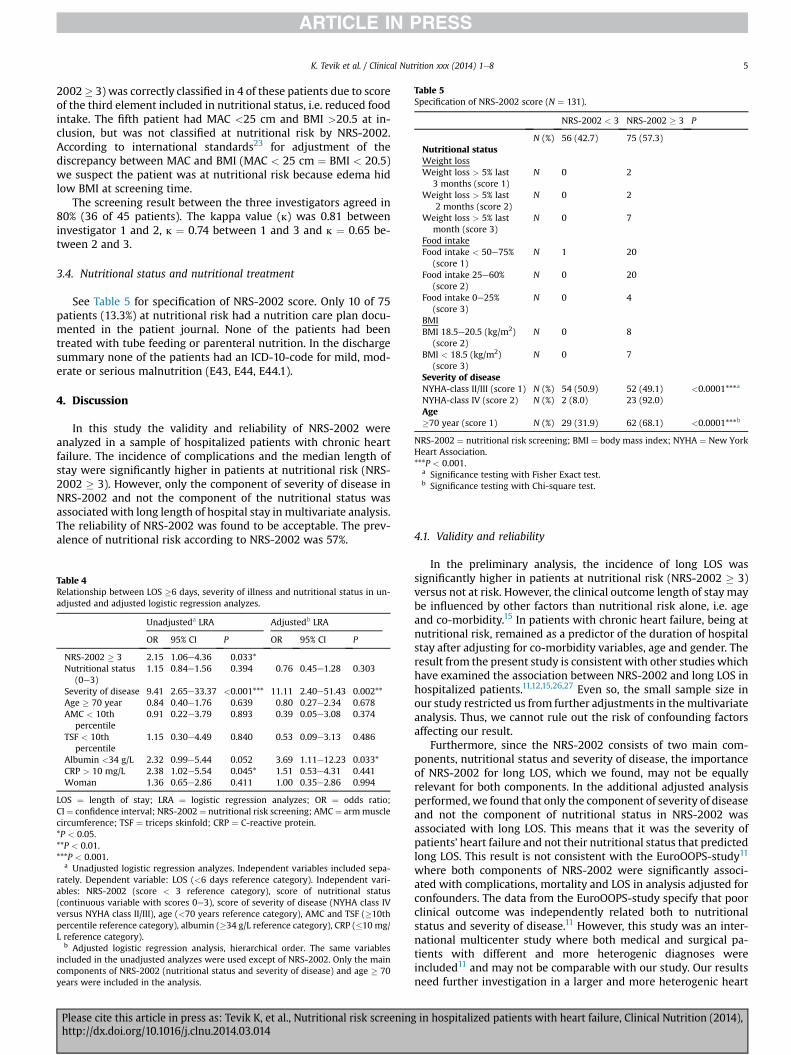
Table 5Specification of NRS-2002 score (N ¼ 131).
NRS-2002 < 3 NRS-2002 � 3 P
N (%) 56 (42.7) 75 (57.3)Nutritional statusWeight lossWeight loss > 5% last
3 months (score 1)N 0 2
Weight loss > 5% last2 months (score 2)
N 0 2
Weight loss > 5% lastmonth (score 3)
N 0 7
Food intakeFood intake < 50e75%
(score 1)N 1 20
Food intake 25e60%(score 2)
N 0 20
Food intake 0e25%(score 3)
N 0 4
BMIBMI 18.5e20.5 (kg/m2)
(score 2)N 0 8
BMI < 18.5 (kg/m2)(score 3)
N 0 7
Severity of diseaseNYHA-class II/III (score 1) N (%) 54 (50.9) 52 (49.1) <0.0001***a
NYHA-class IV (score 2) N (%) 2 (8.0) 23 (92.0)Age�70 year (score 1) N (%) 29 (31.9) 62 (68.1) <0.0001***b
NRS-2002 ¼ nutritional risk screening; BMI ¼ body mass index; NYHA ¼ New YorkHeart Association.***P < 0.001.
a Significance testing with Fisher Exact test.b Significance testing with Chi-square test.
K. Tevik et al. / Clinical Nutrition xxx (2014) 1e8 5
2002� 3) was correctly classified in 4 of these patients due to scoreof the third element included in nutritional status, i.e. reduced foodintake. The fifth patient had MAC <25 cm and BMI >20.5 at in-clusion, but was not classified at nutritional risk by NRS-2002.According to international standards23 for adjustment of thediscrepancy between MAC and BMI (MAC < 25 cm ¼ BMI < 20.5)we suspect the patient was at nutritional risk because edema hidlow BMI at screening time.
The screening result between the three investigators agreed in80% (36 of 45 patients). The kappa value (l) was 0.81 betweeninvestigator 1 and 2, l ¼ 0.74 between 1 and 3 and l ¼ 0.65 be-tween 2 and 3.
3.4. Nutritional status and nutritional treatment
See Table 5 for specification of NRS-2002 score. Only 10 of 75patients (13.3%) at nutritional risk had a nutrition care plan docu-mented in the patient journal. None of the patients had beentreated with tube feeding or parenteral nutrition. In the dischargesummary none of the patients had an ICD-10-code for mild, mod-erate or serious malnutrition (E43, E44, E44.1).
4. Discussion
In this study the validity and reliability of NRS-2002 wereanalyzed in a sample of hospitalized patients with chronic heartfailure. The incidence of complications and the median length ofstay were significantly higher in patients at nutritional risk (NRS-2002 � 3). However, only the component of severity of disease inNRS-2002 and not the component of the nutritional status wasassociated with long length of hospital stay in multivariate analysis.The reliability of NRS-2002 was found to be acceptable. The prev-alence of nutritional risk according to NRS-2002 was 57%.
Table 4Relationship between LOS �6 days, severity of illness and nutritional status in un-adjusted and adjusted logistic regression analyzes.
Unadjusteda LRA Adjustedb LRA
OR 95% CI P OR 95% CI P
NRS-2002 � 3 2.15 1.06e4.36 0.033*Nutritional status
(0e3)1.15 0.84e1.56 0.394 0.76 0.45e1.28 0.303
Severity of disease 9.41 2.65e33.37 <0.001*** 11.11 2.40e51.43 0.002**Age � 70 year 0.84 0.40e1.76 0.639 0.80 0.27e2.34 0.678AMC < 10th
percentile0.91 0.22e3.79 0.893 0.39 0.05e3.08 0.374
TSF < 10thpercentile
1.15 0.30e4.49 0.840 0.53 0.09e3.13 0.486
Albumin <34 g/L 2.32 0.99e5.44 0.052 3.69 1.11e12.23 0.033*CRP > 10 mg/L 2.38 1.02e5.54 0.045* 1.51 0.53e4.31 0.441Woman 1.36 0.65e2.86 0.411 1.00 0.35e2.86 0.994
LOS ¼ length of stay; LRA ¼ logistic regression analyzes; OR ¼ odds ratio;CI¼ confidence interval; NRS-2002 ¼ nutritional risk screening; AMC¼ armmusclecircumference; TSF ¼ triceps skinfold; CRP ¼ C-reactive protein.*P < 0.05.**P < 0.01.***P < 0.001.
a Unadjusted logistic regression analyzes. Independent variables included sepa-rately. Dependent variable: LOS (<6 days reference category). Independent vari-ables: NRS-2002 (score < 3 reference category), score of nutritional status(continuous variable with scores 0e3), score of severity of disease (NYHA class IVversus NYHA class II/III), age (<70 years reference category), AMC and TSF (�10thpercentile reference category), albumin (�34 g/L reference category), CRP (�10 mg/L reference category).
b Adjusted logistic regression analysis, hierarchical order. The same variablesincluded in the unadjusted analyzes were used except of NRS-2002. Only the maincomponents of NRS-2002 (nutritional status and severity of disease) and age � 70years were included in the analysis.
Please cite this article in press as: Tevik K, et al., Nutritional risk screeninghttp://dx.doi.org/10.1016/j.clnu.2014.03.014
4.1. Validity and reliability
In the preliminary analysis, the incidence of long LOS wassignificantly higher in patients at nutritional risk (NRS-2002 � 3)versus not at risk. However, the clinical outcome length of stay maybe influenced by other factors than nutritional risk alone, i.e. ageand co-morbidity.15 In patients with chronic heart failure, being atnutritional risk, remained as a predictor of the duration of hospitalstay after adjusting for co-morbidity variables, age and gender. Theresult from the present study is consistent with other studies whichhave examined the association between NRS-2002 and long LOS inhospitalized patients.11,12,15,26,27 Even so, the small sample size inour study restricted us from further adjustments in themultivariateanalysis. Thus, we cannot rule out the risk of confounding factorsaffecting our result.
Furthermore, since the NRS-2002 consists of two main com-ponents, nutritional status and severity of disease, the importanceof NRS-2002 for long LOS, which we found, may not be equallyrelevant for both components. In the additional adjusted analysisperformed, we found that only the component of severity of diseaseand not the component of nutritional status in NRS-2002 wasassociated with long LOS. This means that it was the severity ofpatients’ heart failure and not their nutritional status that predictedlong LOS. This result is not consistent with the EuroOOPS-study11
where both components of NRS-2002 were significantly associ-ated with complications, mortality and LOS in analysis adjusted forconfounders. The data from the EuroOOPS-study specify that poorclinical outcome was independently related both to nutritionalstatus and severity of disease.11 However, this study was an inter-national multicenter study where both medical and surgical pa-tients with different and more heterogenic diagnoses wereincluded11 and may not be comparable with our study. Our resultsneed further investigation in a larger and more heterogenic heart
in hospitalized patients with heart failure, Clinical Nutrition (2014),
K. Tevik et al. / Clinical Nutrition xxx (2014) 1e86
failure sample using a multicenter study approach in order toinvestigate predictive validity.
A repeated study with these criteria is also needed in order tostudy if nutritional risk (NRS-2002 � 3) is associated with theclinical outcomes of mortality and complications. Since all patientswith complications or who died were patients at nutritional risk,we could not use adjusted logistic regression analysis in the presentstudy.
The construct validity may be good for NRS-2002. Patients atnutritional risk had significantly lower values of serum proteinsand upper arm anthropometric measurements compared withpatients not at nutritional risk. These results are in line with otherstudies comparing NRS-2002 with upper arm anthropometricmeasurements,27 albumin28 and pre-albumin28 in a wide variety ofdiagnosis in a hospital setting.
Studying the validity of a tool is usually done against a goldstandard.15 In the absence of a gold standard for identifyingmalnutrition we used different reference methods such as serumproteins and upper arm anthropometry to validate NRS-2002.15,17
According to van Bokhorst-de van der Schueren et al.15 laboratoryvalues like pre-albumin and albumin are less valid referencemethods as these parameters reflect acute disease more thannutritional status. Both acute and chronic illness and distributionchanges such as increased peripheral vascular permeability, ascitesor pleural fluid can result in reduced concentrations of serumproteins.6,29,30 It is also debated whether upper arm anthropo-metric measurements are useful in determining a patient’s nutri-tional status because they may fail to recognize the multitude offactors that can influence nutritional status.31
Due to our chosen reference methods we cannot be too surethat the construct validity of NRS-2002 in our study remainsgood with use of other assessment tools.15 Newer studies havefound the assessment tools Mini Nutritional Assessment (MNA)and Subjective Global Assessment (SGA) to be better referencemethods for construct and criterion validity.15 For furtherresearch we recommend to use MNA and SGA as referencemethods for NRS-2002.
Patients with edema were probably classified into a correctnutritional status by NRS-2002 despite the fact that edemacamouflaged weight loss and low body mass index at the screeningtime. Only one patient was suspected to be misclassified accordingto nutritional risk because edema hid low BMI at screening time.Most of the patients with edema had a low dietary intake and wereclassified at nutritional risk because they were given a score by thevariable reduced food intake in the dimension of nutritional statusin NRS-2002. Based on these results, it seems that in heart failurepatients with edema, assessment of food intake would be a morevalid parameter to use rather than weight.
The inter-rater reliability of NRS-2002 was documented to havean acceptable kappa-value. This is in accordance with two otherstudies that have tested the reliability of NRS-2002 in a generalhospital population.11,14 However, the testing of the reliability ofNRS-2002 reaffirms some weaknesses in the screening tool. TheNRS-2002 presents no specific guidelines to voluntary versusinvoluntary reduced food intake, voluntary versus involuntaryweight loss or edematous versus non-edematous weight loss.Edematous weight loss should not be included in the scoring sys-tem of NRS-2002. Future researchers might review this mattermore carefully.
4.2. Nutritional status and nutritional treatment
The present study documents that a large proportion of hospi-talized patients with chronic heart failure in a Norwegian hospitalare at nutritional risk (57%). The EuroOOPS-study11 found the
Please cite this article in press as: Tevik K, et al., Nutritional risk screeninhttp://dx.doi.org/10.1016/j.clnu.2014.03.014
prevalence of nutritional risk according to NRS-2002 to be (53%)consistent with our findings in the same type of patients.
In our study we found that only a minority of the patients (13%)had a nutritional care plan documented in the patient journal, andnone of the patients had been treated with tube feeding orparenteral nutrition. These results are not consistent with inter-national studies where 47e86% of patients at nutritional risk haddocumented a nutritional care plan26,32 and 15e52% had beentreated with nasogastric enteral and/or parenteral nutrition.33,34
In addition none of the patients at nutritional risk in our studyreceived a diagnostic code reflecting malnutrition in the dischargesummary. This result is consistent with other studies conducted inEurope where malnourished patients or patients at nutritional riskwere not diagnosed.35,36 Lack of diagnosis indicates that malnu-trition receives too little attention in many European hospitals.
Studies have reported that in the absence of formal screeningprocedures malnourished patients will both be undiagnosed andundertreated.36,37 Thus, the absence of formal screening pro-cedures at the time of screening may be the reason for the lack ofdiagnosis codes and treatment.
It is expected that adequate nutritional intervention can preventa further decline of the patients’ nutritional status and may influ-ence clinical outcomes positively.15 Whether nutritional supportwould improve outcome in patients at nutritional risk (NRS-2002 � 3) with chronic heart failure also needs to be investigated.
4.3. Methodological considerations
A possible limitation of this study was the exclusion of potentialpatients (see Fig. 1). The excluded patients were significantly olderand had higher in-hospital mortality. Thus, the study sample wasnot a representative sample of hospitalized patients with chronicheart failure.
Because NRS-2002 requires patients to report changes inweightand food intake, only cognitively competent patients wereincluded. For that reason, patients with cognitive impairment(N ¼ 27) and acute critically ill patients who were not able toanswer questions (N ¼ 25) were excluded from the study. Patientswith cognitive impairment6 and critically ill patients11 may verywell have a higher probability of being at nutritional risk. Theprevalence of nutritional risk in general hospitalized patients withchronic heart failure may therefore be higher than in this study andthe study may have overestimated the feasibility of NRS-2002.
Heart failure patients with malign disease (N ¼ 19) and severechronic disease (N ¼ 19) were excluded from the study to reduceconfounding factors when interpreting the association betweenheart failure, nutritional status and clinical outcome. Patients withdiabetes and amilder degree of chronic disease such as renal failurewith creatinine <330 mmol/L and COPD grade I or II, were notexcluded from the study. Thus even if we adjusted for comorbidity,we cannot rule out that in some cases reduced food intake, weightloss or low BMI is caused by factors other than heart failure.7 Un-fortunately we do not have information about estimated glomer-ular filtration rate and how many patients had chronic kidneydisease stage 3 or more. Patients with end stage renal disease areassociated with worse nutritional status,6 but these patients wereexcluded from the study.
The study sample consisted of chronic heart failure patientswithcompensated or decompensated heart failure. Unfortunately themedical journalwas not always clear regarding compensated versusdecompensated heart failure and this is a limitation of the study.
Information about complications was collected retrospectivelyfrom the medical record and is also a limitation of the study. Thevalidity of this information would be better if a blinded researchassistant had collected information prospectively, because it is
g in hospitalized patients with heart failure, Clinical Nutrition (2014),
K. Tevik et al. / Clinical Nutrition xxx (2014) 1e8 7
possible that not all complications were noted in the patient record,although this is normally done according to the hospital procedure.
The patients’ score on severity of disease in NRS-2002 in thisstudy was based on the NYHA-classification16 and a prototype forseverity of disease drafted by Kondrup et al.23 Unfortunately thisscoring system is not validated in patients with heart failure, andneeds further investigation.
5. Conclusion
NRS-2002 was a reliable screening tool in an in-patient samplewith chronic heart failure. However, NRS-2002 needs validation inlarger samples of hospitalized patients with chronic heart failureusing better reference methods, like MNA and SGA, to investigatehow well NRS-2002 can identify the patients’ nutritional status. Inour study only the component of severity of disease in NRS-2002was associated with long LOS in adjusted analysis. Most of thepatients with edema were classified in a correct nutritional statusby NRS-2002.
Furthermore, this study confirms the high prevalence of nutri-tional risk (57%) in hospitalized patients with chronic heart failure,and finds lack of nutritional treatment plans and absence of rele-vant diagnosis classification (ICD-10) in patients classified atnutritional risk by NRS-2002.
Statement of authorship
KT carried out the study and data analyses and drafted themanuscript. HT gave statistical advice and drafted the manuscript.MIH participated in the data collection and helped to draft themanuscript. AKS participated in the data collection and helped todraft the manuscript. ASH participated in the study design, gavestatistical advice and drafted the manuscript. All authors have readand approved the final manuscript.
Sources of funding
This study received financial support from St. Olav’s UniversityHospital, Norway.
Conflict of interest statement
There is no financial conflict of interest for any of the authors.
Acknowledgments
Thanks to the clinic manager, Dr. Med, Rune Wiseth, Dr. Med,Johannes Soma and head of nursing, Gunn Husby at the Depart-ment of cardiology, St. Olav’s University Hospital for valuable adviceand support. We also want to thank Anita Stordal, Ingegerd Iversen,nurses and doctors at the department of cardiology for help withthe data collection. Thanks also to Mariana Härmälä, GustavØsterberg Øverli, Brenda Strand and Ph.d, Lene Thoresen at St.Olav’s University Hospital.
References
1. McMurray JJ. ESC Guidelines for the diagnosis and treatment of acute andchronic heart failure 2012. The Task Force for the Diagnosis and Treatment ofAcute and Chronic Heart Failure 2012 of the European Society of Cardiology.Developed in collaboration with the Heart Failure Association. Eur Heart J2012;33:1787e847.
2. Stewart S, MacIntyre K, Hole DJ, Copewell S, McMurray JJ. More ‘malignant’than cancer? Five-year survival following a first admission for heart failure. EurHeart J 2001;3:315e22.
3. Bonilla-Palomas JL, Gàmez-Lòpez AL, Anguita-Sànchez MP, Castillo-Dominguez JC, Garcia-Fuertes D, Crespin-Crespin M, et al. Impact of
Please cite this article in press as: Tevik K, et al., Nutritional risk screeninghttp://dx.doi.org/10.1016/j.clnu.2014.03.014
malnutrition on long-term mortality in hospitalized patients with heart failure.Rev Esp Cardiol 2011;64:752e8.
4. Narumi T, Arimoto T, Funayama A, Kadowaki S, Otaki Y, Nishiyama S, et al. Theprognostic importance of objective nutritional indexes in patients with chronicheart failure. J Cardiol 2013;62(5):307e13.
5. Aziz EF, Javed F, Pratap B, Musat D, Nader A, Pulimi S, et al. Malnutrition asassessed by nutritional risk index is associated with worse outcome in patientsadmitted with acute decompensated heart failure: an ACAP-HF data analysis.Heart Int 2011;6(1):e2.
6. Stratton RJ, Green CJ, Elia M. Disease-related malnutrition: an evidence-basedapproach to treatment. Cambridge: CABI; 2003.
7. Anker SD, Negassa A, Coats AJ, Afzal R, Poole-Wilson PA, Cohn JN, et al. Prog-nostic importance of weight loss in chronic heart failure and the effect oftreatment with angiotensin-converting-enzyme inhibitors: an observationalstudy. Lancet 2003;361(9363):1077e83.
8. Otaki M. Surgical treatment of patients with cardiac cachexia. An analysis offactors affecting operative mortality. Chest 1993;105:1347e51.
9. Rozentryt P, von Haehling S, Lainscak M, Nowak JU, Kalantar-Zadeh K,Polonski L, et al. The effects of a high-caloric protein-rich oral nutritionalsupplement in patients with chronic heart failure and cachexia on quality oflife, body composition, and inflammation markers: a randomized, double-blindpilot study. J Cachex Sarcopenia Muscle 2010;1(1):35e42.
10. Kondrup J, Allison SP, Elia M, Vellas B, Plauth M. ESPEN guidelines for nutritionscreening 2002. Clin Nutr 2003;22:415e21.
11. Sorensen J, Kondrup J, Prokopowicz J, Schiesser M, Krahenbuhl L, Meier R, et al.,EuroOOPS Study Group. EuroOOPS: an international, multicentre study toimplement nutritional risk screening and evaluate clinical outcome. Clin Nutr2008;27:340e9.
12. Tangvik RJ, Tell GS, Eisman JA, Guttormsen AB, Henriksen A, Nilsen RM, et al.The nutritional strategy: four questions predict morbidity, mortality and healthcare costs. Clin Nutr; 2013:1e8 [in press].
13. Young AM, Kidston S, Banks MD, Mudge AM, Isenring EA. Malnutritionscreening tools: comparison against two validated nutrition assessmentmethods in older medical inpatients. Nutrition 2013;29:101e6.
14. Johansen N, Kondrup J, Plum LM, Bak L, Norregaard P, Bunch E, et al. Effect ofnutritional support on clinical outcome in patients at nutritional risk. Clin Nutr2004;23:539e50.
15. Von Bokhorst-de van der Schueren MAE, Guaitoli PR, Jansma EP, Henrica CW.Meta-analyses. Nutrition screening tools: does one size fit all? A systematic re-view of screening tools for the hospital setting. Clin Nutr; 2013:1e8 [in press].
16. The Criteria Committee of the New York Heart Association. Diseases of the heartand blood vessels; nomenclature and criteria for diagnosis. 9th ed. Boston: LittleBrown; 1994.
17. Jones MJ. Nutritional methodology. Validity of nutritional screening andassessment tools. Nutrition 2004;20:312e7.
18. Jones MJ. Nutritional methodology. Reliability of nutritional screening andassessment tools. Nutrition 2004;20:307e11.
19. Jelliffe DB. The assessment of the nutritional status of the community. Geneve:World Health Organization; 1966.
20. Symreng T. Arm anthropometry in a large reference population and in surgicalpatients. Clin Nutr 1982;1(3):211e9.
21. Brodovicz KG, McNaughton K, Uemura N, Meininger G, Girman CJ, Yale SH.Reliability and feasibility of methods to quantitatively assess peripheral edema.Clin Med Res 2009;7(1e2):21e31.
22. St. Olav’s University Hospital in Trondheim, Norway. Department of MedicalBiochemistry. Analyses and surveys. [accessed 18.02.14, at http://www.stolav.no/no/Om-oss/Avdelinger/Medisinsk-biokjemi/Fagfolk/].
23. Kondrup J, Rasmussen HH, Hamberg O, Stanga Z. Nutritional risk screening(NRS 2002): a newmethod based on an analysis of controlled clinical trials. ClinNutr 2003;22:321e36.
24. Buzby GP, Knox LS, Crosby LO, Eisenberg JM, Haakenson CM, McNeal GE, et al.Study protocol: a randomized clinical trial of total parenteral nutrition inmalnourished surgical patients. Am J Clin Nutr 1988;47(Suppl. 2):366e81.
25. Shrout PE. Measurement reliability and agreement in psychiatry. Stat MethodsMed Res 1998;7:301e17.
26. Kondrup J, Johansen N, Plum LM, Bak L, Larsen IH, Martinsen A, et al. Incidenceof nutritional risk and causes of inadequate nutritional care in hospitals. ClinNutr 2002;21:461e8.
27. Amaral TF, Antunes A, Cabral S, Alves P, Kent-Smith L. An evaluation of threenutritional screening tools in a Portuguese oncology centre. J Hum Nutr Diet2008;21:575e83.
28. Cereda E, Pedrolli C, Lucchin L, D’Amicis A, Gentile MG, Battistini NC, et al.,PIMAI Group. Fluid intake and nutritional risk in non-critically ill patients athospital referral. Br J Nutr 2010;104:878e85.
29. Fleck A, Raines G, Hawker F, Trotter J, Wallace PI, Ledingham IM, et al.Increased vascular permeability: a major cause of hypoalbuminaemia in dis-ease and injury. Lancet 1985;6:781e4.
30. Johnson AM, Merlini G, Sheldon J, Ichihara K. Clinical indications for plasmaprotein assays: transthyretin (prealbumin) on inflammation and malnutrition.Clin Chem Lab Med 2007;45:419e26.
31. Sungurtekin H, Sungurtekin U, Oner O, Okke D. Nutrition assessment in criti-cally ill patients. Nutr Clin Pract 2009;23:635e41.
32. Rasmussen HH, Kondrup J, Staun M, Ladefoged K, Lindorff K, Jorgensen LM,et al. A method for implementation of nutritional therapy in hospitals. Clin Nutr2006;25:515e23.
in hospitalized patients with heart failure, Clinical Nutrition (2014),
K. Tevik et al. / Clinical Nutrition xxx (2014) 1e88
33. Liang X, Jiang ZM, Nolan MT, Efron DT, Kondrup J. Comparative survey onnutritional risk and nutritional support between Beijing and Baltimore teach-ing hospitals. Nutrition 2008;24:969e76.
34. Korfali G, Gundogdu H, Aydintug S, Bahar M, Besler T, Moral AR, et al. Nutri-tional risk of hospitalized patients in Turkey. Clin Nutr 2009;28:533e7.
35. Amaral TF, Matos LC, Tavares MM, Subtil A, Martins R, Nazare M, et al. Theeconomic impact of disease-related malnutrition at hospital admission. ClinNutr 2007;26:778e84.
Please cite this article in press as: Tevik K, et al., Nutritional risk screeninhttp://dx.doi.org/10.1016/j.clnu.2014.03.014
36. Mowe M, Bohmer T. The prevalence of undiagnosed protein-calorie under-nutrition in a population of hospitalized elderly patients. J Am Geriatr Soc1991;39:1089e92.
37. Kelly IE, Tessier S, Cahill A, Morris SE, Crumley A, McLaughlin D, et al. Stillhungry in hospital: identifying malnutrition in acute hospital admissions. QJM2000;93:93e8.
g in hospitalized patients with heart failure, Clinical Nutrition (2014),