Nutrients, standing crop and primary production in western coastal waters of the adriatic sea
21
Estuarine, Coastal and Shelf Science (1995) 41,493-513 Nutrients, Standing Crop and primary Production in Western Coastal Waters of the Adriatic Sea A. Zoppini a, M. Pettine ~, C. Totti b, A. Puddu ~, A. Artegiani b and R. Pagnotta ~ alstituto Ricerca sulle Acque, CNR, via Reno I, Rome 00198, Italy and bIstituto di Ricerche per la Pesca Marittima, CNR, Molo Mandracchio, Ancona, Italy Received 15 February 1994 and in revised form 13 September 1994 Keywords: nutrients; phytoplankton; primary production; Adriatic Nutrients and standing crop over a 2-year period and primary production rates over a 1-year period were measured at three stations located 1-5, 6 and 15 nautical miles (NM) from the coast, 150 km south of the Po river mouth. Both nutrients and standing crop (the latter measured as chlorophyll a concentration and phytoplankton cell density) showed a concentration gradient from west to east with marked changes of average values from 6 to 15 NM off the coast. Nutrients and standing crop appeared to be positively correlated and both showed an inverse dependence on salinity which was mainly influenced by freshwater inputs from the major Italian river, the Po. Primary production rates showed values of about 260 and 210 g C m- e year- l at the 1-5 and 6 NM stations respectively, indicating the presence of a narrow coastal belt with productivity levels significantly higher than those previously reported for other Adriatic areas affected by the Po. The offshore station at 15 NM gave an average annual production of about 120 g C m- 2 year- l which lies in the range reported for lagoons and coastal waters in the Po delta area. The photosynthetic efficiency was similar at the 1 '5 and 6 NM stations (respectively 4-04-2-3 and 3.54-2.7) but significantly lower at the 15NM station (1-9 4- 1 '7). This difference reflects either different nutrient levels in inshore and offshore stations or different structures in phytoplankton community: diatoms and phytoflagellates prevailed at 1 "5 and 15 NM, respectively. Photo- synthetic efficiency increased with increasing concentration of nutrients. The behaviour was found to be linear as a function of total dissolved phosphorus, and hyperbolic as a function of total dissolved nitrogen. This different depend- ence suggests a surplus of nitrogen with respect to phosphorus for photo- synthetic processes in the study area, which is consistent with the assumption of phosphorus as limiting element often made for the northern Adriatic. © 1995 Academic Press Limited Introduction The Adriatic sea accounts for a small percentage (~ 5%) of the entire area of the Mediterranean, but receives in its shallow northern part (<14% of the total Adriatic area) significant freshwater inputs which markedly increase its productivity over the 0272-7714/95/050493+21 $12.00/0 © 1995 Academic Press Limited
-
Upload
independent -
Category
Documents
-
view
2 -
download
0
Transcript of Nutrients, standing crop and primary production in western coastal waters of the adriatic sea

Estuarine, Coastal and Shelf Science (1995) 4 1 , 4 9 3 - 5 1 3
Nutrients, Standing Crop and primary Production in Western Coastal Waters of the Adriatic Sea
A. Zopp in i a, M. P e t t i n e ~, C. Tot t i b, A. P u d d u ~, A. A r t e g i a n i b and R. P a g n o t t a ~
alstituto Ricerca sulle Acque, CNR, via Reno I, Rome 00198, Italy and bIstituto di Ricerche per la Pesca Marittima, CNR, Molo Mandracchio, Ancona, Italy
Received 15 February 1994 and in revised form 13 September 1994
Keywords: nutrients; phytoplankton; primary production; Adriatic
Nutrients and standing crop over a 2-year period and primary production rates over a 1-year period were measured at three stations located 1-5, 6 and 15 nautical miles (NM) from the coast, 150 km south of the Po river mouth. Both nutrients and standing crop (the latter measured as chlorophyll a concentration and phytoplankton cell density) showed a concentration gradient from west to east with marked changes of average values from 6 to 15 N M off the coast. Nutrients and standing crop appeared to be positively correlated and both showed an inverse dependence on salinity which was mainly influenced by freshwater inputs from the major Italian river, the Po. Primary production rates showed values of about 260 and 210 g C m - e year - l at the 1-5 and 6 N M stations respectively, indicating the presence of a narrow coastal belt with productivity levels significantly higher than those previously reported for other Adriatic areas affected by the Po. The offshore station at 15 N M gave an average annual production of about 120 g C m - 2 yea r - l which lies in the range reported for lagoons and coastal waters in the Po delta area. The photosynthetic efficiency was similar at the 1 '5 and 6 N M stations (respectively 4-04-2-3 and 3.54-2.7) but significantly lower at the 1 5 N M station (1-9 4- 1 '7). This difference reflects either different nutrient levels in inshore and offshore stations or different structures in phytoplankton community: diatoms and phytoflagellates prevailed at 1 "5 and 15 N M , respectively. Photo- synthetic efficiency increased with increasing concentration of nutrients. The behaviour was found to be linear as a function of total dissolved phosphorus, and hyperbolic as a function of total dissolved nitrogen. This different depend- ence suggests a surplus of nitrogen with respect to phosphorus for photo- synthetic processes in the study area, which is consistent with the assumption of phosphorus as limiting element often made for the northern Adriatic.
© 1995 Academic Press Limited
Introduction
T h e Adr i a t i c sea a c c o u n t s for a smal l p e r c e n t a g e ( ~ 5%) o f the en t i re a rea o f the
M e d i t e r r a n e a n , b u t rece ives in its sha l low n o r t h e r n pa r t ( < 1 4 % o f the to ta l Adr i a t i c
area) s igni f icant f r e shwa te r i npu t s w h i c h m a r k e d l y inc rease its p r o d u c t i v i t y o v e r the
0272-7714/95/050493+21 $12.00/0 © 1995 Academic Press Limited

494 A. Zoppini et al.
oligotrophic features of the Mediterranean sea. The Po, by far the largest Italian river, accounts for 11%, 28% and 50% of the total freshwater flow into the Mediterranean, the entire Adriatic and the northern Adriatic, respectively (UNESCO, 1978). Since the Po valley is one of the most productive agricultural areas in Italy, the Po discharge also accounts for about 50% of the total nutrient load transported into the northern Adriatic (Degobbis et al., 1986; Degobbis & Gilmartin, 1990). The influence of Italian rivers flowing into the northern Adriatic is not limited to the northern part of the Adriatic: it was traced to the central western Adriatic and even to more southern sea regions (Buljan & Zore-Armanda, 1976; Revelante & Gilmartin, 1977; Artegiani & Azzolini, 1981; Artegiani et al., 1993). This widely spread influence is due to the cyclonic circulation pattern which drives riverine waters southward along the Italian coast. The cyclonic current is active during most of the year except during the summer period, when a semi-closed circulation pattern and high vertical stability of the strongly stratified water column (Franco et al., 1982) allow the Po discharge to be advected eastward toward the Istrian peninsula (Gilmartin et al., 1990; Revelante & Gilmartin, 1992).
Several papers dealing with factors controlling plant nutrient concentrations, standing crop and primary production in the northern Adriatic (Franco, 1984; Degobbis et al.,
1986; Smodlaka, 1986; Gilmartin et al., 1990; Degobbis & Gilmartin, 1990; Revelante & Gilmartin, 1992) are available in the literature. Despite the intensive research effort in this area, field results give somewhat contrasting information on the evolution of the trophic state. Nutrient loads significantly increased over the period 1971-81 (Marchetti, 1990) while primary production rates were not found to increase significantly in that period (Smodlaka & Revelante, 1983). These findings strongly contrast with the equivalence of new and regenerated primary productions calculated by Degobbis and Gilmartin (1990). This equivalence should involve a high vulnerability of the ecosystem to the anthropogenic inputs (Gilmartin et al., 1990) while primary production measure- ments suggest a limited sensitivity of the system to strong variations of inputs. While Gilmartin et al. (1990) supposed that temporal and spatial variability could have been responsible for the observed lack of variations of the primary production data set, the intensification of the trophic state in the northern Adriatic is clearly shown by the increased occurrence of anoxic events in bottom waters (Montanari et al., 1984; Degobbis, 1989). The inadequate consideration of lagoons and inshore waters probably contributed to make the recognition of any trend difficult: most available data were in fact collected at distances >10 nautical miles (NM) from the coast. An appropriate evaluation of the role of the coastal belt within 15 NM, extending from the northern to the central Adriatic, would lead to a more accurate estimation of assimilation- regeneration processes occurring in the area under the influence of the Po. Unfortu- nately, experimental information on the southern part of the northern Adriatic as well as on the central Adriatic is scarce, and the influence of northern riverine inputs on this area was mainly deduced from physical properties.
Data on nutrient levels in western waters are limited (Scaccini Cicatelli, 1985-86; Andreoli et al., 1985; Marzocchi et al., 1989) and primary production measurements are only available for eastern coastal waters (Pucher-Petkovic et al., 1971). These considerations stimulated our interest in studying processes which control nutrient concentrations and related production activity in western coastal waters at the boundary between the northern and the central Adriatic. This paper provides, for the first time, data on photosynthetic rates in this area and discusses the relationships existing among nutrients, standing crop and primary production. During this investigation, the chance

Nutrients, standing crop and primary production 495
12°45'E 44°00 ~T ~0 m\30x m 50 n ~ "
Pesar° ~ x , ~ ~ ~
\
':[, -"%.. Senigallia
":; ' " •. Marittima Ancona
0 5 10
NM 44°30~q
14°00
Figure 1. Location of sampling stations in the investigated area. SG01, SG03, SG05 sampling stations.
arose to measure primary production rates in samples with undetectable orthophosphate concentrations, providing field evidence of the occurrence of photosynthetic processes independently of any direct external supply of orthophosphate.
M a t e r i a l and m e t h o d s
The investigation was carried out at three sampling stations: SG01 (43°45'44"N 13°12'73"E); SG03 (43°48'31"N 13°17'67"E); and SG05 (43°54'72"N 13°26'91"E) located 1.5, 6 and 15 N M from the coast respectively, along a transect about 30 km north of Ancona (Figure 1). The respective depths of the three stations were 11, 18 and 54 m. Thirteen sampling programmes were conducted over the period August 1990-July 1992. Seawater samples for nutrient analyses were collected with Niskin plastic bottles at 0"5 and 3 m from surface and 1 m above bottom. Dissolved concentrations of nitrites, nitrates, ammonia, orthophosphate, total dissolved phosphorus (TDP) and silicates were determined according to standard oceanographic methods (Parsons et al., 1983) on samples filtered immediately after collection through 0.4 gm Nucleopore membrane filters and stored frozen until the analyses. Total phosphorus (TP) was determined on unfiltered sample aliquots after digestion with persulphate. Dissolved inorganic carbon (DIC), necessary for the calculation of primary production rates, was determined on seawater aliquots filtered through precombusted Whatman GF/C glass filters and stored at 4 °C using a Carlo Erba T O C meter (model 480). The autotrophic biomass was estimated by measuring chlorophyll a concentration (CHL) on 1 1 filtered seawater. Glass fibre filters for C H L analyses (Whatman GF/C, 1.2 5 pm pore size, 47 m m diameter) were stored frozen until extraction, then ground and extracted in 15 ml of 90% (v/v) MgCO 3 saturated acetone solution. After storing refrigerated overnight, the extracts were filtered through GF/C glass filters to remove particles, and their C H L

496 A. Zoppini et al.
content was measured according to APHA (1989) by using a Turner design fluorometer (model 10-005R) previously calibrated with a standard chlorophyll (Sigma).
The photosynthetically active radiation (PAR, 400-700 nm) was measured in einsteins as quantum energy units (E m - 2) between dawn and dusk using a LI -COR air quantum sensor (model LI-190SA) connected to a LI-1000 data logger. Before sampling, profiles of underwater irradiance were measured with a spherical quantum sensor (model LI-192SA). Primary production rates (PP) were measured using the ~4C radiolabelling technique (APHA, 1989) on samples collected at four depths correspond- ing to 100%, 50%, 25% and 10% of surface illumination. One millilitre of radioactive carbonate solution was added to three 120-ml sample aliquots (one dark and two light bottles). The specific activity of added inorganic carbon, ~ 10 gCi ml - ~, was measured by counting the total activity in an aliquot stock solution stabilized with phenylethyl- amine to prevent CO, losses. Samples were incubated for 4 h on deck, using a flow-through system to maintain the incubation temperature at surface water values and nickel screens (Stork-Veco) to reproduce the in situ light attenuation. Following incubation, samples were filtered through Gelman GN6 Metricel filters (0"45 gm pore size, 25 mm diameter) and the filters rinsed twice with filtered seawater from sampling site. Filters were then acidified with 250 gl 0-2 N HC1 in glass vials and, after standing ovemight to remove inorganic 14C, and drying, were dissolved in 10 ml scintillation cocktail (Packard Filter Count). Filters were finally assayed for 14C incorporation with a Packard Tri Carb (model 4430) liquid scintillation counter over a 12-h period. Measurements were corrected for the instrument efficiency and quenching.
The water column productivity (mg C m 2h l) was calculated by numerical integration using the trapezoid rule and assuming the primary production at the 1% light penetration depth equal to zero (Parsons et al., 1983). Daily primary production (mg C m 2 day ') was calculated by multiplying the hourly productivity of the water column by the ratio of total daily irradiance and mean hourly irradiance relative to the incubation. The annual primary production (g C m 2 year ~) was then calculated following two different procedures: (a) extrapolating mean daily production rates to 1 year; and (b) multiplying mean production rates per energy units over all the study period (mg C m -~ E ~) with the mean annual irradiance, calculated from an extensive irradiance data set recorded in the same area over the period 1958-78 (CNMCA, 1989). The CNMCA station was located at Ancona (43°37'N and 13°31'E): it is not at present in operation and the irradiance data set used was the latest long-term data set available.
Samples for phytoplankton analysis were collected at the same optical depths as those for primary production rates, stored in dark glass bottles and stabilized by adding 10 ml of a neutralized 20% formaldehyde solution to 250 ml seawater (Throndsen, 1978). Although no single method is suitable for the preservation of all types of phytoplankton, the choice of neutralized formaldehyde satisfied various requirements. It gave good results for preserving diatoms and coccoliths; the latter component was often overlooked in the past due to the choice of Lugol's fixation. As for flagellates, both the use of formaldehyde and Lugol's solutions was questioned (Taylor, 1978) due to their inadequacy for preserving naked forms. The neutralized formaldehyde solution was preferred even for this latter component in consideration of the ability acquired by the operator in counting most flagellates in the presence of this preservative agent. The glutaraldehyde solution which is recognized as a better preservative agent for naked flagellate species was not used due to the difficulties met in its handling.
Nutrients, standing crop and primary production 497
Species composition and concentration were determined within 1 month by inverted- microscope method following the procedure of casual fields (Cordelia & Cavolo, 1988). Temperature was measured with reversing thermometers in situ and salinity (S) with an AGE MINISAL (model 2100) salinometer on seawater aliquots.
Resu l t s
Physical characteristics The vertical behaviour of salinity and temperature at the three sampling stations in the different programmes is shown in Figure 2 (one series of data was omitted since it could not be included in the same figure). Salinity values often appeared to be lower in surface waters with respect to deeper waters at all the stations, with marked gradients on occasions at SG01 and SG03. The lowest salinities measured over the study period were recorded at the station SG01 in May and November 1991 and July 1992 and at the station SG03 in July 1992. Freshwater inputs also influenced surface waters at SG05: low salinities were recorded during May-October 1991 as a consequence of the well known summer spreading on the surface of the entire northern and middle Adriatic of riverine waters (mainly of the Po) discharging into the northern Adriatic (Franco et al., 1982) and a massive prolonged spring river runoff (Figure 3). The salinity profile was found to be quite homogeneous at this station in six of 13 surveys performed (see October 1990, April and November 1991, February and July 1992).
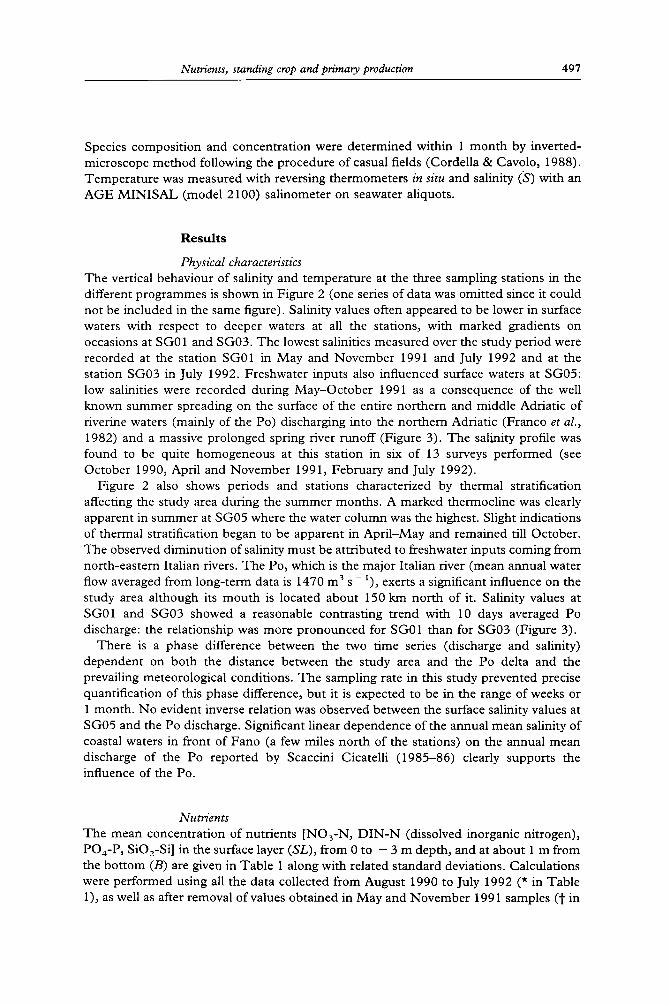
Figure 2 also shows periods and stations characterized by thermal stratification affecting the study area during the summer months. A marked thermocline was clearly apparent in summer at SG05 where the water column was the highest. Slight indications of thermal stratification began to be apparent in April-May and remained till October. The observed diminution of salinity must be attributed to freshwater inputs coming from north-eastem Italian rivers. The Po, which is the major Italian river (mean annual water flow averaged from long-term data is 1470 m ~ s ~), exerts a significant influence on the study area although its mouth is located about 150 km north of it. Salinity values at SG01 and SG03 showed a reasonable contrasting trend with 10 days averaged Po discharge: the relationship was more pronounced for SG01 than for SG03 (Figure 3).
There is a phase difference between the two time series (discharge and salinity) dependent on both the distance between the study area and the Po delta and the prevailing meteorological conditions. The sampling rate in this study prevented precise quantification of this phase difference, but it is expected to be in the range of weeks or 1 month. No evident inverse relation was observed between the surface salinity values at SG05 and the Po discharge. Significant linear dependence of the annual mean salinity of coastal waters in front of Fano (a few miles north of the stations) on the annual mean discharge of the Po reported by Scaccini Cicatelli (1985-86) clearly supports the influence of the Po.
Nutrients The mean concentration of nutrients [NO3-N, D I N - N (dissolved inorganic nitrogen), PO4-P, SiO2-Si] in the surface layer (SL), from 0 to - 3 m depth, and at about 1 m from the bottom (B) are given in Table 1 along with related standard deviations. Calculations were performed using all the data collected from August 1990 to July 1992 (* in Table 1), as well as after removal of values obtained in May and November 1991 samples ( t in

498 A. Zoppini et al.
28 0
-lO L o~ 0
8 -10 ~o 0
-10
Lo -20 ©
-30 5'3
-4O -50
0 -10
0 8 - lO
~ 0 -10
~ -20 © r~ -30
-50 -
0
~-lO II I m 0 - -
8 -10 /
0 -10 -20 -30
m -40 2 8eptem} D -50
0 E -lO - m 0
8 -io o 0
-lO -20
© o -30
-40 -50 -60
S
32 ]
, \ I I
16 October 1990
T(°C)
36 10 15 20 /~ ' I I
I
I
14May 1991
I I
I I /
I
1991
I
r I
I I
_4 February 1992
' ' 2 ' J I
\ , l,
S 32 36
i ~ . , J
I I
- , ,)
22 January 1991
%
I I t _ \
11 June 1991
I I I
,, 1 I
- / 17 October
1991
T (°C)
10 15 20 ~ , 1 I I
|
'? I /
f I I]
I I I
I I I / /
S
32 36 I k . . I
I I
9April 1991
_ i /i
I I
: \ 3 July 1991
I I
27 November
- 1991
T (°C)
10 15 20 i j i i
I r I
/ I I , )
I I J I
I I I I
' '(), )l ) / I I I
I I F //,,, _ i j i
I I
_ 27 May 1992
i i ]l
, z ), /
I I
2 July 1992
I I I
,,J,
/ I I I
, \ ,
, y
I I
/ Figure 2. Vertical profiles of salinity (5") and temperature (T) at the three sampling stations on 12 campaigns, from October 1990 to July 1992. SG01, SG03, SG05, sampling stations.
T a b l e 1) f r o m the da ta set. T h e la t te r da ta w e r e r e m o v e d b e c a u s e sal ini ty a n d n u t r i e n t s
s h o w e d excep t iona l ly low a n d h igh va lues on t h o s e occas ions , respec t ive ly . T h e average
peak values were : 34.3 + 3"5, 40"8 + 3.9, 0.51 + 0"23, a n d 15"8 + 7.3 ~tM respec t ive ly
for N O ~ - N , D I N - N , P O 4 - P a n d SiO2-Si in t he sur face w a t e r s o f S G 0 1 ; a n d 6"1 4- 2.3,
Nutrients, standing crop and primary production 499
' x : J ~
o ~
g (9
N
5000
4000
3000
2000
1000'
40
D E
A
A
AZX A A
A •
• •
A
Z~ A
A
/ ' IX A A
A
O , , , l , , , l , J , l , , , m l , ,
32
m
' 28
O~
e~ t~
36
0o
Figure 3. Time evolution of Po fiver discharge measured at Pontelagosouro (solid line) averaged every 10 clays and surface salinity values at SG01 ( E ) and SG03 ( ~ ) . SG01, SG03, sampling stations.
TABLE 1. Averages and standard deviations of nutrients (MM) and chlorophyll a (CHL) (pg I 1) in the surface and bottom layers at the three sampled stations
SG01 SG03 SG05
* t * t * t
NO3-N
DIN-N
PO4-P
SiO,-Si
C H L
SL B SL B SL B SL B SL
B
7.74- 12.3 2"8+4"1 2"4±2"9 1 ' 7+2"4 0"34-0"2 0"3+0"2 5"0 + 7"1 2"5 + 4"2 1"4 + 1"2 1"1 4- 1"0 1"0 4- 1"5 1"1 + 1"6 9"6 ± 14.3 3"9 4- 4"8 3"2 ± 3"4 2"4 ± 2"7 0-7 ± 0"4 0'6 ± 0"3 6'8 ± 8"4 3"9 ± 4"6 2"9 ± 1'6 2-5 ± 1"3 1"7 ± 1'6 1"8 ± 1"7
0.08 ± 0-10 0.06 ± 0.09 0.05 ± 0.05 0.05 ± 0.05 0.02 4- 0.02 0.02 ± 0.02 0.05 ± 0.07 0-04 ± 0.06 0.05 ± 0.07 0.04 4- 0.06 0.04 ± 0.05 0.05 ± 0.06
4 . 3 ± 6 - 2 2 . 2 ± 2 . 8 2-64-2.3 2 . 2±2 . 1 1 . 0±0 . 9 0 . 9 ± 1 . 0 4 . 3 ± 4 - 3 3 . 3 ± 3 . 4 4 - 1 ± 3 . 3 3 . 6±3 . 1 5 -2±5 .7 5 . 5 + 6 . 2
3 .64±4-69 3 .57±5 .12 1 .45±1 .23 1 .46±1.33 0 .45±0 .25 0.444-0.26 2.00 4- 1-23:]: 1.19 4- 0.47:[: 3.204-2-99 3.134-3.18 1.164-0.69 1.104-0.58 0 . 6 0 ± 0 . 3 7 0.654-0.39 2.30 4- 1-435
*Calculated using total data set; tcalculated after the removal of May and November 1991 nutrient peaks; :~calculated after the removal of C H L peaks recorded in October 1990 and January 1991; SG01, SG03, SG05, sample stations; S, surface layer; B, bottom layer; DIN-N, dissolved inorganic nitrogen; values given as mean ± SD.
7"7 + 3.8, 0 .15 + 0 .09 and 4.7 + 3.5 g M for the same e lements in the surface waters of SG03 . T h e corresponding m e a n values of salinity were 28 .90 + 0 .76 and 35"06 + 0-72. Riverine inputs responsible for the above high concentrat ions o f nutrients produced a particularly marked effect at SG01 (Table 1), while they were impercept ible at SG05 where mean data calculated from all the data (*) were found to be similar to mean values obtained after the removal of May and N o v e m b e r 1991 values ( t ) . T h e average surface

500 A. Zoppb~i et al.
values of nutrients were 2.8 -4- 4.1, 1.7 4- 2.4 and 0.3 + 0.2 ~tM for NO~-N; 0'06 4- 0"09, 0"05 4- 0"05 and 0"02 4- 0"02 ~M for PO4-P; 2"2 4- 2"8, 2.2 4- 2"1 and 0"9 4- 1"0 jaM for SiO2-Si in the surface layer of SG01, SG03 and SG05, respectively. Averages at SG05 and SG01 approached mean levels of nutrients reported for the open northern Adriatic and the area just off the Po delta, respectively (Gilmartin & Revelante, 1983). But, silicate concentrations in our stations were lower than those reported for the northern Adriatic. The comparison of mean nutrient values calculated for the surface and bottom layers after the removal of peak concentrations (-[" in Table 1) showed similar concen- trations of NO3-N, DIN-N, and PO4-P at SG01 and SG03. Mean surface values were, on the contrary, lower than bottom averages at SG05. Silicates showed bottom values higher than the surface values at all the stations. The stronger gradient observed for the vertical distribution of silicon with respect to that of nitrogen and phosphorus is consistent with a more significant contribution given in shallow systems by processes occurring at the sediment level to the regeneration of the former with respect to the latter elements (Degobbis, 1990).
Phytoplankton biomass and composition Phy~oplankton standing crops gave average surface values of 3'64 ± 4.69, 1-45 4- 1'23 and 0-45 + 0'25 gg 1 ] CHL respectively at SG01, SG03 and SG05 (* in Table 1). The removal of the CHL values corresponding to nutrient peaks (af in Table 1) did not significantly affect the results. A marked decrease of the CHL mean values was obtained instead, particularly at SG01, when sporadic CHL peak values were eliminated. Peak CHL values were recorded in October 1990 with CHL reaching 7.8 + 2.8 and 5-0 4- 2.5 ggl ] in the surface layers of stations SG01 and SG03 respectively, and in January 1991 when CHL rose to 17.7 -4- 1-0 gg 1 l in the surface waters of SG01. In this latter case, the peak was confined around station SG01 while station SG03 showed a CHL value of 1.1 lag l ] similar to the mean surface value resulting from this investigation. Average CHL values after the removal of the above peaks became 2-00 :t: 1.23 and 1.19 :t: 0.47 ggl ' in the surface layers of SG01 and SG03. Average surface values of CHL were found to be similar to the bottom values. It is worth noting that the CHL measurements in this study did not include the picoplankton since samples were filtered with GFC filters of nominal 1-2 gm pore size. Therefore, these C H L measurements have to be considered underestimated. These C H L data are comparable with most previous studies carried out in the Adriatic before about 1988, but not with contemporary studies.
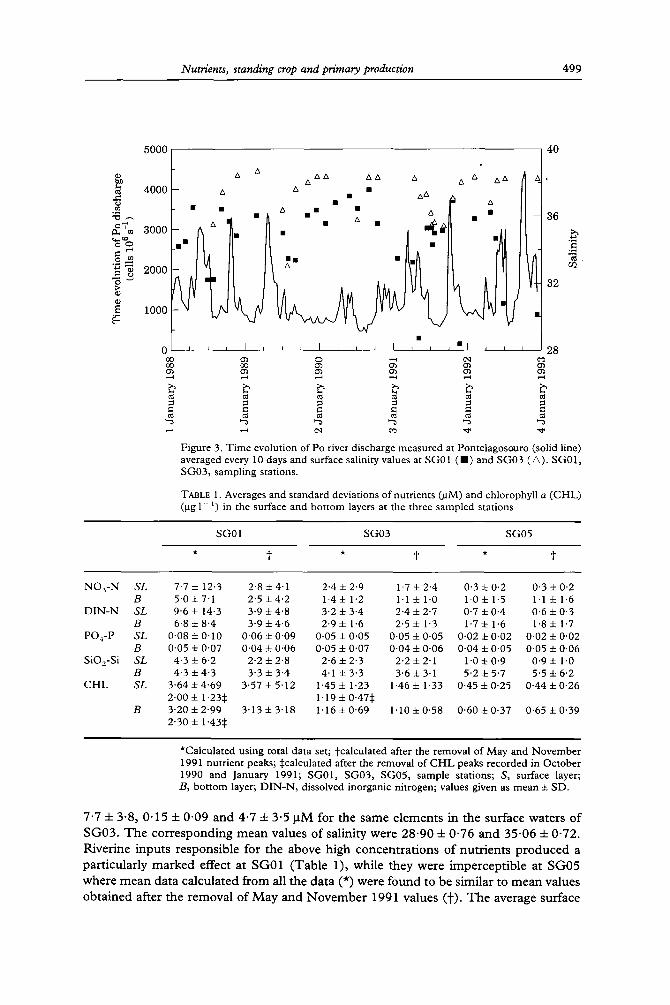
Temporal variations of phytoplankton abundance in the surface layer at the three investigated stations are shown in Figure 4. This illustrates the total cell density and the relative percentage contributions of diatom and phytoflagellate components, found to be the most abundant taxonomic categories among those considered. They included: diatoms, dinoflagellates; phytoflagellates; coccolithophores and others. The phytoflagel- late category comprised various classes (Prasinophycea, Haptophycea, Chlorophycea, Cryptophycea, Chrysophycea) whose identification is difficult under optical microscopy. Moreover, phytoflagellates might also include a significant proportion of heterotrophic forms, since the epifluorescence method was not available. Station SG01 showed the highest cell density values during the January-May 1991 period, SG03 showed the highest cell density values in April 1991 and SG05 showed the highest cell density values in May and June 1991. Phytoflagellates dominated in most of the study periods at the 15 NM station while sharing the dominant role with diatoms at SG01.
Nutrients, standing crop and primary production 501
30 100
75 2O
50
10 25
0 0
v
100 ~ 20
75 -~---
50 10 -~%
25 •
0 0
100 4
75 •
50 2 n~ ~¢:~
25
0 0
.-~ < < o ~ ~ ~ ~
Figure 4. Temporal variations of total cell density (n) and respective percentage contributions by diatoms (open bar) and phytoflagellates (solid bar) in the surface layer ( - 3-0 m) at the three sampling stations. Cell density is expressed a s 1 0 6 cells 1- i
Dinoflagellates and coccoli thophores were always found to be a minor fraction ( < 1 0 - 1 5 % ) of the total phytoplankton populat ion. Red tide p h e n o m e n a due to dinoflagellate blooms, often occurr ing in s u m m e r periods of previous years (Artegiani et al., 1985), were no t observed dur ing this study period. Al though phytoflagellates were found to domina te sometimes, all the significant maxima of cell density C H L were due to the microp lank ton componen t , in accordance with the findings by Revelante and

502 A. Zoppini et al.
TABLE 2. Average cell densities and standard deviations of total phytoplankton and related percentage of diatoms and phytoflagellates in the surface and bottom layers
Cell density
SG01 SG03 SG05
Cells 1061-1 SL 2.5± 1-3 2.1 + 1.3 1.0± 1.1 B 2.5+ 1.5 1.8± 1.5 0.8±0.9
Diatoms (%) SL 31 ± 18 28 ± 22 22 ± 23 B 43 ± 24 33 ± 26 27 + 23
Phytoflagellates (%) SL 56 ± 15 59 ± 21 67 ± 21 B 49 + 21 57 + 23 59 ± 22
Calculations were performed from all the data after the removal of bloom values (> 1 0 7
cells l ~) SL, surface layer; B, bottom layer; SG01, SG03, SG05, sample stations; values given as mean + SD.
Gilmart in (1977). In January 1991, total phytoplankton density reached a value as high as 30 x 106 cells 1 ' at SG01, with Skeletonema costatum account ing for 80-90% of the phytocenosis. Skeletonema costatum was often reported to sustain microplankton win te r - spring blooms in coastal water of the Adriatic under the influence of riverine inputs due to its strong euryhaline behaviour (Voltolina, 1975; Revelante & Gilmart in, 1983). The
January 1991 bloom observed was characterized by exceptional cell density and long persistence with respect to most reported cases (Andreoli et al., 1985; Cabrini et al., 1987-88). The algal b loom extended to SG03 in April 1991 and cell densities attained 23 x 10 ~' and 19 x 10 '~ cells 1 ' at SG01 and SG03, respectively.
Diatoms largely prevailed (90% of the total cells) with S. costatum ( ~ 60% of total) dominat ing in association with two minor species (Chaetoceros cf. fi-agilis and Nitzschia pseudodelicatissima). The bloom was still persistent at SG01 in May 1991 with cell density amount ing to 16 + 10 *' cells 1- i. Diatoms prevailed ( ~ 7 0 % of the total cells) but showed in this case a great species diversity including Chaetoceros simplex, Chaetoceros compressus, S. costatum, Rhizosolenia fragilissima and N. pseudodelicatissima. Cell abun- dance was lower at SG05 with respect to SG01 and SG03. A cell density peak caused by phytoflagellates b looming was observed in the bot tom layer of SG05 in August 1990 (4 x 10 *' cells I '). Other peaks occurred in the surface layer of SG05 in May and June 1991 (3.5 x 10⁶ cells 1 l) and in April 1992 (3 x 10⁶ cells 1 ~): in these latter cases, diatoms (in particular, Chaetoceros sp. and N. pseudodelicatissima) dominated , account ing for about 70% of total cells.
The stratification of the water co lumn occurring dur ing the summer period affected the phytoplankton distr ibution which showed marked differences between the surface and the bot tom layers. The average cell densities calculated from all the data in the water co lumn were 5.7 + 7.5, 2.5 -4- 3"1 and 0.9 4- 1.0 mill ion cells 1 1 at SG01, SG03 and SG05 respectively. T e n samples at SG01 and two samples at SG03, out of 164 samples collected altogether, had a cell density higher than 107 cells 1 '. Such values significantly affected the reported averages diminishing their representativeness for the study area (Table 2). Average cell density values after the removal of the above peaks were 2-5 + 1.4, 2-0 4- 1-4 and 0.9 4- 1.0 mill ion cells 1-- ~ at SG01, SG03 and SG05, respectively, and showed a reasonable homogenei ty along the water column.
Nutrients, standing crop and primary production 503
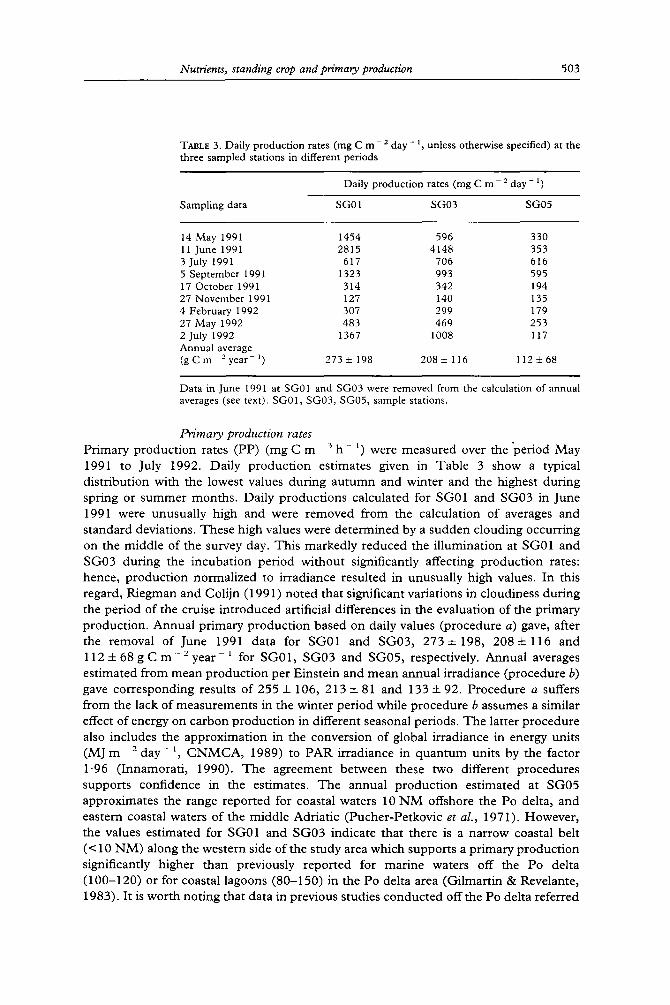
TABLE 3. Daily production rates (mg C m - 2 day - ~, unless otherwise specified) at the three sampled stations in different periods
Daily production rates (mg C m -* day- 1)
Sampling data SG01 SG03 SG05
14 May 1991 1454 596 330 11 June 1991 2815 4148 353 3 July 1991 617 706 616 5 September 1991 1323 993 595 17 October 1991 314 342 194 27 November 1991 127 140 135 4 February 1992 307 299 179 27 May 1992 483 469 253 2 July 1992 1367 1008 117 Annual average (gCm 2year ~) 273+198 208+116 1125:68
Data in June 1991 at SG01 and SG03 were removed from the calculation of annual averages (see text). SG01, SG03, SG05, sample stations.
Primary production rates Pr imary p roduc t ion rates (PP) (mg C m 3 h l) were measu red over t h e ' p e r i o d M a y 1991 to July 1992. Dai ly p roduc t ion es t imates given in Tab le 3 show a typical d i s t r ibu t ion with the lowest values dur ing a u t u m n and winter and the highest dur ing spr ing or s u m m e r months . Dai ly p roduc t ions ca lcula ted for SG01 and SG03 in June 1991 were unusua l ly high and were r emoved from the calculat ion of averages and s t andard deviat ions. These high values were de t e rmine d by a sudden c louding occurr ing on the midd le of the survey day. Th is marked ly r educed the i l lumina t ion at SG01 and SG03 dur ing the incuba t ion pe r iod wi thou t significantly affecting p roduc t ion rates: hence , p roduc t ion no rma l i zed to i r rad iance resul ted in unusua l ly high values. In this regard, R iegman and Coli jn (1991) no ted that significant var ia t ions in c loudiness dur ing the per iod of the cruise in t roduced artificial differences in the evaluat ion of the p r imary p roduc t ion . Annua l p r imary p roduc t ion based on daily values (p rocedure a) gave, after the removal of June 1991 da ta for SG01 and SG03 , 2 7 3 + 198, 2084- 116 and 1 1 2 4- 68 g C m - 2 year ~ for SG01 , SG03 and SG05 , respectively. Annua l averages es t imated f rom mean p roduc t i on per Eins te in and mean annual i r rad iance (procedure b) gave co r re spond ing results of 255 4- 106, 213 4- 81 and 133 4- 92. P rocedure a suffers from the lack of measu remen t s in the winter pe r iod while p rocedu re b assumes a s imilar effect of energy on ca rbon p roduc t i on in different seasonal per iods. T h e la t ter p rocedure also includes the app rox ima t ion in the convers ion of global i r rad iance in energy units ( M ] m 2 d a y - 1, C N M C A , 1989) to P A R i r radiance in q u a n t u m units by the factor 1.96 ( Innamora t i , 1990). T h e ag reemen t be tween these two different p rocedures suppor ts conf idence in the es t imates . T h e annual p roduc t i on es t ima ted at SG05 approx imates the range r epor t ed for coastal waters 10 N M offshore the Po delta, and eastern coastal waters of the midd le Adr ia t ic (Pucher -Pe tkovic et al., 1971). However , the values es t imated for SG01 and SG03 indicate that there is a na r row coastal bel t (< 10 N M ) along the western side of the s tudy area which suppor t s a p r imary p roduc t ion significantly h igher than previously r epor t ed for mar ine waters off the Po del ta (100-120) or for coastal lagoons (80-150) in the Po delta area (Gi lmar t in & Revelante, 1983). I t is wor th no t ing that da ta in previous s tudies c o n d u c t e d o f f t he Po del ta referred

504 A. Zopphli et al.
to coastal stations located > 10 NM from the coast and that the comparison of this PP data with previous measurements (most of them performed before 1980) should not be considered strictly quantitative due to many differences in the experimental conditions used by various workers.
D i s c u s s i o n
Concentrations of nutrients in marine waters are simultaneously affected by advective riverine transport and uptake-regeneration biological processes. Hence, nutrients may or may not be correlated with standing crop, depending on which processes prevail in the investigated area. The correlation coefficient (r) of C H L with NO~-N on all the data collected (August 1990-July 1992) with the exception of nutrient peaks measured in May and November 1991 (seven sets of data out of 120 collected) was 0.71 with 113 data pairs (P=0'0001). The same analysis limited to surface data gave r=0.80 with 70 data pairs indicating a similar high level of significance (P--0-0001). In order to verify that the significance of the correlation was not influenced by a few samples with high NO ~-N concentrations, the analysis was repeated on 58 surface data pairs with NO3-N <7 jam obtaining a value of r=0"42. The correlation was lower in this case but still at a significance level of 0"001.
The corresponding correlation coefficients of CHL with DIN-N were 0.68 with 113 data pairs, 0"78 with 70 surface data pairs and 0.48 with 58 surface data pairs including only DIN-N values <7 jaM. The significant positive correlation of CHL with inorganic nitrogen compounds indicates a prevalence of advective transport over biological assimilation processes. The relationship of CHL with phosphorus compounds was less tightly coupled. The correlation coefficients were 0-21 (P=0"05) with all PO4-P data available (n=113) and 0"35 with surface PO4-P data (n=70; P=0-01). The poor correlation above is probably a consequence of the low levels found for orthophosphate concentiations. These low levels favour the masking of advection by biological processes which probably stimulate algal growth using alternative phosphorus sources. Further- more, the reduced analytical precision associated with low POq-P levels probably introduced a further cause of variability prejudicing the correlation. A stronger relation- ship was found between CHL and T D P concentrations, but the determination of the latter parameter was performed in only six surveys over the period June 1991 to February 1992, hence data pairs were correspondingly reduced. The correlation coefficients were 0"44 with all the 54 T D P data available (P=0.001) and 0.50 with T D P surface data (n--36; P=0'001). The increased significance of the correlation of CI'-IL with T D P compared to that with PO4-P supports a role of dissolved P species other than PO4-P in photosynthetic processes. These P species should not be directly related to northern freshwater inputs but result mainly from biological processes controlling the cycle of phosphorus in the coastal region (Ivancic & Degobbis, 1987).
Chlorophyll a concentration data also showed a reasonable correlation with silicate. The correlation coefficient was 0-37 with all the data collected (n= 113; P--0"001) and 0.62 with 70 surface data (P=0'0001). The inclusion of bottom silicate values dimin- ished the significance of the relationship since the concentration of silicon in deep waters was mainly controlled by regeneration processes occurring in sediments rather than by freshwater inputs.
The CHL measurements in this study missed the contribution of the picoplankton and this may have weakened the correlations with nutrients which were determined on
Nutrients, standing crop and primary production 505
5 -
4 - b~ :3-
3 - -
2 -
1 -
0 25
40
3 0 -
20 I
c7 Z
1 0 -
0 25
0
0
30 35 Salinity
50
40
30
Z I
Z 20
10
0 40 25 30 35 40
Salinity
0.4
°• 0.3 ~ k o
8
0 1 \ , ;o O ^ O O A
30 35 40 25 30 35 40 Salinity Salinity
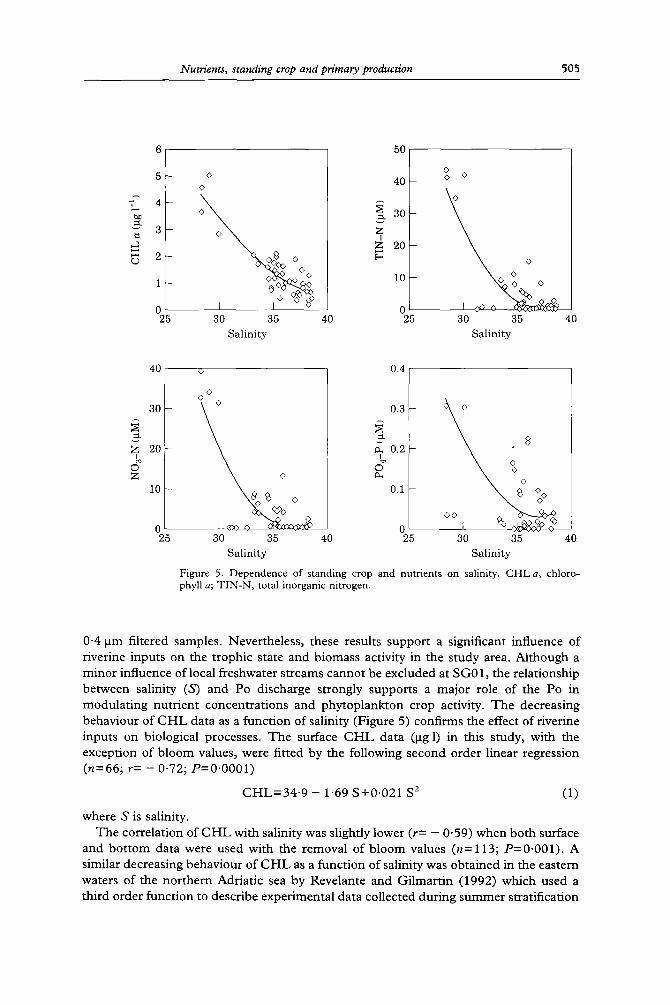
Figure 5. Dependence of standing crop and nutrients on salinity. CHLa, chloro- phyll a; TIN-N, total inorganic nitrogen.
0"4/am filtered samples. Nevertheless, these results support a significant influence of riverine inputs on the trophic state and biomass activity in the s tudy area. Al though a minor influence of local freshwater streams cannot be excluded at SG01, the relationship between salinity (S) and Po discharge strongly supports a major role of the Po in modula t ing nutrient concentrat ions and phytoplankton crop activity. T h e decreasing behaviour of C H L data as a funct ion of salinity (Figure 5) confirms the effect of riverine inputs on biological processes. T he surface C H L data (lag 1) in this study, with the exception of b loom values, were fitted by the following second order linear regression (n=66; r= - 0"72; P=0"0001)
C H L = 3 4 ' 9 - 1"69 S+0 .021 S 2 (1)
where S is salinity. The correlation of C H L with salinity was slightly lower (r= - 0"59) when both surface
and bo t tom data were used with the removal of b loom values (n= 113; P=0"001) . A similar decreasing behaviour of C H L as a funct ion of salinity was obtained in the eastern waters of the nor thern Adriatic sea by Revelante and Gilmart in (1992) which used a third order function to describe experimental data collected during summer stratification
506 A. Zoppini et al.
20
16
12 ¢7,
8
0 ©
] I ) 1 2 3 4 5 6
CHLa (mg n(3)
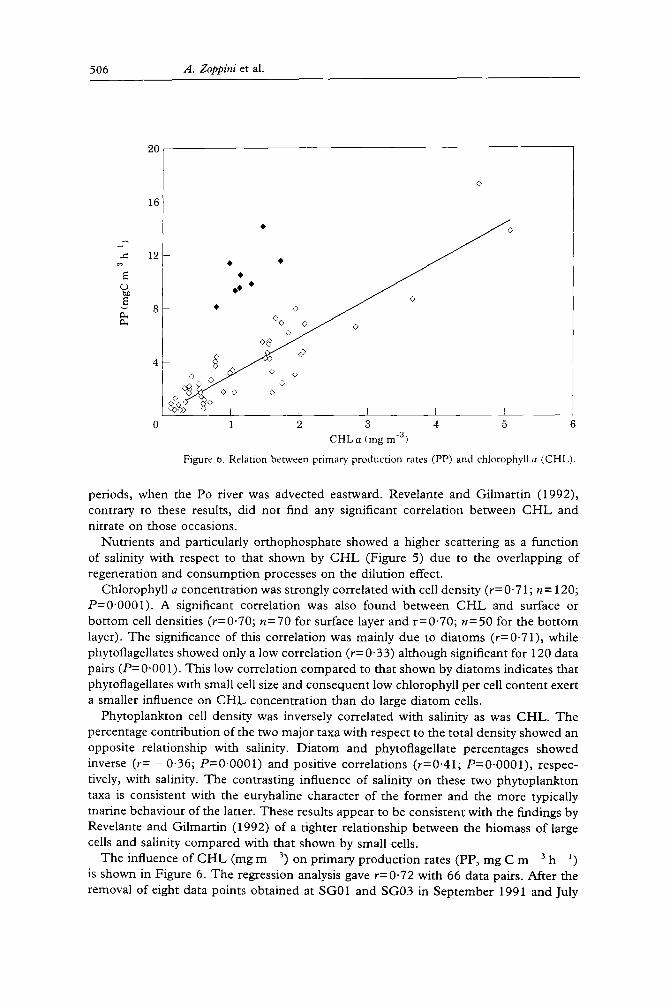
Figure 6. Relation between primary production rates (PP) and chlorophyll a (CHL).
periods, when the Po river was advected eastward. Revelante and Gilmartin (1992), contrary to these results, did not find any significant correlation between C H L and nitrate on those occasions.
Nutrients and particularly orthophosphate showed a higher scattering as a function of salinity with respect to that shown by CHL (Figure 5) due to the overlapping of regeneration and consumption processes on the dilution effect.
Chlorophyll a concentration was strongly correlated with cell density (r= 0'71; n = 120; P=0"0001). A significant correlation was also found between CHL and surface or bottom cell densities (r=0.70; n=70 for surface layer and r=0.70; n=50 for the bottom layer). The significance of this correlation was mainly due to diatoms (r=0"71), while phytoflagellates showed only a low correlation (r= 0'33) although significant for 120 data pairs (P= 0"001). This low correlation compared to that shown by diatoms indicates that phytoflagellates with small cell size and consequent low chlorophyll per cell content exert a smaller influence on CHL concentration than do large diatom cells.
Phytoplankton cell density was inversely correlated with salinity as was CHL. The percentage contribution of the two major taxa with respect to the total density showed an opposite relationship with salinity. Diatom and phytoflagellate percentages showed inverse (r= - 0 ' 3 6 ; P=0-0001) and positive correlations (r=0"41; P=0"0001), respec- tively, with salinity. The contrasting influence of salinity on these two phytoplankton taxa is consistent with the euryhaline character of the former and the more typically marine behaviour of the latter. These results appear to be consistent with the findings by Revelante and Gilmartin (1992) of a tighter relationship between the biomass of large cells and salinity compared with that shown by small cells.
The influence of CHL (mg m 3) on primary production rates (PP, mg C m 3 h 1) is shown in Figure 6. The regression analysis gave r=0"72 with 66 data pairs. After the removal of eight data points obtained at SG01 and SG03 in September 1991 and July

Nutrients, standing crop and primary production 507
10
8
"7 6
Ca)
0 0
- 0
0 ^ ~ O0 0
0 0 0 A ~ A ~ O " - 0 0 0
° ° ° I ° L o I 0.5 1 1.5 2
DIN-N (gM) 2.5
10
7 ~7
(b)
O O
O O
0
0
I 10
O
I I I 20 30 40 50
DIN-N (~tM)
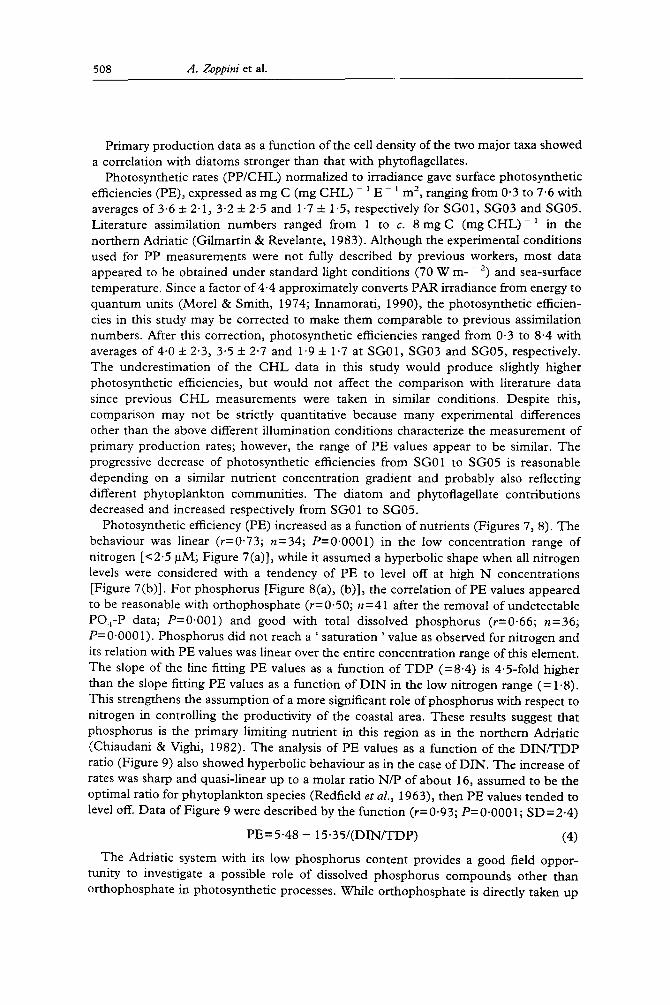
Figure 7. Influence of dissolved inorganic nitrogen (DIN-N) on photosynthetic efficiency (PE). (a) low concentration range; (b) all values.
1992 (see full circle da ta in F igure 6), the regression analysis gave r=0"91. Da ta of F igure 6 are descr ibed by equa t ion (2) ( S D = 1"3)
P P = 0 . 1 6 + 2 . 8 4 C H L (2)
where p r imary p roduc t ion rate (PP) is expressed in m g C m 3 h ] and chlorophyl l a concen t ra t ion ( C H L ) in m g m - 3. I t is wor th no t ing that Kvede r et al. (1971) found values of 0.29 and 1.63 for the in te rcept and the slope of the line fi t t ing pho tosyn the t i c activity u n d e r s t anda rd l i gh t - t empe ra tu r e condi t ions as a funct ion of chlorophyl l (a and c) in the nor the rn Adr ia t ic , respectively. T h e da ta in this s tudy suggests pho tosyn the t i c rates ( P P / C H L ) h igher than those der ived f rom the above 20-year -o ld data.
T h e c o m b i n e d effect of C H L (mg m - 3) and i r radiance (I, E m - 2 h - 1) on p r imary p roduc t ion da ta (mg C m - 3 h - 1) was desc r ibed by the fol lowing mul t ip le regression equa t ion (n=66 ; r=0 .77 ; S D = 2 - 5 0 ) ,
P P = - 0 . 3 7 + 3 - 1 3 C H L + 0 . 5 5 1 (3)
508 A. Zoppini et al.
Primary production data as a function of the cell density of the two major taxa showed a correlation with diatoms stronger than that with phytoflagellates.
Photosynthetic rates (PP/CHL) normalized to irradiance gave surface photosynthetic efficiencies (PE), expressed as mg C (mg CHL) i E - I m 2, ranging from 0.3 to 7.6 with averages of 3"6 + 2"1, 3-2 + 2"5 and 1-7 + 1"5, respectively for SG01, SG03 and SG05. Literature assimilation numbers ranged from 1 to c. 8 mg C (mg CHL) ~ in the northern Adriatic (Gilmartin & Revelante, 1983). Although the experimental conditions used for PP measurements were not fully described by previous workers, most data appeared to be obtained under standard light conditions (70 W m- - 2) and sea-surface temperature. Since a factor of 4.4 approximately converts PAR irradiance from energy to quantum units (Morel & Smith, 1974; Innamorati, 1990), the photosynthetic efficien- cies in this study may be corrected to make them comparable to previous assimilation numbers. After this correction, photosynthetic efficiencies ranged from 0-3 to 8'4 with averages of 4-0 :t: 2.3, 3.5 + 2.7 and 1.9 + 1.7 at SG01, SG03 and SG05, respectively. The underestimation of the CHL data in this study would produce slightly higher photosynthetic efficiencies, but would not affect the comparison with literature data since previous CHL measurements were taken in similar conditions. Despite this, comparison may not be strictly quantitative because many experimental differences other than the above different illumination conditions characterize the measurement of primary production rates; however, the range of PE values appear to be similar. The progressive decrease of photosynthetic efficiencies from SG01 to SG05 is reasonable depending on a similar nutrient concentration gradient and probably also reflecting different phytoplankton communities. The diatom and phytoflagellate contributions decreased and increased respectively from SG01 to SG05.
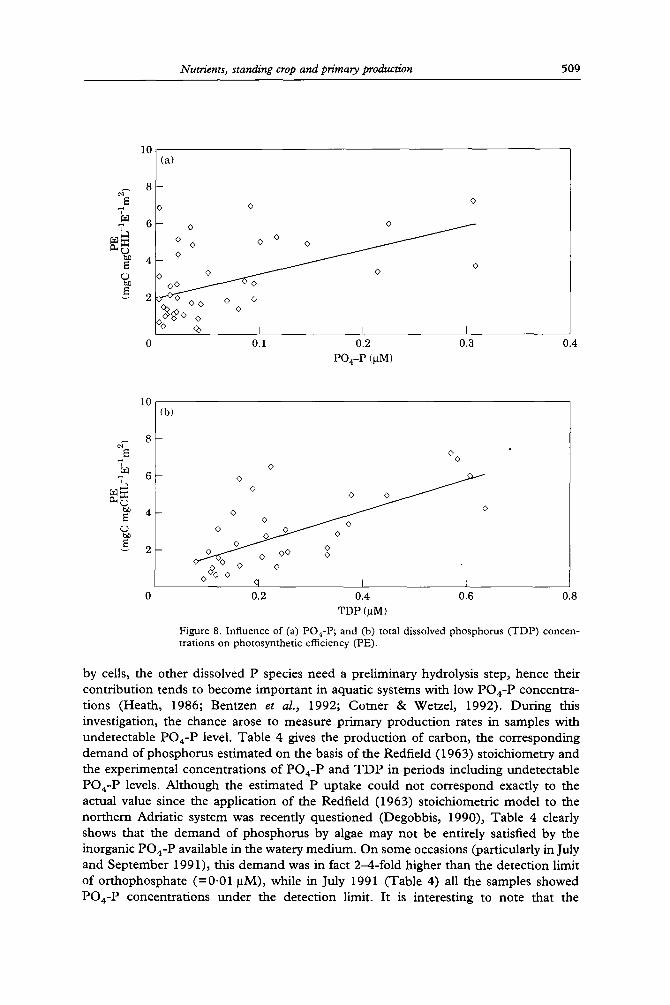
Photosynthetic efficiency (PE) increased as a function of nutrients (Figures 7, 8). The behaviour was linear (r--0"73; n=34; P=0"0001) in the low concentration range of nitrogen [<2.5 ~M; Figure 7(a)], while it assumed a hyperbolic shape when all nitrogen levels were considered with a tendency of PE to level off at high N concentrations [Figure 7(b)]. For phosphorus [Figure 8(a), (b)], the correlation of PE values appeared to be reasonable with orthophosphate (r=0"50; n=41 after the removal of undetectable PO4-P data; P=0.001) and good with total dissolved phosphorus (r=0"66; n=36; P=0'0001). Phosphorus did not reach a ' saturation ' value as observed for nitrogen and its relation with PE values was linear over the entire concentration range of this element. The slope of the line fitting PE values as a function of T D P (=8"4) is 4.5-fold higher than the slope fitting PE values as a flmction of DIN in the low nitrogen range (= 1.8). This strengthens the assumption of a more significant role of phosphorus with respect to nitrogen in controlling the productivity of the coastal area. These results suggest that phosphorus is the primary limiting nutrient in this region as in the northern Adriatic (Chiaudani & Vighi, 1982). The analysis of PE values as a function of the D I N / T D P ratio (Figure 9) also showed hyperbolic behaviour as in the case of DIN. The increase of rates was sharp and quasi-linear up to a molar ratio N/P of about 16, assumed to be the optimal ratio for phytoplankton species (Redfield et al., 1963), then PE values tended to level off. Data of Figure 9 were described by the function (r=0"93; P=0"0001; SD=2.4)
PE= 5-48 - 15-35/(DIN/TDP) (4)
The Adriatic system with its low phosphorus content provides a good field oppor- tunity to investigate a possible role of dissolved phosphorus compounds other than orthophosphate in photosynthetic processes. While orthophosphate is directly taken up
Nutrients, standing crop and primary production 509
10:
"7 "7
lxo
h~
(a)
8
6
4
2
0 0
o o o o o / / o
/ 0 / 0
O 0 0 0 0
% I I I 0.1 0.2 0.3
PO4-P (laM)
0
0.4
"7 "7
10 (b)
8 -
6 -
c j
r...)
O O
0 O
©
O O
o v o q I I 0.2 0.4 0.6 0.8
TDP (laM)
Figure 8. Influence of (a) PO4-P; and (b) total dissolved phosphorus (TDP) concen- trations on photosynthetic efficiency (PE).
by cells, the other dissolved P species need a preliminary hydrolysis step, hence their contribution tends to become important in aquatic systems with low PO4-P concentra- tions (Heath, 1986; Bentzen et al., 1992; Comer & Wetzel, 1992). During this investigation, the chance arose to measure primary production rates in samples with undetectable PO4-P level. Table 4 gives the production of carbon, the corresponding demand of phosphorus estimated on the basis of the Redfield (1963) stoichiometry and the experimental concentrations of PO4-P and T D P in periods including undetectable PO4-P levels. Although the estimated P uptake could not correspond exactly to the actual value since the application of the Redfield (1963) stoichiometric model to the northern Adriatic system was recently questioned (Degobbis, 1990), Table 4 clearly shows that the demand of phosphorus by algae may not be entirely satisfied by the inorganic PO4-P available in the watery medium. On some occasions (particularly in July and September 1991), this demand was in fact 2-4-fold higher than the detection limit of orthophosphate (=0.01 ~tM), while in July 1991 (Table 4) all the samples showed PO4-P concentrations under the detection limit. It is interesting to note that the

510 A. Zoppini et al.
10
7 "7
¢D
8
o
6 -
4
2
I I I 0 32 48 64 80
<>
<>
<> <> .~ f
16 DIN-N/TDP
Figure 9. Relation between photosynthetic efficiency (PE) and the dissolved inorganic nitrogen (DIN-N)/total dissolved phosphorus (TDP) molar ratio.
production rates of carbon at SG01 and SG03 (0.5 and 3 m depth) were similar in September 1991, independently of the external availability of PO4-P. Possible alternative sources of phosphorus for photosynthetic processes include T D P compounds other than PO4-P available in the medium and phosphate stored inside the cells. Unfortunately, these data do not permit characterization of the P species responsible for the photo- synthetic capacity. However, they provide field evidence that a reasonable fraction of the overall photosynthetic production may occur during the summer period despite the very low or undetectable levels of PO4-P often found in the Adriatic waters in that period.
C o n c l u s i o n s
Advective transport of freshwaters coming from riverine inputs discharging into the northern Adriatic and water mass exchange between the northern and central Adriatic control nutrient concentrations and associated dependent assimilation-regeneration pro- cesses in coastal waters of the study area. Nutrient sources support a highly productive coastal belt where primary production amounts to 200-260 g C m - 2 year 1. Primary production decreases offshore reaching a level of about 120 g C m - 2 year - ~ at 15 NM which is in the range of values reported in the Po delta area. A rigorous comparison with previous primary production data is made difficult because of different conditions often used by various workers in the measure of primary production rates. The linear and hyperbolic dependences of the photosynthetic efficiency on total dissolved phosphorus and nitrogen, respectively, suggest a role of phosphorus in determining the photosyn- thetic capacity of coastal waters at the boundary between the northern and the central Adriatic. The exhaustion of orthophosphate in the presence of residual inorganic nitrogen occurring on some occasions would not, on its own, favour phosphorus

Nutrients, standing crop and primary production 511
TABLE 4. Carbon assimilated in 4-h incubation tests, related theoretical phosphorus uptake, experimental concentrations of orthophosphate and total dissolved phosphorus in periods characterized by orthophosphate exhaustion (<0.01 ~M)
Depth C P PO4-P TDP Date Station (m) ()~M) (~tM) (p.M) (p.M)
11 June 1991 SG01 0'5 1.48 0'013 0.03 0.12 3 1 '00 0.009 0.01 0'29
SG03 0-5 2"39 0'021 0"12 0.19 3 1'46 0"013 udl 0"65
SG05 0.5 0.79 0.007 0-03 0-11 3 0-61 0"005 0-08 0-08
3 July 1991 SG01 0"5 2"23 0-019 udl 0"12 3 2-65 0-023 udl 0.12
SG03 0"5 1'73 0.015 udl 0'14 3 1.83 0-016 udl 0.13
SG05 0"5 1.03 0.009 udl 0.16 3 1"10 0"010 udl 0"15
5 September 1991 SG01 0'5 4-68 0.040 0'08 0-35 3 3"83 0'033 udl 0-15
SG03 0.5 3.46 0.030 0"09 0.10 3 3.25 0-028 udl 0"25
SG05 0-5 0.56 0"005 udl 0.09 3 0"62 0-005 0-01 0.33
17 October 1991 SG01 0"5 0.61 0.005 udl 0"25 3 0.55 0.005 udl 0.33
SG03 0.5 0.47 0.004 0.02 0.11 3 0.75 0.006 0.09 0'21
SG05 0"5 0.10 0"001 0.04 0.19 3 0"32 0.003 0"04 0.21
27 November 1991 SG01 0.5 2.88 0.025 0.31 0.63 3 0.46 0.004 0-30 0-57
SG03 0.5 2.03 0.017 0.14 0-44 3 - - - - 0"16 0"37
SG05 0"5 0"31 0"003 udl 0-21 3 0"30 0"003 udl 0-22
SG01, SG03, SG05, sample stations; udl, under detection limit.
l imi ta t ion . T h e i n c r e a s e d co r re l a t ions o f T D P wi th C H L or P P w i t h r e spec t to t hose
s h o w n by P O 4 - P sugges t a p r o b a b l e role o f d i s so lved P species o t h e r t h a n P O 4 - P in the
p h o t o s y n t h e t i c p rocesses . T h u s , T D P s h o u l d be a b e t t e r i ndex t h a n P O 4 - P for
eva lua t i ng the p o t e n t i a l p r o d u c t i v i t y o f t he Adr i a t i c sys tem as sugges t ed by Ivanc ic a n d
D e g o b b i s (1987) . T h e p r e s e n c e o f a h igh ly p r o d u c t i v e coas ta l be l t at a b o u t 150 k m
sou th o f t he Po s t r e n g t h e n s the sugges t i on o f G i l m a r t i n et al. (1990) o f a b e t t e r
eva lua t i on o f the c o n t r i b u t i o n o f i n sho re wa te r s as a p r e r equ i s i t e for a m o r e accu ra t e
q u a n t i f i c a t i o n o f the b i o g e o c h e m i c a l cycle o f n u t r i e n t s in the Adr i a t i c sys tem.
T h e da ta set p r o v i d e d on p r i m a r y p r o d u c t i o n is, to the bes t o f o u r k n o w l e d g e , t he first
avai lable for this area. M o r e o v e r , it is p r e s e n t e d a long wi th r e l a t ed physica l , c h e m i c a l
a n d b io log ica l i n f o r m a t i o n c o n c e r n i n g the d i s t r i bu t i on o f salinity, n u t r i e n t s a n d s t a n d i n g
crop. U n f o r t u n a t e l y , the s t a n d i n g c rop m e a s u r e m e n t s in this s tudy w e r e p e r f o r m e d
fo l lowing the or ig ina l s t a n d a r d m e t h o d . W h i l s t these are c o m p a r a b l e wi th m o s t o f
p rev ious s tudies in the s a m e area they do n o t c o m p a r e wi th t he c o n t e m p o r a r y ones
w h i c h also take in to a c c o u n t t he role o f p i c o p l a n k t o n . E x p e r i m e n t a l da ta on b o t h c a r b o n
ass imi la t ion and n u t r i e n t r e g e n e r a t i o n in the coas ta l area e x t e n d i n g f r o m the n o r t h e r n to

512 A. Zoppini et al.
the central Adriatic will hopefully contribute to the reconciliation of the discrepancy. These should help to explain the lack of variation in the long-term primary production data set compared with the equivalent ratio of new and regenerated productions, the latter involving an upward trend over time corresponding to an increasing trend in nutrients load.
Ac kno wle dge me nt s
The authors wish to thank Dr Kenneth Lindrea on his sabbatical leave from La Trobe University (Bendigo, Victoria, Australia) for his revision of the English form of the paper. The authors also wish to thank F. Bacciu, L. Loreti, D. Mastroianni and Katia Della Sala for their analytical support in the determination of inorganic carbon, chlorophyll and nutrients. Thanks are also due to the crew of RV Lo Bianco.
References
APHA, AWWA, W P C F 1989 Standard Methods for the Examinath~n of Water and Wastewater (Clesceri, L. J., Greenberg, A. E. & Trussel, R. R., eds.). American Public Health Association, Washington DC, p. 17.
Andreoli, M. G., Artegiani, A., Azzolini, R. et al. 1985 Evoluzione annuale dei parametri idrobiologici su un transetto a sud-est di Ancona in corrispondenza delle barriere artificiali de l ITR.Pe .M. (campagna di rilevamento ZO.RI. 1980 1981). Quadet~zi Istituto Ricerehe Pesca Maritthna IV, 2, 103 147.
Artegiani, A. & Azzolini, R. 1981 Influence of the Po floods on the western Adriatic coastal water up to Ancona and beyond. Rapports Commissio~t Inte,tational pour l'E.xploration ScientJfique de la Mer l~,lediterranEe 26, 115 119.
Artegiani, A., Azzolini, R., Marzocchi, M., Morbidoni, M., Solazzi, A. & Cavolo, F. 1985 Prime osservazioni su un ' bloom ' fitoplanctonico lungo la costa marchigiana nell 'anno 1984. Nova Thalassia 7 (suppl. 3), 137-142.
Artegiani, A., Gacic, M., Michelato, A. et al. 1993 The Adriatic Sea hydrography and circulation in spring and au tumn (1985 1987). Deep-Sea Research H 40, in press.
Bentzen, E., Taylor, W. D. & Millard, E. S. 1992 The importance of dissolved organic phosphorus to phosphorus uptake by limnetic plankton. Lim~tolog3, and Oceanography 37, 217 231.
Buljan, M. & Zore-Armanda, M. 1976 Oceanographical properties of the Adriatic sea. Oceanography and Marine Biolo~3, Annual Review 14, 11 98.
Cabrini, M., Milani, L., Honsell, G. & Fonda Umani , S. 1987 88 Il fitoplancton in una stazione del golfo di Trieste da marzo 1989 a set tembre 1988: dati. Nova Thalassia 9, 11-51.
Chiaudani, G. & Vighi, M. 1982 Multistep approach to identification of limiting nutrients in Northern Adriatic eutrophied coastal waters. Water Research 16, 1161 1166.
Cordelia, P. & Cavolo, F. 1988 Una proposta metodologica sul conteggio del fitoplancton. GitnTtale Botanico ltaliam~ 122 (suppl. 1), 141.
C N M C A 1989 Soleggiamento e radiazh,te globale in Italia. Aeronautica Militare, Centro Nazionale di Metereologia e Climatolgia Aeronautica.
Comer, J. B. Jr. & Wetzel, R. G. 1992 Uptake of dissolved inorganic and organic phosphorus compounds by phytoplankton and bacterioplankton. Linmolo~ and Ocealtography 37, 232-243.
Degobbis, D. 1989 Increased eutrophication of the northern Adriatic sea. Second Act. Marine Pollution Bulletht 20, 452-457.
Degobbis, D. 1990 A stoichiometric model of nutrient cycling in the Northern Adriatic sea and its relation to regeneration processes. Mari~te Chemisn3, 29, 235-253.
Degobbis, D. & Gilmartin, M. 1990 Nitrogen, phosphorus and biogenic silicon budgets for the Northern Adriatic sea. Oeeam~logica Aeta 13, 31-45.
Degobbis, D., Gilmartin, M. & Revelante, N. 1986 An annotated nitrogen budget calculation for the Northern Adriatic sea. Marine Chemisny 20, 159-177.
Franco, P. 1984 Fattori influenti su]la produttivitfi primaria dell 'Adriatico settentrionale. Bolletthto di Oceanologia Teo~7'ca ed Applicata 2, 125 140.
Franco, P., Jeffic, Lj., Malanotte-Rizzoli, P., Michelato, A. & Orlic, M. 1982 Descriptive model of the northern Adriatic. Oceanologica Acta 5, 379 389.
Gilmartin, M., Degobbis, D., Revelante, N. & Smodlaka, N. 1990. The mechanisms controlling plant nutrient concentrations in the northern Adriatic sea. Inter~mtionale Revue der Gesamten Hydrobiologie 75, 425 445.

Nutrients, standing crop and primary production 513
Gilmartin, M. & Revelante, N. 1983 The phytoplankton of the Adriatic sea: standing crop and primary production. ThalassiaJugoslavica 19, 173-188.
Heath, R. T. 1986 Dissolved organic phosphorus compounds: Do they satisfy l~lanktonic phosphate demand in summer? Calmdian Jounlal Fisheries and Aquatic Science 43, 343-350.
Innamorati, M. 1990 Misurazione dell'irradianza. In Metodi nell'Ecologia del Plancton Marino (Innamorati, M., Ferrari, I., Marini, D., & Ribera D'Alcala, M., eds.). Nova Thalassia 11, 11-67.
Ivancic, I. & Degobbis, D. 1987 Mechanisms of production and fate of organic phosphorus in the northern Adriatic Sea. Marine Biolog3, 94, 117 125.
Kveder, R., Revelante, N., Smodlaka, N. & Skrivanic, A. 1971 Some characteristics of phitoplankton and phytoplankton productivity in the northern Adriatic. Thalassia Jugoslavica 7, 151 158.
Marchetti, R. 1990 Algal blooms and gel production in the Adriatic sea. In Eutrophicated-relatedphenomena in the Adriatic Sea and in Other A,fediten'anean coastal ~ones (Barth, H. & Fegan, L., eds.), Commission of the European Communities, Water Pollution Research Report 16, CEE-EUR 12978, 21-42.
Marzocchi, M., Artegiani, A., Solazzi, A. et al. 1989 Variazioni annuali dei popolamenti fitoplanctonici e dei parametri ambientali nella baia di Portonovo (Ancona) 1982 1986. Nova Thalassia 10 (suppl. 1), 125-133.
Montanari, G., Nespoli, G. & Rinaldi, A. 1984 Formazione di condizioni anossiche helle acque marine costiere della Emilia-Romagna dal 1977 al 1982. IttqttiTlamento 11, 33-39.
Morel, A. & Smith, R. C. 1974 Relation between total quanta and total energy, for aquatic photosynthesis. Limm~h~gv and Oceanog~'aplLv 19~ 591 600.
Parsons, T. R., Maita, Y. & Lalli, C. M. 1983 A Manual of Chemical and Bh~logical l~lethods for Seawater Analysis. Pergamon Press, Oxford,
Pucher-Petkovic, T., Zore-Armanda, M. & Kacic, I. 1971 Primary and secondary production of the middle Adriatic in relation to climatic factors. Thalassia Jugoslavica 7, 301-311.
Redfield, A. C., Ketchum, B. H. & Richards, F. A. 1963 The influence of organisms on the composition of seawater. In Tire Sea (Hill, M. N., ed.). Interscience Publishers, New York, pp. 27-77~
Revelante, N. & Gilmartin, M. 1977 The effects of northern Italian Rivers and eastern mediterranean ingressions on the phytoplankton of the Adriatic sea. Hydrobiology 56, 229-240.
Revelante, N. & Gilmartin, M. 1983 The phytoplankton of the Adriatic Sea: Community structure and characteristics. Thalassia Jugoslavica 19, 303-318.
Revelante, N. & Gilmartin, M. 1992 The lateral advection of particulate organic matter from the Po Delta region during summer stratification, and its implications for the northern Adriatic. Estuarine, Coastal and Shelf Science 35, 191 212.
Riegman, R. & Colijn, F. 1991 Evaluation of measurements and calculation of primary production in the Dogger Bank area (North sea) in summer 1988. Marine Ecology l~'og~'ess Series 69, 125-132.
Scaccini Cicatelli, M. 1985/86 L'influence du Po sur les eaux marines cotieres devant Fano (1972-1981). Thalassia Jugoslavica 21122, 75-83.
Smodlaka, N. 1986 Primary production of the organic matter as an indicator of the eutrophication in the northern Adriatic sea. The Sciel~ce of Total Environment 56, 211 220.
Smodlaka, N. & Revelante, N. 1983 The trend of phytoplankton production in the northern Adriatic sea: a twelve year survey. Rapport Commission Itttertlational pour l'Exploration Seietttifique de la Mer Mediterra~t~e 28~ 89 90.
Taylor, F. J. R. 1978 Dinoflagellates. In Phytoplankton Manual (Sournia, A., ed.). Monographs on Oceanographic Methodology 6, UNESCO, Paris, pp. 143-147.
Throndsen, J. 1978 Preservation and storage. In Phytoplankton Manual (Sournia, A., ed.). Monographs on Oceanographic Methodology 6~ UNESCO, Paris pp. 69-74.
UNESCO 1978 Meeting of Nathnlal Committee for the bzte~Ttational Hydrobiolog~'cal Programme of Mediterra- nean CountrTes, Rome, 9-12 October 1978. IMP/MED/1.
Voltolina, D. 1975 The phytoplankton of the lagoon of Venice: November 1971-November 1972. Pubblicazione Stazione Zoologica di Napoli 39, 206-340.