Nutrient management in China Part 1 Nutrient balances and ...

Revista Biotemas, 23 (1), março de 2010
211
Nutrient variations and coastal water quality of Santa Catarina
Island, Brazil
José Carlos Simonassi1, 2*
Mariana Coutinho Hennemann1
Dávia Talgatti3
Aguinaldo Nepomuceno Marques Jr.2
1Núcleo de Estudos do Mar, Centro de Ciências BiológicasUniversidade Federal de Santa Catarina, CEP 88.040-900, Florianópolis – SC, Brazil
2PPG em Biologia Marinha, Departamento de Biologia Marinha, Instituto de Biologia Universidade Federal Fluminense, Niterói – RJ, Brazil3PPG em Biologia Vegetal, Departamento de Botânica, Centro de Ciências Biológicas Universidade Federal de Santa Catarina, Florianópolis, SC – Brazil
*Corresponding [email protected]
Submetido em 07/08/2009Aceito para publicação em 21/12/2009
Resumo
Variação dos nutrientes e qualidade das águas costeiras da Ilha de Santa Catarina, Brasil. No presente estudo, investigou-se a variação sazonal dos nutrientes e da qualidade da água costeira da Ilha de Santa Catarina (SCI) entre Agosto/2006 e Fevereiro/2008. As amostras de água foram analisadas segundo: temperatura, salinidade, pH, oxigênio dissolvido, material particulado em suspensão, cloroila-a, nitrogênio inorgânico dissolvido (NID) (nitrito + nitrato + amônia), fosfato, silicato, nitrogênio total (NT) e fósforo total (PT). Os resultados mostraram que na Baia Norte a temperatura da água e salinidade apresentam maior variação que no Pântano do Sul. Os valores médios de temperatura e salinidade de 17,6oC e 34,8 no inverno e 18,1oC e 34,6 na primavera, bem como a maior concentração de nitrato de 4,12µM neste último período estão fortemente relacionados com as assinaturas da Água de Plataforma Subtropical (APST) e da Água Central do Atlântico Sul (ACAS), respectivamente. As razões N:P (NID:fosfato) e Si:N (silicato:NID) indicam que o nitrogênio é o nutriente limitante para a área. Ademais as concentrações de nutrientes inorgânicos dissolvidos são mais baixas que em outras áreas costeiras urbanizadas da Plataforma Sudeste Brasileira (PSB). A avaliação do estado tróico indica que as águas costeiras da SCI podem em geral ser classiicadas como mesotróicas, chegando a eutróicas em alguns períodos do ano.
Unitermos: eutroização, parâmetros físico-químicos, ressurgência, urbanização, zona costeira
Abstract
In the present study, seasonal variations of nutrient concentration and water quality of two coastal areas of Santa Catarina Island (SCI) were investigated from August 2006 to February 2008. Water samples were analyzed for temperature, salinity, pH, dissolved oxygen, suspended particulate matter (SPM), chlorophyll-a, dissolved inorganic nitrogen (DIN) (nitrite + nitrate + ammonium), phosphate, silicate, total nitrogen (TN) and total phosphorus (TP). The results showed that water temperature and salinity in the North Bay present greater
Biotemas, 23 (1): 211-223, março de 2010
ISSN 0103 – 1643

Revista Biotemas, 23 (1), março de 2010
212 J. C. Simonassi et al.
variation than in Pantano do Sul. The average values of temperature and salinity of 17.6oC and 34.8 in the winter, 18.1oC and 34.6 in the spring, and the highest nitrate concentrations of 4.12µM (in the spring), are strongly related to the signatures of Subtropical Shelf Water (STSW) and South Atlantic Central Water (SACW) respectively. The low N:P (DIN:phosphate) and high Si:N (silicate:DIN) ratios indicate that nitrogen is the limiting nutrient in the area. In addition, dissolved inorganic nutrient concentrations are lower than in other urbanized coastal areas in the Southeastern Brazilian Bight (SBB). The trophic state evaluation showed that SCI coastal waters can be classiied in general as mesotrophic, reaching eutrophic conditions during some periods of the year.
Key words: coastal zone, eutrophication, physicochemical parameters, upwelling, urbanization
Introduction
The nutrient input to the coastal areas has been dramatically increasing in the last decades due to intensiication of human activities and urbanization along coastal regions (Newton et al., 2003; Newton and Mudge, 2005). For example, the amount of nitrogen more than doubled in the coastal environments of the globe from 1960 to 1990 (NRC, 2000). This has led to eutrophication and deterioration of water quality in many coastal zones of the world (Nixon, 1995; Kjerfve et al., 1997; Braga et al., 2000; Newton et al., 2003).
Eutrophication of coastal areas can be severe since these areas act as natural ilters for suspended sediments and nutrients coming from the land to the open sea. The most apparent effects are the proliferation of harmful algal blooms and the hypoxia near the bottom of the water column (Vollenweider, 1992; Nixon, 1995), which can contribute to the decline of isheries and may affect human health (Braga et al., 2000; Carreira et al., 2002). Besides the role of land nutrient discharge, the nutrient concentration variations of coastal marine waters can also be related to oceanic sources, as in the case of areas subject to coastal upwelling events (Matsuura, 1986; Gonzalez-Rodriguez et al., 1992; Valentin et al., 1994). During these events the productivity increases and the temporal variation in the nutrient concentrations in waters can be high (Valentin et al., 1994; Fock, 2003; Brandini et al., 2007).
Estuarine areas in the Southeastern Brazilian Bight (SBB) (22.0o – 28.4oS), such as Santos Bay (São Paulo State) and Guanabara Bay (Rio de Janeiro State), have experienced decades with a high discharge of pollutants (Kjerfve et al., 1997; Braga et al., 2000; Marques Jr. et al., 2006). The SBB is one of the most productive areas
of the Brazilian coast, supporting more than 20% of Brazilian industrial isheries (Paes and Moraes, 2007; Möller Jr. et al., 2008). However, in Guanabara Bay (e.g.) untreated sewage discharge has rendered the water inadequate for recreational use and caused 90% isheries decline (Kjerfve et al., 1997; Carreira et al., 2002).
Like these areas, the SCI has suffered from the signiicant population growth and increase of human activities in recent decades, and the results of this process for the local coastal environment are still unknown.
Despite high levels of land nutrient input from urbanized areas, the temporal variation of nutrients in SCI coastal waters seems to be also inluenced by upwelling of the South Atlantic Central Water (SACW). Similarly, another source of nutrients to the inner shelf of SBB in the region is the Subtropical Shelf Water (STSW) (Piola et al., 2008; Möller Jr. et al., 2008).
This paper reports the temporal variation in the physicochemical and biological characteristics of water in two areas representing the inner and outer coast of Santa Catarina Island, southern Brazil, as well as the factors that contribute to these variations.
Material and Methods
Study area
Santa Catarina Island (SCI) is located in the southern part of the SBB and presents a great variety of ecosystems. Consequently, it represents an important nursery for a great diversity of species, and many of these have great economic value (Sierra de Ledo, 1997; Soriano-Sierra and Sierra de Ledo, 1998).
The main oceanographic features in the region can be described considering the occurrence of water masses

Revista Biotemas, 23 (1), março de 2010
213Nutrient and coastal water quality of Santa Catarina Island
such as: i) the Tropical Water (TW) characterized by temperature > 20.0oC and salinity > 36.0; ii) the Coastal Water (CW) with temperature > 22.0oC and salinity < 35.0; iii) the South Atlantic Central Water (SACW) with temperature < 18.0oC and salinity 34.4 – 36.0, (Matsuura, 1986; Valentin, 1994); iv) the Plata Plume Water (PPW) that reaches the region during winter; and v) Subtropical Shelf Water (STSW), a cold water with temperature > 14.0oC and salinity 33.5 – 36.0 which originates from a mixture of PPW and TW (Möller Jr. et al., 2008; Piola et al., 2008), and by the synoptic scale of the meteorological processes which occur in the region.
The tidal regime is semidiurnal with an average range of 0.52m (Soriano-Sierra and Sierra de Ledo, 1998). The climate in the region is characterized by a good distribution of rainfall throughout the year without a rainy season (Cruz, 1998).
The population in the SCI and the adjacent coastal region is about 800,000 inhabitants (IBGE, 2007). The most important economic activities are tourism during the summer, bivalve aquaculture in the bays, and artisanal ishing.
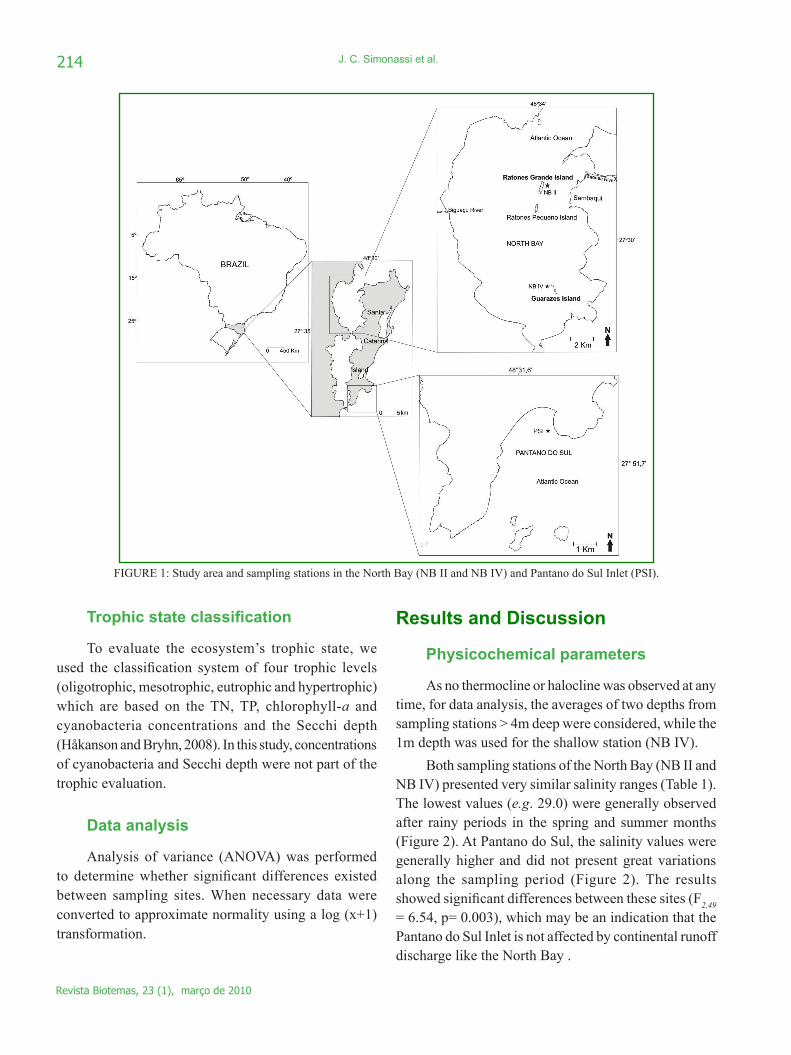
In the present study, water samples were collected in two different areas on the SCI coast: (1) North Bay (NB), a shallow bay with 146 km2 area, measuring about 19km in length and 0.5 to 12km in width, located between the SCI and the mainland. It is connected with the South Bay by a channel (~ 500m width), and with the open ocean to the north. The bay bottom is covered predominantly by silt and clay (Silva, 2002), and hydrodynamics is mainly controlled by the tide currents. The NB region is highly urbanized and receives discharge from rivers with pollutants such as domestic and agriculture efluents (Sierra de Ledo, 1997; Cruz, 1998). (2) The Pantano do Sul Inlet (PSI) is located in the southern region on the oceanic side of SCI and far from the urbanized center. Fisheries and tourism are the main activities. The PSI is limited by rocky shores on both sides. The rocky shore on the eastern side, which is ~ 1000m in length, plays an essential role for the protection of the inlet from waves. The bottom sediments of PSI are predominantly composed by ine sand. Due to its location, the south winds play a major inluence in the oceanographic conditions (Gallucci and Netto, 2004).
Water sampling and analysis
Water samples were collected monthly at NB and PSI from August 2006 to February 2008, at three sampling stations: (a) North Bay II (NB II) with 9m depth located in the outer part of the bay; (b) North Bay IV (NB IV) with 4m depth in the inner part of the bay; and (c) Pantano do Sul Inlet (PSI) with 12m depth. Samples were collected at two depths in the stations NB II (1 and 7m) and PSI (1 and 10m), and at a single depth (1m) in the NB IV station using a 2.5L Van Dorn bottle (Figure 1).
Temperature and dissolved oxygen (DO) were measured in situ with portable probes (HACH-16046) and salinity was measured using a conductivity electrode (HACH-2100P).
A water subsample (1L) was directly filtered through cellulose acetate membrane (Schleicher & Schuell – 0.45µm, 47mm ∅) to separate the dissolved and particulate material. The material retained on the ilters was used for pigment analysis. Chlorophyll-a was extracted with 90% acetone and determined by spectrophotometry following SCOR-UNESCO (1966). The concentrations were calculated using equations according to Lorenzen (1967).
The dissolved inorganic nitrogen (DIN) – ammonium (N-NH
4+), nitrite (N-NO
2-) and nitrate
(N-NO3-) –, phosphate (P-PO
43-), silicate (Si-Si(OH)
4),
and the total nitrogen (TN) and total phosphorus (TP) were analyzed with aliquots of 100 ml of filtered subsample. Analysis was performed following standard colorimetric techniques according to Grasshoff et al. (1983).
The suspended particulate matter (SPM) concentrations were obtained with iltration of a second water subsample (1 L) through a precombusted iber glass ilter (Millipore – 0.7µm, 47mm ∅) according to the gravimetric technique described by Strickland and Parsons (1972).
Meteorological data used in this study were provided by EPAGRI-CIRAM and were recorded at the São José weather station (27º36’07”S - 48º37’11”W).
Revista Biotemas, 23 (1), março de 2010
214 J. C. Simonassi et al.
Trophic state classiication
To evaluate the ecosystem’s trophic state, we used the classiication system of four trophic levels (oligotrophic, mesotrophic, eutrophic and hypertrophic) which are based on the TN, TP, chlorophyll-a and cyanobacteria concentrations and the Secchi depth (Håkanson and Bryhn, 2008). In this study, concentrations of cyanobacteria and Secchi depth were not part of the trophic evaluation.
Data analysis
Analysis of variance (ANOVA) was performed to determine whether signiicant differences existed between sampling sites. When necessary data were converted to approximate normality using a log (x+1) transformation.
Results and Discussion
Physicochemical parameters
As no thermocline or halocline was observed at any time, for data analysis, the averages of two depths from sampling stations > 4m deep were considered, while the 1m depth was used for the shallow station (NB IV).
Both sampling stations of the North Bay (NB II and NB IV) presented very similar salinity ranges (Table 1). The lowest values (e.g. 29.0) were generally observed after rainy periods in the spring and summer months (Figure 2). At Pantano do Sul, the salinity values were generally higher and did not present great variations along the sampling period (Figure 2). The results showed signiicant differences between these sites (F
2,49
= 6.54, p= 0.003), which may be an indication that the Pantano do Sul Inlet is not affected by continental runoff discharge like the North Bay .
FIGURE 1: Study area and sampling stations in the North Bay (NB II and NB IV) and Pantano do Sul Inlet (PSI).
6
(Millipore – 0.7µm, 47mm ∅) according to the gravimetric technique described by
Strickland and Parsons (1972).
FIGURE 1: Study area and sampling stations in the North Bay (NB II and NB IV) and Pantano
do Sul Inlet (PSI).
Meteorological data used in this study were provided by EPAGRI-CIRAM and
were recorded at the São José weather station (27º36’07”S - 48º37’11”W).
Trophic state classification
To evaluate the ecosystem’s trophic state, we used the classification system of
four trophic levels (oligotrophic, mesotrophic, eutrophic and hypertrophic) which are
based on the TN, TP, chlorophyll-a and cyanobacteria concentrations and the Secchi
depth (Håkanson and Bryhn (2008). In this study, concentrations of cyanobacteria and
Secchi depth were not part of the trophic evaluation.

Revista Biotemas, 23 (1), março de 2010
215Nutrient and coastal water quality of Santa Catarina Island
TABLE 1: Summary of the physicochemical and biological parameters of water for Pantano do Sul Inlet and North Bay sampling stations - NB II and NB IV. (n = 18). (O
2 in mg.L-1, PSM in mg.L-1, chlorophyll-a in µg.L-1 and nutrients
in µM) (*n = 15).
VariablePantano do Sul NB II NB IV
Average (± Sd) Range Average (± Sd) Range Average (± Sd) Range
T ºC 19.2 (2.06) 17.0 – 23.75 22.3 (3.49) 16.5 - 27.8 22.8 (3.86) 16.5 - 28.2
Salinity 34.7 (0.82) 33.8 – 36.0 32.9 (1.92) 29.05 - 35.5 32.9 (2.03) 30.0 - 35.5
pH 8.1 (0.15) 7.9 - 8.3 8.1 (0.27) 7.6 - 8.7 8.2 (0.26) 7.8 - 8.7
O2
9.0 (1.08) 5.95 - 10.4 8.9 (1.18) 5.15 - 10.3 8.9 (0.99) 6.2 - 10.2
SPM 15.0 (12.06) 5.71 - 46.71 20.5 (12.44) 8.57 - 48.71 28.3 (25.63) 8.71 - 96.75
Chl-a 3.0 (1.59) 0.67 – 5.97 2.7 (1.13) 1.35 – 5.74 3.8 (1.70) 1.86 – 9.11
NO2- 0.2 (0.15) ND – 0.48 0.1 (0.06) 0.01 – 0.22 0.1 (0.06) ND – 0.23
NO3- 1.1 (1.20) 0.11 – 4.12 0.5 (0.51) ND – 1.40 0.4 (0.51) ND – 1.50
NH4- 1.3 (0.70) 0.54 – 3.14 1.2 (0.51) 0.66 – 2.65 1.0 (0.34) 0.57 – 1.67
PO43+ 0.6 (0.18) 0.34 – 0.89 0.6 (0.11) 0.29 – 0.74 0.5 (0.10) 0.35 – 0.70
Si(OH)4
8.2 (2.97) 1.86 – 11.77 10.1 (4.22) 3.83 – 16.56 10.5 (5.09) 2.75 – 23.13
TN* 23.7 (17.82)10.92 – 72.47
19.5 (8.09) 11.03 – 41.46 18.9 (7.33)10.26 – 34.04
TP* 1.2 (0.78) 0.45 – 3.48 1.0 (0.28) 0.65 – 1.71 1.2 (0.44) 0.69 – 2.42
N:P 5.0 (2.92) 1.42 - 10.07 3.1 (1.73) 1.55 - 7.20 2.7 (1.10) 1.31 - 5.53
Si:N 4.0 (2.23) 0.68 - 8.68 6.6 (3.19) 2.47 - 14.20 7.7 (3.50) 1.02 - 15.52
NT:PT 19.8 (7.16) 9.97 – 39.72 21.0 (7.16) 10.92 - 38.76 18.0 (8.88) 8.17 - 33.65
9
NB II
NB IV
P. Sul
Precipitation
Month /Year
07/06 09/06 11/06 01/07 03/07 05/07 07/07 09/07 11/07 01/08 03/08
Pre
cip
ita
tion
(m
m)
0
5
10
15
20
25
30
35
Salin
ity
28
30
32
34
36
38
precipitation
Pantano do Sul
NB II
NB IV
FIGURE 2: Temporal variation of salinity and precipitation (20 days’ average - July 2006 to
March 2008) at the North Bay (NB II and NB IV) and Pantano do Sul Inlet
sampling stations.
Month/Year
08/06 10/06 12/06 02/07 04/07 06/07 08/07 10/07 12/07 02/08
Te
mp
era
ture
( o
C)
16
18
20
22
24
26
28
30
NB II
NB IV
Pantano do Sul
FIGURE 3: Temporal variation of water temperature at the North Bay sampling stations and
Pantano do Sul Inlet station, from August 2006 to February 2008 (SACW is
presented with key threshold value 18oC).
Temporal variation of nutrients in the water column
There are a few studies about the nutrients and water quality of the coastal
waters of SCI. For the North Bay, some studies have been carried out at the margins of
the bay in some rivers and channels (Assumpção et al., 1993; Laurenti et al., 1996) and
FIGURE 2: Temporal variation of salinity and precipitation (20 days’ average - July 2006 to March 2008) at the North Bay (NB II and NB IV) and Pantano do Sul Inlet sampling stations.

Revista Biotemas, 23 (1), março de 2010
216 J. C. Simonassi et al.
As expected, the water temperature at the North Bay stations (NB II; NB IV) was signiicantly higher than at the PSI station (F
2,51 = 6.517, p= 0.003), but the
temporal variation was similar in both areas (Figure 3). The highest temperature values in NB (28.2ºC) and in PSI (23.7ºC) were observed during the summer and early autumn months (e.g. March, 2007). The winter and spring months (e.g. August and October) were characterized by cold waters with temperatures reaching 17.0 – 18.0ºC, mainly in PSI, as a result of hydrological patterns of the SBB.
Möller Jr. et al. (2008) and Piola et al. (2008) described the occurrence of a cold water mass during the winter at SBB, the Plata Plume Water (PPW) occupying a narrow strip along the coast. At its northern limit (~ 27oS), PPW gets mixed with Tropical Water (TW) to form the Subtropical Shelf Water (STSW) with temperature > 14.0oC and salinity 33.5 – 36.0, that covers the inner shelf in the region.
During the spring and summer months, the favorable upwelling (northeasterly) winds prevail over most of the shelf, resulting in enhanced upwelling of the cold and nutrient rich SACW in the region (Matsuura, 1986; Valentin 1994; Möller Jr. et al., 2008). On the other hand, during the winter the strong S-SW winds, associated with atmospheric frontal systems, inhibit the upwelling events while promoting the presence of
cold waters (e.g. PPW) (Möller Jr. et al., 2008; Piola et al., 2008).
Our results showed that the average values of temperature and salinity in the winter were 17.6oC and 34.8 respectively, while the averages for the spring were 18.1oC and 34.6. These values are associated with the presence of STSW and SACW in the SCI coastal area.
Temporal variation of nutrients in the
water column
There are a few studies about the nutrients and water quality of the coastal waters of SCI. For the North Bay, some studies have been carried out at the margins of the bay in some rivers and channels (Assumpção et al., 1993; Laurenti et al., 1996) and estuarine systems (Pagliosa, 2004). Presently, there is no available information about the Pantano do Sul Inlet.
The nitrate concentrations of the North Bay stations ranged from undetectable to 1.50µM. These values were lower than those described in previous studies (Assumpção et al., 1993; Laurenti et al., 1996; Pagliosa, 2004). Our results were also lower than those observed in estuarine areas of SBB such as Santos Bay (São Paulo coast) and Guanabara Bay (Rio de Janeiro coast) (Kjerfve et al., 1997; Braga et al., 2000; Marques Jr. et al., 2006), but they fell within the range of concentrations
FIGURE 3: Temporal variation of water temperature at the North Bay sampling stations and Pantano do Sul Inlet station, from August 2006 to February 2008 (SACW is presented with key threshold value 18oC).
9
NB II
NB IV
P. Sul
Precipitation
Month /Year
07/06 09/06 11/06 01/07 03/07 05/07 07/07 09/07 11/07 01/08 03/08
Pre
cip
ita
tion
(m
m)
0
5
10
15
20
25
30
35
Salin
ity
28
30
32
34
36
38
precipitation
Pantano do Sul
NB II
NB IV
FIGURE 2: Temporal variation of salinity and precipitation (20 days’ average - July 2006 to
March 2008) at the North Bay (NB II and NB IV) and Pantano do Sul Inlet
sampling stations.
Month/Year
08/06 10/06 12/06 02/07 04/07 06/07 08/07 10/07 12/07 02/08
Te
mp
era
ture
( o
C)
16
18
20
22
24
26
28
30
NB II
NB IV
Pantano do Sul
FIGURE 3: Temporal variation of water temperature at the North Bay sampling stations and
Pantano do Sul Inlet station, from August 2006 to February 2008 (SACW is
presented with key threshold value 18oC).
Temporal variation of nutrients in the water column
There are a few studies about the nutrients and water quality of the coastal
waters of SCI. For the North Bay, some studies have been carried out at the margins of
the bay in some rivers and channels (Assumpção et al., 1993; Laurenti et al., 1996) and
Revista Biotemas, 23 (1), março de 2010
217Nutrient and coastal water quality of Santa Catarina Island
registered by Gianesella and Saldanha-Correa (2003) and Brandini et al. (2007) in São Sebastião (São Paulo coast) and the coastal area of Parana State, respectively.
Since the North Bay is the most urbanized area of the SCI, low nitrate concentrations can be due to the input of nitrogen from the land which consists mainly of dissolved and particulate organic nitrogen (DON and PON). Another factor that contributes to these low concentrations is the assimilation by non-planktonic photoautotrophs (e.g. macroalgae, macrophytes, microphytobenthos, etc.).
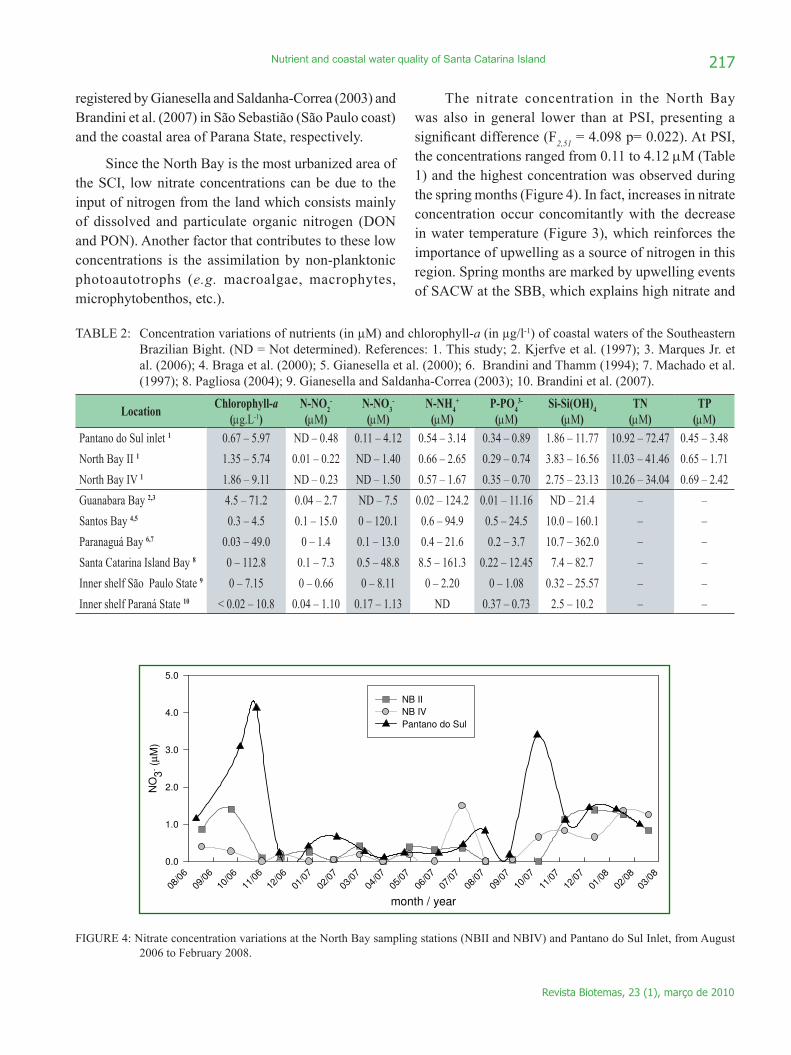
The nitrate concentration in the North Bay was also in general lower than at PSI, presenting a signiicant difference (F
2,51 = 4.098 p= 0.022). At PSI,
the concentrations ranged from 0.11 to 4.12 µM (Table 1) and the highest concentration was observed during the spring months (Figure 4). In fact, increases in nitrate concentration occur concomitantly with the decrease in water temperature (Figure 3), which reinforces the importance of upwelling as a source of nitrogen in this region. Spring months are marked by upwelling events of SACW at the SBB, which explains high nitrate and
TABLE 2: Concentration variations of nutrients (in µM) and chlorophyll-a (in µg/l-1) of coastal waters of the Southeastern Brazilian Bight. (ND = Not determined). References: 1. This study; 2. Kjerfve et al. (1997); 3. Marques Jr. et al. (2006); 4. Braga et al. (2000); 5. Gianesella et al. (2000); 6. Brandini and Thamm (1994); 7. Machado et al. (1997); 8. Pagliosa (2004); 9. Gianesella and Saldanha-Correa (2003); 10. Brandini et al. (2007).
LocationChlorophyll-a
(µg.L-1)
N-NO2
-
(µM)
N-NO3
-
(µM)
N-NH4
+
(µM)
P-PO4
3-
(µM)
Si-Si(OH)4
(µM)
TN
(µM)
TP
(µM)
Pantano do Sul inlet 1 0.67 – 5.97 ND – 0.48 0.11 – 4.12 0.54 – 3.14 0.34 – 0.89 1.86 – 11.77 10.92 – 72.47 0.45 – 3.48
North Bay II 1 1.35 – 5.74 0.01 – 0.22 ND – 1.40 0.66 – 2.65 0.29 – 0.74 3.83 – 16.56 11.03 – 41.46 0.65 – 1.71
North Bay IV 1 1.86 – 9.11 ND – 0.23 ND – 1.50 0.57 – 1.67 0.35 – 0.70 2.75 – 23.13 10.26 – 34.04 0.69 – 2.42
Guanabara Bay 2,3 4.5 – 71.2 0.04 – 2.7 ND – 7.5 0.02 – 124.2 0.01 – 11.16 ND – 21.4 – –
Santos Bay 4,5 0.3 – 4.5 0.1 – 15.0 0 – 120.1 0.6 – 94.9 0.5 – 24.5 10.0 – 160.1 – –
Paranaguá Bay 6,7 0.03 – 49.0 0 – 1.4 0.1 – 13.0 0.4 – 21.6 0.2 – 3.7 10.7 – 362.0 – –
Santa Catarina Island Bay 8 0 – 112.8 0.1 – 7.3 0.5 – 48.8 8.5 – 161.3 0.22 – 12.45 7.4 – 82.7 – –
Inner shelf São Paulo State 9 0 – 7.15 0 – 0.66 0 – 8.11 0 – 2.20 0 – 1.08 0.32 – 25.57 – –
Inner shelf Paraná State 10 < 0.02 – 10.8 0.04 – 1.10 0.17 – 1.13 ND 0.37 – 0.73 2.5 – 10.2 – –
12
A
month / year
08/0
6
09/0
6
10/0
6
11/0
6
12/0
6
01/0
7
02/0
7
03/0
7
04/0
7
05/0
7
06/0
7
07/0
7
08/0
7
09/0
7
10/0
7
11/0
7
12/0
7
01/0
8
02/0
8
03/0
8
NO
3- (µ
M)
0.0
1.0
2.0
3.0
4.0
5.0
NB II
NB IV
Pantano do Sul
FIGURE 4: Nitrate concentration variations at the North Bay sampling stations (NBII and
NBIV) and Pantano do Sul Inlet, from August 2006 to February 2008.
The phosphate concentrations tended also to be low in both NB and PSI
sampling areas. At the NB stations, the concentrations ranged from 0.29 to 0.74µM
(Table 1). In PSI, the phosphate concentrations were similar, but slightly higher than
those from NB, ranging from 0.34 to 0.89µM. Theses values were in the range of
concentrations measured in other coastal areas of the SBB (Gianesella and Saldanha-
Correa, 2003; Brandini et al., 2007) and less variable than those from more urbanized
bays (e.g. Santos and Guanabara Bay) (Kjerfve et al., 1997; Braga et al., 2000; Marques
Jr. et al., 2006) (Table 2). Like nitrate, the temporal variation of phosphate in PSI
increased during the spring and winter months, and this pattern can also be associated
with SACW and STSW waters respectively.
As opposed to the previous nutrients, silicate concentrations were higher at NB,
and ranged from 3.83 to 16.56 µM and 2.75 to 23.13 µM at NB II and NB IV sampling
stations, respectively (Figure 5). During certain periods, the silicate concentrations were
twice as high at NB than at PSI, where the values ranged from 1.86 to 11.77µM (Table
1). The temporal trends of silicate were similar at the three sampling stations. At NB,
some peaks were related with the decrease of salinity due to the increase of continental
runoff during rainy periods (Figure 2). NB is surrounded by a densely populated urban
region, and the degradation of surrounding natural areas (e.g. by deforestation)
contributes with an increase of sediment input to the coastal marine system.
FIGURE 4: Nitrate concentration variations at the North Bay sampling stations (NBII and NBIV) and Pantano do Sul Inlet, from August 2006 to February 2008.

Revista Biotemas, 23 (1), março de 2010
218 J. C. Simonassi et al.
low water temperature (Matsuura, 1986; Gonzalez-Rodriguez et al., 1992; Marques Jr. et al.; 2006).
Increases of nitrate concentration were also observed during the winter of 2007 (Figure 4) and these peaks also occurred concomitantly with the presence of cold waters. The nitrate peaks were less pronounced than those of the spring months and may have been associated with the occurrence of STSW at the inner SBB. Other dissolved inorganic nitrogen forms (e.g. ammonium and nitrite) analyzed during this study did not present a temporal pattern, making their interpretation dificult.
The phosphate concentrations tended also to be low in both NB and PSI sampling areas. At the NB stations, the concentrations ranged from 0.29 to 0.74µM (Table 1). In PSI, the phosphate concentrations were similar, but slightly higher than those from NB, ranging from 0.34 to 0.89µM. Theses values were in the range of concentrations measured in other coastal areas of the SBB (Gianesella and Saldanha-Correa, 2003; Brandini et al., 2007) and less variable than those from more urbanized bays (e.g. Santos and Guanabara Bay) (Kjerfve et al., 1997; Braga et al., 2000; Marques Jr. et al., 2006) (Table 2). Like nitrate, the temporal variation of phosphate in PSI increased during the spring and winter months, and this pattern can also be associated with SACW and STSW waters respectively.
As opposed to the previous nutrients, silicate concentrations were higher at NB, and ranged from 3.83
to 16.56 µM and 2.75 to 23.13 µM at NB II and NB IV sampling stations, respectively (Figure 5). During certain periods, the silicate concentrations were twice as high at NB than at PSI, where the values ranged from 1.86 to 11.77µM (Table 1). The temporal trends of silicate were similar at the three sampling stations. At NB, some peaks were related with the decrease of salinity due to the increase of continental runoff during rainy periods (Figure 2). NB is surrounded by a densely populated urban region, and the degradation of surrounding natural areas (e.g. by deforestation) contributes with an increase of sediment input to the coastal marine system.
The inluence of the land input into the bay was also observed through the temporal variation of suspended particulate matter concentrations (SPM). The highest concentration was registered at the inner sampling station of the North Bay (NB IV), where the average was 28.3mg.L-1 (Table 1), almost twice the average value observed at PSI (15.04mg.L-1).
The nutrient concentrations are directly related with primary production, and phytoplankton biomass can be estimated through chlorophyll-a. The average concentrations of chlorophyll-a were quite similar at the three sampling stations with 2.7 µg.L-1 (NB II), 3.8 µg.L-1 (NB IV) and 3.0 µg.L-1 (PSI). In the North Bay the concentrations ranged from 1.35 to 9.11 µg.L-1, while at the PSI it ranged from 0.67 to 5.97 µg.L-1 (Table 1). Despite the similarity of the concentrations between
13
month / year
08/0
6
09/0
6
10/0
6
11/0
6
12/0
6
01/0
7
02/0
7
03/0
7
04/0
7
05/0
7
06/0
7
07/0
7
08/0
7
09/0
7
10/0
7
11/0
7
12/0
7
01/0
8
02/0
8
03/0
8
Si (O
H) 4
(µ
M)
5.0
10.0
15.0
20.0
25.0
NB II
NB IV
Pantano do Sul
FIGURE 5: Silicate concentration variations at the North Bay sampling stations (NB II and NB
IV) and Pantano do Sul Inlet, from August 2006 to February 2008
The influence of the land input into the bay was also observed through the
temporal variation of suspended particulate matter concentrations (SPM). The highest
concentration was registered at the inner sampling station of the North Bay (NB IV),
where the average was 28.3mg.L-1
(Table 1), almost twice the average value observed at
PSI (15.04mg.L-1
).
The nutrient concentrations are directly related with primary production, and
phytoplankton biomass can be estimated through chlorophyll-a. The average
concentrations of chlorophyll-a were quite similar at the three sampling stations with
2.7 µg.L-1
(NB II), 3.8 µg.L-1
(NB IV) and 3.0 µg.L-1
(PSI). In the North Bay the
concentrations ranged from 1.35 to 9.11 µg.L-1
, while at the PSI it ranged from 0.67 to
5.97 µg.L-1
(Table 1). Despite the similarity of the concentrations between sampling
areas our results did not show patterns of seasonal variation, making a conclusive
interpretation difficult.
Our data show that dissolved inorganic nutrient concentrations of the SCI coast
tend to be lower than those of other urbanized estuarine systems located in the south and
southeastern regions of the Brazilian coast (e.g. Paranaguá, Santos and Guanabara bays)
(Table 2). Despite the fact that the sampling areas in this study were located near the
island’s shore, and very close to an urban center, our results were very similar to those
FIGURE 5: Silicate concentration variations at the North Bay sampling stations (NB II and NB IV) and Pantano do Sul Inlet, from August 2006 to February 2008

Revista Biotemas, 23 (1), março de 2010
219Nutrient and coastal water quality of Santa Catarina Island
sampling areas our results did not show patterns of seasonal variation, making a conclusive interpretation dificult.
Our data show that dissolved inorganic nutrient concentrations of the SCI coast tend to be lower than those of other urbanized estuarine systems located in the south and southeastern regions of the Brazilian coast (e.g. Paranaguá, Santos and Guanabara bays) (Table 2). Despite the fact that the sampling areas in this study were located near the island’s shore, and very close to an urban center, our results were very similar to those registered for areas located at the inner shelf and far from human activities (Gianesella et al., 2000; Brandini et al., 2007) (Table 2).
In contrast with the dissolved inorganic species, the total nitrogen (TN) and total phosphorus (TP)
concentrations were relatively high. The TN averages during this study were 19.5 and 18.9µM at the NB II and NBIV sampling stations respectively, and 23.7µM at PSI (Table 1). At NB the results show an increasing concentration tendency during the spring and summer months. However, that pattern was not observed at PSI (Figure 6). TP ranged from 0.65 to 2.42µM at the NB stations and from 0.45 to 3.48µM at PSI. Similar to TN temporal variation, the TP results also presented the tendency to increase during the warm months in the North Bay. Both TN and TP concentrations presented low variations at all sampling stations. The exceptions were the two peaks registered in March and May of 2007 at Pantano do Sul Inlet with much higher concentrations than those observed in the other months.
14
registered for areas located at the inner shelf and far from human activities (Gianesella
et al., 2000; Brandini et al., 2007) (Table 2).
In contrast with the dissolved inorganic species, the total nitrogen (TN) and total
phosphorus (TP) concentrations were relatively high. The TN averages during this study
were 19.5 and 18.9µM at the NB II and NBIV sampling stations respectively, and
23.7µM at PSI (Table 1). At NB the results show an increasing concentration tendency
during the spring and summer months. However, that pattern was not observed at PSI
(Figure 6). TP ranged from 0.65 to 2.42µM at the NB stations and from 0.45 to 3.48µM
at PSI. Similar to TN temporal variation, the TP results also presented the tendency to
increase during the warm months in the North Bay. Both TN and TP concentrations
presented low variations at all sampling stations. The exceptions were the two peaks
registered in March and May of 2007 at Pantano do Sul Inlet with much higher
concentrations than those observed in the other months.
TN
(µ
M)
0.0
10.0
20.0
30.0
40.0
50.0
60.0
70.0
80.0
NB II
NB IV
Pantano do Sul
month / year
08/0
6
09/0
6
10/0
6
11/0
6
12/0
6
01/0
7
02/0
7
03/0
7
04/0
7
05/0
7
06/0
7
07/0
7
08/0
7
09/0
7
10/0
7
11/0
7
12/0
7
PT
(µ
M)
0.0
1.0
2.0
3.0
4.0
A
B
FIGURE 6: TN (a) and TP (b) concentration variations at the North Bay sampling stations (NBII and NBIV) and Pantano do Sul Inlet, from August 2006 to December 2007.

Revista Biotemas, 23 (1), março de 2010
220 J. C. Simonassi et al.
Nutrient availability and water quality
The Redield ratio (C:N:P 106:16:1) summarizes the composition of marine organisms and is a useful tool to understand nutrient limitation, nutrient input, eutrophication and biogeochemical cycles in the marine environment (Redield et al., 1963; Lenten and Watson, 2000, Newton et al., 2003). The present paper emphasizes the N:P (DIN:Phosphate), Si:N (Silicate:DIN) and Total N:P (N
tot:P
tot) ratios.
N:P and Si:N ratios are presented with key threshold values of 16 and 1 respectively in Figure 7. N:P ratios were low, and the averages were 3.1, 2.7 and 5.0 for NB II, NB IV and PSI respectively (Table 1). These values indicate a nitrogen limitation in both areas, and follow an usual situation in marine systems (Ryther and Dunstan, 1971; Goldman et al., 1979).
In the North Bay, the Si:N ratio averaged 6.6 and 7.7 for NB II and NB IV respectively, while at PSI the Si:N ratio averaged 4.0 (Table 1). These ratios reinforce the conditions of nitrogen limitation in the coastal waters of SCI.
While the N:P ratio suggested a strong nitrogen limitation in the environment, these indings highlight the role of upwelling as a source of nitrogen in SCI
coastal waters, especially during spring and summer (e.g. October) when these inputs were associated with cold water (Figure 8). Indeed, the relatively high N:P ratio (10.07) promoted by the increase of nitrate at PSI in spring (Figures 4 and 8) implied that the input of nitrogen to the system was determined by the upwelling of SACW.
Temporal variation of N:P and Si:N ratios at Pantano do Sul Inlet is presented in Figure 8. Si:N ratios ranged from 0.68 to 8.68, and except for one sample, all ratios were higher than 1.0, also suggesting severe nitrogen limitation. A pronounced peak in April/2007 was observed at PSI, which can be associated with warm waters, highlighting the role of the contribution of different water masses to coastal waters. Indeed, an inverse trend in temporal variation of Si:N in comparison with N:P was observed. Silicate is actively scavenged from the water by diatoms in spring and summer when blooms are a common feature of SACW upwelling events (Gonzales-Rodrigues et al., 1992). These results suggest that the planktonic uptake of silicate is highly controlled by nitrogen availability in SCI waters. Indeed, in the PSI sampling area, silicate uptake might be controlled by available nitrate coming from the alochtonous sources (e.g. SACW upwelling).
15
FIGURE 6: TN (a) and TP (b) concentration variations at the North Bay sampling stations
(NBII and NBIV) and Pantano do Sul Inlet, from August 2006 to December 2007.
Nutrient availability and water quality
The Redfield ratio (C:N:P 106:16:1) summarizes the composition of marine
organisms and is a useful tool to understand nutrient limitation, nutrient input,
eutrophication and biogeochemical cycles in the marine environment (Redfield et al.,
1963; Lenten and Watson, 2000, Newton et al., 2003). The present paper emphasizes
the N:P (DIN:Phosphate), Si:N (Silicate:DIN) and Total N:P (Ntot:Ptot) ratios.
N:P and Si:N ratios are presented with key threshold values of 16 and 1
respectively in Figure 7. N:P ratios were low, and the averages were 3.1, 2.7 and 5.0 for
NB II, NB IV and PSI respectively (Table 1). These values indicate a nitrogen limitation
in both areas, and follow an usual situation in marine systems (Ryther and Dunstan,
1971; Goldman et al., 1979).
S i:N
0 1 2 3 4 5 6 7 8 9 10 11 12 13 14 15 16 17
N:P
0
2
4
6
8
10
12
14
16
18
N orth B ay IV
N orth B ay II
P an tano do S u l
FIGURE 7: N:P and Si:N ratios from August 2006 to November 2008, at North Bay and
Pantano do Sul Inlet.
In the North Bay, the Si:N ratio averaged 6.6 and 7.7 for NB II and NB IV
respectively, while at PSI the Si:N ratio averaged 4.0 (Table 1). These ratios reinforce
the conditions of nitrogen limitation in the coastal waters of SCI.
FIGURE 7: N:P and Si:N ratios from August 2006 to November 2008, at North Bay and Pantano do Sul Inlet.

Revista Biotemas, 23 (1), março de 2010
221Nutrient and coastal water quality of Santa Catarina Island
The annual Ntot
:Ptot
ratio averages were slightly higher than the Redield N:P ratio at both the North Bay sampling stations (NB II = 21.0 and NB IV = 18.0) and in the Pantano do Sul Inlet (19.8). About 80% of water samples presented N
tot:P
tot ratios above the Redield
ratio. This small excess of nitrogen may be related to contributions of both dissolved and particulate organic nitrogen (DON and PON). DON may account for a signiicant percentage of biologically available nitrogen (Seitzinger and Sanders, 1997) and can be higher than PON in marine systems (Romankevich, 1984).
The temporal variations of physicochemical parameters in North Bay waters were determined mainly by the continental runoff, while for the Pantano do Sul Inlet their variability was related to oceanic processes. Peaks of nitrate occurred simultaneously with cold water especially in spring months, being related with the upwelling events of SACW on the coast of Santa Catarina Island.
Water quality evaluation of marine environments has only recently been initiated and generally the models are based on parameters such as nutrients, chlorophyll-a, oxygen concentrations and Secchi disk depth in the water column and nutrients in the sediments (Newton et al., 2003; Håkanson and Bryhn, 2008; Vollenweider et al., 1998). The evaluation of the trophic state of SCI coastal waters showed that in general in the North Bay
and Pantano do Sul there existed mesotrophic conditions with some eutrophic situations in both locations. However, it is important to note that the eutrophic conditions were related with unusually high TN and TP registered in March and May/2007, when compared with all the results obtained during this study. The Trophic Index (TRIX) proposed by Vollenweider et al. (1998) was also calculated with environmental data in order to compare with the method used in this study. The TRIX values ranged from 4.8 to 5.0, indicating a moderate trophic level, and conirming the mesotrophic state of the SCI coastal water.
Acknowledgements
The authors would like to thank the “Coordenação de Aperfeiçoamento de Pessoal de Nível Superior” (CAPES) and the “Conselho Nacional de Desenvolvimento Cientíico e Tecnológico” (CNPq) for inancial support. We are also grateful to EPAGRI-CIRAM for providing meteorological data, Conceição Denise N. Barboza for cooperation in the analysis, the ishermen Germano P. M. Martinez and Lourenço R. Silveira for their support in sampling, and the anonymous reviewers for their valuable comments to the manuscript.
16
While the N:P ratio suggested a strong nitrogen limitation in the environment,
these findings highlight the role of upwelling as a source of nitrogen in SCI coastal
waters, especially during spring and summer (e.g. October) when these inputs were
associated with cold water (Figure 8). Indeed, the relatively high N:P ratio (10.07)
promoted by the increase of nitrate at PSI in spring (Figures 4 and 8) implied that the
input of nitrogen to the system was determined by the upwelling of SACW.
Temporal variation of N:P and Si:N ratios at Pantano do Sul Inlet is presented in
Figure 8. Si:N ratios ranged from 0.68 to 8.68, and except for one sample, all ratios
were higher than 1.0, also suggesting severe nitrogen limitation. A pronounced peak in
April/2007 was observed at PSI, which can be associated with warm waters,
highlighting the role of the contribution of different water masses to coastal waters.
Indeed, an inverse trend in temporal variation of Si:N in comparison with N:P was
observed. Silicate is actively scavenged from the water by diatoms in spring and
summer when blooms are a common feature of SACW upwelling events (Gonzales-
Rodrigues et al., 1992). These results suggest that the planktonic uptake of silicate is
highly controlled by nitrogen availability in SCI waters. Indeed, in the PSI sampling
area, silicate uptake might be controlled by available nitrate coming from the
alochtonous sources (e.g. SACW upwelling).
Months / Year
08/06 10/06 12/06 02/07 04/07 06/07 08/07 10/07 12/07
Te
mp
era
ture
(oC
)
16
18
20
22
24
26
N:P
an
d S
i:N
Ra
tio
s
0
1
2
3
4
5
6
7
8
9
10
11
Temperature
Dissolved N:P
Dissolved Si:N
FIGURE 8: N:P and Si:N ratios and water temperature variation during the sampling period,
from August 2006 to November 2007, at Pantano do Sul Inlet.
FIGURE 8: N:P and Si:N ratios and water temperature variation during the sampling period, from August 2006 to November 2007, at Pantano do Sul Inlet.

Revista Biotemas, 23 (1), março de 2010
222 J. C. Simonassi et al.
References
Assumpção, D. G.; Verdinelli, M. A.; Verdinelli, M. E. P.; Heinzen, V. F. 1993. Estudo prospectivo da qualidade ambiental marinha, no ecossistema costeiro da Ilha de santa Catarina, utilizando a análise fatorial de correspondências. III Simpósio de Ecossistemas da
Costa Brasileira – Subsídios para o gerenciamento ambiental, São Paulo, Brasil, p.246-259.
Braga, E. S.; Bonetti, C. V. D. H.; Burone, L.; Bonetti Filho, J. 2000. Eutrophication and bacterial pollution caused by industrial and domestic wastes at the Baixada Santista estuarine system – Brazil. Marine Pollution Bulletin, 40: 165-173.
Brandini, F. P.; Silva, A. S.; Silva, E. T.; Kolm, H. 2007. Sources of nutrients and seasonal dynamics of chlorophyll in the inner shelf of Paraná State – South Brazil Bight. Journal of Coastal Research,
23: 1131-1140.
Brandini, F. P.; Thamm, C. A. C. 1994. Variações diárias e sazonais do itoplâncton e parâmetros ambientais na Baía de Paranaguá.
Nerítica, 8 (1-2): 55-72.
Carreira, R.; Wagener, A.; Readman, W.; Fileman, T.; Macko, S.; Veiga, A. 2002. Changes in the sedimentary organic carbon pool of a fertilized tropical estuary, Guanabara Bay, Brazil: An elemental, isotopic and molecular marker approach. Marine Chemistry, 79: 207-227.
Cruz, O. 1998. A Ilha de Santa Catarina e o continente próximo:
Um estudo de geomorfologia costeira. Editora da UFSC, Florianópolis, Brasil, 276pp.
Fock, H. O. 2003. Changes in the seasonal cycles of inorganic nutrients in the coastal zone of the southeastern North Sea from 1960 to 1997: Effects of eutrophication and sensitivity to meteoclimatic factors. Marine Pollution Bulletin, 46: 1434-1449.
Gallucci, F; Netto, S. A. 2004. Effects of the passage of cold fronts over a coastal site: An ecosystem approach. Marine Ecology
Progress Series, 281: 79-92.
Gianesella, S. M. F.; Saldanha-Corrêa, F. M. P. 2003. Nutrientes, séston e biomassa itoplanctônica na plataforma interna de São Sebastião – Verão de 1994 e Primavera de 1997. Boletim do
Instituto da Pesca, 29: 161-172.
Goldman, J. C.; McCarthy, J. J.; Peavey, D. G. 1979. Growth rate inluence on the chemical composition of phytoplankton in ocean waters. Nature, 279: 210-215.
Gonzalez-Rodriguez, E.; Valentin, J. L.; André, D. L.; Jacob, A. S. 1992. Upwelling and downwelling at Cabo Frio (Brazil): Comparison of biomass and primary productivity response. Journal
of Plankton Research, 14 (2): 289-306.
Grasshoff, K.; Ehrhardt, M.; Kremling, K. 1983. Methods of
seawater analysis. Verlag Chemie, Weinheim, Germany, 419pp.
Håkanson, L.; Bryhn, A. C. 2008. Tools and criteria for sustainable
coastal ecosystem management. Examples from the Baltic Sea
and other aquatic systems. Springer-Verlag, Berlin, Germany, 292pp.
Gianesella, S. M. F.; Saldanha-Corrêa, F. M. P.; Teixeira, C. 2000. Tidal effects on nutrients and phytoplankton distribution in Bertioga Channel, São Paulo, Brazil. Aquatic Ecosystem Health
and Management, 3: 533-544.
IBGE – Instituto Brasileiro de Geograia e Estatística. 2007. Contagem da população 2007. Available at <www.ibge.gov.br/
home/estatistica/populacao/contagem2007>. Acessed on 03 de fevereiro de 2009.
Kjerfve, B.; Ribeiro, C.; Dias, G.; Filippo, A.; Quaresma, V. 1997. Oceanographic characteristics of an impacted coastal bay: Baia da Guanabara, Rio de Janeiro, Brazil. Continental Shelf Research,
17: 1609-1643.
Laurenti, A.; Assunção, D. T. G.; Heinzen, V. F.; Franco, D. 1996. Annual variations of nutrients and chemical-physical parameters in the Florianopolis Bay. Reunião Especial da SBPC: Ecossistemas
Costeiros - do Conhecimento a Gestão, Florianópolis, Brasil, p.453-454.
Lenten, T. M.; Watson, A. J. 2000. Redield revisited I. Regulation of nitrate, phosphate and oxygen in the ocean. Global Biogeochemical
Cycles, 14: 225-268.
Lorenzen, C. J. 1967. Determination of chlorophyll and phaeopigments: spectrometric equations. Limnology and
Oceanography, 12: 343-346.
Machado, E. C.; Daniel, C. B.; Brandini, N.; Queiroz, R. L. V. 1997. Temporal and spatial dynamics of nutrients and particulate suspended matter in Paranaguá Bay, PR, Brazil. Nerítica, 11: 15-34.
Marques Jr., A. N.; Crapez, M. A. C.; Barboza, C. D. N. 2006. Impact of the Icaraí sewage outfall in Guanabara Bay, Brazil. Brazilian Archives of Biology and Technology, 49 (4): 643-650.
Matsuura, Y. 1986. Contribuição ao estudo da estrutura oceanográica da região sudeste entre Cabo Frio (RJ) e Cabo Santa Marta Grande (SC). Ciência e Cultura, 38 (8): 1439-1450.
Möller Jr., O. O.; Piola, A. R.; Freitas, A. C.; Campos, E. J. D. 2008. The effects of river discharge and seasonal winds on the shelf off southeastern South America. Continental Shelf Research, 28: 1607-1624.
NRC. 2000. Clean coastal waters: Understanding and reducing
the effects of nutrient pollution. National Research Council, Committee on the Causes and Management of Eutrophication, Ocean Studies Board, Water science and Technology Board, Washington, USA, p.428.
Newton, A.; Icely, J. D.; Falcão, M.; Nobre, A.; Nunes, J. P.; Ferreira, J. G.; Vale, C. 2003. Evaluation of eutrophication in the Ria Formosa coastal lagoon, Portugal. Continental Shelf Research,
23: 1945-1961.
Newton, A.; Mudge, S. M. 2005. Lagoon-sea exchange, nutrients dynamics and water quality management of Ria Formosa (Portugal). Estuarine, Coastal and Shelf science, 62: 405-414.
Nixon, S.W. 1995. Coastal marine eutrophication: A deinition, social causes and future concerns. Ophelia, 41: 199-219.
Paes, E. T.; Moraes, L. E. S. 2007. A new hypothesis on the inluence of the El Niño/La Niña upon the biological productivity, ecology and isheries of the Southern Brazilian Bight. Pan-American
Journal of Aquatic Sciences, 2: 94-102.
Pagliosa, P. R. 2004. Variação espacial nas características das
águas, dos sedimentos e da macrofauna bêntica em áreas
urbanas e em unidades de conservação na Baía da Ilha de Santa
Catarina. Tese de Doutorado, Universidade Federal de São Carlos, Brasil, 100pp.
Piola, A. R.; Möller Jr., O. O.; Guerrero, R. A.; Campos, E. J. D. 2008. Variability of the subtropical shelf front off eastern South

Revista Biotemas, 23 (1), março de 2010
223Nutrient and coastal water quality of Santa Catarina Island
America: Winter 2003 and Summer 2004. Continental Shelf
Research, 28: 1639-1648.
Redield, A.; Ketchum, B.; Richards, F. 1963. The inluence of organisms on the composition of sea-water. In: Hill, M. (Ed.). The
Sea. InterISCence, New York, USA, p.26-77.
Romankevich, E. A. 1984. Geochemistry of organic matter in the
Ocean. Springer-Verlag, New York, USA, 334pp.
Ryther, J.; Dunstan, W. 1971. Nitrogen, phosphorous, and eutrophication in the coastal marine environment. Science, 171: 1008-1013.
SCOR-UNESCO. 1966. Determination of photosynthetic pigments in sea-water. Monographs on Oceanographic Methodology, 1: 9-18.
Seitzinger, S. P.; Sanders, R. W. 1997. Contribution of dissolved organic nitrogen from rivers to estuarine eutrophication. Marine
Ecology Progress Series, 159: 1–12.
Sierrra de Ledo, B. 1997. Subsídios ecológicos para um plano de gestão integrada na zona costeira da ilha de Santa Catarina. Aquitaine Ocean, 3: 9-28.
Silva, L. F. 2002. Identiicação de sub-ambientes na Baía Sul (SC) com base na análise de variáveis oceanográico-sedimentares. Dissertação de Mestardo, Universidade Federal de Santa Catarina, Brasil, 102pp.
Soriano-Sierra, E.; Sierra de Ledo B. 1998. (Eds.) Ecologia
e gerenciamento do manguezal de Itacorubí. Fepema, Florianópolis, Brasil, 408pp.
Strickland, J.; Parsons, T. 1972. A practical handbook of seawater analysis. Bulletin of the Fisheries Research Board of Canada,
167: 153-163.
Valentin, J. L. 1994. A ressurgência – Fonte de vida dos oceanos. Ciência e Cultura, 18: 178-183.
Vollenweider, R. A. 1992. Coastal marine eutrophication: Principles and control. The science of the Total Environment, Supplement: 1-20.
Vollenweider, R. A.; Giovanardi, F.; Montanari, G.; Rinaldi. A. 1998. Characterization of the trophic conditions of marine coastal waters, with special reference to the NW Adriatic Sea: Proposal for a trophic scale, turbidity and generalized water quality index. Environmetrics, 9: 329-357.
Copyright © 2022 FDOKUMEN