Universidade Federal de Santa Catarina
144
UNIVERSIDADE FEDERAL DE SANTA CATARINA CENTRO DE CIÊNCIAS FÍSICAS E MATEMÁTICAS PROGRAMA DE PÓS-GRADUAÇÃO EM FÍSICA Muryel Guolo Pereira The Circumnuclear Region and Long-Term Variability of the Active Nucleus in NGC 2992 Florianópolis 2021
-
Upload
khangminh22 -
Category
Documents
-
view
0 -
download
0
Transcript of Universidade Federal de Santa Catarina

UNIVERSIDADE FEDERAL DE SANTA CATARINA
CENTRO DE CIÊNCIAS FÍSICAS E MATEMÁTICAS
PROGRAMA DE PÓS-GRADUAÇÃO EM FÍSICA
Muryel Guolo Pereira
The Circumnuclear Region and Long-Term Variability
of the Active Nucleus in NGC 2992
Florianópolis
2021

Muryel Guolo Pereira
The Circumnuclear Region and Long-Term Variability
of the Active Nucleus in NGC 2992
Dissertação submetida ao Programa de Pós-Graduaçãoem Física da Universidade Federal de Santa Catarina paraa obtenção do título de Mestre em Física.Supervisor: Prof. Dr. Daniel Ruschel Dutra
Florianópolis
2021


Muryel Guolo Pereira
The Circumnuclear Region and Long-Term Variability
of the Active Nucleus in NGC 2992
O presente trabalho em nível de mestrado foi avaliado e aprovado por banca examinadora
composta pelos seguintes membros:
Profa. Dra. Natalia Vale Asari
Universidade Federal de Santa Catarina
Prof. Dr. Rogério Riffel
Universidade Federal do Rio Grande do Sul
Prof. Dr. Tiago Vecchi Ricci
Universidade Federal da Fronteira Sul
Certificamos que esta é a versão original e final do trabalho de conclusão que foi julgado
adequado para obtenção do título de Mestre em Física.
Coordenação do Programa de Pós-Graduação
Prof. Dr. Daniel Ruschel Dutra
Orientador
Florianópolis, 2021.

AGRADECIMENTOS
Primeiramente, aos meus pais, que mesmo com todos os sacrifícios nescessários, sempre
fizeram de tudo para que eu tivesse uma educação de qualidade, e que apesar de não en-
tenderem muito bem o meu trabalho, sempre me apoiaram incondicionalmente nas minhas
decisões e escolhas.
Ao meu orientador, Daniel, por ter me aceito como aluno de Iniciação Científica ainda em 2017
e depois como seu primeiro aluno de mestrado, pelo empenho e companheirismo nesses anos
de orientação que foram essenciais na minha formação como aluno e profissional.
Aos professores do Departamento de Física e do Grupo de Astrofísica da UFSC pela formação
que me foi dada, em especial ao Cid pela oportunidade de participar do grupo logo no meu
primeiro ano na UFSC e pelo apoio nas aplicações para o doutorado.
Aos meus colaboradores pelas contribuições nos artigos que levaram a essa dissertação, em
especial à Thaisa e ao Jaderson, pelas discussões e o apoio nas aplicações para o doutorado.
Aos grandes amigos que a física da UFSC me deu e que levarei para a vida toda: Kevin, Hamil-
ton, Café, João, Chico e Hélcio.
Aos membros da banca, Natália, Rogério e Tiago, por aceitarem avaliar este trabalho.
Ao CNPq pelo suporte financeiro.
A minha noiva, Jéssica, por estar comigo nos altos e baixos dessa trajetória, e me apoiar em
todos os momentos. A vida ainda nos reserva muitas conquistas!

RESUMO
Núcleos Galácticos Ativos (AGN) são regiões compactas no centro de galáxias capazes degerar grandes quantidades de energia, de tal forma que não podem ser explicadas por fusãotermonuclear pelas estrelas da galáxia, mas sim por acreção de matéria por um buraco negrosupermassivo. Além de serem laboratórios para o estudo de física em condições extremas,acredita-se que AGNs são fundamentais para o entendimento da evolução das galáxias. Nestadissertação apresentamos uma análise espacial e temporal do AGN presente na galáxia Seyfertem interação NGC 2992 usando observações em diferentes comprimentos de onda. Primeira-mente, utilizando dados de Espectroscopia de Campo Integral do Telescópio Gemini, fomoscapazes de resolver espacialmente as populações estelares, os mecanismos de ionização e acinemática do gás ionizado. Utilizando síntese de populações estelares, nós mostramos que apopulação estelar é principalmente composta por estrelas velhas e ricas em metais, mas tam-bém por uma fração considerável, de até 30% da luz, por estrelas jovens e pobres em metais.A cinemática da Região de Linhas Estreitas (NLR) apresenta duas principais componentes:uma do gás orbitando o disco da galáxia e outra por uma ejeção (outflow) de gás, relacionadaà emissão em rádio. Mostramos que apesar de a ionização pelo AGN ser o principal dos me-canismos, ionização por estrelas jovens e por choques também contribuem para as razões delinhas encontradas. Depois, apresentamos uma análise do histórico do espectro de emissãoda galáxia em raios-X e no óptico. Mostramos que ela apresenta várias transições em suaclassificação Seyfert, do tipo 2 para tipos intermediários, perdendo e readquirindo sua Linhade Emissão Larga (BEL) em Hα diversas vezes, portanto classificando-o como um ‘Changing
Look ’ AGN. Em raios-X, a fonte apresenta grande variabilidade com sua luminosidade corrigidapor absorção variando por um fator de ∼ 35. Mostramos que a presença (e o fluxo) da BEL emHα está diretamente correlacionada com a taxa de acreção: com um valor mínimo 2.0+2.0
–1.3% narazão de Eddington sendo necessário para a detecção da componente larga. Dois cenários sãopossíveis para explicar as transições de clasificação: o aumento (diminuição) da luminosidadedo contínuo do AGN, que aumenta (diminui) a quantidade de fótons disponíveis para excitaro gás na Região de Linhas Largas (BLR), ou o desaparecimento da estrutura da BEL em siocorre quando a baixa taxa de acreção não é capaz de suportar a taxa de fluxo de nuvensnecessária. Este trabalho evidencia o papel das galáxias próximas no estudo dos fenômenosAGNs, nos quais as estruturas da escala parsec podem ser resolvidas e observações públicasem múltiplos comprimentos de onda e épocas estão disponíveis.Palavras-chave: Astrofísica. Galáxias. Nucleos Galácticos Ativos.

ABSTRACT
Active Galactic Nuclei (AGN) are compact regions at the center of galaxies that can generatelarge amounts of energy, such that it can not be explained by thermonuclear fusion in stars,but instead by accretion of matter onto a supermassive black hole (SMBH). Besides being alaboratory to study Physics in extreme conditions, AGNs are also believed to be fundamentalfor understanding galaxies’ evolution. This dissertation presents a multi-wavelength spatial andtemporal analysis of the AGN in the interacting Seyfert galaxy NGC 2992. First, using datataken with Gemini Multi-Object Spectrographs (GMOS), with the Integral Field Unit mode, fromthe inner 1.1 kiloparsecs of the galaxy, we were able to spatially resolve the stellar populations,the ionization mechanism, and kinematics of ionized gas. From full spectral synthesis, we foundthat the stellar population is primarily composed of old metal-rich stars with a smaller, butconsiderable, contributing of up to 30% of the light, from young and metal-poor populations.The Narrow Line Region kinematics presents two main components: one from gas orbiting thegalaxy disk and another from a blueshifted outflow, correlated with the radio emission. We showthat even though the primary ionization mechanism is the AGN radiation, ionization by youngstars and shocks may also contribute to the emission line ratios found. Later, we present ananalysis of the historical X-rays and optical spectra of the galaxy. We show that the nucleus ofthe galaxy presents multiple Seyfert type transitions from type 2 to intermediate-type, losingand regaining its Hα Broad Emission Line (BEL) recurrently, hence being a ‘Changing Look’AGN. In X-rays, the source shows large intrinsic variability with the absorption corrected 2-10keV luminosity varying by a factor of ∼ 35. We show that the presence (and flux) of the Hα BELis directly correlated with the accretion rate: a minimum Eddington ratio (λEdd = Lbol /LEdd ) valueof 2.0+2.0
–1.3% is necessary for the broad line detection. Two possible scenarios for type transitionsare still open: either there is a dimming (brightening) of the AGN continuum luminosity, whichreduces (increases) the supply of ionizing photons available to excite the gas in the Broad LineRegion (BLR), or the disappearance of the BLR structure itself occurs as the low accretionefficiency is not able to sustain the required cloud flow rate. This work evidences the role of thenearby galaxies in the study of the AGN phenomena, in which the parsec scale structures canbe resolved and public multi-wavelength and multi-epoch observations are available.
Keywords: Astrophysics. Galaxies. Active Galactic Nuclei.

RESUMO EXPANDIDO
Introdução
A interpretação de que os objetos luminosos e distantes descobetos por Schmidt (1963) eram
buracos negros super massivos (SMBH) no centro de galáxias foi primeiramente dada por
Lynden-Bell (1969). Nesse modelo, quando matéria da galáxia hospedeira perde momento
angular e é transportada para sua região nuclear, seu SMBH pode começar um processo co-
nhecido como acreção, através do qual um disco (de acreção) é formado. O material no disco
de acreção irradia energia devido às altas temperaturas atingidas pelo efeito da viscosidade do
mesmo (SHAKURA; SUNYAEV, 1973). Esse processo define a existência dos chamados Nú-
cleos Galácticos Ativos (AGN), onde energia potencial gravitacional do material é transformada
em energia térmica e radiação, dessa forma o AGN é capaz de influenciar o meio interestelar
da sua galáxia hospedeira.
Além de serem laboratórios para o estudo da física em condições extremas, o paradigma
teórico atual de evolução das galáxias não somente atribui um papel fundamental aos AGNs
na evolução de suas galáxias hospedeiras, mas também que ambas evoluções, dos SMBHs
e das partes centrais (bojos) das galáxias, sejam reguladas pelos mesmos processos. Tal
co-evolução é suportada observacionalmente pela existência de correlações fortes entre suas
propriedades, por exemplo, a correlação entre a massa dos SMBHs (MBH ) e a dispersão de
velocidades das estrelas do bojos, σ∗ (e.g., FERRARESE; MERRITT, 2000; GULTEKIN et al.,
2009). Esse cenário se fortalece devido ao fato que ambos o crescimento dos SMBHs (medido
pela taxa de acreção) e o das galáxias (medido pela taxa de formação estelar) são similares na
história do universo (BULLOCK; BOYLAN-KOLCHIN, 2017), ambos com máximo em redshift
(z) ∼ 2.
Objetivos
Embora o efeito dos AGNs em suas galáxias tenha sido maior no universo distante, as infraes-
truturas observacionais disponíveis atualmente não conseguem atingir as resoluções da ordem
de parsecs necessárias para resolver espacialmente as estruturas internas das galáxias em
altos redshifts. Nesse sentido, o estudo de análogos locais ainda é necessário para o com-
pleto entendimento do fenômeno dos AGNs, particularmente para estudo de sua variabilidade,
devido ao fato de essas galáxias estarem sendo observadas por diversos instrumentos de
diversos comprimentos de onda, a décadas. Neste trabalho, analisamos tanto as propriedades
espaciais da região nuclear da galáxia Seyfert em interação NGC 2992, quanto sua variabili-
dade de longo período.
Metodologia
Para resolver espacialmente as propriedades da região circum-nuclear da galáxia utilizamos
dados de Espectroscopia de Campo Integral obtidos com Telescópio Gemini Sul. Aplicamos
síntese de populações estelares, para recuperar a história de formação estelar da galáxia, além
disso, modelamos as linhas de emissão mais proeminentes a fim de estudar a cinemática e
os mecanismo de ionização do gás da galáxia. A análise da variabilidade da galáxia se deu

pela revisão de toda a literatura sobre a fonte, incluindo todos os espectros ópticos e em raio-X
publicados, do final dos anos 1970 até os mais recentes, focando na correlação entre a pre-
sença/ausência de BEL em Hα e a luminosidade em raios-X (usada como um indicador da
taxa de acreção do SMBH).
Resultados e Discussão
Nesse trabalho conseguimos mostrar que a emissão do contínuo da região circum-nuclear
embora dominada por estrelas velhas e ricas em metais, têm uma fração considerável de luz
emitida por estrelas jovens e pobres em metais, o que pode indicar um surto de formação
estelar causado pela interação de NGC 2992 com sua companheira NGC 2993. Mostramos
que a Região de Linhas Estreitas (NLR) apresenta duas componentes cinemáticas, uma que
é bem descrita pelo gás orbitando o disco da galáxia em órbitas Keplerianas, e outra devido
a ejeção (outflow) de gás, possivelmente relacionada com a emissão em rádio da galáxia.
Mostramos ainda que a galáxia possui diferentes mecanismos de ionização, e que embora a
ionização pelo AGN seja a dominante no kiloparsec central, ionização por estrelas jovens e
por choques também contribuem para as razões de linhas encontradas. Em maiores escalas,
a dominância do AGN deve diminuir em relação aos outros dois mecanismos. O estudo da
variabilidade revelou que a fonte apresenta várias transições em sua classificação espectral,
de Seyfert do tipo 2 para tipo intermediário, perdendo e readquirindo sua BEL em Hα em um
período de alguns anos, portanto sendo classificado como um ‘Changing Look’ AGN (CL-AGN).
Em raios-X a fonte também apresenta alta variabilidade, com sua luminosidade intrínseca na
banda 2-10 keV variando por um fator maior que 30, de 4.9×1041 erg s–1até 1.7×1043 erg s–1.
Mostramos que a presença e o fluxo da componente larga da linha em Hα está diretamente
correlacionada com a luminosidade em raios-X: um valor mínimo de L2–10 ≈ 4×1041 erg s–1é
necessário para detecção da componente. Valor esse que se traduz a uma razão de Eddington
(Lbol /LEdd = λEdd ) de 2.0+2.0–1.3%, se supormos MBH = 3×10⁷ M�. A detecção da componente
larga em Hβ só é possível a taxas de acreção ainda maiores, λEdd ≈ 5-8%. Dois cenários para
as transições são possíveis: o aumento (diminuição) da luminosidade do contínuo do AGN,
aumenta (diminui) a quantidade de fótons disponíveis para excitar o gás na Região de Linhas
Largas (BLR), ou o desaparecimento da estrutura da BEL em si ocorre quando a baixa taxa de
acreção não é capaz de suportar a taxa de fluxo de nuvens necessária de acordo com modelos
de vento-disco (disk-wind) para a BLR.
Considerações Finais
Esse trabalho mostra a importância e o papel das galáxias do universo local no estudo do
fenômeno dos AGNs, nas quais estruturas na ordem de parsecs podem ser espacialmente
resolvidas, e para as quais vários dados em diversos comprimentos de onda e diversas épocas
estão publicamente disponíveis. Nele adicionamos evidencias mostrando a influência do AGN
em sua galáxia hospedeira e adicionamos mais um objeto na lista de CL-AGNs, em particular,
um dos poucos em que a dependência entre as transições de classificação e a taxa de acreção
é mostrada explicitamente. Por fim, mencionamos possíveis trabalhos que podem ser realiza-
dos baseados nesse sistema de galáxias em interação ou utilizando-se de métodos similares
aos empregados aqui.

Palavras-chave: Astrofísica. Galáxias. Nucleos Galácticos Ativos.

LIST OF FIGURES
Figure 1 – The MBH - σ∗ relation for galaxies with dynamical measurements. . . . . . . . 18
Figure 2 – Multicolor blackbody emission from Shakura-Sunyaev accretion disk. . . . . . 21
Figure 3 – Composite optical/UV spectra of an AGN. . . . . . . . . . . . . . . . . . . . . 22
Figure 4 – Most important features produced in the Broad Line Region. . . . . . . . . . 24
Figure 5 – Narrow Line Region ionization cone . . . . . . . . . . . . . . . . . . . . . . . 25
Figure 6 – Effect of photoelectric absorption and Compton scattering. . . . . . . . . . . 26
Figure 7 – X-ray spectra NGC 2992. . . . . . . . . . . . . . . . . . . . . . . . . . . . . . 27
Figure 8 – Radio galaxy Hercules A . . . . . . . . . . . . . . . . . . . . . . . . . . . . . 28
Figure 9 – BPT Diagrams . . . . . . . . . . . . . . . . . . . . . . . . . . . . . . . . . . . 29
Figure 10 – Starburst-AGN mixing . . . . . . . . . . . . . . . . . . . . . . . . . . . . . . . 30
Figure 11 – Spectro-polarimetric observation of NGC 1068 . . . . . . . . . . . . . . . . . 31
Figure 12 – Unified Model of AGNs . . . . . . . . . . . . . . . . . . . . . . . . . . . . . . . 31
Figure 13 – The cosmological growth of SMBH and stellar mass in the universe. . . . . . 33
Figure 14 – Dark matter and galaxies mass functions. . . . . . . . . . . . . . . . . . . . . 34
Figure 15 – LRGB image composition of Arp 245. . . . . . . . . . . . . . . . . . . . . . . 35
Figure 16 – H I distribution in Arp 245. . . . . . . . . . . . . . . . . . . . . . . . . . . . . . 36
Figure 17 – Numerical simulation of Arp 245’s interaction process. . . . . . . . . . . . . . 37
Figure 18 – Gemini/GMOS Observation of NGC 2992. . . . . . . . . . . . . . . . . . . . . 41
Figure 19 – Example of stellar population synthesis fit . . . . . . . . . . . . . . . . . . . . 46
Figure 20 – Radial profiles of the recovered properties from starlight fits. . . . . . . . . 47
Figure 21 – Values of 〈Z〉 integrated over the entire FoV . . . . . . . . . . . . . . . . . . . 49
Figure 22 – [N II] +Hα emission lines fit. . . . . . . . . . . . . . . . . . . . . . . . . . . . . 52
Figure 23 – [O III] emission lines fit. . . . . . . . . . . . . . . . . . . . . . . . . . . . . . . 52
Figure 24 – Spatial distribution of the BLR and FC components . . . . . . . . . . . . . . . 53
Figure 25 – Kinematical component 1 properties . . . . . . . . . . . . . . . . . . . . . . . 55
Figure 26 – Kinematical component 2 properties . . . . . . . . . . . . . . . . . . . . . . . 56
Figure 27 – Position-Velocity diagram . . . . . . . . . . . . . . . . . . . . . . . . . . . . . 57
Figure 28 – Hα luminosity and surface mass density of Component 2 . . . . . . . . . . . 59
Figure 29 – V -band extinction and electron density maps . . . . . . . . . . . . . . . . . . 60
Figure 30 – BPT diagrams and emission line ratios maps of NGC 2992 . . . . . . . . . . 61
Figure 31 – AGN-Wind scaling relations . . . . . . . . . . . . . . . . . . . . . . . . . . . . 66
Figure 32 – NGC 2992 historical X-ray and optical light curves . . . . . . . . . . . . . . . 70
Figure 33 – Correlations between the X-ray continuum model parameters and the X-ray
flux. . . . . . . . . . . . . . . . . . . . . . . . . . . . . . . . . . . . . . . . . . 74
Figure 34 – Emission line fitting for the modern optical spectra. . . . . . . . . . . . . . . . 76
Figure 35 – X-ray and optical properties of NGC 2992 from 2005 to 2020. . . . . . . . . . 78
Figure 36 – Link between L2–10 and Hα BEL detection. . . . . . . . . . . . . . . . . . . . 79
Figure 37 – Correlations between X-ray and optical properties. . . . . . . . . . . . . . . . 80
Figure 38 – Polarimetric spectrum of NGC 2992 . . . . . . . . . . . . . . . . . . . . . . . 83
Figure 39 – Maps of the recovered properties from the BC03 synthesis. . . . . . . . . . . 105
Figure 40 – Maps of the recovered properties from the BC03+FC synthesis. . . . . . . . 106

Figure 41 – Maps of the recovered properties from the M11+FC synthesis. . . . . . . . . 106
Figure 42 – Emission line fitting uncertainties. . . . . . . . . . . . . . . . . . . . . . . . . . 107

LIST OF TABLES
Table 1 – SSPs used in the stellar population synthesis. . . . . . . . . . . . . . . . . . . 43
Table 2 – Best-fitting parameters for disk model . . . . . . . . . . . . . . . . . . . . . . . 54
Table 3 – Historical X-ray data for NGC 2992. . . . . . . . . . . . . . . . . . . . . . . . . 71
Table 4 – Historical broad Hα line and Seyfert type classification for NGC 2992. . . . . . 72
Table 5 – Emission line measurements of the modern optical spectra . . . . . . . . . . . 75

LIST OF ABBREVIATIONS
AGB Asymptotic Giant Branch
AGN Active Galactic Nuclei
BEL Broad Emission Line
BLR Broad Line Region
CL-AGN ‘Changing Look’ Active Galactic Nuclei
FC Featureless Continuum
FWHM Full Width at Half Maximum
FoV Field of View
GMOS Gemini Multi-Object Spectrograph
HBLR Hidden Broad Line Region
HST Hubble Space Telescope
IFU Integral Field Unit
IGM intergalactic Medium
IR Infrared
ISM Interstellar Medium
LINER Low-Ionization nuclear Emission-line Region
LLAGN Low Luminosity Active Galactic Nuclei
MUSE Multi-Unit Spectroscopic Explorer
MaNGA Mapping Nearby Galaxies at APO
NIR Near Infrared
NLR Narrow Line Region
PAH Polycyclic Aromatic Hydrocarbon
RIAF Radiatively Inefficient Accretion Flow
RL Radio Loud
RQ Radio Quiet
SDSS Sloan Digital Sky Survey
SFH Star Formation History
SFR Star Formation Rate
SMBH Supermassive Black Hole
SSP Simple Stellar Population
S/N Signal to Noise Ratio
TDE Tidal Disruptive Event
UV Ultraviolet
VLT Very Large Telescope

CONTENTS
1 ACTIVE GALACTIC NUCLEI . . . . . . . . . . . . . . . . . . . . . . . . . . . 16
1.1 An Historical Overview . . . . . . . . . . . . . . . . . . . . . . . . . . . . . . 16
1.2 Anatomy of an AGN . . . . . . . . . . . . . . . . . . . . . . . . . . . . . . . . 17
1.2.1 The Supermassive Black Hole . . . . . . . . . . . . . . . . . . . . . . . . . . . 17
1.2.2 The Accretion Disk . . . . . . . . . . . . . . . . . . . . . . . . . . . . . . . . . 19
1.2.3 The Broad Line Region . . . . . . . . . . . . . . . . . . . . . . . . . . . . . . . 23
1.2.4 The Narrow Line Region . . . . . . . . . . . . . . . . . . . . . . . . . . . . . . 23
1.2.5 The Corona . . . . . . . . . . . . . . . . . . . . . . . . . . . . . . . . . . . . . 24
1.2.6 The Jets . . . . . . . . . . . . . . . . . . . . . . . . . . . . . . . . . . . . . . . 27
1.3 AGN Selection, Classifications and Models . . . . . . . . . . . . . . . . . . 28
1.3.1 The BPT Diagram . . . . . . . . . . . . . . . . . . . . . . . . . . . . . . . . . . 28
1.3.2 AGN Classes and the Unified Model . . . . . . . . . . . . . . . . . . . . . . . 30
1.3.3 The ‘True’ Type 2 and the Disk-Wind BLR Models . . . . . . . . . . . . . . . . 32
1.4 The Role the AGNs in the Evolution of Galaxies . . . . . . . . . . . . . . . 32
1.5 NGC 2992 . . . . . . . . . . . . . . . . . . . . . . . . . . . . . . . . . . . . . . 34
1.6 This Work . . . . . . . . . . . . . . . . . . . . . . . . . . . . . . . . . . . . . . 36
2 THE CIRCUMNUCLEAR REGION OF NGC 2992 . . . . . . . . . . . . . . . . 38
2.1 Introduction: Feeding and Feedback . . . . . . . . . . . . . . . . . . . . . . 38
2.2 Observations and Data Reduction . . . . . . . . . . . . . . . . . . . . . . . 39
2.3 Stellar Populations . . . . . . . . . . . . . . . . . . . . . . . . . . . . . . . . 42
2.3.1 Evolutionary Models, Stellar Libraries and Featureless Continuum . . . . . . . 42
2.3.2 Spatially Resolved Stellar Populations Synthesis . . . . . . . . . . . . . . . . 44
2.3.3 The FC Component Usage: Comparing BC03 and BC03+FC . . . . . . . . . 46
2.3.4 Decomposition Stability: Comparing BC03/STELIB and M11/MILES . . . . . . 48
2.4 Gas kinematics . . . . . . . . . . . . . . . . . . . . . . . . . . . . . . . . . . . 50
2.4.1 Emission Lines Fitting . . . . . . . . . . . . . . . . . . . . . . . . . . . . . . . 50
2.4.2 Rotational and Non-Rotational Components in the NLR . . . . . . . . . . . . . 54
2.4.3 Outflow Properties . . . . . . . . . . . . . . . . . . . . . . . . . . . . . . . . . 58
2.5 Ionization Mechanism and ISM properties . . . . . . . . . . . . . . . . . . . 59
2.5.1 Nebular Extinction and Electron Density . . . . . . . . . . . . . . . . . . . . . 59
2.5.2 Ionization Mechanisms . . . . . . . . . . . . . . . . . . . . . . . . . . . . . . . 60
2.6 Discussion . . . . . . . . . . . . . . . . . . . . . . . . . . . . . . . . . . . . . 63
2.6.1 Interaction-Driven Circumnuclear Star formation . . . . . . . . . . . . . . . . . 63
2.6.2 Feeding vs Feedback . . . . . . . . . . . . . . . . . . . . . . . . . . . . . . . . 64
2.6.3 AGN-Wind Scaling Relations . . . . . . . . . . . . . . . . . . . . . . . . . . . . 64
2.6.4 Multiple Ionization Mechanisms . . . . . . . . . . . . . . . . . . . . . . . . . . 65
3 THE LONG-TERM VARIABILITY OF NGC 2992 . . . . . . . . . . . . . . . . 67
3.1 Introduction: ‘Changing Look’ AGNs . . . . . . . . . . . . . . . . . . . . . . 67
3.2 Data Collection . . . . . . . . . . . . . . . . . . . . . . . . . . . . . . . . . . . 69
3.2.1 X-ray Spectra . . . . . . . . . . . . . . . . . . . . . . . . . . . . . . . . . . . . 69
3.2.2 Historical Optical Spectra . . . . . . . . . . . . . . . . . . . . . . . . . . . . . . 69

3.2.3 Modern Optical Spectra . . . . . . . . . . . . . . . . . . . . . . . . . . . . . . 71
3.2.4 Estimates of the Black Hole Mass . . . . . . . . . . . . . . . . . . . . . . . . . 72
3.3 Data Analyses . . . . . . . . . . . . . . . . . . . . . . . . . . . . . . . . . . . 73
3.3.1 X-ray Variability . . . . . . . . . . . . . . . . . . . . . . . . . . . . . . . . . . . 73
3.3.2 Modern Optical Spectra Analyses . . . . . . . . . . . . . . . . . . . . . . . . . 74
3.3.3 The Link Between the X-ray Luminosity and the BELs . . . . . . . . . . . . . . 77
3.4 Discussion . . . . . . . . . . . . . . . . . . . . . . . . . . . . . . . . . . . . . 82
4 CONCLUSIONS AND FUTURE WORK . . . . . . . . . . . . . . . . . . . . . 84
REFERENCES . . . . . . . . . . . . . . . . . . . . . . . . . . . . . . . . . . . 86
APPENDIX A – APPENDIXES FOR CHAPTER 2 . . . . . . . . . . . . . . . 104
A.1 Stellar Populations Synthesis Maps . . . . . . . . . . . . . . . . . . . . . . 104
A.2 Emission Line Fitting Uncertainties . . . . . . . . . . . . . . . . . . . . . . 104
APPENDIX B – APPENDIXES FOR CHAPTER 3 . . . . . . . . . . . . . . . 108
B.1 Propagation of Asymmetric Uncertainties . . . . . . . . . . . . . . . . . . . 108
B.2 Point-Source Scale Factor Derivation and Measurement . . . . . . . . . . 109
ANNEX A – PAPERS . . . . . . . . . . . . . . . . . . . . . . . . . . . . . . . 111

16
1 ACTIVE GALACTIC NUCLEI
1.1 An Historical Overview
The history of Active Galactic Nuclei (AGNs) started at the beginning of the last century.
Fath (1909) undertook a series of observations aimed at understanding the nature of “spiral
nebulae”, some of the most enigmatic sources at the time. In fact, astronomers were trying to
understand whether these objects were nearby gaseous objects similar to the Orion nebula or
very distant collections of unresolved stars. Fath found continuous spectra with stellar absorption
lines for most objects, which indicated emission from unresolved solar-type stars. However,
for one object, NGC 1068, he found a peculiar spectrum, showing both bright emission and
absorption lines, similar to what had been observed in gaseous nebulae. This result was later
confirmed by Slipher (1917) and by Hubble (1926), who found evidence of this behavior also
in the spectra of NGC 4051 and NGC 4151. The first systematic study of galaxies showing
nuclear emission lines was performed by Seyfert (1943), who studied the spectra of NGC 1068,
NGC 1275, NGC 3516, NGC 4051, NGC 4151, and NGC 7469. He found that while objects like
NGC 1068 had forbidden and permitted lines with roughly similar profiles and widths of ∼ 1000
km s–1, objects like NGC 4151 showed narrow forbidden lines and very broad (∼ 7000 km s–1)
hydrogen lines. In the following years, the AGN study developed mostly on the radio, an energy
band that had started to be explored by astronomers. Later, it led to the discovery of emission
from a discrete source in Cygnus, which was then called Cygnus A (HEY et al., 1946), and later
from several other sources (BOLTON; STANLEY, 1948). In the following years, many more radio
sources were discovered and their positions accurately estimated, thanks to surveys like the
Third Cambridge survey (3C, EDGE et al., 1959). A few years later, the breakthrough came from
observations of the very bright quasar 3C 273 by Hazard et al. (1963). In the same year, based
on optical observations Schmidt (1963) discovered the presence of redshifted emission lines in
3C 273, which were attributed as being due to Hubble expansion (GREENSTEIN; SCHMIDT,
1964). The luminosity obtained and the cosmological distance excluded the possibility that
these objects were highly variable stars. Later, Sandage et al. (1965) reported the discovery of
a large number of radio-quiet objects that resembled quasars. These objects had been found
as a characteristic population examining color-color (U – B, B – V ) diagrams of stars. They
showed a strong “ultraviolet excess”, which is now well known to be one of the most important
characteristics of AGN. Since then, a large number of AGN were discovered and classified
according to their main properties. Today we know that many galaxies harbor AGNs, radio-quiet
objects, as the galaxies discovered by Carl Seyfert (and today called Seyfert galaxies) can
usually be found in spiral galaxies, while radio-loud objects (as 3C 273) are usually hosted by
elliptical galaxies (VÉRON-CETTY; VÉRON, 2001).
The presence of supermassive black holes (SMBHs) in the center of AGNs was first
proposed by Lynden-Bell (1969), and later largely confirmed by several observational evidences.
From the short time scales variations (∼ 1 hour) observed in AGNs, it is possible to obtain an
upper limit on the size of the central source, which, together with mass estimates, points towards
very high densities the order of magnitude of those expected in black holes. A rapidly rotating
disk of ionized gas has been detected by Hubble Space Telescope (HST) observations of M87,

Chapter 1. Active Galactic Nuclei 17
in agreement with a disk being Keplerian rotating around a black hole Ford et al. (1994), the
existence of the supermassive object in M87 was recently undoubtedly confirmed by the Event
Horizon Telescope Collaboration et al. (2019). Moreover, the luminosities observed in AGN can
be easily explained by accretion onto a supermassive black hole (see section 1.2.2), and no
serious alternative explanation to this mechanism exists, although theories involving starburst
have long been debated (e.g., TERLEVICH et al., 1992).
In the following, I will first illustrate the several components that constitute an AGN
(section 1.2), then I will introduce the classification and the unified model (section 1.3), while in
section 1.4 I will discuss the role of the AGNs in the evolution of the galaxies. The main object
(NGC 2992, section 1.5) and the overview of this work are further presented (section 1.6).
1.2 Anatomy of an AGN
AGN are thought to be constituted by several components, all of them very likely intrinsi-
cally related to the supermassive black hole lying at their nucleus, and driving their growth and
evolution. In the following, I will discuss the most important components usually found in AGN.
The supermassive black hole is discussed in section 1.2.1. The Ultraviolet(UV)-Optical emitting
regions: the accretion disk, the broad line region and the narrow line region are discussed from
section 1.2.2 to 1.2.4, while the X-ray emission by the corona and the radio jets are discussed,
respectively, in sections 1.2.5 and 1.2.6.
1.2.1 The Supermassive Black Hole
The existence of black holes was predicted by Penrose (1965) as an interpretation to the
Schwarzschild (1916) solution to Einstein (1916) formulation of General Relativity. However, it
was not until 1972 that evidence for the existence of black holes was found through observations
of Cyg X-1 (WEBSTER; MURDIN, 1972; BOLTON, 1972).
The role of the surface for a black hole of mass M is played by the sphere with a radius
corresponding to the Schwarzschild radius (rg = 2GM/c2). The Schwarzschild radius is the
distance from the singularity at which a body cannot escape anymore from the gravitational
attraction and is bound to fall inside the black hole. The metric of space-time around a non-
rotating black hole is given by the Schwarzschild (1916) solution to Einstein’s general relativity.
From the metric one can deduce the last stable circular orbit around a non-rotating black hole is
r = 3rg . So for r < 3rg no stable orbit exist, and for r < rg particles rapidly fall in the singularity.
The more general solution for a rotating black hole was discovered by Kerr (1963), for a Kerr
balck hole the table circular orbit is 0.5 Rg .
SMBH’s masses range from 106 M�– most found in dwarf galaxies – with the massive
ones – usually found in massive elliptical galaxies – as massive as 1010 M�. Although over the
past few decades, observational work indicates that most, if not all, massive galaxies with a
spheroidal component have a SMBH at their center (e.g., KORMENDY; RICHSTONE, 1995;
MAGORRIAN et al., 1998), the origin of these SMBHs is still unknown. Several scenarios have
been proposed, among it the collapse of supermassive population III stars or the collapse of
massive primordial clouds (DOKUCHAEV et al., 2007; VALIANTE et al., 2017).

Chapter 1. Active Galactic Nuclei 18
Figure 1 – The MBH - σ∗ relation for galaxies with dynamical measurements. The symbol indi-cates the method of MBH mass measurement: stellar dynamics (pentagrams), gasdynamics (circles), masers (asterisks). The color of the error ellipse indicates theHubble type of the host galaxy: elliptical (red), S0 (green), and spiral (blue). The lineis the best fit relation to the full sample: MBH = 108.12 (σ∗/200 km s–1)4.24. Figuretaken from Gültekin et al. (2009).
Measuring SMBH masses
The high angular resolution of HST and ground-based adaptive optics supported tele-
scopes has enabled the determination of the masses of nuclear black holes; for the first time, the
dynamics of stars and gas in the nuclei of nearby galaxies could be studied on scales smaller
than the black hole radius of influence, RBH = GMBH /σ2∗, where MBH is the SMBH mass, σ∗ is
the velocity dispersion of the stars in the host galaxy bulge.
There are direct and indirect methods of measuring MBH . Direct measurements are
those where the mass is derived from the dynamics of stars or gas accelerated by the black
hole itself. These methods include stellar and gas dynamical modeling (e.g., GHEZ et al., 1998;
GENZEL et al., 2003) and reverberation mapping (e.g., PETERSON; HORNE, 2004). Indirect
methods are those where the black hole mass is inferred from observables that are correlated
with the black hole mass. These includes masses based on correlations between black hole
masses and host-galaxy properties, such as the velocity dispersion of bulge stars, i.e., the MBH -
σ∗ relationship (Figure 1, FERRARESE; MERRITT, 2000; GEBHARDT et al., 2000; GÜLTEKIN
et al., 2009; WOO et al., 2013), the bulge luminosity, i.e., the he MBH - Lbulge relationship
(KORMENDY; RICHSTONE, 1995; MAGORRIAN et al., 1998), or even the X-ray variability time
scales, given by the MBH - σrmsx–ray relation (GIERLI NSKI et al., 2008; PONTI et al., 2012) .
One of the most common ways to measure the mass of MBH is through the width of their
broad emission lines (see section 1.2.3), more specific by reverberation mapping. This technique

Chapter 1. Active Galactic Nuclei 19
exploits the fact that emission lines variations are lagged with respect to the continuum (see
section 1.2.2), from which one can calculate rBLR , the distance of the broad emission line region
to the central black hole, by taking into account the light travel time. Using the following equation
one can estimate the SMBH mass (PETERSON et al., 1995):
MBH =f rBLR (∆V )2
G(1)
where ∆V is the velocity of the gas in the broad line region (as measured by the width of
the emission lines). It is also common to distinguish among ‘primary’,‘secondary’ and even
‘tertiary’ methods for the the mass determination, based on the number of assumptions and
model dependence. Reverberation mapping is an interesting example: it is a direct method
as it is based on observations of gas that is accelerated by the gravitational potential of the
central black hole, but, as generally practiced, it is also a secondary method because absolute
calibration of the mass scale depends on another method (the f scale parameter in equation 1,
PETERSON; HORNE, 2004).
1.2.2 The Accretion Disk
Before the 1970s, the importance of accretion in astrophysics was poorly understood.
With the discovery of the first X-ray binaries, it was soon realized that the only mechanism that
could produce the luminosities observed in many of these sources was accretion onto compact
objects.
To have a qualitative idea of the amount of energy produced by accretion processes,
one can consider the gravitational potential energy released by the free fall of a mass m on a
body of mass M and radius R:
∆Eacc =M m G
R(2)
where G is the gravitational constant. To compare it with nuclear processes, the maximum
amount of energy per gram released by nuclear fusion of hydrogen into helium is:
∆Enuc = 0.007 m c2 (3)
where c is the speed of light. Considering, for example, the values typical for a neutron star
(radius of R ∼ 10 km and M ∼ M�), the quantity of energy released by accretion would be
larger than that of nuclear fusion. The energy released ∆Eacc depends on how compact the
accreting object is (Eacc ∝ M/R), thus one can expect that black holes are the sources that
exploit best this source of energy. The luminosity of an accreting black hole can be expressed
as (FRANK et al., 2002):
Lacc ∝ η m c2 (4)
η is the efficiency of the conversion of rest energy of the accreting matter into radiation, and
m is the accretion rate. In the case of a non-rotating spherically symmetric black hole, the last
stable orbit is rI = 3rg = 6GM/c2, which results in a binding energy that is ∼ 6% of the mass of

Chapter 1. Active Galactic Nuclei 20
the particle. In the case of rotating black holes, where rI = 0.5rg = GM/c2 , up to 42.3% of the
rest energy of the material can be released as it spirals into the black hole.
Eddigton luminosity
Accretion is limited by the radiation pressure. At high accretion rates the luminosity
increases and so does the outward force exerted by the radiation (Frad ). On a free electron this
force is:
Frad =Lacc σT
4π r2 c(5)
where σT = 6.65 × 1025 cm2 is the Thomson cross-section. The radiation pressure balances
the gravitational force (FG = GMmp/r2, where mp is the mass of the proton) at the so called
Eddington luminosity. For a fully ionized medium in a spherically symmetric geometry such a
luminosity is:
LEdd =4πG M mp c
σTw 1.3 × 1038
(
M
M�
)
erg s–1. (6)
An accretion disk’s power output across all wavelengths is called its bolometric luminosity.
The ratio between the bolometric luminosity of an object and its Eddington luminosity is called
the Eddington ratio:
λEdd =LBol
LEdd. (7)
Although this derivation of the Eddington luminosity is limited by the spherical symmetry
approximation, which does not represent the physical situation of an accreting disk, it still
provides a useful approximation of the limit luminosity for an accreting system.
The Shakura-Sunyaev accretion disks
Matter falling onto a compact object from infinity acquires kinetic energy as its gravi-
tational potential energy decreases. To conserve the angular momentum, the matter cannot
fall directly into the compact object, but it is commonly believed to form an accretion disk. The
simplest case of accretion disks is the thin accretion disks described by Shakura and Sunyaev
(1973). In this picture, the matter is supposed to form a geometrically thin and optically thick
disk and follows Keplerian orbits at any radius. Angular momentum is transported outwards due
to viscosity produced by turbulent effects and magnetic instabilities (FRANK et al., 2002). The
heat energy produced in the disk is then radiated in the form of multi-temperature blackbodies,
each of them having a temperature
T (R) =(
T∗R
R∗
)–3/4
(8)

Chapter 1. Active Galactic Nuclei 21
Figure 2 – Multicolor blackbody emission from geometrically thin optically thick Shakura andSunyaev (1973) accretion disks with different values of the temperature of the innerlayer Tin. Figure taken from Ricci (2011).
where R is the radius at which it is emitted, R∗ is the radius of a body of mass M∗ accreting at a
rate M, and T∗ is given by:
T∗ ∝(
M∗ M
R3∗
)1/4
. (9)
Between frequencies corresponding to the minimum (rI) and maximum (rmax ) distance from the
accreting object, the spectrum of the accretion disk is given by:
I(ν) ∝ ν1/3 (10)
at frequencies less than that corresponding to the temperature of the disc at rmax , the spectrum
tends towards a Rayleigh-Jeans spectrum, I(ν) ∝ ν2, while it shows a cutoff in the inner parts,
I(ν) ∝ exp(–hν/kTin), where Tin is the temperature of the innermost layers of the thin accretion
disc. An example of the spectrum expected from an accretion disk (for different values of Tin,
SHAKURA; SUNYAEV, 1973) is shown in Figure 2. Observationally this is seems as is show
in Figure 3, and the optical portion is well fitted by a power-law, Flux(λ) ∝ λ–α, with α usually
ranging from 0.5 to 2.5.
The maximum temperature of a thin accretion disk around a Schwarzschild black hole
occurs at r = 49/36 rg (SHAKURA; SUNYAEV, 1973), and is:
Tmax = 1.4 × 10⁵
(
M
0.1MEdd
)1/4( η
0.08
)–1/4(
M
107M�
)–1/4
K (11)
where MEdd = LEdd /ηc2. For parameters typical of a Seyfert galaxy, one obtains an energy of
kTmax = 12 eV, where k is Boltzmann’s constant. From this value one can already see that
the disk alone cannot account for the X-ray emission observed in AGN, we will discuss X-ray
emission in section 1.2.5.

Chapter 1. Active Galactic Nuclei 22
Figure 3 – Composite optical/UV spectra of an AGN. Taken from Vanden Berk et al. (2001).
Alternative accretion scenarios
The Shakura and Sunyaev (1973) model is today believed to be a precise model for
the accretion disks in X-ray Binaries (stellar-mass black holes). However, the predictions by
a simple scaled-up version of the model to SMBHs do not seem to fit well AGN observations.
Given that for AGN scales (where the model still predicts the existence of a geometrically
thin disk), the viscous time scale of the disk is in the order of 104 to 105 years, significantly
exceeding the timescales over which AGN varies. Even more to the transitions of so-called
“Changing Look” AGN’s (CL-AGNS, see section 3.1) where abrupt variations are know to occur
in few years time scales. This incompatibility was noticed long ago (e.g., KORATKAR; BLAES,
1999; ANTONUCCI, 2013), however, just recently, some modification or alternatives to the
application of Shakura and Sunyaev (1973) model to AGNs have been proposed in order to
explain the increasing number of the discovery of these highly variable sources.
For example, Dexter and Begelman (2018) propose that alternatively AGN accretion
discs are vertically supported by magnetic pressure, which makes it geometrically thick (height/radius
between 0.1 and 1.0) at all luminosities. Using three dimensional radiation magneto-hydrodynamic
simulations, Jiang and Blaes (2020) show that, for a 5×10⁸ M� mass black hole, the Rosseland
mean opacity is expected to be larger than the electron scattering value, and the iron opacity
bump then causes the disk to be convectively unstable. This results in strong fluctuations in
surface density and heating of the disk, the opacity drops with increasing temperature, and con-
vection is suppressed, the disk then cools down, and the whole process repeats. This causes
strong oscillations of the disk scale height and luminosity variations by more than a factor of ∼3 – 6 over a few years’ timescales. They argue that since the iron opacity bump will move to
different locations of the disk for black holes with different masses and accretion rates, this is a
physical mechanism that can explain the accretion rate variability of AGN with a wide range of
amplitudes over a time scale of years to decades.
The above-described scenario of an accretion disk seems not to apply for very Low
Luminosity AGNs (LLAGNs). At very low (λEdd � 0.01) accretion rates, the low-density, tenuous

Chapter 1. Active Galactic Nuclei 23
material is optically thin and cannot cool efficiently. Rather than settling into a classical radiatively
efficient disk – the normal configuration for luminous AGNs – the accretion flow puffs up into
a hot, quasi-spherical, radiatively inefficient distribution, whose dynamics may be dominated
by advection, convection, or outflows. The existence of radiatively inefficient accretion flows
(RIAFs, XIE; YUAN, 2012; YUAN; NARAYAN, 2014), or conversely, the absence of a standard
disk extending to small radii (a few rs), is suggested by the weak luminosities of LLAGNs, by
their low Eddington ratios, and especially by their low inferred radiative efficiencies. The great
disparity between the available fuel supply and the observed accretion luminosity demands that
the accretion flow’s radiative efficiency be much less than η = 0.1. The predictions for RIAF’s
spectral energy distribution seems to fit well the broad-band spectrum of a number of LLAGNs,
including NGC 4258 (LASOTA et al., 1996), M81 and NGC 4579 (QUATAERT; NARAYAN, 1999),
NGC 3998 (PTAK et al., 2004), and NGC 1097 (NEMMEN et al., 2006).
1.2.3 The Broad Line Region
Broad emission lines are one of the dominant characteristics of AGN spectra. These
lines are assumed to be Doppler-broadened and are thought to be produced in a region close
to the black hole, generally referred to as the Broad Line Region (BLR). The broad emission
lines of AGN are a useful probe of the central engine. In fact, the bulk motions in the BLR are
regulated both by gravity (due to the black hole) and by the radiation pressure (from the accretion
disk). The widths of AGN broad lines span over two orders of magnitudes, and range from a
minimum Full Width at Half Maximum (FWHM) of 800 km s–1to FWHM up to 104 km s–1, with
typical values of FWHM ∼ 5000 km s–1. The strongest lines observed in the typical spectrum of
an AGN are the hydrogen Balmer-series lines (Hα, Hβ, and Hγ), the hydrogen Lyα, and lines
from abundant ions (Mg II, C III], and C IV), for an example see Figure 4.
The absence of forbidden lines such as [O III] λ5007 gives a lower limit to the ion density
of ∼ 108 cm–3 (NETZER; BLANDFORD, 1990). The BLR mass can be calculated from the
luminosity of C IV and is negligible compared to that of the SMBH. Even for the most luminous
AGN, it is estimated at MBLR ∼ 10 M�. The distance of the BLR from the central black hole
can be inferred by studying the delay of the broad emission lines with respect to the continuum
(reverberation mapping, see section 1.2.1), and it is found to vary with the luminosity, RBLR ∝ L0.7
(KASPI et al., 2000). The average values found are 0.01-0.1 pc for local AGN and up to ∼ 1 pc
for bright quasars.
1.2.4 The Narrow Line Region
The narrow-line region (NLR) is the most extensive AGN component and the only one
which can be resolved by optical and infrared observations. Unlike the BLR, the electron density
in the NLR is low enough that many forbidden transitions are not collisionally suppressed. Some
of the most prominent narrow lines are Lyα λ1216, C IV λ1549, [O III] λ4959, [O III] λ5007, [N II]
λ6584, [S II] λ6717 and [S II] λ6731. The FWHM for narrow emission lines lies in the range 200
km s–1to 900 km s–1, with most of the lines having values of 350-500 km s–1. Analogous to the
BLR, the distance of the NLR to the central engine also scales with luminosity (RNLR ∝ L0.5),
and in Seyfert galaxies has sizes of ∼ 100-300 pc, while it might reach diameters of up to few

Chapter 1. Active Galactic Nuclei 24
Figure 4 – UV/Optical spectrum of the Seyfert 1 galaxy NGC 5548. The spectrum highlightssome of the most important features produced in the BLR. Figure from Mehdipouret al. (2015).
kpc for bright quasars. The NLR mass is several orders of magnitude larger than that of the
BLR, although the amount of line emission produced is often comparable for the two regions.
This is because recombination lines’ emissivity is proportional to the ion density, which makes
the BLR more efficient than the NLR.
The NLR is typically found to be axisymmetric rather than spherically symmetric. One
of the most interesting features of AGN are the “ionization cones” which are clearly detected
in maps of high-excitation lines as [O III] λ5007. These cones have a [O III]/Hα flux ratio higher
than one, which is characteristic of low-density gas ionized by the AGN continuum (see section
1.3). Outside the cone, the ratio is instead lower than unity, which implies that the gas is mostly
ionized by starlight. Figure 5 panel b shows clearly this distinction between the ionization cone,
ionized by the AGN, and the galaxy bar, ionized by the stars.
1.2.5 The Corona
X-ray variability time scales indicate that the X-rays in AGN are produced in a small
region located close to the black hole. The possibility that the disk is responsible for the X-
ray emission can be discarded on the basis that even very warm disks are not supposed to
exceed a few hundred eV (see section 1.2.2 and Figure 2). It is now widely accepted that the
X-ray emission of AGN is produced by Comptonization of optical-UV photons produced in the
accretion disk by a corona of hot electrons. Inverse Compton upscatters to higher energies
photons when their mean energy (〈E〉) is smaller than the thermal energy of the electrons (of
temperature Te): 〈E〉mc2 < 4kTe
mc2 . For hν� mec2 the gain rate of the photon field is:
dE
dt=
43σT c Urad (v2/c2)γ2 (12)
where σT is the Thomson cross-section, Urad the energy density of the photon field, and γ =√1 – v2/c2. The spectrum created by this process depends on the Compton parameter y , given

Chapter 1. Active Galactic Nuclei 25
Figure 5 – (a) Three-color optical image of NGC 1365 combining observations performedthrough three different filters (B, V, R). (b) Two-color image of [O III] (green) andHα (red) stellar subtracted integrated emission, showing the distinction between theAGN ionization cone (green) and the stellar ionized bar-like structure (red). Figureadapted from Venturi et al. (2018).
by:
y =k Te τe
me c2 (13)
where τe is the optical depth of the corona. If the electron gas is optically thin, it can be shown
(see Shapiro et al. (1976) for deduction) that the spectrum is a power-law with a photon index
given by:
Γ = –12
+
√
94
+4y
(14)
As the photons’ energy becomes comparable to the electrons’ thermal energy, the power-law
emission declines in a cutoff at EC ≈ 3kTe. The origin and geometry of the hot corona are
still debated. A popular explanation for the heating of the electrons in the corona, is related
to the presence of flares above the accretion disc, similarly to what is observed in the solar
corona. Although the physical details are somewhat unclear, magnetic flares are a reasonably
working hypothesis to model X-ray spectra and variability of AGN (e.g., HAARDT et al., 1994;
GOOSMANN et al., 2006). In this scenario, the magnetic flares heat the electrons, which then
Comptonize the UV photons from the disk, upscattering them into the X-rays.
The X-rays spectrum of AGNs
Comptonization of low energy seed photons in the hot corona plasma produces a power-
law continuum. Such a power-law continuum that extends from the lowest observable X-ray
energies to a cutoff energy somewhere after ∼ 100 keV is consistent with X-ray observations of
Seyfert galaxies. The flux as a function of the energy of the power-law continuum is given by:
F (E) = A E–Γ photons cm–2s–1 keV –1 (15)

Chapter 1. Active Galactic Nuclei 26
Figure 6 – Effect of photoelectric absorption and Compton scattering on a power law with aphoton index of Γ = 1.95 in the X-rays for different values of the column density NH .Figure taken from Ricci (2011).
where A is the normalization of the power-law at 1 keV, Γ is the photon index (equation 14).
Another important component of AGN X-ray spectra is absorption. Absorption manifests
itself through two processes in the X-rays: photoelectric absorption (boundbound and bound-
free transitions), and Compton scattering (free-free transitions). To model the effect of absorption
one has to take into account both effects. The photoelectric cross section σph has a strong
dependence on the energy, and can be approximated according to the analytic formulae of
Morrison and McCammon (1983):
σph(E) = (C0 + C1E + C2E2) E–3 × 10–24 cm–2, (16)
where C0, C1 and C2 are constants. Compton scattering depends on the Thomson cross section
(σT ), and does not vary with the energy, it becomes significant only for column densities higher
than σ–1T ( 1 × 1024 cm–2), and sources with the column density (NH ) higher than σ–1
T are called
Compton-thick. The Effect of photoelectric absorption and Compton scattering on a power law
with a photon index of Γ = 1.95 is shown is Figure 6 for different values of NH .
An important feature observed in the X-ray spectra of AGN is the reflection component,
produced by Compton scattering of the primary emission in some Compton thick material close
to the X-ray source. Reprocessed emission from neutral material is commonly observed in AGN
through the iron (Fe) Kα emission line. The Fe Kα line is now known to be often constituted
by two components, a narrow and a broad one. The widths of the narrow line core component
usually are of the order of a few thousand km s–1, values which are consistent with the line
originating in the BLR (e.g., YAQOOB et al., 2001; KASPI et al., 2002). However, the lack of
a correlation between the width of the narrow Fe Kα line and the Hβ width or the black hole
mass (NANDRA, 2006) suggests that a significant fraction of the narrow Fe Kα line is produced
in some other region, possibly in the outer part of the accretion disk. This would explain the
rapid (tens of ks) variability observed in some objects (e.g., PETRUCCI et al., 2002). Most of

Chapter 1. Active Galactic Nuclei 27
Figure 7 – Top: Four 0.2-10 keV X-ray spectra of NGC 2992, showing the power law coronaemission and the 6.4 keV Kα lines. Bottom: Residual between equation 17 modeland data. Figure taken from Marinucci et al. (2018).
the reflected emission is, in fact, nowadays believed to originate in the accretion disk, where
the broad relativistic component is also thought to arise (e.g., NANDRA et al., 2007), while the
narrow portion arises in the outer disk and the broader arrises near rI .
In the simplest case, the X-ray spectra for a Compton-thin AGN (where reflection by
Compton scattering is negligible) can be written as:
F (E) = e–σph(E)NGH ×
[
e–σph(E)NH × A E–Γ + G(E)]
(17)
where the term e–σph(E)NGH represents the Galactic photoelectric absorption, by a NG
H Galactic
column density in the line-of-sight, e–σph(E)NH the photoelectric absorption by a NH column
density in the AGN. AE–Γ is the primary power-law corona emission and G(E) a Gaussian profile
to fit the 6.4 keV Fe kα (if both narrow and broad components are present, other Gaussian
profiles can be added). Several other physical components can also be found in AGN X-ray
spectra, e.g., the soft excess and the reflection hump; however, they will not be taken into
account here, because they are not present in NGC 2992 spectra. In Figure 7 four X-ray spectra,
taken in different dates, of NGC 2992 are shown as an example.
1.2.6 The Jets
AGNs can be divided in two classes related to their radio emission, Radio-Loud (RL)
and Radio-Quiet (RQ) AGNs. For the RL the radio emission is typically 103 times brighter than
that in RQ ones. However, a sharp separation between RL and RQ is hard to set, as AGN show
a large variety of radio properties and morphologies, with sources exhibiting compact cores,
jets, knots, and extended diffuse emission in a wide range of strengths and sizes ranging from
sub-pc up to kpc and even Mpc scales.

Chapter 1. Active Galactic Nuclei 28
Figure 8 – Combination of images using data from the VLA (radio) and HST (optical) from theRadio Hercules A galaxy, showing the radio jet extending greater distances from thenucleus than the galaxy itself. Figure taken from O’Dea et al. (2013).
For the RL the radio emission is due to the synchrotron radiation generated in the rela-
tivistic jets, as well as the Radio lobes resulting from the interaction of the jets with intergalactic
medium, sometimes present in these objects (see Hercules A, in Figure 8, for a example of the
radio emission). The production, acceleration and collimation of jets is still poorly understood.
Some of the most popular models are based on magneto-hydrodynamics (BLANDFORD, 2001),
and involve the presence of strong electromagnetic fields that convert the rotational kinetic
energy of a rotating black hole into an outflow through coupling with differential rotation. The
Radio emission in RQ AGNs is thought to have distinct origins, e.g., star formation, accretion
disc winds, expanding plasma bubbles, low-power short jets1 or a combination of them.
1.3 AGN Selection, Classifications and Models
1.3.1 The BPT Diagram
AGN can be distinguished from normal non-active galaxies in several different ways.
Apart from its ubiquitous X-ray emission, one of the most commonly used diagnostics are the
so-called BPT diagrams (BALDWIN et al., 1981), which show the ratios of several lines (e.g.,
[O III]/Hβ vs [N II]/Hα, [O III]/Hβ vs [S II]/Hα, and [O III]/Hβ vs [O I]/Hα, see Figure 9).
Limiting regions based on empirical or theoretical models are used as a division between
distinct ionization sources in the BPT diagram. The Kewley et al. (2001) curve, red in Figure 9,
traces the theoretical upper limit of regions ionized by pure star formation, and therefore all spec-
tra lying above the Kewley et al. (2001) line must include ionization mechanism more energetic
than star formation. The dashed blue curve on the [N II]/Hα vs. [O III]/Hβ diagnostic diagram
1 Here we use the ‘jet’ term to indicate an outflow that becomes collimated, whereas a ‘wind’ is an uncollimatedoutflow. Both transport outwards mass, energy and angular momentum.

Chapter 1. Active Galactic Nuclei 29
Figure 9 – Three BPT diagrams showing the classification of galaxies using emission-line ra-tios. The Kewley et al. (2001) extreme starburst classification line (red solid), theKauffmann et al. (2003) pure star-formation line (blue dashed), and the Seyfert and“LINER” line (blue solid) by Kewley et al. (2006) are used to separate galaxies into H II
region-like (star formation), AGN and LINERs (but not only, also shocks and retiredgalaxies ) ionization and composite types. Figure taken from Kewley et al. (2006).
shows the Kauffmann et al. (2003) empirical classification line, which traces the upper boundary
of the Sloan Digital Sky Survey (SDSS, STRAUSS et al., 2002) star formation sequence.
The full blue curve on the [S II]/Hα vs. [O III]/Hβ and [O III]/Hβ vs [O I]/Hα diagnostic
diagrams traces the Kewley et al. (2006) empirical classification line, which separates high
ionization spectra associated with Seyfert (AGN) and intermediate ionization mechanisms. This
region is often referred to as being the Low-ionization nuclear emission-line region (LINER)’s
region – a class of LLAGNS – however, besides AGNs and LINERs, several excitation mecha-
nisms can also increase the collisional excitation rate, enhancing the ratios of the forbidden to
recombination lines, among them shock excitation and evolved stellar populations (pos-AGB).
Particularly, Cid Fernandes et al. (2011) proposed another classification diagram that uses the
Equivalent Width of Hα (WHα) versus [N II]/Hα (WHAN diagram), to distinguish from LINERs
and Retired Galaxies with Diffuse Gas (DIG) Ionized by pos-AGB stars, the later having WHα < 3
Å (STASINSKA et al., 2008; CID FERNANDES et al., 2011).
Starburst-AGN mixing
The original BPT and its application to SDSS data (previous section and Figure 4) were
based on spectra taken using a single large aperture, and therefore accounting for the emission
lines in the entire or most of the central portion of the galaxies. However, using spatially resolved
spectroscopy (Longslits or Integral Field Unit), it is possible to resolve the internal structures in
the ionization mechanism of galaxies. In particular, the spatially resolved BPT of some AGNs
show an interesting feature – known as Starburst-AGN mixing (e.g., DAVIES et al., 2014b,
2014a; D’AGOSTINO et al., 2018) – in these galaxies the nuclear spectra are located above
Kewley et al. (2001) line, but they cross the line continuously, as the radius increases, towards
Kauffmann et al. (2003) line, and end up, at the outer radius, below the line, at the pure-starburst
region. Figure 10 illustrates this feature in NGC 5728 as an example.

Chapter 1. Active Galactic Nuclei 30
Figure 10 – Resolved BPT diagram showing the Starburst-AGN mixing for NGC 5728. Figuretaken from Davies et al. (2016).
1.3.2 AGN Classes and the Unified Model
Radio-quiet AGNs are divided into low luminosity Seyfert galaxies (the most common
AGN in the local universe) and high luminosity quasars. The division between the two classes
is usually set to MB = –23 mag, where MB is the absolute magnitude in the B band. Historically,
Type 1 AGNs are those showing both broad (section 1.2.3) permitted emission lines and narrow
(section 1.2.4) forbidden lines in their optical spectra; while Type 2 AGNs lack Broad Emission
Lines (BEL). Intermediate AGN types were added by Osterbrock (1981), including types 1.8
and 1.9, classified according to the presence of a weak (type 1.8), or absent (type 1.9), Hβ BEL,
while retaining an Hα BEL. Type 1 AGN spectra usually present a power-law like featureless
continuum (FC) emission from the accretion disk (section 1.2.2), while Type 2 usually lack this
feature.
The presence of intermediate objects between Seyfert 1s and Seyfert 2s was firstly
explained by differences due to varying amounts of absorbing material along the line of sight.
This led to introducing a dust shell with any possible geometry, from a 4π shell with varying
thickness to an angle-dependent axisymmetric structure or a patchy distribution of dust. The
discovery of polarized BELs in the spectrum of the Seyfert 2 galaxy NGC 1068 by Antonucci and
Miller (1985, see original plot in Figure 11) led to the idea that a torus-like distribution of matter
surrounds AGNs. In this scheme the broad lines observed in the polarized spectrum of NGC
1068 are produced by the reflection of the radiation emitted in the BLR. According to the unified
model of AGN, all the objects have a dusty torus extending from 1 to 100 pc from the center, and
in this frame, Seyfert 1s are observed pole on (see Figure 12) so that the observer can look at
both the BLR and the NLR at the same time, whereas Seyfert 2s are observed edge-on so that
the BLR is obscured and one can see only the NLR (ANTONUCCI, 1993; URRY; PADOVANI,
1995).
The Unified Model has been conceived to explain the large zoo of different AGN with a

Chapter 1. Active Galactic Nuclei 31
Figure 11 – The original spectro-polarimetric observation of NGC 1068 by Antonucci and Miller(1985).
Figure 12 – Illustrative diagram of the unified model for AGNs. Adapted from Urry and Padovani(1995).
Chapter 1. Active Galactic Nuclei 32
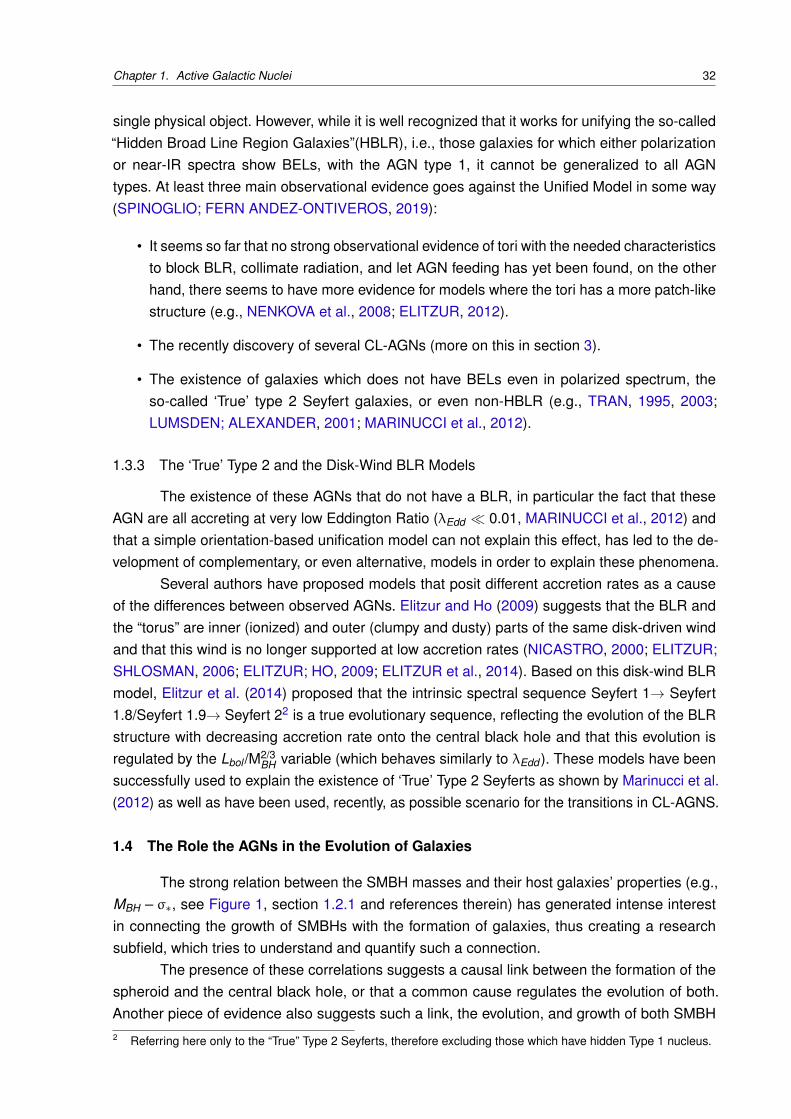
single physical object. However, while it is well recognized that it works for unifying the so-called
“Hidden Broad Line Region Galaxies”(HBLR), i.e., those galaxies for which either polarization
or near-IR spectra show BELs, with the AGN type 1, it cannot be generalized to all AGN
types. At least three main observational evidence goes against the Unified Model in some way
(SPINOGLIO; FERN ANDEZ-ONTIVEROS, 2019):
• It seems so far that no strong observational evidence of tori with the needed characteristics
to block BLR, collimate radiation, and let AGN feeding has yet been found, on the other
hand, there seems to have more evidence for models where the tori has a more patch-like
structure (e.g., NENKOVA et al., 2008; ELITZUR, 2012).
• The recently discovery of several CL-AGNs (more on this in section 3).
• The existence of galaxies which does not have BELs even in polarized spectrum, the
so-called ‘True’ type 2 Seyfert galaxies, or even non-HBLR (e.g., TRAN, 1995, 2003;
LUMSDEN; ALEXANDER, 2001; MARINUCCI et al., 2012).
1.3.3 The ‘True’ Type 2 and the Disk-Wind BLR Models
The existence of these AGNs that do not have a BLR, in particular the fact that these
AGN are all accreting at very low Eddington Ratio (λEdd � 0.01, MARINUCCI et al., 2012) and
that a simple orientation-based unification model can not explain this effect, has led to the de-
velopment of complementary, or even alternative, models in order to explain these phenomena.
Several authors have proposed models that posit different accretion rates as a cause
of the differences between observed AGNs. Elitzur and Ho (2009) suggests that the BLR and
the “torus” are inner (ionized) and outer (clumpy and dusty) parts of the same disk-driven wind
and that this wind is no longer supported at low accretion rates (NICASTRO, 2000; ELITZUR;
SHLOSMAN, 2006; ELITZUR; HO, 2009; ELITZUR et al., 2014). Based on this disk-wind BLR
model, Elitzur et al. (2014) proposed that the intrinsic spectral sequence Seyfert 1→ Seyfert
1.8/Seyfert 1.9→ Seyfert 22 is a true evolutionary sequence, reflecting the evolution of the BLR
structure with decreasing accretion rate onto the central black hole and that this evolution is
regulated by the Lbol /M2/3BH variable (which behaves similarly to λEdd ). These models have been
successfully used to explain the existence of ‘True’ Type 2 Seyferts as shown by Marinucci et al.
(2012) as well as have been used, recently, as possible scenario for the transitions in CL-AGNS.
1.4 The Role the AGNs in the Evolution of Galaxies
The strong relation between the SMBH masses and their host galaxies’ properties (e.g.,
MBH – σ∗, see Figure 1, section 1.2.1 and references therein) has generated intense interest
in connecting the growth of SMBHs with the formation of galaxies, thus creating a research
subfield, which tries to understand and quantify such a connection.
The presence of these correlations suggests a causal link between the formation of the
spheroid and the central black hole, or that a common cause regulates the evolution of both.
Another piece of evidence also suggests such a link, the evolution, and growth of both SMBH
2 Referring here only to the “True” Type 2 Seyferts, therefore excluding those which have hidden Type 1 nucleus.

Chapter 1. Active Galactic Nuclei 33
Figure 13 – The cosmological growth of SMBH and stellar mass in the universe. Figure takenfrom Shankar et al. (2009).
(as traced by AGN accretion rate) and galaxies (as traced by star formation rate) is surprisingly
similar during the history of the universe. There seems to have a sharp increase in the density
star formation rate (SFR) and the SMBH growth rate at about a factor of 10, at 0 < z < 1, a
broad maximum at both rates at z ∼ 2-3 and then a relatively sharp decline in higher redshifts
(see Figure 13). At least for the last ∼ 11 billion years (Gyr) the ratio between the growth
of both SMBHs mass and stellar mass has remained approximately constant, in the order of
10–3. Somehow the growth of both has been kept in synchronized (HOPKINS; BEACOM, 2006;
FARDAL et al., 2007; SHANKAR et al., 2009).
Although such relationships exist, AGNs’ exact role in the evolution of galaxies is not yet
fully understood. It is known that the energy released by AGN feedback in the form of radiation,
winds, or radio-plasma jets has a significant impact on the interstellar medium of the host galaxy.
However, the exact role of feedback is still a matter of debate (feeding and feedback mechanism
will be further discussed in section 2.1). However, hydrodynamic simulations of galaxy formation
are not able to reproduce the observed galaxy mass function if no AGNs feedback mechanism is
inserted in the simulations (SPRINGEL et al., 2005; SILK; MAMON, 2012; BULLOCK; BOYLAN-
KOLCHIN, 2017), where these processes are responsible for suppressing the growth of more
massive galaxies heating up and/or expelling the gas that would form more stars, thus limiting
the growth of very massive galaxies. Figure 14, as an example, shows the mass function for
dark matter, expected by numerical simulations, and the observed mass function of galaxies,
it is clear that there is a significant discrepancy between the two functions for galaxies more
massive than 1011.5 M�, indicating the need for some kind of AGN feedback effect. There is also
a discrepancy in the number of dwarf galaxies, which can be explained only by stellar winds
Chapter 1. Active Galactic Nuclei 34
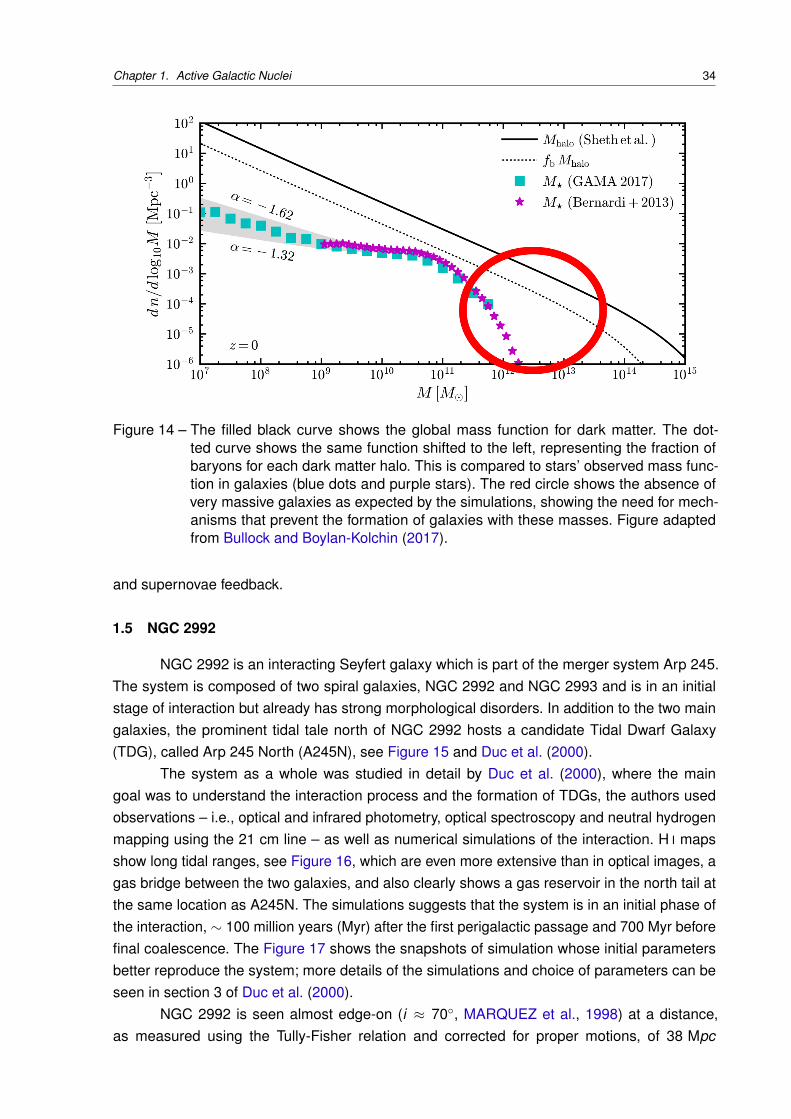
Figure 14 – The filled black curve shows the global mass function for dark matter. The dot-ted curve shows the same function shifted to the left, representing the fraction ofbaryons for each dark matter halo. This is compared to stars’ observed mass func-tion in galaxies (blue dots and purple stars). The red circle shows the absence ofvery massive galaxies as expected by the simulations, showing the need for mech-anisms that prevent the formation of galaxies with these masses. Figure adaptedfrom Bullock and Boylan-Kolchin (2017).
and supernovae feedback.
1.5 NGC 2992
NGC 2992 is an interacting Seyfert galaxy which is part of the merger system Arp 245.
The system is composed of two spiral galaxies, NGC 2992 and NGC 2993 and is in an initial
stage of interaction but already has strong morphological disorders. In addition to the two main
galaxies, the prominent tidal tale north of NGC 2992 hosts a candidate Tidal Dwarf Galaxy
(TDG), called Arp 245 North (A245N), see Figure 15 and Duc et al. (2000).
The system as a whole was studied in detail by Duc et al. (2000), where the main
goal was to understand the interaction process and the formation of TDGs, the authors used
observations – i.e., optical and infrared photometry, optical spectroscopy and neutral hydrogen
mapping using the 21 cm line – as well as numerical simulations of the interaction. H I maps
show long tidal ranges, see Figure 16, which are even more extensive than in optical images, a
gas bridge between the two galaxies, and also clearly shows a gas reservoir in the north tail at
the same location as A245N. The simulations suggests that the system is in an initial phase of
the interaction, ∼ 100 million years (Myr) after the first perigalactic passage and 700 Myr before
final coalescence. The Figure 17 shows the snapshots of simulation whose initial parameters
better reproduce the system; more details of the simulations and choice of parameters can be
seen in section 3 of Duc et al. (2000).
NGC 2992 is seen almost edge-on (i ≈ 70◦, MARQUEZ et al., 1998) at a distance,
as measured using the Tully-Fisher relation and corrected for proper motions, of 38 Mpc

Chapter 1. Active Galactic Nuclei 35
Figure 15 – LRGB image composition of Arp 245 from Block (2011). North is up and east is left,NGC 2992 is the reddish galaxy.
(THEUREAU et al., 2007), which translates into a projected angular scale of ∼ 150 pc per
arcsec. The galaxy nuclear activity has been the subject of several studies, partly due to its
variability as seen both in X-rays (GILLI et al., 2000; MARINUCCI et al., 2018) and in the optical
(TRIPPE et al., 2008b), even leading to changes in spectral classification (these will be fully
explored in chapter 3).
In the radio, the galaxy is a RQ AGN, however its 6 cm radio observations show a double
lobe 8-shaped structure of about 8 arcsec (∼ 1 kpc) extension to the northwest and Southeast
of the galaxy, along position angle (PA) of –26◦ (ULVESTAD; WILSON, 1984). From IR observa-
tions, Chapman et al. (2000) suggest the best interpretation is that this structure is related to
expanding plasma bubbles, possibly carried by internal jets from the AGN. More recently, using
radio polarimetry, Irwin et al. (2017) found another double-lobed radio morphology within its
spiral disc, which was revealed in linearly polarized emission but not in total intensity emission.
This second structure by Irwin et al. (2017) is much more extended than the one found by
Ulvestad and Wilson (1984) reaching several kpcs from the nucleus, being interpreted by the
authors as a relic of an earlier episode of AGN activity. The X-ray properties of the galaxy will
be fully explored in chapter 3.
NGC 2992 gas kinematics is complex as found by several long slit spectroscopy studies
(e.g., MARQUEZ et al., 1998; VEILLEUX et al., 2001) as well as by several IFU data (GARCA-
LORENZO et al., 2001; FRIEDRICH et al., 2010; MULLER-SANCHEZ et al., 2011). These

Chapter 1. Active Galactic Nuclei 36
Figure 16 – H I distribution in Arp 245. H I lines contours are superimposed on an image in theV band, taken from Duc et al. (2000). The contours are 1, 2, 3, 5, 10, 15 and 20 ×1020 cm–2.
observations show, at most slit positions, the presence of a double component line profile. While
one component follows the galaxy rotation curve, the other is interpreted as outflowing gas by
the authors. Using The Multi Unit Spectroscopic Explorer (MUSE, BACON et al., 2010) at the
Very Large Telescope (VLT) Mingozzi et al. (2019) show the presence of a kpc-scale, bipolar
outflow with a large opening angle.
1.6 This Work
The peak of star formation and SMBH growth in the universe was between redshift 3 and
2 (Figure 13), and therefore the effects of both AGN feedback and mergers were more critical
to galaxy evolution at that time than they are in the local universe. However, the high redshift
universe is only now becoming accessible, and the observational facilities can not yet reach the
pc scales resolution need to resolve the internal structures of these galaxies. Therefore, nearby
galaxies, such as NGC 2992, are still essential laboratories to study these processes, not only
due to the high physical spatial resolution that can be reached but also because this sources
have been followed-up since the early ’50s by distinct instruments in several wavelengths.
The following sections are the result of two independent works in which we apply distinct
methods and techniques to probe distinct physical regions of the AGN in NGC 2992:
• In chapter 2, we explore the feeding and feedback process that may operate in the cir-
cumnuclear region of this galaxy as it is both an interacting galaxy and an AGN, therefore,

Chapter 1. Active Galactic Nuclei 37
Figure 17 – Time evolution of the numerical model of the system Arp 245 by Duc et al. (2000).In each panel, it is shown the projected distribution of the stars (color scale) andthat of the gas (green contours). Each panel is 140 h–1 kpc on a side, and the labelsgive the elapsed time after the start of the simulation in units of 0.1 Hubble times(or 0.98 h–1 Gyr). The model is shown in the plane of the sky and the orientation isthe same as in Figure 15.
being one of the nearest probes of the so-called AGN-Merger connection. We do so by
using optical Integral Field Unit (IFU) spectroscopic observations, using the GMOS instru-
ment at the Gemini South Telescope, of the galaxy’s inner kpc to spatially resolve both
the stellar populations and the properties of the ionized gas as well as the effect of the
radio-emitting structure in the interstellar medium.
• In chapter 3, we use time-domain astronomy to probe the central engine of the AGN,
since it can not be spatially resolved. We analyze all historical (1978 to 2019) optical and
X-ray spectra of the source in order to investigate its long-term variability and the singular
physics of this source, which is an example of a rare ‘Changing Look’ AGN.

38
2 THE CIRCUMNUCLEAR REGION OF NGC 2992
This chapter is fully based on the following paper, of which I am the lead author, and therefore
is not intended as an original work:
“Exploring the AGN-Merger Connection in Arp 245 I: Nuclear Star Formation and Gas Outflow
in NGC 2992”, Guolo-Pereira, M., Ruschel-Dutra, D., Storchi-Bergmann, T., Schnorr-Müller,
A., Cid Fernandes, R., Couto, G., Dametto, N, Hernandez-Jimenez, J. A., 2021, MNRAS, 502,
3618.
2.1 Introduction: Feeding and Feedback
As discussed in section 1.4 AGNs may have had an important role in the evolution of
galaxies. The energy released by the AGN in the form of radiation, winds, or radio plasma jets
is known to impact the interstellar medium of the host galaxy. However, it is still the subject
of an ongoing debate about such AGN feedback’s exact role. Some studies indicate that the
shocks resulting from the interaction between the jets and interstellar medium may trigger
star formation (e.g., OOSTERLOO; MORGANTI, 2005; ISHIBASHI; FABIAN, 2012; ZINN et
al., 2013; SILK, 2013). On the other hand, as exemplified by Figure 14, feedback may be an
important factor in the quenching of star formation, mainly at late stages of galaxy evolution (e.g.,
DI MATTEO et al., 2005; CROTON et al., 2006), in which these processes are responsible for
suppressing the growth of most massive galaxies, by heating and expelling that gas that would
form stars. Observationally, feedback in the form of large scales gas outflows are observed
in very energetic forms (e.g., RUPKE; VEILLEUX, 2011; GREENE et al., 2012) reaching up
to 1000 km s–1, those being usually produced by the interaction between the ionized gas and
strong magnetic fields (BISNOVATYI-KOGAN; LOVELACE, 2001), but also in the less energetic
forms, in nearby galaxies, with velocities as low as ∼ 100 – 200 km s–1, with mass outflow
rates averaging at a few solar masses per year (e.g., RIFFEL; STORCHI-BERGMANN, 2011;
CRENSHAW et al., 2015; REVALSKI et al., 2018, see Figure 31 for more examples).
In order for a passive SMBH to be activated, the interstellar medium (ISM) or even
intergalactic medium (IGM) material has to lose angular momentum and by some dynamical
mechanism be transported from regions in galactic scales (kpc) to nuclear regions (sub-pc)
in order to feed the central object. Two types of feeding process are proposed: environmental
mechanism and secular mechanism (STORCHI-BERGMANN; SCHNORR-MÜLLER, 2019, for
a revision in the feeding mechanisms). Secular mechanisms are those internal to the host galaxy,
which can lead its gas to lose angular momentum. Theoretical studies and simulations show that
non-asymmetric potential wells may efficiently promote gas inflow towards the nuclear regions of
the galaxy (e.g., SHLOSMAN et al., 1990; ENGLMAIER; SHLOSMAN, 2004; KNAPEN, 2005).
Using IFU observations, several authors were able to detect gas inflows in nuclear bars as
well as in small-scale nuclear spiral arms, in both ionized and molecular gas (e.g., STORCHI-
BERGMANN et al., 2007; RIFFEL et al., 2008; SCHNORR MÜLLER et al., 2011; COMBES
et al., 2014).
Environmental mechanisms are those in which external factors to the host galaxy are
responsible for driving the inflows; between them, mergers may be the most efficient ones.

Chapter 2. The Circumnuclear Region of NGC 2992 39
Theoretical studies suggest large scale events like major mergers are the dominant processes
leading to SMBH growth at high masses (MENCI et al., 2014). At high redshifts (z > 2), ma-
jor mergers have also been proposed as fuelling mechanisms of the fastest-growing SMBHs
(TREISTER et al., 2012). A major merger can destabilize large quantities of gas due to tidal
forces, driving, therefore, massive inflows towards the nuclear region of galaxies and triggering
bursts of star formation and nuclear activity (HOPKINS; ELVIS, 2010; BLUMENTHAL; BARNES,
2018). Many studies have found that the most luminous AGN are preferentially hosted by galaxy
mergers (e.g., SCHAWINSKI et al., 2010; GLIKMAN et al., 2015; FAN et al., 2016). At lower
luminosities, several studies have found a higher incidence of galaxies with signatures of inter-
actions in AGN hosts as compared to control samples (KOSS et al., 2010) and particularly in
close galaxy pairs (ELLISON et al., 2011; SATYAPAL et al., 2014) suggesting kinematic pairs
are conducive environments for SMBH growth.
The inflow of gas, by either secular or environmental mechanism, drives the simultane-
ous growth of the stellar mass (by triggering star formation) in the nuclear region and of the
SMBH, this may be a possible explanation to the existence of the relations between bulge’s
and SMBH’s properties (as described in 1.2.1 and Figure 1). Observationally, Seyfert galaxies
have younger nuclear stellar populations than those present in normal (non-active) galaxies. In
fact, young stars seem to commonly coexist with AGNs in nuclear regions of active galaxies,
as shown by several stellar populations analyses (e.g., STORCHI BERGMANN et al., 1990;
STORCHI-BERGMANN et al., 2000, 2002; DELGADO et al., 2001; CID FERNANDES et al.,
2004; RIFFEL et al., 2007). Kauffmann et al. (2003), for example, have studied a sample of
more than twenty-two thousand AGN host galaxies from the SDSS and concluded that luminous
AGNs are commonly found in bulges with younger stellar populations. Recently, Mallmann et al.
(2018) explored the spatially resolved stellar populations of 62 AGNs with the Mapping Nearby
Galaxies at APO (MaNGA, BUNDY et al., 2015) Survey and found a higher fraction of young
stars (t < 4 × 10⁷ years) in the central regions (R ≤ 0.5Re) of luminous AGNs (L[O III] ≥ 1041.25
ergs/s) when compared with the control sample.
To explore these multiple scenarios and possibilities, in this section, we use spatially
resolved optical spectroscopy data to probe both the stellar populations and the ionized gas
properties of NGC 2992’s circumnuclear region.
2.2 Observations and Data Reduction
This chapter’s work is mostly based on data obtained with the Integral Field Unit (IFU)
of the Gemini Multi Object Spectrograph (GMOS) at the Gemini South telescope on the night
of February 15, 2018 (Gemini project GS-2018A-Q-208, P.I. Ruschel-Dutra). The observations
consisted of two adjacent IFU fields (covering 5′′× 3.′′5 each). The fields are slightly offset, both
in Right Ascension (RA) and Declination (Dec), in order to increase the field of view (FoV) and
cover a larger portion of the galaxy plane. For each IFU field, there are six exposures, with an
integration time of 560 seconds each. Each science observation is accompanied by a 5′′× 1.′′75
sky observation for atmospheric lines removal.
The reduction procedures were performed using the Gmos Ifu REDuction Suite (GIREDS)1.
1GIREDS is a set of python scripts to automate the reduction of GMOS IFU data, available at GitHub.

Chapter 2. The Circumnuclear Region of NGC 2992 40
The process for each of the 12 observations comprised the usual following steps:
• Bias subtraction: Essentially, all detectors have non-zero counts on 0-second exposure;
these counts are called bias. In order to remove this signature from the instrument, the
bias counts are subtracted from the science files.
• Flat-field correction: A flat field is the response of the telescope/camera system to a source
of uniform illumination. A flat field frame is basically an image of a uniformly illuminated
field. Since the image of the flat field contains differences in illumination due to variations
within the optical system, dividing the science image by the normalized flat field frame
corrects the scientific image for these instrumental variations.
• Removal of cosmic rays: cosmic rays are highly energetic particles that generate a high
number of counts when reaching the CCD, which can be identified as the black dots
randomly scattered in the images. Their removal is done using the routine L.A.Cosmic
(VAN DOKKUM, 2001)
• Wavelength calibration: a spectrum obtained from observation does not have associated
wavelength values. One needs to use a calibration based on a spectrum with known lines,
which is obtained by inserting a calibration lamp in the optical path of the spectrograph, in
this case, a Copper-Argon (CuAr) lamp.
• Flux calibration: consists of associating flux values to each wavelength of the observed
spectrum. This is done by comparing the instrumental counts per unit of time from a known
source, a standard star, with the science spectral counts.
Finally the registering and combination of the 12 individual exposures was done. The
final cube was built with a spatial sampling of 0.′′1 × 0.′′1, resulting in a FoV with ≈ 2800 spaxels.
After cropping the borders and superimposing the FoVs, it results in a total useful combined FoV,
with total angular coverage of 29 arcsec2 around the nucleus. The spatial resolution was limited
by the seeing, which was at 0.′′8 during the observations (as measured from the field stars in
the acquisition image), corresponding to 120 pc at the galaxy. The observed spectra covered
a range from 4075 to 7285 Å with an instrumental dispersion σinstr ≈ 40 km s–1, obtained from
the CuAr arc lamp lines.
Many Gemini data cubes show certain “instrumental fingerprints”, in the form of vertical
stripes in the reconstructed data cube. Such features also have specific spectral signatures. In
order to identify and remove these instrumental features, we use a technique based on Principal
Component Analysis (PCA, MENEZES et al., 2014). The fingerprint removal is fundamental
for the stellar population synthesis because its effect is more apparent for lower instrumental
counts. The data cube spectra were corrected for Galactic extinction using the Cardelli et al.
(1989) extinction curve (CCM), and a Rv =3.1, for an AV = 0.166 (SCHLAFLY; FINKBEINER,
2011) and by Doppler effect using the radial velocity of 2345 km s–1(see section 2.4).
We show in the upper panel of the Figure 18 an LRGB image of the Arp 245 system (Left)
and the acquisition image taken with a r’ filter (Right). In the middle panel we show a zoomed
version of the acquisition image superimposed with the the (ULVESTAD; WILSON, 1984) figure

Chapter 2. The Circumnuclear Region of NGC 2992 41
Figure 18 – Top Left: LRGB image composition of Arp 245 from Block (2011). Top Right: GMOSr’ band acquisition image of NGC 2992. Middle Left: Zoomed acquisition image, andthe Ulvestad and Wilson (1984) radio emission in purple (contours : 3, 6, 9, 15, 30,50, 70, 90 percent of the peak of 7.2 mJy). The dashed rectangles show the two IFUFoV’s. Middle Right: IFU continuum mean flux in the combined FoV. Bottom, fromtop to bottom: Spectra corresponding to the regions marked as A, B, and C, with
spectral flux density in units of 10–15 erg s–1 cm–2 Å–1
. North is up and East to theleft in this and all figures of this chapter. The black cross represents the continuumnuclear position in all figures of this chapter. All maps of this section were smoothedusing a Gaussian kernel with FHWM with half of the spatial resolution, see section2.2.

Chapter 2. The Circumnuclear Region of NGC 2992 42
of 8-shaped radio emission of the galaxy (Left) and the mean continuum flux in the IFU’s FoV
(Right), while in the bottom panels we show three sample spectra from representative regions
marked, respectively from top to bottom, A, B and C. The prominent dust lane seen in the
acquisition image, and in the stellar continuum image from the IFU, has a reported AV greater
than 3 (COLINA et al., 1987; SCHNORR-MULLER et al., 2016a). Spectra from this region of
high extinction have no measurable stellar component above the noise level, as exemplified by
the spectrum extracted from C. The nuclear spectrum shows a broad Hα component, and a
faint broad Hβ is also present.
2.3 Stellar Populations
In order to obtain the spatially resolved star formation history (SFH), and to fit the
gas emission features, free from the stellar population contamination, we performed stellar
population synthesis on the data cube by employing the starlight full spectra fitting code
(CID FERNANDES et al., 2005a). Briefly, starlight fits an observed stellar spectrum Oλ with
a model Mλ built from a linear combination of N spectral components. Dust attenuation is
treated as if due to a foreground screen and parametrised by the V -band extinction AV . Stellar
kinematics is modelled with a Gaussian line-of-sight velocity distribution centred at velocity v∗,
and with a dispersion σ∗.
Besides the model spectrum Mλ, the code outputs the corresponding values of AV , v?,
σ?, and a population vector ~x containing the percentage contribution of each base population
to the flux at a chosen normalisation wavelength λ0, which in our fits was chosen as λ0 =
5500 Å. The code minimises the χ2 of the fit, though a more convenient and intuitive figure of
merit to assess the quality of the fit is through adev parameter, defined as the mean value of∣
∣Oλ – Mλ
∣
∣ /Oλ over the fitted wavelengths.
We note that, while there are many different spectral fitting codes and techniques avail-
able, cross-comparison of these various techniques have shown to yield rather consistent results
(e.g. KOLEVA et al., 2008; FERR E-MATEU et al., 2012; MAKSYM et al., 2014; MENTZ et al.,
2016; CID FERNANDES, 2018). Therefore, rather than trying different fitting codes, we chose
to maintain starlight and investigate the differences introduced by the choice of models and
stellar libraries, which are known to produce variations in the recovered properties (e.g. MARAS-
TON; STROMBACK, 2011; CHEN et al., 2010; WILKINSON et al., 2017; BALDWIN et al., 2018;
DAMETTO et al., 2019).
2.3.1 Evolutionary Models, Stellar Libraries and Featureless Continuum
This section discusses the stellar population models and stellar libraries used in this
work, and how we can account for the contribution of a featureless continuum due to the AGN
in NGC 2992.
The key ingredients in the stellar population synthesis method are the spectral base
elements, i.e. those spectra available to the fitting code to combine in order to recover the
galaxy properties. The base elements are, usually, Simple Stellar Population (SSP), i.e. a
collection of stars with same age and metallicity, taken from an evolutionary model which are
constructed using a stellar spectra library and an Initial Mass Function (IMF).

Chapter 2. The Circumnuclear Region of NGC 2992 43
Table 1 – SSPs used in the stellar population synthesis.
Model BC03 M11Spectral Library STELIB MILES
Metallicity 0.2 1.0 2.5 0.5 1.0 2.0
Ages(Gyr)
0.001, 0.003, 0.005,0.01, 0.025, 0.04,0.1, 0.3, 0.6, 0.9,
1.5, 3.0, 5.0,11.0, 13.0
0.055, 0.065,0.075, 0.085,
0.1, 0.15,0.3, 0.6,
0.9
0.007, 0.008,0.009, 0.01,0.015, 0.025,0.04, 0.055,0.065, 0.075,
0.085, 0.1,0.15, 0.3, 0.9,1.5, 3.0, 5.011.0, 13.0
0.1, 0.15,0.3, 0.6,0.9, 1.5,3.0, 5.0,
11.0, 13.0
In this work we have used SSPs from two models: Bruzual and Charlot (2003, here after
BC03), which uses the STELIB (LE BORGNE et al., 2003) spectral library, and Maraston and
Stromback (2011, hereafter M11), which employs the MILES (S ANCHEZ-BL AZQUEZ et al.,
2006) spectral library. For both models/libraries we use the same Chabrier (2003) IMF and
instantaneous star formation bursts. We found varying the IMF produces only minor variations
in the recovered SFH when compared to the changes introduced by using distinct models. The
former is outside the scope of this work, and we refer the reader interested in this particular
effect to Chen et al. (2010), Ge et al. (2019) and references therein. From the SSPs provided by
BC03 we choose a set of 45 representative elements divided into three metallicities (0.2, 1.0, 2.5
Z�) and an age range covering from t(Gyr) = 0.001 to t(Gyr) = 13. From those available by M11
with the MILES library we chose a set of 40 SSPs with age and metallicity coverage as similar
as possible to the BC03 ones: three metallicities (0.5, 1.0, 2.0 Z�) and ages ranging from t(Gyr)
= 0.007 to t(Gyr) = 13. The complete list of SSPs used from each model is shown in Table 1. It
is important to mention that the MILES Library does not provide metal-poor stars (Z = 0.5 Z�)
younger than 55 Myr (0.055 Gyr), and neither metal-rich stars (Z = 2.0 Z�) younger than 100
Myr (0.1 Gyr), while BC03/STELIB provide the same age range for the three metallicities (see
Table 1).
We define a reduced population vector with three age ranges: t < 100 Myr; 100 Myr
≤ t ≤ 1.4 Gyr; and t > 1.4 Gyr, to obtain a more robust description of the SFH than that obtained
with the full population vector (see, e.g. CID FERNANDES et al., 2005a), as well as to facilitate
the visualisation of the spatially resolved fit results. The population vector components are
denoted by xY , xI and xO, where Y , I and O stands for young, intermediate and old respectively.
The division in a reduced population vector has been used in several works in stellar population
synthesis (e.g. CID FERNANDES et al., 2005a; RIFFEL et al., 2010a; CID FERNANDES et al.,
2013; GONZALEZ DELGADO et al., 2015; MALLMANN et al., 2018), while the range values
may be slightly distinct from one another, the ones adopted here are the most common. Also,
for the young population the cutting value of 100 Myr is the estimated age of the pericentre
passage between NGC2992 and its companion (section 1.5).
When dealing with stellar populations in Seyfert galaxies, a power law (Fλ ∝ λ–α)
featureless continuum (FC) should be added to the spectral base (KOSKI, 1978) to account for
the AGN emission. Values for α are between 0.5 – 2.0 (OSTERBROCK; FERLAND, 2006), with
many authors working with large samples of galaxies assuming a general value of α = 1.5 (e.g.,

Chapter 2. The Circumnuclear Region of NGC 2992 44
RAIMANN et al., 2003; KAUFFMANN et al., 2003; CID FERNANDES et al., 2004; MALLMANN
et al., 2018). Since this work is focused on a single object, we propose a method to specifically
fit the α index for the optical spectrum of NGC 2992. We extracted two integrated spectra: an
inner one, hereafter S(λ), defined as the sum of spectra within a circular region with radius of
0.′′4, and an external one, E(λ), in an annulus with inner radius of 1′′and outer radius of 1.′′4,
both centred at the peak of continuum emission. We model the S(λ) spectrum as a combination
of E(λ) and a power law FC , both reddened by the same factor and normalized in the same
wavelength, λ0 = 5500 Å, as follows:
(
Sm (λ)Sm (λ0)
)
=[
(1 – p)(
E (λ)E (λ0)
)
+ p
(
λ
λ0
)–α]
× 10–0.4δAV qλ (18)
where Sm(λ) is the model spectrum, p is the fraction contribution of the FC, δAV is the difference
in extinction between the S(λ) and E(λ) regions. The values which minimise the residuals
between S(λ) and Sm(λ) are p = 0.23, δAV = 2.2 and α =1.7.
It should be noted we are over-simplifying by assuming that S(λ) is the combination of
E(λ) and an FC, i.e. the stellar spectrum of both are the same. However, we argue this is just
a method to get a data-based value for α, instead of just assuming a fixed value which is even
less physically justified. Also, no further interpretation will be given in this regard besides the
adoption of this α value to produce the FC base element.
2.3.2 Spatially Resolved Stellar Populations Synthesis
In order to perform the spatially resolved stellar synthesis with enough signal to noise
ratio (S/N) we employed the Voronoi tessellation technique (CAPPELLARI; COPIN, 2003) in
our data cube, with a S/N target set to 20. Results from Cid Fernandes et al. (2005a) show
at this level starlight is able to reliably recover input parameters. Some spectra, however,
failed to reach the desired S/N, even when combining several tens of spaxels, specifically those
obscured by the galaxy’s dust lane. Henceforward we will just analyse and show the results for
those voronoi zones which the combined-spectra has S/N ≥ 10, relying again on Cid Fernandes
et al. (2005a) tests that show it to be the minimum value to the reliability of the code.
In order to be able to explore both the effects of the FC component and the change of
model/library, we run the starlight code in the spaxels of the binned cube using three distinct
spectral bases:
• BC03: Only stellar SSP components from the BC03/STELIB models, see Table 1 for ages
and metallicities.
• BC03+FC: Same as BC03 stellar SSPs, with the addition of an FC component (Fλ ∝ λ–1.7)
to the spectral base.
• M11+FC: Stellar SSP components from M11/MILES, see Table 1 for ages and metallicities,
in addition to the FC component.
Since the effects of the presence/absence of FC component can be tested comparing BC03
with BC03+FC, and the change of model/library is explored comparing BC03+FC with M11+FC,
Chapter 2. The Circumnuclear Region of NGC 2992 45
we did not find necessary to test the synthesis using M11 without FC, therefore we kept our
analyze within these three configurations.
The FC component is available for starlight only in the spaxels of the inner 1.1 arcsec2,
which equals 3σ of the Gaussian point spread function. The reason for not allowing the FC to
be used throughout the field is that there is a high level of degeneracy between the FC and a
young reddened population (further discussion in Cid Fernandes and Gonzlez Delgado (2010)
and the next section), and also because there is no physical reason to have an FC emission
outside the nucleus since it is emitted by the spatially unresolved accretion disk. We will call the
percentage contribution of the FC to total light of a spaxel as xagn. During the synthesis all the
emission lines were masked (see Figure 19), the mask is the same in all spaxels with exception
to the central ones (r < 1.1′′) where Hβ and [N II] +Hα masks are broader. The sum of xY , xI ,
xO, xagn values is always 100% for all spaxels.
The maps of the recovered properties from the three distinct bases are shown in Fig-
ure 39, Figure 40 and Figure 41 at the Appendix A.1. These figures show the maps for xY , xI ,
xO, xagn, AV , the light-weighted stellar mean age 〈log t∗〉 defined as:
〈log t∗〉 =
∑N∗
j=1 xj log(tj )∑N∗
j=1 xj
(19)
where xj are the elements of the population vector ~x , i.e. the fraction contribution of each
component to the total light, tj is the ages of j-th component, and N∗ is the number of stellar
spectra in the base (SSPs). The figures in Appendix A.1 also shows the light-weighted stellar
mean metallicity 〈Z〉 for each reduced population vector component xY , xI and xO, respectively
〈Z〉Y , 〈Z〉I and 〈Z〉O, defined as:
〈Z〉 =
∑tfj=t0
xj zj∑tf
j=t0xj
(20)
where t0 and tf are respectively the lower and upper age limit of the reduced population vector
components as defined in the previous section.
The upper panel of Figure 19 shows an example fit for a spaxel at r = 0.′′6, the residuals
between the observed and the fitted spectra and the emission line mask. At the bottom panels
the age/metallicity/FC decomposition for the three syntheses are shown as an example of the
small differences resulting from the change of spectral base (see sections 2.3.3 and 2.3.4).
In Figure 20 we show the radial profiles of xY , xI , xO, xagn and 〈log t∗〉, in bins of 0.′′45 (≈70 pc), with points representing the median, and the colored region represents the 25 and 75
percentiles of the azimuthal distribution for the given radial bin. In Figure 21 we show the values
of 〈Z〉 for each one of the bases integrated over the entire FoV.
In general terms the presence of a large contribution of old metal-rich SSPs and a
smaller, but significant, contribution of young metal-poor stars seems to be independent of the
presence of an FC component, or the change of model/library. The detailed analyses of the
2 The radius(r)= 0.0 is set as the peak of the continuum emission.

Chapter 2. The Circumnuclear Region of NGC 2992 46
2
4
6
8
10Flux
()
Observed (r = 0.6")Fit (BC03+FC)
4500 5000 5500 6000 6500[Å]
0
2
Resid
ual
Mask
106 107 108 109 1010
10203040506070
x j(%
) BC03: Av=2.66, adev=3.99, < log t* > = 9.12 0.2 Z 1.0 Z 2.5 Z
F
106 107 108 109 1010
10203040506070
x j(%
) BC03+FC: Av=2.60, adev=3.93, < log t* > = 9.38 0.2 Z 1.0 Z 2.5 Z
F
106 107 108 109 1010
Age [yr]
10203040506070
x j(%
) M11+FC : : Av=2.77, adev=3.95, < log t* > = 9.27 1.0 Z 2.0 Z
FC
Figure 19 – Example of stellar population synthesis fit. Top: Observed (black) and synthetic (red)
spectra both in units of 10–15 erg s–1 cm–2 Å–1
in a spaxel at radius equal to 0.′′6.Middle: Residual between the observed and synthetic spectra, masked emissionlines are shown in purple. Bottom: Age/metallicity and FC decomposition for thethree synthesis, BC03, BC03+FC and M11+FC. The dashed lines show the divisionbetween xY , xI and xO SSPs.
differences caused by the distinct spectral bases available to the code will be better explored in
the sections below.
2.3.3 The FC Component Usage: Comparing BC03 and BC03+FC
As shown by Figure 20, the differences in the BC03 and BC03+FC synthesis are seen
only at the inner spaxels and are linked to the presence of the FC component in the spectral
base. For the external spaxels (r > 1.′′1), where only BC03 stellar components are used in both
synthesis, the recovered properties are identical, as one would expect. In the external spaxels,
the xO values range between 75% and 85%, with all spaxels having super-solar mean metallicity,
〈Z〉O > 1.5 Z�, and the majority of them being close to the upper limit of the models, 〈Z〉O ≈ 2.5
Z�. The xY values are between 15% and 25%, with most spaxels having a sub-solar mean
metallicity, 〈Z〉Y ≤ 1.0 Z�, with a considerable portion of them at the lower limit of the model, i.e.
〈Z〉Y = 0.2 Z�. Some properties are identical in all runs even at the inner spaxels, AV is very
high in the innermost spaxels (AV > 3 mag) declining rapidly to AV ≈ 2.5 mag and reaching
1.5 mag at the border spaxels (AV map shown at Appendix A.1). Similarly, the contribution from
intermediate SSPs, xI , is null at most spaxels and reaches a maximum value between 10 and
20% in very few regions.

Chapter 2. The Circumnuclear Region of NGC 2992 47
30
40
50
60
70
80
90
100
x O [%
](BC03) (BC03+FC) (M11+FC)
0
10
20
30x I
[%]
0
10
20
30
40
50
x Y [%
]
0
10
20
30
40
x agn
[%]
0.0 0.5 1.0 1.5 2.0 2.5 3.0 3.5Radius [arcsec]
8.8
9.0
9.2
9.4
9.6
log
t * [y
r]
Figure 20 – Radial profiles of the recovered properties for BC03 (gold), BC03+FC (red) andM11+FC (blue) in bins of 0.′′45 (∼ 70 pc). From top to bottom:% contribution tothe total light from young (xO), intermediate (xI) and old (xY ) SSPs, from the FC(xagn) and the light-weighed mean stellar age (〈log t∗〉). xagn is null for BC03 bydefinition. The xI values for BC03 are not shown, however they are exactly thesame as BC03+FC.
Chapter 2. The Circumnuclear Region of NGC 2992 48
Comparing the inner spaxels of BC03 and BC03+FC, we see that the presence of an FC
component in the base causes a decrease in xO by just a few%. Larger differences, however, are
seen in the contribution from young stars, especially where an FC component is not available
(BC03).
In this case, there is a sharp increase in xY from a steady 20% at r > 1′′to more than
40% at the centre. On the other hand, the (BC03+FC) base produces a roughly constant xY
at r < 1.0′′, while xagn increases from ∼0% at 1.0′′to ∼20% in the innermost spaxels. This
effect is caused by the above-mentioned degeneracy between an FC spectrum and a young-
reddened SSP (CID FERNANDES et al., 2004; CID FERNANDES; GONZLEZ DELGADO,
2010). As shown by Cardoso et al. (2017), fitting a spectrum that contains an AGN power law-
like continuum with only stellar components causes the solution to have an excess of young
populations, which leads to a drop in the 〈log t∗〉 (see the bottom panel of Figure 20). Although
such degeneracy can cast some doubts in the exact values of the xY and xagn decomposition
in BC03+FC, the fact that the solution at the center has xY values compatible with the ones of
the external regions of the FoV, and that the FC component contribution follows a radial profile
compatible with an unresolved source (i.e increasing from xagn ≈ 0% to xagn ≈ 20% at the
continuum peak) is strong evidence in favour of the existence of an FC emission in NGC 2992.
2.3.4 Decomposition Stability: Comparing BC03/STELIB and M11/MILES
In this section we discuss differences in the recovered properties between BC03+FC
and M11+FC bases and their derivations. We do not intend to make a detailed analysis of the
models and its derivations, nor to suggest one is a better choice than the other for use with this
type of data. Such discussions can be found in other studies, e.g. Riffel et al. (2015), Baldwin
et al. (2018) and Ge et al. (2019). Instead, we merely want to test the stability of the inferred
stellar properties with changes in models.
Besides the distinct stellar libraries used in these model libraries, they also employ
different evolutionary prescriptions (see CONROY, 2013, for a review on stellar evolutionary
models). BC03 is constructed using the isochrone synthesis approach, while M11 uses the
fuel consumption theory. The treatment of the thermally pulsing asymptotic giant branch (TP-
AGB) phase is also a major topic of disagreement between different models. For example,
Dametto et al. (2019) found a relative excess of young populations and lack of intermediate-age
components when Near-Infrared (NIR) stellar populations synthesis are performed with BC03
SSPs, favoring results achieved with the M11 models. Nevertheless, these effects are much
more important when modelling stellar populations in the NIR, being significantly less relevant
in the optical.
Both xagn and AV are very similar to those obtained with BC03+FC, but the population
vectors have notable differences. For instance, xO values for M11+FC are systematically lower
by ∼5 to 10% than those recovered with BC03+FC, while at the same time both xY and xI are
conversely higher for M11+FC. Given the increase of both xY and xI and the decrease in xO, the
light-weighted mean stellar age 〈log t∗〉 for M11+FC is systematically lower than for BC03+FC
by ∼ 0.05 to 0.1 dex, as show in the bottom panel of Figure 20.
Although there are small differences in age decomposition, the metallicity general pattern

Chapter 2. The Circumnuclear Region of NGC 2992 49
<Z>Y <Z>I <Z>O
0.20.5
1.0
1.5
2.0
2.5Z
[Z]
BC03
<Z>Y <Z>I <Z>O
BC03+FC
<Z>Y <Z>I <Z>O
M11+FC
Figure 21 – Values of 〈Z〉 Y , 〈Z〉 I and 〈Z〉 O integrated over the entire FoV for each base, fromleft to right, respectively, BC03, BC03+FC and M11+FC. Points are the medianvalues, and the coloureds bars are the 25 and 75 percentiles. The dashed blacklines show the metallicity limit for each of the models.
seems to be maintained. As can be seen in Figure 21, the old populations have a super-solar
mean metallicity, close to the upper limit of the model (1.5 Z� < 〈Z〉O ≤ 2.0 Z�) and the
young populations have a solar to sub-solar mean metallicity (〈Z〉Y ≤ 1.0 Z�), as shown in
the middle panels of Figure 21. However, while the values of 〈Z〉Y in BC03+FC are mostly
sub-solar (〈Z〉Y < 1.0 Z�) the values in M11+FC are all solar (〈Z〉Y = 1.0 Z�). This discrepancy
is probably caused by the fact that the MILES library does not contain SSPs with a sub-solar
metallicity younger than 55 Myr (see Table 1). For instance, in the example of Figure 19, while
BC03 and BC03+FC recover its young populations as a combination of three SSPs with ages
of 1 Myr, 5 Myr and 10 Myr, the two first with sub-solar metallicity (Z = 0.2 Z�) and the later with
solar metallicity (Z = 1.0 Z�), the M11+FC recovers it as both 9 Myr and 10 yr solar metallicity
SSPs, and the fitting code would not be able to fit such a young component with lower metallicity
precisely because MILES library does not provide an SSPs with Z = 0.5 Z� younger than 55
Myr. Therefore, we can see these 〈Z〉Y = 1.0 Z� values in the synthesis using M11+FC base
as an upper limit for the young population metallicity.
As mentioned, above, we do not claim any of the three syntheses to be the one that better
describes the data. In fact, there are no significant differences in the adev parameters among
the bases: adev values range from 3% at the inner spaxels up to 8% at larger radius. Recovered
properties produced with the distinct models present the same general trend (see section 2.3.2).
However, we argue the bases which include an FC component are more physically justified.
Both the large decrease in 〈log t∗〉 in the inner spaxels, when this component is ignored, and
the fact that the FC components fluxes have a spatial profile characteristic of a point-like source
(FWHM ≈ 0.′′8, see Figure 24) are strong evidence of the existence of an FC like emission
in NGC 2992. It is worth mentioning even though we are not discussing results for the stellar
kinematics, we have made sure all the three decompositions were kinematically consistent
with each other, and no non-physical value was fitted to v∗, σ∗ parameters, which would cause
an incorrect subtraction of the continuum used in emission line fitting procedures of the next
sections.
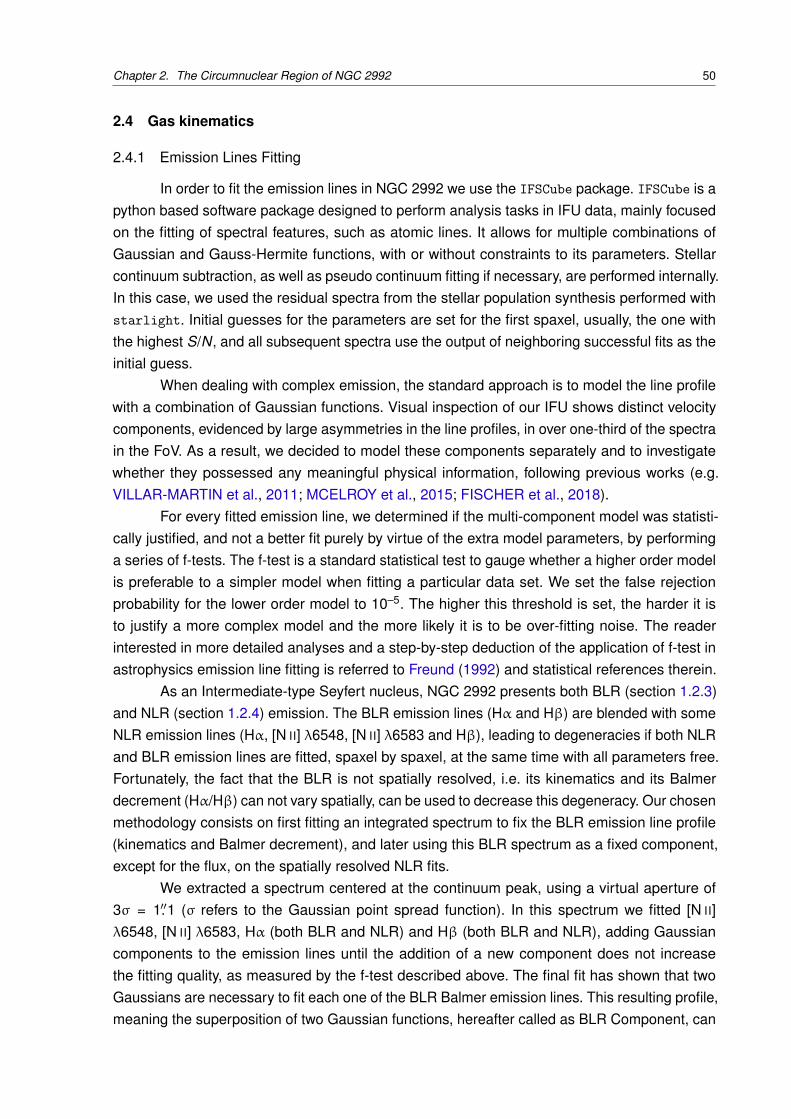
Chapter 2. The Circumnuclear Region of NGC 2992 50
2.4 Gas kinematics
2.4.1 Emission Lines Fitting
In order to fit the emission lines in NGC 2992 we use the IFSCube package. IFSCube is a
python based software package designed to perform analysis tasks in IFU data, mainly focused
on the fitting of spectral features, such as atomic lines. It allows for multiple combinations of
Gaussian and Gauss-Hermite functions, with or without constraints to its parameters. Stellar
continuum subtraction, as well as pseudo continuum fitting if necessary, are performed internally.
In this case, we used the residual spectra from the stellar population synthesis performed with
starlight. Initial guesses for the parameters are set for the first spaxel, usually, the one with
the highest S/N, and all subsequent spectra use the output of neighboring successful fits as the
initial guess.
When dealing with complex emission, the standard approach is to model the line profile
with a combination of Gaussian functions. Visual inspection of our IFU shows distinct velocity
components, evidenced by large asymmetries in the line profiles, in over one-third of the spectra
in the FoV. As a result, we decided to model these components separately and to investigate
whether they possessed any meaningful physical information, following previous works (e.g.
VILLAR-MARTIN et al., 2011; MCELROY et al., 2015; FISCHER et al., 2018).
For every fitted emission line, we determined if the multi-component model was statisti-
cally justified, and not a better fit purely by virtue of the extra model parameters, by performing
a series of f-tests. The f-test is a standard statistical test to gauge whether a higher order model
is preferable to a simpler model when fitting a particular data set. We set the false rejection
probability for the lower order model to 10–5. The higher this threshold is set, the harder it is
to justify a more complex model and the more likely it is to be over-fitting noise. The reader
interested in more detailed analyses and a step-by-step deduction of the application of f-test in
astrophysics emission line fitting is referred to Freund (1992) and statistical references therein.
As an Intermediate-type Seyfert nucleus, NGC 2992 presents both BLR (section 1.2.3)
and NLR (section 1.2.4) emission. The BLR emission lines (Hα and Hβ) are blended with some
NLR emission lines (Hα, [N II] λ6548, [N II] λ6583 and Hβ), leading to degeneracies if both NLR
and BLR emission lines are fitted, spaxel by spaxel, at the same time with all parameters free.
Fortunately, the fact that the BLR is not spatially resolved, i.e. its kinematics and its Balmer
decrement (Hα/Hβ) can not vary spatially, can be used to decrease this degeneracy. Our chosen
methodology consists on first fitting an integrated spectrum to fix the BLR emission line profile
(kinematics and Balmer decrement), and later using this BLR spectrum as a fixed component,
except for the flux, on the spatially resolved NLR fits.
We extracted a spectrum centered at the continuum peak, using a virtual aperture of
3σ = 1.′′1 (σ refers to the Gaussian point spread function). In this spectrum we fitted [N II]
λ6548, [N II] λ6583, Hα (both BLR and NLR) and Hβ (both BLR and NLR), adding Gaussian
components to the emission lines until the addition of a new component does not increase
the fitting quality, as measured by the f-test described above. The final fit has shown that two
Gaussians are necessary to fit each one of the BLR Balmer emission lines. This resulting profile,
meaning the superposition of two Gaussian functions, hereafter called as BLR Component, can

Chapter 2. The Circumnuclear Region of NGC 2992 51
be seen in panel (1) of Figure 22.
In order to resolve the kinematics of the NLR and obtain maps of emission line ra-
tios, we fitted the following eight strongest emission lines present in the data cube: Hβ, [O III]
λ4959,λ5007, Hα, [N II] λ6548,λ6583 and [S II] λ6716,λ6731. Each emission line was modeled
with a set of Gaussian functions. The central wavelength of the Gaussian functions was al-
lowed to vary by up to ±400 km s–1and the velocity dispersion up to 400 km s–1(FWHM ≈ 1000
km s–1). We added one more set of Gaussians to the fit, meaning that each emission line is
modeled by up to two Gaussian components3. To reduce the number of free parameters, each
set of Gaussians was required to have the same velocity and velocity dispersion (meaning their
relative wavelengths were fixed), while their fluxes were allowed to vary. The reason for this is
each component represents a kinematically distinct part of the gas, meaning that they may have
different ionization states determined by their relative fluxes. This means that, for example, the
single-component set of Gaussians fit to the eight emission lines instead of having twenty four
(eight lines × three parameters) free parameters, only had nine (a single velocity, v , and velocity
dispersion, σ, amplitudes of Hα, Hβ, the two [S II] and the stronger [N II] and [O III], while the
amplitudes of the weaker [N II] and [O III] were set fixed as 1/3 of the stronger ones, as given
by their Quantum Mechanics’ probabilities (hereafter we call [O III] λ5007 as [O III], [N II] λ6583
as [N II], and the [S II] λ6716,λ6731 as [S II]). As described in the previous paragraph, the BLR
Component was also included in the fit with only the amplitude as free parameter.
To estimate the uncertainties in the parameters, we performed Monte Carlo simulations,
in which Gaussian noise was added to the observed spectrum. One hundred iterations were
performed and the estimated uncertainty in each parameter was derived from the standard
deviation in all the iterations. The uncertainty maps are presented in Appendix A.2.
We then applied the f-test to each one of the NLR emission lines, spaxel by spaxel, in
order to assess if the simple model (single-Gaussian) is enough to fit the data or the more
complex model (two Gaussians) is required. The f-test results in spatially contiguous regions
of the required number of components for each emission line. The maps for [N II] and [O III]
emission lines are shown in Figure 22 and Figure 23. The figures also show spectral and
emission line fits in selected regions of the FoV.
The maps are not exactly equal for all emission lines. The size of the region in which
two components are needed depends on the line S/N4. Therefore the size is maximum for [O III]
(Figure 23) and Hα (Figure 28), a little bit smaller for [N II] (Figure 22) and the [S II] doublets (not
shown) and much smaller for the low S/N line, Hβ (not shown). However, the general pattern
is the same for all emission lines: the data are well fitted by a single-Gaussian in most of the
FoV, but in a region, from the nucleus to the end of the FoV in the northwest (NW) direction two
Gaussians are needed.
As can be seen in both figures, for those spaxels in which the emission lines are well
behaved and symmetric, a single-Gaussian function, which we will call Component 1, is enough
to fit the data. However, in the spaxels where two components were statistically significant, the
3 Given that usually the NLR emission lines are some times not well fitted by a simple Gaussian profile, due to thepresence of multiple kinematical components in the line of sight, e.g. gaseous disk rotation, gas outflows andinflows (e.g. ZAKAMSKA et al., 2016; SCHNORR-MULLER et al., 2017).
4 Because the f-test detection is sensible to how much the second component, the more complex model, standsout from the noise. Therefore in low S/N lines, it is less likely the f-test will require a complex model.

Chapter 2. The Circumnuclear Region of NGC 2992 52
-3 -2 -1 0 1 2 3X (arcsec)
Y (a
rcse
c)
E
N
1
2
3
-3 -2 -1 0 1 2 3X (arcsec)
-3
-2
-1
0
1
2
3
Y (a
rcse
c)
150pc
1
2
30
2
4
6
8
10
Flux
()
(1) Component 1Component 2BLR ComponentTotal FitObserved
6500 6550 6600 6650 6700 6750wavelength [ ]
0.50.00.5
0.0
0.4
0.8
1.2
1.6
Flux
()
(2)
6500 6550 6600 6650 6700 6750wavelength [ ]
0.10.00.1
0.0
0.5
1.0
1.5
2.0
Flux
()
(3)
6500 6550 6600 6650 6700 6750wavelength [ ]
0.20.00.2
2.0 4.0 6.0[10 16 erg cm 2 s 1 Å 1]
1 2Nb. Gauss. Comp. [N II]
Figure 22 – Top left: Map of the continuum emission at λ = 5500 Å and map of the pre-ferred number of Gaussian components to the [N II] emission-lines. Top right andbottom: Examples of the Hα, [N II] λ6548,λ6583 and [S II] λ6716,λ6730 emis-sion lines fitting and their residual in distinctly regions of the FoV marked in themaps. The vertical axis units in the panels showing the emission-line profiles are
10–15 erg s–1 cm–2 Å–1
and the dashed vertical lines show rest-frame wavelength ofthe lines.
-3 -2 -1 0 1 2 3X (arcsec)
Y (a
rcse
c)
E
N
1
2
3-3 -2 -1 0 1 2 3
X (arcsec)
-3
-2
-1
0
1
2
3
Y (a
rcse
c)
150pc
1
2
3
0
5
10
Flux
()
(1)Component 1Component 2Total FitObserved
4940 4960 4980 5000 5020wavelength [ ]
0.50.00.5
0.0
0.5
1.0
Flux
()
(2)
4940 4960 4980 5000 5020wavelength [ ]
0.10.00.1
0.0
0.5
1.0
1.5
Flux
()
(3)
4940 4960 4980 5000 5020wavelength [ ]
0.20.00.2
2.0 4.0 6.0[10 16 erg cm 2 s 1 Å 1]
1 2Nb. Gauss. Comp. [O III]
Figure 23 – Same as Figure 22 but for [O III] emission lines.
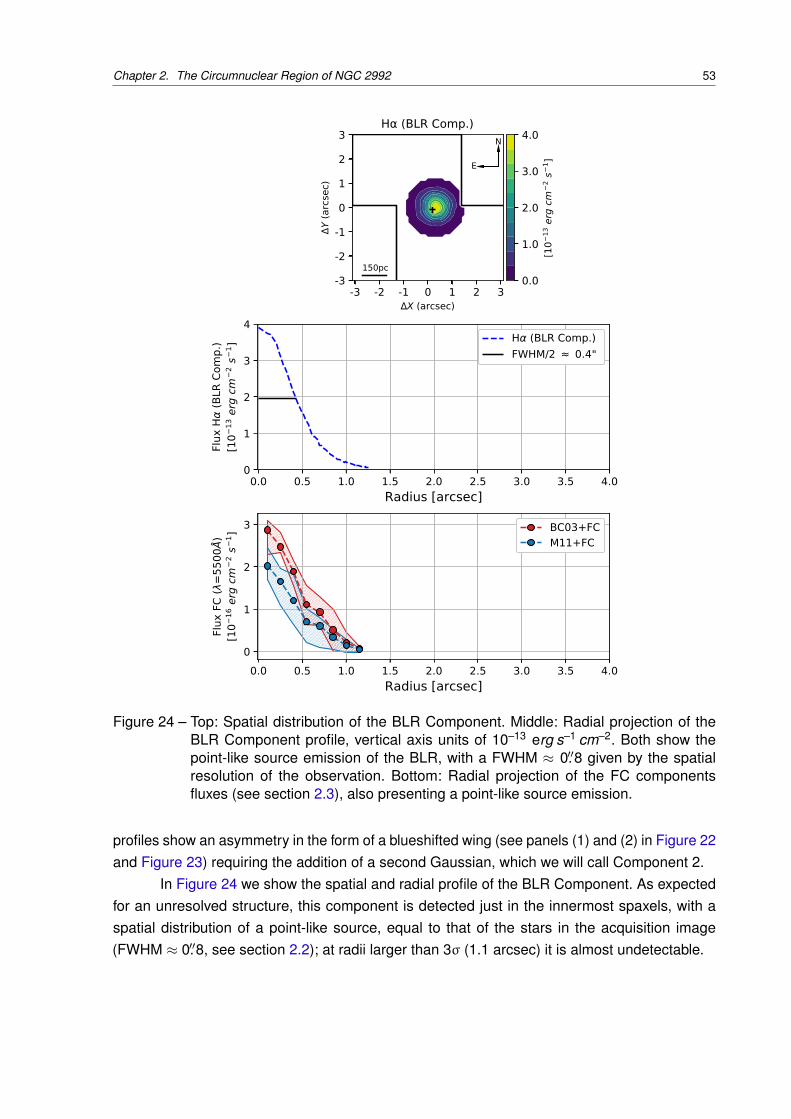
Chapter 2. The Circumnuclear Region of NGC 2992 53
-3 -2 -1 0 1 2 3X (arcsec)
-3
-2
-1
0
1
2
3
Y (a
rcse
c)
150pc
E
NH (BLR Comp.)
0.0 0.5 1.0 1.5 2.0 2.5 3.0 3.5 4.0Radius [arcsec]
0
1
2
3
4
Flux
H (B
LR C
omp.
)[1
013ergcm
2s
1 ]
H (BLR Comp.)FWHM/2 0.4"
0.0 0.5 1.0 1.5 2.0 2.5 3.0 3.5 4.0Radius [arcsec]
0
1
2
3
Flux
FC
(=5
500Å
)[1
016ergcm
2s
1 ]
BC03+FCM11+FC
0.0
1.0
2.0
3.0
4.0
[10
13ergcm
2s
1 ]
Figure 24 – Top: Spatial distribution of the BLR Component. Middle: Radial projection of theBLR Component profile, vertical axis units of 10–13 erg s–1 cm–2. Both show thepoint-like source emission of the BLR, with a FWHM ≈ 0.′′8 given by the spatialresolution of the observation. Bottom: Radial projection of the FC componentsfluxes (see section 2.3), also presenting a point-like source emission.
profiles show an asymmetry in the form of a blueshifted wing (see panels (1) and (2) in Figure 22
and Figure 23) requiring the addition of a second Gaussian, which we will call Component 2.
In Figure 24 we show the spatial and radial profile of the BLR Component. As expected
for an unresolved structure, this component is detected just in the innermost spaxels, with a
spatial distribution of a point-like source, equal to that of the stars in the acquisition image
(FWHM ≈ 0.′′8, see section 2.2); at radii larger than 3σ (1.1 arcsec) it is almost undetectable.

Chapter 2. The Circumnuclear Region of NGC 2992 54
Table 2 – Best Fitting Parameters Bertola et al. (1991) Model.
Parameters Valuesvsys 2345 ± 5 [ km s–1]A 132 ± 4 [ km s–1]p 1a
c0 3.5 ± 0.1 [arcsec]ψ0 32◦ ± 1◦
i 70◦ ± 1◦
a In the model the parameters p is allowed to vary between 1 and 1.5, the fitted value was equals to 1 in all theMonte Carlo iterations.
2.4.2 Rotational and Non-Rotational Components in the NLR
Let us now discuss the spatially resolved properties of the NLR Components 1 and
2 and their possible physical interpretation. Component 1 is present in the entire FoV. In the
top panels of Figure 25 we show, from left to right, [O III] flux, velocity dispersion (σ), already
corrected by instrumental dispersion. In the middle left panel, we present the radial velocity (v ).
We show the [O III] flux as an example of the morphology of this component, which is similar
to the continuum morphology, with the peak of the emission shifted by only ∼ 0.′′2 to southwest
(SW), with a steep decrease (up to 2 dex) towards the dust lane region. The σ values range
from 50-100 km s–1and show a very disturbed pattern. The radial velocity map shows values
from -130 to 120 km s–1and although it presents some disturbance, a rotation pattern is clearly
discernible, with the SW portion receding and the northeastern (NE) approaching. We have
considered the west side of the galaxy is the near one, following the literature (e.g. MARQUEZ
et al., 1998; VEILLEUX et al., 2001); this explains why the emission is seen mainly to the east
and less to the west where it is attenuated by the dust lane in the line-of-sight.
In order to quantify how much the velocity field deviates from a pure rotation and to
derive both the major axis PA and the inclination of disk we fit the (BERTOLA et al., 1991)
model. The model assumes a spherical potential with pure circular orbits, in which the observed
radial velocity at a position (R, ψ) in the plane of the sky is given by the relation:
v (R,ψ) = vsys +A R cos(ψ –ψ0) sin θ cosp i
{
R2[
sin2(ψ –ψ0) + cos2(ψ –ψ0)]
+ c20 cos2i
}p/2 (21)
where vsys is the systemic velocity, i the inclination of the disk (with i = 0 for a face-on disk), A is
the amplitude of the curve, c0 is the concentration parameter and ψ0 the line of nodes PA. The
parameter p defines the form of the rotation curve, varying in the range between 1 (logarithm
potential) and 1.5 (Keplerian potential). To avoid the degeneracy between the parameters,
we restricted the disk inclination to have values of i = 70±10 (based on DUC et al., 2000,
photometric analyses) and we assumed the kinematical center to be co-spatial with the peak
of the continuum emission. A Levenberg-Marquardt least-squares minimization was performed
to determine the best fitting parameters and the uncertainties were obtained by making one
hundred Monte Carlo iterations. We show the best parameters and their uncertainties in Table 2.
The PA of the line of nodes was measured as 32±1◦, in agreement with previous values
from the literature: PA = 32◦ (VEILLEUX et al., 2001, hereafter V01), PA= 30◦ (MARQUEZ et al.,

Chapter 2. The Circumnuclear Region of NGC 2992 55
-3
-2
-1
0
1
2
3
Y (a
rcse
c)150pc
log10 Flux[OIII] (Comp. 1)
E
N (Comp. 1)
-3
-2
-1
0
1
2
3
Y (a
rcse
c)
NEAR
FAR
150pc
V (Comp. 1)
NEAR
FAR
E
NVModel
-3 -2 -1 0 1 2 3X (arcsec)
-3
-2
-1
0
1
2
3
Y (a
rcse
c)
NEAR
FAR
150pc
V VModel
-3 -2 -1 0 1 2 3X (arcsec)
NEAR
FAR
E
NError V (Comp. 1)
15.615.315.014.714.414.113.813.5
405060708090100110
1208040
04080120
1208040
04080120
1208040
04080120
0
5
10
15
Figure 25 – Component 1 properties. Top left: Log10 Flux [O III] λ5007 ( erg s–1 cm–2). Top right:Velocity dispersion σ ( km s–1). Middle left: Radial velocity v ( km s–1). Middle right:Modelled radial velocity ( km s–1), from the Bertola et al. (1991) rotation model fitting.Bottom left: Residual between the measured and the modeled velocity field. Bottomright: Uncertainties in the radial velocity v ( km s–1). Black cross is the continuumpeak and the dashed black line is the fitted major axis PA.
1998, hereafter M98). Vsys and i are also in reasonable agreement with other studies of the
galaxy: V01 found, respectively, 2335 ± 20 km s–1and 68◦, while M98 found 2330 km s–1and
70◦. The velocity field amplitude (A = 132±4 km s–1), though, is much lower than the ones found
by both V01 and M98 (225±20 km s–1and 250 km s–1). This discrepancy is probably due to the
fact that both have used long-slit data in their studies, therefore being able to map the velocity
field up to several kpc. Thus having a better constraint in the behavior of the field at a larger
radius, while our data can only recover the internal portion of the velocity field.
The modeled velocity field is shown in the middle right panel of Figure 25, and the
residuals between the observed field and model are shown in the bottom left panel of the same
figure. The uncertainty map for the Comp. 1 v field, as measured by the Monte Carlo simulations
described in the section 2.4.1, is shown in the bottom right of Figure 25. While most of the field
is well represented by the disk rotation model (∣
∣v – vModel
∣
∣ < 20 km s–1), there is only one region
at the eastern border with residuals up to 40 km s–1.
The fainter component of the NLR (Component 2) is detected in a smaller region, orig-

Chapter 2. The Circumnuclear Region of NGC 2992 56
-5
-4
-3
-2
-1
0
1
2
3
Y (a
rcse
c)
NEARFAR
150pc
log10 Flux[OIII] (Comp. 2)
NEARFAR
E
N
EW[OIII] (Comp. 2)
-4 -3 -2 -1 0 1 2 3X (arcsec)
-5
-4
-3
-2
-1
0
1
2
3
Y (a
rcse
c)
NEARFAR
150pc
(Comp. 2)
-4 -3 -2 -1 0 1 2 3X (arcsec)
NEARFAR
E
N
V (Comp. 2)
16.0
15.5
15.0
14.5
14.0
13.5
13.0
0
20
40
60
80
100
120
140
160
180
190
200
210
220
200
150
100
50
0
50
100
150
200
Figure 26 – Component 2 properties. Top left: Log10 Flux [O III] λ5007 ( erg s–1 cm–2). Top right:Equivalent Width of [O III] λ5007 (Å). Bottom left: Velocity dispersion, σ ( km s–1).Bottom right: Radial velocity, v ( km s–1). Solid black lines represent our FoV. Blackcross is the continuum peak. Grey contours are the 6cm radio emission (ULVESTAD;WILSON, 1984). Red dashed line is the contour of the redshifted structure found byGarca-Lorenzo et al. (2001), at the farthest part of the radio emission major loop,taken from Fig. 9 of their paper.
inating near the continuum peak and extending towards the NW. For the brightest line, [O III]
λ5007, the emission extends up to ∼ 3′′, as shown by both the flux map, top left panel of Fig-
ure 26 and the P-V plot in Figure 27. In Figure 26, we show the maps of equivalent width (EW)
of [O III], σ and v for the Component 2. The v map shows only blueshifted velocities, with values
ranging from -250 to -200 km s–1. The velocity dispersion is higher than that of Comp. 1, ranging
from 200 to 215 km s–1. We also show in all the panels, the contours of the 8-shaped region
detected in the 6 cm radio emission (in grey) in which the smaller loop seems to be co-spatial
with Component 2.
The position-velocity plot along the major kinematical axis (PA = 32◦) and the major axis
of the Radio emission (PA = -26◦) of NGC 2992 are shown in Figure 27. It is clear that while
Comp. 1 has a rotational pattern, Comp. 2 deviates considerably from this pattern. Considering:
• Component 2 is not following the galaxy’s rotation;
• It is co-spatial with the radio emission;
• It has higher velocity dispersion values than those of Comp. 1, σ > 200 km s–1;

Chapter 2. The Circumnuclear Region of NGC 2992 57
250200150100500
50100150200250
V [k
m/s
]
Major Kinematical Axis (PA = 32o)Component 1Component 2
4 3 2 1 0 1 2 3 4Distance [arcsec]
250200150100500
50100150200250
V [k
m/s
]
Radio Axis (PA = 26o)Component 1Component 2
Figure 27 – Position-Velocity plot in virtual slits with 0.′′4 width. In the top panel the slit is at thePA of the major kinematical axis, in the bottom the slit is at the PA of 8-shaped radioemission major axis. Points are the measured velocity values, and the error barsare the uncertainties in the velocities. Red points are the velocities of Component 1and blue points the Component 2 ones.
• It has blueshifted velocities in the near side of the galaxy;
we are led to the conclusion that it is tracing a radio-jet driven gas outflow since all these are
well-known characteristics of this type of phenomena. In fact, this ionized gas outflow was
already reported by other IFU studies, e.g. Garca-Lorenzo et al. (2001), Friedrich et al. (2010)
and Mingozzi et al. (2019). Particularly, Garca-Lorenzo et al. (2001) interpreted this blueshifted
structure as the interaction of the minor loop of the radio-jet with the ISM. Garca-Lorenzo et al.
(2001) also found a similar, however redshifted, structure in the far side of the galaxy, co-spatial
with the farthest part of the radio emission major loop, which is mostly not visible in our FoV.
We have extracted the contours of this structure from Figure 9 of their paper and show it as
the red dashed line in Figure 26. This finding supports the scenario in which a bipolar over-
pressure relativistic plasma is expanding, accelerating and compressing the ISM gas in its
path (CHAPMAN et al., 2000). Interestingly, the only portion of this structure which falls within
our FoV is co-spatial with the largest velocity residuals seen in figure Figure 25. Although our
statistical analysis does not indicate the necessity of a separate component, the large residuals
clearly indicate a perturbation in the velocity field.
A very similar geometry was found by Riffel and Storchi-Bergmann (2011) in the galaxy

Chapter 2. The Circumnuclear Region of NGC 2992 58
Mrk 1157, in which non-rotational blueshifted and redshifted structures are present and co-
spatial to the two loops of a very similar nuclear 8-shaped radio emission. The authors also
interpreted these structures as the effect of the expanding radio-emitting plasma into the ionized
ISM.
2.4.3 Outflow Properties
If we consider Component 2 as ionised outflowing gas, we can measure its properties
such as mass, mass outflow rate and kinetic power. We followed the prescriptions described in
Lena et al. (2015), in which a biconical outflow geometry is assumed, even though in our case
we can see only one of the cones.
The mass outflow rate can be estimated as the ratio between the mass of the outflowing
gas and the dynamical time (time for the gas to reach the present distance from the nucleus),
Mg /td . The mass of the gas in outflow (Component 2) is estimated as:
Mg = ne mp V f (22)
where mp is the proton mass, ne and V are the electron density and the volume of the re-
gion where the component is detected, f is the filling factor. The filling factor and volume are
eliminated by combining equation 22 with the following expression for the Hα luminosity:
L(Hα) ≈ f n2e jHα V (23)
with jHα = 3.534 × 10⁻²⁵ erg cm3 s–1 at T = 10000K (OSTERBROCK; FERLAND, 2006). There-
fore, the gas mass can be written as:
Mg =mp L(Hα)
ne jHα
(24)
Our estimates for ne are based on the flux ratio between [S II] lines, as will be described in
next section. Note that the L(Hα) used here is based on the flux of Comp. 2 Hα emission only,
corrected by extinction as described in next section. The spatially resolved L(Hα) and Mg (i.e.
gas mass surface density, Σg) are shown in Figure 28.
The integrated gas mass is Mg = 3.6 ± 0.6 × 10⁶ M�. The td was estimated as the
ratio between the maximum extension of the outflow ∼ 3′′≈ 450 pc (see Figure 27) to its
mean velocity, 〈vout〉 ≈ 210 km s–1, which gives td ≈ 2.2 × 10⁶ yr. Combining these values we
estimated an outflow mass rate of Mout ≈ 1.6 ± 0.6 M�.
We also estimated the outflow kinetic power as:
Eout =Mout v2
out
2(25)
where vout is the radial velocity of Component 2 (Figure 26). Integrating the entire outflow we
obtained a total outflow kinetic power Eout ≈ 2.2 ± 0.3 × 1040 erg s–1. In section 2.6.3, we

Chapter 2. The Circumnuclear Region of NGC 2992 59
-3 -2 -1 0 1 2 3X (arcsec)
-3
-2
-1
0
1
2
3
Y (a
rcse
c)
150pc
log10 L(H ) (Comp. 2)
-3 -2 -1 0 1 2 3X (arcsec)
E
Nlog10 g
37
38
39
2.5
3.0
3.5
4.0
Figure 28 – Left: Logarithm of Component 2 dereddened Hα luminosity in erg s–1. Right: Loga-rithm of Component 2 surface mass density in units of M� (0.′′1)–2. Black cross isthe peak of the continuum emission.
compare these values with the ones found in the literature and those expected by outflow-AGN
relations.
2.5 Ionization Mechanism and ISM properties
2.5.1 Nebular Extinction and Electron Density
In order to measure the extinction in the NLR, we adopt the Calzetti et al. (2000) atten-
uation law, and assume the case B recombination and the intrinsic Hα/Hβ value for the NLR
(OSTERBROCK; FERLAND, 2006), which combined leads to the following expression to the
V -band extinction:
Av = 7.95 × log10
(
Hα/Hβ3.1
)
(26)
In order to improve the S/N and given the fact that Hβ Component 2 is detected in a very
small region, we used the integrated flux (Component 1 + Component 2) of the NLR Hα and
Hβ lines. The AV map is presented in the top left panel of Figure 29, and its uncertainty in
the bottom left panel. The AV peak at ∼ 4.5 mag at the peak of the gas emission lines, and
has values > 3.5 mag in the dust lane portion of the FoV. However, this value may be even
higher as the uncertainties are up to 2 mag in this region, caused by high impression on the Hβ
flux measurement, as seen in Figure 42. Although the AV are not the same in the continuum
Appendix A.1 and in the NLR, the spatial patterns are similar: the higher values are found the
central spaxels and towards the dust lane, and the lower towards the SE direction.
The electron density (ne) of the ionized gas in the NLR can be obtained from the ratio
between the [S II] lines, [S II] λ6716/λ6731 (OSTERBROCK; FERLAND, 2006). We applied the
solution of the collisional equilibrium equations given by Proxauf et al. (2014) to obtain the ne
values, as follows:

Chapter 2. The Circumnuclear Region of NGC 2992 60
-3
-2
-1
0
1
2
3
Y (a
rcse
c)150pc
Av (NLR)
E
Nne
-3 -2 -1 0 1 2 3X (arcsec)
-3
-2
-1
0
1
2
3
Y (a
rcse
c)
150pc
Error Av (NLR)
-3 -2 -1 0 1 2 3X (arcsec)
E
NError ne
0.51.01.52.02.53.03.54.04.5
100200300400500600700800900
0.0
0.5
1.0
1.5
2.0
0
40
80
120
160
200
Figure 29 – Top left and bottom left panels, shows, respectively the V -band extinction AV mapand its uncertainties, both in units of magnitudes. Top right and bottom right panelshow, respectively, the electron density (ne) and its uncertainties both in cm–3 units.The black cross shows the peak of the continuum emission.
log10(ne [cm3]) = 0.0543 tan(–3.0553R + 2.8506)
+ 6.98 – 10.6905R + 9.9186R2 – 3.5442R3 (27)
with R = F6716/F6731, the ratio between the [S II] lines. The ne map in its uncertainties are
presented, respectively, in the top right and bottom right panel of Figure 29. The maximum
value of ne is 950 cm–3 reached at the peak of the emission lines, decreasing radially down to
100 cm–3, another high (∼ 800 cm–3) density knot is present at the south of the nucleus. Both
the values as well as the spatial profiles of both AV and ne measured here are in agreement
with the recent published analyses by Mingozzi et al. (2019) using MUSE instrument, see their
Figures A1 and B1.
2.5.2 Ionization Mechanisms
Given the presence of young stars discussed in section 2.3, NLR and BLR emission
(section 2.4) which indicate AGN excitation, and the presence of radio emission that can drive
shocks (DOPITA, 2002; ALLEN et al., 2008), we used the [N II]/Hα vs. [O III]/Hβ and [S II]/Hα
vs. [O III]/Hβ BPT diagnostic diagrams (section 1.3.1) to investigate which of these excitation
mechanisms are dominant in the innermost region of the galaxy.
In the bottom panels of Figure 30, we show the maps of [O III]/Hβ, [N II]/Hα and [S II]/Hα
line ratios for the entire line profile (by summing the kinematical components; we do that to
increase the precision in the flux measurement and to avoid regions where a second component

Chapter 2. The Circumnuclear Region of NGC 2992 61
-1.5 -1 -0.5 0 0.5log10([NII]/H )
1.0
0.5
0.0
0.5
1.0
1.5
log 1
0([O
III]/
)
ABCDE
1.0 0.8 0.6 0.4 0.2 0.0 0.2 0.4log10([SII]/H )
1.0
0.5
0.0
0.5
1.0
1.5
log 1
0([O
III]/H
)0.6 0.4 0.2 0.0 0.2
log10([NII]/H )
0.00
0.25
0.50
0.75
1.00
1.25
1.50
log 1
0([O
III]/
)
B
300
600
900
0.4 0.2 0.0 0.2 0.4log10([SII]/H )
0.00
0.25
0.50
0.75
1.00
1.25
1.50
log 1
0([O
III]/H
)
B
300
600
900
-3 -2 -1 0 1 2 3X (arcsec)
-3
-2
-1
0
1
2
3
Y (a
rcse
c)
A
B150pc
[O III]/H
-3 -2 -1 0 1 2 3X (arcsec)
A
B
C
[N II]/H
-3 -2 -1 0 1 2 3X (arcsec)
A
B
C
D
E
E
N[S II]/H
5
10
15
20
0.6
0.7
0.8
0.9
1.0
0.5
0.6
0.7
0.8
0.9
1.0
Figure 30 – Top: [N II]/Hα vs. [O III]/Hβ and [S II]/Hα vs. [O III]/Hβ BPT diagrams; grey contoursare galaxies from the SDSS main galaxy sample measured by Kewley et al. (2006).Red points are the spaxels of NGC 2992. Colored markers are the selected re-gions of NGC 2992, as shown in the bottom panels, representing: red (Region A),blue (B), green (C), pink (D) and cyan (E). Middle: Zoomed BPT diagrams withshock+precursor grid models as measured with MAPPINGS V code (SUTHER-LAND et al., 2018); the ~B indicates increasing magnetic field of the model (from0.01 to 4 µG); the black numbers indicates the velocities of the shocks, ranging from300 to 900 km s–1. Bottom: Respectively, from left to right, [O III]/Hβ, [N II]/Hα, and[S II]/Hα emission lines ratio maps; red circles show the selected regions shown inthe upper panels. In BPT diagrams the grey crosses are the typical errors in theemission line ratios; the solid black lines are the Kewley et al. (2001) theoreticalupper limits for pure star forming galaxies. In the [N II]/Hα vs. [O III]/Hβ diagramthe dashed black line represents the Kauffmann et al. (2003) line which traces theupper boundary of the SDSS star formation sequence. In the [S II]/Hα vs. [O III]/Hβdiagram the dashed-dotted black line represents the empirical division betweenAGN like and low-ionization nuclear emission-line region (LINER) by Kewley et al.(2006).

Chapter 2. The Circumnuclear Region of NGC 2992 62
is detected in high S/N lines, like [O III], but not detected in lower S/N ones, like Hβ.) We excluded
the regions where uncertainties in the total flux, as shown in Appendix A.2, are higher than 30%.
The [O III]/Hβ shows a clear AGN signature, with its peak, up to [O III]/Hβ ≈ 25, at the center of
the FoV and decreasing radially down to [O III]/Hβ ≈ 2 at SW corner of the FoV. The [N II]/Hα
and [S II]/Hα, however, do not show the same pattern: their maximum values are off-nuclear,
and they do not present a radial decrease as in the [O III]/Hβ one. This indicates a lower energy
mechanism (lower than an AGN, but higher than H II regions) can be ionizing the gas too. In
fact, shock ionized regions are characterized by having smaller [O III]/Hβ ratios and larger [S II]
(or [N II])/Hα than those ionized by AGN (VEILLEUX; OSTERBROCK, 1987; KEWLEY et al.,
2006; ALLEN et al., 2008).
We selected limiting regions in the line ratio maps and shown it in the respectively
BPT diagrams in the top panels of Figure 30. We also show some division lines: the solid
black curves on both diagnostic diagrams trace the Kewley et al. (2001) theoretical upper limit
of regions ionized by pure star formation. Several excitation mechanisms can increase the
collisional excitation rate, enhancing the ratios of the forbidden to recombination lines, among
them energetic photons from a power law-like emission (AGN); shock excitation and evolved
stellar populations can also produce line ratios along this branch of the diagram. The latter case
does not apply to the nuclear region of NGC 2992 given that it requires EW(Hα) < 3 Å (see
section 1.3.1) and our entire FoV has EW(Hα) > 10 Å. We also show the dashed black curve on
the [N II]/Hα vs. [O III]/Hβ diagnostic diagram: the Kauffmann et al. (2003) empirical classification
line. The dashed-dotted black curve on the [S II]/Hα vs. [O III]/Hβ diagnostic diagram traces the
Kewley et al. (2006) empirical classification line. We also show as grey points in the top BPT
diagrams a collection of single-fiber emission line measurement from SDSS main galaxy sample
by Kewley et al. (2006).
Region A is the peak of the [O III]/Hβ map, it shows clear AGN-like ratios, with an upper
[O III]/Hβ value higher than any SDSS AGN, which corresponds to a 3′′diameter aperture, and
therefore have a diluted AGN/host-galaxy emission line ratio. Region B has the lowest value
in all the maps, it lies bellow Kewley et al. (2001) showing the radial decrease in the AGN
contribution to the emission lines, and significant contributions from both star formation and
AGN excitation. Regions C, D and E display the highest values in the [S II]/Hα and [N II]/Hα
maps; however, they have lower [O III]/Hβ values than region A. Region E, in fact, crosses the
Kewley et al. (2006) line in the [S II]/Hα diagram, which again indicates the presence of another
ionization mechanism.
In order to search for an explanation to the increase in this intermediary ionization en-
ergy lines ([N II] and [S II]) we used the MAPPINGS V shock models by Sutherland et al. (2018).
We explored the parameter space in the pure shock and shock+precursor grids of the models.
None of the pure shock models could explain these line ratios, given the high [O III]/Hβ values.
However shock+precursor (Shock ionization in a medium already ionized by power-law like emis-
sion) with shock velocities between 300 km s–1and 900 km s–1and magnetic field (~B) between
0.01µG and 4µG, with a two-solar metallicity and a pre-shock density of 1 cm–3, successfully
reproduce the line ratios of regions C, D and E. In the middle panels of Figure 30 we show the
grid models in these shock velocity and magnetic field ranges superimposed with the emission
line ratios of the regions. The shocks in NGC 2992 have been extensively studied by Allen et al.

Chapter 2. The Circumnuclear Region of NGC 2992 63
(1999a), who conclude that shocks are the predominant ionization mechanism in the extended
NLR cones at a distance of several kpc from the nucleus.
We can conclude that a more simple Starburst-AGN mixture (section 1.3.1) in which
the maximum values of all [O III]/Hβ, [N II]/Hα and [S II]/Hα are located in the innermost spaxel
(location of the AGN), and all decrease radially towards the H II ionization region of the BPT
in a straight line (Figure 10), cannot describe the ionization at the circumnuclear region of
NGC 2992. Instead, a more complex Starburst-AGN-Shocks mixture is responsible for its ion-
ization. However, the very high values of [O III]/Hβ indicate the most important among these
three mechanisms is AGN ionization, at least in the innermost portion (see further discussion in
section 2.6.4).
2.6 Discussion
2.6.1 Interaction-Driven Circumnuclear Star formation
In general terms, the stellar population synthesis discussed in section 2.3 shows that
stellar content in the inner 1.1 kpc of NGC 2992 is mainly composed by an old metal-rich
population, with a smaller but considerable contribution from young metal-poor stars. The pres-
ence of the latter is supported by other studies, for instance, using the Bica and Alloin (1986)
base of star clusters for stellar population synthesis, Storchi Bergmann et al. (1990) found a
predominance of old stellar populations (1010 yr) and a small contribution of at least 5% by
recent star formation in the inner 5′′. Moreover, Friedrich et al. (2010) find that 10-20% of the IR
flux is attributable to a starburst, based on the emission from polycyclic aromatic hydrocarbon
(PAH) molecules. Additionally, these authors estimate the starburst to have occurred between
40-50 Myr, based on the equivalent width of the Brγ line.
Major merger processes are known to be responsible for gas inflow towards the central
regions of galaxies enhancing circumnuclear star formation and possibly triggering nuclear
activity. Merger galaxies have an increase in the SFR, mainly at the nuclear regions (ELLISON
et al., 2013; PAN et al., 2019). Thus, these sources have younger nuclear populations than those
found in isolated galaxies, in which most of their recent formed stars are concentrated at the
spiral arms. Moreover, major mergers are also able to modify the metallicity gradients of galaxies
(BARRERA-BALLESTEROS et al., 2015). Galaxy simulations show that the gas, originally
located at external portions of the isolated galaxy (metal-poor regions), moves towards internal
regions (metal-rich regions) of the companion galaxy during the encounter and is capable of
cooling and forming stars.. Such processes are able to explain both the increase in the SFR
and the modifications in the metallicity gradient (DALCANTON, 2007; TORREY et al., 2012;
SILLERO et al., 2017). In fact, the pericentre passage between NGC 2992 and its companion
NGC 2993 is estimated to have occurred ∼ 100 Myr ago (DUC et al., 2000). Thus, a possible
scenario is that metal-poor gas inflow has led to interaction-driven circumnuclear star formation
which can explain the presence of such young metal-poor stellar population in the nucleus.

Chapter 2. The Circumnuclear Region of NGC 2992 64
2.6.2 Feeding vs Feedback
We can compare the mass outflow rate, estimated in section 2.4.3, with the accretion
rate necessary to power the AGN at the nucleus of NGC 2992, calculated as follows:
MBH =Lbol
c2η(28)
where η is the mass-energy conversion efficiency, which for Seyfert galaxies is usually assumed
to be η = 0.1 (FRANK et al., 2002), Lbol is the bolometric luminosity of the AGN, and c is the
speed of light. To measure Lbol we applied the bolometric correction by Marconi et al. (2004) on
the most recent X-ray luminosity measurement of NGC 2992 made by Marinucci et al. (2018).
The author used a 2015 NuSTAR observation and obtained an absorption corrected 2-10 Kev
Luminosity of 7.6 ± 0.1 × 1042 ergs–1 that translates to Lbol = 9.1 ± 0.2 × 1043 ergs–1. We use
these values to derive an accretion rate of MBH ≈ 0.02 M�yr–1.
The nuclear accretion rate is two orders of magnitude smaller than the mass outflow
rate (Mout ≈ 1.6 ± 0.6 M� yr–1, see section 2.4.3). This implies that most of the outflowing
gas does not originate in the AGN, but in the surrounding ISM, and this result supports the
scenario in which the plasma bubbles (radio loops) are expanding, pushing gas away from the
nuclear region. However, the ratio between the kinetic power of this blueshifted outflow loop
and the bolometric luminosity is ∼ 0.002, which means only 0.2% of the AGN radiative power is
in this outflow. Many authors argue that such a low value is not enough to have the feedback
effects expected by cosmological simulations (SPRINGEL et al., 2005; SILK; MAMON, 2012;
BULLOCK; BOYLAN-KOLCHIN, 2017), stating that Eout /Lbol should be closer to 5% or above
in order to effectively suppress growth in the most massive galaxies. However, some models
show that coupling efficiencies of Eout /Lbol ≈ 0.5% (HOPKINS; ELVIS, 2010), and even 0.1%
(COSTA et al., 2018) could successfully prevent star formation.
2.6.3 AGN-Wind Scaling Relations
Comparing our outflow measurements with those from the literature we noted ours
results disagree with those presented in Muller-Sanchez et al. (2011), who reported Mout = 120
M� yr–1 and Eout = 2.5×1042 erg s–1, both almost one hundred times greater than ours. We
attribute this difference to two factors: i) they assumed the filling factor f to be constant equal
to 0.001, while we have measured the filling factor from L(Hα) and ne (see equation 23). This
assumption makes their Mg proportional to ne, and not inversely proportional (as in equation
24); ii) they assume an electronic density of ne = 5000 cm–3, a value more than 5 times larger
than the maximum value we measured in the nuclear region of the galaxy. These two factors
combined explain their overestimation of both Mout and Eout . We also argue these differences
cannot be due to a larger coverage of the outflow by a larger field of view, in the sense of seeing
the farthest part of the radio emission major loop and its redshifted outflow structure, given the
authors have used the OSIRIS/VLT instrument, which has an even smaller FoV than GMOS.
We can compare our values to the properties of outflows found in other previous papers
across the literature. In Figure 28, we show the Fiore et al. (2017) compilation of a set of out-
flow energetics from various studies over the years spanning a large range of AGN luminosity

Chapter 2. The Circumnuclear Region of NGC 2992 65
(Lbol ≥ 1044), which they use to establish AGN wind scaling relations, mass outflow rate and
outflow power as a function of bolometric luminosity, together with several measurements of
nearby galaxies from individual studies compiled by us from the literature or obtained by our
collaborators: NGC 1068, NGC 3783, NGC 6814, NGC 7469 (MULLER-SANCHEZ et al., 2011),
NGC 4151 (CRENSHAW et al., 2015), Mrk 573 (REVALSKI et al., 2018), Mrk 34 (REVALSKI et
al., 2018), NGC 7582 (RIFFEL et al., 2009), Mrk 1066 (RIFFEL et al., 2010b), Mrk 1157 (RIFFEL;
STORCHI-BERGMANN, 2011), Mrk 79 (RIFFEL; STORCHI-BERGMANN, 2013), NGC 5728
(SHIMIZU et al., 2019), and NGC 3081 (SCHNORR-MULLER et al., 2014), ESO 362-G18
(HUMIRE et al., 2018), NGC 1386 (LENA et al., 2015), ESO 153-G20 (SOTO-PINTO et al.,
2019), 3C 33 (COUTO et al., 2017), including NGC 2992 measurement by Muller-Sanchez et al.
(2011). Although these estimates are made using different recipes, leading to differences be-
tween methods, they are generally similar to the one adopted here. Therefore, this comparison
with the literature may be useful at least as an order of magnitude approximation.
As we can see, the overestimated previous measurement of NGC 2992’s outflow made
this source to be an outlier in the Fiore et al. (2017) relations, while our values make the galaxy
more likely to be explained by these relations. However, the other measurements in nearby
Seyfert galaxies support the existence of a larger scatter of these relations, both in Eout and
Mout , at lower luminosities. To confirm whether this extension is valid or not, more detailed
studies like this, mainly using IFU, are needed so that outflow properties can be properly and
systematically measured, without assuming fixed values of ne and f .
2.6.4 Multiple Ionization Mechanisms
In section ?? we showed that despite being dominated by AGN excitation, star formation
and shocks cannot be excluded as ionization mechanisms in the nuclear region of the galaxy.
The existence of star formation ionization in the nucleus is confirmed by Friedrich et al. (2010) IR
emission line analyses, as mentioned in section 2.6.1. The presence of shocks is also supported
by Allen et al. (1999a) using long-slit spectroscopy. The authors also argue the dominance of
shocks increases, compared to ionization by the central source, at larger radius.
Galaxies undergoing rapid phases of evolution (through processes such as galaxy-
galaxy interactions, gas outflows and radio jets) often have multiple ionization mechanisms
contributing to their optical line emission (e.g. RICH et al., 2011; LANZ et al., 2015; RICH et al.,
2015; DAVIES et al., 2017). These multiple ionization mechanisms are also in agreement with
evolutionary scenarios in which gas inflows (driven either by secular mechanisms, like nuclear
bars or nuclear spiral arms, or environmental ones, like minor and major mergers) triggers
nuclear star formation and nuclear activity (feeding process) and then the active nucleus can
drive both ionizing photons from the accretion disk and radio jets (feedback process) that
impacts the ISM physical conditions (HOPKINS et al., 2008; HOPKINS; ELVIS, 2010).

Chapter 2. The Circumnuclear Region of NGC 2992 66
10 2
10 1
100
101
102
103
104
105
Mou
t[M
yr1 ]
Nearby SeyfertsFiore+17 Ionised WindsNGC2992 (Mueller-Sanchez+11)NGC2992 (This Work)
1041 1042 1043 1044 1045 1046 1047 1048 1049
LBol [erg s 1]
1039
1041
1043
1045
1047
E out
[erg
s1 ]
Figure 31 – Correlations between the mass outflow rate (Mout , Top Panel) and kinetic outflowpower (Eout , Bottom Panel). Blue points are the data compiled by Fiore et al. (2017)and the black dashed lines show the best fit correlations for these points. RedSquares are the previous measurement of NGC 2992 by Muller-Sanchez et al.(2011), and green ones are the results of this work. Violet diamonds are compiledfrom various literature sources for more modest AGN luminosities.

67
3 THE LONG-TERM VARIABILITY OF NGC 2992
This chapter is fully based on the following paper, of which I am the lead author, and therefore
is not intended as an original work:
“The Eddington ratio-dependent multiple ‘changing look’ events in NGC 2992”, Guolo-Pereira,
M., Ruschel-Dutra, D., Schimoia, J., Grupe, D., Peterson, B., Nemmen, R., Storchi-Bergmann,
T., Robinson, A., under review in the MNRAS.
3.1 Introduction: ‘Changing Look’ AGNs
The AGN Unified Model (section 1.3) attribute differences in AGN type to the viewing
angle toward an axisymmetric, parsec scale obscuring structure, which can block our direct view
of the AGN central engine (ANTONUCCI, 1993; URRY; PADOVANI, 1995) and is responsible
for the lack of Broad Emission Line (BEL) in the Type 2 ones. However, a relatively small
number of AGN show transitions from one type to another in a few years (e.g., Type 1 to Type
2 or Type 1 to Type 1.9); these objects are known as ‘changing look’ (CL) AGNs. CL-AGNs
challenge the widely accepted AGN paradigm, not only in the orientation-based unified model
but also standard accretion disk models (section 1.2.2). Their extreme and fast variability has
motivated alternatives and/or modifications for both the AGN Unified Model (e.g., NICASTRO,
2000; ELITZUR; SHLOSMAN, 2006; ELITZUR et al., 2014, see also section 1.3.3) and for the
standard Shakura and Sunyaev (1973) accretion disk model (e.g., SNIEGOWSKA et al., 2020;
JIANG; BLAES, 2020)
Until recently there were only a handful of CL events reported, including NGC 3516
(ANDRILLAT; SOUFFRIN, 1971), NGC 1566 (PASTORIZA; GEROLA, 1970; OKNYANSKY et
al., 2019), Mrk 590 (DENNEY et al., 2014), NGC 2617 (SHAPPEE et al., 2014), NGC 7603
(TOHLINE; OSTERBROCK, 1976), Mrk 1018 (COHEN et al., 1986), NGC 1097 (STORCHI-
BERGMANN et al., 1993), NGC 3065 (ERACLEOUS; HALPERN, 2001) and NGC 7582 (ARETX-
AGA et al., 1999). In 2015 (LAMASSA et al.) discovered the first CL Quasar and since then
the number of known CL-AGNs has increased rapidly (e.g., MACLEOD et al., 2016; MCELROY
et al., 2016; RUNNOE et al., 2016; YANG et al., 2018; RUAN et al., 2016; SHENG et al., 2017;
KOLLATSCHNY et al., 2018; GUO et al., 2019; WANG et al., 2019; GRAHAM et al., 2019;
KOLLATSCHNY et al., 2020); however, the number is still less than a hundred.
Some of these CL might be successfully explained via variable obscuration (e.g.„ MATT
et al., 2003; PUCCETTI et al., 2007; RISALITI et al., 2010; MARINUCCI et al., 2013; MARCH-
ESE et al., 2012): in models where the obscuring material has a patchy distribution (e.g.,
NENKOVA et al., 2008; ELITZUR, 2012), the dynamical movement of the dust clouds could
result in a change of classification. Transient events such as tidal disruption events (TDE) of
a star by the SMBH were also claimed as possible drivers of CL events (ERACLEOUS et al.,
1995); however, this scenario does not apply to sources presenting multiple (and quasi-periodic)
CL events.
In a third scenario, it has been argued that changes in type are expected with variations
in accretion rate. In this scenario either the BELs disappear (reappear) due to the reduction
(increase) of ionising photons available to excite the gas in the vicinity of the black hole (e.g.,

Chapter 3. The Long-Term Variability of NGC 2992 68
STORCHI-BERGMANN et al., 2003; LAMASSA et al., 2015) or the BLR itself disappears, given
that in disk-wind BLR models (e.g., NICASTRO, 2000; ELITZUR; SHLOSMAN, 2006; ELITZUR;
HO, 2009, section 1.3.3) the broad line emission region follows an evolutionary sequence that
is directly related to the accretion rate of the compact source. In such disk-wind BLR models,
a low accretion efficiency is not able to sustain the required cloud flow rate responsible for the
formation of the BLR clouds which gives origin to the distinct (intrinsic) AGN types, as proposed
by Elitzur et al. (2014).
NGC 2992 was the subject of several studies and target of all major X-ray missions due
to its variability. In the hard X-rays band (2-10 keV), it steadily declined in observed flux from
1978, when it was observed by HEAO1 (MUSHOTZKY, 1982) at a flux level of about 8 × 10–11
erg cm3 s–1 until 1994 when it was observed by ASCA (WEAVER et al., 1996) at a flux level
by about a factor 20 fainter. Then it underwent a rapid recovery: in 1997 it was observed by
BeppoSAX at a flux level somewhat higher than in 1994, while in 1998 the source fully recovered
its HEAO1 brightness (GILLI et al., 2000). In 2003, when observed by XMM-Newton, the flux
was even higher, about 10–10 erg cm3 s–1 (SHU et al., 2010). The source was then observed by
Suzaku on November/December 2005, and found in a much fainter state, almost an order of
magnitude fainter than in the XMM-Newton observation.
The Rossi X-ray Timing Explorer (RXTE, SWANK, 2006) monitoring campaign between
early March 2005 and late January 2006 found large amplitude (almost an order of magnitude)
variability, indicating that apart from the long-term variability of the source, it also presents short-
term outbursts with variations in the order of days, while no significant variation of the primary
power-law index was found (MURPHY et al., 2007); at the end of the campaign the source was
again at a low flux state, confirmed by Suzaku, at a flux level of ∼ 1 × 10–11 erg cm3 s–1 (PTAK
et al., 2007; YAQOOB et al., 2007) and Chandra, at flux level of ∼ 0.3 × 10⁻¹¹ erg cm3 s–1 (its
historical minimum flux, MURPHY et al., 2017). In 2010, NGC 2992 was observed eight times
for ∼ 40 ks by XMM-Newton with a flux ranging from 0.3 × 10⁻¹¹ erg cm3 s–1 to 1.3 × 10⁻¹¹
erg cm3 s–1. A further 2013 XMM-Newton observation caught the source in a higher but still low
flux state (1.6 × 10⁻¹¹ erg cm3 s–1). In 2015, observations performed simultaneously with Swift
and NuSTAR found a flux of 6 × 10–11 erg cm3 s–1 (MARINUCCI et al., 2018). The most recent
observations was performed again with XMM-Newton in May 2019, when the flux was again at
the highest levels seen, ranging from 6.8 to 10 × 10–11 erg cm3 s–1 (MARINUCCI et al., 2020).
The optical variability of the source was first explored by Gilli et al. (2000) who noticed
that in 1999 the Hα BEL was present again, as it was in early observations of the galaxy by
(VERON et al., 1980) at the end of the ’70s (what led to its first classification as a Seyfert
1.9), in contrast to the Type 2 spectra seen in 1994 by Allen et al. (1999b). Later, Trippe et al.
(2008a) showed that from the beginning of 2006 to the middle of 2007 the source had lost its
BEL. Recently Schnorr-Muller et al. (2016b) and Guolo-Pereira et al. (2021, chapter 2) not only
showed that the Hα BEL was detectable again but also, for the first time, a very faint Hβ BEL
was claimed to be present.
Besides being a very well studied galaxy, to the best of our knowledge no study has yet
explored the entire X-ray and optical historical emission of NGC 2992, nor attempted to link the
behavior in the two wavelength bands. These are our goals in this chapter, which is organized
as follow: In section 3.2 we describe the data collection. The analysis of the data is described
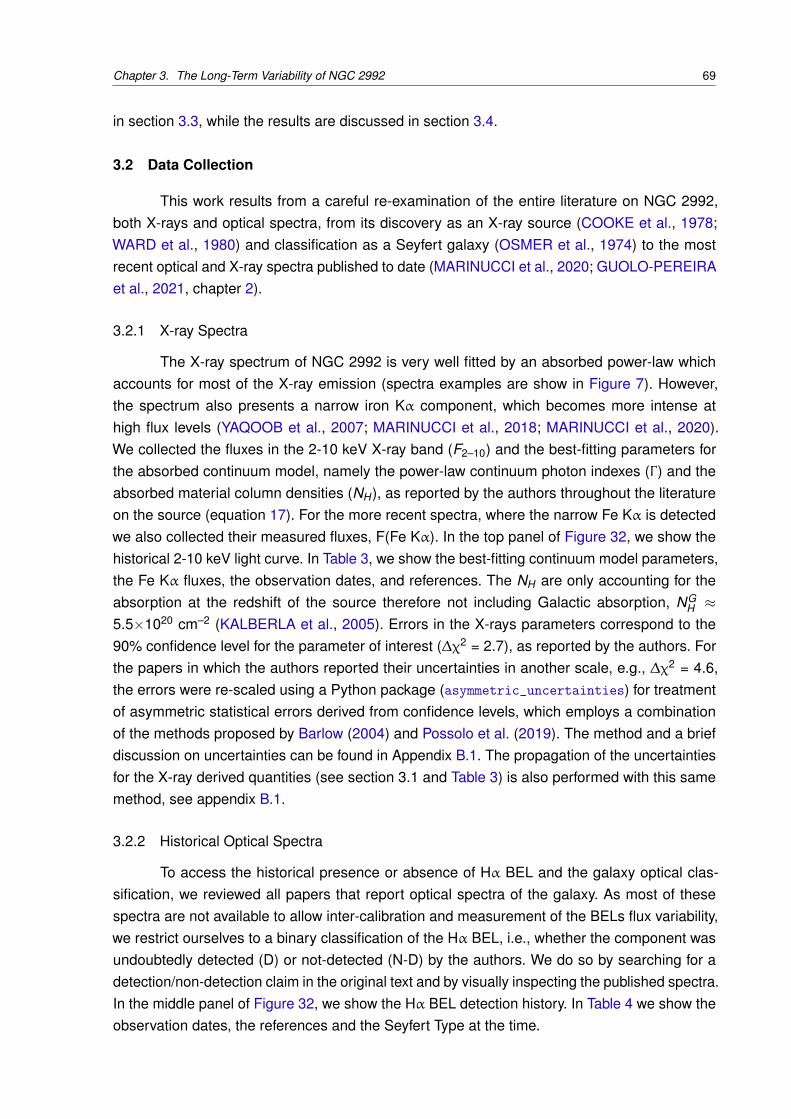
Chapter 3. The Long-Term Variability of NGC 2992 69
in section 3.3, while the results are discussed in section 3.4.
3.2 Data Collection
This work results from a careful re-examination of the entire literature on NGC 2992,
both X-rays and optical spectra, from its discovery as an X-ray source (COOKE et al., 1978;
WARD et al., 1980) and classification as a Seyfert galaxy (OSMER et al., 1974) to the most
recent optical and X-ray spectra published to date (MARINUCCI et al., 2020; GUOLO-PEREIRA
et al., 2021, chapter 2).
3.2.1 X-ray Spectra
The X-ray spectrum of NGC 2992 is very well fitted by an absorbed power-law which
accounts for most of the X-ray emission (spectra examples are show in Figure 7). However,
the spectrum also presents a narrow iron Kα component, which becomes more intense at
high flux levels (YAQOOB et al., 2007; MARINUCCI et al., 2018; MARINUCCI et al., 2020).
We collected the fluxes in the 2-10 keV X-ray band (F2–10) and the best-fitting parameters for
the absorbed continuum model, namely the power-law continuum photon indexes (Γ ) and the
absorbed material column densities (NH ), as reported by the authors throughout the literature
on the source (equation 17). For the more recent spectra, where the narrow Fe Kα is detected
we also collected their measured fluxes, F(Fe Kα). In the top panel of Figure 32, we show the
historical 2-10 keV light curve. In Table 3, we show the best-fitting continuum model parameters,
the Fe Kα fluxes, the observation dates, and references. The NH are only accounting for the
absorption at the redshift of the source therefore not including Galactic absorption, NGH ≈
5.5×1020 cm–2 (KALBERLA et al., 2005). Errors in the X-rays parameters correspond to the
90% confidence level for the parameter of interest (∆χ2 = 2.7), as reported by the authors. For
the papers in which the authors reported their uncertainties in another scale, e.g., ∆χ2 = 4.6,
the errors were re-scaled using a Python package (asymmetric_uncertainties) for treatment
of asymmetric statistical errors derived from confidence levels, which employs a combination
of the methods proposed by Barlow (2004) and Possolo et al. (2019). The method and a brief
discussion on uncertainties can be found in Appendix B.1. The propagation of the uncertainties
for the X-ray derived quantities (see section 3.1 and Table 3) is also performed with this same
method, see appendix B.1.
3.2.2 Historical Optical Spectra
To access the historical presence or absence of Hα BEL and the galaxy optical clas-
sification, we reviewed all papers that report optical spectra of the galaxy. As most of these
spectra are not available to allow inter-calibration and measurement of the BELs flux variability,
we restrict ourselves to a binary classification of the Hα BEL, i.e., whether the component was
undoubtedly detected (D) or not-detected (N-D) by the authors. We do so by searching for a
detection/non-detection claim in the original text and by visually inspecting the published spectra.
In the middle panel of Figure 32, we show the Hα BEL detection history. In Table 4 we show the
observation dates, the references and the Seyfert Type at the time.

Chapter 3. The Long-Term Variability of NGC 2992 70
0
5
102
10ke
VFl
ux[1
011
erg
cm2
s1 ]
HEAO 1
Einstein
EXOSAT
GingaASCA BeppoSAX
XMM-Newton
RXTE
SuzakuChandra
NuSTAR
N-D
D
HBE
L
1980 1990 2000 2010 2020Obs. Date (yr)
0
5
10
15
20
L 210
[1042
erg
s1 ]
Figure 32 – Top: Historical 2-10 keV light curve of the source. Middle: Historical detections (D)and non-detections (N-D) of the broad Hα emission line. Bottom: Intrinsic (absorp-tion corrected) 2-10 keV Luminosity (L2–10) light curve. Each color represents adistinct X-ray mission, and will be maintained throughout the entire paper. In theL2–10 panel, the points without error bars have errors smaller then 3×1041 erg s–1,see Table 3 for the exact values.
In summary: the first spectra of the galaxy in the ’70s (WARD et al., 1980; VERON
et al., 1980; SHUDER, 1980; DURRET; BERGERON, 1988) detected only Hα broad compo-
nents, with no counterpart in Hβ, resulting in its original classification as a Seyfert 1.9 galaxy.
Throughout mid ’80s to the mid ’90s several authors have reported that the BEL Hα was not
detectable anymore (BUSKO; STEINER, 1990; ALLEN et al., 1999b; MARQUEZ et al., 1998;
VEILLEUX et al., 2001), changing its classification to Seyfert 2 Type. However the broad com-
ponent was detected again from the end of the ’90s to the beginning of the 2000s (GILLI et al.,
2000; GARCIA-LORENZO et al., 2001; STOKLASOVÁ et al., 2009). Later, Trippe et al. (2008a)
performed an 18 months long monitoring campaign from the beginning of 2006 to mid 2007 that
revealed the Hα BEL component was missing again, throughout the entire campaign. More re-
cent observations have shown that the galaxy has regained the broad Hα component (DOPITA
et al., 2015; SCHNORR-MULLER et al., 2016b; MINGOZZI et al., 2019), and for the first time,
an Hβ BEL was unambiguously detected, in late 2018, by Guolo-Pereira et al. (2021, chapter
2), therefore changing its classification to a 1.8 Type Seyfert galaxy.
It is important to note the great number of data points collected: 40 in the X-rays (33 with

Chapter 3. The Long-Term Variability of NGC 2992 71
Table 3 – Historical X-ray data for NGC 2992.
Obs. Date(a) Satellite F(b)2–10 N
(c)H
Γ F(Fe Kα)(d) Reference L(e)2–10
10/1977HEAO 1
7.4016.0+8.0
–6.0 1.79+0.09–0.07
–Mushotzky (1982)
13.48+1.40–0.99
02/1978 8.38 – 15.30+1.52–1.13
10/1978 7.21 – 13.09+1.34–0.85
06/1979Einstein
2.17 14.3+6.0–4.0 1.82+0.14
–0.14 – Maccacaro et al. (1982) 3.89+0.30–0.20
06/1980 2.66 22.3+15.2–10.7 1.92+0.47
–0.47 – 5.25+1.01–0.64
12/1983
EXOSAT
1.30 7.0+3.5–1.2 1.46+0.23
–0.16 –
Turner and Pounds (1989)
2.09+0.10–0.03
03/1984 4.50 7.8+6.2–1.6 1.68+0.31
–0.22 – 7.37+0.59–0.17
12/1984 4.70 6.0+1.7–0.6 1.64+0.07
–0.09 – 7.50+0.18–0.07
12/1984 3.70 7.0+1.2–0.3 1.56+0.10
–0.06 – 5.96+0.12–0.03
12/1984 3.00 8.6+2.6–0.3 1.48+0.15
–0.11 – 4.91+0.27–0.03
12/1984 1.50 6.9+7.1–1.8 1.49+0.46
–0.27 – 2.42+0.23–0.07
12/1984 1.50 5.6+5.2–1.2 1.58+0.39
–0.20 – 2.39+0.19–0.05
01/1985 1.60 7.4+4.7–1.2 1.67+0.31
–0.17 – 2.61+0.18–0.05
04/1990 GINGA 1.68 13.6+3.3–3.3 1.64+0.08
–0.08 – Nandra and Pounds (1994) 2.94+0.12–0.12
06/1994 ASCA 0.33 10.1+2.7–2.3 1.70(f) – Weaver et al. (1996) 0.56+0.02
–0.02
12/1997BeppoSAX
0.63 14.0+5.0–4.0 1.72+0.13
–0.12 – Gilli et al. (2000) 1.12+0.07–0.06
11/1998 7.40 9.0+0.3–0.3 1.70+0.02
–0.02 – 12.29+0.05–0.05
05/2003 XMM-Newton 9.50 6.5+0.3–0.2 1.83+0.06
–0.04 – Shu et al. (2010) 15.37+0.07–0.05
03/2005
RXTE
7.38 –(g) 1.71+0.03–0.03 –
Murphy et al. (2007)
–05/2005 2.70 – 1.72+0.04
–0.04 – –06/2005 1.05 – 1.75+0.10
–0.10 – –09/2005 1.23 – 1.85+0.13
–0.12 – –11/2005 1.25 – 1.96+0.12
–0.11 – –01/2006 1.35 – 1.76+0.08
–0.08 – –12/2005 SUZAKU 1.15 8.0+0.6
–0.4 1.57+0.05–0.03 3.99+0.80
–0.80 Yaqoob et al. (2007) 1.88+0.01–0.01
01/2010 CHANDRA 0.36 – – – Murphy et al. (2017) –05/2010
XMM-Newton
0.65 9.2+1.0–1.0 1.67+0.05
–0.05 3.51+0.35–0.35
Marinucci et al. (2018)
1.08+0.01–0.01
05/2010 0.75 8.6+1.0–1.0 1.64+0.04
–0.04 2.96+0.42–0.42 1.24+0.02
–0.0105/2010 1.35 8.4+1.0
–1.0 1.61+0.04–0.04 4.49+0.48
–0.48 2.22+0.03–0.03
06/2010 0.53 8.5+1.0–1.0 1.67+0.05
–0.05 3.69+0.32–0.32 0.87+0.01
–0.0111/2010 0.54 8.0+1.0
–1.0 1.67+0.05–0.05 3.64+0.34
–0.34 0.88+0.01–0.01
11/2010 0.45 8.0+1.0–1.0 1.70+0.06
–0.06 3.70+0.35–0.35 0.74+0.01
–0.0111/2010 0.30 8.1+1.0
–1.0 1.71+0.09–0.09 3.19+0.32
–0.32 0.49+0.01–0.01
12/2010 0.60 9.0+1.0–1.0 1.68+0.04
–0.04 3.00+0.37–0.37 1.00+0.01
–0.0105/2013 1.65 8.1+1.0
–1.0 1.63+0.06–0.06 5.66+1.12
–1.12 2.70+0.03–0.03
12/2015 NuSTAR 5.80 11.0+2.0–2.0 1.72+0.03
–0.03 8.68+1.92–1.92 9.89+0.26
–0.24
05/2019XMM-Newton
10.00 9.0+1.6–1.6 1.68+0.10
–0.10 12.96+1.60–1.60 Marinucci et al. (2020) 16.59+0.34
–0.3405/2019 6.80 8.5+1.6
–1.6 1.63+0.06–0.06 12.96+1.60
–1.60 11.18+0.23–0.22
(a) mm/yyyy. (b) in units of 10–11 erg cm–2 s–1. (c) in units of 1021 cm–2. (d) in units of 10–14 erg cm–2 s–1 (e)Absorption corrected, in units of 1042 erg s–1. (f) The value was frozen in the model fitting, therefore it was excludedin the analyses of the Γ parameter variability of section 3.3.1. (g) Values not provided by the authors.
reported NH and Γ values) and 18 in the optical; allow us to have a quasi-contemporaneous
X-ray measurement for each optical spectrum, within less than one year for most, and less than
two years for all of them, see Figure 32.
3.2.3 Modern Optical Spectra
For four of the six recent spectra of NGC 2992, we were able to apply methods of
flux intercalibration that have been developed for reverberation mapping studies (PETERSON,
1993; VAN GRONINGE; WANDERS, 1992; PETERSON et al., 1995; FAUSNAUGH, 2017) and
measure the intrinsic flux variability of the BELs. The spectra are from:
• Trippe et al. (2008a) and taken in December of 2006 in the Cerro Tololo Inter-American
Observatory; the spectrum was obtained by private communication with one of the au-
thors;
• Dopita et al. (2015) as part of the Siding Spring Southern Seyfert Spectroscopic Snapshot
Survey (S7), taken in April of 2014 and publicly available at the S7 survey website;

Chapter 3. The Long-Term Variability of NGC 2992 72
Table 4 – Historical broad Hα line and Seyfert type classification for NGC 2992.
Obs. Date(a) Hα BEL(b) Reference Seyfert Type07/1977 D Ward et al. (1980) 1.9< 1978 D Veron et al. (1980) 1.901/1979 D Shuder (1980) 1.905/1979 D Durret and Bergeron (1988) 1.903/1985 N-D Busko and Steiner (1990) 203/1991 N-D Marquez et al. (1998) 202/1994 N-D Veilleux et al. (2001) 203/1994 N-D Allen et al. (1999b) 204/1998 D Garcia-Lorenzo et al. (2001) 1.901/1999 D Gilli et al. (2000) 1.903/2001 D Stoklasová et al. (2009) 1.901/2006 N-D
Trippe et al. (2008a)2
12/2006 N-D 206/2007 N-D 202/2014 D Schnorr-Muller et al. (2016b) 1.8/1.904/2014 D Dopita et al. (2015) 1.902/2015 D Mingozzi et al. (2019) 1.8/1.902/2018 D Guolo-Pereira et al. (2021, chapter 2) 1.8
(a) mm/yyyy. (b) Whether the Hα BEL was Detected (D) or Non-Detected (N-D).
• Mingozzi et al. (2019) as part of the Measuring Active Galactic Nuclei Under MUSE
Microscope (MAGNUM) survey using the MUSE instrument at the Very Large Telescope
(VLT) and taken in February of 2015; the spectral data cube is public available at the VLT
archive;
• Data cube from chapter 2 (GUOLO-PEREIRA et al., 2021).
The inter-calibration, aperture/seeing corrections, and the process for emission line fitting of
these spectra will be presented in section 3.3.2.
3.2.4 Estimates of the Black Hole Mass
Precise black hole mass measurements are essential for the energetic calibrations and
scaling to come. Using stellar velocity dispersion measurements of σ∗ = 158 km s–1, Woo and
Urry (2002) estimated the black hole mass of NGC 2992 to be 5.2 × 10⁷ M� by applying the
Tremaine et al. (2002) MBH - σ∗ relation. The value obtained from Gultekin et al. (2009) MBH -
σ∗ relation is MBH = 4.8+3.9–2.4 × 10⁷ M�, using a bulge stellar velocity dispersion σ∗ = 158 ± 13
km s–1(NELSON; WHITTLE, 1995). From the normalized excess variance σ2rms in the 2-10 keV
band and assuming the σ2rms- MBH correlation from Ponti et al. (2012), Marinucci et al. (2020)
reported a MBH = 3.0+5.5–1.5 × 10⁷ M�. Furthermore, we also estimate the SMBH mass using the
emission line measurements, to be described in section 3.3.2, by using single-epoch (SE MBH
estimates. We applied Dalla Bonta et al. (2020) MSE(σHβ, LHβ) relation in all the four modern
spectra. We corrected extinction effects using the measured Balmer decrements and assuming
Calzetti et al. (2000) extinction law. We obtained the following values for MBH : 1.3+2.8–0.9 × 10⁷
M�, 3.5+7.4–2.4 × 10⁷ M� and 2.4+5.1
–1.4 × 10⁷ M�, respectively for 2014, 2015 and 2018 spectra. For
2006 spectrum, as the the Hβ BEL was not detected we use the Hα BEL, assuming a Balmer
decrement of 9 (see section 3.3.2), we obtained MBH = 0.5+1.5–0.4 ×10⁷ M�. In summary, although

Chapter 3. The Long-Term Variability of NGC 2992 73
the distinct methods results in distinct MBH values, they are all within the 0.5 – 5.5 × 10⁷ M�
range.
3.3 Data Analyses
3.3.1 X-ray Variability
In the scenario where the CL events are caused by variable absorption, two natural
consequences are an anti-correlation between the NH and F2–10 and a constant intrinsic
(absorption corrected) luminosity. In the top panel of Figure 33 we show log NH as function of
F2–10: no clear anti-correlation can be seen. The Spearman rank correlation coefficient (rs) for
the two variables and its corespondent pvalue are rs = 0.19+0.15–0.14 and pvalue = 0.22+0.45
–0.17, while the
best-fitting constant value is NH = 22.01+0.03–0.03, where the errors correspond to 90% confidence
level measured by performing a thousand Monte Carlo iterations (see details in appendix B.1).
We can therefore conclude that although there were some variations in the column
density it is not anti-correlated with the X-ray flux as seen in variable absorption CL-AGNs
(e.g., PUCCETTI et al., 2007; BIANCHI et al., 2009).A further confirmation that the absorption
is not the main factor responsible for the behavior of the source can be seen by the intrinsic
(i.e., absorption corrected) rest-frame luminosity (L2–10). The measured L2–10 values, for each
observation in which a NH value is provided, are presented in Table 3. The values range from
4.9 × 1041 erg s–1to ∼ 1.7 × 1043 erg s–1. The L2–10 light curve is shown in the bottom panel
of Figure 32, and it has the same behavior as the F2–10 and this indicates/confirms that the
variations are intrinsic and not due to changes in absorption.
The Sperman rank correlation test shows that there is no monotonic correlation between
the photon index Γ and the X-rays flux (or luminosity) for NGC 2992 (bottom panel of Figure 33).
The values found were rs = 0.15+0.12–0.12 and pvalue = 0.27+0.55
–0.23. The existence of a correlation
between luminosity and photon index is in fact debatable, and several contradictory results have
been presented in the last years. While Dai et al. (2004) reported the existence of a positive
correlation, other works found none (e.g., WINTER et al., 2009) or a negative correlation (e.g.,
CORRAL et al., 2011). A ‘V’ shape for the Γ versus LEdd relation for NGC 2992 was claimed by
Liu et al. (2019); the authors interpreted this as a change in accretion mode, similar to the ones
that occur in stellar-mass X-ray binaries (e.g., QIAO; LIU, 2013), in the AGN. We argue here that
their finding is due to selection effects, as the authors only used data from 2003 to 2013. When
the entire historical data of the source is shown (Figure 33), this effect is not seen. However,
there is a positive correlation between F2–10 and the flux of the Fe Kα, with rs = 0.69+0.07–0.11 and
pvalue = 0.01+0.03–0.01. Fitting the data by assuming a relation of the type:
log F (Fe Kα) = α + β log F2–10 (29)
we obtained a slope of β = 0.39 ± 0.04. As the iron Kα line is created by reprocessing of
the primary X-ray continuum, a tight correlation between the flux of the line and that of the
continuum is expected. For large samples of galaxies Ricci et al. (2014), found β = 0.89 ± 0.04,
while Shu et al. (2010) found β = 0.86 ± 0.01. However, NGC 2992 seems to be one of a few
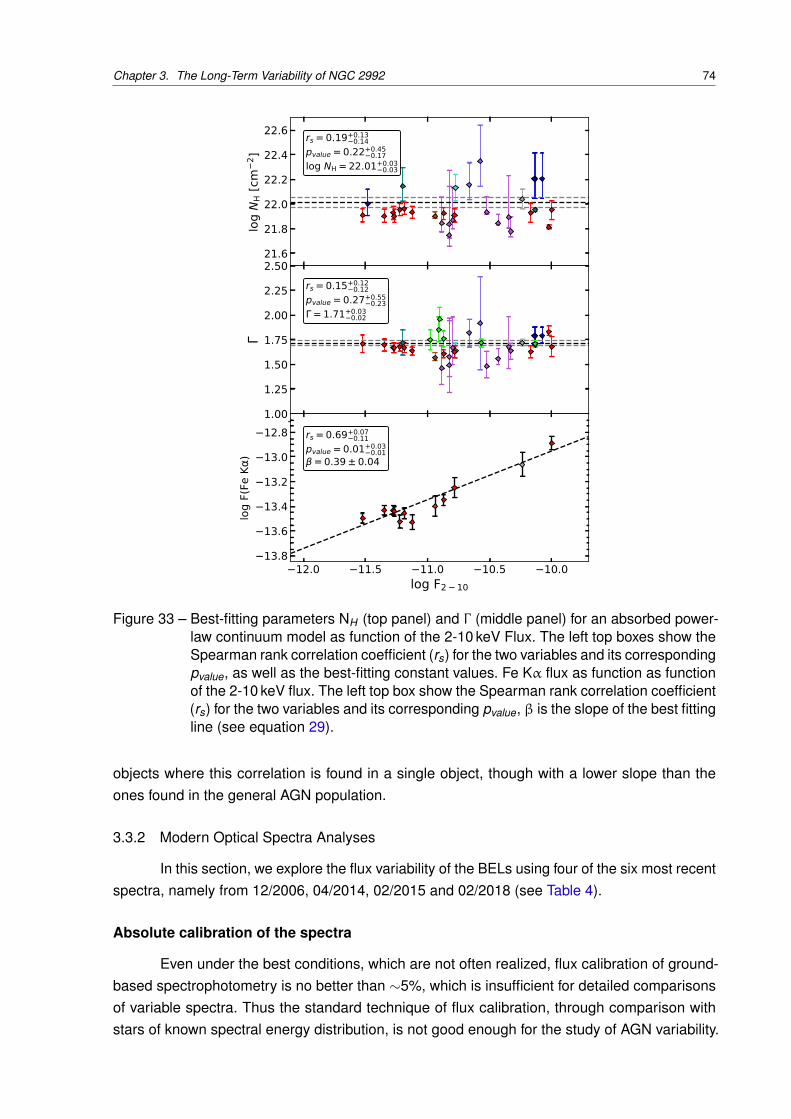
Chapter 3. The Long-Term Variability of NGC 2992 74
21.6
21.8
22.0
22.2
22.4
22.6
logNH[cm
2 ]
rs=0.19+0.130.14pvalue=0.22+0.450.17log NH=22.01+0.030.03
12.0 11.5 11.0 10.5 10.0F2 10 [erg cm 2 s 1]
1.00
1.25
1.50
1.75
2.00
2.25
2.50rs=0.15+0.120.12pvalue=0.27+0.550.23=1.71+0.030.02
12.0 11.5 11.0 10.5 10.0log F2 10
13.8
13.6
13.4
13.2
13.0
12.8
logF(Fe
K)
rs=0.69+0.070.11pvalue=0.01+0.030.01=0.39±0.04
Figure 33 – Best-fitting parameters NH (top panel) and Γ (middle panel) for an absorbed power-law continuum model as function of the 2-10 keV Flux. The left top boxes show theSpearman rank correlation coefficient (rs) for the two variables and its correspondingpvalue, as well as the best-fitting constant values. Fe Kα flux as function as functionof the 2-10 keV flux. The left top box show the Spearman rank correlation coefficient(rs) for the two variables and its corresponding pvalue, β is the slope of the best fittingline (see equation 29).
objects where this correlation is found in a single object, though with a lower slope than the
ones found in the general AGN population.
3.3.2 Modern Optical Spectra Analyses
In this section, we explore the flux variability of the BELs using four of the six most recent
spectra, namely from 12/2006, 04/2014, 02/2015 and 02/2018 (see Table 4).
Absolute calibration of the spectra
Even under the best conditions, which are not often realized, flux calibration of ground-
based spectrophotometry is no better than ∼5%, which is insufficient for detailed comparisons
of variable spectra. Thus the standard technique of flux calibration, through comparison with
stars of known spectral energy distribution, is not good enough for the study of AGN variability.

Chapter 3. The Long-Term Variability of NGC 2992 75
Table 5 – Emission line measurements of the modern optical spectra. Point-Source Scale Factor(ϕ) is measured using Peterson et al. (1995) algorithm (described in section B.2), theerrors in ϕ represents the uncertainty in the centering of the virtual apertures.
Obs. Date(mm/yyyy) Aperture
Point-SourceScale Factor
ϕ
F(Hα)(10–13 erg cm–2 s–1)
FWHM(Hα)( km s–1)
F(Hβ)(10–13 erg cm–2 s–1)
12/2006 Slit (width = 2.0′′) 0.734 ± 0.063 ≤ 4.4 2733 ± 55 –04/2014 Circular (radius = 2.8′′) 0.972 ± 0.025 27.5 ± 1.4 2002 ± 28 3.6 ± 2.602/2015 Circular (radius = 3.0′′) 1.000 ± 0.011 33.8 ± 1.5 2313 ± 17 3.3 ± 2.202/2018 Circular (radius = 3.0′′) 0.973 ± 0.013 43.8 ± 2.2 2016 ± 13 4.9 ± 1.4
Instead, we use the fluxes of the narrow emission lines known to be non-variable on time scales
of tens of years in most AGN. Consequently, the bright narrow emission lines can be adopted
as internal calibrators for scaling AGN spectra (PETERSON, 1993). We assume that the flux of
the [O III] λ5007 line remains constant during the interval covered by these spectra.
We extracted the spectra using virtual apertures from the original data, making them
as similar as possible to each other in the data cubes, as shown in Table 5. The scaling of
the extracted spectra was carried out using a refinement of the method of van Groningen and
Wanders (1992), employed as a Python package (mapspec) by Fausnaugh (2017). This method
allows us to obtain a homogeneous set of spectra with the same wavelength solution, same
spectral resolution (at ∼ 6300Å), and the same [O III] λ5007 flux value.
Stellar component subtraction and emission-line fitting
We subtracted the host galaxy stellar continuum fitted using the starlight (CID FER-
NANDES et al., 2005b) full spectra fitting code, using a base of 45 Simple Stellar Population
(SSP) spectra, with 15 ages (from 1 Myr to 13 Gyr) and 3 metallicities (0.2, 1.0 and 2.5 Z�). The
emission line fitting was performed using the IFSCube package1 (RUSCHEL-DUTRA, 2020).
The code employs Sequential Least Square Programming and allows multiple components
with physically motivated constraints. In order to measure the BEL fluxes, the narrow emission
components must be separated from the broad components. This process is not straightforward
due to the fact the BELs are blended with the narrow lines, for both Hα and Hβ.
The narrow line subtraction was performed in two steps. First we fitted the narrow and
broad Hα and Hβ simultaneously. For the narrow lines, we created a template comprised of two
Gaussian components that were based on the [S II] λ6716 profile. This template was used to
fit the [N II] and narrow Hα and Hβ lines by adjusting its flux scaling factor only. The fits to the
broad lines were subtracted from the spectra, isolating the narrow emission; we then re-fitted
the narrow lines assuming the H I and [N II] lines have the same velocity dispersion and redshift
and we set the flux of [N II] λ6583 line as 2.96 times that of the [N II] λ6548 line, in accordance
with the ratio of their transition probabilities (OSTERBROCK; FERLAND, 2006), while the Hα
and [N II] λ6583 fluxes were free parameters in the fit. Finally, we subtracted the resulting narrow
lines from the original spectrum and re-fit only broad lines using three Gaussian components, in
order to account for the known non-Gaussian profiles of the BEL. The errors were taken as the
standard deviations of one hundred Monte Carlo iterations. The resulting fits for the four spectra
are shown in Figure 34.
1 http://github.com/danielrd6/ifscube

Chapter 3. The Long-Term Variability of NGC 2992 76
0
1
2
3
4
5
6
0
10
20
3012/2006 (Trippe et al.)
0
1
2
3
4
5
6
0
10
20
3004/2014 (Dopita et al.)
0
1
2
3
4
5
6
0
10
20
3002/2015 (Mingozzi et al.)
4800 4850 49000
1
2
3
4
5
6
6450 6500 6550 6600 6650 6700 6750 68000
10
20
3002/2018 (Guolo-Pereira et al.)
Wavelength (Å)
F[1
014
erg
cm2
s1
Å1 ]
Figure 34 – Fit of the emission lines for the modern optical spectra. From top to bottom: 12/2006(TRIPPE et al., 2008a), 04/2014 (DOPITA et al., 2015), 02/2015 (MINGOZZI et al.,2019) and 02/2018 (GUOLO-PEREIRA et al., 2021). Scaled observed spectra(black), narrow components (green), broad components (blue) and total model (red)are shown. Left panels show the Hβ lines while right ones show the Hα, [N II] and[S II] lines.

Chapter 3. The Long-Term Variability of NGC 2992 77
Inter-calibration of the spectral data
The fluxes measured in the scaled spectrum described in the previous sections were
corrected for aperture and distinct seeing effects, because while the BLR is effectively a point-
like source, the NLR is an extended one. Consequently, the measured NLR flux depends on
the size of the spectrograph’s entrance aperture and the observations seeing (see PETERSON
et al., 1995, and section B.2 for more detailed discussion). In order to correct our fluxes for
these effects, we determined a point-source correction factor (ϕ), which was measured using
the procedure described in section B.2. The ϕ value represents the differences in the amount
of light from the NLR with respect to the amount of light from the BLR for each observation,
it is normalized using the largest aperture (ϕ = 1.0, for 04/2015 spectrum). Then the scaled
inter-calibrated and aperture/seeing corrected BEL fluxes were measured as follows:
F (Hα) = ϕ · Fλ5007
[
F (Hα)F ([O III]λ5007)
]
obs
(30)
where Fλ5007 is the scaling absolute flux in the [O III] λ5007 line, described in section 3.3.2, and
the value in brackets is the broad Hα to [O III] λ5007 measured flux ratio for each spectrum as
described in section 3.3.2. The same procedure was applied to Hβ BEL.
The BEL Hα and Hβ fluxes and the Balmer decrements (Hα/Hβ) are shown in Table 5
and in the right panels of Figure 35. In the 12/2006 spectrum, the Hα BEL is not unambiguously
detected (which leads to its classification as a Seyfert 2), and if it is indeed present, it is very faint,
with a maximum flux of 4.4× 10⁻¹³ erg cm3 s–1. From 2014 to 2018 the broad Hα flux increases
from ∼ 28×10–13 erg cm3 s–1 to ∼ 44×10–13 erg cm3 s–1. The Hβ BEL flux, however, does not
increase monotonically: in the 04/2014 spectrum it had a flux of 3.6 × 10⁻¹³ erg cm3 s–1, and a
lower flux, 3.3× 10⁻¹³ erg cm3 s–1, in 02/2015, while in 02/2018 it was measured as 4.9× 10⁻¹³
erg cm3 s–1. In the middle right panel of Figure 35 we also show an estimate of the detection
limit for each spectrum. The broad Hβ is only well above this limit in the 02/2018 spectrum
and possibly in 02/2015. Therefore, based on these spectra, the galaxy can be classified as a
Seyfert 1.8. Within the uncertainties the Balmer decrements seems to be constant at a value of
∼ 9.
3.3.3 The Link Between the X-ray Luminosity and the BELs
Comparing the middle and bottom panels of Figure 32, one can directly see a correlation
between the intrinsic X-ray luminosity and the detection of the broad Hα component. The periods
in which the broad component is detectable are the ones where L2–10 shows the highest values;
the epochs when the galaxy is classified as a Seyfert 2 are those when closest available X-
ray spectra show lower L2–10 values. Given that the X-ray and optical observations are not
simultaneous, in order to quantify the correlation between the BELs and the X-ray luminosity
we linearly interpolate the L2–10 curve (bottom panel of Figure 32) and attribute a L2–10 value
for each historical optical spectrum. In Figure 36 we show the interpolated L2–10 value for each
spectrum as function of the bi-modal Hα BEL detection.
From Figure 36, the link between the BEL and the X-ray luminosity is clear: at all epochs
when an Hα BEL is detected, L2–10 > 4 × 1042 erg s–1; conversely, when a Seyfert 2 spectrum

Chapter 3. The Long-Term Variability of NGC 2992 78
0
5
10
15
L 210
[1042
erg
s1 ]
0
10
20
30
40
50
F(H
)[1
013
erg
cm2
s1 ]
2.5
5.0
7.5
10.0
12.5
15.0
F(Fe
K)
[10
14er
gcm
2s
1 ]
0
2
4
6
8
F(H
)[1
013
erg
cm2
s1 ]
2005 2010 2015 2020Obs. Date (yr)
6
8
10
12
NH
[1021
cm2 ]
2005 2010 2015 2020Obs. Date (yr)
4
6
8
10
12
14
H/H
Figure 35 – X-ray (left) and optical (right) properties from 2005 to 2020. From top to bottom inthe X-ray panels: Intrinsic 2-10 keV Luminosity (L2–10), narrow Fe Kα line flux, andthe column density ( NH ). From top to bottom in the optical panels: Flux of the HαBEL, the flux of the Hβ BEL, and the Balmer decrement (Hα/Hβ). In the opticalpanels, the red lines represent a lower limit for the detection of the lines, beingmeasured as the flux of a line with a signal to noise ratio equal to 3.
is observed, L2–10 < 4× 1042 erg s–1;. Moreover, from Figure 35 (top panels) and Figure 37 (top
panel) we can see that for the modern spectra (2006-2018) the Hα BEL flux increases with the
increase in the L2–10. From the same figures, we can see that the transitions between Type 1.9
to Type 1.8 (i.e., the clear detection of the Hβ BEL) occurs between 10 - 15 ×1042 erg s–1. It is
possible that the oldest high Eddington Ratio optical observations did not detect the broad Hβ
due to its faintness or lower signal to noise ratio.
Under some assumptions one can convert the transitional X-ray luminosity (4× 1042 erg
s–1) into a Bolometric luminosity (Lbol ) and than into Eddington ratio (λEdd ), as follows:
λEdd =Lbol
LEdd=
[KX (L2–10) ± ∆KX ] × L2–10
1.3 × 1038 MBH(31)
where KX is the bolometric correction and ∆KX is uncertainty in the bolometric correction (the
intrinsic spread of the AGN population dominates this uncertainty). We use Duras et al. (2020)
correction, which assumes values of KX (L2–10 = 4×1042 erg s–1) = 15.64 and ∆KX = 0.37 dex ,

Chapter 3. The Long-Term Variability of NGC 2992 79
Not Detected DetectedH BEL
0.5
1
2
5
10
1520
L 210
[1042
erg
s1 ]
Figure 36 – Interpolated intrinsic 2-10 keV X-ray luminosity (L2–10) for each optical spectrum asfunction of the detection or non-detection of the Hα BEL. Showing a clear lowerboundary of L2–10 ≈ 4 × 1042 erg s–1 for the detection of the component.
we can therefore estimate the Eddington ratio in which the transitions occurs as being:
λEdd ≈ 2.0+2.0–1.3 ×
(
3 × 10⁷ M�
MBH
)
% (32)
where(
3 × 10⁷ M� / MBH
)
is written as a systematic scaling factor to take into account the
uncertainties in the black hole mass and the distinct values that can be considered (see section
3.2.4), since if we would have propagated it would dominate the λEdd uncertainty.
In summary, this analysis strongly supports the hypothesis that the CL phenomenon in
NGC 2992 is caused by variations in the accretion rate and not due to changes in absorption
nor due to TDEs (which we discard due to the several repeated CL events). The idea that the
orientation-based Unification Models alone cannot explain the variety of AGNs, and that the
specific accretion rate, as given by the Eddington ratio, is as essential as obscuration in the
classification of the distinct AGN types, has been explored by several authors recently as we
discussed in section 1.3.3.
We have shown that the variability in NGC 2992 is intrinsically driven by changes in
accretion rate, and not due to variable obscuration. In this scenario, the CL events (i.e., the
disappearing and reappearing of the BELs) can be due to two distinct effects:
• Dimming/brightening of the AGN continuum, which changes the supply of ionizing photons
available to excite the gas in the immediate vicinity of the black hole and therefore the
BLR. In this case, variations in the BEL fluxes are due to changes in the ionization state

Chapter 3. The Long-Term Variability of NGC 2992 80
Edd × (3 × 107 MMBH ) %
0
10
20
30
40
50
F(H
)[1
013
erg
cm2
s1 ]
0.2 0.5 1.0 2.0 5.0 10
Edd × (3 × 107 MMBH ) %
1500
2000
2500
3000
3500
FWHM
(H)[
kms
1 ] Elitzur+2014 ( = 0.43)Nicastro 2000 ( / = 0.04)
0 10 20 30 40 50F(H ) [10 13 erg cm 2 s 1]
1500
2000
2500
3000
3500
FWHM
(H)[
kms
1 ] Dalla Bonta+2020MBH = 0.5 × 10⁷MMBH = 1.5 × 10⁷MMBH = 3.0 × 10⁷M
Figure 37 – Top: flux of Hα BEL as function of Eddington Ratio (λEdd ), measured using equa-tions 31 and 32, for each modern optical spectrum. Middle: FHWM of Hα BELas function of λEdd for each modern optical spectrum. Blue and orange dashedlines are, respectively, are the best-fitting Nicastro (2000) and Elitzur et al. (2014)disk-wind models (see section 3.3.3 and equations 33 and 34). Bottom: FHWM ofHα broad as function of Hα BEL flux for for each modern optical spectrum. Eachdashed line represent the Dalla Bonta et al. (2020) relation between the two pa-rameters, assuming a constant Balmer decrement of 9 and Calzetti et al. (2000)extinction law, for distinct supermassive black hole masses ( MBH ) in the rangediscussed in section 3.2.4.

Chapter 3. The Long-Term Variability of NGC 2992 81
of the BLR clouds and not to change in its geometry or structure (STORCHI-BERGMANN
et al., 2003; SCHIMOIA et al., 2012; LAMASSA et al., 2015);
• The fading of the BLR structure itself as proposed by the disk-wind BLR models (see
section 1.3.3), in which a low accretion rate is not able to sustain the required cloud flow
rate (NICASTRO, 2000; TRUMP et al., 2011; ELITZUR et al., 2014), that makes up the
BLR.
The first scenario is supported in the case of the double-peaked LINER/Seyfert 1 nucleus
of NGC 1097, for which Storchi-Bergmann et al. (2003) and Schimoia et al. (2012) found an
inverse correlation between the width of the Hα broad profile and the flux of the line, as well as
for NGC 5548 by Peterson et al. (2002) and for the CL-Quasar SDSS J015957.64+003310.5
by LaMassa et al. (2015). The authors preferred explanation for this is the fact that, when the
AGN is brightest, it ionizes farther out in the BLR, reaching lower velocity clouds, and the profile
becomes narrower. When the AGN is dimmer, it ionizes only the closest regions, where the
velocities are higher and the profile becomes wider, in agreement with a virialized BLR. In our
data, there seems to be such a inverse correlation between FWHM(Hα) and F(Hα), in the
modern optical spectra, as can be seen in the bottom panel of Figure 37.
However, in the second scenario, where the BLR is described as a disk-driven wind and
not as clouds orbiting in Keplerian-like orbits, this inverse correlation is also predicted. Using
distinct, prescriptions both Nicastro (2000) and Elitzur et al. (2014) show that with increasing
accretion rate (which increases Hα BEL flux) the FWHM in the BLR decreases. In the Nicastro
(2000) model, the relation between the two parameters is written as:
log (λEdd ) = –3 log(FWHM) + 9.86 + log(η/α) (33)
where η/α is the ratio between the disk efficiency (η) and its viscosity (α), while Elitzur et al.
(2014) use:
log (λEdd ) = –4 log(FWHM) + 3.60 + log(MBH ) + log(ξ) (34)
where ξ is the ratio between the BLR radius (rBLR) and the dust sublimation radius (Rd ) with
ξ < 1.0. The reader is referred to the original papers as well as to Nicastro et al. (2018) for
detailed explanation of the models and equations. In the middle panel of Figure 37, we show
both models with best-fitting parameters (η/α = 0.04 and ξ = 0.42) for the measured Hα BEL
FWHM and λEdd , measured from the interpolated L2–10 (Figure 36) using the above prescription
(equations 31 and 32).
While we have successfully shown that the CL events in NGC 2992 are driven by
changes in the accretion rate, we could not determine the true nature of the BEL variability,
mainly because, as discussed, we still do not have a full understanding of the formation and
evolution of the BLRs in AGNs. In the next section we discuss the overall state-of-art modeling
of the innermost structure of CL-AGNs as well as a proposed technique to distinguish between
the two above proposed scenario.

Chapter 3. The Long-Term Variability of NGC 2992 82
3.4 Discussion
In both the scenarios discussed on previous section, quick (∼ 10 years between the
maximum and the minimum activity) and large (a factor of ∼ 35 in L2–10) variations in the
accretion rate are necessary. However, the standard Shakura and Sunyaev (1973) accretion
disk model does not support such variations as we discussed in section 1.2.2.
The Eddington ratio in which the BEL transitions occurs in NGC 2992 contains the critical
value at which there is a state transition between a radiatively inefficient accretion flow (RIAF,
see section 1.2.2) and a thin accretion disk λEdd ∼ 0.01 (e.g., XIE; YUAN, 2012, see also
‘Alternative accretion scenarios’ in section 1.2.2). The similarity between these values suggests
that NGC 2992 is operating at the threshold mass accretion rate between the two accretion
modes. Indeed, Sniegowska et al. (2020) proposed an explanation for the sources displaying
multiple quasi-periodic CL phenomena according to which they would be operating at a few per
cent of the Eddington limit. They argue that the outbursts are caused by the radiation pressure
instability operating in the narrow ring between the standard (SHAKURA; SUNYAEV, 1973)
thin pressure dominated outer disk and the hot optically thin inner RIAF (YUAN; NARAYAN,
2014). The corresponding limit cycle is responsible for periodic outbursts, and the timescales
are therefore much shorter than the standard viscous timescale due to the narrowness of the
unstable radial zone.
Even with the possibility of such rapid variability in the accretion rate (given some of these
alternatives to the classical accretion disk, e.g., section 1.2.2), the cause of the type transition
remains uncertain, dimming of the ionizing source or fading of the BLR structure itself. By using
radiative transfer Monte Carlo simulations to test the multiple causes of the CL phenomenon,
Marin (2017) argues that the differences between these two scenarios can only be observable
in polarized light: in the ionizing source dimming scenario, the polarization properties between
the high and low flux state should be the same, while that for the BLR fading a decrease in the
degree of polarization and a rotation in the polarization angle are expected in the low flux state.
We had access to a spectropolarimetric observation of NGC 2992 obtained in 2006 (Robinson
et al., in prep), when the galaxy was at a dim state (see Figure 32). In Figure 38 we show the
polarization angle (top panel), the polarimetric spectrum (middle panel), and polarization degree
as function of wavelength. The data shows no signs of BEL in the polarimetric spectrum (as
well as in normal flux). To test Marin (2017) predictions, we would need recent (with the AGN at
its bright state) observations. As this data is not available to us now, the exact intrinsic cause of
the CL-AGN events in NGC 2992 is still an open question. We join these authors in advocating
for systematic polarimetric observations of CL-AGN to understand their true nature fully.
In this sense, follow up observations of NGC 2992 in the next decades will continue to
help constrain the physics of AGNs. Furthermore, this source joins several others in the literature
that show that the accretion rate is a fundamental variable for any model that tries to unify the
AGN zoology and that viewing angle or obscuration effects alone cannot fully explain differences
seen in SMBH activity in galaxies. For now, in this chapter, we mapped the historical emission of
this AGN, which after this work, is one of the very few known accretion rate-dependent CL-AGN.

Chapter 3. The Long-Term Variability of NGC 2992 83
Figure 38 – Top: polarization angle (θ) as function of wavelength. Middle: Polarized spectra. Bot-tom: Polarization degree (p) in % of the total flux as function of wavelength. Figurekindly provided by Prof. Andrew Robinson in a private communication (Robinson etal, in prep.).
84
4 CONCLUSIONS AND FUTURE WORK
This dissertation has presented a multi-wavelength spatial and temporal analyses of the
AGN in the interacting Seyfert galaxy NGC 2992. To spatially resolve the galaxy’s circumnuclear
region, we use optical spectra obtained with the GMOS IFU on the Gemini South telescope,
with a spatial resolution of ≈ 120 pc and spectral resolution ≈ 40 km s–1. The main results are:
• The stellar population in the nuclear region of the galaxy is mainly composed (60%≤xO ≤ 80%) by an old (t > 1.4 Gyr) metal-rich (〈Z〉O ≥ 2.0 Z�) population with a smaller,
but considerable contribution (10% ≤ xY ≤ 30%) of an young (t < 100 Myr) metal-poor
(〈Z〉Y ≤ 1.0 Z�) population. A possible scenario is that metal-poor gas inflow during
the pericentre passage of NGC 2993 has led to interaction-driven circumnuclear star
formation, which can explain the presence of such young metal-poor stellar population in
the nuclear region;
• The NLR presents two distinctly kinematical components: one that although disturbed is
well fitted by a disk model, and therefore can be identified as gas following regular orbits
in the galactic disk, with radial velocities ranging from -130 to 130 km s–1; another that we
interpreted as an outflow associated with the radio emission, with blueshifted velocities of
∼ 200 km s–1, a mass outflow rate of Mout ≈ 1.6 ± 0.6 M� and a kinematic power of Eout
≈ 2.2 ± 0.3 × 1040 erg s–1;
• The BPT diagnostic diagrams show the galaxy posses multiple ionization mechanisms:
a mixture of AGN, star-formation and shocks, the former being the dominant one. The
[O III]/Hβ ratio peaks at the innermost spaxels, and is located in the upper region of the
BPT diagram. The lower values, located at the border of the FoV, decreases down to
below the Kewley et al. (2001) line, showing an increase in the star-formation ionization
compared to the AGN ionization at larger radius. Off-nuclear peaks in the [N II]/Hα and
[S II]/Hαmaps indicate the presence of another mechanism and are successfully explained
by Sutherland et al. (2018) shock+precursor models.
Regarding the source’s variability, we have explored its historical X-ray and optical spectra from
1978 to 2019, focusing mainly on its CL events. The main results are:
• The source presents large intrinsic X-ray luminosity variability, by a factor of ∼ 35, ranging
from 4.9 × 1041 erg s–1up to 1.7 × 1043 erg s–1;
• The source presents several transitions between type 2 Seyfert to intermediate-type spec-
trum, losing and regaining its Hα BEL on timescales of several years;
• We ruled out TDEs or variable obscuration as causes of the type transitions. We show that
the presence (and the flux) of the Hα BEL is directly correlated with the 2-10 keV X-ray
luminosity: a minimum value of L2–10 ≈ 4 × 1042 erg s–1 is necessary for its appearance.
This value translates to a Eddington ratio of 2.0+2.0–1.3%, if we assume MBH = 3 × 10⁷ M�.
Due to its faintness, the unambiguously detection of the Hβ BEL was only possible in the
most recent spectrum, at even higher accretion rates of λEdd ≈ 5–8%;

Chapter 4. Conclusions and Future Work 85
• We find a correlation between the narrow Fe Kα flux and λEdd , and an anti-correlation
between full width at half maximum of Hα BEL and λEdd , as predicted by the disk-wind
BLR models.
• Two possible scenarios for type transitions are still open: either the dimming (brightening)
of the AGN continuum luminosity, which reduces (increases) the supply of ionizing photons
available to excite the gas in the immediate vicinity of the black hole or the disappearance
of the BLR structure itself occurs as the low accretion efficiency is not able to sustain the
required cloud flow rate in a disk-wind BLR model. Multi-epoch polarimetric observations
may distinguish between the two scenarios.
• We added another object to the list of CL-AGNs, in particularly, one of the very few
known to be accretion rate-dependent. Furthermore, this study supports the idea that
the accretion rate is a fundamental variable in determining the observed AGN type, and
therefore should be included in a more complete model to unify the AGN zoology.
This work shows the importance and the role of the local universe targets to the study
of the AGN phenomena, in which the parsec scale structures can be resolved and public multi-
wavelength (we have used here, radio, optical and X-ray data) and multi-epoch observations are
available. Following, I list some ideas of studies that are being developed or can be developed
based on this galaxy (system of galaxies) or applying similar approaches:
• Modern simulations of Arp 245 system are being developed/studied by another member
of our group, focusing this time on gas inflows and interaction-driven star formation, since
those were not the focus of Duc et al. (2000) work.
• IFU data of NGC 2993 would be very useful to probe the interaction’s effects in the other
object of the system, particularly with a large FoV IFU instrument such as MUSE.
• A spectropolarimetric observation of NGC 2992 at its high state, to compare with the one
presented in Figure 38, allowing us to test Marin (2017) model.
• A similar re-examination of the entire literature, as we have done in chapter 3, to others
well studied/sampled variable AGNs.

86
REFERENCES
ALLEN, Mark G.; DOPITA, Michael A.; TSVETANOV, Zlatan I.; SUTHERLAND, Ralph S. Physical Conditions in the Seyfert Galaxy NGC 2992. The
Astrophysical Journal, v. 511, n. 2, p. 686–708, Feb. 1999a. DOI: 10.1086/306718. arXiv: astro-ph/9809123 [astro-ph].
ALLEN, Mark G.; DOPITA, Michael A.; TSVETANOV, Zlatan I.; SUTHERLAND, Ralph S. Physical Conditions in the Seyfert Galaxy NGC 2992. The
Astrophysical Journal, v. 511, n. 2, p. 686–708, Feb. 1999b. DOI: 10.1086/306718. arXiv: astro-ph/9809123 [astro-ph].
ALLEN, Mark G.; GROVES, Brent A.; DOPITA, Michael A.; SUTHERLAND, Ralph S.; KEWLEY, Lisa J. The MAPPINGS III Library of Fast RadiativeShock Models. The Astrophysical Journal Supplement Series, v. 178, n. 1, p. 20–55, Sept. 2008. DOI: 10.1086/589652. arXiv: 0805.0204[astro-ph].
ANDRILLAT, Y.; SOUFFRIN, S. Sur les Abondances et le Rougissement dans les Noyaux de Galaxies de Seyfert. Astronomy and Astrophysics,v. 11, p. 286, Mar. 1971.
ANTONUCCI; MILLER, J. S. Spectropolarimetry and the nature of NGC 1068. The Astrophysical Journal, v. 297, p. 621–632, Oct. 1985. DOI:10.1086/163559.
ANTONUCCI, Robert. Astrophysics: Quasars still defy explanation. Nature, v. 495, n. 7440, p. 165–167, Mar. 2013. DOI: 10.1038/495165a.
ANTONUCCI, Robert. Unified models for active galactic nuclei and quasars. Annual Review of Astronomy and Astrophysics, v. 31, p. 473–521,Jan. 1993. DOI: 10.1146/annurev.aa.31.090193.002353.
ARETXAGA, Itziar; JOGUET, B.; KUNTH, D.; MELNICK, J.; TERLEVICH, R. J. Seyfert 1 Mutation of the Classical Seyfert 2 Nucleus NGC 7582.The Astrophysical Journal, IOP Publishing, v. 519, n. 2, p. l123–l126, July 1999. ISSN 0004-637X. DOI: 10.1086/312114. Available from:http://dx.doi.org/10.1086/312114.
AVNI, Y. Energy spectra of X-ray clusters of galaxies. The Astrophysical Journal, v. 210, p. 642–646, Dec. 1976. DOI: 10.1086/154870.
BACON, R. et al. The MUSE second-generation VLT instrument. In: MCLEAN, Ian S.; RAMSAY, Suzanne K.; TAKAMI, Hideki (Eds.).Ground-based and Airborne Instrumentation for Astronomy III. [S.l.: s.n.], July 2010. (Society of Photo-Optical Instrumentation Engineers(SPIE) Conference Series), p. 773508. DOI: 10.1117/12.856027.
BALDWIN, C.M.; MCDERMID, R. M.; KUNTSCHNER, H.; MARASTON, C.; CONROY, C. Comparison of stellar population model predictions usingoptical and infrared spectroscopy. Monthly Notices of the Royal Astronomical Society, v. 473, n. 4, p. 4698–4721, Feb. 2018. DOI:10.1093/mnras/stx2502. arXiv: 1709.09300 [astro-ph.GA].
BALDWIN, J. A.; PHILLIPS, M. M.; TERLEVICH, R. Classification parameters for the emission-line spectra of extragalactic objects. Publications of
the Astronomical Society of the Pacific, v. 93, p. 5–19, Feb. 1981. DOI: 10.1086/130766.
BARLOW, Roger. Asymmetric Errors. In: LYONS, L.; MOUNT, R.; REITMEYER, R. (Eds.). Statistical Problems in Particle Physics,
Astrophysics, and Cosmology. [S.l.: s.n.], Jan. 2003a. P. 250. arXiv: physics/0401042 [physics.data-an].
BARLOW, Roger. Asymmetric Statistical Errors. [S.l.: s.n.], 2004. arXiv: physics/0406120 [physics.data-an].
BARLOW, Roger. Asymmetric Systematic Errors. arXiv e-prints, physics/0306138, physics/0306138, June 2003b. arXiv: physics/0306138[physics.data-an].
BARRERA-BALLESTEROS, J. K. et al. Central star formation and metallicity in CALIFA interacting galaxies. Astronomy and Astrophysics, v. 579,A45, a45, July 2015. DOI: 10.1051/0004-6361/201425397. arXiv: 1505.03153 [astro-ph.GA].
BERTOLA, F.; BETTONI, D.; DANZIGER, J.; SADLER, E.; SPARKE, L.; DE ZEEUW, T. Testing the gravitational field in elliptical galaxies - NGC5077. The Astrophysical Journal, v. 373, p. 369–390, June 1991. DOI: 10.1086/170058.
BIANCHI, Stefano; PICONCELLI, Enrico; CHIABERGE, Marco; BAIL ON, Elena Jim enez; MATT, Giorgio; FIORE, Fabrizio. How Complex is theObscuration in Active Galactic Nuclei? New Clues from the Suzaku Monitoring of the X-Ray Absorbers in NGC 7582. The Astrophysical Journal,v. 695, n. 1, p. 781–787, Apr. 2009. DOI: 10.1088/0004-637X/695/1/781. arXiv: 0901.1973 [astro-ph.GA].
BICA, E.; ALLOIN, D. A base of star clusters for stellar population synthesis. Astronomy and Astrophysics, v. 162, p. 21–31, July 1986.

REFERENCES 87
BISNOVATYI-KOGAN, G. S.; LOVELACE, R. V. E. Advective accretion disks and related problems including magnetic fields. Nature, v. 45, n. 11-12,p. 663–742, Dec. 2001. DOI: 10.1016/S1387-6473(01)00146-4. arXiv: astro-ph/0207625 [astro-ph].
BLANDFORD. Black Holes and Relativistic Jets. Progress of Theoretical Physics Supplement, v. 143, p. 182–201, Jan. 2001. DOI:10.1143/PTPS.143.182. arXiv: astro-ph/0110394 [astro-ph].
BLOCK, Adam. Caelum-Observatory:NGC2992. [S.l.], 2011. Available from: http://www.caelumobservatory.com/gallery/n2992.shtml.
BLUMENTHAL, K. A.; BARNES, J. E. Go with the Flow: Understanding inflow mechanisms in galaxy collisions. Monthly Notices of the Royal
Astronomical Society, v. 479, p. 3952–3965, Sept. 2018. DOI: 10.1093/mnras/sty1605. arXiv: 1806.05132.
BOLTON. Identification of Cygnus X-1 with HDE 226868. Nature, v. 235, n. 5336, p. 271–273, Feb. 1972. DOI: 10.1038/235271b0.
BOLTON; STANLEY, G. J. Observations on the Variable Source of Cosmic Radio Frequency Radiation in the Constellation of Cygnus. Australian
Journal of Scientific Research A Physical Sciences, v. 1, p. 58, Mar. 1948. DOI: 10.1071/PH480058.
BRUZUAL, G.; CHARLOT, S. Stellar population synthesis at the resolution of 2003. Monthly Notices of the Royal Astronomical Society, v. 344,p. 1000–1028, Oct. 2003. DOI: 10.1046/j.1365-8711.2003.06897.x. eprint: astro-ph/0309134.
BULLOCK, James S.; BOYLAN-KOLCHIN, Michael. Small-Scale Challenges to the ΛCDM Paradigm. Annual Review of Astronomy and
Astrophysics, v. 55, n. 1, p. 343–387, Aug. 2017. DOI: 10.1146/annurev-astro-091916-055313. arXiv: 1707.04256 [astro-ph.CO].
BUNDY, Kevin et al. Overview of the SDSS-IV MaNGA Survey: Mapping nearby Galaxies at Apache Point Observatory. The Astrophysical
Journal, v. 798, n. 1, 7, p. 7, Jan. 2015. DOI: 10.1088/0004-637X/798/1/7. arXiv: 1412.1482 [astro-ph.GA].
BUSKO, I. C.; STEINER, J. E. Profiles of emission lines in active galactic nuclei. III. Observations of Hα, [N II] and [S II] profiles. Monthly Notices
of the Royal Astronomical Society, v. 245, p. 470, Aug. 1990.
CALZETTI, D.; ARMUS, L.; BOHLIN, R. C.; KINNEY, A. L.; KOORNNEEF, J.; STORCHI-BERGMANN, T. The Dust Content and Opacity of ActivelyStar-forming Galaxies. The Astrophysical Journal, v. 533, p. 682–695, Apr. 2000. DOI: 10.1086/308692. eprint: astro-ph/9911459.
CAPPELLARI, M.; COPIN, Y. Adaptive spatial binning of integral-field spectroscopic data using Voronoi tessellations. Monthly Notices of the
Royal Astronomical Society, v. 342, p. 345–354, June 2003. DOI: 10.1046/j.1365-8711.2003.06541.x. eprint: astro-ph/0302262.
CARDELLI, J. A.; CLAYTON, G. C.; MATHIS, J. S. The relationship between infrared, optical, and ultraviolet extinction. The Astrophysical Journal,v. 345, p. 245–256, Oct. 1989. DOI: 10.1086/167900.
CARDOSO, Leandro S. M.; GOMES, Jean Michel; PAPADEROS, Polychronis. Impact of an AGN featureless continuum on estimation of stellarpopulation properties. Astronomy and Astrophysics, v. 604, A99, a99, Aug. 2017. DOI: 10.1051/0004-6361/201630378. arXiv: 1705.04224[astro-ph.GA].
CHABRIER, G. Galactic Stellar and Substellar Initial Mass Function. Publications of the Astronomical Society of the Pacific, v. 115, p. 763–795,July 2003. DOI: 10.1086/376392. eprint: astro-ph/0304382.
CHAPMAN, S. C.; MORRIS, S. L.; ALONSO-HERRERO, A.; FALCKE, H. Adaptive optics near-infrared imaging of NGC 2992 - unveiling corestructures related to radio figure-of-8 loops. Monthly Notices of the Royal Astronomical Society, v. 314, p. 263–272, May 2000. DOI:10.1046/j.1365-8711.2000.03303.x. eprint: astro-ph/9908222.
CHEN, X. Y.; LIANG, Y. C.; HAMMER, F.; PRUGNIEL, Ph.; ZHONG, G. H.; RODRIGUES, M.; ZHAO, Y. H.; FLORES, H. Comparing six evolutionarypopulation synthesis models by performing spectral synthesis for galaxies. Astronomy and Astrophysics, EDP Sciences, v. 515, a101, June 2010.ISSN 1432-0746. DOI: 10.1051/0004-6361/200913894. Available from: http://dx.doi.org/10.1051/0004-6361/200913894.
CID FERNANDES; GONZLEZ DELGADO, Rosa M. Testing spectral models for stellar populations with star clusters - I. Methodology. Monthly
Notices of the Royal Astronomical Society, v. 403, n. 2, p. 780–796, Apr. 2010. DOI: 10.1111/j.1365-2966.2009.16153.x. arXiv: 0912.0410[astro-ph.CO].
CID FERNANDES; GU, Q.; MELNICK, J.; TERLEVICH, E.; TERLEVICH, R.; KUNTH, D.; RODRIGUES LACERDA, R.; JOGUET, B. The starformation history of Seyfert 2 nuclei. Monthly Notices of the Royal Astronomical Society, v. 355, n. 1, p. 273–296, Nov. 2004. DOI:10.1111/j.1365-2966.2004.08321.x. arXiv: astro-ph/0408483 [astro-ph].

REFERENCES 88
CID FERNANDES; MATEUS, A.; SODR E, L.; STASI NSKA, G.; GOMES, J. M. Semi-empirical analysis of Sloan Digital Sky Survey galaxies - I.Spectral synthesis method. Monthly Notices of the Royal Astronomical Society, v. 358, p. 363–378, Apr. 2005a. DOI:10.1111/j.1365-2966.2005.08752.x. eprint: astro-ph/0412481.
CID FERNANDES; MATEUS, A.; SODR E, L.; STASI NSKA, G.; GOMES, J. M. Semi-empirical analysis of Sloan Digital Sky Survey galaxies - I.Spectral synthesis method. Monthly Notices of the Royal Astronomical Society, v. 358, p. 363–378, Apr. 2005b. DOI:10.1111/j.1365-2966.2005.08752.x. eprint: astro-ph/0412481.
CID FERNANDES, R. On tests of full spectral fitting algorithms. Monthly Notices of the Royal Astronomical Society, v. 480, n. 4, p. 4480–4488,Nov. 2018. DOI: 10.1093/mnras/sty2012.
CID FERNANDES, R.; STASINSKA, G.; MATEUS, A.; VALE ASARI, N. A comprehensive classification of galaxies in the Sloan Digital Sky Survey:how to tell true from fake AGN? Monthly Notices of the Royal Astronomical Society, v. 413, n. 3, p. 1687–1699, May 2011. DOI:10.1111/j.1365-2966.2011.18244.x. arXiv: 1012.4426 [astro-ph.CO].
CID FERNANDES, R. et al. Resolving galaxies in time and space. I. Applying STARLIGHT to CALIFA datacubes. Astronomy and Astrophysics,v. 557, A86, a86, Sept. 2013. DOI: 10.1051/0004-6361/201220616. arXiv: 1304.5788 [astro-ph.CO].
COHEN, Ross D.; RUDY, Richard J.; PUETTER, R. C.; AKE, T. B.; FOLTZ, Craig B. Variability of Markarian 1018: Seyfert 1.9 to Seyfert 1. The
Astrophysical Journal, v. 311, p. 135, Dec. 1986. DOI: 10.1086/164758.
COLINA, L.; FRICKE, K. J.; KOLLATSCHNY, W.; PERRYMAN, M. A. C. Extended emission line regions in nearby Seyfert galaxies. I. NGC 2992.Astronomy and Astrophysics, v. 178, p. 51–61, May 1987.
COMBES, F. et al. ALMA reveals the feeding of the Seyfert 1 nucleus in NGC 1566. Astronomy and Astrophysics, EDP Sciences, v. 565, a97,May 2014. ISSN 1432-0746. DOI: 10.1051/0004-6361/201423433. Available from: http://dx.doi.org/10.1051/0004-6361/201423433.
CONROY, Charlie. Modeling the Panchromatic Spectral Energy Distributions of Galaxies. Annual Review of Astronomy and Astrophysics,Annual Reviews, v. 51, n. 1, p. 393–455, July 2013. ISSN 1545-4282. DOI: 10.1146/annurev-astro-082812-141017. Available from:http://dx.doi.org/10.1146/annurev-astro-082812-141017.
COOKE, B. A. et al. The Ariel V (SSI) catalogue of high galactic latitude (. Monthly Notices of the Royal Astronomical Society, v. 182,p. 489–515, Feb. 1978. DOI: 10.1093/mnras/182.3.489.
CORRAL, A.; DELLA CECA, R.; CACCIANIGA, A.; SEVERGNINI, P.; BRUNNER, H.; CARRERA, F. J.; PAGE, M. J.; SCHWOPE, A. D. The X-rayspectral properties of the AGN population in the XMM-Newton bright serendipitous survey. Astronomy and Astrophysics, v. 530, A42, a42, June2011. DOI: 10.1051/0004-6361/201015227. arXiv: 1104.2173 [astro-ph.CO].
COSTA, Tiago; ROSDAHL, Joakim; SIJACKI, Debora; HAEHNELT, Martin G. Quenching star formation with quasar outflows launched by trappedIR radiation. Monthly Notices of the Royal Astronomical Society, v. 479, n. 2, p. 2079–2111, Sept. 2018. DOI: 10.1093/mnras/sty1514. arXiv:1709.08638 [astro-ph.GA].
COUTO, Guilherme S.; STORCHI-BERGMANN, Thaisa; SCHNORR-MULLER, Allan. Gas rotation, shocks and outflow within the inner 3 kpc of theradio galaxy 3C 33. Monthly Notices of the Royal Astronomical Society, v. 469, n. 2, p. 1573–1586, Aug. 2017. DOI: 10.1093/mnras/stx962.arXiv: 1704.06343 [astro-ph.GA].
CRENSHAW, D. Michael; FISCHER, Travis C.; KRAEMER, Steven B.; SCHMITT, Henrique R. Feedback from Mass Outflows in Nearby ActiveGalactic Nuclei. II. Outflows in the Narrow-line Region of NGC 4151. The Astrophysical Journal, v. 799, n. 1, 83, p. 83, Jan. 2015. DOI:10.1088/0004-637X/799/1/83. arXiv: 1411.4507 [astro-ph.GA].
CROTON, D. J. et al. The many lives of active galactic nuclei: cooling flows, black holes and the luminosities and colours of galaxies. Monthly
Notices of the Royal Astronomical Society, v. 365, p. 11–28, Jan. 2006. DOI: 10.1111/j.1365-2966.2005.09675.x. eprint: astro-ph/0508046.
D’AGOSTINO, Joshua J; POETRODJOJO, Henry; HO, I-Ting; GROVES, Brent; KEWLEY, Lisa; MADORE, Barry F; RICH, Jeff; SEIBERT, Mark.Starburst–AGN mixing: TYPHOON observations of NGC 1365, NGC 1068, and the effect of spatial resolution on the AGN fraction. Monthly
Notices of the Royal Astronomical Society, Oxford University Press (OUP), v. 479, n. 4, p. 4907–4935, June 2018. ISSN 1365-2966. DOI:10.1093/mnras/sty1676. Available from: http://dx.doi.org/10.1093/mnras/sty1676.
DAI, Xinyu; CHARTAS, George; ERACLEOUS, Michael; GARMIRE, Gordon P. A Study of Quasar Evolution in the X-Ray Band with the Aid ofGravitational Lensing. The Astrophysical Journal, IOP Publishing, v. 605, n. 1, p. 45–57, Apr. 2004. ISSN 1538-4357. DOI: 10.1086/382205.Available from: http://dx.doi.org/10.1086/382205.

REFERENCES 89
DALCANTON, Julianne J. The Metallicity of Galaxy Disks: Infall versus Outflow. The Astrophysical Journal, IOP Publishing, v. 658, n. 2,p. 941–959, Apr. 2007. DOI: 10.1086/508913. Available from: https://doi.org/10.10862F508913.
DALLA BONTA et al. The Sloan Digital Sky Survey Reverberation Mapping Project: Estimating Masses of Black Holes in Quasars with
Single-Epoch Spectroscopy. [S.l.: s.n.], 2020. arXiv: 2007.02963 [astro-ph.GA].
DAMETTO, Natacha Z. et al. A SINFONI view of the nuclear activity and circumnuclear star formation in NGC 4303 - II. Spatially resolved stellarpopulations. Monthly Notices of the Royal Astronomical Society, v. 482, n. 4, p. 4437–4453, Feb. 2019. DOI: 10.1093/mnras/sty2996. arXiv:1811.01875 [astro-ph.GA].
DAVIES, Rebecca L.; KEWLEY, Lisa J.; HO, I. -Ting; DOPITA, Michael A. Starburst-AGN mixing - II. Optically selected active galaxies. Monthly
Notices of the Royal Astronomical Society, v. 444, n. 4, p. 3961–3974, Nov. 2014a. DOI: 10.1093/mnras/stu1740. arXiv: 1408.5888[astro-ph.GA].
DAVIES, Rebecca L.; RICH, Jeffrey A.; KEWLEY, Lisa J.; DOPITA, Michael A. Starburst-AGN mixing - I. NGC 7130. Monthly Notices of the Royal
Astronomical Society, v. 439, n. 4, p. 3835–3846, Apr. 2014b. DOI: 10.1093/mnras/stu234. arXiv: 1402.0493 [astro-ph.GA].
DAVIES, Rebecca L. et al. Dissecting galaxies: separating star formation, shock excitation and AGN activity in the central region of NGC 613.Monthly Notices of the Royal Astronomical Society, Oxford University Press (OUP), v. 470, n. 4, p. 4974–4988, June 2017. ISSN 1365-2966.DOI: 10.1093/mnras/stx1559. Available from: http://dx.doi.org/10.1093/mnras/stx1559.
DAVIES, Rebecca L. et al. Dissecting galaxies: spatial and spectral separation of emission excited by star formation and AGN activity. Monthly
Notices of the Royal Astronomical Society, Oxford University Press (OUP), v. 462, n. 2, p. 1616–1629, July 2016. ISSN 1365-2966. DOI:10.1093/mnras/stw1754. Available from: http://dx.doi.org/10.1093/mnras/stw1754.
DELGADO, Rosa M. Gonzalez; HECKMAN, Timothy; LEITHERER, Claus. The Nuclear and Circumnuclear Stellar Population in Seyfert 2 Galaxies:Implications for the Starburst–Active Galactic Nucleus Connection. The Astrophysical Journal, IOP Publishing, v. 546, n. 2, p. 845–865, Jan. 2001.DOI: 10.1086/318295. Available from: https://doi.org/10.10862F318295.
DENNEY, K. D. et al. THE TYPECASTING OF ACTIVE GALACTIC NUCLEI: Mrk 590 NO LONGER FITS THE ROLE. The Astrophysical Journal,IOP Publishing, v. 796, n. 2, p. 134, Nov. 2014. ISSN 1538-4357. DOI: 10.1088/0004-637x/796/2/134. Available from:http://dx.doi.org/10.1088/0004-637X/796/2/134.
DEXTER, Jason; BEGELMAN, Mitchell C. Extreme AGN variability: evidence of magnetically elevated accretion? Monthly Notices of the Royal
Astronomical Society: Letters, Oxford University Press (OUP), v. 483, n. 1, p. l17–l21, Nov. 2018. ISSN 1745-3933. DOI:10.1093/mnrasl/sly213. Available from: http://dx.doi.org/10.1093/mnrasl/sly213.
DI MATTEO, T.; SPRINGEL, V.; HERNQUIST, L. Energy input from quasars regulates the growth and activity of black holes and their host galaxies.Nature, v. 433, p. 604–607, Feb. 2005. DOI: 10.1038/nature03335. eprint: astro-ph/0502199.
DOKUCHAEV, V. I.; EROSHENKO, Yu. N.; RUBIN, S. G. Origin of supermassive black holes. arXiv e-prints, arXiv:0709.0070, arxiv:0709.0070,Sept. 2007. arXiv: 0709.0070 [astro-ph].
DOPITA, M. A. Spectral Signatures of Jet-Driven Shocks in Active Galactic Nuclei. In: HENNEY, William J.; STEFFEN, Wolfgang; BINETTE, Luc;RAGA, Alejandro (Eds.). Revista Mexicana de Astronomia y Astrofisica Conference Series. [S.l.: s.n.], June 2002. (Revista Mexicana deAstronomia y Astrofisica Conference Series), p. 177–182.
DOPITA, Michael A. et al. Probing the Physics of Narrow Line Regions in Active Galaxies. II. The Siding Spring Southern Seyfert SpectroscopicSnapshot Survey (S7). The Astrophysical Journal Supplement Series, v. 217, n. 1, 12, p. 12, Mar. 2015. DOI: 10.1088/0067-0049/217/1/12.arXiv: 1501.02022 [astro-ph.GA].
DUC, P.-A.; BRINKS, E.; SPRINGEL, V.; PICHARDO, B.; WEILBACHER, P.; MIRABEL, I. F. Formation of a Tidal Dwarf Galaxy in the InteractingSystem Arp 245 (NGC 2992/93). The Astronomical Journal, IOP Publishing, v. 120, n. 3, p. 1238–1264, Sept. 2000. DOI: 10.1086/301516.Available from: https://doi.org/10.10862F301516.
DURAS, F. et al. Universal bolometric corrections for active galactic nuclei over seven luminosity decades. Astronomy and Astrophysics, EDPSciences, v. 636, a73, Apr. 2020. ISSN 1432-0746. DOI: 10.1051/0004-6361/201936817. Available from:http://dx.doi.org/10.1051/0004-6361/201936817.
DURRET, F.; BERGERON, J. Long slit spectroscopy of emission line galaxies. I. The sample. Astronomy and Astrophysics Supplement Series,v. 75, p. 273–297, Oct. 1988.

REFERENCES 90
EDGE, D. O.; SHAKESHAFT, J. R.; MCADAM, W. B.; BALDWIN, J. E.; ARCHER, S. A survey of radio sources at a frequency of 159 Mc/s. Monthly
Notices of the Royal Astronomical Society, v. 68, p. 37–60, Jan. 1959.
EINSTEIN, A. Die Grundlage der allgemeinen Relativitatstheorie. Annalen der Physik, v. 354, n. 7, p. 769–822, Jan. 1916. DOI:10.1002/andp.19163540702.
ELITZUR, Moshe. ON THE UNIFICATION OF ACTIVE GALACTIC NUCLEI. The Astrophysical Journal, IOP Publishing, v. 747, n. 2, p. l33, Feb.2012. ISSN 2041-8213. DOI: 10.1088/2041-8205/747/2/l33. Available from: http://dx.doi.org/10.1088/2041-8205/747/2/L33.
ELITZUR, Moshe; HO, Luis C. ON THE DISAPPEARANCE OF THE BROAD-LINE REGION IN LOW-LUMINOSITY ACTIVE GALACTIC NUCLEI.The Astrophysical Journal, IOP Publishing, v. 701, n. 2, p. l91–l94, July 2009. ISSN 1538-4357. DOI: 10.1088/0004-637x/701/2/l91. Availablefrom: http://dx.doi.org/10.1088/0004-637X/701/2/L91.
ELITZUR, Moshe; HO, Luis C.; TRUMP, Jonathan R. Evolution of broad-line emission from active galactic nuclei. Monthly Notices of the Royal
Astronomical Society, v. 438, n. 4, p. 3340–3351, Mar. 2014. DOI: 10.1093/mnras/stt2445. arXiv: 1312.4922 [astro-ph.GA].
ELITZUR, Moshe; SHLOSMAN, Isaac. The AGN-obscuring Torus: The End of the “Doughnut” Paradigm? The Astrophysical Journal Letters,v. 648, n. 2, p. l101–l104, Sept. 2006. DOI: 10.1086/508158. arXiv: astro-ph/0605686 [astro-ph].
ELLISON, S. L.; PATTON, D. R.; MENDEL, J. T.; SCUDDER, J. M. Galaxy pairs in the Sloan Digital Sky Survey - IV. Interactions trigger activegalactic nuclei. Monthly Notices of the Royal Astronomical Society, v. 418, p. 2043–2053, Dec. 2011. DOI:10.1111/j.1365-2966.2011.19624.x. arXiv: 1108.2711.
ELLISON, Sara; MENDEL, J. Trevor; PATTON, David R.; SCUDDER, Jillian M. Galaxy pairs in the Sloan Digital Sky Survey - VIII. The observationalproperties of post-merger galaxies. Monthly Notices of the Royal Astronomical Society, v. 435, n. 4, p. 3627–3638, Nov. 2013. DOI:10.1093/mnras/stt1562. arXiv: 1308.3707 [astro-ph.CO].
ENGLMAIER, Peter; SHLOSMAN, Isaac. Dynamical oupling of Nested Bars: Self-gravitating Gaseous Nuclear Bars. The Astrophysical Journal,IOP Publishing, v. 617, n. 2, p. l115–l118, Nov. 2004. DOI: 10.1086/427280. Available from: https://doi.org/10.10862F427280.
ERACLEOUS, Michael; HALPERN, Jules P. NGC 3065: A Certified LINER with Broad, Variable Balmer Lines. The Astrophysical Journal, IOPPublishing, v. 554, n. 1, p. 240–244, June 2001. DOI: 10.1086/321331. Available from: https://doi.org/10.10862F321331.
ERACLEOUS, Michael; LIVIO, Mario; HALPERN, Jules P.; STORCHI-BERGMANN, Thaisa. Elliptical Accretion Disks in Active Galactic Nuclei. The
Astrophysical Journal, v. 438, p. 610, Jan. 1995. DOI: 10.1086/175104.
EVENT HORIZON TELESCOPE COLLABORATION et al. First M87 Event Horizon Telescope Results. I. The Shadow of the Supermassive BlackHole. The Astrophysical Journal Letters, v. 875, n. 1, L1, p. l1, Apr. 2019. DOI: 10.3847/2041-8213/ab0ec7. arXiv: 1906.11238 [astro-ph.GA].
FAN, Lulu; HAN, Yunkun; FANG, Guanwen; GAO, Ying; ZHANG, Dandan; JIANG, Xiaoming; WU, Qiaoqian; YANG, Jun; LI, Zhao. The MostLuminous Heavily Obscured Quasars Have a High Merger Fraction: Morphological Study of WISE-selected Hot Dust-obscured Galaxies. The
Astrophysical Journal Letters, v. 822, n. 2, L32, p. l32, May 2016. DOI: 10.3847/2041-8205/822/2/L32. arXiv: 1605.00661 [astro-ph.GA].
FARDAL, M. A.; KATZ, N.; WEINBERG, D. H.; DAVE, R. On the evolutionary history of stars and their fossil mass and light. Monthly Notices of the
Royal Astronomical Society, Oxford University Press (OUP), v. 379, n. 3, p. 985–1002, July 2007. ISSN 1365-2966. DOI:10.1111/j.1365-2966.2007.11522.x. Available from: http://dx.doi.org/10.1111/j.1365-2966.2007.11522.x.
FATH, Edward Arthur. The spectra of some spiral nebulae and globular star clusters. Lick Observatory Bulletin, v. 149, p. 71–77, Jan. 1909. DOI:10.5479/ADS/bib/1909LicOB.5.71F.
FAUSNAUGH, M. M. A New Approach to the Internal Calibration of Reverberation-Mapping Spectra. Publications of the Astronomical Society of
the Pacific, IOP Publishing, v. 129, n. 972, p. 024007, Jan. 2017. ISSN 1538-3873. DOI: 10.1088/1538-3873/129/972/024007. Available from:http://dx.doi.org/10.1088/1538-3873/129/972/024007.
FERR E-MATEU, A.; VAZDEKIS, A.; TRUJILLO, I.; S ANCHEZ-BL AZQUEZ, P.; RICCIARDELLI, E.; DE LA ROSA, I. G. Young ages and otherintriguing properties of massive compact galaxies in the local Universe. Monthly Notices of the Royal Astronomical Society, v. 423, n. 1,p. 632–646, June 2012. DOI: 10.1111/j.1365-2966.2012.20897.x. arXiv: 1203.2623 [astro-ph.CO].
FERRARESE, Laura; MERRITT, David. A Fundamental Relation between Supermassive Black Holes and Their Host Galaxies. The Astrophysical
Journal Letters, v. 539, n. 1, p. l9–l12, Aug. 2000. DOI: 10.1086/312838. arXiv: astro-ph/0006053 [astro-ph].
REFERENCES 91
FIORE, F. et al. AGN wind scaling relations and the co-evolution of black holes and galaxies. Astronomy and Astrophysics, v. 601, A143, a143,May 2017. DOI: 10.1051/0004-6361/201629478. arXiv: 1702.04507 [astro-ph.GA].
FISCHER, Travis C. et al. Hubble Space Telescope Observations of Extended [O III]λ 5007 Emission in Nearby QSO2s: New Constraints on AGNHost Galaxy Interaction. The Astrophysical Journal, v. 856, n. 2, 102, p. 102, Apr. 2018. DOI: 10.3847/1538-4357/aab03e. arXiv: 1802.06184[astro-ph.GA].
FORD, Holland C. et al. Narrowband HST Images of M87: Evidence for a Disk of Ionized Gas around a Massive Black Hole. The Astrophysical
Journal Letters, v. 435, p. l27, Nov. 1994. DOI: 10.1086/187586.
FRANK, J.; KING, A.; RAINE, D. J. Accretion Power in Astrophysics: Third Edition. [S.l.: s.n.], Jan. 2002. P. 398.
FREUND, J. How many spectral lines are statistically significant? Annalen Der Physik - ANN PHYS-BERLIN, v. 504, p. 380–385, Jan. 1992. DOI:10.1002/andp.19925040508.
FRIEDRICH, S.; DAVIES, R. I.; HICKS, E. K. S.; ENGEL, H.; MÜLLER-SÁNCHEZ, F.; GENZEL, R.; TACCONI, L. J. Adaptive optics near infraredintegral field spectroscopy of NGC 2992. Astronomy and Astrophysics, EDP Sciences, v. 519, a79, Sept. 2010. ISSN 1432-0746. DOI:10.1051/0004-6361/200913924. Available from: http://dx.doi.org/10.1051/0004-6361/200913924.
GARCA-LORENZO, B.; ARRIBAS, S.; MEDIAVILLA, E. Stellar and ionized gas kinematics of the interacting Seyfert 1.9 galaxy <ASTROBJ>NGC2992</ASTROBJ>. Astronomy and Astrophysics, v. 378, p. 787–799, Nov. 2001. DOI: 10.1051/0004-6361:20011243.
GARCIA-LORENZO, B.; ARRIBAS, F.; MEDIAVILLA, E. Stellar and ionized gas kinematics of the interacting Seyfert 1.9 galaxy <ASTROBJ>NGC2992</ASTROBJ>. Astronomy and Astrophysics, v. 378, p. 787–799, Nov. 2001. DOI: 10.1051/0004-6361:20011243.
GE, Junqiang; MAO, Shude; LU, Youjun; CAPPELLARI, Michele; YAN, Renbin. Recovering stellar population parameters via different populationmodels and stellar libraries. Monthly Notices of the Royal Astronomical Society, Oxford University Press (OUP), v. 485, n. 2, p. 1675–1693, Feb.2019. ISSN 1365-2966. DOI: 10.1093/mnras/stz418. Available from: http://dx.doi.org/10.1093/mnras/stz418.
GEBHARDT, Karl et al. A Relationship between Nuclear Black Hole Mass and Galaxy Velocity Dispersion. The Astrophysical Journal Letters,v. 539, n. 1, p. l13–l16, Aug. 2000. DOI: 10.1086/312840. arXiv: astro-ph/0006289 [astro-ph].
GENZEL, R.; SCHODEL, R.; OTT, T.; ECKART, A.; ALEXANDER, T.; LACOMBE, F.; ROUAN, D.; ASCHENBACH, B. Near-infrared flares fromaccreting gas around the supermassive black hole at the Galactic Centre. Nature, v. 425, n. 6961, p. 934–937, Oct. 2003. DOI:10.1038/nature02065. arXiv: astro-ph/0310821 [astro-ph].
GHEZ, A. M.; KLEIN, B. L.; MORRIS, M.; BECKLIN, E. E. High Proper-Motion Stars in the Vicinity of Sagittarius A*: Evidence for a SupermassiveBlack Hole at the Center of Our Galaxy. The Astrophysical Journal, v. 509, n. 2, p. 678–686, Dec. 1998. DOI: 10.1086/306528. arXiv:astro-ph/9807210 [astro-ph].
GIERLI NSKI, Marek; NIKOŁAJUK, Marek; CZERNY, Bozena. High-frequency X-ray variability as a mass estimator of stellar and supermassiveblack holes. Monthly Notices of the Royal Astronomical Society, v. 383, n. 2, p. 741–749, Jan. 2008. DOI:10.1111/j.1365-2966.2007.12584.x. arXiv: 0710.1566 [astro-ph].
GILLI, R.; MAIOLINO, R.; MARCONI, A.; RISALITI, G.; DADINA, M.; WEAVER, K. A.; COLBERT, E. J. M. The variability of the Seyfert galaxy NGC2992: the case for a revived AGN. Astronomy and Astrophysics, v. 355, p. 485–498, Mar. 2000. eprint: astro-ph/0001107.
GLIKMAN, Eilat; SIMMONS, Brooke; MAILLY, Madeline; SCHAWINSKI, Kevin; URRY, C. M.; LACY, M. Major Mergers Host the Most Luminous
Red Quasars at z 2: A Hubble Space Telescope WFC3/IR Study. [S.l.: s.n.], 2015. arXiv: 1504.02111 [astro-ph.GA].
GONZALEZ DELGADO, R. M. et al. The CALIFA survey across the Hubble sequence. Spatially resolved stellar population properties in galaxies.Astronomy and Astrophysics, v. 581, A103, a103, Sept. 2015. DOI: 10.1051/0004-6361/201525938. arXiv: 1506.04157 [astro-ph.GA].
GOOSMANN, R. W.; CZERNY, B.; MOUCHET, M.; KARAS, V.; DOVCIAK, M.; PONTI, G.; R OZA NSKA, A. Magnetic flares in Active GalacticNuclei: modeling the iron Kα line. Astronomische Nachrichten, v. 327, n. 10, p. 977–980, Dec. 2006. DOI: 10.1002/asna.200610674. arXiv:astro-ph/0611020 [astro-ph].
GRAHAM, Matthew J et al. Understanding extreme quasar optical variability with CRTS: II. Changing-state quasars. Monthly Notices of the Royal
Astronomical Society, Oxford University Press (OUP), Nov. 2019. ISSN 1365-2966. DOI: 10.1093/mnras/stz3244. Available from:http://dx.doi.org/10.1093/mnras/stz3244.

REFERENCES 92
GREENE, J. E.; ZAKAMSKA, N. L.; SMITH, P. S. A Spectacular Outflow in an Obscured Quasar. The Astrophysical Journal, v. 746, 86, p. 86,Feb. 2012. DOI: 10.1088/0004-637X/746/1/86. arXiv: 1112.3358.
GREENSTEIN, Jesse L.; SCHMIDT. The Quasi-Stellar Radio Sources 3C 48 and 3C 273. The Astrophysical Journal, v. 140, p. 1, July 1964. DOI:10.1086/147889.
GULTEKIN, Kayhan et al. The M-σ and M-L Relations in Galactic Bulges, and Determinations of Their Intrinsic Scatter. The Astrophysical
Journal, v. 698, n. 1, p. 198–221, June 2009. DOI: 10.1088/0004-637X/698/1/198. arXiv: 0903.4897 [astro-ph.GA].
GÜLTEKIN, Kayhan et al. THEM- ANDM-LRELATIONS IN GALACTIC BULGES, AND DETERMINATIONS OF THEIR INTRINSIC SCATTER. The
Astrophysical Journal, IOP Publishing, v. 698, n. 1, p. 198–221, May 2009. ISSN 1538-4357. DOI: 10.1088/0004-637x/698/1/198. Availablefrom: http://dx.doi.org/10.1088/0004-637X/698/1/198.
GUO, Hengxiao; SUN, Mouyuan; LIU, Xin; WANG, Tinggui; KONG, Minzhi; WANG, Shu; SHENG, Zhenfeng; HE, Zhicheng. Discovery of an Mg IIChanging-look Active Galactic Nucleus and Its Implications for a Unification Sequence of Changing-look Active Galactic Nuclei. The Astrophysical
Journal Letters, v. 883, n. 2, L44, p. l44, Oct. 2019. DOI: 10.3847/2041-8213/ab4138. arXiv: 1908.00072 [astro-ph.GA].
GUOLO-PEREIRA, Muryel; RUSCHEL-DUTRA, Daniel; STORCHI-BERGMANN, Thaisa; SCHNORR-MÜLLER, Allan; CID FERNANDES, Roberto;COUTO, Guilherme; DAMETTO, Natacha; HERNANDEZ-JIMENEZ, Jose A. Exploring the AGN-merger connection in Arp 245 I: Nuclear starformation and gas outflow in NGC 2992. Monthly Notices of the Royal Astronomical Society, v. 502, n. 3, p. 3618–3637, Apr. 2021. DOI:10.1093/mnras/stab245. arXiv: 2101.10875 [astro-ph.GA].
HAARDT, Francesco; MARASCHI, Laura; GHISELLINI, Gabriele. A Model for the X-Ray and Ultraviolet Emission from Seyfert Galaxies andGalactic Black Holes. The Astrophysical Journal Letters, v. 432, p. l95, Sept. 1994. DOI: 10.1086/187520. arXiv: astro-ph/9405059[astro-ph].
HAZARD, C.; MACKEY, M. B.; SHIMMINS, A. J. Investigation of the Radio Source 3C 273 By The Method of Lunar Occultations. Nature, v. 197,n. 4872, p. 1037–1039, Mar. 1963. DOI: 10.1038/1971037a0.
HEY, J. S.; PARSONS, S. J.; PHILLIPS, J. W. Fluctuations in Cosmic Radiation at Radio-Frequencies. Nature, v. 158, n. 4007, p. 234, Aug. 1946.DOI: 10.1038/158234a0.
HOPKINS, Andrew M.; BEACOM, John F. On the Normalization of the Cosmic Star Formation History. The Astrophysical Journal, IOP Publishing,v. 651, n. 1, p. 142–154, Nov. 2006. DOI: 10.1086/506610. Available from: https://doi.org/10.10862F506610.
HOPKINS, P.; HERNQUIST, L.; COX; KERES, Duvsan. A Cosmological Framework for the Co-Evolution of Quasars, Supermassive Black Holes,and Elliptical Galaxies. I. Galaxy Mergers and Quasar Activity. The Astrophysical Journal Supplement Series, v. 175, n. 2, p. 356–389, Apr.2008. DOI: 10.1086/524362. arXiv: 0706.1243 [astro-ph].
HOPKINS, Philip F.; ELVIS, Martin. Quasar feedback: more bang for your buck. Monthly Notices of the Royal Astronomical Society, v. 401, n. 1,p. 7–14, Jan. 2010. DOI: 10.1111/j.1365-2966.2009.15643.x. arXiv: 0904.0649 [astro-ph.CO].
HUBBLE, E. P. Extragalactic nebulae. The Astrophysical Journal, v. 64, p. 321–369, Dec. 1926. DOI: 10.1086/143018.
HUMIRE, Pedro K. et al. An outflow in the Seyfert ESO 362-G18 revealed by Gemini-GMOS/IFU observations. Astronomy and Astrophysics,v. 614, A94, a94, June 2018. DOI: 10.1051/0004-6361/201731671. arXiv: 1802.07853 [astro-ph.GA].
IRWIN, Judith A. et al. CHANG-ES - VIII. Uncovering hidden AGN activity in radio polarization. Monthly Notices of the Royal Astronomical
Society, v. 464, n. 2, p. 1333–1346, Jan. 2017. DOI: 10.1093/mnras/stw2414. arXiv: 1609.07609 [astro-ph.GA].
ISHIBASHI, W.; FABIAN, A. C. Active galactic nucleus feedback and triggering of star formation in galaxies. Monthly Notices of the Royal
Astronomical Society, v. 427, n. 4, p. 2998–3005, Dec. 2012. DOI: 10.1111/j.1365-2966.2012.22074.x. arXiv: 1209.1480 [astro-ph.GA].
JIANG, Yan-Fei; BLAES, Omer. Opacity-driven Convection and Variability in Accretion Disks around Supermassive Black Holes. The
Astrophysical Journal, American Astronomical Society, v. 900, n. 1, p. 25, July 2020. ISSN 1538-4357. DOI: 10.3847/1538-4357/aba4b7.Available from: http://dx.doi.org/10.3847/1538-4357/aba4b7.
KALBERLA, P. M. W.; BURTON, W. B.; HARTMANN, Dap; ARNAL, E. M.; BAJAJA, E.; MORRAS, R.; POPPEL, W. G. L. TheLeiden/Argentine/Bonn (LAB) Survey of Galactic HI. Final data release of the combined LDS and IAR surveys with improved stray-radiation

REFERENCES 93
corrections. Astronomy and Astrophysics, v. 440, n. 2, p. 775–782, Sept. 2005. DOI: 10.1051/0004-6361:20041864. arXiv: astro-ph/0504140[astro-ph].
KASPI, Shai; SMITH, Paul S.; NETZER, Hagai; MAOZ, Dan; JANNUZI, Buell T.; GIVEON, Uriel. Reverberation Measurements for 17 Quasars andthe Size-Mass-Luminosity Relations in Active Galactic Nuclei. The Astrophysical Journal, v. 533, n. 2, p. 631–649, Apr. 2000. DOI:10.1086/308704. arXiv: astro-ph/9911476 [astro-ph].
KASPI, Shai et al. The Ionized Gas and Nuclear Environment in NGC 3783. I. Time-averaged 900 KilosecondChandraGrating Spectroscopy. The
Astrophysical Journal, American Astronomical Society, v. 574, n. 2, p. 643–662, July 2002. ISSN 1538-4357. DOI: 10.1086/341113. Availablefrom: http://dx.doi.org/10.1086/341113.
KAUFFMANN, G. et al. The host galaxies of active galactic nuclei. Monthly Notices of the Royal Astronomical Society, v. 346, n. 4,p. 1055–1077, Dec. 2003. DOI: 10.1111/j.1365-2966.2003.07154.x. arXiv: astro-ph/0304239 [astro-ph].
KERR, Roy P. Gravitational Field of a Spinning Mass as an Example of Algebraically Special Metrics. Physical Review Letters, v. 11, n. 5,p. 237–238, Sept. 1963. DOI: 10.1103/PhysRevLett.11.237.
KEWLEY, L.; DOPITA, M. A.; SUTHERLAND, R. S.; HEISLER, C. A.; TREVENA, J. Theoretical Modeling of Starburst Galaxies. The Astrophysical
Journal, v. 556, p. 121–140, July 2001. DOI: 10.1086/321545. eprint: astro-ph/0106324.
KEWLEY, L.; GROVES, Brent; KAUFFMANN, Guinevere; HECKMAN, Tim. The host galaxies and classification of active galactic nuclei. Monthly
Notices of the Royal Astronomical Society, v. 372, n. 3, p. 961–976, Nov. 2006. DOI: 10.1111/j.1365-2966.2006.10859.x. arXiv:astro-ph/0605681 [astro-ph].
KNAPEN, J. H. Gravitationally Induced Inflow in Starbursts and Agn. Astrophysics and Space Science, v. 295, n. 1-2, p. 85–94, Jan. 2005. DOI:10.1007/s10509-005-3664-3.
KOLEVA, M.; PRUGNIEL, Ph.; OCVIRK, P.; LE BORGNE, D.; SOUBIRAN, C. Spectroscopic ages and metallicities of stellar populations: validationof full spectrum fitting. Monthly Notices of the Royal Astronomical Society, v. 385, n. 4, p. 1998–2010, Apr. 2008. DOI:10.1111/j.1365-2966.2008.12908.x. arXiv: 0801.0871 [astro-ph].
KOLLATSCHNY, W.; GRUPE, D.; PARKER, M. L.; OCHMANN, M. W.; SCHARTEL, N.; HERWIG, E.; KOMOSSA, S.; ROMERO-COLMENERO, E.;SANTOS-LLEO, M. Optical and X-ray discovery of the changing-look AGN IRAS 23226-3843 showing extremely broad and double-peaked Balmerprofiles. Astronomy and Astrophysics, EDP Sciences, v. 638, a91, June 2020. ISSN 1432-0746. DOI: 10.1051/0004-6361/202037897. Availablefrom: http://dx.doi.org/10.1051/0004-6361/202037897.
KOLLATSCHNY, W.; OCHMANN, M. W.; ZETZL, M.; HAAS, M.; CHELOUCHE, D.; KASPI, S.; POZO NUÑEZ, F.; GRUPE, D. Broad-line regionstructure and line profile variations in the changing look AGN HE 1136-2304. Astronomy and Astrophysics, EDP Sciences, v. 619, a168, Nov.2018. ISSN 1432-0746. DOI: 10.1051/0004-6361/201833727. Available from: http://dx.doi.org/10.1051/0004-6361/201833727.
KORATKAR, Anuradha; BLAES, Omer. Invited Review: The Ultraviolet and Optical Continuum Emission in Active Galactic Nuclei: The Status ofAccretion Disks. Publications of the Astronomical Society of the Pacific, IOP Publishing, v. 111, n. 755, p. 1–30, Jan. 1999. DOI:10.1086/316294. Available from: https://doi.org/10.10862F316294.
KORMENDY, John; RICHSTONE, Douglas. Inward Bound—The Search For Supermassive Black Holes In Galactic Nuclei. Annual Review of
Astronomy and Astrophysics, v. 33, p. 581, Jan. 1995. DOI: 10.1146/annurev.aa.33.090195.003053.
KOSKI, A. T. Spectrophotometry of Seyfert 2 galaxies and narrow-line radio galaxies. The Astrophysical Journal, v. 223, p. 56–73, July 1978. DOI:10.1086/156235.
KOSS, Michael; MUSHOTZKY, Richard; VEILLEUX, Sylvain; WINTER, Lisa. Merging and Clustering of the Swift BAT AGN Sample. The
Astrophysical Journal Letters, v. 716, n. 2, p. l125–l130, June 2010. DOI: 10.1088/2041-8205/716/2/L125. arXiv: 1006.0228 [astro-ph.CO].
LAMASSA, Stephanie M.; CALES, Sabrina; MORAN, Edward C.; MYERS, Adam D.; RICHARDS, Gordon T.; ERACLEOUS, Michael;HECKMAN, Timothy M.; GALLO, Luigi; URRY, C. Megan. The discovery of the first "changing look" Quasar: New insights into the physics andphenomenology of active galactic nuclei. Astrophysical Journal, IOP Publishing, v. 800, n. 2, p. 144, 2015. ISSN 15384357. DOI:10.1088/0004-637X/800/2/144. Available from: http://dx.doi.org/10.1088/0004-637X/800/2/144.
LAMPTON, M.; MARGON, B.; BOWYER, S. Parameter estimation in X-ray astronomy. The Astrophysical Journal, v. 208, p. 177–190, Aug. 1976.DOI: 10.1086/154592.

REFERENCES 94
LANZ, L.; OGLE, P. M.; EVANS, D.; APPLETON, P. N.; GUILLARD, P.; EMONTS, B. JET-ISM INTERACTION IN THE RADIO GALAXY 3C 293:JET-DRIVEN SHOCKS HEAT ISM TO POWER X-RAY AND MOLECULAR H2EMISSION. The Astrophysical Journal, IOP Publishing, v. 801, n. 1,p. 17, Feb. 2015. ISSN 1538-4357. DOI: 10.1088/0004-637x/801/1/17. Available from: http://dx.doi.org/10.1088/0004-637X/801/1/17.
LASOTA, J. -P.; ABRAMOWICZ, M. A.; CHEN, X.; KROLIK, J.; NARAYAN, R.; YI, I. Is the Accretion Flow in NGC 4258 Advection Dominated? The
Astrophysical Journal, v. 462, p. 142, May 1996. DOI: 10.1086/177137. arXiv: astro-ph/9510083 [astro-ph].
LE BORGNE, J.-F.; BRUZUAL, G.; PELL O, R.; LANÇON, A.; ROCCA-VOLMERANGE, B.; SANAHUJA, B.; SCHAERER, D.; SOUBIRAN, C.; VILCHEZ-G OMEZ, R. STELIB: A library of stellar spectra at R ˜ 2000. Astronomy and Astrophysics, v. 402, p. 433–442, May 2003. DOI:10.1051/0004-6361:20030243. eprint: astro-ph/0302334.
LENA, D.; ROBINSON, A.; STORCHI-BERGMAN, T.; SCHNORR-MULLER, A.; SEELIG, T.; RIFFEL, R. A.; NAGAR, N. M.; COUTO, G. S.;SHADLER, L. The Complex Gas Kinematics in the Nucleus of the Seyfert 2 Galaxy NGC 1386: Rotation, Outflows, and Inflows. The Astrophysical
Journal, v. 806, n. 1, 84, p. 84, June 2015. DOI: 10.1088/0004-637X/806/1/84. arXiv: 1504.05089 [astro-ph.GA].
LIU, Hao; WU, Qingwen; LYU, Bing; YAN, Zhen. Evidence for changing-look AGNs is caused by change of accretion mode. [S.l.: s.n.], 2019.arXiv: 1912.03972 [astro-ph.GA].
LUMSDEN, S. L.; ALEXANDER, D. M. The infrared luminosity of the torus and the visibility of scattered broad line emission in Seyfert 2 galaxies.Monthly Notices of the Royal Astronomical Society, v. 328, n. 3, p. l32–l36, Dec. 2001. DOI: 10.1046/j.1365-8711.2001.05074.x. arXiv:astro-ph/0110174 [astro-ph].
LYNDEN-BELL, D. Galactic Nuclei as Collapsed Old Quasars. Nature, v. 223, n. 5207, p. 690–694, Aug. 1969. DOI: 10.1038/223690a0.
MACCACARO, T.; PEROLA, G. C.; ELVIS, M. X-ray observations with the EINSTEIN OBSERVATORY of emission-line galaxies. The Astrophysical
Journal, v. 257, p. 47–55, June 1982. DOI: 10.1086/159961.
MACLEOD, Chelsea L. et al. A systematic search for changing-look quasars in SDSS. Monthly Notices of the Royal Astronomical Society,v. 457, n. 1, p. 389–404, Mar. 2016. DOI: 10.1093/mnras/stv2997. arXiv: 1509.08393 [astro-ph.GA].
MAGORRIAN, John et al. The Demography of Massive Dark Objects in Galaxy Centers. The Astronomical Journal, v. 115, n. 6, p. 2285–2305,June 1998. DOI: 10.1086/300353. arXiv: astro-ph/9708072 [astro-ph].
MAKSYM, W. P.; ULMER, M. P.; ROTH, K. C.; IRWIN, J. A.; DUPKE, R.; HO, L. C.; KEEL, W. C.; ADAMI, C. Deep spectroscopy of the MV ∼ -14.8host galaxy of a tidal disruption flare in A1795. Monthly Notices of the Royal Astronomical Society, v. 444, n. 1, p. 866–873, Oct. 2014. DOI:10.1093/mnras/stu1485. arXiv: 1407.6737 [astro-ph.HE].
MALLMANN, Nícolas Dullius et al. The first 62 AGN observed with SDSS-IV MaNGA – II. Resolvedstellar populations. Monthly Notices of the
Royal Astronomical Society, Oxford University Press (OUP), v. 478, n. 4, p. 5491–5504, May 2018. ISSN 1365-2966. DOI:10.1093/mnras/sty1364. Available from: http://dx.doi.org/10.1093/mnras/sty1364.
MARASTON, C.; STROMBACK, G. Stellar population models at high spectral resolution. Monthly Notices of the Royal Astronomical Society,v. 418, n. 4, p. 2785–2811, Dec. 2011. DOI: 10.1111/j.1365-2966.2011.19738.x. arXiv: 1109.0543 [astro-ph.CO].
MARCHESE, E.; BRAITO, V.; DELLA CECA, R.; CACCIANIGA, A.; SEVERGNINI, P. NGC 454: unveiling a new ’changing look’ active galacticnucleus. Monthly Notices of the Royal Astronomical Society, v. 421, n. 2, p. 1803–1812, Apr. 2012. DOI: 10.1111/j.1365-2966.2012.20445.x.arXiv: 1201.2169 [astro-ph.CO].
MARCONI, A.; RISALITI, G.; GILLI, R.; HUNT, L. K.; MAIOLINO, R.; SALVATI, M. Local supermassive black holes, relics of active galactic nucleiand the X-ray background. Monthly Notices of the Royal Astronomical Society, v. 351, n. 1, p. 169–185, June 2004. DOI:10.1111/j.1365-2966.2004.07765.x. arXiv: astro-ph/0311619 [astro-ph].
MARIN, F. Unveiling the physics behind the spectral variations of changing-look quasars with optical polarimetry. Astronomy and Astrophysics,EDP Sciences, v. 607, a40, Nov. 2017. ISSN 1432-0746. DOI: 10.1051/0004-6361/201731726. Available from:http://dx.doi.org/10.1051/0004-6361/201731726.
MARINUCCI, A.; BIANCHI, S.; BRAITO, V.; MATT, G.; NARDINI, E.; REEVES, J. Tracking the iron K α line and the ultra fast outflow in NGC 2992 atdifferent accretion states. Monthly Notices of the Royal Astronomical Society, v. 478, n. 4, p. 5638–5649, Aug. 2018. DOI:10.1093/mnras/sty1436. arXiv: 1805.12149 [astro-ph.HE].

REFERENCES 95
MARINUCCI, A.; BIANCHI, Stefano; NICASTRO, Fabrizio; MATT, Giorgio; GOULDING, Andy D. The Link between the Hidden Broad Line Regionand the Accretion Rate in Seyfert 2 Galaxies. The Astrophysical Journal, v. 748, n. 2, 130, p. 130, Apr. 2012. DOI:10.1088/0004-637X/748/2/130. arXiv: 1201.5397 [astro-ph.CO].
MARINUCCI, Andrea; RISALITI, Guido; WANG, Junfeng; BIANCHI, Stefano; ELVIS, Martin; MATT, Giorgio; NARDINI, Emanuele;BRAITO, Valentina. X-ray absorption variability in NGC 4507. Monthly Notices of the Royal Astronomical Society, Oxford University Press(OUP), v. 429, n. 3, p. 2581–2586, Jan. 2013. ISSN 0035-8711. DOI: 10.1093/mnras/sts534. Available from:http://dx.doi.org/10.1093/mnras/sts534.
MARINUCCI; BIANCHI, S.; BRAITO, V.; DE MARCO, B.; MATT, G.; MIDDEI, R.; NARDINI, E.; REEVES, J. N. The lively accretion disk in NGC2992. I. Transient iron K emission lines in the high flux state. Monthly Notices of the Royal Astronomical Society, staa1683, June 2020. arXiv:2006.05280. ISSN 0035-8711, 1365-2966. DOI: 10.1093/mnras/staa1683. Available from: http://arxiv.org/abs/2006.05280. Visited on: 15July 2020.
MARQUEZ, I.; BOISSON, C.; DURRET, F.; PETITJEAN, P. A kinematical analysis of NGC 2992. Astronomy and Astrophysics, v. 333,p. 459–465, May 1998. arXiv: astro-ph/9802029 [astro-ph].
MATT, G.; GUAINAZZI, M.; MAIOLINO, R. Changing look: from Compton-thick to Compton-thin, or the rebirth of fossil active galactic nuclei.Monthly Notices of the Royal Astronomical Society, Oxford University Press (OUP), v. 342, n. 2, p. 422–426, June 2003. ISSN 1365-2966. DOI:10.1046/j.1365-8711.2003.06539.x. Available from: http://dx.doi.org/10.1046/j.1365-8711.2003.06539.x.
MCELROY, R. E. et al. The Close AGN Reference Survey (CARS). Mrk 1018 returns to the shadows after 30 years as a Seyfert 1. Astronomy and
Astrophysics, v. 593, L8, p. l8, Sept. 2016. DOI: 10.1051/0004-6361/201629102. arXiv: 1609.04423 [astro-ph.GA].
MCELROY, Rebecca; CROOM, Scott M.; PRACY, Michael; SHARP, Rob; HO, I. -Ting; MEDLING, Anne M. IFU observations of luminous type IIAGN - I. Evidence for ubiquitous winds. Monthly Notices of the Royal Astronomical Society, v. 446, n. 2, p. 2186–2204, Jan. 2015. DOI:10.1093/mnras/stu2224. arXiv: 1410.6552 [astro-ph.GA].
MEHDIPOUR, M. et al. Anatomy of the AGN in NGC 5548. Astronomy & Astrophysics, EDP Sciences, v. 575, a22, Feb. 2015. ISSN 1432-0746.DOI: 10.1051/0004-6361/201425373. Available from: http://dx.doi.org/10.1051/0004-6361/201425373.
MENCI, N.; GATTI, M.; FIORE, F.; LAMASTRA, A. Triggering active galactic nuclei in hierarchical galaxy formation: disk instability vs. interactions.Astronomy and Astrophysics, v. 569, A37, a37, Sept. 2014. DOI: 10.1051/0004-6361/201424217. arXiv: 1406.7740 [astro-ph.GA].
MENEZES, R. B.; STEINER, J. E.; RICCI, T. V. A treatment procedure for Gemini North/NIFS data cubes: application to NGC 4151. Monthly
Notices of the Royal Astronomical Society, v. 438, p. 2597–2620, Mar. 2014. DOI: 10.1093/mnras/stt2381. arXiv: 1401.7078 [astro-ph.IM].
MENTZ, J. J. et al. Abundance ratios and IMF slopes in the dwarf elliptical galaxy NGC 1396 with MUSE. Monthly Notices of the Royal
Astronomical Society, v. 463, n. 3, p. 2819–2838, Dec. 2016. DOI: 10.1093/mnras/stw2129. arXiv: 1608.07042 [astro-ph.GA].
MINGOZZI, M. et al. The MAGNUM survey: different gas properties in the outflowing and disc components in nearby active galaxies with MUSE.Astronomy and Astrophysics, v. 622, A146, a146, Feb. 2019. DOI: 10.1051/0004-6361/201834372. arXiv: 1811.07935 [astro-ph.GA].
MORRISON, R.; MCCAMMON, D. Interstellar photoelectric absorption cross sections, 0.03-10 keV. The Astrophysical Journal, v. 270,p. 119–122, July 1983. DOI: 10.1086/161102.
MULLER-SANCHEZ, F.; PRIETO, M. A.; HICKS, E. K. S.; VIVES-ARIAS, H.; DAVIES, R. I.; MALKAN, M.; TACCONI, L. J.; GENZEL, R. Outflowsfrom Active Galactic Nuclei: Kinematics of the Narrow-line and Coronal-line Regions in Seyfert Galaxies. The Astrophysical Journal, v. 739, 69,p. 69, Oct. 2011. DOI: 10.1088/0004-637X/739/2/69. arXiv: 1107.3140.
MURPHY, K. D.; NOWAK, M. A.; MARSHALL, H. L. The Nuclear X-Ray Emission-line Structure in NGC 2992 Revealed by Chandra-HETGS. The
Astrophysical Journal, v. 840, n. 2, 120, p. 120, May 2017. DOI: 10.3847/1538-4357/aa6d6a.
MURPHY, K. D.; YAQOOB, Tahir; TERASHIMA, Yuichi. Monitoring the Violent Activity from the Inner Accretion Disk of the Seyfert 1.9 Galaxy NGC2992 withRXTE. The Astrophysical Journal, IOP Publishing, v. 666, n. 1, p. 96–108, Sept. 2007. ISSN 1538-4357. DOI: 10.1086/520039.Available from: http://dx.doi.org/10.1086/520039.
MUSHOTZKY, R. F. The X-ray spectrum and time variability of narrow emission line galaxies. The Astrophysical Journal, v. 256, p. 92–102, May1982. DOI: 10.1086/159886.

REFERENCES 96
NANDRA, K. On the origin of the iron K line cores in active galactic nuclei. Monthly Notices of the Royal Astronomical Society: Letters, OxfordUniversity Press (OUP), v. 368, n. 1, p. l62–l66, May 2006. ISSN 1745-3933. DOI: 10.1111/j.1745-3933.2006.00158.x. Available from:http://dx.doi.org/10.1111/j.1745-3933.2006.00158.x.
NANDRA, K.; O’NEILL, P. M.; GEORGE, I. M.; REEVES, J. N. An XMM-Newton survey of broad iron lines in Seyfert galaxies. Monthly Notices of
the Royal Astronomical Society, v. 382, n. 1, p. 194–228, Nov. 2007. DOI: 10.1111/j.1365-2966.2007.12331.x. arXiv: 0708.1305 [astro-ph].
NANDRA, K.; POUNDS, K. A. GINGA observations of the X-ray spectra of Seyfert galaxies. Monthly Notices of the Royal Astronomical Society,v. 268, p. 405–429, May 1994. DOI: 10.1093/mnras/268.2.405.
NELSON, Charles H.; WHITTLE, Mark. Stellar and Gaseous Kinematics of Seyfert Galaxies. I. Spectroscopic Data. The Astrophysical Journal
Supplement Series, v. 99, p. 67, July 1995. DOI: 10.1086/192179.
NEMMEN, Rodrigo S.; STORCHI-BERGMANN, Thaisa; YUAN, Feng; ERACLEOUS, Michael; TERASHIMA, Yuichi; WILSON, Andrew S.Radiatively Inefficient Accretion Flow in the Nucleus of NGC 1097. The Astrophysical Journal, v. 643, n. 2, p. 652–659, June 2006. DOI:10.1086/500571. arXiv: astro-ph/0512540 [astro-ph].
NENKOVA, Maia; SIROCKY, Matthew M.; NIKUTTA, Robert; IVEZI C, Željko; ELITZUR, Moshe. AGN Dusty Tori. II. Observational Implications ofClumpiness. The Astrophysical Journal, v. 685, n. 1, p. 160–180, Sept. 2008. DOI: 10.1086/590483. arXiv: 0806.0512 [astro-ph].
[S.l.]. Active Galactic Nuclei. [S.l.: s.n.], Jan. 1990.
NICASTRO, Fabrizio. Broad Emission Line Regions in Active Galactic Nuclei: The Link with the Accretion Power. The Astrophysical Journal, IOPPublishing, v. 530, n. 2, p. l65–l68, Feb. 2000. ISSN 0004-637X. DOI: 10.1086/312491. Available from: http://dx.doi.org/10.1086/312491.
NICASTRO, Fabrizio; MATHUR, S.; KRONGOLD, Y. When a Seyfert. . . ...has a Crash on a Model. [S.l.]: Zenodo, Oct. 2018. DOI:10.5281/zenodo.1473677. Available from: https://doi.org/10.5281/zenodo.1473677.
O’DEA, C. P.; BAUM, S. A.; TREMBLAY, G. R.; KHARB, P.; COTTON, W.; PERLEY, R. Hubble Space Telescope Observations of Dusty Filaments inHercules A: Evidence for Entrainment. The Astrophysical Journal, v. 771, n. 1, 38, p. 38, July 2013. DOI: 10.1088/0004-637X/771/1/38. arXiv:1305.4935 [astro-ph.CO].
OKNYANSKY, V. L.; WINKLER, H.; TSYGANKOV, S. S.; LIPUNOV, V. M.; GORBOVSKOY, E. S.; VAN WYK, F.; BUCKLEY, D. A. H.; TYURINA, N. V.New changing look case in NGC 1566. Monthly Notices of the Royal Astronomical Society, v. 483, n. 1, p. 558–564, Feb. 2019. DOI:10.1093/mnras/sty3133. arXiv: 1811.06926 [astro-ph.GA].
OOSTERLOO, T. A.; MORGANTI, R. Anomalous HI kinematics in Centaurus A: Evidence for jet-induced star formation. Astronomy and
Astrophysics, v. 429, p. 469–475, Jan. 2005. DOI: 10.1051/0004-6361:20041379. arXiv: astro-ph/0409500 [astro-ph].
OSMER, P. S.; SMITH, M. G.; WEEDMAN, D. W. The nuclei of peculiar emission-line galaxies. The Astrophysical Journal, v. 192, p. 279–291,Sept. 1974. DOI: 10.1086/153058.
OSTERBROCK, D.; FERLAND, G. Astrophysics of gaseous nebulae and active galactic nuclei. [S.l.: s.n.], 2006.
OSTERBROCK, D. E. Seyfert galaxies with weak broad H alpha emission lines. The Astrophysical Journal, v. 249, p. 462–470, Oct. 1981. DOI:10.1086/159306.
PAN, Hsi-An et al. SDSS-IV MaNGA: Spatial Evolution of Star Formation Triggered by Galaxy Interactions. The Astrophysical Journal, v. 881,n. 2, 119, p. 119, Aug. 2019. DOI: 10.3847/1538-4357/ab311c. arXiv: 1907.04491 [astro-ph.GA].
PASTORIZA, M.; GEROLA, H. Spectral Variation in the Seyfert Galaxy NGC 1566. The Astrophysical Journal Letters, v. 6, p. 155, July 1970.
PENROSE, Roger. Gravitational Collapse and Space-Time Singularities. Physics Review Letters, v. 14, n. 3, p. 57–59, Jan. 1965. DOI:10.1103/PhysRevLett.14.57.
PETERSON, B. M.; HORNE, K. Echo mapping of active galactic nuclei. Astronomische Nachrichten, Wiley, v. 325, n. 3, p. 248–251, Mar. 2004.ISSN 1521-3994. DOI: 10.1002/asna.200310207. Available from: http://dx.doi.org/10.1002/asna.200310207.

REFERENCES 97
PETERSON, B. M. et al. Steps toward Determination of the Size and Structure of the Broad-Line Region in Active Galactic Nuclei. XVI. A 13 YearStudy of Spectral Variability in NGC 5548. The Astrophysical Journal, American Astronomical Society, v. 581, n. 1, 2002. ISSN 1538-4357. DOI:10.1086/344197. Available from: http://dx.doi.org/10.1086/344197.
PETERSON, Bradley M. Reverberation Mapping of Active Galactic Nuclei. Publications of the Astronomical Society of the Pacific, v. 105,p. 247, Mar. 1993. DOI: 10.1086/133140.
PETERSON, Bradley M.; POGGE, Richard W.; WANDERS, Ignaz; SMITH, Sean M.; ROMANISHIN, W. Aperture Effects and Limitations on theAccuracy of Ground-Based Spectrophotometry of Active Galactic Nuclei. Publications of the Astronomical Society of the Pacific, IOPPublishing, v. 107, p. 579, June 1995. DOI: 10.1086/133595. Available from: https://doi.org/10.10862F133595.
PETRUCCI, P. O. et al. A rapidly variable narrow X-ray iron line in Mkn 841. Astronomy and Astrophysics, v. 388, p. l5–l8, June 2002. DOI:10.1051/0004-6361:20020534. arXiv: astro-ph/0204095 [astro-ph].
PONTI, G.; PAPADAKIS, I.; BIANCHI, S.; GUAINAZZI, M.; MATT, G.; UTTLEY, P.; BONILLA, N. F. CAIXA: a catalogue of AGN in the XMM-Newtonarchive. III. Excess variance analysis. Astronomy and Astrophysics, v. 542, A83, a83, June 2012. DOI: 10.1051/0004-6361/201118326. arXiv:1112.2744 [astro-ph.HE].
POSSOLO, Antonio; MERKATAS, Christos; BODNAR, Olha. Asymmetrical uncertainties. Metrologia, IOP Publishing, v. 56, n. 4, p. 045009, July2019. DOI: 10.1088/1681-7575/ab2a8d. Available from: https://doi.org/10.10882F1681-75752Fab2a8d.
PROXAUF, B.; OTTL, S.; KIMESWENGER, S. Upgrading electron temperature and electron density diagnostic diagrams of forbidden line emission.Astronomy and Astrophysics, v. 561, A10, a10, Jan. 2014. DOI: 10.1051/0004-6361/201322581. arXiv: 1311.5041 [astro-ph.IM].
PTAK, A.; TERASHIMA, Y.; HO, L. C.; QUATAERT, E. Testing Radiatively Inefficient Accretion Flow Theory: An XMM-Newton Observation of NGC3998. The Astrophysical Journal, v. 606, n. 1, p. 173–184, May 2004. DOI: 10.1086/382940. arXiv: astro-ph/0401524 [astro-ph].
PTAK, A.; YAQOOB, T.; MURPHY, K.; SUZAKU NGC 2992 TEAM. Precision Fe Kalpha and Fe Kbeta Line Spectroscopy of the Seyfert 1.9 GalaxyNGC 2992 with Suzaku. Progress of Theoretical Physics Supplement, v. 169, p. 252–255, Jan. 2007. DOI: 10.1143/PTPS.169.252. arXiv:astro-ph/0609581 [astro-ph].
PUCCETTI, S.; FIORE, F.; RISALITI, G.; CAPALBI, M.; ELVIS, M.; NICASTRO, F. Rapid NH changes in NGC 4151. Monthly Notices of the Royal
Astronomical Society, v. 377, n. 2, p. 607–616, May 2007. DOI: 10.1111/j.1365-2966.2007.11634.x. arXiv: astro-ph/0612021 [astro-ph].
QIAO, Erlin; LIU, B. F. A MODEL FOR THE CORRELATION OF HARD X-RAY INDEX WITH EDDINGTON RATIO IN BLACK HOLE X-RAYBINARIES. The Astrophysical Journal, IOP Publishing, v. 764, n. 1, p. 2, Jan. 2013. ISSN 1538-4357. DOI: 10.1088/0004-637x/764/1/2.Available from: http://dx.doi.org/10.1088/0004-637X/764/1/2.
QUATAERT, Eliot; NARAYAN, Ramesh. Spectral Models of Advection-dominated Accretion Flows with Winds. The Astrophysical Journal, v. 520,n. 1, p. 298–315, July 1999. DOI: 10.1086/307439. arXiv: astro-ph/9810136 [astro-ph].
RAIMANN, D.; STORCHI-BERGMANN, T.; GONZ ALEZ DELGADO, R. M.; CID FERNANDES, R.; HECKMAN, T.; LEITHERER, C.; SCHMITT, H.Stellar population gradients in Seyfert 2 galaxies: northern sample. Monthly Notices of the Royal Astronomical Society, v. 339, p. 772–792, Mar.2003. DOI: 10.1046/j.1365-8711.2003.06222.x. eprint: astro-ph/0210635.
REVALSKI, M. et al. Quantifying Feedback from Narrow Line Region Outflows in Nearby Active Galaxies. II. Spatially Resolved Mass Outflow Ratesfor the QSO2 Markarian 34. The Astrophysical Journal, American Astronomical Society, v. 867, n. 2, p. 88, Nov. 2018. ISSN 1538-4357. DOI:10.3847/1538-4357/aae3e6. Available from: http://dx.doi.org/10.3847/1538-4357/aae3e6.
RICCI, C.; UEDA, Y.; PALTANI, S.; ICHIKAWA, K.; GAND HI, P.; AWAKI, H. Iron Kα emission in type-I and type-II active galactic nuclei. Monthly
Notices of the Royal Astronomical Society, v. 441, n. 4, p. 3622–3633, July 2014. DOI: 10.1093/mnras/stu735. arXiv: 1405.7575[astro-ph.GA].
RICCI, Claudio. Active Galactic Nuclei at hard X-ray energies: absorption, reflection and the unified model. Dec. 2011. PhD thesis. ID:unige:19474. Available from: https://nbn-resolving.org/urn:nbn:ch:unige-194749.
RICH, J. A.; KEWLEY, L. J.; DOPITA, M. A. GALAXY MERGERS DRIVE SHOCKS: AN INTEGRAL FIELD STUDY OF GOALS GALAXIES. The
Astrophysical Journal Supplement Series, IOP Publishing, v. 221, n. 2, p. 28, Dec. 2015. ISSN 1538-4365. DOI: 10.1088/0067-0049/221/2/28.Available from: http://dx.doi.org/10.1088/0067-0049/221/2/28.

REFERENCES 98
RICH, J. A.; KEWLEY, L. J.; DOPITA, M. A. Galaxy-wide Shocks in Late-merger Stage Luminous Infrared Galaxies. The Astrophysical Journal,v. 734, n. 2, 87, p. 87, June 2011. DOI: 10.1088/0004-637X/734/2/87. arXiv: 1104.1177 [astro-ph.CO].
RIFFEL; PASTORIZA; RODRIGUEZ-ARDILA; MARASTON. The First Detection of Near-Infrared CN Bands in Active Galactic Nuclei: Signature ofStar Formation. The Astrophysical Journal, IOP Publishing, v. 659, n. 2, p. l103–l106, Mar. 2007. DOI: 10.1086/517999. Available from:https://doi.org/10.10862F517999.
RIFFEL, R.; PASTORIZA, M.; RODRIGUEZ-ARDILA, Alberto; BONATTO, Charles. Probing the stellar population of seyfert galaxies: a near infraredperspective. In: BRUZUAL, Gustavo R.; CHARLOT, Stephane (Eds.). Stellar Populations - Planning for the Next ade. [S.l.: s.n.], Apr. 2010a.P. 164–167. DOI: 10.1017/S1743921310002711. arXiv: 0909.4312 [astro-ph.CO].
RIFFEL, Rogemar A.; STORCHI-BERGMANN, Thaisa; NAGAR, Neil M. Near-infrared dust and line emission from the central region of Mrk1066:constraints from Gemini NIFS. Monthly Notices of the Royal Astronomical Society, v. 404, n. 1, p. 166–179, May 2010b. DOI:10.1111/j.1365-2966.2010.16308.x. arXiv: 1001.0130 [astro-ph.CO].
RIFFEL, Rogério et al. The stellar spectral features of nearby galaxies in the near infrared: tracers of thermally pulsing asymptotic giant branchstars? Monthly Notices of the Royal Astronomical Society, Oxford University Press (OUP), v. 450, n. 3, p. 3069–3079, May 2015. ISSN1365-2966. DOI: 10.1093/mnras/stv866. Available from: http://dx.doi.org/10.1093/mnras/stv866.
RIFFEL; STORCHI-BERGMANN. Feeding and feedback in the active nucleus of Mrk 1157 probed with the Gemini Near-Infrared Integral-FieldSpectrograph. Monthly Notices of the Royal Astronomical Society, Oxford University Press (OUP), v. 417, n. 4, p. 2752–2769, July 2011. ISSN0035-8711. DOI: 10.1111/j.1365-2966.2011.19441.x. Available from: http://dx.doi.org/10.1111/j.1365-2966.2011.19441.x.
RIFFEL; STORCHI-BERGMANN, and Winge. Feeding versus feedback in AGNs from near-infrared IFU observations: the case of Mrk 79. Monthly
Notices of the Royal Astronomical Society, v. 430, n. 3, p. 2249–2261, Apr. 2013. DOI: 10.1093/mnras/stt045. arXiv: 1301.1242[astro-ph.CO].
RIFFEL; STORCHI-BERGMANN, Thaisa; DORS, Oli L.; WINGE, Cl audia. AGN-starburst connection in NGC7582: Gemini near-infraredspectrograph integral field unit observations. Monthly Notices of the Royal Astronomical Society, v. 393, n. 3, p. 783–797, Mar. 2009. DOI:10.1111/j.1365-2966.2008.14250.x. arXiv: 0811.2327 [astro-ph].
RIFFEL; STORCHI-BERGMANN; WINGE, Cláudia; MCGREGOR, Peter J.; BECK, Tracy; SCHMITT, Henrique. Mapping of molecular gas inflowtowards the Seyfert nucleus of NGC 4051 using Gemini NIFS. Monthly Notices of the Royal Astronomical Society, Oxford University Press(OUP), v. 385, n. 3, p. 1129–1142, Apr. 2008. ISSN 1365-2966. DOI: 10.1111/j.1365-2966.2008.12936.x. Available from:http://dx.doi.org/10.1111/j.1365-2966.2008.12936.x.
RISALITI, G.; ELVIS, M.; BIANCHI, S.; MATT, G. Chandra monitoring of UGC 4203: the structure of the X-ray absorber. Monthly Notices of the
Royal Astronomical Society: Letters, Oxford University Press (OUP), no–no, June 2010. ISSN 1745-3933. DOI:10.1111/j.1745-3933.2010.00873.x. Available from: http://dx.doi.org/10.1111/j.1745-3933.2010.00873.x.
RUAN, John J. et al. TOWARD AN UNDERSTANDING OF CHANGING-LOOK QUASARS: AN ARCHIVAL SPECTROSCOPIC SEARCH IN SDSS.The Astrophysical Journal, American Astronomical Society, v. 826, n. 2, p. 188, July 2016. ISSN 1538-4357. DOI:10.3847/0004-637x/826/2/188. Available from: http://dx.doi.org/10.3847/0004-637X/826/2/188.
RUNNOE, Jessie C. et al. Now you see it, now you don’t: the disappearing central engine of the quasar J1011+5442. Monthly Notices of the
Royal Astronomical Society, v. 455, n. 2, p. 1691–1701, Jan. 2016. DOI: 10.1093/mnras/stv2385. arXiv: 1509.03640 [astro-ph.GA].
RUPKE, David S. N.; VEILLEUX. INTEGRAL FIELD SPECTROSCOPY OF MASSIVE, KILOPARSEC-SCALE OUTFLOWS IN THEINFRARED-LUMINOUS QSO Mrk 231. The Astrophysical Journal, IOP Publishing, v. 729, n. 2, p. l27, Feb. 2011. DOI:10.1088/2041-8205/729/2/l27. Available from: https://doi.org/10.10882F2041-82052F7292F22Fl27.
RUSCHEL-DUTRA, Daniel. danielrd6/ifscube v1.0. [S.l.]: Zenodo, July 2020. DOI: 10.5281/zenodo.3945237. Available from:https://doi.org/10.5281/zenodo.3945237.
S ANCHEZ-BL AZQUEZ, P.; PELETIER, R. F.; JIM ENEZ-VICENTE, J.; CARDIEL, N.; CENARRO, A. J.; FALC ON-BARROSO, J.; GORGAS, J.;SELAM, S.; VAZDEKIS, A. Medium-resolution Isaac Newton Telescope library of empirical spectra. Monthly Notices of the Royal Astronomical
Society, v. 371, n. 2, p. 703–718, Sept. 2006. DOI: 10.1111/j.1365-2966.2006.10699.x. arXiv: astro-ph/0607009 [astro-ph].
SANDAGE, Allan; V ERON, Philippe; WYNDHAM, John D. Optical Identification of New Quasi-Stellar Radio Sources. The Astrophysical Journal,v. 142, p. 1307–1311, Oct. 1965. DOI: 10.1086/148415.

REFERENCES 99
SATYAPAL, Shobita; ELLISON, Sara L.; MCALPINE, William; HICKOX, Ryan C.; PATTON, David R.; MENDEL, J. Trevor. Galaxy pairs in the SloanDigital Sky Survey - IX. Merger-induced AGN activity as traced by the Wide-field Infrared Survey Explorer. Monthly Notices of the Royal
Astronomical Society, v. 441, n. 2, p. 1297–1304, June 2014. DOI: 10.1093/mnras/stu650. arXiv: 1403.7531 [astro-ph.GA].
SCHAWINSKI, Kevin; DOWLIN, Nathan; THOMAS, Daniel; URRY, C. Megan; EDMONDSON, Edward. THE ROLE OF MERGERS IN EARLY-TYPEGALAXY EVOLUTION AND BLACK HOLE GROWTH. The Astrophysical Journal, IOP Publishing, v. 714, n. 1, p. l108–l112, Apr. 2010. DOI:10.1088/2041-8205/714/1/l108. Available from: https://doi.org/10.10882F2041-82052F7142F12Fl108.
SCHIMOIA, Jaderson S.; STORCHI-BERGMANN, Thaisa; NEMMEN, Rodrigo S.; WINGE, Cl audia; ERACLEOUS, Michael. Short TimescaleVariations of the Hα Double-peaked Profile of the Nucleus of NGC 1097. The Astrophysical Journal, v. 748, n. 2, 145, p. 145, Apr. 2012. DOI:10.1088/0004-637X/748/2/145. arXiv: 1203.6101 [astro-ph.CO].
SCHLAFLY, Edward F.; FINKBEINER, Douglas P. Measuring Reddening with Sloan Digital Sky Survey Stellar Spectra and Recalibrating SFD. The
Astrophysical Journal, v. 737, n. 2, 103, p. 103, Aug. 2011. DOI: 10.1088/0004-637X/737/2/103. arXiv: 1012.4804 [astro-ph.GA].
SCHMIDT. 3C 273 : A Star-Like Object with Large Red-Shift. Nature, v. 197, n. 4872, p. 1040, Mar. 1963. DOI: 10.1038/1971040a0.
SCHNORR MÜLLER, Allan; STORCHI-BERGMANN, Thaisa; RIFFEL, Rogemar A.; FERRARI, Fabricio; STEINER, J. E.; AXON, David J.;ROBINSON, Andrew. Gas streaming motions towards the nucleus of M81. Monthly Notices of the Royal Astronomical Society, OxfordUniversity Press (OUP), v. 413, n. 1, p. 149–161, Jan. 2011. ISSN 0035-8711. DOI: 10.1111/j.1365-2966.2010.18116.x. Available from:http://dx.doi.org/10.1111/j.1365-2966.2010.18116.x.
SCHNORR-MULLER, Allan; STORCHI-BERGMANN, Thaisa; NAGAR, Neil M.; ROBINSON, Andrew; LENA, Davide. Gas inflows towards thenucleus of NGC 1358. Monthly Notices of the Royal Astronomical Society, v. 471, n. 4, p. 3888–3898, Nov. 2017. DOI:10.1093/mnras/stx1913. arXiv: 1708.03217 [astro-ph.GA].
SCHNORR-MULLER, Allan; STORCHI-BERGMANN, Thaisa; NAGAR, Neil M.; ROBINSON, Andrew; LENA, Davide; RIFFEL, Rogemar A.;COUTO, Guilherme S. Feeding and feedback in the inner kiloparsec of the active galaxy NGC 2110. Monthly Notices of the Royal Astronomical
Society, v. 437, n. 2, p. 1708–1724, Jan. 2014. DOI: 10.1093/mnras/stt2001. arXiv: 1310.7916 [astro-ph.CO].
SCHNORR-MULLER, Allan et al. Constraints on the broad-line region properties and extinction in local Seyferts. Monthly Notices of the Royal
Astronomical Society, v. 462, n. 4, p. 3570–3590, Nov. 2016a. DOI: 10.1093/mnras/stw1865. arXiv: 1607.07308 [astro-ph.GA].
SCHNORR-MULLER, Allan et al. Constraints on the broad-line region properties and extinction in local Seyferts. Monthly Notices of the Royal
Astronomical Society, v. 462, n. 4, p. 3570–3590, Nov. 2016b. DOI: 10.1093/mnras/stw1865. arXiv: 1607.07308 [astro-ph.GA].
SCHWARZSCHILD, K. On the Gravitational Field of a Mass Point According to Einstein’s Theory. Abh. Konigl. Preuss. Akad. Wissenschaften
Jahre 1906,92, Berlin,1907, v. 1916, p. 189–196, Jan. 1916.
SEYFERT, Carl K. Nuclear Emission in Spiral Nebulae. The Astrophysical Journal, v. 97, p. 28, Jan. 1943. DOI: 10.1086/144488.
SHAKURA, N. I.; SUNYAEV, R. A. Reprint of 1973A&A....24..337S. Black holes in binary systems. Observational appearance. Astronomy and
Astrophysics, v. 500, p. 33–51, June 1973.
SHANKAR, Francesco; WEINBERG, David H.; MIRALDA-ESCUD E, Jordi. Self-Consistent Models of the AGN and Black Hole Populations: DutyCycles, Accretion Rates, and the Mean Radiative Efficiency. The Astrophysical Journal, v. 690, n. 1, p. 20–41, Jan. 2009. DOI:10.1088/0004-637X/690/1/20. arXiv: 0710.4488 [astro-ph].
SHAPIRO, S. L.; LIGHTMAN, A. P.; EARDLEY, D. M. A two-temperature accretion disk model for Cygnus X-1: structure and spectrum. The
Astrophysical Journal, v. 204, p. 187–199, Feb. 1976. DOI: 10.1086/154162.
SHAPPEE, B. J. et al. The Man behind the Curtain: X-Rays Drive the UV through NIR Variability in the 2013 Active Galactic Nucleus Outburst inNGC 2617. The Astrophysical Journal, v. 788, n. 1, 48, p. 48, June 2014. DOI: 10.1088/0004-637X/788/1/48. arXiv: 1310.2241 [astro-ph.HE].
SHENG, Zhenfeng; WANG, Tinggui; JIANG, Ning; YANG, Chenwei; YAN, Lin; DOU, Liming; PENG, Bo. Mid-infrared Variability of Changing-lookAGNs. The Astrophysical Journal, American Astronomical Society, v. 846, n. 1, p. l7, July 2017. ISSN 2041-8213. DOI:10.3847/2041-8213/aa85de. Available from: http://dx.doi.org/10.3847/2041-8213/aa85de.

REFERENCES 100
SHIMIZU, T Taro et al. The multiphase gas structure and kinematics in the circumnuclear region of NGC 5728. Monthly Notices of the Royal
Astronomical Society, Oxford University Press (OUP), Oct. 2019. ISSN 1365-2966. DOI: 10.1093/mnras/stz2802. Available from:http://dx.doi.org/10.1093/mnras/stz2802.
SHLOSMAN, Isaac; BEGELMAN, Mitchell C.; FRANK, Julian. The fuelling of active galactic nuclei. Nature, v. 345, n. 6277, p. 679–686, June 1990.DOI: 10.1038/345679a0.
SHU, X. W.; YAQOOB, T.; MURPHY, K. D.; BRAITO, V.; WANG, J. X.; ZHENG, W. NGC 2992 IN AN X-RAY HIGH STATE OBSERVEDBYXMM-NEWTON: RESPONSE OF THE RELATIVISTIC Fe LINE TO THE CONTINUUM. The Astrophysical Journal, IOP Publishing, v. 713,n. 2, p. 1256–1265, Apr. 2010. ISSN 1538-4357. DOI: 10.1088/0004-637x/713/2/1256. Available from:http://dx.doi.org/10.1088/0004-637X/713/2/1256.
SHUDER, J. M. The optical spectra of narrow-line X-ray galaxies. The Astrophysical Journal, v. 240, p. 32–40, Aug. 1980. DOI: 10.1086/158204.
SILK. UNLEASHING POSITIVE FEEDBACK: LINKING THE RATES OF STAR FORMATION, SUPERMASSIVE BLACK HOLE ACCRETION, ANDOUTFLOWS IN DISTANT GALAXIES. The Astrophysical Journal, IOP Publishing, v. 772, n. 2, p. 112, July 2013. DOI:10.1088/0004-637x/772/2/112. Available from: https://doi.org/10.10882F0004-637x2F7722F22F112.
SILK, J.; MAMON, G. A. The current status of galaxy formation. Research in Astronomy and Astrophysics, v. 12, p. 917–946, Aug. 2012. DOI:10.1088/1674-4527/12/8/004. arXiv: 1207.3080 [astro-ph.CO].
SILLERO, Emanuel; TISSERA, Patricia B.; LAMBAS, Diego G.; MICHEL-DANSAC, Leo. The evolution of the metallicity gradient and the starformation efficiency in disc galaxies. Monthly Notices of the Royal Astronomical Society, Oxford University Press (OUP), v. 472, n. 4,p. 4404–4413, Sept. 2017. ISSN 1365-2966. DOI: 10.1093/mnras/stx2265. Available from: http://dx.doi.org/10.1093/mnras/stx2265.
SLIPHER, V. M. The spectrum and velocity of the nebula N.G.C. 1068 ( M 77). Lowell Observatory Bulletin, v. 3, p. 59–62, Jan. 1917.
SNIEGOWSKA, M.; CZERNY, B.; BON, E.; BON, N. A possible mechanism for multiple changing look phenomenon in Active Galactic
Nuclei. [S.l.: s.n.], 2020. arXiv: 2007.06441 [astro-ph.GA].
SOTO-PINTO, Pamela et al. Outflowing gas in a compact ionization cone in the Seyfert 2 galaxy ESO 153-G20. Monthly Notices of the Royal
Astronomical Society, v. 489, n. 3, p. 4111–4124, Nov. 2019. DOI: 10.1093/mnras/stz2333.
SPINOGLIO, Luigi; FERN ANDEZ-ONTIVEROS, Juan Antonio. AGN types and unification model. arXiv e-prints, arXiv:1911.12176,arxiv:1911.12176, Nov. 2019. arXiv: 1911.12176 [astro-ph.GA].
SPRINGEL, V. et al. Simulations of the formation, evolution and clustering of galaxies and quasars. Nature, v. 435, p. 629–636, June 2005. DOI:10.1038/nature03597. eprint: astro-ph/0504097.
STASINSKA, G.; ASARI, N. Vale; FERNANDES, R. Cid; GOMES, J. M.; SCHLICKMANN, M.; MATEUS, A.; SCHOENELL, W.; SODRÉ JR, L. Canretired galaxies mimic active galaxies? Clues from the Sloan Digital Sky Survey. Monthly Notices of the Royal Astronomical Society: Letters,Oxford University Press (OUP), Sept. 2008. ISSN 1745-3933. DOI: 10.1111/j.1745-3933.2008.00550.x. Available from:http://dx.doi.org/10.1111/j.1745-3933.2008.00550.x.
STOKLASOVÁ, I.; FERRUIT, P.; EMSELLEM, E.; JUNGWIERT, B.; PÉCONTAL, E.; SÁNCHEZ, S. F. OASIS integral-field spectroscopy of thecentral kpc in 11 Seyfert 2 galaxies. Astronomy and Astrophysics, EDP Sciences, v. 500, n. 3, p. 1287–1325, Apr. 2009. ISSN 1432-0746. DOI:10.1051/0004-6361/200811225. Available from: http://dx.doi.org/10.1051/0004-6361/200811225.
STORCHI BERGMANN, T.; BICA, E.; PASTORIZA, M. G. The stellar population and emitting gas in the inner 2-5 KPC for a sample of nine Seyfert2 galaxies. Monthly Notices of the Royal Astronomical Society, v. 245, p. 749, Aug. 1990.
STORCHI-BERGMANN, T.; NEMMEN DA SILVA, Rodrigo; ERACLEOUS, Michael; HALPERN, Jules P.; WILSON, Andrew S.;FILIPPENKO, Alexei V.; RUIZ, Maria Teresa; SMITH, R. Chris; NAGAR, Neil M. Evolution of the Nuclear Accretion Disk Emission in NGC 1097:Getting Closer to the Black Hole. The Astrophysical Journal, v. 598, n. 2, p. 956–968, Dec. 2003. DOI: 10.1086/378938. arXiv:astro-ph/0308327 [astro-ph].
STORCHI-BERGMANN, Thaisa; BALDWIN, Jack A.; WILSON, Andrew S. Double-peaked Broad Line Emission from the LINER Nucleus of NGC1097. The Astrophysical Journal Letters, v. 410, p. l11, June 1993. DOI: 10.1086/186867.

REFERENCES 101
STORCHI-BERGMANN, Thaisa; RAIMANN, Daniel; BICA, Eduardo L. D.; FRAQUELLI, Henrique A. The Frequency of Nuclear Star Formation inSeyfert 2 Galaxies. The Astrophysical Journal, v. 544, n. 2, p. 747–762, Dec. 2000. DOI: 10.1086/317247. arXiv: astro-ph/0007027[astro-ph].
STORCHI-BERGMANN, Thaisa; RAIMANN, Daniel I.; DELGADO, R. Gonzalez; SCHMITT, H. R.; FERNANDES, R. Cid; HECKMAN, T.;LEITHERER, Claus. Stellar population gradients in Seyfert 2 galaxies. [S.l.: s.n.], 2002. arXiv: astro-ph/0211474 [astro-ph].
STORCHI-BERGMANN, Thaisa; SCHNORR-MÜLLER, Allan. Observational constraints on the feeding of supermassive black holes. Nature
Astronomy, Springer Science and Business Media LLC, v. 3, n. 1, p. 48–61, Jan. 2019. ISSN 2397-3366. DOI: 10.1038/s41550-018-0611-0.Available from: http://dx.doi.org/10.1038/s41550-018-0611-0.
STORCHI-BERGMANN, Thaisa; DORS JR., Oli L.; RIFFEL, Rogemar A.; FATHI, Kambiz; AXON, David J.; ROBINSON, Andrew;MARCONI, Alessandro; OSTLIN, Goran. Nuclear Spirals as Feeding Channels to the Supermassive Black Hole: The Case of the Galaxy NGC6951. The Astrophysical Journal, IOP Publishing, v. 670, n. 2, p. 959–967, Dec. 2007. ISSN 1538-4357. DOI: 10.1086/521918. Available from:http://dx.doi.org/10.1086/521918.
STRAUSS, Michael A. et al. Spectroscopic Target Selection in the Sloan Digital Sky Survey: The Main Galaxy Sample. The Astronomical Journal,v. 124, n. 3, p. 1810–1824, Sept. 2002. DOI: 10.1086/342343. arXiv: astro-ph/0206225 [astro-ph].
SUTHERLAND, Ralph; DOPITA, Mike; BINETTE, Luc; GROVES, Brent. MAPPINGS V: Astrophysical plasma modeling code. [S.l.: s.n.], July2018. ascl:1807.005. ascl: 1807.005.
SWANK, J. H. The Rossi X-ray timing explorer: Capabilities, achievements and aims. Advances in Space Research, v. 38, n. 12, p. 2959–2963,Jan. 2006. DOI: 10.1016/j.asr.2006.07.009.
TERLEVICH, Roberto; TENORIO-TAGLE, Guillermo; FRANCO, Jose; MELNICK, Jorge. The starburst model for active galactic nuclei - Thebroad-line region as supernova remnants evolving in a high-density medium. Monthly Notices of the Royal Astronomical Society, v. 255,p. 713–728, Apr. 1992. DOI: 10.1093/mnras/255.4.713.
THEUREAU, G.; HANSKI, M. O.; COUDREAU, N.; HALLET, N.; MARTIN, J. -M. Kinematics of the Local Universe. XIII. 21-cm line measurements of452 galaxies with the Nançay radiotelescope, JHK Tully-Fisher relation, and preliminary maps of the peculiar velocity field. Astronomy and
Astrophysics, v. 465, n. 1, p. 71–85, Apr. 2007. DOI: 10.1051/0004-6361:20066187. arXiv: astro-ph/0611626 [astro-ph].
TOHLINE, J. E.; OSTERBROCK, D. E. Variation of the spectrum of the Seyfert galaxy NGC 7603. The Astrophysical Journal Letters, v. 210,p. l117–l120, Dec. 1976. DOI: 10.1086/182317.
TORREY, Paul; COX, T. J.; KEWLEY, Lisa; HERNQUIST, Lars. THE METALLICITY EVOLUTION OF INTERACTING GALAXIES. The
Astrophysical Journal, IOP Publishing, v. 746, n. 1, p. 108, Jan. 2012. ISSN 1538-4357. DOI: 10.1088/0004-637x/746/1/108. Available from:http://dx.doi.org/10.1088/0004-637X/746/1/108.
TRAN. The Nature of Seyfert 2 Galaxies with Obscured Broad-Line Regions. I. Observations. The Astrophysical Journal, v. 440, p. 565, Feb.1995. DOI: 10.1086/175296.
TRAN. The Unified Model and Evolution of Active Galaxies: Implications from a Spectropolarimetric Study. The Astrophysical Journal, v. 583,n. 2, p. 632–648, Feb. 2003. DOI: 10.1086/345473. arXiv: astro-ph/0210262 [astro-ph].
TREISTER, E.; SCHAWINSKI, K.; URRY, C. M.; SIMMONS, B. D. MAJOR GALAXY MERGERS ONLY TRIGGER THE MOST LUMINOUS ACTIVEGALACTIC NUCLEI. The Astrophysical Journal, IOP Publishing, v. 758, n. 2, p. l39, Oct. 2012. DOI: 10.1088/2041-8205/758/2/l39. Availablefrom: https://doi.org/10.10882F2041-82052F7582F22Fl39.
TREMAINE, Scott et al. The Slope of the Black Hole Mass versus Velocity Dispersion Correlation. The Astrophysical Journal, v. 574, n. 2,p. 740–753, Aug. 2002. DOI: 10.1086/341002. arXiv: astro-ph/0203468 [astro-ph].
TRIPPE; CRENSHAW, D; R. P., Deo; DIETRICH, Matthias. Long-Term Variability in the Optical Spectrum of the Seyfert Galaxy NGC 2992. AJ,v. 135, Apr. 2008a. DOI: 10.1088/0004-6256/135/6/2048.
TRIPPE, M. L.; CRENSHAW, D. M.; DEO, R.; DIETRICH, M. Long-Term Variability in the Optical Spectrum of the Seyfert Galaxy NGC 2992. The
Astronomical Journal, v. 135, n. 6, p. 2048–2054, June 2008b. DOI: 10.1088/0004-6256/135/6/2048. arXiv: 0804.1381 [astro-ph].

REFERENCES 102
TRUMP, Jonathan R. et al. ACCRETION RATE AND THE PHYSICAL NATURE OF UNOBSCURED ACTIVE GALAXIES. The Astrophysical
Journal, IOP Publishing, v. 733, n. 1, p. 60, May 2011. ISSN 1538-4357. DOI: 10.1088/0004-637x/733/1/60. Available from:http://dx.doi.org/10.1088/0004-637X/733/1/60.
TURNER, T. J.; POUNDS, K. A. The EXOSAT spectral survey of AGN. Monthly Notices of the Royal Astronomical Society, v. 240, p. 833–880,Oct. 1989. DOI: 10.1093/mnras/240.4.833.
ULVESTAD, J. S.; WILSON, A. S. Radio structures of Seyfert galaxies. VI. VLA observations of a nearby sample. The Astrophysical Journal,v. 285, p. 439–452, Oct. 1984. DOI: 10.1086/162520.
URRY, C. Megan; PADOVANI, Paolo. Unified Schemes for Radio-Loud Active Galactic Nuclei. Publications of the Astronomical Society of the
Pacific, v. 107, p. 803, Sept. 1995. DOI: 10.1086/133630. arXiv: astro-ph/9506063 [astro-ph].
VALIANTE, Rosa; AGARWAL, Bhaskar; HABOUZIT, Melanie; PEZZULLI, Edwige. On the Formation of the First Quasars. Publications of the
Astronomical Society of Australia, v. 34, e031, e031, July 2017. DOI: 10.1017/pasa.2017.25. arXiv: 1703.03808 [astro-ph.GA].
VAN DOKKUM, Pieter G. Cosmic-Ray Rejection by Laplacian Edge Detection. Publications of the Astronomical Society of the Pacific, v. 113,p. 1420–1427, Nov. 2001. DOI: 10.1086/323894. arXiv: astro-ph/0108003 [astro-ph].
VAN GRONINGE, Ernst; WANDERS, Ignaz. An Algorithm for the Relative Scaling of Spectra. Publications of the Astronomical Society of the
Pacific, v. 104, p. 700, Aug. 1992. DOI: 10.1086/133039.
VAN GRONINGEN, Ernst; WANDERS, Ignaz. An Algorithm for the Relative Scaling of Spectra. Publications of the Astronomical Society of the
Pacific, v. 104, p. 700, Aug. 1992. DOI: 10.1086/133039.
VANDEN BERK, Daniel E. et al. Composite Quasar Spectra from the Sloan Digital Sky Survey. The Astronomical Journal, v. 122, n. 2,p. 549–564, Aug. 2001. DOI: 10.1086/321167. arXiv: astro-ph/0105231 [astro-ph].
VEILLEUX; OSTERBROCK. Spectral Classification of Emission-Line Galaxies. The Astrophysical Journal Supplement Series, v. 63, p. 295, Feb.1987. DOI: 10.1086/191166.
VEILLEUX, S.; SHOPBELL, P. L.; MILLER, S. T. The Biconical Outflow in the Seyfert Galaxy NGC 2992. The Astronomical Journal, v. 121, n. 1,p. 198–209, Jan. 2001. DOI: 10.1086/318046. arXiv: astro-ph/0010134 [astro-ph].
VENTURI, Giacomo et al. MAGNUM survey: A MUSE-Chandra resolved view on ionized outflows and photoionization in the Seyfert galaxyNGC1365. Astronomy and Astrophysics, v. 619, A74, a74, Nov. 2018. DOI: 10.1051/0004-6361/201833668. arXiv: 1809.01206 [astro-ph.GA].
VERON, P.; LINDBLAD, P. O.; ZUIDERWIJK, E. J.; VERON, M. P.; ADAM, G. On the nature of the so-called narrow-line X-ray galaxies. Astronomy
and Astrophysics, v. 87, n. 1-2, p. 245–249, July 1980.
VÉRON-CETTY, M. P.; VÉRON, P. Are all radio galaxies genuine ellipticals? Astronomy and Astrophysics, v. 375, p. 791–796, Sept. 2001. DOI:10.1051/0004-6361:20010902.
VILLAR-MARTIN, M.; HUMPHREY, A.; DELGADO, R. Gonz alez; COLINA, L.; ARRIBAS, S. Ionized outflows in SDSS type 2 quasars at z ∼
0.3-0.6. Monthly Notices of the Royal Astronomical Society, v. 418, n. 3, p. 2032–2042, Dec. 2011. DOI: 10.1111/j.1365-2966.2011.19622.x.arXiv: 1108.2392 [astro-ph.CO].
WANG, J.; XU, D. W.; WANG, Y.; ZHANG, J. B.; ZHENG, J.; WEI, J. Y. Two New “Turn-off” Changing-look Active Galactic Nuclei and Implication on“Partially Obscured” AGNs. The Astrophysical Journal, American Astronomical Society, v. 887, n. 1, p. 15, Dec. 2019. ISSN 1538-4357. DOI:10.3847/1538-4357/ab4d90. Available from: http://dx.doi.org/10.3847/1538-4357/ab4d90.
WARD, M.; PENSTON, M. V.; BLADES, J. C.; TURTLE, A. J. New optical and radio observations of the X-ray galaxies NGC 7582 andNGC 2992.Monthly Notices of the Royal Astronomical Society, v. 193, p. 563–582, Nov. 1980. DOI: 10.1093/mnras/193.3.563.
WEAVER, K. A.; NOUSEK, J.; YAQOOB, T.; MUSHOTZKY, R. F.; MAKINO, F.; OTANI, C. X-Ray Reprocessing by a Molecular Torus in the Seyfert1.9 Galaxy NGC 2992. The Astrophysical Journal, v. 458, p. 160, Feb. 1996. DOI: 10.1086/176800.
WEBSTER, B. Louise; MURDIN, Paul. Cygnus X-1-a Spectroscopic Binary with a Heavy Companion ? Nature, v. 235, n. 5332, p. 37–38, Jan. 1972.DOI: 10.1038/235037a0.

REFERENCES 103
WILKINSON, David M.; MARASTON, Claudia; GODDARD, Daniel; THOMAS, Daniel; PARIKH, Taniya. FIREFLY (Fitting IteRativEly For LikelihoodanalYsis): a full spectral fitting code. Monthly Notices of the Royal Astronomical Society, v. 472, n. 4, p. 4297–4326, Dec. 2017. DOI:10.1093/mnras/stx2215. arXiv: 1711.00865 [astro-ph.GA].
WINTER, Lisa M.; MUSHOTZKY, Richard F.; REYNOLDS, Christopher S.; TUELLER, Jack. X-Ray Spectral Properties of the BAT AGN Sample.The Astrophysical Journal, v. 690, n. 2, p. 1322–1349, Jan. 2009. DOI: 10.1088/0004-637X/690/2/1322. arXiv: 0808.0461 [astro-ph].
WOO, Jong-Hak; SCHULZE, Andreas; PARK, Daeseong; KANG, Wol-Rang; KIM, Sang Chul; RIECHERS, Dominik A. DO QUIESCENT ANDACTIVE GALAXIES HAVE DIFFERENTMBH-RELATIONS? The Astrophysical Journal, IOP Publishing, v. 772, n. 1, p. 49, July 2013. ISSN1538-4357. DOI: 10.1088/0004-637x/772/1/49. Available from: http://dx.doi.org/10.1088/0004-637X/772/1/49.
WOO, Jong-Hak; URRY, C. Megan. Active Galactic Nucleus Black Hole Masses and Bolometric Luminosities. The Astrophysical Journal, v. 579,n. 2, p. 530–544, Nov. 2002. DOI: 10.1086/342878. arXiv: astro-ph/0207249 [astro-ph].
XIE, Fu-Guo; YUAN, Feng. Radiative efficiency of hot accretion flows. Monthly Notices of the Royal Astronomical Society, v. 427, n. 2,p. 1580–1586, Dec. 2012. DOI: 10.1111/j.1365-2966.2012.22030.x. arXiv: 1207.3113 [astro-ph.HE].
YANG, Qian et al. Discovery of 21 New Changing-look AGNs in the Northern Sky. The Astrophysical Journal, v. 862, n. 2, 109, p. 109, Aug. 2018.DOI: 10.3847/1538-4357/aaca3a. arXiv: 1711.08122 [astro-ph.GA].
YAQOOB; GEORGE, I. M.; NANDRA, K.; TURNER, T. J.; SERLEMITSOS, P. J.; MUSHOTZKY, R. F. Physical Diagnostics from a Narrow Fe KαEmission Line Detected by Chandra in the Seyfert 1 Galaxy NGC 5548. The Astrophysical Journal, v. 546, n. 2, p. 759–768, Jan. 2001. DOI:10.1086/318315. arXiv: astro-ph/0008471 [astro-ph].
YAQOOB, Tahir. Parameter Estimation in X-Ray Astronomy Revisited. The Astrophysical Journal, v. 500, n. 2, p. 893–898, June 1998. DOI:10.1086/305781. arXiv: astro-ph/9803057 [astro-ph].
YAQOOB et al. Precision Fe Kα and Fe Kβ Line Spectroscopy of the Seyfert 1.9 Galaxy NGC 2992 with Suzaku. Publications of the
Astronomical Society of Japan, v. 59, p. 283–299, Jan. 2007. DOI: 10.1093/pasj/59.sp1.S283.
YUAN, Feng; NARAYAN, Ramesh. Hot Accretion Flows Around Black Holes. Annual Review of Astronomy and Astrophysics, v. 52, p. 529–588,Aug. 2014. DOI: 10.1146/annurev-astro-082812-141003. arXiv: 1401.0586 [astro-ph.HE].
ZAKAMSKA, Nadia L. et al. Discovery of extreme [O III] λ5007 Å outflows in high-redshift red quasars. Monthly Notices of the Royal
Astronomical Society, v. 459, n. 3, p. 3144–3160, July 2016. DOI: 10.1093/mnras/stw718. arXiv: 1512.02642 [astro-ph.GA].
ZINN, P.-C.; MIDDELBERG, E.; NORRIS, R. P.; DETTMAR, R.-J. ACTIVE GALACTIC NUCLEUS FEEDBACK WORKS BOTH WAYS. The
Astrophysical Journal, IOP Publishing, v. 774, n. 1, p. 66, July 2013. DOI: 10.1088/0004-637x/774/1/66. Available from:https://doi.org/10.10882F0004-637x2F7742F12F66.

104
APPENDIX A – APPENDIXES FOR CHAPTER 2
A.1 Stellar Populations Synthesis Maps
We show the maps of the recovered properties from three spatially resolved STARLIGHT
synthesis we have performed, namely BC03, BC03+FC and M11+FC. The top panels show,
from left to right, the per cent contribution to the total light for young, intermediate and old SSPs
(xY , xI and xO). In the middle panels the light-weighted mean stellar metallicity for the three age
groups, from left to right, 〈Z〉Y , 〈Z〉I and 〈Z〉O. In the bottom panel the V -Band extinction (AV ),
the per cent contribution to the total light from the FC component (xagn) and the light-weighted
mean stellar age, 〈log t∗〉, are shown, respectively, from left to right.
A.2 Emission Line Fitting Uncertainties
We present here the uncertainties in the parameters of the emission lines fitting de-
scribed in section 2.4.1. The uncertainties are the standard deviation over the one hundred
Monte Carlo iterations. The uncertainties in the radial velocity (V) of Component 1 was already
presented in section section 2.4. In Figure 42 we show the uncertainties in the velocity disper-
sion (σ) of Component 1, the values are mostly smaller than 5 km s–1, reaching a maximum
value of 15 km s–1.
In the top panel we also show the uncertainties of v and σ of Component 2, values are
less than 10 km s–1in most the region, reaching up to 30 km s–1in a very small region, the σ
values are less then 10 km s–1in the peak of component emission and up to 30 km s–1in the
borders of the detection region. In the middle and bottom panels the percentile uncertainties
in the integrated flux (Component 1 + Component 2) of Hβ, [O III] λ5007, Hα, [N II] λ6583, and
[S II] λ6716,6731 are shown.
The Hβ line uncertainties range from 10 per cent at the centre of the FoV, up to 45 per
cent in the dust lane region. [O III] and Hα values range from less than 5 per cent up to 25 per
cent at the dust lane region. [S II] and [N II] values range from less than 10 per cent up to 35 per
cent at the dust lane region.

APPENDIX A. Appendixes for chapter 2 105
Figure 39 – Maps of the recovered properties from the BC03 synthesis. Top: from left to right,percentage contribution to the total light from young, intermediate and old SSPs(xY , xI and xO). Middle: from left to right, light-weighted mean stellar metallicity forthe three SSP age groups, 〈Z〉Y , 〈Z〉I and 〈Z〉O. Bottom left: AV extinction parameter.Bottom middle: Featureless continuum (FC) component percentage contribution tothe total light (xagn). Bottom Right: Light-weighted mean stellar age, 〈log t∗〉. Thegrey contour in all the maps is the continuum emission, left panel of Figure 18. Thexagn is null in all points by definition, because there is no FC component in BC03
synthesis spectra base.

APPENDIX A. Appendixes for chapter 2 106
Figure 40 – Same as Figure 39 for BC03+FC.
Figure 41 – Same as Figure 39 for M11+FC.

APPENDIX A. Appendixes for chapter 2 107
-3-2-10123
Y (a
rcse
c)
150pc
Error (Comp. 1) Error V (Comp. 2)
E
NError (Comp. 2)
-3-2-10123
Y (a
rcse
c)
150pc
Error Flux[H ] Error Flux[OIII]
E
NError Flux[H ]
-3 -2 -1 0 1 2 3X (arcsec)
-3-2-10123
Y (a
rcse
c)
150pc
Error Flux[NII]
-3 -2 -1 0 1 2 3X (arcsec)
Error Flux[SII] 6716
-3 -2 -1 0 1 2 3X (arcsec)
E
NError Flux[SII] 6731
0
5
10
15
20
0
10
20
30
0
10
20
30
01020304050
01020304050
01020304050
01020304050
01020304050
01020304050
Figure 42 – Emission line fitting uncertainties. Top: from right to left, velocity dispersion of Com-ponent 1 ( km s–1), radial velocity of Component 2 ( km s–1), velocity dispersion ofComponent 2 ( km s–1). Middle and Bottom: percentage uncertainties in the inte-grated flux (Component 1 + Component) of Hβ, [O III] λ5007, Hα, [N II] λ6583, and[S II] λ6716,6731 (%). The black cross shows the peak of the continuum emission.Each contour in the maps means a 10% variation in the uncertainties.

108
APPENDIX B – APPENDIXES FOR CHAPTER 3
B.1 Propagation of Asymmetric Uncertainties
When the underlying likelihood function of a parameter is not symmetric, the error
distribution will also be asymmetric. Different origins of asymmetry are discussed in detail
by Barlow (2003a,b) and Barlow (2004). In high-energy astrophysics it is related to the low
photon counting. In this case, the estimated parameters are usually reported in a form like
x+ur–ul
. Where x is the best-fitting parameter (minimum χ2) and ul and ur are draw where the ∆χ2
curve reaches some value, for classical 1σ (68%) confidence level ∆χ2 = 1.0, however the 90%
confidence level (∆χ2 = 2.7) is the most employed in X-ray astronomy (AVNI, 1976; LAMPTON
et al., 1976; YAQOOB, 1998).
Usually, one needs to calculate a function of one or more quantities, and propagate its
uncertainties. In most circumstances, well known “Error Propagation” formulas are adequate.
But there are some assumptions and approximations under the Error Propagation, and if they
fail, the method is invalid. These assumptions can be summarised as: the errors are Normally
distributed (Gaussian errors) and they are relatively small. For asymmetric errors in astronomy
any of these assumptions can be made; if the asymmetry is really small, rounding/averaging the
negative and the positive errors into a single value and making the distribution symmetric does
not change the result much. But when the values are not appropriate to do that, researchers
often tend to put two error values into quadrature separately and combine them in the result.
Actually this is not a valid method due to violation of the Central Limit Theorem (BARLOW,
2003b). Eventually more sophisticated methods are needed to use: we present here a Python-
based Monte Carlo solution for this problem, based in a combination of Barlow (2004) and
Possolo et al. (2019) derivations.
During this research we faced the problem that even with numerous of uncertainties
propagation tools publicly-available (e.g. ASTROPY.UNCERTAINTY, UNCERTAINTIES) none of them
are able to handle asymmetric uncertainties as we needed, due to the assumptions stated above.
We therefore created the ASYMMETRIC_UNCERTAINTIES Python package, the main idea of the
code is to generate a random sample from the likelihood function and use this sample in other
calculations (POSSOLO et al., 2019). The code assumes a “Variable Width Gaussian” likelihood,
which, as shown by Barlow (2004), reproduces very well the underlying likelihood of low counting
measurements, and, in contrast to, for example, a “Generalised Poisson” distribution, has a
unique and analytical solution for given values of x , ul and ur at a given confidence level (∆χ2).
From this likelihood the code generates a random sample of data, that can be passed as
parameters for any type of function. Simple operations are deal internally by the code and the
more sophisticated ones can be easy performed by the user, for example: L2–10 values in Table 3
whose uncertainties were propagated from Γ and NH uncertainties; as well as the statistical
tests (rs and pvalue) in Figure 33. The resulting sample is then fitted by the code returning the
nominal value and the propagated uncertainties. The code is publicly-available at github1 where
examples in how to use the code are also presented.
1 https://github.com/muryelgp/asymmetric_uncertainties

APPENDIX B. Appendixes for chapter 3 109
B.2 Point-Source Scale Factor Derivation and Measurement
The fluxes of the BELs (from the BLR) measured from spectra taking from different
instruments at distinct observational conditions suffers from the effects of distinct apertures and
seeing. In this section, based on Peterson et al. (1995), we will derive the expression of the
so-called Point-Source Scale Factor (ϕ), which is used in the correction of these effects in AGN
variability studies.
The flux calibration of ground-based optical spectra of variable AGNs is often done by
assuming that the narrow line flux is constant with time (as done in section 3.3.2). However, at
typical ground-based resolution (generally of order one arcsec), the NLR is often not a point
source in nearby AGNs. Thus, the fraction of the total NLR flux that enters the spectrograph
aperture is not the same as the fraction recorded from a point source (such as the AGN
continuum source or the BLR), and the difference between the recorded NLR flux and point-
source flux is a function of the Point Spread Function (PSF), i.e., the seeing, as well as from the
size of the aperture.
Consider first the flux recorded from a point source. We characterize the PSF, ρ, by its
full width at half-maximum (FWHM), s, measured in arcseconds. In this analysis, the important
quantity will be the integral of the PSF, Φ(R, s), over the projected aperture, i.e.:
Φ(R, s) =∫
R
ρ(R’, s)dR’ (35)
where the integral is over the projected aperture whose boundaries are specified by R. For
good quality data, the PSF is azimuthally symmetric, usually assumed to be Gaussian, and the
integral over a circular aperture of radius R centered on the source simplifies to:
Φ(R, s) = 2π∫ R
0ρ(r , s) r dr (36)
The total narrow line flux measured through the same aperture with the same PSF
is given by a similar equation, but using the observed NLR surface-brightness distribution,
ΣNL(R, s), the actual surface brightness distribution convoluted with the PSF):
FNL(R, s) =∫
R
ΣNL(R’, s)dR’ (37)
Flux calibration of the recorded AGN spectrum is accomplished by assuming that the
narrow-line flux is constant and known. However, one can easily see that if the NLR is slightly
more extended than the PSF, a small aperture (i.e., one that is slightly larger than the width of
the PSF) will admit a larger fraction of light from the point-like source than from the NLR. By
assuming that all of the NLR flux was recorded, one makes an error in calibration in the sense
that the point-source components appear to be brighter than they actually are, but only because
the recorded NLR flux is lower than it should be. To account for this, we define a Point-Source

APPENDIX B. Appendixes for chapter 3 110
Scale Factor (ϕ) by the equation:
ϕ(R, s) =FNL(R, s)Φ(R, s)
(38)
We normalize the correction factor ϕ to some standard aperture geometry and seeing.
The point-source (in this case the BLR) fluxes measured from the calibrated spectrum should
be multiplied by this factor to account for the fact that the observed point-source fluxes are too
high because of lesser light loss (relative to the narrow lines) at the aperture. Thus, the correct
broad-line flux is given by:
L = ϕ(R, s) Lobs (39)
where Lobs is the luminosity measured in the calibrated (assuming same narrow line
flux) spectrum, and therefore the above expression becomes equation 30.
In our case ΣNL was an [O III] λ5007 image, constructed using the 2015 data cube from
the MUSE instrument (see section 3.2.3), ρ a Gaussian function, s the spatial resolution (seeing)
of the observations, and R the apertures (see Table 5) which were than applied to equation 38
result in the ϕ values listed in Table 5.

111
ANNEX A – PAPERS
Attached are the two peer-reviewed papers in which chapters 2 and 3 were based on.

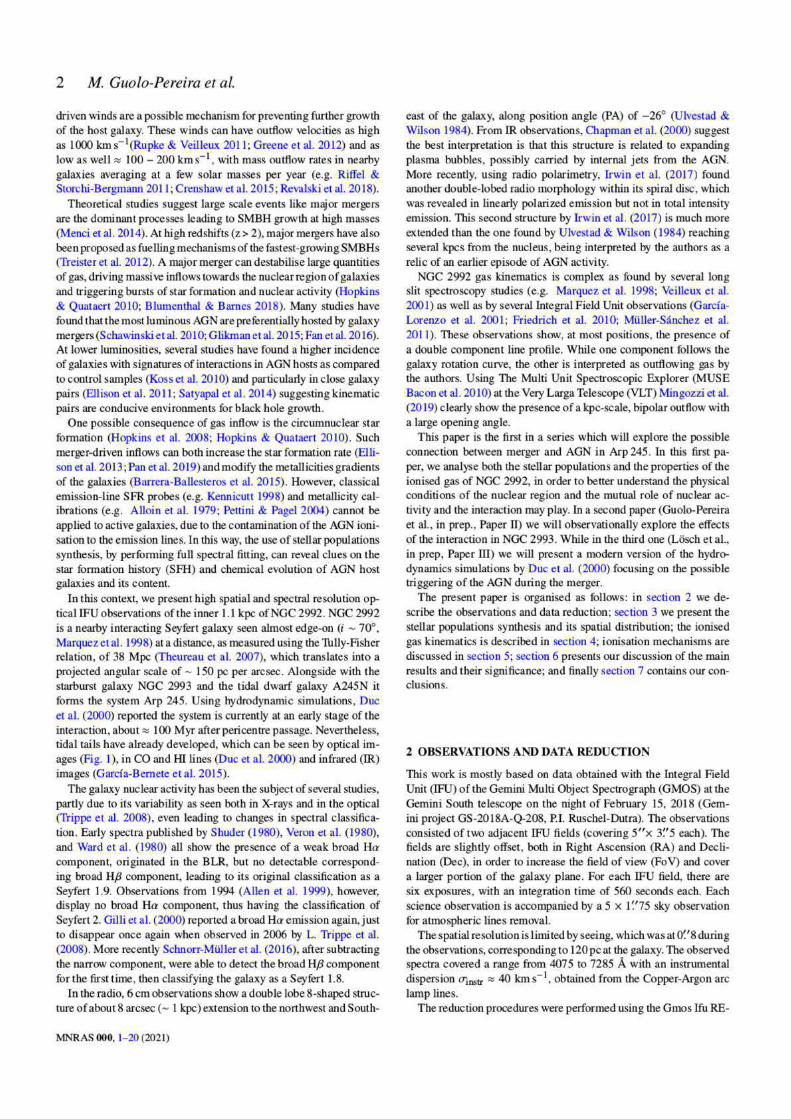


MNRAS 000, 1–12 (2020) Preprint 17 May 2021 Compiled using MNRAS LATEX style file v3.0
The Eddington ratio-dependent multiple changing look events in
NGC 2992
Muryel Guolo-Pereira1★, Daniel Ruschel-Dutra1, Jaderson Schimoia2, Dirk Grupe3,Bradley M. Peterson4,5,6, Rodrigo Nemmen7, Thaisa Storchi-Bergmann8, Andrew Robinson9
1Departamento de Física - CFM - Universidade Federal de Santa Catarina, 476, 88040-900 Florianópolis, SC, Brazil2Departamento de Física - CCNE - Universidade Federal de Santa Maria, 97105-90, Santa Maria, RS, Brazil3Space Science Center, Morehead State University, 235 Martindale Drive, Morehead, KY 40351, USA4 Department of Astronomy, The Ohio State University, 140 W 18th Ave, Columbus, OH 43210, USA5 Center for Cosmology and AstroParticle Physics, 191 Woodruff Ave., Columbus, OH 43210, USA6 Space Telescope Science Institute, 3700 San Martin Drive, Baltimore, MD 21218, USA7 Instituto de Astronomia, Geofísica e Ciências Atmosféricas, Universidade de São Paulo, São Paulo, SP 05508-090, Brazil8 Departamento de Astronomia, Universidade Federal do Rio Grande do Sul. Av. Bento Goncalves 9500, 91501-970 Porto Alegre, RS, Brazil9 School of Physics and Astronomy, Rochester Institute of Technology, 84 Lomb Memorial Drive, Rochester, NY 14623, USA
Accepted XXX. Received YYY; in original form ZZZ
ABSTRACT
We present the analyses of the historical X-rays and optical spectra of the ‘changing look’active galactic nucleus (AGN) NGC 2992, ranging from 1978 to 2019. The galaxy presentsmultiple Seyfert type transitions from type 2 to intermediate-type losing and regaining its HUBroad Emission Line (BEL) recurrently. In X-rays, the source shows intrinsic variability withthe absorption corrected luminosity varying by a factor of ∼ 35. We rule-out tidal disruptionevents or variable obscuration as causes of the type transitions, and show that the presence (andflux) of the broad HU emission line is directly correlated with the 2-10 keV X-ray luminosity(L2−10): a minimum value of L2−10 ≈ 4 × 1042 erg s−1 is necessary for its appearance, thisvalue translates to a Eddington ratio (_Edd = LBol/LEdd) of 2.0+2.0
−1.3% for the assumed black
hole mass. The detection of the HV BEL is only possible at even higher accretion rates of ∼5–8%. We find a correlation between the narrow Fe KU flux and _Edd, and an anti-correlationsbetween full width at half maximum of HU BEL and _Edd. Two possible scenarios for typetransitions are compatible with our results: either the dimming (brightening) of the AGNcontinuum, which reduces (increases) the supply of ionising photons available to excite thegas in the vicinity of the black hole, or the fading of the Broad Line Region (BLR) structureitself occurs as the low accretion rate is not able to sustain the required cloud flow rate in adisk-wind BLR model.
Key words: galaxies: Seyfert – galaxies: nuclei – X-rays: galaxies – optical: galaxies
1 INTRODUCTION
Supermassive black holes (SMBH) at the centre of galaxies canbecome active by the accretion of surrounding matter (see Storchi-Bergmann & Schnorr-Müller 2019, for a review on the feedingmechanism). Such active galactic nuclei (AGN) can be identified byfeatures in their optical spectra - such as broad emission lines (BEL)and/or narrow high ionisation emission lines due to the non-stellarionising continuum - or by their nuclear X-ray emission. Emissionlines produced by the gas orbiting in the vicinity of the SMBH areDoppler broadener, forming the broad-line region (BLR), while thenarrow-line region (NLR) extends from a few parsecs to hundreds
★ E-mail:[email protected]
of parsecs beyond the accretion disk. Historically, Type 1 AGNs arethose showing both broad (> 103 , < 104 km s−1) and narrow (< 103
km s−1) permitted emission lines and narrow forbidden lines in theiroptical spectra; while Type 2 AGNs lack BELs. Intermediate AGNtypes were added by Osterbrock (1981), including types 1.8 and1.9, classified, respectively, according to the presence of a weak, orabsent, HV BEL, while retaining an HU BEL.
AGN unification models attribute differences in AGN type tothe viewing angle toward an axisymmetric, parsec scale obscuringstructure, which can block our direct view of the AGN central engine(Antonucci 1993; Urry & Padovani 1995) and is responsible for thelack of BEL in Type 2 AGNs. However, a relatively small numberof AGN show transitions from one type to another in a few years;these objects are known as “changing look” (CL) AGNs. CL-AGNs
© 2020 The Authors

2 M. Guolo-Pereira et al.
have changed the widely accepted AGN paradigm, not only in theorientation-based unified model but also standard accretion diskmodels (see Lawrence 2018, for a review of the so-called QuasarViscosity Crisis). Their extreme and fast variability has motivatedalternatives and/or modifications for both the AGN Unified Model(e.g. Nicastro 2000; Elitzur & Shlosman 2006; Elitzur et al. 2014)and for the standard Shakura & Sunyaev (1973) accretion disk model(e.g. Sniegowska et al. 2020; Jiang & Blaes 2020)
Until recently there were only a handful of CL events reported,including NGC 3516 (Andrillat & Souffrin 1971), NGC 1566 (Pas-toriza & Gerola 1970; Oknyansky et al. 2019), Mrk 590 (Denneyet al. 2014), NGC 2617 (Shappee et al. 2014), NGC 7603 (Tohline& Osterbrock 1976), Mrk 1018 (Cohen et al. 1986), NGC 1097(Storchi-Bergmann et al. 1993), NGC 3065 (Eracleous & Halpern2001) and NGC 7582 (Aretxaga et al. 1999). In 2015 LaMassa et al.discovered the first CL Quasar and since then the number of knownCL-AGNs has increased rapidly (e.g. MacLeod et al. 2016; McElroyet al. 2016; Runnoe et al. 2016; Yang et al. 2018; Ruan et al. 2016;Sheng et al. 2017; Kollatschny et al. 2018; Guo et al. 2019; Wanget al. 2019; Graham et al. 2019; Kollatschny et al. 2020); however,the number is still fewer than a hundred.
Some of these CL might be successfully explained via variableobscuration (e.g., Matt et al. 2003; Puccetti et al. 2007; Risaliti et al.2010; Marinucci et al. 2013; Marchese et al. 2012): in models wherethe obscuring material has a patchy distribution (e.g. Nenkova et al.2008; Elitzur 2012), the dynamical movement of the dust cloudscould result in a change of classification. Transient events such astidal disruption events (TDE) of a star by the SMBH were alsoclaimed as possible drivers of CL events (Eracleous et al. 1995);however, this scenario does not apply to sources presenting multiple(and quasi-periodic) CL events.
In a third scenario, it has been argued that changes in type areexpected with variations in accretion rate. In this scenario eitherthe BELs disappear (reappear) due to the reduction (increase) ofionising photons available to excite the gas in the vicinity of theblack hole (e.g. Storchi-Bergmann et al. 2003; LaMassa et al. 2015)or the BLR itself disappears, given that in disk-wind BLR models(e.g. Nicastro 2000; Elitzur & Shlosman 2006; Elitzur & Ho 2009)the broad line emission region follows an evolutionary sequencethat is directly related to the accretion rate of the compact source. Insuch disk-wind BLR models, a low accretion efficiency is not ableto sustain the required cloud flow rate responsible for the formationof the BLR clouds which gives origin to the distinct (intrinsic) AGNtypes, as proposed by Elitzur et al. (2014).
NGC 2992 is a highly inclined, 8 ∼ 70◦, nearby (z = 0.00771,Keel 1996) Seyfert galaxy. The galaxy was the subject of severalstudies and target of all major X-ray missions due to its variability.In the X-rays, it steadily declined in observed flux from 1978, whenit was observed by HEAO1 (Mushotzky 1982) at a flux level of about8 × 10−11 erg cm−2 s−1until 1994 when it was observed by ASCA
(Weaver et al. 1996) at a flux level by about a factor 20 fainter.Then it underwent a rapid recovery: in 1997 it was observed byBeppoSAX at a flux level somewhat higher than in 1994, while in1998 the source fully recovered its HEAO1 brightness (Gilli et al.2000). In 2003, when observed by XMM-Newton, the flux was evenhigher, about 10−10 erg cm−2 s−1(Shu et al. 2010). The source wasthen observed by Suzaku on November/December 2005, and foundin a much fainter state, almost an order of magnitude fainter than inthe XMM-Newton observation.
The Rossi X-ray Timing Explorer (RXTE, Swank 2006) mon-itoring campaign between early March 2005 and late January 2006found large amplitude (almost an order of magnitude) variabil-
ity, indicating that apart from the long-term variability of thesource, it also presents short-term outbursts with variations inthe order of days, while no significant variation of the primarypower-law index was found (Murphy et al. 2007); at the endof the campaign the source was again at a low flux state, con-firmed by Suzaku, at a flux level of ∼ 1 × 10⁻¹¹ erg cm−2 s−1(Ptaket al. 2007; Yaqoob et al. 2007) and Chandra, at flux level of∼ 0.3 × 10⁻¹¹ erg cm−2 s−1(its historical minimum flux, Mur-phy et al. 2017). In 2010, NGC 2992 was observed eight timesfor ∼ 40 ks by XMM-Newton with a 2–10 keV flux ranging from0.3 × 10−11 erg cm−2 s−1to 1.3 × 10⁻¹¹ erg cm−2 s−1. A further2013 XMM-Newton observation caught the source in a higher butstill low flux state (1.6×10⁻¹¹ erg cm−2 s−1). In 2015, observationsperformed simultaneously with Swift and NuSTAR found a 2-10 keVflux of 6× 10⁻¹¹ erg cm−2 s−1(Marinucci et al. 2018). The most re-cent observations were performed again with XMM-Newton in May2019, when the flux was again at the highest levels seen, rangingfrom 6.8 to 10 × 10−11 erg cm−2 s−1(Marinucci et al. 2020).
The optical variability of the source was first explored by Gilliet al. (2000) who noticed that in 1999 the HU BEL was presentagain, as it was in early observations of the galaxy by Veron et al.(1980) at the end of the 1970s which led to its first classificationas a Seyfert 1.9, in contrast to the Type 2 spectra seen in 1994 byAllen et al. (1999). Later, Trippe et al. (2008) showed that fromthe beginning of 2006 to the middle of 2007 the source had lostits BEL. Recently Schnorr-Müller et al. (2016) and Guolo-Pereiraet al. (2021) not only showed that the HU BEL was detectable againbut also, for the first time, a very faint HV BEL was claimed to bepresent.
Besides being a very well studied galaxy, to the best of ourknowledge no study has yet explored the entire X-ray and opticalhistorical emission of NGC 2992, nor attempted to link the be-haviour in the two wavelength bands. These are our goals in thispaper. The paper is organised as follow: in section 2 we describe thedata collection. The analysis of the data is described in section 3,while the results are discussed in section 4. Our conclusions appearin section 5.
2 DATA COLLECTION
This paper results from a careful re-examination of the entire lit-erature on NGC 2992, both X-rays and optical spectra, from itsdiscovery as an X-ray source (Cooke et al. 1978; Ward et al. 1980)and classification as a Seyfert galaxy (Osmer et al. 1974) to the mostrecent optical and X-ray spectra published to date (Marinucci et al.2020; Guolo-Pereira et al. 2021).
2.1 X-ray Spectra
The X-ray spectrum of NGC 2992 is very well fitted by an absorbedpower-law which accounts for most of the X-ray emission. How-ever, the spectrum also presents a narrow iron KU component at
6.4 kev, which becomes more intense at high flux levels (Yaqoobet al. 2007; Marinucci et al. 2018; Marinucci et al. 2020, see alsosection 3.1), We collected the fluxes in the 2-10 keV X-ray band(F2−10) and the best-fitting parameters for the absorbed continuummodel, namely the power-law continuum photon indexes (Γ)1 andthe absorbed material column densities (#H), as reported by the
1 The power law index in the continuum model: � (�) ∝ �−Γ .
MNRAS 000, 1–12 (2020)

Changing Look events in NGC 2992 3
authors throughout the literature on the source. For the more recentspectra, where the narrow Fe KU is detected we also collected theirmeasured fluxes, F(Fe KU). In the top panel of Fig. 1, we show thehistorical 2-10 keV light curve. In Table 1, we show the best-fittingcontinuum model parameters, the Fe KU fluxes, the observationdates, and references. The #H are only accounting for the absorp-tion at the redshift of the source therefore not including Galacticabsorption, #H Gal ≈ 5.5×1020 cm−2 (Kalberla et al. 2005). Errorsin the X-rays parameters correspond to the 90% confidence level forthe parameter of interest (Δj2
= 2.7), as reported by the authors.For the papers in which the authors reported their uncertainties inanother scale, e.g., Δj2
= 4.6, the errors were re-scaled using aPython package (asymmetric_uncertainties) for treatment ofasymmetric statistical errors derived from confidence levels, whichemploys a combination of the methods proposed by Barlow (2004)and Possolo et al. (2019). The method and a brief discussion onuncertainties can be found in Appendix A. The propagation of theuncertainties for the X-ray derived quantities (see section 3.1 andTable 1) is also performed with this same method, see appendix A.
2.2 Historical Optical Spectra
To access the historical presence or absence of HU BEL and thegalaxy optical classification, we reviewed all papers that report op-tical spectra of the galaxy. As most of these spectra are not availableto allow inter-calibration and measurement of the BELs flux vari-ability, we restrict ourselves to a binary classification of the HUBEL, i.e., whether the component was undoubtedly detected (D)or not-detected (N-D) by the authors. We do so by searching fora detection/non-detection claim in the original text and by visu-ally inspecting the published spectra. In the middle panel of Fig. 1,we show the HU BEL detection history. In Table 2, we show theobservation dates, the references and the Seyfert type at the time.
In summary: the first spectra of the galaxy in the ’70s (Wardet al. 1980; Veron et al. 1980; Shuder 1980; Durret & Bergeron1988) detected only HU broad components, with no counterpart inHV, resulting in its original classification as a Seyfert 1.9 galaxy.Throughout mid ’80s to the mid ’90s several authors have reportedthat the BEL HUwas not detectable anymore (Busko & Steiner 1990;Allen et al. 1999; Marquez et al. 1998; Veilleux et al. 2001), chang-ing its classification to Seyfert 2 Type. However the broad compo-nent was detected again from the end of the ’90s to the beginning ofthe 2000s (Gilli et al. 2000; García-Lorenzo et al. 2001; Stoklasováet al. 2009). Later, Trippe et al. (2008) performed an 18 months longmonitoring campaign from the beginning of 2006 to mid 2007 thatrevealed the HU BEL component was missing again, throughoutthe entire campaign. More recent observations have shown that thegalaxy has regained the broad HU component (Dopita et al. 2015;Schnorr-Müller et al. 2016; Mingozzi et al. 2019), and for the firsttime, an HV BEL was unambiguously detected, in late 2018, byGuolo-Pereira et al. (2021), therefore changing its classification toa 1.8 Type Seyfert galaxy.
It is important to note the large number of data points collected:40 in the X-rays (33 with reported #H and Γ values) and 18 in theoptical; which allow us to have a quasi-contemporaneous X-raymeasurement for each optical spectrum, within less than one yearfor most, and less than two years for all of them, see Fig. 1.
2.3 Modern Optical Spectra
For four of the six recent spectra of NGC 2992, we were able toapply methods of flux intercalibration that have been developed
for reverberation mapping studies (Peterson 1993; van Groninge &Wanders 1992; Peterson et al. 1995; Fausnaugh 2017) and measurethe intrinsic flux variability of the BELs. The spectra are from:
• Trippe et al. (2008) and taken in December of 2006 in the CerroTololo Inter-American Observatory; the spectrum was obtained byprivate communication with one of the authors;
• Dopita et al. (2015) as part of the Siding Spring SouthernSeyfert Spectroscopic Snapshot Survey (S7), taken in April of 2014and publicly available at the S7 survey website;
• Mingozzi et al. (2019) as part of the Measuring Active Galac-tic Nuclei Under MUSE Microscope (MAGNUM) survey using theMulti-Unit Spectroscopic Explorer (MUSE) at the Very Large Tele-scope (VLT) and taken in February of 2015; the spectral data cubeis public available at the VLT archive;
• A paper recently published by our group (Guolo-Pereira et al.2021). The spectral data cube was taken using the Gemini Multi-Object Spectrographs (GMOS) at the Gemini South Telescope inFebruary of 2018.
The inter-calibration, aperture/seeing corrections, and the processfor emission line fitting of these spectra will be presented in sec-tion 3.2.
2.4 Estimates of the Black Hole Mass and Luminosity
Distance
Precise black hole mass and luminosity distance measurements
are essential for the energetic calibrations and scaling to come.
Using stellar velocity dispersion measurements of f∗ = 158
km s−1, Woo & Urry (2002) estimated the black hole mass of
NGC 2992 to be 5.2 × 10⁷ M� by applying the Tremaine et al.
(2002) MBH- f∗ relation. The value obtained from Gültekin
et al. (2009) MBH- f∗ relation is MBH = 4.8+3.9−2.4
×107 M� , using
a bulge stellar velocity dispersion f∗ = 158 ± 13 km s−1(Nelson
& Whittle 1995). From the normalised excess variance f2A<Bin
the 2-10 keV band and assuming the f2A<B- MBH correlation
from Ponti et al. (2012), Marinucci et al. (2020) reported a MBH
= 3.0+5.5−1.5
× 107 M� . Furthermore, we also estimate the SMBH
mass using the emission line measurements, to be described
in section 3.2.2, by using single-epoch (SE) MBH estimates. We
applied Dalla Bontà et al. (2020) MSE (f�V , !�V) relation in all
the four modern spectra (section 2.3). We corrected extinction
effects using the measured Balmer decrements and assuming
Calzetti et al. (2000) extinction law. We obtained the following
values for MBH: 1.3+2.8−0.9
×107 M� , 3.5+7.4−2.4
×107 M� and 2.4+5.1−1.4
×
107 M� , respectively for 2014, 2015 and 2018 spectra. For 2006
spectrum, as the the HV BEL was not detected we use the HU
BEL, assuming a Balmer decrement of 9 (see section 3.2.3), we
obtained MBH = 0.5+1.5−0.4
× 107 M� . In summary, although the
distinct methods results in distinct MBH values, they are all
within the 0.5 − 5.5 × 10⁷ M� range.
Theureau et al. (2007) found a recession velocity of 2657km s−1for NGC 2992 (already corrected for peculiar motions),which assuming a cosmology with �0 = 70 km s−1Mpc−1, trans-lates to a luminosity distance to NGC 2992 equals to 38 Mpc.
MNRAS 000, 1–12 (2020)

4 M. Guolo-Pereira et al.
0
5
10
210
keV
Flux
[10
11er
gcm
2s
1 ]HEAO 1
Einstein
EXOSAT
GingaASCA BeppoSAX
XMM-Newton
RXTE
SuzakuChandra
NuSTAR
N-D
D
HBE
L
1980 1990 2000 2010 2020Obs. Date (yr)
0
5
10
15
20
L 210
[1042
erg
s1 ]
Figure 1. Top: Historical 2-10 keV light curve of the source. Middle: Historical detections (D) and non-detections (N-D) of the broad HU emission line. Bottom:
Intrinsic (absorption corrected) 2-10 keV Luminosity (L2−10) light curve. Each colour represents a distinct X-ray mission, and will be maintained
throughout the entire paper. In the L2−10 panel, the points without error bars have errors smaller then 3×1041 erg s−1, see Table 1 for the exact values.
3 DATA ANALYSES
3.1 X-ray Variability
In the scenario where the CL events are caused by variable ab-sorption, two natural consequences are an anti-correlation betweenthe #H and F2−10 and a constant intrinsic (absorption corrected)luminosity. In the top panel of Fig. 2 we show log #H as func-tion of F2−10: no clear anti-correlation can be seen. The Spearmanrank correlation coefficient (AB) for the two variables and its core-spondent ?value are AB = 0.19+0.15
−0.14and ?value = 0.22+0.45
−0.17, while
the best-fitting constant value is #H= 22.01+0.03−0.03
, where the er-rors correspond to 90% confidence level measured by performing athousand Monte Carlo iterations (see details in appendix A).
We can therefore conclude that although there were some vari-ations in the column density it is not anti-correlated with the X-rayflux as seen in variable absorption CL-AGNs (e.g. Puccetti et al.2007; Bianchi et al. 2009). A further confirmation that the ab-
sorption is not the main factor responsible for the behaviour of
the source can be seen by the intrinsic (i.e. absorption corrected)
rest-frame luminosity (L2−10). The measured L2−10 values, for
each observation in which a #H value is provided, are pre-
sented in Table 1. The values range from 4.9 × 1041 erg s−1to ∼
1.7 × 1043 erg s−1. The L2−10 light curve is shown in the bottom
panel of Fig. 1, and it has the same behaviour as the F2−10 and
this indicates/confirms that the variations are intrinsic and not
due to changes in absorption.
The Sperman rank correlation test shows that there is no mono-tonic correlation between the photon index Γ and the X-rays flux(or luminosity) for NGC 2992 (bottom panel of Fig. 2). The values
found were AB = 0.15+0.12−0.12
and ?value = 0.27+0.55−0.23
. The existence ofa correlation between luminosity and photon index is in fact debat-able, and several contradictory results have been presented in thelast years. While Dai et al. (2004) reported the existence of a pos-itive correlation, other works found none (e.g. Winter et al. 2009)or a negative correlation (e.g. Corral et al. 2011). A ‘V’ shape forthe Γ versus LEdd relation for NGC 2992 was claimed by Liu et al.(2019); the authors interpreted this as a change in accretion mode,similar to the ones that occur in stellar-mass X-ray binaries, e.g.Qiao & Liu (2013), in the AGN. We argue here that their finding isdue to selection effects, as the authors only used data from 2003 to2013. When the entire historical data of the source is shown (Fig. 2),this effect is not seen. However, there is a positive correlation be-tween F2−10 and the flux of the Fe KU, with AB = 0.69+0.07
−0.11and
pvalue = 0.01+0.03−0.01
. Fitting the data by assuming a relation of thetype:
log F(Fe KU) = U + V log F2−10 (1)
we obtained a slope of V = 0.39 ± 0.04. As the iron KU line iscreated by reprocessing of the primary X-ray continuum, a tightcorrelation between the flux of the line and that of the continuumis expected. For large samples of galaxies Ricci et al. (2014), foundV = 0.89 ± 0.04, while Shu et al. (2010) found V = 0.86 ± 0.01.However, NGC 2992 seems to be one of a few objects where thiscorrelation is found in a single object, though with a lower slopethan the ones found in the general AGN population.
MNRAS 000, 1–12 (2020)

Changing Look events in NGC 2992 5
Table 1. Historical X-ray data for NGC 2992.
Obs. Date(a) Satellite F(b)
2−10#
(c)
HΓ F(Fe KU)(d) Reference L(e)
2−10
10/1977HEAO 1
7.4016.0+8.0
−6.01.79+0.09
−0.07
–Mushotzky (1982)
13.48+1.40−0.99
02/1978 8.38 – 15.30+1.52−1.13
10/1978 7.21 – 13.09+1.34−0.85
06/1979Einstein
2.17 14.3+6.0−4.0
1.82+0.14−0.14
–Maccacaro et al. (1982)
3.89+0.30−0.20
06/1980 2.66 22.3+15.2−10.7
1.92+0.47−0.47
– 5.25+1.01−0.64
12/1983
EXOSAT
1.30 7.0+3.5−1.2
1.46+0.23−0.16
–
Turner & Pounds (1989)
2.09+0.10−0.03
03/1984 4.50 7.8+6.2−1.6
1.68+0.31−0.22
– 7.37+0.59−0.17
12/1984 4.70 6.0+1.7−0.6
1.64+0.07−0.09
– 7.50+0.18−0.07
12/1984 3.70 7.0+1.2−0.3
1.56+0.10−0.06
– 5.96+0.12−0.03
12/1984 3.00 8.6+2.6−0.3
1.48+0.15−0.11
– 4.91+0.27−0.03
12/1984 1.50 6.9+7.1−1.8
1.49+0.46−0.27
– 2.42+0.23−0.07
12/1984 1.50 5.6+5.2−1.2
1.58+0.39−0.20
– 2.39+0.19−0.05
01/1985 1.60 7.4+4.7−1.2
1.67+0.31−0.17
– 2.61+0.18−0.05
04/1990 GINGA 1.68 13.6+3.3−3.3
1.64+0.08−0.08
– Nandra & Pounds (1994) 2.94+0.12−0.12
06/1994 ASCA 0.33 10.1+2.7−2.3
1.70(f) – Weaver et al. (1996) 0.56+0.02−0.02
12/1997BeppoSAX
0.63 14.0+5.0−4.0
1.72+0.13−0.12
–Gilli et al. (2000)
1.12+0.07−0.06
11/1998 7.40 9.0+0.3−0.3
1.70+0.02−0.02
– 12.29+0.05−0.05
05/2003 XMM-Newton 9.50 6.5+0.3−0.2
1.83+0.06−0.04
– Shu et al. (2010) 15.37+0.07−0.05
03/2005
RXTE
7.38 –(g) 1.71+0.03−0.03
–
Murphy et al. (2007)
–05/2005 2.70 – 1.72+0.04
−0.04– –
06/2005 1.05 – 1.75+0.10−0.10
– –09/2005 1.23 – 1.85+0.13
−0.12– –
11/2005 1.25 – 1.96+0.12−0.11
– –01/2006 1.35 – 1.76+0.08
−0.08– –
12/2005 SUZAKU 1.15 8.0+0.6−0.4
1.57+0.05−0.03
3.99+0.80−0.80
Yaqoob et al. (2007) 1.88+0.01−0.01
01/2010 CHANDRA 0.36 – – – Murphy et al. (2017) –
05/2010
XMM-Newton
0.65 9.2+1.0−1.0
1.67+0.05−0.05
3.51+0.35−0.35
Marinucci et al. (2018)
1.08+0.01−0.01
05/2010 0.75 8.6+1.0−1.0
1.64+0.04−0.04
2.96+0.42−0.42
1.24+0.02−0.01
05/2010 1.35 8.4+1.0−1.0
1.61+0.04−0.04
4.49+0.48−0.48
2.22+0.03−0.03
06/2010 0.53 8.5+1.0−1.0
1.67+0.05−0.05
3.69+0.32−0.32
0.87+0.01−0.01
11/2010 0.54 8.0+1.0−1.0
1.67+0.05−0.05
3.64+0.34−0.34
0.88+0.01−0.01
11/2010 0.45 8.0+1.0−1.0
1.70+0.06−0.06
3.70+0.35−0.35
0.74+0.01−0.01
11/2010 0.30 8.1+1.0−1.0
1.71+0.09−0.09
3.19+0.32−0.32
0.49+0.01−0.01
12/2010 0.60 9.0+1.0−1.0
1.68+0.04−0.04
3.00+0.37−0.37
1.00+0.01−0.01
05/2013 1.65 8.1+1.0−1.0
1.63+0.06−0.06
5.66+1.12−1.12
2.70+0.03−0.03
12/2015 NuSTAR 5.80 11.0+2.0−2.0
1.72+0.03−0.03
8.68+1.92−1.92
9.89+0.26−0.24
05/2019XMM-Newton
10.00 9.0+1.6−1.6
1.68+0.10−0.10
12.96+1.60−1.60 Marinucci et al. (2020)
16.59+0.34−0.34
05/2019 6.80 8.5+1.6−1.6
1.63+0.06−0.06
12.96+1.60−1.60
11.18+0.23−0.22
(a) mm/yyyy. (b) in units of 10−11 erg cm−2 s−1. (c) in units of 1021 cm−2. (d) in units of 10×10−14 erg cm−2 s−1 (e) Absorption corrected, in units of1042 erg s−1. (f) The value was frozen in the model fitting, therefore it was excluded in the analyses of the Γ parameter variability of section 3.1. (g) Values
not provided by the authors.
3.2 Modern Optical Spectra Analyses
In this section, we explore the flux variability of the BELs usingfour of the six most recent spectra, namely from 12/2006, 04/2014,02/2015 and 02/2018 (see Table 2).
3.2.1 Absolute calibration of the spectra
Even under the best conditions, which are not often realized, fluxcalibration of ground-based spectrophotometry is no better than≈5%, which is insufficient for detailed comparisons of variablespectra. Thus the standard technique of flux calibration, throughcomparison with stars of known spectral energy distribution, is notgood enough for the study of AGN variability. Instead, we use the
fluxes of the narrow emission lines known to be non-variable ontime scales of tens of years in most AGN. Consequently, the brightnarrow emission lines can be adopted as internal calibrators forscaling AGN spectra (Peterson 1993). We assume that the flux ofthe [O iii] _5007 line remains constant during the interval coveredby these spectra.
We extracted the spectra using virtual apertures from the orig-inal data, making them as similar as possible to each other in thedata cubes, as shown in Table 3. The scaling of the extracted spectrawas carried out using a refinement of the method of van Groningen& Wanders (1992), employed as a Python package (mapspec) byFausnaugh (2017). This method allows us to obtain a homogeneous
MNRAS 000, 1–12 (2020)

6 M. Guolo-Pereira et al.
Table 2. Historical broad HU line and Seyfert Type classification forNGC 2992.
Obs. Date(a) HU BEL(b) Reference Seyfert Type
07/1977 D Ward et al. (1980) 1.9< 1978 D Veron et al. (1980) 1.901/1979 D Shuder (1980) 1.905/1979 D Durret & Bergeron (1988) 1.903/1985 N-D Busko & Steiner (1990) 203/1991 N-D Marquez et al. (1998) 202/1994 N-D Veilleux et al. (2001) 203/1994 N-D Allen et al. (1999) 204/1998 D García-Lorenzo et al. (2001) 1.901/1999 D Gilli et al. (2000) 1.903/2001 D Stoklasová et al. (2009) 1.901/2006 N-D
Trippe et al. (2008)2
12/2006 N-D 206/2007 N-D 202/2014 D Schnorr-Müller et al. (2016) 1.8/1.904/2014 D Dopita et al. (2015) 1.902/2015 D Mingozzi et al. (2019) 1.8/1.902/2018 D Guolo-Pereira et al. (in prep) 1.8
(a) mm/yyyy. (b) Whether the HU BEL was Detected (D) or Non-Detected(N-D).
set of spectra with the same wavelength solution, same spectralresolution (at ∼ 6300Å), and the same [O iii]_5007 flux value.
3.2.2 Stellar component subtraction and emission-line fitting
We subtracted the host galaxy stellar continuum fitted using thestarlight (Cid Fernandes et al. 2005) full spectra fitting code, us-ing a base of 45 Simple Stellar Population (SSP) spectra, with 15ages (from 1 Myr to 13 Gyr) and 3 metallicities (0.2, 1.0 and 2.5Z�). The emission line fitting was performed using the IFSCube
package2 (Ruschel-Dutra 2020). The code employs Sequential LeastSquare Programming and allows multiple components with phys-ically motivated constraints. In order to measure the BEL fluxes,the narrow emission components must be separated from the broadcomponents. This process is not straightforward due to the fact theBELs are blended with the narrow lines, for both HU and HV.
The narrow line subtraction was performed in two steps. Firstwe fitted the narrow and broad HU and HV simultaneously. Forthe narrow lines, we created a template comprised of two Gaus-sian components that were based on the [S ii]_6716 profile. Thistemplate was used to fit the [N ii] and narrow HU and HV linesby adjusting its flux scaling factor only. The fits to the broad lineswere subtracted from the spectra, isolating the narrow emission;we then re-fitted the narrow lines assuming the H i and [N ii] lineshave the same velocity dispersion and redshift and we set the fluxof [N ii]_6583 line as 2.96 times that of the [N ii]_6548 line, in ac-cordance with the ratio of their transition probabilities (Osterbrock& Ferland 2006), while the HU and [N ii]_6583 fluxes were freeparameters in the fit. Finally, we subtracted the resulting narrowlines from the original spectrum and re-fit only broad lines usingthree Gaussian components, in order to account for the known non-Gaussian profiles of the BEL. The errors were taken as the standarddeviations of one hundred Monte Carlo iterations. The resulting fitsfor the four spectra are shown in Fig. 3.
2 http://github.com/danielrd6/ifscube
21.6
21.8
22.0
22.2
22.4
22.6
logNH[cm
2 ]
rs=0.19+0.130.14pvalue=0.22+0.450.17log NH=22.01+0.030.03
12.0 11.5 11.0 10.5 10.0F2 10 [erg cm 2 s 1]
1.00
1.25
1.50
1.75
2.00
2.25
2.50rs=0.15+0.120.12pvalue=0.27+0.550.23=1.71+0.030.02
12.0 11.5 11.0 10.5 10.0log F2 10
13.8
13.6
13.4
13.2
13.0
12.8logF(Fe
K)
rs=0.69+0.070.11pvalue=0.01+0.030.01=0.39±0.04
Figure 2. Best-fitting parameters N� (top panel) and Γ (middle panel) foran absorbed power-law continuum model as function of the 2-10 keV Flux.The left top boxes show the Spearman rank correlation coefficient (AB) forthe two variables and its corresponding ?value, as well as the best-fittingconstant values. Fe KU flux as function as function of the 2-10 keV flux.The left top box show the Spearman rank correlation coefficient (AB) for thetwo variables and its corresponding ?value, V is the slope of the best fittingline (see Equation 1).
3.2.3 Inter-calibration of the spectral data
The fluxes measured in the scaled spectrum described in the previ-ous sections were corrected for aperture and distinct seeing effects,because while the BLR is effectively a point-like source, the NLRis an extended one. Consequently, the measured NLR flux dependson the size of the spectrograph’s entrance aperture and the obser-vations seeing (see Peterson et al. 1995, for a detailed discussion).In order to correct our fluxes for these effects, we determined apoint-source correction factor (i), which was measured using theprocedure described in Peterson et al. (1995). The i value representsthe differences in the amount of light from the NLR with respect tothe amount of light from the BLR for each observation, it is nor-malised using the largest aperture (i = 1.0, for 04/2015 spectrum).Then the scaled inter-calibrated and aperture/seeing corrected BELfluxes were measured as follows:
� (�U) = i · �_5007
[
� (�U)
� ( [O iii]_5007)
]
obs
(2)
where F_5007 is the scaling absolute flux in the [O iii]_5007 line,described in section 3.2.1, and the value in brackets is the broad HUto [O iii]_5007 measured flux ratio for each spectrum as describedin section 3.2.2. The same procedure was applied to HV BEL.
MNRAS 000, 1–12 (2020)

Changing Look events in NGC 2992 7
Table 3. Modern Optical Spectra. Point-Source Scale Factor (i) is measured using Peterson et al. (1995) algorithm, the errors in i represents the uncertaintyin the centring of the virtual apertures.
Obs. Date(mm/yyyy)
AperturePoint-SourceScale Factor
i
F(HU)(10−13 erg cm−2 s−1)
FWHM(HU)( km s−1)
F(HV)(10−13 erg cm−2 s−1)
F(HU)/F(HV)
12/2006 Slit (width = 2.0′′) 0.734 ± 0.063 ≤ 4.4 2733 ± 55 – –04/2014 Circular (radius = 2.8′′) 0.972 ± 0.025 27.5 ± 1.4 2002 ± 28 3.6 ± 2.6 7.6 ± 2.802/2015 Circular (radius = 3.0′′) 1.000 ± 0.011 33.8 ± 1.5 2313 ± 17 3.3 ± 2.2 10.1 ± 3.302/2018 Circular (radius = 3.0′′) 0.973 ± 0.013 43.8 ± 2.2 2016 ± 13 4.9 ± 1.4 8.8 ± 1.7
0
1
2
3
4
5
6
0
10
20
3012/2006 (Trippe et al.)
0
1
2
3
4
5
6
0
10
20
3004/2014 (Dopita et al.)
0
1
2
3
4
5
6
0
10
20
3002/2015 (Mingozzi et al.)
4800 4850 49000
1
2
3
4
5
6
6450 6500 6550 6600 6650 6700 6750 68000
10
20
3002/2018 (Guolo-Pereira et al.)
Wavelength (Å)
F[1
014
erg
cm2
s1
Å1 ]
Figure 3. Fit of the emission lines for the modern optical spectra. From top tobottom: 12/2006 (Trippe et al. 2008), 04/2014 (Dopita et al. 2015), 02/2015(Mingozzi et al. 2019) and 02/2018 (Guolo-Pereira et al. 2021). Scaledobserved spectra (black), narrow components (green), broad components(blue) and total model (red) are shown. Left panels show the HV lines whileright ones show the HU, [N ii] and [S ii] lines.
The BEL HU and HV fluxes and the Balmer decrements
(HU/HV) are shown in Table 3 and in the right panels of
Fig. 4. In the 12/2006 spectrum, the HU BEL is not unam-
biguously detected (which leads to its classification as a Seyfert
2), and if it is indeed present, it is very faint, with a maxi-
mum flux of 4.4 × 10⁻¹³ erg cm−2 s−1. From 2014 to 2018 the
broad HU flux increases from ∼ 28 × 10−13 erg cm−2 s−1to
∼ 44 × 10−13 erg cm−2 s−1. The HV BEL flux, however, does
not increase monotonically: in the 04/2014 spectrum it had
a flux of 3.6 × 10⁻¹³ erg cm−2 s−1, and a lower flux, 3.3 ×
10−13 erg cm−2 s−1, in 02/2015, while in 02/2018 it was measured
as 4.9 × 10⁻¹³ erg cm−2 s−1. In the middle right panel of Fig. 4
we also show an estimate of the detection limit for each spec-
trum. The broad HV is only well above this limit in the 02/2018
spectrum and possibly in 02/2015. Therefore, based on these
spectra, the galaxy can be classified as a Seyfert 1.8. Within the
uncertainties the Balmer decrements seems to be constant at a
value of ∼ 9.
By using this reddening value of the BLR, HU/HV ≈ 9
→ A+ = 3.68 mag using (Calzetti et al. 2000) law, and the
relation #H= 1.68× 10²¹ A+ cm−2 derived by van Steenberg &
Shull (1988) for the local ISM, we estimate the column density
absorbing the BLR to be #H≈ 6.2× 1021 cm−2. Comparing this
with the average value observed in the X-rays, #H≈ 1022, it may
fit with a scenario where this constant extinction/absorption is
mainly due to the host galaxy.
3.3 The Link Between the X-ray Luminosity and the BELs
Comparing the middle and bottom panels of Fig. 1, one can
directly see a correlation between the intrinsic X-ray luminosity
and the detection of the broad HU component. The periods in
which the broad component is detectable are the ones where
L2−10 shows the highest values; the epochs when the galaxy
is classified as a Seyfert 2 are those when closest available X-
ray spectra show lower L2−10 values. Given that the X-ray and
optical observations are not simultaneous, in order to quantify
the correlation between the BELs and the X-ray luminosity we
linearly interpolate the L2−10 curve (bottom panel of Fig. 1) and
attribute a L2−10 value for each historical optical spectrum. In
Fig. 5 we show the interpolated L2−10 value for each spectrum
as function of the bi-modal HU BEL detection.
From Fig. 5, the link between the BEL and the X-ray lu-
minosity is clear: at all epochs when an HU BEL is detected,
L2−10 > 4× 1042 erg s−1; conversely, when a Seyfert 2 spectrum
is observed, L2−10 < 4×1042 erg s−1;. Moreover, from Fig. 4 (top
panels) and Fig. 6 (top panel) we can see that for the modern
spectra (2006-2018) the HU BEL flux increases with the increase
in the L2−10. From the same figures, we can see that the tran-
sitions between Type 1.9 to Type 1.8 (i.e., the clear detection of
the HV BEL) occurs between 10 - 15 ×1042 erg s−1. It is possible
that the oldest high Eddington Ratio optical observations did
not detect the broad HV due to its faintness or lower signal to
noise ratio.
Under some assumptions we can convert the transitional X-
MNRAS 000, 1–12 (2020)
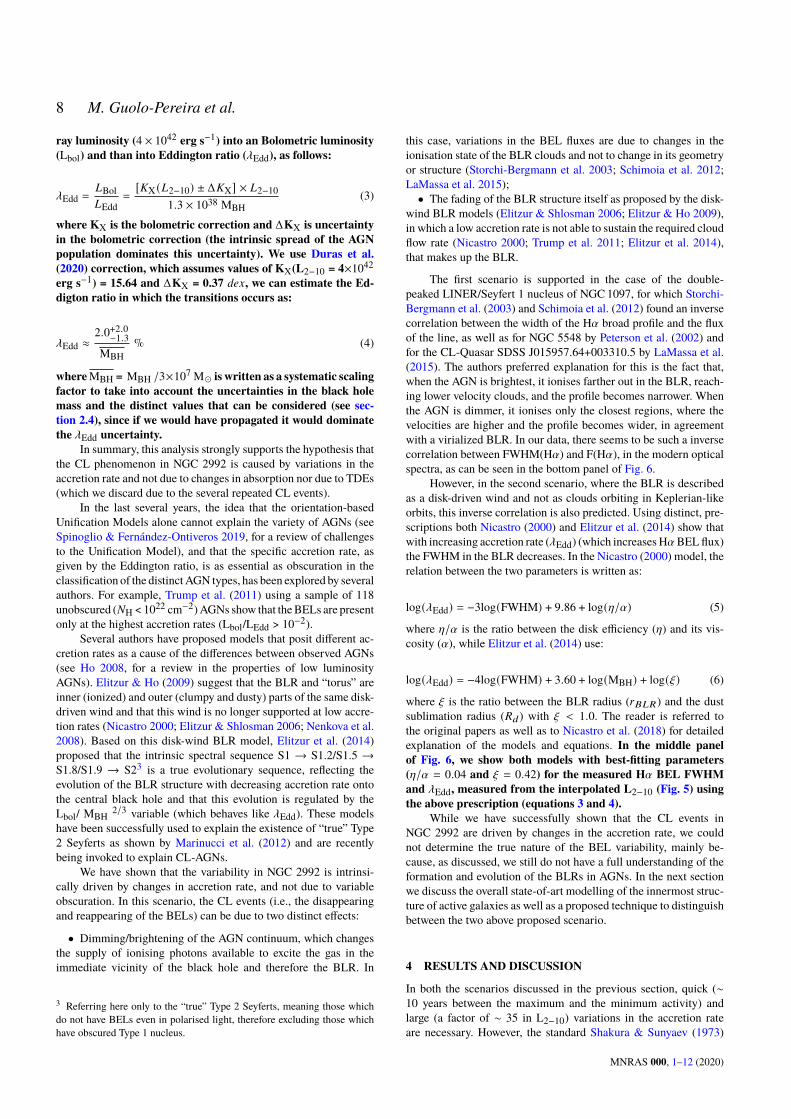
8 M. Guolo-Pereira et al.
ray luminosity (4 × 1042 erg s−1) into an Bolometric luminosity
(Lbol) and than into Eddington ratio (_Edd), as follows:
_Edd =!Bol
!Edd=
[ X (!2−10) ± Δ X] × !2−10
1.3 × 1038 MBH
(3)
where KX is the bolometric correction and ΔKX is uncertainty
in the bolometric correction (the intrinsic spread of the AGN
population dominates this uncertainty). We use Duras et al.
(2020) correction, which assumes values of KX(L2−10 = 4×1042
erg s−1) = 15.64 and ΔKX = 0.37 34G, we can estimate the Ed-
digton ratio in which the transitions occurs as:
_Edd ≈2.0+2.0
−1.3
MBH
% (4)
where MBH = MBH /3×107 M� is written as a systematic scaling
factor to take into account the uncertainties in the black hole
mass and the distinct values that can be considered (see sec-
tion 2.4), since if we would have propagated it would dominate
the _Edd uncertainty.
In summary, this analysis strongly supports the hypothesis thatthe CL phenomenon in NGC 2992 is caused by variations in theaccretion rate and not due to changes in absorption nor due to TDEs(which we discard due to the several repeated CL events).
In the last several years, the idea that the orientation-basedUnification Models alone cannot explain the variety of AGNs (seeSpinoglio & Fernández-Ontiveros 2019, for a review of challengesto the Unification Model), and that the specific accretion rate, asgiven by the Eddington ratio, is as essential as obscuration in theclassification of the distinct AGN types, has been explored by severalauthors. For example, Trump et al. (2011) using a sample of 118unobscured (#H < 1022 cm−2) AGNs show that the BELs are presentonly at the highest accretion rates (Lbol/LEdd > 10−2).
Several authors have proposed models that posit different ac-cretion rates as a cause of the differences between observed AGNs(see Ho 2008, for a review in the properties of low luminosityAGNs). Elitzur & Ho (2009) suggest that the BLR and “torus” areinner (ionized) and outer (clumpy and dusty) parts of the same disk-driven wind and that this wind is no longer supported at low accre-tion rates (Nicastro 2000; Elitzur & Shlosman 2006; Nenkova et al.2008). Based on this disk-wind BLR model, Elitzur et al. (2014)proposed that the intrinsic spectral sequence S1 → S1.2/S1.5 →
S1.8/S1.9 → S23 is a true evolutionary sequence, reflecting theevolution of the BLR structure with decreasing accretion rate ontothe central black hole and that this evolution is regulated by theLbol/ MBH
2/3 variable (which behaves like _Edd). These modelshave been successfully used to explain the existence of “true” Type2 Seyferts as shown by Marinucci et al. (2012) and are recentlybeing invoked to explain CL-AGNs.
We have shown that the variability in NGC 2992 is intrinsi-cally driven by changes in accretion rate, and not due to variableobscuration. In this scenario, the CL events (i.e., the disappearingand reappearing of the BELs) can be due to two distinct effects:
• Dimming/brightening of the AGN continuum, which changesthe supply of ionising photons available to excite the gas in theimmediate vicinity of the black hole and therefore the BLR. In
3 Referring here only to the “true” Type 2 Seyferts, meaning those whichdo not have BELs even in polarised light, therefore excluding those whichhave obscured Type 1 nucleus.
this case, variations in the BEL fluxes are due to changes in theionisation state of the BLR clouds and not to change in its geometryor structure (Storchi-Bergmann et al. 2003; Schimoia et al. 2012;LaMassa et al. 2015);
• The fading of the BLR structure itself as proposed by the disk-wind BLR models (Elitzur & Shlosman 2006; Elitzur & Ho 2009),in which a low accretion rate is not able to sustain the required cloudflow rate (Nicastro 2000; Trump et al. 2011; Elitzur et al. 2014),that makes up the BLR.
The first scenario is supported in the case of the double-peaked LINER/Seyfert 1 nucleus of NGC 1097, for which Storchi-Bergmann et al. (2003) and Schimoia et al. (2012) found an inversecorrelation between the width of the HU broad profile and the fluxof the line, as well as for NGC 5548 by Peterson et al. (2002) andfor the CL-Quasar SDSS J015957.64+003310.5 by LaMassa et al.(2015). The authors preferred explanation for this is the fact that,when the AGN is brightest, it ionises farther out in the BLR, reach-ing lower velocity clouds, and the profile becomes narrower. Whenthe AGN is dimmer, it ionises only the closest regions, where thevelocities are higher and the profile becomes wider, in agreementwith a virialized BLR. In our data, there seems to be such a inversecorrelation between FWHM(HU) and F(HU), in the modern opticalspectra, as can be seen in the bottom panel of Fig. 6.
However, in the second scenario, where the BLR is describedas a disk-driven wind and not as clouds orbiting in Keplerian-likeorbits, this inverse correlation is also predicted. Using distinct, pre-scriptions both Nicastro (2000) and Elitzur et al. (2014) show thatwith increasing accretion rate (_Edd) (which increases HUBEL flux)the FWHM in the BLR decreases. In the Nicastro (2000) model, therelation between the two parameters is written as:
log(_Edd) = −3log(FWHM) + 9.86 + log([/U) (5)
where [/U is the ratio between the disk efficiency ([) and its vis-cosity (U), while Elitzur et al. (2014) use:
log(_Edd) = −4log(FWHM) + 3.60 + log(MBH) + log(b) (6)
where b is the ratio between the BLR radius (A�!') and the dustsublimation radius ('3) with b < 1.0. The reader is referred tothe original papers as well as to Nicastro et al. (2018) for detailedexplanation of the models and equations. In the middle panel
of Fig. 6, we show both models with best-fitting parameters
([/U = 0.04 and b = 0.42) for the measured HU BEL FWHM
and _Edd, measured from the interpolated L2−10 (Fig. 5) using
the above prescription (equations 3 and 4).
While we have successfully shown that the CL events inNGC 2992 are driven by changes in the accretion rate, we couldnot determine the true nature of the BEL variability, mainly be-cause, as discussed, we still do not have a full understanding of theformation and evolution of the BLRs in AGNs. In the next sectionwe discuss the overall state-of-art modelling of the innermost struc-ture of active galaxies as well as a proposed technique to distinguishbetween the two above proposed scenario.
4 RESULTS AND DISCUSSION
In both the scenarios discussed in the previous section, quick (∼10 years between the maximum and the minimum activity) andlarge (a factor of ∼ 35 in L2−10) variations in the accretion rateare necessary. However, the standard Shakura & Sunyaev (1973)
MNRAS 000, 1–12 (2020)

Changing Look events in NGC 2992 9
0
5
10
15
L 210
[1042
erg
s1 ]
0
10
20
30
40
50
F(H
)[1
013
erg
cm2
s1 ]
2.5
5.0
7.5
10.0
12.5
15.0
F(Fe
K)
[10
14er
gcm
2s
1 ]
0
2
4
6
8F(
H)
[10
13er
gcm
2s
1 ]
2005 2010 2015 2020Obs. Date (yr)
6
8
10
12
NH
[1021
cm2 ]
2005 2010 2015 2020Obs. Date (yr)
4
6
8
10
12
14
H/H
Figure 4. X-ray (left) and optical (right) properties from 2005 to 2020. Fromtop to bottom in the X-ray panels: Intrinsic 2-10 keV Luminosity (L2−10),narrow Fe KU line flux, and the column density (#H). From top to bottomin the optical panels: Flux of the HU BEL, the flux of the HV BEL, and theBalmer decrement (HU/HV). In the optical panels, the red lines represent alower limit for the detection of the lines, being measured as the flux of a linewith a signal to noise ratio equal to 3.
Not Detected DetectedH BEL
0.5
1
2
5
10
1520
L 210
[1042
erg
s1 ]
Figure 5. Interpolated intrinsic 2-10 keV x-ray luminosity (L2−10) for
each optical spectrum as function of the detection or non-detection of
the HU BEL. Showing a clear lower boundary of L2−10 ≈ 4 × 1042 erg
s−1 for the detection of the component.
accretion disk model does not support such variations, given thatfor AGN scales (where the model still predicts the existence of ageometrically thin disk, H � R ) the viscous time scale of the diskis in the order of 104 to 105 years, greatly exceeding the timescalesover which CL transitions are known to occur. This incompatibilitywas noticed long ago (e.g. Koratkar & Blaes 1999; Antonucci 2013),but just recently some modification or alternatives to the applicationof Shakura & Sunyaev (1973) model to AGNs have been proposedin order to explain the increasing number of the discovery of theseCL sources.
The Eddington ratio in which the BEL transitions occurs in
0.2 0.5 1.0 2.0 5.0 10Edd / MBH (%)
0
10
20
30
40
50
F(H
)[1
013
erg
cm2
s1 ]
0.2 0.5 1.0 2.0 5.0 10Edd / MBH (%)
1500
2000
2500
3000
3500
FWHM
(H)[
kms
1 ]
Elitzur+2014 ( = 0.43)Nicastro 2000 ( / = 0.04)
0 10 20 30 40 50F(H ) [10 13 erg cm 2 s 1]
1500
2000
2500
3000
3500
FWHM
(H)[
kms
1 ]
Dalla Bonta+2020MBH = 0.5 × 10⁷MMBH = 1.5 × 10⁷MMBH = 3.0 × 10⁷M
Figure 6. Top: flux of HU BEL as function of Eddington Ratio (_Edd),
measured using equations 3 and 4, for each modern optical spectrum.
Middle: FHWM of HU BEL as function of _Edd for each modern optical
spectrum. Blue and orange dashed lines are, respectively, are the best-
fitting Nicastro (2000) and Elitzur et al. (2014) disk-wind models (see
section 3.3 and equations 5 and 6). MBH = MBH /3 × 107 M� is written
as a systematic scaling factor to take into account the uncertainties in
the black hole mass and the distinct values that can be considered (see
section 2.4). Bottom: FHWM of HU broad as function of HU BEL flux
for for each modern optical spectrum. Each dashed line represent the
Dalla Bontà et al. (2020) relation between the two parameters, assuming
a constant Balmer decrement of 9 and Calzetti et al. (2000) extinction
law, for distinct supermassive black hole masses ( MBH) in the range
discussed in section 2.4.
NGC 2992 contains the critical value at which there is a state tran-sition between a radiatively inefficient accretion flow (RIAF) anda thin accretion disk (_Edd ∼ 0.01; e.g. Xie & Yuan 2012). Thesimilarity between these values suggests that NGC 2992 is operat-ing at the threshold mass accretion rate between the two accretionmodes. Indeed, Sniegowska et al. (2020) proposed an explanationfor the sources displaying multiple quasi-periodic CL phenomenaaccording to which they would be operating at a few per cent ofthe Eddington limit. They argue that the outbursts are caused by theradiation pressure instability operating in the narrow ring betweenthe standard (Shakura & Sunyaev 1973) thin pressure dominatedouter disk and the hot optically thin inner RIAF (Yuan & Narayan2014). The corresponding limit cycle is responsible for periodicoutbursts, and the timescales are therefore much shorter than the
MNRAS 000, 1–12 (2020)

10 M. Guolo-Pereira et al.
standard viscous timescale due to the narrowness of the unstableradial zone.
Dexter & Begelman (2018) propose that alternatively AGNaccretion discs are vertically supported by magnetic pressure whichmakes it geometrically thick (H/R between 0.1 and 1.0) at all lumi-nosities. Jiang & Blaes (2020) show, for a 5 × 10⁸ M� mass blackhole, using three dimensional radiation magneto-hydrodynamicsimulations, that under this assumption the Rosseland mean opac-ity is expected to be larger than the electron scattering value, andthe iron opacity bump then causes the disk to be convectively un-stable. This results in strong fluctuations in surface density andheating of the disk. The opacity drops with increasing temperatureand convection is suppressed. The disk cools down and the wholeprocess repeats. This causes strong oscillations of the disk scaleheight and luminosity variations by more than a factor of ≈ 3 – 6over timescales of few years. They argue that since the iron opacitybump will move to different locations of the disk for black holeswith different masses and accretion rates, this is a physical mecha-nism that can explain the accretion rate variability of AGN with awide range of amplitudes over a time scale of years to decades.
Even with the possibility of such rapid variability in the accre-tion rate (given some of these alternatives to the classical accretiondisk) the cause of the type transition remains uncertain, dimmingof the ionising source or fading of the BLR structure itself. Byusing radiative transfer Monte Carlo simulations to test the multi-ple causes of the CL phenomenon, Marin (2017) argues that thedifferences between these two scenarios can only be observable inpolarised light: in the ionising source dimming scenario the polari-sation properties between the high and low flux state should be thesame, while that for the BLR fading a decrease in the degree of po-larisation and a rotation in the polarization angle are expected in thelow flux state. We had access to a spectropolarimetric observationof NGC 2992 obtained in 2006 (Robinson et al., in prep), when thegalaxy was at a dim state (see Fig. 1). It shows no signs of BELin the polarimetric spectrum (as well as in normal flux). In orderto test Marin (2017) predictions we would need a recent (with theAGN at its bright state) observations as well. As this data is notavailable to us now, the exact intrinsic cause of the CL-AGN eventsin NGC 2992 is still an open question. We join these authors inadvocating for systematic polarimetric observations of CL-AGN inorder to fully understand their true nature. In this sense, follow upobservations (polarimetric or not) of NGC 2992 in the next decadeswill continue to help constrain the physics of AGNs. Furthermore,this source joins several others in the literature that show that theaccretion rate is a fundamental variable for any model that tries tounify the AGN zoology, and that viewing angle or obscuration ef-fects alone cannot fully explain differences seen in SMBH activityin galaxies.
5 CONCLUSIONS
We have analysed the historical X-ray and optical observations ofthe Seyfert galaxy NGC 2992, from 1978 to 2019, focusing on itsCL events. The main results are:
• The source presents large intrinsic X-ray luminosity variabilityranging from 4.9 × 1041 erg s−1up to 1.7 × 1043 erg s−1;
• The source presents several transitions between type 2 Seyfertto intermediate-type spectrum, losing and regaining its HU BEL ontimescales of several years;
• We ruled out TDEs or variable obscuration as causes of thetype transitions. We show that the presence (and the flux) of the
HU BEL is directly correlated with the 2-10 keV X-ray luminosity:a minimum value of L2−10 ≈ 4 × 1042 erg s−1 is necessary for itsappearance. This value translates to a Eddington ratio of 2.0+2.0
−1.3%,
if we assume MBH = 3 × 10⁷ M� . Due to its faintness, the unam-biguously detection of the HV BEL was only possible in the mostrecent spectrum, at even higher accretion rates of _Edd ≈ 5–8%;
• We find a correlation between the narrow Fe KU flux and _Edd,and an anti-correlation between full width at half maximum of HUBEL and _Edd, as predicted by the disk-wind BLR models.
• Two possible scenarios for type transitions are still open: ei-ther the dimming (brightening) of the AGN continuum luminosity,which reduces (increases) the supply of ionising photons available toexcite the gas in the immediate vicinity of the black hole (LaMassaet al. 2015) or the disappearance of the BLR structure itself occurs asthe low accretion efficiency is not able to sustain the required cloudflow rate in a disk-wind BLR model (Elitzur & Shlosman 2006;Trump et al. 2011; Elitzur et al. 2014). Multi-epoch polarimetricobservations may distinguish between the two scenarios.
• This study supports the idea that the accretion rate is a funda-mental variable in determining the observed AGN type, and there-fore should be included in a more complete model to unify the AGNzoology.
ACKNOWLEGMENTS
We would like to thank all those authors and observatories that madepublic their data making this work possible, specially Michael Cren-shaw for providing the Trippe et al. (2008) spectrum and AdamThomas for helping us access the S7 survey (Dopita et al. 2015)data. MGP also would like to thanks Michael Fausnaugh for mak-ing mapspec public available as well as for his comments andsuggestions on the paper.
DATA AVAILABILITY
The GMOS and MUSE spectral data cubes are public available atthe Gemini and ESO archive web pages, respectively. The other dataunderlying this article will be shared on reasonable request to thecorresponding author.
REFERENCES
Allen M. G., Dopita M. A., Tsvetanov Z. I., Sutherland R. S., 1999, ApJ,511, 686
Andrillat Y., Souffrin S., 1971, A&A, 11, 286Antonucci R., 1993, ARA&A, 31, 473Antonucci R., 2013, Nature, 495, 165Aretxaga I., Joguet B., Kunth D., Melnick J., Terlevich R. J., 1999, The
Astrophysical Journal, 519, L123–L126Avni Y., 1976, ApJ, 210, 642Barlow R., 2003a, in Lyons L., Mount R., Reitmeyer R., eds, Statistical
Problems in Particle Physics, Astrophysics, and Cosmology. p. 250(arXiv:physics/0401042)
Barlow R., 2003b, arXiv e-prints, p. physics/0306138Barlow R., 2004, Asymmetric Statistical Errors
(arXiv:physics/0406120)Bianchi S., Piconcelli E., Chiaberge M., Bailón E. J., Matt G., Fiore F., 2009,
ApJ, 695, 781Busko I. C., Steiner J. E., 1990, MNRAS, 245, 470Calzetti D., Armus L., Bohlin R. C., Kinney A. L., Koornneef J., Storchi-
Bergmann T., 2000, ApJ, 533, 682
MNRAS 000, 1–12 (2020)

Changing Look events in NGC 2992 11
Cid Fernandes R., Mateus A., Sodré L., Stasińska G., Gomes J. M., 2005,MNRAS, 358, 363
Cohen R. D., Rudy R. J., Puetter R. C., Ake T. B., Foltz C. B., 1986, ApJ,311, 135
Cooke B. A., et al., 1978, MNRAS, 182, 489Corral A., Della Ceca R., Caccianiga A., Severgnini P., Brunner H., Carrera
F. J., Page M. J., Schwope A. D., 2011, A&A, 530, A42Dai X., Chartas G., Eracleous M., Garmire G. P., 2004, The Astrophysical
Journal, 605, 45–57Dalla Bontà E., et al., 2020, The Astrophysical Journal, 903, 112Denney K. D., et al., 2014, The Astrophysical Journal, 796, 134Dexter J., Begelman M. C., 2018, Monthly Notices of the Royal Astronom-
ical Society: Letters, 483, L17–L21Dopita M. A., et al., 2015, ApJS, 217, 12Duras F., et al., 2020, Astronomy & Astrophysics, 636, A73Durret F., Bergeron J., 1988, A&AS, 75, 273Elitzur M., 2012, The Astrophysical Journal, 747, L33Elitzur M., Ho L. C., 2009, The Astrophysical Journal, 701, L91–L94Elitzur M., Shlosman I., 2006, ApJ, 648, L101Elitzur M., Ho L. C., Trump J. R., 2014, MNRAS, 438, 3340Eracleous M., Halpern J. P., 2001, The Astrophysical Journal, 554, 240Eracleous M., Livio M., Halpern J. P., Storchi-Bergmann T., 1995, ApJ, 438,
610Fausnaugh M. M., 2017, Publications of the Astronomical Society of the
Pacific, 129, 024007García-Lorenzo B., Arribas S., Mediavilla E., 2001, A&A, 378, 787Gilli R., Maiolino R., Marconi A., Risaliti G., Dadina M., Weaver K. A.,
Colbert E. J. M., 2000, A&A, 355, 485Graham M. J., et al., 2019, Monthly Notices of the Royal Astronomical
SocietyGültekin K., et al., 2009, ApJ, 698, 198Guo H., Sun M., Liu X., Wang T., Kong M., Wang S., Sheng Z., He Z.,
2019, ApJ, 883, L44Guolo-Pereira M., Ruschel-Dutra D., Storchi-Bergmann T., Schnorr-Müller
A., Cid Fernandes R., Couto G., Dametto N., Hernandez-Jimenez J. A.,2021, MNRAS, 502, 3618
Ho L. C., 2008, Annual Review of Astronomy and Astrophysics, 46, 475Jiang Y.-F., Blaes O., 2020, The Astrophysical Journal, 900, 25Kalberla P. M. W., Burton W. B., Hartmann D., Arnal E. M., Bajaja E.,
Morras R., Pöppel W. G. L., 2005, A&A, 440, 775Keel W. C., 1996, ApJS, 106, 27Kollatschny W., Ochmann M. W., Zetzl M., Haas M., Chelouche D., Kaspi
S., Pozo Nuñez F., Grupe D., 2018, Astronomy & Astrophysics, 619,A168
Kollatschny W., et al., 2020, Astronomy & Astrophysics, 638, A91Koratkar A., Blaes O., 1999, Publications of the Astronomical Society of
the Pacific, 111, 1LaMassa S. M., et al., 2015, Astrophysical Journal, 800, 144Lampton M., Margon B., Bowyer S., 1976, ApJ, 208, 177Lawrence A., 2018, Nature Astronomy, 2, 102Liu H., Wu Q., Lyu B., Yan Z., 2019, Evidence for changing-look AGNs is
caused by change of accretion mode (arXiv:1912.03972)MacLeod C. L., et al., 2016, MNRAS, 457, 389Maccacaro T., Perola G. C., Elvis M., 1982, ApJ, 257, 47Marchese E., Braito V., Della Ceca R., Caccianiga A., Severgnini P., 2012,
MNRAS, 421, 1803Marin F., 2017, Astronomy & Astrophysics, 607, A40Marinucci A., Bianchi S., Nicastro F., Matt G., Goulding A. D., 2012, The
Astrophysical Journal, 748, 130Marinucci A., Risaliti G., Wang J., Bianchi S., Elvis M., Matt G., Nardini E.,
Braito V., 2013, Monthly Notices of the Royal Astronomical Society,429, 2581–2586
Marinucci A., Bianchi S., Braito V., Matt G., Nardini E., Reeves J., 2018,MNRAS, 478, 5638
Marinucci A., Bianchi S., Braito V., De Marco B., Matt G., Middei R., Nar-dini E., Reeves J. N., 2020, Monthly Notices of the Royal AstronomicalSociety, p. staa1683
Marquez I., Boisson C., Durret F., Petitjean P., 1998, A&A, 333, 459
Matt G., Guainazzi M., Maiolino R., 2003, Monthly Notices of the RoyalAstronomical Society, 342, 422–426
McElroy R. E., et al., 2016, A&A, 593, L8Mingozzi M., et al., 2019, A&A, 622, A146Murphy K. D., Yaqoob T., Terashima Y., 2007, The Astrophysical Journal,
666, 96–108Murphy K. D., Nowak M. A., Marshall H. L., 2017, ApJ, 840, 120Mushotzky R. F., 1982, ApJ, 256, 92Nandra K., Pounds K. A., 1994, MNRAS, 268, 405Nelson C. H., Whittle M., 1995, ApJS, 99, 67Nenkova M., Sirocky M. M., Nikutta R., Ivezić Ž., Elitzur M., 2008, ApJ,
685, 160Nicastro F., 2000, The Astrophysical Journal, 530, L65–L68Nicastro F., Mathur S., Krongold Y., 2018, When a Seyfert. . . ...has a
Crash on a Model, doi:10.5281/zenodo.1473677, https://doi.org/10.5281/zenodo.1473677
Oknyansky V. L., Winkler H., Tsygankov S. S., Lipunov V. M., GorbovskoyE. S., van Wyk F., Buckley D. A. H., Tyurina N. V., 2019, MNRAS,483, 558
Osmer P. S., Smith M. G., Weedman D. W., 1974, ApJ, 192, 279Osterbrock D. E., 1981, ApJ, 249, 462Osterbrock D. E., Ferland G. J., 2006, Astrophysics of gaseous nebulae and
active galactic nucleiPastoriza M., Gerola H., 1970, Astrophys. Lett., 6, 155Peterson B. M., 1993, PASP, 105, 247Peterson B. M., Pogge R. W., Wanders I., Smith S. M., Romanishin W.,
1995, Publications of the Astronomical Society of the Pacific, 107, 579Peterson B. M., et al., 2002, The Astrophysical Journal, 581Ponti G., Papadakis I., Bianchi S., Guainazzi M., Matt G., Uttley P., Bonilla
N. F., 2012, A&A, 542, A83Possolo A., Merkatas C., Bodnar O., 2019, Metrologia, 56, 045009Ptak A., Yaqoob T., Murphy K., Suzaku Ngc 2992 Team 2007, Progress of
Theoretical Physics Supplement, 169, 252Puccetti S., Fiore F., Risaliti G., Capalbi M., Elvis M., Nicastro F., 2007,
MNRAS, 377, 607Qiao E., Liu B. F., 2013, The Astrophysical Journal, 764, 2Ricci C., Ueda Y., Paltani S., Ichikawa K., Gand hi P., Awaki H., 2014,
MNRAS, 441, 3622Risaliti G., Elvis M., Bianchi S., Matt G., 2010, Monthly Notices of the
Royal Astronomical Society: Letters, p. no–noRuan J. J., et al., 2016, The Astrophysical Journal, 826, 188Runnoe J. C., et al., 2016, MNRAS, 455, 1691Ruschel-Dutra D., 2020, danielrd6/ifscube v1.0,
doi:10.5281/zenodo.3945237, https://doi.org/10.5281/
zenodo.3945237
Schimoia J. S., Storchi-Bergmann T., Nemmen R. S., Winge C., EracleousM., 2012, ApJ, 748, 145
Schnorr-Müller A., et al., 2016, MNRAS, 462, 3570Shakura N. I., Sunyaev R. A., 1973, A&A, 500, 33Shappee B. J., et al., 2014, ApJ, 788, 48Sheng Z., Wang T., Jiang N., Yang C., Yan L., Dou L., Peng B., 2017, The
Astrophysical Journal, 846, L7Shu X. W., Yaqoob T., Murphy K. D., Braito V., Wang J. X., Zheng W.,
2010, The Astrophysical Journal, 713, 1256–1265Shuder J. M., 1980, ApJ, 240, 32Sniegowska M., Czerny B., Bon E., Bon N., 2020, A possible mecha-
nism for multiple changing look phenomenon in Active Galactic Nuclei(arXiv:2007.06441)
Spinoglio L., Fernández-Ontiveros J. A., 2019, AGN types and unificationmodel (arXiv:1911.12176)
Stoklasová I., Ferruit P., Emsellem E., Jungwiert B., Pécontal E., SánchezS. F., 2009, Astronomy & Astrophysics, 500, 1287–1325
Storchi-Bergmann T., Schnorr-Müller A., 2019, Nature Astronomy, 3, 48Storchi-Bergmann T., Baldwin J. A., Wilson A. S., 1993, ApJ, 410, L11Storchi-Bergmann T., et al., 2003, ApJ, 598, 956Swank J. H., 2006, Advances in Space Research, 38, 2959Theureau G., Hanski M. O., Coudreau N., Hallet N., Martin J.-M., 2007,
A&A, 465, 71
MNRAS 000, 1–12 (2020)

12 M. Guolo-Pereira et al.
Tohline J. E., Osterbrock D. E., 1976, ApJ, 210, L117Tremaine S., et al., 2002, ApJ, 574, 740Trippe M. L., Crenshaw D. M., Deo R., Dietrich M., 2008, AJ, 135, 2048Trump J. R., et al., 2011, The Astrophysical Journal, 733, 60Turner T. J., Pounds K. A., 1989, MNRAS, 240, 833Urry C. M., Padovani P., 1995, PASP, 107, 803Veilleux S., Shopbell P. L., Miller S. T., 2001, AJ, 121, 198Veron P., Lindblad P. O., Zuiderwijk E. J., Veron M. P., Adam G., 1980,
A&A, 87, 245Wang J., Xu D. W., Wang Y., Zhang J. B., Zheng J., Wei J. Y., 2019, The
Astrophysical Journal, 887, 15Ward M., Penston M. V., Blades J. C., Turtle A. J., 1980, MNRAS, 193, 563Weaver K. A., Nousek J., Yaqoob T., Mushotzky R. F., Makino F., Otani C.,
1996, ApJ, 458, 160Winter L. M., Mushotzky R. F., Reynolds C. S., Tueller J., 2009, ApJ, 690,
1322Woo J.-H., Urry C. M., 2002, ApJ, 579, 530Xie F.-G., Yuan F., 2012, MNRAS, 427, 1580Yang Q., et al., 2018, ApJ, 862, 109Yaqoob T., 1998, ApJ, 500, 893Yaqoob T., et al., 2007, PASJ, 59, 283Yuan F., Narayan R., 2014, ARA&A, 52, 529van Groninge E., Wanders I., 1992, PASP, 104, 700van Groningen E., Wanders I., 1992, PASP, 104, 700van Steenberg M. E., Shull J. M., 1988, ApJS, 67, 225
APPENDIX A: PROPAGATION OF ASYMMETRIC
UNCERTAINTIES
When the underlying likelihood function of a parameter is not sym-metric, the error distribution will also be asymmetric. Differentorigins of asymmetry are discussed in detail by Barlow (2003a,b)and Barlow (2004). In high-energy astrophysics it is related to thelow photon counting. In this case, the estimated parameters areusually reported in a form like G+Dr
−Dl. Where G is the best-fitting
parameter (minimum j2) and Dl and Dr are the draw where theΔj2 curve reaches some value, for classical 1f (68%) confidencelevel Δj2
= 1.0, however the 90% confidence level (Δj2= 2.7) is
the most employed in X-ray astronomy (Avni 1976; Lampton et al.1976; Yaqoob 1998).
Usually, one needs to calculate a function of one or more quan-tities, and propagate its uncertainties. In most circumstances, wellknown “Error Propagation” formulas are adequate. But there aresome assumptions and approximations under the Error Propaga-tion, and if they fail, the method is invalid. These assumptions canbe summarised as: the errors are Normally distributed (Gaussianerrors) and they are relatively small. For asymmetric errors in as-tronomy any of these assumptions can be made; if the asymmetryis really small, rounding/averaging the negative and the positive er-rors into a single value and making the distribution symmetric doesnot change the result much. But when the values are not appropri-ate to do that, researchers often tend to put two error values intoquadrature separately and combine them in the result. Actually thisis not a valid method due to violation of the Central Limit Theorem(Barlow 2003b). Eventually more sophisticated methods are neededto use: we present here a Python-based Monte Carlo solution forthis problem, based in a combination of Barlow (2004) and Possoloet al. (2019) derivations.
During this research we faced the problem that even withnumerous of uncertainties propagation tools publicly-available(e.g. astropy.uncertainty, uncertainties) none of themare able to handle asymmetric uncertainties as we needed,due to the assumptions stated above. We therefore created theasymmetric_uncertainties Python package, the main idea ofthe code is to generate a random sample from the likelihood func-tion and use this sample in other calculations (Possolo et al. 2019).The code assumes a “Variable Width Gaussian” likelihood, which,as shown by Barlow (2004), reproduces very well the underlyinglikelihood of low counting measurements, and, in contrast to, forexample, a “Generalised Poisson” distribution, has a unique and an-alytical solution for given values of G, Dl and Dr at a given confidencelevel (Δj2). From this likelihood the code generates a random sam-ple of data, that can be passed as parameters for any type of function.Simple operations are deal internally by the code and the more so-phisticated ones can be easy performed by the user, for example:L2−10 values in Table 1 whose uncertainties were propagated fromΓ and #H uncertainties; as well as the statistical tests (rB and pvalue)in Fig. 2. The resulting sample is then fitted by the code return-ing the nominal value and the propagated uncertainties. The codeis publicly-available at github4 where examples in how to use thecode are also presented.
This paper has been typeset from a TEX/LATEX file prepared by the author.
4 https://github.com/muryelgp/asymmetric_uncertainties
MNRAS 000, 1–12 (2020)