Nutrient utilization ratios in the Polar Frontal Zone in the Australian sector of the Southern...
12
Nutrient utilization ratios in the Polar Frontal Zone in the Australian sector of the Southern Ocean: A model Xiujun Wang, 1,2 Richard J. Matear, 3 and Thomas W. Trull Antarctic CRC, University of Tasmania, Hobart, Tasmania, Australia Received 28 May 2002; revised 8 October 2002; accepted 13 October 2002; published 22 January 2003. [1] To investigate the non-Redfield N/P depletion ratio in the Polar Frontal Zone (PFZ) of the Southern Ocean, we simulated the seasonal nitrate, phosphate, and silicate cycle in the upper ocean with a biophysical model. Total phytoplankton biomass was prescribed from the Sea-viewing Wide Field-of-view Sensor (SeaWiFS) estimates, and we included two phytoplankton types, diatoms and nondiatoms. We set the nondiatoms N/P uptake ratio to 16 while the diatoms N/P and N/Si ratios were determined by fitting the observed seasonal nitrate, phosphate, and silicate cycle in the mixed layer. The best model fit to the observations required an annual N/P utilization ratio of 13.2, but this low N/P ratio still overestimated the nitrate utilization during the summer. We considered three mechanisms for improving the simulated nitrate cycle: (1) seasonal variation in the N/P ratio of the horizontal nutrient supply to the PFZ, (2) different remineralization length scales for particulate organic nitrogen (PON) and particulate organic phosphorus (POP), and (3) seasonal accumulation and decomposition of labile dissolved and suspended organic matter (OM). Model simulations showed that the seasonal variability in the N/P ratio of horizontal supply failed to reduce the simulated excess nitrate utilization in summer. Preferential recycling of PON compared to POP below the mixed layer degrades the simulation and cannot produce results that satisfy both the observed seasonal nitrate and phosphate cycle in the mixed layer. The most realistic model simulation was obtained with preferential recycling of POP over PON, but this mechanism alone was incapable of satisfying the summer nitrate and phosphate data. With the inclusion of an OM pool in our model we were able to reproduce the observed seasonal mixed layer nitrate and phosphate cycles. Satisfactory results can be achieved through various combinations of the N/P ratio of OM and the lifetime of the OM. Seasonal observations of dissolved and suspended organic phosphorus, nitrogen and carbon are needed to confirm their role. The important conclusion of our model study is that in the PFZ the annual nutrient utilization ratio of nitrate to phosphate is considerably less than the classical Redfield value of 16. INDEX TERMS: 4207 Oceanography: General: Arctic and Antarctic oceanography; 4255 Oceanography: General: Numerical modeling; 4572 Oceanography: Physical: Upper ocean processes; 4845 Oceanography: Biological and Chemical: Nutrients and nutrient cycling; KEYWORDS: Redfield ratio, Southern Ocean, nutrients, export production Citation: Wang, X., R. J. Matear, and T. W. Trull, Nutrient utilization ratios in the Polar Frontal Zone in the Australian sector of the Southern Ocean: A model, Global Biogeochem. Cycles, 17(1), 1009, doi:10.1029/2002GB001938, 2003. 1. Introduction [2] In the Southern Ocean, surface phosphate and nitrate are never completely consumed. This feature prompted Martin [1990] to hypothesize that enhanced oceanic uptake of CO 2 may occur with enhanced nutrient utilization. Model studies do show that increased nutrient utilization in the Southern Ocean could explain a large portion of the observed CO 2 decrease during the Last Glacial Maximum [Sigman and Boyle, 2000; Watson et al., 2000; Keeling and Visbeck, 2001]. Simulations of future climate change predict a continued slowdown in thermohaline overtuning in the Southern Ocean producing a net storage of carbon and nutrients in the interior of the Southern Ocean [Sarmiento et al., 1998; Matear and Hirst, 1999; Bopp et al., 2001]. A fundamental assumption in these models of past and future conditions is that the export of particulate organic matter (POM) from the euphotic zone and GLOBAL BIOGEOCHEMICAL CYCLES, VOL. 17, NO. 1, 1009, doi:10.1029/2002GB001938, 2003 1 Formerly at Institute of Antarctic and Southern Ocean Studies, University of Tasmania, Hobart, Tasmania, Australia. 2 Now at Earth System Science Interdisciplinary Center, University of Maryland, College Park, Maryland, USA. 3 Division of Marine Research, Commonwealth Scientific and Industrial Research Organisation, Hobart, Tasmania, Australia. Copyright 2003 by the American Geophysical Union. 0886-6236/03/2002GB001938$12.00 9 - 1
-
Upload
independent -
Category
Documents
-
view
0 -
download
0
Transcript of Nutrient utilization ratios in the Polar Frontal Zone in the Australian sector of the Southern...
Nutrient utilization ratios in the Polar Frontal Zone in the Australian
sector of the Southern Ocean: A model
Xiujun Wang,1,2 Richard J. Matear,3 and Thomas W. TrullAntarctic CRC, University of Tasmania, Hobart, Tasmania, Australia
Received 28 May 2002; revised 8 October 2002; accepted 13 October 2002; published 22 January 2003.
[1] To investigate the non-Redfield N/P depletion ratio in the Polar Frontal Zone (PFZ)of the Southern Ocean, we simulated the seasonal nitrate, phosphate, and silicate cyclein the upper ocean with a biophysical model. Total phytoplankton biomass was prescribedfrom the Sea-viewing Wide Field-of-view Sensor (SeaWiFS) estimates, and we includedtwo phytoplankton types, diatoms and nondiatoms. We set the nondiatoms N/P uptakeratio to 16 while the diatoms N/P and N/Si ratios were determined by fitting the observedseasonal nitrate, phosphate, and silicate cycle in the mixed layer. The best model fit tothe observations required an annual N/P utilization ratio of 13.2, but this low N/P ratio stilloverestimated the nitrate utilization during the summer. We considered three mechanismsfor improving the simulated nitrate cycle: (1) seasonal variation in the N/P ratio of thehorizontal nutrient supply to the PFZ, (2) different remineralization length scales forparticulate organic nitrogen (PON) and particulate organic phosphorus (POP), and (3)seasonal accumulation and decomposition of labile dissolved and suspended organicmatter (OM). Model simulations showed that the seasonal variability in the N/P ratio ofhorizontal supply failed to reduce the simulated excess nitrate utilization in summer.Preferential recycling of PON compared to POP below the mixed layer degrades thesimulation and cannot produce results that satisfy both the observed seasonal nitrate andphosphate cycle in the mixed layer. The most realistic model simulation was obtained withpreferential recycling of POP over PON, but this mechanism alone was incapable ofsatisfying the summer nitrate and phosphate data. With the inclusion of an OM pool inour model we were able to reproduce the observed seasonal mixed layer nitrate andphosphate cycles. Satisfactory results can be achieved through various combinations ofthe N/P ratio of OM and the lifetime of the OM. Seasonal observations of dissolved andsuspended organic phosphorus, nitrogen and carbon are needed to confirm their role.The important conclusion of our model study is that in the PFZ the annual nutrientutilization ratio of nitrate to phosphate is considerably less than the classical Redfieldvalue of 16. INDEX TERMS: 4207 Oceanography: General: Arctic and Antarctic oceanography; 4255
Oceanography: General: Numerical modeling; 4572 Oceanography: Physical: Upper ocean processes; 4845
Oceanography: Biological and Chemical: Nutrients and nutrient cycling; KEYWORDS: Redfield ratio, Southern
Ocean, nutrients, export production
Citation: Wang, X., R. J. Matear, and T. W. Trull, Nutrient utilization ratios in the Polar Frontal Zone in the Australian sector of the
Southern Ocean: A model, Global Biogeochem. Cycles, 17(1), 1009, doi:10.1029/2002GB001938, 2003.
1. Introduction
[2] In the Southern Ocean, surface phosphate and nitrateare never completely consumed. This feature prompted
Martin [1990] to hypothesize that enhanced oceanic uptakeof CO2 may occur with enhanced nutrient utilization. Modelstudies do show that increased nutrient utilization in theSouthern Ocean could explain a large portion of the observedCO2 decrease during the Last Glacial Maximum [Sigman andBoyle, 2000;Watson et al., 2000;Keeling and Visbeck, 2001].Simulations of future climate change predict a continuedslowdown in thermohaline overtuning in the Southern Oceanproducing a net storage of carbon and nutrients in the interiorof the Southern Ocean [Sarmiento et al., 1998; Matear andHirst, 1999; Bopp et al., 2001]. A fundamental assumption inthese models of past and future conditions is that the export ofparticulate organic matter (POM) from the euphotic zone and
GLOBAL BIOGEOCHEMICAL CYCLES, VOL. 17, NO. 1, 1009, doi:10.1029/2002GB001938, 2003
1Formerly at Institute of Antarctic and Southern Ocean Studies,University of Tasmania, Hobart, Tasmania, Australia.
2Now at Earth System Science Interdisciplinary Center, University ofMaryland, College Park, Maryland, USA.
3Division of Marine Research, Commonwealth Scientific and IndustrialResearch Organisation, Hobart, Tasmania, Australia.
Copyright 2003 by the American Geophysical Union.0886-6236/03/2002GB001938$12.00
9 - 1
its subsequent remineralization in the ocean interior occurswith a constant C/N/P ratio (e.g., the classical Redfield ratioof 106/16/1) [Redfield et al., 1963]. As discussed byDenmanet al. [1998], the modeled air-sea carbon fluxes are sensitiveto the C/N/P ratio and the potential for the marine biota toalter this ratio either spatially or temporally could signifi-cantly impact these fluxes. A recent study documented adecadal trend in these ratios in the Northern Hemisphere[Pahlow and Riebesell, 2000]. Therefore, it is important todetermine the stoichiometry of the exported material toaccurately model the regional CO2 uptake.[3] Oceanwide estimates of the stoichiometry of POM as
derived from either averaged phytoplankton assemblages[Redfield et al., 1963] or changes in C, N, and P alongisopycnal surfaces [Takahashi et al., 1985; Anderson andSarmiento, 1994] are consistent with the constant ‘‘Redfield’’stoichiometry. The latter studies yield basinwide estimates,but the method is not suitable for regional investigationbecause of the limited accuracy of the data, the smallchange in C, N, and P from the remineralization of POM,and the potential influence of diapycnal mixing.[4] Recent observations from the Southern Ocean docu-
ment N/P utilization ratios in the euphotic zone that are lessthan the classical Redfield value of 16 [Lourey and Trull,2001]. Observations show that Southern Ocean diatoms canproduce N/P utilization ratios between 4 and 10 [de Baar etal., 1997; Arrigo et al., 2000; Sweeney et al., 2000]. Thelow N/P utilization ratio for diatom usually occurs duringspring diatom blooms. Observations also show that N/Puptake ratio in diatoms decreases under Fe limited condition[Takeda, 1998; Boyd et al., 1999]. The observed non-Red-field nutrient utilization ratio may reflect the SouthernOcean’s unique phytoplankton community and the low ironconcentrations in the upper ocean which limits biologicalproduction [Sedwick et al., 1999; Boyd et al., 2000].[5] Our study investigates the non Redfield N/P utilization
ratios observed in the euphotic zone of the Polar Front Zone(PFZ) [Lourey and Trull, 2001]. We use model simulationsand seasonal observations to close the annual budgets ofnitrate, phosphate, and silicate in the upper ocean of the PFZand determine the nutrient utilization of nitrate, phosphate,and silicate. Our one-dimensional biophysical model couplesa vertical mixing model with a parameterization of horizontaladvective supply [Wang and Matear, 2001; Wang et al.,2001] to a two-functional group phytoplankton model (dia-toms and nondiatoms). In the phytoplankton model, thenondiatom phytoplankton satisfy the classical N/P uptakeratio of 16 but the diatoms are permitted to have a varying N/P and N/Si uptake ratios. We include silicate in the model toprovide additional constraints on the diatom production. Toclose the annual nitrate, phosphate, and silicate budgetsrequires the annual export from the euphotic zone to equalthe supply. The N/P ratio of the annual export may be lessthan 16, but this requires at least one of the followingpossibilities: (1) advective supply of N/P is less than 16;(2) there is preferential regeneration of particulate organicnitrogen (PON) into nitrate relative to particulate organicphosphorus (POP) into phosphate; or (3) the dissolved andsuspended organic materials (OM) accumulate nitrogen andphosphorus in non-Redfield proportions. The final possibil-
ity is that the Redfield N/P uptake only applies on a seasonalto annual timescale and non-Redfield uptake is a short-periodevent, which, averaged over the seasonal cycle, does notdrive the N/P uptake ratio far from the classical Redfieldvalue of 16 [Hoppema and Goeyens, 1999].[6] In this study we simulate the daily nutrient utilization
ratios in the euphotic zone and investigate the relationshipsbetween the observed low N/P depletion ratio in the upperocean and the proposed mechanisms for closing the annualnutrient budgets. Our simulations do not support thehypothesis that the observed low N/P utilization ratio inPFZ is a transient feature, which does not represent theseasonal nitrate and phosphate uptake.
2. Hydrographic Setting and Distribution ofNutrients
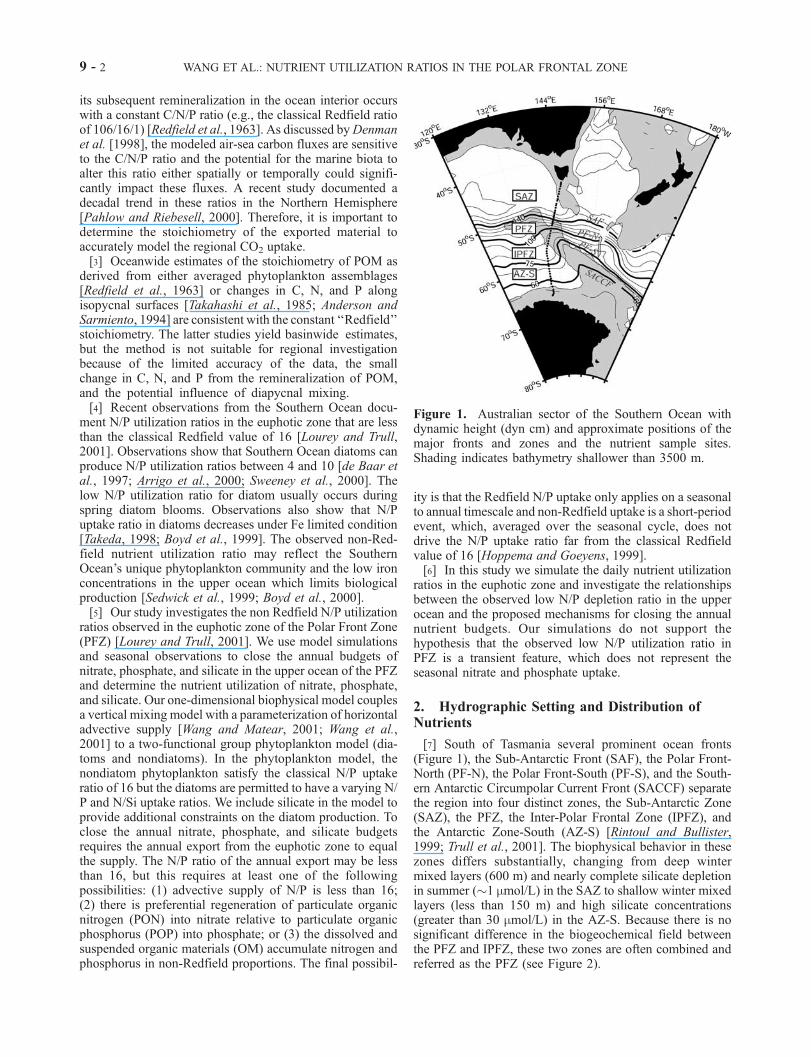
[7] South of Tasmania several prominent ocean fronts(Figure 1), the Sub-Antarctic Front (SAF), the Polar Front-North (PF-N), the Polar Front-South (PF-S), and the South-ern Antarctic Circumpolar Current Front (SACCF) separatethe region into four distinct zones, the Sub-Antarctic Zone(SAZ), the PFZ, the Inter-Polar Frontal Zone (IPFZ), andthe Antarctic Zone-South (AZ-S) [Rintoul and Bullister,1999; Trull et al., 2001]. The biophysical behavior in thesezones differs substantially, changing from deep wintermixed layers (600 m) and nearly complete silicate depletionin summer (�1 mmol/L) in the SAZ to shallow winter mixedlayers (less than 150 m) and high silicate concentrations(greater than 30 mmol/L) in the AZ-S. Because there is nosignificant difference in the biogeochemical field betweenthe PFZ and IPFZ, these two zones are often combined andreferred as the PFZ (see Figure 2).
Figure 1. Australian sector of the Southern Ocean withdynamic height (dyn cm) and approximate positions of themajor fronts and zones and the nutrient sample sites.Shading indicates bathymetry shallower than 3500 m.
9 - 2 WANG ET AL.: NUTRIENT UTILIZATION RATIOS IN THE POLAR FRONTAL ZONE

[8] Several repeat hydrographic and biogeochemicalmeasurements have been made along �140�E south ofTasmania in the 1990s [see Griffiths et al., 1999; Loureyand Trull, 2001; Trull et al., 2001; Rintoul and Trull,2001, and references therein]. Figure 2 shows the meri-dional nutrient distributions south of Tasmania and thenutrient ratios in the mixed layer in both the early winter(July, AU9501) and the late summer (March, AU9309). Inthe PFZ, the winter mixed layer phosphate, nitrate, andsilicate concentrations are high. In the summer, nutrientconcentrations decline with silicate nearly completelydepleted. At the SAF, there is a large meridional gradientin nitrate and phosphate that is slightly greater in thesummer than in the winter. At the PF-S, there is aprominent meridional silicate gradient in both the summerand winter.[9] The nitrate/phosphate ratio in the mixed layer of the
PFZ displays weak seasonality increasing from �14.5 inwinter to �16 in summer (Figure 2). In the winter, thenitrate/phosphate ratio in the mixed layer shows no prom-inent gradient across the SAF, but in the summer, the ratiofrom south of the front exceeds the value from north of thefront. In the mixed layer of the PFZ, the Si/N and Si/Pratios display clear seasonal changes (Figure 2). The ratios
are high in winter and decline towards zero as the silicate isnearly completely consumed during the spring-summergrowing season.
3. Model Description
[10] To describe the evolution of phosphate, nitrate, andsilicate concentrations in the euphotic zone we use thefollowing equations:
dP
dt¼ d
dzKZ
dP
dz
� �zfflfflfflfflfflfflfflffl}|fflfflfflfflfflfflfflffl{vertical
þFP tx tð Þ
txPy tð ÞPy
zfflfflfflfflfflfflfflfflfflffl}|fflfflfflfflfflfflfflfflfflffl{horizontal
� Q1rP1 þ Q2r
P2
� � QOP
zfflfflfflfflfflfflfflfflfflfflfflfflfflfflfflfflfflffl}|fflfflfflfflfflfflfflfflfflfflfflfflfflfflfflfflfflffl{biological
ð1Þ
dN
dt¼ d
dzKZ
dN
dz
� �þ F
N tx tð Þtx
Ny tð ÞNy
� Fe
Kf þ FeQ1r
N1 þ Q2r
N2
� �� QON ð2Þ
dSi
dt¼ d
dzKZ
dSi
dz
� �þ F
Si tx tð Þtx
Siy tð ÞSiy
� Si
Ksþ SiQ1r
Si1 : ð3Þ
[11] Vertical, horizontal, and biological processes affectthe evolutions of the nutrient concentrations. For the verticalprocess, the vertical mixing coefficient, Kz, is calculated byour one-dimensional upper ocean model forced by 6-hourlyheat fluxes, freshwater flux, and wind-stresses from theNation Center for Environmental Prediction (NCEP) dataset. The model and forcing fields are identical to what wasused at the PFZ site in the Wang and Matear [2001] study.The biological processes that affect the nutrient concentra-tions are the accumulation and remineralization of dissolvedand suspended organic phosphorus (OP) and nitrogen (ON),QOP and QON, and export of POP, PON, and biogenic silica(the first biological terms in equations (1), (2), and (3),respectively). For simulations without ON and OP pools,QOP and QON are set equal to zero.[12] Below the euphotic zone we model the evolution of
the phosphate concentrations as
dP
dt¼ d
dzKZ
dP
dz
� �zfflfflfflfflfflfflfflffl}|fflfflfflfflfflfflfflffl{vertical
þEP d
dzRP zð Þ
zfflfflfflfflfflfflffl}|fflfflfflfflfflfflffl{biological
ð4Þ
where EP is the export of POP from the euphotic zone andRP is the remineralization profile for POP. Similar equationsapply for nitrate and silicate where EN and ESi are the exportof PON and opal, respectively, and RN and RSi are theremineralization profiles for PON and opal, respectively. Inthe model, we assume that POP, PON and opal produced inthe euphotic zone are instantaneously exported andremineralized according to prescribed remineralizationprofiles.[13] In the following sections we will describe the param-
eterization of the horizontal and biological processes. For
Figure 2. Meridional change in (a) phosphate, (c) nitrate,and (e) silicate concentrations and in (b) nitrate/phosphate,(d) silicate/nitrate, and (f) silicate/phosphate ratios in thesurface waters from a winter cruise AU9501 (solid lines)and a summer cruise AU9309 (dotted lines).
WANG ET AL.: NUTRIENT UTILIZATION RATIOS IN THE POLAR FRONTAL ZONE 9 - 3

reference, the model parameters and their values are sum-marized in Table 1.
3.1. Horizontal Supply
[14] Ekman transport plays a major role in supplyingnutrients and cold salty water to the upper ocean in thePFZ [Wang and Matear, 2001; Wang et al., 2001]. Weparameterize the horizontal nutrient supply in the same wayas Wang and Matear [2001] parameterized the supply ofcold salty water. As given in equation (1), the horizontalsupply of phosphate is
FP tð Þ ¼ FP tx tð Þ
txPy tð ÞPy
: ð5Þ
where tx(t) is the eastward wind stress at time t, �tx is the 4-year (1995–1998) averaged eastward wind stress, Py(t) isthe meridional gradient of the phosphate at time t, and �Py isthe annual mean meridional phosphate gradient. The term�FP is the annual mean horizontal transport of phosphatenecessary to close the annual phosphate budget. Thehorizontal supply of nitrate and silicate is treated in thesame way with �FN and �FSi as the two parameters used toclose the annual mixed layer cycle of nitrate and silicate,respectively.[15] The meridional gradient of nitrate and phosphate
displays weak seasonality south of the SAF and in thePFZ. The corresponding N/P ratio of the mixed layernutrients is also nearly uniform (�14.5 in the winter and�16 in the summer, Figure 2). Hence, we initially use noseasonal variability in the meridional gradient of phosphateand nitrate (i.e., Py(t) = �Py and Ny(t) = �Ny) and we set �FN =14.5 �FP. For silicate, the meridional gradient is largest in thewinter and smallest in the summer (Figure 2). Based on theobservations, Siy(t) is calculated from silicate concentration(Si), Siy(t) = l(Si(t) � 0.5), where l is a constant (1 m�1).Our formulation produces a winter meridional gradient thatis approximately 6 times the summer gradient, which isconsistent with the observed seasonal changes in gradient atthe PFZ site.
3.2. Biological Model
[16] The biological model parameterizes the biologicaluptake of phosphate, nitrate, and silicate and the export of
particulate organic matter from the euphotic zone and theaccumulation and remineralization of labile OM.3.2.1. Phytoplankton Growth Model[17] Our model includes two phytoplankton types, dia-
toms (Phy1) and nondiatoms (Phy2). In equations (1) to (3),Q1 and Q2 denote the growth rate in moles phosphate perm3 per day of diatoms and nondiatoms, respectively, andthey are set to
Q1 ¼ s t; zð Þ Si
KSim þ Si
Phy1
!ð6Þ
Q2 ¼ s t; zð Þ P
KPm þ P
Phy2
!ð7Þ
where Phy1 and Phy2 are the concentration of diatoms andnondiatoms in moles phosphate per m3. The algal growthrate, s, is given by [Clementson et al., 1998]
s t; zð Þ ¼ V Tð Þ 1� exp �aI t; zð ÞV Tð Þ
� �� �ð8Þ
where I is light intensity, T is temperature (�C), V(T ) is themaximum growth rate given by V(T ) = 0.6(1.066)T [Eppley,1972], and a is the initial slope of the P-I curve. Lightintensity is a function of depth and it is given by
I t; zð Þ ¼ PAR I t; 0ð Þ exp � kw þ kcP0ð Þzð Þ ð9Þ
where PAR is the photosynthetically active fraction of totalinsolation, and kw and kc are the light attenuation constantsfor water and phytoplankton. The solar insolation at thesurface, I(t, 0), was obtained from NCEP data [Kalnay etal., 1996].[18] In equations (6) and (7), Si
KSim þSi
and PKPm þP
are the nutrientlimiting factors controlling the growth rate of diatoms andnondiatoms, respectively, with Km
Si and KmP as the half-satu-
ration constants. For both diatoms and nondiatoms, thephosphate concentrations are always high enough in theeuphotic zone that phosphate never limits growth and thislimiting term never drops below 0.9. For diatoms, silicatelimitation is always more restrict than phosphate limitation;
Table 1. Parameters Used by the Biological Model
Parameter Symbol Units Value Reference
Initial slope of P-I curve in ML a a (W m�2 d)�1 0.05 Parslow et al. [2001]Initial slope of P-I curve in SCMa a (W m�2 d)�1 0.1 Parslow et al. [2001]Photosynthetically active radiation PAR 0.5 Clementson et al. [2001]Half saturation constant for nondiatoms Km
P mM P 0.1 Matear and Hirst [1999]Half saturation constant for diatoms Km
Si mM Si 1.0 this studyLight attenuation by phytoplankton Kc m�1 (mM P)�1 0.96 Matear [1995]Light attenuation by water Kw m�1 0.04 Matear [1995]Ratio of C to chl a C/Chl g:g 75 Arrigo et al. [1998]Ratio of C to P C:P 90 this studyHalf saturation constant for Si uptake Ks mM Si 3.6 this studyHalf saturation constant for NO3 uptake Kf nM Fe 0.09 this studyScale length of PON remineralization zL
N m 180 this studyScale length of POP remineralization zL
P m 180 this studyScale length of opal remineralization zL
Si m 450 this studyEuphotic zone ze m 120 this study
9 - 4 WANG ET AL.: NUTRIENT UTILIZATION RATIOS IN THE POLAR FRONTAL ZONE
hence we only retain the former term in the growth rate ofdiatoms. We are aware that iron may limit growth of the bothdiatoms and nondiatoms. The availability of only limited dataon the seasonal iron distribution and algal iron requirementsmakes it very difficult to explicitlymodel the iron cycle in thisregion, but wewill explore how ironmay alter diatoms abilityto utilize nitrate.3.2.1.1. Prescription of the Biomass of Diatoms andNondiatoms[19] Total biomass in moles phosphate per m3 (Po) was
estimated from the monthly chlorophyll a (chl a) derivedfrom the Sea-viewing Wide Field-of-view Sensor (Sea-WiFS) using
Po ¼ chlC
chl
1
12C=Pð10Þ
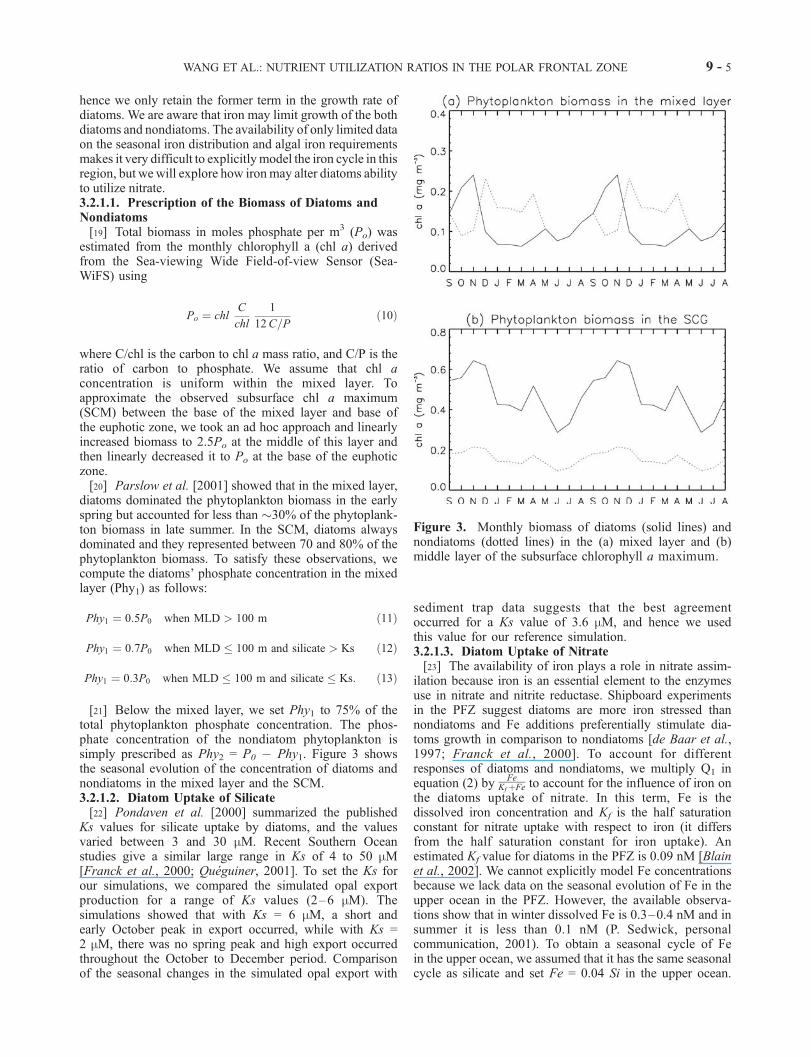
where C/chl is the carbon to chl a mass ratio, and C/P is theratio of carbon to phosphate. We assume that chl aconcentration is uniform within the mixed layer. Toapproximate the observed subsurface chl a maximum(SCM) between the base of the mixed layer and base ofthe euphotic zone, we took an ad hoc approach and linearlyincreased biomass to 2.5Po at the middle of this layer andthen linearly decreased it to Po at the base of the euphoticzone.[20] Parslow et al. [2001] showed that in the mixed layer,
diatoms dominated the phytoplankton biomass in the earlyspring but accounted for less than �30% of the phytoplank-ton biomass in late summer. In the SCM, diatoms alwaysdominated and they represented between 70 and 80% of thephytoplankton biomass. To satisfy these observations, wecompute the diatoms’ phosphate concentration in the mixedlayer (Phy1) as follows:
Phy1 ¼ 0:5P0 when MLD > 100 m ð11Þ
Phy1 ¼ 0:7P0 when MLD � 100 m and silicate > Ks ð12Þ
Phy1 ¼ 0:3P0 when MLD � 100 m and silicate � Ks: ð13Þ
[21] Below the mixed layer, we set Phy1 to 75% of thetotal phytoplankton phosphate concentration. The phos-phate concentration of the nondiatom phytoplankton issimply prescribed as Phy2 = P0 � Phy1. Figure 3 showsthe seasonal evolution of the concentration of diatoms andnondiatoms in the mixed layer and the SCM.3.2.1.2. Diatom Uptake of Silicate[22] Pondaven et al. [2000] summarized the published
Ks values for silicate uptake by diatoms, and the valuesvaried between 3 and 30 mM. Recent Southern Oceanstudies give a similar large range in Ks of 4 to 50 mM[Franck et al., 2000; Queguiner, 2001]. To set the Ks forour simulations, we compared the simulated opal exportproduction for a range of Ks values (2–6 mM). Thesimulations showed that with Ks = 6 mM, a short andearly October peak in export occurred, while with Ks =2 mM, there was no spring peak and high export occurredthroughout the October to December period. Comparisonof the seasonal changes in the simulated opal export with
sediment trap data suggests that the best agreementoccurred for a Ks value of 3.6 mM, and hence we usedthis value for our reference simulation.3.2.1.3. Diatom Uptake of Nitrate[23] The availability of iron plays a role in nitrate assim-
ilation because iron is an essential element to the enzymesuse in nitrate and nitrite reductase. Shipboard experimentsin the PFZ suggest diatoms are more iron stressed thannondiatoms and Fe additions preferentially stimulate dia-toms growth in comparison to nondiatoms [de Baar et al.,1997; Franck et al., 2000]. To account for differentresponses of diatoms and nondiatoms, we multiply Q1 inequation (2) by
FeKf þFe to account for the influence of iron on
the diatoms uptake of nitrate. In this term, Fe is thedissolved iron concentration and Kf is the half saturationconstant for nitrate uptake with respect to iron (it differsfrom the half saturation constant for iron uptake). Anestimated Kf value for diatoms in the PFZ is 0.09 nM [Blainet al., 2002]. We cannot explicitly model Fe concentrationsbecause we lack data on the seasonal evolution of Fe in theupper ocean in the PFZ. However, the available observa-tions show that in winter dissolved Fe is 0.3–0.4 nM and insummer it is less than 0.1 nM (P. Sedwick, personalcommunication, 2001). To obtain a seasonal cycle of Fein the upper ocean, we assumed that it has the same seasonalcycle as silicate and set Fe = 0.04 Si in the upper ocean.
Figure 3. Monthly biomass of diatoms (solid lines) andnondiatoms (dotted lines) in the (a) mixed layer and (b)middle layer of the subsurface chlorophyll a maximum.
WANG ET AL.: NUTRIENT UTILIZATION RATIOS IN THE POLAR FRONTAL ZONE 9 - 5
This gives a seasonal change of Fe from 0.36 nM to 0.08nM, which is similar to the limited observations, but itassumes that diatoms drive the seasonal depletion of iron.3.2.2. Export production[24] To convert the phytoplankton uptake of phosphate to
the export of POP, we use the scaling factors, r1P and r2
P, fordiatoms and nondiatoms, respectively. Based on the obser-vation that diatoms have much higher f ratio than non-diatoms, due to their faster sinking rate [Boyd and Newton,1999], we set r1
P = 3r2P. With this assumption, the averaged
fraction of export for phosphate is �0.75 and �0.25 for thediatoms and nondiatoms, respectively, in this study. Thesimulated f ratio in community (ratio of export to totalproduction for phosphate) is �0.6 in the spring and �0.3 inthe summer, and thus is consistent with the observations inthe PFZ [Mengesha et al., 1998; Cailliau et al., 1999;Sambrotto and Mace, 2000].[25] For nondiatoms, we assume that the uptake of nitrate
and phosphate satisfies the Redfield ratio (N/P = 16);therefore we have the relationship r2
N = 16r2P. For diatoms,
the conversion of nitrate and silicate uptake to the export ofPON and opal, r1
N and r1Si, respectively, are determined by
trying to reproduce the observed seasonal cycle of nutrientsin the upper ocean.3.2.3. OM Accumulation and Remineralization[26] We investigated the potential role of OM on the
seasonal nutrient cycle by adding terms to represent theaccumulation and remineralization of OP and ON, QOP andQON, in equations (1) and (2), respectively. To maintain thesame export of phosphorus and nitrogen as in the simulationwithout the OM pool, we imposed the condition that anyaccumulation of OP and ON requires a correspondingreduction of POP and PON export. In the simulations withOM that are discussed in the next section we prescribed thetime period over which OM is either accumulating orremineralizing OP and ON. We investigate different ratiosof OP to ON to assess model sensitivity.3.2.4. Parameterization of the Remineralizationof POM[27] In our model, we assumed that the export of POP,
PON, and biogenic silica is instantaneously remineralizedbelow the euphotic zone (ze) according to prescribed pro-files. We used the following remineralization profile forphosphate [Williams and Follows, 1998]:
RP zð Þ ¼ exp� z� zeð Þ
zPLð14Þ
where zLP is the scale length for remineralization for POP.
Similar equations were applied for the remineralization ofPON and opal with zL
N and zLSi as the remineralization length
scales of PON and opal, respectively. To determine zLN and
zLSi we used the simulated export production and Trull et al.[2001] sediment trap measurements of PON and opalfluxes. We set zL
N = 180 m and zLSi = 450 m. Since we have
no sediment trap observations of POP, we assume zLN = zL
P.
3.3. Model Setup
[28] Wang and Matear [2001] and Wang et al. [2001]described the model setup in detail. In brief, the model was
forced with the surface fluxes of heat and fresh water andthe wind stress from the NCEP (September 1997 to Sep-tember 1998) and initialized with observed winter profilesof temperature and salinity from the Aurora Australis cruiseAU9501. The initial profiles of nitrate, phosphate, andsilicate were taken from Niskin bottle data from the samecruise [Rosenberg et al., 1997]. The model domain was 0–1000 m, with a uniform vertical grid spacing of 5 m. Themodel bottom boundary was closed so that diffusive fluxesthrough the bottom were zero. The location of the simu-lation site is 54�S 140�E in the PFZ, which corresponds tothe location of the PFZ sediment trap mooring of Trull et al.[2001].[29] As presented above and summarized in Table 1, the
biophysical model given in equations (1) to (3) had fiveunknown variables (�FP, �FSi, r2
P, r1N, and r1
Si) which need tobe determined. In a steady state ocean, the annual con-sumption and export of nutrients in the euphotic zone mustbalance the vertical and horizontal nutrient supply. Byclosing the annual budget for phosphate and silicate inthe euphotic zone and by reproducing the observed winter-summer silicate and phosphate depletion, we iterativelysolved for �FP, �FSi, r2
P, and r1Si. The observed seasonal
nutrient cycle was obtained from bottle data collected onAurora Australis and Southern Survey cruises during the1991–1998 period [see Griffiths et al., 1999; Lourey andTrull, 2001, and references therein]. For the PFZ, thesolution for �FP, �FSi, r2
P, and r1Si was unique because the
seasonal cycle of export production differs from that ofhorizontal supply which decouples two unknowns for eachnutrient. Export production primarily occurs in the spring-summer period while horizontal supply is nearly constantthroughout the year for phosphate and is greatest in winterfor silicate. To test the uniqueness of our solution, we fittedthe observations using various initial guesses of the modelparameters and still obtained the same solution. Once �FP
and r2P were determined, the unknown r1
N was determinedby closing the annual nitrate budget. Hence, nitrate deple-tion was not tuned to match the observations, whichallowed us to use the nitrate cycle to identify the potentiallimitations of the model and investigate different mecha-nisms for reproducing the observed seasonal cycle ofnitrate.
4. Model Results
[30] The reference simulation used the previouslydescribed model and parameters (Table 1) but did notinclude an OM pool. In the mixed layer, the referencesimulation reproduced the seasonal phosphate and silicateconcentrations and the Si/N ratio (Figure 4). The referencesimulation overestimated seasonal nitrate depletion in themixed layer and underestimated mixed layer nitrate con-centrations in March (Figure 4c). The simulated nitrate/phosphate ratios in the mixed layer (14.3–14.7) weregenerally less than the observed values (Figure 4b). Thesimulations had nearly a constant vertical Si/N utilizationprofile which was high (�3) during September–December(data not shown) but low (�1) during January–April. In themixed layer, the simulated Si/N utilization ratio in March
9 - 6 WANG ET AL.: NUTRIENT UTILIZATION RATIOS IN THE POLAR FRONTAL ZONE

agrees with the limited observations (�1) [Parslow et al.,2001].[31] The initial simulation failed to reproduce the seasonal
nitrate depletion in the mixed layer. In the followingsections, we attempt to remedy these defects. First, we testthe impact of changing the diatom uptake dependency oniron by altering the half saturation uptake constant, Kf, inequation (2). Second, we use different remineralizationlength scales for PON and POP. Third, we add an OM poolto account for seasonal accumulation and remineralizationof labile OM and nitrogen pool other than nitrate.
4.1. Iron Limitation
[32] Shipboard and in situ experiments demonstrate thatiron addition to the PFZ stimulates phytoplankton growth[Sedwick et al., 1999; Boyd et al., 2000]. However, there islimited quantitative information to relate the iron concen-trations to the nitrate uptake rate. We parameterize thisrelationship for diatoms using Fe
Kf þFewith Kf = 0.09 nM
[Blain et al., 2002]. As discussed by Blain et al. [2002],there are large variations in Kf. In particular, their studyindicated a Kf value of �0.4 nM Fe for the PFZ in theIndian sector. Here we explore the sensitivity of our modelsimulation to the Kf value.[33] For a range of Kf values between 0.03 nM and 0.4
nM, the simulations produced similar seasonal patterns of
nitrate depletion to that of the reference simulation. Whilevariations in Kf can not fix the overestimate of nitratedepletion, it influences the Si/N utilization ratio in the mixedlayer. Figure 5a shows that in the mixed layer the simulationwith the highest Kf (0.4 nM) produced the greatest diatomSi/N utilization ratio. During the growing season, the Si/Nutilization ratio for the diatoms is �0.6 greater using thelargest Kf value than using the smallest Kf value. However,the difference of Si/N utilization ratio in the community withdifferent Kf value is much smaller, in particular during theperiod of January–April (Figure 5b). Unfortunately, there isonly one measurement of Si/N uptake in the PFZ Australiansector, and it shows that in March, Si/N uptake ratio was �1in the mixed layer [Parslow et al., 2001]. It is important tonote that the Si/N utilization ratio from the model representsthe Si/N ratio of the material exported from the upper oceanand may not be comparable observation of the Si/N uptake.Our simulations show that the seasonality of the Si/Nutilization is insensitive to the Kf value, and we use a valueof 0.09 in our subsequent simulations.
4.2. Remineralization of PON and POP
[34] There is large uncertainty in estimating the reminer-alization length scale of POM from the modeled exportproduction and deep sediment trap data. Here, we are notinterested in the absolute values of the POP and PON
Figure 4. Daily (a) phosphate, (c) nitrate, and (e) silicateconcentrations, and (b) nitrate/phosphate, (d) silicate/nitrate,and (f ) silicate/phosphate ratios in the surface water for thereference solution. The diamonds denote observed values.
Figure 5. Monthly Si/N utilization ratio for (a) diatomsand (b) the total phytoplankton population in the mixedlayer for the reference solution (solid lines), the simulationwith Kf = 0.4 mM (dotted lines), and the simulation withKf = 0.03 mM (dashed lines).
WANG ET AL.: NUTRIENT UTILIZATION RATIOS IN THE POLAR FRONTAL ZONE 9 - 7

remineralization length scales but in how differing lengthscales for POP and PON would impact the N/P utilizationratio and the simulated seasonal nutrient cycles. For con-venience we keep the length scale of POP constant (180 m)and perform two additional simulations with the remineral-ization length of PON set to 125 m and 250 m. Assuming aeuphotic depth of 100 m, a remineralization length scale of125 m, 180 m, and 250 m would enable only 4%, 11%, and20% POM, respectively, to sink below 500 m. In compar-ison, using the classical Martin curve ([z/100]�0.858), 25%of the POM would sink below 500 m.[35] With a shallower remineralization of PON than POP
(125 m versus 180 m, respectively), one further overesti-mates the summer nitrate depletion in the mixed layer fromthe reference run (Figure 6). This appears to contradict theintuition that preferential recycling of PON relative to POPshould increase the supply of nitrate to the mixed layer andreduce the seasonal depletion of nitrate. However, in thePFZ the seasonal nutrient uptake is largely decoupled fromthe resupply, because most of the uptake occurs during thespring-summer when the mixed layer is shoaling and mostof the resupply occurs during the fall and winter when themixed layer is deepening. Therefore, increasing the nitrate
supply in the fall-winter period by reducing the remineral-ization length scale of PON requires increased nitrate uptakein the spring-summer period to close the annual nitratebudget. The increased spring-summer uptake increases thesummer depletion of nitrate and worsens the agreement withthe observations. The seasonal nitrate and phosphate budg-ets are summarized in Table 2, which shows how changes invertical resupply arising from differing remineralizationlength-scales alter simulated export of PON.[36] Our simulations show that preferential recycling of
POP compared to PON improved the agreement with theobservations from either equal or preferential recycling ofPON. Although preferential recycling of POP over PONimproved the simulation, this process alone cannot enablethe model to reproduce the observed late summer nitrateconcentrations. Between late January and late March theobserved nitrate concentrations increase slightly and mod-ifications to the PON recycling cannot remedy this situationbecause there is little vertical resupply of nitrate to themixed layer during this period to offset the biologicaluptake of nitrate.
4.3. OM Pool
[37] The seasonal depletion of nutrients in the euphoticzone may inaccurately represent seasonal nutrient utilizationif there is a seasonal accumulation of organic matter (OM)as either dissolved and suspended particulate organic matteror dissolved inorganic nitrogen other than nitrate (ODIN).To quantify the seasonal change in the OM pool, we useseasonal observations from the PFZ. For phosphate, wedefine the organic phosphorus (OP) pool as the sum ofdissolved organic phosphorus (DOP) and the suspendedPOP. For nitrogen, we define the organic nitrogen (ON)
Figure 6. Simulated seasonal change of (a) nitrateconcentration and (b) nitrate/phosphate ratio in the mixedlayer from the reference solution (solid line), the run withzLN = 250 m (dotted line) and the run with zL
N = 125 m(dashed line). The diamonds denote the observed valuesfrom the site.
Table 2. Nitrate and Phosphate Fluxes in Relation to Remine-
ralization Length Scale During September–March (S–M) and
March–September (M–S)a
Phosphate NitrateNitrate/
Phosphate
S–M M–S S–M M–S S–M M–S
ReferenceEP 50 17.8 688 224 13.8 12.6Depletion 20.8 �20.6 275 �281 13.2 13.6Res.-y 23.0 28.2 333 408 14.5 14.5Res.-z 6.2 10.2 80 97 12.9 9.5Res. Total 38.4 505 13.2
zNL = 250EP 50 17.8 667 217 13.3 12.2Depletion 20.8 �20.6 263 �270 12.6 13.1Res.-y 23.0 28.2 333 408 14.5 14.5Res.-z 6.2 10.2 71 79 11.5 7.7Res. Total 38.4 487 12.7
zNL = 125EP 50 17.8 741 237 14.8 13.3Depletion 20.8 �20.6 308 �318 14.8 15.4Res.-y 23.0 28.2 333 408 14.5 14.5Res.-z 6.2 10.2 100 147 16.1 14.4Res. Total 38.4 555 14.5
aDepletion =R z�120
z
R t�b
t�a[P(t, z) � P(a, z)]dtdz; Res.-y: horizontal
transport; Res.-z: vertical resupply; Res. Total = Res.-y + Res.-z.
9 - 8 WANG ET AL.: NUTRIENT UTILIZATION RATIOS IN THE POLAR FRONTAL ZONE

pool as the sum of dissolved organic nitrogen (DON),suspended PON and ODIN.[38] In the Australian sector of the PFZ, neither DON nor
DOP measurements are available, but dissolved organiccarbon (DOC) measurements show a winter to summeraccumulation of DOC that varies between 5 and 15 mM inthe upper 50 m (T. Trull, unpublished data, 2001). Assum-ing a DOC/DOP ratio of 106 for the labile dissolved organicmatter (DOM) pool, the estimated seasonal accumulation ofDOP in the mixed layer is approximately 0.14 mM. The ratioof either DOC/DON or DON/DOP in the labile DOM isuncertain. Measured ratios of labile DON to DOP in thePFZ (54�S, 176�W) were approximately 16 in the euphoticzone [Loh and Bauer, 2000]. However, others haveobserved DOC/DON ratios that are greater than 106/16 inthe PFZ [Ogawa et al., 1999] and in the DOM produced bydiatoms [Biddanda and Benner, 1997]. To deal with theuncertainty in specifying the DON/DOP ratio of labileDOM, we consider two different ratios, 16 and 6.
[39] The abundance of PON in the surface water of theupper PFZ varied between a minimum winter value of 0.2mM and a maximum summer value of 0.7 mM [Lourey andTrull, 2001]. Hence we assign a seasonal accumulation of0.5 mM for the PON. POP was 0.02 mM in the PFZ in March1998 [Cardinal et al., 2001]. Without winter data, weassume that half of this value represents the seasonal POPaccumulation. Observations of the ODIN are also sparse.Seasonal accumulation of ammonium (A. J. Watson, unpub-lished data, 2001), nitrite (T. Trull, unpublished data, 2001),and urea (F. Dehairs, unpublished data, 2001) are estimatedto be �1.0 mmol N in the mixed layer in mid-March.[40] We investigated the potential role of OM pool on the
seasonal nutrient cycle by prescribing the temporal patternof accumulation and remineralization of OM. We set theseasonal accumulation of OP in the mixed layer to 0.15 mM,and the seasonal ON to
ON¼DPON þ DODIN þDDON ¼ 0:5mM þ 1:0mM þ r*DDOP
ð15Þ
where r* is the N/P ratio in the seasonal accumulation oflabile DOM and DDON is the seasonal accumulation ofDON. For all the simulations, we assumed DODIN andDPON accumulated at a constant rate during the Septem-ber–March period and was converted to nitrate at a constantrate during the March 1 to August 1 period. For the first twosimulations, we assumed that DDON and DDOP accumu-lated at a constant rate from September 1 to early January 1and then were remineralized at a constant rate from January1 to March 31 (referred as fast remineralization). Forcomparison, we also performed two additional simulations:DDON and DDOP accumulating from September 1 toMarch 1 and remineralizing from March 1 to September 1(referred as slow remineralization).[41] Adding the OM pool greatly improved the simula-
tions (Figure 7). With the OM pool it is possible toreproduce the observed seasonal cycles of phosphate andnitrate by varying the combination of OM remineralizationand the value of r*. The solution does not appear unique,and various combinations of remineralization and r* wouldbe able to reproduce the nitrate and phosphate observations.More observations of DOM stoichiometry and seasonalityare required to verify the role of the DOM pool.
4.4. Seasonal Export Production and NutrientExport Ratio
[42] Using the model run with DDON/DDOP = 16 andfast remineralization, we get an annual export productionfrom the euphotic zone of �69 mmol P m�2, �762 mmol Nm�2, and 1816 mmol Si m�2. Diatoms contribute �75% ofthe annual export production of phosphate and nitrate.Figure 8 shows that total export of PON and POP fromthe euphotic zone is greatest in December. Opal export fromthe euphotic zone was high between October and lateDecember with a peak in early December, which mayreflect high light intensity and high Si concentrations(>Ks) in the mixed layer. The simulated opal export pro-duction remains high for about 120 days (October to lateDecember), which is roughly similar to the period of high
Figure 7. Simulated seasonal change of (a) nitrateconcentration and (b) nitrate/phosphate ratio in the mixedlayer from the reference solution (solid line), the simulationwith DDON/DDOP = 6 and slow recycle (dotted line), thesimulation with DDON/DDOP = 16 and slow recycle(dashed line), the simulation with DDON/DDOP = 6 andfast recycle (dash-dotted line), and the simulation withDDON/DDOP = 16 and fast recycle (dot-dot-dot-dashedline). The diamonds denote the observed values from thesite.
WANG ET AL.: NUTRIENT UTILIZATION RATIOS IN THE POLAR FRONTAL ZONE 9 - 9

biogenic silica collections found in the 800-m sediment trap[Trull et al., 2001], although those observations suggest twopeaks of export rather than a single broad peak as in themodel (Figure 8e). It is difficult to further assess temporaland amplitude differences between the modeled EP (at 120m) and the deep sediment collection (at 800 m) becauseremineralization, differential settling of different compo-nents of the export materials, and ocean circulation cansignificantly alter the magnitude and timing of sedimenta-tion. Interestingly, there are similar time lags between theonset of the simulated high export production in the modeland the first peak of biogenic silica at 800 m, and betweenthe first peaks of biogenic silica at 800 m and at 1500 mfrom the sediment trap collections.[43] The N/P export ratio is higher during December–
March than other seasons (Figure 8b), with a range of 8–15in the diatoms and 10–15 in the community. The diatomsSi/N export ratio ranged from �5 in the spring to �2 in thesummer (Figure 8d). For the community, the Si/N exportratio was high (3–4) during September–December but low(�1) during January–April. The simulated decrease in theSi/N export ratio from spring to summer reflects the impactof silicate limitation. Data from the Antarctic EnvironmentSouthern Ocean Process Study supports our silicate response
with high Si/N depletion ratio (3–4) in high Si water and alow ratio (1–2) in low Si water (X. Wang et al., manuscriptin preparation, 2002). In our model, silicate limitation ondiatom growth is more restrictive than iron limitation on theuptake of nitrate by diatoms. Hence, as the seasons progressfrom spring to summer, the dominance of the silicatelimitation causes the Si/N ratio to decline. This modelresponse occurs for Kf values between 0.03 and 0.4 nM(Figure 5). Shipboard incubations produce large ranges inthe Si/N utilization (1–8) during spring-summer in the PFZwaters in the Pacific Sector [Franck et al., 2000]. Theyobtained the highest ratio in the summer, which may reflectthe higher silicate concentration (5 mM) and lower nitrateconcentration (2.5 mM) at their site relative to those at oursite. Our simulated Si/N export ratio for diatoms was greaterthan the measured uptake ratio for diatoms (2.3–3) fromincubation experiments under iron deficit condition [Takeda,1998; Hutchins and Bruland, 1998]. Part of the differencebetween the model and observations may reflect the fact thatthe model is providing the Si/N ratio of the export material,which is not a direct measure of the Si/N uptake ratio ofphytoplankton. Another explanation for the difference is thatour PFZ site has lower iron concentrations than water used inthe incubation experiments.
5. Discussion and Conclusion
[44] Summer observations in the PFZ show that the N/Pdepletion ratio in the mixed layer is less than the classicalRedfield value of 16. To address the question of the non-Redfield N/P utilization, we use a biophysical model tosimulate the seasonal nitrate, phosphate, and silicate cycle.Our biophysical model included two phytoplankton types,diatoms, and nondiatoms. We used SeaWiFS derived esti-mates of the seasonal phytoplankton biomass to prescribethe biomass of diatoms and nondiatoms. We assumed thatthe nondiatoms N/P utilization ratio is 16 while the diatomsN/P ratio is determined by trying to reproduce the seasonalnitrate, phosphate, and silicate cycle.[45] Our study estimates a N/P utilization ratio of 8–15
for diatoms and 10–15 for the combined diatoms andnondiatoms (Figure 8). Our simulations do not support thehypothesis that the observed low N/P utilization ratio is atransient feature which does not represent the seasonalnitrate and phosphate uptake. Our estimated annual N/Putilization ratio (�12) is similar to the observed spring N/Putilization ratio of 8.3 ± 5.4 in the Polar Frontal zone at140�E [Lourey and Trull, 2001], to water along 6�W [DeBaar et al., 1997], and to the ratio measured in January1995 at 64�S, 141�E [Takeda, 1998]. Assuming a C/Putilization ratio of 106, our estimated C/N utilization ratiois �10.5 in the spring and �6.5 in the summer. Thesevalues are similar to the spring and summer POC/PONratios of 9–10 and 6.8, respectively, which were measuredin the sediment traps at our simulation site [Trull et al.,2001].[46] To close the annual nitrate and phosphate budgets in
the upper ocean and explain the observed non-Redfield N/Pdepletion ratio in the mixed layer during the spring-summerperiod requires that the export or the resupply of nitrate and
Figure 8. Simulated weekly export production from thesimulation with DDON/DDOP = 16 and fast recycle for (a)phosphate, (c) nitrate, and (e) opal, and (b) N/P export ratioand (d) Si/N export ratio for diatoms (dotted line) and for allphytoplankton (solid line). The dashed line (dash-dottedline) in Figure 8e represents the biogenic silica (mmol Si �10 m�2 d�1) collected at 800 m (1500 m).
9 - 10 WANG ET AL.: NUTRIENT UTILIZATION RATIOS IN THE POLAR FRONTAL ZONE

phosphate is also non-Redfield. Three mechanisms are pro-posed for closing the annual nitrogen and phosphate budgets:(1) the horizontal transports supplying nutrients with a lowN/P ratio, (2) the preferential recycling of PON relative to POPbelow the euphotic zone, and (3) the accumulation of OMduring the spring-summer period and subsequent remineral-ization of the OM during the late summer-winter period.[47] Observations show that the horizontal gradient of
nitrate/phosphate in the PFZ has a weak seasonality, �14.5in the winter and �16 in the late summer (Figure 2). For ourmodel simulations, we set the nitrate/phosphate ratio forhorizontal supply to 14.5, which may underestimate thehorizontal supply of nitrate in the late summer and winter.However, if we increase nitrate supply during this period,additional nitrate export is needed to close the annual nitratebudget. The increase in export production will furtherincrease nitrate utilization during the spring-summer periodin the mixed layer. Therefore, horizontal supply is ruled outof as a possible mechanism for satisfying the observednitrate/phosphate depletion ratio.[48] Our simulations showed that preferential recycling of
PON over POP degrades the simulation and cannot satisfyboth the observed seasonal nitrate and phosphate cycle. Amore realistic simulation is obtained with preferential recy-cling of POP over PON but again this mechanism isincapable of satisfying the observed nitrate and phosphatedata from the mixed layer.[49] The simulations with the OM pool enable us to
satisfy the seasonal cycle of N/P depletion in the mixedlayer. Through a combination DDON/DDOP ratio andaccumulation/remineralization period, one is capable ofproducing results consistent with observations. We postu-late that DOM is an important component to the seasonalnutrient budget. We expect that DOC will also play a rolein the seasonal evolution of the fCO2. Seasonal observa-tions of DOP, DON, and DOC are needed to confirm thishypothesis. These observations need to be supplementedwith better seasonal observations of nitrate, phosphate, andsilicate. While these details will be clarified further byadditional observation, in the PFZ of the Australian sector,diatoms utilize nitrate and phosphate in a ratio considerablylower than the classical Redfield value and the net annualcommunity export also has a N/P ratio that is lower thanthe Redfield value of 16.
[50] Acknowledgments. The NCEP Reanalysis data were providedby the NOAA-CIRES Climate Diagnostics Center, Boulder, Colorado, fromthe Web site at http://www.cdc.noaa.gov. NASA provided the SeaWiFS Chla data, at http://SeaWiFS.gsfc.nasa.gov/SEAWIFS.html via the Hobart localreceiving station (John Parslow and Chris Rathbone, CSIRO). Fundingsupport from the Environment Australia Climate Change Research Programwas provided to R.J.M. This work was partially supported by an AntarcticCRC Ph.D. scholarship to X. Wang and by Australian Antarctic Divisiongrants.
ReferencesAnderson, L. A., and J. L. Sarmiento, Redfield ratios of remineralizationdetermined by nutrient data analysis, Global Biogeochem. Cycles, 8, 65–80, 1994.
Arrigo, K. R., G. R. DiTullio, R. B. Dunbar, D. H. Robinson, M. VanWoert,D. L. Worthen, and M. P. Lizotte, Phytoplankton taxonomic variability innutrient utilization and primary production in the Ross Sea, J. Geophys.Res., 105, 8827–8845, 2000.
Biddanda, B., and R. Benner, Carbon, nitrogen, and carbohydrate fluxesduring the production of particulate and dissolved organic matter bymarine phytoplankton, Limnol. Oceanogr., 42, 506–518, 1997.
Blain, S., P. N. Sedwick, F. B. Griffiths, B. Queguiner, E. Bucciarelli,M. Fiala, P. Pondaven, and P. Treguer, Quantification of algal ironrequirements in the Subantarctic Southern Ocean, Deep Sea Res.,Part II, 49, 3255–3273, 2002.
Bopp, L., P. Monfray, O. Aumont, J. L. Dufresne, H. Le Treut, G. Madec,L. Terray, and J. C. Orr, Potential impact of climate change on marineexport production, Global Biogeochem. Cycles, 15(1), 81–99, 2001.
Boyd, P. W., and P. Newton, Does planktonic community structure deter-mine downward particulate organic carbon flux in different oceanic pro-vinces?, Deep Sea Res., Part I, 46, 63–91, 1999.
Boyd, P., J. LaRoche, M. Gall, R. Frew, and R. M. L. McKay, Role of iron,light, and silicate in controlling algal biomass in subantarctic waters SEof New Zealand, J. Geophys. Res., 104, 13,395–13,408, 1999.
Boyd, P. W., et al., A mesoscale phytoplankton bloom in the polar SouthernOcean stimulated by iron fertilization, Nature, 407, 695–702, 2000.
Cailliau, C., S. Belviso, M. Goutx, A. Bedo, Y. Park, and E. Charriaud,Sedimentation pathways in the Indian sector of the Southern Ocean dur-ing a production regime dominated by regeneration, Mar. Ecol. Prog.Ser., 190, 53–67, 1999.
Cardinal, D., F. Dehairs, T. Cattaldo, and L. Andre, Geochemistry of sus-pended particles in the Subantarctic and Polar Frontal Zones south ofAustralia: Constraints on export and advection processes, J. Geophys.Res., 106, 31,637–31,656, 2001.
Clementson, L. A., J. S. Parslow, F. B. Griffiths, V. D. Lyne, D. J. Mackey,G. P. Harris, D. C. McKenzie, P. I. Bonham, C. A. Rathbone, and S.Rintoul, Controls on phytoplankton production in the Australasian sectorof the subtropical convergence, Deep Sea Res., Part I, 45, 1627–1661,1998.
de Baar, H. J. W., M. A. Vanleeuwe, R. Scharek, L. Goeyens, K. M. J.Bakker, and P. Fritsche, Nutrient anomalies in fragilariopsis kerguelensisblooms, iron deficiency and the nitrate/phosphate ratio (redfield,a.c.) ofthe Antarctic Ocean, Deep Sea Res., Part II, 44, 229–261, 1997.
Denman, K. L., M. A. Pena, and S. P. Haigh, Simulations of marine eco-system response to climate variations with a one dimensional coupleecosystem/mixed layer model, in Biotic Impacts of Extratropical ClimateChange in the Pacific, Univ. of Hawaii at Monoa, Monoa, Hawaii, 1998.
Eppley, R. W., Temperature and phytoplankton growth in the sea, Fish.Bull., 70, 1063–1085, 1972.
Franck, V. M., M. A. Brzezinski, K. H. Coale, and D. M. Nelson, Iron andsilicic acid concentrations regulate Si uptake north and south of the PolarFrontal Zone in the Pacific Sector of the Southern Ocean, Deep Sea Res.,Part II, 47, 3315–3338, 2000.
Griffiths, F. B., T. S. Bates, P. K. Quinn, L. A. Clementson, and J. S.Parslow, Oceanographic context of the First Aerosol CharacterizationExperiment (ACE 1): A physical, chemical, and biological overview,J. Geophys. Res., 104, 21,649–21,671, 1999.
Hoppema, M., and L. Goeyens, Redfield behaviour of carbon, nitrate andphosphate depletions in Antarctic surface water, Limnol. Oceanogr., 44,220–224, 1999.
Hutchins, D. A., and K. W. Bruland, Iron-limited diatom growth and Si:Nuptake ratios in a coastal upwelling regime, Nature, 393, 561–584, 1998.
Kalnay, E., et al., The NCEP/NCAR 40-year reanalysis project, Bull. Am.Meteorol. Soc., 77, 437–471, 1996.
Keeling, R. F., and M. Visbeck, Palaeoceanography–Antarctic stratificationand glacial CO2, Nature, 412, 605–606, 2001.
Loh, A. N., and J. E. Bauer, Distribution, partitioning and fluxes of dis-solved and particulate organic C, N and P in the eastern North Pacific andSouthern Oceans, Deep Sea Res., Part 1, 47, 2287–2316, 2000.
Lourey, M., and T. W. Trull, Seasonal nutrient depletion and carbon exportin the Subantarctic and Polar Frontal Zones of the Southern Ocean Southof Australia, J. Geophys. Res., 106, 31,463–31,487, 2001.
Martin, J. H., Glacial-interglacial CO2 change: The iron hypothesis, Paleo-ceanography, 5, 1, 1990.
Matear, R. J., Parameter optimization and analysis of ecosystem modelsusing simulated annealing–A case study at Station P, J. Ma. Res., 4,571–607, 1995.
Matear, R. J., and A. C. Hirst, Climate change feedback on the futureoceanic CO2 uptake, Tellus, Ser. B, 51(3), 722–733, 1999.
Mengesha, S., F. Dehairs, M. Fiala, M. Elskens, and L. Goeyens, Seasonalvariation of phytoplankton community structure and nitrogen uptake re-gime in the Indian sector of the Southern Ocean, Polar Biol., 4, 259–272,1998.
Ogawa, H., R. Fukuda, and I. Koike, Vertical distributions of dissolvedorganic carbon and nitrogen in the Southern Ocean, Deep Sea Res., PartI, 46, 1809–1826, 1999.
WANG ET AL.: NUTRIENT UTILIZATION RATIOS IN THE POLAR FRONTAL ZONE 9 - 11

Pahlow, M., and U. Riebesell, Temporal trends in deep ocean Redfieldratios, Science, 287(5454), 831–833, 2000.
Parslow, J., P. Boyd, S. R. Rintoul, and F. B. Griffiths, A persistent sub-surface chlorophyll maximum in the Polar Frontal Zone south of Aus-tralia: Seasonal evolution and implications for phytoplankton-light-nutri-ent interactions, J. Geophys. Res., 106, 31,543–31,557, 2001.
Pondaven, P., D. Ruiz-Pino, C. Fravalo, P. Treguer, and C. Jeandel, Inter-annual variability of Si and N cycles at the time-series station KERFIXbetween 1990 and 1995: A 1-D modelling study, Deep Sea Res., Part I,47, 223–257, 2000.
Queguiner, B., Biogenic silicate production in the Australian sector of theSub-Antarctic Zone of the Southern Ocean in late summer 1998, J.Geophys. Res., 106, 31,627–31,636, 2001.
Redfield, A., B. Ketchum, and F. Richards, The influence of organisms onthe composition of sea water, in The Sea, edited by M. Hill, pp. 26–77,Wiley-Intersci., New York, 1963.
Rintoul, S. R., and J. L. Bullister, A late winter hydrographic section fromTasmania to Antarctica, Deep Sea Res., Part I, 46, 1417–1454, 1999.
Rintoul, S. R., and T. W. Trull, Seasonal evolution of the mixed layer in theSubantarctic Zone south of Australia, J. Geophys. Res., 106(C12),31,447–31,462, 2001.
Rosenberg, M., S. Bray, N. Bindoff, R. Rintoul, N. Johnson, S. Bell, andP. Towler, Aurora Australis marine cruise au9501, au9604 and au9601—Oceanographic field measurements and analysis, inter-cruise comparisonsand data quality notes, Res. Rep. 12, 150 pp., Antarctic Coop. Res. Cent.,Hobart, Australia, 1997.
Sambrotto, R. N., and B. J. Mace, Coupling of biological and physicalregimes across the Antarctic Polar Front as reflected by nitrogenproduction and recycling, Deep Sea Res., Part II, 47, 3339–3367,2000.
Sarmiento, J. L., T. M. C. Hughes, R. J. Stouffer, and S. Manabe, Simulatedresponse of the ocean carbon cycle to anthropogenic climate warming,Nature, 393, 245–249, 1998.
Sedwick, P. N., G. R. DiTulliio, D. A. Hutchins, P. W. Boyd, F. B. Griffiths,A. C. Crossley, T. W. Trull, and B. Queguiner, Limitation of algal pro-
duction by iron and silicic acid deficiency in the Australian Subantarcticregion, Geophys. Res. Lett., 26, 2865–2868, 1999.
Sigman, D. M., and E. A. Boyle, Glacial/interglacial variations in atmo-spheric carbon dioxide, Nature, 407, 859–869, 2000.
Sweeney, C., et al., Nutrient and carbon removal ratios and fluxes in theRoss Sea, Antarctica, Deep Sea Res., Part II, 47, 3395–3421, 2000.
Takahashi, T., W. Broecker, and S. Langer, Redfield ratio based on chemi-cal data from isopycnal surfaces, J. Geophys. Res., 90, 6907–6924, 1985.
Takeda, Influence of iron availability on nutrient consumption ratio ofdiatoms in oceanic waters, Nature, 393, 774–777, 1998.
Trull, T., S. Bray, S. Manganini, S. Honjo, and R. Francois, Moored sedi-ment trap measurements of carbon export in the Sub-Antarctic and PolarFrontal Zones of the Southern Ocean, south of Australia, J. Geophys.Res., 106, 31,489–31,509, 2001.
Wang, X., and R. J. Matear, Modeling the upper ocean dynamics in theSubantarctic and Polar Frontal Zones in the Australian sector of theSouthern Ocean, J. Geophys. Res., 106, 31,511–31,524, 2001.
Wang, X., R. J. Matear, and T. W. Trull, Modeling seasonal phosphateexport and resupply in the Subantarctic and Polar Frontal Zones in theAustralian sector of the Southern Ocean, J. Geophys. Res., 106, 31,525–31,541, 2001.
Watson, A. J., D. C. E. Bakker, A. J. Ridgwell, P. W. Boyd, and C. S. Law,Effect of iron supply on Southern Ocean CO2 uptake and implications forglacial atmospheric CO2, Nature, 407, 730–733, 2000.
Williams, R. G., and M. J. Follows, The Ekman transfer of nutrients andmaintenance of new production over the north Atlantic, Deep Sea Res.,Part I, 45, 461–489, 1998.
�������������������������R. J. Matear and T. W. Trull, Antarctic CRC, University of Tasmania,
GPO Box 252-80, Hobart 7001, Tasmania, Australia.X. Wang, Earth System Science Interdisciplinary Center, University of
Maryland, 2227 Computer and Space Science, Building 224, College Park,MD 20742, USA. ([email protected])
9 - 12 WANG ET AL.: NUTRIENT UTILIZATION RATIOS IN THE POLAR FRONTAL ZONE