#19 PolarPredictNews - Polar Prediction Project
23
1 Find more information at www.polarprediction.net Working on Deck In this photo, Tao Li and his student Jialiang Zhu from the Ocean University of China in Qingdao, China perform a dry run of setting up a buoy in preparation for its eventual deployment on the sea ice. The photo was taken by physicist and professional photographer Thea Schneider, who joined the first part of the MOSAiC expedition on board the Russian research vessel RV Akademik Fedorov. This summer, Thea Schneider launched a successful crowdfunding campaign to fund the printing of “The Quiet”, a book of her original images. Read more on page 20. Lindy Hop and Arctic Meteorology by Gunilla Svensson An Arctic Buoy Story by Thomas Rackow, Daniel Watkins and Vasiliy Smolyanitsky “Let the Experts Do What They Do Best” YOPP-endorsed! – The ALERTNESS Project Interview with Alertness PI Jørn Kristiansen YOPP in Antarctica – Winter Targeted Observing Periods by Irina Gorodetskaya and the YOPP-SH Task Team Photo: Thea Schneider #19 PolarPredictNews n lar Predictio for Po October 2021
-
Upload
khangminh22 -
Category
Documents
-
view
0 -
download
0
Transcript of #19 PolarPredictNews - Polar Prediction Project

1
PolarPredictNews #19
Oktober 2021
Find more information atwww.polarprediction.net
Working on Deck In this photo, Tao Li and his student Jialiang Zhu from the Ocean University of China in Qingdao, China perform a dry run of setting up a buoy in preparation for its eventual deployment on the sea ice. The photo was taken by physicist and professional photographer Thea Schneider, who joined the first part of the MOSAiC expedition on board the Russian research vessel RV Akademik Fedorov. This summer, Thea Schneider launched a successful crowdfunding campaign to fund the printing of “The Quiet”, a book of her original images.
Read more on page 20.
Lindy Hop and Arctic Meteorology by Gunilla Svensson
An Arctic Buoy Storyby Thomas Rackow, Daniel Watkins and Vasiliy Smolyanitsky
“Let the Experts Do What They Do Best”YOPP-endorsed! – The ALERTNESS Project Interview with Alertness PI Jørn Kristiansen
YOPP in Antarctica – Winter Targeted Observing Periodsby Irina Gorodetskaya and the YOPP-SH Task Team
Photo: Thea Schneider
#19 PolarPredictNews
nlar Predictiofor Po
October 2021

Content
photo: Martina Buchholz/Alfred Wegener Institute
The Year of Polar Prediction (YOPP) is a ma-jor international activity that was initiated by
the World Meteorological Organization as a key component of the
Polar Prediction Project (PPP). The overarching goal of YOPP is to
significantly advance our environmental prediction capabilities for the polar regions
and beyond. As an internationally coordinated period of intensive observing, modelling, prediction,
verification, user-engagement, and education activities involving various stake-
holders, YOPP contributes to the knowledge base needed to manage the opportunities and risks that come with
polar climate change.
Dear Colleagues,
In this 19th issue of PolarPredictNews, we feature another fantastic Science+Art project. Sergi González and Sara Pasqualetto developed the “Stations & Stripes”, a lucid way of illustrating the last decades’ temperature evolution for a number of Antarctic stations. Also in this issue, Irina Gorodetskaya and the YOPP-SH team have provided an overview on the upcoming Special Observing Period during Antarctic winter 2022 which will be one of the activities that will be ongoing beyond the formal end of PPP in 2022.
Kirstin Werner, our Director of the International Coordination for Polar Prediction (ICO) for the last 5 1/2 years will be leaving us by end of October 2021 to take up a new and exciting post at the University of Rostock, Germany. Over the years, Kirstin has made outstanding contributions to PPP and YOPP, and I would be lying if I would say that her departure won’t have an impact on the final outcome of YOPP. At the same time I am tremendously happy for Kirstin to have been offered this high-level job; and I am delighted that PPP and YOPP provided the opportunity for Kirstin to develop her leadership and communication skills, among others.
When it became clear that Kirstin will be leaving, we recognised that we will have to adjust our ambition. Rather than continuing all activities with reduced resources, we decided to “cut in the vertical”. Given Kirstin’s pivotal role in editing PolarPredictNews, we made the decision to stop issuing this newsletter. We would simply not be able to keep up the high standards that Kirstin and her team have established.
With this I would like to take the opportunity and thank Kirstin on behalf of the whole polar prediction community for her excellent work; and I wish her all the best for her new job! For all the readers, I hope that you will enjoy this last issue of PolarPredictNews.
Happy reading, Thomas Jung
Lindy Hop and Arctic Meteorologyby Gunilla Svensson
p. 5–7
Polar Prediction and the Ocean by Daniel Butkaitisp. 8–11
About a Buoy – Story of an Arctic Research Buoy Interview with Thomas Rackow, Daniel Watkins and Vasily Smolyanitsky
p. 12–15
International Coordination Office (ICO) for Polar Prediction
Find more information atwww.polarprediction.net
03
0102
What’s been Published? – First Results One Year after the MOSAiC Expeditionby Patrick Hansen and Thomas Hasiweder
p. 16–1704
YOPP Final Summit – Call for Abstracts and Registration p. 18–19
05A Day in the Life of a Polar Scientist – How a Crowdfunding Campaign Became a Success Story by Thomas Hasiweder
p. 2006
New YOPP-Endorsed Project “Arctic PASSION” to Recast Arctic Observing Systemsby Patrick Hansen
p. 2107
p. 24–2608 YOPP in Antarctica – Winter
Targeted Observing Periodsby Irina Gorodetskaya, David Bromwich and the YOPP-SH Task Team
p. 2709 A Decade of Polar
Prediction – New YOPP Video Available
p. 2911 Bonus Episode
of The IcePod with Polarstern Captain Thomas Wunderlich
p. 30–3112 Introducing the YOPP
Task Teams – YOPP Educationby Nadine Hillenbrand
p. 3213 Hello and Good Bye –
News from the YOPP International Coordination Office
p. 3314 On a Personal Note
p. 3415 International MOSAiC Conference/
Workshop – Postponed by Nadine Hillenbrand
p. 3516 YOPP Southern Hemisphere Session at
ICSHMO in New Zealand by Thomas Hasiweder
p. 3617 Reanalysis Study Calls for More Small-
Scale Observations over East Antarctica Sergi González et al. analyze surface air temperatures on the Antarctic Plateau
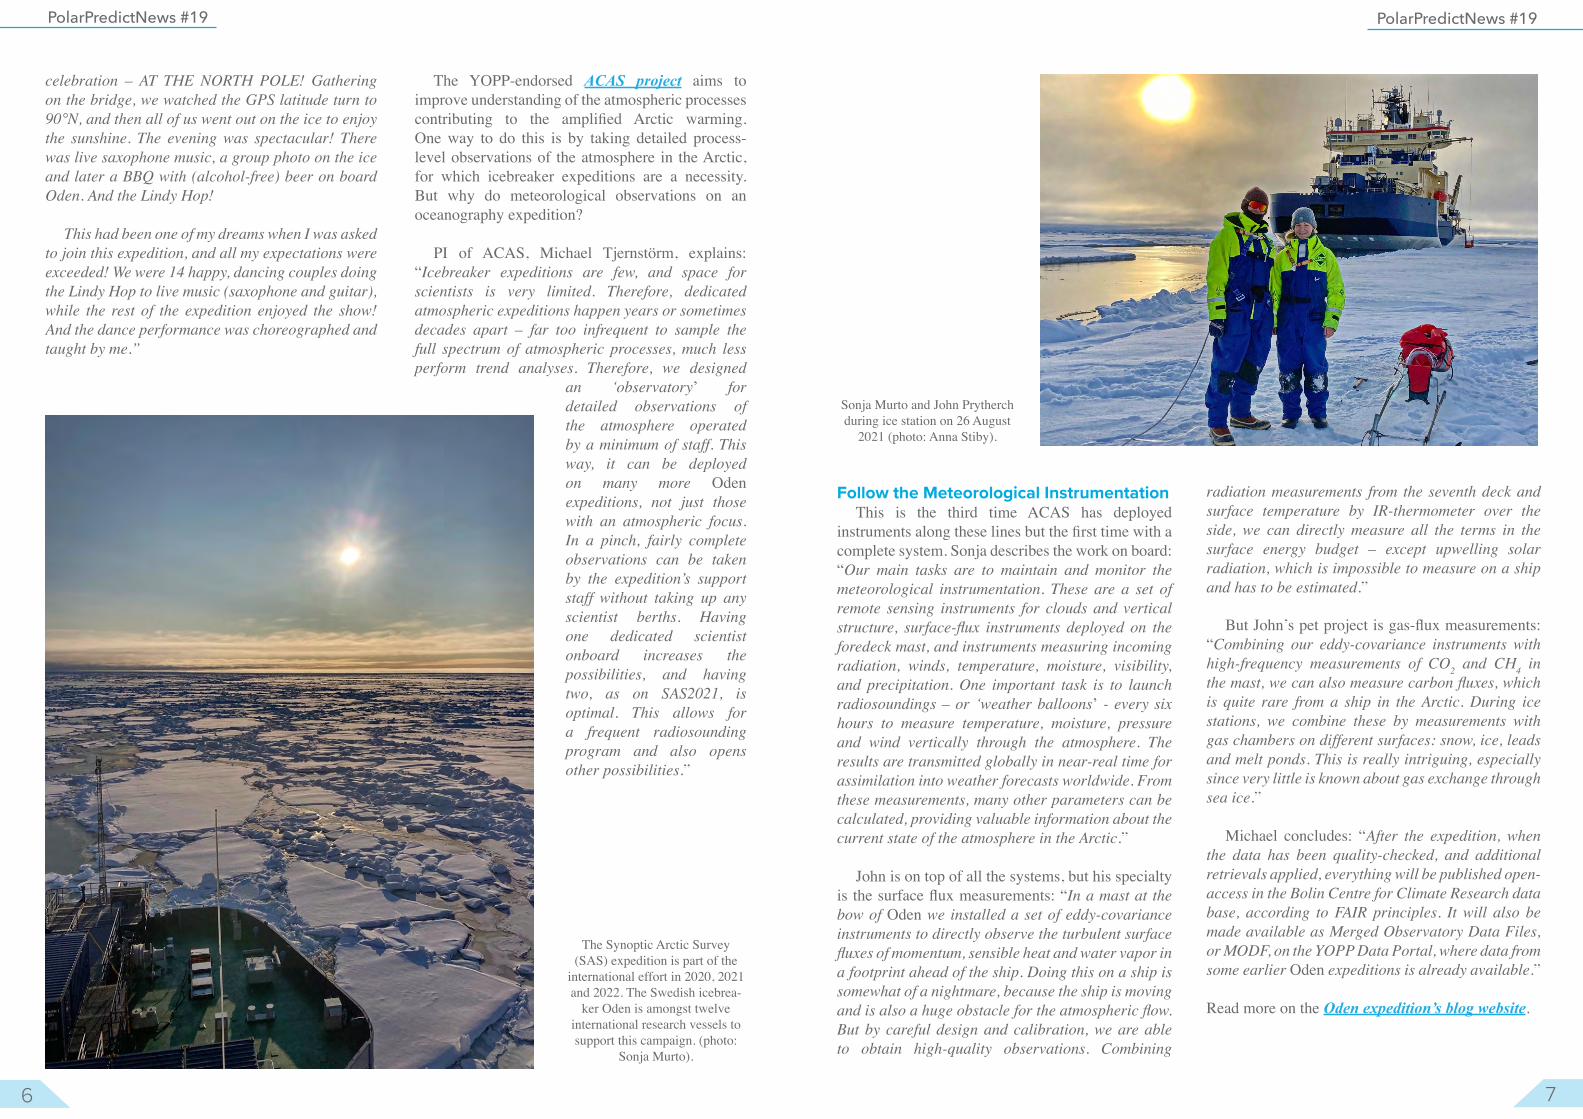
p. 36–3718 Radiation in Alaska – How to Keep
Sensors Free from Icing Chris Cox et al. show that vetilation can largely avoid icing of radiometer sensors
p. 42–4321 Upcoming (mostly Online) Meetings
p. 38–4120 “Let the Experts Do What They Do Best”
YOPP-endorsed! – The Alertness ProjectInterview with Alertness PI Jørn Kristiansen from Met Norway
Art + Science
FEATURED IN THIS ISSUE:
by Sergi González and Sara Pasqualetto
p. 4, 22–23
TOP STORY
NEW PUBLICATIONS
NEW PUBLICATIONS
p. 2810 The Great Expectations – The
IcePod’s Final Episode with Matthew Shupe

5
PolarPredictNews #19
FEATURED IN THIS ISSUE:
After the YOPP International Coordination Office’s call for Science + Art ideas, Sergi González (from AEMET) shared some graphs with us on Antarctic surface temperature data from 1950 to 2020. Together, we came up with the idea of developing temperature stripes, which Sara Pasqualetto then added to her beautiful drawings of Antarctic stations. “The idea seemed so cool to me that I couldn’t refuse to participate”, says Sergi. Now there’s even a TikTok video that has since been produced on the evolution of temperatures in Antarctica.
Sergi González works at the Spanish Meteorological Agency (AEMET), where he is a member of the Antarctic group. He takes on both operational and research tasks and recently obtained his PhD in physics at the University of Barcelona analysing remote-sensing observations of snow and other precipitation. Sergi has participated in three Antarctic campaigns: two as a weather forecaster at the Spain’s Juan Carlos I station (2016/17, 2017/18), and another as a scientist on the MICROAIRPOLAR
project around the Antarctic Peninsula and at the international Byers Camp (2018/19). He also participated in the Windsled expeditions in Greenland and Antarctica, giving ground support and co-designing the instrumentation for the Year
of Polar Prediction- (YOPP-) endorsed MAWS project.
Sara Pasqualetto studied political science and international relations in Italy and Germany and has worked in the advocacy and outreach sections of international organizations like UNICEF
and the Coalition for the ICC. She followed her interest in climate change and prediction and joined the Alfred Wegener Institute in Bremerhaven from December 2018 to June 2020 to get involved in communication and management activities not only for the Polar Prediction Project but also for the H2020 project APPLICATE and the Helmholtz Association-funded ESM project. She just recently moved to Boulder, Colorado to look for her next opportunity.
For more information on the Stations & Stripes project, see pp. 22–23 and all across this PolarPredictNews issue.
Art + Science
4
remote ice floes. And the whole time, we’re running our own meteorological observation program”, says Sonja.
The Synoptic Arctic Survey is an international program to map the physical, biological and ecological state of the Arctic Ocean, and to understand its functioning and changes due to climate change and other drivers; SAS2021 is the Swedish contribution. On board is a team of ~35 international scientists and ~40 crew members. Most of the scientists are chemists or biologists, but John and Sonja are on the ACAS (Arctic Climate Across Scales) project’s meteorology team, led by professor Michael Tjernström who follows the progress from Sweden.
But what about the Lindy Hop?Of course, Sonja can best tell this story: “On
Monday evening, 16 August, we started the final transit to the North Pole. The weather had mostly been foggy and cloudy, but this evening the sun came out, and the weather turned absolutely beautiful. We had finished for the day and were ready for
Lindy Hop and Arctic Meteorology01
Why would anyone do the Lindy Hop on sea ice at the North Pole? The answer will not be obvious to most but to PhD student Sonja Murto, an avid dancer, it is the most natural thing in the world. Sonja, together with Dr John Prytherch, both from the Department of Meteorology at Stockholm University, were part of the Synoptic Arctic Survey 2021 (SAS2021) expedition on the Swedish research icebreaker Oden this summer. And the Lindy Hop is Sonja’s passion – that, and meteorology.
“Due to the pandemic, our adventure started earlier, on 16 July, with an 8-day quarantine at a hotel in southern Sweden before we were allowed on board Oden to start the transit to the Arctic. We reached the ice edge at the beginning of August, and since then we have traversed towards the North Pole. On the way, we stop briefly for CTD-casts, measuring ocean vertical structure, and also do longer stops, for 24–48 h, for extensive sampling of all sorts of biology and chemistry of the snow, sea ice and ocean; and even for fishing! And if not stopping, we use the ship’s helicopter to reach more
by Gunilla Svensson, University of Stockholm
by Sergi González, Spanish State Meteorological Agency AEMET, and Sara Pasqualetto, WMO WWRP International Coordination Office for Polar Prediction, Alfred Wegener Institute
Stations & Stripes: Temperature Evolution in Antarctica
TOP STORY
Since December 2018, Sara has worked with us in the YOPP Coordination Office. She just moved to Boulder. We are sad to say Good Bye to her (see p. 32, photo: private). Lindy Hop dancers at the North Pole. From 26 July to 20 September, the Synoptic Arctic Survey (SAS) expedition took place on
board the Swedish icebreaker Oden (photo: Hans-Jörgen Hansen).
When Sergi González is not looking into future or past temperature data from Antarctica, he is keen on finding a penguin who likes to be on a selfie with him (photo: Sergi
González).
7
PolarPredictNews #19PolarPredictNews #19
6
Follow the Meteorological InstrumentationThis is the third time ACAS has deployed
instruments along these lines but the first time with a complete system. Sonja describes the work on board: “Our main tasks are to maintain and monitor the meteorological instrumentation. These are a set of remote sensing instruments for clouds and vertical structure, surface-flux instruments deployed on the foredeck mast, and instruments measuring incoming radiation, winds, temperature, moisture, visibility, and precipitation. One important task is to launch radiosoundings – or ‘weather balloons’ - every six hours to measure temperature, moisture, pressure and wind vertically through the atmosphere. The results are transmitted globally in near-real time for assimilation into weather forecasts worldwide. From these measurements, many other parameters can be calculated, providing valuable information about the current state of the atmosphere in the Arctic.”
John is on top of all the systems, but his specialty is the surface flux measurements: “In a mast at the bow of Oden we installed a set of eddy-covariance instruments to directly observe the turbulent surface fluxes of momentum, sensible heat and water vapor in a footprint ahead of the ship. Doing this on a ship is somewhat of a nightmare, because the ship is moving and is also a huge obstacle for the atmospheric flow. But by careful design and calibration, we are able to obtain high-quality observations. Combining
radiation measurements from the seventh deck and surface temperature by IR-thermometer over the side, we can directly measure all the terms in the surface energy budget – except upwelling solar radiation, which is impossible to measure on a ship and has to be estimated.”
But John’s pet project is gas-flux measurements: “Combining our eddy-covariance instruments with high-frequency measurements of CO2 and CH4 in the mast, we can also measure carbon fluxes, which is quite rare from a ship in the Arctic. During ice stations, we combine these by measurements with gas chambers on different surfaces: snow, ice, leads and melt ponds. This is really intriguing, especially since very little is known about gas exchange through sea ice.”
Michael concludes: “After the expedition, when the data has been quality-checked, and additional retrievals applied, everything will be published open-access in the Bolin Centre for Climate Research data base, according to FAIR principles. It will also be made available as Merged Observatory Data Files, or MODF, on the YOPP Data Portal, where data from some earlier Oden expeditions is already available.”
Read more on the Oden expedition’s blog website.
celebration – AT THE NORTH POLE! Gathering on the bridge, we watched the GPS latitude turn to 90°N, and then all of us went out on the ice to enjoy the sunshine. The evening was spectacular! There was live saxophone music, a group photo on the ice and later a BBQ with (alcohol-free) beer on board Oden. And the Lindy Hop!
This had been one of my dreams when I was asked to join this expedition, and all my expectations were exceeded! We were 14 happy, dancing couples doing the Lindy Hop to live music (saxophone and guitar), while the rest of the expedition enjoyed the show! And the dance performance was choreographed and taught by me.”
The YOPP-endorsed ACAS project aims to improve understanding of the atmospheric processes contributing to the amplified Arctic warming. One way to do this is by taking detailed process-level observations of the atmosphere in the Arctic, for which icebreaker expeditions are a necessity. But why do meteorological observations on an oceanography expedition?
PI of ACAS, Michael Tjernstörm, explains: “Icebreaker expeditions are few, and space for scientists is very limited. Therefore, dedicated atmospheric expeditions happen years or sometimes decades apart – far too infrequent to sample the full spectrum of atmospheric processes, much less perform trend analyses. Therefore, we designed
an ‘observatory’ for detailed observations of the atmosphere operated by a minimum of staff. This way, it can be deployed on many more Oden expeditions, not just those with an atmospheric focus. In a pinch, fairly complete observations can be taken by the expedition’s support staff without taking up any scientist berths. Having one dedicated scientist onboard increases the possibilities, and having two, as on SAS2021, is optimal. This allows for a frequent radiosounding program and also opens other possibilities.”
The Synoptic Arctic Survey (SAS) expedition is part of the
international effort in 2020, 2021 and 2022. The Swedish icebrea-
ker Oden is amongst twelve international research vessels to support this campaign. (photo:
Sonja Murto).
Sonja Murto and John Prytherch during ice station on 26 August
2021 (photo: Anna Stiby).

9
PolarPredictNews #19PolarPredictNews #19
8
Polar Prediction and the Ocean02
2021 marks the beginning of the Decade of Ocean Science for Sustainable Development embarked on by the United Nations. Fostering international research cooperation to improve our understanding of the ocean, its special focus lies on the polar regions most severely affected by climate change. Here, we look at the role of the oceans in making predictions in the polar regions.
More than 70 % of Earth’s surface is covered by oceans. The sea plays a crucial role in our global climate system. Without ocean currents such as the gulf stream, winters in Europe would be much colder. Oceans are also an important sink for atmospheric carbon dioxide. Since the beginning of the industrial revolution, ocean waters have absorbed around 30% of anthropogenic carbon dioxide. Millions of people depend on the rich diversity of life that lies beneath the ocean surface. The oceans are a priceless treasure for all humanity.
by Daniel Butkaitis, WMO WWRP International Coordination Office for Polar Prediction, Alfred Wegener Institute
Yet the vast ecosystem beneath the sea surface is still largely unexplored; our knowledge about the oceans literally just scratches the surface. Even the moon is better mapped than the deep sea. Still, what has become clear over the past decades is that our oceans are suffering as a result of human activities. Overfishing, acidification of the oceans, and anthropogenic-induced sea-level rise are just some of the many challenges we are currently facing when it comes to maintaining our oceans in a healthy state.
To foster international partnerships and research collaborations in ocean science, the United Nations has launched the Decade of Ocean Science for Sustainable Development at the beginning of 2021. This decadal programme, whose motto is “The science we need for the ocean we want”, will provide a global science-policy framework to support countries toward achieving the Sustainable Development Goals allied with the Agenda 2030. The recently submitted Ocean Decade Implementation Plan defines seven societal outcomes (SOs) which reflect what society needs from ocean science. Since November 2020, more than 200 programme proposals have already been submitted in response to the first call for the Decade’s activities.
Rapid Sea-Ice Loss Causes Increasing Freshwater Content
The polar regions are amongst the most vulnerable areas to climate change. Predicting weather and climate in these regions requires a thorough understanding of the prevailing physical processes. The interactions between the ocean and the atmosphere are one of the fundamental drivers of weather and climate patterns. In the Arctic and in Antarctica, sea ice plays an additional role in the energy budget of the polar atmosphere as it regulates exchanges of heat and motion between both domains. Around 15 to 25 million km2 of the global ocean surface is covered by sea ice on annual average, though its thickness and extent can differ depending on the season. However, the average sea-ice extent in the Arctic has been declining now for
decades, and it seems like this trend will continue, as confirmed by climate-model predictions and supported by observations and various data analyses.
The reasons for the sea-ice loss are manifold. One of the best-known drivers of sea-ice loss is the ice-albedo feedback, meaning that the darker ocean surface absorbs more heat than the whiter ice cover, accelerating ice loss. An overview of the important drivers of ice loss is shown by Maksym (2019); the author illustrates well how strongly atmosphere, ocean and sea ice are interconnected.
A recent paper published in Nature Communications by Armitage et. al (2020) investigates changes in the Arctic Ocean’s Beaufort Gyre using 12 years of satellite data. The Beaufort Gyre is a region where cold freshwater from precipitation in the western Arctic Ocean and northern Alaska collects. Over the course of decades, this cold water is transported through the Arctic Ocean and eventually released into the Atlantic Ocean. However, data analysis by the authors shows that
since the 1990s, the Beaufort Gyre has accumulated vast amounts of fresh water. According to them, “the loss of sea ice and acceleration of ocean currents after 2007 resulted in enhanced mechanical energy input but without corresponding increases in potential energy storage”. Possible explanations for the increased amount of freshwater include either mesoscale eddy activity or a reduced sea-ice–ocean surface stress. Both factors influence the ocean’s circulation, most likely via what is known as Ekman transport in the upper surface layers. As the wind blows, it pushes against the ocean surface, which can lead to up- or downwelling of the surface water masses and thereby impact deeper ocean layers.
The Beaufort Sea, one of the biggest freshwater reservoirs in the Arctic Ocean, has increased its freshwater content this way by 40 % over the past two decades. A recent study by Zhang et al. (2021) raised concerns that the release of this freshwater could have major effects on the Atlantic Meridional Overturning Circulation (AMOC). The AMOC is one of the world’s largest ocean currents, and it
Overview of the Ocean Decade process (source: Implementation Plan United Nations Decade of Ocean Science for Sustainable Development, Figure 3).
Photo: Stefan Hendricks, Alfred Wegener Institute

11
PolarPredictNews #19PolarPredictNews #19
10
strongly influences weather and climate at every latitude. If the AMOC were to weaken, or even collapse, it would lead to massive cooling in the northern hemisphere, with less precipitation events and a southward shift of the monsoons in South America and Africa, as the British MET Office explains in one of their factsheets.
Despite their importance for global weather, climate and ecosystems, the polar regions are still badly underdeveloped in terms of observational infrastructur compared to the rest of the world. This puts scientists to the test as weather and climate models are often unable to access important data needed to accurately predict weather conditions and future climate scenarios. More collaborative and interdisciplinary efforts in Arctic and Antarctic research programs will therefore be very important in the upcoming Ocean Decade.
Current Activities within the UN Ocean Decade
Under the umbrella of the UN Ocean Decade, several regional action plans have been (or are now in the process of being) set up. One of the first of these is the Arctic Action Plan, which aims to identify strategic priorities and activities for the Ocean Decade and implement them regionally. A similar action plan for the Southern Ocean is currently being developed. The second Southern Ocean Regional Workshop is set to take place this September as part of the fourth iteration of the Polar Data Forum. This event provides a space for key stakeholders to gather and further discuss and prioritize the Southern Ocean challenges and identify specific activities and deliverables for the community to overcome them.
Other ongoing projects also look very promising. A good example is the S2S project, a comprehensive endeavour of the WMO World Weather Research Programme (WWRP) and the World Climate Research Programme (WCRP). Its main goal is to enhance the prediction technology for sub-seasonal to seasonal, or S2S, timescales, which ranges from two weeks to two months. The second phase of this project has been underway since 2018; it will conclude in 2023. A major goal of the first phase of the project was the establishment of the S2S database. It contains various datasets from 11 operational centres. The database is constantly being updated, and new parameters are added regularly.
So far, the S2S approach seems very beneficial compared to conventional models. Zampieri et al. (2018), who evaluated the various models in the S2s database, found that many of them have been able to properly predict the Arctic sea-ice edge up to a month or more in advance. Their findings show the great potential of more sophisticated approaches to modelling for sub-seasonal to seasonal weather prediction, which is useful for applications like polar navigation.
Coming Up: Virtual Diving Tours A major goal of the UN Ocean Decade will be the
creation of what is being termed a “digital twin of the ocean”, also part of the new European Green Deal launched by the European Commission. A digital twin of the ocean – a virtual copy of the ocean – will be the next major milestone in model development. Oceanographic data is already being collected from various sources such as satellites, buoys and research vessels. Over time, new methods and technologies will come into play. The aim of the ocean’s digital twin is to integrate a wide range of existing as well as new data sources into a single, sophisticated model. According to the European Commission, this digital representation of the real ocean “should allow assessment of the state of ecosystems, habitats and the impact of human activities; forecasts of their short and long-term changes; development of biodiversity conservation strategies; management of sustainable economic activities; assessment of
infrastructure vulnerability; development of mitigation, adaptation and replacement plans to deal with climate risks and optimization of emergency responses to severe events such as storm surge”. The digital twin will also follow the FAIR guiding principles for scientific data management and stewardship, meaning that all the data will be Findable, Accessible, Interoperable and Reproducible for everyone.
The digital twin ocean will also include a dynamic, open-access ocean map for the discovery, exploration and visualization of past, current and future ocean conditions as relevant not only for specific stakeholders but also for the society as a whole. The digital twin will thus serve as a conduit between science and society by letting scientific findings be visualized in an understandable manner. In contrast to current coupled or uncoupled ocean models, the digital-twin approach allows biological and biochemical factors to be considered. For
instance, the fishing industry could use a digital ocean twin to project the most sustainable ways to capture wild fish.
Professor Martin Visbeck, head of physical oceanography at the GEOMAR Helmholtz Centre for Ocean Research in Kiel, is currently the lead PI in the development of the digital ocean twin. He is very optimistic about the social benefits of a digital twin. The holistic approach allows a wide range of uses. People might do virtual field campaigns or deep-water dives to see how certain decisions affect the environment. In an interview with Der Standard, a German news agency, Visbeck said, You could see what a particular reef would look like in 30 years under the EU’s Green Deal as opposed to the recommendation of then-U.S. President Donald Trump.
ConclusionOcean science is currently at an exciting juncture.
While data collection and observational capabilities have steadily evolved in the past few decades, scien-tists still struggle to fully understand the complex interactions between the ocean and the atmosphere. Especially in the polar regions, the multifaceted in-terrelationships of ocean and atmosphere are beco-ming clearer, sea ice connects the two domains and is crucial for weather and climate predictions both in these regions and, if we look at longer timescales, beyond them. With the UN Ocean Decade now just
beginning and so many promising projects and initi-atives just about to start, the future is looking bright for ocean predictions all around the globe.
ReferencesArmitage, T. W. K., Manucharyan, G. E., Petty, A. A., Kwok, R., & Thompson, A. F. (2020). Enhan-ced eddy activity in the Beaufort Gyre in response to sea ice loss. Nature Communications, 11(1). https://doi.org/10.1038/s41467-020-14449-z
Maksym, T. (2019). Arctic and Antarctic Sea Ice Change: Contrasts, Commonalities, and Cau-ses. Annual Review of Marine Science, 11(1), 187–213. https://doi.org/10.1146/annurev-mari-ne-010816-060610
Zampieri, L., Goessling, H. F., & Jung, T. (2018). Bright Prospects for Arctic Sea Ice Prediction on Subseasonal Time Scales. Geophysical Re-search Letters, 45(18), 9731–9738. https://doi.org/10.1029/2018gl079394 Zhang, J., Weijer, W., Steele, M., Cheng, W., Verma, T., & Veneziani, M. (2021). Labrador Sea freshening linked to Beaufort Gyre freshwater release. Nature Communications, 12(1). https://doi.org/10.1038/s41467-021-21470-3
Orcadas Station, located in the South Orkney Islands at the northern tip of the Antarctic Peninsula, is the longest series of temperatures in Antarctica. This series, with more than 100 years of duration, shows a clear warming trend, consistent with the increase of greenhouse gas concentrations but also strengthened by the positive SAM trends observed in the last 60 years (Jones et al. 2019). In fact, the Antarctic Peninsula has been found to be one of the fastest regional warming places in the world (Vaughan et al. 2003).

13
PolarPredictNews #19PolarPredictNews #19
12
About a Buoy – Story of an Arctic Research Buoy
During the MOSAiC expedition, a buoy of the of the Marlyn-Yug iceST-B/40 type (i.e. an SVP-B/40H but without drogue), known as 2019P123, was released on 10 October 2019 as part of the mission of the research icebreaker Akademik Fedorov that helped RV Polarstern set up a distributed network around the MOSAiC research camp. Surviving for 359 days, 2019P123 was one of the most dependable, longest-lived buoys deployed on the one-year Arctic drift. While being tracked via GPS, it collected pressure and temperature data that weather forecasters began using immediately. The data it gathered over the course of its long life will be used to improve climate simulations and better understand the climate of the central Arctic. A virtual conversation took place between Thomas Rackow, Daniel Watkins and Vasily Smolyanitsky, who deployed 2019P123 by helicopter during the Akademik Fedorov’s journey home.
Generally speaking, is it possible to anticipate which buoy will have a longer lifetime or collect more valuable data in comparison to others buoys?Thomas Rackow (TR): Realizing that there is a more or less persistent sea-ice drift pattern consisting of the Beaufort Gyre circulation and the Transpolar Drift, you can say that buoys within the gyre – or far away from Fram Strait, where huge amounts of sea ice are transported out of the Arctic and eventually melt southwards of it – are more likely to survive longer. Buoys close to Fram Strait could be expelled rather quickly, well before one year has passed.
Vasily Smolyanitsky (VS): Besides these gyres, there are a couple of other zones in the Arctic Ocean where the buoys may stay for a considerable amount of time including the “transcoastal” zone along the Siberian coast from the Chukchi Sea to the East Siberian Sea and into the western Laptev Sea. However, a life spent in one of the gyres is just the one purpose in a buoy’s lifespan. Another is the time spent under more or less uniform environmental conditions, either only in open water, in more or less undeformed ice or – and this is the least interesting but most favorable environment for a buoy – thrown on the coast. The current record for a Surface Velocity Program barometer drifter (SVP-B buoy), 709 days and still active, is held by Argos 174645 of the SVP-B/40H (same as the iceST-B/40 but with the drogue) which was thrown on the coast of the Taimyr Peninsula after some drifting in the autumn in the Laptev Sea. The current absolute lifetime record of 714 days is held by the Argos 174646 of the SVP-B/40H (same as the iceST-B/40 but with a drogue), which started its anabasis east of Bolshevik Island, visited the Vilkitsky Strait and then was propelled for more than a year under the ice to awake west of Franz-Josef Land. The buoy is still active, though, there is an issue with data retrieval.
03Interview: Thomas Hasiweder and Kirstin Werner, WMO WWRP International Coordination Office for Polar Prediction, Alfred Wegener Institute
What makes 2019P123 special in comparison to other buoys? Why should it be considered the “YOPP-Buoy”?TR: There had been a gap in the observational network of drifting Arctic buoys. Since this area is rather remote, it was a good opportunity for us to take the Mi-8 helicopter from Akademik Fedorov while we were on the way back from the successful set-up up of the MOSAiC distributed network. It was one of the last buoys to be deployed, which made it special.
VS: Besides 2019P123, there were also other buoys belonging to a wider MOSAiC network and deployed during the same period in the Eurasian Arctic; they are all to be called special. For a example, the Argos IDs SVP-B 53093 and 52960 deployed from the icebreaker Kapitan Dranitsyn in December 2019 during MOSAiC leg 2. They drifted from approximately the initial position of the distributed network to Fram Strait for 369 and 335 days, respectively. The Argos ID 53095 SVP-B, deployed just at the start of MOSAiC in the central Arctic, drifted for 431 days to a point eastward of the North Pole, that is, for much longer than Polarstern.
Daniel Watkins (DW): There were quite a few buoys deployed that were much more complex and took measurements at a level of detail that hadn’t really been seen before. For example, the autonomous ocean flux buoys deployed by Tim Stanton and his team (one of which operated until March 2021), the snow depth sensors and the tethered profilers from WHOI (with their 700-metre-deep measurements) were all much more challenging to deploy and operate. But that isn’t to take away from 2019P123 doing a great job at its particular task!
Can you talk about the deployment of 2019P123? How was it released? What was challenging?DW: We deployed the buoy using an Mi-8 helicopter and flew it out as far as we could safely go. A special part of this buoy deployment was that we were able to get approval for a few people involved in YOPP to come with us who hadn’t had a chance to go along on a deployment yet.
TR: The deployment site was actually far away from our ship, some 400 km there and back (or about two hours flight time). Considering the return trip, this was much farther than what the helicopters on RV Polarstern could safely accomplish. For
Daniel Watkins, Vasily Smolyanitsky and Thomas Rackow back on board RV Akademik Fedorov after buoy 2019P123 had been
successfully deployed in the Arctic Ocean (photo: Friederike Krüger).
Vasily Smolyanitsky (l.) and Daniel Watkins (r.) walking back to the
helicopter after they deployed 2019P123 (photo right and p. 14: Thomas Rackow).
Drift tracks from buoy 2019P123 (yellow) and six other EUMETNET buoys. (source: Daniel Watkins).

15
PolarPredictNews #19PolarPredictNews #19
14
Located near Orkney, in the South Shetland Islands is Juan Carlos I station. Juan Carlos I, with a continuous short series that began in 1997 (the entire series began in 1988 but only for summer seasons) does not show any trend. This series started at the beginning of the 20-year cooling period observed in the area between the late 1990s and the mid-2010s (Turner et al. 2016, Oliva et al. 2017). This short-term cooling has been recently reversed (Carrasco et al. 2021). This is a great example of the high variability exhibited by temperature trends in the Antarctic Peninsula for periods of less than 30 years (González and Fortuny, 2018).
me personally, it was also my first flight on a Russian Mi-8 in the Arctic, which made it even more exciting. We all signed the buoy, I scribbled the YOPP logo on its smooth hull and Daniel and Vasily jumped out of the helicopter after it landed on the ice surface and placed the buoy several meters from the helicopter. It is rather surprising how quick the deployment process for these simpler positional buoys is compared to setting up the more complicated instruments for the distributed network or even the organizational challenges to just get there. The buoy was started by pulling a magnetic switch, and that’s it.
DW: Like most of the drifting buoys, 2019P123’s importance is due to its function as a part of a network rather than its performance alone. 2019P123 was one of seven buoys funded by EUMETNET that we deployed during fall 2019, each equipped with temperature and pressure sensors along with GPS. Four of the EUMETNET buoys were placed in a ring 50 km away from RV Polarstern, and three were placed between 100 and 200 km away. Buoys 2019P123 and 2019P128 were placed the furthest away, at 175 km. This was about as far away from the ship as we could fly. They were deployed in a “hole” in the Arctic-wide buoy system: i.e., in an area where no observations were available from
other buoys, ships or weather stations for many kilometres. It immediately began being used for weather prediction as far as I am aware. Throughout the Arctic, drifting buoys are an important tool, because they can report on-the-surface temperature and air pressure, both of which can’t be measured as easily by satellites. By filling a data gap, I expect that 2019P123 helped improve weather forecasts for Europe immediately after the data began being imported by weather forecasters. Just as advances in science nearly always represent team efforts rather than individual achievements, 2019P123 was most importantly part of a “team” of buoys.
What can threaten the life of a buoy after being released in the open ocean? And what can be done to make the life of a buoy easier?DW: Buoys fail because they get attacked by wildlife, buried or crushed, have electronics problems, or simply because the battery runs out. While we can know how long the battery should last, we can’t predict bear attacks or ice motion, at least not that far in advance. When we place a buoy, we try to put it in the middle of a large ice floe with the hope that the ice breaks and forms ridges at the edges instead of in the middle of the floe. And I think we did a pretty good job placing the buoys; looking at the
seven EUMETNET-provided buoys, the shortest-lived were 82 days and 115 days; all the rest lasted between 350 days and 557 days. In the ice, that’s a really long time to avoid being crushed!
Was there already a forecast available for the drift of 2019P123? If so, what was it? And how closely did the reality track the forecast? TR: Climatological forecasts for buoys in that area as well as previous buoys suggested that it would roughtly follow the Transpolar Drift of sea ice from Siberia to Greenland and then pass through Fram Strait following the Greenland current. The buoy did exactly that but stopped sending around Fram Strait after about one year.
VS: However, the tracks of other buoys deployed in those same weeks eastward or southward of 2019P123 showed quite different drift patterns, for example the already-mentioned Argos ID 53095 and 174639.
2019P123 measured surface air temperature and pressure. What has been done with this data in correlation to the position of the buoy?TR: The YOPP buoy as well as other YOPP buoys deployed in other areas of the Arctic quickly (in a couple of hours) joined the WMO Global Telecommunications System and thereby, potentially, directly improved weather and seasonal
forecasts at centres like ECMWF, who feed these data into their systems. It will have supported various YOPP “data denial” numerical experiments, too. Arctic observations can also be key for mid-latitude prediction, especially in winter, when data is sparse.
DW: Surface temperature in the Arctic is notoriously difficult to measure from satellites, and as a result, surface temperature forecasts from weather models are often off. So having buoys like 2019P123 in place really helps make the surface temperature forecasts more accurate. Pressure data helps in tracking storm systems. Both the temperature and the pressure data are made more useful by multiple active buoys. For the purposes of the MOSAiC expedition, having the surface temperature and pressure data helps us as we look into the effects of very local weather activity. From the timing of temperature and pressure changes, we can see exactly when a storm system comes through the area and whether there are differences in the “mesoscale”, meaning distances from 10 to 1000 km, a size range that’s more complicated than the continent-wide weather patterns we see on public-facing weather reports.
See more on buoy 2019P123 at Seaiceportal.de and download the deployment sheet here. Also, a regularly updated figure of all AARI/EUMETNET/IABP buoys is available at http://wdc.aari.ru/datasets/d0018/buoys/status.png

17
PolarPredictNews #19PolarPredictNews #19
16
What’s been Published? – First Results One Year after the MOSAiC Expedition
About a year after the return of the German research icebreaker RV Polarstern, MOSAiC, this biggest-ever international Arctic expedition has already resulted in a number of publications. Here, we briefly summarize their results.
On 12 October 2020, 389 days after the ship left for the Arctic in fall 2019, RV Polarstern returned to Bremerhaven from the MOSAiC (Multidisciplinary drifting Observatory for the Study of Arctic Climate) expedition. During its mission, Polarstern was anchored to an ice floe and drifted with the ice through the Arctic Ocean. MOSAiC aimed to gather data from sea ice, the atmosphere and the ocean and observe their interactions. The collected data was to help scientists to fill knowledge gaps about processes, particularly during Arctic winter, that had been little observed due to the very harsh conditions that make the central Arctic inaccessible during winter.
Weather Conditions during MOSAiC An article recently published in Elementa on
“Meteorological conditions during the MOSAiC expedition: Normal or anomalous?” by Rinke et al. depicts the meteorological conditions during the MOSAiC expedition. It compares the near-surface meteorological conditions with interannual variability and extremes from the past four decades based on hourly ERA5 reanalysis data. The conditions the research icebreaker RV Polarstern experienced were relatively normal; however, from late fall 2019 through early spring 2020, anomalous and record-breaking conditions were recorded. There were especially warm, moist air intrusions and strong
04
by Patrick Hansen and Thomas Hasiweder, WMO WWRP International Coordination Office for Polar Predic-tion, Alfred Wegener Institute
winter and spring storms. July and August 2020 saw all-time warmest and wettest summer weather. Moreover, the near-melting point conditions lasted more than a month longer than usual. These results fit into the general trend of increasing temperatures and moisture in the central Arctic. But the contrary took place from November 2019 to March 2020: unusually cold conditions associated with a positive phase of the Arctic Oscillation pattern. (th)
Loss of Ozone in the Arctic
In June this year, von der Gathen et al. published “Climate change favours large seasonal loss of Arctic ozone” in Nature Communicat ions . The authors monitored Arctic ozone loss by looking at the formation of polar
stratospheric clouds (PSCs) in cold winters as well as at the output of General Circulation Models (GCMs). They conclude that the potential formation of PSCs has seen a positive trend from 1950 to 2100. Their simulations yield the highest end-of-century values when the radiative forcing of climate is increased by greenhouse gases. The authors suspect that conditions that favour large, seasonal losses of Arctic ozone could continue or potentially worsen through the end of the century if greenhouse gas emissions continue to rise. (ph)
Another study dealing with ozone loss, entitled “Near-Complete Local Reduction of Arctic Stratospheric Ozone by Severe Chemical Loss in Spring 2020” by Wohltmann et al., appeared in September 2020 in the Geophysical Research Letters (GRL). According to the authors, measurements
from 17 March to 17 April 2020 showed that ozone loss in the Arctic, which is normally smaller
than in the Antarctic, had reached values of 93% compared to 95–99% in the Antarctic. Additionally, atmospheric ozone, which had never dropped below 0.5 ppm, reached values of 0.2 ppm with individual profiles falling to 0.13 ppm in Eureka, Canada on 24 March 2020. The reason for this reduced mixing ratio was an unusually strong, stable and cold polar vortex which lasted until early- to mid-May. (ph)
Sea Ice at Various Scales A study by Katlein et al. on “Platelet Ice Under
Arctic Pack Ice in Winter”, also in the August issue of GRL, is about decimetre-scale thin ice plates known as “platelet ice” that form on the underside of sea ice (see picture left). Platelet ice is mostly found in the Antarctic, where it forms in water that is below the local freezing point. However, during the MOSAiC expedition the authors observed platelet ice forming in freely drifting pack ice during Arctic winter. They conclude that platelet-ice formation is widespread during Arctic winter. (ph)
Krumpen et al. examined the ice floe to which Polarstern attached itself in fall 2019 and on which most MOSAiC experiments were carried out on the first three legs. In their study, “The MOSAiC ice floe: sediment-laden survivor from the Siberian shelf”, published in the February 2020 issue of The Cryosphere, the authors were able to determine that the MOSAIC ice floe, called “the fortress” due to its initial stability, had formed in December 2018 north of the New Siberian Islands. Measurements showed that the sea ice in the vicinity of the Central Observatory was 36% thinner and younger than the surrounding ice. By September 2019, the ice could already be classified as exceptionally thin as compared to data from the last 26 years. Such exceptional thinning raises the possibility of a seasonally ice-free Arctic Ocean with big impacts on the central Arctic ecosystem. (ph)
In June 2021, also Belter et al. published their study, “Interannual variability in Transpolar Drift summer sea ice thickness and potential impact of Atlantification” in The Cryosphere. The authors take a July–August summer time series from 2001to 2020 of extensive ice thickness surveys from the end of
the Transpolar Drift and compare it with preliminary results from the MOSAiC expedition. The results show that modal summer ice thickness of the MOSAiC floe and its surroundings was consistent with measurements from the late Transpolar Drift. The authors conclude that in the coming years, winter sea-ice growth could be shorter while effects of processes such as the Atlantification of the Arctic Ocean would extend beyond the summer season due to the shortened duration of the Transpolar Drift. (ph)
ReferencesBelter, H. J., Krumpen, T., von Albedyll, L., Alekseeva, T. A., Birnbaum, G., Frolov, S. V. et al. (2021). Interannual variability in Transpolar Drift summer sea ice thickness and potential impact of Atlantification. The Cryosphere, 15, 2575–2591. doi.org/10.5194/tc-15-2575-2021
von der Gathen, P., Kivi, R., Wohltmann, I., Salawitch, R.J., and Rex, M. (2021). Climate change favours large seasonal loss of Arctic ozone. Nature Communications 12, 3886. doi.org/10.1038/s41467-021-24089-6
Katlein, C., Mohrholz, V., Sheikin, I., Itkin, P., Divine, D. V., & Stroeve, J., et al. (2020). Platelet Ice Under Arctic Pack Ice in Winter. Geophysical Research Letters, 47, e2020GL088898. doi.org/10.1029/2020GL088898
Krumpen, T., Birrien, F., Kauker, F., Rackow, T., von Albedyll, L., Angelopoulos, M., et al. (2020). The MOSAiC ice floe: sediment-laden survivor from the Siberian shelf. The Cryosphere, 14, 2173–2187. doi.org/10.5194/tc-14-2173-2020
Rinke, A., Cassano, J., Cassano, E.N., Jaiser, R., Handorf, D. (2021). Meteorological conditions during the MOSAiC expedition: Normal or anomalous? Elementa: Science of the Anthropocene, 9(1), 00023. doi.org/10.1525/elementa.2021.00023
Wohltmann, I., von der Gathen, P., Lehmann, R., Maturilli, M., Deckelmann, H., Manney, G. L., et al. (2020). Near-Complete Local Reduction of Arctic Stratospheric Ozone by Severe Chemical Loss in Spring 2020. Geophysical Research Letters, 47, e2020GL089547. doi.org/10.1029/2020GL089547
Brinicles covered in platelets (photo: Katlein et al, 2020; doi.org/10.1594/PANGAEA.919398).

19
PolarPredictNews #19PolarPredictNews #19
18
05YOPP Final Summit – Launch of Website and Call for Abstracts
The Year of Polar Prediction (YOPP) Final Summit will take place in Montreal (QC), Canada, on 1–4 May 2022. The YOPP Final Summit website has been launched now.
The YOPP Final Summit is the apex of the decade-long Polar Prediction Project initiated by the World Meteorological Organization’s World Weather Research Programme in 2013. The conference aims to review progress, share key findings and success stories, and discuss and shape the legacy of the Polar Prediction Project. The summit will bring together polar science experts from operational prediction centres, academia and research institutes, government, and corporate representatives as well as northern communities and users of polar prediction services.
Contributors are invited to submit their abstracts on their research and achievements produced in the frame of PPP and YOPP, on the below topics: • Advancements in polar prediction during YOPP
(2017–2019) and their operationalization;
• Building international cooperation amongst the polar prediction community;
• Paving the way for the legacy of the Polar Prediction Project, to enable environmental safety in the Arctic and Antarctic in the future;
• Representation of polar processes in numerical models, with a focus on coupling of the atmosphere, ocean and sea ice;
• Ocean and sea-ice modelling and services;
• The MOSAiC expedition and other polar observation campaigns;
• Supersite multi-variate observations and process studies (YOPPsiteMIP);
• Observing System Experiments (OSE) and reanalyses in polar regions;
• Teleconnections linking polar weather to mid-latitudes predictability;
• Science to services: tailoring polar forecasting products and services to meet user needs; and
• Societal and economic implications of accessible, relevant, and useable forecasts.
Early Career ResearchersParticipation of Early Career Researchers (ECRs)
is encouraged. A third Polar Prediction School will precede the YOPP Final Summit from 27 April to 01 May 2022 in Rimouski, QC, Canada. Also, YOPP Final Summit fellowships will provide ECRs with the opportunity to showcase their research and networking with senior mentors at the YOPP Final Summit. For information how to apply to become a YOPP Final Summit Fellow (self-nominations are welcome) and to participate in the Polar Prediction School, please find more information on the YOPP Final Summit website.
YOPP FINAL SUMMIT 2022
01–04 May 2022The Centre Mont-RoyalMontreal, Quebec, Canada
More information at https://yoppfinalsummit.com/
Plenary SpeakersThe following science plenary speaker have
confirmed their contributions:
• Petteri Taalas (WMO), Secretary General of WMO;
• Thomas Jung (AWI), PPP Steering Group Chair, on the realization and successes of YOPP, and on the PPP legacy;
• Gilbert Brunet (BoM), on the design of the WMO WWRP Polar Prediction Project;
• Peter Bauer (ECMWF), on Earth System Modelling and predictability in polar regions and beyond;
• Gunilla Svensson (Stockholm Univ.) on using observations for evaluating process representation in models;
• Gregory Smith (ECCC), on the NWP modelling contributions to YOPP;
• Matthew Shupe, on the Multidisciplinary drifting Observatory for the Study of Arctic Climate (MOSAiC);
• Jackie Dawson on societal and economic research and applications of YOPP; and
• Karin Strand, Vice President of Expeditions, Hurtigruten Norwegian coastal ferry service and cruise line.
Timeline• September 2021 – abstract submission and
registration opens• 15 November 2021 – deadline for abstract
submission • 15 January 2022 – letter of acceptance• 15 February 2022 – early registration deadline• 15 April 2022 – registration deadline• 1-4 May 2022 – YOPP Final Summit
Abstract Submission and RegistrationSubmit your abstract by 15 November 2021
at https://yoppfinalsummit.com/. Early Bird registration will be open until 15 February 2022. All information including the Early Career Researchers’ opportunities and options to request funding to attend can be found at https://yoppfinalsummit.com/.

21
PolarPredictNews #19PolarPredictNews #19
20
A Day in the Life of a Polar Scientist – How a Crowdfunding Campaign became a Success Story
06
Thea Schneider is a photographer and physicist who joined the first segment of the MOSAiC expedition aboard the Russian research vessel (RV) Akademik Fedorov. A crowdfunding campaign she initiated, under the name “The Quiet”, ended recently. The goal of her campaign: To raise 2 000 Euros to help her self-publish a book of images from her participation in the MOSAiC School 2019. The book provides personal insights into her experience on board and into the daily lives of the polar scientists during the expedition. She not only met but surpassed her goal, drawing 183 pledges totalling more than 9 000 Euros.
The Multidisciplinary drifting Observatory for the Study of Arctic Climate (MOSAiC) expedition took place from fall 2019 to fall 2020. To gain a better understanding of Arctic processes and the effects of global climate change, the research icebreaker Polarstern was maneuvered into the central Arctic Ocean sea ice to drift, for the first time, throughout a polar winter and summer to record important observational data.
Thea Schneider was one of twenty early career scientists selected to participate in the MOSAiC School of 2019. They boarded RV Akademik Fedorov in September 2019, a vessel that not only supported Polarstern on her way into the ice but also set up a network of autonomous instruments in Polarstern’s vicinity. The school lasted six weeks and gave participants experience in various hands-on tasks such as setting up measuring tools.
Lectures were also held aboard the vessel where they learned about all the expedition’s different disciplines, e.g. about sea-ice forecasting.
Thea Schneider, whose participation in the MOSAiC School was supported by the Polar Prediction Project, took the opportunity to indulge in her first profession as a photographer as well. Her book of images will focus on daily life and work during the expedition. The book aims to show the diversity of characters with different abilities, tasks and life stories as well as “the quiet, more mundane in-between moments of an incredible expedition like MOSAiC that create space for people to identify and empathize with the expedition participants on a human level.”
The response to her Kickstarter crowdfunding campaign was overwhelming, with pledgers from her extensive network of polar scientists donating more than four times the required amount. This allowed Schneider to not only publish the book but also to put on an exhibition to accompany it. The book and selected postcards, stickers and prints are scheduled to ship in November 2021.
Books can still be ordered via [email protected]. For more information visit https://theaschneider.com/ and www.kickstarter.c o m / p r o j e c t s /theaschneider/thequiet
by Thomas Hasiweder, WMO WWRP International Coordination Office for Polar Prediction, Alfred Wegener Institute
New YOPP-Endorsed Project “Arctic PASSION” to Recast Arctic Observing Systems
07
A new YOPP-endorsed project called “Arctic PASSION” began on 1 July 2021. Endowed with 15 million Euros over four years by the European Union’s Horizon 2020 program, the project will contribute to the development of a sustained and accessible observing system for the Arctic that can be utilized by a diverse range of users.
Global warming has led to rapid changes in the Arctic. In fact, these changes are happening even faster here than anywhere else. Their impacts range from environmental to social and economic, and their effects will be felt not only locally but also much more widely due to the impact of the Arctic on our mid-latitude climate. As environmental changes and their consequences on weather and climate become even more pronounced, the demand from local community users as well as decision-makers for more reliable, versatile observational data streams and services is expected to increase.
Germany’s Alfred Wegener Institute for Polar and Marine Research is coordinating the EU project Arctic PASSION (Pan-Arctic observing System of Systems: Implementing Observations for societal Needs). Thirty-five European and international partners from a total of 17 countries are participating in the project. The Arctic PASSION coordination team consists of coordinator Michael Karcher, project manager Luisa Cristini, and administrative and financial manager Tordis Hellmann.
The project aims at integrating international environmental observing systems for the Arctic and improving these systems to meet the demands of different user groups as some components of Arctic observation systems are still fragmented and challenges remain in the area of data accessibility. Arctic PASSION also intends to expand and
Patrick Hansen, WMO WWRP International Cordination Office for Polar Prediction, Alfred Wegener Institute
better coordinate the Earth-observation capacity and capabilities in the Arctic by taking additional measurements and improving international integration. To better understand local histories of change in the Arctic, the plans also involve incoporating measurements taken by Indigenous communities and national monitoring programs that go back a decade or more. As a final goal, together with international partners, Arctic PASSION plans to develop an integrated pan-Arctic Observing System of Systems (pan-AOSS).
The project officially started on 1 July 2021 with an informal online welcome for over 70 participants who were introduced to the coordination team and got a glimpse of the upcoming activities. The European Commission’s project officer also introduced the
project within the wider portfolio of EU-funded polar research.
More information on Arctic PASSION can be found at their website https://arcticpassion.eu/. An overview of
this and other YOPP-endorsed projects is available at the data base of YOPP-Endorsed projects.
Photos left: Thea Schneider

23
PolarPredictNews #19PolarPredictNews #19
22
FEATURED IN THIS ISSUE: Art + Science
Stations & Stripes: Temperature Evolution in Antarctica
Orcadas
Juan Carlos I
Amundsen - Scott
Neumayer
Casey
Dumont D’Urville
Linear change of near-Surface temperatures during the period 1957-2020
The ideaSergi González: “I don’t have a great artistic sensibility in the more traditional sense, but I like playing with the data and making beautiful designs in my plots to catch the people’s eye. When the ICO called for Sci + Art ideas, I responded with some graphs with Antarctic data I had already made. We put together ideas with ICO staff (mainly Kirstin) and also Thomas Rackow to make a TikTok video (my first!) of the evolution of temperatures in Antarctica. After that, Kirstin asked me if I could do some temperature stripes for Sara’s idea of combining stripes with beautiful drawings of Antarctic stations. The idea seemed so cool to me that I couldn’t refuse to participate. I expect
that the demand for more reliable and more versatile observational data streams and services from users in local communities will increase.”
Sara Pasqualetto: “I was really inspired
by Sergi’s data visualization plots; together with the ICO, we were thinking of the best way to show the changes that had occurred over the years at those Antarctic stations. I happened to have a brand-new iPad with drawing functions that I was eager to try out, and I thought that if we could isolate the data from the individual stations and put them into a drawing of the architecture of those stations, we could tell the story of the sites and the changes that they’ve seen in the last few decades. I thought of using the stripes that were first used by Ed Hawkins because they make a great pattern for drawings and had already been successfully applied to other, more common subjects. I thought this might be a nice artistic take on climate data.”
The dataSergi González: “For most of the stations, I used the quality-controlled long-term records of monthly mean surface climatological observations of temperature at Antarctic stations obtained from the SCAR MET-READER (Turner et al., 2004) to calculate annual mean anomalies and plot the stripes.
However, not all Antarctic stations are included in this database. Other stations with shorter series, such as Juan Carlos I, have their own series, published in this case at the website https://antartida.aemet.es. For this dataset I applied similar filters to the ones in the MET-READER project (e.g. using months with more than 80% of data).
Antarctic maps have been made using the monthly mean near-surface temperatures from the ERA5 reanalysis (Hersbach et al. 2020). I took advantage of the recent release of the 1950–1978 period to create maps for the last 70 years. However, the performance of this reanalysis has not been evaluated yet. A preliminary analysis that I conducted for the Antarctic Peninsula for this period suggests that performance in ERA5 on near-surface temperatures is slightly worse for the pre-satellite era (1979–2020),
b u t still reliable for the entire instrumental era (1957–2020).
Plots were made using python language with the Pandas, Matplotlib and Seaborn libraries programmed in a Jupyter notebook. Here is the open code to plot the ERA5 Antarctic and Arctic maps and the Antarctic stripes of any of the MET-READER stations: https://github.com/sergigonzalezh/Polar-Temperature-Maps-and-Stripes.”
by Sergi González, Spanish State Meteorological Agency AEMET, and Sara Pasqualetto, WMO WWRP International Coordination Office for Polar Prediction, Alfred Wegener Institute

25
PolarPredictNews #19PolarPredictNews #19
24
08YOPP in Antarctica – Winter Targeted Observing Periods
As part of the Year of Polar Prediction’s international initiative, a Special Observing Period (SOP) in the Southern Hemisphere (SH) is being planned for next austral winter, from April to July 2022. This YOPP-SH winter SOP will include both regular observations as well as Targeted Observing Periods (TOPs) during which extra radiosondes will be launched. These will focus on the intense extra-tropical weather systems, which have strong impacts and involve processes that need improved understanding and better representation in models.
The Year of Polar Prediction in the Southern Hemisphere (YOPP-SH) is a national and international collaborative effort with the common goal of combining resources and i n c l u s i v e l y and objecti-vely raising the value of Antarctic ob-servations. One primary scienti-fic goal is to effectively put regular, enhanced ob-servations toward improving both weather forecasts and climate models across the Southern Ocean and Antarctica. The previous SOP in the Antarctic was staged during austral summer, from 16 November 2018 to 15 February 2019. Its main objective was to assess the impact of more frequent observations in Antarctica. In an overview publication authored by Bromwich et al. (2020), the initial results of this YOPP-SH summer SOP show that prediction skill on average did not substantially improve over the entire SOP period. However, significant advance-
ment in process understanding and predictive skills was seen for specific weather conditions including intense extra-tropical cyclones and atmospheric rivers. Building on these results, and in light of the more limited resources of an Antarctic winter, the YOPP-SH task team decided to conduct Targeted Observing Periods (TOPs) during the austral win-ter SOP.
Targeted Observing Periods (TOPs) during the YOPP-SH Winter SOP
The phenomena to be explored range from l a r g e - s c a l e dynamics that influence extra-t r o p i c a l c y c l o n e development to regional and local impacts i n c l u d i n g cloud and precipi tat ion properties that are important for surface mass balance and surface r a d i a t i o n budget; fog and l o w - l e v e l
clouds that pose difficulties for
aviation and navigation; gravity waves, which are important in extra-tropical cyclone development; foehn winds, particularly in connection with atmospheric rivers and sublimation of precipitation; strong wind events caused by various mechanisms. We have particularly targeted intense weather events, which have significant effects but can be difficult to forecast, especially in the polar regions. The TOPs have been set up to demonstrate the value and promote the use of existing forecasting systems providing large-scale and/or regional forecasts, as well as the national forecasting done
by Irina Gorodetskaya, University of Aveiro, Portugal, David Bromwich, Byrd Polar and Climate Research Center, USA, and the YOPP-SH Task Team*
Radiosonde launch during first Antarctic summer Special Observing Period at French Antarctic station Dumont d‘Urville (photo: Météo France).
for specific stations, and to evaluate their capabilities with respect to high-impact extreme events. While enhancing collaboration in the international scientific community, the YOPP-SH’s TOP efforts will also help to better understand and appreciate user and stakeholder needs outside of the scientific community.
YOPP-SH Winter TOPs Participants and Planned Observations
In total, 16 countries have confirmed their interest in participating by contributing enhanced measurements and/or forecasting capabilities: Argentina, Australia, Brazil, Chile, France, Germany, Italy, Japan, New Zealand, Portugal, South Africa, South Korea, Spain, United Kingdom, Ukraine, and the United States.
Extra radiosonde launches have been planned for numerous stations on sub-Antarctic islands, at the Antarctic coast and also at inland stations representing various regional climates. The figure
below shows the Antarctic stations participating in the YOPP-SH TOPs. (The list was last updated during the YOPP-SH workshop in June 2021, see the report.) Some of the stations have regular (e.g., once-per-day) radiosonde launches and will be doing additional launches during the winter TOPs. Novel observations will also include a cloud supercooled liquid water sensor, which during the TOPs will be added to the regular radiosonde launches at several stations including Escudero station on King George Island, Marambio on the northern Antarctic Peninsula, Jang Bogo in Terra Nova Bay and Concordia (Dome C).
At many stations, ground-based remote sensing instruments that measure clouds, precipitation and radiative fluxes are planned to be maintained and enhanced throughout the winter SOP period. In addition to atmospheric measurements, it is hoped that complementary oceanographic and sea-ice observations can be carried out through the use of ships, buoys, sea-ice mass balance stations, and
satellite remote sensing.
The enhanced observations will be used to evaluate the performance of weather prediction models and climate models, to study the value of extra radiosondes for improved weather forecasts, and to advance our understanding of the processes involved. It should be noted that any country’s planned contribution is subject to operational constraints.
Forecast Plans for TOPsWinter YOPP-SH SOP
planning encompasses a range of scientific interests, while relying on limited resources and personnel during winter. Planning it requires a specific strategy and forecast measurement protocols, so a regional approach has been adapted that combines the specific information available from the greater Antarctic Peninsula, greater Ross Sea and East Antarctica regions. Several
Map of Antarctica with locations of the stations (red circles), an autonomous scientific platform (orange circle) and vessels (green circles, approximate location) participating in the YOPP-SH winter targeted observing periods (TOPs) with enhanced observations
(figure: YOPP-SH Task Team).

27
PolarPredictNews #19PolarPredictNews #19
26
forecasting teams have volunteered to collaborate to identify TOPs. Attendees at the monthly meetings of the YOPP-SH task team have discussed and identified existing forecasting capabilities that target the various phenomena of interest. The discussions have synthesized information about measurements (long-term monitoring, extra radiosondes and other enhanced station- or ship-based measurements during TOPs), and ways for forecast, measurement and other regional teams to communicate. Dry runs were held for the Ross Sea region during August with analysis of weather patterns and “making decisions” about potentially launching TOPs. A dry run for the Antarctic Peninsula region took place in September, including an overview of the past winter conditions in order to identify overlapping scientific questions and a discussion of forecasting capabilities for the region. National forecasts produced for specific stations will be combined with regional and Antarctic-wide forecasts by both the Antarctic Mesoscale Prediction System (AMPS, based on the Polar-WRF model) as well as by the non-hydrostatic model AROME at 1.5 km for an area covering Dome C and Dumont d’Urville. Available global forecasts by the ECMWF’s IFS, the NCEP’s GFS and the ARPEGE models will be used to identify large-scale circulation patterns.
Research on Risks and Decision Making Besides planning and implementing TOPs,
the PPP’s societal and economic research and applications (PPP-SERA) task team will examine different types of human activities in the Antarctic and Southern Ocean and the extent to which expeditioners, vessel operators, researchers, and
National Antarctic Program personnel engage with environmental forecasting tools. A social science project on weather-related decision-making will seek to understand how people make decisions in the “real world” and in difficult conditions such as what one might expect during intense weather events. Understanding these is a goal of the TOPs. The project will run alongside with the TOPs and study how the “go/no go” decisions are made, what kinds of challenges are encountered and what consequences the decisions made have.
A report on the 2021 YOPP-SH workshop can be found here.
*We appreciate input from the following contributors to this article: Claudio Duran-Alarcon, Kirstin Werner, Eric Bazile, Daniela Liggett, Paola Imazio, Marcello Vichi, Inga Smith, Heitor Evangelista, Steve Colwell, Sangjong Park, Vito Vitale and all YOPP-SH Task Team members.
09New YOPP Video Available – A Decade of Polar PredictionThomas Hasiweder and Kirstin Werner, WMO WWRP International Cordination Office for Polar Prediction, Alfred Wegener Institute
A video on the final-phase activities of the Polar Prediction Project (PPP) is now available. In it, PPP Steering Group members explain why environmental forecast research in the Arctic and Antarctic is relevant and how the Year of Polar Prediction can help spur action. The video also highlights ways forward and the PPP’s potential legacy with many follow-up activities.
The Polar Prediction Project is a 10-year (2013–2022) endeavour of the World Weather Research Programme (WWRP) of the World Meteorological Organization (WMO). It aims to promote cooperative international research enabling development of improved weather and environmental prediction services for the polar regions on time scales from hours to seasonal.
The Year of Polar Prediction (May 2017 to June 2019) has been the flagship activity of PPP. Its purpose is to enable a significant improvement in environmental prediction capabilities for the polar regions and beyond by coordinating a period of
intensive observing, modelling, verification, user-engagement and education activities.
The video, produced by the YOPP International Coordination Office, provides an overview of various activities to enhance weather and sea-ice forecasts within the PPP. It demonstrates the importance of advancing environmental prediction capabilities to ensure environmental safety in the Arctic and Antarctic. Moreover, the video explains how research and education activities intensified during the ten years of the Polar Prediction Project, which will culminate in the YOPP Final Summit (https://yoppfinalsummit.com/) to be held from 1 to 4 May 2022 in Montreal, Canada and bring together the polar prediction community to discuss the results of numerous efforts to improve weather and sea-ice predictions in polar regions.
The video is available from the YOPP Youtube channel here.
Neumayer, Casey and Dumont D’Urville (see p. 31 and 35) located in East Antarctica also show no clear trends in temperatures, with much longer series than Juan Carlos I. The stable temperature that exhibit these stations has been linked to the positive Southern Annual Mode (SAM) trends, which produced cooling trends associated with this climate mode of variability over the East Antarctica that masked the possible anthropogenic warming signal on this region (Jones et al. 2019; González and Fortuny, 2018).

29
PolarPredictNews #19PolarPredictNews #19
28
and particularly the Italian card game connection that formed over time on an Arctic island in the sun.
What are Matt’s plans for the future? While looking at the “old stuff” may be in “some ways less sexy”, it’s a necessary step to pave the way for the next big thing in Arctic research, which, Matt is confident, is in great hands.
Find Matt’s IcePod episode on Spotify.
For updates and other materials, check also theicepodcast.home.blog.
Here’s the final episode of The IcePod, season 1. It’s a pretty special one: We got to meet Matt Shupe, one of the highest-ranking members of MOSAiC. Matt co-led the expedition and was onboard Polarstern for the first and the fourth legs of the one-year expedition – the dark one and the light one.
Matt is actually a cloud person; he has been working on his research sweet-spot, Arctic mixed-phase clouds, since basically forever. As a PhD student, he was involved in the Arctic drifting expedition SHEBA in 1997 and thus came into the new project with prior experience in camping on the ice.
Since that Arctic expedition, he had always wanted to go back to better understand what’s going on there in terms of atmosphere–sea-ice interactions. When he met the German physicist Klaus Dethloff, who by the time worked at the Alfred Wegener Institute, they realized they had a similar vision for an Arctic overwintering campaign. It took them quite a few years and no small effort championing these paired ideas, but eventually they convinced enough people and secured the German research vessel Polarstern for the undertaking.
Matt, summarizing the expedition in retrospect, says: “My expectations were not necessarily the plan of the Arctic, but the Arctic came up and said ‘Hej, this is what I am right now’”. With COVID-19 and logistical issues – not to mention the fast drift of the ice floe – the MOSAiC expedition was sometimes not as they had pictured it. But great expectations can only be topped by the reality, which was not expected and turned out to be amazing, due not only to the various observations of polar night and day but also to the team spirit, the human relationships
The IcePod’s Final Episode with Matthew Shupe – The Great Expectations10by Sara Pasqualetto and Kirstin Werner, WMO WWRP International Cordination Office for Polar Prediction, Alfred Wegener Institute
#TheIcePod is the podcast about polar science and the people. We’ll talk to scientists who went on board Polarstern, the German research icebreaker, for the biggest-ever research expedition to the Arctic. The IcePod is produced in collaboration with the Alfred Wegener Institute and Radio Weser.TV, where the full episode, with music, will air at www.medialabnord.de/radio-livestream/. For dates, check in with [email protected].
Editorial responsibility: Kirstin Werner and Sara Pasqualetto
Photo: MOSAiC
Photo: Lianna Nixon
Surprise, surprise! After The IcePod’s final episode with Matt Shupe, we have another one for you. In this German edition of The IcePod, we talk to Captain Thomas Wunderlich who took command of the German research icebreaker RV Polarstern in June 2020 after leg 3 of the MOSAiC expedition.
Thomas Wunderlich is one of three current captains at the helm of Polarstern. Together with his colleague, Captain Stefan Schwarze, he made sure that scientists were able to do their work during the one-year drift of the MOSAiC ice camp in the central Arctic. How does one become captain of a 39-year-old Lady Polarstern, and what is the captain’s role when the ship is not actively moving but just drifting through floes of sea ice? Not only do we learn what items Thomas Wunderlich always brings aboard when leaving for the north or south – suffice it here to mention “night socks” – but we also learn about pursuing a career in shipping, different officer grades at sea and on the general aspects of seafaring in Germany and around the world.
“There are the dead, there are the living and there are sailors”, Thomas Wunderlich quotes an unknown source. His life each year is divided into six months at sea and six months at home; both phases are lived intensively, and yes: Thomas Wunderlich likes to be on land, too, using his spare time to work in the garden or explore the beautiful Spreewald south of Berlin, where he makes his home.
Bonus Episode of the IcePod with Polarstern Captain Thomas Wunderlich11by Sara Pasqualetto and Kirstin Werner, WMO WWRP International Cordination Office for Polar Prediction, Alfred Wegener Institute
Wunderlich tells us about the moment many years ago when he first heard that something called the MOSAiC expedition was being discussed; he takes us back to the precious moment, in June of last year, when he met his colleague, Captain Stefan Schwarze, somewhere at the edge of the sea ice; and no, he won’t deny they hugged as he took command at the end of leg 3. After all, when it is uncertain whether an expedition like MOSAiC can continue even under the circumstances of a pandemic, his
endorsement as well as some brilliant logistics contributed to expedition leader Markus Rex’s determination to keep going.
There is one common goal aboard a research vessel, and that is to make the scientists happy by enabling them to do their research. For this to work, each side must treat the other with an abundance of respect. It went very smoothly for Thomas Wunderlich on legs 4 and 5 of MOSAiC. “While we, captain and crew, could take water samples, we cannot analyse them. But without us, the ship would still be sitting in Bremerhaven.” In October 2020, after one year in the ice, Thomas
Wunderlich steered RV Polarstern home to Bremerhaven. The moment was both joyous and very emotional as the vessel entered port on a sunny early-October morning accompanied by many welcome-honking escort boats and people waving from the quay.
Find Thomas Wunderlich’s episode on Spotify.
Find the new and all previous IcePod episodes e.g. on Spotify, Apple Podcast, Castbox (no sign-up needed) or on our website theicepodcast.home.blog

31
PolarPredictNews #19PolarPredictNews #19
30
and working in polar regions. Better forecasts of weather and sea-ice conditions will reduce risks and enable safety management in the polar regions and lead to improved forecasts in lower latitudes, where most people live. ECRs represent a transitional stage between PhD and senior academic roles, and by providing educational
activities and opportunities, we can help to develop future leaders in polar prediction. Polar prediction is inherently a multi-disciplinary
problem, and the Polar Prediction Project is in the unique situation of being able to draw on researchers working across the disciplines to introduce ECRs to the mélange of observing, modelling, verification and user-engagement that comprise the research being undertaken. We hope that by strengthening training opportunities and broadening networks for ECRs, we can provide a strong basis for the development of future polar prediction research.
What are the education division’s current plans, and what challenges and achievements do you foresee?
We are planning a polar prediction school for up to 30 students alongside the YOPP Final Summit in Montreal in April/May 2022. We are also putting together a fellowship program that will run during the YOPP Final Summit to promote four outstanding Early Career Researchers working in polar prediction. This “YOPP Final Summit School” will take place over five days preceding the summit. Attendees will then join the presentations and activities associated with the YOPP Final Summit. The school is aimed at early career researchers working in polar prediction and will introduce students to some of the interesting scientific problems related to numerical weather prediction in polar regions. The program will be held in Rimouski and in Montreal and will include a mix of lectures, modelling assignments and the
Introducing the YOPP Task Teams – YOPP Education Task Team12
The PPP Communication, Outreach and Education Task Team keeps the YOPP community engaged and informed about ongoing and upcoming activities as well as about research findings and data sets resulting from various YOPP and PPP activities. In an interview, YOPP Education activities leader Clare Eayrs told us about YOPP’s educational activities in general, her specific tasks and this task team’s plans. She also talked about the relevance of education within the project itself.
Clare Eayrs, currently working at the New York University Abu Dhabi, is a research scientist at the Center for Global Sea Level Change. Her main focus is sea ice. Sea ice plays a critical role in our changing climate due to the amount of solar radiation it reflects and the fact that it mediates heat exchange between the atmosphere and the ocean.
Clare, you are part of the YOPP Task Team on Communication, Outreach and Education. What is this team’s role and what are your specific responsibilities?
The task team raises awareness of the activities going on in YOPP and provides opportunities for early career researchers (ECRs) to engage with YOPP data and researchers. My role is to lead on education with the support from the rest of the task team and from members of the Polar Prediction Steering Group. I look for opportunities to create educational resources and design activities from the work going on within YOPP to help to engage and train the next generation of polar prediction researchers. I am very lucky to have the support of the PPP Steering Group, who contribute plenty of ideas and advice and who are always willing to give their time to help out.
Why does education play such a major role in the Polar Prediction Project?
Polar prediction affects the lives of people living
Interview: Nadine Hillenbrand, WMO WWRP International Cordination Office for Polar Prediction, Alfred Wegener Institute
Photo: Center for Global Sea Level Change, NYUAD
collection and analysis of field observations. Stay posted for our announcement for further details!
One of the major challenges with organizing the YOPP Final Summit School is the uncertainty still surrounding international travel. We have managed to hold several online workshops over the last couple of years (take a look at the YOPP YouTube channel) but we are really hoping that we can hold this as an in-person event as it will be the last educational activity we will host before the end of the project in 2022. We have an enthusiastic team working on an exciting program for the school, and we are really looking forward to joining the students in Canada next year.
PPP will be ending in 2022. How has PPP contributed to the education and support of the next generation of polar prediction scientists?
Although PPP is coming to an end next year, its information and training resources will extend well beyond the life of the project. Two polar prediction schools have already trained more than 60 ECRs, and these researchers are now working in polar research at universities and institutions across the world. PPP researchers have delivered workshops and seminars at conferences, both online and in person. Unfortunately, we have missed out on some
of the networking benefits when holding online events over the last year and a half. But the silver lining is that we have managed to reach a wider audience by recording our online events. Take a look at the YOPP YouTube Channel and the APECS Vimeo Channel to find a wealth of information in the recorded webinars. We have made an effort to continue to create opportunities despite the lack of in-person events – for example, an article in PolarPredictNews #18 by Marvin Kähnert came out of the YOPP session at the online Arctic Science Summit Week earlier this year.
The Polar Prediction Project has done a great job of engaging with ECRs via APECS by including APECS representatives in many of the educational events. In this way, ECRs have also been included in planning and organizing events and this provides a good model for other projects to follow. Indeed, my position on the PPP Steering Group has been a wonderful educational and networking opportunity for me!

33
PolarPredictNews #19PolarPredictNews #19
32
The International Coordination Office for Polar Prediction would like to thank Sara Pasqualetto, who supported the team for two
and a half years, especially in outreach and communication. She bid us farewell at the end of June, and we would like to express our gratitude for her great work.
Having studied political science and international relations in Italy and Germany and worked in the advocacy and outreach sections of international organizations like UNICEF and the Coalition for the ICC, Sara’s skills were ideally suited to aid our team. She followed her interest in climate change and prediction and
got involved in the communication and management activities for not only the Polar Prediction Project but also the YOPP-endorsed H2020 project APPLICATE and the Helmholtz A s s o c i a t i o n -funded ESM project. The I n t e r n a t i o n a l C o o r d i n a t i o n Office for Polar Prediction is grateful for Sara’s constant support and wishes her the very best in her career.
The International Coordination Office for Polar Prediction (ICO) welcomed three new members this summer: Nadine Hillenbrand, Thomas Hasiweder and Simon Schaepe.
Nadine Hillenbrand has been at the Alfred Wegener Institute since 2017. Together with her colleagues from the project “klimafit”, she is developing an adult education program on climate change with REKLIM. Her background is in geography and American studies, in which subjects she received bachelor’s and master’s degrees from the University of Heidelberg. Besides her work for klimafit, Nadine now supports the International Coordination Office for Polar Prediction, in particular when it comes to planning the YOPP Final Summit and the third Polar Prediction School.
T h o m a s H a s i w e d e r worked at the ICO in July and August this year. He is from Austria and obtained his bachelor’s degree at the University of Vienna. Currently, he is pursuing a
master’s degree in sustainable chemistry at KU Leuven in Belgium.
Simon Schaepe joined our team at end of August and will stay with us until mid-October. He studies geography at the University of Bamberg, Germany.
Hello and Good Bye – News from the YOPP International Coordination Office
13On a Personal Note 14
Dear Colleagues,
The past five and a half polar prediction years went by quickly. Eventually, things come to an end, and people move on – and so am I, to take on a new and very exciting role. At the same time, this means leaving a position as director of the International Coordination Office for Polar Prediction that was truly fulfilling down to my last work day.
Throughout my tenure, I have enjoyed working with all of you and learning things about which I previously had basically no clear idea. I have felt very welcome in the community, and it was encouraging to us at the ICO to see first-hand this network of enthusiastic scientists growing over the years and working toward one common goal.
With this change at the ICO, this 19th issue of the PolarPredictNews newsletter will also be the final one. I do hope you have enjoyed reading
PolarPredictNews, or at least had fun flipping through it.
Thomas Jung, Jeff Wilson, Katharina Kirchhoff and Nadine Hillenbrand will continue to be there to make sure that YOPP and PPP activities can thrive in view of the consolidation phase and the conclusion of the polar prediction decade at the end of 2022. However, please note that with this transition, activtiy at the ICO will be slightly reduced from now on.
I would like to thank you all for letting me be part of your world, and I look forward to seeing you on other occasions. There is a German saying: “Man trifft sich immer zwei Mal” – you always meet again.
Sincerely yours, Kirstin
by Kirstin Werner, WMO WWRP International Cordination Office for Polar Prediction, Alfred Wegener Institute
Photos this page: all private except last one by Kirstin Werner.
Photo p. 33 shows International Coordination Office for Polar Prediction at the end of 2019
with (from left to right) Helge Goessling, Katharina Kirchhoff, Ann-Christin Stucke, Jeff
Wilson, Sara Pasqualetto, Thomas Jung and Kirstin Werner, photo by Lorenzo Zampieri.

35
PolarPredictNews #19PolarPredictNews #19
34
15Postponed: International MOSAiC Science Conference/Workshop
The international MOSAiC Science Confe-rence had been scheduled to take place in Octo-ber 2022 in Potsdam, Germany one year after the research ice breaker Polarstern returned from drifting in the Arctic ice. Due to COVID-19 and the uncertainty that still surrounds international travel, the conference had to be postponed.
In September 2019, the German research vessel Polarstern left for the Arctic Ocean to start the MOSAiC expedition (“MOSAiC” stands for the Multidisciplinary drifting Observatory for the Study of Arctic Climate). For an entire year, the research vessel drifted in the central Arctic studying the region’s climate and environmental processes to better understand global climate change. The conference and workshop aimed to allow the MOSAiC community to discuss the scientific data from and results of this expedition two years after it began. It strove to unite all the different disciplines working on the Arctic climate system. Focusing on the scientific exchange of the coupled Arctic climate
system, the goal is to enhance sea-ice and weather forecasts as well as regional and global climate models. Although the meeting cannot take place as planned due to the ongoing pandemic, a new date will be set in order to provide new possibilities for scientific exchange within the MOSAiC community.
The idea behind the conference is to mirror the scientific work of the MOSAiC scientists. As currently planned, the conference will include 16 thematic highlights to be outlined in sessions that can be viewed online. The MOSAiC meeting will function as a conference and workshop, mixing sessions for oral and poster presentations with various breakout sessions for more detailed discussions.
For all updates on the new conference date and and current information, visit the conference website (https://mosaic-expedition.org/science-conference/) or contact the conference organization team organizing the conference ([email protected]).
by Nadine Hillenbrand, WMO WWRP International Cordination Office for Polar Prediction, Alfred Wegener Institute
MOSAiC team during leg 4 (photo: Lianna Nixon).
month. YOPP-SH held a special observing period (SOP) in the 2018/2019 season that coincided with the greatest summer operational activity ever recorded in the Antarctic. YOPP-SH is undertaking another SOP from mid-April to mid-July 2022 to sample the period of rapid Antarctic sea-ice growth. As part of this SOP, targeted observing periods (TOPs) featuring enhanced observations have been adopted in recognition of the limited resources and personnel during austral winter. Four to five TOPs, of a few days each, have been planned, targeting major forecasting challenges such as intense oceanic cyclones and atmospheric rivers. The YOPP-SH session to be held during the ICSHMO aims to discuss the current state of knowledge around meteorological research and forecasting in the Antarctic as well as challenges relating to using this knowledge to improve operational safety.
The conference is scheduled as an in-person meeting in Christchurch, New Zealand. However, remote participation is also possible. More information at: https://confer.eventsair.com/icshmo-2022/
YOPP Southern Hemisphere Session at ICSHMO in New Zealand
16
The 13th International Conference on Sout-hern Hemisphere Meteorology and Oceanogra-phy (ICSHMO) will be held from 8 to 12 Fe-bruary 2022. The conference aims to review “all things south the equator”, such as “oceans, ice, weather, climate, advances in science and tech-nology”. A YOPP in the Southern Hemisphere (YOPP-SH) session has been scheduled during ICSHMO to summarize the current state of knowledge around meteorological research in preparation for the upcoming YOPP-SH special observing period in austral winter–spring 2022.
ICSHMO was founded in the early 1980s and has been a regular platform for researchers to discuss scientific developments ever since. The conference takes place every few years. The last one was held in Sydney, Australia in 2018. The majority of participants are from New Zealand and Australia; however, anyone interested is welcome to attend.
The YOPP-SH community seeks to improve environmental prediction for the Southern Ocean and Antarctica on time scales from hours up to one
by Thomas Hasiweder and Kirstin Werner, WMO WWRP International Cordination Office for Polar Prediction, Alfred Wegener Institute
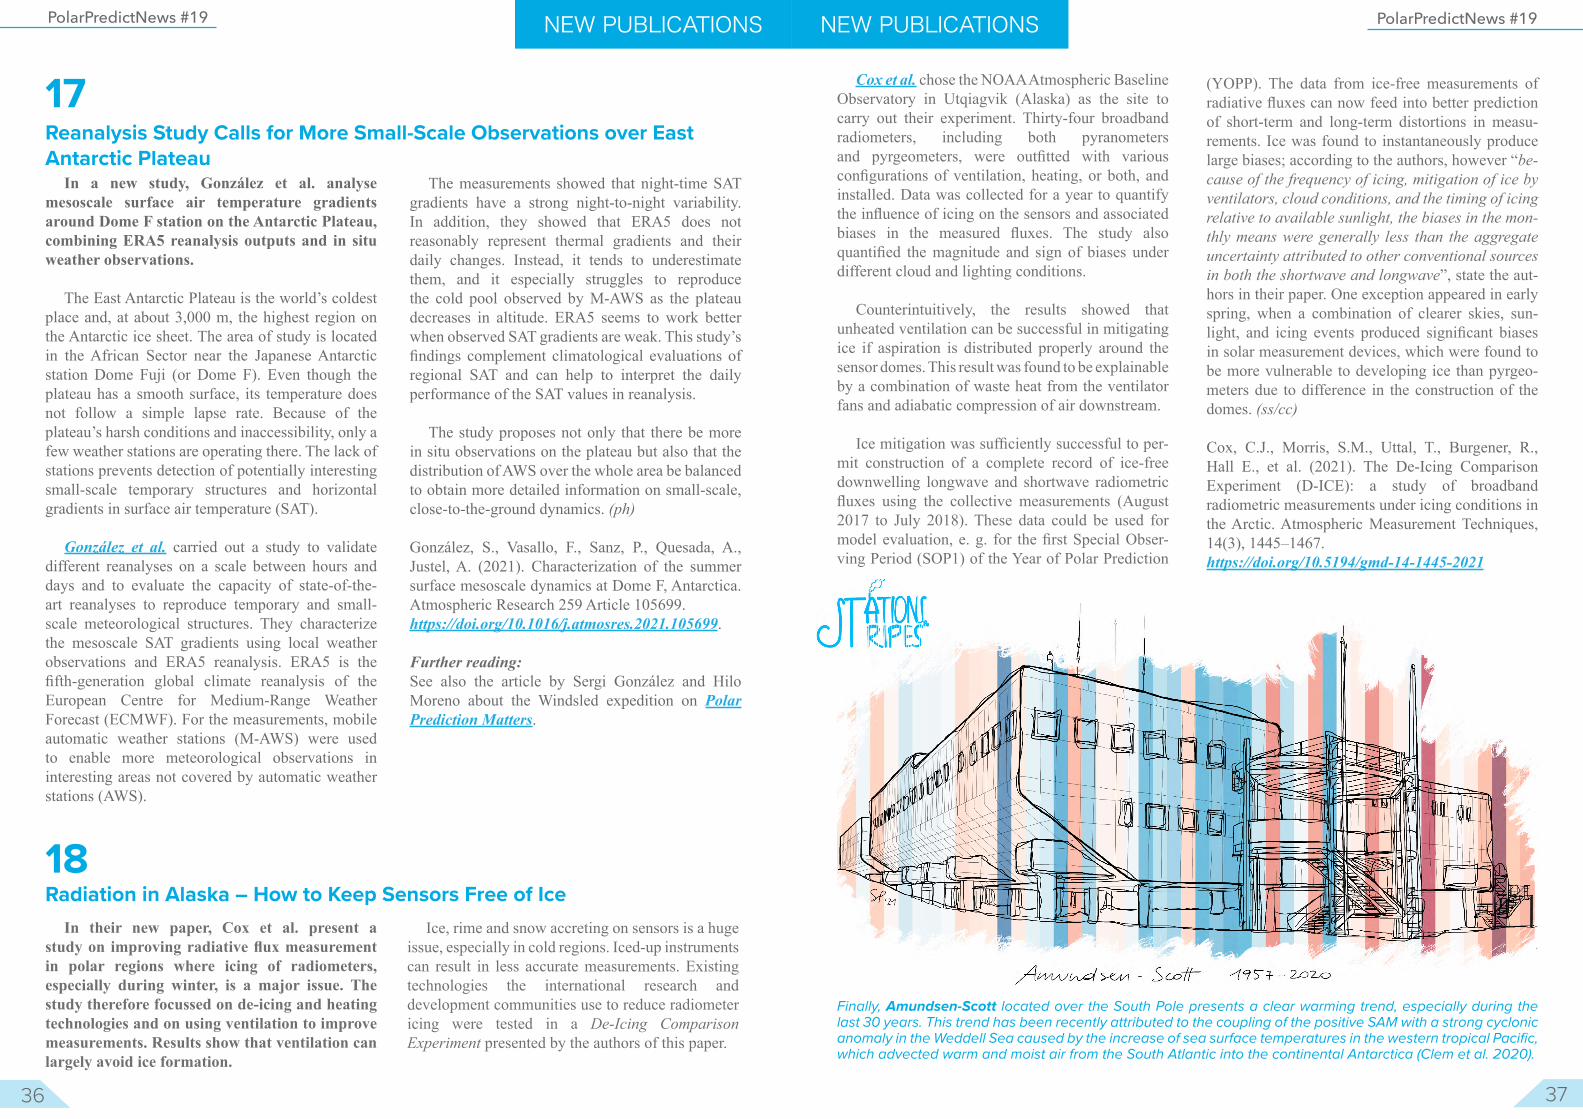
37
PolarPredictNews #19PolarPredictNews #19
36
Reanalysis Study Calls for More Small-Scale Observations over East Antarctic Plateau
17
In a new study, González et al. analyse mesoscale surface air temperature gradients around Dome F station on the Antarctic Plateau, combining ERA5 reanalysis outputs and in situ weather observations.
The East Antarctic Plateau is the world’s coldest place and, at about 3,000 m, the highest region on the Antarctic ice sheet. The area of study is located in the African Sector near the Japanese Antarctic station Dome Fuji (or Dome F). Even though the plateau has a smooth surface, its temperature does not follow a simple lapse rate. Because of the plateau’s harsh conditions and inaccessibility, only a few weather stations are operating there. The lack of stations prevents detection of potentially interesting small-scale temporary structures and horizontal gradients in surface air temperature (SAT).
González et al. carried out a study to validate different reanalyses on a scale between hours and days and to evaluate the capacity of state-of-the-art reanalyses to reproduce temporary and small-scale meteorological structures. They characterize the mesoscale SAT gradients using local weather observations and ERA5 reanalysis. ERA5 is the fifth-generation global climate reanalysis of the European Centre for Medium-Range Weather Forecast (ECMWF). For the measurements, mobile automatic weather stations (M-AWS) were used to enable more meteorological observations in interesting areas not covered by automatic weather stations (AWS).
The measurements showed that night-time SAT gradients have a strong night-to-night variability. In addition, they showed that ERA5 does not reasonably represent thermal gradients and their daily changes. Instead, it tends to underestimate them, and it especially struggles to reproduce the cold pool observed by M-AWS as the plateau decreases in altitude. ERA5 seems to work better when observed SAT gradients are weak. This study’s findings complement climatological evaluations of regional SAT and can help to interpret the daily performance of the SAT values in reanalysis.
The study proposes not only that there be more in situ observations on the plateau but also that the distribution of AWS over the whole area be balanced to obtain more detailed information on small-scale, close-to-the-ground dynamics. (ph)
González, S., Vasallo, F., Sanz, P., Quesada, A., Justel, A. (2021). Characterization of the summer surface mesoscale dynamics at Dome F, Antarctica. Atmospheric Research 259 Article 105699. https://doi.org/10.1016/j.atmosres.2021.105699.
Further reading:See also the article by Sergi González and Hilo Moreno about the Windsled expedition on Polar Prediction Matters.
NEW PUBLICATIONS
Radiation in Alaska – How to Keep Sensors Free of Ice18
In their new paper, Cox et al. present a study on improving radiative flux measurement in polar regions where icing of radiometers, especially during winter, is a major issue. The study therefore focussed on de-icing and heating technologies and on using ventilation to improve measurements. Results show that ventilation can largely avoid ice formation.
Ice, rime and snow accreting on sensors is a huge issue, especially in cold regions. Iced-up instruments can result in less accurate measurements. Existing technologies the international research and development communities use to reduce radiometer icing were tested in a De-Icing Comparison Experiment presented by the authors of this paper.
NEW PUBLICATIONS
Cox et al. chose the NOAA Atmospheric Baseline Observatory in Utqiagvik (Alaska) as the site to carry out their experiment. Thirty-four broadband radiometers, including both pyranometers and pyrgeometers, were outfitted with various configurations of ventilation, heating, or both, and installed. Data was collected for a year to quantify the influence of icing on the sensors and associated biases in the measured fluxes. The study also quantified the magnitude and sign of biases under different cloud and lighting conditions.
Counterintuitively, the results showed that unheated ventilation can be successful in mitigating ice if aspiration is distributed properly around the sensor domes. This result was found to be explainable by a combination of waste heat from the ventilator fans and adiabatic compression of air downstream.
Ice mitigation was sufficiently successful to per-mit construction of a complete record of ice-free downwelling longwave and shortwave radiometric fluxes using the collective measurements (August 2017 to July 2018). These data could be used for model evaluation, e. g. for the first Special Obser-ving Period (SOP1) of the Year of Polar Prediction
(YOPP). The data from ice-free measurements of radiative fluxes can now feed into better prediction of short-term and long-term distortions in measu-rements. Ice was found to instantaneously produce large biases; according to the authors, however “be-cause of the frequency of icing, mitigation of ice by ventilators, cloud conditions, and the timing of icing relative to available sunlight, the biases in the mon-thly means were generally less than the aggregate uncertainty attributed to other conventional sources in both the shortwave and longwave”, state the aut-hors in their paper. One exception appeared in early spring, when a combination of clearer skies, sun-light, and icing events produced significant biases in solar measurement devices, which were found to be more vulnerable to developing ice than pyrgeo-meters due to difference in the construction of the domes. (ss/cc)
Cox, C.J., Morris, S.M., Uttal, T., Burgener, R., Hall E., et al. (2021). The De-Icing Comparison Experiment (D-ICE): a study of broadband radiometric measurements under icing conditions in the Arctic. Atmospheric Measurement Techniques, 14(3), 1445–1467. https://doi.org/10.5194/gmd-14-1445-2021
Finally, Amundsen-Scott located over the South Pole presents a clear warming trend, especially during the last 30 years. This trend has been recently attributed to the coupling of the positive SAM with a strong cyclonic anomaly in the Weddell Sea caused by the increase of sea surface temperatures in the western tropical Pacific, which advected warm and moist air from the South Atlantic into the continental Antarctica (Clem et al. 2020).

39
PolarPredictNews #19PolarPredictNews #19
38
“Let the Experts Do What They Do Best” YOPP-endorsed! – The ALERTNESS Project
20
The YOPP-endorsed research project Alertness (“Advanced models and weather prediction in the Arctic”) is led by the Norwegian Meteorological Institute (MET Norway). We have spoken with project PI Jørn Kristiansen about the objectives and main achievements in Alertness, national and international collaboration, and about building a reliable relationship with forecast end users. Jørn is Director of the Development Centre for Weather Forecasting at MET Norway and member of the PPP Steering Group.
Jørn, Alertness has entered its final year. What was the project about? What were its main goals, and were you able to achieve them in the past four years?
Jørn Kristiansen (JK): The goal of Alertness is to develop world leading capacity for the delivery of reliable, accurate Arctic weather forecasts and warnings for the benefit of maritime operations, businesses and society.
Alertness is funded by the Norwegian Research Councils program for polar research
Interview: Kirstin Werner, WWRP International Coordination Office for Polar Prediction, Alfred Wegener Institute
POLARPROG. A specific aim of this call was also to contribute to YOPP. Our work is guided by the scientific hypotheses that improved observations and improved utilization of observations enable advances in Arctic forecasting.
I believe that we have achieved a lot already and that there is still some time left for further achievements. Our three PhD students, Matilda, Marvin and Mate, are set to continue, for good reasons, until sometime in 2022. I also think we achieved some results we did not expect when we started the project. These have come through collaboration with other projects and initiatives, like the YOPP-endorsed projects EU-APPLICATE, IGP and Nansen Legacy but also the Copernicus Arctic Regional Re-Analysis (CARRA).
How did collaboration with Norwegian and international project partners work out? To what extent did the pandemic impact the project’s workflow? JK: The Alertness project’s partners are MET Norway, the University of Bergen (UiB), the Norwegian Research Centre (NORCE), the University of Tromsø
Jørn Kristiansen is involved in the development and operational running of the high-resolution forecast model Arome-Arctic. Being in charge of the web portal yr.no, Jørn has an end-to-end responsibility for the operational MET Norway weather forecasts (photo:
Kamilla Pedersen, MET Norway).
(UiT), the Royal Netherlands Meteorological Institute (KNMI), the Nansen Environmental and Remote Sensing Center (NERSC) and the University Centre in Svalbard (UNIS). In addition, we have benefited from our engagement with experts at the Finnish Meteorological Institute (FMI) and the Swedish Meteorological and Hydrological Institute (SMHI).
I am both happy and impressed with these collaborations. Good relations and mutual understanding have been success factors and have also benefitted cooperation beyond the realm of the project. We have met twice per year, one meeting was dedicated more to working together; for the other meeting, we invited external experts for presentations and discussions.
We established good working practices and structures quite early in the project, and that helped us through the pandemic. We gained experience conducting online meetings in different configurations and formats. I am especially happy with our Svalbard online seminar from May of last year, in which we presented the Alertness project and Arctic weather forecasting to a wider audience. It was broadcast live and followed by about 200 viewers. The pandemic and its consequences have affected mostly our PhD students. It is impressive how they have been able to keep up the momentum without too much delay, and I look forward to their dissertations in 2022. What are the main achievements of the project, both in regard to enhancing Arctic weather forecasting and otherwise?
JK: To me, the main achievement of Alertness has been the good collaboration within the project group, where academia and operational weather centres have forged a common understanding and have worked together very well and efficiently. I also think we have been quite successful at interacting with other projects and at utilizing the opportunities
presented by YOPP, including its networking side. In my view, this is a good environment in which to educate the next generation of researchers and developers.
What’s there now that wouldn’t have been without the Alertness project?
JK: The methodological basis of our work on Alertness has been the operational forecast system AROME Arctic, a configuration of HARMONIE-AROME developed jointly by the Aladin and HIRLAM consortia (now merged into ACCORD). I think we have raised interest in operational numerical weather prediction (NWP) beyond the weather centres, which, again, broadens and deepens the potential contributions to advancing our NWP capacities. To better forecast dangerous weather
situations in the Arctic, we need to tackle the Arctic’s unique challenges. Alertness has made a significant contribution to establishing AROME Arctic as an operational NWP model system for the Arctic. We have put science into practice for service providers and society. AROME Arctic is used by Yr.no (a MET Norway weather forecasting service) and is the basis for automated marine weather forecasts, student field campaigns at UNIS, etc.
Alertness contributes to a better understanding of Arctic forecast capabilities by a set of new diagnostics and metrics and by new use, visualization and conditioning of existing methods, e.g. Hallerstig et al. (2020). We have improved our understanding of observation, interpolation and representativeness errors (Køltzow et al., 2020), and demonstrated how temperature diagnostics can highlight the problematic NWP behaviour in connection with stable boundary layers (Valkonen et al., 2020). We also implemented individual tendency output as a new diagnostic in AROME Arctic, and demonstrated its utility during a marine cold air outbreak (Kähnert et al., 2021). We could identify controlling factors for the activity of certain physical parameterisation schemes and study the interplay between them.

41
PolarPredictNews #19PolarPredictNews #19
40
In Alertness, we have developed a methodology (supermodding) to improve the assimilation of satellite data by accounting for its effective resolution (Mile et al., 2021). Regional observing system experiments (OSEs), coordinated with global OSEs of the EU-APPLICATE project, show the relative impact of different observations on forecast accuracy, disentangling the benefits of observations on local forecast accuracy (Randriamampianina et al., 2021). Model representation and initialization of sea ice is also very important in the Arctic area (e.g. Batrak, 2021).
An important aspect of Alertness is to quantify uncertainty in weather forecasts across the Nordic Arctic. We have established an ensemble prediction system that is able to better quantify the uncertainty in near surface weather parameters, such as temperature and wind speed, than the global ensemble from ECMWF (Singleton and Grote, 2020). We are also seeing promising results from a new method to estimate the uncertainty in sea surface temperature by targeting perturbations towards areas where the uncertainty is largest.
How does Alertness contribute to the Year of Polar Prediction’s goals?
JK: Alertness was planned with the aim of contributing to YOPP and its goals. We have taken advantage of several unique opportunities that arose during YOPP. For instance, we made use of additional radiosondes during the Special Observing Periods. The fact that Alertness existed paved the way for MET Norway’s radiosonde contributions. Alertness has contributed to YOPP’s cooperative international research in several ways: unique observation system experiments; YOPPsiteMIP; and of course, enabling development of improved weather prediction services for the Arctic on time scales from hours to days. We have been actively engaged across YOPP’s observing, modelling, verification, user-engagement and education activities and participated in YOPP task teams.
As a project lead, which major challenges did you face? Any advice on how to cope with and overcome them?
JK: The first challenge is to establish a well-functioning consortium of partners. Then, it is about finding common goals and ambitions. I do not know if I have any particular advice on this, other than to
search for partners that will complement one other and strengthen the project proposal. I believe it is important to establish the project group and engage them in writing the proposal. To this end, it is beneficial if the project lead has a sense of direction and the group shared it. Once the application has been successful, I think it is important to assemble the group and start the work as quickly as possible. That said, it is also important that people get to know each other and have some time for socializing. Let the experts do what they do best, be flexible and pragmatic. Was there a moment when you realized this project has legs?
JK: There have been several such moments; it is difficult to select just one. They range from brief comments during project meetings, scientific results, solving problems together and getting a sense of the project members’ hard work and dedication, to higher-level invitations to present our results. It all adds up to people growing both individually and as a group.
Will there be a follow-on project to Alertness? How will the deliverables from Alertness feed into future activities in Norway and internationally? How can it be ensured that the Alertness project’s results will figure into the outcome of YOPP?JK: We should definitely find an opportunity for a follow-up project of Alertness but as of now we are not pursuing any particular calls. It is really a great group to work with, and we achieved a lot together. There are already a number of initiatives and projects which have benefitted from or even build on the work and results from Alertness and AROME Arctic. Some, like YOPPsiteMIP, will for sure stretch beyond the active phase of Alertness, We have strengthened the connections between MET Norway and UiB and UNIS, and that will for sure be a legacy of Alertness. We will continue to engage with and support YOPP and will make sure that AROME Arctic provides accurate, reliable weather forecasts.
Is MET Norway, the lead institution in Alertness, very user oriented? Can you talk a little about collaborating with users of Arctic forecasting products? How did you enable a dialogue about users’ needs,
and how was their feedback implemented within Alertness?
JK: We wanted to leverage established relationships with the users. Hence we embedded Alertness in an existing value-chain structure for NWP that is in place and operational at MET Norway. Since it was mainly driven by the user-informed science-for-service work required for MET Norway to fulfil its mandate, we were able to utilize existing channels for user feedback. This value-chain structure is supplemented by well-established national and international links and joint research activities with academia and research institutions.
With Alertness, we wanted to strengthen the end-user experience and tie it in with academic excellence and the knowledge derived from MET Norway’s continuous service delivery. I think we were quite successful at using the value-chain structure to identify strengths, weaknesses, deficiencies and needs in the Arctic weather prediction capabilities. Utilizing established relationships and structures meant that we were less dependent on direct user-engagement, which has been hampered by the pandemic. Still, we would have preferred, and it would have been a benefit, to engage more directly
with the users, for example by letting stakeholders explore advances in probabilistic forecasting.
An example of an Alertness product end-user is UNIS. They use weather forecasts from AROME Arctic on a daily basis in their field-based educational and research activities. The forecasts are useful in particular for students taking courses in meteorology. UNIS uses such forecasts both to plan the fieldwork itself and for interpreting and complementing the weather observations that they make during the fieldwork. In turn, UNIS uses the observations for improving their understanding of the studied atmospheric phenomena and also for validating the forecasts. Some of these observations come from instruments that have either been rented or purchased with Alertness funds. Furthermore, the fine-meshed observations provided by UNIS have enabled the Alertness project to investigate the impact of a higher grid resolution (500 m), which resulted in a publication (Valkonen et al., 2020) with both project partners and students as co-authors.
Where can the PPP community find out more about Alertness?
JK: You can learn more about Alertness and see its results from the last half-year of the project on our website www.alertness.no. Alertness papers (and more) can be found here.
I would also like to mention that we have had fantastic support from our outreach and communications team, who have made sure that we have been actively developing and utilizing the communications plan. Our popular science articles have reached many people, and I hope this has also been a rewarding as well as motivating factor for the scientists.
The Alertness project consortium at their annual meeting in March 2019 in
Tromsø, infront of the buil-ding from 1918 that hosted the weather forecasting in Northern-Norway (photo:
Sevim Gulbrandsen).

43
PolarPredictNews #19PolarPredictNews #19
42
23202114–17 October 2021Arctic Circle AssemblyReykjavik, Iceland
03–05 November 2021ACUNS Student Conference on Northern Studies: Adaptation, Resilience and Change in the NorthOnline
04–05 November 2021ICPMO 2021 –15th International Conference on Polar Meteorology and OceanographyOnline
08 November 2021Linking multidisciplinary observations from Svalbard with the MOSAiC campaignOnline
18–20 November 202138th International Polar Symposium “Environmental Changes in Polar Regions: New Problems –New Solutions”Torún, Poland
18–19 November 20212021 SCAR SC-HASS Biennial Conference – The Global AntarcticKobe, Japan & Online
06–10 December 2021ArcticNet Annual Scientific MeetingOnline
08–10 December 202115th Polar Low WorkshopMoscow, Russia & Online
13–17 December 2021AGU Fall MeetingNew Orleans, USA & Online
Upcoming (mostly Online) Meetings
2022 31 January – 03 February 2022Arctic Frontiers 2022Tromsø, Norway & Online
08–12 February 2022ICSHMO 2022 – International Conference on Southern Hemisphere Meteorology and Oceanography• YOPP SH session Christchurch, New Zealand & Online
27 February – 04 March 202Ocean Sceince Meeting Honolulu, USA & Online
26–31 March 2022ASSW 2022 – Arctic Science Summit WeekTromsø, Norway & Online
30 March – 01 April 2022Arctic Observing SummitTromsø, Norway & Online
03–08 April 2022EGU General Assembly 2022Vienna, Austria & Online
01–04 May 2022YOPP Final SummitMontreal, Canada & Online
01–05 May 202228th International Polar ConferencePotsdam, Germany
UpcomingInternational MOSAiC Science Conference/Workshop 2021Potsdam, Germany

PolarPredictNews #19
44
International Coordination Officefor Polar Prediction
Editorial Responsibility: Kirstin WernerScience+Art Design: Sara Pasqualetto and Sergi GonzalezLayout: Manon John and Kirstin WernerLanguage editing: John A. Foulks, Katharina Kirchhoff, Nadine Hillenbrand
cc: Christopher Cox, ph: Patrick Hansen, ss: Simon Schaepe, th: Thomas Hasiweder
E-mail: [email protected]: +49 471 4831 1588
Address:Alfred Wegener Institute Helmholz Centre for Polar and Marine ResearchBussestraße 24, 27570 Bremerhaven, Germany
Follow us on Twitter and Instagram@polarprediction
Signing up for the Polar Prediction Mailing List, a mailing list for anyone interested in polar Weather and climate predictability and prediction, please send an email to [email protected]
International Coordination Office (ICO) for Polar Prediction
Find more information atwww.polarprediction.net
ReferencesCarrasco, J. F., Bozkurt, D., & Cordero, R. R. (2021). A review of the observed air temperature in the Antarctic Peninsula. Did the warming trend come back after the early 21st hiatus? Polar Science, 100653.
Clem, K. R., Fogt, R. L., Turner, J., et al. (2020). Record warming at the South Pole during the past three decades. Nature Climate Change, 10(8), 762-770.
González, S., & Fortuny, D. (2018). How robust are the temperature trends on the Antarctic Peninsula? Antarctic Science, 30(5), 322-328.
Hersbach, H., Bell, B., Berrisford, P., et al. (2020). The ERA5 global reanalysis. Quarterly Journal of the Royal Meteorological Society, 146(730), 1999-2049.
Jones, M. E., Bromwich, D. H., Nicolas, J. P., et al. (2019). Sixty years of widespread warming in the Southern Middle and High Latitudes (1957–2016). Journal of Climate, 32(20), 6875-6898.
Oliva, M., Navarro, F., Hrbáček, F., et al. (2017). Recent regional climate cooling on the Antarctic Peninsula and associated impacts on the cryosphere. Science of the Total Environment, 580, 210-223.
Turner, John, et al. (2005) Antarctic climate change during the last 50 years. International journal of Climatology 25.3, 279-294.
Turner, J., Lu, H., White, I., et al. (2016). Absence of 21st century warming on Antarctic Peninsula consistent with natural variability. Nature, 535(7612), 411-415.
Vaughan, David G., et al. (2003) Recent rapid regional climate warming on the Antarctic Peninsula.“ Climatic change 60.3 (2003): 243-274.