Tsunami in Troia, Antik Kaynakların Işığında Troia'da Tsunami, Bilim ve Ütopya 2006
Upload
concepta-netCategory
view
0download
0
NUMERICAL SIMULATION OF LANTEX 2013 TSUNAMI SCENARIO WITH THE HYSEA MODEL. IMPACT ASSESSMENT ON PUERTO RICO COASTS
Jorge Macías1, José M. González-Vida2, Aurelio Mercado3, Sergio Ortega4, Manuel J. Castro1
1 Dpto. de Análisis Matemático, Facultad de Ciencias, Universidad de Málaga, Spain 2 Dpto. de Matemática Aplicada, Escuela Politécnica Superior, UMA, Spain
3 Physical Oceanography Lab, Dept. of Marine Sciences, UPRM, Puerto Rico 4 Laboratory of Numerical Methods, UMA, 29080-Málaga, Spain
e-mail: [email protected]
ABSTRACT
HySEA tsunami model is used to simulate the Caribbean LANTEX 2013 scenario. The numerical simulation of the propagation and inundation phases is performed with a single integrated model but using different mesh resolutions and nested meshes. Special emphasis is placed on assessing the most exposed coastal areas at Puerto Rico affected by this event. Some comparisons with MOST tsunami model available at UPR are made. Both models compare well for propagating tsunami waves in open sea, producing very similar results. In near-shore shallow waters, HySEA should be compared with the inundation version of MOST, also producing similar results. Nevertheless the most striking difference resides in computational time; HySEA is coded using the advantages of GPU architecture, and can produce a 4 hour simulation in a 60 arc-sec resolution grid for the whole Caribbean Sea in less than 4 min with a single GPU and as fast as 11 seconds with 32 GPUs. When details about the inundation must be simulated, a 1 arc-sec (approximately 30 m) inundation resolution mesh covering all of Puerto Rico, an island with dimensions of 160 km east-west and 56 km north-south, is used, and a three level nested meshes technique implemented. In this case approximately 11 hours of wall clock time are needed for a 2 hour simulation in a single GPU (versus more than a week for MOST inundation). When domain decomposition techniques are finally implemented by breaking up the computational domain into sub-domains and assigning a GPU to each subdomain (multiGPU HySEA version), the wall clock time should decrease significantly, allowing high-resolution inundation modeling in just a few hours and at a modest hardware cost compared with present tsunami models. Keywords: HySEA model, MOST model, tsunamis, numerical simulation, LANTEX 2013, Caribbean Sea, Puerto Rico.
INTRODUCTION The necessity of having a validated model that can run both fast and without requiring extremely expensive supercomputer resources is crucial in the tsunami simulation field, but such a model has not been developed yet. Nevertheless, the use of Graphics Processing Units (GPUs) allows increasing the computational potential at dramatically low cost. This new GPU technology together with well-adapted tsunami numerical models that exploit these capabilities will make it possible, for developing nations, to establish their own, in-house, tsunami flood mapping resources, a goal of many of the Intergovernmental Coordinating Groups (ICG's) that have been setup all over the planet after the 2004 Indian Ocean tsunami. The ever-increasing availability of high resolution topographic/bathymetric data makes it possible to perform high resolution flood mapping, allowing more accurate results. But this has to be tied in with the availability of affordable, and fast, hardware, and this requirement is, again, filled in by the use of GPUs and suitable numerical codes. At the same time, the numerical codes must be robust enough to deal with this kind of high resolution data with no need of smoothing topographic-bathymetric data, otherwise the effort of getting more precise results could be useless. The HySEA model, developed by the EDANYA Group (Diferential Equations, Numerical Analysis and Applications) at the University of Málaga, Spain, is a non-linear hydrostatic shallow-water model implemented in CUDA (NVIDIA® CUDA® is a parallel computing platform and programming model that enables dramatic increases in computing performance by harnessing the power of the graphics processing units (GPUs)), well adapted to be run in multi-GPU architectures. HySEA does not distinguish between propagation and inundation phases, and runs without any bathymetry smoothing, allowing for a more faithful simulation of what a real tsunami encounters. The reduction in computational time obtained by HySEA compared with other well-established tsunami models is major and the cost of the computational resources needed much less, thus encouraging us to propose HySEA as an efficient, fast and robust tsunami code. In this work, testing of HySEA has been carried out in the Caribbean region and some comparisons were made with the widely-used MOST tsunami model from NOAA, which runs in serial mode. This has been done in Puerto Rico, where MOST has been used since 2005. The latest inundation grids used by MOST in Puerto Rico have computational cells of 1 arc-second resolution (approximately 30 meters). Limitations in the matrix dimensions (3000x3000) of the MOST inundation software available at the University of Puerto Rico required breaking down the island of Puerto Rico (approximately 160 km east-west, by 56 km north-south) into three parts if it was desired to use that resolution in the inner (inundation) nested grid (Grid C in Fig. 1). Each part (West, Center, East) is run separately, each one in its own CPU, but all at the same time. This is something akin to the Domain Decomposition used in some parallel models, but with no feedbacks amongst the domains. But even on a high-performance 64-bits Linux box it takes around 10 days of wall-clock time to perform a 4-hour simulation (Mercado, 2014b) using the PGI Fortran with all optimization switches turned on.
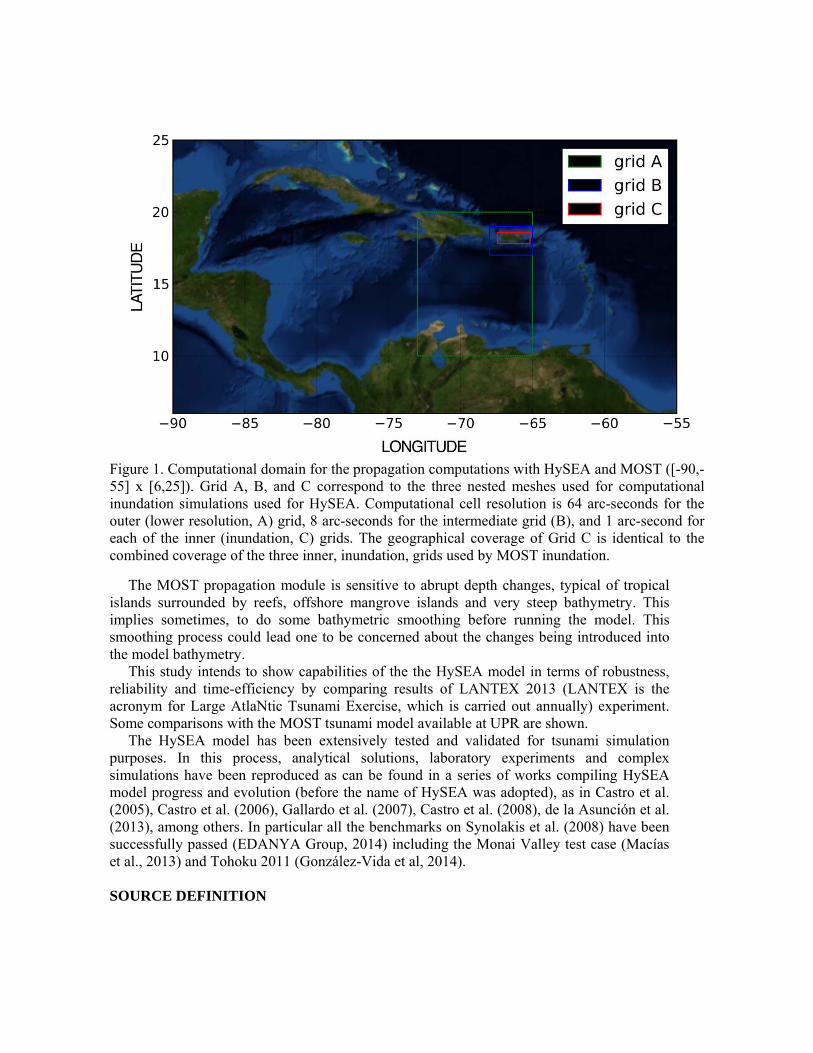
Figure 1. Computational domain for the propagation computations with HySEA and MOST ([-90,-55] x [6,25]). Grid A, B, and C correspond to the three nested meshes used for computational inundation simulations used for HySEA. Computational cell resolution is 64 arc-seconds for the outer (lower resolution, A) grid, 8 arc-seconds for the intermediate grid (B), and 1 arc-second for each of the inner (inundation, C) grids. The geographical coverage of Grid C is identical to the combined coverage of the three inner, inundation, grids used by MOST inundation.
The MOST propagation module is sensitive to abrupt depth changes, typical of tropical islands surrounded by reefs, offshore mangrove islands and very steep bathymetry. This implies sometimes, to do some bathymetric smoothing before running the model. This smoothing process could lead one to be concerned about the changes being introduced into the model bathymetry. This study intends to show capabilities of the the HySEA model in terms of robustness, reliability and time-efficiency by comparing results of LANTEX 2013 (LANTEX is the acronym for Large AtlaNtic Tsunami Exercise, which is carried out annually) experiment. Some comparisons with the MOST tsunami model available at UPR are shown. The HySEA model has been extensively tested and validated for tsunami simulation purposes. In this process, analytical solutions, laboratory experiments and complex simulations have been reproduced as can be found in a series of works compiling HySEA model progress and evolution (before the name of HySEA was adopted), as in Castro et al. (2005), Castro et al. (2006), Gallardo et al. (2007), Castro et al. (2008), de la Asunción et al. (2013), among others. In particular all the benchmarks on Synolakis et al. (2008) have been successfully passed (EDANYA Group, 2014) including the Monai Valley test case (Macías et al., 2013) and Tohoku 2011 (González-Vida et al, 2014). SOURCE DEFINITION
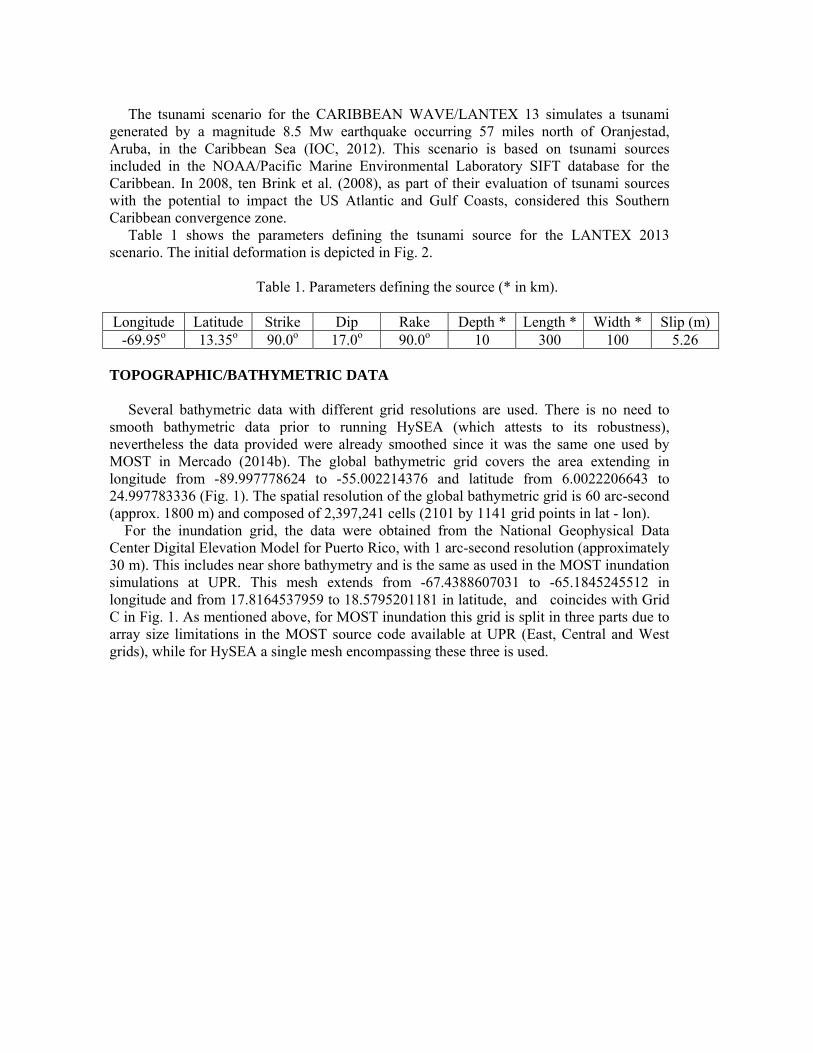
The tsunami scenario for the CARIBBEAN WAVE/LANTEX 13 simulates a tsunami generated by a magnitude 8.5 Mw earthquake occurring 57 miles north of Oranjestad, Aruba, in the Caribbean Sea (IOC, 2012). This scenario is based on tsunami sources included in the NOAA/Pacific Marine Environmental Laboratory SIFT database for the Caribbean. In 2008, ten Brink et al. (2008), as part of their evaluation of tsunami sources with the potential to impact the US Atlantic and Gulf Coasts, considered this Southern Caribbean convergence zone. Table 1 shows the parameters defining the tsunami source for the LANTEX 2013 scenario. The initial deformation is depicted in Fig. 2.
Table 1. Parameters defining the source (* in km). Longitude Latitude Strike Dip Rake Depth * Length * Width * Slip (m)
-69.95o 13.35o 90.0o 17.0o 90.0o 10 300 100 5.26 TOPOGRAPHIC/BATHYMETRIC DATA Several bathymetric data with different grid resolutions are used. There is no need to smooth bathymetric data prior to running HySEA (which attests to its robustness), nevertheless the data provided were already smoothed since it was the same one used by MOST in Mercado (2014b). The global bathymetric grid covers the area extending in longitude from -89.997778624 to -55.002214376 and latitude from 6.0022206643 to 24.997783336 (Fig. 1). The spatial resolution of the global bathymetric grid is 60 arc-second (approx. 1800 m) and composed of 2,397,241 cells (2101 by 1141 grid points in lat - lon). For the inundation grid, the data were obtained from the National Geophysical Data Center Digital Elevation Model for Puerto Rico, with 1 arc-second resolution (approximately 30 m). This includes near shore bathymetry and is the same as used in the MOST inundation simulations at UPR. This mesh extends from -67.4388607031 to -65.1845245512 in longitude and from 17.8164537959 to 18.5795201181 in latitude, and coincides with Grid C in Fig. 1. As mentioned above, for MOST inundation this grid is split in three parts due to array size limitations in the MOST source code available at UPR (East, Central and West grids), while for HySEA a single mesh encompassing these three is used.
Figure 2. LANTEX 2013 initial bottom deformation according to the Okada model used for both HySEA and MOST models.
COMPUTATIONAL MESHES Propagation Mesh For testing the propagation features of the HySEA code, three different computational meshes covering the whole domain (that coincides with the global bathymetric grid as shown in Fig. 1) were tested. This is done in order to assess mesh refinement influence on the tsunami wave simulated, convergence of the refined solutions and for assessing computational time requirements. The complete (propagation – but recall that HySEA does not distinguish between just propagation and just inundation, as MOST does) computational domain extends from -90.0 to -55.0 longitude and from 6.0 to 25.0 in latitude. The coarser mesh is a 60 arc-sec one composed by 2,101 x 1,141 = 2,397,241 cells. The global intermediate mesh has a 16 arc-sec resolution and 7,878 x 4,278 = 33,702,084 cells. Finally, an 8 arc-sec resolution propagation global mesh composed of 15,757 x 8,557 = 134,832,649 cells is considered. MOST propagation is run just in the coarser 60 arc-sec mesh. Inundation Mesh When a detailed description of the inundated coastal areas is required, an enhanced coastal resolution is needed. In that case tsunami-HySEA has been run in a three level nested mesh, with an enhanced resolution of 8 times when moving from one level to the next one. The spatial extension of each one of these three submesh levels can be found in Fig. 1. Therefore, for HySEA the submesh resolutions are 64, 8, and 1 arc-sec. Mesh A, with a 64 arc-sec resolution is much smaller than the global propagation mesh where bathymetric data were given, extending from -73.00 to -65.02 in longitude and from 10.00 to 19.99 in latitude, with 450 x 563 = 253,350 cells. Mesh B with an 8 arc-sec resolution is composed by 1,344 by 896 = 1,204,224 cells. And finally, Mesh C with a 1 arc-sec resolution extends from 67.4388607031 to -65.1845245512 in longitude and from 17.816454 to 18.57952 in latitude (i.e. same extension as the topo-bathymetric inundation grid described in the previous
section) and is composed of 8,112 x 2,736 = 22,194,432 cells. Therefore, in the case of propagation with inundation, the size of the whole computational mesh is 23,652,006 cells, most of them corresponding to the finer inundation grid. In this case we did not run the MOST inundation code due to the computational time required for a single simulation (the numerical results for this simulation can be found in Mercado (2014b)). NUMERICAL RESULTS AND COMMENTS According to Mercado (2014a and b) a constant Manning coefficient of 0.03 was used. Propagation buoys In order to compare the propagation phase of both codes, HySEA and MOST, eight propagation buoys have been located between the epicenter and the South offshore virtual gauge defined below, i.e. a total of 10 control points. The geographical coordinates of these points are gathered in Table 2 and depicted in Fig. 3. In the propagation phase both codes are compared using the same MOST base resolution of 60 arc-seconds used in Puerto Rico, but for HySEA two additional resolutions of 16 and 8 arc-sec were also considered. These time series are presented in Figs. 4 and 5. It can be observed that maximum amplitude and arrival times agree for both models. As the tsunami wave gets away from the source it can be noted that the maximum amplitude decreases from 1.3 m to 0.9 m for buoy 3 and below 0.5 m for buoy 4. It can be observed that when the tsunami wave approaches the coast (buoy 9) the amplitudes increases back (compare buoys 7, 8 and 9). Observing the behavior of these time series for HySEA as resolution increases, a certain convergent trend can be noticed.
Table 2. UTM coordinates for the location of the propagations buoys in Fig. 3. Epicenter 1 2 3 4 Longitude Latitude
-69.95 13.35
-69.5648 13.85
-69.1796 14.35
-68.7944 14.85
-68.4092 15.35
5 6 7 8 9 Longitude Latitude
-68.0241 15.85
-67.6389 16.35
-67.2537 16.85
-66.8685 17.35
-66.4833 17.85
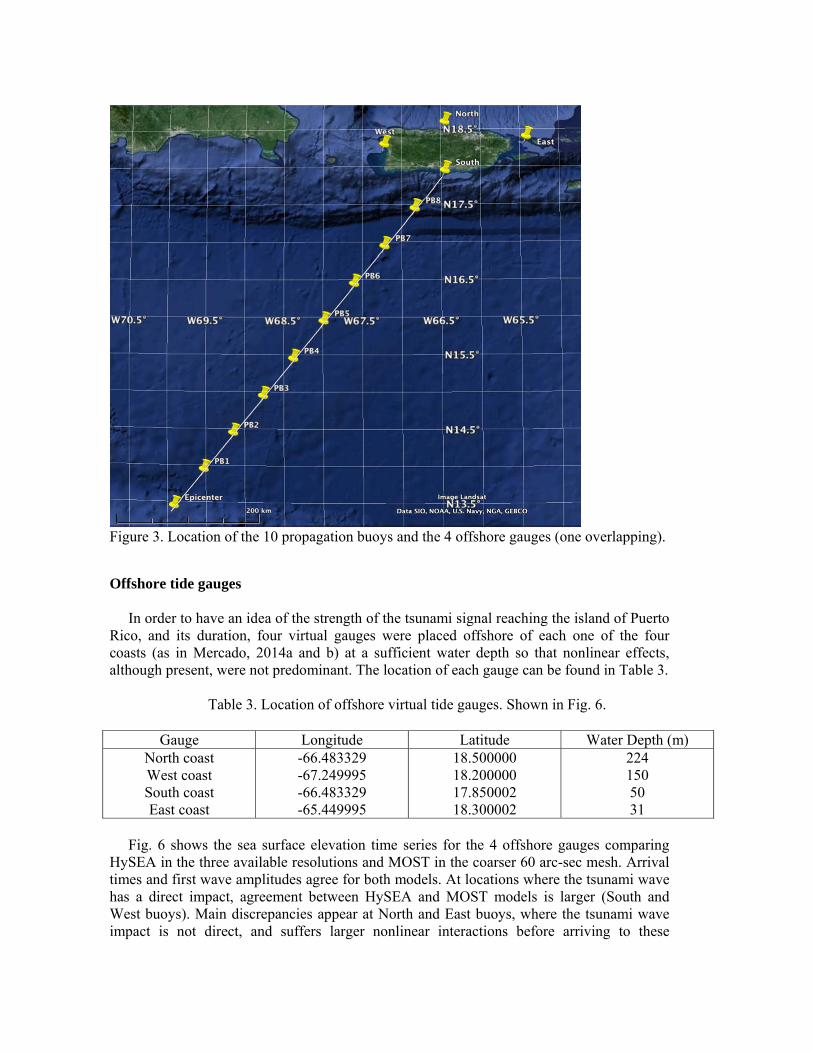
Figure 3. Location of the 10 propagation buoys and the 4 offshore gauges (one overlapping).
Offshore tide gauges In order to have an idea of the strength of the tsunami signal reaching the island of Puerto Rico, and its duration, four virtual gauges were placed offshore of each one of the four coasts (as in Mercado, 2014a and b) at a sufficient water depth so that nonlinear effects, although present, were not predominant. The location of each gauge can be found in Table 3.
Table 3. Location of offshore virtual tide gauges. Shown in Fig. 6.
Gauge Longitude Latitude Water Depth (m)North coastWest coastSouth coastEast coast
-66.483329-67.249995-66.483329-65.449995
18.50000018.20000017.85000218.300002
2241505031
Fig. 6 shows the sea surface elevation time series for the 4 offshore gauges comparing HySEA in the three available resolutions and MOST in the coarser 60 arc-sec mesh. Arrival times and first wave amplitudes agree for both models. At locations where the tsunami wave has a direct impact, agreement between HySEA and MOST models is larger (South and West buoys). Main discrepancies appear at North and East buoys, where the tsunami wave impact is not direct, and suffers larger nonlinear interactions before arriving to these

locations. It can be observed a kind of convergence of the numerical solutions for the two finer resolutions of 16 and 8 arc-sec.
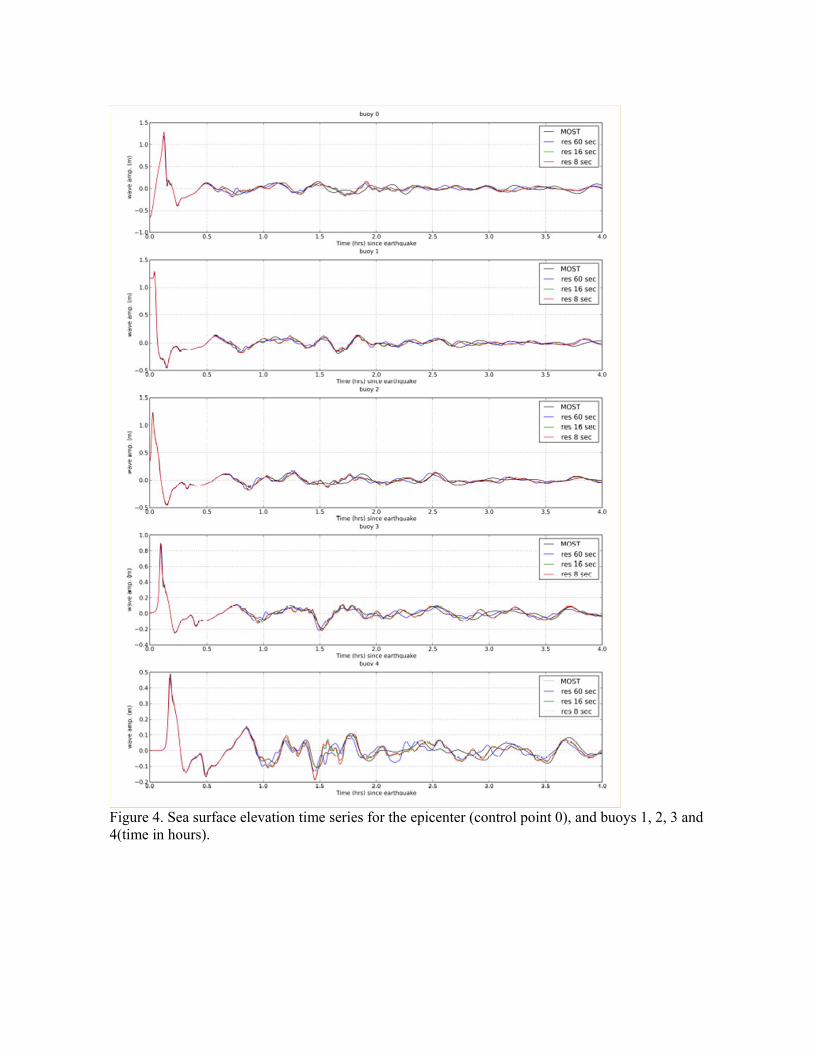
Figure 4. Sea surface elevation time series for the epicenter (control point 0), and buoys 1, 2, 3 and 4(time in hours).
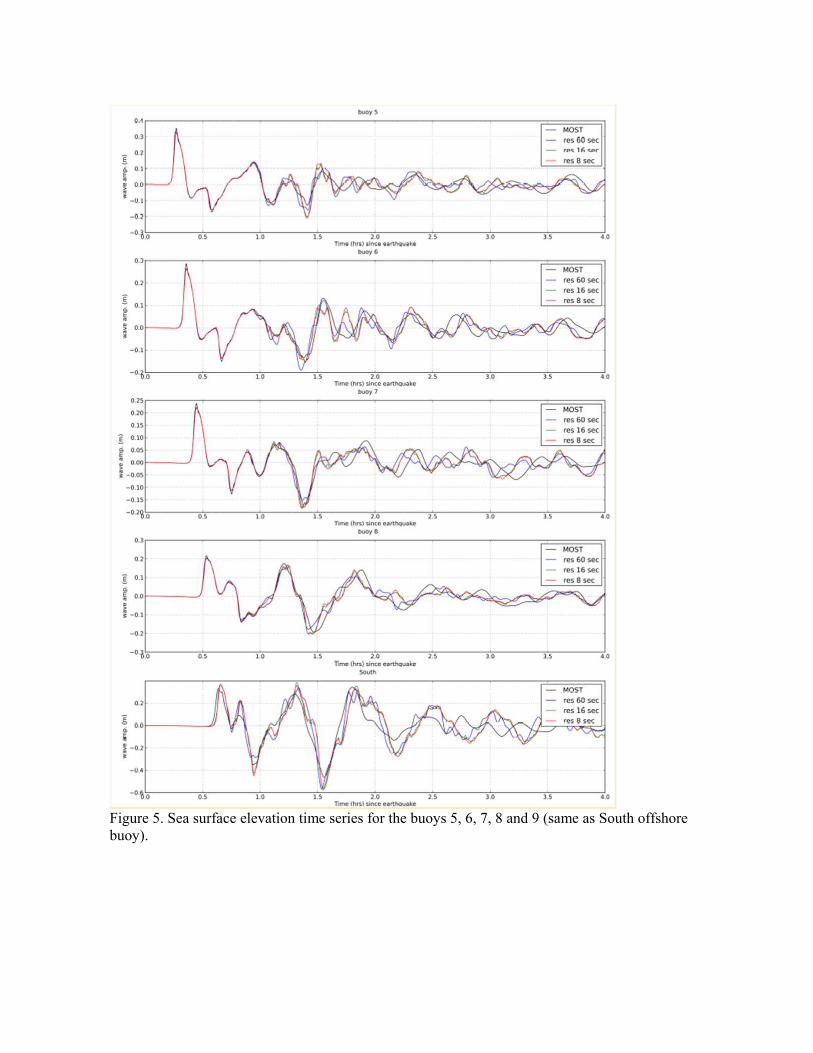
Figure 5. Sea surface elevation time series for the buoys 5, 6, 7, 8 and 9 (same as South offshore buoy).
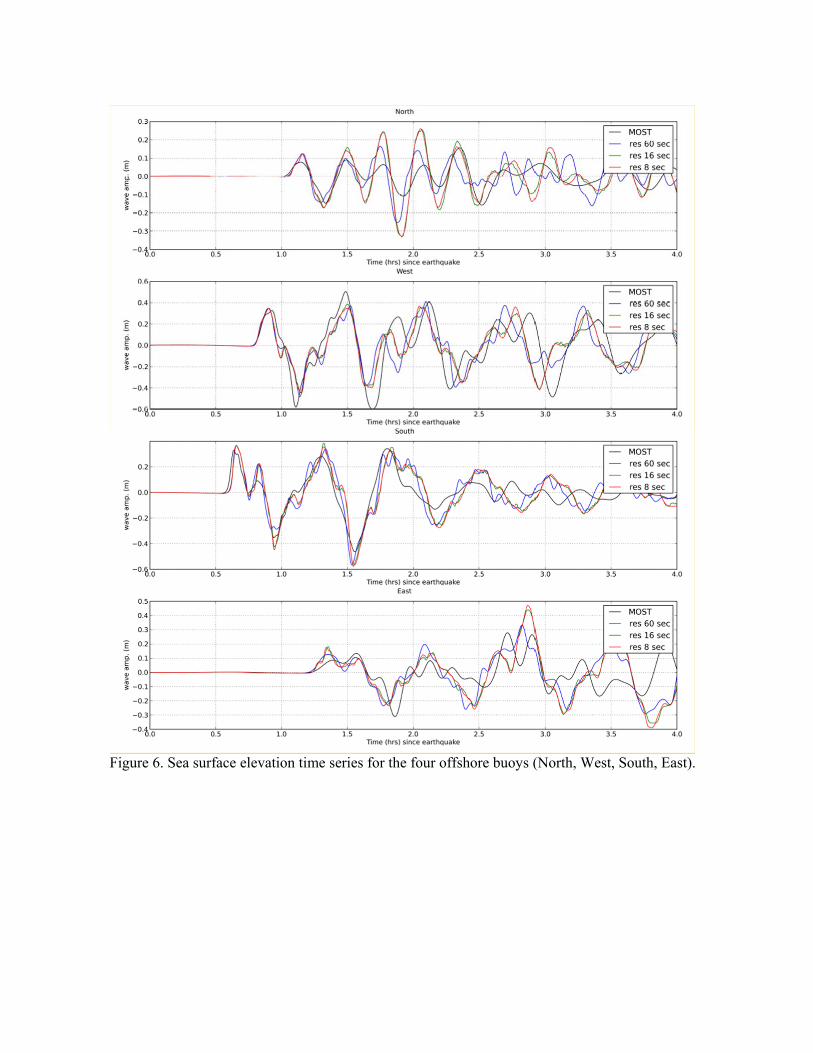
Figure 6. Sea surface elevation time series for the four offshore buoys (North, West, South, East).
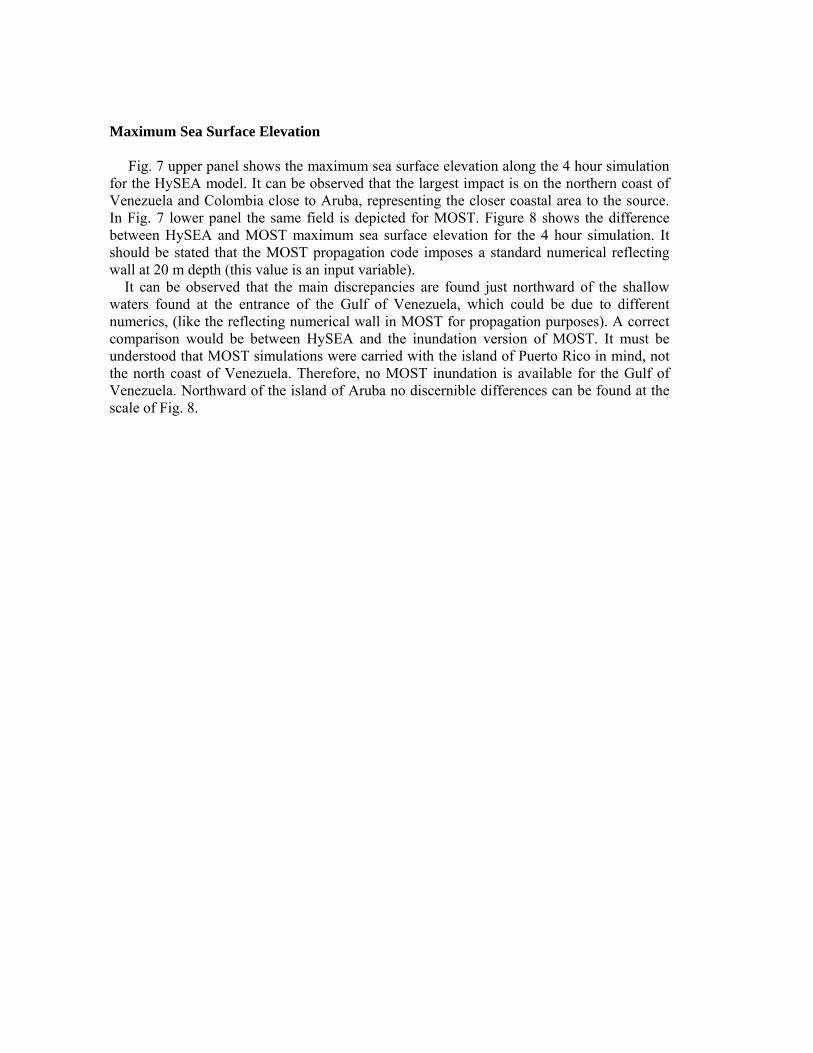
Maximum Sea Surface Elevation Fig. 7 upper panel shows the maximum sea surface elevation along the 4 hour simulation for the HySEA model. It can be observed that the largest impact is on the northern coast of Venezuela and Colombia close to Aruba, representing the closer coastal area to the source. In Fig. 7 lower panel the same field is depicted for MOST. Figure 8 shows the difference between HySEA and MOST maximum sea surface elevation for the 4 hour simulation. It should be stated that the MOST propagation code imposes a standard numerical reflecting wall at 20 m depth (this value is an input variable). It can be observed that the main discrepancies are found just northward of the shallow waters found at the entrance of the Gulf of Venezuela, which could be due to different numerics, (like the reflecting numerical wall in MOST for propagation purposes). A correct comparison would be between HySEA and the inundation version of MOST. It must be understood that MOST simulations were carried with the island of Puerto Rico in mind, not the north coast of Venezuela. Therefore, no MOST inundation is available for the Gulf of Venezuela. Northward of the island of Aruba no discernible differences can be found at the scale of Fig. 8.
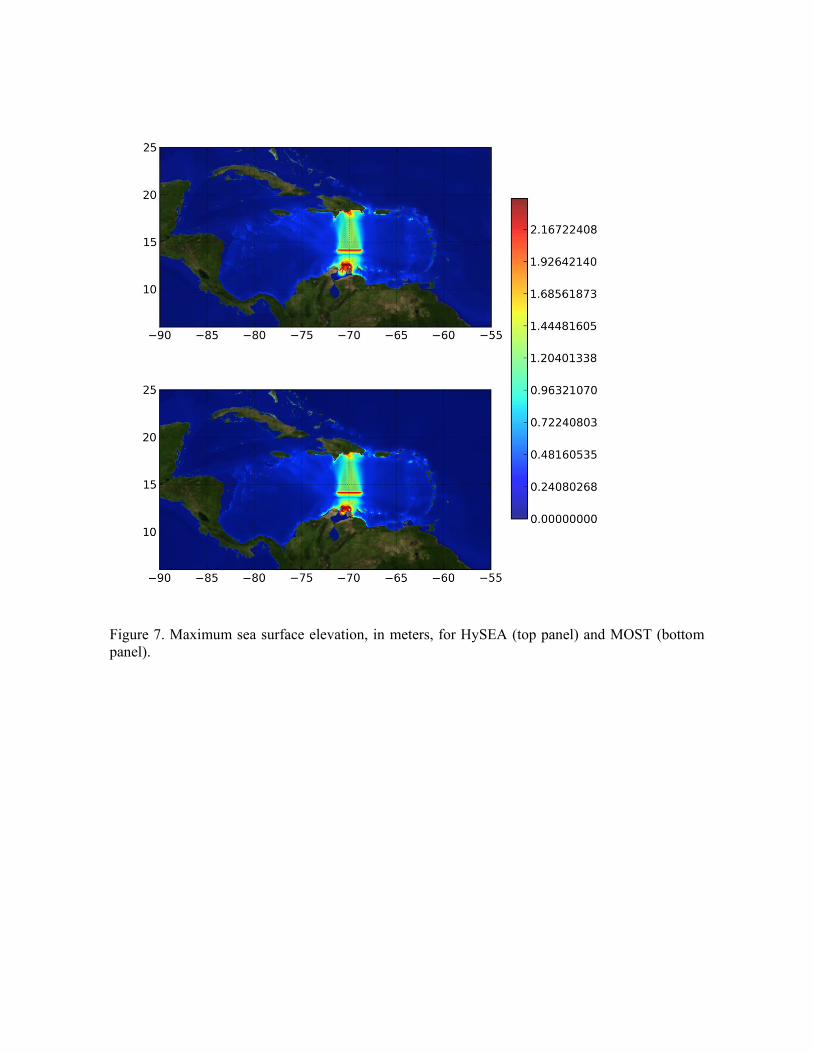
Figure 7. Maximum sea surface elevation, in meters, for HySEA (top panel) and MOST (bottom panel).
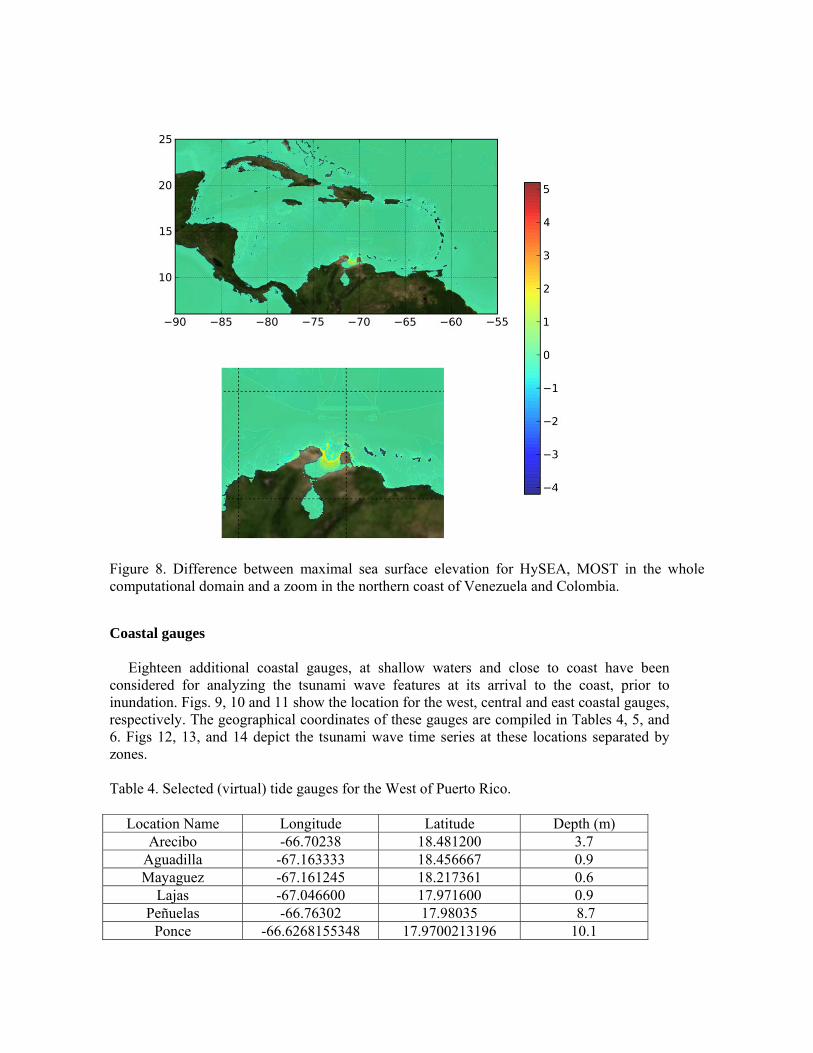
Figure 8. Difference between maximal sea surface elevation for HySEA, MOST in the whole computational domain and a zoom in the northern coast of Venezuela and Colombia.
Coastal gauges Eighteen additional coastal gauges, at shallow waters and close to coast have been considered for analyzing the tsunami wave features at its arrival to the coast, prior to inundation. Figs. 9, 10 and 11 show the location for the west, central and east coastal gauges, respectively. The geographical coordinates of these gauges are compiled in Tables 4, 5, and 6. Figs 12, 13, and 14 depict the tsunami wave time series at these locations separated by zones. Table 4. Selected (virtual) tide gauges for the West of Puerto Rico.
Location Name Longitude Latitude Depth (m) Arecibo -66.70238 18.481200 3.7
Aguadilla -67.163333 18.456667 0.9 Mayaguez -67.161245 18.217361 0.6
Lajas -67.046600 17.971600 0.9 Peñuelas -66.76302 17.98035 8.7
Ponce -66.6268155348 17.9700213196 10.1
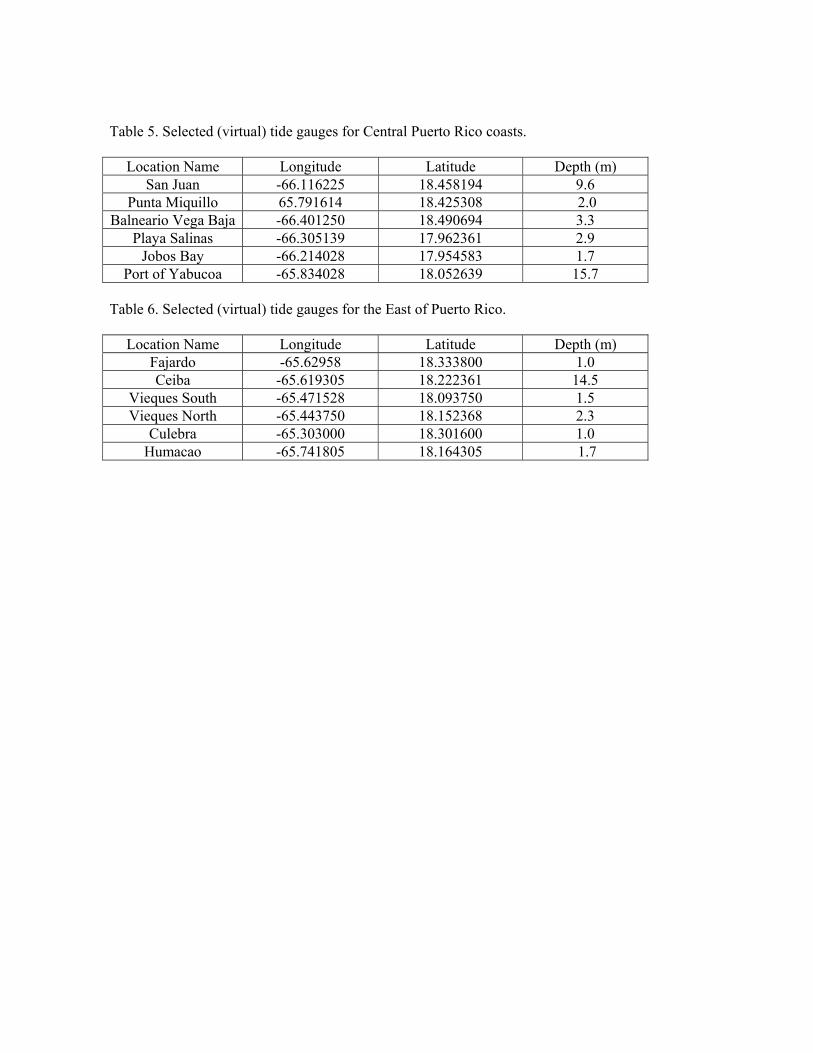
Table 5. Selected (virtual) tide gauges for Central Puerto Rico coasts.
Location Name Longitude Latitude Depth (m) San Juan -66.116225 18.458194 9.6
Punta Miquillo 65.791614 18.425308 2.0 Balneario Vega Baja -66.401250 18.490694 3.3
Playa Salinas -66.305139 17.962361 2.9 Jobos Bay -66.214028 17.954583 1.7
Port of Yabucoa -65.834028 18.052639 15.7 Table 6. Selected (virtual) tide gauges for the East of Puerto Rico.
Location Name Longitude Latitude Depth (m) Fajardo -65.62958 18.333800 1.0 Ceiba -65.619305 18.222361 14.5
Vieques South -65.471528 18.093750 1.5 Vieques North -65.443750 18.152368 2.3
Culebra -65.303000 18.301600 1.0 Humacao -65.741805 18.164305 1.7
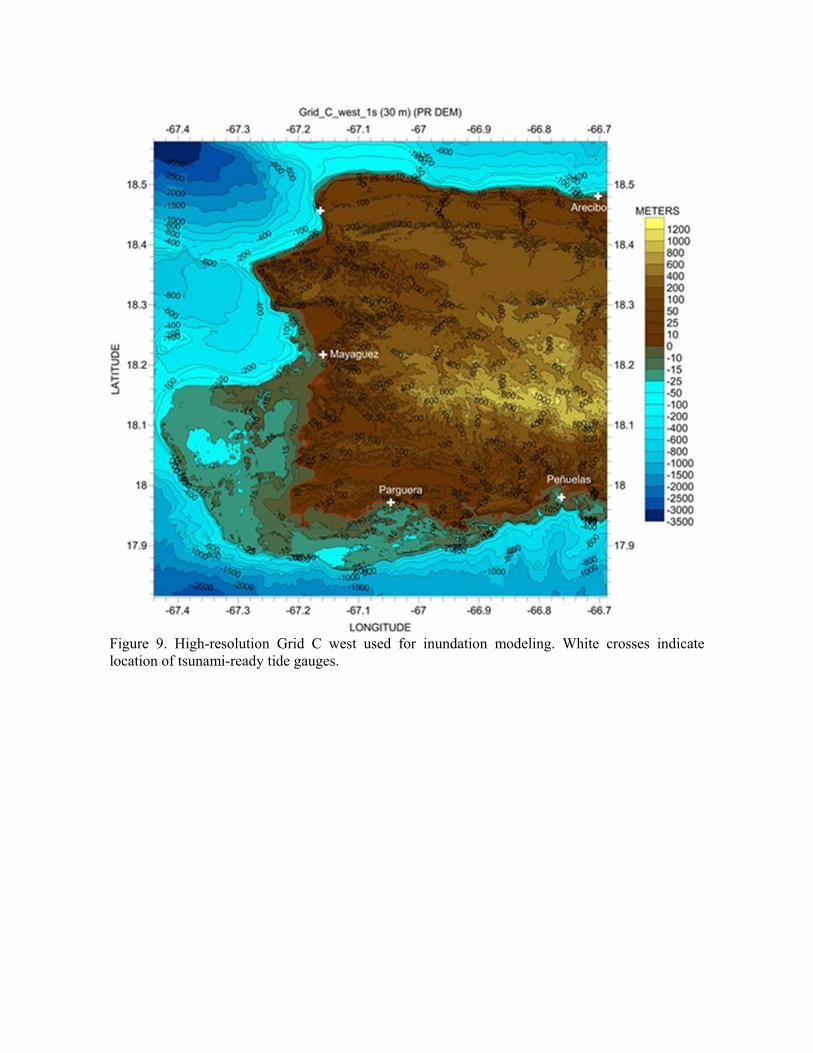
Figure 9. High-resolution Grid C west used for inundation modeling. White crosses indicate location of tsunami-ready tide gauges.
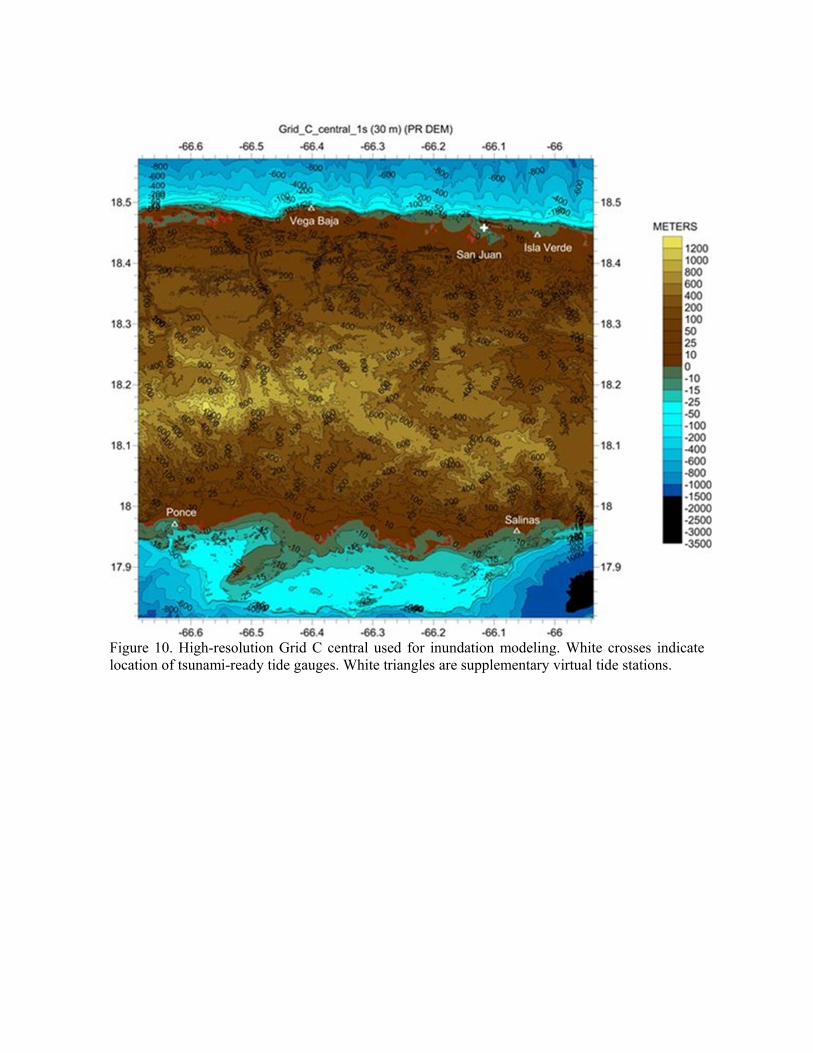
Figure 10. High-resolution Grid C central used for inundation modeling. White crosses indicate location of tsunami-ready tide gauges. White triangles are supplementary virtual tide stations.
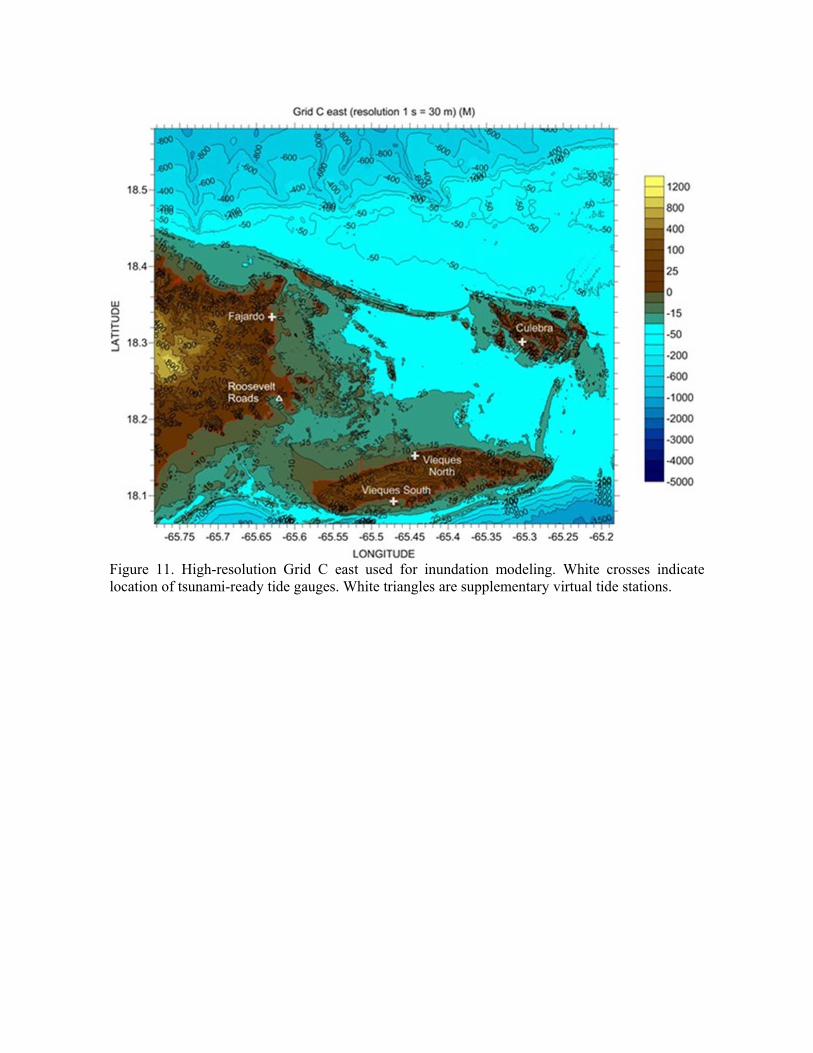
Figure 11. High-resolution Grid C east used for inundation modeling. White crosses indicate location of tsunami-ready tide gauges. White triangles are supplementary virtual tide stations.
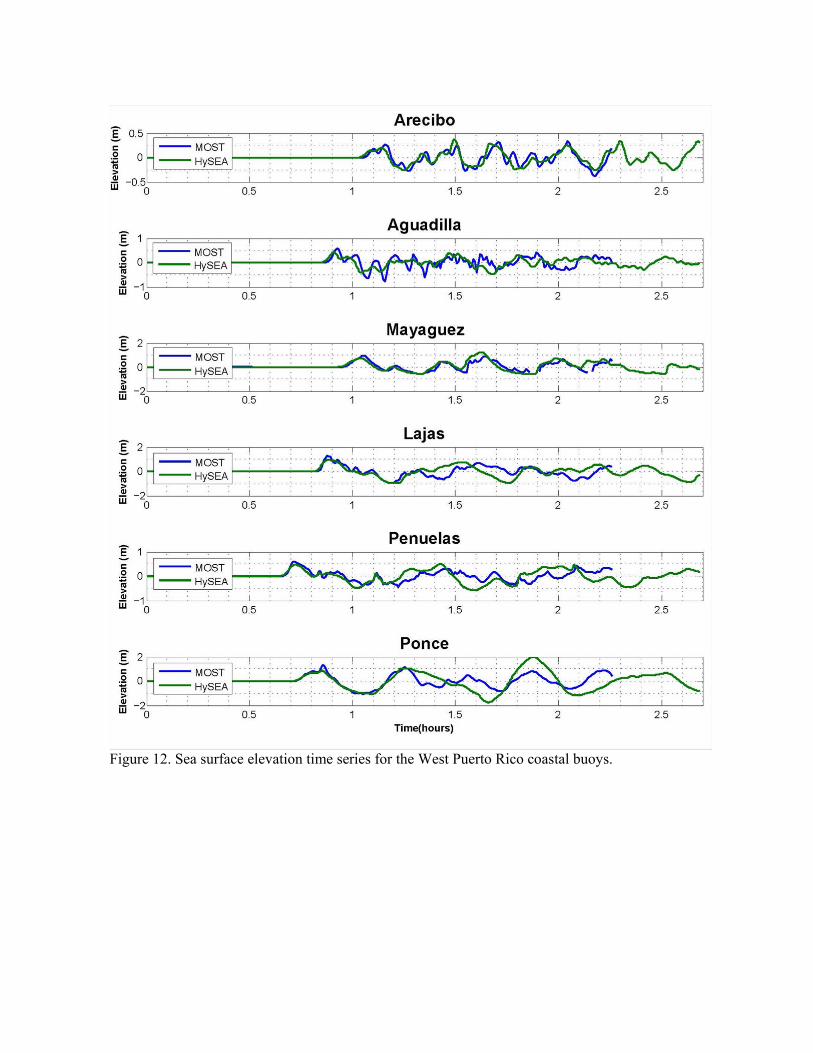
Figure 12. Sea surface elevation time series for the West Puerto Rico coastal buoys.
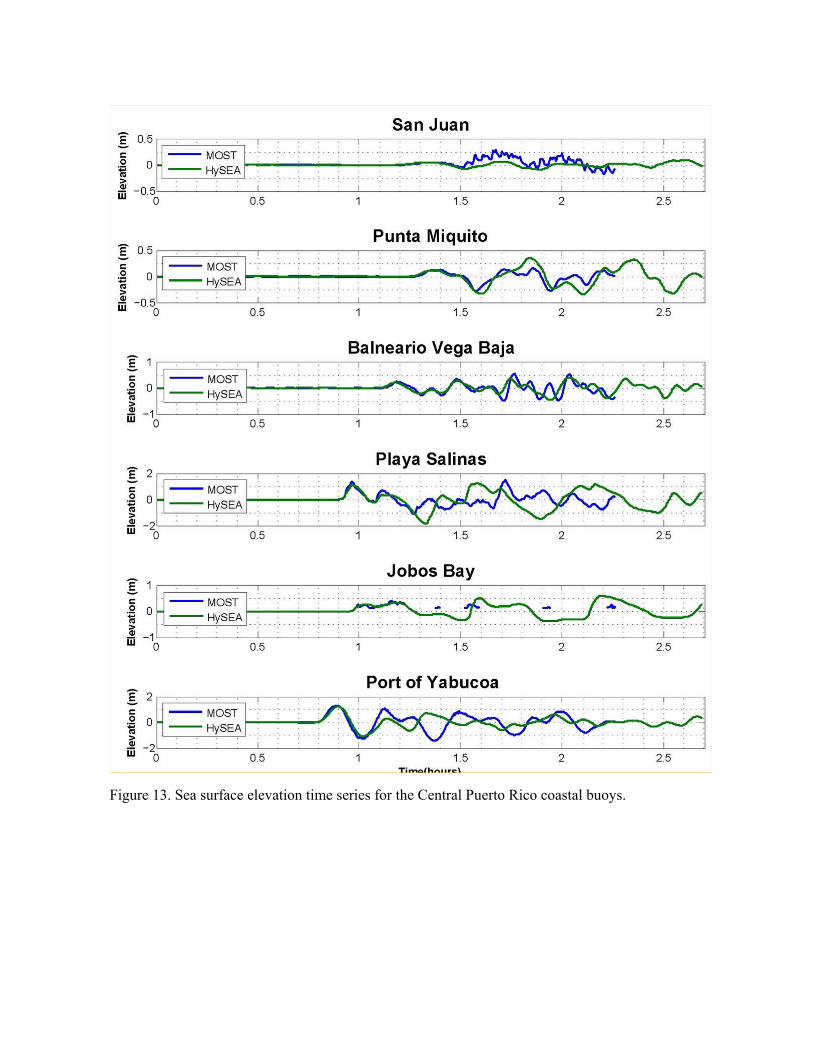
Figure 13. Sea surface elevation time series for the Central Puerto Rico coastal buoys.
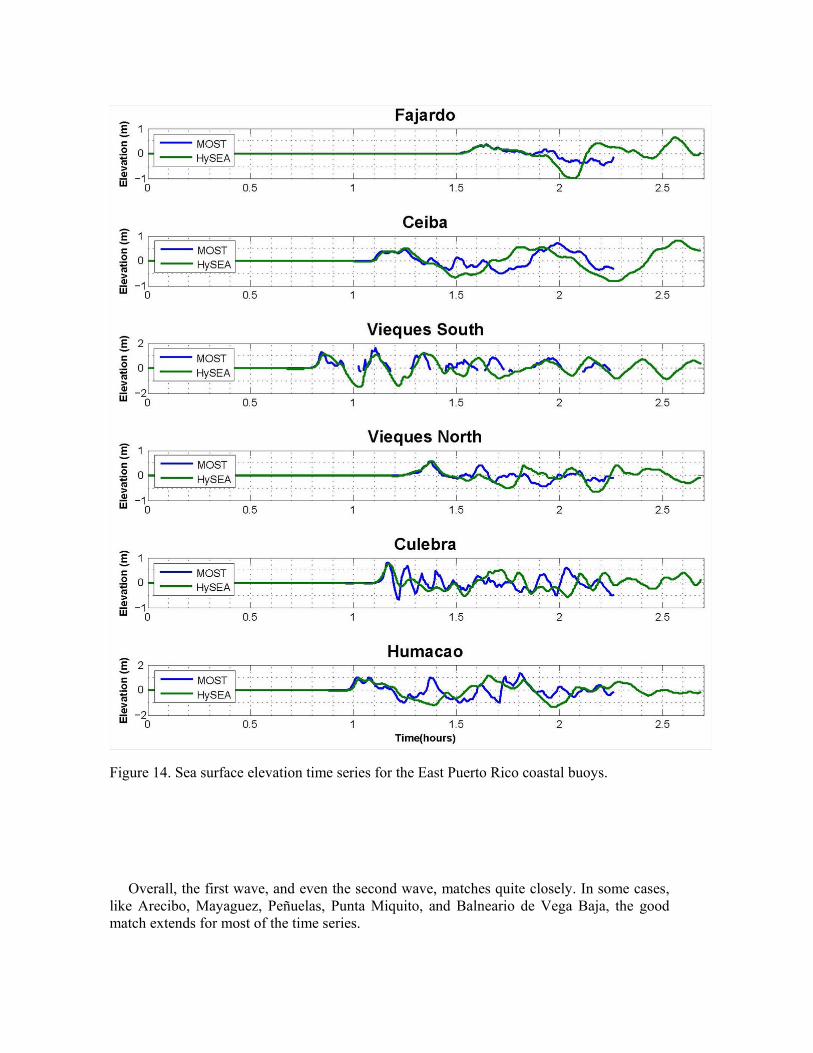
Figure 14. Sea surface elevation time series for the East Puerto Rico coastal buoys.
Overall, the first wave, and even the second wave, matches quite closely. In some cases, like Arecibo, Mayaguez, Peñuelas, Punta Miquito, and Balneario de Vega Baja, the good match extends for most of the time series.
Coastal Inundation
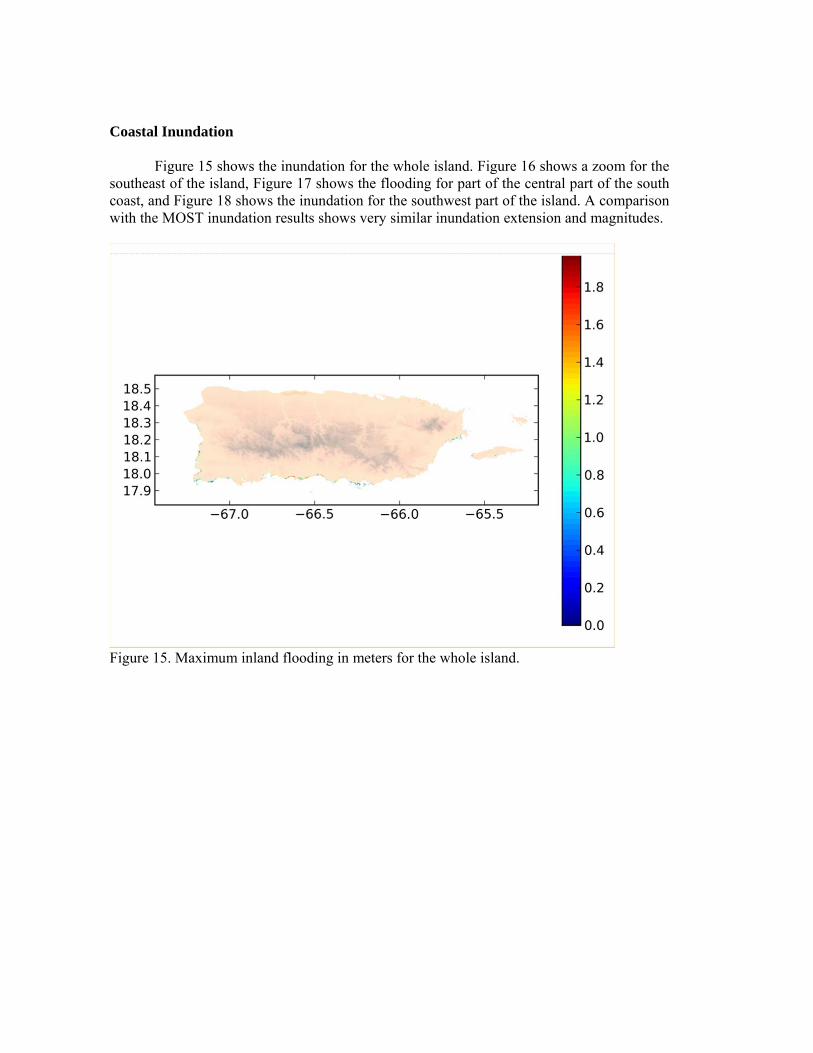
Figure 15 shows the inundation for the whole island. Figure 16 shows a zoom for the southeast of the island, Figure 17 shows the flooding for part of the central part of the south coast, and Figure 18 shows the inundation for the southwest part of the island. A comparison with the MOST inundation results shows very similar inundation extension and magnitudes.
Figure 15. Maximum inland flooding in meters for the whole island.
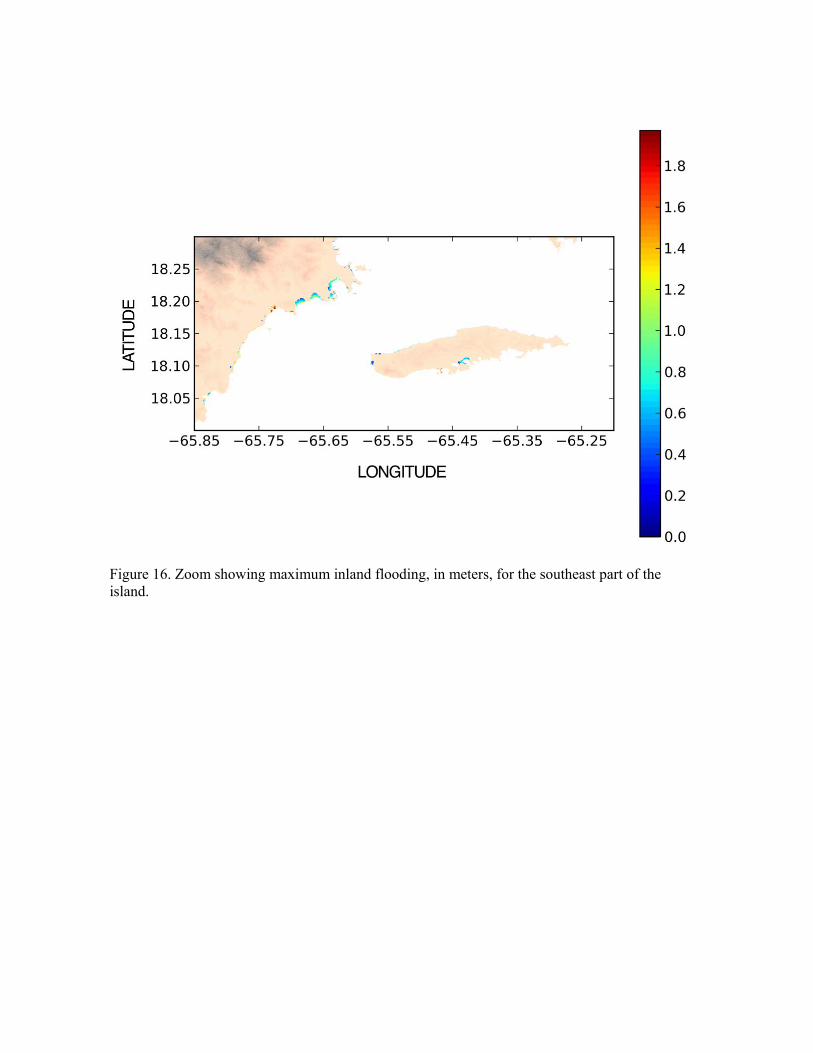
Figure 16. Zoom showing maximum inland flooding, in meters, for the southeast part of the island.
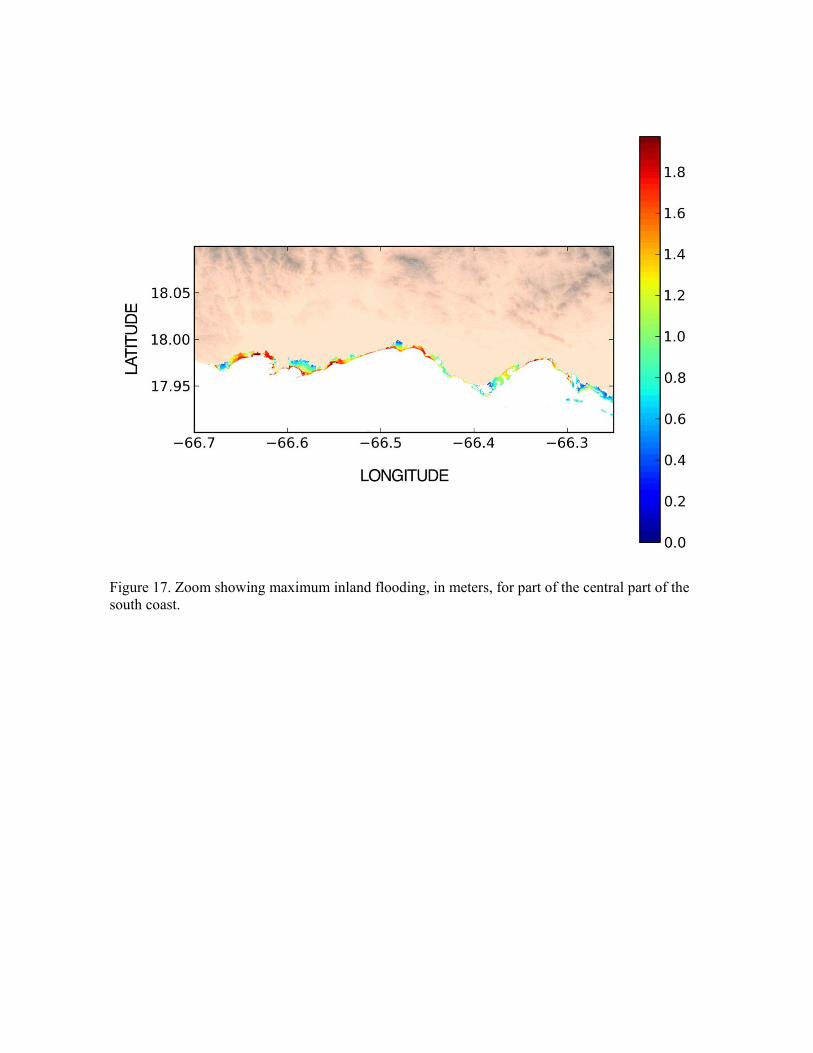
Figure 17. Zoom showing maximum inland flooding, in meters, for part of the central part of the south coast.
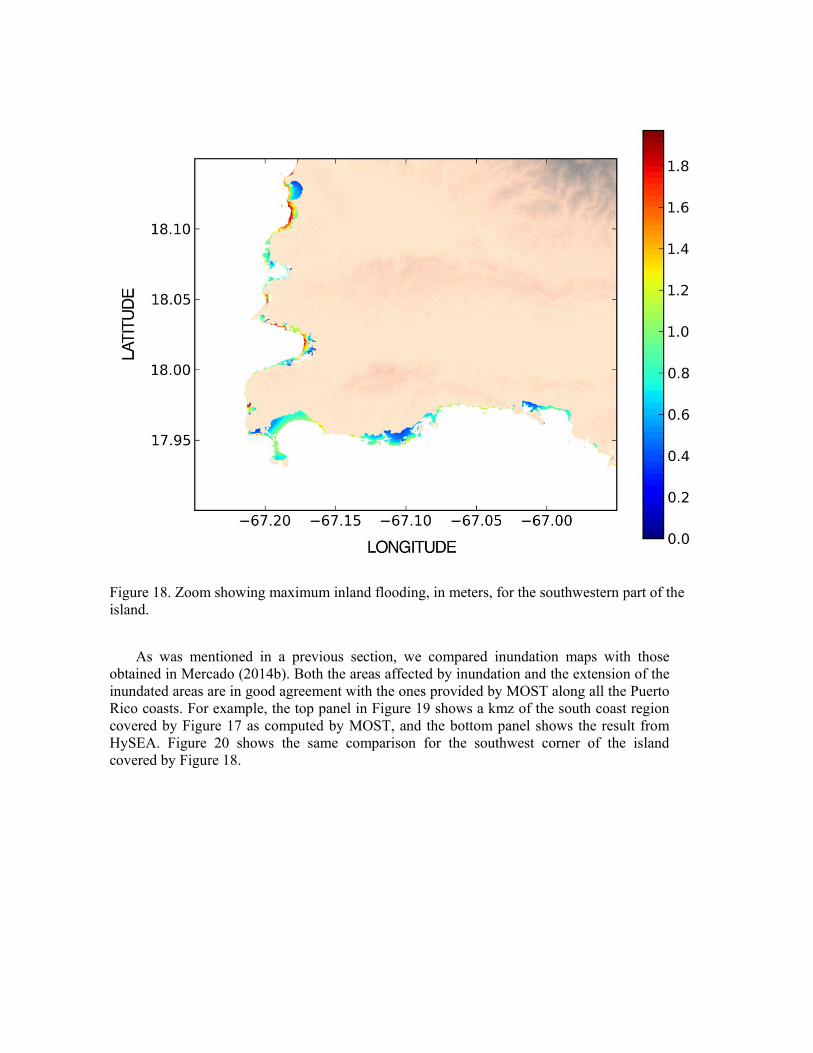
Figure 18. Zoom showing maximum inland flooding, in meters, for the southwestern part of the island.
As was mentioned in a previous section, we compared inundation maps with those
obtained in Mercado (2014b). Both the areas affected by inundation and the extension of the inundated areas are in good agreement with the ones provided by MOST along all the Puerto Rico coasts. For example, the top panel in Figure 19 shows a kmz of the south coast region covered by Figure 17 as computed by MOST, and the bottom panel shows the result from HySEA. Figure 20 shows the same comparison for the southwest corner of the island covered by Figure 18.
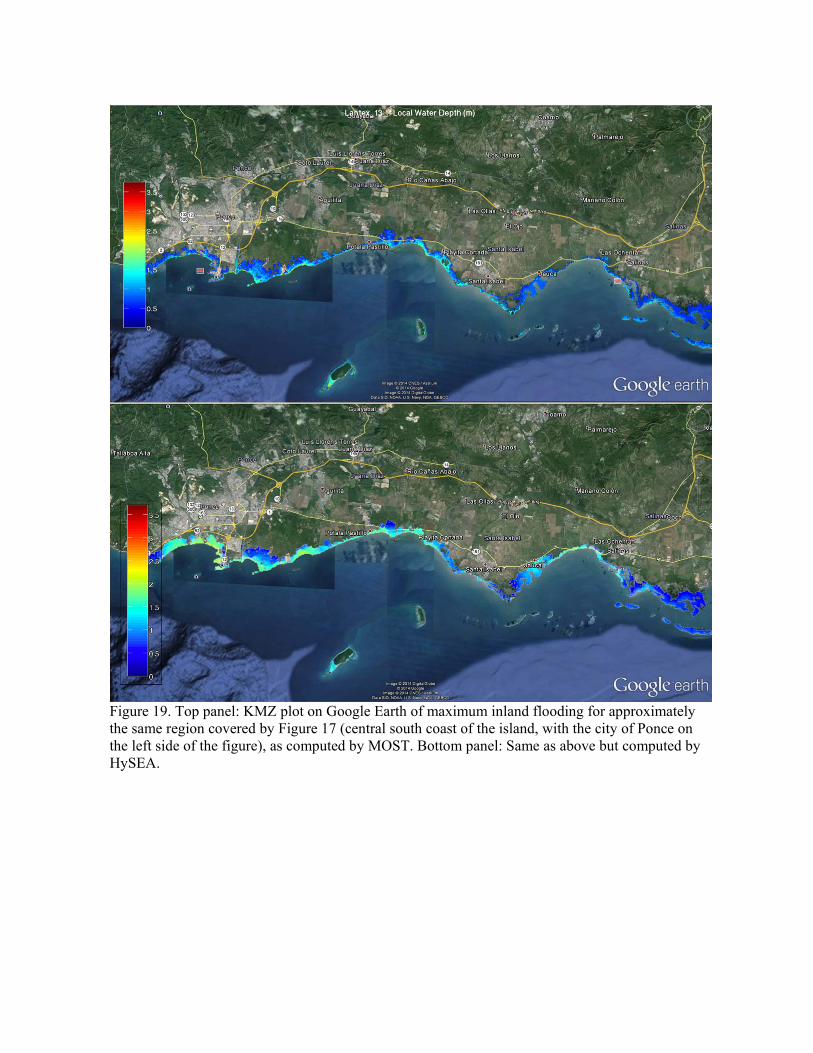
Figure 19. Top panel: KMZ plot on Google Earth of maximum inland flooding for approximately the same region covered by Figure 17 (central south coast of the island, with the city of Ponce on the left side of the figure), as computed by MOST. Bottom panel: Same as above but computed by HySEA.
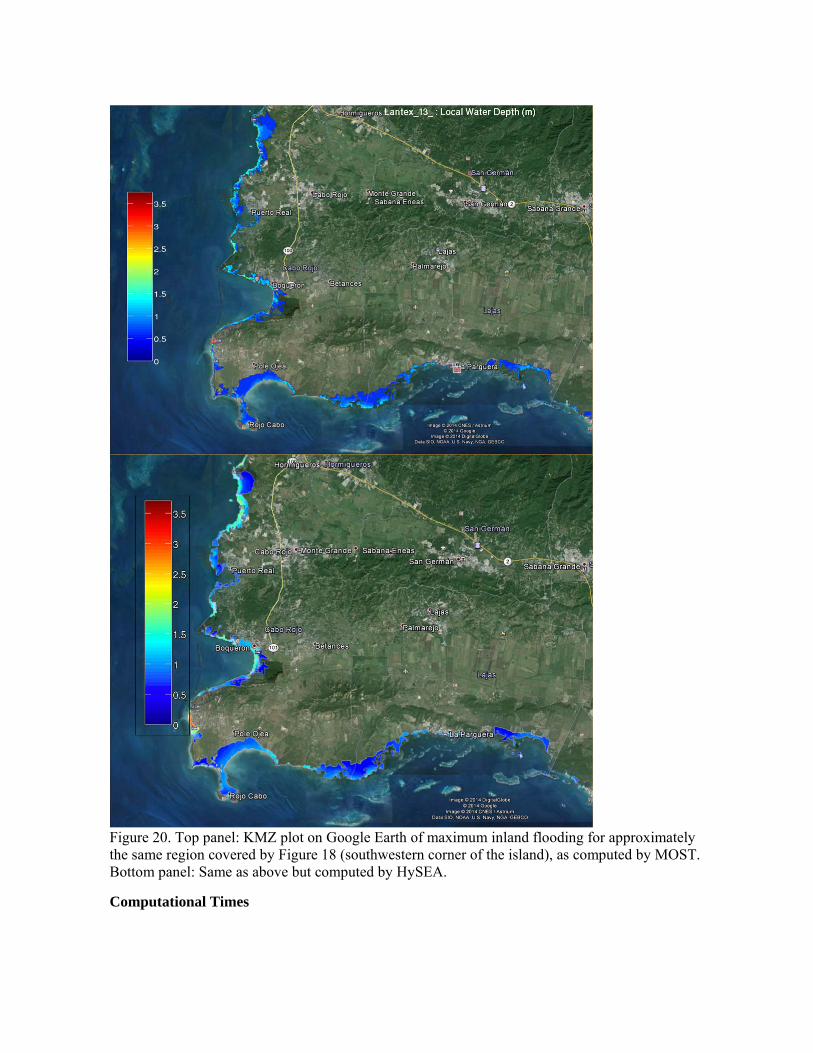
Figure 20. Top panel: KMZ plot on Google Earth of maximum inland flooding for approximately the same region covered by Figure 18 (southwestern corner of the island), as computed by MOST. Bottom panel: Same as above but computed by HySEA.
Computational Times
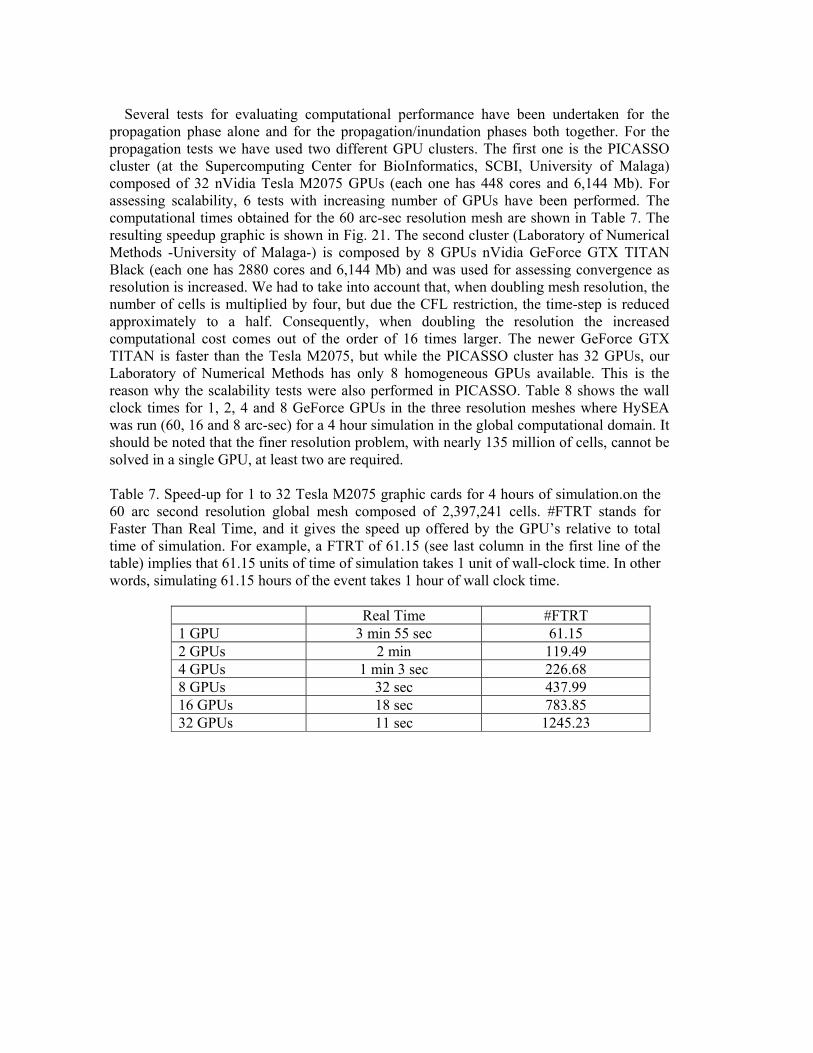
Several tests for evaluating computational performance have been undertaken for the propagation phase alone and for the propagation/inundation phases both together. For the propagation tests we have used two different GPU clusters. The first one is the PICASSO cluster (at the Supercomputing Center for BioInformatics, SCBI, University of Malaga) composed of 32 nVidia Tesla M2075 GPUs (each one has 448 cores and 6,144 Mb). For assessing scalability, 6 tests with increasing number of GPUs have been performed. The computational times obtained for the 60 arc-sec resolution mesh are shown in Table 7. The resulting speedup graphic is shown in Fig. 21. The second cluster (Laboratory of Numerical Methods -University of Malaga-) is composed by 8 GPUs nVidia GeForce GTX TITAN Black (each one has 2880 cores and 6,144 Mb) and was used for assessing convergence as resolution is increased. We had to take into account that, when doubling mesh resolution, the number of cells is multiplied by four, but due the CFL restriction, the time-step is reduced approximately to a half. Consequently, when doubling the resolution the increased computational cost comes out of the order of 16 times larger. The newer GeForce GTX TITAN is faster than the Tesla M2075, but while the PICASSO cluster has 32 GPUs, our Laboratory of Numerical Methods has only 8 homogeneous GPUs available. This is the reason why the scalability tests were also performed in PICASSO. Table 8 shows the wall clock times for 1, 2, 4 and 8 GeForce GPUs in the three resolution meshes where HySEA was run (60, 16 and 8 arc-sec) for a 4 hour simulation in the global computational domain. It should be noted that the finer resolution problem, with nearly 135 million of cells, cannot be solved in a single GPU, at least two are required. Table 7. Speed-up for 1 to 32 Tesla M2075 graphic cards for 4 hours of simulation.on the 60 arc second resolution global mesh composed of 2,397,241 cells. #FTRT stands for Faster Than Real Time, and it gives the speed up offered by the GPU’s relative to total time of simulation. For example, a FTRT of 61.15 (see last column in the first line of the table) implies that 61.15 units of time of simulation takes 1 unit of wall-clock time. In other words, simulating 61.15 hours of the event takes 1 hour of wall clock time.
Real Time #FTRT 1 GPU 3 min 55 sec 61.15 2 GPUs 2 min 119.49 4 GPUs 1 min 3 sec 226.68 8 GPUs 32 sec 437.99 16 GPUs 18 sec 783.85 32 GPUs 11 sec 1245.23
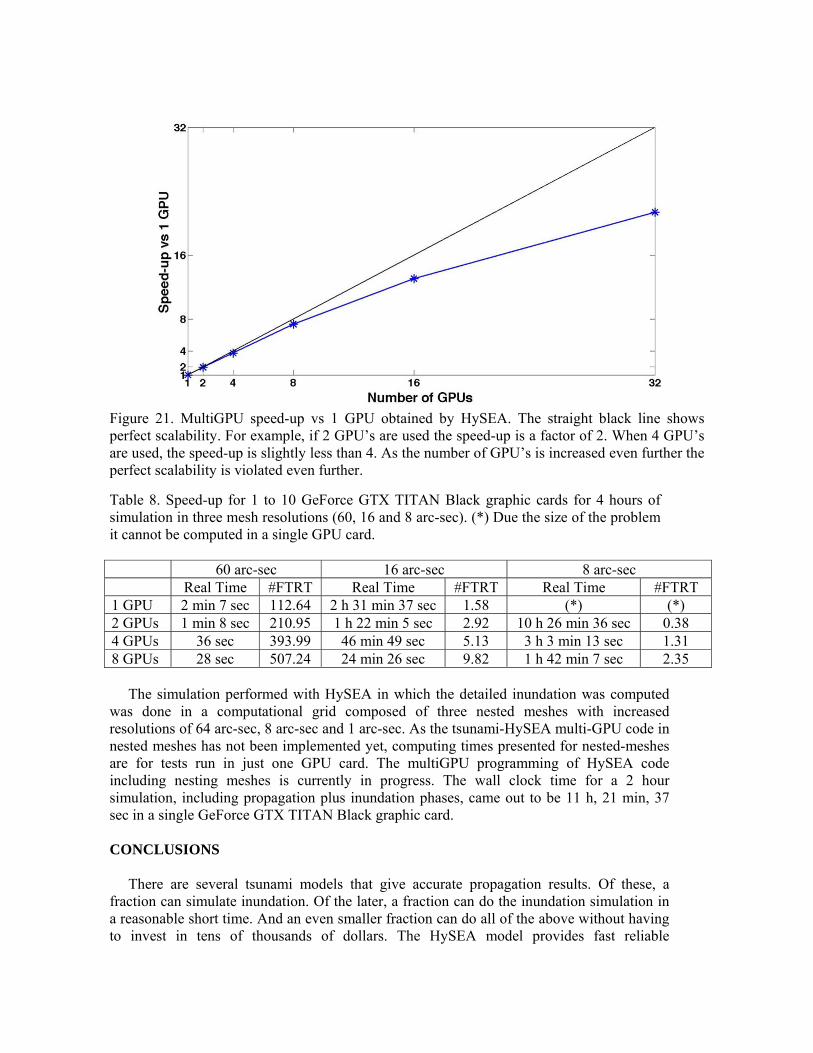
Figure 21. MultiGPU speed-up vs 1 GPU obtained by HySEA. The straight black line shows perfect scalability. For example, if 2 GPU’s are used the speed-up is a factor of 2. When 4 GPU’s are used, the speed-up is slightly less than 4. As the number of GPU’s is increased even further the perfect scalability is violated even further.
Table 8. Speed-up for 1 to 10 GeForce GTX TITAN Black graphic cards for 4 hours of simulation in three mesh resolutions (60, 16 and 8 arc-sec). (*) Due the size of the problem it cannot be computed in a single GPU card. 60 arc-sec 16 arc-sec 8 arc-sec Real Time #FTRT Real Time #FTRT Real Time #FTRT 1 GPU 2 min 7 sec 112.64 2 h 31 min 37 sec 1.58 (*) (*) 2 GPUs 1 min 8 sec 210.95 1 h 22 min 5 sec 2.92 10 h 26 min 36 sec 0.38 4 GPUs 36 sec 393.99 46 min 49 sec 5.13 3 h 3 min 13 sec 1.31 8 GPUs 28 sec 507.24 24 min 26 sec 9.82 1 h 42 min 7 sec 2.35 The simulation performed with HySEA in which the detailed inundation was computed was done in a computational grid composed of three nested meshes with increased resolutions of 64 arc-sec, 8 arc-sec and 1 arc-sec. As the tsunami-HySEA multi-GPU code in nested meshes has not been implemented yet, computing times presented for nested-meshes are for tests run in just one GPU card. The multiGPU programming of HySEA code including nesting meshes is currently in progress. The wall clock time for a 2 hour simulation, including propagation plus inundation phases, came out to be 11 h, 21 min, 37 sec in a single GeForce GTX TITAN Black graphic card. CONCLUSIONS There are several tsunami models that give accurate propagation results. Of these, a fraction can simulate inundation. Of the later, a fraction can do the inundation simulation in a reasonable short time. And an even smaller fraction can do all of the above without having to invest in tens of thousands of dollars. The HySEA model provides fast reliable
simulations for tsunami wave studies and coastal risk assessment. This model, developed by the EDANYA Group at the University of Málaga, Spain, enables dramatic increases in computing performance by harnessing the power of the graphics processing units (GPUs), and has been implemented to be run in multi-GPU architectures too. HySEA is a non-linear integrated model that does not distinguish between propagation and inundation phases. That is, in a single run it goes from generation to propagation and inundation, and runs without any bathymetry smoothing, allowing for a more faithful simulation of what a real tsunami encounters. The reduction in computational time obtained by HySEA compared with other well-established tsunami models is major and the cost of the computational resources needed much less, thus encouraging us to propose HySEA as an efficient, fast and robust tsunami code. When used with low resolution meshes the HySEA model can be used as a code for Tsunami Early Warning Systems, computing tsunami propagation in real time. This will start at INGV (Italy) in pre-operational mode in October 2014. When inundation maps are desired, then high resolution meshes with nesting capabilities can be used for accurate and faster computations. A version of tsunami-HySEA code is available upon request at [email protected]. ACKNOWLEDGMENTS This research has been partially supported by the Junta de Andalucía research project TESELA (P11- RNM7069) and the Spanish Government Research project DAIFLUID (MTM2012-38383-C02-01). The tsunami work in Puerto Rico was supported by the USA National Tsunami Hazard Mitigation Program. Travel funds for Aurelio Mercado were provided by the Puerto Rico Seismic Network and the Faculty of Arts and Sciences of the University of Puerto Rico, Mayaguez, P.R. REFERENCES
de la Asunción, M., Castro, M.J., Fernández-Nieto, E.D., Mantas, J.M., Ortega, S., González-Vida, J.M. (2013). Efficient GPU implementation of a two waves TVD-WAF method for the two-dimensional one layer shallow water system on structured meshes. Computers & Fluids, 80, 441-452.
ten Brink, U., Twichell D., Geist E., Chaytor J., Locat J., Lee H., Buczkowski B., Barkan R., Solow A., Andrews B., Parsons T., Lynett P., Lin J. and Sansoucy M. (2008). Evaluation of tsunami sources with the potential to impact the U.S. Atlantic and Gulf coasts: An Updated Report to the Nuclear Regulatory Commission. U.S. Geological Survey Administrative Report. Castro, M.J., Chacón, T., Fernández-Nieto, E.D., González-Vida, J.M., Parés, C. (2008). Well-balenced finite volume schemes for 2D non-homogeneus hyperbolic systems. Applications to the dam break of Aznalcóllar. Computer Methods in Applied Mechanics and Engineering 197 (45), 3932-3950.
Castro, M.J., Ferreiro, A., García, J.A., González, J.M., Macías, J., Parés, C. and Vázquez, M.E. (2005). On the numerical treatment of wet/dry fronts in shallow flows: Applications to one-layer and two-layer systems. Math. Comp. Model. 42 (3-4): 419-439.
Castro, M.J., González, J.M. and Parés, C. (2006). Numerical treatment of wet/dry fronts in shallow flows with a modified Roe scheme. Math. Mod. Meth. App. Sci. Vol. 16, No. 6, 897-931.
EDANYA Group (2014). Validation and verification of HySEA tsunami model. In preparation.
Gallardo, J.M., Parés, C. and Castro, M.J. (2007). On a well-balanced high-order finite volume scheme for shallow water equations with topography and dry areas. J. Comput. Phys. 227: 574-601.
González-Vida, J.M., Ortega, S., Castro, M.J., Macías, J., (2014). Modelling propagation and inundation of March 2011 Tohoku tsunami with the tsunami-HySEA model. In preparation.
Intergovernmental Oceanographic Commission. Exercise Caribe Wave/LANTEX 13. A Caribbean Tsunami Warning Exercise, 20 March 2013. Volume 1: Participant Handbook. IOC Technical Series No. 101. Paris, UNESCO, 2012. Macías, J., Castro, M.J., González-Vida, J.M., Ortega, S. (2013). Non-linear Shallow Water Models for coastal run-up simulations. EGU 2013. Mercado, A. (2014a). Report on Puerto Rico tsunami flood maps for local events. Submitted to the Puerto Rico Seismic Network. 55 pages. Mercado, A. (2014b). Report on Puerto Rico tsunami flood maps for regional events. Submitted to the Puerto Rico Seismic Network. 141 pages. Synolakis, C.E., Bernard, E.N., Titov, V.V., Kânoğlu, U., González, F.I. (2008). Validation and Verification of Tsunami Numerical Models. J. Pure and Applied Geophysics,165 (11-12): 2197-2228.
Copyright © 2022 FDOKUMEN