Nucleoporin levels regulate cell cycle progression and phase-specific gene expression
11
Developmental Cell Article Nucleoporin Levels Regulate Cell Cycle Progression and Phase-Specific Gene Expression Papia Chakraborty, 1 Yaming Wang, 2 Jen-Hsuan Wei, 1 Jan van Deursen, 3 Hongtao Yu, 4 Liviu Malureanu, 3 Mary Dasso, 5 Douglass J. Forbes, 6 David E. Levy, 2 Joachim Seemann, 1,7 and Beatriz M.A. Fontoura 1,7, * 1 Department of Cell Biology, University of Texas Southwestern Medical Center, Dallas, TX 75390, USA 2 Department of Pathology, New York University School of Medicine, New York, NY 10016, USA 3 Department of Pediatrics and Adolescent Medicine, Mayo Clinic, Rochester, MN 55905, USA 4 Department of Pharmacology, University of Texas Southwestern Medical Center, Dallas, TX 75390, USA 5 Laboratory of Gene Regulation and Development, NICHD, NIH, Bethesda, MD 20892, USA 6 Section of Cell and Developmental Biology, University of California San Diego, La Jolla, CA 92093, USA 7 J. Seemann and B.M.A. Fontoura share the senior authorship. *Correspondence: [email protected] DOI 10.1016/j.devcel.2008.08.020 SUMMARY The Nup107-160 complex, the largest subunit of the nuclear pore, is multifunctional. It mediates mRNA export in interphase, and has roles in kinetochore function, spindle assembly, and postmitotic nuclear pore assembly. We report here that the levels of constituents of the Nup107-160 complex are coordi- nately cell cycle-regulated. At mitosis, however, a member of the complex, Nup96, is preferentially downregulated. This occurs via the ubiquitin-pro- teasome pathway. When the levels of Nup96 are kept high, a significant delay in G1/S progression occurs. Conversely, in cells of Nup96 +/ mice, which express low levels of Nup96, cell cycle progression is accelerated. These lowered levels of Nup96 yield specific defects in nuclear export of certain mRNAs and protein expression, among which are key cell cycle regulators. Thus, Nup96 levels regu- late differential gene expression in a phase-specific manner, setting the stage for proper cell cycle progression. INTRODUCTION Nuclear transport factors and nuclear pore complex proteins (nucleoporins or Nups) mediate nucleocytoplasmic trafficking in interphase. Both transport factors and certain nucleoporins also have additional functions in mitosis, including spindle as- sembly and checkpoint functions (Harel and Forbes, 2004; Tran and Wente, 2006). Moreover, nuclear transport is subject to multiple levels of regulation, being impacted by signaling pathways, viral infection, and the proximity of active genes to the nuclear pore complex (NPC) (Tran and Wente, 2006). Furthermore, nucleocytoplasmic transport is specifically regu- lated during closed mitosis in yeast by molecular rearrange- ments at the NPC (Makhnevych et al., 2003). These changes in the NPC occur via the interaction of a specific nucleoporin with a transport receptor thus resulting in enhanced cargo release. Since these interactions are specific to mitosis, it underscores the importance of cell cycle in regulating nucleo- cytoplasmic trafficking and vice-versa (Makhnevych et al., 2003). Another level of NPC regulation related to the cell cycle is the progressive increase in the number of nuclear pores from G1 to G2, presumably due to a doubling of nucleoporin concentration in preparation for postmitotic nuclear assembly in the daughter cells (Maul et al., 1972, 1980; Winey et al., 1997). Studies per- formed in a Xenopus nuclear reconstitution system demon- strated that the steady increase in nuclear pore numbers can occur by de novo insertion of nucleoporins from both sides of the nuclear envelope to form new nuclear pores (D’Angelo et al., 2006). These observations were made with constituents of the Nup107-160 subcomplex of the NPC, which has a key role in nuclear pore assembly (Harel et al., 2003; Rasala et al., 2006; Walther et al., 2003). The vertebrate Nup107-160 complex constitutes one third of the proteins of the vertebrate NPC, containing Nup107, Nup160, Nup133, Nup85, Nup96, Sec13, Nup43, Nup37, Seh1, and variably ELYS/MEL-28 (Belgareh et al., 2001; Enninga et al., 2003; Fontoura et al., 1999; Franz et al., 2007; Harel et al., 2003; Loiodice et al., 2004; Orjalo et al., 2006; Rasala et al., 2006; Vasu et al., 2001). Once incorporated into the nuclear pore, the Nup107-160 complex, like its yeast counterpart, the Nup84 complex, plays a key role in mediating mRNA export (Aitchison et al., 1995; Boehmer et al., 2003; Dockendorff et al., 1997; Emt- age et al., 1997; Faria et al., 2006; Teixeira et al., 1997). In mitosis, the Nup107-160 complex assumes other important functions, being incorporated into both kinetochores and the centro- somes/proximal spindle poles (Enninga et al., 2003; Loiodice et al., 2004; Orjalo et al., 2006; Rasala et al., 2006). Indeed, de- pletion of the Nup107-160 complex disrupts the correct forma- tion of spindle microtubules in mitotic Xenopus egg extracts (Orjalo et al., 2006) and compromises kinetochore function (Zuc- colo et al., 2007). Here we report that the Nup107-160 complex is cell cycle-regulated. In particular, Nup96 is preferentially down- regulated in mitosis via the ubiquitin-proteasome pathway. We show that this regulation of Nup96 controls cell cycle progres- sion and differential phase-specific gene expression of key cell cycle regulators. Developmental Cell 15, 657–667, November 11, 2008 ª2008 Elsevier Inc. 657
Transcript of Nucleoporin levels regulate cell cycle progression and phase-specific gene expression
Developmental Cell
Article
Nucleoporin Levels Regulate Cell Cycle Progressionand Phase-Specific Gene ExpressionPapia Chakraborty,1 Yaming Wang,2 Jen-Hsuan Wei,1 Jan van Deursen,3 Hongtao Yu,4 Liviu Malureanu,3
Mary Dasso,5 Douglass J. Forbes,6 David E. Levy,2 Joachim Seemann,1,7 and Beatriz M.A. Fontoura1,7,*1Department of Cell Biology, University of Texas Southwestern Medical Center, Dallas, TX 75390, USA2Department of Pathology, New York University School of Medicine, New York, NY 10016, USA3Department of Pediatrics and Adolescent Medicine, Mayo Clinic, Rochester, MN 55905, USA4Department of Pharmacology, University of Texas Southwestern Medical Center, Dallas, TX 75390, USA5Laboratory of Gene Regulation and Development, NICHD, NIH, Bethesda, MD 20892, USA6Section of Cell and Developmental Biology, University of California San Diego, La Jolla, CA 92093, USA7J. Seemann and B.M.A. Fontoura share the senior authorship.
*Correspondence: [email protected]
DOI 10.1016/j.devcel.2008.08.020
SUMMARY
The Nup107-160 complex, the largest subunit of thenuclear pore, is multifunctional. It mediates mRNAexport in interphase, and has roles in kinetochorefunction, spindle assembly, and postmitotic nuclearpore assembly. We report here that the levels ofconstituents of the Nup107-160 complex are coordi-nately cell cycle-regulated. At mitosis, however,a member of the complex, Nup96, is preferentiallydownregulated. This occurs via the ubiquitin-pro-teasome pathway. When the levels of Nup96 arekept high, a significant delay in G1/S progressionoccurs. Conversely, in cells of Nup96+/�mice, whichexpress low levels of Nup96, cell cycle progressionis accelerated. These lowered levels of Nup96yield specific defects in nuclear export of certainmRNAs and protein expression, among which arekey cell cycle regulators. Thus, Nup96 levels regu-late differential gene expression in a phase-specificmanner, setting the stage for proper cell cycleprogression.
INTRODUCTION
Nuclear transport factors and nuclear pore complex proteins
(nucleoporins or Nups) mediate nucleocytoplasmic trafficking
in interphase. Both transport factors and certain nucleoporins
also have additional functions in mitosis, including spindle as-
sembly and checkpoint functions (Harel and Forbes, 2004;
Tran and Wente, 2006). Moreover, nuclear transport is subject
to multiple levels of regulation, being impacted by signaling
pathways, viral infection, and the proximity of active genes
to the nuclear pore complex (NPC) (Tran and Wente, 2006).
Furthermore, nucleocytoplasmic transport is specifically regu-
lated during closed mitosis in yeast by molecular rearrange-
ments at the NPC (Makhnevych et al., 2003). These changes
in the NPC occur via the interaction of a specific nucleoporin
with a transport receptor thus resulting in enhanced cargo
Developme
release. Since these interactions are specific to mitosis, it
underscores the importance of cell cycle in regulating nucleo-
cytoplasmic trafficking and vice-versa (Makhnevych et al.,
2003).
Another level of NPC regulation related to the cell cycle is the
progressive increase in the number of nuclear pores from G1 to
G2, presumably due to a doubling of nucleoporin concentration
in preparation for postmitotic nuclear assembly in the daughter
cells (Maul et al., 1972, 1980; Winey et al., 1997). Studies per-
formed in a Xenopus nuclear reconstitution system demon-
strated that the steady increase in nuclear pore numbers can
occur by de novo insertion of nucleoporins from both sides of
the nuclear envelope to form new nuclear pores (D’Angelo
et al., 2006). These observations were made with constituents
of the Nup107-160 subcomplex of the NPC, which has a key
role in nuclear pore assembly (Harel et al., 2003; Rasala et al.,
2006; Walther et al., 2003).
The vertebrate Nup107-160 complex constitutes one third of
the proteins of the vertebrate NPC, containing Nup107,
Nup160, Nup133, Nup85, Nup96, Sec13, Nup43, Nup37,
Seh1, and variably ELYS/MEL-28 (Belgareh et al., 2001; Enninga
et al., 2003; Fontoura et al., 1999; Franz et al., 2007; Harel et al.,
2003; Loiodice et al., 2004; Orjalo et al., 2006; Rasala et al., 2006;
Vasu et al., 2001). Once incorporated into the nuclear pore, the
Nup107-160 complex, like its yeast counterpart, the Nup84
complex, plays a key role in mediating mRNA export (Aitchison
et al., 1995; Boehmer et al., 2003; Dockendorff et al., 1997; Emt-
age et al., 1997; Faria et al., 2006; Teixeira et al., 1997). In mitosis,
the Nup107-160 complex assumes other important functions,
being incorporated into both kinetochores and the centro-
somes/proximal spindle poles (Enninga et al., 2003; Loiodice
et al., 2004; Orjalo et al., 2006; Rasala et al., 2006). Indeed, de-
pletion of the Nup107-160 complex disrupts the correct forma-
tion of spindle microtubules in mitotic Xenopus egg extracts
(Orjalo et al., 2006) and compromises kinetochore function (Zuc-
colo et al., 2007). Here we report that the Nup107-160 complex is
cell cycle-regulated. In particular, Nup96 is preferentially down-
regulated in mitosis via the ubiquitin-proteasome pathway. We
show that this regulation of Nup96 controls cell cycle progres-
sion and differential phase-specific gene expression of key cell
cycle regulators.
ntal Cell 15, 657–667, November 11, 2008 ª2008 Elsevier Inc. 657
Developmental Cell
Nucleoporin Levels Regulate Cell Cycle Progression
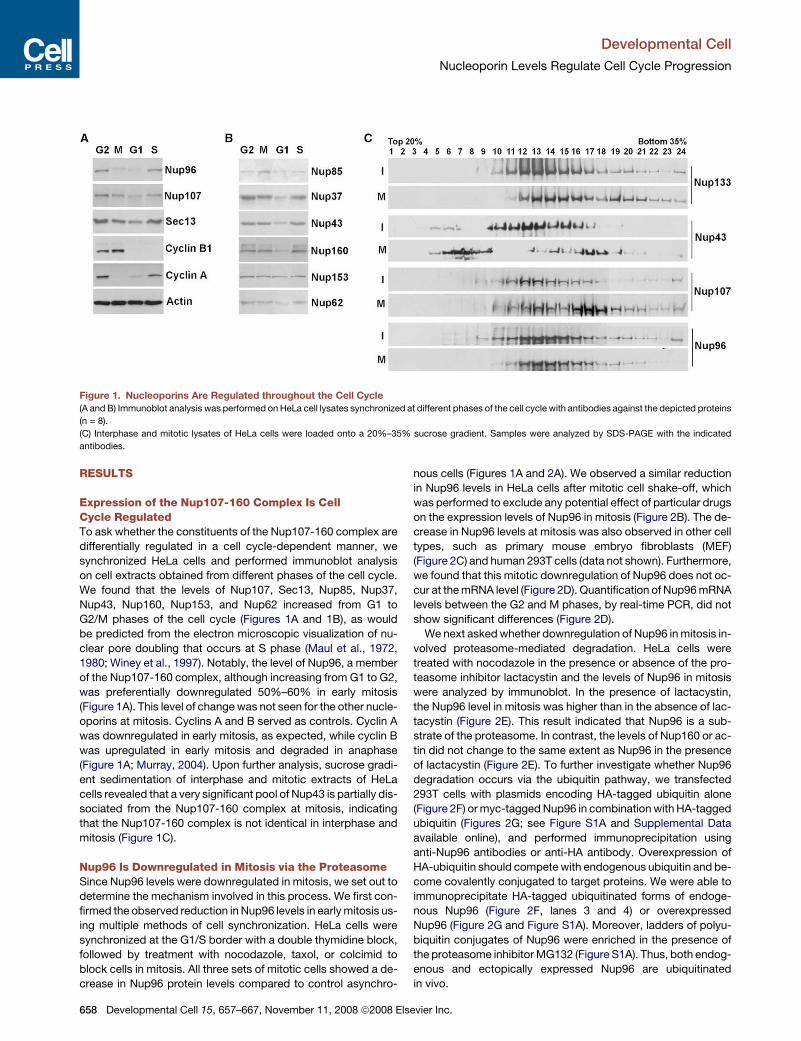
Figure 1. Nucleoporins Are Regulated throughout the Cell Cycle
(A and B) Immunoblot analysis was performed on HeLa cell lysates synchronized at different phases of the cell cycle with antibodies against the depicted proteins
(n = 8).
(C) Interphase and mitotic lysates of HeLa cells were loaded onto a 20%–35% sucrose gradient. Samples were analyzed by SDS-PAGE with the indicated
antibodies.
RESULTS
Expression of the Nup107-160 Complex Is CellCycle RegulatedTo ask whether the constituents of the Nup107-160 complex are
differentially regulated in a cell cycle-dependent manner, we
synchronized HeLa cells and performed immunoblot analysis
on cell extracts obtained from different phases of the cell cycle.
We found that the levels of Nup107, Sec13, Nup85, Nup37,
Nup43, Nup160, Nup153, and Nup62 increased from G1 to
G2/M phases of the cell cycle (Figures 1A and 1B), as would
be predicted from the electron microscopic visualization of nu-
clear pore doubling that occurs at S phase (Maul et al., 1972,
1980; Winey et al., 1997). Notably, the level of Nup96, a member
of the Nup107-160 complex, although increasing from G1 to G2,
was preferentially downregulated 50%–60% in early mitosis
(Figure 1A). This level of change was not seen for the other nucle-
oporins at mitosis. Cyclins A and B served as controls. Cyclin A
was downregulated in early mitosis, as expected, while cyclin B
was upregulated in early mitosis and degraded in anaphase
(Figure 1A; Murray, 2004). Upon further analysis, sucrose gradi-
ent sedimentation of interphase and mitotic extracts of HeLa
cells revealed that a very significant pool of Nup43 is partially dis-
sociated from the Nup107-160 complex at mitosis, indicating
that the Nup107-160 complex is not identical in interphase and
mitosis (Figure 1C).
Nup96 Is Downregulated in Mitosis via the ProteasomeSince Nup96 levels were downregulated in mitosis, we set out to
determine the mechanism involved in this process. We first con-
firmed the observed reduction in Nup96 levels in early mitosis us-
ing multiple methods of cell synchronization. HeLa cells were
synchronized at the G1/S border with a double thymidine block,
followed by treatment with nocodazole, taxol, or colcimid to
block cells in mitosis. All three sets of mitotic cells showed a de-
crease in Nup96 protein levels compared to control asynchro-
658 Developmental Cell 15, 657–667, November 11, 2008 ª2008 Els
nous cells (Figures 1A and 2A). We observed a similar reduction
in Nup96 levels in HeLa cells after mitotic cell shake-off, which
was performed to exclude any potential effect of particular drugs
on the expression levels of Nup96 in mitosis (Figure 2B). The de-
crease in Nup96 levels at mitosis was also observed in other cell
types, such as primary mouse embryo fibroblasts (MEF)
(Figure 2C) and human 293T cells (data not shown). Furthermore,
we found that this mitotic downregulation of Nup96 does not oc-
cur at the mRNA level (Figure 2D). Quantification of Nup96 mRNA
levels between the G2 and M phases, by real-time PCR, did not
show significant differences (Figure 2D).
We next asked whether downregulation of Nup96 in mitosis in-
volved proteasome-mediated degradation. HeLa cells were
treated with nocodazole in the presence or absence of the pro-
teasome inhibitor lactacystin and the levels of Nup96 in mitosis
were analyzed by immunoblot. In the presence of lactacystin,
the Nup96 level in mitosis was higher than in the absence of lac-
tacystin (Figure 2E). This result indicated that Nup96 is a sub-
strate of the proteasome. In contrast, the levels of Nup160 or ac-
tin did not change to the same extent as Nup96 in the presence
of lactacystin (Figure 2E). To further investigate whether Nup96
degradation occurs via the ubiquitin pathway, we transfected
293T cells with plasmids encoding HA-tagged ubiquitin alone
(Figure 2F) or myc-tagged Nup96 in combination with HA-tagged
ubiquitin (Figures 2G; see Figure S1A and Supplemental Data
available online), and performed immunoprecipitation using
anti-Nup96 antibodies or anti-HA antibody. Overexpression of
HA-ubiquitin should compete with endogenous ubiquitin and be-
come covalently conjugated to target proteins. We were able to
immunoprecipitate HA-tagged ubiquitinated forms of endoge-
nous Nup96 (Figure 2F, lanes 3 and 4) or overexpressed
Nup96 (Figure 2G and Figure S1A). Moreover, ladders of polyu-
biquitin conjugates of Nup96 were enriched in the presence of
the proteasome inhibitor MG132 (Figure S1A). Thus, both endog-
enous and ectopically expressed Nup96 are ubiquitinated
in vivo.
evier Inc.
Developmental Cell
Nucleoporin Levels Regulate Cell Cycle Progression
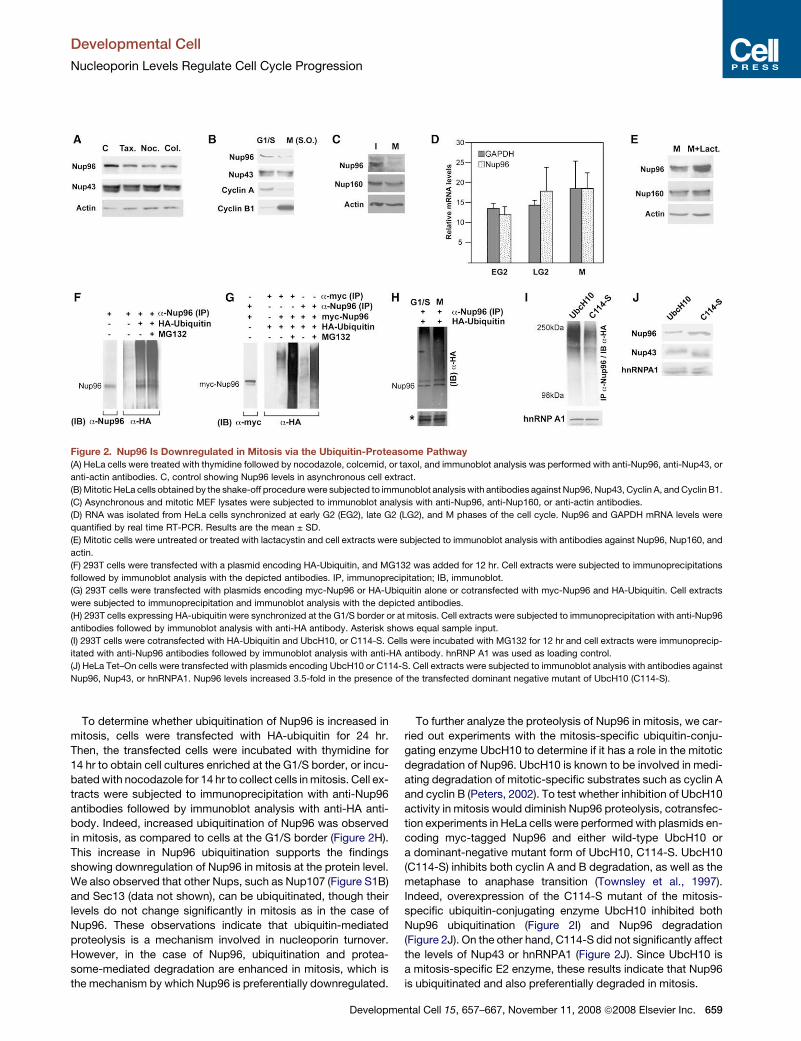
Figure 2. Nup96 Is Downregulated in Mitosis via the Ubiquitin-Proteasome Pathway
(A) HeLa cells were treated with thymidine followed by nocodazole, colcemid, or taxol, and immunoblot analysis was performed with anti-Nup96, anti-Nup43, or
anti-actin antibodies. C, control showing Nup96 levels in asynchronous cell extract.
(B) Mitotic HeLa cells obtained by the shake-off procedure were subjected to immunoblot analysis with antibodies against Nup96, Nup43, Cyclin A, and Cyclin B1.
(C) Asynchronous and mitotic MEF lysates were subjected to immunoblot analysis with anti-Nup96, anti-Nup160, or anti-actin antibodies.
(D) RNA was isolated from HeLa cells synchronized at early G2 (EG2), late G2 (LG2), and M phases of the cell cycle. Nup96 and GAPDH mRNA levels were
quantified by real time RT-PCR. Results are the mean ± SD.
(E) Mitotic cells were untreated or treated with lactacystin and cell extracts were subjected to immunoblot analysis with antibodies against Nup96, Nup160, and
actin.
(F) 293T cells were transfected with a plasmid encoding HA-Ubiquitin, and MG132 was added for 12 hr. Cell extracts were subjected to immunoprecipitations
followed by immunoblot analysis with the depicted antibodies. IP, immunoprecipitation; IB, immunoblot.
(G) 293T cells were transfected with plasmids encoding myc-Nup96 or HA-Ubiquitin alone or cotransfected with myc-Nup96 and HA-Ubiquitin. Cell extracts
were subjected to immunoprecipitation and immunoblot analysis with the depicted antibodies.
(H) 293T cells expressing HA-ubiquitin were synchronized at the G1/S border or at mitosis. Cell extracts were subjected to immunoprecipitation with anti-Nup96
antibodies followed by immunoblot analysis with anti-HA antibody. Asterisk shows equal sample input.
(I) 293T cells were cotransfected with HA-Ubiquitin and UbcH10, or C114-S. Cells were incubated with MG132 for 12 hr and cell extracts were immunoprecip-
itated with anti-Nup96 antibodies followed by immunoblot analysis with anti-HA antibody. hnRNP A1 was used as loading control.
(J) HeLa Tet–On cells were transfected with plasmids encoding UbcH10 or C114-S. Cell extracts were subjected to immunoblot analysis with antibodies against
Nup96, Nup43, or hnRNPA1. Nup96 levels increased 3.5-fold in the presence of the transfected dominant negative mutant of UbcH10 (C114-S).
To determine whether ubiquitination of Nup96 is increased in
mitosis, cells were transfected with HA-ubiquitin for 24 hr.
Then, the transfected cells were incubated with thymidine for
14 hr to obtain cell cultures enriched at the G1/S border, or incu-
bated with nocodazole for 14 hr to collect cells in mitosis. Cell ex-
tracts were subjected to immunoprecipitation with anti-Nup96
antibodies followed by immunoblot analysis with anti-HA anti-
body. Indeed, increased ubiquitination of Nup96 was observed
in mitosis, as compared to cells at the G1/S border (Figure 2H).
This increase in Nup96 ubiquitination supports the findings
showing downregulation of Nup96 in mitosis at the protein level.
We also observed that other Nups, such as Nup107 (Figure S1B)
and Sec13 (data not shown), can be ubiquitinated, though their
levels do not change significantly in mitosis as in the case of
Nup96. These observations indicate that ubiquitin-mediated
proteolysis is a mechanism involved in nucleoporin turnover.
However, in the case of Nup96, ubiquitination and protea-
some-mediated degradation are enhanced in mitosis, which is
the mechanism by which Nup96 is preferentially downregulated.
Developme
To further analyze the proteolysis of Nup96 in mitosis, we car-
ried out experiments with the mitosis-specific ubiquitin-conju-
gating enzyme UbcH10 to determine if it has a role in the mitotic
degradation of Nup96. UbcH10 is known to be involved in medi-
ating degradation of mitotic-specific substrates such as cyclin A
and cyclin B (Peters, 2002). To test whether inhibition of UbcH10
activity in mitosis would diminish Nup96 proteolysis, cotransfec-
tion experiments in HeLa cells were performed with plasmids en-
coding myc-tagged Nup96 and either wild-type UbcH10 or
a dominant-negative mutant form of UbcH10, C114-S. UbcH10
(C114-S) inhibits both cyclin A and B degradation, as well as the
metaphase to anaphase transition (Townsley et al., 1997).
Indeed, overexpression of the C114-S mutant of the mitosis-
specific ubiquitin-conjugating enzyme UbcH10 inhibited both
Nup96 ubiquitination (Figure 2I) and Nup96 degradation
(Figure 2J). On the other hand, C114-S did not significantly affect
the levels of Nup43 or hnRNPA1 (Figure 2J). Since UbcH10 is
a mitosis-specific E2 enzyme, these results indicate that Nup96
is ubiquitinated and also preferentially degraded in mitosis.
ntal Cell 15, 657–667, November 11, 2008 ª2008 Elsevier Inc. 659
Developmental Cell
Nucleoporin Levels Regulate Cell Cycle Progression
Nup96 Levels Regulate Cell Cycle ProgressionTo determine the functional significance of Nup96 downregula-
tion in mitosis, we investigated whether Nup96, if present at
high levels, has effects on mitotic timing. We generated stably
transfected HeLa cell lines expressing high levels of FLAG-
tagged-Nup96 (data not shown) and coexpressed histone
H2B-YFP to follow live cells as they transitioned through mitosis.
In the presence of excess Nup96, we observed a slight delay
from metaphase to anaphase and from anaphase to cytokinesis
(Table 1). These modest effects of high levels of Nup96 on mitotic
timing did not result in any major mitotic defect. We also followed
mitotic progression in the presence of high levels of Nup37,
another constituent of the Nup107-160 complex, and again did
not detect any major effect on mitotic timing or mitotic defects
(Table 1). In addition, we tested whether high levels of Nup96
would affect mitotic timing of normal rat kidney (NRK) cells,
which have an intact G1 checkpoint. We show, in Table 1, that
increased levels of Nup96 had modest effects on mitotic timing
in NRK cells causing a slight acceleration from NEBD to meta-
phase and from anaphase to cytokinesis. Although these minor
defects on mitotic timing caused by high levels of Nup96 varied
between HeLa cells and NRK cells (Table 1), in both cases they
did not result in any major mitotic defect.
However, we observed that high levels of Nup96 resulted in
a prominent delay in G1/S progression. In this experiment we
also used NRK cells because they have an intact G1 checkpoint.
NRK cells were synchronized in S phase with aphidicolin, then
transfected 3 hr after release from aphidicolin with plasmids en-
coding Nup96, Nup37, ALADIN, or EGFP, at a time when the
cells were in late G2. Under these conditions, detectable protein
expression occurs in G1, after plasmids efficiently enter the nu-
cleus following nuclear envelope breakdown in mitosis. BrdU
staining was performed 19 hr after the aphidicolin release and
cells were analyzed by immunofluorescence and Apotome mi-
croscopy (Figure 3A). Quantification of BrdU-positive cells, in-
dicative of cells having entered S phase, was carried out. The
data showed that approximately half of the population of cells
expressing high levels of Nup96 was still in G1 at 19 hr
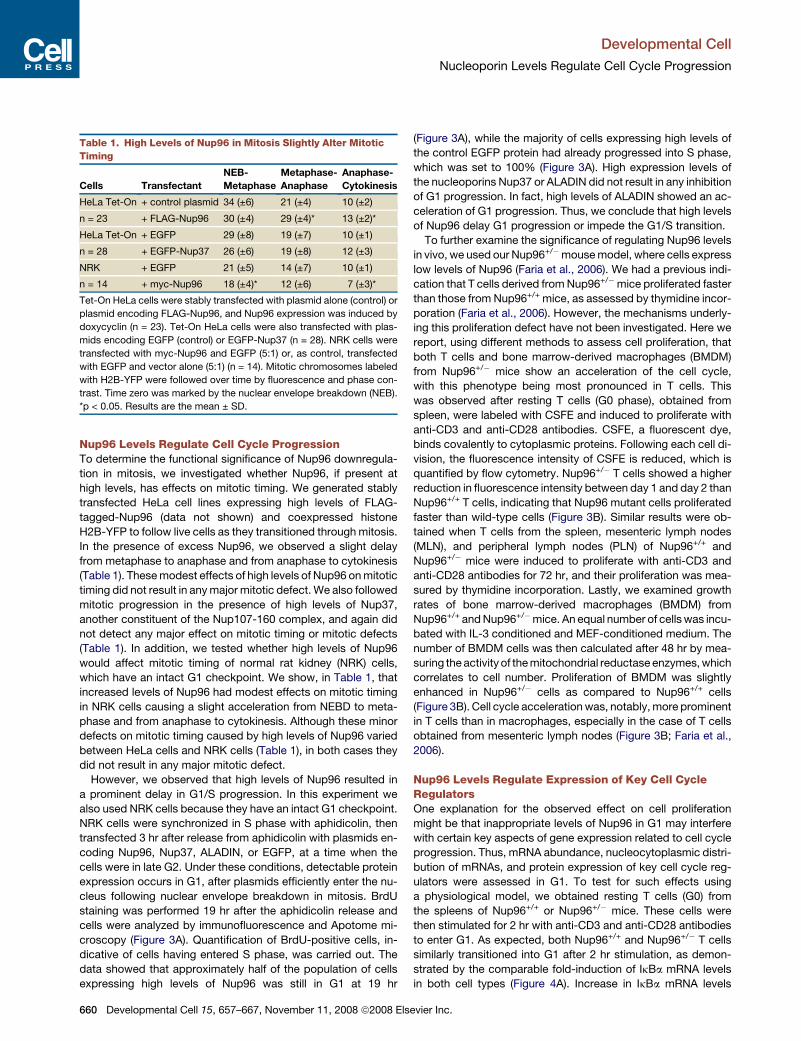
Table 1. High Levels of Nup96 in Mitosis Slightly Alter Mitotic
Timing
Cells Transfectant
NEB-
Metaphase
Metaphase-
Anaphase
Anaphase-
Cytokinesis
HeLa Tet-On + control plasmid 34 (±6) 21 (±4) 10 (±2)
n = 23 + FLAG-Nup96 30 (±4) 29 (±4)* 13 (±2)*
HeLa Tet-On + EGFP 29 (±8) 19 (±7) 10 (±1)
n = 28 + EGFP-Nup37 26 (±6) 19 (±8) 12 (±3)
NRK + EGFP 21 (±5) 14 (±7) 10 (±1)
n = 14 + myc-Nup96 18 (±4)* 12 (±6) 7 (±3)*
Tet-On HeLa cells were stably transfected with plasmid alone (control) or
plasmid encoding FLAG-Nup96, and Nup96 expression was induced by
doxycyclin (n = 23). Tet-On HeLa cells were also transfected with plas-
mids encoding EGFP (control) or EGFP-Nup37 (n = 28). NRK cells were
transfected with myc-Nup96 and EGFP (5:1) or, as control, transfected
with EGFP and vector alone (5:1) (n = 14). Mitotic chromosomes labeled
with H2B-YFP were followed over time by fluorescence and phase con-
trast. Time zero was marked by the nuclear envelope breakdown (NEB).
*p < 0.05. Results are the mean ± SD.
660 Developmental Cell 15, 657–667, November 11, 2008 ª2008 Els
(Figure 3A), while the majority of cells expressing high levels of
the control EGFP protein had already progressed into S phase,
which was set to 100% (Figure 3A). High expression levels of
the nucleoporins Nup37 or ALADIN did not result in any inhibition
of G1 progression. In fact, high levels of ALADIN showed an ac-
celeration of G1 progression. Thus, we conclude that high levels
of Nup96 delay G1 progression or impede the G1/S transition.
To further examine the significance of regulating Nup96 levels
in vivo, we used our Nup96+/�mouse model, where cells express
low levels of Nup96 (Faria et al., 2006). We had a previous indi-
cation that T cells derived from Nup96+/�mice proliferated faster
than those from Nup96+/+ mice, as assessed by thymidine incor-
poration (Faria et al., 2006). However, the mechanisms underly-
ing this proliferation defect have not been investigated. Here we
report, using different methods to assess cell proliferation, that
both T cells and bone marrow-derived macrophages (BMDM)
from Nup96+/� mice show an acceleration of the cell cycle,
with this phenotype being most pronounced in T cells. This
was observed after resting T cells (G0 phase), obtained from
spleen, were labeled with CSFE and induced to proliferate with
anti-CD3 and anti-CD28 antibodies. CSFE, a fluorescent dye,
binds covalently to cytoplasmic proteins. Following each cell di-
vision, the fluorescence intensity of CSFE is reduced, which is
quantified by flow cytometry. Nup96+/� T cells showed a higher
reduction in fluorescence intensity between day 1 and day 2 than
Nup96+/+ T cells, indicating that Nup96 mutant cells proliferated
faster than wild-type cells (Figure 3B). Similar results were ob-
tained when T cells from the spleen, mesenteric lymph nodes
(MLN), and peripheral lymph nodes (PLN) of Nup96+/+ and
Nup96+/� mice were induced to proliferate with anti-CD3 and
anti-CD28 antibodies for 72 hr, and their proliferation was mea-
sured by thymidine incorporation. Lastly, we examined growth
rates of bone marrow-derived macrophages (BMDM) from
Nup96+/+ and Nup96+/�mice. An equal number of cells was incu-
bated with IL-3 conditioned and MEF-conditioned medium. The
number of BMDM cells was then calculated after 48 hr by mea-
suring the activity of the mitochondrial reductase enzymes, which
correlates to cell number. Proliferation of BMDM was slightly
enhanced in Nup96+/� cells as compared to Nup96+/+ cells
(Figure 3B). Cell cycle acceleration was, notably, more prominent
in T cells than in macrophages, especially in the case of T cells
obtained from mesenteric lymph nodes (Figure 3B; Faria et al.,
2006).
Nup96 Levels Regulate Expression of Key Cell CycleRegulatorsOne explanation for the observed effect on cell proliferation
might be that inappropriate levels of Nup96 in G1 may interfere
with certain key aspects of gene expression related to cell cycle
progression. Thus, mRNA abundance, nucleocytoplasmic distri-
bution of mRNAs, and protein expression of key cell cycle reg-
ulators were assessed in G1. To test for such effects using
a physiological model, we obtained resting T cells (G0) from
the spleens of Nup96+/+ or Nup96+/� mice. These cells were
then stimulated for 2 hr with anti-CD3 and anti-CD28 antibodies
to enter G1. As expected, both Nup96+/+ and Nup96+/� T cells
similarly transitioned into G1 after 2 hr stimulation, as demon-
strated by the comparable fold-induction of IkBa mRNA levels
in both cell types (Figure 4A). Increase in IkBa mRNA levels
evier Inc.
Developmental Cell
Nucleoporin Levels Regulate Cell Cycle Progression
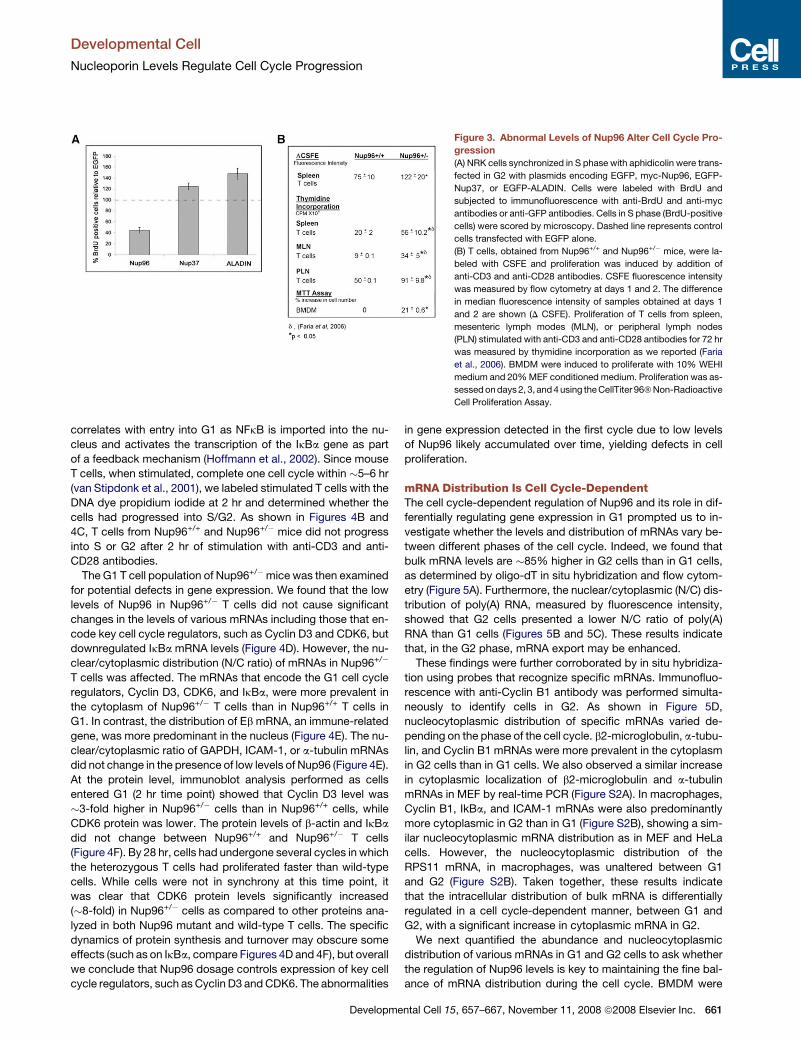
Figure 3. Abnormal Levels of Nup96 Alter Cell Cycle Pro-
gression
(A) NRK cells synchronized in S phase with aphidicolin were trans-
fected in G2 with plasmids encoding EGFP, myc-Nup96, EGFP-
Nup37, or EGFP-ALADIN. Cells were labeled with BrdU and
subjected to immunofluorescence with anti-BrdU and anti-myc
antibodies or anti-GFP antibodies. Cells in S phase (BrdU-positive
cells) were scored by microscopy. Dashed line represents control
cells transfected with EGFP alone.
(B) T cells, obtained from Nup96+/+ and Nup96+/� mice, were la-
beled with CSFE and proliferation was induced by addition of
anti-CD3 and anti-CD28 antibodies. CSFE fluorescence intensity
was measured by flow cytometry at days 1 and 2. The difference
in median fluorescence intensity of samples obtained at days 1
and 2 are shown (D CSFE). Proliferation of T cells from spleen,
mesenteric lymph modes (MLN), or peripheral lymph nodes
(PLN) stimulated with anti-CD3 and anti-CD28 antibodies for 72 hr
was measured by thymidine incorporation as we reported (Faria
et al., 2006). BMDM were induced to proliferate with 10% WEHI
medium and 20% MEF conditioned medium. Proliferation was as-
sessed on days 2, 3, and 4 using the CellTiter 96� Non-Radioactive
Cell Proliferation Assay.
correlates with entry into G1 as NFkB is imported into the nu-
cleus and activates the transcription of the IkBa gene as part
of a feedback mechanism (Hoffmann et al., 2002). Since mouse
T cells, when stimulated, complete one cell cycle within �5–6 hr
(van Stipdonk et al., 2001), we labeled stimulated T cells with the
DNA dye propidium iodide at 2 hr and determined whether the
cells had progressed into S/G2. As shown in Figures 4B and
4C, T cells from Nup96+/+ and Nup96+/� mice did not progress
into S or G2 after 2 hr of stimulation with anti-CD3 and anti-
CD28 antibodies.
The G1 T cell population of Nup96+/�mice was then examined
for potential defects in gene expression. We found that the low
levels of Nup96 in Nup96+/� T cells did not cause significant
changes in the levels of various mRNAs including those that en-
code key cell cycle regulators, such as Cyclin D3 and CDK6, but
downregulated IkBa mRNA levels (Figure 4D). However, the nu-
clear/cytoplasmic distribution (N/C ratio) of mRNAs in Nup96+/�
T cells was affected. The mRNAs that encode the G1 cell cycle
regulators, Cyclin D3, CDK6, and IkBa, were more prevalent in
the cytoplasm of Nup96+/� T cells than in Nup96+/+ T cells in
G1. In contrast, the distribution of Eb mRNA, an immune-related
gene, was more predominant in the nucleus (Figure 4E). The nu-
clear/cytoplasmic ratio of GAPDH, ICAM-1, or a-tubulin mRNAs
did not change in the presence of low levels of Nup96 (Figure 4E).
At the protein level, immunoblot analysis performed as cells
entered G1 (2 hr time point) showed that Cyclin D3 level was
�3-fold higher in Nup96+/� cells than in Nup96+/+ cells, while
CDK6 protein was lower. The protein levels of b-actin and IkBa
did not change between Nup96+/+ and Nup96+/� T cells
(Figure 4F). By 28 hr, cells had undergone several cycles in which
the heterozygous T cells had proliferated faster than wild-type
cells. While cells were not in synchrony at this time point, it
was clear that CDK6 protein levels significantly increased
(�8-fold) in Nup96+/� cells as compared to other proteins ana-
lyzed in both Nup96 mutant and wild-type T cells. The specific
dynamics of protein synthesis and turnover may obscure some
effects (such as on IkBa, compare Figures 4D and 4F), but overall
we conclude that Nup96 dosage controls expression of key cell
cycle regulators, such as Cyclin D3 and CDK6. The abnormalities
Developme
in gene expression detected in the first cycle due to low levels
of Nup96 likely accumulated over time, yielding defects in cell
proliferation.
mRNA Distribution Is Cell Cycle-DependentThe cell cycle-dependent regulation of Nup96 and its role in dif-
ferentially regulating gene expression in G1 prompted us to in-
vestigate whether the levels and distribution of mRNAs vary be-
tween different phases of the cell cycle. Indeed, we found that
bulk mRNA levels are �85% higher in G2 cells than in G1 cells,
as determined by oligo-dT in situ hybridization and flow cytom-
etry (Figure 5A). Furthermore, the nuclear/cytoplasmic (N/C) dis-
tribution of poly(A) RNA, measured by fluorescence intensity,
showed that G2 cells presented a lower N/C ratio of poly(A)
RNA than G1 cells (Figures 5B and 5C). These results indicate
that, in the G2 phase, mRNA export may be enhanced.
These findings were further corroborated by in situ hybridiza-
tion using probes that recognize specific mRNAs. Immunofluo-
rescence with anti-Cyclin B1 antibody was performed simulta-
neously to identify cells in G2. As shown in Figure 5D,
nucleocytoplasmic distribution of specific mRNAs varied de-
pending on the phase of the cell cycle. b2-microglobulin, a-tubu-
lin, and Cyclin B1 mRNAs were more prevalent in the cytoplasm
in G2 cells than in G1 cells. We also observed a similar increase
in cytoplasmic localization of b2-microglobulin and a-tubulin
mRNAs in MEF by real-time PCR (Figure S2A). In macrophages,
Cyclin B1, IkBa, and ICAM-1 mRNAs were also predominantly
more cytoplasmic in G2 than in G1 (Figure S2B), showing a sim-
ilar nucleocytoplasmic mRNA distribution as in MEF and HeLa
cells. However, the nucleocytoplasmic distribution of the
RPS11 mRNA, in macrophages, was unaltered between G1
and G2 (Figure S2B). Taken together, these results indicate
that the intracellular distribution of bulk mRNA is differentially
regulated in a cell cycle-dependent manner, between G1 and
G2, with a significant increase in cytoplasmic mRNA in G2.
We next quantified the abundance and nucleocytoplasmic
distribution of various mRNAs in G1 and G2 cells to ask whether
the regulation of Nup96 levels is key to maintaining the fine bal-
ance of mRNA distribution during the cell cycle. BMDM were
ntal Cell 15, 657–667, November 11, 2008 ª2008 Elsevier Inc. 661
Developmental Cell
Nucleoporin Levels Regulate Cell Cycle Progression
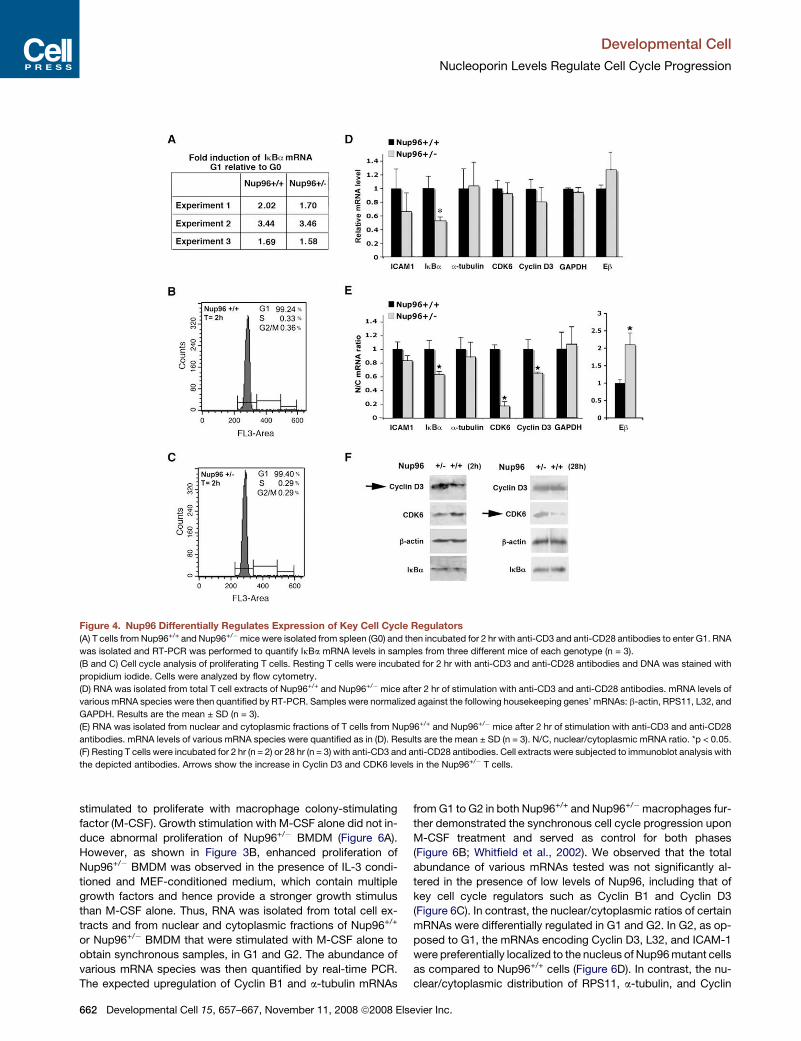
Figure 4. Nup96 Differentially Regulates Expression of Key Cell Cycle Regulators
(A) T cells from Nup96+/+ and Nup96+/�mice were isolated from spleen (G0) and then incubated for 2 hr with anti-CD3 and anti-CD28 antibodies to enter G1. RNA
was isolated and RT-PCR was performed to quantify IkBa mRNA levels in samples from three different mice of each genotype (n = 3).
(B and C) Cell cycle analysis of proliferating T cells. Resting T cells were incubated for 2 hr with anti-CD3 and anti-CD28 antibodies and DNA was stained with
propidium iodide. Cells were analyzed by flow cytometry.
(D) RNA was isolated from total T cell extracts of Nup96+/+ and Nup96+/�mice after 2 hr of stimulation with anti-CD3 and anti-CD28 antibodies. mRNA levels of
various mRNA species were then quantified by RT-PCR. Samples were normalized against the following housekeeping genes’ mRNAs: b-actin, RPS11, L32, and
GAPDH. Results are the mean ± SD (n = 3).
(E) RNA was isolated from nuclear and cytoplasmic fractions of T cells from Nup96+/+ and Nup96+/� mice after 2 hr of stimulation with anti-CD3 and anti-CD28
antibodies. mRNA levels of various mRNA species were quantified as in (D). Results are the mean ± SD (n = 3). N/C, nuclear/cytoplasmic mRNA ratio. *p < 0.05.
(F) Resting T cells were incubated for 2 hr (n = 2) or 28 hr (n = 3) with anti-CD3 and anti-CD28 antibodies. Cell extracts were subjected to immunoblot analysis with
the depicted antibodies. Arrows show the increase in Cyclin D3 and CDK6 levels in the Nup96+/� T cells.
stimulated to proliferate with macrophage colony-stimulating
factor (M-CSF). Growth stimulation with M-CSF alone did not in-
duce abnormal proliferation of Nup96+/� BMDM (Figure 6A).
However, as shown in Figure 3B, enhanced proliferation of
Nup96+/� BMDM was observed in the presence of IL-3 condi-
tioned and MEF-conditioned medium, which contain multiple
growth factors and hence provide a stronger growth stimulus
than M-CSF alone. Thus, RNA was isolated from total cell ex-
tracts and from nuclear and cytoplasmic fractions of Nup96+/+
or Nup96+/� BMDM that were stimulated with M-CSF alone to
obtain synchronous samples, in G1 and G2. The abundance of
various mRNA species was then quantified by real-time PCR.
The expected upregulation of Cyclin B1 and a-tubulin mRNAs
662 Developmental Cell 15, 657–667, November 11, 2008 ª2008 Els
from G1 to G2 in both Nup96+/+ and Nup96+/�macrophages fur-
ther demonstrated the synchronous cell cycle progression upon
M-CSF treatment and served as control for both phases
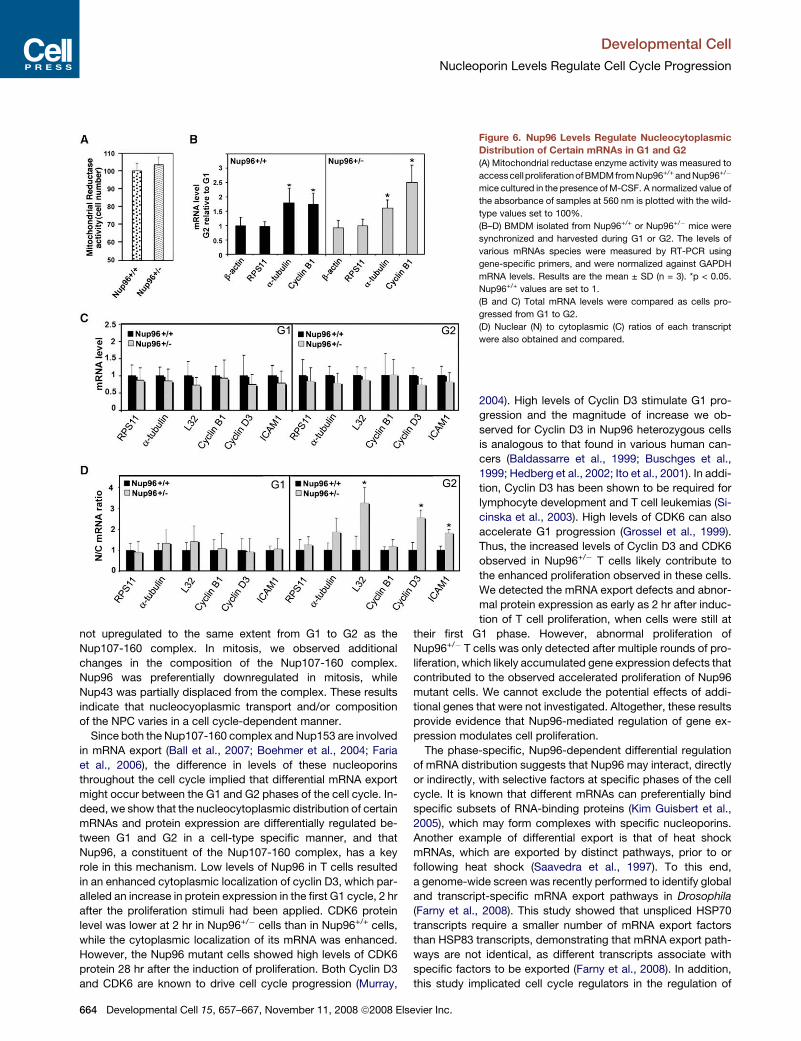
(Figure 6B; Whitfield et al., 2002). We observed that the total
abundance of various mRNAs tested was not significantly al-
tered in the presence of low levels of Nup96, including that of
key cell cycle regulators such as Cyclin B1 and Cyclin D3
(Figure 6C). In contrast, the nuclear/cytoplasmic ratios of certain
mRNAs were differentially regulated in G1 and G2. In G2, as op-
posed to G1, the mRNAs encoding Cyclin D3, L32, and ICAM-1
were preferentially localized to the nucleus of Nup96 mutant cells
as compared to Nup96+/+ cells (Figure 6D). In contrast, the nu-
clear/cytoplasmic distribution of RPS11, a-tubulin, and Cyclin
evier Inc.
Developmental Cell
Nucleoporin Levels Regulate Cell Cycle Progression
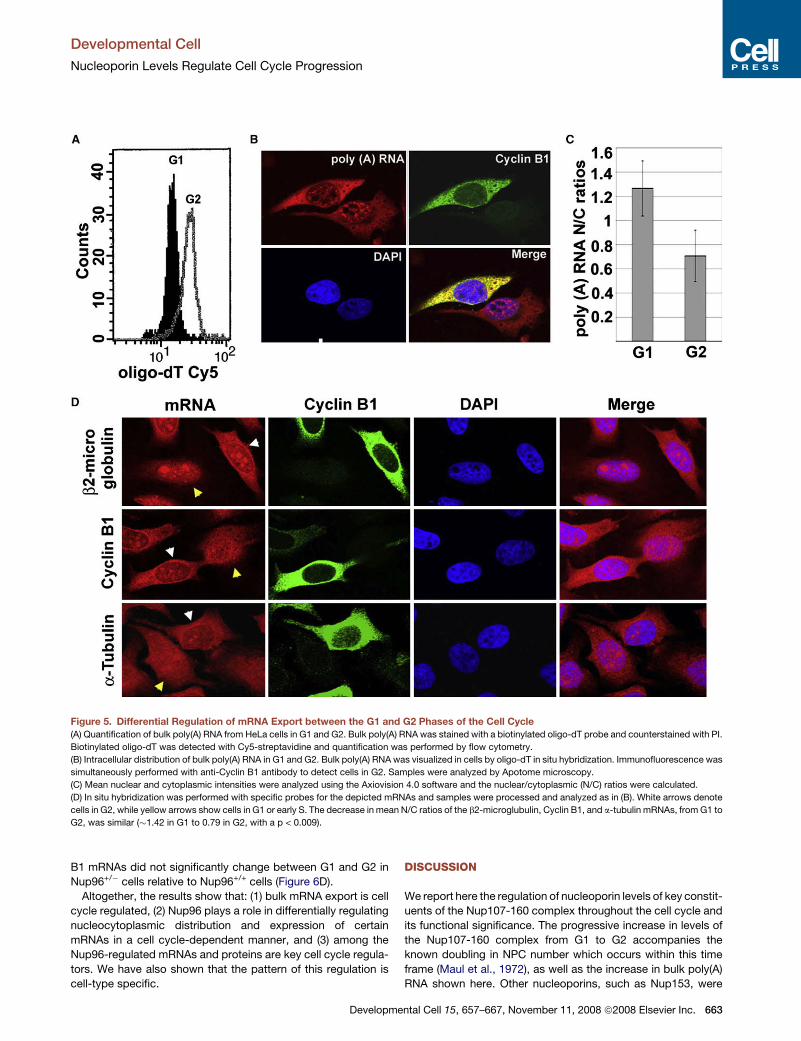
Figure 5. Differential Regulation of mRNA Export between the G1 and G2 Phases of the Cell Cycle
(A) Quantification of bulk poly(A) RNA from HeLa cells in G1 and G2. Bulk poly(A) RNA was stained with a biotinylated oligo-dT probe and counterstained with PI.
Biotinylated oligo-dT was detected with Cy5-streptavidine and quantification was performed by flow cytometry.
(B) Intracellular distribution of bulk poly(A) RNA in G1 and G2. Bulk poly(A) RNA was visualized in cells by oligo-dT in situ hybridization. Immunofluorescence was
simultaneously performed with anti-Cyclin B1 antibody to detect cells in G2. Samples were analyzed by Apotome microscopy.
(C) Mean nuclear and cytoplasmic intensities were analyzed using the Axiovision 4.0 software and the nuclear/cytoplasmic (N/C) ratios were calculated.
(D) In situ hybridization was performed with specific probes for the depicted mRNAs and samples were processed and analyzed as in (B). White arrows denote
cells in G2, while yellow arrows show cells in G1 or early S. The decrease in mean N/C ratios of the b2-microglubulin, Cyclin B1, and a-tubulin mRNAs, from G1 to
G2, was similar (�1.42 in G1 to 0.79 in G2, with a p < 0.009).
B1 mRNAs did not significantly change between G1 and G2 in
Nup96+/� cells relative to Nup96+/+ cells (Figure 6D).
Altogether, the results show that: (1) bulk mRNA export is cell
cycle regulated, (2) Nup96 plays a role in differentially regulating
nucleocytoplasmic distribution and expression of certain
mRNAs in a cell cycle-dependent manner, and (3) among the
Nup96-regulated mRNAs and proteins are key cell cycle regula-
tors. We have also shown that the pattern of this regulation is
cell-type specific.
Developm
DISCUSSION
We report here the regulation of nucleoporin levels of key constit-
uents of the Nup107-160 complex throughout the cell cycle and
its functional significance. The progressive increase in levels of
the Nup107-160 complex from G1 to G2 accompanies the
known doubling in NPC number which occurs within this time
frame (Maul et al., 1972), as well as the increase in bulk poly(A)
RNA shown here. Other nucleoporins, such as Nup153, were
ental Cell 15, 657–667, November 11, 2008 ª2008 Elsevier Inc. 663
Developmental Cell
Nucleoporin Levels Regulate Cell Cycle Progression
not upregulated to the same extent from G1 to G2 as the
Nup107-160 complex. In mitosis, we observed additional
changes in the composition of the Nup107-160 complex.
Nup96 was preferentially downregulated in mitosis, while
Nup43 was partially displaced from the complex. These results
indicate that nucleocyoplasmic transport and/or composition
of the NPC varies in a cell cycle-dependent manner.
Since both the Nup107-160 complex and Nup153 are involved
in mRNA export (Ball et al., 2007; Boehmer et al., 2004; Faria
et al., 2006), the difference in levels of these nucleoporins
throughout the cell cycle implied that differential mRNA export
might occur between the G1 and G2 phases of the cell cycle. In-
deed, we show that the nucleocytoplasmic distribution of certain
mRNAs and protein expression are differentially regulated be-
tween G1 and G2 in a cell-type specific manner, and that
Nup96, a constituent of the Nup107-160 complex, has a key
role in this mechanism. Low levels of Nup96 in T cells resulted
in an enhanced cytoplasmic localization of cyclin D3, which par-
alleled an increase in protein expression in the first G1 cycle, 2 hr
after the proliferation stimuli had been applied. CDK6 protein
level was lower at 2 hr in Nup96+/� cells than in Nup96+/+ cells,
while the cytoplasmic localization of its mRNA was enhanced.
However, the Nup96 mutant cells showed high levels of CDK6
protein 28 hr after the induction of proliferation. Both Cyclin D3
and CDK6 are known to drive cell cycle progression (Murray,
Figure 6. Nup96 Levels Regulate Nucleocytoplasmic
Distribution of Certain mRNAs in G1 and G2
(A) Mitochondrial reductase enzyme activity was measured to
access cell proliferation of BMDM from Nup96+/+ and Nup96+/�
mice cultured in the presence of M-CSF. A normalized value of
the absorbance of samples at 560 nm is plotted with the wild-
type values set to 100%.
(B–D) BMDM isolated from Nup96+/+ or Nup96+/� mice were
synchronized and harvested during G1 or G2. The levels of
various mRNAs species were measured by RT-PCR using
gene-specific primers, and were normalized against GAPDH
mRNA levels. Results are the mean ± SD (n = 3). *p < 0.05.
Nup96+/+ values are set to 1.
(B and C) Total mRNA levels were compared as cells pro-
gressed from G1 to G2.
(D) Nuclear (N) to cytoplasmic (C) ratios of each transcript
were also obtained and compared.
2004). High levels of Cyclin D3 stimulate G1 pro-
gression and the magnitude of increase we ob-
served for Cyclin D3 in Nup96 heterozygous cells
is analogous to that found in various human can-
cers (Baldassarre et al., 1999; Buschges et al.,
1999; Hedberg et al., 2002; Ito et al., 2001). In addi-
tion, Cyclin D3 has been shown to be required for
lymphocyte development and T cell leukemias (Si-
cinska et al., 2003). High levels of CDK6 can also
accelerate G1 progression (Grossel et al., 1999).
Thus, the increased levels of Cyclin D3 and CDK6
observed in Nup96+/� T cells likely contribute to
the enhanced proliferation observed in these cells.
We detected the mRNA export defects and abnor-
mal protein expression as early as 2 hr after induc-
tion of T cell proliferation, when cells were still at
their first G1 phase. However, abnormal proliferation of
Nup96+/� T cells was only detected after multiple rounds of pro-
liferation, which likely accumulated gene expression defects that
contributed to the observed accelerated proliferation of Nup96
mutant cells. We cannot exclude the potential effects of addi-
tional genes that were not investigated. Altogether, these results
provide evidence that Nup96-mediated regulation of gene ex-
pression modulates cell proliferation.
The phase-specific, Nup96-dependent differential regulation
of mRNA distribution suggests that Nup96 may interact, directly
or indirectly, with selective factors at specific phases of the cell
cycle. It is known that different mRNAs can preferentially bind
specific subsets of RNA-binding proteins (Kim Guisbert et al.,
2005), which may form complexes with specific nucleoporins.
Another example of differential export is that of heat shock
mRNAs, which are exported by distinct pathways, prior to or
following heat shock (Saavedra et al., 1997). To this end,
a genome-wide screen was recently performed to identify global
and transcript-specific mRNA export pathways in Drosophila
(Farny et al., 2008). This study showed that unspliced HSP70
transcripts require a smaller number of mRNA export factors
than HSP83 transcripts, demonstrating that mRNA export path-
ways are not identical, as different transcripts associate with
specific factors to be exported (Farny et al., 2008). In addition,
this study implicated cell cycle regulators in the regulation of
664 Developmental Cell 15, 657–667, November 11, 2008 ª2008 Elsevier Inc.
Developmental Cell
Nucleoporin Levels Regulate Cell Cycle Progression
mRNA export. For example, the cyclin-dependent kinase CDK11
was identified as an export factor (Farny et al., 2008) that could
potentially regulate the interaction of SR proteins and the
mRNA export receptor NXF1 (Hu et al., 2003; Huang et al.,
2004). Altogether, these observations point to mechanisms of
differential mRNA export.
Nup96 is translated as a Nup98-Nup96 protein precursor con-
taining two nucleoporins (Fontoura et al., 1999), which, by auto-
proteolysis, yield Nup98 and Nup96 (Rosenblum and Blobel,
1999). Interestingly, the importance of properly regulating the
nup98-nup96 gene is emphasized by the fact that this gene is
a target of chromosomal translocations involved in different
types of leukemias (Nakamura, 2005). These translocations re-
sult in the expression of fusion proteins constituted of the
amino-terminal FG repeat region of Nup98 and, variously, the
homeodomain transcription factors (Kalverda and Fornerod,
2007). These aberrant proteins transactivate or transrepress tar-
get genes, resulting in abnormal gene expression. The fact that
the nup98-nup96 gene is a major target in these leukemias raises
the issue that Nup96, which is encoded by the same gene (Fon-
toura et al., 1999), would also be affected during such transloca-
tions. One possibility is that the chromosomal translocations
would result in deletion of Nup96 expression in one allele. These
cells would likely then express low levels of Nup96. To this end,
we show here that low levels of Nup96 enhance cell proliferation.
Indeed, abnormal levels of nucleoporins have been reported in
many tumors (http://www.oncomine.org/main/index.jsp). More-
over, we have previously shown that Nup96 is upregulated by in-
terferon (Enninga et al., 2002), which is a cytokine known to have
antigrowth properties (Gimeno et al., 2005). Since we show here
that high levels of Nup96 delay cell cycle progression, it is pos-
sible that induction of Nup96 by interferon contributes to the anti-
proliferative effects of this cytokine. Altogether, these findings
underscore the importance of the nup98-nup96 gene in regulat-
ing cell cycle progression. The cell cycle-dependent mRNA dis-
tribution and protein expression revealed here add another layer
of complexity to the mechanisms controlling cell cycle progres-
sion, which are dependent on nucleoporin levels.
EXPERIMENTAL PROCEDURES
Plasmid Construction
Wild-type Nup96 was cloned into myc-pAlter-MAX based on the Nup96 se-
quence that matches 100% of the human genome sequence (accession
AF231130.1), since our original sequence matched 99.7% (accession
AF071076). FLAG-Nup96 was generated by PCR and subcloned into the
SalI/HindIII sites of pRev TRE (BD Biosciences, San Jose, CA) to generate a tet-
racycline responsive expression construct. pET28A vectors encoding wild-
type UbcH10 and UbcH10:C114-S were provided by R. Basavappa.
UbcH10 and UbcH10:C114-S were subcloned into the Sal/Not sites of myc-
pAlter-MAX. Ubiquitin (pcDNA3-HA-Ubiquitin) was provided by Z. Nawaz.
EGFP-ALADIN was kindly provided by M.J. Matunis.
Cell Culture, Transfections, and Cell Synchronization
293T, HeLa, and NRK cells were grown in DMEM supplemented with 10% FBS
and 1% antibiotic-antimycotic (GIBCO, Carlsbad, CA). Transfections were
performed with Lipofectamine 2000 (Invitrogen, Carlsbad, CA). HeLa Tet-On
cell lines (BD Biosciences) were stably transfected with FLAG-Nup96 and con-
trol vector (p-Rev TRE), and maintained in 90% DMEM, 10% FBS (Tet-system
approved), 100 mg/ml G418, 1% antibiotic antimycotic, and 300 mg/ml hy-
gromycin B. Cells were induced with 2 mg/ml Doxycyclin for 48 hr. MEF
were cultured as described (Jeganathan et al., 2005).
Developme
HeLa cell synchronization at the G1/S border was performed with 2 mM thy-
midine for 15 hr, followed by a 9 hr release in fresh medium, and a second in-
cubation with 2 mM thymidine for 15 hr. Cells in S, early G2, and late G2 phases
were collected 4 hr, 7 hr, and 10 hr after release. Mitotic cells were harvested
by shake-off in the absence or presence of nocodazole (100 ng/ml), or Taxol
(100 nM), or Colcimid (1 mg/ml), 10 hr after the G1/S release. Cells in G2
were collected by harvesting the adherent cells that remained after shaking
off mitotic cells. Cells in mid G1 were obtained by culturing mitotic cells in fresh
medium for 6 hr. Only adherent cells were collected. Mitotic 293T wells were
obtained after treatment with nocodazole (100 ng/ml) for 16 hr. Two millimolar
thymidine was added for a period of 16 hr to obtain cells in the G1/S boundary.
MEF were synchronized as described (Jeganathan et al., 2005). Measurement
of DNA content by flow cytometry was performed to confirm the phases of the
cell cycle. For experiments performed with lactacystin, cells were synchro-
nized as above and 10 mM lactacystin was added 3 hr prior to harvesting mi-
totic cells.
NRK cells were synchronized in S phase with aphidicolin (2.5 ng/ml) for
14 hr. Cells were released and transfected in G2 (5 hr postrelease) with plas-
mids encoding EGFP alone, myc-Nup96, EGFP-Nup37, or EGFP-ALADIN.
Fifty micromolar BrdU was added 11 hr postrelease.
Resting T cells (G0) were selected from spleens, as we described (Faria
et al., 2006), using the Dynal Mouse T cell Negative Isolation kit (Invitrogen).
T cells were stimulated with 5 ug/ml of anti-CD3 and anti-CD28 antibodies.
Two hours poststimulation, T cells were collected in G1 phase. BMDM from
6–8 week old mice were obtained from femur, tibia, and fibula. Cells were
then plated at a concentration of 1 million cells/ ml of RPMI containing 15%
heat-inactivated FBS and antibiotics. After 24 hr, nonadherent cells were incu-
bated in RPMI containing 4 ng/ml of recombinant mouse macrophage colony
stimulating factor (M-CSF) (R&D Systems, Minneapolis, MN). Macrophages
were synchronized in G1 in the absence of M-CSF for 18 hr. M-CSF was added
back and cells were collected after 16 hr to obtain samples in G2.
Immunoprecipitations and Immunoblots
Immunoprecipitations and immunoblots were performed as described (Faria
et al., 2005). The following antibodies were used: Nup107 antibodies were
generated against Nup107 (aa 140–699) and were affinity purified; Sec13 an-
tibodies were generated as we described (Enninga et al., 2003); Nup85,
Nup37, Nup43, Nup160, Nup153, and Nup62 antibodies were generated as
described (Orjalo et al., 2006). hnRNP A1 (a gift from M. Matunis); Cyclin A, Cy-
clin D3, and Cyclin B1 (Transduction Laboratories, Franklin Lakes, NJ); anti-
CD3 and anti-CD28 antibodies (BD Pharmigen, San Diego, CA); anti-actin
and anti-FLAG M2 (Sigma, St. Louis, MO); anti-BrdU (BD Biosciences); anti-
GFP (Pelletier et al., 2002); anti-myc monoclonal antibody (Roche); anti-myc
polyclonal antibody (Santa Cruz Biotechnology, Santa Cruz, CA); anti-HA
12CA5 (Roche, Palo Alto, CA); anti-CDK6 (Santa Cruz Biotechnology); IkBa
(Abcam, Cambridge, MA). Immunoblots were quantified using the ImageJ pro-
gram. Sucrose gradient sedimentation was performed as described (Loiodice
et al., 2004).
BrdU Staining, Immunofluorescence, and Microscopy
For BrdU staining, cells were washed, fixed with 4% formaldehyde (EM grade-
Polysciences, Warrington, PA) for 30 min, and permeabilized with acetone at
�20�C for 5 min. Cells were washed in PBS, permeabilized with 2N HCl for
10 min, blocked with PBS/1% BSA/0.1% TWEEN-20 for 5 min, and incubated
with anti-myc antibodies (to detect Nup96) or anti-GFP antibodies (to amplify
the GFP signal), and anti-BrdU antibody for 25 min at 37�C. Cells were incu-
bated with secondary antibodies, washed, and DAPI was added. Samples
were analyzed by Apotome microscopy in a Zeiss Axiovert 200M (Thornwood,
NY). Live cell imaging was performed as previously described (Jeganathan
et al., 2005).
In Situ Hybridization and Flow Cytometry
For the in situ hybridization procedures, HeLa cells were washed, fixed in form-
aldehyde for 10 min, and permeabilized in 70% ethanol overnight, at �20�C.
Cells were then treated with 10% DEPC in ethanol for 1 hr, centrifuged at
12,000 3 g for 20 s, and then resuspended in 0.5% Tween in PBS. Cells
were subjected to oligo-dT in situ hybridization as described (Chakraborty
ntal Cell 15, 657–667, November 11, 2008 ª2008 Elsevier Inc. 665
Developmental Cell
Nucleoporin Levels Regulate Cell Cycle Progression
et al., 2006), washed, stained with propidium iodide, and subjected to flow
cytometry.
Oligo-dT in situ hybridization or in situ hybridization performed with specific
probes were carried out as we described (Chakraborty et al., 2006). Samples
were analyzed by Apotome microscopy. Quantification of image intensities
was performed using the Axiovision 4.0 image analysis software.
For flow cytometry procedures, T cells were washed in PBS and fixed with
ice cold 70% ethanol for 18 hr at 4�C. Cells were then stained with a mixture of
PI/RNase solution in PBS and resuspended at 1 million cells per ml for FACS
analysis. Cells at different phases of the cell cycle were analyzed using the Cell
Quest software.
T Cell and Macrophage Proliferation Assays
T cells were obtained from spleens of Nup96+/+ and Nup96+/� mice and la-
beled with 5 mM CSFE (Molecular Probes, Carlsbad, CA) in RPMI for 15 min
at 37�C. Cells were washed with RPMI containing 2% FBS and plated in
RPMI containing 10% FBS. T cell proliferation was induced by anti-CD3 and
anti-CD28 antibodies at 5 mg/ml. Samples were collected at 0, 24, and
48 hr. CSFE intensity was analyzed by flow cytometry.
BMDM were maintained in culture for 7 d. M-CSF containing medium was
replenished at day 3 and day 7 of culture. Experiments were then performed
between day 8 and day 12. The macrophage proliferation assay was carried
out with �30,000 cells per well in RPMI medium containing 4 ng/ml M-CSF
alone or 10% WEHI medium (IL-3 conditioned) and 20% MEF-conditioned me-
dium (R&D Systems). Proliferation was assessed on days 2, 3, and 4, using the
CellTiter 96� Non-Radioactive Cell Proliferation Assay kit (Promega, Madison,
WI).
Cell Fractionation and Real-Time PCR Analysis
Cell fractionation, RNA isolation, and RT-PCR were performed as described
(Wang et al., 2006).
SUPPLEMENTAL DATA
Supplemental Data include two figures and can be with this article online at
http://www.developmentalcell.com/cgi/content/full/15/5/657/DC1/.
ACKNOWLEDGMENTS
We thank A. Levay, D.R. Nussenzveig, and K. Jeganathan for assistance. We
thank R. Basavappa, Z. Nawaz, and M. Matunis for reagents. This work was
supported by NIH R01AI28900 and U54AI5715801 to D.E.L., and R01
GM07159-01 to B.M.A.F.
Received: September 16, 2007
Revised: July 13, 2008
Accepted: August 28, 2008
Published: November 10, 2008
REFERENCES
Aitchison, J.D., Blobel, G., and Rout, M.P. (1995). Nup120p: a yeast nucleo-
porin required for NPC distribution and mRNA transport. J. Cell Biol. 131,
1659–1675.
Baldassarre, G., Belletti, B., Bruni, P., Boccia, A., Trapasso, F., Pentimalli, F.,
Barone, M.V., Chiappetta, G., Vento, M.T., Spiezia, S., et al. (1999). Overex-
pressed cyclin D3 contributes to retaining the growth inhibitor p27 in the cyto-
plasm of thyroid tumor cells. J. Clin. Invest. 104, 865–874.
Ball, J.R., Dimaano, C., Bilak, A., Kurchan, E., Zundel, M.T., and Ullman, K.S.
(2007). Sequence preference in RNA recognition by the nucleoporin Nup153.
J. Biol. Chem. 282, 8734–8740.
Belgareh, N., Rabut, G., Bai, S.W., van Overbeek, M., Beaudouin, J., Daigle,
N., Zatsepina, O.V., Pasteau, F., Labas, V., Fromont-Racine, M., et al.
(2001). An evolutionary conserved NPC subcomplex, which redistributes in
part to kinetochores in mammalian cells. J. Cell Biol. 154, 1147–1160.
Boehmer, T., Enninga, J., Dales, S., Blobel, G., and Zhong, H. (2003). Depletion
of a single nucleoporin, Nup107, prevents the assembly of a subset of nucle-
666 Developmental Cell 15, 657–667, November 11, 2008 ª2008 Els
oporins into the nuclear pore complex. Proc. Natl. Acad. Sci. USA 100,
981–985.
Boehmer, T., Blobel, G., and Glavy, J.S. (2004). Members of the Nup107–160
subcomplex are phosphorylated in mitosis. ASCB 44th Annual Meeting
Abstract 1807, 472a.
Buschges, R., Weber, R.G., Actor, B., Lichter, P., Collins, V.P., and Reifen-
berger, G. (1999). Amplification and expression of cyclin D genes (CCND1,
CCND2 and CCND3) in human malignant gliomas. Brain Pathol. 9, 435–442.
Chakraborty, P., Satterly, N., and Fontoura, B.M. (2006). Nuclear export as-
says for poly(A) RNAs. Methods 39, 363–369.
D’Angelo, M.A., Anderson, D.J., Richard, E., and Hetzer, M.W. (2006). Nuclear
pores form de novo from both sides of the nuclear envelope. Science 312,
440–443.
Dockendorff, T.C., Heath, C.V., Goldstein, A.L., Snay, C.A., and Cole, C.N.
(1997). C-terminal truncations of the yeast nucleoporin Nup145p produce
a rapid temperature-conditional mRNA export defect and alterations to nu-
clear structure. Mol. Cell. Biol. 17, 906–920.
Emtage, J.L., Bucci, M., Watkins, J.L., and Wente, S.R. (1997). Defining the
essential functional regions of the nucleoporin Nup145p. J. Cell Sci. 110,
911–925.
Enninga, J., Levy, D.E., Blobel, G., and Fontoura, B.M. (2002). Role of nucleo-
porin induction in releasing an mRNA nuclear export block. Science 295,
1523–1525.
Enninga, J., Levay, A., and Fontoura, B.M. (2003). Sec13 shuttles between the
nucleus and the cytoplasm and stably interacts with Nup96 at the nuclear pore
complex. Mol. Cell. Biol. 23, 7271–7284.
Faria, P.A., Chakraborty, P., Levay, A., Barber, G.N., Ezelle, H.J., Enninga, J.,
Arana, C., van Deursen, J., and Fontoura, B.M. (2005). VSV disrupts the Rae1/
mrnp41 mRNA nuclear export pathway. Mol. Cell 17, 93–102.
Faria, A.M., Levay, A., Wang, Y., Kamphorst, A.O., Rosa, M.L., Nussenzveig,
D.R., Balkan, W., Chook, Y.M., Levy, D.E., and Fontoura, B.M. (2006). The nu-
cleoporin Nup96 is required for proper expression of interferon-regulated pro-
teins and functions. Immunity 24, 295–304.
Farny, N.G., Hurt, J.A., and Silver, P.A. (2008). Definition of global and tran-
script-specific mRNA export pathways in metazoans. Genes Dev. 22, 66–78.
Fontoura, B.M., Blobel, G., and Matunis, M.J. (1999). A conserved biogenesis
pathway for nucleoporins: proteolytic processing of a 186-kilodalton precursor
generates nup98 and the novel nucleoporin, nup96. J. Cell Biol. 144,
1097–1112.
Franz, C., Walczak, R., Yavuz, S., Santarella, R., Gentzel, M., Askjaer, P., Galy,
V., Hetzer, M., Mattaj, I.W., and Antonin, W. (2007). MEL-28/ELYS is required
for the recruitment of nucleoporins to chromatin and postmitotic nuclear pore
complex assembly. EMBO Rep. 8, 165–172.
Gimeno, R., Lee, C.K., Schindler, C., and Levy, D.E. (2005). Stat1 and Stat2 but
not Stat3 arbitrate contradictory growth signals elicited by a/b interferon in
T lymphocytes. Mol. Cell. Biol. 25, 5456–5465.
Grossel, M.J., Baker, G.L., and Hinds, P.W. (1999). cdk6 can shorten G(1)
phase dependent upon the N-terminal INK4 interaction domain. J. Biol.
Chem. 274, 29960–29967.
Harel, A., and Forbes, D.J. (2004). Importin beta: conducting a much larger cel-
lular symphony. Mol. Cell 16, 319–330.
Harel, A., Orjalo, A.V., Vincent, T., Lachish-Zalait, A., Vasu, S., Shah, S.,
Zimmerman, E., Elbaum, M., and Forbes, D.J. (2003). Removal of a single
pore subcomplex results in vertebrate nuclei devoid of nuclear pores. Mol.
Cell 11, 853–864.
Hedberg, Y., Roos, G., Ljungberg, B., and Landberg, G. (2002). Cyclin D3 pro-
tein content in human renal cell carcinoma in relation to cyclin D1 and clinico-
pathological parameters. Acta Oncol. 41, 175–181.
Hoffmann, A., Levchenko, A., Scott, M.L., and Baltimore, D. (2002). The
IkB-NF-kB signaling module: temporal control and selective gene activation.
Science 298, 1241–1245.
Hu, D., Mayeda, A., Trembley, J.H., Lahti, J.M., and Kidd, V.J. (2003). CDK11
complexes promote pre-mRNA splicing. J. Biol. Chem. 278, 8623–8629.
evier Inc.
Developmental Cell
Nucleoporin Levels Regulate Cell Cycle Progression
Huang, Y., Yario, T.A., and Steitz, J.A. (2004). A molecular link between SR pro-
tein dephosphorylation and mRNA export. Proc. Natl. Acad. Sci. USA 101,
9666–9670.
Ito, Y., Takeda, T., Wakasa, K., Tsujimoto, M., and Matsuura, N. (2001). Ex-
pression and possible role of cyclin D3 in human pancreatic adenocarcinoma.
Anticancer Res. 21, 1043–1048.
Jeganathan, K.B., Malureanu, L., and van Deursen, J.M. (2005). The Rae1-
Nup98 complex prevents aneuploidy by inhibiting securin degradation. Nature
438, 1036–1039.
Kalverda, B., and Fornerod, M. (2007). The nuclear life of nucleoporins. Dev.
Cell 13, 164–165.
Kim Guisbert, K., Duncan, K., Li, H., and Guthrie, C. (2005). Functional speci-
ficity of shuttling hnRNPs revealed by genome-wide analysis of their RNA bind-
ing profiles. RNA 11, 383–393.
Loiodice, I., Alves, A., Rabut, G., Van Overbeek, M., Ellenberg, J., Sibarita,
J.B., and Doye, V. (2004). The entire Nup107–160 complex, including three
new members, is targeted as one entity to kinetochores in mitosis. Mol. Biol.
Cell 15, 3333–3344.
Makhnevych, T., Lusk, C.P., Anderson, A.M., Aitchison, J.D., and Wozniak,
R.W. (2003). Cell cycle regulated transport controlled by alterations in the nu-
clear pore complex. Cell 115, 813–823.
Maul, G.G., Maul, H.M., Scogna, J.E., Lieberman, M.W., Stein, G.S., Hsu, B.Y.,
and Borun, T.W. (1972). Time sequence of nuclear pore formation in phytohe-
magglutinin-stimulated lymphocytes and in HeLa cells during the cell cycle.
J. Cell Biol. 55, 433–447.
Maul, G.G., Deaven, L.L., Freed, J.J., Campbell, G.L., and Becak, W. (1980).
Investigation of the determinants of nuclear pore number. Cytogenet. Cell
Genet. 26, 175–190.
Murray, A.W. (2004). Recycling the cell cycle: cyclins revisited. Cell 116,
221–234.
Nakamura, T. (2005). NUP98 fusion in human leukemia: dysregulation of the
nuclear pore and homeodomain proteins. Int. J. Hematol. 82, 21–27.
Orjalo, A.V., Arnaoutov, A., Shen, Z., Boyarchuk, Y., Zeitlin, S.G., Fontoura, B.,
Briggs, S., Dasso, M., and Forbes, D.J. (2006). The Nup107–160 nucleoporin
complex is required for correct bipolar spindle assembly. Mol. Biol. Cell 17,
3806–3818.
Pelletier, L., Stern, C.A., Pypaert, M., Sheff, D., Ngo, H.M., Roper, N., He, C.Y.,
Hu, K., Toomre, D., Coppens, I., et al. (2002). Golgi biogenesis in Toxoplasma
gondii. Nature 418, 548–552.
Peters, J.M. (2002). The anaphase-promoting complex: proteolysis in mitosis
and beyond. Mol. Cell 9, 931–943.
Rasala, B.A., Orjalo, A.V., Shen, Z., Briggs, S., and Forbes, D.J. (2006). ELYS is
a dual nucleoporin/kinetochore protein required for nuclear pore assembly and
proper cell division. Proc. Natl. Acad. Sci. USA 103, 17801–17806.
Developm
Rosenblum, J.S., and Blobel, G. (1999). Autoproteolysis in nucleoporin bio-
genesis. Proc. Natl. Acad. Sci. USA 96, 11370–11375.
Saavedra, C.A., Hammell, C.M., Heath, C.V., and Cole, C.N. (1997). Yeast heat
shock mRNAs are exported through a distinct pathway defined by Rip1p.
Genes Dev. 11, 2845–2856.
Sicinska, E., Aifantis, I., Le Cam, L., Swat, W., Borowski, C., Yu, Q., Ferrando,
A.A., Levin, S.D., Geng, Y., von Boehmer, H., et al. (2003). Requirement for
cyclin D3 in lymphocyte development and T cell leukemias. Cancer Cell 4,
451–461.
Teixeira, M.T., Siniossoglou, S., Podtelejnikov, S., Benichou, J.C., Mann, M.,
Dujon, B., Hurt, E., and Fabre, E. (1997). Two functionally distinct domains
generated by in vivo cleavage of Nup145p: a novel biogenesis pathway for nu-
cleoporins. EMBO J. 16, 5086–5097.
Townsley, F.M., Aristarkhov, A., Beck, S., Hershko, A., and Ruderman, J.V.
(1997). Dominant-negative cyclin-selective ubiquitin carrier protein E2-C/
UbcH10 blocks cells in metaphase. Proc. Natl. Acad. Sci. USA 94, 2362–2367.
Tran, E.J., and Wente, S.R. (2006). Dynamic nuclear pore complexes: life on
the edge. Cell 125, 1041–1053.
van Stipdonk, M.J., Lemmens, E.E., and Schoenberger, S.P. (2001). Naive
CTLs require a single brief period of antigenic stimulation for clonal expansion
and differentiation. Nat. Immunol. 2, 423–429.
Vasu, S., Shah, S., Orjalo, A., Park, M., Fischer, W.H., and Forbes, D.J. (2001).
Novel vertebrate nucleoporins Nup133 and Nup160 play a role in mRNA ex-
port. J. Cell Biol. 155, 339–353.
Walther, T.C., Alves, A., Pickergill, H., Loiodice, I., Hetzer, M., Galy, V., Huls-
mann, B.B., Kocher, T., Wilm, M., Allen, T., et al. (2003). The conserved
Nup107–160 complex is critical for nuclear pore complex assembly. Cell
113, 195–206.
Wang, Y., Zhu, W., and Levy, D.E. (2006). Nuclear and cytoplasmic mRNA
quantification by SYBR green based real-time RT-PCR. Methods 39, 356–362.
Whitfield, M.L., Sherlock, G., Saldanha, A.J., Murray, J.I., Ball, C.A., Alexander,
K.E., Matese, J.C., Perou, C.M., Hurt, M.M., Brown, P.O., et al. (2002). Identi-
fication of genes periodically expressed in the human cell cycle and their ex-
pression in tumors. Mol. Biol. Cell 13, 1977–2000.
Winey, M., Yarar, D., Giddings, T.H., Jr., and Mastronarde, D.N. (1997). Nu-
clear pore complex number and distribution throughout the Saccharomyces
cerevisiae cell cycle by three-dimensional reconstruction from electron micro-
graphs of nuclear envelopes. Mol. Biol. Cell 8, 2119–2132.
Zuccolo, M., Alves, A., Galy, V., Bolhy, S., Formstecher, E., Racine, V., Sibarita,
J.B., Fukagawa, T., Shiekhattar, R., Yen, T., et al. (2007). The human Nup107–
160 nuclear pore subcomplex contributes to proper kinetochore functions.
EMBO J. 26, 1853–1864.
ental Cell 15, 657–667, November 11, 2008 ª2008 Elsevier Inc. 667