Nucleation and growth of new particles in the rural atmosphere of Northern Italy—relationship to...
13
Atmospheric Environment 39 (2005) 6734–6746 Nucleation and growth of new particles in the rural atmosphere of Northern Italy—relationship to air quality monitoring Sergio Rodrı´guez a,b, , Rita Van Dingenen a , Jean-Philippe Putaud a , Sebastiao Martins-Dos Santos a , Davide Roselli c a European Commission, Joint Research Centre, Institute for Environment and Sustainability, T.P. 290, 21020 Ispra (VA), Italy b Institute of Earth Sciences ‘‘Jaume Almera’’, CSIC, Barcelona, Spain c Forschungszentrum Ju¨lich GmbH, Germany Received 25 January 2005; received in revised form 30 June 2005; accepted 13 July 2005 Abstract This study investigates the relationship between aerosols number size distribution on the one hand, and air quality in terms of particulate matter (PM) mass concentrations (as usually monitored in the air quality networks) on the other hand. For this purpose, time series of trace gases levels, submicron aerosol size distributions, both recorded at a rural site in Northern Italy (ISPRA), and of trace gas levels and PM mass concentrations, recorded in the air quality network operating in this region, have been compared and interpreted. Because of the regional nature of the PM pollution events, the daily mean levels of the aerosol volume (V), surface area (S) and black carbon (BC) concentrations at ISPRA rural site are well correlated with the daily mean levels of PM mass concentrations recorded at the other air quality monitoring sites. At ISPRA, the submicron aerosol size distribution is strongly influenced by two main competing processes: nucleation of new particles and condensation of gas-phase components onto pre-existing particles (resulting in particles growth). These processes influence on the daily, seasonal and day-to-day variations of the submicron aerosol features. Because increasing aerosol S concentrations favour condensation and hinder nucleation (and vice versa) the ‘mean’ particle size D p N (mode of the dN/dlog D size distribution) increases with increasing PM concentrations (e.g. 45 nm for V ¼ 4 mm 3 cm 3 and 110 nm for V ¼ 45 mm 3 cm 3 ). Owing to this, time series of aerosol D p N and V , S, mass and BC concentrations are strongly anti-correlated with those of the smallest ultrafine particle number concentration (N, 5–10 and 10–20 nm). Nucleation episodes occur under the clean air conditions prompted by the North-Fo¨ehn meteorology. This anti-correlation between submicron aerosol mass and No20 nm concentrations (prompted by the low contribution of the ultrafine particles to the aerosol mass) has important implications for a proper air quality monitoring: the parameters classically used for the air quality assessing (e.g. PM2.5) are not suitable for monitoring of this ultrafine PM pollution and consequently a specific monitoring of the ultrafine PM number concentration should be performed. The significance of this specific ultrafine PM number concentration monitoring is ARTICLE IN PRESS www.elsevier.com/locate/atmosenv 1352-2310/$ - see front matter r 2005 Elsevier Ltd. All rights reserved. doi:10.1016/j.atmosenv.2005.07.036 Corresponding author. Current address: Izan˜ a Atmospheric Observatory, INM-CSIC, La Marina 20, 6a planta, 38071, Santa Cruz de Tenerife, Canary Islands Spain. E-mail address: [email protected] (S. Rodrı´guez).
-
Upload
universidadacooperativadecolombia -
Category
Documents
-
view
2 -
download
0
Transcript of Nucleation and growth of new particles in the rural atmosphere of Northern Italy—relationship to...
ARTICLE IN PRESS
1352-2310/$ - se
doi:10.1016/j.at
�Correspondde Tenerife, Ca
E-mail addr
Atmospheric Environment 39 (2005) 6734–6746
www.elsevier.com/locate/atmosenv
Nucleation and growth of new particles in therural atmosphere of Northern Italy—relationship to
air quality monitoring
Sergio Rodrıgueza,b,�, Rita Van Dingenena, Jean-Philippe Putauda,Sebastiao Martins-Dos Santosa, Davide Rosellic
aEuropean Commission, Joint Research Centre, Institute for Environment and Sustainability, T.P. 290, 21020 Ispra (VA), ItalybInstitute of Earth Sciences ‘‘Jaume Almera’’, CSIC, Barcelona, Spain
cForschungszentrum Julich GmbH, Germany
Received 25 January 2005; received in revised form 30 June 2005; accepted 13 July 2005
Abstract
This study investigates the relationship between aerosols number size distribution on the one hand, and air quality in
terms of particulate matter (PM) mass concentrations (as usually monitored in the air quality networks) on the other
hand. For this purpose, time series of trace gases levels, submicron aerosol size distributions, both recorded at a rural
site in Northern Italy (ISPRA), and of trace gas levels and PM mass concentrations, recorded in the air quality network
operating in this region, have been compared and interpreted. Because of the regional nature of the PM pollution
events, the daily mean levels of the aerosol volume (V), surface area (S) and black carbon (BC) concentrations at
ISPRA rural site are well correlated with the daily mean levels of PM mass concentrations recorded at the other air
quality monitoring sites. At ISPRA, the submicron aerosol size distribution is strongly influenced by two main
competing processes: nucleation of new particles and condensation of gas-phase components onto pre-existing particles
(resulting in particles growth). These processes influence on the daily, seasonal and day-to-day variations of the
submicron aerosol features. Because increasing aerosol S concentrations favour condensation and hinder nucleation
(and vice versa) the ‘mean’ particle size DpN (mode of the dN/dlogD size distribution) increases with increasing PM
concentrations (e.g. 45 nm for V ¼ 4mm3 cm�3 and 110 nm for V ¼ 45mm3 cm�3). Owing to this, time series of aerosol
DpN and V , S, mass and BC concentrations are strongly anti-correlated with those of the smallest ultrafine particle
number concentration (N, 5–10 and 10–20 nm). Nucleation episodes occur under the clean air conditions prompted by
the North-Foehn meteorology. This anti-correlation between submicron aerosol mass and No20 nm concentrations
(prompted by the low contribution of the ultrafine particles to the aerosol mass) has important implications for a proper
air quality monitoring: the parameters classically used for the air quality assessing (e.g. PM2.5) are not suitable for
monitoring of this ultrafine PM pollution and consequently a specific monitoring of the ultrafine PM number
concentration should be performed. The significance of this specific ultrafine PM number concentration monitoring is
e front matter r 2005 Elsevier Ltd. All rights reserved.
mosenv.2005.07.036
ing author. Current address: Izana Atmospheric Observatory, INM-CSIC, La Marina 20, 6a planta, 38071, Santa Cruz
nary Islands Spain.
ess: [email protected] (S. Rodrıguez).
ARTICLE IN PRESSS. Rodrıguez et al. / Atmospheric Environment 39 (2005) 6734–6746 6735
supported by facts already proven: a significant fraction of the current urban PM emissions occurs in the ultrafine PM
fraction and exposure to ultrafine PM is associated with adverse effects on human health.
r 2005 Elsevier Ltd. All rights reserved.
Keywords: Aerosols size distribution; Number concentration; Air quality; Nucleation; Po valley
Adriadic sea
Alps
Mediterraneansea
Study
area
0-100
100-200
200-500
500-800
800-1500
1500-3000>3000
m.a.s.l.
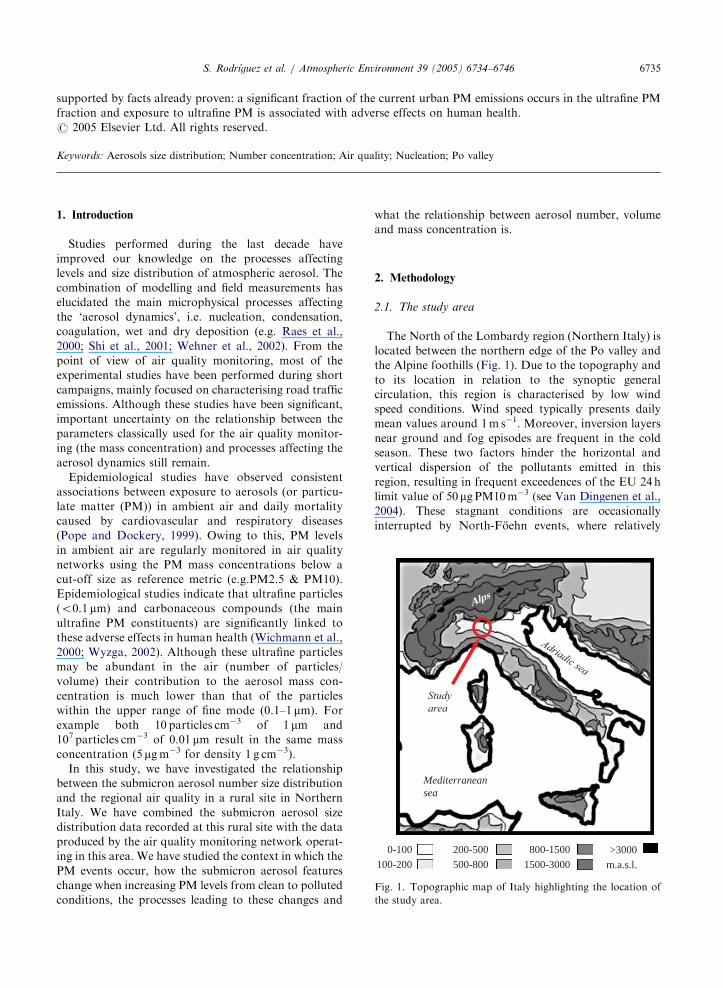
Fig. 1. Topographic map of Italy highlighting the location of
the study area.
1. Introduction
Studies performed during the last decade have
improved our knowledge on the processes affecting
levels and size distribution of atmospheric aerosol. The
combination of modelling and field measurements has
elucidated the main microphysical processes affecting
the ‘aerosol dynamics’, i.e. nucleation, condensation,
coagulation, wet and dry deposition (e.g. Raes et al.,
2000; Shi et al., 2001; Wehner et al., 2002). From the
point of view of air quality monitoring, most of the
experimental studies have been performed during short
campaigns, mainly focused on characterising road traffic
emissions. Although these studies have been significant,
important uncertainty on the relationship between the
parameters classically used for the air quality monitor-
ing (the mass concentration) and processes affecting the
aerosol dynamics still remain.
Epidemiological studies have observed consistent
associations between exposure to aerosols (or particu-
late matter (PM)) in ambient air and daily mortality
caused by cardiovascular and respiratory diseases
(Pope and Dockery, 1999). Owing to this, PM levels
in ambient air are regularly monitored in air quality
networks using the PM mass concentrations below a
cut-off size as reference metric (e.g.PM2.5 & PM10).
Epidemiological studies indicate that ultrafine particles
(o0.1 mm) and carbonaceous compounds (the main
ultrafine PM constituents) are significantly linked to
these adverse effects in human health (Wichmann et al.,
2000; Wyzga, 2002). Although these ultrafine particles
may be abundant in the air (number of particles/
volume) their contribution to the aerosol mass con-
centration is much lower than that of the particles
within the upper range of fine mode (0.1–1 mm). Forexample both 10 particles cm�3 of 1 mm and
107 particles cm�3 of 0.01 mm result in the same mass
concentration (5 mgm�3 for density 1 g cm�3).
In this study, we have investigated the relationship
between the submicron aerosol number size distribution
and the regional air quality in a rural site in Northern
Italy. We have combined the submicron aerosol size
distribution data recorded at this rural site with the data
produced by the air quality monitoring network operat-
ing in this area. We have studied the context in which the
PM events occur, how the submicron aerosol features
change when increasing PM levels from clean to polluted
conditions, the processes leading to these changes and
what the relationship between aerosol number, volume
and mass concentration is.
2. Methodology
2.1. The study area
The North of the Lombardy region (Northern Italy) is
located between the northern edge of the Po valley and
the Alpine foothills (Fig. 1). Due to the topography and
to its location in relation to the synoptic general
circulation, this region is characterised by low wind
speed conditions. Wind speed typically presents daily
mean values around 1m s�1. Moreover, inversion layers
near ground and fog episodes are frequent in the cold
season. These two factors hinder the horizontal and
vertical dispersion of the pollutants emitted in this
region, resulting in frequent exceedences of the EU 24h
limit value of 50mgPM10m�3 (see Van Dingenen et al.,
2004). These stagnant conditions are occasionally
interrupted by North-Foehn events, where relatively
ARTICLE IN PRESSS. Rodrıguez et al. / Atmospheric Environment 39 (2005) 6734–67466736
warm and dry downslope wind from the Alps flows over
the area. During its ascent at the northern Alpine slope,
the air mass gets supersaturated and looses its moisture,
thereby scavenging practically all particulate matter. At
the south slope, the air expands adiabatically during its
descent, and heats up, sometimes reaching 20 1C in
January when it reaches the valley. In such North-Foehn
conditions, extremely clean air prevails over the region.
During the cold season, relatively high temperature and
the highest O3 events are recorded during these North-
Foehn episodes; however, these O3 concentrations are
lower than those typically recorded in the warm season
(even at the same temperature; other details in Bauman
et al., 2001; Weber and Prevot, 2002).
2.2. Measurement sites
The main data set of this study was recorded at the
EMEP station located into the Joint Research Centre at
ISPRA (451480N, 81380E, 235m asl). We will refer to this
station as ISPRA. This measurement site is representa-
tive of the rural environment of Northern Lombardy.
The nearby cities located in our study area (into a radius
of 60 km) and the mobile sources along the roads and
motorways are the most important air pollutant sources.
Industrial emission around Milan area could also
contribute to background air pollution. In order to
place the measurements performed at ISPRA into the
context of the regional air pollution, data from seven air
quality monitoring stations (managed by ARPA—
Agenzia Regionale per la Protezione dell’Ambiente)
operating in the cities of Varese, Busto Arsizio and
Gallarate were also studied.
2.3. Data
At ISPRA the following measurements were per-
formed:
1.
Number concentration and dry size distribution(5–800 nm particle diameter) by means of a con-
densation particle counter (CPC, TSI model 3010)
and a Vienna-type medium length differential mobi-
lity analyzer. The dry particle diameter was deter-
mined using a closed dry sheath air circuit (Jokinen
and Makela, 1997). The measurements were per-
formed from June 1999 to December 2000 (there are
some small interruptions in July 1999, and June and
September 2000).
2.
Black carbon (BC) levels were determined bymeans of an aethalometer (Magee model AE-10,
incandescent lamp) from August 1999 to March
2000. Although this monitor actually determines
the equivalent black carbon, we will refer to this
as BC.
3.
Levels of O3, NO, NO2, SO2 and CO by means ofstandard automatic methods.
The following data from the ARPA air quality
monitoring stations were used:
1.
Concentrations of O3, NO, NO2, SO2 and CO,the mass concentration of total suspended particles
(TSP in 1999) and PM o10 mm (PM10 in 2000).
All data were obtained by means of standards
methods.
2.
Local meteorology (T, RH, wind, rain and total solarradiation).
Moreover, surface pressure charts of the UK Meteor-
ological Office and satellite observations of the infrared
channel of Meteosat were used for assessing the day-to-
day changes in the meteorology.
2.4. Data treatment
The following parameters were calculated and stu-
died:
1.
N, V and S: number, volume and surface concentra-tion of particles, respectively.
2.
NX–Y, VX–Y and SX–Y: number, volume andsurface concentrations of particles with size between
X and Y nm, respectively.
3.
DpN: diameter where the size distribution dN/dlogDpreaches its maximum, i.e. the size distribution mode.
4.
The distance (in nm) from DpN for accounting to the5, 10, 15,y% of N toward each side of DpN. For this
purpose, the dN/dlogD curve was integrated from
the central position (defined by DpN) toward each
extreme by steps containing 5% of total number
concentration. Thus, the diameters containing the 10,
20, y.and the 80% of the total number concentra-
tion, with respect to the DpN central position, were
determined. We will denote by ‘DDp X% N ¼ Y2Z0
the diameters Y and Z which contain the X% of the
total number concentration, being Y and Z at each
side of DpN. This is a measure of the ‘width or
dispersion’ of the aerosol diameter spectrum.
3. Results and discussion
3.1. Mean levels
A descriptive statistic of the aerosol parameters and
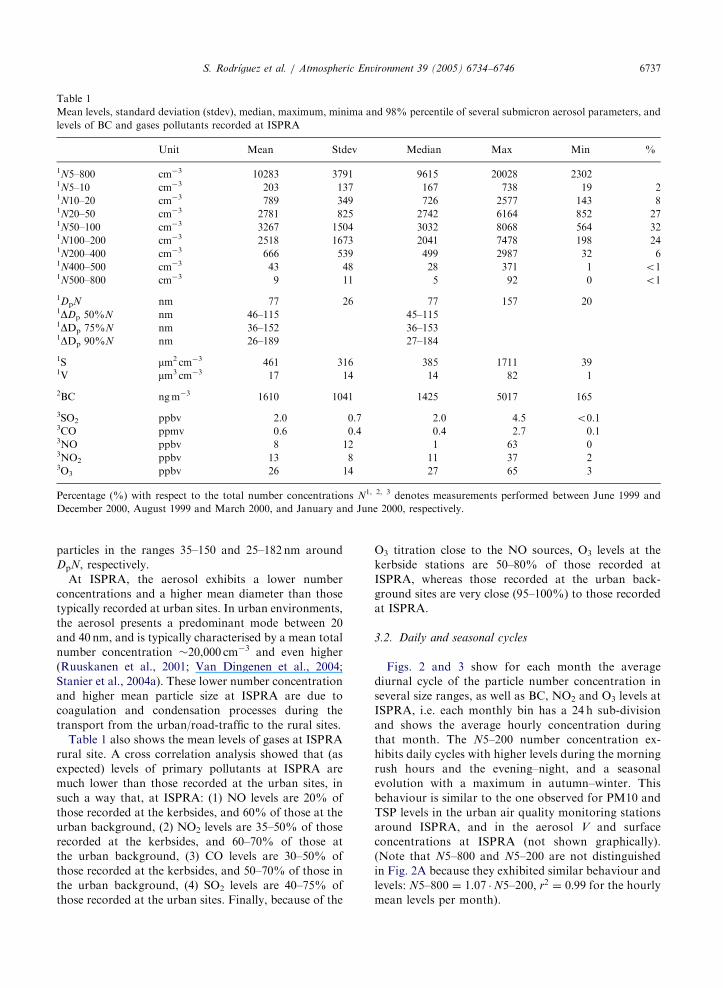
gases at ISPRA rural site is shown in Table 1. The mean
N5–800 concentration is �10,300 cm�3. The aerosol
number concentration reaches a maximum around the
diameter DpN ¼ 77 nm, with the 75% and 90% of the
ARTICLE IN PRESS
Table 1
Mean levels, standard deviation (stdev), median, maximum, minima and 98% percentile of several submicron aerosol parameters, and
levels of BC and gases pollutants recorded at ISPRA
Unit Mean Stdev Median Max Min %
1N5–800 cm�3 10283 3791 9615 20028 23021N5–10 cm�3 203 137 167 738 19 21N10–20 cm�3 789 349 726 2577 143 81N20–50 cm�3 2781 825 2742 6164 852 271N50–100 cm�3 3267 1504 3032 8068 564 321N100–200 cm�3 2518 1673 2041 7478 198 241N200–400 cm�3 666 539 499 2987 32 61N400–500 cm�3 43 48 28 371 1 o11N500–800 cm�3 9 11 5 92 0 o11DpN nm 77 26 77 157 201DDp 50%N nm 46–115 45–1151DDp 75%N nm 36–152 36–1531DDp 90%N nm 26–189 27–184
1S mm2 cm�3 461 316 385 1711 391V mm3 cm�3 17 14 14 82 1
2BC ngm�3 1610 1041 1425 5017 165
3SO2 ppbv 2.0 0.7 2.0 4.5 o0.13CO ppmv 0.6 0.4 0.4 2.7 0.13NO ppbv 8 12 1 63 03NO2 ppbv 13 8 11 37 23O3 ppbv 26 14 27 65 3
Percentage (%) with respect to the total number concentrations N1, 2, 3 denotes measurements performed between June 1999 and
December 2000, August 1999 and March 2000, and January and June 2000, respectively.
S. Rodrıguez et al. / Atmospheric Environment 39 (2005) 6734–6746 6737
particles in the ranges 35–150 and 25–182 nm around
DpN, respectively.
At ISPRA, the aerosol exhibits a lower number
concentrations and a higher mean diameter than those
typically recorded at urban sites. In urban environments,
the aerosol presents a predominant mode between 20
and 40 nm, and is typically characterised by a mean total
number concentration �20,000 cm�3 and even higher
(Ruuskanen et al., 2001; Van Dingenen et al., 2004;
Stanier et al., 2004a). These lower number concentration
and higher mean particle size at ISPRA are due to
coagulation and condensation processes during the
transport from the urban/road-traffic to the rural sites.
Table 1 also shows the mean levels of gases at ISPRA
rural site. A cross correlation analysis showed that (as
expected) levels of primary pollutants at ISPRA are
much lower than those recorded at the urban sites, in
such a way that, at ISPRA: (1) NO levels are 20% of
those recorded at the kerbsides, and 60% of those at the
urban background, (2) NO2 levels are 35–50% of those
recorded at the kerbsides, and 60–70% of those at
the urban background, (3) CO levels are 30–50% of
those recorded at the kerbsides, and 50–70% of those in
the urban background, (4) SO2 levels are 40–75% of
those recorded at the urban sites. Finally, because of the
O3 titration close to the NO sources, O3 levels at the
kerbside stations are 50–80% of those recorded at
ISPRA, whereas those recorded at the urban back-
ground sites are very close (95–100%) to those recorded
at ISPRA.
3.2. Daily and seasonal cycles
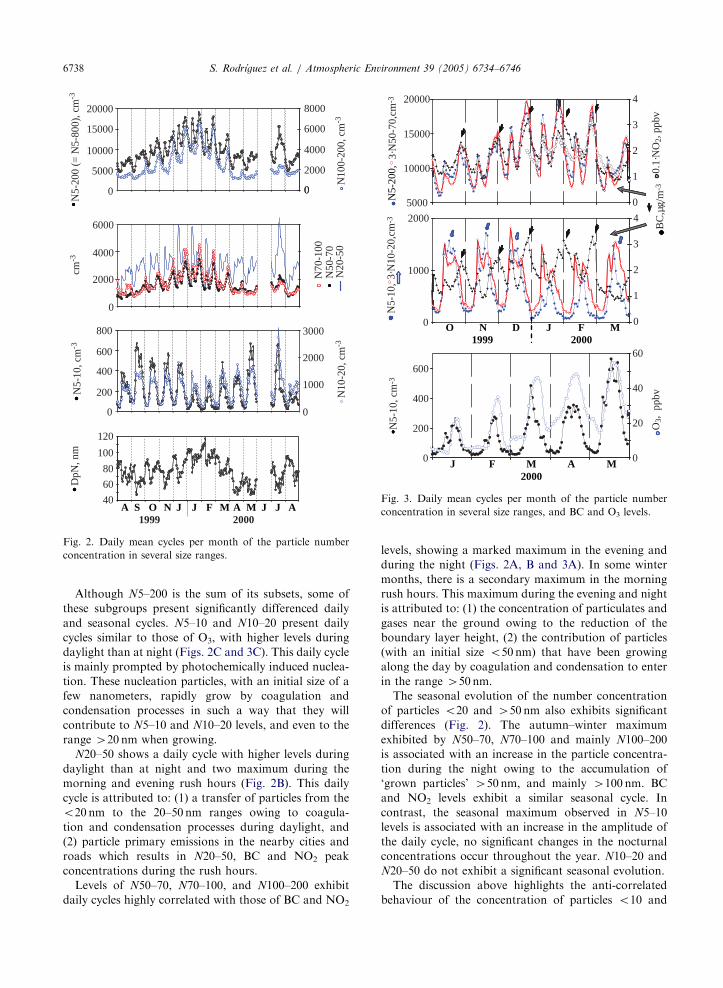
Figs. 2 and 3 show for each month the average
diurnal cycle of the particle number concentration in
several size ranges, as well as BC, NO2 and O3 levels at
ISPRA, i.e. each monthly bin has a 24 h sub-division
and shows the average hourly concentration during
that month. The N5–200 number concentration ex-
hibits daily cycles with higher levels during the morning
rush hours and the evening–night, and a seasonal
evolution with a maximum in autumn–winter. This
behaviour is similar to the one observed for PM10 and
TSP levels in the urban air quality monitoring stations
around ISPRA, and in the aerosol V and surface
concentrations at ISPRA (not shown graphically).
(Note that N5–800 and N5–200 are not distinguished
in Fig. 2A because they exhibited similar behaviour and
levels: N5–800 ¼ 1.07 �N5–200, r2 ¼ 0:99 for the hourlymean levels per month).
ARTICLE IN PRESS
20000
10000
5000
4000
0
4000
2000
8000
0
15000 6000
6000
600
2000
400
200
2000
0
800
1000
0
3000
0
40
60
120
100
80
0
1999 2000
DpN
, nm
N5-
10, c
m-3
cm-3
N5-
200
(= N
5-80
0), c
m-3
N10
-20,
cm
-3
N70
-100
N50
-70
N20
-50
N10
0-20
0, c
m-3
A S O N J J F M A M J J A
Fig. 2. Daily mean cycles per month of the particle number
concentration in several size ranges.
5000
315000
10000
20000
2
1
0
4
1000
0
3
2000
2
1
0
4
400
200
0
600
40
20
0
60
0.1·
NO
2, p
pbv
N5-
10, c
m-3
N5-
10,
3·N
10-2
0,cm
-33·
N50
-70,
cm-3
N5-
200,
O
J F M A M
N D J F M1999 2000
2000
O3,
ppb
vB
C,µ
g/m
-3
Fig. 3. Daily mean cycles per month of the particle number
concentration in several size ranges, and BC and O3 levels.
S. Rodrıguez et al. / Atmospheric Environment 39 (2005) 6734–67466738
Although N5–200 is the sum of its subsets, some of
these subgroups present significantly differenced daily
and seasonal cycles. N5–10 and N10–20 present daily
cycles similar to those of O3, with higher levels during
daylight than at night (Figs. 2C and 3C). This daily cycle
is mainly prompted by photochemically induced nuclea-
tion. These nucleation particles, with an initial size of a
few nanometers, rapidly grow by coagulation and
condensation processes in such a way that they will
contribute to N5–10 and N10–20 levels, and even to the
range 420 nm when growing.
N20–50 shows a daily cycle with higher levels during
daylight than at night and two maximum during the
morning and evening rush hours (Fig. 2B). This daily
cycle is attributed to: (1) a transfer of particles from the
o20 nm to the 20–50 nm ranges owing to coagula-
tion and condensation processes during daylight, and
(2) particle primary emissions in the nearby cities and
roads which results in N20–50, BC and NO2 peak
concentrations during the rush hours.
Levels of N50–70, N70–100, and N100–200 exhibit
daily cycles highly correlated with those of BC and NO2
levels, showing a marked maximum in the evening and
during the night (Figs. 2A, B and 3A). In some winter
months, there is a secondary maximum in the morning
rush hours. This maximum during the evening and night
is attributed to: (1) the concentration of particulates and
gases near the ground owing to the reduction of the
boundary layer height, (2) the contribution of particles
(with an initial size o50 nm) that have been growingalong the day by coagulation and condensation to enter
in the range 450 nm.The seasonal evolution of the number concentration
of particles o20 and 450 nm also exhibits significant
differences (Fig. 2). The autumn–winter maximum
exhibited by N50–70, N70–100 and mainly N100–200
is associated with an increase in the particle concentra-
tion during the night owing to the accumulation of
‘grown particles’ 450 nm, and mainly 4100 nm. BCand NO2 levels exhibit a similar seasonal cycle. In
contrast, the seasonal maximum observed in N5–10
levels is associated with an increase in the amplitude of
the daily cycle, no significant changes in the nocturnal
concentrations occur throughout the year. N10–20 and
N20–50 do not exhibit a significant seasonal evolution.
The discussion above highlights the anti-correlated
behaviour of the concentration of particles o10 and
ARTICLE IN PRESSS. Rodrıguez et al. / Atmospheric Environment 39 (2005) 6734–6746 6739
450 nm (e.g. daily and seasonal cycles; Figs. 2 and 3).
After the morning rush hours resulting in the N20–50
peak concentrations discussed above, the daylight
conditions (increase in the temperature, solar radiation
intensity, photochemistry and boundary layer height)
favour the dilution of pollutants, the photochemical
oxidation of secondary aerosols precursors and particle
nucleation, resulting in the N5–10 and N10–20 max-
imums during daylight. In contrast, the nocturnal
conditions favour the concentration of pollutants as
well as particles growth by coagulation (due to the
decrease in the mean free path) and condensation of
semi-volatile species onto the particle’s surface. Because
of these processes, the particle diameter DpN exhibits a
daily cycle with lower levels during daylight (Fig. 2D).
Moreover, the winter maximum in N5–200 (the classical
PM winter maxima) is associated with a strong increase
in the particle diameter DpN (Fig. 2D).
3.3. Episodes study
3.3.1. PM mass events
The day-to-day variations in the aerosol BC and V
concentrations at ISPRA have been used as representa-
tive of the day-to-day variations in the submicron
aerosol mass concentrations at this site (mass ¼
volume � density; e.g. density 1.5–1.7 g/cm3 for many
submicron aerosol species; Mc Murry et al., 2002). At
the urban air quality monitoring sites, TSP and PM10
levels were used as representative of the PM mass
concentrations at these sites.
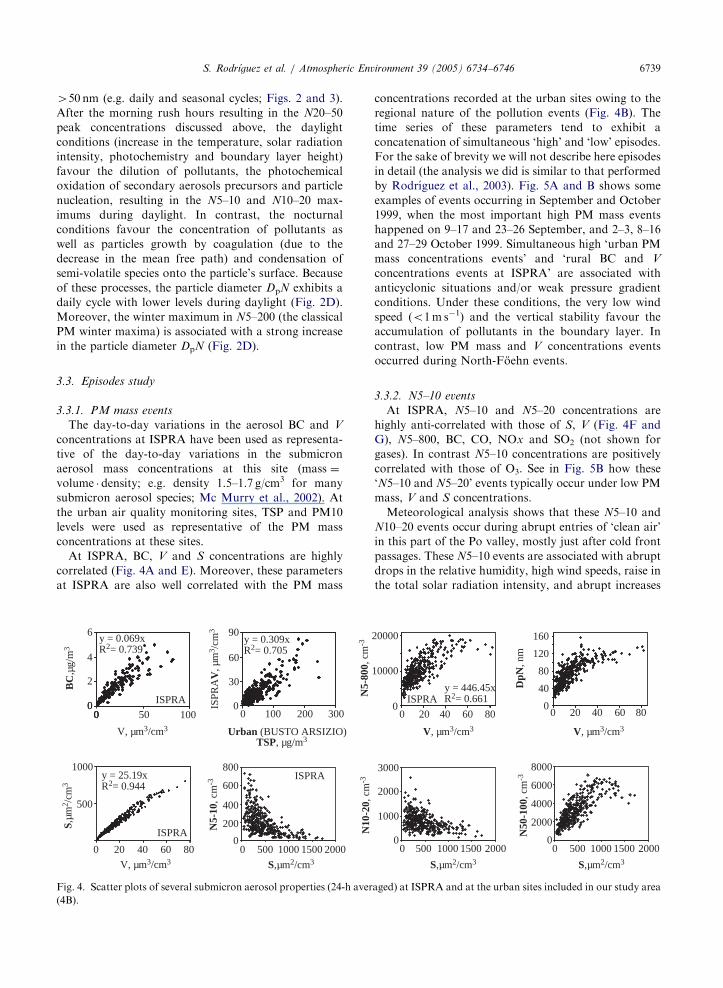
At ISPRA, BC, V and S concentrations are highly
correlated (Fig. 4A and E). Moreover, these parameters
at ISPRA are also well correlated with the PM mass
300
90
60
30
00 100 200100
0
2
4
6
0 50
500
800 20 6040
200
400
600
800
00 500 1000 1500 2000
000
BC
,µg/
m3
ISPRA
ISPRA
ISPRA N10
-20,
cm
-3
N5-
10, c
m-3
1000
S,µm
2 /cm
3
S,µm2/cm3
ISPR
AV
, µm
3 /cm
3
V, µm3/cm3
V, µm3/cm3
y = 0.069xR2= 0.739
y = 25.19xR2= 0.944
y = 0.309xR2= 0.705
N5-
800,
cm
-3
TSP, µg/m3Urban (BUSTO ARSIZIO)
Fig. 4. Scatter plots of several submicron aerosol properties (24-h aver
(4B).
concentrations recorded at the urban sites owing to the
regional nature of the pollution events (Fig. 4B). The
time series of these parameters tend to exhibit a
concatenation of simultaneous ‘high’ and ‘low’ episodes.
For the sake of brevity we will not describe here episodes
in detail (the analysis we did is similar to that performed
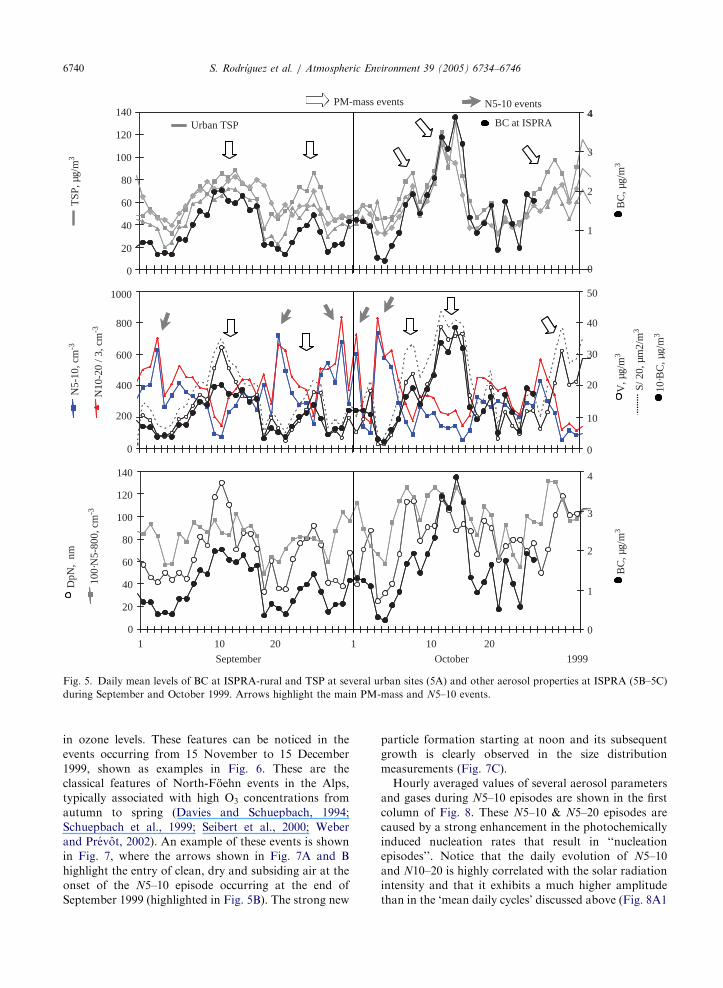
by Rodrıguez et al., 2003). Fig. 5A and B shows some
examples of events occurring in September and October
1999, when the most important high PM mass events
happened on 9–17 and 23–26 September, and 2–3, 8–16
and 27–29 October 1999. Simultaneous high ‘urban PM
mass concentrations events’ and ‘rural BC and V
concentrations events at ISPRA’ are associated with
anticyclonic situations and/or weak pressure gradient
conditions. Under these conditions, the very low wind
speed (o1m s�1) and the vertical stability favour theaccumulation of pollutants in the boundary layer. In
contrast, low PM mass and V concentrations events
occurred during North-Foehn events.
3.3.2. N5–10 events
At ISPRA, N5–10 and N5–20 concentrations are
highly anti-correlated with those of S, V (Fig. 4F and
G), N5–800, BC, CO, NOx and SO2 (not shown for
gases). In contrast N5–10 concentrations are positively
correlated with those of O3. See in Fig. 5B how these
‘N5–10 and N5–20’ events typically occur under low PM
mass, V and S concentrations.
Meteorological analysis shows that these N5–10 and
N10–20 events occur during abrupt entries of ‘clean air’
in this part of the Po valley, mostly just after cold front
passages. These N5–10 events are associated with abrupt
drops in the relative humidity, high wind speeds, raise in
the total solar radiation intensity, and abrupt increases
20000
10000
0 0
40
160
80
120
800 20 6040
20000 500 1000 1500
3000
2000
1000
00 500 1000 1500 2000
6000
8000
4000
2000
0
ISPRA
N50
-100
, cm
-3
S,µm2/cm3 S,µm2/cm3
y = 446.45xR2= 0.661
V, µm3/cm3 V, µm3/cm3
800 20 6040
DpN
, nm
aged) at ISPRA and at the urban sites included in our study area
ARTICLE IN PRESS
4
2
1
0
120
4
100
60
140
40
20
0
80
40
30
20
0
50
10
1000
600
120
200
0
800
3
2
1
0
3
400
100
60
140
40
20
0
80
201 10201 10
4
1999September October
PM-mass events N5-10 events
BC at ISPRA
BC
, µg/
m3
V, µ
g/m
3
S/ 2
0, µ
m2/
m3
10·B
C, µ
g/m
3
BC
, µg/
m3
DpN
, nm
100·
N5-
800,
cm
-3
N5-
10, c
m-3
N10
-20
/ 3, c
m-3
TSP
, µg/
m3
Urban TSP
Fig. 5. Daily mean levels of BC at ISPRA-rural and TSP at several urban sites (5A) and other aerosol properties at ISPRA (5B–5C)
during September and October 1999. Arrows highlight the main PM-mass and N5–10 events.
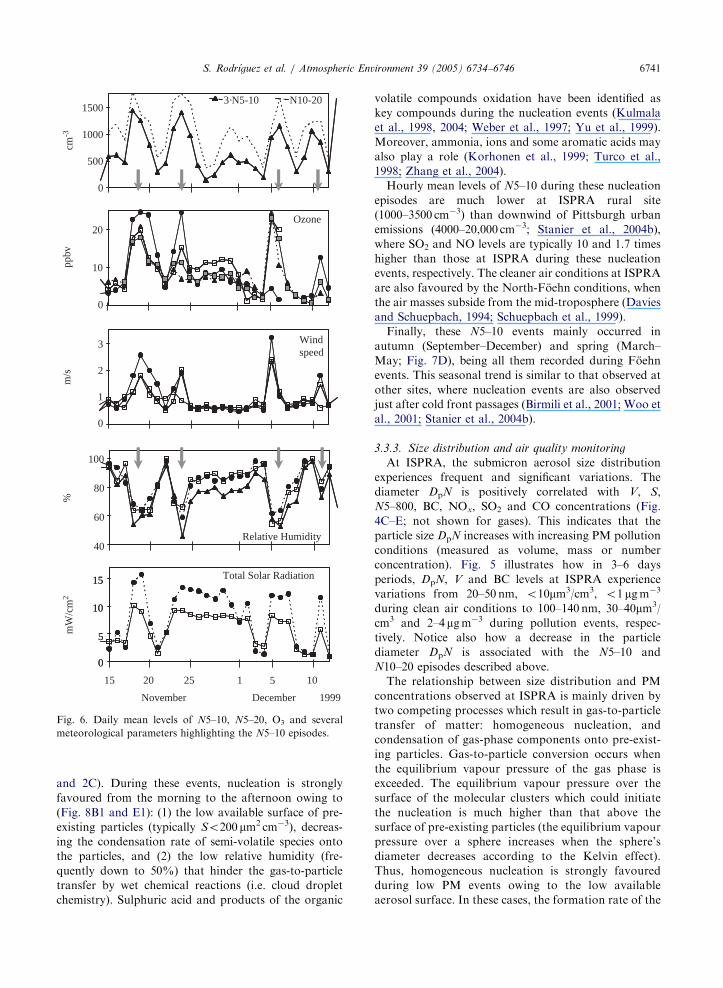
S. Rodrıguez et al. / Atmospheric Environment 39 (2005) 6734–67466740
in ozone levels. These features can be noticed in the
events occurring from 15 November to 15 December
1999, shown as examples in Fig. 6. These are the
classical features of North-Foehn events in the Alps,
typically associated with high O3 concentrations from
autumn to spring (Davies and Schuepbach, 1994;
Schuepbach et al., 1999; Seibert et al., 2000; Weber
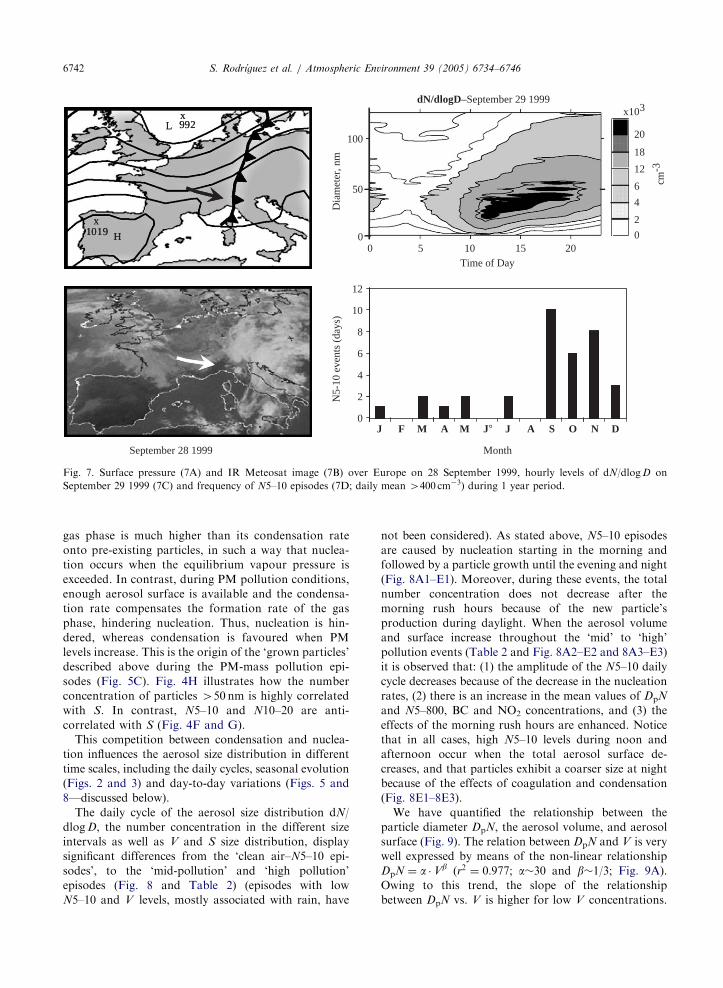
and Prevot, 2002). An example of these events is shown
in Fig. 7, where the arrows shown in Fig. 7A and B
highlight the entry of clean, dry and subsiding air at the
onset of the N5–10 episode occurring at the end of
September 1999 (highlighted in Fig. 5B). The strong new
particle formation starting at noon and its subsequent
growth is clearly observed in the size distribution
measurements (Fig. 7C).
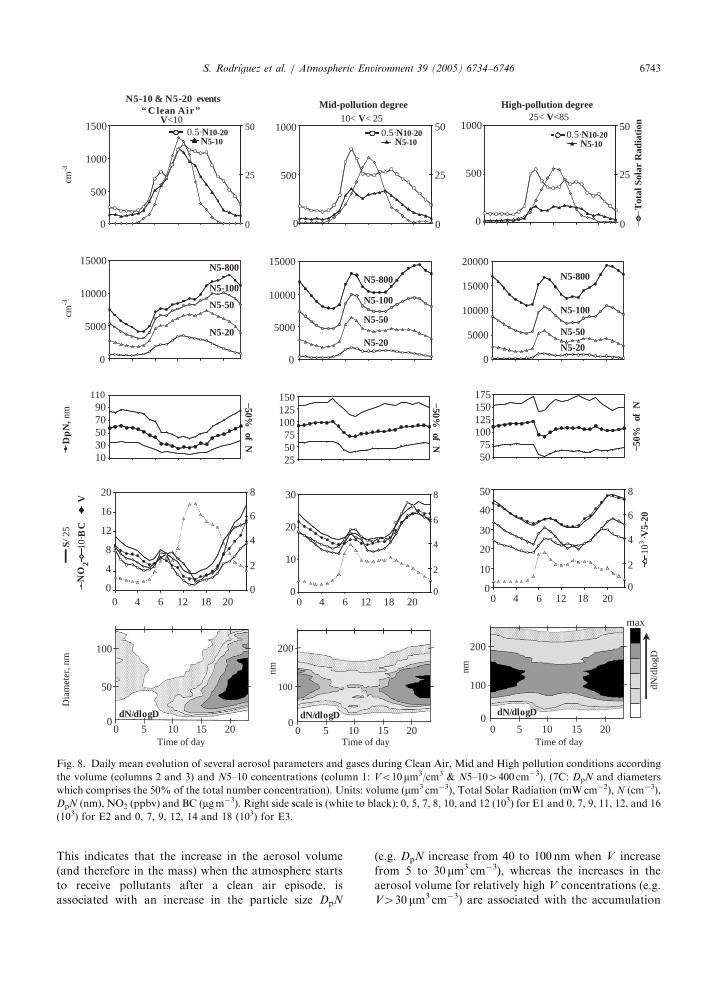
Hourly averaged values of several aerosol parameters
and gases during N5–10 episodes are shown in the first
column of Fig. 8. These N5–10 & N5–20 episodes are
caused by a strong enhancement in the photochemically
induced nucleation rates that result in ‘‘nucleation
episodes’’. Notice that the daily evolution of N5–10
and N10–20 is highly correlated with the solar radiation
intensity and that it exhibits a much higher amplitude
than in the ‘mean daily cycles’ discussed above (Fig. 8A1
ARTICLE IN PRESS
0
10
0
20
2
1
0
3
60
10
80
40
0
15
5
%
515 20 25 101
10
0
15
5
1500
500
1000
Total Solar Radiation
Relative Humidity
Windspeed
Ozone
3·N5-10 N10-20
cm-3
100
m/s
ppbv
mW
/cm
2
December 1999November
Fig. 6. Daily mean levels of N5–10, N5–20, O3 and several
meteorological parameters highlighting the N5–10 episodes.
S. Rodrıguez et al. / Atmospheric Environment 39 (2005) 6734–6746 6741
and 2C). During these events, nucleation is strongly
favoured from the morning to the afternoon owing to
(Fig. 8B1 and E1): (1) the low available surface of pre-
existing particles (typically So200 mm2 cm�3), decreas-
ing the condensation rate of semi-volatile species onto
the particles, and (2) the low relative humidity (fre-
quently down to 50%) that hinder the gas-to-particle
transfer by wet chemical reactions (i.e. cloud droplet
chemistry). Sulphuric acid and products of the organic
volatile compounds oxidation have been identified as
key compounds during the nucleation events (Kulmala
et al., 1998, 2004; Weber et al., 1997; Yu et al., 1999).
Moreover, ammonia, ions and some aromatic acids may
also play a role (Korhonen et al., 1999; Turco et al.,
1998; Zhang et al., 2004).
Hourly mean levels of N5–10 during these nucleation
episodes are much lower at ISPRA rural site
(1000–3500 cm�3) than downwind of Pittsburgh urban
emissions (4000–20,000 cm�3; Stanier et al., 2004b),
where SO2 and NO levels are typically 10 and 1.7 times
higher than those at ISPRA during these nucleation
events, respectively. The cleaner air conditions at ISPRA
are also favoured by the North-Foehn conditions, when
the air masses subside from the mid-troposphere (Davies
and Schuepbach, 1994; Schuepbach et al., 1999).
Finally, these N5–10 events mainly occurred in
autumn (September–December) and spring (March–
May; Fig. 7D), being all them recorded during Foehn
events. This seasonal trend is similar to that observed at
other sites, where nucleation events are also observed
just after cold front passages (Birmili et al., 2001; Woo et
al., 2001; Stanier et al., 2004b).
3.3.3. Size distribution and air quality monitoring
At ISPRA, the submicron aerosol size distribution
experiences frequent and significant variations. The
diameter DpN is positively correlated with V, S,
N5–800, BC, NOx, SO2 and CO concentrations (Fig.
4C–E; not shown for gases). This indicates that the
particle size DpN increases with increasing PM pollution
conditions (measured as volume, mass or number
concentration). Fig. 5 illustrates how in 3–6 days
periods, DpN, V and BC levels at ISPRA experience
variations from 20–50 nm, o10mm3/cm3, o1mgm�3
during clean air conditions to 100–140 nm, 30–40mm3/cm3 and 2–4mgm�3 during pollution events, respec-
tively. Notice also how a decrease in the particle
diameter DpN is associated with the N5–10 and
N10–20 episodes described above.
The relationship between size distribution and PM
concentrations observed at ISPRA is mainly driven by
two competing processes which result in gas-to-particle
transfer of matter: homogeneous nucleation, and
condensation of gas-phase components onto pre-exist-
ing particles. Gas-to-particle conversion occurs when
the equilibrium vapour pressure of the gas phase is
exceeded. The equilibrium vapour pressure over the
surface of the molecular clusters which could initiate
the nucleation is much higher than that above the
surface of pre-existing particles (the equilibrium vapour
pressure over a sphere increases when the sphere’s
diameter decreases according to the Kelvin effect).
Thus, homogeneous nucleation is strongly favoured
during low PM events owing to the low available
aerosol surface. In these cases, the formation rate of the
ARTICLE IN PRESS
12
8
10
4
2
0
6
20151050
2
4
6
12
18
20
0
L
H
x1019
x992L
H
x1019
x992
cm-3
Time of Day
Dia
met
er, n
m
50
0
100
N5-
10 e
vent
s (d
ays)
September 28 1999
dN/dlogD–September 29 1999x103
Month
J F M A M J° J A S O N D
Fig. 7. Surface pressure (7A) and IR Meteosat image (7B) over Europe on 28 September 1999, hourly levels of dN/dlogD on
September 29 1999 (7C) and frequency of N5–10 episodes (7D; daily mean 4400 cm�3) during 1 year period.
S. Rodrıguez et al. / Atmospheric Environment 39 (2005) 6734–67466742
gas phase is much higher than its condensation rate
onto pre-existing particles, in such a way that nuclea-
tion occurs when the equilibrium vapour pressure is
exceeded. In contrast, during PM pollution conditions,
enough aerosol surface is available and the condensa-
tion rate compensates the formation rate of the gas
phase, hindering nucleation. Thus, nucleation is hin-
dered, whereas condensation is favoured when PM
levels increase. This is the origin of the ‘grown particles’
described above during the PM-mass pollution epi-
sodes (Fig. 5C). Fig. 4H illustrates how the number
concentration of particles 450 nm is highly correlated
with S. In contrast, N5–10 and N10–20 are anti-
correlated with S (Fig. 4F and G).
This competition between condensation and nuclea-
tion influences the aerosol size distribution in different
time scales, including the daily cycles, seasonal evolution
(Figs. 2 and 3) and day-to-day variations (Figs. 5 and
8—discussed below).
The daily cycle of the aerosol size distribution dN/
dlogD, the number concentration in the different size
intervals as well as V and S size distribution, display
significant differences from the ‘clean air–N5–10 epi-
sodes’, to the ‘mid-pollution’ and ‘high pollution’
episodes (Fig. 8 and Table 2) (episodes with low
N5–10 and V levels, mostly associated with rain, have
not been considered). As stated above, N5–10 episodes
are caused by nucleation starting in the morning and
followed by a particle growth until the evening and night
(Fig. 8A1–E1). Moreover, during these events, the total
number concentration does not decrease after the
morning rush hours because of the new particle’s
production during daylight. When the aerosol volume
and surface increase throughout the ‘mid’ to ‘high’
pollution events (Table 2 and Fig. 8A2–E2 and 8A3–E3)
it is observed that: (1) the amplitude of the N5–10 daily
cycle decreases because of the decrease in the nucleation
rates, (2) there is an increase in the mean values of DpN
and N5–800, BC and NO2 concentrations, and (3) the
effects of the morning rush hours are enhanced. Notice
that in all cases, high N5–10 levels during noon and
afternoon occur when the total aerosol surface de-
creases, and that particles exhibit a coarser size at night
because of the effects of coagulation and condensation
(Fig. 8E1–8E3).
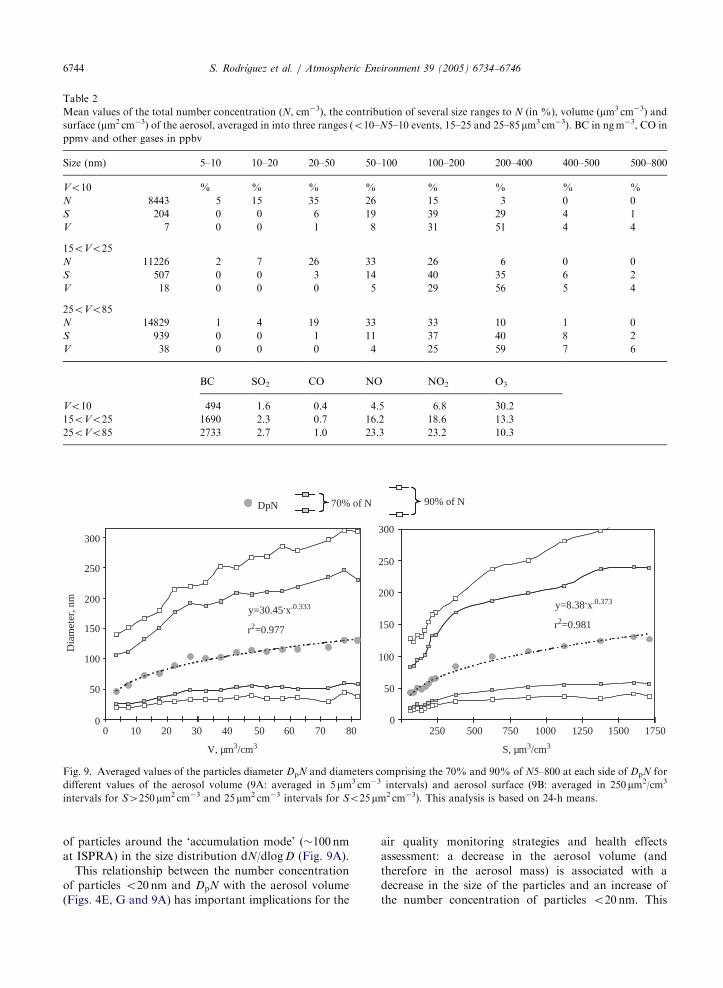
We have quantified the relationship between the
particle diameter DpN, the aerosol volume, and aerosol
surface (Fig. 9). The relation between DpN and V is very
well expressed by means of the non-linear relationship
DpN ¼ a �Vb (r2 ¼ 0:977; a�30 and b�1/3; Fig. 9A).Owing to this trend, the slope of the relationship
between DpN vs. V is higher for low V concentrations.
ARTICLE IN PRESS
50
25
0
6
4
2
0
8
1000
25
30
0
10000
5000
10
20
125
7550
100
50
25
0
0
75100
30
10
6
4
2
0
8
0
1000
15000
10000
5000
40
50
50
20
20000
125
175
50
25
0
1500
0
110
70
3050
90
16
12
8
4
6
4
2
8
500
1000
100
0
100
50
0
200
100
200
nmnm
20
0 0
15000
0
0
10
0
15000
10000
5000
N5-800
N5-100
N5-50
N5-20
500
N5-10 & N5-20 events “ C lean Air”
V<10
cm-3
0.5·N10-20N5-10
Mid-pollution degree High-pollution degree10< V< 25 25< V<85
Tot
al S
olar
Rad
iati
on
0.5·N10-20N5-10
0.5·N10-20N5-10
N5-100
N5-800
N5-50
N5-20
N5-800
N5-100
N5-20
N5-50
−50%
of
N
cm-3
−50% of N
−50% of N
150
0
500
Dp
N, n
m
V
S/ 2
5
NO
210
·BC
150
103
·V5-
20dN
/dlo
gD
0 105 15 20
dN/dlogDdN/dlogDdN/dlogD
Time of day0 105 15 20
Time of day0 105 15 20
Time of day
0
Dia
met
er, n
m
0 4 6 12 18 20 0 4 6 12 18 20 0 4 6 12 18 20
max
Fig. 8. Daily mean evolution of several aerosol parameters and gases during Clean Air, Mid and High pollution conditions according
the volume (columns 2 and 3) and N5–10 concentrations (column 1: Vo10mm3/cm3 & N5–104400 cm�3). (7C: DpN and diameters
which comprises the 50% of the total number concentration). Units: volume (mm3 cm�3), Total Solar Radiation (mWcm�2), N (cm�3),
DpN (nm), NO2 (ppbv) and BC (mgm�3). Right side scale is (white to black): 0, 5, 7, 8, 10, and 12 (103) for E1 and 0, 7, 9, 11, 12, and 16
(103) for E2 and 0, 7, 9, 12, 14 and 18 (103) for E3.
S. Rodrıguez et al. / Atmospheric Environment 39 (2005) 6734–6746 6743
This indicates that the increase in the aerosol volume
(and therefore in the mass) when the atmosphere starts
to receive pollutants after a clean air episode, is
associated with an increase in the particle size DpN
(e.g. DpN increase from 40 to 100 nm when V increase
from 5 to 30 mm3 cm�3), whereas the increases in the
aerosol volume for relatively high V concentrations (e.g.
V430 mm3 cm�3) are associated with the accumulation
ARTICLE IN PRESS
Table 2
Mean values of the total number concentration (N, cm�3), the contribution of several size ranges to N (in %), volume (mm3 cm�3) and
surface (mm2 cm�3) of the aerosol, averaged in into three ranges (o10–N5–10 events, 15–25 and 25–85mm3 cm�3). BC in ngm�3, CO in
ppmv and other gases in ppbv
Size (nm) 5–10 10–20 20–50 50–100 100–200 200–400 400–500 500–800
Vo10 % % % % % % % %
N 8443 5 15 35 26 15 3 0 0
S 204 0 0 6 19 39 29 4 1
V 7 0 0 1 8 31 51 4 4
15oVo25N 11226 2 7 26 33 26 6 0 0
S 507 0 0 3 14 40 35 6 2
V 18 0 0 0 5 29 56 5 4
25oVo85N 14829 1 4 19 33 33 10 1 0
S 939 0 0 1 11 37 40 8 2
V 38 0 0 0 4 25 59 7 6
BC SO2 CO NO NO2 O3
Vo10 494 1.6 0.4 4.5 6.8 30.2
15oVo25 1690 2.3 0.7 16.2 18.6 13.3
25oVo85 2733 2.7 1.0 23.3 23.2 10.3
10 30 5020 7040 80600
0
70% of N 90% of N
500
300
250
Dia
met
er, n
m 200
150
100
50
0
300
250
200
150
100
50
y=30.45.x.0.333
r2=0.977
y=8.38.x.0.373
r2=0.981
DpN
V, µm3/cm3 S, µm3/cm3
250 750 1000 1250 1500 1750
Fig. 9. Averaged values of the particles diameter DpN and diameters comprising the 70% and 90% of N5–800 at each side of DpN for
different values of the aerosol volume (9A: averaged in 5mm3 cm�3 intervals) and aerosol surface (9B: averaged in 250mm2/cm3
intervals for S4250mm2 cm�3 and 25mm2 cm�3 intervals for So25mm2 cm�3). This analysis is based on 24-h means.
S. Rodrıguez et al. / Atmospheric Environment 39 (2005) 6734–67466744
of particles around the ‘accumulation mode’ (�100 nm
at ISPRA) in the size distribution dN/dlogD (Fig. 9A).
This relationship between the number concentration
of particles o20 nm and DpN with the aerosol volume
(Figs. 4E, G and 9A) has important implications for the
air quality monitoring strategies and health effects
assessment: a decrease in the aerosol volume (and
therefore in the aerosol mass) is associated with a
decrease in the size of the particles and an increase of
the number concentration of particles o20 nm. This
ARTICLE IN PRESSS. Rodrıguez et al. / Atmospheric Environment 39 (2005) 6734–6746 6745
decrease in the V and mass concentrations could happen
if, in the current framework, a reduction in the emission
rates of gaseous precursors of aerosols is performed in
order to try to improve the air quality. Because the
contribution of ultrafine particles to the submicron
aerosol mass and volume is very low (Table 2), the
parameters classically used for assessing the air quality
based on the mass concentrations (e.g. PM2.5 or PM1)
are not suitable for monitoring this type of aerosols
pollution, and consequently a specific monitoring of the
ultrafine particle number concentration should be
performed. Note in Table 2 how the particles o50 nmcontributes with 25–60% to the total number, whereas
their contribution to the aerosol volume is o1.5%.Observe also in Fig. 5 the previously discussed ‘high
N5–10 and N10–20’ and ‘low V and mass episodes’. The
fact that a significant fraction of the current urban PM
emissions occurs in the ultrafine fraction (Shi et al.,
2001; Wahlin et al., 2001) highlights the significance of
this specific ultrafine PM number concentration mon-
itoring.
4. Conclusions
In a rural environment in Northern Italy, the size
distribution of submicron aerosols and its relationship
with the aerosol volume and mass is strongly influenced
by two competing processes: homogeneous nucleation
(resulting in new o10 nm particles) and growth of
particles by condensation of gas-phase species onto pre-
existing particles. Because of the influence of these
processes, the aerosol size distribution experience
frequent and significant variations (including daily and
seasonal evolution, as well as important day-to-day
changes). Moreover, there is a strong link between
‘aerosol concentrations’ and ‘aerosol size distribution’:
the particle size increases with the aerosol volume and
mass concentrations, whereas the number concentration
of particles o20 nm is anti-correlated with the aerosol
volume and mass. This has important implications for
the strategies for the air quality monitoring: a reduction
in the aerosol volume or mass (e.g. a consequence of a
decrease in the emission rates of gaseous aerosols
precursors) would increase the number concentration
of the smallest ultrafine particles. Because the contribu-
tion of these particles to the aerosol volume and mass
concentrations is very low, the parameters classically
used for the air quality assessing (PM2.5 & PM1) are not
suitable for monitoring of this type of PM pollution, and
consequently a specific monitoring of the ultrafine PM
number concentration should be performed. The sig-
nificance of this specific ultrafine PM number concen-
tration monitoring is supported by two facts already
proven: (1) adverse effects on human health—epidemio-
logical studies have shown that ultrafine particles and
carbonaceous compounds (the main ultrafine PM
constituents), are associated with mortality in urban
areas, and (2) emissions—a significant fraction of the
current urban emissions of PM occurs in the ultrafine
fraction.
Acknowledgement
The air quality data from the Lombardy region were
provided by the Agenzia Regionale per la Protezione
dell’Ambiente (http://www.ambiente.regione.lombar-
dia.it). Surface pressure charts and infrared radiation
satellite observations maps have been provided by the
UK Meteorological Office and Meteosat, respectively.
This work has been developed at the JRC with a
postdoctoral grant awarded by the Ministry of Educa-
tion and Culture of Spain, and a collaboration agree-
ment between the JRC and CSIC.
References
Bauman, K., Maurer, H., Rau, G., Piringer, M., Pechinger, U.,
Prevot, Furger, M., Bruno, N., Pellegrini, U., 2001. The
influence of south Foehn on the ozone distribution in the
Alpine Rhine valley—results from the MAP field phase.
Atmospheric Environment 35, 6379–6390.
Birmili, W., Wiedensohler, A., Heitzenber, J., Lehmann, K.,
2001. Atmospheric particle number size distribution in
Central Europe: statistical relationship to air masses and
meteorology. Journal of Geophysical Research 106 (D26),
32005–32018.
Davies, T.D., Schuepbach, E., 1994. Episodes of high ozone
concentrations at the Earth’s surface resulting from trans-
port down from the upper troposphere/lower stratosphere: a
review and case studies. Atmospheric Environment 28,
53–68.
Jokinen, V., Makela, J.M., 1997. Closed-loop arrangements
with critical orifice for DMA sheath/excess flow system.
Journal of Aerosol Science 28, 643–648.
Korhonen, P., Kulmala, M., Laaksonen, A., Viisanen, Y.,
McGraw, R., Seinfield, J.H., 1999. Ternary nucleation of
H2SO4, NH3, and H2O in the atmosphere. Journal of
Geophysical Research 104, 26349–26353.
Kulmala, M., Laaksonen, A., Pirjola, L., 1998. Parametriza-
tions for sulphuric acid/water nucleation rates. Journal of
Geophysical Research 103, 8301–8303.
Kulmala, M., Vehkamaki, Petaja, Dal Maso, M., Lauri, A.,
Kerminen, V.M., Birmili, W., McMurry, P.H., 2004.
Formation and growth rates of ultrafine atmospheric
particles: a review of observations. Journal of Aersosol
Science 35, 143–176.
Mc Murry, P.H., Wang, X., Kihong, P., Ehara, K., 2002. The
relationship between mass and mobility for atmospheric
particles: a new technique for measuring particle density.
Aerosol Science and Technology 36, 227–238.
Pope, C.A., Dockery, D.W., 1999. Epidemiology of particles
effects. In: Holgate, S.T., Samet, J.M., Koren, H.S.,
ARTICLE IN PRESSS. Rodrıguez et al. / Atmospheric Environment 39 (2005) 6734–67466746
Maynard, R.L. (Eds.), Air Pollution and Health. Academy
press, San Diego, pp. 673–705.
Raes, F., Van Dingenen, R., Vignati, E., Wilson, J., Putaud,
J.P., Seinfeld, J.H., Adams, P., 2000. Formation and cycling
of aerosols in the global troposphere. Atmospheric Envir-
onment 34, 4215–4240.
Rodrıguez, S., Querol, X., Alastuey, A., Viana, M.M.,
Mantilla, E., 2003. Events affecting levels and seasonal
evolution of airborne particulate matter concentrations in
the Western Mediterranean. Environmental Science and
Technology 37 (2), 216–222.
Ruuskanen, J., Tuch, Th., Ten Brink, H., Peters, A., Khlystov,
Mirme, A., Kos, G.P.A., Brunekreef, B., Wichmann,
Buzorius, G., Vallius, M., Kreyling, Pekkanen, 2001.
Concentrations of ultrafine, fine and PM2.5 particles in
three European cities. Atmospheric Environment 35,
3729–3738.
Schuepbach, E., Davies, T.D., Massacand, A.C., Wernli, H.,
1999. Mesoscale modelling of vertical atmospheric transport
in the Alps associated with the advection of a tropopause
fold—a winter ozone episode. Atmospheric Environment
33, 3613–3626.
Seibert, P., Feldmann, H., Neininger, Baumle, Trickl, T., 2000.
South Foehn and ozone in the Eastern Alps—case study
and climatological aspects. Atmospheric Environment 34,
1379–1394.
Shi, J.P., Evans, D.E., Khan, A.A., Harrison, R.M., 2001.
Sources and concentration of nanoparticles (o10 nmdiameter) in the urban atmosphere. Atmospheric Environ-
ment 35, 1193–1202.
Stanier, C.O., Khlystov, A.Y., Pandys, S.N., 2004a. Ambient
aerosol size distribution and number concentrations mea-
sured during the Pittsburg air quality study (PAQS).
Atmospheric Environment 38, 3275–3284.
Stanier, C.O., Khlystov, A.Y., Pandis, S.N., 2004b. Nucleation
events during the Pittsburgh air quality study: description
and relation to key meteorological, gas phase and aerosol
parameters. Aerosol Science and Technology 38 (S1),
253–264.
Turco, R.P., Zhao, J.X., Yu, F., 1998. A new source of
tropospheric aerosols: ion–ion recombination. Geophysical
Research Letters 25, 635–638.
Van Dingenen, R., (28 authors), et al., 2004. A European
aerosol phenomenology—1: physical characteristics of
particulate matter at kerbside, urban, rural and background
sites in Europe. Atmospheric Environment 38 (16),
2561–2577.
Wahlin, P., Palmgren, F., Van Dingenen, R., Raes, F., 2001.
Pronounced decrease of ambient particle number emissions
from diesel tra$c in Denmark after reduction of the sulphur
content in diesel fuel. Atmospheric Environment 35,
3549–3552.
Weber, R.O., Prevot, A.S.H., 2002. Climatology of ozone
transport from the free troposphere into the boundary layer
south of the Alps during North Foehn. Journal of
Geophysical Research 107, 4030–4035.
Weber, R.J., Marti, J.J., McMurry, P.H., Eisele, F.L., Tanner,
D.J., Jefferson, A., 1997. Measurements of new particle
formation and ultrafine particle growth rates at a clean
continental site. Journal of Geophysical Research 201,
4375–4385.
Wehner, B., Birmili1, W., Gnauk, T., Wiedensohler, A., 2002.
Particle number size distributions in a street canyon and
their transformation into the urban-air background: mea-
surements and a simple model study. Atmospheric Envir-
onment 36, 2215–2223.
Wichmann, H.E., Spix, C., Tuch, T., Wolke, G., Peters, A.,
Heinrich, J., Kreyling G., Heyder, J., 2000. Daily mortality
and fine and ultrafine particles in Erfurt, Germany. Part-I:
Role of particle number and particle mass. Health Effects
Institute, Research Report, number 98, November 2000.
Woo, K.S., Chen, D.R., Pui, D.Y.H., McMurry, P.H., 2001.
Measurements of Atlanta aerosol size distributions: ob-
servations of ultrafine particles events. Aerosol Science and
Technology 34, 75–87.
Wyzga, E.R., 2002. Air pollution and health; are particulates
the answer? Proceedings of the NETL Conference ‘‘PM2.5
and Electric Power Generation: Recent Findings and
Implications,’’ Pittsburgh, PA, April 9–10. http://www.netl.-
doe.gov/publications/proceedings/02/PM25/.
Yu, J., Cocker, D.R., Griffin, R.J., Flagan, R.C., Seinfield,
J.H., 1999. Gas-phase ozone oxidation of monoterpenes:
gaseous and particulate products. Journal of Atmospheric
Chemistry 34, 207–258.
Zhang, R., Suh, I., Zhao, J., Zhang, D., Fortner, E.C., Tie, X.,
Molina, L.T., Molina, M.J., 2004. Atmospheric New
particle formation enhanced by organics acids. Science
304, 1487–1490.