NSSE Annual Results 2013 - Angelo State University
56
A FRESH LOOK AT STUDENT ENGAGEMENT ANNUAL RESULTS 2013
-
Upload
khangminh22 -
Category
Documents
-
view
4 -
download
0
Transcript of NSSE Annual Results 2013 - Angelo State University

A FRESH LOOK AT STUDENT ENGAGEMENTANNUAL RESULTS 2013

NATIONAL ADVISORY BOARD
Suggested citation
National Survey of Student Engagement. (2013). A Fresh Look at Student Engagement—Annual Results 2013. Bloomington, IN: Indiana University Center for Postsecondary Research.
Jo Michelle Beld
Director of Evaluation and Assessment
Professor of Political Science
St. Olaf College
Daniel J. Bernstein
Professor of Cognitive Psychology
Director of the Center for Teaching Excellence
The University of Kansas
Peter Ewell, Chair
Vice President
National Center for Higher Education Management Systems (NCHEMS)
Mildred García
President
California State University, Fullerton
Muriel A. Howard
President
American Association of State Colleges and Universities (AASCU)
Pat Hutchings, Vice Chair
Consulting Scholar
The Carnegie Foundation for the Advancement of Teaching
Stanley O. Ikenberry
Professor and Senior Scientist
Center for the Study of Higher Education
The Pennsylvania State University
Regent Professor and President Emeritus
University of Illinois at Urbana-Champaign
Paul E. Lingenfelter
Former President
State Higher Education Executive Officers Association (SHEEO)
Kay McClenney, Ex Officio
Director
Center for Community College Student Engagement
Anne-Marie Nuñez
Associate Professor
Educational Leadership and Policy Studies
The University of Texas at San Antonio
Mary M. Sapp
Assistant Vice President
Planning, Institutional Research, and Assessment
University of Miami
Cover Images Front Cover
Background New Mexico TechInset Top Campbellsville UniversityInset Center Elon UniversityInset Bottom Armstrong Atlantic State University
Back Cover
Background Clayton State UniversityInset Top Virginia TechInset Bottom Bloomfield College
“Colleges and universities derive enormous internal value from participating in NSSE; of equal importance is the reassurance to their external publics that a commitment to undergraduate education and its improvement is a high priority. ”— MURIEL HOWARD, PRESIDENT, AMERICAN ASSOCIATION OF STATE COLLEGES AND UNIVERSITIES (AASCU)

The National Survey of Student Engagement (NSSE)
documents dimensions of quality in undergraduate
education and provides information and assistance
to colleges, universities, and other organizations to
improve student learning. Its primary activity is annually
surveying college students to assess the extent to
which they engage in educational practices associated
with high levels of learning and development.
Annual Results 2013 is sponsored by the Carnegie
Foundation for the Advancement of Teaching.
CLEARY COLLEGE
TABLE OF CONTENTS
Foreword . . . . . . . . . . . . . . . . . . . . . . . . . . . . . . . . . . . . . . . . . . . . . . . . . . . . . . . . . . . . . . . . . . . . . . . . . . . . . . . . . . . . . . . . . . . . . . . . . . . . . . .2
Director’s Message . . . . . . . . . . . . . . . . . . . . . . . . . . . . . . . . . . . . . . . . . . . . . . . . . . . . . . . . . . . . . . . . . . . . . . . . . . . . . . . . . . . . . . . . . . . . . . .4
Quick Facts . . . . . . . . . . . . . . . . . . . . . . . . . . . . . . . . . . . . . . . . . . . . . . . . . . . . . . . . . . . . . . . . . . . . . . . . . . . . . . . . . . . . . . . . . . . . . . . . . . . . .6
Selected Results . . . . . . . . . . . . . . . . . . . . . . . . . . . . . . . . . . . . . . . . . . . . . . . . . . . . . . . . . . . . . . . . . . . . . . . . . . . . . . . . . . . . . . . . . . . . . . . . .8
Academic Challenge . . . . . . . . . . . . . . . . . . . . . . . . . . . . . . . . . . . . . . . . . . . . . . . . . . . . . . . . . . . . . . . . . . . . . . . . . . . . . . . . . . . . . . . . . .9
Learning with Peers . . . . . . . . . . . . . . . . . . . . . . . . . . . . . . . . . . . . . . . . . . . . . . . . . . . . . . . . . . . . . . . . . . . . . . . . . . . . . . . . . . . . . . . . . . 14
Experiences with Faculty . . . . . . . . . . . . . . . . . . . . . . . . . . . . . . . . . . . . . . . . . . . . . . . . . . . . . . . . . . . . . . . . . . . . . . . . . . . . . . . . . . . . . . 16
Campus Environment . . . . . . . . . . . . . . . . . . . . . . . . . . . . . . . . . . . . . . . . . . . . . . . . . . . . . . . . . . . . . . . . . . . . . . . . . . . . . . . . . . . . . . . . . 18
High-Impact Practices . . . . . . . . . . . . . . . . . . . . . . . . . . . . . . . . . . . . . . . . . . . . . . . . . . . . . . . . . . . . . . . . . . . . . . . . . . . . . . . . . . . . . . . .20
Topical Modules . . . . . . . . . . . . . . . . . . . . . . . . . . . . . . . . . . . . . . . . . . . . . . . . . . . . . . . . . . . . . . . . . . . . . . . . . . . . . . . . . . . . . . . . . . . . .22
FSSE: Selected Results . . . . . . . . . . . . . . . . . . . . . . . . . . . . . . . . . . . . . . . . . . . . . . . . . . . . . . . . . . . . . . . . . . . . . . . . . . . . . . . . . . . . . . . 24
BCSSE: Selected Results . . . . . . . . . . . . . . . . . . . . . . . . . . . . . . . . . . . . . . . . . . . . . . . . . . . . . . . . . . . . . . . . . . . . . . . . . . . . . . . . . . . . . .26
Using NSSE Data . . . . . . . . . . . . . . . . . . . . . . . . . . . . . . . . . . . . . . . . . . . . . . . . . . . . . . . . . . . . . . . . . . . . . . . . . . . . . . . . . . . . . . . . . . . . . . . .28
NSSE Institute for Effective Educational Practice . . . . . . . . . . . . . . . . . . . . . . . . . . . . . . . . . . . . . . . . . . . . . . . . . . . . . . . . . . . . . . . . . . . . . . . .30
Looking Ahead . . . . . . . . . . . . . . . . . . . . . . . . . . . . . . . . . . . . . . . . . . . . . . . . . . . . . . . . . . . . . . . . . . . . . . . . . . . . . . . . . . . . . . . . . . . . . . . . . .32
References and Resources . . . . . . . . . . . . . . . . . . . . . . . . . . . . . . . . . . . . . . . . . . . . . . . . . . . . . . . . . . . . . . . . . . . . . . . . . . . . . . . . . . . . . . . .33
Engagement Indicators . . . . . . . . . . . . . . . . . . . . . . . . . . . . . . . . . . . . . . . . . . . . . . . . . . . . . . . . . . . . . . . . . . . . . . . . . . . . . . . . . . . . . . . . . . .34
Participating Colleges and Universities 2009–2013 . . . . . . . . . . . . . . . . . . . . . . . . . . . . . . . . . . . . . . . . . . . . . . . . . . . . . . . . . . . . . . . . . . . . . .46
NSSE Staff . . . . . . . . . . . . . . . . . . . . . . . . . . . . . . . . . . . . . . . . . . . . . . . . . . . . . . . . . . . . . . . . . . . . . . . . . . . . . . . . . . . . . . . . . . . . . . . . . . . . .53

2 NATIONAL SURVEY OF STUDENT ENGAGEMENT | ANNUAL RESULTS 2013
FOREWORD
Unsurprisingly, some educators see the shift in policy focus from
financing growth to questioning the educational process and related
outcomes as a dangerous and potentially harmful development. They
rightly question the ability of government to assess quality in higher
education. And experienced policy analysts note that institutions have
proved skillful in “gaming” incentive/reward schemes in ways that defeat
the intended purpose and yield unintended, often harmful consequences.
Despite the worries of educators, policy makers (including the
President) recognize that governmental policy cannot achieve
widespread attainment, higher quality, and affordability without the help,
creativity, and commitment of the educational community. But attaining
the goal is imperative; educators must find a way of working with each
other and the policy community to reach it.
What does this shift in government policy have to do with “a fresh look
at student engagement?” Everything. Authentic, extensive student
engagement is essential for both quality and the scale required for
widespread, affordable attainment.
Quality. High demand, combined with pressure to reduce the cost
of higher education, poses an ethical challenge to institutions and a
danger to the unsophisticated student. Providers face a temptation to
solve the cost-effectiveness problem by producing degrees that are
cheaper in value as well as price. Human nature being what it is, if a
fraudulent, undemanding educational program is presented to students
as the real McCoy, some will buy it.
Advances in technology, “disruptive innovation” if you will, can
significantly reduce the cost of some forms of instruction. But the focus
must be on learning. Large classes, passively received lectures, and
the mere transmission of information are easily automated; but they
represent the least imaginative, least productive aspects of traditional
instruction. While “disruptive innovation“ can play a useful role in
reducing costs, automated instruction, unaccompanied by extensive
student engagement with faculty, with other students, and with creative
work, is almost certain to be second-rate.
The Association of American Colleges and Universities’ systematic
surveys of employers indicate that the 21st century workplace
requires the ability to communicate effectively, to understand the
complexity of the world, to work in teams, and to solve unscripted
Why a Fresh Look at Student Engagement?
This 2013 Annual Results report of the National Survey of Student
Engagement (NSSE) provides a fresh and deeper view of students’
engagement in their education. Although the updated survey and
new engagement measures could be justified entirely on the principle
of seeking continuous improvement, the policy environment and the
growing needs for higher education make a fresh look at student
engagement imperative.
As this report was being written President Barack Obama traveled
to a university campus and announced an initiative to “make college
more affordable.” The President’s plan proposes giving students more
extensive information on the effectiveness of institutions as well as
using this information to reward effective institutions financially. It also
proposes to encourage and support innovation through a variety of
other actions. (See sidebar.)
The President’s proposals are the latest in a series of policy initiatives
marking a significant shift in the public policy dialogue for higher
education. For nearly sixty years (since Sputnik was launched and
the tidal wave of baby boomers arrived on college campuses) public
policy conversations focused primarily on finding enough money to
finance the growing demand for higher education. Money is becoming
harder to find, but student demand continues to grow. Moreover,
serious questions about educational quality and completion rates keep
cropping up. Policy makers are now taking a very hard look at the
educational process in order to find ways of getting the educational
results society needs at a cost the public is willing and able to pay.
Although educators frequently suggest political leaders provide
inadequate support because they undervalue education, that dog will
no longer hunt. The states increased funding from $62 billion in 2000
to $89 billion in 2008—hardly a disinvestment (SHEEO: State Higher
Education Finance). Despite the Great Recession and some very painful
cuts in 2012 after the federal stimulus funds ended, annual state support
still remains above $80 billion. During the same period the federal
government greatly increased its support for student financial aid.
The problem is not that policy makers no longer value higher education.
The problem is that enrollment demand since 2000 has grown faster
than ever, with the exception of the 1960s baby boom. Governments,
struggling to address health care, pension commitments, national
security, K-12 education, recessions, and decaying infrastructure in
addition to postsecondary enrollment growth, haven’t been able to fund
enrollment growth without increasing reliance on tuition revenue.
What does this shift in government policy have to do with “a fresh look at student engagement?” Everything. Authentic, extensive student engagement is essential for both quality and the scale required for widespread, affordable attainment.

SUMMARY OF THE OBAMA ADMINISTRATION’S PROPOSALS FOR HIGHER EDUCATION
In order to “pay colleges and students for performance,” President
Obama proposes:
• To develop a new system of “college ratings” that would help
students determine which colleges and universities do the best
job of helping students from disadvantaged backgrounds and
provide the best value for their money;
• To assess the cost effectiveness of institutions with measures
such as:
o The percentage of students receiving Pell grants, as an
indicator of access;
o Average tuition, scholarships, and loan debt, as an indicator
of affordability; and
o Graduation and transfer rates, graduate earnings, and
advanced degrees earned by graduates as indicators of
program quality.
• To use such indicators to guide the disbursement of federal
student assistance, providing more support to students
attending high performing colleges.
• Through a “Race to the Top” program, to encourage states to
develop and implement higher education programs that have
higher value and lower costs.
• To provide a bonus to colleges that graduate large numbers
of Pell grant recipients, and to require higher levels of
accountability and regulatory control for colleges with high
drop-out rates.
• To strengthen academic progress requirements for students to
receive continued financial aid.receive continued financial aid.
CARLOW UNIVERSITY
To promote innovation and competition President Obama challenges
colleges and universities to offer credit for prior learning, to grant
credit for demonstrated competency rather than seat time, to
use technology to reduce costs and improve quality, to expand
dual-enrollment in high schools, and to develop and implement
other innovations that would reduce costs and accelerate degree
completion. To facilitate the widespread implementation of such
changes, the Administration proposes providing students with
information about innovative institutions, supporting innovation with
grant funds, and reducing regulatory barriers.
Finally, the President proposes to make all federal student loan
borrowers eligible for “pay as you earn” repayment plans based
on income and to launch an enrollment campaign encouraging
borrowers who have fallen behind in payments to use these plans.
3NATIONAL SURVEY OF STUDENT ENGAGEMENT | ANNUAL RESULTS 2013
problems. An authentic postsecondary education is more than simply
acquiring knowledge; it must produce a sophisticated ability to use
knowledge creatively to solve problems and add value. An unengaged
undergraduate education will ultimately prove disappointing both to
students and those who employ them.
Scale. Attainment at scale is feasible only if many more students who
now leave college without a degree acquire the learning and skills
signified by a legitimate degree. First-generation students, some older
adults, low-income students, underprepared students, and those
lacking sufficient motivation often fail to get engaged and persist in
postsecondary education. Such students persist and learn, not when
they are left to fend for themselves in an alien environment, but when
colleges and universities engage them in learning activities they find
rewarding and meaningful.
Cost effectiveness. The engagement indicators and high impact
practices reported in NSSE 2013 are derived from years of research
on the components of an excellent undergraduate education and the
experience of faculty and students in hundreds of institutions. The
evidence is compelling—students who have these experiences persist
and graduate and acquire the knowledge and skill of an educated
person at higher rates. So the effectiveness of these practices is clear.
Do they cost more?
An ineffective educational program is always more expensive in the long
run than an effective one. It takes the time and money of students and
the public without returning commensurate value. While colleges and
universities can always use additional money, many institutions have found
ways to use the money they have to improve educational quality. Many
high impact educational practices can be employed without increased
cost, or by reallocating funds from less effective purposes. Monitoring the
student experience and pursuing higher levels of student engagement will
pay dividends in learning, retention, persistence, and completion.
The “fresh look” of NSSE 2013 is designed to help advance those ends.
Let’s put NSSE findings to use, so we can improve undergraduate
education and produce the results society needs.
Paul E. Lingenfelter
Former President
State Higher Education Executive Officers Association
LEBANON VALLEY COLLEGE

4 NATIONAL SURVEY OF STUDENT ENGAGEMENT | ANNUAL RESULTS 2013
DIRECTOR’S MESSAGE
If It’s Not Broken . . . Make It Better
For a project that reaches out to more than a million undergraduates annually
inviting them to describe their college experience, every year is a big year.
But 2013 is different. This has been a very big year. Not because of
the number of invited students (about 1.6 million) or the number of
participating institutions (more than 600), but because 2013 marks a
significant milestone for the National Survey of Student Engagement (NSSE).
Culminating several years of behind-the-scenes intensive development,
NSSE inaugurated an updated version of the survey—representing the
most significant change since the project’s launch at the millennium.
Stability is vital to projects like NSSE. Participating institutions track
their results over time to monitor the impact of improvement efforts.
At the Indiana University Center for Postsecondary Research as well,
we examine trend data like those documented in the 2009 and 2012
editions of this report. Along with stability, however, is the need to adapt
in response to accumulated experience, new research findings, and
changes in the nature and context of undergraduate education. How can
we balance these competing priorities—one opposing change, the other
favoring it? Our answer borrows a concept from evolutionary biology,
punctuated equilibrium (Eldredge & Gould, 1972), which posits that
evolution is not characterized by steady, gradual change but, rather, by
long periods of stability punctuated by bursts of change. We committed
to maintaining the survey’s stability over a long period while collecting
ideas and suggestions, incorporating those ideas and suggestions in an
eventual, substantial update, and returning to a period of stability.
Intensive survey development
Our approach to updating the survey was rigorous and deliberate.
Thanks to NSSE’s growth over the previous decade, we had
accumulated a rich set of findings as well as many suggestions from
institutional users. We also had a staff of capable and dedicated
research analysts. To draw on a wide range of technical experience
and expertise, we reconstituted NSSE’s Technical Advisory Panel. Our
research team split into groups by content area charged with reviewing
research and consulting with experts. Team members also led different
components of a comprehensive battery of psychometric analyses.
Virtually everything about the updated survey has been thoroughly
researched and tested. Item development was informed by several
years of experimental questions appended to the standard NSSE
survey for samples of respondents and by two years of pilot testing at
a diverse group of more than 70 colleges and universities (see box).
Student focus groups and cognitive interviews at 10 institutions guided
refinements to wording and response frames.
As part of this process, NSSE’s companion surveys—the Faculty Survey
of Student Engagement and the Beginning College Survey of Student
Engagement—were also updated to maintain their alignment with NSSE.
Key changes
I am often asked what excites me most about the updated survey. This
is a tough question, because the real answer is “Nearly everything!” Yet
four broad categories do stand out:
• New content. We expanded coverage of the student experience by
adding questions about learning strategies, quantitative reasoning,
and effective teaching practices.
• Refined content. We improved our coverage of collaborative
learning, experiences with diversity, and quality of interactions.
We simplified wording related to higher-order learning, and we
reworded many items to be more neutral with regard to the mode
of course delivery.
• New summary measures. The new Engagement Indicators, which
succeed NSSE’s Benchmarks of Effective Educational Practice,
provide targeted and concrete summaries of different facets of
student engagement. Much of this year’s report is devoted to
introducing and describing these new measures.
• Topical modules. As valuable as the NSSE survey has been, it is
unavoidably broad rather than deep—asking a limited number
of questions about a lot of important things. Now, institutions
can dig deeper into topics of special interest by appending up
to two topical modules to the core survey. These short, focused
question sets inquire into specific experiences (for example,
advising, experiences with writing, civic engagement, learning with
technology, and experiences with diverse perspectives). In this
report, we describe results from two topical modules—advising and
learning with technology.
What has not changed is NSSE’s signature focus on experiences that matter
to student learning and development—examined with a strong focus on
behavior. Our primary emphasis remains twofold: enriching the discourse on
college quality and providing colleges and universities with diagnostic
and actionable information that can inform educational improvement.
A collaborative venture
Many people have contributed to NSSE’s development and success,
from its founding to the recent update. Russ Edgerton, then at the Pew
Charitable Trusts, had the big idea. Peter Ewell, at the National Center for
Higher Education Management Systems, convened the expert panel that
designed the first survey. At Indiana University, George Kuh assembled a

PARTNERS IN DEVELOPING NSSE 2013
Pilot survey, focus group, and cognitive interview sites
External partners in module development
Technical Advisory Panel
Albany State University Alma College American Public University System Averett University Baldwin-Wallace College Ball State University Bellarmine University Belmont University Bethel University Boise State University Bowling Green State University Bradley University California State University, Fullerton California State University, Northridge Carnegie Mellon University Connecticut College Cornell College DePauw University Earlham College Georgia College & State University Grand View University Hanover College Henderson State University Indiana University Bloomington Indiana University Southeast Indiana University-Purdue University Indianapolis Johnson State College Kaplan University Kenyon College Marquette University Meredith College Miami University-Oxford New Jersey City University Northern Kentucky University Oakland University Ohio Wesleyan University Philander Smith College Ramapo College of New Jersey Roger Williams University
Saint Anselm College San Diego State University Savannah State University Slippery Rock University of Pennsylvania Southwestern University SUNY Potsdam Sweet Briar College Taylor University Texas Christian University Texas Lutheran University Texas State University-San Marcos Truman State University University of Alabama University of Charleston University of Cincinnati University of Guelph University of La Verne University of Miami University of Minnesota-Crookston University of Nebraska at Kearney University of Nebraska at Lincoln University of New Brunswick - Fredericton University of North Carolina at Charlotte University of North Carolina Wilmington University of San Francisco University of South Florida University of Southern Mississippi University of the Incarnate Word University of Wisconsin-Eau Claire University of Wisconsin-Green Bay Utah State University Virginia Commonwealth University Weber State University Wiley College Wingate University Winthrop University Woodbury University Xavier University of Louisiana
American Association of State Colleges and UniversitiesAssociation of American Colleges and UniversitiesCouncil of Writing Program AdministratorsEDUCAUSE
Hamish Coates, Professor, University of Melbourne
Sirkka Kauffman, Assistant Dean for Academic Affairs, Marlboro College
John Kennedy, Senior Research Director, Indiana University Center for Survey Research
C. Nathan Marti, Principal, Abacist Analytics
Rick Miller, Vice President, Institutional Effectiveness and Enrollment Management, State University of New York at Potsdam
Gary Pike, Executive Director of Information Management & Institutional Research, Indiana University Purdue University Indianapolis
Tricia Seifert, Assistant Professor, University of Toronto
Robert Smallwood, Assistant to the Provost for Assessment, University of Alabama
Paul Umbach, Associate Professor, North Carolina State University
5NATIONAL SURVEY OF STUDENT ENGAGEMENT | ANNUAL RESULTS 2013
dedicated team to make the idea a reality and won the hearts and minds
of college and university leaders by demonstrating the value of student
engagement as a lens on college quality. John Kennedy and the Indiana
University Center for Survey Research delivered a state-of-the-art survey
administration system that could grow with the project. NSSE’s National
Advisory Board and Technical Advisory Panel, representing institutional
leaders, association leaders, researchers, and faculty, have provided wise
counsel over the life of the project. Our most crucial collaborators, of
course, are our student respondents.
Finally, I cannot overstate my gratitude to the NSSE staff, whose hard
work and dedication have cemented NSSE’s reputation for analytical
rigor and commitment to quality and continuous improvement. With
great pride in what we have accomplished, I am confident that
NSSE will continue to play a central role in advancing the quality of
undergraduate education.
Alexander C. McCormick
Director
Associate Professor of Educational Leadership and Policy Studies,
Indiana University
BRYANT UNIVERSITY
6 NATIONAL SURVEY OF STUDENT ENGAGEMENT | ANNUAL RESULTS 2013
QUICK FACTS
SurveyThe NSSE survey is administered online and takes about 15 minutes
to complete.
nsse.iub.edu/links/surveys
ObjectivesProvide data to colleges and universities to assess and improve
undergraduate education, inform quality assurance and accreditation
efforts, and facilitate national and sector benchmarking, among others.
Participating Colleges & UniversitiesSince its launch in 2000, more than 1,500 four-year colleges and
universities in the US and Canada have participated in NSSE, with 586
U.S. and 27 Canadian institutions in 2013. Participating institutions
generally mirror the national distribution of the 2010 Basic Carnegie
Classification (Figure 1).
AudiencesCollege and university leaders, faculty members, advisors, teaching
and learning center staff, assessment professionals, institutional
researchers, student life staff, governing boards, students, higher
education scholars, accreditors, government agencies, prospective
students and their families, high school counselors, and journalists.
Participation AgreementParticipating colleges and universities agree that NSSE can use the
data in the aggregate for reporting purposes and other undergraduate
research and improvement initiatives. NSSE may not disclose
institutionally identified results without permission. Colleges and
universities may use their own data for institutional purposes, including
public reporting.
AdministrationIndiana University Center for Postsecondary Research in cooperation
with the Indiana University Center for Survey Research.
Data SourcesCensus-administered or randomly sampled first-year and senior
students from bachelor’s degree-granting institutions. Supplemented
by other information such as institutional records and data from the
Integrated Postsecondary Education Data System (IPEDS).
Validity & ReliabilityThe NSSE survey was designed by an expert panel and updated in
2013 after extensive pilot testing to ensure validity and reliability. New,
continuing, and updated items were tested for clarity and applicability
of survey language, and to develop new measures related to effective
teaching and learning. The update process included cognitive interviews
and focus groups with students as well as feedback from institutional
users. Engagement Indicators were developed using exploratory and
confirmatory factor analysis, reliability analysis, item response theory,
generalizability theory, and known-groups comparisons. Refer to our online
Psychometric Portfolio for more information about NSSE data quality.
nsse.iub.edu/html/psychometric_portfolio.cfm
Response RatesThe average institutional response rate in 2013 was 30%. The
highest response rate among U.S. institutions was 80%, and 45% of
institutions achieved a response rate of at least 30%.
Consortia & University SystemsGroups of institutions sharing a common interest and university systems
receive group comparisons. Some groups add additional questions, and
some share student-level data among member institutions.
Figure 1: NSSE 2013 Participating Colleges and Universities
0%
5%
10%
15%
20%
25%
30%
NSSE 2013 National
RU/VH RU/H DRU Master’sM
Master’sS
Bac/A&S
Bac/Diverse
Master’sL
Carnegie 2010 Basic Classification
classifications.carnegiefoundation.org
Percentages are based on U.S. institutions that belong to one of
the eight Carnegie classifications above.
RU/VH Research Universities (very high research activity)
RU/H Research Universities (high research activity)
DRU Doctoral/Research Universities
Master’s L Master’s Colleges and Universities (larger programs)
Master’s M Master’s Colleges and Universities (medium programs)
Master’s S Master’s Colleges and Universities (smaller programs)
Bac/A&S Baccalaureate Colleges–Arts & Sciences
Bac/Diverse Baccalaureate Colleges–Diverse Fields

ConsortiaAmerican Democracy Project
Arts Consortium
Association of American Universities Data Exchange
Association of Independent Colleges of Art and Design
Association of Independent Technical Universities
Bringing Theory to Practice
Canadian Consortium
Canadian Research Universities
Canadian U4
Catholic Colleges & Universities
Colleges That Change Lives
Committee on Institutional Cooperation
Consortium for the Study of Writing in College
Council for Christian Colleges & Universities
Council of Independent Colleges
Council of Public Liberal Arts Colleges
Flashlight Group
G13-x-Ontario
Hispanic Serving Institutions
Historically Black Colleges and Universities
Information Literacy
Jesuit Colleges and Universities
Lutheran Colleges and Universities
Mid-Atlantic Private Colleges
Military Academy Consortium
Mission Engagement Consortium for Independent Colleges
New American Colleges and Universities
New Western Canadian Universities
Online Educators Consortium
Private Liberal Arts Colleges and Universities
Qatar Foundation/Education Division/OFSS
Seventh Day Adventist Colleges and Universities
Sustainability Education Consortium
Teagle Diversity Consortium
Teagle Integrated Learning Consortium
Texas Six
Urban Universities
Women’s Colleges
Work Colleges
State or University SystemsCalifornia State University
City University of New York
Concordia Universities
Connecticut State Universities
Indiana University
Kentucky Council on Postsecondary Education
Minnesota State Colleges and Universities
New Jersey Public Universities
North Dakota University System
Ohio State University System
Ontario Universities
Penn State System
Pennsylvania State System of Higher Education
South Dakota Public Universities
State University of New York
Tennessee Publics
Texas A&M System
University of Hawai’i
University of Louisiana System
University of Maryland
University of Massachusetts
University of Missouri
University of North Carolina
University of Texas
University of Wisconsin Comprehensives
University System of Georgia
CONSORTIA & STATE OR UNIVERSITY SYSTEMS 2000–2013
ConsortiaAmerican Democracy Project
Arts Consortium
Association of American Universities Data Exchange
Association of Independent Colleges of Art and Design
Association of Independent Technical Universities
Bringing Theory to Practice
Canadian Consortium
Canadian Research Universities
Canadian U4
Catholic Colleges & Universities
Colleges That Change Lives
Committee on Institutional Cooperation
Consortium for the Study of Writing in College
Council for Christian Colleges & Universities
Council of Independent Colleges
Council of Public Liberal Arts Colleges
Flashlight Group
G13-x-Ontario
Hispanic Serving Institutions
Historically Black Colleges and Universities
Information Literacy
Jesuit Colleges and Universities
Lutheran Colleges and Universities
Mid-Atlantic Private Colleges
Military Academy Consortium
Mission Engagement Consortium for Independent Colleges
New American Colleges and Universities
New Western Canadian Universities
Online Educators Consortium
Private Liberal Arts Colleges and Universities
Qatar Foundation/Education Division/OFSS
Seventh Day Adventist Colleges and Universities
Sustainability Education Consortium
Teagle Diversity Consortium
Teagle Integrated Learning Consortium
Texas Six
Urban Universities
Women’s Colleges
Work Colleges
State or University SystemsCalifornia State University
City University of New York
Concordia Universities
Connecticut State Universities
Indiana University
Kentucky Council on Postsecondary Education
Minnesota State Colleges and Universities
New Jersey Public Universities
North Dakota University System
Ohio State University System
Ontario Universities
Penn State System
Pennsylvania State System of Higher Education
South Dakota Public Universities
State University of New York
Tennessee Publics
Texas A&M System
University of Hawai’i
University of Louisiana System
University of Maryland
University of Massachusetts
University of Missouri
University of North Carolina
University of Texas
University of Wisconsin Comprehensives
University System of Georgia
7NATIONAL SURVEY OF STUDENT ENGAGEMENT | ANNUAL RESULTS 2013
Participation Cost & BenefitsThe NSSE survey is fully supported by institutional participation fees.
Base fees range from $1,800 to $7,800, determined by undergraduate
enrollment. Participation benefits include uniform third-party survey
administration; customizable survey invitations; survey customization
with optional topical modules or consortium questions; a student-level
data file of all respondents; comprehensive reporting that includes
results for three customizable comparison groups, major field reports,
and concise reports for campus leaders and prospective students; and
resources for interpreting results and translating them into practice.
Current InitiativesThe NSSE Institute for Effective Educational Practice is continuing
work on the Spencer Foundation funded project, Learning to Improve:
A Study of Evidence-Based Improvement in Higher Education, an
investigation of institutions that show a pattern of improved performance
in their NSSE results over time, and collaborating with the Community
College Survey of Student Engagement (CCSSE) and NSSE and CCSSE
partner institutions to create actionable information and strategies for
strengthening the engagement experiences of Latino students and
facilitating their successful transfer and college completion.
Other Programs & ServicesBeginning College Survey of Student Engagement (BCSSE), Faculty
Survey of Student Engagement (FSSE), NSSE Institute workshops and
Webinars, faculty and staff retreats, consulting, and custom analyses.
PartnersEstablished in 2000 with a grant from The Pew Charitable Trusts. Research
and development projects have been supported by Lumina Foundation for
Education, the Center of Inquiry in the Liberal Arts at Wabash College, the
Spencer Foundation, Teagle Foundation, and the National Postsecondary
Education Cooperative. NSSE’s Annual Results report is sponsored by the
Carnegie Foundation for the Advancement of Teaching.
“NSSE not only provides participating institutions a valid and reliable sense of how their students are learning through engagement with the institution, but also how this compares to other institutions. That’s powerful information for a student-centered institution.”— DAVID LONGANECKER, PRESIDENT, WESTERN INTERSTATE COMMISSION
FOR HIGHER EDUCATION

8 NATIONAL SURVEY OF STUDENT ENGAGEMENT | ANNUAL RESULTS 2013
SELECTED RESULTS
Engagement Indicators and High-Impact Practices: New Measures to Assess the Educational Experience
With the 2013 update to NSSE, sets of new, continuing, and modified
items were rigorously tested and grouped within ten Engagement
Indicators representing broad dimensions of the student experience
associated with learning and development. These indicators are
organized within four themes adapted from NSSE’s former Benchmarks
of Effective Educational Practice:
This section first introduces the Engagement Indicators, examining
how groups of students differ in these important dimensions and how
these measures relate to other forms of engagement such as time
spent studying and the challenging nature of coursework. Several of the
indicators are examined by groups of related majors, online education
status, age, and first-generation status. Next, we present results for the
six high-impact practices identified above–including a summary table
of results by student and institutional characteristics (page 21). We
then feature results for two of the six topical modules offered in 2013—
academic advising and the uses of technology in learning.
The section concludes with results from NSSE’s two companion
surveys, the Faculty Survey of Student Engagement (FSSE) and the
Beginning College Survey of Student Engagement (BCSSE). The
FSSE analysis examines results from the updated faculty survey by
disciplinary area, and includes results from FSSE’s academic advising
module. It also features findings from experimental NSSE and FSSE
questions about end-of-course evaluations. The BCSSE study includes
an account of entering first-year students and their intentions to major
in science, technology, engineering, or mathematics (STEM) fields.
Quick Takes
• Students whose courses challenged them to do their best work
also experienced greater emphasis on higher-order learning and
higher levels of reflective & integrative learning. Emphasis on
higher-order learning was nearly doubled among seniors who
indicated a high level of course challenge compared with those
whose courses provided low challenge.
• Effective learning strategies were more frequently used by students
who were older, enrolled part-time, or taking all their coursework
online, and were associated with higher self-reported college grades.
• On average, seniors in engineering and biology were most engaged
in collaborative learning, while their peers majoring in arts and
humanities, social sciences, and social service professions were
engaged in collaborative learning the least.
• Students taking all of their courses online were significantly less
engaged in collaborative learning.
• Seniors majoring in arts and humanities observed the highest
levels of effective teaching practices, while those in STEM fields –
especially engineering – observed the lowest levels.
• About one student in ten never met with an academic advisor
during the academic year.
• Both learning with technology and courses that improved students’
understanding and use of technology had a positive association
with all four of the NSSE academic challenge indicators.
• About one in three first-year students and one in four
seniors submitted evaluations to external providers such as
ratemyprofessors.com, and about half of all students said they used
these sources when selecting courses.
• The use of course evaluation results to improve courses and
teaching was more common among faculty at lower ranks than among
their more senior colleagues. About two-thirds of assistant professors
and full- or part-time lecturers frequently used the results, compared to
just over half of professors and associate professors.
Theme Engagement Indicators
Academic Challenge
Higher-Order Learning
Reflective & Integrative Learning
Learning Strategies
Quantitative Reasoning
Learning with PeersCollaborative LearningDiscussions with Diverse Others
Experiences with FacultyStudent-Faculty InteractionEffective Teaching Practices
Campus EnvironmentQuality of InteractionsSupportive Environment
Instead of combining a variety of enriching experiences in a single
benchmark, we now report separately on a set of High-Impact Practices
(participation in learning communities, service-learning, research with
a faculty member, internships or field experiences, study abroad, and
culminating senior experiences).
This report uses the new Engagement Indicators and measures of High-
Impact Practices as a powerful lens for understanding variations in the
quality of the undergraduate experience.
Introduction to Selected Results
The results reported in this section are based on nearly 335,000
census-administered or randomly sampled first-year and senior
students attending 568 U.S. bachelor’s degree-granting institutions
that participated in NSSE in spring 2013. We also used data from
two topical modules appended to the Web version of the survey for a
subset of 2013 institutions.
“NSSE results have informed our faculty development programming, conversations about class size and pedagogy, reports on the outcomes of grant-funded projects, discussions about campus climate, and analysis of results from other assessment efforts.”— JO BELD, DIRECTOR OF EVALUATION AND ASSESSMENT, PROFESSOR OF
POLITICAL SCIENCE, ST. OLAF COLLEGE
9NATIONAL SURVEY OF STUDENT ENGAGEMENT | ANNUAL RESULTS 2013
Interestingly, three quarters of students taking all of their courses online
experienced high levels of challenge, compared with 55% to 59%
of those who had no online courses (Table 3). Online students spent
slightly more time studying and reading, and they were assigned more
writing on average.
SELECTED RESULTS: ACADEMIC CHALLENGE
Table 2: Key Academic Challenge Items for Seniors by Related-Major Category
Preparing for class Reading Assigned
writingaChallenging
coursesb
Institutional emphasis on academicsc
hours per week
hours per week pages % %
Arts & Humanities 16 8 80 60 79
Biological Sciences, Agriculture, & Natural Resources
16 7 66 60 84
Physical Sciences, Mathematics, & Computer Science
17 6 58 57 81
Social Sciences 14 8 92 58 80
Business 14 7 81 60 82
Communications, Media, & Public Relations 12 6 81 53 75
Education 15 6 80 65 80
Engineering 19 5 86 61 86
Health Professions 16 7 75 70 86
Social Service Professions 13 7 92 64 81
a. Based on reported number of assigned papers of various lengthsb. Percentage of those selecting 6 or 7 on a scale from 1=“Not at all” to 7=“Very much” c. Percentage of those responding “Quite a bit” or “Very much”
Table 3: Key Academic Challenge Items by Online Status
Preparing for class Reading Assigned
writingaChallenging
coursesb
Institutional emphasis on academicsc
hours per week
hours per week pages % %
First-year
Taking all courses online
15 8 59 76 86
Taking no courses online
14 6 45 55 84
Senior
Taking all courses online
16 8 107 75 84
Taking no courses online
15 7 75 59 81
a. Based on reported number of assigned papers of various lengthsb. Percentage of those selecting 6 or 7 on a scale from 1=“Not at all” to 7=“Very much” c. Percentage of those responding “Quite a bit” or “Very much”
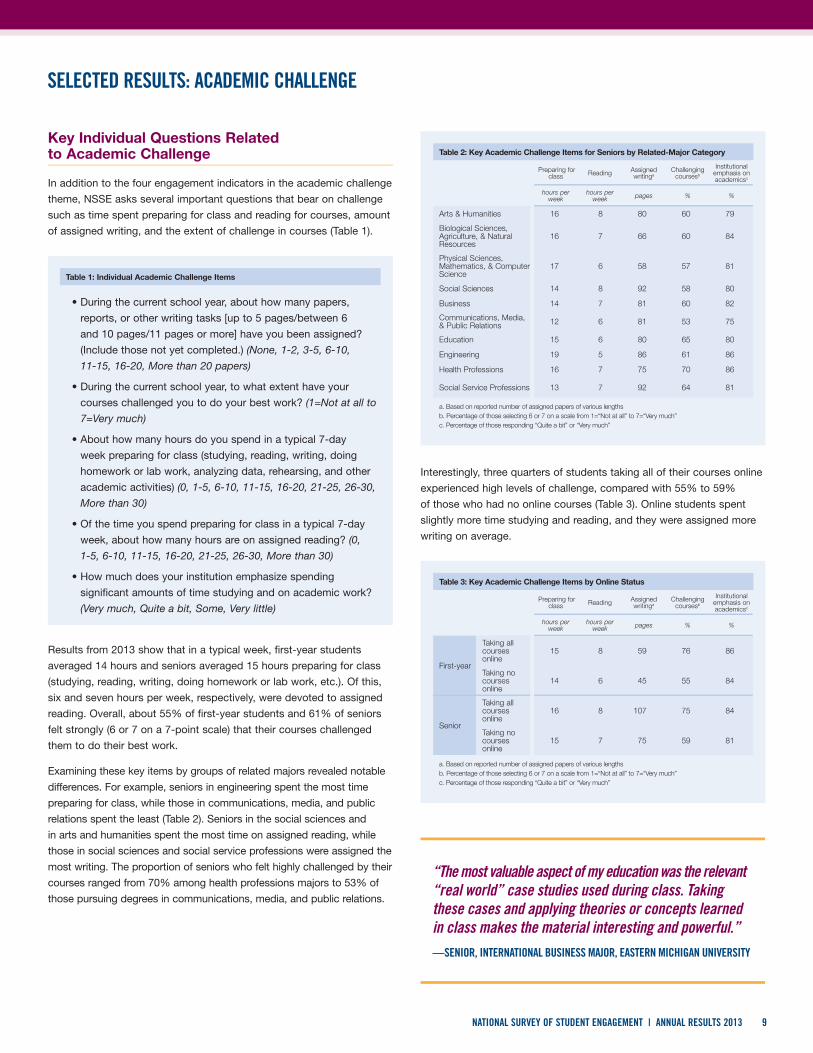
Key Individual Questions Related to Academic Challenge
In addition to the four engagement indicators in the academic challenge
theme, NSSE asks several important questions that bear on challenge
such as time spent preparing for class and reading for courses, amount
of assigned writing, and the extent of challenge in courses (Table 1).
Results from 2013 show that in a typical week, first-year students
averaged 14 hours and seniors averaged 15 hours preparing for class
(studying, reading, writing, doing homework or lab work, etc.). Of this,
six and seven hours per week, respectively, were devoted to assigned
reading. Overall, about 55% of first-year students and 61% of seniors
felt strongly (6 or 7 on a 7-point scale) that their courses challenged
them to do their best work.
Examining these key items by groups of related majors revealed notable
differences. For example, seniors in engineering spent the most time
preparing for class, while those in communications, media, and public
relations spent the least (Table 2). Seniors in the social sciences and
in arts and humanities spent the most time on assigned reading, while
those in social sciences and social service professions were assigned the
most writing. The proportion of seniors who felt highly challenged by their
courses ranged from 70% among health professions majors to 53% of
those pursuing degrees in communications, media, and public relations.
Table 1: Individual Academic Challenge Items
• During the current school year, about how many papers,
reports, or other writing tasks [up to 5 pages/between 6
and 10 pages/11 pages or more] have you been assigned?
(Include those not yet completed.) (None, 1-2, 3-5, 6-10,
11-15, 16-20, More than 20 papers)
• During the current school year, to what extent have your
courses challenged you to do your best work? (1=Not at all to
7=Very much)
• About how many hours do you spend in a typical 7-day
week preparing for class (studying, reading, writing, doing
homework or lab work, analyzing data, rehearsing, and other
academic activities) (0, 1-5, 6-10, 11-15, 16-20, 21-25, 26-30,
More than 30)
• Of the time you spend preparing for class in a typical 7-day
week, about how many hours are on assigned reading? (0,
1-5, 6-10, 11-15, 16-20, 21-25, 26-30, More than 30)
• How much does your institution emphasize spending
significant amounts of time studying and on academic work?
(Very much, Quite a bit, Some, Very little)
“The most valuable aspect of my education was the relevant “real world” case studies used during class. Taking these cases and applying theories or concepts learned in class makes the material interesting and powerful.”— SENIOR, INTERNATIONAL BUSINESS MAJOR, EASTERN MICHIGAN UNIVERSITY

10 NATIONAL SURVEY OF STUDENT ENGAGEMENT | ANNUAL RESULTS 2013
SELECTED RESULTS: ACADEMIC CHALLENGE (CONTINUED)
courses experienced almost twice as much course emphasis on higher-
order learning than their counterparts who experienced low levels of
course challenge. A similar association held for reflective and integrative
learning, but to a lesser degree.
Certain academic behaviors were also associated with course emphasis
on higher-order learning. Pinpointing specific behaviors to higher-order
learning may be valuable for faculty teaching undergraduates. For
example, faculty commonly assign course readings and writing papers
and reports that challenge students to approach course material in
deeper ways. Figure 3 shows a positive relationship between amount
of reading and higher-order learning. Course emphasis on higher-order
learning increased steadily when students spent more time reading for
class.
Higher-order learning was also positively associated with the amount
of writing students were assigned (Figure 5). Overall, the more writing
tasks first-year students were assigned, the more they perceived
higher-order learning was emphasized in their courses. This relationship
was especially true for short and medium-length papers. With long
papers, students who wrote at least one were more likely to be asked
by faculty to engage in higher-order learning.
Reflective & Integrative Learning
Reflective and integrative learning requires students to personally
connect with the course material by considering prior knowledge and
experiences, other courses, and societal issues. Students must take
into account the diverse perspectives of others as well as their own
views while examining the views of others. Reflective and integrative
learning is characteristic of students who engage in deep approaches
to learning (Nelson Laird et al., 2006). Intentional learners will apply
Higher-Order Learning
Higher-order learning is composed of four items which measure the
extent to which students perceive their coursework to emphasize
more complex, challenging thinking skills. Generally, students who
participate in courses that emphasize higher-order learning are more
likely to apply what they learned to practical problems, analyze ideas
and experiences, evaluate information from other sources, and form
new ideas from various pieces of information. Challenging students to
engage in these practices, as well as reflective and integrative learning,
are signals that students are approaching learning in a deep way, and
thus, gaining knowledge beyond a surface-level understanding (Marton
& Säljö, 1976, 1997; Nelson Laird et al., 2006).
The NSSE survey also asks students to indicate, on a seven-point
scale, the degree to which courses challenged them to do their
best work. Does emphasizing higher-order learning in the classroom
correspond to a challenging learning environment? Figure 2 suggests
that it does. For example, seniors who felt highly challenged by their 0 15 30 45 60
0
1-5
6-10
11-15
More than15
First-year
Ho
urs
per
Wee
k
Senior
Figure 3: Higher-Order Learning by Time Spent Reading for Class
0 15 30 45 60
Low challenge(1 or 2)
Moderatechallenge
(3, 4, or 5)
High challenge(6 or 7)
0 15 30 45 60
Low challenge(1 or 2)
Moderatechallenge
(3, 4, or 5)
High challenge(6 or 7)
Reflective & Integrative Learning
Higher-Order Learning
Figure 2: Higher-Order Learning and Reflective &Integrative Learning by Perceptions of Course Challenge
First-year
Senior

11NATIONAL SURVEY OF STUDENT ENGAGEMENT | ANNUAL RESULTS 2013
0 15 30 45 60
Largepapers
(11 pagesor more)
Mediumpapers
(6 to 10pages)
Shortpapers(up to
5 pages)
Num
ber
of
Ass
ignm
ents
fo
rS
hort
, Med
ium
, and
Lo
ng P
aper
s
Noassignments
1–2assignments
3–5assignments
More than 5assignments
Num
ber
of
Ass
ignm
ents
fo
rS
hort
, Med
ium
, and
Lo
ng P
aper
s
Reflective & Integrative Learning
0 15 30 45 60
Largepapers
(11 pagesor more)
Mediumpapers
(6 to 10pages)
Shortpapers(up to
5 pages)
Higher-Order Learning
Figure 5: The Relationship between Amount of Writing andTwo Engagement Indicators for First-Year Students
0 15 30 45 60
Engineering
Phys Sci,Math, CS
HealthProfessions
Business
Bio, Agric, &Nat Res
Education
Social SvcProfessions
Comm,Media, PR
Arts & Humanities
Social Sciences
Figure 4: Reflective & Integrative Learningby Related-Major Categories
First-year
Senior
these skills as way to gain a deeper understanding of the course
material (Huber & Hutchings, 2004). However, depending upon
students’ major field of study, they may apply these skills at varying
degrees (Figure 4). For example, seniors majoring in the arts and
humanities, social sciences, and social service professions engaged
in reflective and integrative learning more than those majoring in
engineering, physical sciences, mathematics, and computer science.
Similar to findings reported above with higher-order learning, higher
levels of reflective and integrative learning were associated with
students feeling challenged to do their best work in the classroom
(Figure 2). Likewise, first-year students’ reflective and integrative
learning also varied by the length of the writing assignment as well as
the number of times they were assigned the task (Figure 5).
GOUCHER COLLEGE

12 NATIONAL SURVEY OF STUDENT ENGAGEMENT | ANNUAL RESULTS 2013
SELECTED RESULTS: ACADEMIC CHALLENGE (CONTINUED)
Finally, such strategies appear to vary between the disciplines. Seniors
majoring in health and social service professions reported the greatest use,
while those majoring in engineering and physical sciences, mathematics, and
computer sciences reported the least use of learning strategies (Figure 7).
Learning Strategies
Learning strategies are specific activities that students use to gain
knowledge. Students enhance their learning and retention by actively
engaging with and analyzing course material rather than approaching
learning as absorption. Academic performance depends on the
learning activities used, and students benefit when they use a variety
of approaches to study and learn, such as taking notes when reading,
summarizing and organizing new information, and creating a study-
friendly environment (Vermetten et al., 1999).
The NSSE 2013 survey included three new questions which form a reliable
engagement indicator on the use of learning strategies. Results showed
that the use of these strategies varied by selected student characteristics
(Figure 6). For example, students’ use of learning strategies were positively
related to self-reported grades. First-year students and seniors who earned
mostly A’s used learning strategies significantly more than those who
earned grades of C or lower. Females report significantly greater use of
learning strategies than males. Learning strategies were also used more
frequently by nontraditional college students. Student who were older or
taking all their coursework online used study strategies more often than
their counterparts. Additionally, first-generation students, transfer students,
and students not living on campus used learning strategies more often
than their counterparts (Figure 6).0 15 30 45 60
Social SvcProfessions
Social Sciences
Phys Sci,Math, CS
HealthProfessions
Engineering
Education
Comm,Media, PR
Business
Bio, Agric, &Nat Res
Arts & Humanities
Figure 7: Learning Strategies by Related-Major Category
First-year
Senior
Figure 6: Use of Learning Strategies by Student Characteristics
Identifed keyinformation from
reading assignmentsReviewed notes
after class
First-year
First-generation
Not first-generation
Transfer
Started here
Live on-campus
Live off-campus
Traditional age
Nontraditional age
All online classes
Some online classes
No online classes
Male
Female
Cs or lower
Mostly Bs
Mostly As
Summarized whatyou are learning in
class or from course
81
81
83
81
81
82
81
86
90
81
81
78
83
71
79
85
69
65
72
66
64
70
65
77
77
69
65
62
70
58
65
69
66
63
71
63
62
68
62
75
80
65
63
62
66
55
63
67
Identifed keyinformation from
reading assignmentsReviewed notes
after class
Senior
Summarized whatyou are learning in
class or from course
85
83
86
83
82
84
82
88
91
84
83
81
86
73
82
87
69
61
70
59
56
66
58
74
73
67
62
60
68
58
63
67
69
64
70
63
60
67
62
73
78
67
64
63
69
57
64
69
Note: Values are the percentage of students who responded “Very often” or “Often” to each item. Traditional age is defined as under 21 for first-year students and under 25 for seniors. First-generation: Neither parent holds a bachelor’s degree.
13NATIONAL SURVEY OF STUDENT ENGAGEMENT | ANNUAL RESULTS 2013
SELECTED RESULTS: ACADEMIC CHALLENGE (CONTINUED)
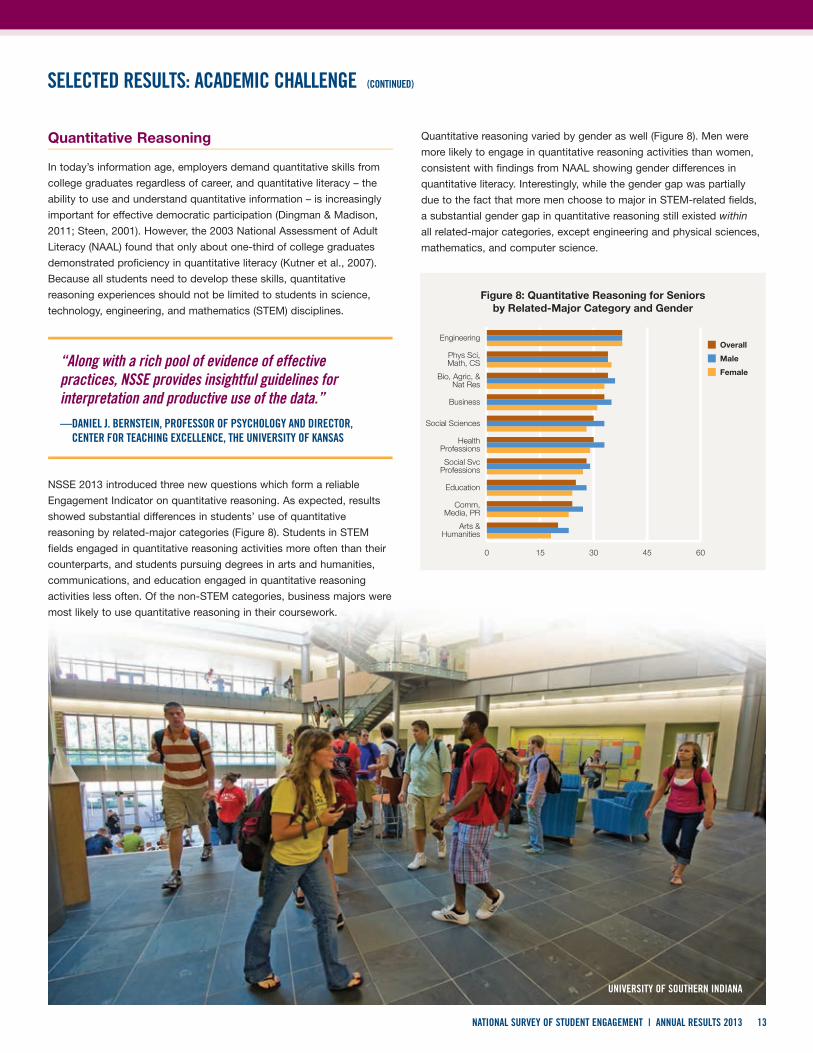
Quantitative reasoning varied by gender as well (Figure 8). Men were
more likely to engage in quantitative reasoning activities than women,
consistent with findings from NAAL showing gender differences in
quantitative literacy. Interestingly, while the gender gap was partially
due to the fact that more men choose to major in STEM-related fields,
a substantial gender gap in quantitative reasoning still existed within
all related-major categories, except engineering and physical sciences,
mathematics, and computer science.
Quantitative Reasoning
In today’s information age, employers demand quantitative skills from
college graduates regardless of career, and quantitative literacy – the
ability to use and understand quantitative information – is increasingly
important for effective democratic participation (Dingman & Madison,
2011; Steen, 2001). However, the 2003 National Assessment of Adult
Literacy (NAAL) found that only about one-third of college graduates
demonstrated proficiency in quantitative literacy (Kutner et al., 2007).
Because all students need to develop these skills, quantitative
reasoning experiences should not be limited to students in science,
technology, engineering, and mathematics (STEM) disciplines.
NSSE 2013 introduced three new questions which form a reliable
Engagement Indicator on quantitative reasoning. As expected, results
showed substantial differences in students’ use of quantitative
reasoning by related-major categories (Figure 8). Students in STEM
fields engaged in quantitative reasoning activities more often than their
counterparts, and students pursuing degrees in arts and humanities,
communications, and education engaged in quantitative reasoning
activities less often. Of the non-STEM categories, business majors were
most likely to use quantitative reasoning in their coursework.
0 15 30 45 60
Arts & Humanities
Comm,Media, PR
Education
Social SvcProfessions
HealthProfessions
Social Sciences
Business
Bio, Agric, &Nat Res
Phys Sci,Math, CS
Engineering
Figure 8: Quantitative Reasoning for Seniorsby Related-Major Category and Gender
Overall
Male
Female
UNIVERSITY OF SOUTHERN INDIANA
“Along with a rich pool of evidence of effective practices, NSSE provides insightful guidelines for interpretation and productive use of the data.”— DANIEL J. BERNSTEIN, PROFESSOR OF PSYCHOLOGY AND DIRECTOR,
CENTER FOR TEACHING EXCELLENCE, THE UNIVERSITY OF KANSAS

14 NATIONAL SURVEY OF STUDENT ENGAGEMENT | ANNUAL RESULTS 2013
SELECTED RESULTS: LEARNING WITH PEERS
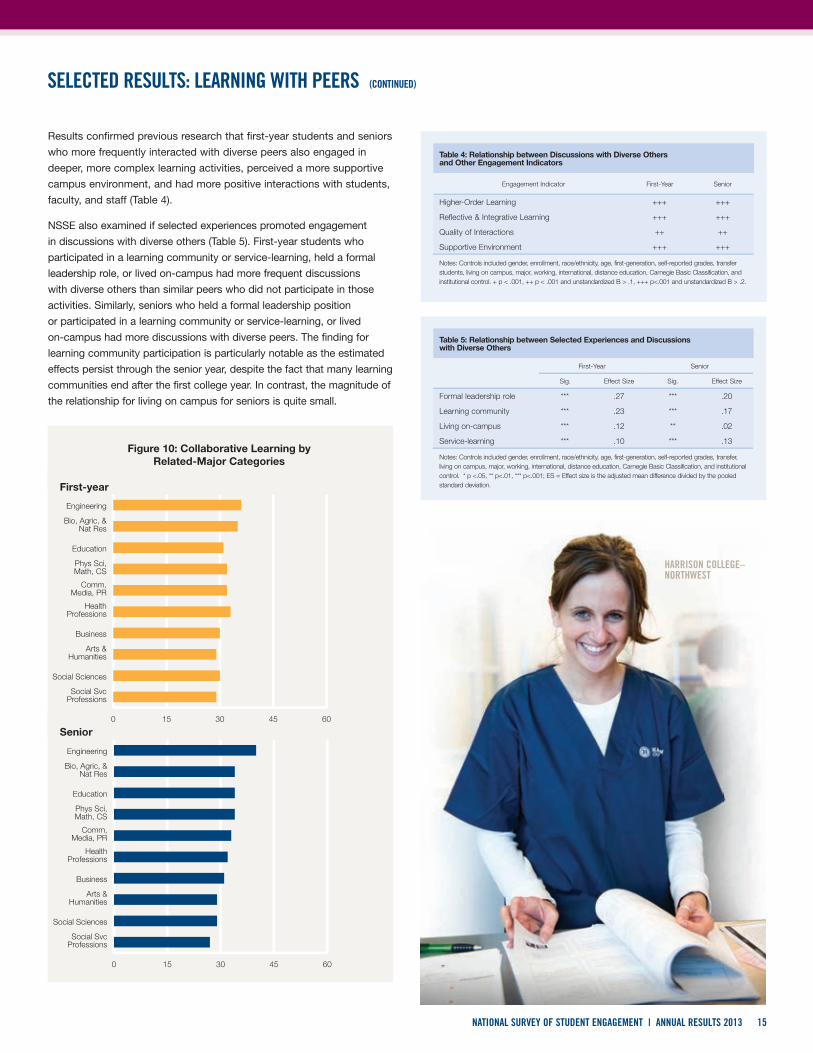
professions were the least engaged (Figure 10). In general, students
majoring in science fields reported higher levels of collaborative learning
compared to their peers in the social science disciplines.
Staff and faculty interested in increasing collaboration can use these
results to better understand challenges they may face depending on
their discipline, teaching modality, or student characteristics.
Discussions with Diverse Others
Many undergraduates arrive on college campuses having lived only
in relatively homogenous communities (Orfield, 2009). Consequently,
college provides opportunities to engage with others with different
backgrounds, experiences, and beliefs for the first time. An increasing
amount of research has found that structural and interaction diversity
promotes a wide variety of academic and civic outcomes (Gurin et
al., 2002; Loes, Pascarella, & Umbach, 2012). Consequently, with
the updated survey in 2013, NSSE expanded the number of items
focusing on diversity and created the “Discussions with Diverse Others”
Engagement Indicator. These questions ask students how often they
had discussions with people from a different race or ethnicity, economic
background, religious belief, and political view than their own.
Collaborative Learning
Collaborative learning enhances student success by facilitating
motivation, shared understanding of material, and peer support,
among other benefits across disciplines and contexts (McKeachie,
2002; Ormrod, 2008). NSSE’s updated collaborative learning scale
includes four items, which ask students how often they seek academic
help, explain course material, prepare for exams, and work on course
projects or assignments with other students.
As important as collaborative learning is to student success, we
know that not all students are equally engaged in collaborative
learning. Below, NSSE 2013 data were used to highlight differences
in collaborative learning for first-year students by selected student
and institutional characteristics (Figure 9). First-generation students,
older students, and students taking all their courses online engaged
in collaborative learning at significantly lower levels. Among institution
characteristics, first-year students attending Baccalaureate A&S
institutions were engaged the most in collaborative learning, whereas
students at Master’s-large institutions collaborated the least. Students
attending public institutions were slightly more collaborative on average
than their peers at private institutions. Finally, students enrolled at
institutions with 2,500 or fewer undergraduate students also reported
the highest levels of collaborative learning. Results for seniors, not
shown, were the same.
Both first-year and senior engineering students were more engaged
in collaborative learning activities than students majoring in all
other disciplinary areas, while their peers majoring in social service
Figure 9: Collaborative Learning in the First Year bySelected Student and Institutional Characteristics
0 15 30 45 60
10,000 or more
5,000 to 9,999
2,501 to 4,999
2,500 or fewer
Private
Public
Bac/Diverse
Bac/A&S
Master's S
Master's M
Master's L
DRU
RU/H
RU/VH
All
None
Nontraditional
Traditional
No
Yes
Enrollment Size
Online coursework
Age
Control
Institutional CharacteristicsBasic Carnegie Type
Student CharacteristicsFirst-generation
0 15 30 45 60
UNIVERSITY OF TENNESSEE, KNOXVILLE
15NATIONAL SURVEY OF STUDENT ENGAGEMENT | ANNUAL RESULTS 2013
SELECTED RESULTS: LEARNING WITH PEERS (CONTINUED)
Results confirmed previous research that first-year students and seniors
who more frequently interacted with diverse peers also engaged in
deeper, more complex learning activities, perceived a more supportive
campus environment, and had more positive interactions with students,
faculty, and staff (Table 4).
NSSE also examined if selected experiences promoted engagement
in discussions with diverse others (Table 5). First-year students who
participated in a learning community or service-learning, held a formal
leadership role, or lived on-campus had more frequent discussions
with diverse others than similar peers who did not participate in those
activities. Similarly, seniors who held a formal leadership position
or participated in a learning community or service-learning, or lived
on-campus had more discussions with diverse peers. The finding for
learning community participation is particularly notable as the estimated
effects persist through the senior year, despite the fact that many learning
communities end after the first college year. In contrast, the magnitude of
the relationship for living on campus for seniors is quite small.
0 15 30 45 60
Social SvcProfessions
Social Sciences
Arts & Humanities
Business
HealthProfessions
Comm,Media, PR
Phys Sci,Math, CS
Education
Bio, Agric, &Nat Res
Engineering
Senior
First-year
Figure 10: Collaborative Learning byRelated-Major Categories
0 15 30 45 60
Social SvcProfessions
Social Sciences
Arts & Humanities
Business
HealthProfessions
Comm,Media, PR
Phys Sci,Math, CS
Education
Bio, Agric, &Nat Res
Engineering
Table 4: Relationship between Discussions with Diverse Others and Other Engagement Indicators
Engagement Indicator First-Year Senior
Higher-Order Learning +++ +++
Reflective & Integrative Learning +++ +++
Quality of Interactions ++ ++
Supportive Environment +++ +++
Notes: Controls included gender, enrollment, race/ethnicity, age, first-generation, self-reported grades, transfer students, living on campus, major, working, international, distance education, Carnegie Basic Classification, and institutional control. + p < .001, ++ p < .001 and unstandardized B > .1, +++ p<.001 and unstandardized B > .2.
Table 5: Relationship between Selected Experiences and Discussions with Diverse Others
First-Year Senior
Sig. Effect Size Sig. Effect Size
Formal leadership role *** .27 *** .20
Learning community *** .23 *** .17
Living on-campus *** .12 ** .02
Service-learning *** .10 *** .13
Notes: Controls included gender, enrollment, race/ethnicity, age, first-generation, self-reported grades, transfer, living on campus, major, working, international, distance education, Carnegie Basic Classification, and institutional control. * p <.05, ** p<.01, *** p<.001; ES = Effect size is the adjusted mean difference divided by the pooled standard deviation.
HARRISON COLLEGE–NORTHWEST

16 NATIONAL SURVEY OF STUDENT ENGAGEMENT | ANNUAL RESULTS 2013
SELECTED RESULTS: EXPERIENCES WITH FACULTY
In addition, students attending smaller institutions were more likely
to interact with faculty (Figure 12). For example, 33% of first-year
students and 46% of seniors at the smallest institutions (those with
total enrollments below 1,000) discussed course topics, ideas, or
concepts “Very often” or “Often” with faculty members, compared with
22% and 28% of their counterparts at the largest institutions (with total
enrollments larger than 10,000).
Effective Teaching Practices
Faculty who teach their courses with clarity and organization, and
provide prompt and formative feedback have a positive impact on
the learning and development of their students. In 2008, the Wabash
National Study of Liberal Arts Education (WNSLAE) found that students’
perceptions of various effective teaching practices were positively
associated with critical thinking, psychological well-being, leadership,
openness to diversity, and academic motivation (Blaich & Wise, 2008).
In light of these findings, NSSE adapted a set of the WNSLAE items for
a new engagement indicator—Effective Teaching Practices—which asks
students for their perceptions of the teaching they received. The questions
ask if instructors taught with clarity and organization, if they used examples
to explain difficult points, and if they emphasized formative feedback as
well as prompt and detailed feedback on tests or completed assignments.
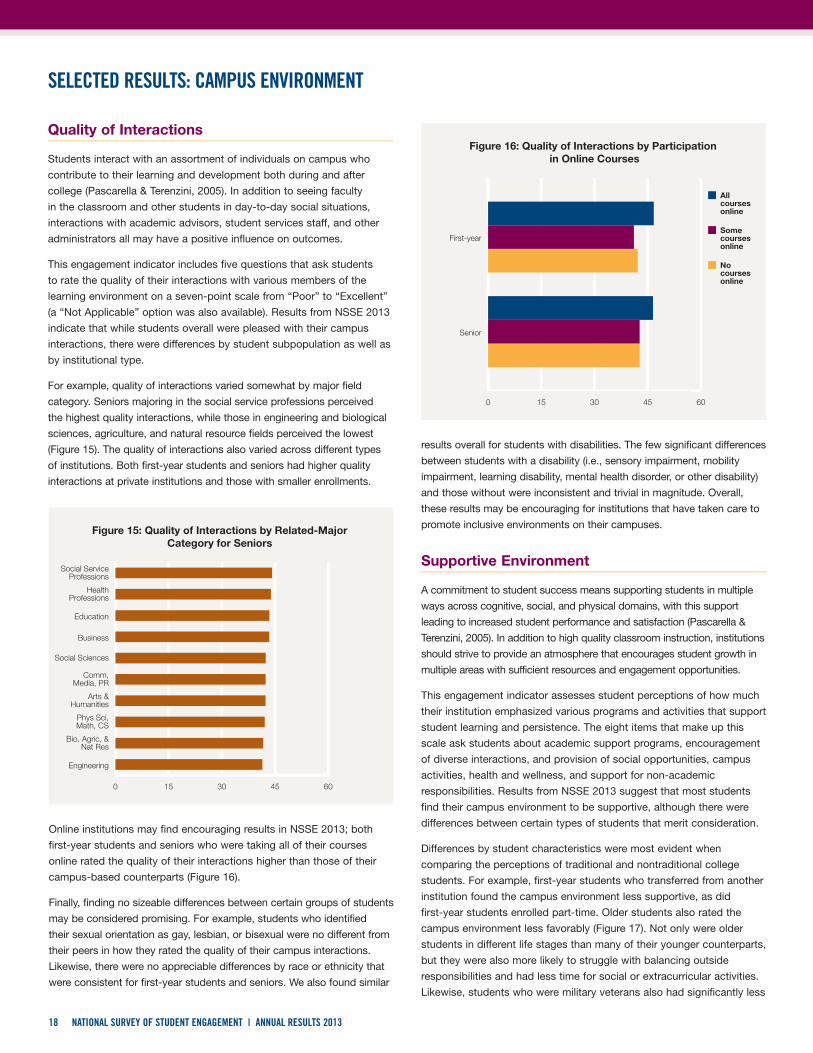
Results showed that student perceptions varied somewhat by discipline
(Figure 13). Seniors majoring in arts and humanities and social service
professions experienced the highest levels of effective teaching
practices, while those in STEM fields—especially engineering—
experienced the lowest levels. To illustrate, 85% of seniors in arts and
humanities said their instructors clearly explained course goals and
requirements, compared with 77% of engineering students. Additionally,
more seniors in arts and humanities (72%) than engineering (61%) said
their instructors emphasized prompt and detailed feedback on tests or
completed assignments “Very much” or “Quite a bit.”
Student-Faculty Interaction
Meaningful interactions with faculty impact a student’s college experience
in a multitude of ways (see discussion in Kuh & Hu, 2001) and can have
a positive influence on cognitive growth, development, and retention
(Pascarella & Terenzini, 2005). NSSE’s Student-Faculty Interaction
engagement indicator is based on responses to four questions—how
often students discussed their academic performance, career plans, and
course topics with faculty members, and how often they worked with
faculty on committees or activities other than coursework.
Results by selected student characteristics were consistent with past
NSSE findings (Figure 11). For example, for both first-year students and
seniors, full-time students and athletes interacted with faculty at higher
rates than their counterparts, while students taking all of their courses
online had fewer interactions with faculty. Seniors living on campus
were much more likely to have meaningful interactions with faculty, but
senior veterans, on the other hand, were less likely.
0 15 30 45 60
Senior
First-year
Figure 12: Student-Faculty Interactionby Enrollment Size
1,000or fewer
1,001to 3,000
3,001to 5,000
5,001 to 10,000
More than10,000
No
Yes
0 15 30 45 60
Veteran
Varsity athlete
Living oncampus
Taking allcourses online
Enrolledfull-time
Senior
First-year
0 15 30 45 60
Veteran
Varsity athlete
Living oncampus
Taking allcourses online
Enrolledfull-time
Figure 11: Student-Faculty Interactionby Selected Student Characteristics
Note: Enrollment size is total number of undergraduates.

17NATIONAL SURVEY OF STUDENT ENGAGEMENT | ANNUAL RESULTS 2013
SELECTED RESULTS: EXPERIENCES WITH FACULTY (CONTINUED)
Differences in approaches to teaching were also evident by institution
type (Figure 14). For example, students attending baccalaureate liberal
arts colleges were on average more likely to experience effective
teaching practices than their peers enrolled at research universities.
Given the results in Figure 13, we wondered if the greater concentration
of STEM majors at research universities might explain such differences.
Analyses showed, however, that only a very small proportion of
the differences between the baccalaureate colleges and research
universities can be explained by the composition of majors.
0 15 30 45 60
Engineering
Phys Sci,Math, CS
Bio, Agric, &Nat Res
Business
Comm,Media, PR
Education
HealthProfessions
Social Sciences
Social ServiceProfessions
Arts & Humanities
Figure 13: Effective Teaching Practices Resultsfor Seniors by Related-Major Categories
0 15 30 45 60
Bac/Diverse
Bac/A&S
Master's S
Master's M
Master's L
DRU
RU/H
RU/VH
Figure 14: Average Effective Teaching Practices Scoresby Carnegie Classification
First-year
Senior
CANISIUS COLLEGE
18 NATIONAL SURVEY OF STUDENT ENGAGEMENT | ANNUAL RESULTS 2013
SELECTED RESULTS: CAMPUS ENVIRONMENT
results overall for students with disabilities. The few significant differences
between students with a disability (i.e., sensory impairment, mobility
impairment, learning disability, mental health disorder, or other disability)
and those without were inconsistent and trivial in magnitude. Overall,
these results may be encouraging for institutions that have taken care to
promote inclusive environments on their campuses.
Supportive Environment
A commitment to student success means supporting students in multiple
ways across cognitive, social, and physical domains, with this support
leading to increased student performance and satisfaction (Pascarella &
Terenzini, 2005). In addition to high quality classroom instruction, institutions
should strive to provide an atmosphere that encourages student growth in
multiple areas with sufficient resources and engagement opportunities.
This engagement indicator assesses student perceptions of how much
their institution emphasized various programs and activities that support
student learning and persistence. The eight items that make up this
scale ask students about academic support programs, encouragement
of diverse interactions, and provision of social opportunities, campus
activities, health and wellness, and support for non-academic
responsibilities. Results from NSSE 2013 suggest that most students
find their campus environment to be supportive, although there were
differences between certain types of students that merit consideration.
Differences by student characteristics were most evident when
comparing the perceptions of traditional and nontraditional college
students. For example, first-year students who transferred from another
institution found the campus environment less supportive, as did
first-year students enrolled part-time. Older students also rated the
campus environment less favorably (Figure 17). Not only were older
students in different life stages than many of their younger counterparts,
but they were also more likely to struggle with balancing outside
responsibilities and had less time for social or extracurricular activities.
Likewise, students who were military veterans also had significantly less
Online institutions may find encouraging results in NSSE 2013; both
first-year students and seniors who were taking all of their courses
online rated the quality of their interactions higher than those of their
campus-based counterparts (Figure 16).
Finally, finding no sizeable differences between certain groups of students
may be considered promising. For example, students who identified
their sexual orientation as gay, lesbian, or bisexual were no different from
their peers in how they rated the quality of their campus interactions.
Likewise, there were no appreciable differences by race or ethnicity that
were consistent for first-year students and seniors. We also found similar
Quality of Interactions
Students interact with an assortment of individuals on campus who
contribute to their learning and development both during and after
college (Pascarella & Terenzini, 2005). In addition to seeing faculty
in the classroom and other students in day-to-day social situations,
interactions with academic advisors, student services staff, and other
administrators all may have a positive influence on outcomes.
This engagement indicator includes five questions that ask students
to rate the quality of their interactions with various members of the
learning environment on a seven-point scale from “Poor” to “Excellent”
(a “Not Applicable” option was also available). Results from NSSE 2013
indicate that while students overall were pleased with their campus
interactions, there were differences by student subpopulation as well as
by institutional type.
For example, quality of interactions varied somewhat by major field
category. Seniors majoring in the social service professions perceived
the highest quality interactions, while those in engineering and biological
sciences, agriculture, and natural resource fields perceived the lowest
(Figure 15). The quality of interactions also varied across different types
of institutions. Both first-year students and seniors had higher quality
interactions at private institutions and those with smaller enrollments.
0 15 30 45 60
Engineering
Bio, Agric, &Nat Res
Phys Sci,Math, CS
Arts &Humanities
Comm,Media, PR
Social Sciences
Business
Education
HealthProfessions
Social ServiceProfessions
Figure 15: Quality of Interactions by Related-MajorCategory for Seniors
0 15 30 45 60
Senior
First-year
Figure 16: Quality of Interactions by Participation in Online Courses
Allcoursesonline
Somecoursesonline
Nocoursesonline

19NATIONAL SURVEY OF STUDENT ENGAGEMENT | ANNUAL RESULTS 2013
SELECTED RESULTS: CAMPUS ENVIRONMENT (CONTINUED)
favorable perceptions of the campus environment, perhaps because
they were more likely to be older as well.
Perceptions of institutional support can relate to one’s physical environment
as well, and the experiences of nontraditional students also seemed to
influence these perceptions. Students living off-campus and those taking all
of their courses online found the campus environment to be less supportive.
This pattern was true for both first-year students as well as seniors (Figure 17).
Though many of the services, events, and activities offered by institutions
appeared to be beneficial for students having a traditional college
experience, they may have been less effective for part-time students,
transfer students, older students, military veterans, online learners,
and off-campus students. Still, there were favorable patterns related
to engagement in some extracurricular activities. For example, Greek-
affiliated students in fraternities and sororities and student athletes found
the campus environment more supportive than unaffiliated students. It
may be that the social camaraderie that comes from these activities has
a positive influence on overall perceptions of the campus environment.
0 15 30 45 60
Nontraditionalage
Traditionalage
Livingoff-campus
Livingon-campus
All OnlineCourses
Some OnlineCourses
No OnlineCourses
0 15 30 45 60
Nontraditionalage
Traditionalage
Livingoff-campus
Livingon-campus
All OnlineCourses
Some OnlineCourses
No OnlineCourses
Senior
First-year
Figure 17: Supportive Environment Score Comparisonsby Online Courses, Living Situation, and Age
Note: Traditional age for first-year students is under 21, and for seniors is under 25.
BELMONT ABBEY COLLEGE
“My professors have been extremely helpful in furthering my career. They truly desire to develop relationships with their students and help them in their professional endeavors.”— SENIOR, MANAGEMENT, FRANKLIN PIERCE UNIVERSITY

20 NATIONAL SURVEY OF STUDENT ENGAGEMENT | ANNUAL RESULTS 2013
0% 25% 50% 75% 100%
Senior
First-year
Figure 19: Participation inHigh-Impact Practices
Participatedin two or moreHIPs
12% 46%
60% 24%
Participatedin oneHIP
Note: Both figures include participation in learning communities, service-learning, and research with faculty. The figure for seniors also includes participation in internships or field experiences, study abroad, and culminating senior experiences.
SELECTED RESULTS: HIGH-IMPACT PRACTICES
High-Impact Practices
Table 7 displays how prevalent high-impact practices were in 2013,
and offers insight into the extent to which high-impact practice (HIP)
engagement varied within student populations. For example, while
women participated more in learning communities and service-learning,
men were a bit more likely to do research with faculty. Seniors majoring
in education, health professions, and social service professions were
more likely to take courses that included a service-learning component;
and arts and humanities, communications, and engineering majors were
more often asked to do a culminating senior experience. What’s more,
students who were older, first-generation, enrolled part time, and living
off-campus participated in HIPs at lower rates than their counterparts.
These practices were also less common among students taking some
or all of their courses online, as shown, for example, with participation
in internships or field experiences (Figure 18).
NSSE founding director George Kuh recommended that institutions
aspire for all students to participate in at least two HIPs over the course
of their undergraduate experience—one during the first year and the
second in the context of the major (Kuh, 2008). Nearly three in five first-
year students and four in five seniors met this goal (Figure 19).
More importantly, participation in HIPs was associated with desirable
learning gains and overall educational satisfaction. First-year students
who participated in at least one HIP and seniors who participated
in at least two reported greater gains in their knowledge, skills, and
personal development, were more satisfied with their entire educational
experience, and were more likely to return to the same institution if they
were to start over again. Participation in high-impact practices was also
positively associated with other key forms of engagement. For example,
first-year students who participated in learning communities, service-
learning experiences, or research with faculty members were generally
more engaged in NSSE’s ten key indicators than their non-participating
peers (Table 6).
Table 6: Effect of Participation in High-Impact Practices in the First Year
Engagement Indicator Learning Community Service-Learning Research with Faculty
Higher-Order Learning + + ++
Reflective & Integrative Learning ++ + ++
Quantitative Reasoning + + +++
Learning Strategies + + ++
Collaborative Learning ++ ++ +++
Discussions with Diverse Others ++ + ++
Student-Faculty Interaction ++ ++ +++
Effective Teaching Practices + + +
Quantitative Reasoning + + +
Supportive Environment ++ + ++
Note: Symbols represent Cohen’s d effect size (ES) of the difference on each Engagement Indicator between participants and non-participants according to the following key: + ES > .1, ++ ES > .3, +++ ES > .5. All differences were positive for participants.
0% 25% 50% 75% 100%
All OnlineCourses
Some OnlineCourses
No OnlineCourses
Figure 18: Senior Participation in Internshipsby Distance Education Status
54%
46%
20%
MILLSAPS COLLEGE

21NATIONAL SURVEY OF STUDENT ENGAGEMENT | ANNUAL RESULTS 2013
SELECTED RESULTS: HIGH-IMPACT PRACTICES (CONTINUED)
Because of their positive effects on student learning and retention,
special undergraduate opportunities such as learning communities,
service-learning, research with a faculty member, study abroad,
internships, and culminating senior experiences are called high-impact
practices (Kuh, 2008). High-impact practices share several traits: they
demand considerable time and effort, provide learning opportunities
outside of the classroom, require meaningful interactions with faculty
and students, encourage interaction with diverse others, and provide
frequent and meaningful feedback. Participation in these practices can
be life-changing.
Table 7: Percentage of Students Who Participateda in High-Impact Practices by Institution and Student Characteristics
First-Year Senior
Learning Community
Service-Learning
Research with Faculty
Learning Community
Service-Learning
Research with Faculty
Internship/ Field Exp. Study Abroad Culminating
Experience
Institutional Characteristics
2010 BasicCarnegie Classification
Research Universities (very high research activity) 21 46 6 26 52 28 53 16 45
Research Universities (high research activity) 18 49 5 24 58 24 50 14 43
Doctoral/Research Universities 16 57 5 21 59 15 36 8 37
Master’s Colleges and Universities (larger programs) 13 53 5 23 62 19 45 10 42
Master’s Colleges and Universities (medium programs) 13 55 5 24 65 23 46 12 46
Master’s Colleges and Universities (smaller programs) 14 56 5 29 70 28 56 14 56
Baccalaureate Colleges—Arts & Sciences 12 52 6 30 68 44 66 39 74
Baccalaureate Colleges—Diverse Fields 11 58 6 24 67 24 50 9 50
Control Public 16 50 5 24 59 23 48 11 43
Private 13 56 5 23 63 23 47 16 48
Student Characteristics
Genderb Female 16 52 5 26 64 22 49 14 44
Male 14 52 6 21 55 24 46 11 45
Race/ethnicity or internationalb
American Indian or Alaska Native 11 52 5 23 61 21 40 8 42
Asian 14 56 6 25 65 25 46 12 42
Black or African American 16 54 7 25 65 17 40 8 38
Hispanic or Latino 16 57 5 24 62 19 41 10 36
Native Hawaiian/Other Pacific Islander 12 67 6 32 68 18 42 9 43
White 15 50 5 24 59 24 51 13 47
Other 15 55 7 21 63 14 37 9 28
Foreign or nonresident alien 13 68 10 25 75 27 40 24 45
Two or more races/ethnicities 16 49 6 25 61 25 47 13 43
Age Traditional (First-Year < 21, Senior < 25): 16 53 5 29 65 30 59 18 54
Nontraditional (First-Year 21+, Senior 25+) 8 44 5 15 54 13 31 4 32
First-generationc Not first-generation 16 51 5 26 60 28 54 18 50
First-generation 13 53 5 21 60 18 41 8 39
Enrollment statusb Part-time 7 41 4 14 52 13 32 5 31
Full-time 16 53 5 26 62 26 52 15 48
Residence Living off campus 11 50 5 22 60 21 45 11 42
Living on campus 18 53 5 34 65 36 63 25 60
Major categoryd Arts & humanities 15 49 4 22 55 27 42 24 57
Biological sciences, agriculture, natural resources 17 50 7 25 54 45 53 16 45
Physical sciences, math, computer science 14 46 7 20 42 39 45 11 45
Social sciences 15 50 5 20 60 30 45 17 46
Business 14 52 5 19 53 12 38 12 41
Communications, media, public relations 15 53 5 26 67 22 64 19 58
Education 15 61 5 35 82 15 67 10 47
Engineering 19 45 6 28 44 30 58 10 55
Health professions 15 56 4 29 76 18 50 8 35
Social service professions 12 57 5 24 69 15 46 6 39
Undecided/undeclared 12 52 4 17 63 16 30 12 25
Overall 15 52 5 24 60 23 48 13 45
Note: Percentages are weighted by gender, enrollment, and institution size. a. Percentage of students who responded “Done or in progress” for all HIPs except service-learning, for which they reported at least “Some” of their courses included a community-based project. b. Gender, enrollment status, and race/ethnicity are institution-reported variables. c. Neither parent holds a bachelor’s degree. d. These are NSSE’s default related-major categories, based on students’ first reported majors. Excludes majors categorized as “all other.”
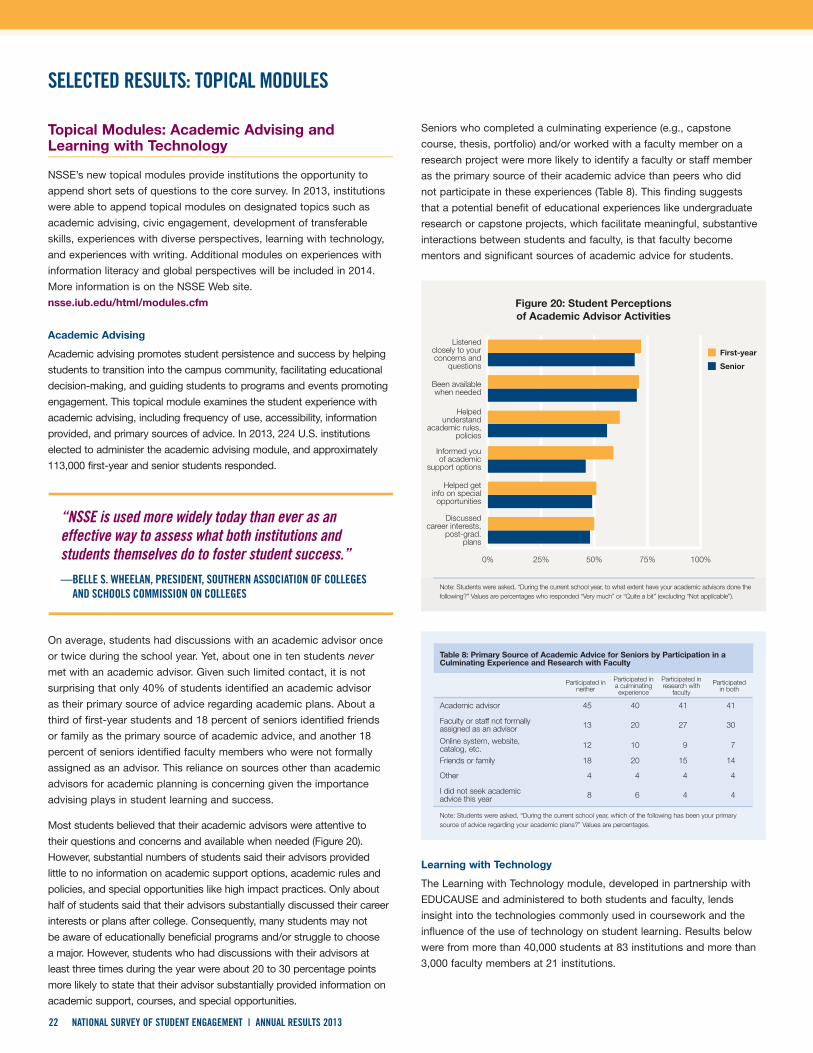
22 NATIONAL SURVEY OF STUDENT ENGAGEMENT | ANNUAL RESULTS 2013
SELECTED RESULTS: TOPICAL MODULES
Seniors who completed a culminating experience (e.g., capstone
course, thesis, portfolio) and/or worked with a faculty member on a
research project were more likely to identify a faculty or staff member
as the primary source of their academic advice than peers who did
not participate in these experiences (Table 8). This finding suggests
that a potential benefit of educational experiences like undergraduate
research or capstone projects, which facilitate meaningful, substantive
interactions between students and faculty, is that faculty become
mentors and significant sources of academic advice for students.
Learning with Technology
The Learning with Technology module, developed in partnership with
EDUCAUSE and administered to both students and faculty, lends
insight into the technologies commonly used in coursework and the
influence of the use of technology on student learning. Results below
were from more than 40,000 students at 83 institutions and more than
3,000 faculty members at 21 institutions.
Topical Modules: Academic Advising and Learning with Technology
NSSE’s new topical modules provide institutions the opportunity to
append short sets of questions to the core survey. In 2013, institutions
were able to append topical modules on designated topics such as
academic advising, civic engagement, development of transferable
skills, experiences with diverse perspectives, learning with technology,
and experiences with writing. Additional modules on experiences with
information literacy and global perspectives will be included in 2014.
More information is on the NSSE Web site.
nsse.iub.edu/html/modules.cfm
Academic Advising
Academic advising promotes student persistence and success by helping
students to transition into the campus community, facilitating educational
decision-making, and guiding students to programs and events promoting
engagement. This topical module examines the student experience with
academic advising, including frequency of use, accessibility, information
provided, and primary sources of advice. In 2013, 224 U.S. institutions
elected to administer the academic advising module, and approximately
113,000 first-year and senior students responded.
On average, students had discussions with an academic advisor once
or twice during the school year. Yet, about one in ten students never
met with an academic advisor. Given such limited contact, it is not
surprising that only 40% of students identified an academic advisor
as their primary source of advice regarding academic plans. About a
third of first-year students and 18 percent of seniors identified friends
or family as the primary source of academic advice, and another 18
percent of seniors identified faculty members who were not formally
assigned as an advisor. This reliance on sources other than academic
advisors for academic planning is concerning given the importance
advising plays in student learning and success.
Most students believed that their academic advisors were attentive to
their questions and concerns and available when needed (Figure 20).
However, substantial numbers of students said their advisors provided
little to no information on academic support options, academic rules and
policies, and special opportunities like high impact practices. Only about
half of students said that their advisors substantially discussed their career
interests or plans after college. Consequently, many students may not
be aware of educationally beneficial programs and/or struggle to choose
a major. However, students who had discussions with their advisors at
least three times during the year were about 20 to 30 percentage points
more likely to state that their advisor substantially provided information on
academic support, courses, and special opportunities.
0% 25% 50% 75% 100%
Discussedcareer interests,
post-grad.plans
Helped getinfo on special
opportunities
Informed youof academic
support options
Helpedunderstand
academic rules,policies
Been availablewhen needed
Listenedclosely to yourconcerns and
questions
Figure 20: Student Perceptionsof Academic Advisor Activities
First-year
Senior
Note: Students were asked, “During the current school year, to what extent have your academic advisors done the following?” Values are percentages who responded “Very much” or “Quite a bit” (excluding “Not applicable”).
Table 8: Primary Source of Academic Advice for Seniors by Participation in a Culminating Experience and Research with Faculty
Participated in neither
Participated in a culminating experience
Participated in research with
faculty
Participated in both
Academic advisor 45 40 41 41
Faculty or staff not formally assigned as an advisor 13 20 27 30
Online system, website, catalog, etc. 12 10 9 7
Friends or family 18 20 15 14
Other 4 4 4 4
I did not seek academic advice this year 8 6 4 4
Note: Students were asked, “During the current school year, which of the following has been your primary source of advice regarding your academic plans?” Values are percentages.
“NSSE is used more widely today than ever as an effective way to assess what both institutions and students themselves do to foster student success.”— BELLE S. WHEELAN, PRESIDENT, SOUTHERN ASSOCIATION OF COLLEGES
AND SCHOOLS COMMISSION ON COLLEGES

23NATIONAL SURVEY OF STUDENT ENGAGEMENT | ANNUAL RESULTS 2013
SELECTED RESULTS: TOPICAL MODULES (CONTINUED)
According to faculty, the most important aspects were providing
students with technology to facilitate learning and to complete
coursework, and providing support services to help students use the
technology (Figure 22). About two in three faculty members (70%) also
said that providing support services to help faculty use technology was
important to them.
Further analysis showed that use of technology was positively related
to student engagement. Both learning with technology and courses
that improved the understanding and use of technology had a positive
association with all four academic challenge engagement indicators
for first-year students, including Higher-Order Learning, Reflective &
Integrative Learning, and Learning Strategies (Table 9). Courses that
improved the understanding and use of technology had a modest
positive influence on Higher-Order Learning and Quantitative Reasoning.
Essentially the same associations were found among seniors.
0% 25% 50% 75% 100%
Blogs
Collaborativeediting
software
Electronictextbooks
Mobilecomputing
Multimediasoftware
Onlineportfolios ore-portfolios
Socialnetworking
Figure 21: Frequency of Technology Use in Coursework
First-year
Senior
Note: Students were asked, “During the current school year, about how often have you used the following technologies in your coursework?” Values represented are the percentages who responded “Very often” or “Often” to each item.
1 2 3 4
That additionalsupport
services bemade available
Teachingstudents how
to use availabletechnologies
Providingstudents with
technologyto learn, study...
Teachingwith new,
cutting-edgetechnologies
Figure 22: Student and Faculty Perceptionsof Technology Emphasis and Importance
First-year
Senior
Faculty
Average Response
Note: Students were asked how much their institution emphasized aspects of technology on a scale from 1=Very little to 4=Very much. Faculty were asked how important these aspects of technology are on a scale from 1=Not important to 4=Very important.
Table 9: Relationship between Technology and Academic Challenge for First-Year Students
Academic Challenge Engagement Indicators
Higher-Order Learning
Reflective & Integrative Learning
Quantitative Reasoning
Learning Strategies
Learning with technology +++ +++ ++ +++
Extent to which technology distracted from completing coursework
– – –
Extent to which courses improved understanding and use of technology
++ + ++ ++
Note: Learning with technology was defined as the extent to which technology contributed to: (a) understanding of course materials and ideas, (b) learning, studying, or completing coursework (either individually or with other students), and (c) demonstrating understanding of course content. Controls included gender, enrollment, race or ethnicity, age, first-generation, self-reported grades, transfer, living on campus, related-major category, working, international, distance education, Carnegie type, and institutional control.
Key: + p<.001, ++ p<.001 and standardized B>.1, +++ p<.001 and standardized B>.2, - p<.001, - - p<.001 and standardized B<-.1, - - - p<.001 and standardized B<-.2. Cells were left blank if the findings were not significant at p<.001.
Technology has become interwoven into the college experience. For
example, nearly all students (96%) used some form of technology
in their courses during the school year with the most frequent being
mobile devices (smartphones, tablets, etc.), collaborative editing
software (Wikis, Google Docs, etc.), and electronic textbooks (Figure 21).
Yet, technology use varied between first-year students and seniors. For
example, first-year students were more likely to use social networking
(Facebook, Twitter, etc.) and electronic textbooks, while seniors were
more likely to use collaborative editing software.
SETON HALL UNIVERSITY
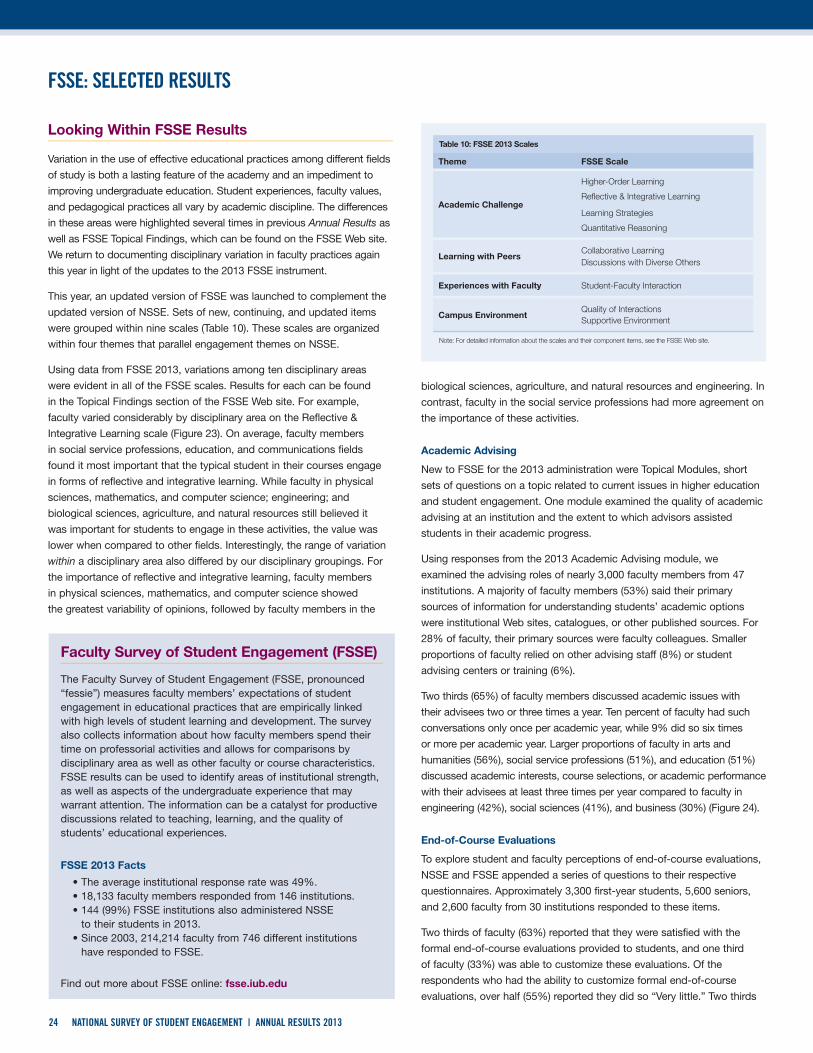
Faculty Survey of Student Engagement (FSSE)
The Faculty Survey of Student Engagement (FSSE, pronounced “fessie”) measures faculty members’ expectations of student engagement in educational practices that are empirically linked with high levels of student learning and development. The survey also collects information about how faculty members spend their time on professorial activities and allows for comparisons by disciplinary area as well as other faculty or course characteristics. FSSE results can be used to identify areas of institutional strength, as well as aspects of the undergraduate experience that may warrant attention. The information can be a catalyst for productive discussions related to teaching, learning, and the quality of students’ educational experiences.
FSSE 2013 Facts
• The average institutional response rate was 49%.• 18,133 faculty members responded from 146 institutions.• 144 (99%) FSSE institutions also administered NSSE
to their students in 2013.• Since 2003, 214,214 faculty from 746 different institutions
have responded to FSSE.
Find out more about FSSE online: fsse.iub.edu
24 NATIONAL SURVEY OF STUDENT ENGAGEMENT | ANNUAL RESULTS 2013
FSSE: SELECTED RESULTS
biological sciences, agriculture, and natural resources and engineering. In
contrast, faculty in the social service professions had more agreement on
the importance of these activities.
Academic Advising
New to FSSE for the 2013 administration were Topical Modules, short
sets of questions on a topic related to current issues in higher education
and student engagement. One module examined the quality of academic
advising at an institution and the extent to which advisors assisted
students in their academic progress.
Using responses from the 2013 Academic Advising module, we
examined the advising roles of nearly 3,000 faculty members from 47
institutions. A majority of faculty members (53%) said their primary
sources of information for understanding students’ academic options
were institutional Web sites, catalogues, or other published sources. For
28% of faculty, their primary sources were faculty colleagues. Smaller
proportions of faculty relied on other advising staff (8%) or student
advising centers or training (6%).
Two thirds (65%) of faculty members discussed academic issues with
their advisees two or three times a year. Ten percent of faculty had such
conversations only once per academic year, while 9% did so six times
or more per academic year. Larger proportions of faculty in arts and
humanities (56%), social service professions (51%), and education (51%)
discussed academic interests, course selections, or academic performance
with their advisees at least three times per year compared to faculty in
engineering (42%), social sciences (41%), and business (30%) (Figure 24).
End-of-Course Evaluations
To explore student and faculty perceptions of end-of-course evaluations,
NSSE and FSSE appended a series of questions to their respective
questionnaires. Approximately 3,300 first-year students, 5,600 seniors,
and 2,600 faculty from 30 institutions responded to these items.
Two thirds of faculty (63%) reported that they were satisfied with the
formal end-of-course evaluations provided to students, and one third
of faculty (33%) was able to customize these evaluations. Of the
respondents who had the ability to customize formal end-of-course
evaluations, over half (55%) reported they did so “Very little.” Two thirds
Looking Within FSSE Results
Variation in the use of effective educational practices among different fields
of study is both a lasting feature of the academy and an impediment to
improving undergraduate education. Student experiences, faculty values,
and pedagogical practices all vary by academic discipline. The differences
in these areas were highlighted several times in previous Annual Results as
well as FSSE Topical Findings, which can be found on the FSSE Web site.
We return to documenting disciplinary variation in faculty practices again
this year in light of the updates to the 2013 FSSE instrument.
This year, an updated version of FSSE was launched to complement the
updated version of NSSE. Sets of new, continuing, and updated items
were grouped within nine scales (Table 10). These scales are organized
within four themes that parallel engagement themes on NSSE.
Using data from FSSE 2013, variations among ten disciplinary areas
were evident in all of the FSSE scales. Results for each can be found
in the Topical Findings section of the FSSE Web site. For example,
faculty varied considerably by disciplinary area on the Reflective &
Integrative Learning scale (Figure 23). On average, faculty members
in social service professions, education, and communications fields
found it most important that the typical student in their courses engage
in forms of reflective and integrative learning. While faculty in physical
sciences, mathematics, and computer science; engineering; and
biological sciences, agriculture, and natural resources still believed it
was important for students to engage in these activities, the value was
lower when compared to other fields. Interestingly, the range of variation
within a disciplinary area also differed by our disciplinary groupings. For
the importance of reflective and integrative learning, faculty members
in physical sciences, mathematics, and computer science showed
the greatest variability of opinions, followed by faculty members in the
Table 10: FSSE 2013 Scales
Theme FSSE Scale
Academic Challenge
Higher-Order Learning
Reflective & Integrative Learning
Learning Strategies
Quantitative Reasoning
Learning with PeersCollaborative LearningDiscussions with Diverse Others
Experiences with Faculty Student-Faculty Interaction
Campus EnvironmentQuality of InteractionsSupportive Environment
Note: For detailed information about the scales and their component items, see the FSSE Web site.
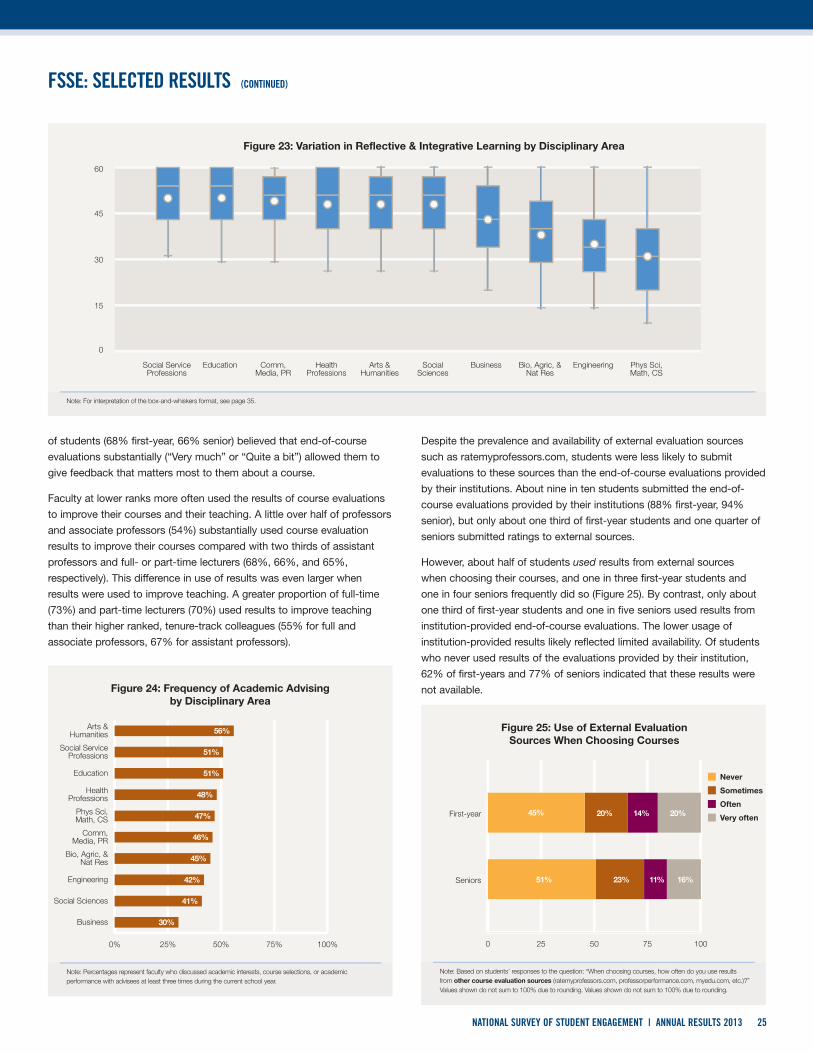
25NATIONAL SURVEY OF STUDENT ENGAGEMENT | ANNUAL RESULTS 2013
0 25 50 75 100
Seniors
First-year
Figure 25: Use of External EvaluationSources When Choosing Courses
45% 20% 14% 20%
51% 23% 11% 16%
Never
Sometimes
Often
Very often
Note: Based on students’ responses to the question: “When choosing courses, how often do you use results from other course evaluation sources (ratemyprofessors.com, professorperformance.com, myedu.com, etc.)?” Values shown do not sum to 100% due to rounding. Values shown do not sum to 100% due to rounding.
0% 25% 50% 75% 100%
Business
Social Sciences
Engineering
Bio, Agric, &Nat Res
Comm,Media, PR
Phys Sci,Math, CS
HealthProfessions
Education
Social ServiceProfessions
Arts & Humanities
Figure 24: Frequency of Academic Advisingby Disciplinary Area
56%
51%
51%
48%
47%
46%
45%
42%
41%
30%
Social Sciences
Note: Percentages represent faculty who discussed academic interests, course selections, or academic performance with advisees at least three times during the current school year.
0
15
30
45
60
Social ServiceProfessions
Education Comm,Media, PR
HealthProfessions
Arts &Humanities
Figure 23: Variation in Reflective & Integrative Learning by Disciplinary Area
Bio, Agric, &Nat Res
Engineering Phys Sci,Math, CS
SocialSciences
Business
Note: For interpretation of the box-and-whiskers format, see page 35.
of students (68% first-year, 66% senior) believed that end-of-course
evaluations substantially (“Very much” or “Quite a bit”) allowed them to
give feedback that matters most to them about a course.
Faculty at lower ranks more often used the results of course evaluations
to improve their courses and their teaching. A little over half of professors
and associate professors (54%) substantially used course evaluation
results to improve their courses compared with two thirds of assistant
professors and full- or part-time lecturers (68%, 66%, and 65%,
respectively). This difference in use of results was even larger when
results were used to improve teaching. A greater proportion of full-time
(73%) and part-time lecturers (70%) used results to improve teaching
than their higher ranked, tenure-track colleagues (55% for full and
associate professors, 67% for assistant professors).
Despite the prevalence and availability of external evaluation sources
such as ratemyprofessors.com, students were less likely to submit
evaluations to these sources than the end-of-course evaluations provided
by their institutions. About nine in ten students submitted the end-of-
course evaluations provided by their institutions (88% first-year, 94%
senior), but only about one third of first-year students and one quarter of
seniors submitted ratings to external sources.
However, about half of students used results from external sources
when choosing their courses, and one in three first-year students and
one in four seniors frequently did so (Figure 25). By contrast, only about
one third of first-year students and one in five seniors used results from
institution-provided end-of-course evaluations. The lower usage of
institution-provided results likely reflected limited availability. Of students
who never used results of the evaluations provided by their institution,
62% of first-years and 77% of seniors indicated that these results were
not available.
FSSE: SELECTED RESULTS (CONTINUED)

Beginning College Survey of Student Engagement (BCSSE)
The Beginning College Survey of Student Engagement (BCSSE, pronounced “bessie”) measures entering first-year students’ high school academic and co-curricular experiences as well as their expectations for participating in educationally purposeful activities during the first year of college. BCSSE administration takes place prior to the start of fall classes, so responses can be paired with NSSE in the spring. BCSSE results can aid the design of orientation programs, student service initiatives, and other programmatic efforts aimed at improving the learning experiences of first-year students. Since its launch in 2007, more than 430,000 first-year students at 373 higher education institutions across the US and Canada have completed the BCSSE survey.
BCSSE 2012–NSSE 2013 Facts
• More than 78,000 first-year students enrolled at 119 institutions participated in BCSSE in the summer and fall of 2012.
• Of these 119 institutions, 77 also participated in NSSE 2013 and received the BCSSE–NSSE Combined Report.
• Of the BCSSE–NSSE participants, 43% were public institutions, and approximately 47% were bachelor’s-granting colleges, 35% master’s level, and 19% doctorate-granting.
The Updated BCSSE
BCSSE was updated in 2013 to align with the updated version of NSSE. The new version maintains BCSSE’s focus on gathering information from entering first-year students regarding their high school experiences and their expectations for engagement during their first year in college. It also includes new items to increase alignment with NSSE, improved clarity and applicability of survey language, refinements of existing measures, and new First-Year Engagement Indicators.
Find out more about BCSSE online: bcsse.iub.edu
26 NATIONAL SURVEY OF STUDENT ENGAGEMENT | ANNUAL RESULTS 2013
BCSSE: SELECTED RESULTS
Table 11: STEM Intentions by Student Characteristics
Distribution of those with initial STEM intentions
On Entry End of Year Joiners Leavers Continuers
HS calculus (yes) 37 41 17 17 84
HS calculus (no) 19 17 5 32 68
Male 35 39 15 15 85
Female 21 20 6 31 69
Asian 38 39 15 21 79
Black/African American 26 23 6 26 74
Hispanic 24 21 6 26 74
White 25 26 10 25 75
First-generation 24 21 6 29 71
Not first-generation 26 28 11 21 79
Overall 25 26 9 24 76
Note: Cells contain percentages.
STEM Joiners and Leavers by Student Characteristics
Data for this analysis included almost 10,000 entering, first-year students
enrolled at 71 U.S. bachelor’s-granting institutions (38% baccalaureate,
42% masters, and 20% doctoral) who completed both the BCSSE upon
entering college and the NSSE toward the end of the first year. According
to their BCSSE responses, 25% of these students intended to major in a
STEM field, and according to their NSSE responses toward the end of their
first year, 26% identified as a STEM major. As seen in Figure 26, for every
100 students who started the first-year intending to major in a STEM field,
24 switched to a non-STEM major by the spring. However, 27 students
who originally were not intending to major in STEM, decided to major in
STEM by the spring of the first year. Overall, this gives the appearance
that there is little attrition from STEM fields within the first year of college
although there were significant numbers of Leavers and Joiners.
The details however, suggest something more interesting and nuanced.
For instance, of the students who completed calculus in high school, 37%
started college intending to major in a STEM field, and by the end of the first
year an additional 17% had decided to major in a STEM field – the Joiners
(Table 11). Overall, 41% of all students who completed HS calculus were
intending to major in STEM by the end of their first year, compared to only
17% of students who did not complete calculus in high school.
First-Year Student Intentions to Major in STEM Fields
According to the President’s Council of Advisors on Science and
Technology (2012), we must graduate one million more students in a
STEM field (science, technology, engineering, or mathematics) than we
currently graduate. Every fall, thousands of entering first-year college
students enroll with the expectation that they will major in a STEM field.
However, the reality is that many of these students do not persist to
graduation in a STEM field (AAAS, 2001; Brown et al, 2009). Though it is
common for students to change majors often during the undergraduate
years, it is disheartening when academically qualified students choose
not to persist in their STEM majors.
Using longitudinal data from the 2012 administration of the Beginning
College Survey of Student Engagement (BCSSE) and the 2013 National
Survey of Student Engagement (NSSE), the results below focus on
three groups of students: (a) those who continued their interest in STEM
through their first year (“Continuers”), (b) those who initially but no longer
expressed intention to major in STEM (“Leavers”), and (c) those who
initially did not intend to major in a STEM field, but expressed intent by
the end of the first year (“Joiners”).
For every 100 entering first-year students who intended to major in STEM:24 Left, 76 Continued. In addition, 27 Joined.
103 intended to major in STEMnear end of the first year100 Entered
Figure 26: STEM Majors from Beginning to End of First Year
76 Continued27 Joined
24 Left
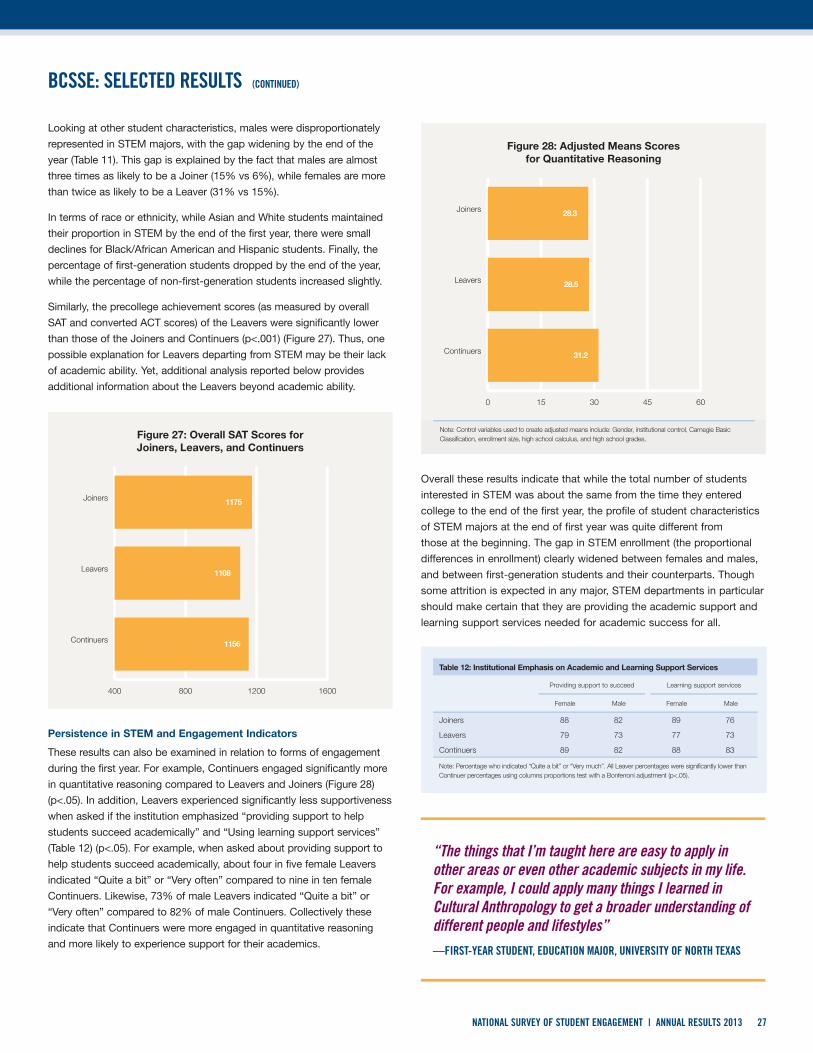
27NATIONAL SURVEY OF STUDENT ENGAGEMENT | ANNUAL RESULTS 2013
Table 12: Institutional Emphasis on Academic and Learning Support Services
Providing support to succeed Learning support services
Female Male Female Male
Joiners 88 82 89 76
Leavers 79 73 77 73
Continuers 89 82 88 83
Note: Percentage who indicated “Quite a bit” or “Very much”. All Leaver percentages were significantly lower than Continuer percentages using columns proportions test with a Bonferroni adjustment (p<.05).
Looking at other student characteristics, males were disproportionately
represented in STEM majors, with the gap widening by the end of the
year (Table 11). This gap is explained by the fact that males are almost
three times as likely to be a Joiner (15% vs 6%), while females are more
than twice as likely to be a Leaver (31% vs 15%).
In terms of race or ethnicity, while Asian and White students maintained
their proportion in STEM by the end of the first year, there were small
declines for Black/African American and Hispanic students. Finally, the
percentage of first-generation students dropped by the end of the year,
while the percentage of non-first-generation students increased slightly.
Similarly, the precollege achievement scores (as measured by overall
SAT and converted ACT scores) of the Leavers were significantly lower
than those of the Joiners and Continuers (p<.001) (Figure 27). Thus, one
possible explanation for Leavers departing from STEM may be their lack
of academic ability. Yet, additional analysis reported below provides
additional information about the Leavers beyond academic ability.
Persistence in STEM and Engagement Indicators
These results can also be examined in relation to forms of engagement
during the first year. For example, Continuers engaged significantly more
in quantitative reasoning compared to Leavers and Joiners (Figure 28)
(p<.05). In addition, Leavers experienced significantly less supportiveness
when asked if the institution emphasized “providing support to help
students succeed academically” and “Using learning support services”
(Table 12) (p<.05). For example, when asked about providing support to
help students succeed academically, about four in five female Leavers
indicated “Quite a bit” or “Very often” compared to nine in ten female
Continuers. Likewise, 73% of male Leavers indicated “Quite a bit” or
“Very often” compared to 82% of male Continuers. Collectively these
indicate that Continuers were more engaged in quantitative reasoning
and more likely to experience support for their academics.
Overall these results indicate that while the total number of students
interested in STEM was about the same from the time they entered
college to the end of the first year, the profile of student characteristics
of STEM majors at the end of first year was quite different from
those at the beginning. The gap in STEM enrollment (the proportional
differences in enrollment) clearly widened between females and males,
and between first-generation students and their counterparts. Though
some attrition is expected in any major, STEM departments in particular
should make certain that they are providing the academic support and
learning support services needed for academic success for all.
400 800 1200 1600
Continuers
Leavers
Joiners
Figure 27: Overall SAT Scores forJoiners, Leavers, and Continuers
1175
1108
1156
0 15 30 45 60
Continuers
Leavers
Joiners
Figure 28: Adjusted Means Scoresfor Quantitative Reasoning
28.3
28.5
31.2
Note: Control variables used to create adjusted means include: Gender, institutional control, Carnegie Basic Classification, enrollment size, high school calculus, and high school grades.
BCSSE: SELECTED RESULTS (CONTINUED)
“The things that I’m taught here are easy to apply in other areas or even other academic subjects in my life. For example, I could apply many things I learned in Cultural Anthropology to get a broader understanding of different people and lifestyles”— FIRST-YEAR STUDENT, EDUCATION MAJOR, UNIVERSITY OF NORTH TEXAS

28 NATIONAL SURVEY OF STUDENT ENGAGEMENT | ANNUAL RESULTS 2013
USING NSSE DATA
Since NSSE’s inception, documenting examples of the use of NSSE
data has been important. Administering the survey and receiving
detailed reports only starts the process to share and interpret results,
identify priorities for action, formulate and implement plans for
improvement, and then circle back to assess impact. Hundreds of rich
examples of institutions putting student engagement results to use
have been featured in the “Using NSSE Data” section in past Annual
Results and described in depth in two volumes of Lessons from the
Field. These examples highlight proven steps for converting data to
action in ways that promote student success. Collectively, they illustrate
1) the value of sharing results widely, 2) the utility of linking NSSE data
to other sources, and 3) the potential for using data to address real
campus problems and issues. Moreover, these institutional accounts
demonstrate how NSSE’s diagnostic, actionable information can help
catalyze vital, sometimes challenging conversations about the quality of
undergraduate education on a campus.
The examples of institutions’ use of NSSE data represented in Annual
Results 2013 reflect the growing sophistication of NSSE users to
integrate their results with efforts to improve student success and to
tighten the links between results and improvements in teaching and
learning. The final example provides a retrospective view of using NSSE
results over time. The Looking Ahead section of this report introduces
specific ways the updated NSSE instrument—in particular, its more
actionable measures and concise, visually appealing reports—promises
to extend and deepen data use.
Fostering Student Success System-Wide
Minnesota State Colleges and Universities
Minnesota State Colleges and Universities (MnSCU) system convened
member campuses for a two-day working conference to build upon
efforts to promote promising practices for student success—practices
aligned with the chancellor’s priorities to dramatically increase student
retention, successful transfer, and completion of degrees. Sessions
addressed high-impact practices (learning communities, service-
learning, first-year seminars, and undergraduate research) for both
state university and two-year college student success. The goal of
the conference was to use data, including results from NSSE and
the Community College Survey of Student Engagement (CCSSE), to
inform the design of such practices, with particular emphasis on first-
year experience courses, supplemental instruction, and accelerated
developmental education. Each MnSCU campus team—composed
of chief academic officers, faculty, student affairs staff, equity
officers, deans, and directors of academic support—developed their
institution’s plan to scale-up promising practices and to set target
measures for increasing student success outcomes. As a result of
these conversations, best practices in student success are being
fostered across MnSCU campuses including: corequisite, accelerated,
and modularized models of developmental education; Statways
and Quantways efforts (Carnegie Foundation for the Advancement
of Teaching curriculum development initiatives to increase student
success in mathematics); and expanded supplemental instruction,
learning communities, and first-year experience programs. In the
next year, MnSCU will launch a faculty-driven process to determine
shared learner outcomes for developmental education and, through
partnerships with secondary schools and adult basic education
programs, will create a series of targeted interventions to cultivate
college readiness and foster success.
Assessing and Improving the First-Year Experience
The Catholic University of America
In 2009, The Catholic University of America (CUA), in Washington,
D.C., launched a comprehensive assessment plan for their newly
implemented First-Year Experience (FYE) program. The FYE program—
comprised of numerous components that support student success
including a streamlined summer registration process; first-year
advising; learning communities; a weekly FYE newsletter; increased
tutoring and learning assistance programs; and, at its core, academic
and intellectual elements—represented a substantial investment in
helping the newest members of the campus community enter into
the life of the university and improve student retention. CUA used
a range of data to inform the creation and improvement of FYE,
including NSSE, the Classroom-Level Survey of Student Engagement
(CLASSE), advising surveys, course and instructor evaluations, and
institutional retention data. CUA has administered NSSE annually since
2000 and examined results longitudinally to assess improvements
in first-year student engagement and, in particular, to assess the
impact of implementing learning communities and enhanced first-year
courses. CUA’s NSSE scores for student-faculty interaction increased
significantly over time and in comparison to their Carnegie peers. For
MINNESOTA STATE UNIVERSITY MOORHEAD

29NATIONAL SURVEY OF STUDENT ENGAGEMENT | ANNUAL RESULTS 2013
USING NSSE DATA (CONTINUED)
example, results demonstrated improvements in teaching and learning
in the first year, including discussing ideas from readings with faculty
members outside of class and receiving prompt feedback on academic
performance. Similar improvements also occurred for collaborative
learning activities such as discussing ideas with peers outside of
class and participating in community-based projects. By combining
NSSE with other assessment results, including course and instructor
evaluations, CUA further revised the curriculum of their introductory
writing course, implemented block scheduling of learning communities,
and established an FYE reading room. CUA concluded that assessment
results supported the incorporation of learning communities, first-
year advising, and co-curricular enhancements to the FYE, and
also indicated that further attention was needed to the academic
core of FYE. CUA plans to invest in expanded faculty development
activities and to continue striving to make the educational experience
academically rich and personally nurturing to ensure student success.
Reimagining General Education
Kenyon College
Kenyon College, a liberal arts institution in central Ohio, found in NSSE
results that overall their students were engaged and highly satisfied
with their educational experience. Yet digging deeper into the data on
educational gains brought Kenyon new insights regarding students’
perceptions of the university’s contribution to their acquiring work-related
skills and clarifying a personal code of values or ethics. These findings
helped make the case for an initiative to reimagine general education
on campus. The Working Group on Curricular Essentials at Kenyon was
charged to think critically about general education; to convene discussion
among faculty, staff, and administrators on the ideal liberal arts
education; and to explore ways of delivering that ideal to their students.
The Working Group developed guiding principles and compiled a short
list of different approaches to general education to continue faculty
discussion of these issues at a retreat and to develop recommendations
about how best to reimagine general education on campus.
Examining Student and Faculty Perceptions of Higher-Order Learning
Truman State University
For its participation in the Wabash National Study of Liberal Education,
Truman State University, a public liberal arts and sciences university in
Missouri, established a committee to evaluate frameworks and rubrics
associated with the university’s commitment to enhancing the following
characteristics in its graduates: a) understanding and articulating well-
reasoned arguments; b) demonstrating courageous, visionary, and
service-oriented leadership; and c) living emotionally and physically
healthy lives. The committee looked to Truman’s NSSE results on
higher- and lower-order learning skills to learn more about their
students’ experiences. NSSE results revealed, for example, that first-
year students and seniors reported a much greater emphasis on the
lower-order task of memorization than Truman faculty reported in the
Faculty Survey of Student Engagement (FSSE), suggesting a significant
gap in the perceptions of faculty and students. More broadly, NSSE
data suggested that in areas related to higher-order learning Truman
students were performing near or slightly above the level of students at
comparison institutions. The gap is now informing their North Central
Association Higher Learning Commission Pathways Project to assure
quality and demonstrate continuous improvement. Moving forward, they
plan to craft frameworks and rubrics for higher-order thinking to help
students and faculty recognize connections across courses and among
disciplines, creating an integrated understanding of the curriculum while
helping faculty be more efficient and intentional in their teaching and
letting students know better what is expected of them.
NSSE Retrospective: Celebrating Insights about Educational Quality
Pace University
Pace University, a multi-campus research institution in the New York
metropolitan area, administered NSSE every year from 2002 through
2012 and the updated version in 2013. While initially saddened to
bring closure to several multi-year studies, campus leaders realized
that beginning with NSSE 2013, it was time to open a new chapter of
NSSE studies that would provide different perspectives on institutional
questions. To celebrate all they had learned and the action they had
taken on their institutional assessment results, Pace published a NSSE
Retrospective recounting all the ways NSSE has made a difference for
teaching, learning, and, especially, students at Pace. To investigate
institutional concerns such as retention, for example, Pace matches
the most recent NSSE data to each fall’s rosters of first-year students
who stayed and those who left. Analysis of these results provides
valuable clues to student behavior and suggests actions that faculty
and student success professionals might take. A study of sophomore
retention at Pace used the NSSE responses of second semester first-
year students who would soon be sophomores to provide insight into
how to address “sophomore slump” and resulting attrition. Results from
the early years of NSSE administration at Pace highlighted the need
to pay more attention to student-faculty interaction. To address this
need, Pace’s Center for Teaching, Learning, and Technology, along with
the University Assessment Committee, developed a series of faculty
development workshops using NSSE results to provide evidence. These
workshops included breakout sessions in which faculty discussed
NSSE results and shared best practices. Results from subsequent
NSSE administrations showed upward trends in the student-faculty
interaction benchmark. With NSSE 2013, Pace opens a new chapter
in its increasingly sophisticated efforts for improvement. The updated
survey’s potential for deeper examination of student-faculty interaction
through the Engagement Indicators, its expansion of the quality of
relationship questions, and its new quantitative reasoning items invite
new perspectives, fresh insights, and fuller understanding of important
educational issues.
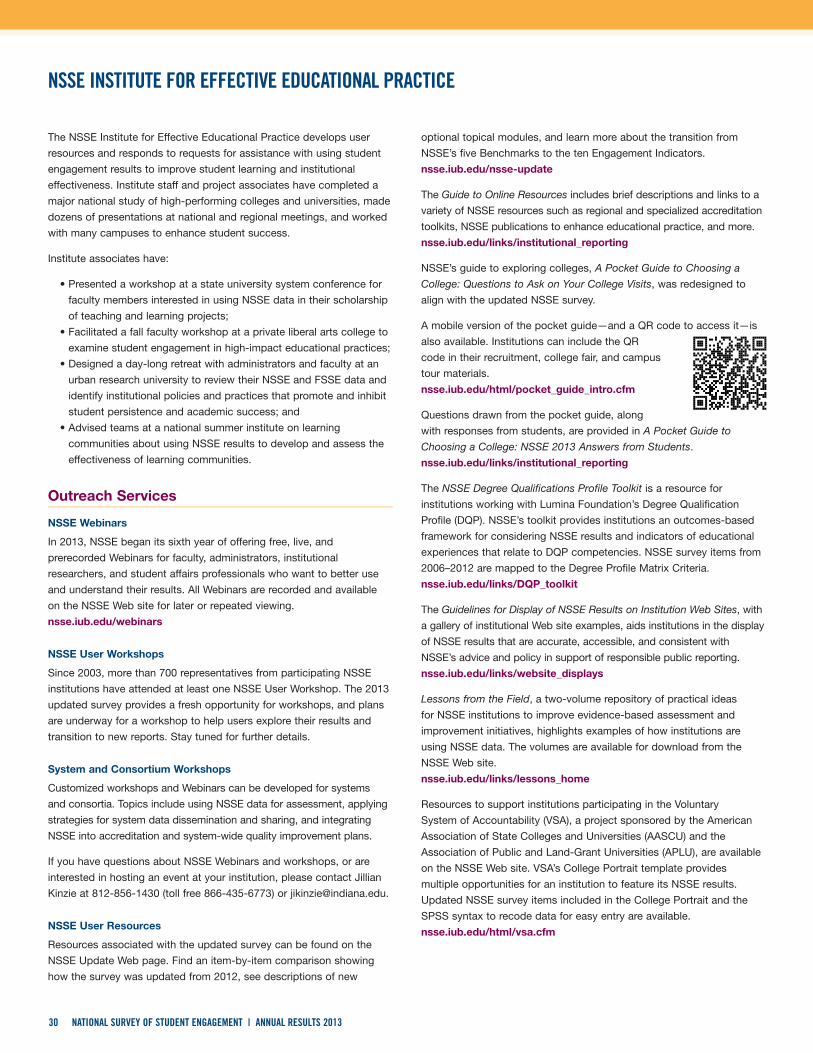
30 NATIONAL SURVEY OF STUDENT ENGAGEMENT | ANNUAL RESULTS 2013
NSSE INSTITUTE FOR EFFECTIVE EDUCATIONAL PRACTICE
The NSSE Institute for Effective Educational Practice develops user
resources and responds to requests for assistance with using student
engagement results to improve student learning and institutional
effectiveness. Institute staff and project associates have completed a
major national study of high-performing colleges and universities, made
dozens of presentations at national and regional meetings, and worked
with many campuses to enhance student success.
Institute associates have:
• Presented a workshop at a state university system conference for
faculty members interested in using NSSE data in their scholarship
of teaching and learning projects;
• Facilitated a fall faculty workshop at a private liberal arts college to
examine student engagement in high-impact educational practices;
• Designed a day-long retreat with administrators and faculty at an
urban research university to review their NSSE and FSSE data and
identify institutional policies and practices that promote and inhibit
student persistence and academic success; and
• Advised teams at a national summer institute on learning
communities about using NSSE results to develop and assess the
effectiveness of learning communities.
Outreach Services
NSSE Webinars
In 2013, NSSE began its sixth year of offering free, live, and
prerecorded Webinars for faculty, administrators, institutional
researchers, and student affairs professionals who want to better use
and understand their results. All Webinars are recorded and available
on the NSSE Web site for later or repeated viewing.
nsse.iub.edu/webinars
NSSE User Workshops
Since 2003, more than 700 representatives from participating NSSE
institutions have attended at least one NSSE User Workshop. The 2013
updated survey provides a fresh opportunity for workshops, and plans
are underway for a workshop to help users explore their results and
transition to new reports. Stay tuned for further details.
System and Consortium Workshops
Customized workshops and Webinars can be developed for systems
and consortia. Topics include using NSSE data for assessment, applying
strategies for system data dissemination and sharing, and integrating
NSSE into accreditation and system-wide quality improvement plans.
If you have questions about NSSE Webinars and workshops, or are
interested in hosting an event at your institution, please contact Jillian
Kinzie at 812-856-1430 (toll free 866-435-6773) or [email protected].
NSSE User Resources
Resources associated with the updated survey can be found on the
NSSE Update Web page. Find an item-by-item comparison showing
how the survey was updated from 2012, see descriptions of new
optional topical modules, and learn more about the transition from
NSSE’s five Benchmarks to the ten Engagement Indicators.
nsse.iub.edu/nsse-update
The Guide to Online Resources includes brief descriptions and links to a
variety of NSSE resources such as regional and specialized accreditation
toolkits, NSSE publications to enhance educational practice, and more.
nsse.iub.edu/links/institutional_reporting
NSSE’s guide to exploring colleges, A Pocket Guide to Choosing a
College: Questions to Ask on Your College Visits, was redesigned to
align with the updated NSSE survey.
A mobile version of the pocket guide—and a QR code to access it—is
also available. Institutions can include the QR
code in their recruitment, college fair, and campus
tour materials.
nsse.iub.edu/html/pocket_guide_intro.cfm
Questions drawn from the pocket guide, along
with responses from students, are provided in A Pocket Guide to
Choosing a College: NSSE 2013 Answers from Students.
nsse.iub.edu/links/institutional_reporting
The NSSE Degree Qualifications Profile Toolkit is a resource for
institutions working with Lumina Foundation’s Degree Qualification
Profile (DQP). NSSE’s toolkit provides institutions an outcomes-based
framework for considering NSSE results and indicators of educational
experiences that relate to DQP competencies. NSSE survey items from
2006–2012 are mapped to the Degree Profile Matrix Criteria.
nsse.iub.edu/links/DQP_toolkit
The Guidelines for Display of NSSE Results on Institution Web Sites, with
a gallery of institutional Web site examples, aids institutions in the display
of NSSE results that are accurate, accessible, and consistent with
NSSE’s advice and policy in support of responsible public reporting.
nsse.iub.edu/links/website_displays
Lessons from the Field, a two-volume repository of practical ideas
for NSSE institutions to improve evidence-based assessment and
improvement initiatives, highlights examples of how institutions are
using NSSE data. The volumes are available for download from the
NSSE Web site.
nsse.iub.edu/links/lessons_home
Resources to support institutions participating in the Voluntary
System of Accountability (VSA), a project sponsored by the American
Association of State Colleges and Universities (AASCU) and the
Association of Public and Land-Grant Universities (APLU), are available
on the NSSE Web site. VSA’s College Portrait template provides
multiple opportunities for an institution to feature its NSSE results.
Updated NSSE survey items included in the College Portrait and the
SPSS syntax to recode data for easy entry are available.
nsse.iub.edu/html/vsa.cfm

Snapshot
Engagement Indicators
Theme Engagement Indicator
Higher-Order Learning (HO)
Reflective & Integrative Learning (RI)
Learning Strategies (LS)
Quantitative Reasoning (QR)
Collaborative Learning (CL)
Discussions with Diverse Others (DD)
-- Student-Faculty Interaction (SF)
Effective Teaching Practices (ET)
Quality of Interactions (QI)
Supportive Environment (SE)
High-Impact Practices (HIPs)
Administra on Summary Additional Questions
△--
△--
▼Your students’ average was significantly lower (p < .05) with an effect size at least .3 in magnitude.
Public Research UnivFirst-year Senior
△--
▽--
△△----
Sets of items are grouped into ten Engagement Indicators, which fit within four themes of engagement. At right are summary results for your institution. For details, see your Engagement Indicators report.
Key:
No significant difference.
Academic Challenge
Learning with Peers
Experiences with Faculty
Campus Environment
▲
----
▽--
--
△
Due to their positive associations with student learning and retention, special undergraduate opportunities are designated "high-impact." For more details and statistical comparisons, see your High-Impact Practices report.
Your institution administered the following additional question set(s):
Academic Advising
Experiences with Writing
Refer to your Topical Module report(s) for complete results.
First-year
1,577
NSSE asks first-year and senior students about a wide range of educationally purposeful activities (for more information, see page 4). This Snapshot is a concise collection of key findings from your institution's NSSE 2013 participation. We hope this information stimulates discussion on your campus about the undergraduate experience. Additional details about these results, including statistical test results, can be found in the reports referenced throughout.
NSSE 2013 SnapshotNSSEville State University
Your students compared with
Comparison Group
See your Selected Comparison Groups report for details.
Public Research Univ
The comparison group featured in this report is
Your students’ average was significantly higher (p < .05) with an effect size at least .3 in magnitude.
△Your students’ average was significantly higher (p < .05) with an effect size less than .3 in magnitude.
▽Your students’ average was significantly lower (p < .05) with an effect size less than .3 in magnitude.
△▽
1,238 21%
27% 63% 70%
Refer to your Administration Summary and Respondent Profile reports for more information.
63%
Full-time
First-yearLearning Communities, Service-Learning, and Research w/Faculty
SeniorLearning Communities, Service-Learning, Research w/Faculty, Internships, Study Abroad, and Culminating Experiences
Female
95%
Count Resp. rate
Senior
58%
60%
26%
24%
NSSEville State
Public Research Univ
Participated in two or more HIPs Participated in one HIP
10%
13%
54%
43%
0% 25% 50% 75% 100%
NSSEville State
Public Research Univ
Introducing the NSSE 2013 Snapshot
The NSSE 2013 Snapshot summarizes each institution’s key
findings and provides an accessible orientation to results. This
concise, four-page report uses enhanced graphics to highlight
results organized around the new Engagement Indicators and
High-Impact Practices, and displays item-level results for five
questions on which students scored the highest and the lowest
relative to comparison groups. It also shows results revealing
students’ perceptions of their cognitive and affective development
as well as their overall satisfaction with the institution.
The Snapshot is designed to
be used by and shared with
faculty and staff across campus.
Consider sharing this report in
any of the following ways:
• Provide copies to senior
level administrators.
• Meet with directors from
student affairs and support
service units to review
Snapshot results and discuss
data points related to student
life and to identify themes
and student subpopulation
results requiring more in-depth examination.
• Share the report with faculty development staff to identify
potential topics for teaching and learning workshops.
Institutions that participated in NSSE 2013 can download their
Snapshot by logging onto the NSSE Institution Interface.
View a sample Snapshot here:
nsse.iub.edu/html/sampleInstitutionalReport.cfm
31NATIONAL SURVEY OF STUDENT ENGAGEMENT | ANNUAL RESULTS 2013
Research Initiatives
Learning to Improve: A Study of Evidence-Based Improvement in Higher Education
NSSE’s work on the Spencer Foundation funded project, Learning to
Improve: A Study of Evidence-Based Improvement in Higher Education,
continues. Findings from a set of institutions that achieved significant
positive improvement in a variety of NSSE measures over time reveals
promising practices to develop a culture of institutional improvement
and foster reform in higher education.
nsse.iub.edu/learningtoimprove
Collaboration with the Linking Institutional Policies to Student Success (LIPSS) Project
The LIPSS research project, coordinated by the Center for Higher
Education Research, Teaching, and Innovation at Florida State
University, involved nearly 100 institutions participating in NSSE to
use results to identify institution-wide policies that influence student
engagement and illuminate the relationship between institutional
policies and practices and student success.
www.cherti.fsu.edu/LIPSS
Engaging Latino Students for Transfer and College Completion Project
With support from The Kresge Foundation and the Greater Texas
Foundation, NSSE and the Center for Community College Student
Engagement have joined with Excelencia in Education in a special project
focused on helping 22 two- and four-year partner institutions strengthen
Latino student engagement, transfer success, and college completion.
The project will begin with special analyses of NSSE and Community
College Survey of Student Engagement (CCSSE) data pertaining to the
experiences of Latinos. Partner institutions will then develop action plans
focused on Latino engagement and success.
nsse.iub.edu/links/EngagingLatinoStudents
NSSE INSTITUTE (CONTINUED)
ACADIA UNIVERSITY

32 NATIONAL SURVEY OF STUDENT ENGAGEMENT | ANNUAL RESULTS 2013
LOOKING AHEAD
Following the successful launch of the updated NSSE and the production
of redesigned reports and resources, we look forward to new insights
from the updated survey and learning how participating institutions are
making use of their results. We are particularly excited to document new
findings about salient issues in undergraduate education and to explore
the updated survey’s potential to inform the key priorities of institutional
assessment and improvement efforts in teaching and learning.
New Opportunities for Data Use
The updated NSSE instrument, accompanied by its more actionable
measures and concise, information-rich reports, promises to extend
and deepen data use. In fact, a central goal for the refined measures
and scales was to make data more useful for institutional assessment.
This resulted in one of the project’s most significant transitions: the
shift from the familiar five NSSE benchmarks to a new set of ten
Engagement Indicators nested within four broad themes (see page
8). The new indicators offer more coherent and specific measures of
educationally effective practices, thereby providing greater insight into
where to concentrate educational improvement efforts.
Several of the new measures, such as Learning Strategies and Effective
Teaching Practices, carry the potential to expand the audience for
NSSE results. First-year student results related to learning strategies,
for example, can be shared with academic advisors, professionals in
academic success centers, faculty teaching first-year courses, and
peer advisors to promote new students’ use of proven approaches for
learning effectiveness. NSSE results have always lent themselves to
informing faculty development initiatives, and the new effective teaching
practice items can extend partnerships between centers for teaching
and learning and academic programs.
Uses for Accreditation
The updated survey and new topical modules aptly reflect the current
emphases in quality assurance and accreditation. For example, the new
Quantitative Reasoning items address a variety of ways that students
may analyze and apply numerical information across the curriculum.
Results from this Engagement Indicator and the survey questions that
make it up can inform the Western Association of Schools and Colleges
(WASC) accreditation standard 2.2a, which focuses on assessment
of core competencies. Similarly, institutions that participated in the
Learning with Technology module and are accredited by the Southern
Association of Colleges and Schools Commission on Colleges (SACS)
can use their NSSE data when writing their self-studies, using the
module results as an indirect measure for SACS Standard 3.8, Library
and Other Learning Resources.
NSSE’s Accreditation Toolkits assist in the use of NSSE results in
accreditation self-studies. All regional accreditation toolkits have been
updated to reflect recent changes in the NSSE survey, and updates to
the Specialized Accreditation Toolkits are ongoing.
nsse.iub.edu/links/accred_toolkits
Redesigned Reports and Tools Create New Opportunities
The updated survey and new topical modules create novel
opportunities to reimagine and reexamine uses for the data and form
new partnerships on campuses. To accompany these changes, we
thoroughly redesigned our reports for participating institutions to
provide greater information value and utility for a range of users.
In addition, NSSE’s interactive online Report Builders—both the publicly
available version that provides access to aggregate data and the
secure institutional version designed for our users—offer an easy way
to investigate the prevalence of effective educational practice among
user-defined subgroups. These valuable tools will be updated with 2013
data in late fall 2013.
nsse.iub.edu/links/rb_intro
The new measures afforded by the updated NSSE survey more precisely
reflect contemporary dimensions of effective educational practice,
offer greater coherence in measurement, and provide more actionable
results. NSSE’s transition to these new measures promises to generate
assessment results that are more meaningful and that effectively
stimulate campus-wide discussions about teaching and learning.
What is Your Institution’s Story?
We hope our users share our enthusiasm about these changes, and we
look forward to learning more about how institutions use their NSSE
results. If you have a NSSE story to tell, please contact Jillian Kinzie of the
NSSE Institute for Effective Educational Practice at [email protected].
NSSE and its companion projects are dedicated to providing diagnostic,
actionable information that colleges and universities can use to
understand, document, and enhance quality in undergraduate education.
We look forward to continuing our collaborations with participating
institutions and others in service to this vitally important mission.
FARMINGDALE STATE COLLEGE OF THE STATE UNIVERSITY OF NEW YORK
Online Resources
Summary Tables
Access basic tables of annual survey responses and statistics by student and institution characteristics. nsse.iub.edu/links/summary_tables
NSSE Report Builders—Public and Institutional
Interactive tools that allow institutions to generate NSSE results by user-selected student and institutional characteristics. Two versions are available: Public—for media, institutions, researchers, etc., and Institutional—for participating institutions to generate custom reports using their own NSSE data. nsse.iub.edu/html/report_builder.cfm
Psychometric Portfolio
Studies of validity, reliability, and other indicators of quality of NSSE’s data are detailed, including breakdowns by a variety of student and institutional characteristics. nsse.iub.edu/links/psychometric_portfolio
Participating Institutions Search
Search tool to generate lists of participating institutions for selected years and surveys (NSSE, FSSE, BCSSE, LSSSE), or to identify the participation history of a specific institution. nsse.iub.edu/html/participants.cfm
Webinars
Live and recorded Webinars for faculty, administrators, institutional researchers, and student affairs professionals who want to better use and understand their results. nsse.iub.edu/webinars
Find out more about BCSSE online. bcsse.iub.edu
33NATIONAL SURVEY OF STUDENT ENGAGEMENT | ANNUAL RESULTS 2013
REFERENCES AND RESOURCES
American Association for the Advancement of Science. (2001). In pursuit of a diverse science, technology, engineering, and mathematics workforce: Recommended research priorities to enhance participation by underrepresented minorities. Washington, DC: AAAS.
Blaich, C., & Wise, K. (2008). Overview of findings from the first year of the Wabash National Study of Liberal Arts Education. Unpublished manuscript. Retrieved from www.liberalarts.wabash.edu
Brown, M. K., Hershock, C., Finelli, C. J., & O’Neal, C. (2009). Teaching for retention in science, engineering, and math disciplines: A guide for faculty. Occasional Paper No. 25. Ann Arbor, MI: Center for Research on Teaching and Learning, University of Michigan.
Dingman, S. W., & Madison, B. L. (2011). Twenty-first-century quantitative education: Beyond content. Peer Review, 13(3), 15-18.
Eldredge, N., & Gould, S. J. (1972). Punctuated equilibria: An alternative to phyletic gradualism. In T. J. M. Schopf (Ed.), Models in paleobiology (pp. 82–115). San Francisco, CA: Freeman Cooper.
Gonyea, R. M. & Kuh, G. D. (Eds.). (2009). Using NSSE in institutional research [Special issue]. New Directions for Institutional Research, 141. San Francisco: Jossey-Bass.
Gurin P., Dey E. L., Hurtado S., Gurin G. (2002). Diversity in higher education: Theory and impact on educational outcomes. Harvard Educational Review, 72(3), 330–366.
Huber, M.T., & Hutchings, T. (2004). Integrative learning: Mapping the terrain. Washington, DC: Association of American Colleges and Universities.
Kuh, G. D., & Hu, S. (2001). The effects of student-faculty interaction in the 1990s. Review of Higher Education, 24(3), 309–332.
Kuh, G. D. (2008). High-impact educational practices: What they are, who has access to them, and why they matter. Washington, DC: Association of American Colleges and Universities.
Kuh, G. D., Kinzie, J., Schuh, J. H., Whitt, E. J., & Associates (2010). Student success in college: Creating conditions that matter. San Francisco: Jossey-Bass.
Kunter, M., Greenburg, E., Jin, Y., Boyle, B., Hsu, Y., & Dunleavy, E. (2007). Literacy in everyday life: Results from the 2003 National Assessment of Adult Literacy. NCES 2007-490. U.S. Department of Education, National Center for Educational Statistics, Washington, DC.
Loes, C., Pascarella, E., & Umbach, P. (2012). Effects of diversity experiences on critical thinking skills: Who benefits? The Journal of Higher Education 83(1), 1-25.
Marton, F., & Säljö, R. (1976). On qualitative differences in learning. I: Outcome and process. British Journal of Educational Psychology, 46, 4-11.
Marton, F., & Säljö, R. (1997). Approaches to learning. In F. Marton, D.J. Hounsell, & N.J. Entwistle (Eds.), The Experience of Learning: Implications for teaching and Studying Higher Education (pp. 36-55). Edinburgh, UK: Scottish Academic Press.
McCormick, A. C., Gonyea, R. M., & Kinzie, J. (2013). Refreshing Engagement: NSSE at 13. Change: The Magazine of Higher Learning, 45(3), 6-15.
McCormick, A. C., Kinzie, J., & Gonyea, R. M. (2013). Student Engagement: Bridging Research and Practice to Improve the Quality of Undergraduate Education. In M.B. Paulsen (Ed.), Higher Education: Handbook of Theory and Research Vol. 28 (pp. 47-92). Dordrecht, The Netherlands: Springer.
McKeachie, W. J. (2002). McKeachie’s teaching tips: Strategies, research, and theory for college and university teachers. Boston, MA: Houghton Mifflin.
Nelson Laird, T. F., Shoup, R., & Kuh, G.D. (2006, May). Measuring deep approaches to learning using the National Survey of Student Engagement. Paper presented at the Annual Forum of Association for Institutional Research, Chicago, IL.
Orfield, G. (2009). Reviving the goal of an integrated society: A 21st century challenge. Los Angeles, CA: Civil Rights Project/Proyecto Derechos Civiles.
Ormrod, J. E. (2008). Human learning. Upper Saddle River, NJ: Pearson.
Pascarella, E. T., & Terenzini, P. T. (2005). How college affects students: Vol. 2. A third decade of research. San Francisco, CA: Jossey-Bass.
President’s Council of Advisors on Science and Technology (2012). Engage to excel: Producing one million additional college graduates with degrees in science, technology, engineering, and mathematics. Report to the President. Retrieved from http://www.whitehouse.gov/sites/default/ files/microsites/ostp/pcast-engage-to-excel-final_feb.pdf
Steen, L. A. (2001). Mathematics and democracy: The case for quantitative literacy. Washington, DC: National Council on Education and the Disciplines.
Vermetten, Y. J., Lodewijks, H. G., & Vermunt, J. D. (1999). Consistency and variability of learning strategies in different university courses. Higher Education, 37(1), 1-21.
For a list of research articles, conference presentations, and other works, see nsse.iub.edu/html/pubs.cfm

34 NATIONAL SURVEY OF STUDENT ENGAGEMENT | ANNUAL RESULTS 2013
ENGAGEMENT INDICATORS: INTRODUCTION
To represent the multi-dimensional nature of student engagement
at national, sector, institutional, and intra-institutional levels,
NSSE developed ten Engagement Indicators organized within four
engagement themes:
Theme Engagement Indicators
Academic Challenge
Higher-Order Learning
Reflective & Integrative Learning
Learning Strategies
Quantitative Reasoning
Learning with PeersCollaborative LearningDiscussions with Diverse Others
Experiences with FacultyStudent-Faculty InteractionEffective Teaching Practices
Campus EnvironmentQuality of InteractionsSupportive Environment
Pages 36 through 45 show means and percentile distributions of
Engagement Indicator scores, plus student responses to survey items that
make up each indicator. These statistics are presented separately by class
level for the entire U.S. NSSE 2013 cohort of colleges and universities, and
for those institutions that scored in the top 50% and top 10% of all U.S.
NSSE 2013 institutionsa on a given Engagement Indicator.
Detailed tables of Engagement Indicators and responses to all survey
items by student and institutional characteristics are available on the
NSSE Web site: nsse.iub.edu/html/summary_tables.cfm
SampleThese results are based on responses from 136,397 first-year and 199,346
senior students who were randomly sampled or census-administered from
568 bachelor’s-granting colleges and universities in the US.b
WeightingPercentile distributions and frequency tables are weighted by gender
and enrollment status to account for differential survey response
(women and full-time students respond at higher rates). In addition, to
compensate for different sampling and response rates by institutions of
varying size, cases are weighted to ensure that each institution has an
appropriate proportional share of all U.S. respondents.
CALIFORNIAN LUTHERN UNIVERSITY
Each Engagement Indicator provides valuable information about a distinct
aspect of student engagement by summarizing students’ responses to
a set of related survey questions. To facilitate comparisons over time,
as well as between individual institutions or groups of institutions, each
Engagement Indicator is expressed on a 60-point scale. Engagement
Indicators were computed by scoring responses to each component
question from 0 to 60, then taking the average. Thus an Engagement
Indicator score of zero means that every student chose the lowest
response option for every item in that indicator, while a score of 60 means
that every student chose the highest response to every item.
“I’ve been challenged to learn new and difficult things, think critically, and examine various points of view. I’ve also always felt that my instructors and other faculty and even students sincerely want me to succeed and were willing to help me. ”— SENIOR, RELIGION MAJOR, GOSHEN COLLEGE
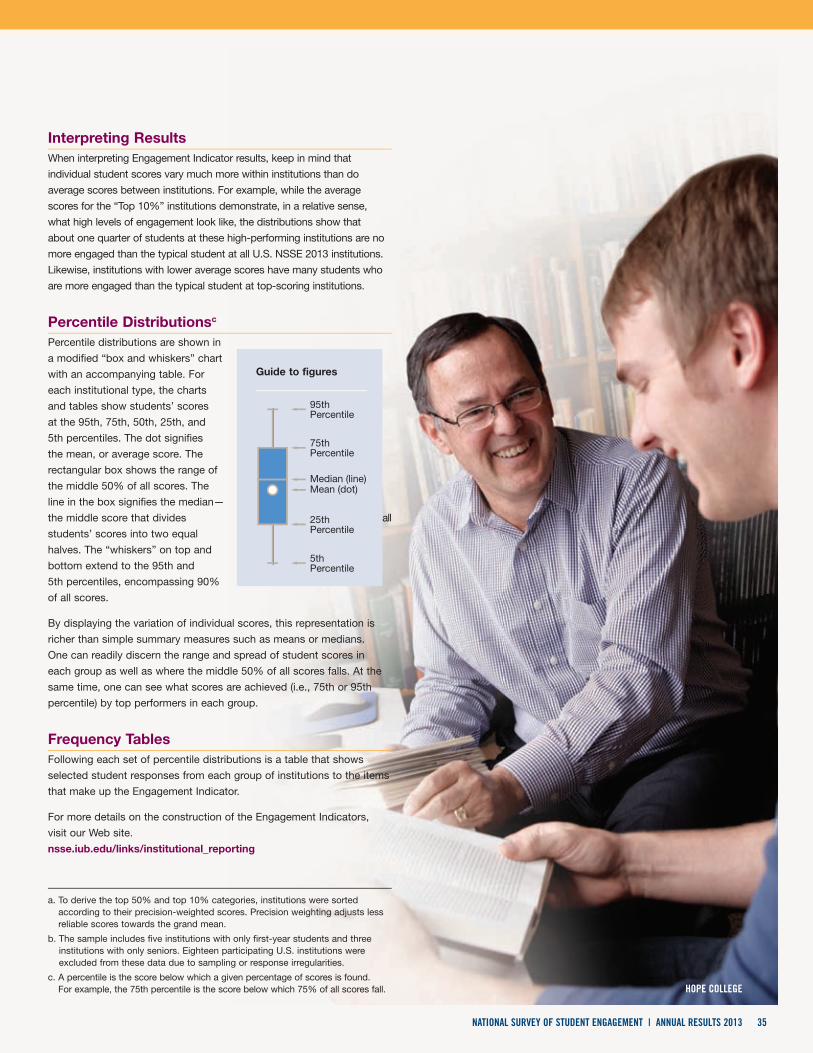
35NATIONAL SURVEY OF STUDENT ENGAGEMENT | ANNUAL RESULTS 2013
95thPercentile
75thPercentile
Median (line)Mean (dot)
25thPercentile
5thPercentile
Guide to figures
Interpreting ResultsWhen interpreting Engagement Indicator results, keep in mind that
individual student scores vary much more within institutions than do
average scores between institutions. For example, while the average
scores for the “Top 10%” institutions demonstrate, in a relative sense,
what high levels of engagement look like, the distributions show that
about one quarter of students at these high-performing institutions are no
more engaged than the typical student at all U.S. NSSE 2013 institutions.
Likewise, institutions with lower average scores have many students who
are more engaged than the typical student at top-scoring institutions.
Percentile Distributionsc
Percentile distributions are shown in
a modified “box and whiskers” chart
with an accompanying table. For
each institutional type, the charts
and tables show students’ scores
at the 95th, 75th, 50th, 25th, and
5th percentiles. The dot signifies
the mean, or average score. The
rectangular box shows the range of
the middle 50% of all scores. The
line in the box signifies the median—
the middle score that divides all
students’ scores into two equal
halves. The “whiskers” on top and
bottom extend to the 95th and
5th percentiles, encompassing 90%
of all scores.
By displaying the variation of individual scores, this representation is
richer than simple summary measures such as means or medians.
One can readily discern the range and spread of student scores in
each group as well as where the middle 50% of all scores falls. At the
same time, one can see what scores are achieved (i.e., 75th or 95th
percentile) by top performers in each group.
Frequency Tables Following each set of percentile distributions is a table that shows
selected student responses from each group of institutions to the items
that make up the Engagement Indicator.
For more details on the construction of the Engagement Indicators,
visit our Web site.
nsse.iub.edu/links/institutional_reporting
a. To derive the top 50% and top 10% categories, institutions were sorted according to their precision-weighted scores. Precision weighting adjusts less reliable scores towards the grand mean.
b. The sample includes five institutions with only first-year students and three institutions with only seniors. Eighteen participating U.S. institutions were excluded from these data due to sampling or response irregularities.
c. A percentile is the score below which a given percentage of scores is found. For example, the 75th percentile is the score below which 75% of all scores fall. HOPE COLLEGE
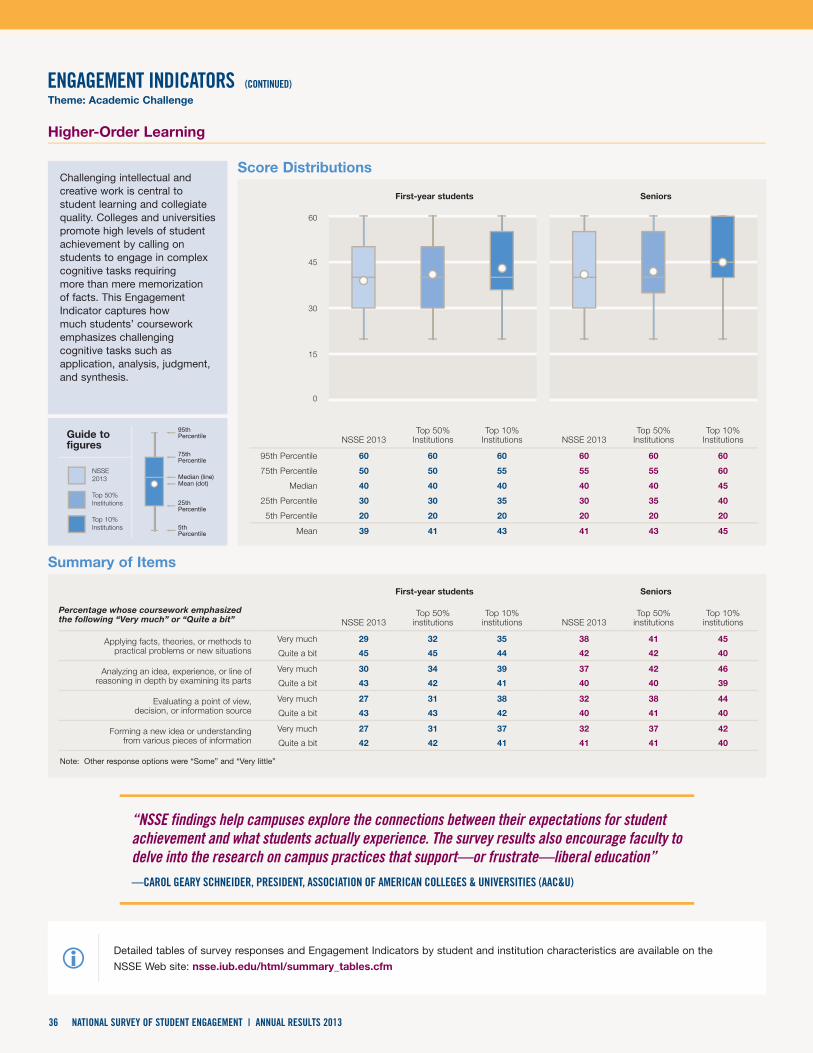
0
15
30
45
60
NSSE 2013Top 50%
InstitutionsTop 10%
Institutions NSSE 2013Top 50%
InstitutionsTop 10%
Institutions
95th Percentile 60 60 60 60 60 60
75th Percentile 50 50 55 55 55 60
Median 40 40 40 40 40 45
25th Percentile 30 30 35 30 35 40
5th Percentile 20 20 20 20 20 20
Mean 39 41 43 41 43 45
Percentage whose coursework emphasized the following “Very much” or “Quite a bit” NSSE 2013
Top 50% institutions
Top 10% institutions NSSE 2013
Top 50% institutions
Top 10% institutions
Applying facts, theories, or methods topractical problems or new situations
Very much 29 32 35 38 41 45
Quite a bit 45 45 44 42 42 40
Analyzing an idea, experience, or line ofreasoning in depth by examining its parts
Very much 30 34 39 37 42 46
Quite a bit 43 42 41 40 40 39
Evaluating a point of view, decision, or information source
Very much 27 31 38 32 38 44
Quite a bit 43 43 42 40 41 40
Forming a new idea or understandingfrom various pieces of information
Very much 27 31 37 32 37 42
Quite a bit 42 42 41 41 41 40
First-year students
First-year students
Score Distributions
Higher-Order Learning
Theme: Academic Challenge
Note: Other response options were “Some” and “Very little”
Seniors
Seniors
Challenging intellectual and creative work is central to student learning and collegiate quality. Colleges and universities promote high levels of student achievement by calling on students to engage in complex cognitive tasks requiring more than mere memorization of facts. This Engagement Indicator captures how much students’ coursework emphasizes challenging cognitive tasks such as application, analysis, judgment, and synthesis.
95thPercentile
75thPercentile
Median (line)Mean (dot)
25thPercentile
5thPercentile
Guide to figures
NSSE 2013
Top 50% Institutions
Top 10% Institutions
Summary of Items
Detailed tables of survey responses and Engagement Indicators by student and institution characteristics are available on the
NSSE Web site: nsse.iub.edu/html/summary_tables.cfmi
36 NATIONAL SURVEY OF STUDENT ENGAGEMENT | ANNUAL RESULTS 2013
ENGAGEMENT INDICATORS (CONTINUED)
“NSSE findings help campuses explore the connections between their expectations for student achievement and what students actually experience. The survey results also encourage faculty to delve into the research on campus practices that support—or frustrate—liberal education”— CAROL GEARY SCHNEIDER, PRESIDENT, ASSOCIATION OF AMERICAN COLLEGES & UNIVERSITIES (AAC&U)
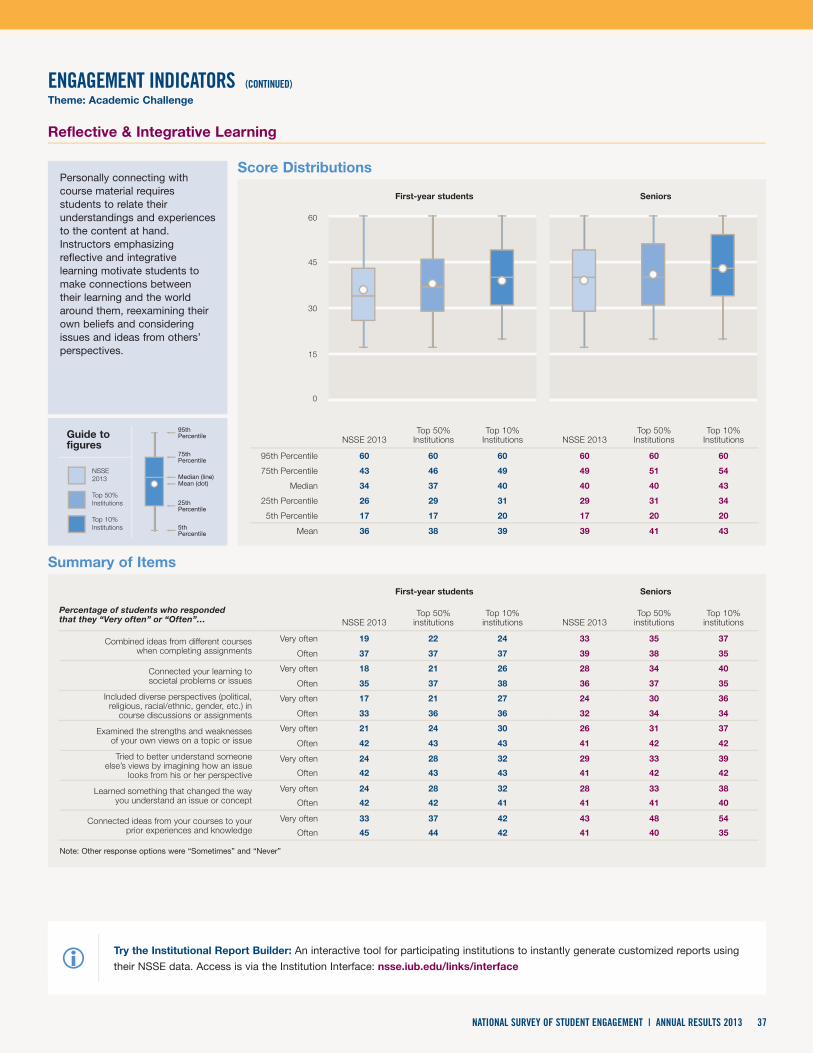
Reflective & Integrative Learning
Theme: Academic Challenge
Personally connecting with course material requires students to relate their understandings and experiences to the content at hand. Instructors emphasizing reflective and integrative learning motivate students to make connections between their learning and the world around them, reexamining their own beliefs and considering issues and ideas from others’ perspectives.
0
15
30
45
60
NSSE 2013Top 50%
InstitutionsTop 10%
Institutions NSSE 2013Top 50%
InstitutionsTop 10%
Institutions
95th Percentile 60 60 60 60 60 60
75th Percentile 43 46 49 49 51 54
Median 34 37 40 40 40 43
25th Percentile 26 29 31 29 31 34
5th Percentile 17 17 20 17 20 20
Mean 36 38 39 39 41 43
Percentage of students who responded that they “Very often” or “Often”… NSSE 2013
Top 50% institutions
Top 10% institutions NSSE 2013
Top 50% institutions
Top 10% institutions
Combined ideas from different courses when completing assignments
Very often 19 22 24 33 35 37
Often 37 37 37 39 38 35
Connected your learning to societal problems or issues
Very often 18 21 26 28 34 40
Often 35 37 38 36 37 35
Included diverse perspectives (political, religious, racial/ethnic, gender, etc.) in
course discussions or assignments
Very often 17 21 27 24 30 36
Often 33 36 36 32 34 34
Examined the strengths and weaknesses of your own views on a topic or issue
Very often 21 24 30 26 31 37
Often 42 43 43 41 42 42
Tried to better understand someone else’s views by imagining how an issue
looks from his or her perspective
Very often 24 28 32 29 33 39
Often 42 43 43 41 42 42
Learned something that changed the way you understand an issue or concept
Very often 24 28 32 28 33 38
Often 42 42 41 41 41 40
Connected ideas from your courses to your prior experiences and knowledge
Very often 33 37 42 43 48 54
Often 45 44 42 41 40 35
First-year students
First-year students
Score Distributions
Note: Other response options were “Sometimes” and “Never”
Seniors
Seniors
95thPercentile
75thPercentile
Median (line)Mean (dot)
25thPercentile
5thPercentile
Guide to figures
NSSE 2013
Top 50% Institutions
Top 10% Institutions
Summary of Items
Try the Institutional Report Builder: An interactive tool for participating institutions to instantly generate customized reports using
their NSSE data. Access is via the Institution Interface: nsse.iub.edu/links/interfacei
37NATIONAL SURVEY OF STUDENT ENGAGEMENT | ANNUAL RESULTS 2013
ENGAGEMENT INDICATORS (CONTINUED)

Learning Strategies
Theme: Academic Challenge
College students enhance their learning and retention by actively engaging with and analyzing course material rather than approaching learning as absorption. Examples of effective learning strategies include identifying key information in readings, reviewing notes after class, and summarizing course material. Knowledge about the prevalence of effective learning strategies helps colleges and universities target interventions to promote student learning and success.
95thPercentile
75thPercentile
Median (line)Mean (dot)
25thPercentile
5thPercentile
Guide to figures
NSSE 2013
Top 50% Institutions
Top 10% Institutions
Score Distributions
Summary of Items
0
15
30
45
60
NSSE 2013Top 50%
InstitutionsTop 10%
Institutions NSSE 2013Top 50%
InstitutionsTop 10%
Institutions
95th Percentile 60 60 60 60 60 60
75th Percentile 53 53 60 53 60 60
Median 40 40 47 40 40 47
25th Percentile 27 33 33 33 33 40
5th Percentile 20 20 20 13 20 20
Mean 40 42 44 41 43 45
Percentage of students who responded that they “Very often” or “Often”… NSSE 2013
Top 50% institutions
Top 10% institutions NSSE 2013
Top 50% institutions
Top 10% institutions
Identified key information from reading assignments
Very often 38 43 50 46 51 57
Often 43 42 37 38 36 33
Reviewed your notes after classVery often 33 38 45 34 40 45
Often 33 33 31 31 31 30
Summarized what you learned in class or from course materials
Very often 28 33 41 32 38 45
Often 36 35 34 34 34 33
First-year students
First-year students
Note: Other response options were “Sometimes” and “Never”
Seniors
Seniors
Detailed tables of survey responses and Engagement Indicators by student and institution characteristics are available on the
NSSE Web site: nsse.iub.edu/html/summary_tables.cfmi
38 NATIONAL SURVEY OF STUDENT ENGAGEMENT | ANNUAL RESULTS 2013
ENGAGEMENT INDICATORS (CONTINUED)

Quantitative Reasoning
Theme: Academic Challenge
Quantitative literacy—the ability to use and understand numerical and statistical information in everyday life—is an increasingly important outcome of higher education. All students, regardless of major, should have ample opportunities to develop their ability to reason quantitatively—to evaluate, support, and critique arguments using numerical and statistical information.
95thPercentile
75thPercentile
Median (line)Mean (dot)
25thPercentile
5thPercentile
Guide to figures
NSSE 2013
Top 50% Institutions
Top 10% Institutions
Score Distributions
Summary of Items
0
15
30
45
60
NSSE 2013Top 50%
InstitutionsTop 10%
Institutions NSSE 2013Top 50%
InstitutionsTop 10%
Institutions
95th Percentile 60 60 60 60 60 60
75th Percentile 40 40 40 40 40 40
Median 27 27 27 27 33 33
25th Percentile 20 20 20 20 20 20
5th Percentile 0 0 0 0 0 0
Mean 27 29 30 30 31 33
Percentage of students who responded that they “Very often” or “Often”… NSSE 2013
Top 50% institutions
Top 10% institutions NSSE 2013
Top 50% institutions
Top 10% institutions
Reached conclusions based on your own analysis of numerical information
(numbers, graphs, statistics, etc.)
Very often 18 20 22 22 24 26
Often 34 35 37 32 34 34
Used numerical information to examine a real-world problem or issue (unemployment,
climate change, public health, etc.)
Very often 12 14 16 17 19 21
Often 26 28 29 27 28 30
Evaluated what others have concluded from numerical information
Very often 11 12 14 15 17 19
Often 26 28 30 28 30 31
First-year students
First-year students
Note: Other response options were “Sometimes” and “Never”
Seniors
Seniors
Try the Institutional Report Builder: An interactive tool for participating institutions to instantly generate customized reports using
their NSSE data. Access is via the Institution Interface: nsse.iub.edu/links/interfacei
39NATIONAL SURVEY OF STUDENT ENGAGEMENT | ANNUAL RESULTS 2013
ENGAGEMENT INDICATORS (CONTINUED)
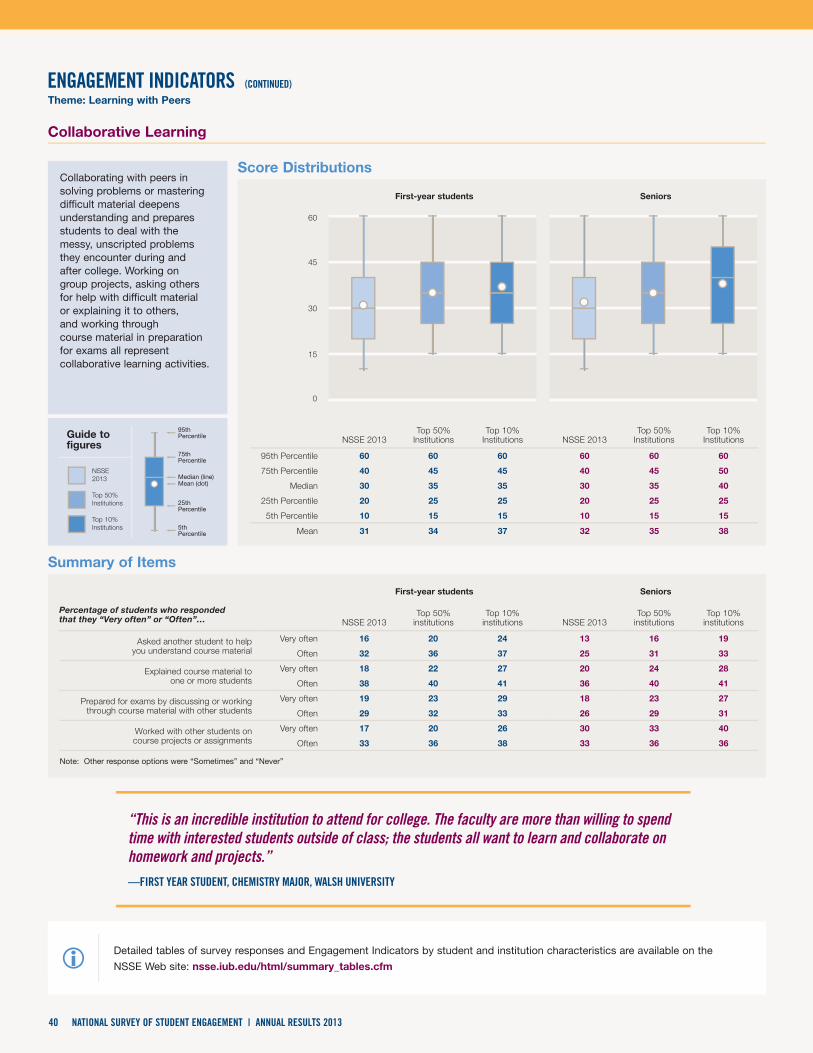
Collaborative Learning
Theme: Learning with Peers
Collaborating with peers in solving problems or mastering difficult material deepens understanding and prepares students to deal with the messy, unscripted problems they encounter during and after college. Working on group projects, asking others for help with difficult material or explaining it to others, and working through course material in preparation for exams all represent collaborative learning activities.
95thPercentile
75thPercentile
Median (line)Mean (dot)
25thPercentile
5thPercentile
Guide to figures
NSSE 2013
Top 50% Institutions
Top 10% Institutions
Score Distributions
Summary of Items
0
15
30
45
60
NSSE 2013Top 50%
InstitutionsTop 10%
Institutions NSSE 2013Top 50%
InstitutionsTop 10%
Institutions
95th Percentile 60 60 60 60 60 60
75th Percentile 40 45 45 40 45 50
Median 30 35 35 30 35 40
25th Percentile 20 25 25 20 25 25
5th Percentile 10 15 15 10 15 15
Mean 31 34 37 32 35 38
Percentage of students who responded that they “Very often” or “Often”… NSSE 2013
Top 50% institutions
Top 10% institutions NSSE 2013
Top 50% institutions
Top 10% institutions
Asked another student to help you understand course material
Very often 16 20 24 13 16 19
Often 32 36 37 25 31 33
Explained course material to one or more students
Very often 18 22 27 20 24 28
Often 38 40 41 36 40 41
Prepared for exams by discussing or working through course material with other students
Very often 19 23 29 18 23 27
Often 29 32 33 26 29 31
Worked with other students on course projects or assignments
Very often 17 20 26 30 33 40
Often 33 36 38 33 36 36
First-year students
First-year students
Note: Other response options were “Sometimes” and “Never”
Seniors
Seniors
Detailed tables of survey responses and Engagement Indicators by student and institution characteristics are available on the
NSSE Web site: nsse.iub.edu/html/summary_tables.cfmi
40 NATIONAL SURVEY OF STUDENT ENGAGEMENT | ANNUAL RESULTS 2013
ENGAGEMENT INDICATORS (CONTINUED)
“This is an incredible institution to attend for college. The faculty are more than willing to spend time with interested students outside of class; the students all want to learn and collaborate on homework and projects.”— FIRST YEAR STUDENT, CHEMISTRY MAJOR, WALSH UNIVERSITY

Discussions with Diverse Others
Theme: Learning with Peers
Colleges and universities afford students new opportunities to interact with and learn from others with different backgrounds and life experiences. Interactions across difference, both inside and outside the classroom, confer educational benefits and prepare students for personal and civic participation in a diverse and interdependent world.
95thPercentile
75thPercentile
Median (line)Mean (dot)
25thPercentile
5thPercentile
Guide to figures
NSSE 2013
Top 50% Institutions
Top 10% Institutions
Score Distributions
Summary of Items
0
15
30
45
60
NSSE 2013Top 50%
InstitutionsTop 10%
Institutions NSSE 2013Top 50%
InstitutionsTop 10%
Institutions
95th Percentile 60 60 60 60 60 60
75th Percentile 55 60 60 60 60 60
Median 40 45 50 40 45 50
25th Percentile 30 35 40 30 35 40
5th Percentile 15 20 20 15 20 20
Mean 41 43 46 42 44 46
Percentage of students who responded that they “Very often” or “Often” had discussions with… NSSE 2013
Top 50% institutions
Top 10% institutions NSSE 2013
Top 50% institutions
Top 10% institutions
People from a race or ethnicity other than your own
Very often 41 47 56 44 52 58
Often 30 29 27 28 27 26
People from an economic background other than your own
Very often 39 45 50 42 47 52
Often 34 33 31 33 31 29
People with religious beliefs other than your own
Very often 38 45 52 40 46 51
Often 30 30 28 29 29 27
People with political views other than your own
Very often 38 43 49 41 46 49
Often 31 31 28 31 30 28
First-year students
First-year students
Note: Other response options were “Sometimes” and “Never”
Seniors
Seniors
Try the Institutional Report Builder: An interactive tool for participating institutions to instantly generate customized reports using
their NSSE data. Access is via the Institution Interface: nsse.iub.edu/links/interfacei
41NATIONAL SURVEY OF STUDENT ENGAGEMENT | ANNUAL RESULTS 2013
ENGAGEMENT INDICATORS (CONTINUED)
“Prior to coming to college, I had never been exposed to so many different people from various backgrounds. I have become a more well-rounded individual and have learned many life lessons that I will use throughout the remainder of my life.”—SENIOR, BIOLOGY MAJOR, LAWRENCE UNIVERSITY

Student-Faculty Interaction
Theme: Experiences with Faculty
Interactions with faculty can positively influence the cognitive growth, development, and persistence of college students. Through their formal and informal roles as teachers, advisors, and mentors, faculty members model intellectual work, promote mastery of knowledge and skills, and help students make connections between their studies and their future plans.
95thPercentile
75thPercentile
Median (line)Mean (dot)
25thPercentile
5thPercentile
Guide to figures
NSSE 2013
Top 50% Institutions
Top 10% Institutions
Score Distributions
Summary of Items
0
15
30
45
60
NSSE 2013Top 50%
InstitutionsTop 10%
Institutions NSSE 2013Top 50%
InstitutionsTop 10%
Institutions
95th Percentile 50 55 60 55 60 60
75th Percentile 30 35 40 35 40 45
Median 20 20 25 20 30 35
25th Percentile 10 10 15 10 20 20
5th Percentile 0 0 0 0 5 10
Mean 20 23 27 23 30 35
Percentage of students who responded that they “Very often” or “Often”… NSSE 2013
Top 50% institutions
Top 10% institutions NSSE 2013
Top 50% institutions
Top 10% institutions
Talked about career plans with a faculty member
Very often 11 14 20 17 26 36
Often 21 25 27 24 30 31
Worked w/faculty on activities other than coursework (committees, student groups, etc.)
Very often 6 9 13 11 17 24
Often 12 15 18 14 20 25
Discussed course topics, ideas, or concepts with a faculty member outside of class
Very often 7 10 15 12 18 26
Often 17 21 22 20 27 31
Discussed your academic performance with a faculty member
Very often 9 11 17 12 17 25
Often 20 24 27 21 26 30
First-year students
First-year students
Note: Other response options were “Sometimes” and “Never”
Seniors
Seniors
Detailed tables of survey responses and Engagement Indicators by student and institution characteristics are available on the
NSSE Web site: nsse.iub.edu/html/summary_tables.cfmi
42 NATIONAL SURVEY OF STUDENT ENGAGEMENT | ANNUAL RESULTS 2013
ENGAGEMENT INDICATORS (CONTINUED)
“I think the instructors and teachers really make this university a beneficial place to be. Without the impact of their guidance on my life, I would definitely not be where I am today.”— SENIOR, ART HISTORY MAJOR, BOWLING GREEN STATE UNIVERSITY

Effective Teaching Practices
Theme: Experiences with Faculty
Student learning is heavily dependent on effective teaching. Organized instruction, clear explanations, illustrative examples, and effective feedback on student work all represent aspects of teaching effectiveness that promote student comprehension and learning.
95thPercentile
75thPercentile
Median (line)Mean (dot)
25thPercentile
5thPercentile
Guide to figures
NSSE 2013
Top 50% Institutions
Top 10% Institutions
Score Distributions
Summary of Items
0
15
30
45
60
NSSE 2013Top 50%
InstitutionsTop 10%
Institutions NSSE 2013Top 50%
InstitutionsTop 10%
Institutions
95th Percentile 60 60 60 60 60 60
75th Percentile 52 56 60 52 56 60
Median 40 44 48 40 44 48
25th Percentile 32 35 36 32 36 36
5th Percentile 20 20 20 16 20 20
Mean 40 43 45 41 43 45
Percentage responding “Very much” or “Quite a bit” about the extent to which instructors have… NSSE 2013
Top 50% institutions
Top 10% institutions NSSE 2013
Top 50% institutions
Top 10% institutions
Clearly explained course goals and requirements
Very much 38 43 49 41 47 53
Quite a bit 44 41 37 42 38 35
Taught course sessions in an organized way
Very much 35 41 48 38 44 51
Quite a bit 45 42 37 44 40 37
Used examples or illustrations to explain difficult points
Very much 37 43 48 41 45 51
Quite a bit 40 37 33 39 36 33
Provided feedback on a draft or work in progress
Very much 30 38 45 30 37 41
Quite a bit 35 35 31 32 31 31
Provided prompt and detailed feedback on tests or completed assignments
Very much 26 34 42 30 38 43
Quite a bit 37 37 34 38 37 35
First-year students
First-year students
Note: Other response options were “Some” and “Very little”
Seniors
Seniors
Try the Institutional Report Builder: An interactive tool for participating institutions to instantly generate customized reports using
their NSSE data. Access is via the Institution Interface: nsse.iub.edu/links/interfacei
43NATIONAL SURVEY OF STUDENT ENGAGEMENT | ANNUAL RESULTS 2013
ENGAGEMENT INDICATORS (CONTINUED)

Quality of Interactions
Theme: Campus Environment
College environments characterized by positive interpersonal relations promote student learning and success. Students who enjoy supportive relationships with peers, advisors, faculty, and staff are better able to find assistance when needed, and to learn from and with those around them.
Detailed tables of survey responses and Engagement Indicators by student and institution characteristics are available on the
NSSE Web site: nsse.iub.edu/html/summary_tables.cfmi
95thPercentile
75thPercentile
Median (line)Mean (dot)
25thPercentile
5thPercentile
Guide to figures
NSSE 2013
Top 50% Institutions
Top 10% Institutions
Score Distributions
Summary of Items
0
15
30
45
60
NSSE 2013Top 50%
InstitutionsTop 10%
Institutions NSSE 2013Top 50%
InstitutionsTop 10%
Institutions
95th Percentile 60 60 60 60 60 60
75th Percentile 50 53 56 52 55 58
Median 44 46 48 44 48 50
25th Percentile 34 38 40 36 40 42
5th Percentile 18 22 23 20 24 24
Mean 42 44 46 43 46 48
Percentage rating as high quality (6 or 7) or medium quality (3, 4, or 5) their interactions with… NSSE 2013
Top 50% institutions
Top 10% institutions NSSE 2013
Top 50% institutions
Top 10% institutions
StudentsHigh 60 66 69 65 69 70
Medium 36 31 28 33 29 28
Academic advisorsHigh 49 56 63 53 63 72
Medium 41 37 31 36 30 23
FacultyHigh 51 59 66 61 69 71
Medium 43 38 31 35 28 26
Student services staff (career services, student activities, housing, etc.)
High 44 50 56 42 51 58
Medium 45 42 35 45 39 31
Other administrative staff and offices (registrar, financial aid, etc.)
High 42 49 59 43 54 64
Medium 46 42 34 45 37 29
First-year students
First-year students
Note: On a scale from 1=”Poor” to 7=”Excellent”
Seniors
Seniors
44 NATIONAL SURVEY OF STUDENT ENGAGEMENT | ANNUAL RESULTS 2013
ENGAGEMENT INDICATORS (CONTINUED)
“I found most instructors/professors to be quite knowledgeable in their field, full of valuable experiences they willingly shared with the class, supportive, as well as available outside of class time.”— SENIOR, HEALTHCARE ADMINISTRATION AND POLICY MAJOR, KAPLAN UNIVERSITY

Supportive Environment
Theme: Campus Environment
Institutions that are committed to student success provide support and involvement across a variety of domains, including the cognitive, social, and physical. These commitments foster higher levels of student performance and satisfaction. This Engagement Indicator summarizes students’ perceptions of how much an institution emphasizes services and activities that support their learning and development.
Try the Institutional Report Builder: An interactive tool for participating institutions to instantly generate customized reports using
their NSSE data. Access is via the Institution Interface: nsse.iub.edu/links/interfacei
95thPercentile
75thPercentile
Median (line)Mean (dot)
25thPercentile
5thPercentile
Guide to figures
NSSE 2013
Top 50% Institutions
Top 10% Institutions
Score Distributions
Summary of Items
0
15
30
45
60
NSSE 2013Top 50%
InstitutionsTop 10%
Institutions NSSE 2013Top 50%
InstitutionsTop 10%
Institutions
95th Percentile 60 60 60 60 60 60
75th Percentile 48 50 53 43 45 50
Median 38 40 43 33 38 40
25th Percentile 28 30 33 23 28 30
5th Percentile 14 18 20 10 13 18
Mean 37 40 41 33 36 39
Percentage whose institutions emphasized the following “Very much” or “Quite a bit” NSSE 2013
Top 50% institutions
Top 10% institutions NSSE 2013
Top 50% institutions
Top 10% institutions
Providing support to help students succeed academically
Very much 38 42 47 31 36 42
Quite a bit 40 39 37 41 42 40
Using learning support services (tutoring services, writing center, etc.)
Very much 42 46 50 31 34 39
Quite a bit 36 35 34 37 38 37
Encouraging contact among students from different backgrounds
(social, racial/ethnic, religious, etc.)
Very much 26 29 31 22 24 27
Quite a bit 32 33 34 30 31 32
Providing opportunities to be involved sociallyVery much 35 40 45 29 35 44
Quite a bit 37 38 37 37 38 37
Providing support for your overall well-being (recreation, health care, counseling, etc.)
Very much 34 39 46 27 33 42
Quite a bit 38 39 36 35 38 37
Helping you manage your non-academic responsibilities (work, family, etc.)
Very much 16 18 19 12 13 15
Quite a bit 28 30 31 20 23 25
Attending campus activities and events (performing arts, athletic events, etc.)
Very much 31 37 44 23 31 39
Quite a bit 36 38 36 33 37 36
Attending events that address important social, economic, or political issues
Very much 21 25 28 16 21 26
Quite a bit 33 35 36 29 33 34
First-year students
First-year students
Note: Other response options were “Some” and “Very little”
Seniors
Seniors
45NATIONAL SURVEY OF STUDENT ENGAGEMENT | ANNUAL RESULTS 2013
ENGAGEMENT INDICATORS (CONTINUED)

46 NATIONAL SURVEY OF STUDENT ENGAGEMENT | ANNUAL RESULTS 2013
PARTICIPATING COLLEGES & UNIVERSITIES 2009–2013United States
AlabamaAlabama A&M University 2
Alabama State UniversityAuburn University 1 2
Auburn University at Montgomery 1
Birmingham-Southern College 1 2
Columbia Southern UniversityFaulkner University 2
Jacksonville State University 2
Judson College 1 2
Samford University 2
Southeastern Bible CollegeSpring Hill CollegeTroy UniversityUniversity of Alabama at Birmingham 1 2
University of Alabama in HuntsvilleUniversity of Alabama, The 2
University of Mobile 1
University of MontevalloUniversity of South Alabama
AlaskaAlaska Pacific University 2
University of Alaska Anchorage 2
University of Alaska Fairbanks
ArizonaArizona Christian UniversityEmbry Riddle Aeronautical University-PrescottGrand Canyon UniversityNorthern Arizona University 2
Prescott College 1
University of Advancing TechnologyUniversity of ArizonaUniversity of Phoenix-Online CampusUniversity of Phoenix-Phoenix CampusWestern International University 2
ArkansasArkansas State University 2
Central Baptist CollegeHenderson State University 2
Hendrix College 1
John Brown University 1 2
Lyon CollegeOuachita Baptist UniversityPhilander Smith College 2
Southern Arkansas University 2
University of ArkansasUniversity of Arkansas at Fort Smith 1 2
University of Arkansas at Little Rock 2
University of Central ArkansasUniversity of the Ozarks 1
CaliforniaArt Center College of Design 2
Biola UniversityBrooks InstituteCalifornia Baptist University 2
California College of the Arts 1
California Lutheran University 1 2
California Maritime Academy 1
California Polytechnic State University-San Luis Obispo 1 2
California State Polytechnic University-PomonaCalifornia State University-Bakersfield 1
California State University-Channel Islands 1
California State University-Chico 2
California State University-Dominguez Hills 2
California State University-Fresno 2
California State University-FullertonCalifornia State University-Los AngelesCalifornia State University-Monterey Bay
California State University-NorthridgeCalifornia State University-Sacramento 2
California State University-San Bernardino 2
California State University-San MarcosCalifornia State University-Stanislaus 2
Chapman UniversityClaremont McKenna CollegeColeman UniversityConcordia University 2
DeVry University-CaliforniaFresno Pacific UniversityGolden Gate University-San FranciscoHarvey Mudd College 1 2
Hope International UniversityHumboldt State UniversityHumphreys College 2
La Sierra UniversityLife Pacific College 1
Loyola Marymount University 1
Menlo College 1
Mills College 2
National University 2
Notre Dame de Namur University 2
Occidental CollegePacific Union CollegePepperdine University 1 2
Pitzer College 2
Point Loma Nazarene UniversitySaint Mary’s College of California 2
San Diego Christian CollegeSan Diego State UniversitySan Francisco State University 2
San Jose State University 2
Santa Clara University 2
Scripps College 2
Simpson UniversitySonoma State University 2
Trident University International 2
University of California-Merced 1
University of California-Santa CruzUniversity of La Verne 1 2
University of Phoenix-Southern California CampusUniversity of RedlandsUniversity of San Francisco 1
University of the PacificVanguard University of Southern California 1 2
Westmont College 2
Whittier College 1 2
Woodbury University 2
ColoradoAdams State University 1 2
American Sentinel UniversityColorado College 2
Colorado Mesa University 2
Colorado School of MinesColorado State University 2
Colorado State University-PuebloColorado Technical University-Colorado SpringsColorado Technical University-DenverColorado Technical University-OnlineFort Lewis College 1 2
Johnson & Wales University-DenverMetropolitan State University of Denver 2
Naropa UniversityNazarene Bible CollegeRegis University 2
United States Air Force Academy 2
University of Colorado at BoulderUniversity of Colorado at Colorado Springs 2
University of Colorado at Denver 2
University of Denver 1 2
Western State College of Colorado
ConnecticutCentral Connecticut State University 1
Charter Oak State CollegeConnecticut College 2
Eastern Connecticut State University 1
Fairfield UniversityLyme Academy College of Fine Arts 1
Mitchell College 1 2
Quinnipiac University 2
Sacred Heart University 1 2
Southern Connecticut State University 1
University of BridgeportUniversity of Connecticut 2
University of HartfordUniversity of New Haven 2
University of Saint JosephWestern Connecticut State University 1 2
DelawareDelaware State University 2
Goldey-Beacom CollegeUniversity of Delaware 2
Wesley College 2
Wilmington University
District of ColumbiaAmerican UniversityCatholic University of AmericaCorcoran College of Art and Design 2
Gallaudet University 2
Howard University 2
Strayer University-District of ColumbiaStrayer University-Global RegionUniversity of the District of Columbia 1 2
FloridaAdventist University of Health Sciences 2
American InterContinental University-South FloridaBarry University 1 2
Bethune Cookman University 1 2
Eckerd CollegeEdward Waters College 1 2
Embry Riddle Aeronautical University-Daytona BeachEmbry Riddle Aeronautical University-WorldwideFlagler College 1 2
Florida A&M University 2
Florida Atlantic University 2
Florida Gulf Coast University 2
Florida Institute of TechnologyFlorida International University 2
Florida Memorial UniversityFlorida Southern College 1 2
Florida State UniversityJacksonville University 1 2
Johnson & Wales University-Florida CampusLynn University 2
New College of Florida 2
Northwood UniversityNova Southeastern University 1
Palm Beach Atlantic University-West Palm Beach 2
Ringling College of Art and DesignRollins College 2
Saint Leo University 1
Saint Thomas UniversitySoutheastern UniversityStetson University 1 2
University of Central Florida 2
University of MiamiUniversity of North Florida 1 2
University of Phoenix-North Florida CampusUniversity of South FloridaUniversity of South Florida-St. Petersburg Campus 2
University of Tampa, The 2
University of West Florida, The 1 2
Warner University 2

47NATIONAL SURVEY OF STUDENT ENGAGEMENT | ANNUAL RESULTS 2013
PARTICIPATING COLLEGES & UNIVERSITIES 2009–2013 (CONTINUED)
GeorgiaAgnes Scott College 2
Albany State University 1
American InterContinental University-AtlantaAmerican InterContinental University-BuckheadArmstrong Atlantic State University 1
Augusta State UniversityBerry College 2
Brenau UniversityClark Atlanta University 2
Clayton State University 1 2
College of Coastal GeorgiaColumbus State University 2
Covenant College 2
Dalton State College 2
DeVry University-GeorgiaEmory UniversityFort Valley State University 1
Georgia College & State University 2
Georgia Gwinnett College 1 2
Georgia Health Sciences UniversityGeorgia Institute of Technology 1
Georgia Southern University 2
Georgia Southwestern State University 2
Georgia State University 1 2
Kennesaw State University 2
LaGrange College 1 2
Life UniversityMacon State College 1
Mercer University 1 2
Morehouse CollegeOglethorpe University 1 2
Paine College 2
Savannah College of Art and Design 2
Savannah State University 2
Shorter University 1 2
Southern Catholic CollegeSouthern Polytechnic State UniversitySpelman CollegeTruett-McConnell CollegeUniversity of Georgia 1 2
University of North Georgia 1 2
University of Phoenix-Atlanta CampusUniversity of West Georgia 2
Valdosta State University 2
Wesleyan College 2
Young Harris College
GuamUniversity of Guam
HawaiiBrigham Young University-Hawaii 2
Chaminade University of Honolulu 1 2
Hawai‘i Pacific University 2
University of Hawai‘i at Hilo 2
University of Hawai‘i at Manoa 2
University of Hawai‘i-West O‘ahu
IdahoBoise State University 1 2
Brigham Young University-Idaho 2
College of Idaho, TheIdaho State University 2
Lewis-Clark State CollegeUniversity of Idaho
IllinoisAmerican InterContinental University-OnlineAugustana College 2
Benedictine University 2
Bradley University 2
Chicago State University 1 2
Columbia College Chicago 2
Concordia University 1
DePaul University 2
DeVry University-IllinoisDominican University 1 2
Eastern Illinois UniversityEast-West University 2
Elmhurst College 2
Eureka College 2
Harrington College of DesignIllinois College 2
Illinois Institute of Art-Chicago, TheIllinois Institute of TechnologyIllinois State University 1 2
Illinois Wesleyan University 1 2
Judson UniversityKnox College 2
Lake Forest CollegeLewis University 1
Lincoln Christian UniversityLoyola University ChicagoMacMurray CollegeMcKendree UniversityMethodist CollegeMillikin University 1 2
Monmouth College 2
North Central College 1 2
North Park University 2
Northeastern Illinois UniversityNorthern Illinois UniversityOlivet Nazarene UniversityQuincy University 1 2
Robert Morris University Illinois 2
Rockford UniversityRoosevelt University 2
Saint Xavier University 1 2
School of the Art Institute of ChicagoSouthern Illinois University CarbondaleSouthern Illinois University Edwardsville 2
Trinity Christian College 2
University of Illinois at Springfield 2
University of Illinois at Urbana-ChampaignUniversity of Phoenix-Chicago CampusUniversity of St. Francis 1 2
Western Illinois University 1 2
Wheaton College 2
IndianaAnderson UniversityBall State UniversityButler University 1 2
Calumet College of Saint Joseph 1 2
DePauw University 2
Earlham College 2
Franklin CollegeGoshen CollegeGrace College and Theological SeminaryHanover CollegeHarrison College-Indianapolis 2
Holy Cross College 1
Huntington University 2
Indiana Institute of Technology 2
Indiana State University 1 2
Indiana University Bloomington 1 2
Indiana University East 2
Indiana University KokomoIndiana University Northwest 2
Indiana University South Bend 1 2
Indiana University SoutheastIndiana University-Purdue University Fort WayneIndiana University-Purdue University Indianapolis 2
Indiana Wesleyan University 1 2
Manchester University 2
Martin UniversityPurdue University 1
Purdue University-Calumet CampusPurdue University-North Central Campus
Rose-Hulman Institute of Technology 2
Saint Joseph’s CollegeSaint Mary-of-the-Woods College 2
Saint Mary’s College 1 2
Taylor UniversityTrine UniversityUniversity of Evansville 1 2
University of Indianapolis 2
University of Saint Francis-Ft. Wayne 2
University of Southern Indiana 2
Valparaiso UniversityWabash College 2
IowaAshford UniversityBriar Cliff University 2
Buena Vista University 1 2
Central College 2
Clarke University 1 2
Cornell CollegeDordt CollegeDrake University 1 2
Graceland University-Lamoni 2
Grand View University 2
Grinnell College 1 2
Iowa State University 2
Iowa Wesleyan College 1
Kaplan University 2
Loras CollegeLuther College 1 2
Maharishi University of ManagementMorningside College 2
Mount Mercy UniversityNorthwestern CollegeSaint Ambrose University 2
University of DubuqueUniversity of Iowa 2
University of Northern Iowa 2
Upper Iowa UniversityWaldorf CollegeWartburg College 1 2
KansasBaker University 2
Benedictine College 2
Bethany College 2
Emporia State University 2
Fort Hays State University 2
Friends University 2
Kansas State UniversityKansas Wesleyan UniversityMcPherson CollegeMidAmerica Nazarene UniversityNational American University-Overland Park 2
Newman University 2
Ottawa UniversityPittsburg State UniversitySouthwestern College 2
Tabor College 2
University of KansasUniversity of Saint MaryWashburn University 1 2
Wichita State University 1 2
KentuckyBellarmine University 1 2
Berea CollegeBrescia UniversityCampbellsville University 1 2
Centre College 1
Eastern Kentucky University 2
Kentucky State University 2
Kentucky Wesleyan College 2
Lindsey Wilson CollegeMidway College

48 NATIONAL SURVEY OF STUDENT ENGAGEMENT | ANNUAL RESULTS 2013
PARTICIPATING COLLEGES & UNIVERSITIES 2009–2013 (CONTINUED)
Morehead State University 1 2
Murray State University 2
Northern Kentucky University 1 2
Thomas More CollegeTransylvania University 2
Union CollegeUniversity of KentuckyUniversity of Louisville 1 2
University of PikevilleUniversity of the CumberlandsWestern Kentucky University 2
LouisianaCentenary College of LouisianaDillard University 2
Grambling State University 2
Louisiana State University and Agricultural & Mechanical College 2
Louisiana Tech UniversityLoyola University New Orleans 1 2
McNeese State UniversityNicholls State University 1
Northwestern State University of Louisiana 1 2
Our Lady of the Lake College 1 2
Southeastern Louisiana University 2
Southern University and A&M College 2
Southern University at New OrleansTulane University of Louisiana 2
University of Louisiana at Lafayette 1
University of Louisiana MonroeUniversity of New OrleansXavier University of Louisiana 1 2
MaineColby College 2
College of the AtlanticHusson University 2
Saint Joseph’s College of Maine 1 2
Thomas College 2
Unity College 2
University of MaineUniversity of Maine at AugustaUniversity of Maine at Farmington 1 2
University of Maine at Fort Kent 2
University of Maine at Machias 1
University of Maine at Presque Isle 1 2
University of New EnglandUniversity of Southern Maine 2
MarylandBaltimore International CollegeBowie State UniversityCollege of Notre Dame of Maryland 2
Coppin State UniversityFrostburg State UniversityGoucher College 1 2
Hood CollegeLoyola University Maryland 2
Maryland Institute College of ArtMcDaniel College 2
Morgan State University 2
Mount St. Mary’s University 2
Saint Mary’s College of Maryland 1
Salisbury UniversitySojourner-Douglass CollegeStevenson University 2
Strayer University-MarylandTowson University 1 2
United States Naval Academy 2
University of Baltimore 2
University of Maryland-Baltimore County 2
University of Maryland-College ParkUniversity of Maryland-Eastern Shore 2
Washington Adventist University 1
Washington College 1 2
MassachusettsAmerican International CollegeAnna Maria College 2
Assumption CollegeBard College at Simon’s Rock 1
Bay Path CollegeBay State College 1
Bentley University 1
Boston CollegeBridgewater State UniversityCambridge College 2
Clark University 1 2
College of Our Lady of the Elms 1 2
College of the Holy CrossCurry CollegeDean College 1
Eastern Nazarene CollegeEmerson CollegeEmmanuel College 2
Endicott College 2
Fitchburg State University 2
Framingham State University 1 2
Franklin W. Olin College of Engineering 1
Gordon CollegeLesley University 2
Massachusetts College of Art and DesignMassachusetts College of Liberal Arts 2
Merrimack CollegeMount Ida College 1
Newbury College-Brookline 2
Nichols College 2
Northeastern UniversitySalem State University 2
Simmons CollegeSpringfield College 1 2
Stonehill College 2
Suffolk University 2
Tufts UniversityUniversity of Massachusetts Amherst 2
University of Massachusetts Boston 1
University of Massachusetts DartmouthUniversity of Massachusetts Lowell 2
Wentworth Institute of Technology 1 2
Western New England UniversityWestfield State UniversityWheaton College 1 2
Wheelock College 1
Worcester Polytechnic Institute 1 2
Worcester State University 1 2
MichiganAdrian College 2
Albion College 2
Alma College 1 2
Andrews University 2
Aquinas CollegeCalvin College 1
Central Michigan University 2
Cleary University 2
Cornerstone UniversityDavenport UniversityEastern Michigan University 2
Ferris State University 2
Grand Valley State University 1 2
Hope CollegeKalamazoo College 1 2
Kettering UniversityKuyper CollegeLake Superior State UniversityLawrence Technological University 2
Madonna UniversityMarygrove CollegeMichigan State UniversityMichigan Technological University 2
Northern Michigan University
Northwood UniversityOakland University 1
Rochester College 2
Saginaw Valley State UniversitySiena Heights UniversitySpring Arbor University 1
University of Detroit Mercy 2
University of Michigan-Ann Arbor 2
University of Michigan-Dearborn 2
University of Michigan-Flint 2
University of Phoenix-Metro Detroit CampusWayne State University 2
Western Michigan University 1 2
MinnesotaAugsburg College 2
Bemidji State University 1
Bethany Lutheran CollegeBethel University 2
Capella UniversityCarleton CollegeCollege of Saint Benedict and Saint John’s UniversityCollege of Saint Scholastica, TheConcordia College at Moorhead 2
Concordia University-Saint Paul 2
Gustavus Adolphus College 2
Hamline University 1
Macalester CollegeMartin Luther CollegeMetropolitan State UniversityMinneapolis College of Art and DesignMinnesota State University-Mankato 1 2
Minnesota State University-Moorhead 2
Saint Catherine University 2
Saint Cloud State UniversitySaint Mary’s University of MinnesotaSaint Olaf College 1 2
Southwest Minnesota State UniversityUniversity of Minnesota-CrookstonUniversity of Minnesota-Duluth 1 2
University of Minnesota-Morris 1
University of Minnesota-Twin CitiesUniversity of St. Thomas 1 2
Winona State University 1
MississippiAlcorn State UniversityDelta State University 2
Jackson State University 2
Millsaps CollegeMississippi State University 2
Mississippi University for WomenUniversity of MississippiUniversity of Southern Mississippi
MissouriAvila University 1 2
Central Methodist University 1 2
Colorado Technical University-Kansas CityCulver-Stockton College 2
Drury University 2
Fontbonne UniversityGrantham UniversityHarris-Stowe State University 1
Kansas City Art InstituteLindenwood University 1
Maryville University of Saint Louis 2
Missouri Southern State University 1 2
Missouri State University 1 2
Missouri University of Science and Technology 2
Missouri Valley College 2
Missouri Western State UniversityNorthwest Missouri State University 2
Park UniversityRockhurst University 2

49NATIONAL SURVEY OF STUDENT ENGAGEMENT | ANNUAL RESULTS 2013
PARTICIPATING COLLEGES & UNIVERSITIES 2009–2013 (CONTINUED)
Saint Louis University 1
Saint Luke’s College 2
Southeast Missouri State UniversityStephens College 1 2
Truman State University 2
University of Central Missouri 2
University of Missouri-ColumbiaUniversity of Missouri-Kansas City 2
University of Missouri-St. Louis 2
Webster UniversityWestminster CollegeWilliam Jewell College 1 2
William Woods University 2
MontanaCarroll College 2
Montana State University-Billings 1 2
Montana State University-Bozeman 1
Montana State University-Northern 2
Montana Tech of the University of MontanaRocky Mountain College 1
University of Great Falls 1 2
University of Montana, The 2
NebraskaBellevue University 2
Chadron State College 2
College of Saint MaryConcordia UniversityDana College 2
Doane College 1 2
Hastings CollegeMidland University 1
Nebraska Methodist College 2
Nebraska Wesleyan University 1 2
Peru State CollegeUnion College 1 2
University of Nebraska at Kearney 1 2
University of Nebraska at Lincoln 2
University of Nebraska at Omaha 2
Wayne State College 2
NevadaNevada State College 1
Sierra Nevada College 1
University of Nevada, Las Vegas 1
University of Nevada, Reno 2
New HampshireColby-Sawyer College 2
Franklin Pierce University 2
Keene State College 2
New England College 2
Plymouth State University 2
Rivier University 2
Saint Anselm College 1
University of New Hampshire
New JerseyBerkeley College 2
Bloomfield College 1
Centenary College 1 2
College of New Jersey, The 1 2
College of Saint Elizabeth 2
Drew University 1 2
Felician College 2
Georgian Court University 1 2
Kean UniversityMonmouth University 1 2
Montclair State University 2
New Jersey City University 2
New Jersey Institute of TechnologyRamapo College of New JerseyRichard Stockton College of New Jersey, The 1 2
Rider University
Rowan UniversityRutgers University-CamdenRutgers University-New BrunswickRutgers University-NewarkSaint Peter’s CollegeSeton Hall University 1 2
Stevens Institute of Technology 2
William Paterson University of New Jersey 2
New MexicoEastern New Mexico University 1 2
Institute of American Indian and Alaska Native Culture 2
New Mexico Highlands UniversityNew Mexico Institute of Mining and TechnologyNew Mexico State University 1
Northern New Mexico College 2
University of New Mexico 2
University of Phoenix-New Mexico CampusWestern New Mexico University 2
New YorkAdelphi University 1 2
Alfred University 2
Berkeley College 2
Canisius CollegeClarkson University 2
Colgate UniversityCollege of Mount Saint VincentCollege of Saint Rose, TheConcordia College-New York 1
Cooper Union for the Advancement of Science and ArtCUNY Bernard M Baruch College 1 2
CUNY Brooklyn College 1 2
CUNY College of Staten Island 1 2
CUNY Herbert H. Lehman College 2
CUNY Hunter College 2
CUNY John Jay College of Criminal Justice 2
CUNY Medgar Evers College 1 2
CUNY New York City College of Technology 2
CUNY Queens College 2
CUNY The City College 2
CUNY York College 2
Daemen College 1 2
Dominican College of Blauvelt 1 2
Dowling CollegeExcelsior College 2
Fashion Institute of TechnologyFordham UniversityHamilton CollegeHartwick College 1 2
Hilbert College 1
Hobart and William Smith CollegesHofstra UniversityHoughton College 2
Iona CollegeIthaca CollegeKeuka CollegeLe Moyne CollegeLIM College 1 2
Long Island University-Brooklyn Campus 2
Long Island University-C. W. Post CampusManhattan CollegeManhattanville College 2
Marist College 1
Marymount Manhattan CollegeMedaille College 1 2
Mercy CollegeMolloy CollegeMount Saint Mary College 2
Nazareth College 2
New School, TheNew York Institute of Technology-Old WestburyNiagara UniversityNyack CollegePace University 1 2
Paul Smith’s College 1 2
Polytechnic Institute of New York University 2
Pratt InstituteRoberts Wesleyan CollegeRochester Institute of TechnologyRussell Sage CollegeSage College of AlbanySaint Bonaventure University 2
Saint Francis CollegeSaint John Fisher College 1
Saint John’s University-New York 2
Saint Joseph’s College 2
Saint Joseph’s College-Suffolk Campus 2
Saint Lawrence UniversitySarah Lawrence CollegeSchool of Visual ArtsSiena College 2
Skidmore College 2
Stony Brook University 1 2
SUNY at AlbanySUNY at BinghamtonSUNY at FredoniaSUNY at GeneseoSUNY at Purchase College 2
SUNY College at Brockport 2
SUNY College at Buffalo 1 2
SUNY College at CortlandSUNY College at New Paltz 1
SUNY College at Oneonta 1
SUNY College at PotsdamSUNY College of Agriculture and Technology at CobleskillSUNY College of Environmental Science and Forestry 1
SUNY College of Technology at AlfredSUNY Maritime CollegeSyracuse University 1
Touro College 2
Union College 1
United States Merchant Marine Academy 2
United States Military AcademyUniversity at BuffaloVassar CollegeVaughn College of Aeronautics and Technology 1 2
Wagner College 1 2
Webb InstituteWells College 2
Yeshiva University
North CarolinaAppalachian State UniversityBarton College 2
Belmont Abbey CollegeBrevard CollegeCampbell University Inc. 2
Catawba CollegeChowan UniversityEast Carolina University 1 2
Elizabeth City State University 2
Elon University 1 2
Fayetteville State University 1 2
Gardner-Webb University 1 2
Greensboro College 2
Guilford College 2
High Point UniversityJohnson & Wales University-CharlotteJohnson C Smith University 2
Lees-McRae College 2
Lenoir-Rhyne University 1
Livingstone College 2
Mars Hill UniversityMeredith College 1 2
Methodist University 2
Mount Olive CollegeNorth Carolina A&T State University 2
North Carolina Central University 2
50 NATIONAL SURVEY OF STUDENT ENGAGEMENT | ANNUAL RESULTS 2013
PARTICIPATING COLLEGES & UNIVERSITIES 2009–2013 (CONTINUED)
North Carolina State UniversityPfeiffer UniversityQueens University of CharlotteSaint Andrews UniversitySaint Augustine’s College 2
Salem College 2
Shaw University 2
University of North Carolina at AshevilleUniversity of North Carolina at Chapel HillUniversity of North Carolina at CharlotteUniversity of North Carolina at Greensboro 1 2
University of North Carolina at Wilmington 2
Warren Wilson College 2
Western Carolina University 1 2
William Peace University 1
Wingate University 2
Winston-Salem State University 2
North DakotaDickinson State University 2
Mayville State University 2
Minot State University 2
North Dakota State University 2
University of Mary 1
University of North Dakota 1 2
Valley City State University 2
OhioAshland UniversityBaldwin Wallace University 2
Bowling Green State University 2
Capital University 1
Case Western Reserve University 1
Cedarville University 2
Cleveland State UniversityCollege of Mount St. JosephCollege of Wooster, The 1 2
Columbus College of Art and Design 2
Defiance College 1 2
Denison University 2
Franklin UniversityHeidelberg University 2
Hiram College 2
John Carroll University 2
Kent State University 1 2
Kent State University Stark CampusKenyon CollegeLake Erie CollegeLourdes University 2
Malone UniversityMarietta CollegeMiami University-Oxford 1 2
Notre Dame College 2
Oberlin CollegeOhio Dominican UniversityOhio Northern University 2
Ohio State University, TheOhio State University-Lima CampusOhio State University-Mansfield CampusOhio State University-Marion CampusOhio State University-Newark CampusOhio UniversityOhio Wesleyan University 1
Otterbein University 2
Shawnee State University 1 2
Tiffin University 1
University of Akron, The 1 2
University of Cincinnati 2
University of DaytonUniversity of Findlay, TheUniversity of Mount Union 2
University of Rio Grande 2
University of ToledoUrsuline College 2
Walsh University
Wilberforce UniversityWilmington CollegeWittenberg University 1
Wright State University 1
Xavier University 1 2
Youngstown State University
OklahomaBacone CollegeCameron UniversityEast Central UniversityNortheastern State UniversityNorthwestern Oklahoma State UniversityOklahoma Christian University 1
Oklahoma City University 2
Oklahoma State University 1
Oral Roberts University 1 2
Rogers State UniversitySaint Gregory’s UniversitySoutheastern Oklahoma State UniversitySouthern Nazarene University 2
Southwestern Oklahoma State UniversityUniversity of Central OklahomaUniversity of OklahomaUniversity of Science and Arts of OklahomaUniversity of Tulsa 2
OregonConcordia UniversityEastern Oregon University 2
George Fox University 1 2
Lewis & Clark CollegeLinfield College 1 2
Linfield College-Adult Degree Program 2
Linfield College-Nursing & Health Sciences 2
Oregon Institute of TechnologyOregon State University 1 2
Pacific University 2
Portland State University 2
Southern Oregon University 2
University of OregonUniversity of PortlandWarner Pacific CollegeWestern Oregon UniversityWillamette University 2
PennsylvaniaAlbright CollegeAllegheny College 2
Alvernia University 1
Arcadia UniversityBloomsburg University of Pennsylvania 2
Bryn Athyn College of the New Church 2
Bryn Mawr CollegeBucknell University 1
Cabrini CollegeCalifornia University of Pennsylvania 2
Carlow University 1
Carnegie Mellon University 1
Cedar Crest College 2
Central Pennsylvania CollegeChatham University 1 2
Chestnut Hill College 2
Cheyney University of Pennsylvania 2
Clarion University of PennsylvaniaDelaware Valley College 2
DeSales UniversityDickinson CollegeDrexel University 2
East Stroudsburg University of PennsylvaniaEastern University 2
Edinboro University of PennsylvaniaElizabethtown College 1 2
Franklin and Marshall CollegeGannon University 1
Gettysburg CollegeGrove City College 1 2
Gwynedd Mercy CollegeHarrisburg University of Science and TechnologyHoly Family University 2
Immaculata UniversityIndiana University of PennsylvaniaJuniata College 2
Keystone CollegeKutztown University of PennsylvaniaLa Roche CollegeLa Salle University 2
Lafayette CollegeLebanon Valley CollegeLehigh University 2
Lincoln University of Pennsylvania 1 2
Lock Haven University 2
Lycoming CollegeMansfield University of PennsylvaniaMarywood University 2
Mercyhurst UniversityMessiah CollegeMillersville University of Pennsylvania 1 2
Misericordia UniversityMoore College of Art and DesignMount Aloysius CollegeMuhlenberg College 1
Neumann University 1 2
Penn State University Abington 2
Penn State University AltoonaPenn State University Berks 1 2
Penn State University BrandywinePenn State University Erie, The Behrend CollegePenn State University Fayette, The Eberly CampusPenn State University HarrisburgPenn State University Hazleton 2
Penn State University University ParkPenn State University Worthington ScrantonPenn State University YorkPennsylvania College of TechnologyPhiladelphia University 2
Point Park UniversityRobert Morris UniversityRosemont CollegeSaint Francis UniversitySaint Joseph’s UniversitySaint Vincent College 2
Seton Hill UniversityShippensburg University of PennsylvaniaSlippery Rock University of Pennsylvania 1 2
Susquehanna University 2
Temple UniversityThiel College 1 2
University of Pittsburgh-Bradford 2
University of Pittsburgh-Johnstown 2
University of Scranton 1 2
University of the Arts, TheUniversity of the SciencesUrsinus College 1 2
Villanova UniversityWashington & Jefferson CollegeWaynesburg UniversityWest Chester University of Pennsylvania 1 2
Widener University 1 2
Wilson College 2
York College of Pennsylvania
Puerto RicoInter American University of Puerto Rico-BarranquitasInter American University of Puerto Rico-Metro 2
Pontifical Catholic University of Puerto Rico-AreciboPontifical Catholic University of Puerto Rico-MayaguezPontifical Catholic University of Puerto Rico-PonceUniversity of Puerto Rico-Carolina 2
University of Puerto Rico-Cayey

51NATIONAL SURVEY OF STUDENT ENGAGEMENT | ANNUAL RESULTS 2013
PARTICIPATING COLLEGES & UNIVERSITIES 2009–2013 (CONTINUED)
University of Puerto Rico-MayaguezUniversity of Puerto Rico-Ponce 2
University of Puerto Rico-Rio Piedras Campus 2
University of Sacred Heart 2
Rhode IslandBryant University 1 2
Johnson & Wales UniversityProvidence CollegeRhode Island CollegeRoger Williams University 1 2
Salve Regina UniversityUniversity of Rhode Island 2
South CarolinaAnderson UniversityBenedict CollegeBob Jones University 1 2
Charleston Southern UniversityCitadel Military College of South Carolina 2
Claflin University 1 2
Clemson UniversityCoastal Carolina UniversityCoker College 1 2
College of Charleston 1 2
Columbia College 2
Columbia International UniversityConverse College 1 2
Francis Marion UniversityFurman University 1
Lander UniversityLimestone CollegePresbyterian College 2
University of South Carolina-Aiken 2
University of South Carolina-Beaufort 1 2
University of South Carolina-ColumbiaUniversity of South Carolina-Upstate 2
Voorhees College 1 2
Winthrop University 2
Wofford College 1 2
South DakotaAugustana College 1
Black Hills State University 1 2
Colorado Technical University-Sioux FallsDakota State University 1 2
Dakota Wesleyan UniversityMount Marty CollegeNational American University-Rapid City 2
National American University-Sioux Falls 2
Northern State University 2
Presentation College 1 2
South Dakota School of Mines and Technology 1 2
South Dakota State University 2
University of South Dakota 2
TennesseeAustin Peay State University 2
Baptist Memorial College of Health Sciences 2
Belmont University 2
Bethel UniversityCarson-Newman University 2
Christian Brothers UniversityCumberland University 1
East Tennessee State UniversityFisk University 2
Johnson UniversityKing University 1
Lane College 1 2
Lee UniversityLincoln Memorial University 2
Lipscomb University 1 2
Martin Methodist College 1 2
Memphis College of ArtMiddle Tennessee State University
Milligan College 2
Rhodes College 2
Southern Adventist University 2
Tennessee State University 2
Tennessee Technological UniversityTennessee Temple UniversityTrevecca Nazarene University 1
Tusculum College 2
Union UniversityUniversity of MemphisUniversity of Tennessee, The 1 2
University of Tennessee-Chattanooga, The 1 2
University of Tennessee-Martin, TheUniversity of the South, Sewanee 2
TexasAbilene Christian University 1 2
American InterContinental University-HoustonAngelo State UniversityAustin College 1 2
Baylor University 1 2
Concordia University Texas 1
DeVry University-TexasEast Texas Baptist University 1 2
Houston Baptist UniversityHoward Payne UniversityHuston-Tillotson UniversityLamar University 2
LeTourneau UniversityLubbock Christian University 2
McMurry University 2
Midwestern State UniversityNorthwood UniversityOur Lady of the Lake University-San Antonio 2
Prairie View A&M University 1 2
Saint Edward’s UniversitySaint Mary’s University 1 2
Sam Houston State University 2
Schreiner UniversitySouthern Methodist UniversitySouthwestern Adventist UniversitySouthwestern Assemblies of God UniversitySouthwestern Christian CollegeSouthwestern University 2
Stephen F. Austin State University 2
Tarleton State University 1 2
Texas A&M International University 1 2
Texas A&M University 2
Texas A&M University - Commerce 2
Texas A&M University - Corpus Christi 1
Texas A&M University - Kingsville 2
Texas A&M University - Texarkana 1
Texas Christian University 2
Texas Lutheran University 2
Texas Southern University 1
Texas State University-San Marcos 1 2
Texas Tech University 1 2
Texas Woman’s University 1 2
Trinity UniversityUniversity of DallasUniversity of HoustonUniversity of Houston-Clear LakeUniversity of Houston-Downtown 2
University of Houston-Victoria 1 2
University of North TexasUniversity of Phoenix-Houston Westside CampusUniversity of St. Thomas 2
University of Texas at Arlington, The 1 2
University of Texas at Austin, The 2
University of Texas at Brownsville, TheUniversity of Texas at Dallas, The 1 2
University of Texas at El Paso, TheUniversity of Texas at San Antonio, The 2
University of Texas at Tyler, The 1 2
University of Texas of the Permian Basin, The
University of Texas-Pan American, The 2
University of the Incarnate Word 2
Wayland Baptist University 2
West Texas A&M University 1 2
Wiley College 1 2
UtahBrigham Young University 1 2
Dixie State College of UtahSouthern Utah UniversityUniversity of Utah 2
Utah Valley University 1 2
Weber State UniversityWestern Governors UniversityWestminster College 1 2
VermontBennington College 1
Burlington CollegeCastleton State CollegeChamplain CollegeCollege of St. JosephGreen Mountain CollegeJohnson State College 1
Lyndon State College 1
Marlboro College 2
Middlebury CollegeNorwich University 2
Saint Michael’s CollegeSouthern Vermont College 1
University of Vermont 2
Virgin IslandsUniversity of the Virgin Islands
VirginiaArt Institute of Washington, The 1 2
Averett UniversityBluefield CollegeBridgewater CollegeChristopher Newport UniversityCollege of William & Mary 1
Eastern Mennonite UniversityEmory and Henry CollegeFerrum CollegeGeorge Mason University 1 2
Hampden-Sydney College 1 2
Hollins UniversityJames Madison UniversityLiberty University 2
Longwood University 2
Lynchburg CollegeMary Baldwin CollegeMarymount University 2
Norfolk State University 1 2
Old Dominion University 2
Radford University 2
Randolph CollegeRandolph-Macon College 1
Regent University 2
Roanoke College 1 2
Shenandoah University 2
Southern Virginia University 1 2
Sweet Briar College 1 2
University of Mary WashingtonUniversity of Richmond 2
University of VirginiaUniversity of Virginia’s College at Wise, TheVirginia Commonwealth University 1 2
Virginia Intermont College 1 2
Virginia Military InstituteVirginia Polytechnic Institute and State UniversityVirginia Union UniversityVirginia Wesleyan CollegeWashington and Lee University 1 2

52 NATIONAL SURVEY OF STUDENT ENGAGEMENT | ANNUAL RESULTS 2013
WashingtonCentral Washington University 2
Eastern Washington University 1
Evergreen State College, The 2
Gonzaga UniversityHeritage University 1 2
Northwest UniversityPacific Lutheran University 1 2
Saint Martin’s University 2
Seattle Pacific University 2
Seattle University 1
University of Puget SoundUniversity of Washington-BothellUniversity of Washington-SeattleUniversity of Washington-Tacoma 1 2
Walla Walla UniversityWashington State University 1 2
Western Washington UniversityWhitman CollegeWhitworth University 2
West VirginiaAlderson-Broaddus CollegeAmerican Public University SystemBethany College 2
Bluefield State CollegeConcord UniversityDavis & Elkins College 2
Fairmont State University 2
Glenville State CollegeMarshall University 2
Mountain State University 2
Ohio Valley UniversityShepherd University 1
University of Charleston 2
West Liberty UniversityWest Virginia University 2
West Virginia Wesleyan College 2
Wheeling Jesuit University 2
WisconsinAlverno College 2
Beloit College 2
Cardinal Stritch University 2
Carroll University 1 2
Carthage College 1 2
Concordia University-Wisconsin 2
Edgewood College 1 2
Lawrence UniversityMaranatha Baptist Bible College 2
Marian University 2
Marquette UniversityMilwaukee School of EngineeringMount Mary College 2
Northland College 2
Ripon CollegeSaint Norbert CollegeUniversity of Wisconsin-Eau Claire 2
University of Wisconsin-Green Bay 1 2
University of Wisconsin-La Crosse 1 2
University of Wisconsin-Madison 1
University of Wisconsin-Milwaukee 2
University of Wisconsin-Oshkosh 2
University of Wisconsin-Parkside 1 2
University of Wisconsin-Platteville 2
University of Wisconsin-River Falls 1 2
University of Wisconsin-Stevens Point 2
University of Wisconsin-Stout 2
University of Wisconsin-Superior 1 2
University of Wisconsin-Whitewater 2
Viterbo University 2
Wisconsin Lutheran College 1 2
WyomingUniversity of Wyoming 2
Canada
AlbertaAlberta College of Art and DesignAmbrose University CollegeAthabasca UniversityCanadian University CollegeGrant MacEwan UniversityKing’s University College, TheMount Royal UniversityUniversity of AlbertaUniversity of Calgary 1 2
University of Lethbridge
British ColumbiaCapilano UniversityKwantlen Polytechnic University 2
Quest University CanadaRoyal Roads UniversitySimon Fraser UniversityThompson Rivers University 2
Trinity Western UniversityUniversity of British ColumbiaUniversity of British Columbia, OkanaganUniversity of Northern British Columbia 2
University of the Fraser Valley 2
University of VictoriaVancouver Island University
ManitobaBrandon UniversityUniversity of ManitobaUniversity of Winnipeg
NewfoundlandMemorial University of Newfoundland, St. John’s Campus
New BrunswickMount Allison UniversitySt. Thomas UniversityUniversity of New Brunswick - Fredericton 2
University of New Brunswick - Saint John Campus 2
Nova ScotiaAcadia UniversityCape Breton UniversityDalhousie UniversityMount St. Vincent UniversityNova Scotia Agricultural College 1
Saint Mary’s University 2
St. Francis Xavier University
OntarioAlgoma UniversityBrescia University CollegeBrock UniversityCarleton University 1 2
Humber College Institute of Technology and Advanced Learning 2
Huron University CollegeKing’s University College 2
Lakehead UniversityLaurentian UniversityMcMaster UniversityNipissing UniversityOntario College of Art and Design UniversityQueen’s UniversityRedeemer University CollegeRyerson UniversitySheridan College Institute of Technology and Advanced Learning 2
Trent UniversityTyndale University College and SeminaryUniversité de HearstUniversité d’Ottawa / University of OttawaUniversity of Guelph 1 2
University of Ontario-Institute of TechnologyUniversity of TorontoUniversity of WaterlooUniversity of WindsorWestern UniversityWilfrid Laurier UniversityYork University 1
Prince Edward IslandUniversity of Prince Edward Island 1 2
QuebecBishop’s UniversityConcordia UniversityÉcole de technologie supérieureMcGill UniversityUniversité de Montréal, Montréal CampusUniversité de SherbrookeUniversité du Québec à ChicoutimiUniversité du Québec à MontréalUniversité du Québec à RimouskiUniversité du Québec à Trois-RivièresUniversité du Québec en Abitibi-TémiscamingueUniversité du Québec en OutaouaisUniversité Laval
SaskatchewanBriercrest College and SeminaryUniversity of ReginaUniversity of Saskatchewan
AfghanistanAmerican University of Afghanistan, The
EgyptAmerican University in Cairo, The
EnglandAmerican InterContinental University London
IraqAmerican University of Iraq, Sulaimani 2
LebanonLebanese American University 2
MexicoUniversidad de Monterrey
QatarCarnegie Mellon, Qatar Campus 1 2
Georgetown University School of Foreign Service in QatarNorthwestern University in QatarTexas A&M University at QatarVirginia Commonwealth University in QatarWeill Cornell Medical College in Qatar
United Arab EmiratesAmerican University of Sharjah
1. Also participated in the Beginning College Survey of Student Engagement (BCSSE)
2. Also participated in the Faculty Survey of Student Engagement (FSSE)
PARTICIPATING COLLEGES & UNIVERSITIES 2009–2013 (CONTINUED)
53NATIONAL SURVEY OF STUDENT ENGAGEMENT | ANNUAL RESULTS 2013
NSSE STAFF
National Survey of Student Engagement
Director .......................................................................................................................Alexander C. McCormick
Associate Director, Research & Data Analysis ..............................................................Robert M. Gonyea
Associate Director, NSSE Institute ..................................................................................................Jillian Kinzie
Assistant Director, NSSE Survey Operations & Project Services ........................Shimon Sarraf
BCSSE Project Manager & Research Analyst .........................................................................................James S. Cole
FSSE Principal Investigator .........................................................Thomas F. Nelson Laird
FSSE Project Manager & Research Analyst .........................................................................................Allison BrckaLorenz
LSSSE Director ..............................................................................................Carole Silver
LSSSE Project Manager ...................................................................Chad Christensen
Research Analysts......................................................................................Kevin Fosnacht Heather Haeger Amber D. Lambert Angie L. Miller Amy Ribera Louis M. Rocconi Rick Shoup
Finance Manager .........................................................................................Marilyn Gregory
Office & Project Coordinator .....................................................Barbara Stewart
Office Secretary .............................................................................................Katie Noel
Publications Coordinator .................................................................Sarah Martin
Web Developer .............................................................................................Hien Nguyen
Research Project Associates .....................................................Yiran Dong Jennifer Nailos Lanlan Mu Rong (Lotus) Wang John Zilvinskis
FSSE Project Associates .................................................................Yi-Chen Chiang Jessica Harris Leah Peck
NSSE Institute Project Associates ....................................Cynthia Ahonen Katherine Wheatle
NSSE Project Services Manager .........................................Jennifer Brooks
NSSE Project Associates ................................................................Reginald A. Blockett Jacob Docking Sarah Fernandez Polly Graham Mark Houlemarde Elijah Howe Karyn Rabourn Bridget Chase Yuhas
Indiana University Center for Survey Research
Director .......................................................................................................................Ashley Bowers
Senior Research Director ................................................................John Kennedy
Director of Research Project Management Services ................................................Reya Calistes
Director of Business Operations & Human Resources .....................................................................................Maryanne McDonnell
Director of Technologies ..................................................................Kevin Tharp
Study Director/Technologies Analyst ............................Alycia Cameron
Study Directors ...............................................................................................Stacey Giroux Heather Terhune Marti
CPR Technical Lead/ Senior Analyst/Programmer ........................................................Joe Wilkerson
Director of Research & Development ...........................Lilian Yahng
Director of Research Data Management Services ........................................................Jamie Roberts
Associate Director of Research Data Management Services ........................................................Erica Moore
Research Data Services Associate ...................................Michael Steinhilber
Processing Assistants ........................................................................Danielle Ahmed Ariel Ehrlich Kyle Smith
Production Staff ............................................................................................Melody Kowalski Juliet Roberts
Programmers/Analysts ........................................................................Jason Francis Barb Gelwick Rick Watson
“What has shaped my experience is the Residence and Housing aspect. I learned so much about diversity regarding sexual orientation, religion, and race. I feel the experience has taught me to work through issues between people of different backgrounds.”—SENIOR, PUBLIC HEALTH MAJOR, WINONA STATE UNIVERSITY

Indiana University Center for Postsecondary Research
1900 East Tenth Street, Suite 419
Bloomington, Indiana 47406-7512
Phone 812-856-5824
Fax 812-856-5150
Email [email protected]
Web nsse.iub.edu