![“Paciencia y barajar”, in Daniel Balderston, ed. Las novelas cortas de Onetti. UNESCO / Colección Archivos, 2009. [On Juan Carlos Onetti's "La muerte y la niña"]](https://static.fdokumen.com/doc/165x107/630bcb4976f452696a0439e1/paciencia-y-barajar-in-daniel-balderston-ed-las-novelas-cortas-de-onetti.jpg)
Novelas y fertilidad: elementos de juicio de Brasil
47
Inter-American Development Bank Banco Interamericano de Desarrollo (BID) Research Department Departamento de Investigación Working Paper #633 Soap Operas and Fertility: Evidence from Brazil By Eliana La Ferrara* Alberto Chong** Suzanne Duryea** *Bocconi University and IGIER **Inter-American Development Bank June 2008
Transcript of Novelas y fertilidad: elementos de juicio de Brasil

Inter-American Development Bank
Banco Interamericano de Desarrollo (BID) Research Department
Departamento de Investigación Working Paper #633
Soap Operas and Fertility: Evidence from Brazil
By
Eliana La Ferrara* Alberto Chong** Suzanne Duryea**
*Bocconi University and IGIER **Inter-American Development Bank
June 2008

2
Cataloging-in-Publication data provided by the Inter-American Development Bank Felipe Herrera Library La Ferrara, Eliana.
Soap operas and fertility : evidence from Brazil / by Eliana La Ferrara, Alberto Chong, Suzanne Duryea.
p. cm. (Research Department Working paper series ; 633) Includes bibliographical references.
1. Fertility, Human—Brazil. 2. Soap operas—Brazil. 3. Fertility, Human—Brazil—Effect of soap operas on. I. Chong, Alberto. II. Duryea, Suzanne. III. Inter-American Development Bank. Research Dept. IV. Title. V. Series. HB973 .L487 2008 304.63 L487-----dc22 ©2008 Inter-American Development Bank 1300 New York Avenue, N.W. Washington, DC 20577 The views and interpretations in this document are those of the authors and should not be attributed to the Inter-American Development Bank, or to any individual acting on its behalf. This paper may be freely reproduced provided credit is given to the Research Department, Inter-American Development Bank. The Research Department (RES) produces a quarterly newsletter, IDEA (Ideas for Development in the Americas), as well as working papers and books on diverse economic issues. To obtain a complete list of RES publications, and read or download them please visit our web site at: http://www.iadb.org/res.
3
Abstract*
This paper focuses on fertility choices in Brazil, a country where soap operas (novelas) portray families that are much smaller than in reality, to study the effects of television on individual behavior. Using Census data for the period 1970-1991, the paper finds that women living in areas covered by the Globo signal have significantly lower fertility. The effect is strongest for women of lower socioeconomic status and for women in the central and late phases of their fertility cycle. Finally, the paper provides evidence that novelas, rather than television in general, affected individual choices.
* We thank Stefano DellaVigna, Abigail Barr, Francesco Billari, Erica Field, Hugo Ñopo, Ben Olken, Fabrizio Zilibotti and seminar participants at the University of Zurich, Oxford University, Bocconi University, the CEPR 2007 Development Economics Conference in Stockholm and the BREAD 2007 workshop in Princeton for helpful comments. Silvia Redaelli, Enestor Dos Santos Junior, Gianmarco León, María Victoria Rodríguez Pombo and Daniella Kobayashi provided excellent research assistance.

4
1. Introduction In the early 1990s, after more than 30 years of expansion of basic schooling, over 50 percent of
15-year-olds in Brazil scored at the lowest levels of the literacy portion of the Programme for
International Student Assessment (PISA), indicating that they could not perform simple tasks
such as locating basic information within a text. People with four or fewer years of schooling
accounted for 39 percent of the adult population in urban areas, and nearly 73 percent in rural
areas as measured by the 2000 Census. On the other hand, the share of households owning a
television set had grown from 8 percent in 1970 to 81 percent in 1991, and remained
approximately the same 10 years later. The spectacular growth in television viewership in the
face of slow increases in education levels characterizes Brazil as well as many other developing
countries. Most importantly, it suggests that a wide range of messages and values, including
those with important implications for development policy, have the potential to reach households
through the screen as well as through the classroom.
This paper examines the effect of three decades of expansion of commercial television on
fertility patterns in Brazil. Fertility is an interesting dimension of development policy to explore
in the context of Brazil. In fact, this country experienced a dramatic drop in fertility in the past
40 years. The total fertility rate was 6.3 in 1960, 5.8 in 1970, 4.4 in 1980, 2.9 in 1991, and 2.3 in
2000 (Lam and Marteleto, 2005). The only other developing country comparable in size to have
experienced such a sharp and generalized decline is China, where the decline was the result of
deliberate government policy. In Brazil no population control policy was ever enacted by the
government, and for a period of time advertising of contraceptive methods was even illegal. The
change was therefore demand driven. What led Brazilians to desire smaller family sizes? While
there are certainly important changes in the structure of the Brazilian economy that may be
associated with fertility decline, in this paper we focus on television as a vehicle for shaping
individual preferences towards fewer births.
In particular, we examine the effect of exposure to one of the most pervasive forms of
cultural communication in Brazilian society: soap operas, or novelas. The vast majority of the
Brazilian population, across all social classes, regularly watches regularly the 8 p.m. novela
broadcast by Rede Globo, the network that has a virtual monopoly on the production of Brazilian
novelas. A content analysis of 115 Globo novelas aired between 1965 and 1999 in the two time
slots with the largest highest audience between 1965 and 1999 reveals that 72 percent of the
5
main female characters (aged 50 or below) had no children at all, and 21 percent had only one
child. This is in marked contrast with the prevalent fertility rates in Brazilian society over the
same period.
To identify the effects on fertility of exposure to novelas, we exploit information on the
timing of Globo entry into different areas. Our key independent variable, a dummy that captures
whether an area receives the Globo signal in a given year, is constructed from information on the
location and radial reach of Globo broadcasting and retransmitting stations in every year.
In a first set of results we examine the relationship at the aggregate level, i.e., over time
and across 3,659 Minimally Comparable Areas (AMCs) in Brazil. Using Census data for the
period 1970-1991 we find that, after controlling for time-varying covariates and for time-
invariant area characteristics, AMCs reached by the Globo signal had significantly lower
fertility, measured as the number live births for women aged 15-49. The magnitude of the effect
is about 1/10 of the effect of being married, and is comparable to that associated with an increase
of 1 doctor or nurse per 1,000 population. These results appear not to be driven by selection in
Globo entry: after controlling for area fixed effects, Globo coverage is uncorrelated both with
previous fertility levels and with lagged changes in fertility.
In a second set of results we use individual-level data and estimate the likelihood that a
woman gives birth in any given year between 1980 and 1991, as a function of individual and
household characteristics and of the availability of Globo’s signal in the area where the woman
lives. Ceteris paribus, Globo coverage is associated with a decrease in the probability of giving
birth of 0.6 percentage points, which is 6 percent of the mean. The magnitude of this effect is
comparable to that associated with an increase of two years in women’s education. The
(negative) effect of Globo exposure is stronger for households with lower education and wealth,
as one would expect given that these households are relatively less likely to obtain information
from written sources or to interact with peers that have small family sizes. There is also
considerable heterogeneity along the age dimension. Interestingly, the effect of Globo coverage
is insignificant for women aged 15-24 and is quantitatively larger and significant for women
aged 25-34 (a decrease of 8 percent of the mean probability of giving birth for this age group)
and for women aged 35-44 (a decrease of 11 percent of the mean). This is consistent with the
demographic literature on Brazil, which has highlighted how the decline in fertility was mostly
due to stopping and not to delayed first births. We also show that our results are robust to

6
placebo treatments constructed using Globo’s future entry or women who are not of childbearing
age.
In the last part of the paper we discuss the extent to which these results may be
interpreted as related to television viewing per se, or also to the type of programs (novelas)
broadcast by Globo. While our identification strategy does not allow us to separately identify the
two effects, we find evidence consistent with the idea that novelas did play a role in family
decisions, possibly including those on fertility. Our first piece of evidence comes from naming
patterns among school-aged children. Using administrative data on a random sample of AMCs,
we find that parents living in areas that are reached by Globo are significantly more likely to
name their children after the name of the main characters of novelas aired in the year in which
the children were born. Our second piece of evidence comes from the entry of the second largest
commercial network, Sistema Brasileiro de Televisão (SBT). Running similar regressions to
those that we run for Globo, we find that exposure to SBT does not significantly affect fertility
patterns. Interestingly, SBT broadcasts programs that are imported from Mexico and the United
States are generally not perceived as realistic portraits of Brazilian society. While only
suggestive, these results indicate that exposure to television programs that are framed in a way
that makes them immediately relevant for people’s everyday life may have significant effects on
individual choices.
Our paper is related to two strands of literature. The first is the literature on the
determinants of fertility, with particular reference to the role of television in Latin America. We
shall not review this literature here, as we discuss it in Section 2 below in the context of
Brazilian novelas. It should be observed that, with respect to these contributions, which are
mostly sociological and based on case studies, our work is the first attempt to identify a causal
link with econometric techniques using a country-wide dataset.
The second strand of literature related to our paper is that on the effects of the media on
social and political outcomes. Contributions in this field have largely focused on the role of
newspapers and radio as mechanisms of accountability for politicians (Besley and Burgess,
2002; Stromberg, 2004), and on the effects of the media on voters’ behavior (Gentzkow, 2006;
DellaVigna and Kaplan, 2007). Other studies investigate the effects of television on social, as
opposed to political, behavior, in particular on children’s school performance (Gentzkow and
Shapiro, 2006) and on adults’ participation in social activities and trust (Olken, 2006).

7
In a recent contribution, Jensen and Oster (2007) estimate the impact of the entry of cable
television on subjective measures of female autonomy, school enrollment and fertility. They use
survey data on a sample of 180 rural villages in India for the years 2001-2003. Of these villages,
21 introduced cable television during the survey period. One difference between our work and
Jensen and Oster’s lies in the breadth of the area covered (using Census data we cover the
universe of Brazilian municipal areas) and time horizon (we explore the effects of Globo from its
entry in the mid-1960s until the early 1990s). This allows us to have a considerable degree of
variation across areas over time and to examine the long-run impact of television viewing on
fertility. At the same time, the Census does not contain information on attitudes.
Another difference with respect to Jensen and Oster (2007)—and most of the literature
cited above—is that the authors do not exploit information on the content of media programs. In
our analysis we provide suggestive evidence that what matters is not only television viewing, but
also viewing a set of programs—novelas—that portray situations to which viewers can relate.
Two recent papers have explored the role of media content. The first, Dahl and DellaVigna
(2008), focus on the short-run effects of movie violence on crime. The second, Paluck (2008),
estimates the effects on beliefs and norms of a radio soap opera featuring messages of intergroup
tolerance in Rwanda. Our work shares largely the same motivation as Paluck’s in that we are
also interested in the possibility that media programs may become vehicles of development
policy.
The remainder of the paper is organized as follows. In Section 2 we provide some
information on Brazilian novelas and on their main producer, Rede Globo. Sections 3 and 4
illustrate, respectively, our empirical strategy and the data. Section 5 contains our econometric
results. Section 6 discusses the interpretation of our results in terms of television exposure and
media content. Finally, Section 7 concludes.
2. Background on Brazilian Novelas Television has played a central role for the functioning and reproduction of contemporary
Brazilian society and has played a strategic role in the process of articulating, diffusing, and
institutionalizing new behavioral and attitudinal patterns in the country (Faria and Potter, 1999).
In the span of three decades, exposure to television messages rose from zero to become universal
in urban areas and to almost half of rural households. One of the crucial reasons for television’s

8
influence in Brazil is the strength of the country’s oral tradition.1 In the early 1990s, after more
than 30 years of expansion of basic schooling, adult literacy had reached only 80 percent. Ten
years later, people with four or fewer years of schooling accounted for 39 percent of the adult
population in the urban areas, and 73 percent in rural areas (Census 2000). Another characteristic
of the country that contributes to the impact of television is the high rate of geographical,
occupational, and social mobility: in this context, television helps to provide a sense of belonging
(Faria and Potter, 1999).
2.1 Rede Globo Television became a mass medium in Brazil earlier than in most developing countries. The
military government in power in 1964 saw the potential of television as a tool for integrating the
country, creating a national identity, developing markets, and controlling political information.
The military pushed television deeper into the population by subsidizing credit for sales of
television sets and, in particular, by promoting the growth of one specific network to encourage
national production. Rede Globo, selected as the privileged partner, began functioning in 1965
and quickly became the leading national network. Today, Rede Globo is the fourth-largest
commercial network in the world, after ABC, CBS, and NBC, with coverage of about 98 percent
of the total number of municipalities in Brazil, representing approximately 17.6 million
households.
For the purpose of our identification strategy, it is important to understand how the
expansion of Rede Globo occurred. During the military regime of general João Baptista
Figueredo (1978-1985), the concession of television network rights followed clientelistic,
political, and ideological criteria, and the dictator was invested with absolute power over licenses
for radio and television stations. Although the law was later changed so that Congress was in
charge of approving broadcast licenses, the clientelistic criterion remained in place (de Lima,
2001). The relevance of the role of the media for the military regime was central. As several
authors have stated, the military regime had an “obsession” with national integration, and the
1 In 2006, according to the PISA survey 39 percent of 15-year students in Brazil reported that they lived in homes with fewer than 10 books. In comparison, fewer than 10 percent of students from the OECD countries (excluding Mexico) lived in homes with so few books (OECD, PISA 2006). The sample excludes 15-year olds who have left school.

9
media were in charge of cultural, political and economic integration. During that period the
association between the government and Rede Globo was clear (Miguel, 2001).
Under the government of President Jose Sarney (1985-1990), the first elected government
after the fall of the military dictatorship, the clientelistic provision of licenses continued. This
practice was readily apparent in 1989, when the constitution was amended to lengthen the
presidential term from four to five years. In the previous two years the government had granted a
large number of television and radio licenses to companies associated with congressmen who
later voted in favor of the constitutional amendment (Costa and Brener, 1997). A similar
situation occurred during the first term of President Fernando Henrique Cardoso (1995-1998),
when the Congress was about to vote on another constitutional amendment that would allow
presidential reelection. Again, a large number of broadcast licenses for retransmission stations
were given to firms associated with congressmen (Capparelli and Lima, 2004). Indeed, media
ownership in Brazil remains highly concentrated, especially television concessions, which are
controlled by only eight families or groups.
In keeping with the criteria discussed above, the government’s choice of Rede Globo as a
partner was based largely on the network’s long-standing cooperation agreement with Time-Life
during the 1960s, including assistance with marketing strategies that were at the time unheard of
in Brazil. The military government apparently assessed that Rede Globo provided the best
platform for its integration platform, and by the early 1970s Time-Life’s marketing know-how
had already been assimilated (dos Santos and Capparelli, 2005).
The instrumental use of licenses for clientelistic and political goals helps our
identification strategy in that it mitigates concerns that Globo entry in different municipal areas
may be driven by pre-existing (declining) fertility trends. Indeed, we empirically test for this
possibility below and find that it is not supported in the data.
Obviously, political clientelism and a solid marketing strategy had to be complemented
with a viable, high-quality product, and the novela is just such a product. In fact, to this day a
typical novela is watched by anything between 60 to 80 million viewers. The reason for the
enormous success of this television format from Rede Globo during the last three decades can be
traced to three factors. First, novelas are set in easily recognizable locations so that viewers can
better relate with the story; the context and the issues addressed in novelas always relate to the
daily life of the Brazilian population. Second, the network makes novelas accessible to viewers

10
through the following means: i) colloquial language; ii) a middle-class setting, with which most
viewers identify regardless of their own socioeconomic background; iii) an element of social
mobility; and iv) the integration of novelas with everyday life, as its characters celebrate the
national festivities and events in “real time.” Third, the network spares no expense in order to
produce novelas of the highest technical and artistic quality. In fact, each episode of an average
novela costs around $125,000, approximately 15 times greater than the production costs of the
other Latin American novela powerhouse, Mexico’s Televisa (Marques de Melo, 1988).
2.2 Fertility Decline in Brazil As mentioned in Section 1, in a few decades fertility fell rapidly in Brazil, with the total fertility
rate (TFR) declining by over 50 percent from 1970 to 1990. Given that the military government
was far more interested in populating remote areas to protect borders than in organizing and
promoting family planning programs, Brazil has often been described as an ideal environment
for exploring specific determinants of fertility decline.
A large demographic literature has examined the proximate determinants of fertility.
High rates of female sterilization have played a role as a main proximate determinant, along with
increased use of the birth control pill (Merrick and Berquó, 1983; Rutenberg, Ocho and Arruda,
1987). The rank of sterilization as a preferred method of contraception is related to institutional
policies encouraging the delivery of births by Caesarean section as well as government
propaganda in the late 1960s that warned of the dangers of the birth control pill. The role of
abortion, illegal in Brazil, is less clear.
The timing of births over the life cycle has also been explored in detail. Changes in the
starting age of fertility have been negligible, related both to relatively stable marital patterns as
well as persistently high rates of adolescent fertility. An increased spacing of births has
contributed to the overall decline, although the stopping of childbirth at younger ages has been
found to be more important (Martine, 1996; Flórez and Nuñez, 2003). While the increase in
education explored by Lam and Duryea (1999) can explain a large share of the overall decline,
none of the aforementioned factors satisfactorily replicate the intertemporal and interspatial pace
of the decline. Additionally, these studies typically do not address the underlying forces driving
higher demand for contraceptives or education.

11
2.3 Novelas and Fertility One of the ideas advanced in sociological and communication studies is that there may be a link
between the diffusion of television, particularly novelas, and fertility decline (e.g., Vink, 1988).
Brazilian novelas are rather different from their Mexican counterparts, and in general
from many stereotypical Latin American telenovelas, because of the high quality of their scripts
and production. Since military-imposed censorship was in effect during most of the
developmental period of the novela, a number of important writers, some of whom were having
political problems with the military government, started to write screenplays for Rede Globo.2
These authors saw the opportunity of employment in the cultural industry as a way to fight the
dictatorship through the reinforcement of new values and ideas in their plots. In addition to
freedom, recurrent themes include: criticism of religious and traditional values, consumption of
luxurious goods, the portrayal of wealthy families, the display of new lifestyles, the circulation
of modern ideas such as female emancipation in the workplace, the female pursuit of pleasure
and love even if through adultery, display of homosexuality, criticism of machismo, and an
emphasis on individualism (Rios-Neto, 2001; Fadul, 1999). In Section 4.2 below, we try to
quantify the extent to which some of these values (specifically, those relating to fertility,
marriage and divorce) are contained in the novelas produced by Rede Globo.
Interestingly, family planning and population control were not explicitly addressed by
Brazilian television or by novelas. Moreover, until the late 1970s the government was reluctant
to adopt population control policies: even advertising of contraception methods was illegal. Still,
novelas in Brazil were, and still are, replete with material directly or indirectly relevant to family
size preferences. Television reiterates the discourse of a very specific model: a small, beautiful,
white, healthy, urban, middle or upper middle class consumerist family. Novelas have thus
provided a powerful medium for idealizing the small family. On the one hand, in many instances,
the content of the story is related to the urban middle class of Rio de Janeiro and Sao Paulo, and
the material of the novela consequently deals with this family type, spreading its values, attitudes
and behavioral patterns. On the other hand, the small family may result from the constraints
imposed by the plot. In Brazilian novelas the drama typically revolves around four or five 2 The extreme example is the case of Roque Santeiro, the most popular Brazilian novela ever. Initially censored by the military government, it was viewed by nearly 100 million people when democracy was restored, achieving a rating that fluctuated between 90 percent and 100 percent of the television audience. The censorship of the novela had little to do with the topic itself, but rather with the fact that the author was a Communist.
12
families. In order to keep the number of characters manageable, no family can be very large.
Sometimes this constraint leads to highly unrealistic family profiles.
The findings of an experimental focus group discussion illustrate this point. Herzog
(1994) asked the group subjects, adult women of middle and lower-class backgrounds, to portray
the families that are most frequently displayed on television by using available photographs,
drawings, and printed material. They asked the same subjects to portray the family of common
people using the same material. The results were clear: television families are small, rich and
happy; the families portrayed as common people are poor and contain more children, and the
faces portrayed more often seem unhappy.
In summary, constant exposure to smaller, less burdened television families may have
created a preference for fewer children and greater sensitivity to the opportunity costs of raising
children (Faria and Potter, 1999).
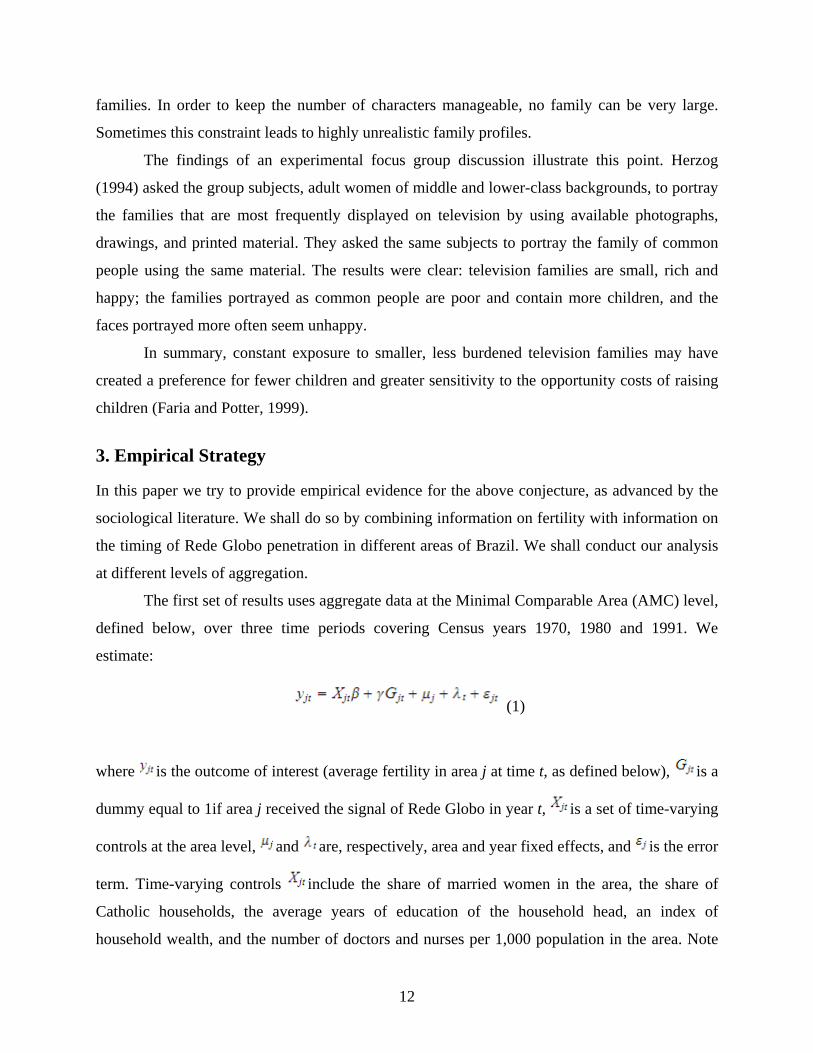
3. Empirical Strategy In this paper we try to provide empirical evidence for the above conjecture, as advanced by the
sociological literature. We shall do so by combining information on fertility with information on
the timing of Rede Globo penetration in different areas of Brazil. We shall conduct our analysis
at different levels of aggregation.
The first set of results uses aggregate data at the Minimal Comparable Area (AMC) level,
defined below, over three time periods covering Census years 1970, 1980 and 1991. We
estimate:
(1)
where is the outcome of interest (average fertility in area j at time t, as defined below), is a
dummy equal to 1if area j received the signal of Rede Globo in year t, is a set of time-varying
controls at the area level, and are, respectively, area and year fixed effects, and is the error
term. Time-varying controls include the share of married women in the area, the share of
Catholic households, the average years of education of the household head, an index of
household wealth, and the number of doctors and nurses per 1,000 population in the area. Note

13
that by adding area fixed effects ( ) we control for time-invariant unobserved characteristics
that affect fertility and may also be correlated with the timing of Globo entry. The time dummies
capture instead the secular (declining) trend in fertility that is common to all areas. Our
identifying assumption is that, conditional on area and time fixed effects and on the time-varying
controls , the year of Globo entry is orthogonal to the error term. We shall test the plausibility
of this assumption in Section 4.2 below. In all regressions our standard errors are clustered by
AMC.
There are two potential sources of endogeneity in the timing of Globo entry in different
locations. The first is that the Ministry of Telecommunications may have used selective criteria
in awarding licenses. As discussed in Section 2 above, the considerations underlying the
Ministry’s choices were mostly linked to patronage vis-à-vis influential Brazilian families, and
with no obvious link to local fertility patterns. A second concern is that, because Globo is a
commercial television network, it may have chosen to enter wealthier locations first, as the latter
would yield higher profits from advertising. For these reasons, we control for area fixed effects
and for time-varying characteristics by including a proxy for wealth in our regressions. We also
explicitly assess the potential selection on our variables of interest.
In a second set of results we exploit individual level data to estimate the probability that a
woman gives birth in a given year as a function of individual controls and Globo presence. As
we explain below, in these regressions we employ the 1991 Census wave and build a
retrospective history of a woman’s fertility for the previous 12 years. We thus have 13
observations (years) for each woman in childbearing age. We estimate the following linear
probability model:
(2)
where is equal to 1if a woman i living in area j gives birth to a child in year t; is a dummy
equal to 1if area j received the signal of Rede Globo at least 9 months prior to year t; are AMC
fixed effects and are year fixed effects. The variables in include the woman’s age, the
number (stock) of children she had up to year t, and a dummy for whether she gave birth in t-1,
plus her marital status, religion, the education of the household head and an index of household

14
wealth. We shall estimate (2) both for the full sample of women aged 15-49, and for different
age brackets, to assess what are the age categories on which Globo viewing has a relatively
larger impact. We cluster our standard errors by AMC in all regressions.
We shall also consider if exposure to television during different periods of a woman's life
leads different outcomes in terms of fertility behavior. For this purpose, we shall modify our
estimating equation as follows:
(3)
where is the number of years woman i living in area j at time t has been exposed to
Globo programs during ages 10-19, 20-29, and so on in 10-year brackets until which is
the number of years of exposure to Globo during ages 40-49
Using individual-level data we shall also test for the presence of heterogeneous effects in
the impact of Globo according to socioeconomic status, and estimate the interacted specification:
(4)
where will be, alternatively, education and wealth.
Finally, in a last set of results we shall explore the extent to which our results can be
linked to novela viewing rather than simply television viewing, and rely on ancillary regressions
as well an on estimates of (1) and (2) where, instead of a dummy for the presence of the Globo
signal, we introduce a dummy for the presence of another TV network with different
programming characteristics.
4. Data 4.1 Fertility For the first set of regressions (1), our dependent variable is constructed by aggregating
individual-level data from three rounds of the Brazilian Census: 1970, 1980 and 1991. We
restrict the sample to women aged 15 to 49. Each woman has a geographic identifier that allows
us to attribute her to the municipality where she lives. We do not actually use municipalities but
rather Minimally Comparable Areas (AMCs) as our spatial unit of analysis because this is the

15
smallest consistently defined geographic area provided by the Brazilian Statistical Institute. The
geographic borders of Brazil’s approximately 5,000 municipalities have changed over time,
while there are 3,659 consistently defined AMCs for each round of the Census.
We define fertility as the number of live births that a woman declares to have had. This
variable, which we denote as LIVEBIRTHS, is recorded directly as a specific question in each
round of the Census and includes children born alive to a woman, regardless of whether the child
is currently living in the household. Our dependent variable is the average value of
LIVEBIRTHS for all women aged 15-49 in AMC j and Census year t. Note that this variable
moves rather slowly over time: in our sample the average number of live births across AMCs
decreases from 3.0 in 1970 to 2.4 in 1991.
From the Census we also construct the following independent variables at the AMC
level: average age of women aged 15-49; average years of education of the household head;3 a
proxy for average wealth that is constructed through principal component analysis from durables
ownership and access to basic services (electricity, sanitation, etc.);4 share of women aged 15-49
who are married; share of Catholic households; and the number of doctors and nurses with a
diploma per 1,000 population. The latter variable is meant to control for supply-side factors that
may have driven the reduction in fertility contemporaneously with the entry of Globo into
different areas, notably health facilities and medical staff.
For the individual level regressions (2) we shall employ as dependent variable a “flow”
variable, that is, a dummy equal to 1 if woman i living in area j gave birth in year t. This
variable is not explicitly incorporated in the Census questionnaire. We therefore impute it using
the following procedure. For each woman in the age range 15-49, we know from the household
roster which children of hers are living in the household. We retain only children younger than
12, as this increases our confidence that we measure all the births occurred in that time period. In 3 We chose the education of the household head, rather than that of the woman, to mitigate potential endogeneity problems. For younger women, the decision to acquire more education may be a response to novela viewing; also, for these women the causality may run from fertility to education as they may stop studying once they have a child. If we include among the controls the number of years of education of the woman (as opposed to those of the head), our estimates of the Globo effect remain virtually unchanged. We show this for the individual-level regressions in Table 5. 4 The variable denoted as “wealth” in the regressions is the first principal component extracted from the following set of variables: share of households with access to piped water from the public system, share of households with sanitation, share of households with electricity, share of households owning a radio, share of households owning a refrigerator, share of households owning a car. We do not consider ownership of a television set, as this is likely endogenous to the availability of the Globo signal.

16
fact in the Brazilian context it is extremely unlikely that a child leaves the household before the
age of 12. Given that the Census reports the age of all household members, we compute the year
of birth of a child as the difference between the year of the Census interview and the age of the
child. We thus recover every year in which a woman gave birth over the 12-year period before
the Census. Consider, for example, a woman interviewed in 1991 who has two children living
with her, one two years old and the other seven years old. We can therefore infer that this woman
gave birth in 1984 and 1989 and, according to our procedure, in no other year during the period
1979-91. We thus construct a dummy taking a value of 1 in years 1984 and 1989, and 0 in the
remaining years during the period 1979-1991.
Due to the size of the original data, for the individual-level regressions we extract a 5
percent random sample from the 1991 Census. We chose this Census wave because the previous
12 years represent the period where the bulk of Globo expansion occurred, as shown in the next
section (Figure 1).
The construction of the variable rests on the assumption that a woman’s children
do not leave the household before the age of 12. While we cannot rule out that this may occur in
a small number of cases—which would lead us to underestimate fertility—we have checked the
consistency of our method by comparing our imputed figures with the answer to the Census
question on the number of children currently alive for women younger than 25. In fact, given
their age, these are women whose children should all be in the household if our conjecture is
correct. Our results indicate that our method is quite reliable: in 96 percent of the cases our
imputed number of children exactly coincides with the number of births these women declare; in
a remaining 3.5 percent of the cases we underestimate the number of children born by 1 unit.
From the Census we also take the following independent variables: age of the woman;
years of education of the household head; a proxy for wealth constructed from durable goods
ownership and access to basic services;5 a dummy equal to one if the woman is married, a
dummy for Catholic religion, and the number of doctors and nurses with a diploma per 1,000
population.
Summary statistics of all variables are reported in Appendix Table A1.
5 The variable denoted as “wealth” in the regressions is the first principal component extracted from the following set of dummies for each household: access to piped water from the public system; sanitation; electricity in the house; ownership of a radio; ownership of a refrigerator; ownership of a car.

17
4.2 Rede Globo and Novelas Our second data source is information provided by Rede Globo on the year in which different
areas obtained access to their programs. For each broadcasting or retransmitting station, we
know the year and the location where it was installed (latitude and longitude), as well as its radial
reach in kilometers. This allows us to know which municipios where reached by the signal of
any particular antenna and in which year they first started receiving the signal. We then match
this information with the AMC corresponding to each municipio, and construct a variable
equal to 1if AMC j is within the signal radius of a Globo broadcasting or
retransmitting station in year t, and 0 otherwise.
Figure 1 shows the increase over time in the number of AMCs reached by the Globo
signal. In 1970, only four AMCs out of 3,659 were receiving the Globo signal; in 1980 the
number had increased to 1,300 and in 1991 to 3,147. Figure 2 shows the geographic expansion of
the network between 1970 and 2000. Lighter colors represent earlier exposure to the signal (with
the exception of white, which stands for “no signal”). This figure suggests that the entry of
Globo into different areas may not have been random. Globo reached the most developed parts
of Brazil first, which is potentially a concern for our identification strategy because these areas
are also those with lower fertility. However, we show below that after controlling for our time-
varying controls and for AMC fixed effects there seems to be no evidence of selection in
unobservables correlated with fertility trends.
To motivate our analysis and help us interpret the results, we have collected a large
amount of data on the content of individual novelas broadcast by Rede Globo since the start of
its operations. Rede Globo traditionally airs three sets of novelas:
• novelas das seis, at 6 p.m., which are typically historical stories about slavery and
colonial times and have romantic content. These are the novelas with the smallest
audience.
• novelas das sete, at 7 p.m., which are mostly contemporary comedies and often include
elements of envy and conspiracy;
• novelas das oito, at 8 p.m. (or 9 p.m.), which focus largely on social issues and have by
far the largest audience throughout the country.

18
We have coded a number of variables for all 7 p.m. and 8 p.m. novelas from 1965 to
1999. Appendix Table A2 reports the full list of titles with beginning and ending date. For the
purpose of the present analysis, the most relevant variables coded are: age of first female
character; number of children of first female character; marital status of first female character;
and whether the first female character is unfaithful to her partner (in the case of a married
woman, whether she has an extramarital relationship). The distribution of these variables is
shown in Table 1.
Over the full sample of 7 and 8 p.m. novelas aired between 1965 and 1999, in 62.2
percent of novelas the main female character does not have any children, in 20.7 percent she has
one child, in 9 percent two children, 4.5 percent three children, and in the remaining cases has
four or more children. It is also interesting to consider a restricted sample of novelas where the
main female character is under 50 years of age (still the vast majority, at 97 of the 115 novelas in
the sample), as these may be the characters with whom women of childbearing age most easily
identify. In this smaller sample, the percentage of childless women increases to 71.6, 21.1
percent of the women have one child, and only 7.4 percent have two or three children; no woman
has four or more. Finally, if we look at married women only, 41.2 percent have no children, 33.3
percent have one child and 20.1 percent have two. These figures are quite astonishing if we
compare them to actual fertility patterns in the Brazilian population over this period.
Furthermore, the low fertility among novela heroines is not driven by the more recent novelas: if
anything, quite the opposite.
Figure 3 shows the average number of children of the main female character of all 7 p.m.
and 8 p.m. novelas aired in a given year. The numbers corresponding to each observation
represent the sample size (number of novelas) from which the average is computed. As a general
observation, with the exception of the year 1996, the average female main character has no more
than one child in each and every year between 1965 and 1999. Most strikingly, in the first decade
of operation of Rede Globo, almost all 7 p.m. and 8 p.m. novelas—with only two exceptions—
were about a woman who had no children at all. Similar observations apply to variables such as
marriage, divorce and extramarital relationships. Only 29 percent of the main female characters
in novelas are married (27 in the sample younger than 50), and 12 percent are divorced or
separated (10 percent in the sample younger than 50). In the full sample, 26 percent of the main
female characters are unfaithful to their partner (29 percent in the sample younger than 50 and

19
42.3 in the married sample younger than 50). While for the latter variable it is not possible to
find a counterpart in Census data, in novelas marriage rates are markedly lower and divorce rates
markedly higher than in Brazilian society at the time. These observations make us confident that
the role models portrayed in the programs of the television channels we shall analyze were
clearly consistent with a radical re-orientation of society’s attitudes towards women’s roles in the
family, including fertility.
5. Econometric Results In this section we take advantage of variation in the timing of Globo entry into different areas to
formally test the hypothesis that exposure to the programs of this television network was
associated with a reduction in fertility rates. We start by presenting evidence at the aggregate
level, and then move to individual level regressions.
5.1 Aggregate Regressions 5.1.1 Baseline Results
Table 2 contains our first set of results, obtained using aggregate data at the Minimal
Comparable Area (AMC) level for the Census years 1970-1991.
The dependent variable in this table is , i.e., the average number of live
births for women aged 15-49 in the AMC in any given Census year. Our key variable of interest
(Globo coverage) is a dummy equal to one if the AMC receives the Globo signal in that year.
The table reports OLS coefficients and standard errors clustered by AMC. In column 1 we run a
simple regression on the full sample controlling only for time dummies. On average, after
accounting for the secular declining trend in fertility, areas reached by Globo have an average
number of live births that is lower by 0.29. Of course, this coefficient cannot be interpreted due
to the fact that Globo presence in an area may be correlated with unobserved characteristics that
are associated with lower fertility. In columns 2 to 4 we thus introduce different area fixed
effects to control for differences in time-invariant unobservables across locations. We start with
State (Unidade Federação, UF) fixed effects in column 2, proceed with microregion fixed effects
in column 3 (for a total of 522 microregions), and finally include AMC fixed effects in column 4,
which gives a full panel fixed effects regression. In this last regression the coefficient of the
Globo variable is -0.024 and is significant at the 5 percent level.

20
In columns 5 to 8 we include a number of controls to account for time-varying
differences across AMCs. These variables are: the average years of education of the household
head, an index of wealth built from information on durable goods ownership and quality of the
house, the share of married women in the AMC, the share of Catholic households in the AMC,
and the number of doctors and nurses with a diploma per 1,000 people in the AMC. We do not
include the share of households owning a TV set as this is likely an endogenous variable.6 After
we include these time-varying controls and we control for AMC fixed effects, the coefficient on
the Globo variable is -0.027 and is significant at the 1 percent level (column 8). Surprisingly,
once we control for AMC fixed effects, the education of the head has a very small (and only
marginally significant) effect on fertility. Wealth, marriage rates and health supply factors play a
significant role in explaining fertility. The coefficient on the share of Catholic households is not
statistically significant.
Prima facie, the effect we find on Globo coverage may seem small. The mean of our
dependent variable across AMCs is 2.67, and the standard deviation is 0.55. However, it should
be noted that the average number of live births changes very little over time. In fact, the mean
value of LIVEBIRTHS is 2.98 in 1970, 2.66 in 1980 and 2.36 in 1991. If we compare the effect of
Globo exposure with that of one more year of education of the household head, the effect of
Globo is substantially larger. This is remarkable in a country where the average education of
household heads over this period is 2.72 years (and the standard deviation is 2.38). Also, from
column (8) of Table 2 we see that the effect of Globo exposure is comparable in size to that of
having one more doctor or nurse per 1,000 people, which is also remarkable given that the mean
of this variable is 0.2 (standard deviation 0.74).
Finally, to quantify the magnitude of the effect it can be useful to combine the estimated
coefficient of Globo coverage with the rate of TV ownership in the population, which is 0.41 on
average over this period. If all and only women living in households that owned a television
watched Rede Globo, the effect of Globo on women effectively watching TV would be a
decrease in LIVEBIRTHS of 0.058. This rough estimate may still be downward biased if the
audience of Rede Globo were below 100 percent. On the other hand, it may be biased upwards if
people watched television in their neighbors’ house or in public places.
6 However, if we control for TV ownership the effect of Globo coverage is actually stronger (the estimated coefficient in column 8 is -0.032 and is significant at the 1 percent level).

21
In Table 3 we estimate a similar set of regressions, but we focus on the length of
exposure to Globo programs, rather than simply on whether an area was reached by the signal.
Our variable of interest is the number of years for which an AMC was covered by the Globo
signal. The results we obtain are very similar to those shown in Table 2. In the specification with
all controls and AMC fixed effects (column 8), ceteris paribus one more year of Globo coverage
is associated with a reduction in LIVEBIRTHS of 0.009.
5.1.2 Selection The key identification assumption underlying our approach is that Globo entry in a market,
though not random, was uncorrelated with pre-existing differences in fertility trends across areas,
after controlling for time varying controls and time invariant area characteristics. To assess the
plausibility of this assumption and investigate the nature of the selection, we estimate the
following linear probability models:
where is a dummy equal to 1 if AMC j receives the Globo signal in year t and
0 otherwise; is the set of time-varying controls that we use in all regressions, is the
fertility level in the previous period, is the change in fertility between t-1 and t, and
is the change in fertility between t-2 and t-1; and and are AMC and time fixed
effects. The results are reported in Table 4.
In column 1 of Table 4 we estimate the probability of having Globo in a given year as a
function of lagged fertility, as well as contemporaneous controls, time and AMC dummies. The
set of controls is the same as employed in Tables 2 and 3. As we can see from the table, once we
introduce area fixed effects there is no correlation between Globo presence and previous fertility
levels.
We also examine whether selection may occur on previous changes in fertility. In
columns 2 and 3 we regress Globo presence at time t on the change in fertility between t-1 and t.
In this regression, we control for contemporaneous levels of the controls (column 2) and
22
additionally for changes in the controls between t-1 and t (column 3). Again, we find no
significant correlation between changes in fertility and Globo coverage.
Finally, in columns 4, 5 and 6 we regress Globo presence at time t on the change in
fertility between t-2 and t-1.7 The three columns vary the specification regarding the timing of
the controls. In none of the specifications, however, is the fertility trend a significant predictor of
Globo presence. Overall, we believe these results should mitigate possible concerns about our
identification strategy.
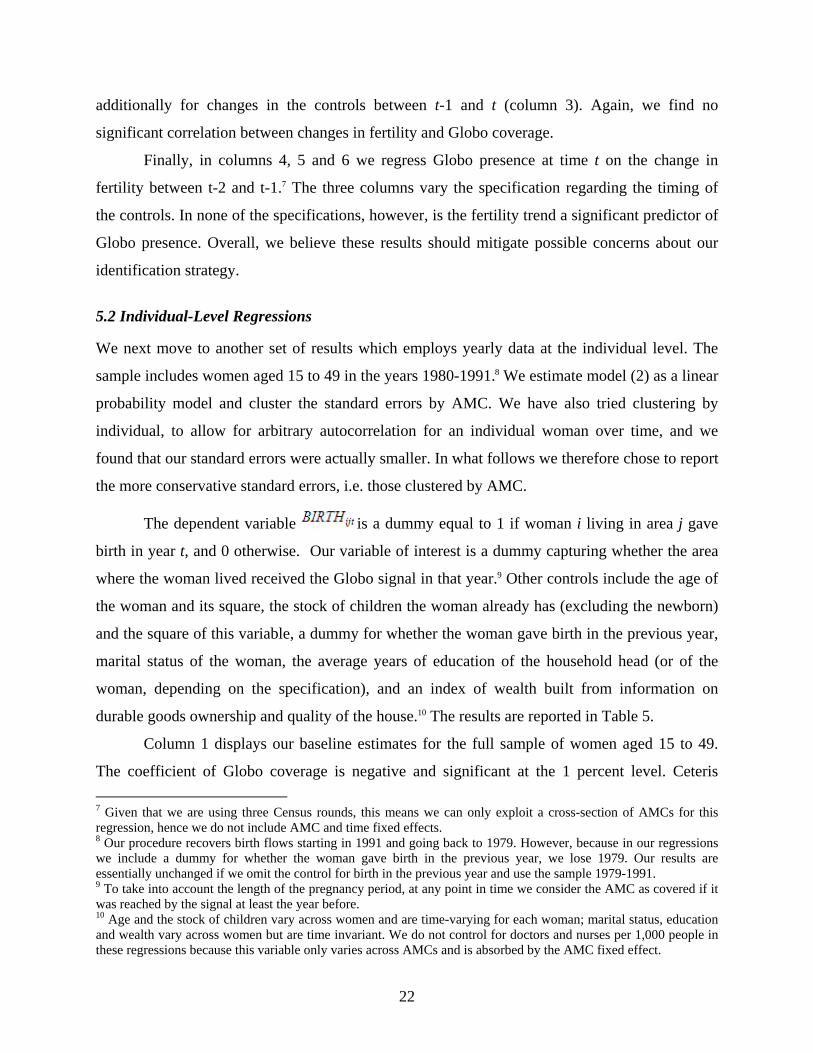
5.2 Individual-Level Regressions We next move to another set of results which employs yearly data at the individual level. The
sample includes women aged 15 to 49 in the years 1980-1991.8 We estimate model (2) as a linear
probability model and cluster the standard errors by AMC. We have also tried clustering by
individual, to allow for arbitrary autocorrelation for an individual woman over time, and we
found that our standard errors were actually smaller. In what follows we therefore chose to report
the more conservative standard errors, i.e. those clustered by AMC.
The dependent variable is a dummy equal to 1 if woman i living in area j gave
birth in year t, and 0 otherwise. Our variable of interest is a dummy capturing whether the area
where the woman lived received the Globo signal in that year.9 Other controls include the age of
the woman and its square, the stock of children the woman already has (excluding the newborn)
and the square of this variable, a dummy for whether the woman gave birth in the previous year,
marital status of the woman, the average years of education of the household head (or of the
woman, depending on the specification), and an index of wealth built from information on
durable goods ownership and quality of the house.10 The results are reported in Table 5.
Column 1 displays our baseline estimates for the full sample of women aged 15 to 49.
The coefficient of Globo coverage is negative and significant at the 1 percent level. Ceteris 7 Given that we are using three Census rounds, this means we can only exploit a cross-section of AMCs for this regression, hence we do not include AMC and time fixed effects. 8 Our procedure recovers birth flows starting in 1991 and going back to 1979. However, because in our regressions we include a dummy for whether the woman gave birth in the previous year, we lose 1979. Our results are essentially unchanged if we omit the control for birth in the previous year and use the sample 1979-1991. 9 To take into account the length of the pregnancy period, at any point in time we consider the AMC as covered if it was reached by the signal at least the year before. 10 Age and the stock of children vary across women and are time-varying for each woman; marital status, education and wealth vary across women but are time invariant. We do not control for doctors and nurses per 1,000 people in these regressions because this variable only varies across AMCs and is absorbed by the AMC fixed effect.
23
paribus, a woman living in an area that receives Globo is 0.6 percentage points less likely to give
birth in any given year (the mean of the dependent variable is 0.10). In column 2 we control for
the number of years of education of the woman, rather than of the household head. The estimated
coefficient of the Globo variable is unchanged. The magnitude of the coefficients indicates that,
ceteris paribus, being exposed to Globo programs leads to the same decrease in the probability of
giving birth as an increase of two years in the woman's education. This is quite relevant, given
that the average education of women in our sample is 5.6 years.
In columns 3 to 5 we test for the presence of heterogeneous effects along the dimensions
of education and wealth. We introduce among the regressors an interaction term between Globo
coverage and (i) the years of education of the household head (column 3); (ii) the years of
education of the woman (column 4); and (iii) the wealth index of the household (column 5). In
all cases we find that the negative effect of Globo exposure on fertility is strongest for women
living in poorer households and households with lower levels of education, and is attenuated for
richer and more educated households. This is quite important from a policy point of view,
because it is precisely among poorer and less educated individuals that we should expect a
medium like television to have the most communication potential. Rich and educated households
may already be exposed to different lifestyles and role models through written media or social
interactions.
In Table 6 we explore age, another dimension of heterogeneity in impact. In columns 1 to
3 we split the sample into three age groups: 15-24, 25-34, 35-44. The results in the table suggest
interesting differences among age groups. For the youngest age bracket, i.e., women aged 15-24,
Globo coverage decreases the probability of giving birth by 0.2 percentage points, but the effect
is not statistically significant (the mean of BIRTH for this group is 0.11). For the age group 25-
34, which on average has a probability of giving birth in any given year of 0.136, the coefficient
is -0.0107. For this group Globo presence is associated with a reduction of over one percentage
point in the likelihood of giving birth. The effect is also very strong for the next age group, i.e.,
women aged 35 to 44. The average probability of giving birth for this group is 0.058, and
exposure to Globo leads to a reduction of 0.65 percentage points, which is quite sizeable in
relation to the mean.

24
In columns 4 and 5 of Table 6 we estimate the effect of length of exposure to Globo,
allowing for a differential effect of exposure at different ages.11 We find that among women aged
30 to 49, one more year of exposure as a teenager (i.e., during age 10-19) decreases the
likelihood of giving birth by 0.003 and has a similar impact in terms of magnitude as one more
year of exposure during ages 20 to 29. On the other hand, years of exposure during ages 30 to 39
has the strongest effect on fertility, with an estimated coefficient of -0.006. Among women aged
40 to 49 (column 5) we find that one more year of exposure during ages 20 to 29 decreases the
likelihood of giving birth by 0.008, a similar effect as one more year of exposure during ages 30
to 39 (the estimate being -0.009). Exposure during the ages 40-49 leads to a reduction of 0.2
percentage points in the probability of giving birth.
It is worth discussing the above findings in relation to the demographic literature on
Brazil. An apparently puzzling result in Table 6 is the absence of significance of Globo exposure
for the youngest age group, women aged 15 to 24. However, this is very consistent with what is
known about the nature of changing fertility patterns in Brazil. Martine (1996) and Flórez and
Núñez (2003) find that changes in the starting age of fertility have been negligible in Brazil
country, related both to relatively stable marital patterns as well as persistently high rates of
adolescent fertility. On the other hand, increased spacing of births and—especially—stopping of
childbirth have been found to be more important (Moreno, 1991). These findings are confirmed
in our data, as illustrated in Figure 4.
The histograms in Figure 4 represent the average number of live births for women aged
15-19, 20-24, and so on until 40-44, for the three Census years in our sample. Interestingly, over
the period 1970-1991 there has been absolutely no decrease in the average number of live births
for women younger than 25. By the age of 24, the average woman in our sample had one child
both in 1970 and in 1991. What happens between the age of 25 and that of 35, on the other hand,
is very different over this period. In 1970, a woman aged 30 to 34 would have had on average 4.4
live births in her life; in 1991 this number had decreased to 3.2. A similar decline occurred
between 35 and 45 years of age. In 1970, a woman aged 40-45 would have had on average 6.4
11 The variables “Years exposed during 10-19”, ... “Years exposed during 40-49” are defined only for women who have reached the relevant age bracket. Therefore the sample in column 5 includes women aged 40 to 49 because these are the only ones for whom “Years exposed during 40-49” is not missing. On the other hand, in this column “Years exposed during 10-19” is not included among the regressors because it is identically zero for the 40-49 age group. Column 4 enlarges the sample to women aged 30 to 49, and for this group the coefficient on “Years exposed during 10-19” can be estimated.
25
live births in her life; in 1991 this number had decreased to 4.9. These data suggest that it is in
the intermediate and late stages of their reproductive life that Brazilian women chose to have
fewer children, which is consistent with our estimates in Table 6.
5.3 Robustness To corroborate the validity of our results, in this section we perform some falsification tests and
robustness analysis. The results are reported in Table 7. In panel A of the table we construct a
placebo treatment using the timing of Globo entry. We perform analogous regressions to the
ones we performed in Table 2 (our baseline AMC-level specification), but instead of looking at
the effects of Globo past entry on current behavior, we look at the effects of future entry for
areas that are not covered by Globo at a given point in time. Our dependent variable is
i.e., the average number of live births for women aged 15-49 in AMC j in
Census wave t. Our regressor of interest (Globo coverage in t+1) is a dummy equal to one if
AMC j will receive the Globo signal in Census wave t+1. For each wave t, we only include in
the sample AMCs that do not receive the signal in that wave (otherwise changes in fertility may
have been induced by previous exposure to Globo), and that may or may not receive it in t+1.
Our hypothesis for the “placebo” experiment is that fertility in places that do not receive the
Globo signal should not be affected by the fact that the signal may become available in the
future. Indeed, the results of panel A show that both when we omit time-varying controls
(column 1) and when we include them (column 2), future presence of Globo has no predictive
power on current fertility levels.
In panel B of Table 7, we use individual-level data and work with sub-samples of the
original dataset. The first subsample is made up of women aged 45 to 54 in any given year
between 1980 and 1991. We expect that these women should have already completed their
fertility cycle, hence there should not be any correlation between Globo presence and their
likelihood of giving birth. Indeed, the coefficient on the Globo variable reported in column 3 of
Table 7 is not statistically different from zero, suggesting that our variable is not capturing
unobserved (time-varying) characteristics of the area where women live.
A second strategy is to restrict the analysis to migrants. We exploit a question in the
Census that asks the respondent if she has lived continuously in the current municipality for at
least 10 years, and if not, records the name of the municipality where she was living immediately

26
before. If the underlying reason for the negative relationship between Globo presence and
fertility is related to exposure to Globo programs and their role models, as we hypothesize, we
should find a similar (negative) effect when we use Globo presence in the area the respondent is
coming from. If, on the other hand, the Globo variable is capturing unobserved time-varying
characteristics correlated with fertility in the destination area, then our result should disappear.
The estimates in column 4 of Table 7 show that indeed the effect of Globo coverage in the AMC
of origin of migrant women is negative and significant at the 5 percent level, and it is similar in
magnitude to our baseline estimate.
Taken together, the results in Table 7 increase our confidence that our findings are not
spurious.
6. Interpretation: TV or Novelas? Our results so far indicate a robust and negative effect of Globo presence on fertility choices in
Brazil. In this section we try to understand to what extent this is a general effect of television
viewing, and to what extent it may be linked to the particular type of programs broadcast by
Rede Globo. The data available do not allow us to identify the effect of Globo programming
separately from the effect of Globo entry, hence our arguments in this section should be
considered only suggestive. Nonetheless, given that a sizeable anthropological and sociological
literature in Brazil has stressed the role of novela content in shaping individual behavior, we
think it can be interesting to explore different strategies to assess the plausibility of such
hypotheses.
A first step is to show that indeed people watched novelas and that some of the decisions
people made were affected by the content of novelas. We focus on naming patterns among
children and test whether, ceteris paribus, it is more common for parents living in areas that are
reached by Globo to name their children after popular characters in novelas. In particular, we use
administrative data on the names of Brazilian fifth-graders in 2004 (Ministry of Education of
Brazil, 2005) and compare the pattern of their first names with the first names of the main

27
characters in the novelas aired in the year in which these children were born, typically 1994.12
We do this for a 10 percent random sample of AMCs in the country, i.e., for 366 AMCs.13
Our variable of interest is a dummy NAMESMATCH that equals 1 if at least one of the
top 20 most prevalent names of children born in 1994 is one of the names of the main novela
characters of that year. Since novela names tend to be very idiosyncratic in Brazil and elsewhere
in Latin America, we believe that evidence on possible name patterns strongly suggests a link
between novela content and behavior. Table 8 reports the results of this exercise.
Of the 366 AMCs for which we have data, 319 had received the Globo signal by 1994
(the birth year of the children in our sample), and 47 received it after 1994 or did not receive it at
all. Panel A of the table shows a simple comparison of means in the two subsamples. The mean
of the NAMESMATCH variable is 0.329 in the group of AMCs covered by Globo and 0.085 in
the other group. In other words, the likelihood that the 20 most popular names chosen by parents
for their newborns would include one or more names of the main characters of novelas aired that
year was about 33 percent if the area where parents lived received the Globo signal and only 8.5
percent if it did not. Panel A also reports confidence intervals and shows that the difference is
statistically significant at the 1 percent level.
In Panel B we run a linear probability model and a probit model using as dependent
variable NAMESMATCH and clustering the standard errors at the State (Unidade Federação)
level. The Globo coverage variable has a positive and significant effect also after we control for
the same variables used in previous regressions (columns 2 and 4), and the size of the coefficient
is basically the same as without the controls (columns 1 and 3). Our estimates suggest that,
ceteris paribus, AMCs that receive the Globo signal have a 24 percent higher probability of
displaying a “match” between children’s and novela characters’ names.
A second way to assess the role of Globo programming separately from general TV
viewership is to test if the entry of other TV networks had similar effects on fertility. The
channel we focus on is SBT (Sistema Brasileiro de Televisão), which started operating in 1980
and is the second most popular network after Globo in Brazil. Appendix Table A3 shows 12 We coded the names of the three main male and female characters of Globo novelas aired in 1994 based on detailed plot descriptions provided by Globo itself. 13 While we would have liked to compare names for the full spectrum of AMCs in our sample, this was not possible due to data limitations. However, we tested for possible differences in observables among the AMCs for which we had names and the remaining ones, and in no case we could reject the null of equality of means, suggesting that the randomization worked well.

28
audience rates of all major networks in Brazil from 1975 to 2000, the only years for which data
are available. The table clearly shows the virtual monopoly of Globo until the early 1990s, as
well as the fact that SBT is the only other network whose impact may be easily detected, given
its audience shares. Interestingly, the marketing strategy of SBT was very different from that of
Rede Globo. While Globo heavily relied on national productions, strengthening the concept of
“Brazilian identity,” SBT always relied heavily on imports, including foreign shows and
Mexican and US soap operas.
In Table 9 we estimate equations (1) and (2) at the AMC and individual level,
respectively, including among the controls the entry of SBT instead of Rede Globo. In particular,
the dummy is constructed exactly in the same way as , namely
assigning a value of 1 to the observations reached by the SBT signal in a given year (as
calculated from the radial reach of SBT broadcasting and retransmitting stations in that year) and
0 otherwise. In columns 1 to 4 the units of observations are AMCs for the Census years 1970,
1980 and 1991, and the dependent variable is the average number of live births for women aged
15-49 in the AMC in a given year ( ). In columns 5-6, the units are individual
women aged 15-49 in the 12 years 1980-1991, and the dependent variable is a dummy equal to 1
if a woman gave birth in a given year ( ). All specifications include the same set of
controls as the AMC level and the individual-level regressions. Columns 1, 2 and 5 use the full
sample of AMCs available. In this sample, SBT presence has no significant effect on fertility.
However, in its decisions to enter any given market, SBT may have been a follower with respect
of Rede Globo. Therefore we cannot exclude that an AMC where SBT enters in a given year
may have received Globo programming earlier on. To rule out this possibility, in columns 3, 4
and 6 we restrict the sample to areas that were not reached by Rede Globo in a given year (i.e.,
for which the variable was equal to 0 in that year). Also in this smaller sample,
SBT presence never has a significant effect on fertility.
One way to interpret the above findings is that Globo programming had a stronger impact
on fertility choices because it portrayed a reality with which Brazilian viewers could more easily
identify. The role of “frame salience” has been underlined in the communications literature on
Brazilian novelas (e.g., Vink, 1988), which has stressed how viewers tend to be more affected by

29
the content of a novela when they can more easily relate to its main character(s) and to the
environment.
7. Conclusions This paper has explored the effects of television, and in particular of programs such as soap
operas, on women’s fertility. Our analysis draws on the experience of Brazil, a country where
soap opera watching is ubiquitous and cuts across social classes. We exploit differences in the
timing of entry into different markets of Rede Globo, which until the early 1990s had an
effective monopoly on the production of novelas in Brazil, to estimate the impact of Globo
availability on fertility choices. We find that, after controlling for time-varying controls and for
time-invariant area characteristics, the presence of the Globo signal leads to significantly lower
fertility. This effect is stronger for women of low socioeconomic status, as measured by
education or durable goods ownership. The effect is also stronger for women who are in the
middle and late phases of their child-bearing life, suggesting that television contributed more to
stopping behavior than to delayed first births, consistent with demographic patterns documented
for Brazil. Finally, suggestive evidence in the last part of the paper indicates that the results may
be interpreted not only in terms of exposure to television, but also of exposure to the particular
reality portrayed by Brazilian novelas.
Our findings have important policy implications for other developing countries. In
societies where literacy is relatively low and newspaper circulation limited, television plays a
crucial role in circulating ideas. Our work suggests that programs targeted to the culture of the
local population have the potential of reaching an overwhelming number of people at very low
cost and could thus be used by policymakers to convey important social and economic messages
(e.g., about HIV/AIDS prevention, children’s education, the rights of minorities, etc.). Recent
work by social psychologists (e.g., Paluck, 2008) stresses the role of the media, and of radio soap
operas in particular, as a tool for conflict prevention. Our paper suggests that programs of this
type may be usefully employed for a broader set of development policies.

30
References Besley, T., and R. Burgess. 2002. “The Political Economy of Government Responsiveness:
Theory and Evidence from India.” Quarterly Journal of Economics 117(4): 1415-52.
Capparelli, S., and V.A. Lima. 2004. Comunicação e televisão: desafios da pósglobalização. Sao
Paulo, Brazil: Hacker Editores.
Costa, S., and J. Brener. 1997. “Coronelismo electrônico: O governo Fernando Henrique e o
novo capitulo de uma velha historia.” Comunicaçã & Política 4.
Dahl, G., and S. DellaVigna. 2008. “Does Movie Violence Increase Violent Crime?” NBER
Working Paper 13718. Cambridge, United States: National Bureau of Economic
Research.
DellaVigna, S., and E. Kaplan. 2007. “The Fox News Effect: Media Bias and Voting.” Quarterly
Journal of Economics 122(3): 1187-1234.
De Lima, V.A. 2001. Comunicação e política. São Paulo, Brazil: Hacker Editores.
De Lima, Venicio A., and S. Capparelli. 2004. Comunicação e Televisão: Desafios da pós-
globalização. Sao Paolo, Brazil: Hacker Editores.
Dos Santos, S., and S. Capparelli. 2004. “Coronelismo, radiodifusão e voto: A nova fase de un
velho conceito.” Porto Alegre, Brazil: Universidad Federal do Rio Grande do Sul.
Manuscript.
Fadul, A. 1999. “Novela e Familia no Brasil.” Rio de Janeiro, Brazil: Congreso Brasileiro de
Ciencias de Comunicação. Manuscript.
Faria, V., and J. Potter. 1999. “Television, Telenovelas, and Fertility Change in North-East
Brazil.” In: R. Leete, editor. Dynamics of Values in Fertility Change. Oxford, United
Kingdom: Oxford University Press.
Flórez, C.E., and J. Núñez. 2003. “Teenage Childbearing in Latin American Countries.” In: S.
Duryea, A. Cox-Edwards and M. Ureta, editors. Critical Decisions at a Critical Age:
Adolescents and Young Adults in Latin America. Washington, DC, United States: Inter-
American Development Bank.
Gentzkow, M. 2006. “Television and Voter Turnout.” Quarterly Journal of Economics 121(3):
931-972.
31
Gentzkow, M., and J. Shapiro. 2006. “Does Television Rot Your Brain? New Evidence from the
Coleman Study.” NBER Working Paper 12021. Cambridge, United States: National
Bureau of Economic Research.
Herzog, C. 1994. “A Novela na Familia versus a Familia na Novela.” Manuscript.
Jensen, R., and E. Oster. 2007. “The Power of TV: Cable Television and Women’s Status in
India.” NBER Working Paper 13305. Cambridge, United States: National Bureau of
Economic Research.
Lam, D., and S. Duryea. 1999. “Effects of Schooling on Fertility, Labor Supply, and Investments
in Children, with Evidence from Brazil.” Journal of Human Resources 34(1): 160-90.
Lam, D., and L. Marteleto. 2005. “Small Families and Large Cohorts: The Impact of the
Demographic Transition on Schooling in Brazil.” In: C. B. Lloyd, editor. Growing Up
Global: The Changing Transitions to Adulthood in Developing Countries. Washington,
DC, United States: National Academies Press.
Marques de Melo, J. 1988. As Novelas da Globo: Produção e Exportação. Sao Paulo, Brazil:
Summus Editorial.
Martine, G. 1996. “Brazil's Fertility Decline, 1965-95: A Fresh Look at Key Factors.”
Population and Development Review 22(1): 47-75.
Merrick, T., and E. Berquó. 1983. The Determinants of Brazil's Recent Rapid Decline in
Fertility. Washington, DC, United States: National Academies Press.
Miguel, L.F. 2001. “Meios de Comunicação de Massa e Política no Brasil.” Diálogos Latino-
americanos 3: 43-70.
Moreno, L. 1991. “An Alternative Model of the Impact of the Proximate Determinants of
Fertility Change: Evidence from Latin America.” Population Studies 45(2): 313-337.
Olken, B. 2006. “Do Television and Radio Destroy Social Capital? Evidence from Indonesian
Villages.” NBER Working Paper 12561. Cambridge, United States: National Bureau of
Economic Research.
Paluck, E.L. 2008. “Reducing Intergroup Prejudice and Conflict Using the Media: A Field
Experiment in Rwanda.” Forthcoming in Journal of Personality and Social Psychology.
Potter, J., C. Schmertmann and S. Cavenaghi. 2002. “Fertility and Development: Evidence from
Brazil.” Demography 39(4): 739-61.

32
Rios-Neto, L. 2001. “Television, Value Constructs, and Reproductive Behavior in Brazilian
Excluded Communities.” Paper presented at XXIV General Population Conference of
the International Union for the Scientific Study of Population, Salvador, Brazil.
Rutenberg, N., L.H. Ochoa and J.M. Arruda. 1987. “The Proximate Determinants of Low
Fertility in Brazil.” International Family Planning Perspectives 13(3): 75-80.
Stromberg, D. 2004. “Radio’s Impact on Public Spending.” Quarterly Journal of Economics
119(1): 189-221.
Vink, N. 1988. The Telenovela and Emancipation: A Study of Television and Social Change in
Brazil. Amsterdam, The Netherlands: Royal Tropical Institute.

33
Figure 1. Rede Globo Expansion over Time
032
97#
AMC
s co
vere
d by
Glo
bo s
igna
l
1965 1970 1980 1990 2000year
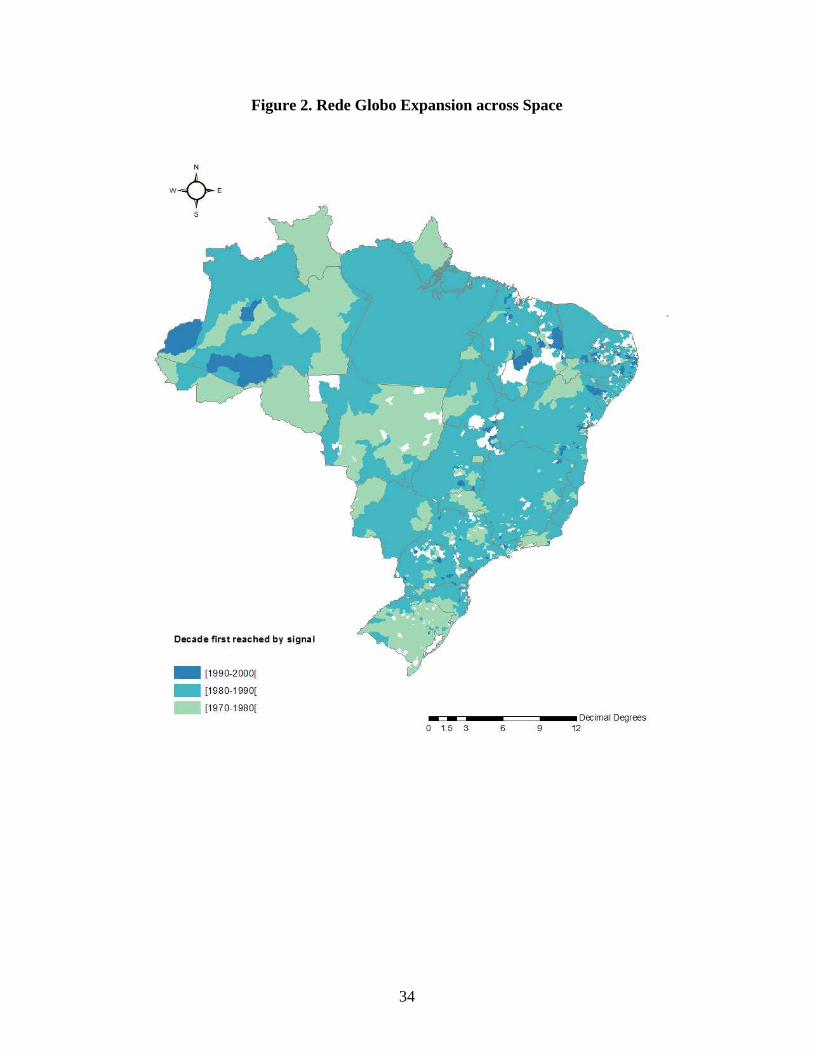
34
Figure 2. Rede Globo Expansion across Space

35
Figure 3. Average Number of Children of Main Female Character in Novelas, by Year (Numbers on each data point indicate the number of novelas from which average is computed)
av
g #c
hild
ren
1st f
emal
e <5
0 yr
s
year_start1965 1970 1980 1990 2000
0
.5
1
1.5
2
2.5
1 1
22
22
333
333 22 333 4444 333 55555
55555333 333
4444
4444 333
4444
22
333
333 1
333
22
333 22 22 333
4444333
22
22
22
22
4444
Figure 4. Average Number of Births, by Age Cohort
0
1
2
3
4
5
6
7
[15-19] [20-24] [25-29] [30-34] [35-39] [40-44]
Age
Ave
rage
no.
of l
ive
birth
s
1970 1980 1991
Source: Authors’ calculations based on Census data.

36
Table 1. Novela Content Analysis: Characteristics of Main Female Character
Full sample Age of Female1 <50 Age of Female1 <50 % novelas % novelas & married, % novelas Number of children 0 62.2 71.6 41.2 1 20.7 21.1 33.3 2 9.0 6.3 20.1 3 4.5 1.1 4.2 4 or more 3.6 0 0 (N=111) (N=95) (N=24) Married Yes 29.0 26.8 - (N=114) (N=97) Divorced or separated Yes 12.2 10.3 - (N=115) (N=97) Unfaithful to partner Yes 26.1 28.9 42.3 (N=115) (N=97) (N=26)
Source: Authors’ calculations based on novela content analysis.

37
Table 2. Globo Coverage and Aggregate Fertility Dependent variable: Avg. number of live births for women aged 15-49 in AMC (LIVEBIRTHS)
[1] [2] [3] [4] [5] [6] [7] [8]
Globo coverage -0.2926 -0.0458 -0.0498 -0.0236 -0.0913 -0.0233 -0.0239 -0.0268(0.0146)** (0.0107)** (0.0088)** (0.0096)* (0.0090)** (0.0082)** (0.0076)** (0.0094)**
Education of head -0.0136 -0.0054 -0.0038 -0.0026(0.0016)** (0.0015)** (0.0015)** -0.0015
Wealth -0.1565 -0.1367 -0.1247 -0.1239(0.0020)** (0.0025)** (0.0028)** (0.0056)**
Married -0.2626 0.1055 0.4824 0.2168(0.0542)** (0.0655) (0.0717)** (0.0884)*
Catholic -0.068 -0.2944 -0.0545 0.0501(0.0577) (0.0601)** (0.0535) (0.1203)
Doctors&nurses -0.0178 -0.0292 -0.027 -0.029(0.0036)** (0.0035)** (0.0037)** (0.0051)**
Constant 2.984 2.984 2.984 2.984 3.221 3.2113 2.7651 2.8175(0.007)** (0.007)** (0.006)** (0.005)** (0.0637)** (0.0663)** (0.0639)** (0.1140)**
Year fixed effects Yes Yes Yes Yes Yes Yes Yes YesArea fixed effects No State Micro-region AMC No State Micro-region AMCNumber of Areas 27 522 3659 27 522 3659
Observations 10,977 10,977 10,977 10,977 10,977 10,977 10,977 10,977R-squared 0.245 0.572 0.697 0.823 0.6275 0.6929 0.7629 0.8358
Standard errors in parentheses are corrected for clustering at the AMC level. * significant at 5%; ** significant at 1% AMC stands for Minimally Comparable Area and is a geographic aggregate slightly larger than a municipio. Each observation is a joint AMC-Census year. Reference year: 1970
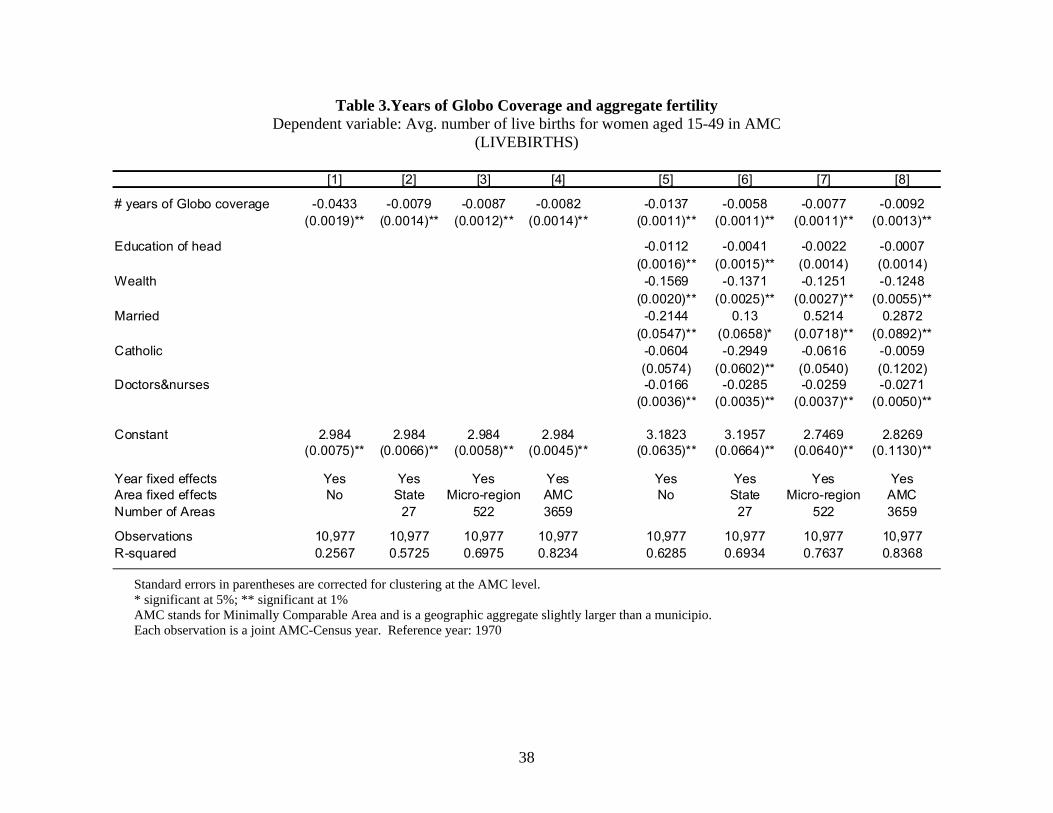
38
Table 3.Years of Globo Coverage and aggregate fertility Dependent variable: Avg. number of live births for women aged 15-49 in AMC
(LIVEBIRTHS)
[1] [2] [3] [4] [5] [6] [7] [8]
# years of Globo coverage -0.0433 -0.0079 -0.0087 -0.0082 -0.0137 -0.0058 -0.0077 -0.0092(0.0019)** (0.0014)** (0.0012)** (0.0014)** (0.0011)** (0.0011)** (0.0011)** (0.0013)**
Education of head -0.0112 -0.0041 -0.0022 -0.0007(0.0016)** (0.0015)** (0.0014) (0.0014)
Wealth -0.1569 -0.1371 -0.1251 -0.1248(0.0020)** (0.0025)** (0.0027)** (0.0055)**
Married -0.2144 0.13 0.5214 0.2872(0.0547)** (0.0658)* (0.0718)** (0.0892)**
Catholic -0.0604 -0.2949 -0.0616 -0.0059(0.0574) (0.0602)** (0.0540) (0.1202)
Doctors&nurses -0.0166 -0.0285 -0.0259 -0.0271(0.0036)** (0.0035)** (0.0037)** (0.0050)**
Constant 2.984 2.984 2.984 2.984 3.1823 3.1957 2.7469 2.8269(0.0075)** (0.0066)** (0.0058)** (0.0045)** (0.0635)** (0.0664)** (0.0640)** (0.1130)**
Year fixed effects Yes Yes Yes Yes Yes Yes Yes YesArea fixed effects No State Micro-region AMC No State Micro-region AMCNumber of Areas 27 522 3659 27 522 3659
Observations 10,977 10,977 10,977 10,977 10,977 10,977 10,977 10,977R-squared 0.2567 0.5725 0.6975 0.8234 0.6285 0.6934 0.7637 0.8368
Standard errors in parentheses are corrected for clustering at the AMC level. * significant at 5%; ** significant at 1% AMC stands for Minimally Comparable Area and is a geographic aggregate slightly larger than a municipio. Each observation is a joint AMC-Census year. Reference year: 1970
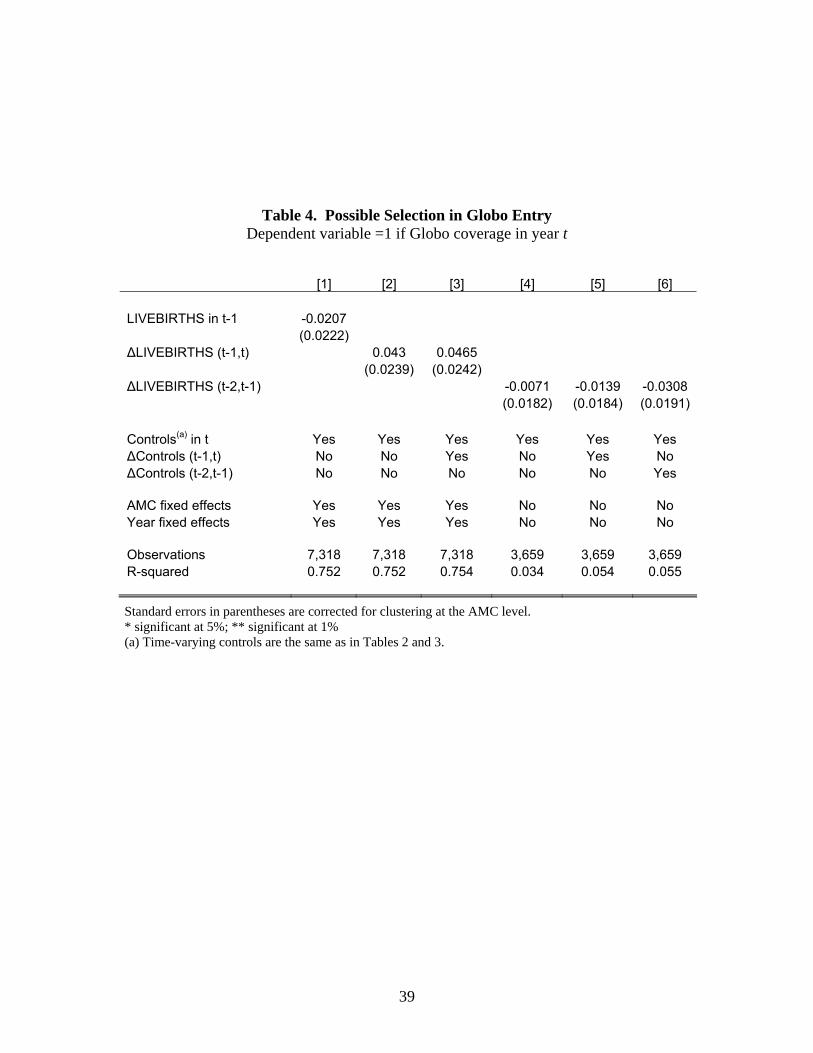
39
Table 4. Possible Selection in Globo Entry Dependent variable =1 if Globo coverage in year t
[1] [2] [3] [4] [5] [6] LIVEBIRTHS in t-1 -0.0207 (0.0222) ΔLIVEBIRTHS (t-1,t) 0.043 0.0465 (0.0239) (0.0242) ΔLIVEBIRTHS (t-2,t-1) -0.0071 -0.0139 -0.0308 (0.0182) (0.0184) (0.0191) Controls(a) in t Yes Yes Yes Yes Yes Yes ΔControls (t-1,t) No No Yes No Yes No ΔControls (t-2,t-1) No No No No No Yes AMC fixed effects Yes Yes Yes No No No Year fixed effects Yes Yes Yes No No No Observations 7,318 7,318 7,318 3,659 3,659 3,659 R-squared 0.752 0.752 0.754 0.034 0.054 0.055
Standard errors in parentheses are corrected for clustering at the AMC level. * significant at 5%; ** significant at 1% (a) Time-varying controls are the same as in Tables 2 and 3.

40
Table 5. Globo Coverage and Probability of Giving Birth, Individual Level (Dependent variable =1 if gives birth in year t (BIRTH)—Years 1980-1991)
[1] [2] [3] [4] [5] Globo coverage -0.006 -0.006 -0.0109 -0.0133 -0.005 (0.0015)** (0.0015)** (0.0016)** (0.0017)** (0.0015)** Globo coverage*Education of head 0.0013 (0.0002)** Globo coverage*Education of woman 0.0017 (0.0002)** Globo coverage*Wealth 0.0023 (0.0006)** Birth previous year -0.0255 -0.0253 -0.0255 -0.0254 -0.0255 (0.0018)** (0.0018)** (0.0019)** (0.0018)** (0.0018)**Age 0.0196 0.0201 0.0196 0.0201 0.0196 (0.0004)** (0.0004)** (0.0004)** (0.0004)** (0.0004)**Age sq.(a) -0.3753 -0.3856 -0.3747 -0.3847 -0.3751 (0.0087)** (0.0087)** (0.0087)** (0.0086)** (0.0087)**Stock of children 0.0035 0.0014 0.0035 0.0014 0.0035 (0.0007)** (0.0007)* (0.0007)** (0.0007)* (0.0007)**Stock of children sq.(a) -0.1535 -0.0382 -0.1567 -0.045 -0.155 (0.0377)** (0.0386) (0.0378)** (0.0385) (0.0377)**Education of head 0 -0.001 0 (0.0001) (0.0002)** (0.0001) Education of woman -0.003 -0.0044 (0.0001)** (0.0002)** Wealth -0.021 -0.0165 -0.0209 -0.0164 -0.0228 (0.0003)** (0.0004)** (0.0003)** (0.0004)** (0.0005)**Married 0.0607 0.0617 0.0608 0.0618 0.0608 (0.0012)** (0.0012)** (0.0012)** (0.0012)** (0.0012)**Catholic -0.0027 -0.0031 -0.0027 -0.0031 -0.0027 (0.0007)** (0.0006)** (0.0007)** (0.0006)** (0.0007)**Constant -0.1326 -0.1197 -0.1281 -0.1131 -0.1333 (0.0058)** (0.0054)** (0.0057)** (0.0056)** (0.0058)** Year fixed effects Yes Yes Yes Yes AMC fixed effects Yes Yes Yes Yes Observations 2,152,451 2,152,451 2,152,451 2,152,451 2,152,451 R-squared 0.050 0.051 0.050 0.051 0.050
Standard errors in parentheses are corrected for clustering at the AMC level. * significant at 5%; ** significant at 1% AMC stands for Minimally Comparable Area. Each observation is a woman in a given year. (a) Coefficient and standard error multiplied by 1,000.

41
Table 6. Age Effects, Individual Level (Dependent variable =1 if gives birth in year t (BIRTH)—Years 1980-1991)
Age range: 15-24 25-34 35-44 30-49 40-49 [1] [2] [3] [4] [5] Globo coverage -0.0019 -0.0107 -0.0065 (0.0017) (0.0029)** (0.0022)** Yrs exposed 10-19 -0.0033 (0.0009)** Yrs exposed 20-29 -0.004 -0.0083 (0.0006)** (0.0011)**Yrs exposed 30-39 -0.006 -0.0089 (0.0006)** (0.0008)**Yrs exposed 40-49 -0.0019 (0.0007)** Controls(a) Yes Yes Yes Yes Yes Year fixed effects Yes Yes Yes Yes Yes AMC fixed effects Yes Yes Yes Yes Yes Observations 2,152,451 2,152,451 2,152,451 1,169,142 609,812 R-squared 0.0511 0.0512 0.0512 0.0549 0.0636
Standard errors in parentheses are corrected for clustering at the AMC level. * significant at 5%; ** significant at 1% AMC stands for Minimally Comparable Area. Each observation is a woman in a given year. (a) Controls are the same as in col. 1 of Table 5.

42
Table 7. Placebo and Robustness
Panel A: Current fertility and future Globo entry (aggregate level) Dependent variable: Avg. number of live births in year t (LIVEBIRTHSt)(a) [1] [2] Globo coverage in t+1 -0.0162 -0.0423 (0.0290) (0.0282) Controls(b) in t No Yes AMC fixed effects Yes Yes Year fixed effects Yes Yes Observations 6526 6526 R-squared 0.828 0.842 Panel B: Subsamples (individual level) Dependent variable =1 if gives birth in year t (BIRTHt)
Sample: Women aged 45-
54 Migrants(c) [3] [4] Globo coverage -0.0016 (0.0009) Globo coverage in AMC of origin -0.0053 (0.0026)* Controls(d) Yes Yes AMC fixed effects Yes Yes Year fixed effects Yes Yes Observations 332124 421284 R-squared 0.028 0.048
Standard errors in parentheses are corrected for clustering at the AMC level. * significant at 5%; ** significant at 1% (a) Sample includes AMCs that do not have Globo coverage in year t. (b) Controls are the same as in col. 8 of Table 2. (c) Sample includes women who lived in AMC different from current residence in past 10 years. (d) Controls are the same as in col. 1 of Table 5.

43
Table 8. Naming Children after Novela Characters Panel A: Test of means
Mean of 95% Conf. Interval Difference of
means Obs. NAMESMATCH(a) Lower Upper (p-value) Globo coverage Yes 319 0.329 0.277 0.381 No 47 0.085 0.002 0.168 0.0003 Panel B: Multivariate regression Dependent variable: NAMESMATCH OLS coeff.(b) Marginal Probit coeff.(b) [1] [2] [3] [4] Globo coverage 0.244 0.2461 0.244 0.2456 (0.0566)** (0.0549)** (0.0566)** (0.0567)** Controls(c) No Yes No Yes Predicted P 0.287 0.284 R-squared 0.032 0.048 0.032 0.046 No. Obs. 366 366 366 366
Notes: (a) The variable NAMESMATCH is a dummy equal to 1 if any of the names of the three main characters of Globo novelas aired in 1994 appears among the top 20 names of children born that year. (b) Standard errors in parentheses are clustered by State (UF). * significant at 5%; ** significant at 1% (c) Controls are the same as in col. 8 of Table 2.

44
Table 9. Fertility and Other TV Networks
Dependent variable: Avg. Number of live births in AMC B=1 if gives birth in year t [1] [2] [3] [4] [5] [6] SBT coverage 0.0239 0.005 0.0705 0.0531 -0.0023 -0.0048 (0.0183) (0.0179) (0.0828) (0.0821) (0.0016) (0.0038) Controls(a) No Yes No Yes Yes Yes Year fixed effects Yes Yes Yes Yes Yes Yes Area fixed effects Yes Yes Yes Yes Yes Yes Sample Full Full Not covered Not covered Full Not covered by Globo by Globo by Globo Observations 10977 10977 6526 6526 2152451 394316 R-squared 0.823 0.836 0.828 0.842 0.050 0.061
Standard errors in parentheses are corrected for clustering at the AMC level. * significant at 5%; ** significant at 1% AMC stands for Minimally Comparable Area and is a geographic aggregate slightly larger than a municipio. Each observation in columns [1]-[4] is a joint AMC-Census year. In [5]-[6] it is a joint woman/year. (a) In columns [2] and [4], controls are the same used in col. 8 of Table 2. In columns [5]-[6], controls are the same used in col. 1 of Table 5.
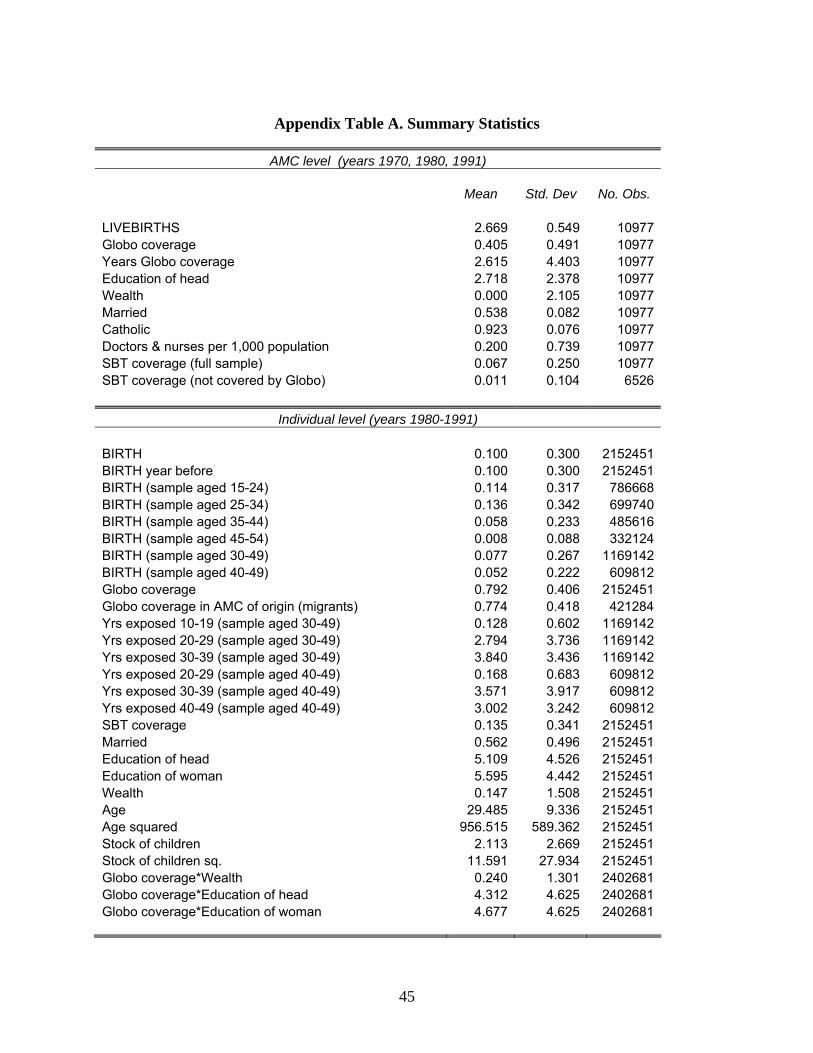
45
Appendix Table A. Summary Statistics
AMC level (years 1970, 1980, 1991)
Mean Std. Dev No. Obs. LIVEBIRTHS 2.669 0.549 10977 Globo coverage 0.405 0.491 10977 Years Globo coverage 2.615 4.403 10977 Education of head 2.718 2.378 10977 Wealth 0.000 2.105 10977 Married 0.538 0.082 10977 Catholic 0.923 0.076 10977 Doctors & nurses per 1,000 population 0.200 0.739 10977 SBT coverage (full sample) 0.067 0.250 10977 SBT coverage (not covered by Globo) 0.011 0.104 6526
Individual level (years 1980-1991) BIRTH 0.100 0.300 2152451 BIRTH year before 0.100 0.300 2152451 BIRTH (sample aged 15-24) 0.114 0.317 786668 BIRTH (sample aged 25-34) 0.136 0.342 699740 BIRTH (sample aged 35-44) 0.058 0.233 485616 BIRTH (sample aged 45-54) 0.008 0.088 332124 BIRTH (sample aged 30-49) 0.077 0.267 1169142 BIRTH (sample aged 40-49) 0.052 0.222 609812 Globo coverage 0.792 0.406 2152451 Globo coverage in AMC of origin (migrants) 0.774 0.418 421284 Yrs exposed 10-19 (sample aged 30-49) 0.128 0.602 1169142 Yrs exposed 20-29 (sample aged 30-49) 2.794 3.736 1169142 Yrs exposed 30-39 (sample aged 30-49) 3.840 3.436 1169142 Yrs exposed 20-29 (sample aged 40-49) 0.168 0.683 609812 Yrs exposed 30-39 (sample aged 40-49) 3.571 3.917 609812 Yrs exposed 40-49 (sample aged 40-49) 3.002 3.242 609812 SBT coverage 0.135 0.341 2152451 Married 0.562 0.496 2152451 Education of head 5.109 4.526 2152451 Education of woman 5.595 4.442 2152451 Wealth 0.147 1.508 2152451 Age 29.485 9.336 2152451 Age squared 956.515 589.362 2152451 Stock of children 2.113 2.669 2152451 Stock of children sq. 11.591 27.934 2152451 Globo coverage*Wealth 0.240 1.301 2402681 Globo coverage*Education of head 4.312 4.625 2402681 Globo coverage*Education of woman 4.677 4.625 2402681

46
Appendix Table A2. Globo Novelas in Sample Title Start date End date Title Start date End date rosinha do sobrado 3/8/1965 1/10/1965 final feliz 29/11/1982 4/6/1983 o sheik de agadir 18/7/1966 17/2/1967 louco amor 11/4/1983 21/10/1983 o rei dos ciganos 12/9/1966 20/2/1967 guerra dos sexos 6/6/1983 7/1/1984 a sombra de rebeca 21/2/1967 23/6/1967 champagne 24/10/1983 5/5/1984 anastacia, a mulher sem destino 28/6/1967 16/12/1967 transas caretas 9/1/1984 21/7/1984 sangue e areia 18/12/1967 25/7/1968 partido alto 7/5/1984 24/11/1984 a grande mentira 5/6/1968 4/7/1969 vereda tropical 23/7/1984 2/2/1985 passo dos ventos 26/6/1968 1/1/1969 corpo a corpo 26/11/1984 21/6/1985 rosa rebelde 15/1/1969 13/10/1969 um sonho a mais 4/2/1985 2/8/1985 a cabana do pai tomas 7/7/1969 1/3/1970 roque santeiro 24/6/1985 22/2/1986 veu de noiva 10/11/1969 29/6/1970 ti ti ti 5/8/1985 8/3/1986 pigmaliao 70 2/3/1970 24/10/1970 cambalacho 10/3/1986 4/10/1986 irmaos coragem 29/6/1970 15/7/1971 roda de fogo 25/8/1986 21/3/1987 a prossima atracao 26/10/1970 18/4/1971 hipertensao 6/10/1986 18/4/1987 minha doce namorada 19/4/1971 25/1/1972 o outro 23/3/1987 10/10/1987 o homen que deve morrer 16/7/1971 11/4/1972 brega e chique 20/4/1987 7/11/1987 o primeiro amor 24/1/1972 17/10/1972 mandala 12/10/1987 14/5/1988 selva de pedra 12/4/1972 23/1/1973 sassaricando 9/11/1987 11/6/1988 uma rosa com amor 18/10/1972 3/7/1973 vale tudo 16/5/1988 6/1/1989 cavalo de aço 24/1/1973 21/8/1973 bebe a bordo 13/6/1988 11/2/1989 o bem amado 24/1/1973 9/10/1973 o salvador da patria 9/1/1989 12/8/1989 carinhoso 4/7/1973 22/1/1974 que rei sou eu 13/2/1989 16/9/1989 o semi deus 22/8/1973 7/5/1974 tieta 14/8/1989 31/3/1990 super manoela 21/1/1974 2/7/1974 top model 18/9/1989 5/5/1990 fogo sobre a terra 8/5/1974 4/1/1975 rainha da sucata 2/4/1990 26/10/1990 corrida do ouro 3/7/1974 25/1/1975 mico preto 7/5/1990 1/12/1990 escalada 6/1/1975 26/8/1975 meu bem meu mal 29/10/1990 18/5/1991 cuca legal 27/1/1975 13/6/1975 lua cheia de amor 3/12/1990 13/7/1991 gabriela 14/4/1975 24/10/1975 o dono do mundo 20/5/1991 4/1/1992 bravo 16/6/1975 31/1/1976 vamp 15/7/1991 8/2/1992 pecado capital 24/11/1975 5/6/1976 pedra sobre pedra 6/1/1992 31/7/1992 anjo mau 2/2/1976 24/8/1976 perigosas peruas 10/2/1992 29/8/1992 o casarao 7/6/1976 11/12/1976 de corpo e alma 3/8/1992 6/3/1993 estupido cupido 25/8/1976 28/2/1977 deus nos acuda 31/8/1992 27/3/1993 escrava isaura 11/10/1976 5/2/1977 renascer 8/3/1993 13/11/1993 duas vidas 13/12/1976 13/6/1977 o mapa da mina 29/3/1993 4/9/1993 locomotiva 1/3/1977 12/9/1977 olho no olho 6/9/1993 9/4/1994 espelho magico 14/6/1977 5/12/1977 fera ferida 15/12/1993 16/7/1994 sem lenço sem documento 13/9/1977 4/3/1978 a viajem 11/4/1994 22/10/1994 o astro 6/12/1977 8/7/1978 patria minha 18/7/1994 10/3/1995 te contei? 6/3/1978 2/9/1978 quatro por quatro 24/10/1994 22/7/1995 dancin' days 10/7/1978 27/1/1979 a proxima vitima 13/3/1995 4/11/1995 pecado rasgado 4/9/1978 17/3/1979 cara & coroa 24/7/1995 30/3/1996 pai heroi 29/1/1979 18/8/1979 explode coraçao 6/12/1995 4/5/1996
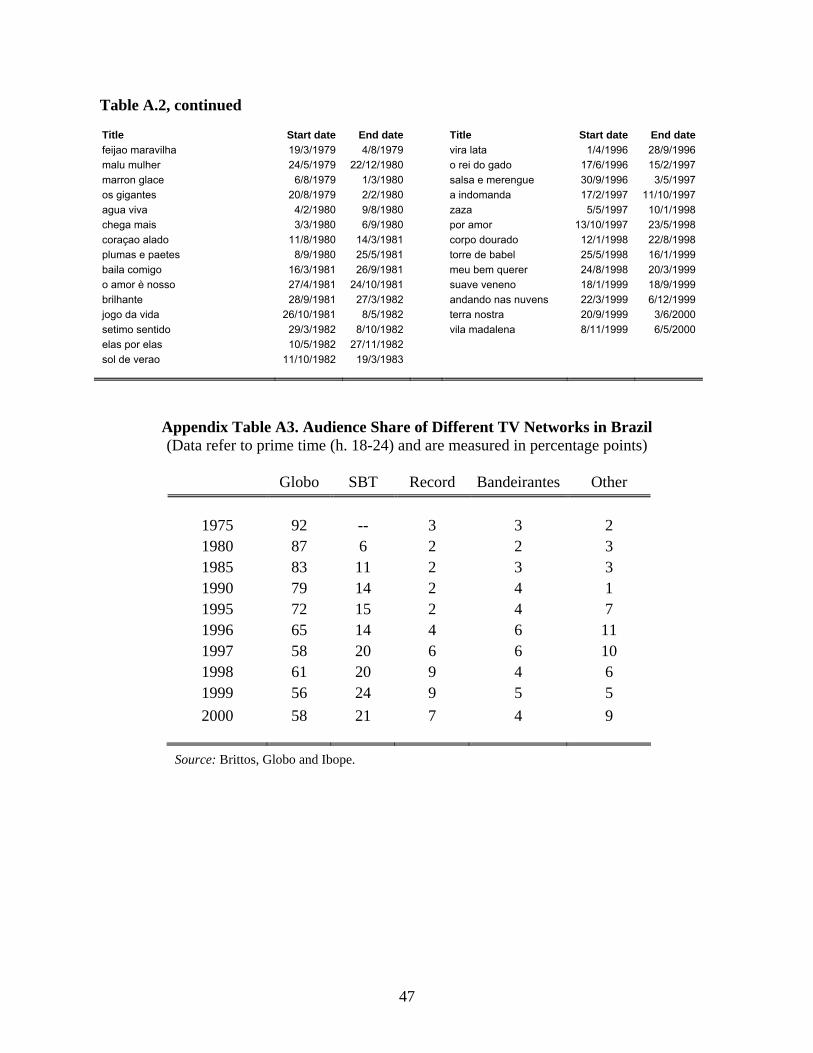
47
Table A.2, continued
Title Start date End date Title Start date End date feijao maravilha 19/3/1979 4/8/1979 vira lata 1/4/1996 28/9/1996 malu mulher 24/5/1979 22/12/1980 o rei do gado 17/6/1996 15/2/1997 marron glace 6/8/1979 1/3/1980 salsa e merengue 30/9/1996 3/5/1997 os gigantes 20/8/1979 2/2/1980 a indomanda 17/2/1997 11/10/1997 agua viva 4/2/1980 9/8/1980 zaza 5/5/1997 10/1/1998 chega mais 3/3/1980 6/9/1980 por amor 13/10/1997 23/5/1998 coraçao alado 11/8/1980 14/3/1981 corpo dourado 12/1/1998 22/8/1998 plumas e paetes 8/9/1980 25/5/1981 torre de babel 25/5/1998 16/1/1999 baila comigo 16/3/1981 26/9/1981 meu bem querer 24/8/1998 20/3/1999 o amor è nosso 27/4/1981 24/10/1981 suave veneno 18/1/1999 18/9/1999 brilhante 28/9/1981 27/3/1982 andando nas nuvens 22/3/1999 6/12/1999 jogo da vida 26/10/1981 8/5/1982 terra nostra 20/9/1999 3/6/2000 setimo sentido 29/3/1982 8/10/1982 vila madalena 8/11/1999 6/5/2000 elas por elas 10/5/1982 27/11/1982 sol de verao 11/10/1982 19/3/1983
Appendix Table A3. Audience Share of Different TV Networks in Brazil (Data refer to prime time (h. 18-24) and are measured in percentage points)
Globo SBT Record Bandeirantes Other
1975 92 -- 3 3 2 1980 87 6 2 2 3 1985 83 11 2 3 3 1990 79 14 2 4 1 1995 72 15 2 4 7 1996 65 14 4 6 11 1997 58 20 6 6 10 1998 61 20 9 4 6 1999 56 24 9 5 5 2000 58 21 7 4 9
Source: Brittos, Globo and Ibope.