Deep Sequencing the MicroRNA Transcriptome in Colorectal Cancer
Upload
independentCategory
view
0download
0
Novel Tools for Conservation Genomics: Comparing TwoHigh-Throughput Approaches for SNP Discovery in theTranscriptome of the European HakeIlaria Milano1*, Massimiliano Babbucci2, Frank Panitz3, Rob Ogden4, Rasmus O. Nielsen3, Martin I.
Taylor5, Sarah J. Helyar5, Gary R. Carvalho5, Montserrat Espineira6, Miroslava Atanassova6, Fausto
Tinti1, Gregory E. Maes7, Tomaso Patarnello2, FishPopTrace Consortium, Luca Bargelloni2
1 Department of Experimental and Evolutionary Biology, University of Bologna, Bologna, Italy, 2 Department of Public Health, Comparative Pathology, and Veterinary
Hygiene, University of Padova, Legnaro, Italy, 3 Department of Molecular Biology and Genetics, Faculty of Science and Technology, Aarhus University, Tjele, Denmark,
4 TRACE Wildlife Forensics Network, Royal Zoological Society of Scotland, Edinburgh, United Kingdom, 5 Molecular Ecology and Fisheries Genetics Laboratory (MEFGL),
School of Biological Sciences, Environment Centre Wales, University of Bangor, Bangor, Gwynedd, United Kingdom, 6 ANFACO-CECOPECSA, Vigo, Spain, 7 Laboratory of
Animal Diversity and Systematics, Katholieke Universiteit Leuven, Leuven, Belgium
Abstract
The growing accessibility to genomic resources using next-generation sequencing (NGS) technologies has revolutionizedthe application of molecular genetic tools to ecology and evolutionary studies in non-model organisms. Here we presentthe case study of the European hake (Merluccius merluccius), one of the most important demersal resources of Europeanfisheries. Two sequencing platforms, the Roche 454 FLX (454) and the Illumina Genome Analyzer (GAII), were used for SingleNucleotide Polymorphisms (SNPs) discovery in the hake muscle transcriptome. De novo transcriptome assembly into uniquecontigs, annotation, and in silico SNP detection were carried out in parallel for 454 and GAII sequence data. High-throughput genotyping using the Illumina GoldenGate assay was performed for validating 1,536 putative SNPs. Validationresults were analysed to compare the performances of 454 and GAII methods and to evaluate the role of several variables(e.g. sequencing depth, intron-exon structure, sequence quality and annotation). Despite well-known differences insequence length and throughput, the two approaches showed similar assay conversion rates (approximately 43%) andpercentages of polymorphic loci (67.5% and 63.3% for GAII and 454, respectively). Both NGS platforms thereforedemonstrated to be suitable for large scale identification of SNPs in transcribed regions of non-model species, although thelack of a reference genome profoundly affects the genotyping success rate. The overall efficiency, however, can beimproved using strict quality and filtering criteria for SNP selection (sequence quality, intron-exon structure, target regionscore).
Citation: Milano I, Babbucci M, Panitz F, Ogden R, Nielsen RO, et al. (2011) Novel Tools for Conservation Genomics: Comparing Two High-ThroughputApproaches for SNP Discovery in the Transcriptome of the European Hake. PLoS ONE 6(11): e28008. doi:10.1371/journal.pone.0028008
Editor: Zhanjiang Liu, Auburn University, United States of America
Received June 29, 2011; Accepted October 29, 2011; Published November 22, 2011
Copyright: � 2011 Milano et al. This is an open-access article distributed under the terms of the Creative Commons Attribution License, which permitsunrestricted use, distribution, and reproduction in any medium, provided the original author and source are credited.
Funding: The research leading to these results has received funding from the European Community’s Seventh Framework Programme (FP7/2007–2013) undergrant agreement nu KBBE-212399 (FishPopTrace). Financial support for GAII sequencing and SNP discovery was provided by the MerSnip project funded by theJoint Research Council (JRC). The funders had no role in study design, data collection and analysis, decision to publish, or preparation of the manuscript.
Competing Interests: The authors have declared that no competing interests exist.
* E-mail: [email protected]
Introduction
The European hake (Merluccius merluccius, Linnaeus, 1758;
Merlucciidae, Actinopterygii) is a widely distributed species
inhabiting the North-Eastern Atlantic Ocean and the Mediterra-
nean Sea, whose respective stocks are managed by the Interna-
tional Council for the Exploration of the Seas (ICES) and the
General Fisheries Commission for the Mediterranean (GFCM). It
represents one of the most important demersal target species of
Western European and Mediterranean commercial fisheries [1,2].
According to the FAO report on 2008 fishery statistics [3],
European hake ranks first within Mediterranean and among the
ten top demersal fish species in North-East Atlantic in terms of
catches, and at present stocks are under heavy exploitation and
rebuilding action plans [4,5]. Despite its relevance as a fishery
resource and growing concerns on fishery stock sustainability,
population structure and management units of European hake are
only roughly defined and poorly supported by fishery-independent
data, such as life-history traits and population genetics. At present,
three large stock units of European hake have been recognized in a
management framework, two in the North-Eastern Atlantic (i.e.
the Northern and Southern stocks which extend northward and
southward to the Cape Breton submarine canyon in the Bay of
Biscay, respectively) and one in the whole Mediterranean, from
the Gibraltar Strait to the Levantine Sea. Population genetic
structure assessed at six potentially neutral microsatellite loci
supported a distinction between Atlantic and Mediterranean
stocks [6,7], while the high connectivity and temporal variation
among Atlantic populations [6–10] questioned the separation
between Northern and Southern Atlantic stocks [11,12]. However,
the subtle genetic differentiation among population samples at the
neutral loci revealed a relatively weak population structure and
PLoS ONE | www.plosone.org 1 November 2011 | Volume 6 | Issue 11 | e28008
prevented the robust assignment of individual fish to the stock of
origin [7]. On the other hand, genetic loci potentially under
selection might be more efficient in detecting locally adapted
populations and associated potential management units for
conservation in marine fish [13,14]. In European hake populations
a significant correlation between the allele frequency variation at
the glyceraldehyde-3-phosphate dehydrogenase locus and the
latitudinal gradient in surface salinity has been previously detected
[15]. Identification of other genetic loci potentially under selection
might provide promising tools to resolve population structure and
traceability of this species at a smaller spatial scale.
Recently, major technological advances have opened innovative
opportunities in the application of molecular genetic tools to study
evolutionary processes in natural populations of marine species
[14,16]. The emergent field of population genomics [17] has
shown the potential of exploring genetic variation at a genome-
wide scale and offered the opportunity to gain insights into the
evolutionary mechanisms of adaptive divergence in the wild [18–
20]. The growing interest in developing genomic resources is due
mainly to the rapid development of next-generation sequencing
(NGS) technologies (see review by Metzker [21]), allowing the
production of massive volumes of data at relatively modest and
decreasing costs compared to the traditional Sanger sequencing
method. The opportunity to obtain extremely large collections of
expressed sequence tags (ESTs) at reduced cost, potentially
provides an unprecedented trove of genetic markers located in
functionally relevant regions of the genome [22–26]. Although
EST data mining has mainly been used so far to identify
microsatellite loci, the application of single nucleotide polymor-
phisms (SNPs) is rapidly catching up [27], because they are the
most abundant and widespread genetic variants in the eukaryote
genome, with great potential in ecological and evolutionary studies
[28,29]. Compared to microsatellites, SNPs show lower genotyp-
ing error rates, higher data quality and genomic coverage and low
probability of homoplasy [28], with the further advantage of easier
‘‘portability’’ of genotypic data across laboratories. A major benefit
of utilizing SNP markers associated with transcribed regions of the
genome concerns the prospect of identifying outlier genetic
markers, showing significantly increased or decreased differentia-
tion among populations compared to neutral expectations [17,30].
Outlier loci are presumed to be either directly linked or in tight
linkage disequilibrium with loci subject to natural selection
[19,31]. Scaling up the number of available EST-linked SNPs to
hundreds of thousands of markers extends the genome-coverage,
thereby increasing the probability of identifying loci under
selection, and associated insights into population structuring and
its determinants [32].
The growing accessibility to high-throughput sequencing
technologies and the concurrent development of innovative
bioinformatics tools has enabled the application of wide-scale
SNP discovery based on transcriptome sequencing even in species
for which genomic resources are still limited or absent [25,26,33–
37]. Recently, several studies concerning fish species relevant to
fishery and aquaculture, such as rainbow trout [38], lake sturgeon
[39], lake whitefish [40], sockeye salmon [41], catfish [42] and
turbot [43] have successfully used this approach. However,
experimental evidence on large scale validation of in silico-
identified SNPs is still limited and restricted to EST data sets
obtained with traditional Sanger sequencing [44,45].
The present study reports the muscle transcriptome character-
ization and the discovery and validation of a large set of SNP loci
for European hake, based on NGS technologies. Existing NGS
technologies provide a variety of approaches for transcriptome
characterization, although the two most popular platforms are the
Roche 454 FLX [46] and the Illumina Genome Analyzer [47,48].
The Roche 454 FLX (hereafter 454) is capable of generating one
hundred million nucleotides per run, producing sequences of
length approaching 400 base pairs (bp) with an average
substitution error rate that is relatively low with respect to other
sequencing technologies. The alternative leading sequencing
system, the Illumina Genome Analyzer (hereafter GAII) produces
shorter reads, currently up to 150 bp, with higher average
substitution error rates but much higher throughput and lower
costs [48]. As longer reads facilitate de novo assembly most
published studies on transcriptome sequencing of non-model
organism have to date used the Roche 454 pyrosequencing
platform; however current advances in bioinformatics have
allowed the assembly of shorter reads without reference genome
or transcriptome [41,49]. Using the European hake as a case study
for non-model species, these two approaches (454 and GAII) were
applied in parallel to high-throughput SNP discovery in expressed
sequences. Large scale (1,536 SNPs) validation of discovered
markers was carried out to properly evaluate and compare their
performance. The ultimate goal was to test whether an optimal
and cost effective strategy exists to develop a broad set of SNP
markers linked to functional loci to be used for improved genetic
management of hake fisheries.
Materials and Methods
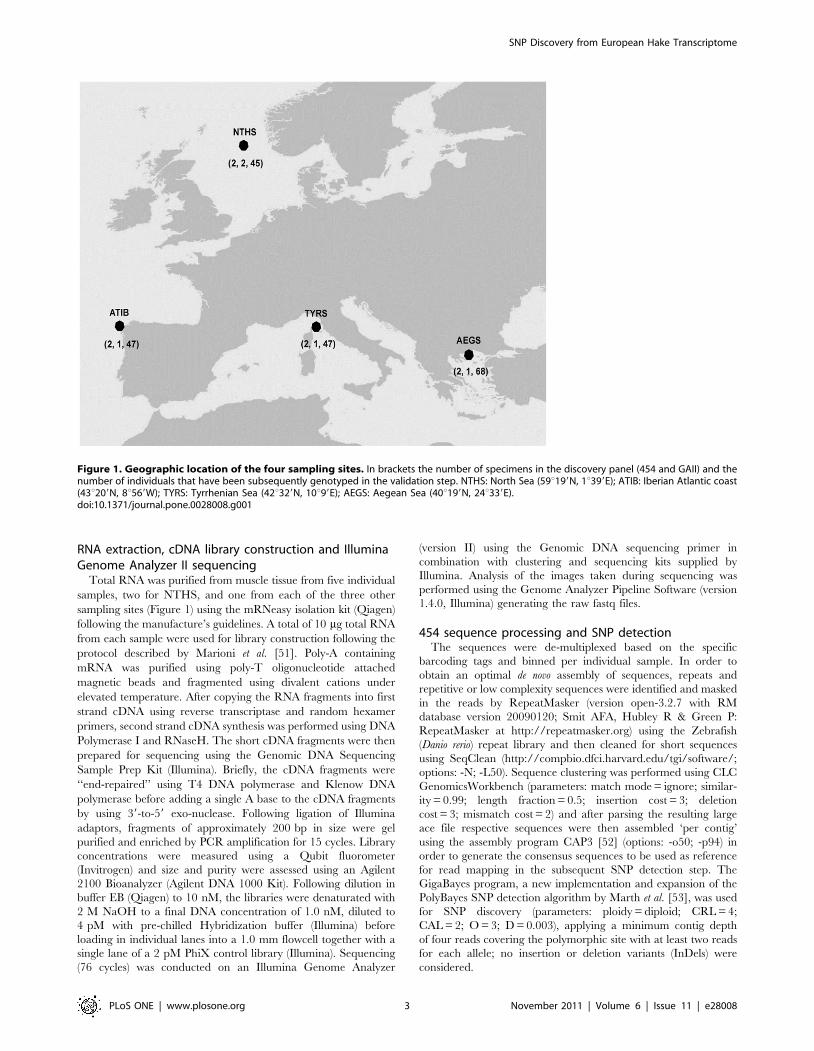
Samples for cDNA librariesMuscle tissue samples for transcriptome sequencing were
collected from four geographic regions (Figure 1) considered
representative for the species range: two locations in the
Mediterranean Sea (Aegean Sea and North Tyrrhenian, hereafter
respectively AEGS and TYRS), and two in the Atlantic Ocean
(North Sea and Iberian Atlantic coast, hereafter NTHS and ATIB,
respectively). Animals used in this research were obtained from
commercial fishery catches, therefore approval from any ethics
committee or institutional review board was not necessary. Muscle
tissues were stored in RNA later (Qiagen) at 280uC before RNA
extraction. Two distinct non-normalized cDNA libraries were
constructed and sequenced using 454 and GAII sequencing
systems, following the methods described in detail below. Non-
normalized library were used since, according to Hale et al. [39],
cDNA libraries normalization has little impact on discovery of rare
transcripts when NGS platform are used, due to the depth of
sequencing coverage.
RNA extraction, cDNA library construction and 454 GSFLX sequencing
Total mRNA was obtained from eight individuals (two for each
sampling location, Figure 1) using the RNeasy Lipid Tissue Mini
Kit (Qiagen). mRNA was isolated using the Oligotex mRNA Mini
Kit (Qiagen) and cDNA was synthesized using the SuperScript
Double-stranded cDNA Synthesis Kit (Invitrogen). Due to the low
amount of available cDNA compared to that specified in standard
protocol for the preparation of a GS FLX sequencing library using
Roche multiplex identifiers (MIDs), it was decided to use a
customized barcoding protocol, modified from Binladen et al. [50],
that allows smaller amounts of cDNA to be used for library
preparation: a multiplex sequencing library was prepared by
labeling each individual sample with two tags by ligation of specific
10-mer barcoding oligonucleotides to allow post-sequencing
identification of sequences from the different samples. High-
throughput sequencing was performed on a Roche 454 GS FLX
(454) sequencer according to the manufacturer’s protocol.
SNP Discovery from European Hake Transcriptome
PLoS ONE | www.plosone.org 2 November 2011 | Volume 6 | Issue 11 | e28008
RNA extraction, cDNA library construction and IlluminaGenome Analyzer II sequencing
Total RNA was purified from muscle tissue from five individual
samples, two for NTHS, and one from each of the three other
sampling sites (Figure 1) using the mRNeasy isolation kit (Qiagen)
following the manufacture’s guidelines. A total of 10 mg total RNA
from each sample were used for library construction following the
protocol described by Marioni et al. [51]. Poly-A containing
mRNA was purified using poly-T oligonucleotide attached
magnetic beads and fragmented using divalent cations under
elevated temperature. After copying the RNA fragments into first
strand cDNA using reverse transcriptase and random hexamer
primers, second strand cDNA synthesis was performed using DNA
Polymerase I and RNaseH. The short cDNA fragments were then
prepared for sequencing using the Genomic DNA Sequencing
Sample Prep Kit (Illumina). Briefly, the cDNA fragments were
‘‘end-repaired’’ using T4 DNA polymerase and Klenow DNA
polymerase before adding a single A base to the cDNA fragments
by using 39-to-59 exo-nuclease. Following ligation of Illumina
adaptors, fragments of approximately 200 bp in size were gel
purified and enriched by PCR amplification for 15 cycles. Library
concentrations were measured using a Qubit fluorometer
(Invitrogen) and size and purity were assessed using an Agilent
2100 Bioanalyzer (Agilent DNA 1000 Kit). Following dilution in
buffer EB (Qiagen) to 10 nM, the libraries were denaturated with
2 M NaOH to a final DNA concentration of 1.0 nM, diluted to
4 pM with pre-chilled Hybridization buffer (Illumina) before
loading in individual lanes into a 1.0 mm flowcell together with a
single lane of a 2 pM PhiX control library (Illumina). Sequencing
(76 cycles) was conducted on an Illumina Genome Analyzer
(version II) using the Genomic DNA sequencing primer in
combination with clustering and sequencing kits supplied by
Illumina. Analysis of the images taken during sequencing was
performed using the Genome Analyzer Pipeline Software (version
1.4.0, Illumina) generating the raw fastq files.
454 sequence processing and SNP detectionThe sequences were de-multiplexed based on the specific
barcoding tags and binned per individual sample. In order to
obtain an optimal de novo assembly of sequences, repeats and
repetitive or low complexity sequences were identified and masked
in the reads by RepeatMasker (version open-3.2.7 with RM
database version 20090120; Smit AFA, Hubley R & Green P:
RepeatMasker at http://repeatmasker.org) using the Zebrafish
(Danio rerio) repeat library and then cleaned for short sequences
using SeqClean (http://compbio.dfci.harvard.edu/tgi/software/;
options: -N; -L50). Sequence clustering was performed using CLC
GenomicsWorkbench (parameters: match mode = ignore; similar-
ity = 0.99; length fraction = 0.5; insertion cost = 3; deletion
cost = 3; mismatch cost = 2) and after parsing the resulting large
ace file respective sequences were then assembled ‘per contig’
using the assembly program CAP3 [52] (options: -o50; -p94) in
order to generate the consensus sequences to be used as reference
for read mapping in the subsequent SNP detection step. The
GigaBayes program, a new implementation and expansion of the
PolyBayes SNP detection algorithm by Marth et al. [53], was used
for SNP discovery (parameters: ploidy = diploid; CRL = 4;
CAL = 2; O = 3; D = 0.003), applying a minimum contig depth
of four reads covering the polymorphic site with at least two reads
for each allele; no insertion or deletion variants (InDels) were
considered.
Figure 1. Geographic location of the four sampling sites. In brackets the number of specimens in the discovery panel (454 and GAII) and thenumber of individuals that have been subsequently genotyped in the validation step. NTHS: North Sea (59u199N, 1u399E); ATIB: Iberian Atlantic coast(43u209N, 8u569W); TYRS: Tyrrhenian Sea (42u329N, 10u99E); AEGS: Aegean Sea (40u199N, 24u339E).doi:10.1371/journal.pone.0028008.g001
SNP Discovery from European Hake Transcriptome
PLoS ONE | www.plosone.org 3 November 2011 | Volume 6 | Issue 11 | e28008
GAII sequence processing and SNP detectionAfter renaming and trimming of the first base, GAII short reads
were assembled de novo using Abyss [54,55]. Different settings were
tested and the final assembly was run using a k-mer value of 65.
Contig trimming and exclusion of sequences shorter than 100 bp
was performed by Seqclean (http://compbio.dfci.harvard.edu/
tgi/software/; l = 100). MosaikBuild was used to build a database
of reads (options: -st illumina, -tp 1, -ts 1) and MosaikAligner was
applied (options: -mmp 0.05, -mm 12, unique, -act 35) to map the
reads (database) against the Abyss contigs. After running
MosaikSort the MosaikAssembler was used to generate the (.gig)
input files for the SNP detection by GigaBayes (options: gff,
diploid, multiple, CRL 10, CAL 4, D 0.003).
Contig functional annotation and Gene Ontologyanalyses
In order to characterize 454 and GAII contigs several
approaches were explored, using the Basic Local Alignment
Search Tool (BLAST) against various protein and nucleotide
databases. The Blastn option was used against the NCBI
nucleotide database (cut-off e-value of ,1.0 E25), against all
annotated transcripts in the draft genomes of Danio rerio, Gasterosteus
aculeatus, Oryzias latipes, Takifugu rubripes, Tetraodon nigroviridis, and
Homo sapiens available at the Ensembl Genome Browser, and
against all unique transcripts for D. rerio, H. sapiens, O. latipes, T.
rubripes, Salmo salar, Oncorhynchus mykiss stored in the NCBI
UniGene databases. The Blastx option was used (cut-off e-value
of ,1.0 E23) to search against the entire UniProtKB/SwissProt
and UniProtKB/TrEMBL protein databases as well as against the
annotated proteins from the transcriptomes of D. rerio, G. aculeatus,
O. latipes, T. rubripes, T. nigroviridis, and H. sapiens available through
the Ensembl Genome Browser.
The Gene Ontology (GO) terms (‘‘Cellular Component’’,
‘‘Biological Process’’ and ‘‘Molecular Function’’) were recovered
using the Blastx search tool implemented in the software
Blast2GO [56] against the NCBI non-redundant protein database.
A pipeline was developed to characterize the SNP mutations at
the amino acid level. To obtain the putative reading frame all
SNP-containing contigs were compared against six peptide
sequence databases (Ensembl genome assembly for G. aculeatus,
T. nigroviridis, O. latipes, T. rubripes, D. rerio and Swissprot database)
using the Blastx algorithm (cut-off e-value of ,1.0 E23). The best
match was selected and the aligned sequence portions of the query
were saved as fasta files and then formatted as a Blast database. A
fasta file containing 120 bp SNP-flanking sequences was prepared
(two sequences for both alleles of each SNP) and a Blastx analysis
was performed against the previously formatted database (cut-off
e-value of ,1.0 E210). The aligned sequence portion of the two
alleles for each SNP was compared for the presence of a
synonymous or not-synonymous mutation.
To evaluate whether SNP-containing contigs were significantly
enriched for specific GO terms compared to all annotated hake
contigs, the Gossip package [57], which is integrated in the
Blast2Go software, was used. Statistical assessment of annotation
differences between the two sets of sequences (SNP-containing
contigs vs all hake contigs) was carried out using Fisher’s Exact
Test with False Discovery Rate (FDR) correction for multiple
testing.
Candidate SNP selectionAfter SNP detection, in silico evaluation of candidate SNPs was
carried out to select a panel of 1,536 candidate SNPs for high-
throughput genotyping validation. Selection criteria were based on
the score assigned by the Illumina GoldenGate Assay Design Tool
(ADT), the analysis of putative intron-exon boundaries within each
contig, and visual inspection of flanking region sequence quality.
SNP scores obtained with the ADT take into consideration
template GC content, melting temperature, uniqueness, and
tendency to form hairpin loops. All SNPs with ADT scores below
0.4 were discarded, while SNPs with an ADT score higher than
0.7 were preferentially selected.
Intron-exon boundary prediction was performed using fish
genome and transcriptome sequence resources following two
parallel approaches. In the first, SNP-containing contigs were
compared against five high-quality draft fish genomes (Ensembl
genome assemblies for G. aculeatus, T. nigroviridis, O. latipes, T.
rubripes, and D. rerio) using Blastn (cut-off e-value of ,1.0 E25).
After parsing Blast results, the best match was listed including
information on alignment length, as well as the start and end of the
aligned region. In the case of a positive match, the position of the
candidate SNP was evaluated in the framework of the aligned
region. If the 60 bp up- and downstream of the SNP position were
present in the alignment, the candidate SNP was considered
embedded in a single exon, otherwise an intron was assumed to be
present in the 121 bp target region for SNP assay design. The
same process was repeated against five different databases (see
above) and each SNP was assigned a code, either ‘‘1’’ (when in at
least one comparison the candidate SNP and its flanking regions
were located on a single exon), ‘‘0’’ (an intron was predicted to
disrupt the candidate region), or ‘‘no’’ (no significant match
against any of the five reference fish genomes). The second
approach was designed in order to further increase the likelihood
of a positive match and the reliability of intron-exon boundary
prediction. SNP-containing contigs were used as a query in a Blast
search (Blastn option, cut-off e-value of ,1.0 E25) against the
transcriptome of each of the five model species as above. In the
case of a positive hit, the matching transcript for each fish model
species was downloaded from the Ensembl database, and the
nucleotide position in the downloaded sequence corresponding to
the candidate SNP in the original hake contig was identified based
on the start-end positions of the Blast alignment between the hake
contig and the fish model transcript. Then the putative homolog
transcript was compared to its own genome sequence using Blast.
Based on the inferred SNP position on the fish model transcript,
SNPs were assigned a code as above (‘‘1’’ for SNP candidate
region located on a single exon or ‘‘0’’ if SNP region was assumed
to be disrupted by an intron). In the case of no matches between
the original hake contig and any of the five fish transcriptomes, the
SNP was scored ‘‘no’’. A flowchart for the intron-exon pipeline is
depicted in Figure S3.
A final evaluation step of putative SNPs was performed by
direct visual inspection of contigs using the assembly viewer
software Eagleview [58] and Cluster Viewer (clview; http://
compbio.dfci.harvard.edu/tgi/software/), with the aim of ranking
candidates within each contig by integrating information on the
overall contig assembly quality, depth and length, the quality of
flanking regions (number of ambiguous sites), distance and
clustering of polymorphic sites. SNPs with highest rank values
were selected within each contig.
SNP validation by high-throughput genotypingA total of 1,536 candidate SNPs were selected to be validated by
high-throughput genotyping. Genomic DNA was extracted from
fin clip tissues of 207 individuals sampled from the same four
locations of origin of specimens used to derive the libraries (AEGS,
TYRS, ATIB, NTHS, see Figure 1). A NanoDrop spectro-
photomer was used to ascertain that DNA quality and quantity
SNP Discovery from European Hake Transcriptome
PLoS ONE | www.plosone.org 4 November 2011 | Volume 6 | Issue 11 | e28008
met the requirements for the genotyping assay. Genotyping was
performed using the Illumina GoldenGate Assay platform [59]
and the resulting data were visualized and analyzed with the
GenomeStudio Data Analysis Software package (1.0.2.20706,
Illumina Inc.). Samples with a call rate lower than 0.8 and loci
showing poor clustering were excluded. Accepted SNPs were
manually re-clustered, to correct errors in allele calling due to
inappropriate cluster identification.
Statistical analysisDifferent variables were defined to analyze results of SNP
discovery and genotyping. The first two are categorical variables
that refer to the outcome of individual SNP assays. SNP_assay_-
conversion assumes value 0 (failed) if Illumina SNP assay did not
yield a reliable genotype for the examined individuals, either
because no clear clustering was observed or due to lack of signal,
value 1 (successful) if consistent clustering was obtained,
irrespective of the observed genotype(s). SNP_genotype has value 0
(monomorphic) if all scored individuals are homozygous for the
same allele, value 1 (polymorphic) if two alleles are observed.
SNP_score reports ADT score for individual SNPs. I_E_test and
I_E_species_match refer to the outcome of the intron-exon boundary
analysis pipeline, I_E_test = ‘‘no’’ means no significant match could
be obtained, value 1 signifies that at least one significant match
was reported, with the SNP candidate region putatively contained
in a single exonic region, while I_E_species_match counts the
number of fish model species showing a significant Blast match.
Depth is a quantitative variable reporting the number of sequence
reads supporting individual SNPs, Individuals and Geosites counts
respectively the number of individuals and geographical sites from
the original discovery panel that contributed with at least one
sequence read to a specific SNP. MSAF (minor sequencing allele
frequency) represents the frequency of the minor allele detected at
the SNP discovery stage. Rank is an ordinal variable referring to an
order of choice of SNPs within each contig, arbitrarily assigned
after a visual inspection (see above). Q reports the number of
mismatches in the flanking regions of SNP positions based on
comparison of sequence reads within a contig. SNP discovery
results obtained using 454 sequencing technology were compared
with those produced through GAII sequencing using either
parametric T-tests for two independent samples (for quantitative,
normally distributed variables: Contig length, Depth) or non-
parametric tests, a x2 test for categorical variables (SNP_assay_-
conversion, SNP_genotype, I_E_test) and a Mann-Whitney U test for
ordinal variables (I_E_species_match, Geosites) or quantitative
variables not following a normal distribution (SNP_score, MSAF).
All tests were carried out in SPSS ver. 12.0 with Monte Carlo
simulation (1,000,000 permutations) to estimate confidence
intervals for Mann-Whitney tests.
Binomial logistic regression, implemented in SPSS ver. 12.0,
was used to evaluate several predictor variables on two dependent
dichotomous variables: SNP_assay_conversion and SNP_genotype. For
both data sets (GAII and 454), positive conversion/clustering of
individual SNP assay was analyzed first, assigning single SNPs into
two classes (successful-failed). Second, DNA polymorphism was
evaluated by filtering out failed SNPs and dividing positive loci
respectively into two groups based on observed genotypes
(polymorphic-monomorphic, SNP_genotype). For 454 data, eight
ordinal/quantitative variables (SNP_score, I_E_species_match, Depth,
MSAF, Individuals, Geosites, Q, Rank) and one categorical variable
(I_E_test) were considered. For GAII data, six ordinal/quantitative
variables (SNP_score, I_E_species_match, Depth, MSAF, Individuals,
Geosites) and one categorical variable (I_E_test) were examined.
Predictor variables were either all included in the predicting model
(option ‘‘enter’’ in SPSS) or best predictors were selected using a
stepwise deletion approach (option ‘‘backward’’). In the latter
approach, the Wald x2 statistic was used to estimate the
contribution of each predictor.
The Receiver Operating Characteristic (ROC) curve, a widely
used method for evaluating the discriminating power of a
diagnostic test, was used to assess the significance of specific
variables. ROC analysis was implemented in MedCalc ver.
11.5.1.0.
Results and Discussion
Sequencing, de novo assembly, and annotationApproximately 100 Mega base pairs (Mbp) were obtained using
454 sequencing technology, whereas nearly 4,000 Mbp were
produced using the GAII sequencer (Table 1). About 6% (30,025)
of raw 454 reads, in which no barcoding tag could be reliably
recognized, were excluded from further analysis, as individual
sample identity of the reads was considered essential to the
validation process. The remaining 476,747 reads, which showed
the 59 barcoding tag, were assigned to four groups according to
geographic origin (Figure 1, 102,854 for AEGS, 135,494 for
TYRS, 97,207 for NTHS, and 141,192 for ATIB). GAII
sequencing yielded 8,789,024, 10,327,499, and 10,029,014 reads
from single individuals from AEGS, TYRS, and ATIB respec-
tively, while 21,539,868 sequences were obtained from two distinct
individuals from NTHS. All 454 and GAII sequence data have
been submitted to the EBI Sequence Read Archive (SRA) under
the study accession number ERP000950 (http://www.ebi.ac.uk/
ena/data/view/ERP000950).
After pre-processing steps (adaptor clipping and read quality
filtering), 462,489 454 reads were assembled de novo into 5,702
separate contigs of at least 100 bp length (from 4,710 initial
clusters). GAII sequence assembly resulted in 9,258 contigs, of
which 60% were discarded, having a length shorter than 100 bp.
The remaining 3,756 contigs were further processed for SNP
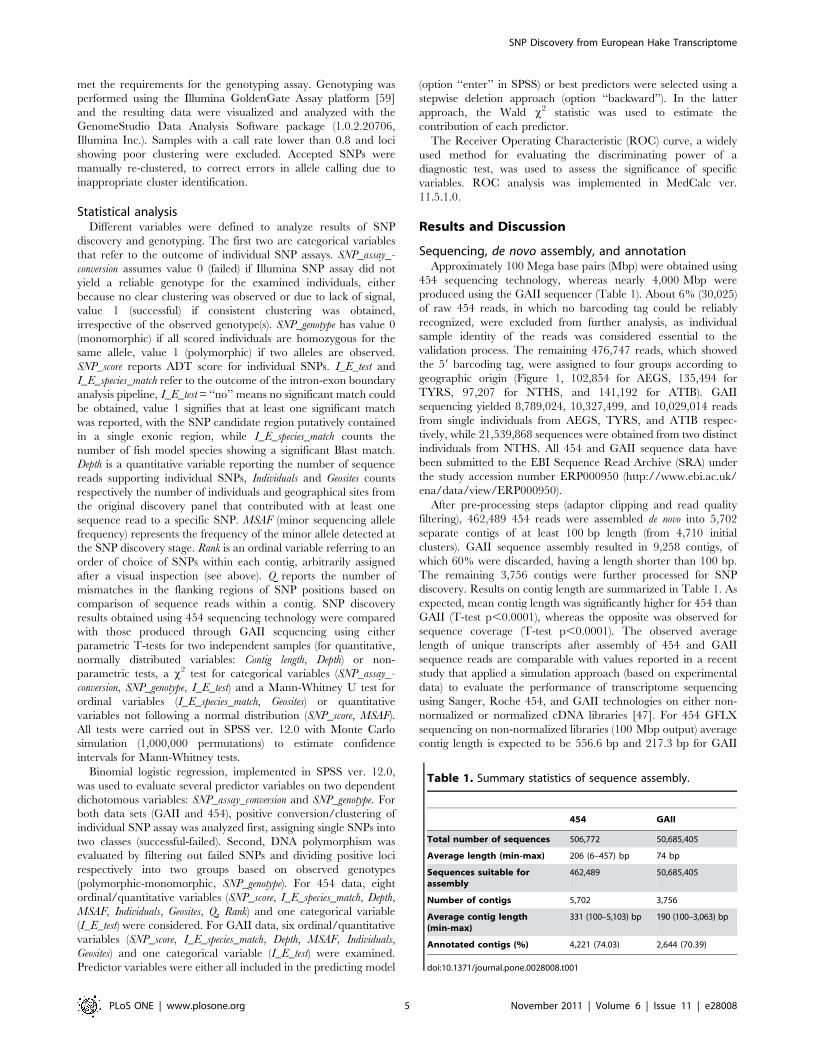
discovery. Results on contig length are summarized in Table 1. As
expected, mean contig length was significantly higher for 454 than
GAII (T-test p,0.0001), whereas the opposite was observed for
sequence coverage (T-test p,0.0001). The observed average
length of unique transcripts after assembly of 454 and GAII
sequence reads are comparable with values reported in a recent
study that applied a simulation approach (based on experimental
data) to evaluate the performance of transcriptome sequencing
using Sanger, Roche 454, and GAII technologies on either non-
normalized or normalized cDNA libraries [47]. For 454 GFLX
sequencing on non-normalized libraries (100 Mbp output) average
contig length is expected to be 556.6 bp and 217.3 bp for GAII
Table 1. Summary statistics of sequence assembly.
454 GAII
Total number of sequences 506,772 50,685,405
Average length (min-max) 206 (6–457) bp 74 bp
Sequences suitable forassembly
462,489 50,685,405
Number of contigs 5,702 3,756
Average contig length(min-max)
331 (100–5,103) bp 190 (100–3,063) bp
Annotated contigs (%) 4,221 (74.03) 2,644 (70.39)
doi:10.1371/journal.pone.0028008.t001
SNP Discovery from European Hake Transcriptome
PLoS ONE | www.plosone.org 5 November 2011 | Volume 6 | Issue 11 | e28008
sequencing (4,000 Mbp output, non-normalized libraries) [47],
similar to what was observed in the present study, whereas the
number of unique contigs obtained for hake muscle transcriptome
is considerably smaller than expected (respectively 37,853 contigs
for 454 and 147,261 for GAII under the same conditions as
above). Differences in the experimental setting in the present work
(e.g. use of a single tissue library and different genome size of the
target species) are likely contributing factors to the observed
differences.
A total of 4,221 454-contigs (74.02%) showed a significant Blast
match against at least one species sequence database among those
searched. Annotation by similarity was possible for 2,644 GAII
contigs (70.39%), significantly less (x2 = 14.83, p,0.001) than 454
contigs. A potential explanation for this observation lies in the
shorter average length of GAII contigs, which likely reduces the
overall probability of obtaining positive Blast hits. In any case, the
percentage of annotated contigs is higher for both 454 and GAII
data when compared to other studies reporting transcriptome
sequencing in teleost fish (40–63% of total annotated contigs,
[45,60]). There are several variables that might influence the
observed fraction of contigs with a positive Blast match, including
phylogenetic distance from species with high quality draft genome
sequence, contig length, tissue type(s), developmental stages, and
the method used for library construction. The use of a non-
normalized cDNA library of adult skeletal muscle may have led to
a biased representation of the hake transcriptome, favouring
highly expressed genes encoding either housekeeping or structural
(muscle contractile fibres) proteins. Housekeeping and structural
proteins are known to be expressed at higher levels and to show a
higher degree of sequence conservation compared to other
proteins [61] (e.g. components of the immune system), therefore
increasing the chance of finding a positive Blast match. A total of
120 454-contigs (2.1%) and 67 GAII-contigs (1.78%) were
identified as mitochondrial sequences. It was possible to associate
one or more GO terms to 1,606 454-contigs (28.16%) and 884
GAII contigs (23.53%). Results from level 2 GO assignments
within the three categories are summarized in Figures S1 and S2.
In silico SNP detectionA total of 4,034 candidate SNPs were identified in silico in 889
454-sequenced contigs (15%), with an average of 0.73 SNPs per
100 bp surveyed in the assembled transcriptome, or 41.1 SNPs per
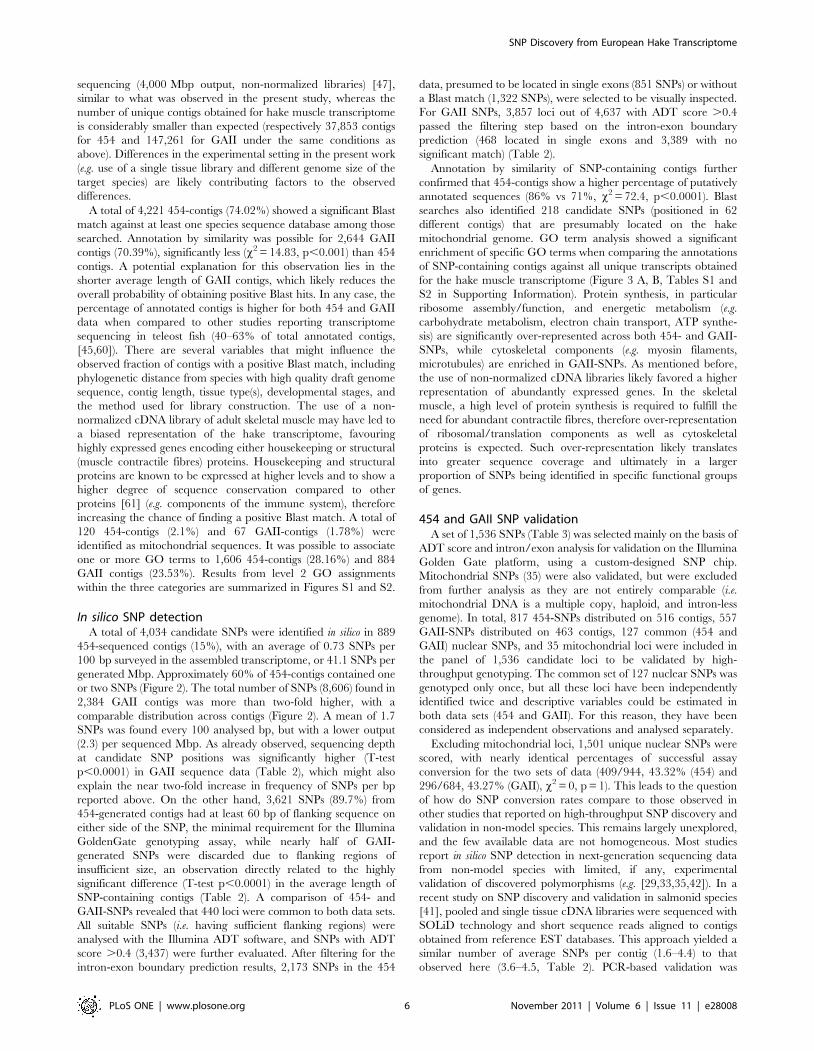
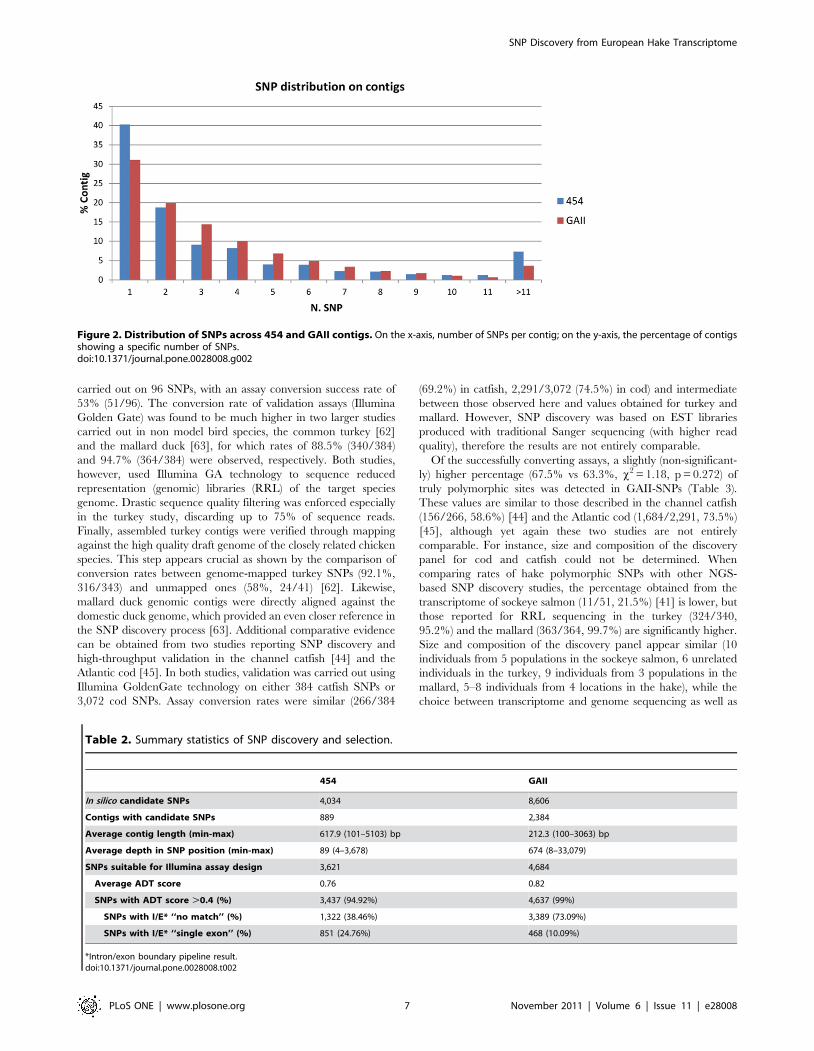
generated Mbp. Approximately 60% of 454-contigs contained one
or two SNPs (Figure 2). The total number of SNPs (8,606) found in
2,384 GAII contigs was more than two-fold higher, with a
comparable distribution across contigs (Figure 2). A mean of 1.7
SNPs was found every 100 analysed bp, but with a lower output
(2.3) per sequenced Mbp. As already observed, sequencing depth
at candidate SNP positions was significantly higher (T-test
p,0.0001) in GAII sequence data (Table 2), which might also
explain the near two-fold increase in frequency of SNPs per bp
reported above. On the other hand, 3,621 SNPs (89.7%) from
454-generated contigs had at least 60 bp of flanking sequence on
either side of the SNP, the minimal requirement for the Illumina
GoldenGate genotyping assay, while nearly half of GAII-
generated SNPs were discarded due to flanking regions of
insufficient size, an observation directly related to the highly
significant difference (T-test p,0.0001) in the average length of
SNP-containing contigs (Table 2). A comparison of 454- and
GAII-SNPs revealed that 440 loci were common to both data sets.
All suitable SNPs (i.e. having sufficient flanking regions) were
analysed with the Illumina ADT software, and SNPs with ADT
score .0.4 (3,437) were further evaluated. After filtering for the
intron-exon boundary prediction results, 2,173 SNPs in the 454
data, presumed to be located in single exons (851 SNPs) or without
a Blast match (1,322 SNPs), were selected to be visually inspected.
For GAII SNPs, 3,857 loci out of 4,637 with ADT score .0.4
passed the filtering step based on the intron-exon boundary
prediction (468 located in single exons and 3,389 with no
significant match) (Table 2).
Annotation by similarity of SNP-containing contigs further
confirmed that 454-contigs show a higher percentage of putatively
annotated sequences (86% vs 71%, x2 = 72.4, p,0.0001). Blast
searches also identified 218 candidate SNPs (positioned in 62
different contigs) that are presumably located on the hake
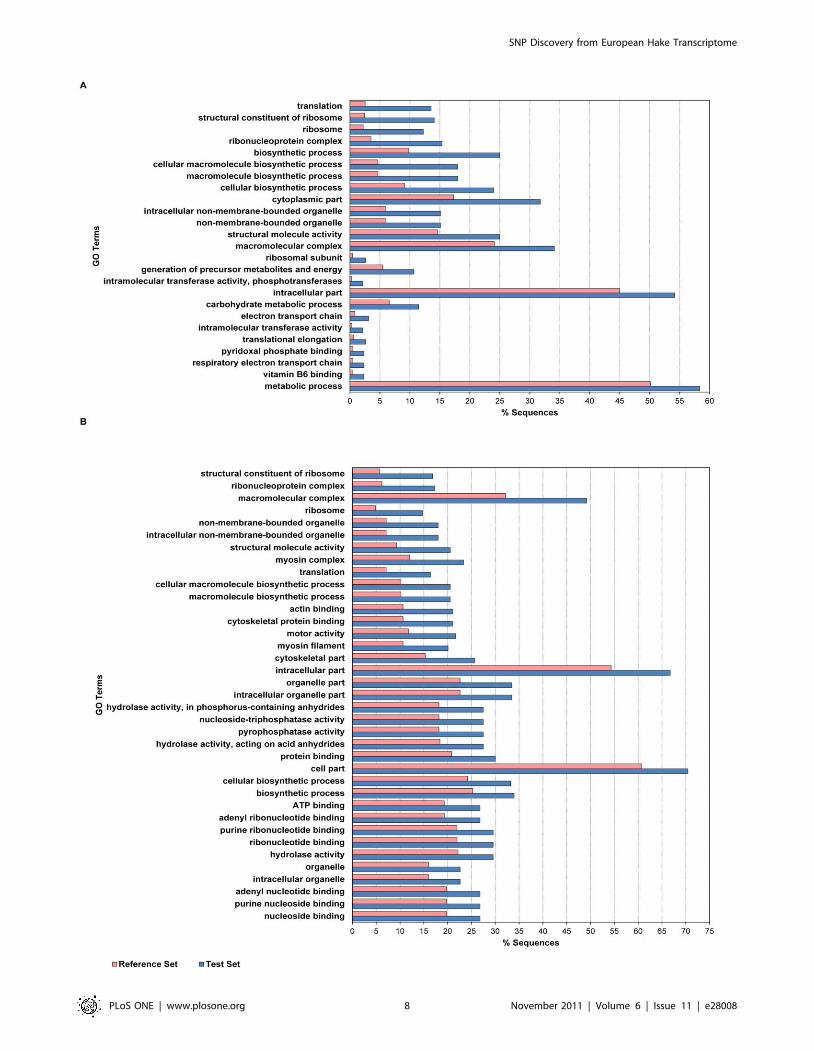
mitochondrial genome. GO term analysis showed a significant
enrichment of specific GO terms when comparing the annotations
of SNP-containing contigs against all unique transcripts obtained
for the hake muscle transcriptome (Figure 3 A, B, Tables S1 and
S2 in Supporting Information). Protein synthesis, in particular
ribosome assembly/function, and energetic metabolism (e.g.
carbohydrate metabolism, electron chain transport, ATP synthe-
sis) are significantly over-represented across both 454- and GAII-
SNPs, while cytoskeletal components (e.g. myosin filaments,
microtubules) are enriched in GAII-SNPs. As mentioned before,
the use of non-normalized cDNA libraries likely favored a higher
representation of abundantly expressed genes. In the skeletal
muscle, a high level of protein synthesis is required to fulfill the
need for abundant contractile fibres, therefore over-representation
of ribosomal/translation components as well as cytoskeletal
proteins is expected. Such over-representation likely translates
into greater sequence coverage and ultimately in a larger
proportion of SNPs being identified in specific functional groups
of genes.
454 and GAII SNP validationA set of 1,536 SNPs (Table 3) was selected mainly on the basis of
ADT score and intron/exon analysis for validation on the Illumina
Golden Gate platform, using a custom-designed SNP chip.
Mitochondrial SNPs (35) were also validated, but were excluded
from further analysis as they are not entirely comparable (i.e.
mitochondrial DNA is a multiple copy, haploid, and intron-less
genome). In total, 817 454-SNPs distributed on 516 contigs, 557
GAII-SNPs distributed on 463 contigs, 127 common (454 and
GAII) nuclear SNPs, and 35 mitochondrial loci were included in
the panel of 1,536 candidate loci to be validated by high-
throughput genotyping. The common set of 127 nuclear SNPs was
genotyped only once, but all these loci have been independently
identified twice and descriptive variables could be estimated in
both data sets (454 and GAII). For this reason, they have been
considered as independent observations and analysed separately.
Excluding mitochondrial loci, 1,501 unique nuclear SNPs were
scored, with nearly identical percentages of successful assay
conversion for the two sets of data (409/944, 43.32% (454) and
296/684, 43.27% (GAII), x2 = 0, p = 1). This leads to the question
of how do SNP conversion rates compare to those observed in
other studies that reported on high-throughput SNP discovery and
validation in non-model species. This remains largely unexplored,
and the few available data are not homogeneous. Most studies
report in silico SNP detection in next-generation sequencing data
from non-model species with limited, if any, experimental
validation of discovered polymorphisms (e.g. [29,33,35,42]). In a
recent study on SNP discovery and validation in salmonid species
[41], pooled and single tissue cDNA libraries were sequenced with
SOLiD technology and short sequence reads aligned to contigs
obtained from reference EST databases. This approach yielded a
similar number of average SNPs per contig (1.6–4.4) to that
observed here (3.6–4.5, Table 2). PCR-based validation was
SNP Discovery from European Hake Transcriptome
PLoS ONE | www.plosone.org 6 November 2011 | Volume 6 | Issue 11 | e28008
carried out on 96 SNPs, with an assay conversion success rate of
53% (51/96). The conversion rate of validation assays (Illumina
Golden Gate) was found to be much higher in two larger studies
carried out in non model bird species, the common turkey [62]
and the mallard duck [63], for which rates of 88.5% (340/384)
and 94.7% (364/384) were observed, respectively. Both studies,
however, used Illumina GA technology to sequence reduced
representation (genomic) libraries (RRL) of the target species
genome. Drastic sequence quality filtering was enforced especially
in the turkey study, discarding up to 75% of sequence reads.
Finally, assembled turkey contigs were verified through mapping
against the high quality draft genome of the closely related chicken
species. This step appears crucial as shown by the comparison of
conversion rates between genome-mapped turkey SNPs (92.1%,
316/343) and unmapped ones (58%, 24/41) [62]. Likewise,
mallard duck genomic contigs were directly aligned against the
domestic duck genome, which provided an even closer reference in
the SNP discovery process [63]. Additional comparative evidence
can be obtained from two studies reporting SNP discovery and
high-throughput validation in the channel catfish [44] and the
Atlantic cod [45]. In both studies, validation was carried out using
Illumina GoldenGate technology on either 384 catfish SNPs or
3,072 cod SNPs. Assay conversion rates were similar (266/384
(69.2%) in catfish, 2,291/3,072 (74.5%) in cod) and intermediate
between those observed here and values obtained for turkey and
mallard. However, SNP discovery was based on EST libraries
produced with traditional Sanger sequencing (with higher read
quality), therefore the results are not entirely comparable.
Of the successfully converting assays, a slightly (non-significant-
ly) higher percentage (67.5% vs 63.3%, x2 = 1.18, p = 0.272) of
truly polymorphic sites was detected in GAII-SNPs (Table 3).
These values are similar to those described in the channel catfish
(156/266, 58.6%) [44] and the Atlantic cod (1,684/2,291, 73.5%)
[45], although yet again these two studies are not entirely
comparable. For instance, size and composition of the discovery
panel for cod and catfish could not be determined. When
comparing rates of hake polymorphic SNPs with other NGS-
based SNP discovery studies, the percentage obtained from the
transcriptome of sockeye salmon (11/51, 21.5%) [41] is lower, but
those reported for RRL sequencing in the turkey (324/340,
95.2%) and the mallard (363/364, 99.7%) are significantly higher.
Size and composition of the discovery panel appear similar (10
individuals from 5 populations in the sockeye salmon, 6 unrelated
individuals in the turkey, 9 individuals from 3 populations in the
mallard, 5–8 individuals from 4 locations in the hake), while the
choice between transcriptome and genome sequencing as well as
Figure 2. Distribution of SNPs across 454 and GAII contigs. On the x-axis, number of SNPs per contig; on the y-axis, the percentage of contigsshowing a specific number of SNPs.doi:10.1371/journal.pone.0028008.g002
Table 2. Summary statistics of SNP discovery and selection.
454 GAII
In silico candidate SNPs 4,034 8,606
Contigs with candidate SNPs 889 2,384
Average contig length (min-max) 617.9 (101–5103) bp 212.3 (100–3063) bp
Average depth in SNP position (min-max) 89 (4–3,678) 674 (8–33,079)
SNPs suitable for Illumina assay design 3,621 4,684
Average ADT score 0.76 0.82
SNPs with ADT score .0.4 (%) 3,437 (94.92%) 4,637 (99%)
SNPs with I/E* ‘‘no match’’ (%) 1,322 (38.46%) 3,389 (73.09%)
SNPs with I/E* ‘‘single exon’’ (%) 851 (24.76%) 468 (10.09%)
*Intron/exon boundary pipeline result.doi:10.1371/journal.pone.0028008.t002
SNP Discovery from European Hake Transcriptome
PLoS ONE | www.plosone.org 7 November 2011 | Volume 6 | Issue 11 | e28008
SNP Discovery from European Hake Transcriptome
PLoS ONE | www.plosone.org 8 November 2011 | Volume 6 | Issue 11 | e28008
the availability and quality of reference sequences vary across
studies. As already observed for the assay conversion rate, the
relevance of the latter factor is emphasized by the significant
difference (x2 = 5.62, p = 0.017) in the percentage of polymorphic
‘‘unmapped’’ SNPs (20/24, 83.3%) and ‘‘mapped’’ ones (304/316,
96.3%) in the turkey data set [62]. Flanking sequences (120 bp) of
SNPs validated as polymorphic in this study are available in Table
S3.
While similar conversion rates and percentages of polymorphic
loci were obtained for both NGS technologies applied to hake
SNP discovery, 454-SNPs showed a significantly higher number of
Blast matches against at least one fish model coding sequence
(I_E_test rate 38.4% (454) – 17.9% (GAII), x2 = 68.05 p,0.0001).
Also continuous/ordinal variables were significantly different
between the two data sets (data not shown), with average
I_E_species_match and MSAF being higher in 454 SNPs, whereas
mean SNP_score, Geosites, and Depth were larger in GAII data.
Higher mean number of species matching with 454-SNPs is linked
to the significantly larger I_E test rate, which in turn likely
correlates with the higher percentage of annotated 454-contigs,
while greater Depth in GAII-SNPs reflects the overall much deeper
sequence coverage obtained with GAII technology. Likewise,
differential coverage likely explains the more complete represen-
tation of sequence variation across all four collection sites in GAII-
SNPs. It is not clear why higher average SNP_score for GAII-SNPs
was observed. It might be an effect of different contig length and/
or sequence quality as the parameters that the ADT uses for
estimating SNP scores are likely influenced by these factors. The
higher MSAF estimated for 454-SNPs appears to be the effect of
over-estimation of allele frequencies based on sequence data, again
putatively related to the lower coverage of SNP sites obtained with
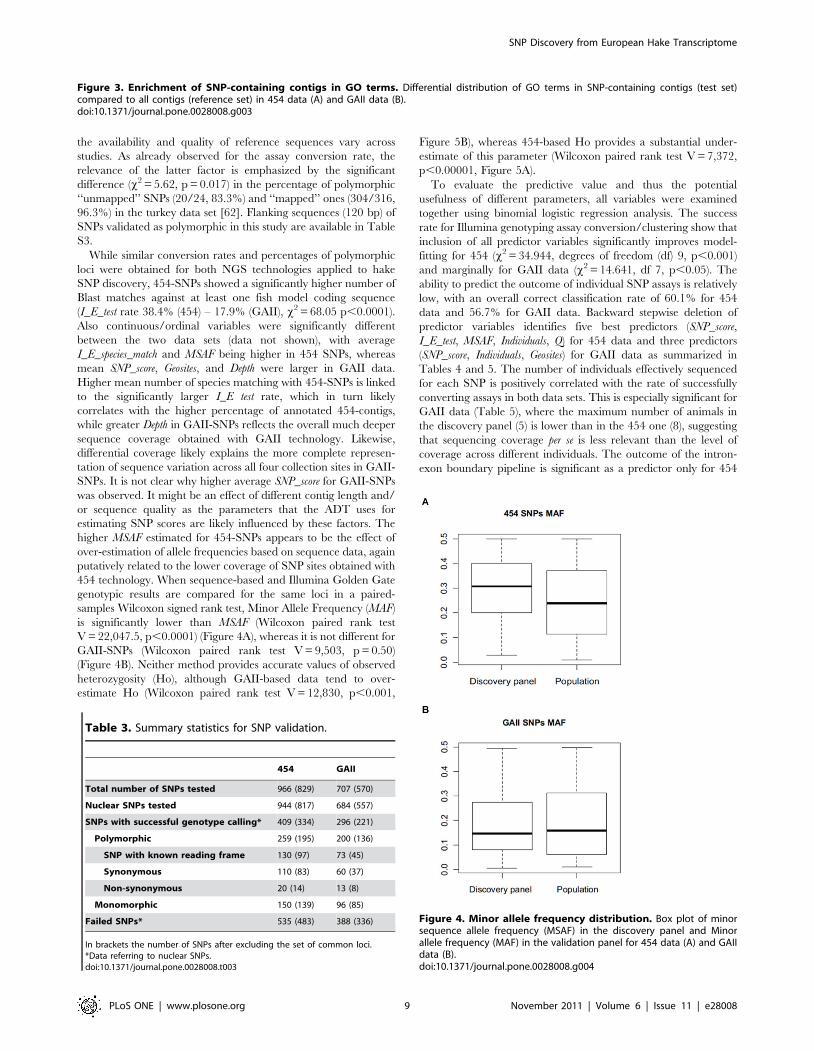
454 technology. When sequence-based and Illumina Golden Gate
genotypic results are compared for the same loci in a paired-
samples Wilcoxon signed rank test, Minor Allele Frequency (MAF)
is significantly lower than MSAF (Wilcoxon paired rank test
V = 22,047.5, p,0.0001) (Figure 4A), whereas it is not different for
GAII-SNPs (Wilcoxon paired rank test V = 9,503, p = 0.50)
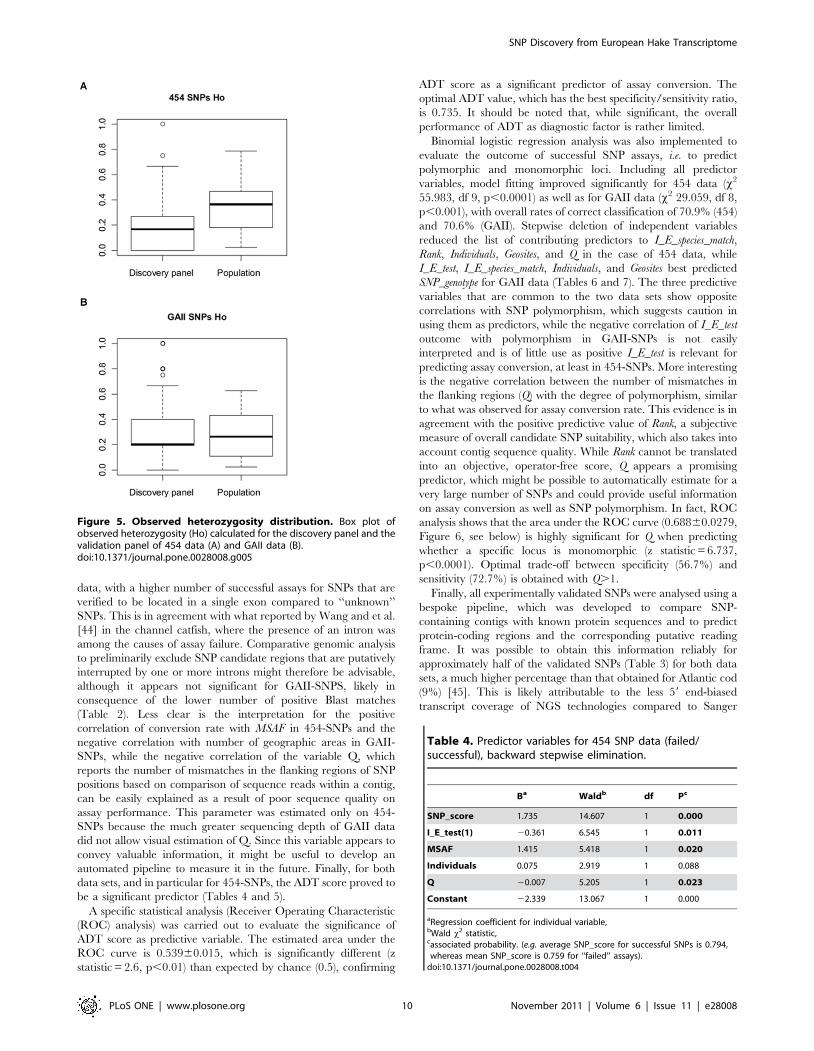
(Figure 4B). Neither method provides accurate values of observed
heterozygosity (Ho), although GAII-based data tend to over-
estimate Ho (Wilcoxon paired rank test V = 12,830, p,0.001,
Figure 5B), whereas 454-based Ho provides a substantial under-
estimate of this parameter (Wilcoxon paired rank test V = 7,372,
p,0.00001, Figure 5A).
To evaluate the predictive value and thus the potential
usefulness of different parameters, all variables were examined
together using binomial logistic regression analysis. The success
rate for Illumina genotyping assay conversion/clustering show that
inclusion of all predictor variables significantly improves model-
fitting for 454 (x2 = 34.944, degrees of freedom (df) 9, p,0.001)
and marginally for GAII data (x2 = 14.641, df 7, p,0.05). The
ability to predict the outcome of individual SNP assays is relatively
low, with an overall correct classification rate of 60.1% for 454
data and 56.7% for GAII data. Backward stepwise deletion of
predictor variables identifies five best predictors (SNP_score,
I_E_test, MSAF, Individuals, Q) for 454 data and three predictors
(SNP_score, Individuals, Geosites) for GAII data as summarized in
Tables 4 and 5. The number of individuals effectively sequenced
for each SNP is positively correlated with the rate of successfully
converting assays in both data sets. This is especially significant for
GAII data (Table 5), where the maximum number of animals in
the discovery panel (5) is lower than in the 454 one (8), suggesting
that sequencing coverage per se is less relevant than the level of
coverage across different individuals. The outcome of the intron-
exon boundary pipeline is significant as a predictor only for 454
Table 3. Summary statistics for SNP validation.
454 GAII
Total number of SNPs tested 966 (829) 707 (570)
Nuclear SNPs tested 944 (817) 684 (557)
SNPs with successful genotype calling* 409 (334) 296 (221)
Polymorphic 259 (195) 200 (136)
SNP with known reading frame 130 (97) 73 (45)
Synonymous 110 (83) 60 (37)
Non-synonymous 20 (14) 13 (8)
Monomorphic 150 (139) 96 (85)
Failed SNPs* 535 (483) 388 (336)
In brackets the number of SNPs after excluding the set of common loci.*Data referring to nuclear SNPs.doi:10.1371/journal.pone.0028008.t003
Figure 4. Minor allele frequency distribution. Box plot of minorsequence allele frequency (MSAF) in the discovery panel and Minorallele frequency (MAF) in the validation panel for 454 data (A) and GAIIdata (B).doi:10.1371/journal.pone.0028008.g004
Figure 3. Enrichment of SNP-containing contigs in GO terms. Differential distribution of GO terms in SNP-containing contigs (test set)compared to all contigs (reference set) in 454 data (A) and GAII data (B).doi:10.1371/journal.pone.0028008.g003
SNP Discovery from European Hake Transcriptome
PLoS ONE | www.plosone.org 9 November 2011 | Volume 6 | Issue 11 | e28008
data, with a higher number of successful assays for SNPs that are
verified to be located in a single exon compared to ‘‘unknown’’
SNPs. This is in agreement with what reported by Wang and et al.
[44] in the channel catfish, where the presence of an intron was
among the causes of assay failure. Comparative genomic analysis
to preliminarily exclude SNP candidate regions that are putatively
interrupted by one or more introns might therefore be advisable,
although it appears not significant for GAII-SNPS, likely in
consequence of the lower number of positive Blast matches
(Table 2). Less clear is the interpretation for the positive
correlation of conversion rate with MSAF in 454-SNPs and the
negative correlation with number of geographic areas in GAII-
SNPs, while the negative correlation of the variable Q, which
reports the number of mismatches in the flanking regions of SNP
positions based on comparison of sequence reads within a contig,
can be easily explained as a result of poor sequence quality on
assay performance. This parameter was estimated only on 454-
SNPs because the much greater sequencing depth of GAII data
did not allow visual estimation of Q. Since this variable appears to
convey valuable information, it might be useful to develop an
automated pipeline to measure it in the future. Finally, for both
data sets, and in particular for 454-SNPs, the ADT score proved to
be a significant predictor (Tables 4 and 5).
A specific statistical analysis (Receiver Operating Characteristic
(ROC) analysis) was carried out to evaluate the significance of
ADT score as predictive variable. The estimated area under the
ROC curve is 0.53960.015, which is significantly different (z
statistic = 2.6, p,0.01) than expected by chance (0.5), confirming
ADT score as a significant predictor of assay conversion. The
optimal ADT value, which has the best specificity/sensitivity ratio,
is 0.735. It should be noted that, while significant, the overall
performance of ADT as diagnostic factor is rather limited.
Binomial logistic regression analysis was also implemented to
evaluate the outcome of successful SNP assays, i.e. to predict
polymorphic and monomorphic loci. Including all predictor
variables, model fitting improved significantly for 454 data (x2
55.983, df 9, p,0.0001) as well as for GAII data (x2 29.059, df 8,
p,0.001), with overall rates of correct classification of 70.9% (454)
and 70.6% (GAII). Stepwise deletion of independent variables
reduced the list of contributing predictors to I_E_species_match,
Rank, Individuals, Geosites, and Q in the case of 454 data, while
I_E_test, I_E_species_match, Individuals, and Geosites best predicted
SNP_genotype for GAII data (Tables 6 and 7). The three predictive
variables that are common to the two data sets show opposite
correlations with SNP polymorphism, which suggests caution in
using them as predictors, while the negative correlation of I_E_test
outcome with polymorphism in GAII-SNPs is not easily
interpreted and is of little use as positive I_E_test is relevant for
predicting assay conversion, at least in 454-SNPs. More interesting
is the negative correlation between the number of mismatches in
the flanking regions (Q) with the degree of polymorphism, similar
to what was observed for assay conversion rate. This evidence is in
agreement with the positive predictive value of Rank, a subjective
measure of overall candidate SNP suitability, which also takes into
account contig sequence quality. While Rank cannot be translated
into an objective, operator-free score, Q appears a promising
predictor, which might be possible to automatically estimate for a
very large number of SNPs and could provide useful information
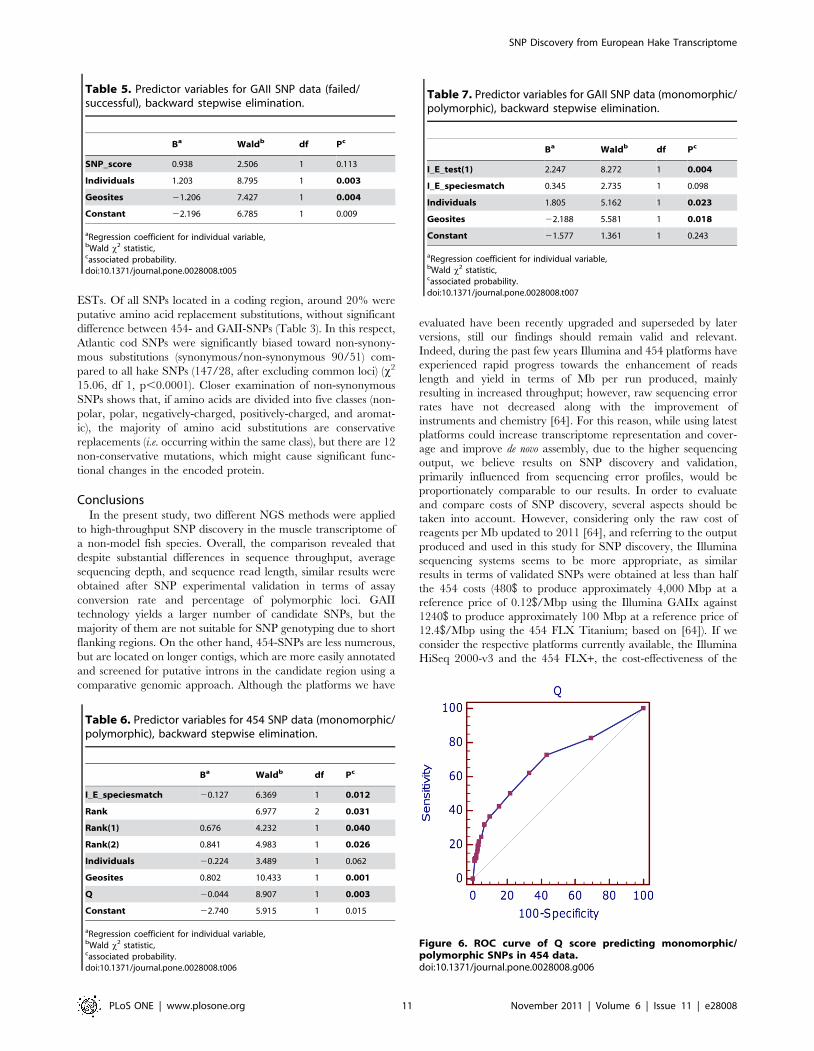
on assay conversion as well as SNP polymorphism. In fact, ROC
analysis shows that the area under the ROC curve (0.68860.0279,
Figure 6, see below) is highly significant for Q when predicting
whether a specific locus is monomorphic (z statistic = 6.737,
p,0.0001). Optimal trade-off between specificity (56.7%) and
sensitivity (72.7%) is obtained with Q.1.
Finally, all experimentally validated SNPs were analysed using a
bespoke pipeline, which was developed to compare SNP-
containing contigs with known protein sequences and to predict
protein-coding regions and the corresponding putative reading
frame. It was possible to obtain this information reliably for
approximately half of the validated SNPs (Table 3) for both data
sets, a much higher percentage than that obtained for Atlantic cod
(9%) [45]. This is likely attributable to the less 59 end-biased
transcript coverage of NGS technologies compared to Sanger
Figure 5. Observed heterozygosity distribution. Box plot ofobserved heterozygosity (Ho) calculated for the discovery panel and thevalidation panel of 454 data (A) and GAII data (B).doi:10.1371/journal.pone.0028008.g005
Table 4. Predictor variables for 454 SNP data (failed/successful), backward stepwise elimination.
Ba Waldb df Pc
SNP_score 1.735 14.607 1 0.000
I_E_test(1) 20.361 6.545 1 0.011
MSAF 1.415 5.418 1 0.020
Individuals 0.075 2.919 1 0.088
Q 20.007 5.205 1 0.023
Constant 22.339 13.067 1 0.000
aRegression coefficient for individual variable,bWald x2 statistic,cassociated probability. (e.g. average SNP_score for successful SNPs is 0.794,whereas mean SNP_score is 0.759 for ‘‘failed’’ assays).
doi:10.1371/journal.pone.0028008.t004
SNP Discovery from European Hake Transcriptome
PLoS ONE | www.plosone.org 10 November 2011 | Volume 6 | Issue 11 | e28008
ESTs. Of all SNPs located in a coding region, around 20% were
putative amino acid replacement substitutions, without significant
difference between 454- and GAII-SNPs (Table 3). In this respect,
Atlantic cod SNPs were significantly biased toward non-synony-
mous substitutions (synonymous/non-synonymous 90/51) com-
pared to all hake SNPs (147/28, after excluding common loci) (x2
15.06, df 1, p,0.0001). Closer examination of non-synonymous
SNPs shows that, if amino acids are divided into five classes (non-
polar, polar, negatively-charged, positively-charged, and aromat-
ic), the majority of amino acid substitutions are conservative
replacements (i.e. occurring within the same class), but there are 12
non-conservative mutations, which might cause significant func-
tional changes in the encoded protein.
ConclusionsIn the present study, two different NGS methods were applied
to high-throughput SNP discovery in the muscle transcriptome of
a non-model fish species. Overall, the comparison revealed that
despite substantial differences in sequence throughput, average
sequencing depth, and sequence read length, similar results were
obtained after SNP experimental validation in terms of assay
conversion rate and percentage of polymorphic loci. GAII
technology yields a larger number of candidate SNPs, but the
majority of them are not suitable for SNP genotyping due to short
flanking regions. On the other hand, 454-SNPs are less numerous,
but are located on longer contigs, which are more easily annotated
and screened for putative introns in the candidate region using a
comparative genomic approach. Although the platforms we have
evaluated have been recently upgraded and superseded by later
versions, still our findings should remain valid and relevant.
Indeed, during the past few years Illumina and 454 platforms have
experienced rapid progress towards the enhancement of reads
length and yield in terms of Mb per run produced, mainly
resulting in increased throughput; however, raw sequencing error
rates have not decreased along with the improvement of
instruments and chemistry [64]. For this reason, while using latest
platforms could increase transcriptome representation and cover-
age and improve de novo assembly, due to the higher sequencing
output, we believe results on SNP discovery and validation,
primarily influenced from sequencing error profiles, would be
proportionately comparable to our results. In order to evaluate
and compare costs of SNP discovery, several aspects should be
taken into account. However, considering only the raw cost of
reagents per Mb updated to 2011 [64], and referring to the output
produced and used in this study for SNP discovery, the Illumina
sequencing systems seems to be more appropriate, as similar
results in terms of validated SNPs were obtained at less than half
the 454 costs (480$ to produce approximately 4,000 Mbp at a
reference price of 0.12$/Mbp using the Illumina GAIIx against
1240$ to produce approximately 100 Mbp at a reference price of
12.4$/Mbp using the 454 FLX Titanium; based on [64]). If we
consider the respective platforms currently available, the Illumina
HiSeq 2000-v3 and the 454 FLX+, the cost-effectiveness of the
Table 5. Predictor variables for GAII SNP data (failed/successful), backward stepwise elimination.
Ba Waldb df Pc
SNP_score 0.938 2.506 1 0.113
Individuals 1.203 8.795 1 0.003
Geosites 21.206 7.427 1 0.004
Constant 22.196 6.785 1 0.009
aRegression coefficient for individual variable,bWald x2 statistic,cassociated probability.doi:10.1371/journal.pone.0028008.t005
Figure 6. ROC curve of Q score predicting monomorphic/polymorphic SNPs in 454 data.doi:10.1371/journal.pone.0028008.g006
Table 6. Predictor variables for 454 SNP data (monomorphic/polymorphic), backward stepwise elimination.
Ba Waldb df Pc
I_E_speciesmatch 20.127 6.369 1 0.012
Rank 6.977 2 0.031
Rank(1) 0.676 4.232 1 0.040
Rank(2) 0.841 4.983 1 0.026
Individuals 20.224 3.489 1 0.062
Geosites 0.802 10.433 1 0.001
Q 20.044 8.907 1 0.003
Constant 22.740 5.915 1 0.015
aRegression coefficient for individual variable,bWald x2 statistic,cassociated probability.doi:10.1371/journal.pone.0028008.t006
Table 7. Predictor variables for GAII SNP data (monomorphic/polymorphic), backward stepwise elimination.
Ba Waldb df Pc
I_E_test(1) 2.247 8.272 1 0.004
I_E_speciesmatch 0.345 2.735 1 0.098
Individuals 1.805 5.162 1 0.023
Geosites 22.188 5.581 1 0.018
Constant 21.577 1.361 1 0.243
aRegression coefficient for individual variable,bWald x2 statistic,cassociated probability.doi:10.1371/journal.pone.0028008.t007
SNP Discovery from European Hake Transcriptome
PLoS ONE | www.plosone.org 11 November 2011 | Volume 6 | Issue 11 | e28008
Illumina technology is maintained, as same results would be
achieved with less than a quarter of 454 costs. Additionally, HiSeq
technology might allow to increase the number of individuals
included in the SNP discovery panel without decreasing coverage
depth. As such a variable (Individuals) was found to be positively
correlated with successful conversion rate of SNP assays, this
represents a further element in favor of Illumina technology. It
should be noted, however, that the most expensive steps were the
in silico analysis of sequence reads (assembly, SNP discovery,
quality assessment) and the high-throughput genotyping assays.
While the latter showed similar conversion rates, analysis of GAII
reads might be more laborious and produce less reliable assemblies
[47]. On the other hand, it has been demonstrated that the quality
of transcriptome assembly depends on sequence coverage [47],
therefore the shift toward HiSeq might allow easier and more
reliable assemblies. More generally, the results presented here
clearly demonstrate that it is possible to identify and effectively
validate many polymorphic SNPs, in transcribed regions of a non
model species. The lack of a reference genome, however,
dramatically affects the genotyping success rate, although the
overall efficiency can be improved using strict quality criteria/
filters, especially in the case of 454-SNPs, such as testing for
intron-exon boundaries, defining optimal ADT scores, and
targeting low Q values (number of mismatches in the flanking
regions).
The SNP markers developed in the current study represent
novel tools for a broad range of future applications in population
genetic studies focusing on the European hake. A deeper
understanding of ecological and evolutionary dynamics of
European hake populations across the entire distribution range
provides the necessary means for a proper management and
conservation policy, aimed at promoting sustainable fishery and
preventing overexploitation and illegal fishing activities.
Supporting Information
Figure S1 Gene Ontology (GO) assignment (2nd levelGO terms) of hake 454 contigs. A ‘‘Cellular Component’’. BMolecular Function’’. C ‘‘Biological Process’’.
(PDF)
Figure S2 Gene Ontology (GO) assignment (2nd levelGO terms) of hake GAII contigs. A ‘‘Cellular Component’’. BMolecular Function’’. C ‘‘Biological Process’’.
(PDF)
Figure S3 Flowchart describing the intron-exon pipe-line.(PDF)
Table S1 Results of GO enrichment analysis performedusing all 454 contigs as reference set, and 454 SNP-containing contigs as test set. Significantly overrepresented
GO terms are listed, together with the respective category (P:
‘‘Biological Process’’; F: ‘‘Molecular Function’’; C: ‘‘Cellular
Component’’), FDR (false discovery rate) and Fisher’s Exact Test
p-value.
(PDF)
Table S2 Results of GO enrichment analysis performedusing all GAII contigs as reference set, and GAII SNP-containing contigs as test set. Significantly overrepresented
GO terms are listed, together with the respective category (P:
‘‘Biological Process’’; F: ‘‘Molecular Function’’; C: ‘‘Cellular
Component’’), FDR (false discovery rate) and Fisher’s Exact Test
p-value.
(PDF)
Table S3 List of 395 SNPs validated as polymorphic inthis study (including 454-, GAII- SNPs and the set of locidetected using both data sets) together with thecorresponding flanking sequences of approximately120 bp (SNP alleles in brackets).(XLSX)
Acknowledgments
We would like to thank all the members of the FishPopTrace Consortium
for their input, and Marco Martini and Michele Drigo for their help with
ROC analysis. Sampling was made possible by the generous collaboration
of Paolo Sartor from the CBMI (Consorzio per il Centro Interuniversitario
di Biologia Marina ed Ecologia Applicata ‘‘G. Bacci’’, Italy), Corrado
Piccinetti and Marco Stagioni from the University of Bologna (Italy),
Audrey Geffen from the University of Bergen (Norway) and Grigorios Krey
from the National Agricultural Research Foundation (Greece). We thank
Pernille K. Andersen (Aarhus University, Denmark) for sequencing sample
and library management. We are particularly grateful to Jann Martinsohn
and Eoin MacAoidh from the European Commission’s Joint Research
Center, Institute for the Protection and Security of the Citizen (Italy).
Author Contributions
Conceived and designed the experiments: GRC LB TP RO GEM.
Performed the experiments: FP RON RO MIT SJH ME MA IM MB.
Wrote the paper: IM LB RO GRC FT MB FP. Carried out in silico
analyses: FP RON RO MIT SJH IM MB ME MA. Analyzed genotype
data: IM MB RO LB. Carried out statistical analysis: IM MB RO LB.
References
1. Oliver P, Massutı E, Alheit J, Pitcher TJ (1994) Biology and fisheries of western
Mediterranean hake (M. merluccius). In: Noakes DLG, ed. Hake: Biology,
fisheries and markets: Springer Netherlands. pp 181–202.
2. Casey J, Pereiro J, Alheit J, Pitcher TJ (1994) European hake (M. merluccius) in
the North-east Atlantic. In: Noakes DLG, ed. Hake: Biology, fisheries and
markets: Springer Netherlands. pp 125–147.
3. FAO (2010) FAO yearbook. Fishery and Aquaculture Statistics. 2008.
4. FAO (2010) REPORT OF THE 12TH SESSION OF THE SCIENTIFIC
ADVISORY COMMITTEE (SAC)-GFCM: XXXIV/2010/Inf.9.
5. Murua H, Michael L (2010) The Biology and Fisheries of European Hake,
Merluccius merluccius, in the North-East Atlantic. Advances in Marine Biology:
Academic Press. pp 97–154.
6. Lundy CJ, Moran P, Rico C, Milner RS, Hewitt GM (1999) Macrogeographical
population differentiation in oceanic environments: a case study of European
hake (Merluccius merluccius), a commercially important fish. Molecular Ecology
8: 1889–1898.
7. Pita A, Presa P, Perez M (2010) Gene flow, multilocus assignment and genetic
structuring of the European hake (Merluccius merluccius). Thalassas 26: 129–133.
8. Roldan MI, Garcia-Marin J, Utter FM, Pla C (1998) Population genetic
structure of European hake, Merluccius merluccius. Heredity 81: 327–334.
9. Castillo AGF, Martinez JL, Garcia-Vazquez E (2004) Fine Spatial Structure of
Atlantic Hake (Merluccius merluccius) Stocks Revealed by Variation at
Microsatellite Loci. Marine Biotechnology 6: 299–306.
10. Lundy CJ, Rico C, Hewitt GM (2000) Temporal and spatial genetic variation in
spawning grounds of European hake (Merluccius merluccius) in the Bay of
Biscay. Molecular ecology 9: 2067–2079.
11. Reiss H, Hoarau G, Dickey-Collas M, Wolff WJ (2009) Genetic population
structure of marine fish: mismatch between biological and fisheries management
units. Fish and Fisheries 10: 361–395.
12. Pita A, Perez M, Cervino S, Presa P (2011) What can gene flow and recruitment
dynamics tell us about connectivity between European hake stocks in the Eastern
North Atlantic? Continental Shelf Research 31: 376–387.
13. Ferguson A (1994) Molecular genetics in fisheries: current and future
perspectives. Reviews in Fish Biology and Fisheries 4: 379–383.
14. Hauser L, Carvalho GR (2008) Paradigm shifts in marine fisheries genetics: ugly
hypotheses slain by beautiful facts. Fish and Fisheries 9: 333–362.
SNP Discovery from European Hake Transcriptome
PLoS ONE | www.plosone.org 12 November 2011 | Volume 6 | Issue 11 | e28008
15. Cimmaruta R, Bondanelli P, Nascetti G (2005) Genetic structure and
environmental heterogeneity in the European hake (Merluccius merluccius).Molecular ecology 14: 2577–2591.
16. Hauser L, Seeb JE (2008) Advances in molecular technology and their impact onfisheries genetics. Fish and Fisheries 9: 473–486.
17. Luikart G, England PR, Tallmon D, Jordan S, Taberlet P (2003) The power andpromise of population genomics: from genotyping to genome typing. Nature
reviews Genetics 4: 981–994.
18. Wenne R, Boudry P, Hemmer-Hansen J, Lubieniecki KP, Was A, et al. (2007)
What role for genomics in fisheries management and aquaculture? AquatLiving
Resour 20: 241–255.
19. Bonin A (2008) Population genomics: a new generation of genome scans to
bridge the gap with functional genomics. Molecular ecology 17: 3583–3584.
20. Nielsen EE, Hemmer-Hansen J, Larsen PF, Bekkevold D (2009) Population
genomics of marine fishes: identifying adaptive variation in space and time.Molecular ecology 18: 3128–3150.
21. Metzker ML (2010) Sequencing technologies - the next generation. Naturereviews Genetics 11: 31–46.
22. Weber APM, Weber KL, Carr K, Wilkerson C, Ohlrogge JB (2007) Samplingthe Arabidopsis Transcriptome with Massively Parallel Pyrosequencing. Plant
Physiology 144: 32–42.
23. Hudson ME (2008) Sequencing breakthroughs for genomic ecology and
evolutionary biology. Molecular Ecology Resources 8: 3–17.
24. Wheat C (2010) Rapidly developing functional genomics in ecological model
systems via 454 transcriptome sequencing. Genetica 138: 433–451.
25. Helyar SJ, Hemmer-Hansen J, Bekkevold D, Taylor MI, Ogden R, et al. (2011)
Application of SNPs for population genetics of nonmodel organisms: new
opportunities and challenges. Molecular Ecology Resources 11: 123–136.
26. Seeb JE, Carvalho G, Hauser L, Naish K, Roberts S, et al. (2011) Single-
nucleotide polymorphism (SNP) discovery and applications of SNP genotypingin nonmodel organisms. Molecular Ecology Resources 11: 1–8.
27. Panitz F, Stengaard H, Hornshøj H, Gorodkin J, Hedegaard J, et al. (2007) SNPmining porcine ESTs with MAVIANT, a novel tool for SNP evaluation and
annotation. Bioinformatics 23: i387–i391.
28. Morin PA, Luikart G, Wayne RK, the Snp wg (2004) SNPs in ecology, evolution
and conservation. Trends in Ecology & Evolution 19: 208–216.
29. Garvin MR, Saitoh K, Gharrett AJ (2010) Application of single nucleotide
polymorphisms to non-model species: a technical review. Molecular EcologyResources 10: 915–934.
30. Beaumont MA, Balding DJ (2004) Identifying adaptive genetic divergenceamong populations from genome scans. Molecular ecology 13: 969–980.
31. Hemmer-Hansen J, Nielsen EE, Meldrup D, Mittelholzer C (2011) Identifica-tion of single nucleotide polymorphisms in candidate genes for growth and
reproduction in a nonmodel organism; the Atlantic cod, Gadus morhua.
Molecular Ecology Resources 11: 71–80.
32. Freamo H, O’Reilly P, Berg PR, Lien S, Boulding EG (2011) Outlier SNPs show
more genetic structure between two Bay of Fundy metapopulations of Atlanticsalmon than do neutral SNPs. Molecular Ecology Resources 11: 254–267.
33. Barbazuk WB, Emrich SJ, Chen HD, Li L, Schnable PS (2007) SNP discoveryvia 454 transcriptome sequencing. The Plant Journal 51: 910–918.
34. Novaes E, Drost D, Farmerie W, Pappas G, Grattapaglia D, et al. (2008) High-throughput gene and SNP discovery in Eucalyptus grandis, an uncharacterized
genome. BMC Genomics 9: 312.
35. Vera JC, Wheat CW, Fescemyer HW, Frilander MJ, Crawford DL, et al. (2008)
Rapid transcriptome characterization for a nonmodel organism using 454pyrosequencing. Molecular ecology 17: 1636–1647.
36. Galindo J, Grahame JW, Butlin RK (2010) An EST-based genome scan using454 sequencing in the marine snail Littorina saxatilis. Journal of Evolutionary
Biology 23: 2004–2016.
37. Lepoittevin C, Frigerio J-M, Garnier-Gere P, Salin F, Cervera M-T, et al. (2010)
In Vitro vs In Silico Detected SNPs for the Development of a Genotyping Array:
What Can We Learn from a Non-Model Species? PLoS ONE 5: e11034.
38. Sanchez C, Smith T, Wiedmann R, Vallejo R, Salem M, et al. (2009) Single
nucleotide polymorphism discovery in rainbow trout by deep sequencing of areduced representation library. BMC Genomics 10: 559.
39. Hale M, McCormick C, Jackson J, DeWoody JA (2009) Next-generationpyrosequencing of gonad transcriptomes in the polyploid lake sturgeon
(Acipenser fulvescens): the relative merits of normalization and rarefaction ingene discovery. BMC Genomics 10: 203.
40. Renaut S, Nolte AW, Bernatchez L (2010) Mining transcriptome sequences
towards identifying adaptive single nucleotide polymorphisms in lake whitefishspecies pairs (Coregonus spp. Salmonidae). Molecular ecology 19: 115–131.
41. Everett MV, Grau ED, Seeb JE (2011) Short reads and nonmodel species:
exploring the complexities of next-generation sequence assembly and SNPdiscovery in the absence of a reference genome. Molecular Ecology Resources
11: 93–108.42. Liu SK, Zhou ZC, Lu JG, Sun FY, Wang SL, et al. (2011) Generation of
genome-scale gene-associated SNPs in catfish for the construction of a high-
density SNP array. BMC Genomics 12: 13.43. Vera M, Alvarez-Dios JA, Milian A, Pardo BG, Bouza C, et al. (2011)
Validation of single nucleotide polymorphism (SNP) markers from an immuneExpressed Sequence Tag (EST) turbot, Scophthalmus maximus, database.
Aquaculture 313: 31–41.44. Wang S, Sha Z, Sonstegard T, Liu H, Xu P, et al. (2008) Quality assessment
parameters for EST-derived SNPs from catfish. BMC Genomics 9: 450.
45. Hubert S, Higgins B, Borza T, Bowman S (2010) Development of a SNPresource and a genetic linkage map for Atlantic cod (Gadus morhua). BMC
Genomics 11: 14.46. Margulies M, Egholm M, Altman WE, Attiya S, Bader JS, et al. (2005) Genome
sequencing in microfabricated high-density picolitre reactors. Nature 437:
376–380.47. Wall PK, Leebens-Mack J, Chanderbali AS, Barakat A, Wolcott E, et al. (2009)
Comparison of next generation sequencing technologies for transcriptomecharacterization. BMC Genomics 10: 19.
48. Kircher M, Kelso J (2010) High-throughput DNA sequencing - concepts andlimitations. Bioessays 32: 524–536.
49. Paszkiewicz K, Studholme DJ (2010) De novo assembly of short sequence reads.
Briefings in Bioinformatics 11: 457–472.50. Binladen J, Gilbert MT, Bollback JP, Panitz F, Bendixen C, et al. (2007) The
Use of Coded PCR Primers Enables High-Throughput Sequencing of MultipleHomolog Amplification Products by 454 Parallel Sequencing. PLoS ONE 2:
e197.
51. Marioni JC, Mason CE, Mane SM, Stephens M, Gilad Y (2008) RNA-seq: Anassessment of technical reproducibility and comparison with gene expression
arrays. Genome research 18: 1509–1517.52. Huang X, Madan A (1999) CAP3: A DNA Sequence Assembly Program.
Genome research 9: 868–877.53. Marth GT, Korf I, Yandell MD, Yeh RT, Gu Z, et al. (1999) A general
approach to single-nucleotide polymorphism discovery. Nature genetics 23:
452–456.54. Birol
.I, Jackman SD, Nielsen CB, Qian JQ, Varhol R, et al. (2009) De novo
transcriptome assembly with ABySS. Bioinformatics 25: 2872–2877.55. Simpson JT, Wong K, Jackman SD, Schein JE, Jones SJM, et al. (2009) ABySS:
A parallel assembler for short read sequence data. Genome research 19:
1117–1123.56. Gotz S, Garcıa-Gomez JM, Terol J, Williams TD, Nagaraj SH, et al. (2008)
High-throughput functional annotation and data mining with the Blast2GOsuite. Nucleic acids research 36: 3420–3435.
57. Bluthgen N, Brand K, Cajavec B, Swat M, Herzel H, et al. (2005) Biologicalprofiling of gene groups utilizing Gene Ontology. Genome Inform 16: 106–115.
58. Huang W, Marth G (2008) EagleView: A genome assembly viewer for next-
generation sequencing technologies. Genome research 18: 1538–1543.59. Fan JB, Oliphant A, Shen R, Kermani BG, Garcia F, et al. (2003) Highly
Parallel SNP Genotyping. Cold Spring Harbor symposia on quantitative biology68: 69–78.
60. Ferraresso S, Milan M, Pellizzari C, Vitulo N, Reinhardt R, et al. (2010)
Development of an oligo DNA microarray for the European sea bass and itsapplication to expression profiling of jaw deformity. BMC Genomics 11: 17.
61. Zhang LQ, Li WH (2004) Mammalian housekeeping genes evolve more slowlythan tissue-specific genes. Molecular Biology and Evolution 21: 236–239.
62. Kerstens HHD, Crooijmans R, Veenendaal A, Dibbits BW, Chin-A-
Woeng TFC, et al. (2009) Large scale single nucleotide polymorphism discoveryin unsequenced genomes using second generation high throughput sequencing
technology: applied to turkey. BMC Genomics 10: 11.63. Kraus RHS, Kerstens HHD, Van Hooft P, Crooijmans R, Van der Poel JJ, et al.
(2011) Genome wide SNP discovery, analysis and evaluation in mallard (Anasplatyrhynchos). BMC Genomics 12: 11.
64. Glenn TC (2011) Field guide to next-generation DNA sequencers. Molecular
Ecology Resources 11: 759–769.
SNP Discovery from European Hake Transcriptome
PLoS ONE | www.plosone.org 13 November 2011 | Volume 6 | Issue 11 | e28008
Copyright © 2022 FDOKUMEN