Novel Quantitative Real-Time LCR for the Sensitive Detection of SNP Frequencies in Pooled DNA:...
11
Novel Quantitative Real-Time LCR for the Sensitive Detection of SNP Frequencies in Pooled DNA: Method Development, Evaluation and Application Androniki Psifidi 1 , Chrysostomos Dovas 2 *, Georgios Banos 1 1 Department of Animal Production, Faculty of Veterinary Medicine, Aristotle University of Thessaloniki, Thessaloniki, Greece, 2 Laboratory of Microbiology and Infectious Diseases, Faculty of Veterinary Medicine, Aristotle University of Thessaloniki, Thessaloniki, Greece Abstract Background: Single nucleotide polymorphisms (SNP) have proven to be powerful genetic markers for genetic applications in medicine, life science and agriculture. A variety of methods exist for SNP detection but few can quantify SNP frequencies when the mutated DNA molecules correspond to a small fraction of the wild-type DNA. Furthermore, there is no generally accepted gold standard for SNP quantification, and, in general, currently applied methods give inconsistent results in selected cohorts. In the present study we sought to develop a novel method for accurate detection and quantification of SNP in DNA pooled samples. Methods: The development and evaluation of a novel Ligase Chain Reaction (LCR) protocol that uses a DNA-specific fluorescent dye to allow quantitative real-time analysis is described. Different reaction components and thermocycling parameters affecting the efficiency and specificity of LCR were examined. Several protocols, including gap-LCR modifications, were evaluated using plasmid standard and genomic DNA pools. A protocol of choice was identified and applied for the quantification of a polymorphism at codon 136 of the ovine PRNP gene that is associated with susceptibility to a transmissible spongiform encephalopathy in sheep. Conclusions: The real-time LCR protocol developed in the present study showed high sensitivity, accuracy, reproducibility and a wide dynamic range of SNP quantification in different DNA pools. The limits of detection and quantification of SNP frequencies were 0.085% and 0.35%, respectively. Significance: The proposed real-time LCR protocol is applicable when sensitive detection and accurate quantification of low copy number mutations in DNA pools is needed. Examples include oncogenes and tumour suppressor genes, infectious diseases, pathogenic bacteria, fungal species, viral mutants, drug resistance resulting from point mutations, and genetically modified organisms in food. Citation: Psifidi A, Dovas C, Banos G (2011) Novel Quantitative Real-Time LCR for the Sensitive Detection of SNP Frequencies in Pooled DNA: Method Development, Evaluation and Application. PLoS ONE 6(1): e14560. doi:10.1371/journal.pone.0014560 Editor: Katy C. Kao, Texas A & M University, United States of America Received July 16, 2010; Accepted December 20, 2010; Published January 19, 2011 Copyright: ß 2011 Psifidi et al. This is an open-access article distributed under the terms of the Creative Commons Attribution License, which permits unrestricted use, distribution, and reproduction in any medium, provided the original author and source are credited. Funding: This research was supported by the Sixth Framework Program of the European Commission, project RISKSCRA, grant number: 030278, FPC-2004-SMW- COLL. The funder had no role in study design, data collection and analysis, decision to publish, or preparation of the manuscript. Competing Interests: The authors have declared that no competing interests exist. * E-mail: [email protected] Introduction Single Nucleotide Polymorphisms (SNP) are the most common type of genetic markers and refer to a position where two alternative bases occur at appreciable frequency (.1%) in a population [1]. The identification of SNP is fundamental to basic life science, human hereditary disease diagnosis and pharmacoge- nomics [2,3]. SNP detection is also of great importance to agriculture and animal science, addressing quantitative trait loci (QTL) identification, marker assisted selection, genome mapping, food traceability, parental tests, detection of genetically modified organisms in food and feed, diagnosis of animal genetic diseases, and disease susceptibility. Typically, in genetic diseases caused by mutations in high proportion of DNA, sensitivity of diagnostic assays is not a critical factor for SNP detection. However, in cases where mutated DNA molecules correspond to a small fraction of the wild-type DNA, for example oncogenes or tumour suppressor genes and microbial or viral mutations associated with drug resistance, the sensitivity of SNP detection becomes a critical factor [4]. Estimation of allele frequency is required in a number of applications of great interest that use pooled DNA samples, such as monitoring minimal residual disease in the course of malignant haematopathies and the quantitative assessment of post transplant chimerism. Association studies of non-Mendelian complex diseases have emphasized cost benefits of allele frequency estimation in DNA pools [5] and raised the need for reliable, highly sensitive, fast throughput screening assays. In addition, DNA pooling can reduce the genotyping effort and cost. For example, in milking ruminants, bulk milk (meaning the total amount of milk produced and collected on a given day in a certain farm) has already been used as a source of DNA pooled across all animals raised on the PLoS ONE | www.plosone.org 1 January 2011 | Volume 6 | Issue 1 | e14560
-
Upload
independent -
Category
Documents
-
view
3 -
download
0
Transcript of Novel Quantitative Real-Time LCR for the Sensitive Detection of SNP Frequencies in Pooled DNA:...
Novel Quantitative Real-Time LCR for the SensitiveDetection of SNP Frequencies in Pooled DNA: MethodDevelopment, Evaluation and ApplicationAndroniki Psifidi1, Chrysostomos Dovas2*, Georgios Banos1
1 Department of Animal Production, Faculty of Veterinary Medicine, Aristotle University of Thessaloniki, Thessaloniki, Greece, 2 Laboratory of Microbiology and Infectious
Diseases, Faculty of Veterinary Medicine, Aristotle University of Thessaloniki, Thessaloniki, Greece
Abstract
Background: Single nucleotide polymorphisms (SNP) have proven to be powerful genetic markers for genetic applicationsin medicine, life science and agriculture. A variety of methods exist for SNP detection but few can quantify SNP frequencieswhen the mutated DNA molecules correspond to a small fraction of the wild-type DNA. Furthermore, there is no generallyaccepted gold standard for SNP quantification, and, in general, currently applied methods give inconsistent results inselected cohorts. In the present study we sought to develop a novel method for accurate detection and quantification ofSNP in DNA pooled samples.
Methods: The development and evaluation of a novel Ligase Chain Reaction (LCR) protocol that uses a DNA-specificfluorescent dye to allow quantitative real-time analysis is described. Different reaction components and thermocyclingparameters affecting the efficiency and specificity of LCR were examined. Several protocols, including gap-LCRmodifications, were evaluated using plasmid standard and genomic DNA pools. A protocol of choice was identified andapplied for the quantification of a polymorphism at codon 136 of the ovine PRNP gene that is associated with susceptibilityto a transmissible spongiform encephalopathy in sheep.
Conclusions: The real-time LCR protocol developed in the present study showed high sensitivity, accuracy, reproducibilityand a wide dynamic range of SNP quantification in different DNA pools. The limits of detection and quantification of SNPfrequencies were 0.085% and 0.35%, respectively.
Significance: The proposed real-time LCR protocol is applicable when sensitive detection and accurate quantification of lowcopy number mutations in DNA pools is needed. Examples include oncogenes and tumour suppressor genes, infectiousdiseases, pathogenic bacteria, fungal species, viral mutants, drug resistance resulting from point mutations, and geneticallymodified organisms in food.
Citation: Psifidi A, Dovas C, Banos G (2011) Novel Quantitative Real-Time LCR for the Sensitive Detection of SNP Frequencies in Pooled DNA: MethodDevelopment, Evaluation and Application. PLoS ONE 6(1): e14560. doi:10.1371/journal.pone.0014560
Editor: Katy C. Kao, Texas A & M University, United States of America
Received July 16, 2010; Accepted December 20, 2010; Published January 19, 2011
Copyright: � 2011 Psifidi et al. This is an open-access article distributed under the terms of the Creative Commons Attribution License, which permitsunrestricted use, distribution, and reproduction in any medium, provided the original author and source are credited.
Funding: This research was supported by the Sixth Framework Program of the European Commission, project RISKSCRA, grant number: 030278, FPC-2004-SMW-COLL. The funder had no role in study design, data collection and analysis, decision to publish, or preparation of the manuscript.
Competing Interests: The authors have declared that no competing interests exist.
* E-mail: [email protected]
Introduction
Single Nucleotide Polymorphisms (SNP) are the most common
type of genetic markers and refer to a position where two
alternative bases occur at appreciable frequency (.1%) in a
population [1]. The identification of SNP is fundamental to basic
life science, human hereditary disease diagnosis and pharmacoge-
nomics [2,3]. SNP detection is also of great importance to
agriculture and animal science, addressing quantitative trait loci
(QTL) identification, marker assisted selection, genome mapping,
food traceability, parental tests, detection of genetically modified
organisms in food and feed, diagnosis of animal genetic diseases,
and disease susceptibility.
Typically, in genetic diseases caused by mutations in high
proportion of DNA, sensitivity of diagnostic assays is not a critical
factor for SNP detection. However, in cases where mutated DNA
molecules correspond to a small fraction of the wild-type DNA, for
example oncogenes or tumour suppressor genes and microbial or
viral mutations associated with drug resistance, the sensitivity of
SNP detection becomes a critical factor [4].
Estimation of allele frequency is required in a number of
applications of great interest that use pooled DNA samples, such as
monitoring minimal residual disease in the course of malignant
haematopathies and the quantitative assessment of post transplant
chimerism. Association studies of non-Mendelian complex diseases
have emphasized cost benefits of allele frequency estimation in
DNA pools [5] and raised the need for reliable, highly sensitive,
fast throughput screening assays. In addition, DNA pooling can
reduce the genotyping effort and cost. For example, in milking
ruminants, bulk milk (meaning the total amount of milk produced
and collected on a given day in a certain farm) has already been
used as a source of DNA pooled across all animals raised on the
PLoS ONE | www.plosone.org 1 January 2011 | Volume 6 | Issue 1 | e14560
farm, for selective genotyping in marker assisted selection studies,
QTL detection and gene mapping projects [6,7].
Current methods of SNP detection differ in accuracy, sensitivity
and throughput. Traditional procedures such as restriction
fragment length polymorphism (RFLP), denaturation gradient
gel electrophoresis and chemical cleavage of mismatched hetero-
duplexes are labour intensive, non-automated processes and, most
importantly, lack sensitivity [4]. Therefore, a large number of
more sensitive and selective approaches for SNP detection have
been introduced in recent years. In general, each method bases
SNP detection on one of the following procedures: hybridization,
invasive cleavage, oligonucleotide ligation, and primer extension
using either allele-specific nucleotide incorporation or allele-
specific Polymerase Chain Reaction (PCR) [8]. The products of
such procedures are usually analyzed with gel separation, arrays,
mass spectrometry, or fluorescence plate reader techniques [9].
Some of these techniques have been also found suitable for the
quantification of SNP. These include fluorescence in situ
hybridization, denaturing HPLC [10], bioluminometric assay
[11], real-time PCR [3], oligo-ligation assay, Invader assayTM
(Third Wave Technologies Inc), DNA chips [12] and Pyrose-
quencing [13]. To date, however, there is not a generally accepted
golden standard method for SNP quantification, and, in general,
currently applied methods give inconsistent results in selected
cohorts.
Real-time PCR has been extensively used for the detection and
quantification of SNP in DNA pools. Detection and quantification
limits of this technique vary among individual SNP, ranging
between 1% to 25% [14,15]. Nevertheless, such limits are not
adequate in cases of testing blood for early detection of cancer,
monitoring disease progression and assessing response to therapy
[16,17], where sensitivity at levels greater than 1:1000 might be
required.
Ligase Chain Reaction (LCR) is another DNA amplification
method developed as an alternative to PCR [18]. LCR evolved as
a very promising diagnostic technique that is often utilized in
conjunction with a primary PCR amplification. LCR employs a
thermostable ligase and allows the discrimination of SNP. Two
complementary pairs of DNA oligonucleotides are utilized and
exponential signal amplification analogous to PCR is achieved.
However, although conventional LCR is characterized by highly
specificity of ligation, background ligation in the absence of
template may still occur at a low level [19]. In order to prevent this
template-independent ligation, another LCR protocol, gap-LCR,
has been developed [18,20]. Gap-LCR utilizes a DNA polymerase
to seal a gap at the site of point mutation between adjacent
oligonucleotides and a DNA ligase, to seal the nick between them
[18,4,20]. However, the fact that, to this date, both LCR and gap-
LCR are gel based separation methods limits their use for high
throughput applications [21].
In recent years, new methods that combined LCR with
detection systems thereby alleviating the laborious gel separation
problem have been reported. For example, labelling of LCR
oligonucleotides with biotin and digoxigenin, combined with an
ELISA-based detection system permitted sensitivity increase and
ease of LCR applications [22]. Increased sensitivity was also
attained when asymmetric gap-LCR products were detected by
microparticle enzyme immunoassay [23]. A gap-LCR assay has
also been combined with a fluorescence polystyrene microsphere
measurement platform that allows multiplex analysis of SNP [24].
Despite several reports of improvements in LCR detection
systems, these refer mainly in the sensitivity of SNP detection and
not the quantification potential of LCR. Only recently, a semi-
quantitative real-time gap-LCR assay, coupled with PCR, for the
sensitive detection of p53 mutation at low levels in surgical margins
of tumours was reported [19]. In this case, oligonucleotides labelled
with FAM and TAMRA were used for visualization of the LCR
products during amplification [19]. This assay required modifica-
tion of the real-time platform to accommodate excitation of FAM at
494 nm and detection of TAMRA emission at 605 nm. In addition,
purification and quantification of the PCR amplicons was required
before they could be used as templates for the LCR.
The objective of this study was to develop a quantitative real-
time LCR-based method for the sensitive detection and accurate
quantification of SNP in DNA pools suitable for routinely
performed high throughput diagnostics. This novel protocol
combined the advantages of LCR detection with the use of a
DNA binding fluorescent dye to allow quantitative real-time
analysis. The effect of different parameters, such as reaction
components, thermocycling conditions and oligonucleotide ther-
modynamic properties, in the specificity and efficiency of this real-
time LCR protocol were studied. Modifications of the method
(gap-LCR) were also introduced and evaluated. An ovine SNP
associated with susceptibility to scrapie was used as a model in this
study. Scrapie is a fatal degenerative disorder of small ruminants’
central nervous system that belongs to the transmissible spongi-
form encephalopathies. More specifically, a mutation at codon 136
of the ovine PRNP gene, which changes from GCC to GTC,
coding alanine (A136) and valine (V136), respectively, and increases
susceptibility to the disease, was detected and quantified in plasmid
and genomic DNA pools. The allele V136 was selected because it is
usually detected at very low frequencies depending mainly on the
breed of sheep. In the present study, milk samples from the highest
milk producing and most prolific Greek dairy sheep breed, Chios,
were examined, where a 0.4% V136 frequency across the
population has been reported [25].
Materials and Methods
Sample collection and individual genotypingIndividual milk samples were taken from 60 ewes of the Chios
dairy breed of sheep raised in 5 different flocks at the northern part
of Greece. Milk samples were collected in 50 ml tubes in the
milking parlour, under aseptic conditions, and were immediately
placed in isothermic boxes and transferred to the laboratory. Milk
sampling took place during the routine milking process in the farm
and no animals were treated, handled or otherwise inconve-
nienced.
Genomic DNA was isolated from these milk samples using a
commercial kit, NucleospinH Blood (Mackerey-Nagel, Duren,
Germany), modified properly for milk conditions [26]. All samples
were genotyped for the PRNP gene using a RFLP analysis protocol
[27], modified by using a different upstream primer PrPov1:
GTCAAGGTGGTAGCCACA. The specificity of RFLP analysis
was verified by sequencing 21 of these samples.
Preparation of plasmid and genomic standard poolsPrimers CLPRNP-F (59-CAT GAA GCA TGT GGC AGG
AGC TG-39) and CLPRNP-R (59- ACC ACT ACA GGG CTG
CAG GTA GAC-39) were used to amplify a 261 base pair (bp)
fragment of the PRNP gene of a previously detected heterozygous
ewe, containing the mutant V136 and the wild-type A136 allele.
The amplicons were cloned into PCRHII-TOPOH vector
(Invitrogen, Karlsruhe, Germany). Plasmid DNA was extracted
using the Nucleospin Plasmid kit (Macherey-Nagel, Duren,
Germany) and linearized with NotI-HFTM (New England Biolabs
Inc., MA, USA). Selection of clones containing V136 or A136 was
based on restriction analysis using BspHI (New England Biolabs
Quantitative Real-Time LCR
PLoS ONE | www.plosone.org 2 January 2011 | Volume 6 | Issue 1 | e14560
Inc., MA, USA). The concentration of plasmid DNA samples was
determined by spectrophotometry. Stocks from two selected
plasmid clones (V136 and A136) were diluted with 10 mM Tris
buffer to obtain solutions containing 1011 copies/ml. DNA pools
with a total number of 5?109 copies/ml, defined as mutant DNA
frequencies of 100%, 25%, 6.25%, 1.56% and 0.39%, were
generated by serial dilutions of mutant V136 plasmid DNA in 1:4
ratios with the wild-type A136 plasmid DNA. These pooled
plasmid DNA samples were used to obtain a standard curve, in
order to assess linearity and amplification efficiency, variability,
dynamic range of quantification, and detection limit of the method
described below.
In addition, genomic DNA pools were prepared from extracted
samples containing the V136 polymorphism at different pre-
determined frequencies (50%, 25%, 6.25%, 1.56%, and 0.39%).
These were created by mixing equimolar genomic DNA extracts
from homozygous V136 (mutant DNA) and A136 (wild-type)
individuals that were quantified by spectrophotometry. For each
frequency, four different DNA pools were prepared using extracts
from different individuals. These genomic DNA pools were used to
test the accuracy of quantification of the method described below.
Method description for SNP detection and quantificationBasic protocol. A quantitative real-time LCR protocol was
developed to assess the prevalence of mutant (V136) polymorphism
in extracts from DNA pools (genomic or plasmid) and natural
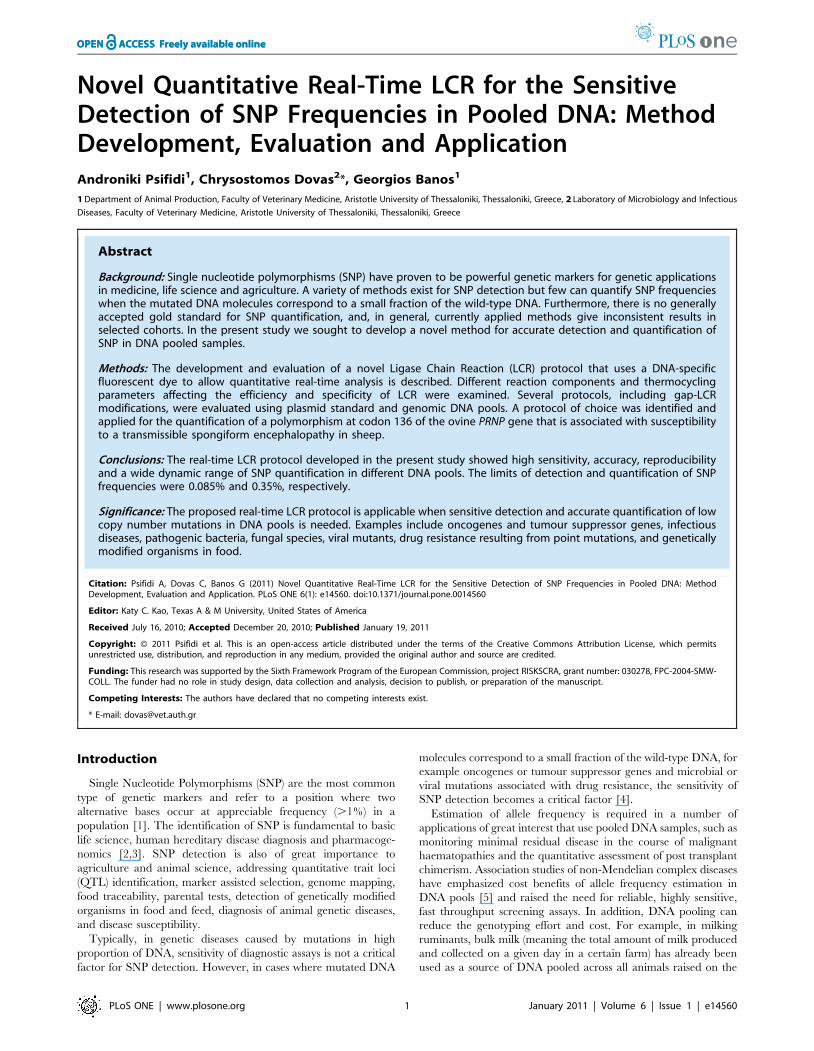
extracts from individual ovine milk samples. The full process is
illustrated in Figure 1.
Prerequisite for accurate quantification of mutant DNA by real-
time LCR was the different templates to be equimolar. For this
reason, after the isolation of genomic DNA, a real-time PCR
which amplified a genomic region containing the SNP was
introduced (Figure 2). Due to the PCR amplification plateau
effect, it was expected that the final PCR products would be
equimolar irrespectively of the initial DNA concentration of the
different DNA extracts. The use of a DNA intercalating dye
(EvaGreen) permitted the monitoring of concentration of the PCR
products [28,29]. For this purpose, two primers, PRNPf (GGCC-
TTGGTGGCTACATGCTGGGA) and PRNPr (CCCTTGG-
TGGTGGTGGTGACTGTGTG) targeting a 216 bp PRNP
genomic region were designed. One ml of plasmid or extracted
DNA was added to a 20 ml reaction mixture. The PCR reactions
were optimized for standard cycling conditions with an initial
denaturation step at 95uC (3 min), followed by 42 cycles of
denaturation at 95uC (30 s) and annealing at 65uC (1 min), using
the Mx3005P QPCR system (Stratagene Co., La Jolla, CA).
Optimal reaction conditions for PCR were determined as follows:
0.5 units of PlatinumH Taq DNA polymerase (Invitrogen, The
Netherlands), 2 ml PCR buffer (10X), 200 mM each dATP, dCTP,
dGTP, and dTTP, 2 mM MgCl2, 1 ml DNA-specific fluorescent
dye EvaGreenTM (Biotium, Hayward, CA, USA) (20X), 0.2 mM
PRNPf and 0.2 mM PRNPr gene specific primers (Table 1), and
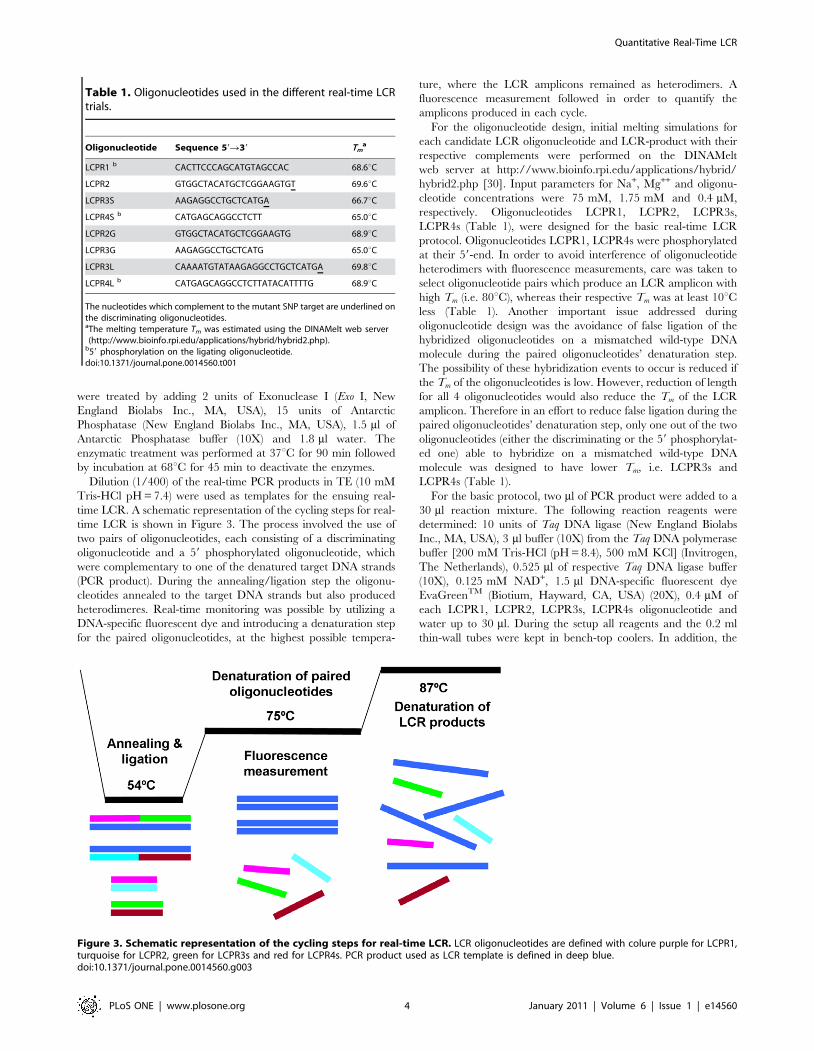
water up to 20 ml. All samples were run in triplicates. The plateau
of the amplification curve for each sample was required to lie
within three standard deviations of the mean. Samples with a
plateau that deviated from the mean by more than three standard
deviations were excluded from the real-time LCR trials and were
re-amplified in a subsequent PCR.
A treatment of PCR products with Exonuclease I and Antarctic
Phosphatase followed in order to digest all single stranded DNA
(PCR products and primers) and dephosphorylate the remaining
dNTPs respectively (Figure 1). Specifically, 10 ml of PCR product
Figure 1. Schematic representation of the entire process for SNP detection and quantification.doi:10.1371/journal.pone.0014560.g001
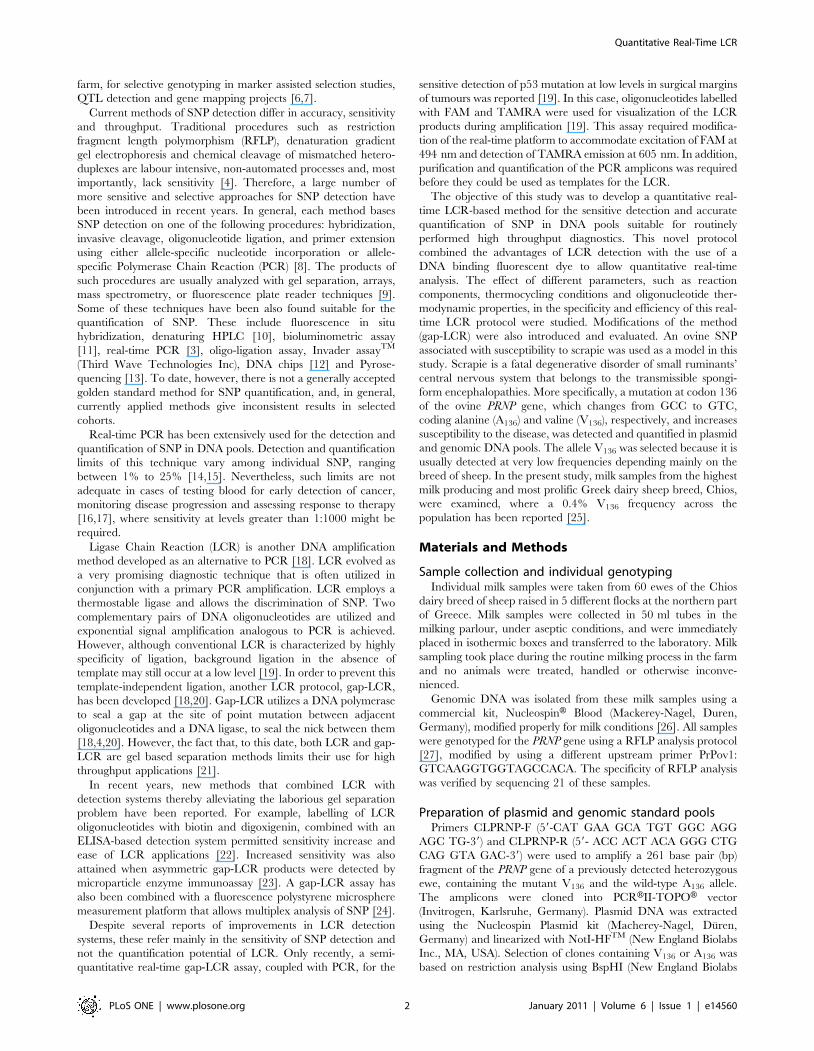
Figure 2. Real-time PCR amplification curves of genomic DNA isolated from different animals.doi:10.1371/journal.pone.0014560.g002
Quantitative Real-Time LCR
PLoS ONE | www.plosone.org 3 January 2011 | Volume 6 | Issue 1 | e14560
were treated by adding 2 units of Exonuclease I (Exo I, New
England Biolabs Inc., MA, USA), 15 units of Antarctic
Phosphatase (New England Biolabs Inc., MA, USA), 1.5 ml of
Antarctic Phosphatase buffer (10X) and 1.8 ml water. The
enzymatic treatment was performed at 37uC for 90 min followed
by incubation at 68uC for 45 min to deactivate the enzymes.
Dilution (1/400) of the real-time PCR products in TE (10 mM
Tris-HCl pH = 7.4) were used as templates for the ensuing real-
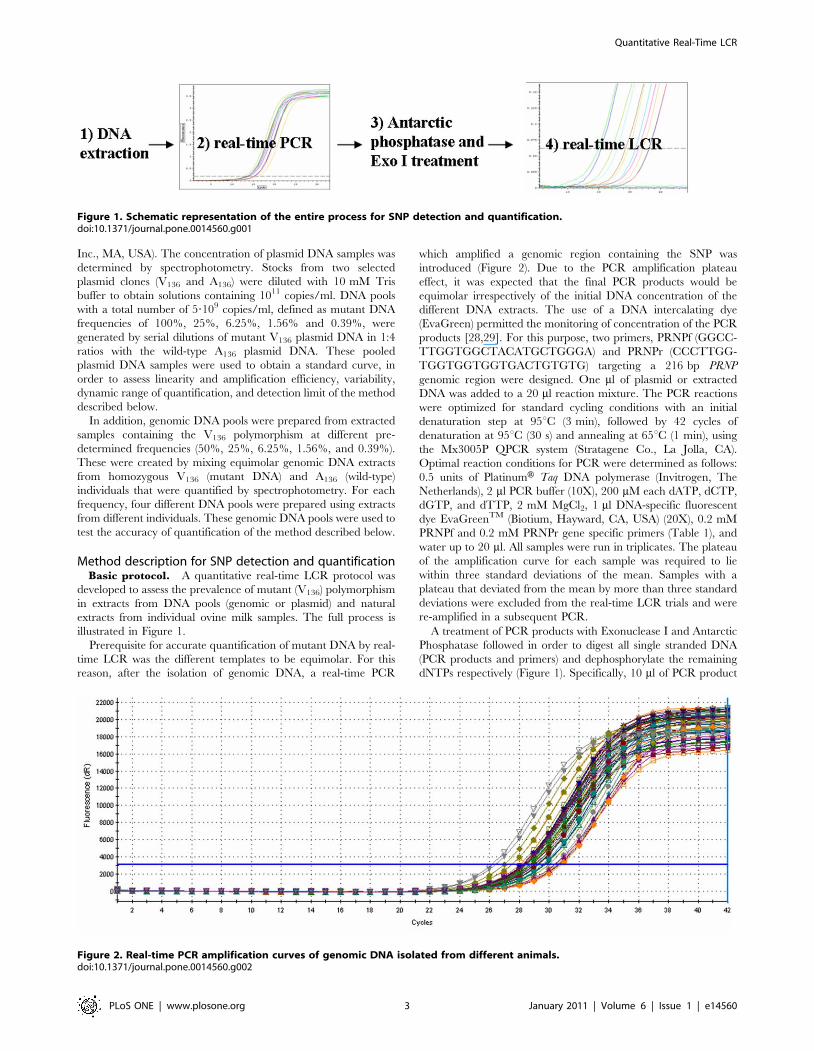
time LCR. A schematic representation of the cycling steps for real-
time LCR is shown in Figure 3. The process involved the use of
two pairs of oligonucleotides, each consisting of a discriminating
oligonucleotide and a 59 phosphorylated oligonucleotide, which
were complementary to one of the denatured target DNA strands
(PCR product). During the annealing/ligation step the oligonu-
cleotides annealed to the target DNA strands but also produced
heterodimeres. Real-time monitoring was possible by utilizing a
DNA-specific fluorescent dye and introducing a denaturation step
for the paired oligonucleotides, at the highest possible tempera-
ture, where the LCR amplicons remained as heterodimers. A
fluorescence measurement followed in order to quantify the
amplicons produced in each cycle.
For the oligonucleotide design, initial melting simulations for
each candidate LCR oligonucleotide and LCR-product with their
respective complements were performed on the DINAMelt
web server at http://www.bioinfo.rpi.edu/applications/hybrid/
hybrid2.php [30]. Input parameters for Na+, Mg++ and oligonu-
cleotide concentrations were 75 mM, 1.75 mM and 0.4 mM,
respectively. Oligonucleotides LCPR1, LCPR2, LCPR3s,
LCPR4s (Table 1), were designed for the basic real-time LCR
protocol. Oligonucleotides LCPR1, LCPR4s were phosphorylated
at their 59-end. In order to avoid interference of oligonucleotide
heterodimers with fluorescence measurements, care was taken to
select oligonucleotide pairs which produce an LCR amplicon with
high Tm (i.e. 80uC), whereas their respective Tm was at least 10uCless (Table 1). Another important issue addressed during
oligonucleotide design was the avoidance of false ligation of the
hybridized oligonucleotides on a mismatched wild-type DNA
molecule during the paired oligonucleotides’ denaturation step.
The possibility of these hybridization events to occur is reduced if
the Tm of the oligonucleotides is low. However, reduction of length
for all 4 oligonucleotides would also reduce the Tm of the LCR
amplicon. Therefore in an effort to reduce false ligation during the
paired oligonucleotides’ denaturation step, only one out of the two
oligonucleotides (either the discriminating or the 59 phosphorylat-
ed one) able to hybridize on a mismatched wild-type DNA
molecule was designed to have lower Tm, i.e. LCPR3s and
LCPR4s (Table 1).
For the basic protocol, two ml of PCR product were added to a
30 ml reaction mixture. The following reaction reagents were
determined: 10 units of Taq DNA ligase (New England Biolabs
Inc., MA, USA), 3 ml buffer (10X) from the Taq DNA polymerase
buffer [200 mM Tris-HCl (pH = 8.4), 500 mM KCl] (Invitrogen,
The Netherlands), 0.525 ml of respective Taq DNA ligase buffer
(10X), 0.125 mM NAD+, 1.5 ml DNA-specific fluorescent dye
EvaGreenTM (Biotium, Hayward, CA, USA) (20X), 0.4 mM of
each LCPR1, LCPR2, LCPR3s, LCPR4s oligonucleotide and
water up to 30 ml. During the setup all reagents and the 0.2 ml
thin-wall tubes were kept in bench-top coolers. In addition, the
Table 1. Oligonucleotides used in the different real-time LCRtrials.
Oligonucleotide Sequence 59R39 Tma
LCPR1 b CACTTCCCAGCATGTAGCCAC 68.6uC
LCPR2 GTGGCTACATGCTCGGAAGTGT 69.6uC
LCPR3S AAGAGGCCTGCTCATGA 66.7uC
LCPR4S b CATGAGCAGGCCTCTT 65.0uC
LCPR2G GTGGCTACATGCTCGGAAGTG 68.9uC
LCPR3G AAGAGGCCTGCTCATG 65.0uC
LCPR3L CAAAATGTATAAGAGGCCTGCTCATGA 69.8uC
LCPR4L b CATGAGCAGGCCTCTTATACATTTTG 68.9uC
The nucleotides which complement to the mutant SNP target are underlined onthe discriminating oligonucleotides.aThe melting temperature Tm was estimated using the DINAMelt web server(http://www.bioinfo.rpi.edu/applications/hybrid/hybrid2.php).
b59 phosphorylation on the ligating oligonucleotide.doi:10.1371/journal.pone.0014560.t001
Figure 3. Schematic representation of the cycling steps for real-time LCR. LCR oligonucleotides are defined with colure purple for LCPR1,turquoise for LCPR2, green for LCPR3s and red for LCPR4s. PCR product used as LCR template is defined in deep blue.doi:10.1371/journal.pone.0014560.g003
Quantitative Real-Time LCR
PLoS ONE | www.plosone.org 4 January 2011 | Volume 6 | Issue 1 | e14560
Taq-ligase buffer was split into small aliquots in order to avoid
multiple thawing that may affect the efficiency of the process.
Thermocycling was applied using the Mx3005P QPCR system
(Stratagene Co., La Jolla, CA, USA). Specific conditions included
three initial steps consisting of a PCR-amplicon denaturation step
at 92uC (30 s), an annealing/ligation step at 54uC (6 s) and a
second denaturation step at 92uC (30 s), followed by 39 LCR
cycles, each one consisting of an annealing/ligation step at 54uC(6 s), a paired oligonucleotides’ denaturation step at 75uC (30 s),
where fluorescence measurement also was taken place, and an
LCR product denaturation step at 87uC (20 s). At the end of
amplification, a denaturation/renaturation cycle was included by
heating at 95uC (5 min) followed by cooling at 74uC (3 min) to
promote LCR-amplicon duplex formation, and at 37uC (1 min)
for oligonucleotide duplex formation. A melting curve analysis
followed. The EvaGreenTM was detected in the FAM channel
using a gain setting of 8. The analysis of fluorescence data was
conducted using the MxPro-Mx3005P software (Version 4.00;
Stratagene, La Jolla, CA, USA). The baseline was adaptive and
the threshold fluorescence levels used to derive threshold cycle (Ct)
values were determined automatically. All individual samples were
run in triplicates. Non-template controls containing all reagents
minus the DNA template were included, to monitor the progress
of template-independent ligation.
For the estimation of mutant DNA frequencies (%) standard
curves were produced by plotting the threshold cycle values (Ct
values) versus the logarithm of % frequency of mutant (V136) DNA
in the standard plasmid DNA pools.
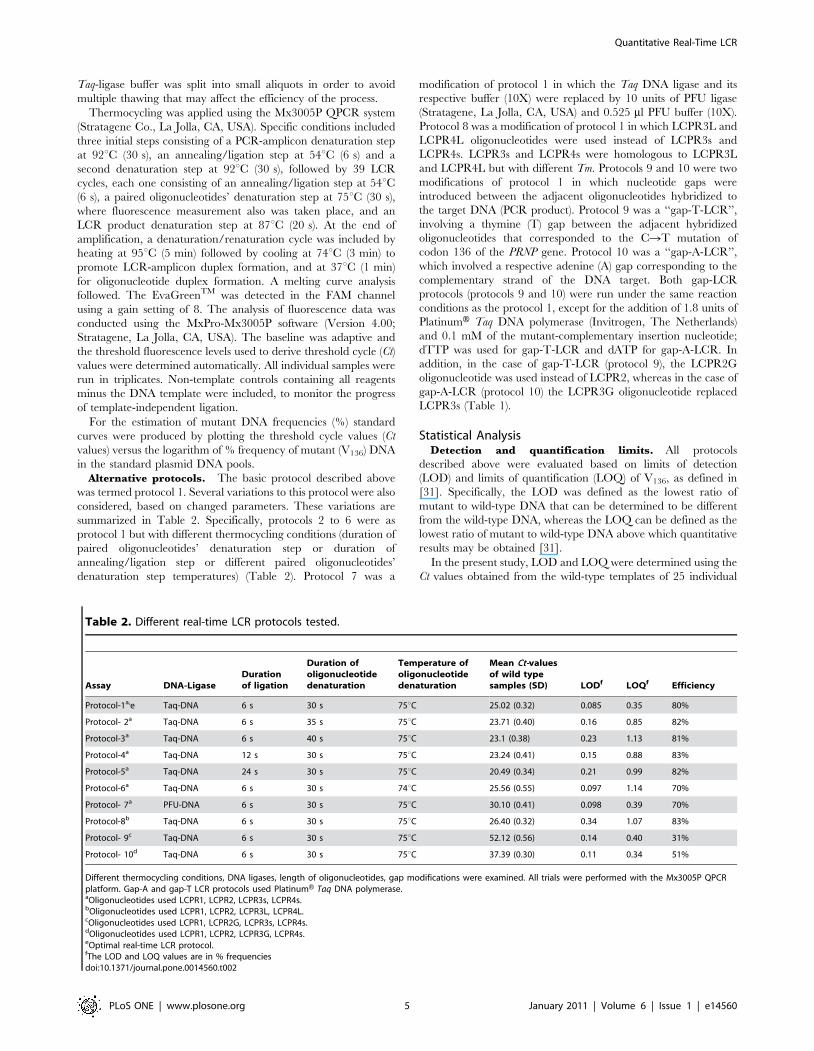
Alternative protocols. The basic protocol described above
was termed protocol 1. Several variations to this protocol were also
considered, based on changed parameters. These variations are
summarized in Table 2. Specifically, protocols 2 to 6 were as
protocol 1 but with different thermocycling conditions (duration of
paired oligonucleotides’ denaturation step or duration of
annealing/ligation step or different paired oligonucleotides’
denaturation step temperatures) (Table 2). Protocol 7 was a
modification of protocol 1 in which the Taq DNA ligase and its
respective buffer (10X) were replaced by 10 units of PFU ligase
(Stratagene, La Jolla, CA, USA) and 0.525 ml PFU buffer (10X).
Protocol 8 was a modification of protocol 1 in which LCPR3L and
LCPR4L oligonucleotides were used instead of LCPR3s and
LCPR4s. LCPR3s and LCPR4s were homologous to LCPR3L
and LCPR4L but with different Tm. Protocols 9 and 10 were two
modifications of protocol 1 in which nucleotide gaps were
introduced between the adjacent oligonucleotides hybridized to
the target DNA (PCR product). Protocol 9 was a ‘‘gap-T-LCR’’,
involving a thymine (T) gap between the adjacent hybridized
oligonucleotides that corresponded to the CRT mutation of
codon 136 of the PRNP gene. Protocol 10 was a ‘‘gap-A-LCR’’,
which involved a respective adenine (A) gap corresponding to the
complementary strand of the DNA target. Both gap-LCR
protocols (protocols 9 and 10) were run under the same reaction
conditions as the protocol 1, except for the addition of 1.8 units of
PlatinumH Taq DNA polymerase (Invitrogen, The Netherlands)
and 0.1 mM of the mutant-complementary insertion nucleotide;
dTTP was used for gap-T-LCR and dATP for gap-A-LCR. In
addition, in the case of gap-T-LCR (protocol 9), the LCPR2G
oligonucleotide was used instead of LCPR2, whereas in the case of
gap-A-LCR (protocol 10) the LCPR3G oligonucleotide replaced
LCPR3s (Table 1).
Statistical AnalysisDetection and quantification limits. All protocols
described above were evaluated based on limits of detection
(LOD) and limits of quantification (LOQ) of V136, as defined in
[31]. Specifically, the LOD was defined as the lowest ratio of
mutant to wild-type DNA that can be determined to be different
from the wild-type DNA, whereas the LOQ can be defined as the
lowest ratio of mutant to wild-type DNA above which quantitative
results may be obtained [31].
In the present study, LOD and LOQ were determined using the
Ct values obtained from the wild-type templates of 25 individual
Table 2. Different real-time LCR protocols tested.
Assay DNA-LigaseDurationof ligation
Duration ofoligonucleotidedenaturation
Temperature ofoligonucleotidedenaturation
Mean Ct-valuesof wild typesamples (SD) LODf LOQf Efficiency
Protocol-1a,e Taq-DNA 6 s 30 s 75uC 25.02 (0.32) 0.085 0.35 80%
Protocol- 2a Taq-DNA 6 s 35 s 75uC 23.71 (0.40) 0.16 0.85 82%
Protocol-3a Taq-DNA 6 s 40 s 75uC 23.1 (0.38) 0.23 1.13 81%
Protocol-4a Taq-DNA 12 s 30 s 75uC 23.24 (0.41) 0.15 0.88 83%
Protocol-5a Taq-DNA 24 s 30 s 75uC 20.49 (0.34) 0.21 0.99 82%
Protocol-6a Taq-DNA 6 s 30 s 74uC 25.56 (0.55) 0.097 1.14 70%
Protocol- 7a PFU-DNA 6 s 30 s 75uC 30.10 (0.41) 0.098 0.39 70%
Protocol-8b Taq-DNA 6 s 30 s 75uC 26.40 (0.32) 0.34 1.07 83%
Protocol- 9c Taq-DNA 6 s 30 s 75uC 52.12 (0.56) 0.14 0.40 31%
Protocol- 10d Taq-DNA 6 s 30 s 75uC 37.39 (0.30) 0.11 0.34 51%
Different thermocycling conditions, DNA ligases, length of oligonucleotides, gap modifications were examined. All trials were performed with the Mx3005P QPCRplatform. Gap-A and gap-T LCR protocols used PlatinumH Taq DNA polymerase.aOligonucleotides used LCPR1, LCPR2, LCPR3s, LCPR4s.bOligonucleotides used LCPR1, LCPR2, LCPR3L, LCPR4L.cOligonucleotides used LCPR1, LCPR2G, LCPR3s, LCPR4s.dOligonucleotides used LCPR1, LCPR2, LCPR3G, LCPR4s.eOptimal real-time LCR protocol.fThe LOD and LOQ values are in % frequenciesdoi:10.1371/journal.pone.0014560.t002
Quantitative Real-Time LCR
PLoS ONE | www.plosone.org 5 January 2011 | Volume 6 | Issue 1 | e14560
samples. These Ct-values were first tested for normality using the
Kolmogorov-Smirnov and Shapiro-Wilk tests. Both tests showed
that Ct-values followed a normal distribution. Subsequently, LOD
and LOQ were calculated according to the following formulae:
LOD~Xwt+3swt
LOQ~Xwt+10swt
where Xwt is the mean Ct value and swt is the standard deviation
of the wild-type DNA Ct measurements. In practical terms, LOD
was set at the concentration that gives a signal equal to three times
the standard deviation of the wild-type sample measurements [32].
The three-standard deviation criterion represents a 99.73%
probability that the value is above the background level. Similarly,
LOQ was set at ten times the standard deviation of the wild-type
sample measurements, representing a corresponding probability
higher than 99.99% [32]. Finally, LOD and LOQ were expressed
as mutant-type frequencies (%) by fitting a standard curve
generated by the standard plasmid DNA pools.
Further protocol comparisons were made between average Ct-
values from the analysis of samples with the lowest known mutant
(0.39% V136) frequency, used for the determination of the
standard curves, with samples with 100% wild-type (A136)
frequency. A t-test was used in this regard. All protocols shown
in Table 2 were tested.
Linearity and efficiency. Linearity and efficiency of the
protocols were assessed using a standard curve constructed by the
amplification of plasmid standard pools with a total number of
5?109 copies/ml including different mutant DNA frequencies,
ranging from 100% to 0.39%. Efficiency (E) was calculated using
the equation: E = 10 (21/slope) -1; slope was estimated directly by
the MxPro-Mx3005P software (Version 4.00; Stratagene, La Jolla,
CA, USA).
Determination of reproducibility. To assess the reproduci-
bility of the basic real-time LCR protocol, the intra-assay and
inter-assay coefficients of variation (CV) were evaluated, based on
the measured mutant V136 frequencies (%) in the DNA pools. For
intra-assay CV calculation, standard plasmid pools were applied in
eight replicates at each concentration level of the mutant V136, in
one trial run. For inter-assay CV calculation, the plasmid standard
pools were applied three-fold in three different trial runs
performed on different days using freshly prepared reagents.
Accuracy of quantification using genomic DNA pools and
natural samples of individual animals. The accuracy of the
basic real-time LCR protocol for mutant DNA quantification was
assessed by testing the genomic DNA pools prepared from
extracted samples containing the V136 polymorphism at different
pre-determined frequencies (50%, 25%, 6.25%, 1.56%, and
0.39%). For each frequency, four different DNA pools were
tested. Furthermore, each of these pools was tested in four
replicates and the V136 frequency was calculated by plotting the
mean Ct value in a standard curve created by the plasmid stan-
dard pools (100%, 25%, 6.25%, 1.56%, and 0.39%) that were
included in the same trial. A linear regression analysis of the
estimated mutant (V136) log10 frequencies on the actual (known)
log10 frequencies was performed to test the quantification
accuracy.
In addition, all 60 individual animal samples that had been
genotyped with RFLP analysis were re-tested with the basic real-
time LCR protocol in order to detect and quantify V136 mutant
DNA.
Results and Discussion
Real-time PCR amplification and treatment withExonuclease I and Antarctic Phosphatase
The first step introduced was a real-time PCR, which amplified
a genomic region containing the SNP in order to develop the
template needed for the ensuing LCR protocols. DNA quantifi-
cation became possible using the intercalating DNA dye, Eva-
Green [28,29]. Previously, in a real-time PCR platform the
intensity of fluorescence was found to be proportional to the total
amount of the DNA in the tube [28]. In the present study, real
time PCR amplification curve plateaus indicated that equimolar
PCR products were amplified, as approximately 99.9% of the
samples gave fluorescence plateau intensities with low variability
(CV = 11%), irrespectively of their original DNA concentrations;
the latter were substantially different, as evidenced by their
respective Ct values that ranged from 26.1 to 30.9 cycles,
suggesting a difference in DNA quantity of up to 27.8-folds
(efficiency 100%) (Figure 2). A very low number of samples,
approximately 0.1%, showed plateaus outside the 63 SD range
from the mean and were not included in the ensuing LCR trials.
Thus, with the incorporation of this real-time PCR step, the vast
majority of samples could be subsequently tested reliably in the
real-time LCR, irrespectively of their original DNA concentration.
Furthermore, in order to assess the effect of different
concentrations of extracted DNA on the final real-time LCR
results, 3 serial 10-fold dilutions of a heterozygous A136/V136
genomic DNA extract were tested; DNA extract dilutions had
been prepared using TE (10 mM Tris-HCl, pH = 7.4). Real-time
amplification results showed different Ct values, as expected due to
different dilutions, but similar fluorescence plateaus (data not
shown). In all cases, the basic real-time LCR protocol determined
the correct (50%) percentage of V136, showing that the method is
not dependent on the initial DNA concentration of the extract.
Hence, the method may be applicable to cases where minute
amounts of DNA are available (e.g. forensics, cancer biopsies with
limited number of cells etc).
In addition, the necessity of PCR-product treatment with
Antarctic Phosphatase and Exonuclease I was demonstrated by
running LCR trials using real-time PCR products that had not
been previously treated with these enzymes (data not shown). The
samples that had not been subjected to this treatment, showed very
high Ct variability and low mean-Ct value compared to the treated
samples. Lower Ct values obtained from PCR products that had
not been treated with Antarctic phosphatase and Exonuclease I
could be attributed either to polymerization events during the
LCR due to the presence of residual Taq polymerase and dNTPs,
or possible presence of ssDNA amplicons that could provide a
template for false ligation events during the LCR setup. Both
events were avoided by the simultaneous treatment with Antarctic
phosphatase and Exonuclease I, which permitted the dephosphor-
ylation of residual dNTPs and degradation of PCR primers along
with potential ssDNA amplicons. Therefore the need for
incorporating a laborious purification step of the PCR product
was alleviated.
Evaluation of the method for SNP detection andquantification
Impact of different parameters on detection and
quantification limits. Results pertaining to the impact of the
different parameters, as illustrated by the ten protocols, are shown
at Table 2. It became obvious that the extent of SNP
discrimination depended mainly on the thermocycling condi-
tions. Trials with different thermocycling parameters (Protocols 1
Quantitative Real-Time LCR
PLoS ONE | www.plosone.org 6 January 2011 | Volume 6 | Issue 1 | e14560

to 6) showed that the duration of annealing/ligation and paired
oligonucleotides’ denaturation steps, along with the temperature of
paired oligonucleotides’ denaturation step, were determining
factors for the specificity of ligation. These parameters changed
the Ct values of the wild-type samples and, therefore, LOD and
LOQ were affected. Higher time duration of annealing/ligation
and paired oligonucleotides’ denaturation steps, increased
(worsened) both LOD and LOQ (Table 2). These results could
be attributed to non-specific ligation events during these steps.
Such events can occur due to false ligation of oligonucleotides
hybridized on mismatched wild-type DNA molecules [19] as well
as sticky-end ligation of the paired oligonucleotides [18]. Both
non-specific ligation events pose limitations on the LOD and LOQ
of the real-time LCR because they lead to non-specific
background signals. Therefore, short time period for both steps
is crucial. Minimum duration of annealing/ligation (6 s) and
paired oligonucleotides’ denaturation (30 s) steps (protocol 1)
proved to be the optimum for obtaining low LOD and LOQ
values. Additional control trials showed that, when the paired
oligonucleotides’ denaturation step temperature was reduced from
75uC (protocol 1) to 74uC (protocol 6), the LOD and LOQ values
were considerably increased (Table 2). At lower oligonucleotides’
denaturation step temperatures than the proposed one (75uC), the
ligase has more time to exhibit non-specific activity due to the
presence of oligonucleotides hybridized on mismatched wild-type
DNA molecules. The initial selection of temperatures for real-time
LCR cycling steps was based on melting simulations for each
candidate LCR oligonucleotide and LCR product, with their
respective complements. The most important criteria for
temperature selection were maximum concentrations of LCR
amplicon heterodimers and minimum concentrations for
oligonucleotide heterodimers during fluorescence measurement
(Figure 4). Nevertheless, as results of the present study illustrated,
delicate adjustments of temperature and duration of this step are
important for optimum sensitivity of SNP discrimination in DNA
pools.
In an effort to reduce false ligation during the paired
oligonucleotides’ denaturation step, one out of the two oligonu-
cleotides able to hybridize on a mismatched wild-type DNA
molecule (i.e. LCPR3s and LCPR4s) was designed to have lower
Tm. It was expected that these shorter oligonucleotides, would not
be able to efficiently hybridize on either strand of the target-DNA
Figure 4. Melting curve profile of the LCR products. The first peak represents the melting of oligonucleotide dimers and the second themelting of LCR products. Selected temperatures for LCR steps are indicated by arrows.doi:10.1371/journal.pone.0014560.g004
Quantitative Real-Time LCR
PLoS ONE | www.plosone.org 7 January 2011 | Volume 6 | Issue 1 | e14560
during the paired oligonucleotides’ denaturation step and
therefore contribute to the decrease of LOD and LOQ. This
hypothesis was supported after substitution of LCPR3s and
LCPR4s (protocol 1) with the homologous longer oligonucleotides
LCPR3L and LCPR4L (protocol 8) (Table 1) which resulted in an
almost three-fold increase of LOD and LOQ (Table 2).
Moreover, substitution of Taq DNA ligase (protocol 1) by PFU
thermostable ligase (protocol 7) did not lead to any considerable
improvement regarding LOD and LOQ values (Table 2). This
result was contrary to others previously reported, which suggested
that PFU DNA ligase had higher fidelity than Taq DNA ligase
[33].
In the present study calculated LOD and LOQ values for both
protocols 9 and 10 (gap-T and gap-A) were not better than those
of the protocol 1 (Table 2). Only the LOQ calculated for protocol
10 was slightly lower (0.34 versus 0.35). The theoretical advantage
of gap-LCR is the avoidance of sticky-end ligation [18]. This is
explained by an initial extension of the discriminating oligonucle-
otide by a DNA polymerase which precedes the ligation process.
According to the present results, reduction of sticky-end ligation
was also possible in the basic protocol (protocol 1) due to
performing the setup at low temperatures by keeping reagents and
thin wall tubes in bench-top coolers during the real-time LCR
setup. This observation was supported by some preliminary real-
time LCR trials (not shown) with a setup at room temperature
which led to an increase of sticky-end ligation, as indicated by
decreased Ct values of the non-template controls.
Further gap-LCR trials were performed with proofreading
polymerases [PFX Platinum (Invitrogen, The Netherlands),
PhusionH (New England Biolabs Inc., MA, USA) and VentH(New England Biolabs Inc., MA, USA)] in an effort to improve the
SNP discrimination capability of the LCR (results not shown).
These enzymes exhibit a 39R59 exonuclease proofreading activity.
It was expected that proofreading activity at the site of point
mutation would exclude the incorporation of a mismatched
nucleotide during the gap filling and, thus, improve the specificity
of gap-LCR applications. In this case, phosphorothioate (PTO)
and locked nucleic acid (LNA) modifications of LCR oligonucle-
otides were also introduced to avoid degradation of their 39
termini [34,35]. However, PTO modifications led to increased Ct-
variability and LOD, possibly due to interference with the catalytic
domain of the ligase in a way that impairing the fidelity of the
process. Furthermore, LNA modifications resulted in partial
oligonucleotide degradation and sample amplification failure.
These results demonstrate that proofreading polymerases are not
suitable for real-time gap-LCR protocols.
Comparisons made between average Ct-values from the analysis
of samples with the lowest known mutant (0.39% V136) frequencies
and 100% wild-type (A136) samples, showed that differences were
statistically significant (P,0.05) for all protocols except from
protocol 8 (which used different oligonucleotides). When signifi-
cant, results meant that V136 detection was possible at this
frequency. The lowest P-value was observed for protocol 1
(P = 0.001), followed by protocols 9 and 10 (P = 0.003 and 0.002).
This result suggested that, in 999 in 1,000 cases, protocol 1 would
effectively detect V136, when the frequency of the latter was
0.39%. In practical terms, detection of this deleterious mutation
would be possible in a flock of sheep, using their pooled DNA,
even when only 1 in 250 animals was carrier of the mutant DNA.
Linearity and Efficiency. Real-time LCR protocols 1 to 8
showed similar efficiency at the satisfactory level of 80% (Table 2).
The absolute magnitude of this parameter is difficult to assess due
to lack of literature reports on LCR efficiency. The possible
explanation for the observed, lower than 100% LCR amplification
efficiency is the formation of oligonucleotide pairs during the
annealing/ligation step, which reduces their availability for
annealing to the target-DNA. For both gap-LCR protocols
(protocols 9 and 10), the amplification efficiency was much
lower compared to the others (Table 2). The complexity of gap-
LCR necessitating the simultaneous activity of both enzymes
(ligase and polymerase) is the probable cause of this reduction in
efficiency.
In all protocols, there was a linear relationship between Ct
values and V136 frequencies, manifested by a very high (.0.97) R2
value of the regression of the latter on the former (Figure 5). In
all cases, regression slopes were very close to unity and inter-
cepts were practically zero, attesting to the high accuracy of
quantification.
Based on LOD, LOQ, linearity and efficiency was concluded
that all variations introduced did not further improve the basic
protocol. Therefore, the latter (protocol 1) is our protocol of
choice. Only protocol 10 improved slightly LOQ, but since it
required additional consumables (Taq DNA polymerase), it is not
recommended.
Determination of reproducibility. The experimental intra-
and inter-assay variability obtained using plasmid standard pools
with different V136 frequencies is summarized in Table 3. Good
reproducibility is an essential requirement of quantitative assays.
The low intra- and inter-assay variability of the basic real-time
LCR protocol obtained in the present study is comparable with
other quantitative DNA amplification methods based on real-time
PCR [36].
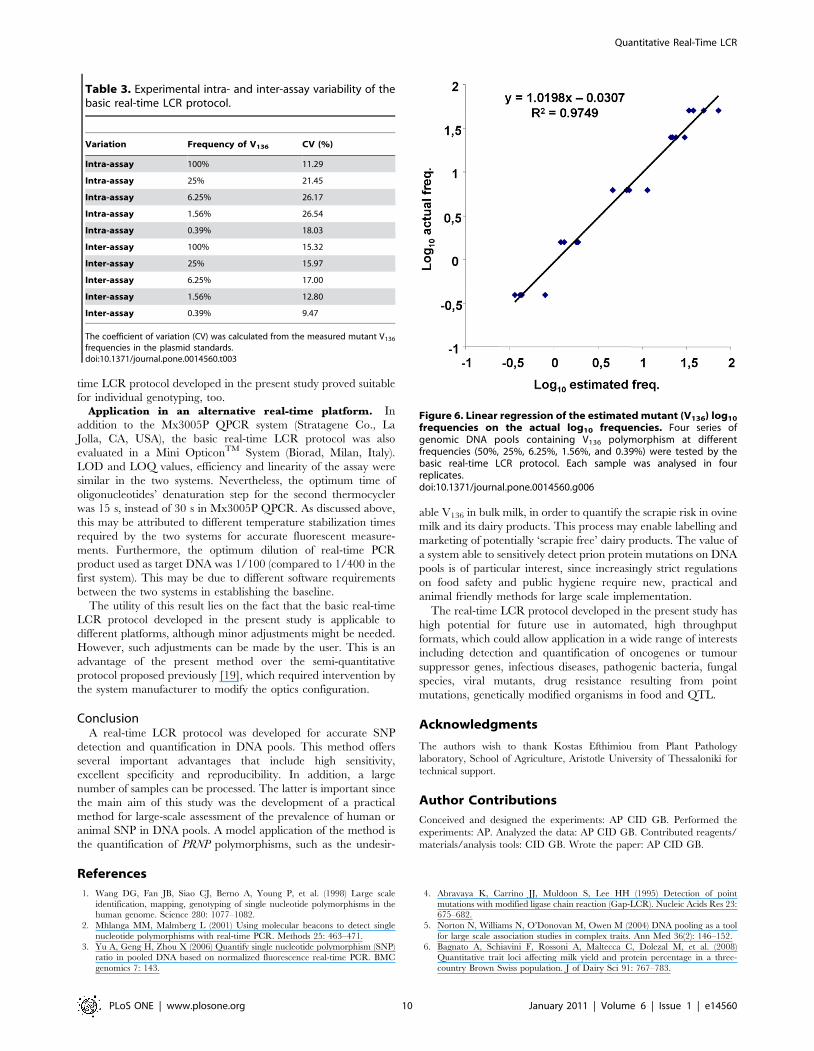
Accuracy of quantification using genomic DNA pools and
natural samples of individual animals. The ability of the
basic real-time LCR protocol to accurately quantify mutant DNA
was assessed using genomic DNA pools that were artificially
prepared to contain different mutant DNA frequencies (50%,
25%, 6.25%, 1.56%, and 0.39%). Estimates of the V136
frequencies were calculated by plotting the mean Ct values in a
standard curve created by plasmid standard pools. Linear
regression analysis of the estimated mutant (V136) log10
frequencies on the actual (known) log10 frequencies showed a
high linear relationship between the two sets of values
(R2 = 0.9749, Figure 6). Slope and intercept of the regression
were not significantly different from 1 and 0, respectively
(P.0.05). These results attest to the predictive capacity of the
basic real-time LCR protocol developed in the present study.
Furthermore, these results are comparable to those obtained with
plasmid standards, described previously, suggesting that the
method is quantitative at both types of pools. This is the first
time, to our knowledge, that a quantitative LCR protocol was
applied to the quantification of mutant DNA at the full range of
LCR sensitivity.
All 60 genotyped individual animal samples were re-tested with
the basic real-time LCR protocol in order to detect and quantify of
V136 mutant DNA. With the basic real-time LCR protocol it was
possible to determine the individual animal genotypes in all sixty
milk samples. One animal was homozygous V136, five were
heterozygous V136 and 44 were homozygous A136. The mean
(standard deviations in parenthesis) Ct value obtained for the
homozygous V136 sample was 15.06, for the heterozygous V136
samples was 16.75 (0.35) and for the homozygous A136 samples
was 28.34 (0.64). The percentage of V136 calculated by the
standard curve created using plasmid standard pools was 111% for
homozygous V136 and 47.03% for the heterozygous V136 samples.
Moreover, these genotyping results were consistent with RFLP
genotyping of the same animals, which in turn was verified by
sequencing 21 of them (data not shown). Therefore, the basic real-
Quantitative Real-Time LCR
PLoS ONE | www.plosone.org 8 January 2011 | Volume 6 | Issue 1 | e14560
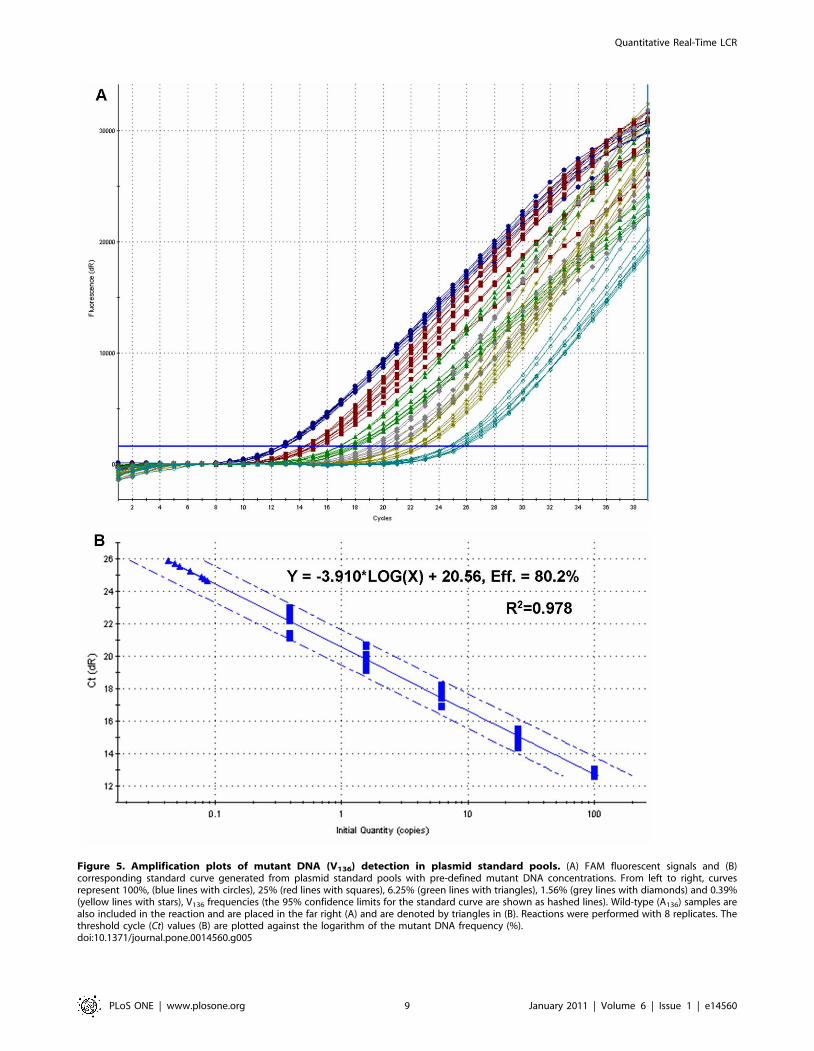
Figure 5. Amplification plots of mutant DNA (V136) detection in plasmid standard pools. (A) FAM fluorescent signals and (B)corresponding standard curve generated from plasmid standard pools with pre-defined mutant DNA concentrations. From left to right, curvesrepresent 100%, (blue lines with circles), 25% (red lines with squares), 6.25% (green lines with triangles), 1.56% (grey lines with diamonds) and 0.39%(yellow lines with stars), V136 frequencies (the 95% confidence limits for the standard curve are shown as hashed lines). Wild-type (A136) samples arealso included in the reaction and are placed in the far right (A) and are denoted by triangles in (B). Reactions were performed with 8 replicates. Thethreshold cycle (Ct) values (B) are plotted against the logarithm of the mutant DNA frequency (%).doi:10.1371/journal.pone.0014560.g005
Quantitative Real-Time LCR
PLoS ONE | www.plosone.org 9 January 2011 | Volume 6 | Issue 1 | e14560
time LCR protocol developed in the present study proved suitable
for individual genotyping, too.Application in an alternative real-time platform. In
addition to the Mx3005P QPCR system (Stratagene Co., La
Jolla, CA, USA), the basic real-time LCR protocol was also
evaluated in a Mini OpticonTM System (Biorad, Milan, Italy).
LOD and LOQ values, efficiency and linearity of the assay were
similar in the two systems. Nevertheless, the optimum time of
oligonucleotides’ denaturation step for the second thermocycler
was 15 s, instead of 30 s in Mx3005P QPCR. As discussed above,
this may be attributed to different temperature stabilization times
required by the two systems for accurate fluorescent measure-
ments. Furthermore, the optimum dilution of real-time PCR
product used as target DNA was 1/100 (compared to 1/400 in the
first system). This may be due to different software requirements
between the two systems in establishing the baseline.
The utility of this result lies on the fact that the basic real-time
LCR protocol developed in the present study is applicable to
different platforms, although minor adjustments might be needed.
However, such adjustments can be made by the user. This is an
advantage of the present method over the semi-quantitative
protocol proposed previously [19], which required intervention by
the system manufacturer to modify the optics configuration.
ConclusionA real-time LCR protocol was developed for accurate SNP
detection and quantification in DNA pools. This method offers
several important advantages that include high sensitivity,
excellent specificity and reproducibility. In addition, a large
number of samples can be processed. The latter is important since
the main aim of this study was the development of a practical
method for large-scale assessment of the prevalence of human or
animal SNP in DNA pools. A model application of the method is
the quantification of PRNP polymorphisms, such as the undesir-
able V136 in bulk milk, in order to quantify the scrapie risk in ovine
milk and its dairy products. This process may enable labelling and
marketing of potentially ‘scrapie free’ dairy products. The value of
a system able to sensitively detect prion protein mutations on DNA
pools is of particular interest, since increasingly strict regulations
on food safety and public hygiene require new, practical and
animal friendly methods for large scale implementation.
The real-time LCR protocol developed in the present study has
high potential for future use in automated, high throughput
formats, which could allow application in a wide range of interests
including detection and quantification of oncogenes or tumour
suppressor genes, infectious diseases, pathogenic bacteria, fungal
species, viral mutants, drug resistance resulting from point
mutations, genetically modified organisms in food and QTL.
Acknowledgments
The authors wish to thank Kostas Efthimiou from Plant Pathology
laboratory, School of Agriculture, Aristotle University of Thessaloniki for
technical support.
Author Contributions
Conceived and designed the experiments: AP CID GB. Performed the
experiments: AP. Analyzed the data: AP CID GB. Contributed reagents/
materials/analysis tools: CID GB. Wrote the paper: AP CID GB.
References
1. Wang DG, Fan JB, Siao CJ, Berno A, Young P, et al. (1998) Large scale
identification, mapping, genotyping of single nucleotide polymorphisms in thehuman genome. Science 280: 1077–1082.
2. Mhlanga MM, Malmberg L (2001) Using molecular beacons to detect single
nucleotide polymorphisms with real-time PCR. Methods 25: 463–471.
3. Yu A, Geng H, Zhou X (2006) Quantify single nucleotide polymorphism (SNP)
ratio in pooled DNA based on normalized fluorescence real-time PCR. BMC
genomics 7: 143.
4. Abravaya K, Carrino JJ, Muldoon S, Lee HH (1995) Detection of point
mutations with modified ligase chain reaction (Gap-LCR). Nucleic Acids Res 23:675–682.
5. Norton N, Williams N, O’Donovan M, Owen M (2004) DNA pooling as a tool
for large scale association studies in complex traits. Ann Med 36(2): 146–152.
6. Bagnato A, Schiavini F, Rossoni A, Maltecca C, Dolezal M, et al. (2008)
Quantitative trait loci affecting milk yield and protein percentage in a three-
country Brown Swiss population. J of Dairy Sci 91: 767–783.
Table 3. Experimental intra- and inter-assay variability of thebasic real-time LCR protocol.
Variation Frequency of V136 CV (%)
Intra-assay 100% 11.29
Intra-assay 25% 21.45
Intra-assay 6.25% 26.17
Intra-assay 1.56% 26.54
Intra-assay 0.39% 18.03
Inter-assay 100% 15.32
Inter-assay 25% 15.97
Inter-assay 6.25% 17.00
Inter-assay 1.56% 12.80
Inter-assay 0.39% 9.47
The coefficient of variation (CV) was calculated from the measured mutant V136
frequencies in the plasmid standards.doi:10.1371/journal.pone.0014560.t003
Figure 6. Linear regression of the estimated mutant (V136) log10
frequencies on the actual log10 frequencies. Four series ofgenomic DNA pools containing V136 polymorphism at differentfrequencies (50%, 25%, 6.25%, 1.56%, and 0.39%) were tested by thebasic real-time LCR protocol. Each sample was analysed in fourreplicates.doi:10.1371/journal.pone.0014560.g006
Quantitative Real-Time LCR
PLoS ONE | www.plosone.org 10 January 2011 | Volume 6 | Issue 1 | e14560

7. Buitkamp J, Gotz K (2004) Use of milk samples from a milk evaluation
programme for the genotyping of cows. Arch Tierz Dummerstorf 47: 15–26.8. Know PY (2001) Methods for genotyping single nucleotide polymorphisms.
Annu Rev Genom Hum G 2: 235–258.
9. Gut LG (2001) Automation in genotyping of single nucleotide polymorphisms.Hum Mutat 17: 475–492.
10. Hoogendoorn B, Norton N, Kirov G, Williams N, Hamshere ML, et al. (2000)Cheap, Accurate and rapid allele frequency estimation of single nucleotide
polymorphisms by primer extention and DHPLC in DNA pools. Hum Genet
107: 488–493.11. Zhou G, Kamahori M, Okano K, Chuan G, Harada K, et al. (2001)
Quantitative detection of single nucleotide polymorphisms for a pooled sampleby a bioluminometric assay coupled with modified primer extention reactions
(BAMPER). Nucleic Acids Res 29: e93.12. Macgregor S, Visscher PM, Montgomery G (2006) Analysis of pooled DNA
samples on high density arrays without prior knowledge of differential
hybridization rates. Nucleid Acids Res 34: e55.13. Gruber JD, Colligan PB, Wolford JK (2002) Estimation of single nucleotide
polymorphism allele frequency in DNA pools by using pyrosequencing. HumGenet 110: 395–401.
14. Tapp I, Malmberg L, Rennel E, Wik M, Syvanen AC (2000) Homogeneous
scoring of single-nucleotide polymoephisms: comparison of the 59-nucleaseTaqMan assay and Molecular Beacons probes. Biotechniques 28: 732–738.
15. Mattarucchi E, Marsoni M, Binelli G, Passi, A, Lo Curto F, et al. (2005)Different real-time PCR approaches for fine quantification of SNP’s alleles in
DNA pools: assays development, characterization and pre-validation. BiochemMol Biol 38: 555–562.
16. Sidransky D (2002) Emerging molecular markers for cancer. Nat Rev Cancer 2:
210–219.17. Diehl F, Li M, Dressman D, He Y, Shen D (2005) Detection and quantification
of mutations in the plasma of patients with colorectal tumors. Proc Natl Acad SciUSA 102: 16386–16373.
18. Wiedmann M, Wilson WJ, Czajka J, Luo J, Barrany F, et al. (1994) Ligase chain
reaction (LCR)-overview and applications. PCR methods Appl 3S: 51–64.19. Harden S, Thomas D, Benoit N, Minhas K, Westra W, et al. (2004) Real-time
Gap Ligase Chain Reaction: A rapid semiquantitative assay for detection p53mutation at low levels in surgical margins and lymph nodes from resected lung
and head and neck tumors. Clin Cancer Res 10: 2379–2385.20. Birkenmeyer L, Armstrong A (1992) Preliminary evaluation of the ligase chain
reaction for specific detection of Neisseria gonorrhoeae. J Clin Microbiol 30:
3089–3094.21. Cao W (2004) Recent developments in ligase-mediated amplification and
detection. Trends Biotechnol 22.
22. Tooley PW, Hatziloukas E, Scott DL, Carras MM (2002) Use of ligase chain
reaction for enhanced detection of Phytophora infestans. Can J Plant Pathol 24:294–301.
23. Marshall RL, Laffler TG, Cerney MB, Sustachek JC, Kratochvi JD, et al. (1994)
Detection of HCV RNA by the asymmetric gap-ligase chain reaction. PCRMeth Appl 4: 80–84.
24. Tian F, Wu Y, Zhou Y, Liu X, Visvikis-Siest S, et al. (2008) A new singlenucleotide polymorphism genotyping method based on gap ligase chain reaction
and a microsphere detection assay. Clin Chem Lab Med 46(4): 486–489.
25. Psifidi A, Basdagianni Z, Dovas CI, Arsenos G, Sinapis E, et al. (2010)Characterisation of the PRNP gene locus in Chios dairy sheep and its association
with milk production and reproduction traits. Animal Genetics (in press).26. Psifidi A, Dovas CI, Banos G (2010) A comparison of six methods for genomic
DNA extraction suitable for PCR-based genotyping amplifications using ovinemilk samples. Mol Cell Probes 24: 93–98.
27. Luhken G, Buschmann A, Groschup MH, Erhardt G (2004) Prion protein allele
A136H154Q171 is associated with high susceptibility to scrapie in purebred andcrossbred German Merinoland sheep. Arch Virol 149: 1571–1580.
28. Wang W, Chen K, Xu C (2006) DNA quantification using EvaGreen and a real-time PCR instrument. Anal Biochem 356: 303–305.
29. Ihrig J, Lill R, Muhlenhoff U (2006) Application of the DNA-specific dye
EvaGreen for the routine quantification of DNA in microplates. Anal Biochem359: 265–267.
30. Markham NR, Zuker M (2005) DINAMelt web server for nucleic acid meltingprediction. Nucleic Acids Res 33: W577–W581.
31. Schwarz G, Baumler S, Block A, Felsenstein F, Wenzel G (2004) Determinationof detection and quantification limits for SNP allele frequency estimation in
DNA pools using real-time PCR. Nucleic Acids Res 32: e 24.
32. Inczedy J, Lengyel T, Ure AM (1998) Compedium on analytical Nomenclature.Definite Rules 1997. Third Edition. New York: Blackwell Science.
33. Borodina T, Lehrach H, Soldatov A (2004) Ligation detection reaction-Taq-Man procedure for single nucleotide polymorphism detection on genomic DNA.
Anal Biochem 333: 309–319.
34. De Noronha CMC, Mullins JI (1992) Amplimers with 39-terminal phosphor-othioate linkages resist degradation by Vent polymerase and reduce Taq
polymerase mispriming. PCR Meth Appl 2: 131–136.35. Di Giusto DA, King GC (2004) Strong positional preference in the interaction of
LNA oligonucleotides with DNA polymerase and proofreading exonucleaseactivities: implication for genotyping assays. Nucleic Acids Res 32(3): e32.
36. Dovas CI, Papanastassopoulou M, Georgiadis MP, Chatzinasiou E,
Maliogka VI, et al. (2010) Detection and quantification of infectious avianinfluenza A (H5N1) virus in environmental water by using real-time reverse
transcription-PCR. Appl Environ Microbiol 76: 2165–74.
Quantitative Real-Time LCR
PLoS ONE | www.plosone.org 11 January 2011 | Volume 6 | Issue 1 | e14560