Novel method for the fast determination of ultra trace amount of nortriptyline in its pharmaceutical...
12
Novel Method for the Fast Determination of Ultra Trace Amount of Nortriptyline in its Pharmaceutical Formulations by Fast Fourier Transform Continuous Cyclic Voltammetric Technique at Au Microelectrode in Flowing Solutions PARVIZ NOROUZI, 1 MOHAMMAD REZA GANJALI, 1 SIMINDOKHT SHIRVANI-ARANI, 1 ALI MOHAMMADI 2 1 Department of Chemistry, Tehran University, Tehran, Iran 2 Department of Drug and Food Quality, Faculty of Pharmacy, Medical Science University of Tehran, Tehran, Iran Received 1 January 2006; revised 18 February 2006; accepted 20 March 2006 Published online in Wiley InterScience (www.interscience.wiley.com). DOI 10.1002/jps.20648 ABSTRACT: In this work a novel method for the determination of nortriptyline in flow- injection systems has been developed. The proposed method was used for the fast determination of nortriptyline in its pharmaceutical formulations. The developed technique is very simple, precise, accurate, time saving, and economical, compared to all of the previously reported methods. The effects of various parameters on the sensitivity of the method were investigated. The best performance obtained at pH value of 2, scan rate value of 30 V/s, accumulation potential of 400 mV, and accumulation time of 0.5 s. The proposed method has some advantages over other reported methods such as, no need for the removal of oxygen from the test solution, a subnanomolar detection limit, and finally the method is sufficiently fast for the determination of any such compound, in a wide variety of chromatographic methods. The potential waveform, consisting of the potential steps for cleaning, accumulation and potential ramp of analyte, was continuously applied on an Au disk microelectrode (12.5 mm in radius). The detection limit of the method was 2.0 10 11 M. The relative standard deviation of the method at 1.2 10 8 M was 2.1% for eight runs. ß 2007 Wiley-Liss, Inc. and the American Pharmacists Association J Pharm Sci 96:893– 904, 2007 Keywords: nortriptyline; ultramicroelectrode; continuous cyclic voltammetry; flow- injection analysis; fast Fourier transformation INTRODUCTION Nortriptyline hydrochloride [3-(10, 11-dihydro- 5H-dibenzo [a, d] cycloheptan-5-ylidene) propyl- methylamine hydrochloride (Fig. 1, NTT) is a tricyclic antidepressant and the main active metabolite of amitriptyline. NTT has been widely used, due to its high in-vivo activity. In the treatment of major depressive disorders, pain of varying etiology, pathological crying or laughing, tinnitus, and nocturnal enuresis. 1–7 Various analytical procedures for determina- tion of NTT, including spectrophotometry, reversed-phase HPLC, flow injection fluorimetric, high performance liquid chromatography, fluori- metry, and colorimetry (ISEs), 8–15 have been reported in the literature. In this work for the first time, we report a fast Fourier transform continuous cyclic voltammetric method for the determination of subnanomol of nortriptyline in pure and pharmaceutical samples having a sensitivity range of parts-per-billion. Stripping voltammetric techniques are very rapid and economical, for the determination of heavy metal ions, and many organic compounds, in aqueous systems. 16–20 Indeed, the application of such techniques, in the flowing solutions, due to JOURNAL OF PHARMACEUTICAL SCIENCES, VOL. 96, NO. 4, APRIL 2007 893 Correspondence to: Parviz Norouzi (Telephone: þ98-021- 61112788; Fax: þ98-021-66495291; E-mail: [email protected]) Journal of Pharmaceutical Sciences, Vol. 96, 893–904 (2007) ß 2007 Wiley-Liss, Inc. and the American Pharmacists Association
-
Upload
independent -
Category
Documents
-
view
3 -
download
0
Transcript of Novel method for the fast determination of ultra trace amount of nortriptyline in its pharmaceutical...
Novel Method for the Fast Determination of Ultra TraceAmount of Nortriptyline in its Pharmaceutical Formulationsby Fast Fourier Transform Continuous Cyclic VoltammetricTechnique at Au Microelectrode in Flowing Solutions
PARVIZ NOROUZI,1 MOHAMMAD REZA GANJALI,1 SIMINDOKHT SHIRVANI-ARANI,1 ALI MOHAMMADI2
1Department of Chemistry, Tehran University, Tehran, Iran
2Department of Drug and Food Quality, Faculty of Pharmacy, Medical Science University of Tehran, Tehran, Iran
Received 1 January 2006; revised 18 February 2006; accepted 20 March 2006
Published online in Wiley InterScience (www.interscience.wiley.com). DOI 10.1002/jps.20648
ABSTRACT: In this work a novel method for the determination of nortriptyline in flow-injection systems has been developed. The proposed method was used for the fastdetermination of nortriptyline in its pharmaceutical formulations. The developedtechnique is very simple, precise, accurate, time saving, and economical, compared toall of the previously reported methods. The effects of various parameters on thesensitivity of themethodwere investigated. Thebest performance obtainedat pHvalue of2, scan rate value of 30 V/s, accumulation potential of 400 mV, and accumulation time of0.5 s. The proposedmethod has some advantages over other reportedmethods such as, noneed for the removal of oxygen from the test solution, a subnanomolar detection limit, andfinally the method is sufficiently fast for the determination of any such compound, in awide variety of chromatographic methods. The potential waveform, consisting of thepotential steps for cleaning, accumulation and potential ramp of analyte, wascontinuously applied on an Au disk microelectrode (12.5 mm in radius). The detectionlimit of the method was 2.0� 10�11 M. The relative standard deviation of the method at1.2� 10�8 M was 2.1% for eight runs. � 2007 Wiley-Liss, Inc. and the American Pharmacists
Association J Pharm Sci 96:893–904, 2007
Keywords: nortriptyline; ultramicroelectrode; continuous cyclic voltammetry; flow-injection analysis; fast Fourier transformation
INTRODUCTION
Nortriptyline hydrochloride [3-(10, 11-dihydro-5H-dibenzo [a, d] cycloheptan-5-ylidene) propyl-methylamine hydrochloride (Fig. 1, NTT) is atricyclic antidepressant and the main activemetabolite of amitriptyline. NTT has been widelyused, due to its high in-vivo activity. In thetreatment of major depressive disorders, pain ofvarying etiology, pathological crying or laughing,tinnitus, and nocturnal enuresis.1–7
Various analytical procedures for determina-tion of NTT, including spectrophotometry,reversed-phase HPLC, flow injection fluorimetric,high performance liquid chromatography, fluori-metry, and colorimetry (ISEs),8–15 have beenreported in the literature.
In this work for the first time, we report a fastFourier transform continuous cyclic voltammetricmethod for the determination of subnanomol ofnortriptyline in pure and pharmaceutical sampleshaving a sensitivity range of parts-per-billion.Stripping voltammetric techniques are very rapidand economical, for the determination of heavymetal ions, and many organic compounds, inaqueous systems.16–20 Indeed, the application ofsuch techniques, in the flowing solutions, due to
JOURNAL OF PHARMACEUTICAL SCIENCES, VOL. 96, NO. 4, APRIL 2007 893
Correspondence to: Parviz Norouzi (Telephone: þ98-021-61112788; Fax: þ98-021-66495291;E-mail: [email protected])
Journal of Pharmaceutical Sciences, Vol. 96, 893–904 (2007)� 2007 Wiley-Liss, Inc. and the American Pharmacists Association

the movement of analyte zone in an electrochemi-cal flow cell, requires fast accumulation of theanalyte and also fast potential sweeping (which isnot appropriate for large electrodes).21,22 Electro-chemical measurements at solid electrodes, ingeneral, are not suitable for the processes, thatare kinetically controlled, or in other words, areirreversible. This is because the surfaces of thesolid electrodes are easily deactivated (or poi-soned) by products of the red/ox reactions of thedesired species or that of the impurities present inthe solution.Most of the problemsof suchmethods,however, can be overcome by the application ofultramicroelectrode (UMEs). As a matter of fact,the use of voltammetric techniques has beenfurther stimulated by the advent of UMEs, forexample, their steady state currents, highersensitivity due to the increased mass transport,and their ability to be used in solutions with veryhigh resistances.23 For instance, UMEs havebeen applied as sensors in various techniques likeflow-injection analysis,24,25 cardiovascular moni-toring, and in the analysis of some organiccompounds.26–28
Another problem comes from the changes in thecharacteristics of the electrode surface during thepotential scan. The electrode signal will have alarge background current, if the surface of the solidelectrode is oxidized and reduced during voltam-metricmeasurements (the response of the electrodewill have a large background current), which isassociated with high levels of noise due to thestructural changes of the electrode surface.29
Currents like this, can interfere with the desirableelectrode processes, and may adversely affect thedetection limits of the methods used.30 Applicationof a potential sweeping technique, such as cyclicor square wave voltammetry associated with a
potential waveform for electrode conditioning,however, can be very helpful.31 Electrochemicalconditioning permits the maintenance of a cleanandactive electrode surface for longperiods of time.
Aswewill discuss later, the background currentin voltammetric measurements can provide usefulpieces of information about the adsorption pro-cesses and changes in the double layer at theelectrode surface. For instance, in square wavevoltammetric measurements, the change in thedouble layer capacitance that occurs due toadsorption of species on gold UME was used forthe determination of acid anions.32 In addition,small amounts of adsorption of the species presentin the solution, on the electrode surface, canstrongly affect the cathodic and anodic currentsof the red/ox reaction of the electrode.
A special computer based numerical method isalso introduced, for the calculation of the signal ofthe analyte and noise reduction. The calculation ofsignal was based on the net partial and totalcharge exchanges at electrode surface, and wasdone by integrating the currents at the selectedpotential range at the cyclic voltammogram (CV).Depending on conditions applied, the detector (theproposed method) can be used in the determina-tion of inorganic and organic species in variouschromatographic analysis methods (e.g., HPLC).
EXPERIMENTAL
Reagents
All solutions were prepared in double-distilleddeionized water, using analytical grade reagents.The reagents used to prepare the stock eluentsolution for flow-injection analysis were obtainedfromMerck Chemicals (Manchester, UK). In all ofthe experiments, solutions were made up in thebackground electrolyte (BGE) solution, and wereused without removal of dissolved oxygen.Nortriptyline hydrochloride, (NTT, Fig. 1) was agift from the Center of Quality Control of Foodand Drug (Tehran, Iran), made by South Africa.Nortriptyline hydrochloride tablet (Tolid DaruCo., Tehran, Iran), containing a label claim of10 mg nortriptyline hydrochloride, that waspurchased from a local pharmacy.
BGE
The running buffer or BGE was made by additionof 8.7 mL of phosphoric acid (85% w/v) into a
Figure 1. Structure of NTT.
894 NOROUZI ET AL.
JOURNAL OF PHARMACEUTICAL SCIENCES, VOL. 96, NO. 4, APRIL 2007 DOI 10.1002/jps

1000 mL volumetric flask and dilution to a cons-tant volume with distilled water. The pH wasadjusted to 2.3 with sodium hydroxide and allsolutions were freshly prepared.
Standards and Sample Solutions
Standard Stock Solutions
A standard stock solution of nortriptyline hydro-chloride (1 mg/mL) was prepared in distilledwater. This solution was protected from lightusing foil and stored at 48C for 10 days and wasfound to be stable during this period.
Standard Solutions for FIA
Aliquots of standard stock solution of nortripty-line hydrochloride were dispensed into 10 mLvolumetric flasks and the flasks made up tovolume with the running buffer to give finalconcentrations range of 50–90000 pg/mL.
Preparation of Tablets for Assay
For the determination of NTT, five tablets of eachsample were weighed and thoroughly grinded. Anaccurately weighed portion of the obtained pow-der equivalent to 10.0 mg of NTT was extractedwith 25 mL of triply distilled water. It was shakenfor about 5 min, filtered into a 1000mLmeasuringflask. The residues were washed several times,and diluted to the mark with distilled water.0.1 mL of the resulting solution was diluted with0.05 M phosphoric acid in a 1000 mL volumetricflask, and the method described for the determi-nation of NTT, was applied on it.
Electrode Preparation
Gold UMEs (12.5 mm, in diameter) were preparedby sealing metal micro-wires (Goodfellow MetalsLtd., Huntingdon, UK) into a soft glass capillary.The capillary was then cut, perpendicular to itslength, to expose the wire. Electrical contactswere made using silver epoxy (Johnson MattheyLtd., London, UK). Before each experiment theelectrode surface was polished for 1 min using anextra fine carborundum paper, and then for10 min with 0.3 mm alumina. Prior to beingplaced in the cell, the electrode was washed withdistilled water. During all measurements, anAg(s)jAgCl(s)jKCl (aq, 1 M) reference electrodewas used. The auxiliary electrode was made of aPt wire, 1 cm in length and 0.5 mm in diameter.
Flow Injection Setup
The equipment for flow injection analysisincluded an eight roller peristaltic pump (LKB2115 Microperpex Co., Lorton Vale, UK) and afour-ways injection valve (Supelco RheodyneModel 5020) with a 50 mL sample injection loop.Solutions were introduced into the sample loop bymeans of a plastic syringe. The electrochemicalcell used in the flow-injection analysis is shown inFigure 2. The volume of the cell was 100 mL. In allexperiments described in this paper, the flow rateof eluent solution was 100 mL/s.
Data Acquisition and Processing
All of the electrochemical experiments weredone using a setup comprising a PC PIII Pentium300 MHz microcomputer, equipped with a dataacquisition board (PCL-818HG, Advantech Co.,Milton, UK) and a custom made potentiostate.33
In Figure 3, the diagram of applied potentialwaveform during cyclic voltammetric measure-ments is shown. The potential waveform consistsof two sections. At the first section, the electrodesurfaces electrochemically cleaned by applyingtwo potential steps. At the first step, the electrodesurface is strongly oxidized by applying verypositive potential (EEc1¼ 1800 mV, for 100 ms),within this time, the entire adsorbed moleculesare removed from the surface, and at the secondstep, the electrode surface is recovered (orrenewed) by applying a negative potential(EEc2¼�400 mV, for 100 ms). One reason forobtaining a clean electrode surface is that aftereach injection the baseline of the response curvereturns to its original value (see Fig. 6. This partis followed by potential step Ec, where accumula-tion of the nortriptyline takes place. Finally thecurrent measurements take place during poten-tial ramp. All data acquisition and data proces-sing programs were developed in Delphi 61
program environment.
Signal Calculation
As mentioned above, the current passing throughthe electrode was sampled only during thepotential ramp. In this detection method, theintegration of the net current changes is appliedover the scanned potential range. It must be notedthat in this case, the current changes (resultingfrom injected analyte) at the voltammograms canbe caused by various processes, which take place
FAST FOURIER TRANSFORM CONTINUOUS CYCLIC VOLTAMMETRIC TECHNIQUE 895
DOI 10.1002/jps JOURNAL OF PHARMACEUTICAL SCIENCES, VOL. 96, NO. 4, APRIL 2007
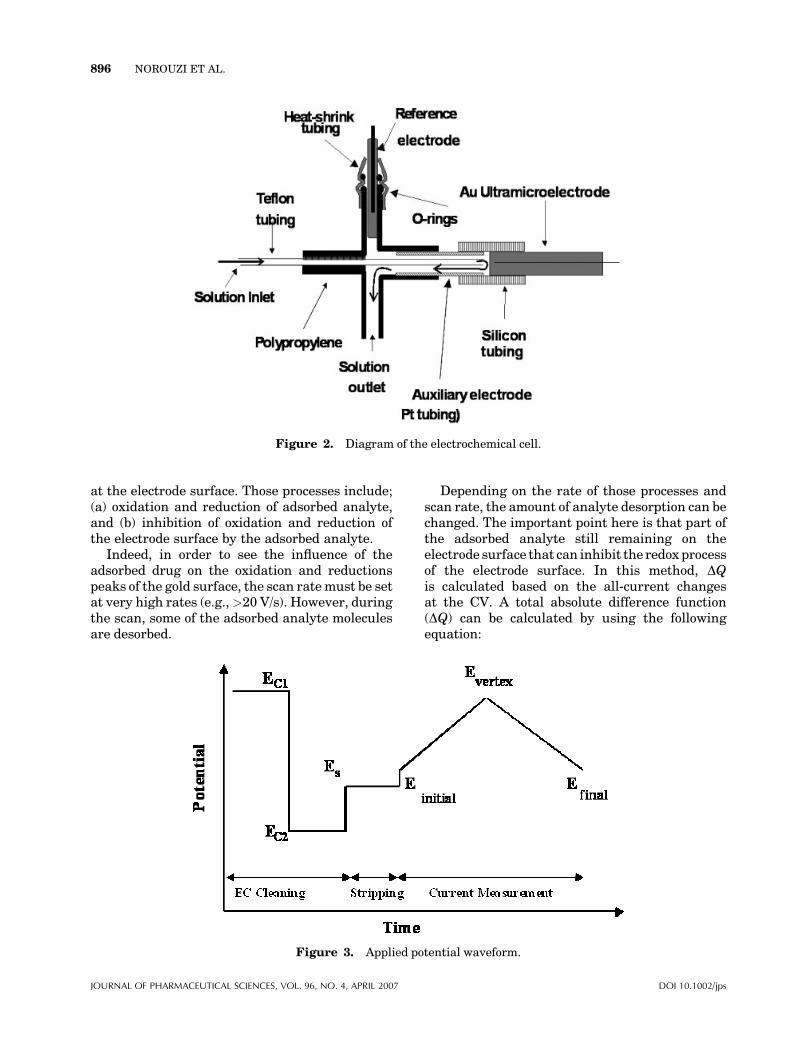
at the electrode surface. Those processes include;(a) oxidation and reduction of adsorbed analyte,and (b) inhibition of oxidation and reduction ofthe electrode surface by the adsorbed analyte.
Indeed, in order to see the influence of theadsorbed drug on the oxidation and reductionspeaks of the gold surface, the scan ratemust be setat very high rates (e.g.,>20 V/s). However, duringthe scan, some of the adsorbed analyte moleculesare desorbed.
Depending on the rate of those processes andscan rate, the amount of analyte desorption can bechanged. The important point here is that part ofthe adsorbed analyte still remaining on theelectrode surface that can inhibit the redox processof the electrode surface. In this method, DQis calculated based on the all-current changesat the CV. A total absolute difference function(DQ) can be calculated by using the followingequation:
Figure 2. Diagram of the electrochemical cell.
Figure 3. Applied potential waveform.
896 NOROUZI ET AL.
JOURNAL OF PHARMACEUTICAL SCIENCES, VOL. 96, NO. 4, APRIL 2007 DOI 10.1002/jps

DQTAðs�Þ ¼ Dt
"XE¼Ev
E¼Ei
jiðs;EÞ � iðsr;EÞj_
þXE¼Ei
E¼Ev
jiðs;EÞ � iðsr;EÞj#
ð1Þ
where, s is the sweep number, t is the time periodbetween subsequent sweeps, Dt is the timedifference between two subsequent points on theCV curves, i (s, E) represents the current of theCV curve recorded during the s-th sweep and i(sr,E) is the reference current of the CV curve. Ei andEv are the initial and the vertex potential,respectively. The reference CV curve wasobtained by averaging a few CV curves recordedat the beginning of the experiment (i.e., beforeinjection of the analyte). Typically, the averagingof CVs included the three to six curves (SeeFig. 5).
All CV curves observed during the entireexperiment (typically 100–1000 curves) werealways stored in computer memory and could besaved onto a hard drive for future analysis, ifdesired. These equations show that for the sameflow injection experiment the analyte response canbe obtained using different integration limits.However, the selectivity and sensitivity of theanalyte response expressed in terms of DQstrongly depends on the selection of the integra-tion limits.
It should be noted that in this method, allstudied processes involve adsorption of analyte;hence both charging and faradic currents maypotentially carry useful analytical information. Toget such information, it was important to samplecurrent at a frequency at least two times higherthan the current transducer bandwidth. In orderto fulfill this requirement the sampling frequencywas always at 100 kHz. In addition to remove noisefrom the data a second order low pass filters with0.5–30 kHz cut off frequencies were placedbetween the current output of the potentiostatand the data acquisition board. If the maincontribution to the baseline noise is from the‘‘white’’ noise generated by the potentiostat,the integration procedure usually provides a 3- to10-fold improvement in signal-to-noise (S/N) ratiocompared to the simple monitoring of the currentat a fixed potential. However, in the case of severeenvironmental noise (e.g., power line noise) theimprovement may be much larger.
One of the important aspects of this method isapplication of a special analog filtration, which isapplied during the measurement. In this method
at the first, a CV of the electrode was recorded (seeFig. 4a) and then by applying FFT on the collecteddata, the existing high frequency noises wereindicated (see Fig. 4b). Finally, by using thisinformation, the cutoff frequency of the digitaland analog filters was set at a certain value (wherethe noises were removed from the CV). Theresulting CV in Figure 4c shows successfulness ofthe filtering procedure. This kind of filtration andintegration of the net current charges significantlyreduces noise level in the obtained data.
Figure 4. Typical cyclic voltammogram of Au diskultramicroelectrode in 0.05 M H3PO4 (eluent). The flowrate was 100 mL/min, and the sweep rate was 0.5 V/s. a:Without any filtration, (b) FFT diagram of the voltam-mogram, and (c) after applying filtration and removing(the cut off frequency was 40 Hz).
FAST FOURIER TRANSFORM CONTINUOUS CYCLIC VOLTAMMETRIC TECHNIQUE 897
DOI 10.1002/jps JOURNAL OF PHARMACEUTICAL SCIENCES, VOL. 96, NO. 4, APRIL 2007
RESULTS AND DISCUSSION
Method Development and Optimization
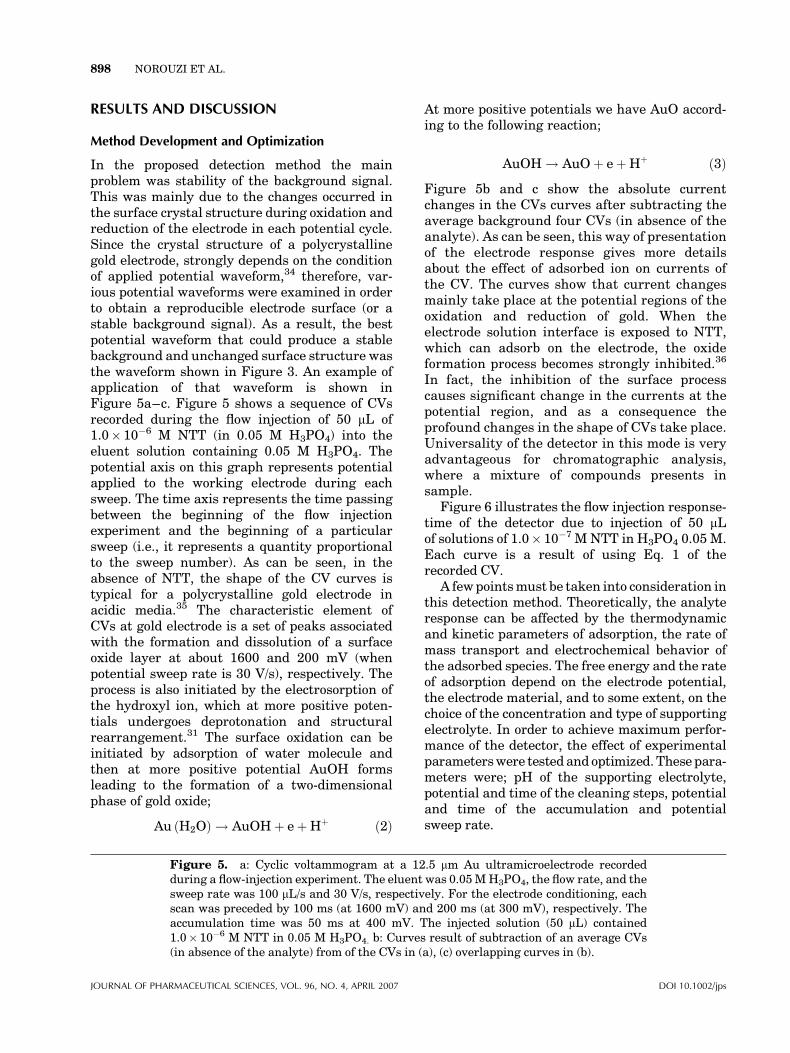
In the proposed detection method the mainproblem was stability of the background signal.This was mainly due to the changes occurred inthe surface crystal structure during oxidation andreduction of the electrode in each potential cycle.Since the crystal structure of a polycrystallinegold electrode, strongly depends on the conditionof applied potential waveform,34 therefore, var-ious potential waveforms were examined in orderto obtain a reproducible electrode surface (or astable background signal). As a result, the bestpotential waveform that could produce a stablebackground and unchanged surface structure wasthe waveform shown in Figure 3. An example ofapplication of that waveform is shown inFigure 5a–c. Figure 5 shows a sequence of CVsrecorded during the flow injection of 50 mL of1.0� 10�6 M NTT (in 0.05 M H3PO4) into theeluent solution containing 0.05 M H3PO4. Thepotential axis on this graph represents potentialapplied to the working electrode during eachsweep. The time axis represents the time passingbetween the beginning of the flow injectionexperiment and the beginning of a particularsweep (i.e., it represents a quantity proportionalto the sweep number). As can be seen, in theabsence of NTT, the shape of the CV curves istypical for a polycrystalline gold electrode inacidic media.35 The characteristic element ofCVs at gold electrode is a set of peaks associatedwith the formation and dissolution of a surfaceoxide layer at about 1600 and 200 mV (whenpotential sweep rate is 30 V/s), respectively. Theprocess is also initiated by the electrosorption ofthe hydroxyl ion, which at more positive poten-tials undergoes deprotonation and structuralrearrangement.31 The surface oxidation can beinitiated by adsorption of water molecule andthen at more positive potential AuOH formsleading to the formation of a two-dimensionalphase of gold oxide;
Au ðH2OÞ ! AuOHþ eþHþ ð2Þ
At more positive potentials we have AuO accord-ing to the following reaction;
AuOH ! AuOþ eþHþ ð3Þ
Figure 5b and c show the absolute currentchanges in the CVs curves after subtracting theaverage background four CVs (in absence of theanalyte). As can be seen, this way of presentationof the electrode response gives more detailsabout the effect of adsorbed ion on currents ofthe CV. The curves show that current changesmainly take place at the potential regions of theoxidation and reduction of gold. When theelectrode solution interface is exposed to NTT,which can adsorb on the electrode, the oxideformation process becomes strongly inhibited.36
In fact, the inhibition of the surface processcauses significant change in the currents at thepotential region, and as a consequence theprofound changes in the shape of CVs take place.Universality of the detector in this mode is veryadvantageous for chromatographic analysis,where a mixture of compounds presents insample.
Figure 6 illustrates the flow injection response-time of the detector due to injection of 50 mLof solutions of 1.0� 10�7 M NTT in H3PO4 0.05 M.Each curve is a result of using Eq. 1 of therecorded CV.
A fewpointsmust be taken into consideration inthis detection method. Theoretically, the analyteresponse can be affected by the thermodynamicand kinetic parameters of adsorption, the rate ofmass transport and electrochemical behavior ofthe adsorbed species. The free energy and the rateof adsorption depend on the electrode potential,the electrode material, and to some extent, on thechoice of the concentration and type of supportingelectrolyte. In order to achieve maximum perfor-mance of the detector, the effect of experimentalparameterswere tested and optimized. These para-meters were; pH of the supporting electrolyte,potential and time of the cleaning steps, potentialand time of the accumulation and potentialsweep rate.
Figure 5. a: Cyclic voltammogram at a 12.5 mm Au ultramicroelectrode recordedduring a flow-injection experiment. The eluent was 0.05MH3PO4, the flow rate, and thesweep rate was 100 mL/s and 30 V/s, respectively. For the electrode conditioning, eachscan was preceded by 100 ms (at 1600 mV) and 200 ms (at 300 mV), respectively. Theaccumulation time was 50 ms at 400 mV. The injected solution (50 mL) contained1.0� 10�6 M NTT in 0.05 M H3PO4. b: Curves result of subtraction of an average CVs(in absence of the analyte) from of the CVs in (a), (c) overlapping curves in (b).
898 NOROUZI ET AL.
JOURNAL OF PHARMACEUTICAL SCIENCES, VOL. 96, NO. 4, APRIL 2007 DOI 10.1002/jps
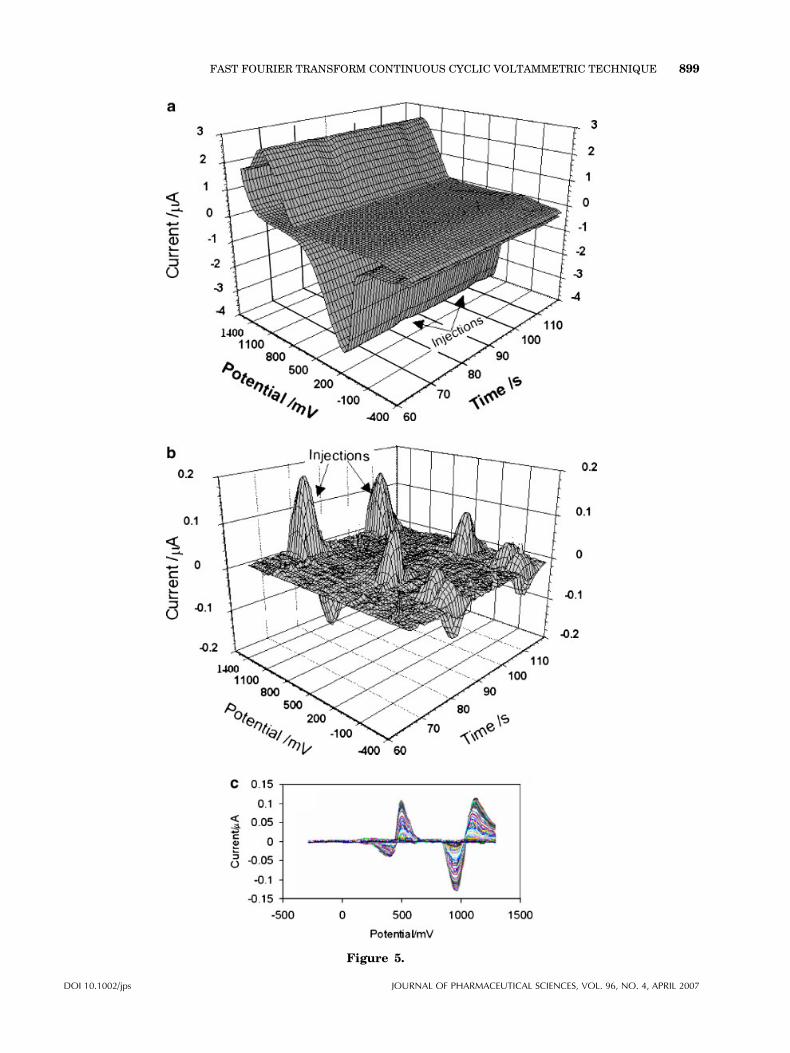
Figure 5.
FAST FOURIER TRANSFORM CONTINUOUS CYCLIC VOLTAMMETRIC TECHNIQUE 899
DOI 10.1002/jps JOURNAL OF PHARMACEUTICAL SCIENCES, VOL. 96, NO. 4, APRIL 2007
Effect of pH of the Eluent
The CV of the gold UME in various pH values ofeluent, are shown in Figure 7. As it is seen, thepH of the eluent changes the potentials of theoxidation and reduction of the gold UME. Figure 7clearly shows that basic solutions (having high pHvalues) are not suitable for the measurements.However, the best S/N ratio was obtained betweenpH values of 2–3. In addition, the results showthat at pH higher than nine noise levels in thebaseline (DQ vs. Time) are higher, up to 12%,compared to that of acidic solution.
Effect of Sweep Rate
To investigate of the influence of sweeping rates, a1.0� 10�7 M solution of NTT was used. Theresponses of the detector to the potential sweeprates were recorded at different scan ratesranging from 20 to 50 V/s, and the results are
shown in Figure 8. Regarding the figure,the proposed detector exhibits the maximumsensitivity at 30 V/s of scan rate. The effects ofthe sweep rate on the detection performance canbe considered from two aspects: first, speed indata acquisition, and second, kinetic factors ofadsorption of the NTT. The use of this detectionmethod in conjunction with fast separation tech-niques such as capillary electrophoresis alsorequires the employment of high sweep rates.From this point of view, it is important tocheck how the sensitivity of the method isaffected by the sweep rate. In order to detectthe amount of the adsorbed analyte on theelectrode surface, high sweep rates must beemployed, so that the sweeping step is short incomparison with the accumulation period. This isvery significant in this detection method, notably,when the accumulation of NTT occurs at apotential that is much larger or smaller than Ei.The main reason for the application of a highsweep rate, is to prevent desorption of theadsorbed NTT, during the potential scanning. Inaddition, under this condition, the inhibitioneffect of the adsorbed NTT, on the oxidationprocess can also take place. However, sensitivityof the detection system mainly depends on thepotential sweep rate, due to kinetic factors ofadsorption, and instrumental limitations. Theresults obtained from the examined NTT onthe gold UME show that the maximum height ofthe electrode response was at the sweep rates of20–35 V/s.
The Effect of Accumulation Potential
The effect of the accumulation potential onresponse of the gold UME for the injection a
Figure 6. Response of Au ultramicroelectrode to fiveconsecutive injections of 1� 10�7 M NTT. All experi-mental conditions as in Figure 5 curves represent DQfunction calculated according to Eq. 1.
Figure 7. Cyclic voltammogram of Au electrode invarious pH at the sweep rate 30 V/s.
Figure 8. The effect of the sweep rate on the responseof Au electrode (12.5 mm in radius) to injections of 1�10�7 M in 0.05 M H3PO4.
900 NOROUZI ET AL.
JOURNAL OF PHARMACEUTICAL SCIENCES, VOL. 96, NO. 4, APRIL 2007 DOI 10.1002/jps

solution of 1.0� 10�7 M NTT, in 0.05 M H3PO4
was also studied over the potential ranges of�700to 300 mV, and the results are depicted inFigure 9. As can be concluded from Figure 9, theadsorption process shows a strong dependenceupon the applied potential. Thus, �400 mVaccumulations potential was chosen. The relationobserved for NTT can be easily explained: regard-ing the fact that the adsorption of protonated NTTon the positively charged electrode becomesthermodynamically unfavorable at the positivepotentials, the efficiency of accumulation reducesat these potential values. The observed drop ofthe response, at very negative potentials, ismost probably due to the competitive adsorptionof hydronium ions.
Influence of the Accumulation Time
The sensitivity of the measurement stronglydepends on the time and the potential of accumu-lation. Accumulation of NTT, on the electrodetakes place during the stripping step (assumingthat an appropriate potential is selected). Asmentioned above, the surface of gold UME is verysmall, and can be saturated in a very short time.Figure 10 depicts the plot of peak charge versuspreconcentration time for 1.0� 10�7 NTT, inthe presence 0.05 M of phosphoric acid. As canbe concluded from Figure 10, the surface of theelectrode becomes saturated with the NTT withina 500 ms time window. In fact, the difference inthe time of saturation of the various compoundscan be related to the existing differences intheir kinetics of the electron transfer and masstransport (Fig. 11).
The Response Stability of the Method
The response of the gold UMEwas investigated forseveral hours and the results showed that theelectrode exhibits a stable response without anychemical or mechanical treatment. The longesttest (24 h) involved replicate measurements of theresponse for 10�7 M NTT on a gold UME in acontinuously flowing of 0.05 M phosphoric acid.The scan rate of 30 V/s, the accumulation potentialof 0.4 V, and accumulation time of 0.5 s wereapplied for all experiments. The relative standarddeviation of the results was 1.7%.
Validation
The method was validated with respect to para-meters such as linearity, limit of quantification(LOQ), limit of detection (LOD), precision, accu-racy, robustness, recovery, and selectivity.37–39
Linearity
The linearity was evaluated by linear regressionanalysis, which calculated by the least square
Figure 9. Theeffect of thepotential on the response ofAu electrode to injections of 1� 10�7 MNTT in a 0.05MH3PO4.
Figure 10. The effect of the accumulation time on theelectrode response to injections of 1� 10�7 M NTT in0.05 M H3PO4.
Figure 11. Calibration curves obtained for NTT onthe Au electrode in 0.05MH3PO4 and its linear dynamicrange (0.05–92 nM).
FAST FOURIER TRANSFORM CONTINUOUS CYCLIC VOLTAMMETRIC TECHNIQUE 901
DOI 10.1002/jps JOURNAL OF PHARMACEUTICAL SCIENCES, VOL. 96, NO. 4, APRIL 2007
regression method.40,41 The calibration curvesconstructed for NTT were linear over the concen-tration range of 50–92000 pg/mL. Peak areas ofNTT were plotted versus NTT concentrationand linear regression analysis performed onthe resultant curve. A correlation coefficient ofR¼ 0.998 with %RSD values ranging from 0.28%to 3% across the concentration range studied wereobtained following linear regression analysis.Typically, the regression equation for the calibra-tion curve was found to be y¼ 0.3552 Xþ 1.978.
LOQ and LOD
The LOQ and LOD were determined based on a S/N ratio and were based on analytical responses of10 and 3 times the background noise, respec-tively.42 The LOQ was found to be 19 pg/mL witha resultant %RSD of 0.4% (n¼ 5). The LOD wasfound to be 6 pg/mL.
Precision
Precision of the assay was investigated withrespect to both repeatability and reproducibility.Repeatability was investigated by injecting ninereplicate samples of each of the 50, 40000, and90000 pg/mL standards where the mean concen-trations were found to be 50.2, 40054, and 89950with associated %RSD’s of 2.3, 1.24, and 0.42,respectively. Inter-day precision was assessed byinjecting the same three concentrations over 3consecutive days, resulting in mean concentra-tions of NTT of 50.3, 40042, and 90009 pg/mL andassociated %RSD of 3.33%, 3.59%, and 2.7%,respectively.
Ruggedness
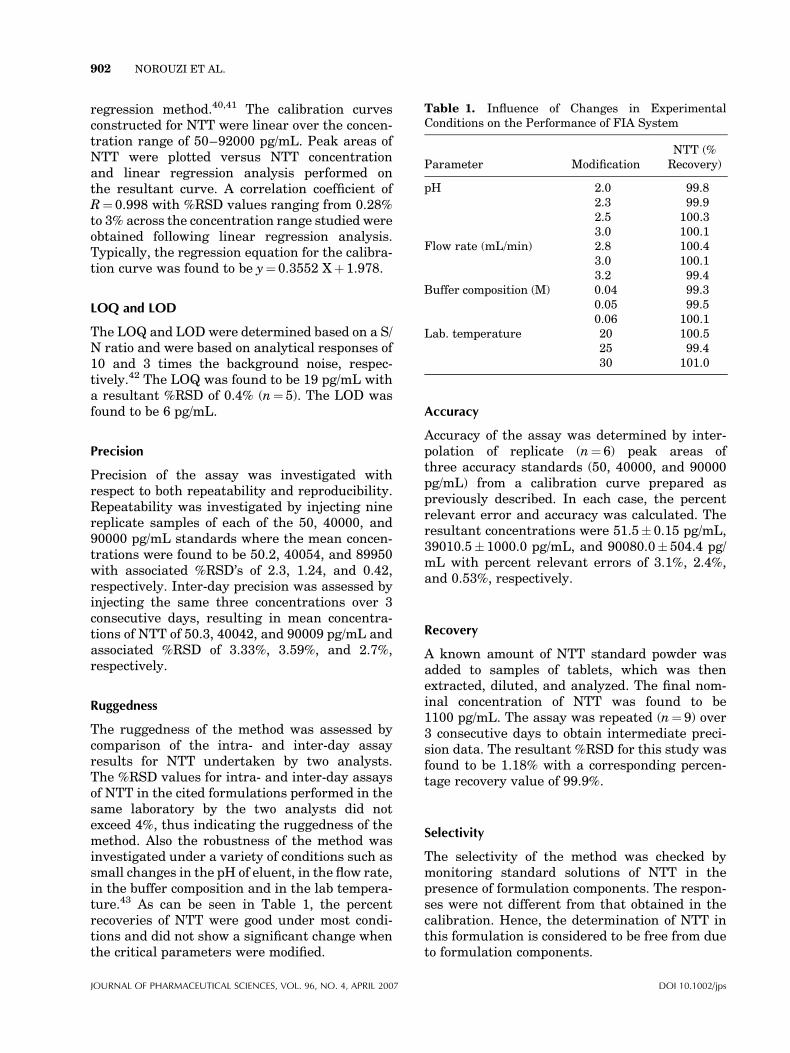
The ruggedness of the method was assessed bycomparison of the intra- and inter-day assayresults for NTT undertaken by two analysts.The %RSD values for intra- and inter-day assaysof NTT in the cited formulations performed in thesame laboratory by the two analysts did notexceed 4%, thus indicating the ruggedness of themethod. Also the robustness of the method wasinvestigated under a variety of conditions such assmall changes in the pH of eluent, in the flow rate,in the buffer composition and in the lab tempera-ture.43 As can be seen in Table 1, the percentrecoveries of NTT were good under most condi-tions and did not show a significant change whenthe critical parameters were modified.
Accuracy
Accuracy of the assay was determined by inter-polation of replicate (n¼ 6) peak areas ofthree accuracy standards (50, 40000, and 90000pg/mL) from a calibration curve prepared aspreviously described. In each case, the percentrelevant error and accuracy was calculated. Theresultant concentrations were 51.5� 0.15 pg/mL,39010.5� 1000.0 pg/mL, and 90080.0� 504.4 pg/mL with percent relevant errors of 3.1%, 2.4%,and 0.53%, respectively.
Recovery
A known amount of NTT standard powder wasadded to samples of tablets, which was thenextracted, diluted, and analyzed. The final nom-inal concentration of NTT was found to be1100 pg/mL. The assay was repeated (n¼ 9) over3 consecutive days to obtain intermediate preci-sion data. The resultant %RSD for this study wasfound to be 1.18% with a corresponding percen-tage recovery value of 99.9%.
Selectivity
The selectivity of the method was checked bymonitoring standard solutions of NTT in thepresence of formulation components. The respon-ses were not different from that obtained in thecalibration. Hence, the determination of NTT inthis formulation is considered to be free from dueto formulation components.
Table 1. Influence of Changes in ExperimentalConditions on the Performance of FIA System
Parameter ModificationNTT (%Recovery)
pH 2.0 99.82.3 99.92.5 100.33.0 100.1
Flow rate (mL/min) 2.8 100.43.0 100.13.2 99.4
Buffer composition (M) 0.04 99.30.05 99.50.06 100.1
Lab. temperature 20 100.525 99.430 101.0
902 NOROUZI ET AL.
JOURNAL OF PHARMACEUTICAL SCIENCES, VOL. 96, NO. 4, APRIL 2007 DOI 10.1002/jps

Assay
The proposed method was applied to the determi-nation of NTT in a generic brand of NTTtablets. The resulting from this assay yielded100.01(%RSD¼ 1.9%) of label claim for the gen-eric brand tablets. The results of the assayindicate that the method is selective for the assayof NTT without interference from the excipientsused in this formulation.
Comparison of the Sensitivity of the ProposedMethod and Other Previously Reported Methods
Table 2 compares the detection limit of theproposed method with those of other reportedmethods. As it is immediately obvious, thesensitivity of the method is superior to all thepreviously reported ones. The data in Table 2revealed that the detection limit of the method is5000 times lower than the most sensitive pre-viously reported method.
REFERENCES
1. Coleman JL, Schoolbag HC, Block MR, MadonnaMJ, Rodriguez E. 1997. Treating depressed pri-mary care patients improves their physical, men-tal, and social functioning. Arch Intern Med157:1113–1117.
2. Dow B, Kline N. 1997. Antidepressant treatment ofpost-traumatic stress disorder and major depres-sion in veterans. Ann Clin Psychiatry 9:1.
3. Montgomery SA. 1994. Prophylactic treatment ofdepression. Br J Hosp Med 52:5.
4. Mico JA, Gigert-Rahola J, Casas J, Rajas O,Serrano MI, Serrano JS. 1997. Implication ofbeta(1)- and beta(2)-adrenergic receptors in theantinociceptive effect of tricyclic antidepressants.Eur Neuropsychopharmacol 7:139–145.
5. Andersson KE. 1988. Current concepts in thetreatment of disorders micturition. Drugs 35:477–481.
6. Robinson RG. 1993. Prevention strategies for post-stroke depression. Am J Psychiatry 150:286.
7. Sullivan M. 1993. A randomized trial of nortrip-tyline for severe chronic tinnitus—effects ondepression, disability, and tinnitus symptoms.Arch Intern Med 153:2251–2259.
8. Floury K. 1972. Analytical profile of drugsubstances, Vol. 1. San Diego: Harcourt BraceJovanovich. pp 233–247.
9. British pharmacopoeia. 1998. British pharmaco-poeia 1998. London: Stationary office. pp 946–1839.
10. United States Pharmacopeia 28-NF 23. 2005.United States pharmacopeia 28-NF 23. Rockville,MD: United States Pharmacopeial Convention,INC. 1404p.
11. Atmaca S, Biligc Z, Acikkol M. 1991. Simultaneousdetermination of nortriptyline hydrochloride andperphenazine in tablets by 4th-derivative ultravio-let spectro-photometry. Pharmazie 46:532–533.
12. Mahgoub H, KoranyM, Abdine H, Abdel-Hady EM.1991. Spectrophotometric assay of fluphenazineHCl-nortriptyline HCl mixture in tablets usingFourier-function method. Anal Lett 24:1797–1811.
13. Dela Pena L, Gomez-hens A, Perez-bendito d. 1995.Kinetic determination of nortriptyline in pharma-ceutical samples by use of photometric and fluori-metric detection. J Pharm Biomed Anal 13:199–203.
14. Bhonagade SL, Kasture AV. 1993. Extractivespectrophotometric determinations of some phe-nothiazine-derivatives in pharmaceutical prepera-tions. Indian J Pharm Sci 55:155–157.
15. Oztunc A, Docurmaci N, Ahtasakl E. 1999. The useof tetracyanoquinodimethane for the determina-tion of nortriptyline and desipramine in tablets.Farmaco 54:835–837.
16. Wang J. 1985. Stripping analysis. Deerfield Beach,Florida: VCH publishers.
17. Norouzi P, Ganjali MR, Matloobi P. 2005. Sub-second adsorption for sub-nanomolar monitoring ofmetoclopramide by fast stripping continuous cyclicvoltammetry. Electrochem Commun 7:333–338.
18. Ganjali MR, Sepehri A, Daftari A, Norouzi P,Pirelahi H, Moradzadegan A. 2005. Determinationof salbutamol, amikacin and paromomycin sulfateby a novel sulfate polymeric membrane sensorbased on 2,6-diphenyl 4-(4-methoxyphenyl) pyry-lium perchlorate. Microchim Acta 149:245–249.
19. Ganjali MR, Norouzi P, Ghorbani M, Sepehri A.2005. Fourier transform cyclic voltammetric tech-nique for monitoring ultratrace amounts of salbu-tamol at gold ultra microelectrode in flowingsolutions. Talanta 66:1225–1233.
Table 2. Comparison between the Detection Limitsof the Proposed Method with the Other ReportedMethods
Method Detection Limit Ref.
Spectrophotometry <24 mg/mL 8Reversed-phase HPLC 2.8� 10�2 mg/mL 9HPLC <0.6 mg/mL 11Fluorimetry 0.12 mg/mL 13Colorimetry 0.18 mg/mL 14Flow-injection fluorimetry 0.13 mg/mL 10This work �6.0 pg/mL —
FAST FOURIER TRANSFORM CONTINUOUS CYCLIC VOLTAMMETRIC TECHNIQUE 903
DOI 10.1002/jps JOURNAL OF PHARMACEUTICAL SCIENCES, VOL. 96, NO. 4, APRIL 2007
20. Norouzi P, Ganjali MR, Ghorbani M, Sepehri A.2005. Novel method for fast determination of ultratrace amounts of timolol maleate by continouscyclic voltammetry at Au microelectrode in flowinginjection systems. Sens Actuators B 110:239–245.
21. Kissinger PT, Heineman WR. 1984. Laboratorytechniques in electroanalytical chemistry. NewYork: Marcel Dekker.
22. Li SFY. 1992. Capillary electrophoresis; principles,practice and applications. Amsterdam: Elsevier.
23. Wightman RM,Wip FDO. 1989. In: Bard AJ, editor.Electroanalytical chemistry, Vol. 15. New York:Marcel Dekker.
24. Paeschke M, Dietrich F, Ulig A, Hintsche R. 1996.Voltammetric multichannel measurements usingsilicon fabricated microelectrode arrays. Electro-analysis 8:891–898.
25. Dimitrakopoulos T, Alexander PW, Hibbert DB.1996. Serial array of ises for use in a portablebattery-powered flow injection analyzer. Electro-analysis 8:438–442.
26. Cosofret V, Erdosy M, Johnson TA, Buck RP,Ash RB, NeumanMR. 1995. Microfabricated sensorarrays sensitive to pH and Kþ for ionic distributionmeasurements in the beating heart. Anal Chem67:1647–1653.
27. Hintsche R, Paeschke M, Wollenberger U,Schnakenberg U, Wagner B, Lisec T. 1994. Micro-electrode arrays and application to biosensingdevices. Biosens Bioelectron 9:697–705.
28. Sreenivas G, Ang SS, Fritsch I, Brown WD,Gerhardt GA, Woodward D. 1996. Fabrication andcharacterization of sputtered-carbon microelec-trode arrays. J Anal Chem 68:1858–1864.
29. Conway BE, Angerstein-Kozlowska H, Ho FC,Klinger J, Macdugall B, Gottesfeld S. 1973. Fara-day Discuss. Chem Soc 56:199–205.
30. Burke LD, O’Dwyer KJ. 1989. Mediation of oxida-tion reactions at noble metal anodes by low levels ofin situ generated hydroxy species. ElectrochimActa 34:1659–1664.
31. Kovacs GTA, Storment CW, Kounaves SP. 1995.Microfabricated heavy-metal ion sensor. SensActuators B 23:41–47.
32. Baranski AS, Norouzi P, Lana N. 1996. Newvoltammetric detection of proteins and amino acidsutilizing electrosorption processes at gold ultra-microelectrodes. J Proc Electrochem Soc 9:41–44.
33. Baranski AS, Krogulec T, Lana N, Norouzi P. 1998.High-frequency impedance spectroscopy of plati-num ultramicroelectrode in flowing solutions. AnalChem 14:2895–2901.
34. Wightman RM, Wip FDO. In: Bard AJ, editor.Electroanalytical chemistry. 5th edition. New York:Marcel Dekker.
35. Bockris JOM, Conway BE, Yeager E. 1980. Com-prehensive treatise of electrochemistry. New Yorkand London: Plenum.
36. Lipkowski J, Stolberg L. 1992. In: Lipkowski J,Ross PN, editors. Adsorption of molecules at metalelectrodes edition. New york: VCH.
37. Ermer J. 2001. Validation in pharmaceuticalanalysis. Part I: An integrated approach. J PharmBiomed Anal 24:755.
38. Shabir GA, Chromatogra J. 2003. Validation ofhigh-performance liquid chromatography methodsfor pharmaceutical analysis—Understanding thedifferences and similarities between validationrequirements of the US Food and Drug Adminis-tration. J Chromatogr A 987:57.
39. United States pharmacopeia 28-NF 23. 2005.Rockville, MD: United States PharmacopeialConvention, INC. 2748p.
40. Miller JC, Miller JN. 1984. Statistics for analyticalchemistry, Vol. 22. Chichester: Ellis Horwood. 82p.
41. Al-Kurdi Z, Al-Jallad T, Badwanamd A, JaberAMY. 1999. High performance liquid chromatogra-phy method for determination of methyl-5-benzoyl-2-benzimidazole carbamate (mebendazole) and itsmain degradation product in pharmaceuticaldosage forms. Talanta 50:1089–1097.
42. International Conference on Harmonisation (ICH).1995. Guidelines on Validation of Analytical proce-dures: Definitions and Terminology, Federal Reg-ister Vol. 60, IFPMA, Switzerland.
43. Heyden YV, Nijhuis A, Smeyers-Verbeke J,Vandeginste BGM, Massaret DL, 2001. Guidancefor robustness/ruggedness tests in method valida-tion. J Pharm Biomed Anal 18:43–56.
904 NOROUZI ET AL.
JOURNAL OF PHARMACEUTICAL SCIENCES, VOL. 96, NO. 4, APRIL 2007 DOI 10.1002/jps