(Amount in Thousand) EXPORT OF GOODS BY COMMDOITY ...
141
Rs. US $ (Amount in Thousand) Difference (A) Total Export Receipts (Schedule Banks) EXPORT OF GOODS BY COMMDOITY / COUNTRY AND SERVICES BY TYPE / COUNTRY 144,682,230 178,301 1,692,129 1,513,828 169 State Bank of Pakistan July 2010 200 9 2010 HS CODE-COMMODITY / COUNTRY Live Horses, Asses, Mules and Hinnies 497 149 646 55,194 101 0 - Albania 2,138 25 0 25 France 3,872 45 0 45 Germany 0 0 .. .. India 0 0 26 -26 Kuwait 0 0 13 -13 Malaysia 0 0 29 -29 Russian Federation 768 9 0 9 Saudi Arabia 1,282 15 0 15 Spain 0 0 4 -4 U. A. E. Dubai 31,608 370 6 364 U. K. 564 7 .. 7 U. S. A. 14,963 175 72 103 Live Bovine Animals 735 39 774 66,180 102 0 - Afghanistan 513 6 0 6 Bangladesh 1,958 23 0 23 China 3,694 43 0 43 Iran 10,649 125 0 125 Somalia 34,412 402 0 402 U. A. E. Dubai 8,704 102 39 62 U. S. A. 6,251 73 0 73 Live Sheep and Goats 4 142 146 12,496 104 0 - U. A. E. Dubai 12,496 146 134 13 U. A. E. Sharjah 0 0 8 -8 Live Chickens, Ducks, Geese, Turkeys, and -6 8 2 206 105 0 - Bahrain 0 0 7 -7 Hong Kong 206 2 0 2 U. A. E. Dubai 0 0 1 -1 Live Animals NES -68 270 202 17,254 106 0 - China 6,356 74 0 74 Hong Kong 1,824 21 0 21 Kenya 6,947 81 0 81 Oman 0 0 16 -16 Turkey 2,128 25 0 25 U. A. E. Dubai 0 0 229 -229 U. K. 0 0 2 -2 U. S. A. 0 0 22 -22 Uzbekistan 0 0 1 -1 Meat of Bovine Animals, Fresh or Chilled 5,013 761 5,774 493,692 201 0 - Afghanistan 50,761 594 0 594 Bahrain 31,786 372 0 372 Brunei 1,843 22 0 22 Hong Kong 374 4 42 -37 Kuwait 66,719 780 78 702 Oman 28,349 332 68 264 Qatar 0 0 79 -79 Saudi Arabia 62,960 736 4 732 U. A. E. Abudhabi 36,218 424 196 227 U. A. E. Ajman 6,236 73 0 73 U. A. E. Dubai 179,883 2,104 291 1,813 U. A. E. Sharjah 3,444 40 0 40 U. K. 25,118 294 4 290 Meat of Bovine Animals, Frozen 516 8 524 44,811 202 0 - Kuwait 1,356 16 8 8 Saudi Arabia 10,378 121 0 121 U. A. E. Abudhabi 1,320 15 0 15 U. A. E. Ajman 27,207 318 0 318 U. A. E. Dubai 4,551 53 0 53 Meat of Swine, Fresh, Chilled or Frozen -14 35 21 1,768 203 0 - Hong Kong 0 0 .. .. Italy 1,768 21 0 21 U. A. E. Dubai 0 0 35 -35
-
Upload
khangminh22 -
Category
Documents
-
view
0 -
download
0
Transcript of (Amount in Thousand) EXPORT OF GOODS BY COMMDOITY ...

Rs. US $
(Amount in Thousand)
Difference
(A) Total Export Receipts (Schedule Banks)
EXPORT OF GOODS BY COMMDOITY / COUNTRY AND SERVICES BY TYPE / COUNTRY
144,682,230 178,301 1,692,129 1,513,828
169 State Bank of Pakistan
July20 10 200 920 10HS CODE-COMMODITY / COUNTRY
Live Horses, Asses, Mules and Hinnies 49714964655,194 1010 -Albania 2,138 25 0 25France 3,872 45 0 45Germany 0 0 .. ..India 0 0 26 -26Kuwait 0 0 13 -13Malaysia 0 0 29 -29Russian Federation 768 9 0 9Saudi Arabia 1,282 15 0 15Spain 0 0 4 -4U. A. E. Dubai 31,608 370 6 364U. K. 564 7 .. 7U. S. A. 14,963 175 72 103Live Bovine Animals 7353977466,180 1020 -Afghanistan 513 6 0 6Bangladesh 1,958 23 0 23China 3,694 43 0 43Iran 10,649 125 0 125Somalia 34,412 402 0 402U. A. E. Dubai 8,704 102 39 62U. S. A. 6,251 73 0 73Live Sheep and Goats 414214612,496 1040 -U. A. E. Dubai 12,496 146 134 13U. A. E. Sharjah 0 0 8 -8Live Chickens, Ducks, Geese, Turkeys, and -682206 1050 -Bahrain 0 0 7 -7Hong Kong 206 2 0 2U. A. E. Dubai 0 0 1 -1Live Animals NES -6827020217,254 1060 -China 6,356 74 0 74Hong Kong 1,824 21 0 21Kenya 6,947 81 0 81Oman 0 0 16 -16Turkey 2,128 25 0 25U. A. E. Dubai 0 0 229 -229U. K. 0 0 2 -2U. S. A. 0 0 22 -22Uzbekistan 0 0 1 -1Meat of Bovine Animals, Fresh or Chilled 5,0137615,774493,692 2010 -Afghanistan 50,761 594 0 594Bahrain 31,786 372 0 372Brunei 1,843 22 0 22Hong Kong 374 4 42 -37Kuwait 66,719 780 78 702Oman 28,349 332 68 264Qatar 0 0 79 -79Saudi Arabia 62,960 736 4 732U. A. E. Abudhabi 36,218 424 196 227U. A. E. Ajman 6,236 73 0 73U. A. E. Dubai 179,883 2,104 291 1,813U. A. E. Sharjah 3,444 40 0 40U. K. 25,118 294 4 290Meat of Bovine Animals, Frozen 516852444,811 2020 -Kuwait 1,356 16 8 8Saudi Arabia 10,378 121 0 121U. A. E. Abudhabi 1,320 15 0 15U. A. E. Ajman 27,207 318 0 318U. A. E. Dubai 4,551 53 0 53Meat of Swine, Fresh, Chilled or Frozen -1435211,768 2030 -Hong Kong 0 0 .. ..Italy 1,768 21 0 21U. A. E. Dubai 0 0 35 -35

Rs. US $
(Amount in Thousand)
Difference
EXPORT OF GOODS BY COMMDOITY / COUNTRY AND SERVICES BY TYPE / COUNTRY
Export of Goods and Services July 2010 170
July20 10 200 920 10HS CODE-COMMODITY / COUNTRY
Meat of Sheep or Goats, Fresh, Chilled or Frozen 1,8635,6427,505641,694 2040 -Bahrain 54,146 633 103 530Kuwait 50,537 591 832 -241Oman 43,653 511 703 -192Panama Inc. Panama Canal Zone 0 0 13 -13Qatar 29,444 344 272 73Saudi Arabia 318,991 3,731 1,919 1,811Solomon Islands 0 0 21 -21U. A. E. Abudhabi 10,302 120 89 31U. A. E. Ajman 3,708 43 4 39U. A. E. Dubai 125,197 1,464 1,685 -221U. A. E. Sharjah 2,950 35 0 35U. S. A. 1,535 18 0 18Viet Nam 1,230 14 0 14Edible Offal of Bovine Animals; Swine, Sheep, 6544050543,200 2060 -Germany 0 0 98 -98Hong Kong 21,052 246 164 82Myanmar 7,266 85 0 85Portugal 9,755 114 105 10Viet Nam 5,127 60 74 -14Meat and Edible Offal of Poultry, Fresh, Chilled 1811913711,751 2070 -Hong Kong 5,288 62 119 -57Viet Nam 6,462 76 0 76Other Meat & Edible Offal ; Fresh, Chilled or -303000 2080 -Uganda 0 0 30 -30Meat and Edible Offal Salted, Dried etc. and 6410867 2100 -Italy 0 0 2 -2Romania 0 0 2 -2U. A. E. Dubai 867 10 0 10Fish, Live -87958718 3010 -Bahrain 428 5 0 5Hong Kong 0 0 8 -8Kuwait 0 0 61 -61Other Countries 290 3 0 3Saudi Arabia 0 0 12 -12South Korea 0 0 14 -14Fish, Fresh or Chilled (Not Fish Fillets & other -21234513311,371 3020 -Bangladesh 132 2 95 -93China 0 0 50 -50Denmark 0 0 38 -38Kuwait 2,808 33 0 33Myanmar 0 0 19 -19Oman 0 0 3 -3Qatar 359 4 0 4Saudi Arabia 2,575 30 7 23Thailand 0 0 88 -88U. A. E. Dubai 4,116 48 26 23U. A. E. Sharjah 0 0 .. ..U. S. A. 1,381 16 19 -3Fish Frozen (Not Fish Fillets & other Fish Meat) 3,6483,8837,531643,887 3030 -Bangladesh 12,240 143 5 138China 203,595 2,381 1,326 1,055Egypt 66,337 776 0 776Germany 0 0 9 -9Hong Kong 27,932 327 270 57Indonesia 11,229 131 0 131Japan 6,585 77 33 44Jordan 481 6 0 6Leeward Islands 705 8 0 8Malaysia 24,077 282 167 115Other Countries 9,227 108 0 108Saudi Arabia 7,439 87 10 77Singapore 8,675 101 206 -105

Rs. US $
(Amount in Thousand)
Difference
EXPORT OF GOODS BY COMMDOITY / COUNTRY AND SERVICES BY TYPE / COUNTRY
171 State Bank of Pakistan
July20 10 200 920 10HS CODE-COMMODITY / COUNTRY
South Korea 50,058 585 139 446Sri Lanka 7,104 83 68 15Thailand 160,878 1,882 1,359 522U. A. E. Dubai 6,499 76 142 -66U. A. E. Sharjah 10,694 125 20 105U. A. E. Ummal Quwain 0 0 30 -30U. K. 7,369 86 0 86U. S. A. 22,763 266 0 266Viet Nam 0 0 99 -99Fish Fillets and other Fish Meat, Fresh, Chilled -6122,6562,044174,792 3040 -Bahrain 2,636 31 0 31Bangladesh 821 10 19 -10China 52,729 617 637 -20Hong Kong 4,099 48 0 48India 0 0 2 -2Indonesia 6,994 82 34 48Japan 21,936 257 121 135Kuwait 6,611 77 202 -125Malaysia 2,351 27 114 -87Other Countries 239 3 0 3Saudi Arabia 18,487 216 257 -41Singapore 852 10 80 -70South Korea 15,587 182 232 -49Sri Lanka 1,195 14 0 14Thailand 21,036 246 652 -406Turkey 0 0 7 -7U. A. E. Dubai 7,731 90 87 3U. A. E. Sharjah 0 0 45 -45U. S. A. 4,898 57 43 14Viet Nam 6,590 77 125 -48Fish Dried, Salted or in Brine; Smoked etc; Ed -16954237331,907 3050 -Bahrain 258 3 0 3Bangladesh 925 11 12 -1China 13,008 152 0 152Hong Kong 0 0 62 -62Qatar 621 7 0 7Saudi Arabia 428 5 20 -15South Korea 0 0 24 -24Sri Lanka 12,849 150 345 -194U. A. E. Dubai 660 8 0 8Viet Nam 3,158 37 80 -43Crustaceans; Live, Fresh etc, and Cooked etc. 3541,4091,763150,764 3060 -Bahrain 0 0 100 -100Chad 4,271 50 0 50China 29,301 343 89 254Egypt 20,199 236 384 -148Hong Kong 22,433 262 111 152Japan 0 0 79 -79Jordan 517 6 6 ..Kuwait 2,171 25 0 25Lebanon 0 0 143 -143Malaysia 1,022 12 0 12Other Countries 896 10 0 10Saudi Arabia 5,115 60 84 -24Singapore 2,156 25 11 14South Korea 21,240 248 226 22Thailand 0 0 32 -32U. A. E. Dubai 27,447 321 102 219U. A. E. Sharjah 11,131 130 0 130U. S. A. 2,572 30 36 -6Viet Nam 294 3 6 -2Molluscs & Aquatic Invertebrates NES Live etc. -4717713011,141 3070 -China 11,141 130 0 130Sri Lanka 0 0 41 -41Viet Nam 0 0 136 -136

Rs. US $
(Amount in Thousand)
Difference
EXPORT OF GOODS BY COMMDOITY / COUNTRY AND SERVICES BY TYPE / COUNTRY
Export of Goods and Services July 2010 172
July20 10 200 920 10HS CODE-COMMODITY / COUNTRY
Milk and Cream, Not Concentrated or Sweetened -262600 4010 -Kuwait 0 0 26 -26Milk and Cream, Concentrated or Sweetened -2,9083,10820017,098 4020 -Afghanistan 17,098 200 2,922 -2,722Germany 0 0 150 -150U. A. E. Dubai 0 0 37 -37Butter milk, Yogurt, Kephir etc, Flavored Not 300302,531 4030 -Afghanistan 2,531 30 0 30Whey and Milk Products NES, Flavored etc. or 415428 4040 -Greece 0 0 1 -1Zimbabwe 428 5 0 5Butter and other Fats and Oils Derived from -218296786,675 4050 -Germany 0 0 288 -288Hong Kong 1,022 12 0 12Oman 4,549 53 0 53Saudi Arabia 1,105 13 8 5Natural Honey -1012111109,382 4090 -Canada 0 0 39 -39Iraq 4,972 58 0 58Kuwait 0 0 2 -2Nigeria 0 0 4 -4Oman 0 0 41 -41Saudi Arabia 0 0 125 -125U. A. E. Dubai 239 3 0 3U. S. A. 4,170 49 0 49Human Hair, Unworked and Waste of Human 11011913 5010 -U. A. E. Dubai 913 11 0 11Horsehair and Horsehair Waste 610615,254 5030 -Belgium 5,254 61 0 61Guts, Bladders, Stomachs of Animals (Not Fish) -491,1481,09993,945 5040 -Austria 0 0 16 -16Burkina Faso ( Upper Volta) 0 0 140 -140Central African Republic 2,225 26 0 26China 2,564 30 0 30France 5,743 67 28 39Germany 8,004 94 22 72Hong Kong 2,780 33 119 -87Italy 10,613 124 57 67Japan 5,706 67 27 40Lithuania 2,269 27 0 27Myanmar 2,134 25 0 25Poland 13,925 163 169 -6Portugal 0 0 25 -25Romania 25,420 297 318 -20Spain 4,431 52 61 -9Turkey 4,713 55 49 6U. A. E. Dubai 0 0 10 -10U. S. A. 855 10 30 -20Viet Nam 2,563 30 76 -46Bird Skins and other Feathered Parts and Down 404335 5050 -Viet Nam 335 4 0 4Bones & Horn - Cores, Unworked, Defatted, -291388978,286 5060 -Indonesia 0 0 133 -133Kuwait 0 0 50 -50Philippines 0 0 2 -2Singapore 0 0 56 -56U. A. E. Dubai 2,565 30 88 -58U. K. 5,721 67 24 43U. S. A. 0 0 25 -25Venezuela 0 0 9 -9Ivory, Tortoise-Shell, Whalebone etc. -2273514,359 5070 -Egypt 1,961 23 17 5

Rs. US $
(Amount in Thousand)
Difference
EXPORT OF GOODS BY COMMDOITY / COUNTRY AND SERVICES BY TYPE / COUNTRY
173 State Bank of Pakistan
July20 10 200 920 10HS CODE-COMMODITY / COUNTRY
Japan 2,397 28 29 -1Saudi Arabia 0 0 13 -13U. A. E. Dubai 0 0 14 -14Ambergris, Castoreum, Civet and Musk -141400 5100 -Romania 0 0 14 -14Animal Products NES, Inedible Dead Animals -25103786,695 5110 -Germany 5,118 60 103 -44Hong Kong 276 3 0 3Romania 1,301 15 0 15Bulbs, Tubers, Tuberous Roots, Corms, Chicory -8800 6010 -Bangladesh 0 0 8 -8Other Live Plants and their Roots NES, Cuttings -3757201,675 6020 -Egypt 0 0 25 -25France 0 0 32 -32Germany 1,675 20 0 20Cut Flowers and Flower Buds for Bouquet or for -2591665,629 6030 -Bahrain 0 0 7 -7Germany 920 11 11 ..India 0 0 2 -2Libya 862 10 19 -9Mexico 0 0 10 -10U. A. E. Dubai 3,846 45 42 3Foliage, Branches and other Parts of Plants for -373700 6040 -Malaysia 0 0 37 -37Potatoes, Fresh or Chilled -3431,00566256,576 7010 -Bahrain 1,453 17 0 17Kazakhstan 0 0 10 -10Malaysia 14,431 169 90 78Saudi Arabia 102 1 0 1Singapore 361 4 3 1Sri Lanka 38,538 451 868 -417U. A. E. Abudhabi 0 0 6 -6U. A. E. Dubai 1,690 20 26 -6U. K. 0 0 2 -2Tomatoes, Fresh or Chilled 10601069,063 7020 -U. A. E. Dubai 9,063 106 0 106Onions, Shallots, Garlic, Leeks etc, Fresh or 6009369359,235 7030 -Bahrain 1,420 17 0 17Canada 1,760 21 0 21Indonesia 0 0 13 -13Malaysia 3,897 46 0 46Norway 452 5 0 5Oman 1,270 15 0 15Singapore 1,197 14 0 14Sri Lanka 13,568 159 0 159Turkey 331 4 0 4U. A. E. Abudhabi 0 0 37 -37U. A. E. Dubai 31,112 364 42 321U. A. E. Sharjah 3,396 40 0 40U. S. A. 832 10 0 10Cabbages, Cauliflower, Kohlrabi, Kale etc. Fresh -18019111912 7040 -Afghanistan 0 0 45 -45Canada 762 9 20 -11Kuwait 150 2 11 -9Malaysia 0 0 95 -95U. K. 0 0 21 -21Carrots, Turnips & other Edible Roots, Fresh or 263292,437 7060 -Saudi Arabia 2,437 29 0 29U. A. E. Dubai 0 0 3 -3Other Vegetables NES Fresh or Chilled -3143,1972,883246,510 7090 -Austria 628 7 0 7Bahrain 6,743 79 111 -32

Rs. US $
(Amount in Thousand)
Difference
EXPORT OF GOODS BY COMMDOITY / COUNTRY AND SERVICES BY TYPE / COUNTRY
Export of Goods and Services July 2010 174
July20 10 200 920 10HS CODE-COMMODITY / COUNTRY
Belgium 549 6 .. 6Canada 8,404 98 180 -81Egypt 0 0 17 -17France 0 0 85 -85Germany 8,417 98 64 35Greece 2,580 30 3 27India 4,505 53 0 53Ireland 0 0 3 -3Italy 348 4 6 -2Kuwait 2,730 32 54 -22Malaysia 37 .. 18 -17Maldives 137 2 1 1Netherlands (Holland) 1,389 16 28 -12North Korea 294 3 0 3Norway 4,025 47 50 -3Oman 312 4 7 -4Polynesia 6 .. 0 ..Qatar 11,445 134 45 88Saudi Arabia 27,972 327 233 94Singapore 252 3 6 -3Spain 0 0 3 -3Sri Lanka 9,677 113 17 96Sweden 977 11 4 8Switzerland 6,029 71 194 -124U. A. E. Abudhabi 11,456 134 87 47U. A. E. Dubai 62,183 727 603 124U. A. E. Sharjah 0 0 86 -86U. K. 75,417 882 1,291 -409Vegetables Frozen 4776221,09993,939 7100 -Angola 19 .. 0 ..Austria 546 6 0 6Kuwait 2,846 33 0 33Malaysia 0 0 2 -2Norway 1,631 19 3 16Oman 851 10 0 10Qatar 1,749 20 0 20Saudi Arabia 487 6 25 -19Singapore 0 0 8 -8Sri Lanka 58,747 687 579 108U. A. E. Abudhabi 4,465 52 0 52U. A. E. Dubai 4,197 49 3 46U. A. E. Sharjah 0 0 1 -1U. K. 17,623 206 0 206U. S. A. 779 9 0 9Vegetables, Temporarily Preserved, not now -292900 7110 -U. K. 0 0 29 -29Vegetables, Dried, Whole, Cut etc. not further 15556271761,339 7120 -Bahrain 492 6 0 6Canada 410 5 0 5France 10,448 122 396 -273Malaysia 6,188 72 3 69South Africa 180 2 0 2Sri Lanka 12,206 143 5 138Switzerland 24,752 289 136 154U. A. E. Dubai 6,661 78 19 59U. K. 0 0 3 -3Leguminous Vegetables, Dried Shelled -313100 7130 -U. K. 0 0 31 -31Other Nuts NES Fresh or Dried Whether Shelled -1,0691,26019116,351 8020 -Australia 0 0 10 -10Bahrain 2,558 30 0 30Denmark 0 0 194 -194France 0 0 345 -345Germany 5,462 64 426 -362

Rs. US $
(Amount in Thousand)
Difference
EXPORT OF GOODS BY COMMDOITY / COUNTRY AND SERVICES BY TYPE / COUNTRY
175 State Bank of Pakistan
July20 10 200 920 10HS CODE-COMMODITY / COUNTRY
Greece 0 0 52 -52Italy 1,091 13 0 13Malaysia 0 0 6 -6Spain 0 0 28 -28U. A. E. Dubai 3,032 35 127 -91U. A. E. Sharjah 0 0 8 -8U. K. 4,208 49 35 14U. S. A. 0 0 30 -30Dates, Figs, Pineapples, Avocados etc, Fr or Dried -1,74514,74613,0011,111,607 8040 -Afghanistan 0 0 128 -128Australia 1,378 16 49 -33Austria 1,335 16 2 13Azerbaijan 12,654 148 0 148Bahrain 5,590 65 52 14Bangladesh 5,757 67 0 67Belgium 35,338 413 316 98Canada 23,529 275 140 135China 2,450 29 1 28Denmark 5,178 61 73 -12France 17,634 206 170 36French Guinea 0 0 1 -1Germany 37,746 441 626 -184Greece 1,408 16 16 ..Hong Kong 1,924 22 50 -28India 130,641 1,528 2,082 -554Iran 3,797 44 73 -28Iraq 916 11 0 11Ireland 236 3 10 -7Italy 11,469 134 79 55Jamaica 1,131 13 3 10Japan 0 0 12 -12Jordan 0 0 19 -19Kenya 853 10 0 10Kuwait 6,586 77 73 4Libya 0 0 262 -262Malaysia 10,219 120 113 7Maldives 901 11 4 6Mali 0 0 1 -1Malta 127 1 0 1Nepal 788 9 11 -2Netherlands (Holland) 3,731 44 50 -7Norway 19,481 228 202 26Oman 44,063 515 611 -96Other Countries 846 10 20 -10Qatar 6,491 76 174 -98Russian Federation 0 0 16 -16Saudi Arabia 96,223 1,125 2,410 -1,284Singapore 10,143 119 78 41Solomon Islands 171 2 0 2South Africa 6,365 74 38 37Spain 1,056 12 24 -12Sri Lanka 494 6 0 6Sweden 17,751 208 111 97Switzerland 9,024 106 222 -117U. A. E. Abudhabi 208 2 2 ..U. A. E. Ajman 1,250 15 0 15U. A. E. Dubai 217,989 2,549 2,241 309U. K. 352,131 4,118 4,080 38U. S. A. 4,608 54 101 -47Citrus Fruit, Fresh or Dried -4751,5051,03088,107 8050 -Bahrain 1,190 14 15 -2Germany 945 11 3 9Hong Kong 0 0 21 -21Indonesia 466 5 0 5Iran 3,206 37 524 -487Italy 1,008 12 0 12

Rs. US $
(Amount in Thousand)
Difference
EXPORT OF GOODS BY COMMDOITY / COUNTRY AND SERVICES BY TYPE / COUNTRY
Export of Goods and Services July 2010 176
July20 10 200 920 10HS CODE-COMMODITY / COUNTRY
Kuwait 14,645 171 2 169Mauritius 0 0 16 -16Netherlands (Holland) 2,030 24 0 24Norway 907 11 0 11Oman 3,471 41 15 25Philippines 1,612 19 0 19Qatar 0 0 8 -8Russian Federation 16,505 193 336 -143Saudi Arabia 8,558 100 73 27South Korea 0 0 20 -20Sri Lanka 128 2 0 2Sweden 0 0 4 -4U. A. E. Dubai 29,435 344 377 -33U. K. 1,306 15 3 12U. S. A. 2,523 30 0 30Ukraine 0 0 47 -47Uzbekistan 171 2 40 -38Grapes, Fresh or Dried 130131,112 8060 -Malaysia 1,112 13 0 13Melons and Papayas, Fresh -5105418 8070 -Netherlands (Holland) 418 5 0 5U. K. 0 0 10 -10Apples, Pears and Quinces, Fresh -656500 8080 -Sri Lanka 0 0 25 -25U. A. E. Dubai 0 0 40 -40Apricots, Cherries, Peaches, Plums and Sloes, 94131,077 8090 -India 759 9 0 9U. A. E. Dubai 0 0 4 -4U. K. 318 4 0 4Fruit NES Fresh -3851,17979467,927 8100 -Australia 201 2 11 -9Austria 0 0 16 -16Bahrain 684 8 34 -26Canada 5,690 67 52 14Denmark 217 3 0 3Germany 2,342 27 61 -34Hong Kong 616 7 0 7Iran 0 0 4 -4Italy 934 11 0 11Kuwait 1,829 21 29 -8Malaysia 0 0 6 -6Maldives 0 0 .. ..Netherlands (Holland) 321 4 8 -5Nigeria 0 0 16 -16Norway 1,478 17 118 -100Oman 3,204 37 7 31Qatar 6,100 71 61 11Russian Federation 1,006 12 0 12Saudi Arabia 14,258 167 321 -155Singapore 757 9 37 -28Spain 218 3 54 -51Sri Lanka 4,086 48 59 -12U. A. E. Dubai 6,168 72 195 -123U. A. E. Sharjah 0 0 15 -15U. K. 15,365 180 74 106U. S. A. 2,454 29 0 29Fruit and Nuts; Raw or Cooked By Steam etc. 2424484,069 8110 -India 0 0 24 -24Saudi Arabia 3,869 45 0 45U. A. E. Abudhabi 200 2 0 2Fruit and Nuts Temporarily Preserved, Not Now -118205877,431 8120 -Austria 0 0 11 -11Bahrain 0 0 10 -10Hong Kong 0 0 2 -2

Rs. US $
(Amount in Thousand)
Difference
EXPORT OF GOODS BY COMMDOITY / COUNTRY AND SERVICES BY TYPE / COUNTRY
177 State Bank of Pakistan
July20 10 200 920 10HS CODE-COMMODITY / COUNTRY
Italy 2,006 23 24 ..Kuwait 147 2 36 -35Saudi Arabia 0 0 12 -12U. A. E. Dubai 5,278 62 111 -49Fruit Dried NES Mixtures of Nuts or Dried Fruit 2859738232,625 8130 -Australia 370 4 0 4Germany 0 0 13 -13Hong Kong 2,126 25 0 25India 1,528 18 0 18Kuwait 205 2 0 2Malaysia 0 0 2 -2Poland 4,441 52 0 52Saudi Arabia 0 0 40 -40U. K. 23,954 280 43 237Coffee; Coffee Husks and Skins etc. Substitutes of 330332,807 9010 -U. S. A. 2,807 33 0 33Tea Whether or not Flavored -884974907,685 9020 -Afghanistan 0 0 865 -865Australia 0 0 3 -3Canada 2,137 25 0 25Iran 2,565 30 13 17Kuwait 0 0 26 -26Saudi Arabia 2,403 28 0 28South Korea 253 3 0 3U. S. A. 327 4 67 -63Mate -262600 9030 -U. S. A. 0 0 26 -26Pepper, Genus Piper; Genus Capsicum or -8849540734,764 9040 -Egypt 0 0 246 -246India 1,413 17 0 17Iran 0 0 16 -16Jordan 0 0 7 -7Kuwait 0 0 7 -7Saudi Arabia 3,560 42 48 -7Sri Lanka 0 0 114 -114U. A. E. Dubai 25,586 299 57 243U. S. A. 4,206 49 0 49Vanilla Beans 980988,414 9050 -Saudi Arabia 8,414 98 0 98Cloves, Whole Fruit, Cloves and Stems -242400 9070 -U. K. 0 0 24 -24Seeds of Anise, Badian, Fennel, Coriander, 8727636331,009 9090 -Bangladesh 2,492 29 0 29India 7,121 83 51 32Nepal 667 8 9 -1Sri Lanka 20,591 241 216 24U. S. A. 136 2 0 2Ginger, Saffron, Turmeric, Thyme, Bay Leaves, -1101,4761,366116,824 9100 -Afghanistan 0 0 48 -48Australia 894 10 0 10Bangladesh 0 0 86 -86Canada 0 0 51 -51France 0 0 15 -15Germany 0 0 3 -3Hong Kong 0 0 55 -55India 764 9 0 9Italy 0 0 2 -2Kuwait 0 0 56 -56Malaysia 0 0 10 -10New Zealand 0 0 13 -13Oman 1,047 12 2 10Saudi Arabia 72,411 847 56 790Singapore 0 0 12 -12

Rs. US $
(Amount in Thousand)
Difference
EXPORT OF GOODS BY COMMDOITY / COUNTRY AND SERVICES BY TYPE / COUNTRY
Export of Goods and Services July 2010 178
July20 10 200 920 10HS CODE-COMMODITY / COUNTRY
South Africa 0 0 20 -20South Korea 0 0 42 -42Spain 1,496 18 0 18Sudan 6,865 80 0 80U. A. E. Dubai 20,615 241 798 -556U. K. 7,509 88 83 5U. S. A. 5,223 61 125 -64Maize (Corn) -1,2591,275161,33110050 -India 0 0 204 -204Indonesia 0 0 212 -212Malaysia 0 0 457 -457Oman 0 0 23 -23Other Countries 138 2 0 2Singapore 0 0 276 -276South Korea 1,193 14 0 14Viet Nam 0 0 101 -101Rice 55,566132,967188,53316,120,1411006-Afghanistan 181,927 2,128 216 1,912Algeria 27,855 326 602 -276Andorra 2,961 35 0 35Angola 4,048 47 702 -655Armenia 0 0 52 -52Australia 150,047 1,755 1,089 665Austria 1,877 22 0 22Azerbaijan 18,537 217 132 84Bahrain 171,087 2,001 2,759 -758Bangladesh 1,974,362 23,091 61 23,030Belarus 1,106 13 14 -1Belgium 97,181 1,137 594 542Benin ( Dahomey ) 74,562 872 4,651 -3,779Bosnia Herzegovina 0 0 11 -11Botswana 0 0 9 -9Brunei 0 0 15 -15Bulgaria 743 9 140 -131Cameroon 39,326 460 0 460Canada 75,293 881 903 -22Cape Verde 0 0 1 -1Central African Republic 54,807 641 0 641China 853 10 90 -80Comoros 110,129 1,288 1,044 244Congo 2,454 29 54 -26Costa Rica 0 0 1,026 -1,026Croatia 6,102 71 0 71Cyprus 2,814 33 16 17Czech Republic 0 0 8 -8Denmark 11,135 130 240 -109Djibouti 47,190 552 513 38Egypt 23,582 276 148 128Ethiopia 1,544 18 56 -38Fiji 0 0 8 -8Finland 0 0 22 -22France 128,185 1,499 166 1,333Gambia 50,612 592 576 16Georgia 10,094 118 161 -42Germany 33,225 389 924 -536Ghana 73,955 865 126 739Gibraltar 5,235 61 0 61Greece 13,410 157 259 -103Guinea 40,448 473 219 254Guinea-Bissau 8,014 94 342 -248Haiti 192 2 127 -125Hong Kong 15,535 182 231 -49Hungary 0 0 10 -10India 1,545 18 0 18Indonesia 8,007 94 95 -1Iran 600,425 7,022 11,317 -4,295

Rs. US $
(Amount in Thousand)
Difference
EXPORT OF GOODS BY COMMDOITY / COUNTRY AND SERVICES BY TYPE / COUNTRY
179 State Bank of Pakistan
July20 10 200 920 10HS CODE-COMMODITY / COUNTRY
Iraq 951,866 11,133 1,164 9,968Ireland 8,796 103 84 19Italy 119,475 1,397 253 1,144Ivory Coast 0 0 3,506 -3,506Jamaica 0 0 11 -11Japan 692 8 25 -17Jordan 40,855 478 620 -142Kenya 564,683 6,604 8,616 -2,012Kiribati 15,921 186 0 186Kuwait 117,618 1,376 1,882 -507Latvia 5,602 66 27 39Lebanon 55,721 652 155 496Liberia 49,674 581 0 581Libya 1,260 15 16 -2Lithuania 32,420 379 35 344Madagascar 103,831 1,214 662 552Malaysia 84,091 983 932 51Maldives 69,946 818 257 561Mali 0 0 28 -28Malta 3,232 38 11 26Mauritania 0 0 135 -135Mauritius 289,831 3,390 2,479 911Moldova 513 6 0 6Mozambique 649,378 7,595 1,129 6,465Nepal 0 0 215 -215Netherlands (Holland) 138,916 1,625 588 1,036New Zealand 20,397 239 340 -101Niger 10,604 124 1,186 -1,062Nigeria 47,099 551 415 135North Korea 2,135 25 0 25Norway 34,169 400 28 372Oman 470,680 5,505 5,937 -432Other Countries 14,077 165 1,250 -1,085Papua New Guinea 2,677 31 0 31Philippines 48,593 568 0 568Poland 6,246 73 59 14Portugal 19,802 232 26 205Qatar 473,553 5,538 4,876 662Reunion Island 0 0 81 -81Romania 0 0 30 -30Russian Federation 65,965 771 244 528Rwanda 4,802 56 0 56Saudi Arabia 1,151,769 13,470 11,234 2,236Senegal 78,662 920 1,543 -623Seychelles 5,113 60 50 10Sierra Leone 346,531 4,053 234 3,819Singapore 224,596 2,627 943 1,684Somalia 226,166 2,645 1,871 774South Africa 336,414 3,935 706 3,228South Korea 74 1 140 -140Spain 203,971 2,386 3,236 -850Sri Lanka 153,617 1,797 786 1,010St. Helena 0 0 197 -197Sudan 22,997 269 40 229Swaziland 1,759 21 0 21Sweden 28,734 336 428 -92Switzerland 622,714 7,283 127 7,156Syrian Arab Republic 37,543 439 276 163Tanzania 28,840 337 254 83Thailand 9,682 113 94 20Togo 56,338 659 0 659Tunisia 1,902 22 264 -242Turkey 171,472 2,005 2,267 -261Turkmenistan 0 0 13 -13Tuvalu 0 0 .. ..U. A. E. Abudhabi 114,851 1,343 2,617 -1,274

Rs. US $
(Amount in Thousand)
Difference
EXPORT OF GOODS BY COMMDOITY / COUNTRY AND SERVICES BY TYPE / COUNTRY
Export of Goods and Services July 2010 180
July20 10 200 920 10HS CODE-COMMODITY / COUNTRY
U. A. E. Ajman 5,607 66 38 28U. A. E. Dubai 2,290,316 26,786 18,666 8,120U. A. E. Fujairah 2,138 25 0 25U. A. E. Ras Al Khaimah 3,687 43 0 43U. A. E. Sharjah 63,834 747 1,431 -684U. K. 518,826 6,068 5,905 163U. S. A. 255,848 2,992 3,845 -853Uganda 7,490 88 410 -322Ukraine 20,539 240 472 -232Uzbekistan 0 0 4 -4Yemen Arab Republic 503,405 5,888 7,660 -1,772Zambia 6,564 77 53 23Zimbabwe 22,617 265 125 140Grain Sorghum -297297001007-Kenya 0 0 45 -45Malaysia 0 0 55 -55Singapore 0 0 88 -88U. A. E. Dubai 0 0 36 -36U. S. A. 0 0 73 -73Buckwheat, Millet and Canary Seed; other 184018415,7591008-Afghanistan 14,905 174 0 174U. A. E. Dubai 854 10 0 10Wheat or Meslin Flour -296314181,5541101-Afghanistan 0 0 238 -238Australia 515 6 0 6U. A. E. Dubai 0 0 60 -60U. K. 201 2 0 2Yemen Arab Republic 838 10 16 -7Cereal Flours, Except of Wheat or of Meslin -1,4561,539837,0761102-Afghanistan 0 0 3 -3Australia 2,591 30 45 -14Cyprus 0 0 3 -3Indonesia 0 0 104 -104Iran 0 0 587 -587Jordan 3,632 42 0 42Malaysia 0 0 663 -663Maldives 853 10 0 10New Zealand 0 0 4 -4Singapore 0 0 5 -5Tunisia 0 0 9 -9U. A. E. Dubai 0 0 32 -32U. K. 0 0 16 -16U. S. A. 0 0 68 -68Cereal Groats, Meal and Pellets 760766,4561103-China 1,219 14 0 14Netherlands (Holland) 5,237 61 0 61Cereal Grains, Worked Like Hulled, Rolled, -2,0492,068191,6101104-Afghanistan 1,610 19 0 19Indonesia 0 0 458 -458Malaysia 0 0 1,200 -1,200U. S. A. 0 0 411 -411Flour, Meal and Flakes of Potatoes 2415718115,4851105-China 14,917 174 156 19Hong Kong 0 0 1 -1U. K. 568 7 0 7Flour and Meal of Dry etc. -13513832581106-Bahrain 0 0 34 -34Qatar 0 0 26 -26Turkey 0 0 64 -64U. A. E. Dubai 258 3 14 -11Malt, Whether or Not Roasted 850857,2881107-Australia 1,035 12 0 12Greece 2,360 28 0 28

Rs. US $
(Amount in Thousand)
Difference
EXPORT OF GOODS BY COMMDOITY / COUNTRY AND SERVICES BY TYPE / COUNTRY
181 State Bank of Pakistan
July20 10 200 920 10HS CODE-COMMODITY / COUNTRY
U. K. 2,323 27 0 27U. S. A. 1,571 18 0 18Starches; Inulin 11039350342,9741108-Afghanistan 25,133 294 0 294Bahrain 496 6 9 -4Bangladesh 2,965 35 73 -38Ethiopia 0 0 17 -17Malaysia 8,964 105 0 105Maldives 121 1 0 1Other Countries 1,341 16 0 16Qatar 0 0 3 -3U. A. E. Dubai 3,954 46 121 -75Yemen Arab Republic 0 0 170 -170Wheat Gluten, Whether or Not Dried -309309001109-Qatar 0 0 2 -2Saudi Arabia 0 0 3 -3U. A. E. Dubai 0 0 304 -304Rape or Colza Seeds, Whether or Not Broken 8918927823,7521205-Bangladesh 714 8 0 8China 21,904 256 0 256Japan 0 0 10 -10Malaysia 0 0 83 -83South Korea 1,135 13 0 13U. A. E. Dubai 0 0 8 -8Viet Nam 0 0 89 -89Sunflower Seeds, Whether or Not Broken 5053851206-Saudi Arabia 385 5 0 5Other Oil Seeds and Oleaginous Fruits NES -5,4155,57816313,9781207-Bangladesh 224 3 0 3China 5,836 68 499 -431India 408 5 466 -462Indonesia 0 0 551 -551Iran 4,109 48 285 -237Italy 0 0 115 -115Malaysia 2,047 24 1,017 -993Netherlands (Holland) 0 0 67 -67Other Countries 1,354 16 0 16Poland 0 0 30 -30Russian Federation 0 0 61 -61Saudi Arabia 0 0 11 -11South Korea 0 0 819 -819Sri Lanka 0 0 20 -20Turkey 0 0 651 -651U. A. E. Dubai 0 0 775 -775U. S. A. 0 0 118 -118Viet Nam 0 0 93 -93Flour and Meals of Oil Seeds or Oleaginous -1,1292,8371,708146,0531208-Afghanistan 0 0 2,047 -2,047China 144,839 1,694 81 1,613Malaysia 1,215 14 0 14Other Countries 0 0 9 -9Viet Nam 0 0 700 -700Seeds, Fruit and Spores, for Sowing 10019229224,9621209-Belgium 169 2 0 2Egypt 0 0 33 -33Hong Kong 0 0 1 -1Italy 9,532 111 88 24Jordan 14,345 168 47 120Kuwait 0 0 9 -9Saudi Arabia 607 7 12 -5Sudan 309 4 2 2Hop Cones, Fresh or Dried; Lupulin 10001008,5661210-China 2,623 31 0 31

Rs. US $
(Amount in Thousand)
Difference
EXPORT OF GOODS BY COMMDOITY / COUNTRY AND SERVICES BY TYPE / COUNTRY
Export of Goods and Services July 2010 182
July20 10 200 920 10HS CODE-COMMODITY / COUNTRY
Egypt 310 4 0 4France 5,356 63 0 63Spain 277 3 0 3Plants etc. for Pharmacy, Perfume, Insecticides 4717581,229105,0901211-Afghanistan 0 0 28 -28China 1,710 20 32 -12Egypt 50,861 595 312 282France 4,642 54 0 54Germany 916 11 0 11India 22,495 263 212 51Indonesia 0 0 13 -13Kenya 0 0 4 -4Myanmar 2,851 33 42 -9Netherlands (Holland) 4,002 47 0 47Other Countries 3,949 46 0 46Saudi Arabia 5,472 64 5 59Singapore 3,591 42 0 42Sri Lanka 711 8 0 8Switzerland 0 0 36 -36Tajikistan 0 0 10 -10U. A. E. Dubai 2,135 25 25 ..U. K. 1,674 20 22 -2U. S. A. 80 1 15 -14Yemen Arab Republic 0 0 2 -2Locust Beans, Seaweeds and other Algae, Sugar -2525001212-Saudi Arabia 0 0 25 -25Cereal Straw and Husks -259330716,0671213-Germany 164 2 0 2Kuwait 3,561 42 96 -54Netherlands (Holland) 207 2 0 2Oman 0 0 61 -61South Africa 1,847 22 0 22U. A. E. Dubai 288 3 173 -170Swedes, mangolds, Fodder Roots Hay, Clover etc. 23034957949,5421214-Bahrain 0 0 5 -5China 26,979 316 0 316Sweden 0 0 15 -15U. A. E. Abudhabi 0 0 310 -310U. A. E. Dubai 22,563 264 18 245Lac; Natural Gums, Resins, Gum-Resins and 962,1152,211189,0601301-Argentina 2,685 31 0 31Australia 0 0 19 -19Bangladesh 521 6 0 6Belgium 4,480 52 0 52Canada 10,243 120 51 69China 48,268 565 571 -6Denmark 2,989 35 39 -4Egypt 0 0 33 -33Germany 2,445 29 39 -10India 1,957 23 0 23Italy 8,607 101 0 101Japan 4,600 54 176 -122Kenya 13,116 153 315 -161Malaysia 2,291 27 26 1Netherlands (Holland) 4,891 57 38 20Norway 0 0 14 -14Other Countries 4,558 53 37 16Philippines 2,394 28 14 14Russian Federation 2,052 24 0 24Singapore 16,058 188 44 144South Korea 770 9 0 9Spain 4,686 55 0 55Sri Lanka 4,588 54 38 16Thailand 1,318 15 6 9

Rs. US $
(Amount in Thousand)
Difference
EXPORT OF GOODS BY COMMDOITY / COUNTRY AND SERVICES BY TYPE / COUNTRY
183 State Bank of Pakistan
July20 10 200 920 10HS CODE-COMMODITY / COUNTRY
Tunisia 0 0 24 -24U. K. 2,223 26 40 -14U. S. A. 42,754 500 527 -27Uruguay 564 7 0 7Zambia 0 0 64 -64Vegetable Saps and Extracts: Pectates, 27632760351,5401302-China 15,339 179 17 162Egypt 0 0 12 -12Italy 0 0 72 -72Japan 16,925 198 0 198Malaysia 7,003 82 0 82Netherlands (Holland) 2,309 27 61 -34Other Countries 2,779 33 0 33Philippines 2,531 30 0 30Singapore 3,745 44 0 44Thailand 910 11 0 11U. S. A. 0 0 164 -164Vegetable Plaiting Materials Like Bamboos, 000211401-U. S. A. 21 .. 0 ..Vegetable Materials used in Brooms Like 3422564,7871403-Egypt 337 4 0 4Malaysia 391 5 0 5Mauritius 427 5 0 5Saudi Arabia 0 0 22 -22U. S. A. 3,632 42 0 42Vegetable Products NES 42012854846,8751404-Algeria 6,806 80 44 36Australia 226 3 0 3Bahrain 3,019 35 0 35China 20,250 237 12 225Egypt 81 1 0 1Hong Kong 850 10 0 10India 0 0 9 -9Italy 17 .. 0 ..Kuwait 988 12 61 -49Libya 748 9 0 9Malaysia 0 0 2 -2Morocco 876 10 0 10Oman 1,672 20 0 20Saudi Arabia 1,362 16 0 16U. A. E. Dubai 5,777 68 0 68U. K. 1,501 18 0 18U. S. A. 2,702 32 0 32Lard Stearin, Lard Oil etc. -167193262,2531503-Australia 2,253 26 0 26Germany 0 0 18 -18Kuwait 0 0 42 -42U. A. E. Dubai 0 0 66 -66U. K. 0 0 60 -60U. S. A. 0 0 7 -7Olive Oil and Its Fractions Not Chem. Modified -129282,4261509-Saudi Arabia 2,426 28 29 -1Other Oils and their Fractions 659655,5631510-Tunisia 2,372 28 0 28U. A. E. Dubai 3,191 37 59 -22Palm Oil and Its Fractions, Not Chem. Modified -23941918015,3731511-Afghanistan 0 0 180 -180U. A. E. Dubai 15,373 180 240 -60Coconut, Palm Kernel or Babassu Oil etc. Not 6064831513-Saudi Arabia 483 6 0 6Rape, Colza or Mustard Oil and Fractions -3636001514-U. S. A. 0 0 36 -36

Rs. US $
(Amount in Thousand)
Difference
EXPORT OF GOODS BY COMMDOITY / COUNTRY AND SERVICES BY TYPE / COUNTRY
Export of Goods and Services July 2010 184
July20 10 200 920 10HS CODE-COMMODITY / COUNTRY
Other Fixed Vegetable Fats and Oils NES, Not -17918454261515-Malaysia 0 0 184 -184South Korea 426 5 0 5Animal or Vegetable Fats and Oils -237,3507,327626,4571516-Afghanistan 626,243 7,324 7,350 -26U. A. E. Dubai 214 3 0 3Margarine; Edible Mixtures of Animals or -300300001517-Afghanistan 0 0 300 -300Animal or Vegetable Fats and Oils Chem. 900090076,9881518-Afghanistan 63,700 745 0 745Kuwait 2,683 31 0 31Singapore 766 9 0 9U. A. E. Dubai 9,840 115 0 115Sausages and Similar Products of Meat and -243287101601-Afghanistan 0 0 5 -5Kuwait 710 8 26 -18U. A. E. Dubai 0 0 1 -1Prepared or Preserved Meat, Meat Offal and -3535001602-Hong Kong 0 0 35 -35Extracts Etc. of Meat, Fish, Crustaceans etc. 224022419,1911603-Germany 14,273 167 0 167Spain 4,918 58 0 58Prepared or Preserved Fish, Caviar and Caviar 3042,1352,439208,5341604-Bangladesh 3,888 45 0 45Chile 0 0 15 -15China 36,645 429 220 209Egypt 37,448 438 25 413Hong Kong 14,575 170 7 164Indonesia 2,048 24 147 -123Japan 0 0 47 -47Kuwait 0 0 1 -1Lebanon 4,296 50 1 50Malaysia 8,755 102 72 30Other Countries 1,699 20 0 20Saudi Arabia 11,559 135 32 103Singapore 1,853 22 131 -110South Korea 2,257 26 46 -20Sri Lanka 913 11 16 -6Thailand 57,961 678 857 -179U. A. E. Ajman 0 0 67 -67U. A. E. Dubai 4,702 55 134 -79U. A. E. Sharjah 5,992 70 83 -13U. K. 3,925 46 0 46U. S. A. 2,473 29 60 -31Viet Nam 7,542 88 173 -84Crustaceans Molluscs etc Prepared or Preserved 1,0009901,990170,1741605-China 6,556 77 0 77Egypt 63,095 738 556 182India 8,082 95 0 95Indonesia 11,392 133 0 133Japan 4,828 56 0 56Mauritius 3,497 41 0 41Netherlands (Holland) 0 0 200 -200Saudi Arabia 6,223 73 0 73South Korea 0 0 52 -52Thailand 3,888 45 0 45U. A. E. Dubai 35,126 411 109 301U. A. E. Sharjah 17,839 209 72 137U. S. A. 8,245 96 0 96Viet Nam 1,403 16 0 16Cane or Beet Sugar and Sucrose in Solid Form -2874463,9381701-Egypt 539 6 0 6France 0 0 .. ..

Rs. US $
(Amount in Thousand)
Difference
EXPORT OF GOODS BY COMMDOITY / COUNTRY AND SERVICES BY TYPE / COUNTRY
185 State Bank of Pakistan
July20 10 200 920 10HS CODE-COMMODITY / COUNTRY
Malaysia 3,399 40 0 40Thailand 0 0 74 -74Other Sugar NES -91,1501,14197,5821702-Afghanistan 18,692 219 86 133Australia 5,587 65 0 65Belgium 0 0 43 -43Canada 1,693 20 32 -12Congo 2,907 34 0 34Djibouti 1,355 16 0 16Italy 1,991 23 0 23Lebanon 946 11 0 11Mauritania 0 0 38 -38Poland 1,514 18 0 18Saudi Arabia 1,527 18 13 5South Korea 1,625 19 48 -29U. A. E. Dubai 546 6 0 6U. K. 1,006 12 0 12U. S. A. 58,193 681 887 -206Yemen Arab Republic 0 0 5 -5Molasses Extracted from Sugar -6,4236,66223920,4161703-Germany 0 0 1,112 -1,112Iran 0 0 9 -9Italy 0 0 1,010 -1,010Malaysia 255 3 0 3Netherlands (Holland) 14,049 164 3,447 -3,283South Africa 0 0 2 -2South Korea 71 1 0 1U. A. E. Dubai 5,214 61 16 45U. K. 773 9 1,066 -1,057U. S. A. 55 1 0 1Sugar Confectionery including White Chocolate 112,1042,115180,8211704-Afghanistan 64,766 757 773 -15Angola 3,471 41 46 -5Australia 10,964 128 82 46Belgium 1,302 15 44 -29Bolivia 0 0 14 -14Cameroon 0 0 10 -10Canada 0 0 7 -7China 2,589 30 0 30Congo 0 0 50 -50Costa Rica 2,184 26 0 26France 0 0 11 -11Georgia 1,301 15 0 15Hong Kong 1,363 16 0 16India 0 0 12 -12Italy 1,163 14 0 14Lebanon 0 0 11 -11Madagascar 0 0 8 -8Maldives 724 8 15 -6Morocco 0 0 30 -30Mozambique 3,899 46 0 46New Zealand 723 8 6 2Nigeria 684 8 0 8Oman 1,517 18 5 13Saudi Arabia 0 0 51 -51Singapore 0 0 13 -13Somalia 0 0 31 -31South Africa 5,709 67 50 17Spain 675 8 79 -71Sri Lanka 703 8 0 8Sudan 3,195 37 0 37Sweden 2,645 31 29 2Tajikistan 6,417 75 0 75Tanzania 27,584 323 300 22U. A. E. Dubai 19,278 225 96 129

Rs. US $
(Amount in Thousand)
Difference
EXPORT OF GOODS BY COMMDOITY / COUNTRY AND SERVICES BY TYPE / COUNTRY
Export of Goods and Services July 2010 186
July20 10 200 920 10HS CODE-COMMODITY / COUNTRY
U. K. 1,931 23 59 -36U. S. A. 12,577 147 112 35Uganda 0 0 12 -12Uzbekistan 0 0 100 -100Yemen Arab Republic 3,456 40 45 -4Zimbabwe 0 0 4 -4Chocolate and other Food Products Containing 420423,6171806-South Africa 2,249 26 0 26U. K. 1,368 16 0 16Malt Extracts; Food Prep. of Flour etc. Under -5551,39684171,9101901-Afghanistan 1,977 23 159 -135Canada 3,127 37 0 37Denmark 0 0 30 -30Greece 0 0 27 -27Hong Kong 1,896 22 0 22India 108 1 50 -49Italy 8,340 98 62 36Japan 575 7 0 7Kazakhstan 0 0 4 -4Kenya 0 0 58 -58Mauritius 414 5 0 5Oman 293 3 0 3Other Countries 0 0 15 -15Qatar 1,410 16 0 16Saudi Arabia 1,084 13 0 13South Africa 641 8 0 8South Korea 3,981 47 0 47Sri Lanka 778 9 64 -54Switzerland 0 0 3 -3U. A. E. Dubai 3,091 36 549 -513U. K. 29,977 351 284 66U. S. A. 12,511 146 91 55Uganda 1,708 20 0 20Pasta and Couscous, Prepared or Not -5950644738,1981902-Afghanistan 13,014 152 257 -105Australia 0 0 10 -10Bahrain 0 0 14 -14Madagascar 2,136 25 45 -20Mauritius 0 0 35 -35Namibia 0 0 10 -10Oman 3,286 38 47 -8Saudi Arabia 5,667 66 57 9South Africa 1,031 12 0 12Sri Lanka 546 6 6 1U. A. E. Dubai 2,982 35 0 35U. K. 5,398 63 20 43U. S. A. 4,139 48 0 48Uganda 0 0 7 -7Foods Prep. by Swelling Cereal; Cereal NES, -15628012410,6041904-Hong Kong 340 4 0 4Indonesia 0 0 105 -105Iran 0 0 15 -15Other Countries 0 0 27 -27Qatar 0 0 11 -11U. A. E. Dubai 5,216 61 122 -61U. K. 5,049 59 0 59Bread, Pastry, Cakes etc 3841,4731,857158,7441905-Afghanistan 95,195 1,113 588 526Angola 0 0 30 -30Australia 2,898 34 31 3Bahrain 0 0 5 -5Canada 3,394 40 37 3China 0 0 2 -2Djibouti 0 0 3 -3

Rs. US $
(Amount in Thousand)
Difference
EXPORT OF GOODS BY COMMDOITY / COUNTRY AND SERVICES BY TYPE / COUNTRY
187 State Bank of Pakistan
July20 10 200 920 10HS CODE-COMMODITY / COUNTRY
Egypt 634 7 0 7Hong Kong 41 .. 0 ..Japan 0 0 15 -15Kuwait 2,150 25 18 7Madagascar 3,912 46 0 46Malaysia 1,399 16 0 16Maldives 0 0 29 -29Mauritius 4,211 49 67 -18Mozambique 782 9 0 9Norway 775 9 14 -5Oman 0 0 8 -8Philippines 0 0 6 -6Qatar 3,000 35 0 35Romania 0 0 18 -18Saudi Arabia 6,025 70 12 58Singapore 1,277 15 0 15South Africa 3,862 45 16 29Sweden 922 11 0 11Tanzania 0 0 11 -11U. A. E. Dubai 3,929 46 235 -189U. K. 4,488 52 71 -18U. S. A. 16,012 187 235 -47Yemen Arab Republic 3,838 45 23 22Vegetable, Fruit, Nuts Etc, Prep Or Pres By 472472862,2432001-Australia 4,499 53 0 53France 2,121 25 0 25Hong Kong 0 0 8 -8India 0 0 21 -21Italy 1,704 20 0 20Kuwait 0 0 10 -10Malaysia 0 0 12 -12Mauritius 2,988 35 25 10Norway 1,558 18 0 18Russian Federation 5,558 65 0 65Saudi Arabia 6,061 71 48 23Singapore 0 0 53 -53South Africa 5,119 60 0 60South Korea 26 .. 0 ..Sri Lanka 0 0 8 -8Sweden 1,789 21 0 21U. A. E. Dubai 14,061 164 388 -224U. A. E. Sharjah 0 0 14 -14U. K. 4,868 57 72 -15U. S. A. 11,891 139 65 74Mushrooms and Truffles Prepared or Preserved -4343002003-Germany 0 0 43 -43Vegetables Prepared or Preserved NES Frozen -2653272,3202004-Australia 640 7 0 7Canada 1,680 20 3 17U. A. E. Dubai 0 0 50 -50Vegetables Prepared or Preserved NES not 1595221118,0652005-France 0 0 3 -3Malaysia 0 0 23 -23Netherlands (Holland) 0 0 7 -7Saudi Arabia 16,932 198 0 198Sri Lanka 164 2 10 -8Switzerland 0 0 8 -8U. A. E. Dubai 849 10 0 10U. S. A. 120 1 0 1Fruit, Nuts, Fruit-Peel etc, Preserved by Sugar -17738120417,4122006-Germany 1,071 13 153 -141Kuwait 0 0 4 -4Norway 1,228 14 1 13Oman 128 2 2 -1

Rs. US $
(Amount in Thousand)
Difference
EXPORT OF GOODS BY COMMDOITY / COUNTRY AND SERVICES BY TYPE / COUNTRY
Export of Goods and Services July 2010 188
July20 10 200 920 10HS CODE-COMMODITY / COUNTRY
Qatar 0 0 18 -18Saudi Arabia 4,122 48 17 31Spain 0 0 4 -4U. A. E. Abudhabi 1,095 13 0 13U. A. E. Dubai 0 0 .. ..U. A. E. Fujairah 0 0 24 -24U. K. 9,768 114 150 -36U. S. A. 0 0 7 -7Jams, Fruit Jellies, Marmalades etc. Cooked -11162851744,2452007-Afghanistan 0 0 33 -33Australia 3,648 43 0 43Bangladesh 472 6 0 6Canada 3,746 44 19 25China 494 6 6 ..France 0 0 162 -162Japan 1,986 23 0 23Kuwait 0 0 12 -12Oman 4,725 55 0 55Saudi Arabia 0 0 28 -28Switzerland 0 0 364 -364U. A. E. Dubai 19,503 228 0 228U. K. 8,239 96 4 92U. S. A. 1,433 17 0 17Fruit, Nuts etc. Prepared or Preserved NES 2548734129,1672008-Bahrain 0 0 14 -14Libya 25,331 296 0 296Saudi Arabia 1,092 13 0 13Turkey 2,513 29 0 29U. A. E. Dubai 231 3 39 -36U. K. 0 0 34 -34Fruit Juices including Grape Must and Vegtable 3,8881,4995,387460,5692009-Afghanistan 335,395 3,923 730 3,193Angola 44,281 518 0 518Australia 1,903 22 0 22Belgium 0 0 7 -7Canada 73 1 13 -12Cyprus 16,676 195 0 195Germany 3,201 37 11 27Hong Kong 625 7 0 7India 10,460 122 129 -7Iran 11,777 138 0 138Malaysia 0 0 48 -48Mauritius 342 4 0 4Netherlands (Holland) 11,762 138 167 -29Oman 1,206 14 23 -9Saudi Arabia 1,422 17 0 17South Africa 0 0 10 -10Spain 0 0 11 -11Sri Lanka 537 6 30 -24Thailand 5,171 60 28 32U. A. E. Dubai 1,776 21 100 -79U. K. 12,351 144 99 45U. S. A. 576 7 91 -84Uganda 1,033 12 0 12Sauces and Preparations thereof -2743161,3322103-Australia 0 0 .. ..Saudi Arabia 0 0 27 -27U. K. 1,332 16 16 -1Ice Cream and other Edible Ice 21831048,9282105-Afghanistan 8,928 104 68 36U. S. A. 0 0 15 -15Food Preparations NES -36781244538,0342106-Afghanistan 20,281 237 350 -112Australia 457 5 0 5

Rs. US $
(Amount in Thousand)
Difference
EXPORT OF GOODS BY COMMDOITY / COUNTRY AND SERVICES BY TYPE / COUNTRY
189 State Bank of Pakistan
July20 10 200 920 10HS CODE-COMMODITY / COUNTRY
Bahrain 205 2 0 2Belgium 0 0 112 -112Canada 283 3 5 -2Hong Kong 0 0 28 -28India 0 0 12 -12Iran 0 0 19 -19Jamaica 0 0 5 -5Mozambique 0 0 12 -12Netherlands (Holland) 0 0 23 -23Norway 0 0 18 -18Qatar 1,501 18 0 18Saudi Arabia 2,441 29 0 29South Africa 2,208 26 0 26U. A. E. Dubai 3,350 39 24 15U. K. 2,331 27 100 -72U. S. A. 4,977 58 104 -46Waters, Natural etc. Not Sweetened, Ice and 2763030626,1542201-Afghanistan 23,098 270 0 270U. S. A. 3,056 36 30 6Waters, Sweetened etc and other Nonalcoholic -8975166256,5682202-Afghanistan 674 8 355 -347Bahrain 1,413 17 0 17Canada 0 0 45 -45India 353 4 0 4Kuwait 1,354 16 29 -13Oman 0 0 8 -8U. A. E. Dubai 35,167 411 259 152U. K. 8,126 95 26 69U. S. A. 8,126 95 29 66Western Samoa 1,354 16 0 16Other Fermented Beverages NES -411411002206-Afghanistan 0 0 411 -411Ethyl Alcohol, Strength: more than 80% Alcohol -1,4706,7215,251448,9632207-Australia 0 0 38 -38Hong Kong 66,558 778 0 778India 0 0 69 -69Indonesia 562 7 0 7Italy 147,236 1,722 1,074 648Malaysia 886 10 172 -161Mauritius 14,995 175 0 175Philippines 0 0 767 -767Saudi Arabia 1,138 13 27 -14Singapore 0 0 43 -43South Korea 0 0 2,795 -2,795Switzerland 57,725 675 545 130Tunisia 73,173 856 0 856Turkey 39,118 458 1,049 -591U. A. E. Abudhabi 0 0 11 -11U. A. E. Dubai 47,572 556 125 432U. S. A. 0 0 8 -8Flour, Meal etc. of Meat etc, Not For Human 5816746,3382301-Sri Lanka 6,338 74 16 58Bran, Sharps and other Residue -8432624220,6862302-Bahrain 0 0 2 -2Kuwait 4,705 55 62 -7Oman 5,563 65 0 65Qatar 372 4 0 4U. A. E. Dubai 5,346 63 250 -188U. A. E. Fujairah 0 0 12 -12U. A. E. Sharjah 4,700 55 0 55Residues of Starch Manufacture like Beet-Pulp 280282,3972303-U. A. E. Dubai 2,397 28 0 28

Rs. US $
(Amount in Thousand)
Difference
EXPORT OF GOODS BY COMMDOITY / COUNTRY AND SERVICES BY TYPE / COUNTRY
Export of Goods and Services July 2010 190
July20 10 200 920 10HS CODE-COMMODITY / COUNTRY
Other Oilcakes NES From Vegetable Fats and 2,582652,647226,3192306-Australia 0 0 65 -65China 226,319 2,647 0 2,647Preparations Used In Animal Feeding -3131002309-Germany 0 0 6 -6Kuwait 0 0 25 -25Tobacco and Tobacco Refuse 401,0931,13396,9132401-Bangladesh 1,206 14 0 14France 5,240 61 0 61Malaysia 5,134 60 200 -140Paraguay 27,611 323 117 206Philippines 33,137 388 0 388Romania 1,359 16 0 16South Africa 1,788 21 0 21Sweden 189 2 0 2U. A. E. Dubai 21,249 249 685 -436U. A. E. Sharjah 0 0 22 -22U. K. 0 0 69 -69Cigars, Cigarettes Etc. of Tobacco or Substitutes 9222794981,1202402-Guinea 3,335 39 0 39Italy 54,601 639 0 639Malaysia 0 0 27 -27Romania 11,674 137 0 137Sierra Leone 3,335 39 0 39U. A. E. Dubai 3,367 39 0 39U. A. E. Sharjah 4,810 56 0 56Tobacco and Tobacco Substitutes Manufactured -300377776,6092403-France 0 0 262 -262Malaysia 0 0 90 -90Romania 4,952 58 0 58Saudi Arabia 287 3 0 3U. A. E. Dubai 1,278 15 15 ..U. K. 91 1 10 -9Salt, Pure Sodium Chloride, Sea Water -3571,3671,01086,3292501-Argentina 83 1 0 1Australia 3,404 40 27 12Austria 0 0 12 -12Bahrain 0 0 3 -3Bangladesh 2,138 25 15 10Belgium 0 0 22 -22Canada 4,676 55 17 38China 4,622 54 50 4Colombia 73 1 0 1Cyprus 0 0 19 -19Czech Republic 0 0 2 -2Egypt 103 1 0 1Finland 0 0 7 -7France 412 5 36 -31Germany 12,773 149 221 -72Greece 577 7 8 -1Hong Kong 917 11 0 11Hungary 4,868 57 12 45India 6,993 82 45 37Italy 827 10 8 2Japan 3,891 46 37 8Kenya 321 4 4 ..Lebanon 0 0 9 -9Malaysia 3,583 42 41 1Myanmar 0 0 13 -13Netherlands (Holland) 0 0 13 -13New Zealand 481 6 0 6Other Countries 4,548 53 16 37Paraguay 21 .. 0 ..Poland 0 0 21 -21
Rs. US $
(Amount in Thousand)
Difference
EXPORT OF GOODS BY COMMDOITY / COUNTRY AND SERVICES BY TYPE / COUNTRY
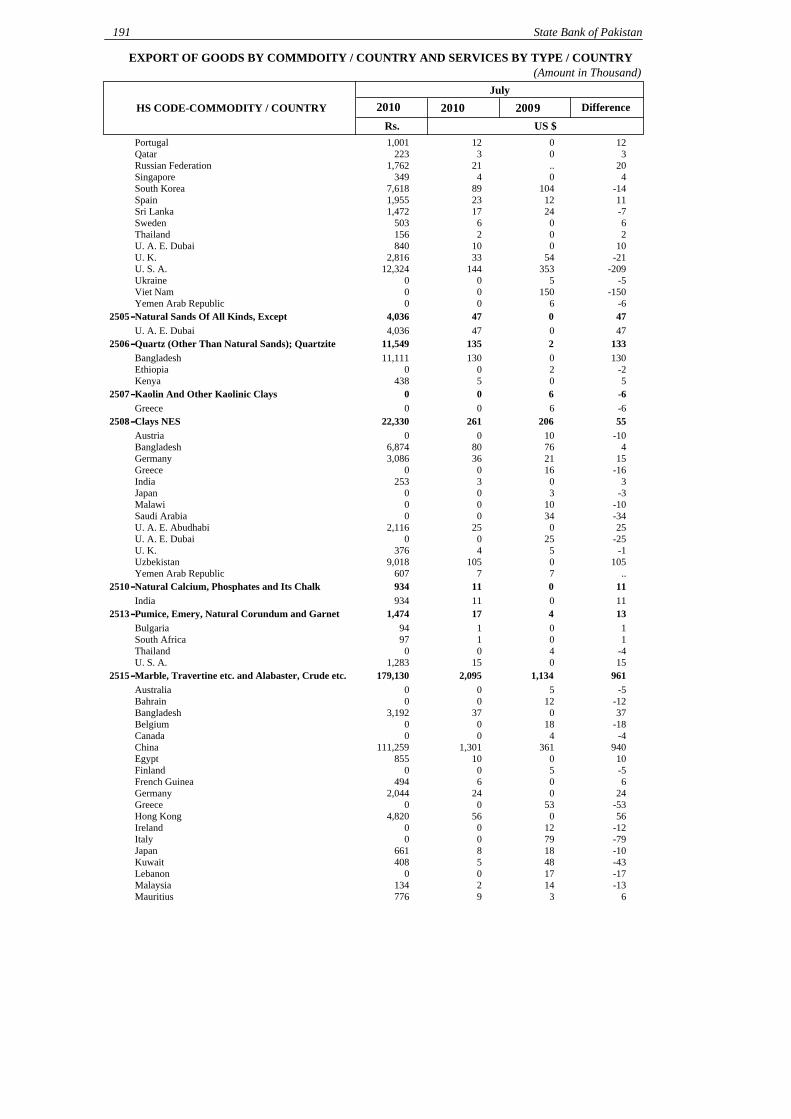
191 State Bank of Pakistan
July20 10 200 920 10HS CODE-COMMODITY / COUNTRY
Portugal 1,001 12 0 12Qatar 223 3 0 3Russian Federation 1,762 21 .. 20Singapore 349 4 0 4South Korea 7,618 89 104 -14Spain 1,955 23 12 11Sri Lanka 1,472 17 24 -7Sweden 503 6 0 6Thailand 156 2 0 2U. A. E. Dubai 840 10 0 10U. K. 2,816 33 54 -21U. S. A. 12,324 144 353 -209Ukraine 0 0 5 -5Viet Nam 0 0 150 -150Yemen Arab Republic 0 0 6 -6Natural Sands Of All Kinds, Except 470474,0362505-U. A. E. Dubai 4,036 47 0 47Quartz (Other Than Natural Sands); Quartzite 133213511,5492506-Bangladesh 11,111 130 0 130Ethiopia 0 0 2 -2Kenya 438 5 0 5Kaolin And Other Kaolinic Clays -66002507-Greece 0 0 6 -6Clays NES 5520626122,3302508-Austria 0 0 10 -10Bangladesh 6,874 80 76 4Germany 3,086 36 21 15Greece 0 0 16 -16India 253 3 0 3Japan 0 0 3 -3Malawi 0 0 10 -10Saudi Arabia 0 0 34 -34U. A. E. Abudhabi 2,116 25 0 25U. A. E. Dubai 0 0 25 -25U. K. 376 4 5 -1Uzbekistan 9,018 105 0 105Yemen Arab Republic 607 7 7 ..Natural Calcium, Phosphates and Its Chalk 110119342510-India 934 11 0 11Pumice, Emery, Natural Corundum and Garnet 134171,4742513-Bulgaria 94 1 0 1South Africa 97 1 0 1Thailand 0 0 4 -4U. S. A. 1,283 15 0 15Marble, Travertine etc. and Alabaster, Crude etc. 9611,1342,095179,1302515-Australia 0 0 5 -5Bahrain 0 0 12 -12Bangladesh 3,192 37 0 37Belgium 0 0 18 -18Canada 0 0 4 -4China 111,259 1,301 361 940Egypt 855 10 0 10Finland 0 0 5 -5French Guinea 494 6 0 6Germany 2,044 24 0 24Greece 0 0 53 -53Hong Kong 4,820 56 0 56Ireland 0 0 12 -12Italy 0 0 79 -79Japan 661 8 18 -10Kuwait 408 5 48 -43Lebanon 0 0 17 -17Malaysia 134 2 14 -13Mauritius 776 9 3 6

Rs. US $
(Amount in Thousand)
Difference
EXPORT OF GOODS BY COMMDOITY / COUNTRY AND SERVICES BY TYPE / COUNTRY
Export of Goods and Services July 2010 192
July20 10 200 920 10HS CODE-COMMODITY / COUNTRY
New Zealand 0 0 61 -61Other Countries 0 0 34 -34Portugal 943 11 25 -14Qatar 0 0 3 -3Russian Federation 0 0 5 -5Saudi Arabia 2,218 26 90 -64South Korea 6,937 81 15 66U. A. E. Abudhabi 1,703 20 0 20U. A. E. Dubai 27,676 324 222 102U. A. E. Sharjah 588 7 0 7U. K. 522 6 1 5U. S. A. 9,848 115 31 85Ukraine 1,789 21 0 21Viet Nam 2,263 26 0 26Granite, Porphyry, Basalt etc., Crude or Cut etc. -2626002516-China 0 0 26 -26Pebbles, Gravel etc. Macadam of Slag, Dross etc. 4548937,9942517-Bangladesh 2,812 33 24 9China 1,967 23 0 23Japan 0 0 17 -17Tanzania 1,331 16 0 16U. A. E. Dubai 0 0 8 -8U. S. A. 380 4 0 4Viet Nam 1,506 18 0 18Magnesite, Fused Magnesia and Sintered -2525002519-Ethiopia 0 0 25 -25Gypsum; Anhydrite; Plasters etc. 3938776,5862520-Bangladesh 457 5 0 5China 0 0 25 -25India 4,713 55 0 55Sri Lanka 1,416 17 11 6U. A. E. Sharjah 0 0 2 -2Quicklime, Slaked Lime and Hydraulic Lime 2021922522-U. A. E. Dubai 192 2 0 2Portland Cement, Aluminous Cement and Slag -5,13147,79042,6593,647,4982523-Afghanistan 1,438,315 16,822 15,747 1,075Austria 0 0 65 -65Bahrain 0 0 575 -575Comoros 18,135 212 0 212Congo 436 5 0 5Djibouti 49,478 579 2,835 -2,257Egypt 33,343 390 370 20Ethiopia 0 0 3,652 -3,652Germany 0 0 1 -1Guinea 13,766 161 0 161India 264,152 3,089 3,324 -234Iraq 270,245 3,161 400 2,761Kenya 16,062 188 281 -93Lebanon 0 0 7 -7Macao 15,287 179 0 179Madagascar 22,656 265 334 -69Mauritius 81,698 956 214 742Mozambique 44,091 516 312 203Nigeria 0 0 28 -28Oman 0 0 2,353 -2,353Qatar 201,278 2,354 6,924 -4,570Singapore 14,243 167 54 113Somalia 51,726 605 0 605South Africa 104,604 1,223 0 1,223Sri Lanka 222,000 2,596 285 2,311Sudan 114,851 1,343 6,307 -4,964Switzerland 37,217 435 216 219Tanzania 201,888 2,361 1,201 1,160Thailand 3,329 39 0 39

Rs. US $
(Amount in Thousand)
Difference
EXPORT OF GOODS BY COMMDOITY / COUNTRY AND SERVICES BY TYPE / COUNTRY
193 State Bank of Pakistan
July20 10 200 920 10HS CODE-COMMODITY / COUNTRY
U. A. E. Dubai 215,973 2,526 1,851 675Viet Nam 0 0 32 -32Yemen Arab Republic 212,724 2,488 423 2,065Asbestos 4208050042,7592524-India 0 0 80 -80Sudan 42,759 500 0 500Mica, Including Splitting and Mica Waste -99002525-China 0 0 9 -9Natural Steatite Roughly Trimmed etc. 2,8955443,439294,0052526-Austria 1,316 15 38 -22Bangladesh 0 0 4 -4Belgium 1,441 17 0 17Greece 5,215 61 107 -46India 1,022 12 52 -40Indonesia 0 0 17 -17Iran 289 3 0 3Italy 101,742 1,190 234 956Netherlands (Holland) 21,430 251 0 251Saudi Arabia 1,023 12 0 12Spain 8,928 104 0 104Sri Lanka 310 4 0 4Thailand 2,822 33 21 12Turkey 5,240 61 72 -11U. A. E. Dubai 286 3 0 3U. S. A. 142,942 1,672 0 1,672Feldspar; Lucite; Nepheline and Syenite 1841620017,0972529-Greece 2,961 35 0 35India 3,791 44 0 44South Korea 4,811 56 0 56U. A. E. Dubai 3,781 44 0 44U. A. E. Ras Al Khaimah 1,753 21 0 21Ukraine 0 0 16 -16Mineral Substances NES -108137292,4762530-Afghanistan 0 0 120 -120China 0 0 2 -2U. S. A. 2,476 29 15 14Iron Ores and Concentrates -1749447740,7642601-China 40,764 477 494 -17Manganese Ores and Concentrates 10401048,8592602-China 8,859 104 0 104Copper Ores and Concentrates -121170494,1662603-China 3,713 43 170 -127U. S. A. 453 5 0 5Lead Ores and Concentrates -6262002607-U. A. E. Dubai 0 0 28 -28U. A. E. Sharjah 0 0 34 -34Chromium Ores and Concentrates 5,2863,6298,915762,2952610-Chile 0 0 39 -39China 604,897 7,075 3,459 3,616Japan 12,042 141 0 141Netherlands (Holland) 8,421 98 14 84Russian Federation 105,861 1,238 0 1,238Slovak Republic 17,084 200 22 178South Korea 6,242 73 55 18Spain 7,749 91 40 51Ores And Concentrates NES 217021718,5542617-U. A. E. Dubai 18,554 217 0 217Slag, Dross, Scaling and Other Waste of Iron / 4676052745,0372619-China 45,037 527 60 467Ash & Residues (Not From Iron Mfr) With Metal 3032542620-Sweden 254 3 0 3

Rs. US $
(Amount in Thousand)
Difference
EXPORT OF GOODS BY COMMDOITY / COUNTRY AND SERVICES BY TYPE / COUNTRY
Export of Goods and Services July 2010 194
July20 10 200 920 10HS CODE-COMMODITY / COUNTRY
Coal, Briquettes and Ovoid etc. Manufactures of 5054262701-India 426 5 0 5Coke and Semi-coke of Coal, of Lignite or Peat -55002704-Saudi Arabia 0 0 5 -5Mineral Tars, Including Reconstituted Tars 620625,2952706-Bangladesh 5,295 62 0 62Oils etc from High Temperature Coal Tar 8,6329,45818,0901,546,7592707-Switzerland 0 0 9,458 -9,458U. A. E. Dubai 758,268 8,868 0 8,868U. A. E. Fujairah 788,491 9,222 0 9,222Oil from Petrol and Bituminous Mineral etc. 18,74685,650104,3968,926,1512710-Afghanistan 4,118,875 48,172 41,872 6,300Austria 0 0 47 -47China 0 0 176 -176Denmark 537,517 6,287 10,764 -4,478Djibouti 0 0 13 -13India 0 0 1,130 -1,130Japan 0 0 9,265 -9,265Oman 0 0 3,560 -3,560Other Countries 172,520 2,018 219 1,799Turkey 8,542 100 0 100U. A. E. Dubai 2,995,340 35,032 10,399 24,633U. A. E. Fujairah 1,067,797 12,488 7,353 5,135U. A. E. Sharjah 0 0 851 -851U. S. A. 14,963 175 0 175Yemen Arab Republic 10,597 124 0 124Petroleum Jelly; Mineral Waxes and Similar -2020002712-South Korea 0 0 20 -20Electrical Energy 101492716-Afghanistan 49 1 0 1Fluorine, Chlorine, Bromine and Iodine 1162013611,6162801-Bangladesh 11,616 136 0 136Brunei 0 0 12 -12Malaysia 0 0 9 -9Carbon NES 250252,1552803-Sri Lanka 2,155 25 0 25Hydrogen Chloride; Chlorosulphuric Acid 21439160551,7022806-Algeria 0 0 17 -17Angola 3,540 41 0 41El Salvador 556 7 0 7Eritrea 449 5 0 5France 0 0 2 -2Germany 467 5 0 5Ghana 977 11 0 11Guinea 238 3 0 3Iran 0 0 6 -6Kenya 884 10 21 -11Malaysia 13,400 157 0 157Mozambique 473 6 0 6Nigeria 850 10 31 -21Oman 1,702 20 12 8Panama Inc. Panama Canal Zone 355 4 0 4Philippines 1,738 20 0 20Qatar 0 0 7 -7Singapore 10,544 123 0 123Sri Lanka 1,196 14 23 -9Sudan 0 0 46 -46Switzerland 1,446 17 0 17Tanzania 1,783 21 12 9Turkey 0 0 3 -3U. A. E. Dubai 6,702 78 192 -114U. A. E. Sharjah 0 0 12 -12U. K. 4,402 51 0 51

Rs. US $
(Amount in Thousand)
Difference
EXPORT OF GOODS BY COMMDOITY / COUNTRY AND SERVICES BY TYPE / COUNTRY
195 State Bank of Pakistan
July20 10 200 920 10HS CODE-COMMODITY / COUNTRY
Yemen Arab Republic 0 0 9 -9Sulfuric Acid; Oleum 74119342807-India 83 1 0 1Kenya 0 0 3 -3Myanmar 851 10 0 10Oman 0 0 2 -2Diphosphorus Pentaoxide and Phosphoric Acid -3333002809-U. K. 0 0 33 -33Oxides Of Boron and Boric Acids 110119202810-China 920 11 0 11Inorganic Acids and Inorganic Oxygen -1321632811-Sri Lanka 0 0 3 -3U. A. E. Dubai 163 2 0 2Ammonia, Anhydrous Or In Aqueous Solution -2421942814-Kuwait 0 0 4 -4Qatar 194 2 0 2Sodium Hydroxide and Potassium Hydroxide etc. 200201,7512815-Sri Lanka 1,751 20 0 20Zinc Oxide And Zinc Peroxide 84211058,9682817-Sri Lanka 8,968 105 21 84Chromium Oxides And Hydroxides 860867,3172819-China 6,466 76 0 76Malaysia 851 10 0 10Iron Oxides and Hydroxides 122141,1682821-Oman 1,168 14 0 14U. A. E. Dubai 0 0 2 -2Chlorides, Bromides and Iodides etc. 25324049342,1162827-Afghanistan 641 8 7 ..Canada 0 0 19 -19China 1,793 21 0 21India 1,724 20 14 6Oman 28,408 332 117 215Sri Lanka 0 0 6 -6U. A. E. Dubai 8,883 104 27 77U. A. E. Sharjah 668 8 49 -41Hypochlorites etc, Chlorites and Hypobromites 8086412828-Afghanistan 641 8 0 8Chlorates etc. Bromates etc and Iodates etc. -313108622829-Australia 862 10 10 ..New Zealand 0 0 3 -3Sulfates, Alums and Peroxosulfates 169016914,4092833-Bangladesh 14,409 169 0 169Phosphinates, Phosphinates, Phosphates and 831847,1702835-India 1,806 21 0 21Malaysia 5,365 63 1 61Carbonates; Peroxocarbonates etc. -8711,17830726,2372836-Afghanistan 2,326 27 25 3Bangladesh 11,437 134 187 -53India 8,757 102 805 -702South Africa 0 0 103 -103Sri Lanka 2,470 29 12 17U. A. E. Dubai 1,247 15 47 -33Silicates; Commercial Alkali Metal Silicates 151161,3852839-Canada 1,385 16 0 16Kuwait 0 0 1 -1Salts of Oxometallic or Peroxometallic Acids -634634002841-China 0 0 437 -437Oman 0 0 197 -197Rare-Earth Metal Compounds of Yttrium or -18519054562846-China 456 5 190 -185

Rs. US $
(Amount in Thousand)
Difference
EXPORT OF GOODS BY COMMDOITY / COUNTRY AND SERVICES BY TYPE / COUNTRY
Export of Goods and Services July 2010 196
July20 10 200 920 10HS CODE-COMMODITY / COUNTRY
Hydrogen Peroxide -84122383,2232847-India 0 0 87 -87South Africa 0 0 7 -7Sri Lanka 3,091 36 0 36Turkey 0 0 20 -20U. A. E. Dubai 133 2 9 -7Carbides -2535108402849-India 168 2 0 2Saudi Arabia 0 0 35 -35U. S. A. 672 8 0 8Halogenated Derivatives of Hydrocarbons 1,78701,787152,7522903-Malaysia 152,752 1,787 0 1,787Acyclic Alcohols and Halogenated Derivatives 10301038,7832905-India 8,783 103 0 103Ethers, Ether-Alcohols and Alcohol Peroxides etc. 1,3888742,262193,4222909-China 0 0 8 -8India 0 0 326 -326Iran 0 0 158 -158Kenya 3,529 41 0 41Singapore 9,110 107 0 107South Korea 100,649 1,177 0 1,177Sri Lanka 23,729 278 0 278Switzerland 0 0 274 -274Thailand 0 0 66 -66U. A. E. Dubai 24,868 291 42 249U. A. E. Sharjah 31,535 369 0 369Unsaturated Acyclic and Cyclic Monocarboxylic 370373,1852916-Bangladesh 3,185 37 0 37Polycarboxylic Acids and Anhydrides etc. 1,4054831,888161,4262917-Afghanistan 10,624 124 82 42China 1,106 13 0 13India 149,695 1,751 179 1,571U. A. E. Dubai 0 0 222 -222Oxygen-Function Amino-Compounds 490494,1692922-Singapore 4,169 49 0 49Carboxyamide-Function Compounds etc. -163163002924-Morocco 0 0 163 -163Nitrogen Function Compounds NES 250252,1122929-Indonesia 2,112 25 0 25Heterocyclic Compounds with Nitrogen -1531161,3932933-Malaysia 386 5 0 5South Africa 0 0 7 -7Sri Lanka 152 2 0 2Tanzania 0 0 15 -15U. S. A. 0 0 9 -9Viet Nam 855 10 0 10Antibiotics 26613239834,0252941-Guyana 851 10 0 10India 0 0 20 -20Jordan 0 0 6 -6Kenya 483 6 0 6Mauritius 277 3 0 3Nigeria 23,606 276 0 276Other Countries 0 0 2 -2Philippines 1,182 14 0 14South Africa 0 0 26 -26Sri Lanka 4,114 48 0 48Turkey 730 9 0 9Turkmenistan 1,573 18 0 18U. A. E. Dubai 0 0 78 -78Uganda 1,209 14 0 14

Rs. US $
(Amount in Thousand)
Difference
EXPORT OF GOODS BY COMMDOITY / COUNTRY AND SERVICES BY TYPE / COUNTRY
197 State Bank of Pakistan
July20 10 200 920 10HS CODE-COMMODITY / COUNTRY
Glands and other Organs for -129142131,0903001-Djibouti 972 11 0 11Germany 118 1 0 1India 0 0 7 -7Maldives 0 0 7 -7Sudan 0 0 41 -41U. A. E. Dubai 0 0 87 -87Human Blood or Animal Blood Prepared for 18355874163,3493002-Afghanistan 1,581 18 17 1Bahamas 15,294 179 0 179Burkina Faso ( Upper Volta) 0 0 .. ..Canada 316 4 0 4Ethiopia 0 0 4 -4France 3,241 38 24 14Germany 0 0 68 -68Indonesia 107 1 0 1Ireland 0 0 11 -11Kuwait 0 0 6 -6New Zealand 167 2 0 2Nigeria 853 10 91 -81Philippines 0 0 8 -8Saudi Arabia 0 0 57 -57Singapore 0 0 6 -6South Africa 686 8 1 7South Korea 0 0 10 -10Spain 49 1 0 1Sri Lanka 5,702 67 82 -15Switzerland 245 3 0 3Syrian Arab Republic 0 0 15 -15U. K. 1,145 13 14 -1U. S. A. 28,655 335 145 190Uganda 2,244 26 0 26Uzbekistan 1,647 19 0 19Zimbabwe 1,417 17 0 17Medicaments Mixtures for Therapeutic Use 1,1001,2452,345200,5233003-Afghanistan 60,511 708 228 480Azerbaijan 0 0 29 -29Bahamas 0 0 100 -100Bangladesh 4,652 54 28 27Cambodia Kampuchea 8,861 104 1 103Canada 28 .. 0 ..Ghana 513 6 0 6Indonesia 1,847 22 0 22Kazakhstan 0 0 15 -15Kenya 5,941 69 41 29Malaysia 543 6 0 6Mauritius 240 3 0 3Myanmar 11,201 131 85 46Nepal 0 0 11 -11Nigeria 1,234 14 0 14Other Countries 6,061 71 0 71Peru 424 5 10 -6Philippines 36,931 432 152 280Saudi Arabia 0 0 46 -46Singapore 1,963 23 1 22Sri Lanka 1,789 21 51 -30Sudan 21,759 254 360 -105Tanzania 0 0 21 -21U. K. 0 0 4 -4U. S. A. 10,266 120 0 120Uganda 1,613 19 53 -34Uzbekistan 3,437 40 0 40Viet Nam 18,240 213 10 203Virgin Islands 2,471 29 0 29

Rs. US $
(Amount in Thousand)
Difference
EXPORT OF GOODS BY COMMDOITY / COUNTRY AND SERVICES BY TYPE / COUNTRY
Export of Goods and Services July 2010 198
July20 10 200 920 10HS CODE-COMMODITY / COUNTRY
Medicaments NES -7045,2134,509385,5453004-Afghanistan 84,477 988 633 355Algeria 0 0 34 -34Australia 0 0 1 -1Azerbaijan 1,709 20 0 20Bahamas 0 0 175 -175Barbados 0 0 3 -3Belize 0 0 3 -3Botswana 0 0 .. ..Cambodia Kampuchea 1,101 13 135 -122Canada 0 0 .. ..Congo 147 2 10 -8Egypt 942 11 30 -19Fiji 3,710 43 11 32France 832 10 11 -1Ghana 0 0 15 -15Guinea 1,743 20 0 20Guyana 2,049 24 0 24Hong Kong 1,487 17 0 17India 0 0 14 -14Ireland 0 0 .. ..Jordan 0 0 5 -5Kazakhstan 2,183 26 0 26Kenya 15,340 179 106 74Kuwait 9,838 115 0 115Laos 1,028 12 16 -4Macao 0 0 2 -2Malaysia 8,451 99 39 60Maldives 1,563 18 44 -26Mauritius 1,103 13 52 -39Moldova 1,093 13 17 -4Morocco 9,845 115 0 115Mozambique 682 8 0 8Myanmar 0 0 25 -25Niger 0 0 19 -19Nigeria 40,218 470 664 -194Other Countries 0 0 4 -4Philippines 42,585 498 744 -246Polynesia 0 0 33 -33Rwanda 1,957 23 0 23Saudi Arabia 3,040 36 0 36Sierra Leone 642 8 0 8Singapore 350 4 132 -128Somalia 428 5 34 -29South Africa 852 10 104 -94Sri Lanka 33,107 387 589 -202Sudan 64,680 756 272 484Switzerland 2,125 25 0 25Tajikistan 2,821 33 0 33Tanzania 1,170 14 3 11Thailand 1,325 16 67 -52Trinidad and Tobago 1,068 12 0 12Turkmenistan 0 0 76 -76U. A. E. Dubai 4,728 55 193 -137U. K. 1,491 17 40 -22U. S. A. 1,589 19 185 -166Uganda 8,070 94 0 94Uzbekistan 4,738 55 18 37Viet Nam 8,587 100 610 -510Yemen Arab Republic 10,458 122 44 78Zambia 194 2 0 2Wading, Gauze, Bandages etc. 883512310,4953005-Germany 266 3 0 3Hong Kong 832 10 0 10Malaysia 2,669 31 0 31Nigeria 31 .. 0 ..

Rs. US $
(Amount in Thousand)
Difference
EXPORT OF GOODS BY COMMDOITY / COUNTRY AND SERVICES BY TYPE / COUNTRY
199 State Bank of Pakistan
July20 10 200 920 10HS CODE-COMMODITY / COUNTRY
Sri Lanka 2,306 27 3 24Sudan 1,211 14 0 14U. S. A. 0 0 32 -32Uzbekistan 3,181 37 0 37Pharmaceutical Goods 1959261152,2553006-Afghanistan 11,136 130 0 130Algeria 0 0 8 -8Austria 0 0 15 -15Germany 3,390 40 0 40India 21,408 250 0 250Kenya 4,679 55 50 5Mauritius 0 0 1 -1Other Countries 2,138 25 3 22Philippines 1,425 17 496 -479South Africa 0 0 1 -1Turkmenistan 237 3 0 3U. A. E. Dubai 7,843 92 18 74Tanning Extracts of Vegetable Origin -19620264703201-Afghanistan 0 0 202 -202Bangladesh 470 6 0 6Synthetic Organic tanning Substances -8383003202-China 0 0 83 -83Synthetic Organic Coloring Matter 31364395681,7163204-Bahrain 0 0 3 -3Bangladesh 10,404 122 309 -187China 119 1 9 -7France 0 0 22 -22Germany 40,396 472 0 472Hong Kong 5,102 60 59 ..India 629 7 0 7Indonesia 0 0 79 -79Ireland 295 3 0 3Italy 2,137 25 0 25Saudi Arabia 0 0 55 -55Singapore 1,376 16 0 16South Korea 154 2 0 2Spain 0 0 5 -5Thailand 8,626 101 28 73Turkey 0 0 75 -75U. A. E. Dubai 160 2 0 2U. S. A. 12,319 144 0 144Other Color Matters 36711079,1353206-China 0 0 66 -66Saudi Arabia 6,482 76 0 76U. A. E. Dubai 1,801 21 5 16Viet Nam 853 10 0 10Paints and Varnishes of Synthetic Polymers 8334501,283109,7033208-Afghanistan 108,824 1,273 450 823France 879 10 0 10Paints and Varnish of Synthetic Polymers 3032853209-Bangladesh 261 3 0 3Canada 25 .. 0 ..Paints and Varnishes NES -461611159,8253210-Afghanistan 9,825 115 154 -39China 0 0 7 -7Prepared Driers 15131846940,1093211-Belgium 18,565 217 0 217China 0 0 172 -172France 1,246 15 0 15Germany 419 5 0 5India 1,309 15 0 15Italy 6,654 78 23 55Japan 0 0 25 -25

Rs. US $
(Amount in Thousand)
Difference
EXPORT OF GOODS BY COMMDOITY / COUNTRY AND SERVICES BY TYPE / COUNTRY
Export of Goods and Services July 2010 200
July20 10 200 920 10HS CODE-COMMODITY / COUNTRY
North Korea 153 2 0 2South Korea 10,154 119 0 119Sweden 1,607 19 0 19Turkey 0 0 43 -43U. S. A. 0 0 55 -55Pigments Dispersed in Non-aqueous Liquid -1734532828,0093212-Afghanistan 26,913 315 345 -30China 1,096 13 0 13Artists’ Colors etc in Tablets, Tubes, Jars etc. -88003213-Germany 0 0 8 -8Glaziers Putty, Resin Cements, Caulking Comps -3055252,1333214-Afghanistan 2,133 25 35 -10Egypt 0 0 17 -17Singapore 0 0 3 -3Ink, Printing, Writing, Drawing etc. -1575605,1543215-Bangladesh 5,126 60 75 -15China 28 .. 0 ..Essential Oils, Resinoids and Terpene 00003301-Indonesia 0 0 .. ..Odoriferous Mixtures as Raw Materials for 3786544337,8753302-Afghanistan 34,911 408 0 408Iraq 1,733 20 50 -30U. S. A. 1,231 14 15 -1Perfumes and Toilet Waters -4860121,0653303-Germany 507 6 0 6India 0 0 15 -15Saudi Arabia 428 5 21 -16U. K. 131 2 0 2U. S. A. 0 0 24 -24Beauty and Make-Up Preparations -6241134929,8633304-Afghanistan 2,745 32 0 32Australia 2,491 29 7 22Canada 0 0 4 -4China 2,321 27 0 27Colombia 511 6 0 6France 52 1 0 1Germany 6,191 72 96 -24India 1,864 22 19 3Japan 33 .. 0 ..Kazakhstan 0 0 1 -1Kuwait 1,706 20 0 20Malaysia 0 0 5 -5Mauritius 147 2 2 -1Morocco 0 0 108 -108Saudi Arabia 0 0 77 -77South Africa 1,551 18 2 16Spain 1,419 17 4 13Thailand 0 0 11 -11Turkey 1,763 21 0 21U. A. E. Ajman 0 0 21 -21U. A. E. Dubai 4,944 58 42 16U. K. 2,124 25 10 15Preparations for Use on Hair 50418168558,5433305-Afghanistan 41,170 482 0 482Bangladesh 105 1 5 -4Greece 0 0 18 -18Italy 3,969 46 70 -24Morocco 2,531 30 0 30Saudi Arabia 8,501 99 43 57Sri Lanka 1,333 16 2 14U. A. E. Sharjah 0 0 44 -44Zimbabwe 933 11 0 11

Rs. US $
(Amount in Thousand)
Difference
EXPORT OF GOODS BY COMMDOITY / COUNTRY AND SERVICES BY TYPE / COUNTRY
201 State Bank of Pakistan
July20 10 200 920 10HS CODE-COMMODITY / COUNTRY
Preparations for Oral or Dental Hygiene 41621038,7653306-Cambodia Kampuchea 0 0 1 -1Morocco 2,832 33 0 33Saudi Arabia 0 0 27 -27U. A. E. Dubai 5,933 69 34 36Personal Toilet etc Prep NES 4105946940,0953307-Afghanistan 4,060 47 0 47Bangladesh 2,081 24 39 -14Mexico 111 1 1 ..Oman 3,760 44 0 44Philippines 127 1 0 1Saudi Arabia 1,372 16 0 16South Africa 164 2 0 2U. A. E. Dubai 18,413 215 13 202U. A. E. Sharjah 7,239 85 0 85U. K. 2,767 32 0 32U. S. A. 0 0 6 -6Soap, Organic Surf-Act Products used for Soap -5921,6211,02987,9843401-Afghanistan 74,469 871 631 240Bangladesh 0 0 10 -10China 8,644 101 0 101Kazakhstan 0 0 14 -14Saudi Arabia 0 0 3 -3U. A. E. Dubai 344 4 942 -938U. K. 2,562 30 0 30U. S. A. 1,965 23 4 19Yemen Arab Republic 0 0 18 -18Organic Surf-Act Agents and Products other than -3049191,5943402-Afghanistan 1,594 19 11 8Bangladesh 0 0 36 -36Singapore 0 0 3 -3Lubricating Preparations, Antirust and Treating -3640136531,1963403-Cambodia Kampuchea 0 0 5 -5Germany 0 0 22 -22Hong Kong 28,001 327 79 249India 0 0 242 -242Slovenia 0 0 9 -9South Korea 0 0 1 -1U. S. A. 0 0 41 -41Viet Nam 3,194 37 3 35Artificial and Prepared Waxes 2124453,8493404-Oman 2,018 24 0 24U. A. E. Dubai 848 10 24 -14U. K. 984 12 0 12Polishes and Creams for Leather, Wood etc. -2136151,2783405-Australia 0 0 2 -2Bangladesh 0 0 6 -6Italy 0 0 23 -23U. A. E. Dubai 0 0 5 -5U. S. A. 1,278 15 0 15Casein, Caseinates and other Casein Derivatives -132297303501-Madagascar 0 0 22 -22U. A. E. Dubai 730 9 0 9Gelatin and Derivatives 3784187875,1003503-Australia 190 2 0 2Germany 9,978 117 104 12India 7,634 89 0 89Iran 15,083 176 152 25Malaysia 22,474 263 198 65South Africa 5,883 69 67 2Turkey 8,345 98 320 -222U. K. 5,513 64 0 64

Rs. US $
(Amount in Thousand)
Difference
EXPORT OF GOODS BY COMMDOITY / COUNTRY AND SERVICES BY TYPE / COUNTRY
Export of Goods and Services July 2010 202
July20 10 200 920 10HS CODE-COMMODITY / COUNTRY
Dextrin and Glues Based on Starches etc. -1748312,6663505-Bangladesh 2,666 31 0 31Saudi Arabia 0 0 48 -48Prepared Glues and Adhesives NES -91897363506-Ethiopia 736 9 0 9Madagascar 0 0 5 -5Sri Lanka 0 0 13 -13Enzymes; Prepared Enzymes NES 1419332,8463507-Bangladesh 2,846 33 19 14Safety Fuses, Detonating Fuse and Percussion etc. 8458292779,2903603-U. S. A. 79,290 927 82 845Fireworks, Signaling Flares and Rain Rockets etc. -1111003604-Ethiopia 0 0 11 -11Matches and Except Pyrotechnic Articles 2162,1352,351201,0553605-Afghanistan 18,674 218 463 -244Benin ( Dahomey ) 0 0 50 -50Burkina Faso ( Upper Volta) 4,769 56 40 15Chile 7,774 91 28 63Congo 35,206 412 38 374Ecuador 469 5 0 5Egypt 41,464 485 279 206El Salvador 0 0 12 -12Estonia 1,495 17 0 17Ethiopia 0 0 38 -38Georgia 0 0 17 -17Ghana 0 0 23 -23Greece 259 3 0 3Haiti 905 11 0 11India 2,602 30 0 30Iran 1,505 18 0 18Iraq 4,181 49 120 -71Jordan 5,438 64 4 60Kenya 0 0 5 -5Lebanon 619 7 0 7Malawi 150 2 0 2Mali 15,888 186 52 133Mozambique 0 0 15 -15Netherlands (Holland) 2,893 34 0 34Nicaragua 0 0 24 -24Nigeria 12,868 150 405 -255Romania 1,807 21 25 -4Singapore 0 0 17 -17South Africa 1,077 13 7 5Sudan 10,596 124 0 124Tajikistan 0 0 24 -24Tanzania 13,541 158 20 138Togo 0 0 104 -104Turkmenistan 0 0 11 -11U. A. E. Dubai 7,809 91 204 -112U. S. A. 0 0 10 -10Yemen Arab Republic 6,891 81 27 53Zambia 0 0 20 -20Zimbabwe 2,176 25 52 -26Photo Plates and Film Flat, Sensitized, Unexposed 00003701-U. S. A. 0 0 .. ..Activated Carbon etc. Animal Black -33003802-U. A. E. Dubai 0 0 3 -3Insecticides, Rodenticides and Fungicides etc. 350235230,0563808-China 296 3 0 3India 2,499 29 0 29Oman 257 3 0 3Singapore 23,890 279 0 279Sri Lanka 2,234 26 0 26

Rs. US $
(Amount in Thousand)
Difference
EXPORT OF GOODS BY COMMDOITY / COUNTRY AND SERVICES BY TYPE / COUNTRY
203 State Bank of Pakistan
July20 10 200 920 10HS CODE-COMMODITY / COUNTRY
U. A. E. Dubai 880 10 0 10Uganda 0 0 2 -2Finishing Agents etc. for Textiles, Paper etc NES 5,265105,275451,0093809-Bangladesh 7,896 92 10 82Belgium 871 10 0 10Brazil 1,308 15 0 15Canada 22,976 269 0 269Colombia 1,114 13 0 13Denmark 2,703 32 0 32Egypt 5,105 60 0 60Estonia 5,598 65 0 65France 34,140 399 0 399Germany 110,796 1,296 0 1,296India 3,506 41 0 41Jordan 850 10 0 10Kenya 1,364 16 0 16Malaysia 623 7 0 7Mexico 8,529 100 0 100Netherlands (Holland) 14,283 167 0 167New Zealand 6,340 74 0 74Norway 11,631 136 0 136Peru 1,194 14 0 14Saudi Arabia 1,176 14 0 14Slovenia 792 9 0 9South Africa 8,547 100 0 100Spain 13,886 162 0 162Sri Lanka 19,182 224 0 224Sweden 9,842 115 0 115Turkey 2,217 26 0 26U. A. E. Dubai 25,235 295 0 295U. A. E. Sharjah 4,530 53 0 53U. A. E. Ummal Quwain 1,651 19 0 19U. K. 24,774 290 0 290U. S. A. 98,351 1,150 0 1,150Antiknock Preparations and other Additives -136136003811-China 0 0 136 -136Prepared Rubber Accelerators etc. 321332,8613812-China 2,861 33 0 33U. A. E. Dubai 0 0 1 -1Organic Composite Solvents and Thinners NES -33003814-Bahrain 0 0 3 -3Chemical Elements Doped for Used in Electronics -2121003818-Bangladesh 0 0 18 -18Sri Lanka 0 0 3 -3Prepared binders for foundry moulds or cores 857616113,8053824-Afghanistan 0 0 14 -14Bangladesh 4,725 55 0 55China 3,645 43 49 -6Egypt 1,484 17 0 17Indonesia 0 0 10 -10Philippines 70 1 4 -3Singapore 243 3 0 3Tanzania 2,840 33 0 33U. K. 473 6 0 6U. S. A. 324 4 0 4Residual Products of Chemical or Allied -2,9882,988003825-Afghanistan 0 0 39 -39Argentina 0 0 19 -19Australia 0 0 149 -149Bahamas 0 0 1 -1Belgium 0 0 134 -134Brazil 0 0 26 -26Canada 0 0 56 -56Colombia 0 0 7 -7

Rs. US $
(Amount in Thousand)
Difference
EXPORT OF GOODS BY COMMDOITY / COUNTRY AND SERVICES BY TYPE / COUNTRY
Export of Goods and Services July 2010 204
July20 10 200 920 10HS CODE-COMMODITY / COUNTRY
Czech Republic 0 0 36 -36Denmark 0 0 12 -12Finland 0 0 22 -22France 0 0 208 -208Germany 0 0 200 -200Greece 0 0 11 -11Hong Kong 0 0 12 -12India 0 0 139 -139Ireland 0 0 3 -3Italy 0 0 241 -241Japan 0 0 7 -7Mexico 0 0 88 -88Nepal 0 0 6 -6Netherlands (Holland) 0 0 148 -148New Zealand 0 0 32 -32Norway 0 0 26 -26Peru 0 0 1 -1Singapore 0 0 3 -3South Africa 0 0 99 -99Spain 0 0 20 -20Sri Lanka 0 0 38 -38Sweden 0 0 56 -56Tanzania 0 0 43 -43Thailand 0 0 2 -2Tunisia 0 0 9 -9Turkey 0 0 10 -10U. A. E. Abudhabi 0 0 64 -64U. A. E. Dubai 0 0 302 -302U. K. 0 0 231 -231U. S. A. 0 0 489 -489Polymers of Ethylene, in Primary Forms 2864533128,3123901-Afghanistan 5,894 69 45 24India 21,103 247 0 247Ireland 150 2 0 2U. A. E. Ajman 1,165 14 0 14Polymers of Propylene or other Olefins, Primary 8315623920,4283902-Afghanistan 19,941 233 0 233China 40 .. 0 ..France 0 0 2 -2South Africa 278 3 0 3Turkmenistan 0 0 102 -102U. A. E. Dubai 0 0 36 -36U. A. E. Sharjah 169 2 0 2U. K. 0 0 16 -16Polymers of Styrene in Primary Forms 3731,1621,535131,2543903-Australia 1,601 19 0 19Cambodia Kampuchea 0 0 93 -93Egypt 2,365 28 0 28Greece 1,802 21 0 21Iran 17,085 200 406 -206Italy 257 3 0 3Jordan 15,462 181 0 181Kuwait 34,388 402 120 282Mozambique 1,728 20 0 20Qatar 60 1 0 1South Africa 1,109 13 55 -42Sri Lanka 206 2 3 ..Turkey 35,432 414 464 -50U. A. E. Dubai 19,617 229 22 208Viet Nam 141 2 0 2Polymers of Vinyl Chloride etc. in Primary Forms 10201028,7193904-Afghanistan 8,719 102 0 102Polymers of Vinyl Acetate and other Vinyl -2643171,4363905-Bangladesh 0 0 15 -15

Rs. US $
(Amount in Thousand)
Difference
EXPORT OF GOODS BY COMMDOITY / COUNTRY AND SERVICES BY TYPE / COUNTRY
205 State Bank of Pakistan
July20 10 200 920 10HS CODE-COMMODITY / COUNTRY
Hong Kong 0 0 3 -3Madagascar 1,436 17 0 17Netherlands (Holland) 0 0 18 -18Singapore 0 0 7 -7Acrylic Polymers in Primary Forms 2251023520,0863906-Bangladesh 7,850 92 10 82Indonesia 12,056 141 0 141Thailand 180 2 0 2Polyesters, Epoxides and Polyesters, Primary 8,43013,79722,2271,900,4583907-Afghanistan 90,864 1,063 777 286Azerbaijan 0 0 16 -16Belgium 0 0 354 -354Bulgaria 36,224 424 0 424Canada 0 0 13 -13China 27,002 316 1,754 -1,438Egypt 24,248 284 0 284France 224,419 2,625 953 1,672Georgia 22,147 259 0 259Germany 0 0 823 -823Iraq 53,884 630 0 630Italy 708,318 8,284 3,464 4,820Kuwait 0 0 27 -27Nigeria 13,968 163 0 163Poland 0 0 634 -634Portugal 9,734 114 50 64Romania 0 0 727 -727Saudi Arabia 2,356 28 99 -72South Africa 4,007 47 0 47Spain 63,102 738 931 -193Sri Lanka 7,929 93 32 61Sudan 2,169 25 0 25Turkey 392,808 4,594 444 4,150U. A. E. Dubai 854 10 26 -16U. K. 0 0 1,159 -1,159U. S. A. 171,602 2,007 1,414 593Ukraine 44,822 524 0 524Zambia 0 0 101 -101Polyamides in Primary Forms 970978,3293908-Afghanistan 2,990 35 0 35China 852 10 0 10U. A. E. Dubai 4,487 52 0 52Amino-Resins, Phenolic and Polyurethane, 261272,3123909-Netherlands (Holland) 255 3 0 3U. A. E. Dubai 2,056 24 0 24U. S. A. 0 0 1 -1Cellulose and Chemical Derivatives NES Primary -33003912-India 0 0 3 -3Waste, Parings and Scrap, of Plastics 8571,0911,948166,5323915-Afghanistan 3,420 40 0 40Belgium 16,396 192 309 -117China 114,399 1,338 566 772Hong Kong 15,765 184 62 122Italy 1,338 16 0 16Japan 0 0 22 -22Kuwait 0 0 30 -30Other Countries 5,239 61 40 21South Korea 1,995 23 3 20Sri Lanka 1,169 14 13 1U. K. 6,811 80 0 80Western Samoa 0 0 45 -45Monofilament of Cross-Sectional Dimension -1424723319,9233916-Afghanistan 19,923 233 247 -14

Rs. US $
(Amount in Thousand)
Difference
EXPORT OF GOODS BY COMMDOITY / COUNTRY AND SERVICES BY TYPE / COUNTRY
Export of Goods and Services July 2010 206
July20 10 200 920 10HS CODE-COMMODITY / COUNTRY
Tubes, Pipes and Hoses and their Fittings, of -1891189376,3693917-Afghanistan 67,820 793 714 79Argentina 54 1 0 1Egypt 249 3 0 3Japan 578 7 0 7Qatar 601 7 0 7U. A. E. Dubai 5,984 70 197 -127U. A. E. Sharjah 702 8 0 8U. K. 381 4 0 4Floor Cover: Rolls and Tiles, Wall Cover, Plastics 2614730826,3173918-Afghanistan 26,206 306 47 260U. S. A. 111 1 0 1Self-Adhesive Plates, Sheets, Film etc. of Plastics 0443833919-China 383 4 0 4U. K. 0 0 4 -4Plates, Sheets, Film etc. 4949281,422121,5553920-Bangladesh 0 0 87 -87Cameroon 3,747 44 2 41Canada 0 0 2 -2China 3,298 39 141 -102Hong Kong 0 0 4 -4India 9,589 112 191 -79Italy 0 0 104 -104Kuwait 1,841 22 0 22Nigeria 64,446 754 0 754Oman 0 0 64 -64Other Countries 8,023 94 0 94South Africa 2,784 33 72 -39Sri Lanka 6,906 81 114 -33Sudan 0 0 36 -36Turkey 3,124 37 0 37U. A. E. Dubai 13,657 160 89 71U. K. 4,141 48 16 33U. S. A. 0 0 8 -8Plates, Sheets, Film, Foil and Strip NES Plastics 580584,9743921-U. A. E. Dubai 4,974 58 0 58Baths, Washbasins, Lavatory Seats etc. of Plastics 115161,3643922-Afghanistan 684 8 0 8Lebanon 680 8 0 8U. A. E. Dubai 0 0 15 -15Containers: Boxes, Bags, Closures etc, Plastic -551,6521,597136,5293923-Afghanistan 54,800 641 434 207China 7,411 87 195 -109Denmark 642 8 0 8France 202 2 0 2Kuwait 26,450 309 9 300Lebanon 1,126 13 0 13Norway 0 0 13 -13Oman 14,344 168 0 168Qatar 0 0 12 -12Saudi Arabia 2,971 35 0 35Sri Lanka 11,211 131 0 131Togo 424 5 0 5Turkey 0 0 516 -516U. A. E. Ajman 0 0 20 -20U. A. E. Dubai 15,640 183 279 -96U. K. 1,308 15 5 11U. S. A. 0 0 163 -163Uganda 0 0 7 -7Tableware and other Household Articles etc, 52142294380,6163924-Afghanistan 57,530 673 388 285Australia 0 0 1 -1Canada 861 10 0 10

Rs. US $
(Amount in Thousand)
Difference
EXPORT OF GOODS BY COMMDOITY / COUNTRY AND SERVICES BY TYPE / COUNTRY
207 State Bank of Pakistan
July20 10 200 920 10HS CODE-COMMODITY / COUNTRY
China 0 0 7 -7Hong Kong 732 9 0 9India 1,763 21 8 13Oman 499 6 0 6Saudi Arabia 0 0 9 -9Sri Lanka 266 3 0 3Tanzania 1,966 23 5 18U. A. E. Dubai 16,999 199 5 194Builders' Ware of Plastics, NES -1961423,5683925-Afghanistan 3,568 42 61 -19Articles of Plastics Including Polymers and 2071,8782,085178,2793926-Afghanistan 26,297 308 65 243Belgium 397 5 0 5Canada 0 0 7 -7China 3,684 43 108 -65Czech Republic 0 0 39 -39Egypt 1,099 13 5 7France 39,811 466 180 286Germany 23,033 269 243 27Greece 1,428 17 73 -56Hong Kong 4,668 55 20 35India 0 0 9 -9Indonesia 0 0 15 -15Ireland 0 0 18 -18Italy 0 0 27 -27Japan 4,471 52 98 -45Kuwait 577 7 19 -12Netherlands (Holland) 2,624 31 28 3New Zealand 0 0 7 -7Norway 0 0 3 -3Oman 0 0 4 -4Other Countries 6,216 73 0 73Portugal 0 0 9 -9Saudi Arabia 0 0 11 -11Singapore 451 5 25 -20South Africa 470 6 233 -227South Korea 5,358 63 29 34Spain 2,324 27 7 20Sri Lanka 19 .. 260 -260Sweden 6,643 78 14 63Syrian Arab Republic 0 0 3 -3Thailand 0 0 1 -1Turkey 0 0 3 -3U. A. E. Abudhabi 2,562 30 0 30U. A. E. Ajman 88 1 0 1U. A. E. Dubai 14,831 173 129 44U. A. E. Sharjah 596 7 0 7U. K. 15,633 183 78 105U. S. A. 15,000 175 107 69Natural Rubber, Balata, Chicle etc, Primary 4594850743,3084001-Afghanistan 1,607 19 0 19China 0 0 48 -48U. A. E. Dubai 41,701 488 0 488U. S. A. 0 0 .. ..Synthetic Rubber and Factice Derived from Oil 420423,5914002-Mauritius 3,591 42 0 42Waste of Rubber and Powder Obtain thereof -13626112510,6834004-Ethiopia 240 3 0 3Indonesia 958 11 11 ..Saudi Arabia 0 0 83 -83South Korea 9,485 111 124 -13Tanzania 0 0 7 -7U. K. 0 0 23 -23Viet Nam 0 0 13 -13

Rs. US $
(Amount in Thousand)
Difference
EXPORT OF GOODS BY COMMDOITY / COUNTRY AND SERVICES BY TYPE / COUNTRY
Export of Goods and Services July 2010 208
July20 10 200 920 10HS CODE-COMMODITY / COUNTRY
Tubes, Pipes and Hoses of Unhard Vulcanized 814857,3024009-Canada 166 2 0 2Kuwait 593 7 0 7Malaysia 2,211 26 0 26U. A. E. Abudhabi 0 0 1 -1U. A. E. Sharjah 325 4 0 4U. S. A. 4,007 47 3 44Conveyor or Transmission Belts of Vulcanized -1111004010-Bangladesh 0 0 3 -3Canada 0 0 1 -1U. K. 0 0 7 -7New Pneumatic Tires of Rubber 49713463153,9904011-Afghanistan 39,112 457 68 390Bangladesh 1,584 19 0 19Egypt 2,281 27 0 27France 0 0 27 -27India 2,151 25 0 25Italy 2,012 24 0 24Syrian Arab Republic 2,993 35 40 -5Turkey 3,857 45 0 45Retread or Used Pneumatic Tires of Rubber 265312,6854012-India 0 0 5 -5Poland 2,685 31 0 31Inner Rubber Tubes for Tires 52581109,4074013-Belgium 3,229 38 0 38Japan 1,553 18 0 18Saudi Arabia 0 0 58 -58Turkey 3,129 37 0 37U. A. E. Ajman 1,496 18 0 18Hygienic of Pharmaceutical Articles of Rubber 52614567157,3454014-Afghanistan 38,304 448 0 448Angola 2,135 25 0 25Azerbaijan 4,002 47 0 47Canada 0 0 2 -2Kenya 527 6 0 6Laos 555 6 0 6Lebanon 0 0 35 -35Nigeria 7,623 89 36 54Singapore 4,200 49 50 -1U. A. E. Dubai 0 0 16 -16Uganda 0 0 6 -6Articles of Apparel and Clothing Acc. of Rubber 8902,4373,327284,4814015-Argentina 2,360 28 2 25Australia 889 10 30 -20Austria 1,471 17 14 3Bangladesh 0 0 102 -102Belgium 2,698 32 4 27Brazil 26,149 306 0 306Canada 9,502 111 8 103China 0 0 14 -14Czech Republic 8,258 97 21 76Denmark 0 0 5 -5Egypt 0 0 8 -8Finland 1,989 23 0 23France 39,748 465 194 271Germany 23,236 272 149 122Greece 0 0 6 -6Guyana 755 9 0 9Hong Kong 399 5 .. 4Hungary 447 5 0 5India 850 10 22 -12Italy 3,583 42 76 -34Japan 2,225 26 23 3Latvia 0 0 1 -1

Rs. US $
(Amount in Thousand)
Difference
EXPORT OF GOODS BY COMMDOITY / COUNTRY AND SERVICES BY TYPE / COUNTRY
209 State Bank of Pakistan
July20 10 200 920 10HS CODE-COMMODITY / COUNTRY
Lithuania 189 2 0 2Mexico 2,934 34 21 13Netherlands (Holland) 2,279 27 3 23New Zealand 223 3 7 -4Norway 9,661 113 35 78Other Countries 346 4 2 3Philippines 1,060 12 0 12Poland 0 0 4 -4Qatar 0 0 6 -6Romania 0 0 2 -2Russian Federation 8,235 96 80 16Saudi Arabia 710 8 25 -17Singapore 242 3 2 1Slovenia 274 3 0 3South Africa 201 2 0 2South Korea 709 8 48 -40Spain 8,312 97 36 62Sweden 0 0 18 -18Switzerland 865 10 29 -19Thailand 1,549 18 0 18Turkey 0 0 11 -11U. A. E. Dubai 0 0 3 -3U. K. 15,087 176 152 24U. S. A. 105,388 1,233 1,201 32Uganda 1,657 19 19 1Venezuela 0 0 22 -22Viet Nam 0 0 31 -31Articles NES of Unhard Vulcanized Rubber 5041917,8144016-Bangladesh 524 6 0 6Saudi Arabia 298 3 7 -4U. A. E. Sharjah 0 0 10 -10U. S. A. 2,856 33 24 9Venezuela 4,135 48 0 48Hard Rubber and Articles thereof 101764017-South Korea 76 1 0 1Raw Hides and Skins of Bovine or Equine 5038711,374117,4824101-Austria 9,462 111 0 111China 0 0 53 -53France 2,430 28 10 19Germany 2,123 25 22 3Hong Kong 59,815 700 185 514Hungary 0 0 4 -4India 4,675 55 101 -47Italy 7,228 85 99 -14Japan 6,867 80 14 67Malaysia 0 0 33 -33Singapore 1,774 21 27 -6South Africa 2,081 24 32 -7South Korea 4,518 53 27 25Spain 2,741 32 93 -61Turkey 9,994 117 109 8U. A. E. Dubai 1,105 13 0 13U. K. 1,541 18 0 18U. S. A. 170 2 63 -61Viet Nam 958 11 0 11Raw Skins of Sheep or Lambs NES -18856437632,1184102-Belgium 2,317 27 0 27China 0 0 21 -21France 0 0 27 -27Germany 11,997 140 208 -68India 1,142 13 13 ..Italy 2,532 30 9 20Japan 0 0 14 -14Romania 5,868 69 206 -137Spain 4,270 50 65 -15

Rs. US $
(Amount in Thousand)
Difference
EXPORT OF GOODS BY COMMDOITY / COUNTRY AND SERVICES BY TYPE / COUNTRY
Export of Goods and Services July 2010 210
July20 10 200 920 10HS CODE-COMMODITY / COUNTRY
U. K. 3,992 47 0 47Raw Hides and Skins NES -6541,50184772,4184103-Brazil 974 11 0 11Canada 403 5 0 5China 5,383 63 130 -68Czech Republic 3,541 41 0 41France 1,485 17 63 -46Germany 1,334 16 55 -39Hong Kong 3,102 36 80 -44India 1,034 12 15 -3Indonesia 874 10 0 10Italy 6,421 75 333 -258Japan 3,038 36 11 25Poland 1,021 12 0 12Portugal 1,943 23 0 23Saudi Arabia 0 0 53 -53South Korea 6,252 73 270 -197Spain 11,546 135 257 -122Thailand 1,233 14 37 -22Turkey 91 1 12 -11U. A. E. Dubai 17,522 205 0 205U. S. A. 0 0 106 -106Venezuela 5,221 61 0 61Viet Nam 0 0 79 -79Bovine or Equine Leather, No Hair NES -6711,33065956,3194104-Bangladesh 12,201 143 0 143Belgium 0 0 120 -120Bulgaria 0 0 14 -14China 10,204 119 183 -64Finland 0 0 15 -15France 1,445 17 0 17Germany 0 0 7 -7Hong Kong 8,459 99 211 -112Italy 4,260 50 46 4Japan 474 6 2 3Lebanon 508 6 0 6Poland 1,143 13 0 13Romania 2,221 26 14 12Singapore 655 8 0 8Slovenia 0 0 245 -245South Africa 0 0 23 -23South Korea 12,093 141 292 -151Spain 0 0 74 -74U. S. A. 0 0 33 -33Viet Nam 2,656 31 49 -18Sheep or Lamb Skin Leather, No Wool NES -52680327723,6804105-Antigua & Barbuda 1,627 19 0 19Belgium 0 0 131 -131Canada 1,099 13 0 13China 470 5 67 -61Germany 0 0 142 -142Hong Kong 363 4 131 -126India 7,763 91 0 91Japan 1,789 21 2 19Other Countries 0 0 10 -10Romania 2,845 33 135 -102South Korea 7,007 82 108 -26Sweden 0 0 58 -58U. A. E. Dubai 320 4 0 4U. K. 0 0 21 -21U. S. A. 396 5 0 5Goat or Kidskin Leather, No Hair NES 1,2342,5213,755321,1004106-Austria 15,912 186 28 158China 23,180 271 346 -75France 169 2 9 -7

Rs. US $
(Amount in Thousand)
Difference
EXPORT OF GOODS BY COMMDOITY / COUNTRY AND SERVICES BY TYPE / COUNTRY
211 State Bank of Pakistan
July20 10 200 920 10HS CODE-COMMODITY / COUNTRY
Germany 11,040 129 12 117Hong Kong 120,865 1,414 1,135 278Hungary 2,633 31 0 31India 9,498 111 0 111Indonesia 2,769 32 0 32Italy 41,861 490 109 381Japan 9,049 106 0 106Lebanon 2,456 29 0 29Malaysia 2,892 34 0 34Netherlands (Holland) 0 0 26 -26Other Countries 8,603 101 120 -20Portugal 1,706 20 0 20Singapore 0 0 12 -12Slovenia 945 11 19 -8South Korea 41,357 484 437 46Spain 9,161 107 188 -81Sri Lanka 0 0 5 -5Thailand 506 6 4 2Turkey 1,696 20 9 10U. S. A. 7,812 91 6 85Viet Nam 6,987 82 53 28Leather of Animals NES, No Hair NES 5,5802,9398,519728,4214107-Afghanistan 801 9 0 9Australia 681 8 0 8Austria 45 1 0 1Bangladesh 19,939 233 87 147Belgium 6,508 76 0 76Burundi 3,990 47 0 47Cambodia Kampuchea 10,464 122 29 93China 39,834 466 67 399Denmark 409 5 0 5France 942 11 393 -382Germany 13,255 155 2 153Greece 0 0 12 -12Hong Kong 172,109 2,013 239 1,774India 86,944 1,017 18 999Indonesia 1,022 12 19 -7Ireland 0 0 6 -6Italy 158,235 1,851 653 1,198Japan 49 1 9 -8Malaysia 10,094 118 6 112Myanmar 4,122 48 0 48Other Countries 11,805 138 30 108Philippines 5,114 60 216 -156Portugal 648 8 0 8Russian Federation 9,182 107 7 101Saudi Arabia 14,589 171 3 168Seychelles 1,280 15 0 15Singapore 0 0 13 -13Slovenia 10,757 126 0 126South Africa 46,923 549 533 16South Korea 44,392 519 275 245Sweden 2,777 32 60 -28Turkey 8,672 101 132 -31U. K. 12,544 147 2 145U. S. A. 6,404 75 14 60Ukraine 0 0 16 -16Viet Nam 23,893 279 99 180Leather further prepared after tanning (sheep, -3832,0491,666142,4154112-China 33,527 392 71 322France 446 5 0 5Germany 17,900 209 0 209Hong Kong 21,840 255 386 -131Hungary 230 3 0 3India 247 3 67 -64Indonesia 0 0 96 -96

Rs. US $
(Amount in Thousand)
Difference
EXPORT OF GOODS BY COMMDOITY / COUNTRY AND SERVICES BY TYPE / COUNTRY
Export of Goods and Services July 2010 212
July20 10 200 920 10HS CODE-COMMODITY / COUNTRY
Italy 4,538 53 256 -203Japan 465 5 391 -386Kenya 0 0 9 -9Malaysia 0 0 8 -8Netherlands (Holland) 1,768 21 0 21New Zealand 0 0 3 -3Other Countries 1,061 12 21 -8Philippines 0 0 23 -23Portugal 0 0 13 -13Singapore 0 0 57 -57Slovenia 8,040 94 0 94South Africa 0 0 141 -141South Korea 2,828 33 36 -3Spain 2,598 30 177 -147Sri Lanka 3,032 35 56 -20Sweden 16,727 196 0 196Thailand 937 11 130 -119Turkey 132 2 58 -57U. K. 17,715 207 41 166U. S. A. 8,385 98 9 89Leather further prepared after tanning (other 3,44227,21030,6522,620,8034113-Afghanistan 0 0 2 -2American Samoa 0 0 6 -6Andorra 315 4 0 4Australia 6,188 72 102 -30Austria 36,216 424 443 -20Bahamas 239 3 0 3Bahrain 277 3 10 -7Bangladesh 59,980 701 390 311Belgium 22,741 266 182 84Belize 0 0 8 -8Bosnia Herzegovina 0 0 2 -2Brazil 963 11 33 -22Canada 51,469 602 340 262Chad 0 0 56 -56Chile 1,760 21 0 21China 249,641 2,920 2,569 350Croatia 0 0 10 -10Cyprus 0 0 8 -8Czech Republic 4,246 50 135 -85Denmark 22,146 259 13 246Fiji 0 0 2 -2Finland 0 0 47 -47France 74,647 873 806 67Germany 200,506 2,345 3,311 -966Greece 1,952 23 39 -16Greenland 0 0 1 -1Hong Kong 595,700 6,967 3,436 3,531Hungary 947 11 48 -37India 25,562 299 565 -266Indonesia 17,623 206 89 117Ireland 238 3 8 -5Italy 184,745 2,161 1,458 703Japan 133,108 1,557 739 818Jordan 244 3 0 3Kuwait 0 0 2 -2Lebanon 5,583 65 41 24Luxembourg 3,862 45 0 45Macao 0 0 25 -25Malaysia 10,434 122 30 92Mauritius 0 0 6 -6Mexico 1,359 16 20 -5Morocco 0 0 3 -3Myanmar 0 0 29 -29Netherlands (Holland) 14,212 166 579 -413New Zealand 0 0 4 -4

Rs. US $
(Amount in Thousand)
Difference
EXPORT OF GOODS BY COMMDOITY / COUNTRY AND SERVICES BY TYPE / COUNTRY
213 State Bank of Pakistan
July20 10 200 920 10HS CODE-COMMODITY / COUNTRY
Nigeria 15 .. 0 ..North Korea 0 0 10 -10Norway 1,146 13 62 -49Oman 3,111 36 44 -8Other Countries 20,318 238 120 117Philippines 1,780 21 66 -45Poland 15,777 185 32 152Portugal 10,506 123 111 12Qatar 0 0 33 -33Romania 150 2 0 2Russian Federation 4,098 48 26 22Sao Tome & Principe 119 1 0 1Saudi Arabia 1,034 12 229 -217Singapore 3,231 38 29 9South Africa 65,819 770 486 284South Korea 215,953 2,526 1,496 1,030Spain 119,555 1,398 1,385 14Sri Lanka 15,749 184 106 78Sweden 18,999 222 453 -231Switzerland 2,711 32 306 -275Thailand 3,891 46 43 3Tunisia 1,512 18 0 18Turkey 52,902 619 2,451 -1,832U. A. E. Dubai 13,272 155 0 155U. A. E. Ummal Quwain 0 0 21 -21U. K. 125,230 1,465 1,137 328U. S. A. 167,317 1,957 2,716 -759Venezuela 0 0 13 -13Viet Nam 29,702 347 235 112Chamois -517517004114-Bangladesh 0 0 89 -89France 0 0 75 -75Hong Kong 0 0 5 -5Italy 0 0 273 -273Sri Lanka 0 0 40 -40Turkey 0 0 18 -18U. K. 0 0 17 -17Composition Leather with a Basis of Leather or -1630141,2154115-Canada 57 1 0 1China 0 0 10 -10Denmark 203 2 9 -6India 0 0 2 -2Netherlands (Holland) 455 5 10 -5Tunisia 500 6 0 6Saddlery, Harness, Traces and Leads etc. 8359991,834156,8234201-Australia 1,342 16 9 6Austria 55 1 0 1Bahrain 0 0 1 -1Belgium 0 0 22 -22Canada 784 9 13 -4China 8,252 97 57 40Denmark 7,031 82 7 76Finland 0 0 6 -6France 1,016 12 18 -6Germany 19,997 234 126 107Ghana 426 5 0 5Greece 109 1 0 1Hong Kong 63,723 745 382 363Hungary 1,635 19 0 19Ireland 208 2 0 2Italy 10,981 128 0 128Japan 892 10 11 ..Netherlands (Holland) 1,215 14 21 -7Nigeria 1,164 14 0 14North Korea 14,007 164 0 164

Rs. US $
(Amount in Thousand)
Difference
EXPORT OF GOODS BY COMMDOITY / COUNTRY AND SERVICES BY TYPE / COUNTRY
Export of Goods and Services July 2010 214
July20 10 200 920 10HS CODE-COMMODITY / COUNTRY
Other Countries 0 0 17 -17Portugal 0 0 5 -5South Africa 353 4 2 2South Korea 3,590 42 0 42Spain 1,270 15 0 15Sweden 666 8 47 -39Switzerland 0 0 8 -8Thailand 300 4 0 4U. A. E. Dubai 86 1 74 -73U. K. 2,375 28 34 -6U. S. A. 14,962 175 138 36Viet Nam 385 5 0 5Travel Goods, Handbags, Wallets, Jewelry Cases 18951139,6274202-Australia 13 .. 0 ..France 0 0 1 -1Germany 642 8 28 -20Greece 0 0 9 -9Italy 0 0 5 -5Qatar 4,275 50 0 50Saudi Arabia 257 3 5 -2Sri Lanka 183 2 0 2Switzerland 858 10 2 8U. A. E. Dubai 3,320 39 1 38U. K. 80 1 42 -41U. S. A. 0 0 3 -3Articles of Apparel and Accessories of Leather 6,52422,35828,8822,469,5194203-Australia 39,442 461 311 151Austria 8,509 100 160 -60Bahrain 395 5 11 -6Barbados 7,884 92 0 92Belgium 120,397 1,408 1,088 320Belize 432 5 0 5Bolivia 5,548 65 0 65Brazil 14,126 165 96 69Bulgaria 1,157 14 4 10Canada 41,308 483 242 241Chile 0 0 5 -5China 14,707 172 29 143Colombia 158 2 18 -16Costa Rica 1,765 21 9 11Croatia 175 2 9 -7Cyprus 384 4 6 -2Czech Republic 35,529 416 143 273Denmark 48,409 566 783 -217Egypt 1,446 17 0 17Estonia 0 0 6 -6Fiji 3,078 36 0 36Finland 22,979 269 329 -61France 202,974 2,374 1,680 694Georgia 105 1 0 1Germany 473,939 5,543 2,937 2,606Greece 4,177 49 72 -23Hong Kong 16,656 195 252 -57Hungary 2,190 26 30 -4Iceland 0 0 5 -5India 1,774 21 41 -20Ireland 1,544 18 40 -22Italy 74,076 866 499 367Japan 14,002 164 138 26Jordan 3,895 46 0 46Kazakhstan 1,022 12 8 4Kenya 1,452 17 6 11Kuwait 4,735 55 10 45Lithuania 508 6 12 -6Macedonia (FormerlyYugoslavia) 672 8 0 8Malaysia 13,652 160 52 108

Rs. US $
(Amount in Thousand)
Difference
EXPORT OF GOODS BY COMMDOITY / COUNTRY AND SERVICES BY TYPE / COUNTRY
215 State Bank of Pakistan
July20 10 200 920 10HS CODE-COMMODITY / COUNTRY
Mexico 7,510 88 12 75Morocco 0 0 27 -27Netherlands (Holland) 115,615 1,352 1,008 344Netherlands Antilles 400 5 0 5New Zealand 900 11 25 -14Nigeria 779 9 0 9North Korea 607 7 0 7Norway 13,640 160 347 -188Oman 1,175 14 52 -38Other Countries 5,280 62 2 60Peru 0 0 1 -1Philippines 126 1 1 ..Poland 15,313 179 313 -134Polynesia 14 .. 0 ..Portugal 5,730 67 69 -2Qatar 1,935 23 62 -39Romania 1,378 16 22 -6Russian Federation 8,067 94 34 60Saudi Arabia 48,815 571 746 -175Serbia 468 5 6 ..Singapore 19,475 228 69 159Slovak Republic 637 7 7 1Slovenia 435 5 4 1Somalia 4,388 51 0 51South Africa 85,382 999 469 529South Korea 2,749 32 55 -23Spain 193,003 2,257 1,769 488Sudan 1,021 12 10 2Sweden 72,139 844 583 261Switzerland 39,518 462 270 192Thailand 2,328 27 14 13Turkey 103,615 1,212 1,181 31U. A. E. Abudhabi 903 11 5 5U. A. E. Dubai 51,639 604 738 -134U. A. E. Sharjah 0 0 19 -19U. A. E. Ummal Quwain 277 3 100 -97U. K. 127,375 1,490 1,928 -439U. S. A. 351,683 4,113 3,374 739Viet Nam 0 0 2 -2Articles of Leather Used in Machinery and 5893,5854,174356,8964204-Argentina 1,430 17 0 17Australia 11,303 132 154 -22Austria 0 0 24 -24Bahrain 0 0 34 -34Belgium 5,287 62 97 -36Canada 3,523 41 35 6China 16,864 197 0 197Czech Republic 0 0 28 -28Denmark 5,287 62 12 50France 10,887 127 119 8Germany 96,915 1,133 986 148Hong Kong 17,750 208 83 125Hungary 0 0 38 -38India 1,970 23 0 23Italy 31,277 366 15 351Japan 12,282 144 62 82Kuwait 0 0 110 -110Lithuania 0 0 .. ..Malaysia 283 3 11 -8Netherlands (Holland) 40,557 474 611 -137New Zealand 0 0 9 -9Norway 352 4 0 4Other Countries 1,655 19 0 19Poland 2,416 28 4 24Portugal 0 0 9 -9Qatar 34 .. 173 -173

Rs. US $
(Amount in Thousand)
Difference
EXPORT OF GOODS BY COMMDOITY / COUNTRY AND SERVICES BY TYPE / COUNTRY
Export of Goods and Services July 2010 216
July20 10 200 920 10HS CODE-COMMODITY / COUNTRY
Russian Federation 5,999 70 0 70Saudi Arabia 0 0 3 -3Singapore 605 7 0 7Slovak Republic 69 1 0 1South Africa 13,717 160 69 91South Korea 3,783 44 0 44Spain 7,906 92 83 9Sri Lanka 6,137 72 0 72Sweden 13,343 156 15 141Switzerland 0 0 25 -25Turkey 8,243 96 21 75U. A. E. Dubai 2,025 24 363 -339U. K. 16,555 194 212 -19U. S. A. 18,183 213 178 34Ukraine 261 3 0 3Articles of Leather NES 1,0111,1812,192187,4154205-Argentina 0 0 20 -20Australia 4,521 53 57 -4Austria 0 0 13 -13Belgium 1,672 20 0 20Brazil 5,746 67 0 67Brunei 0 0 1 -1Canada 897 10 56 -45Chile 32 .. 31 -31China 1,805 21 2 19Croatia 0 0 3 -3Denmark 6,069 71 2 69Finland 0 0 2 -2France 930 11 40 -29Germany 28,117 329 42 286Greece 4,645 54 21 34India 583 7 0 7Iran 185 2 0 2Ireland 1,750 20 36 -15Italy 6,151 72 287 -215Japan 954 11 6 5Kuwait 0 0 7 -7Latvia 0 0 2 -2Lebanon 0 0 56 -56Netherlands (Holland) 22,481 263 31 232New Zealand 264 3 0 3Nicaragua 646 8 0 8Nigeria 7 .. 0 ..Norway 188 2 32 -30Poland 151 2 0 2Portugal 1,993 23 1 22Romania 15 .. 0 ..Saudi Arabia 333 4 18 -14Seychelles 0 0 4 -4South Africa 1,280 15 52 -37South Korea 29,850 349 2 347Spain 2,590 30 10 20St. Kitts-Nevis 106 1 0 1Sweden 7 .. 0 ..Switzerland 25,616 300 88 212U. A. E. Dubai 0 0 5 -5U. A. E. Sharjah 1,159 14 0 14U. K. 25,472 298 94 204U. S. A. 10,178 119 151 -32Uruguay 0 0 10 -10Uzbekistan 1,023 12 0 12Articles of Gut NES of Gold Beater's Skin etc. -66004206-Philippines 0 0 6 -6Raw Furskins NES -15161504301-Germany 0 0 16 -16

Rs. US $
(Amount in Thousand)
Difference
EXPORT OF GOODS BY COMMDOITY / COUNTRY AND SERVICES BY TYPE / COUNTRY
217 State Bank of Pakistan
July20 10 200 920 10HS CODE-COMMODITY / COUNTRY
Hong Kong 50 1 0 1Tanned or Dressed Furskins including Heads, -2020004302-Zimbabwe 0 0 20 -20Articles of Apparel etc, of Furskins 3032534303-Switzerland 253 3 0 3Fuel Wood, In Logs etc. Wood in Chips etc. -55004401-U. A. E. Dubai 0 0 5 -5Wood Charcoal, Whether or Not Agglomerated -77004402-Malaysia 0 0 7 -7Wood in Rough, Stripped or Not of Sapwood etc. -1212004403-Saudi Arabia 0 0 6 -6U. A. E. Dubai 0 0 6 -6Hopwood; Split Poles; Pickets and Stakes etc. -11004404-U. S. A. 0 0 1 -1Fiberboard of Wood or Other Ligneous Materials 6205991,219104,2234411-Afghanistan 102,947 1,204 599 605U. A. E. Dubai 1,276 15 0 15Plywood, Veneered Panels and Laminated Wood 7032873162,4604412-Afghanistan 60,674 710 28 682Nigeria 1,131 13 0 13Sri Lanka 655 8 0 8Wooden Frames Paintings and Photographs etc. 2830584,9564414-Bangladesh 353 4 0 4Iran 3,581 42 0 42Saudi Arabia 896 10 30 -19U. S. A. 126 1 0 1Packing Cases etc. of Wood; Pallets etc. -3333004415-U. A. E. Dubai 0 0 6 -6U. K. 0 0 27 -27Tools, Tool Bodies, Tool Handles of Wood 554595,0184417-Germany 5,018 59 0 59Italy 0 0 4 -4Tableware and Kitchenware of Wood -112134221,8994419-Germany 731 9 0 9Qatar 0 0 14 -14Saudi Arabia 0 0 12 -12U. S. A. 1,167 14 108 -94Wood Marquetry & inlaid Wood Jewel Case etc. -2840121,0324420-Australia 150 2 0 2Germany 0 0 1 -1Italy 559 7 0 7Malaysia 0 0 3 -3Saudi Arabia 0 0 23 -23South Korea 0 0 2 -2Spain 0 0 1 -1Turkey 210 2 0 2U. A. E. Dubai 114 1 0 1U. S. A. 0 0 10 -10Articles of Wood NES -7131023920,4754421-Canada 984 12 0 12Czech Republic 7,101 83 0 83Egypt 0 0 5 -5Ethiopia 1,987 23 34 -10Germany 0 0 105 -105Hong Kong 0 0 28 -28Kuwait 300 4 13 -9Malaysia 679 8 0 8Oman 864 10 0 10Saudi Arabia 6,436 75 85 -10Spain 0 0 8 -8U. A. E. Abudhabi 0 0 13 -13

Rs. US $
(Amount in Thousand)
Difference
EXPORT OF GOODS BY COMMDOITY / COUNTRY AND SERVICES BY TYPE / COUNTRY
Export of Goods and Services July 2010 218
July20 10 200 920 10HS CODE-COMMODITY / COUNTRY
U. A. E. Ajman 0 0 2 -2U. A. E. Dubai 904 11 7 3U. A. E. Sharjah 0 0 2 -2U. K. 0 0 3 -3U. S. A. 1,221 14 7 7Plaits etc and Products of Plaiting Materials 208020817,8124601-Italy 2,637 31 0 31Jordan 1,806 21 0 21U. S. A. 13,368 156 0 156Pulps of Fibrous Cellulosic Material NES -9947837932,3694706-China 0 0 88 -88Germany 0 0 14 -14South Africa 32,369 379 281 98U. A. E. Dubai 0 0 95 -95Waste and Scrap of Paper or Paperboard 8086804707-Germany 513 6 0 6Norway 167 2 0 2Newsprint, in Rolls or Sheets -11004801-India 0 0 1 -1Paper Uncoated For Writing etc, Rolls; 5524630125,7334802-Afghanistan 25,733 301 188 113U. A. E. Dubai 0 0 39 -39U. A. E. Ras Al Khaimah 0 0 18 -18Toilet or Facial Tissues Stock, Towel or Napkin -192258665,6504803-Afghanistan 4,367 51 31 20Iran 0 0 47 -47Oman 0 0 33 -33U. A. E. Dubai 1,283 15 147 -132Kraft Paper and Paperboard Uncoated NES 20415636030,7454804-Argentina 0 0 14 -14Bahrain 1,378 16 0 16Germany 4,219 49 127 -77Italy 2,966 35 0 35Jamaica 0 0 2 -2Mexico 0 0 13 -13Portugal 3,136 37 0 37South Africa 2,828 33 0 33Spain 8,254 97 0 97U. K. 7,963 93 0 93Paper and Paperboard Uncoated NES, Rolls or 1,0331391,172100,1934805-Iran 5,513 64 0 64Malaysia 7,883 92 0 92Singapore 8,105 95 0 95Sri Lanka 53,723 628 93 535Sweden 0 0 46 -46U. A. E. Dubai 24,969 292 0 292Composite Paper and Paperboard, Not 330332,8284807-U. A. E. Dubai 2,779 33 0 33U. S. A. 49 1 0 1Paper Carbon, Self-Copy Paper and other 500504,2604809-Afghanistan 4,260 50 0 50Paper, Paperboard, Wading etc. Coated etc NES -66004811-Qatar 0 0 6 -6Cigarette Paper 1057618115,4754813-Afghanistan 15,475 181 76 105Paper, Carbon, Self-Copy etc NES -1818004816-Sri Lanka 0 0 18 -18Envelopes, Letter Cards, Postcards of Paper or -28291864817-Bahrain 0 0 9 -9Denmark 86 1 0 1Morocco 0 0 1 -1

Rs. US $
(Amount in Thousand)
Difference
EXPORT OF GOODS BY COMMDOITY / COUNTRY AND SERVICES BY TYPE / COUNTRY
219 State Bank of Pakistan
July20 10 200 920 10HS CODE-COMMODITY / COUNTRY
Spain 0 0 4 -4U. K. 0 0 15 -15Toilet Paper, Paper Tissues, Towels, Napkins etc. -4841,7211,237105,8054818-Afghanistan 2,974 35 120 -86Angola 0 0 11 -11Chile 0 0 56 -56Germany 1,565 18 21 -2Greece 0 0 11 -11Italy 6,846 80 40 40Japan 3,848 45 0 45Jordan 4,467 52 0 52Kazakhstan 0 0 11 -11Netherlands (Holland) 3,475 41 135 -94New Zealand 0 0 46 -46Norway 4,699 55 146 -91Poland 0 0 8 -8Portugal 0 0 82 -82Romania 2,275 27 0 27Russian Federation 0 0 8 -8Saudi Arabia 0 0 154 -154Spain 4,599 54 0 54Tanzania 0 0 4 -4U. A. E. Dubai 0 0 40 -40U. K. 8,418 98 107 -9U. S. A. 62,639 733 721 11Cartons, Boxes, Cases, Bags and other Packing 213613811,7884819-Afghanistan 11,026 129 20 109Belgium 0 0 68 -68Canada 20 .. 0 ..Lebanon 0 0 46 -46Netherlands (Holland) 742 9 0 9U. K. 0 0 2 -2Registers, Notebooks, Order Book, Receipt Book -3251191,6284820-Netherlands (Holland) 0 0 1 -1Oman 107 1 0 1Saudi Arabia 0 0 4 -4Singapore 0 0 6 -6South Africa 738 9 0 9Sri Lanka 0 0 4 -4U. A. E. Dubai 253 3 0 3U. K. 144 2 0 2U. S. A. 386 5 36 -31Paper and Paperboard Labels of all Kinds 4284647440,5194821-China 0 0 2 -2U. K. 1,667 19 .. 19U. S. A. 38,852 454 43 411Bobbins, Spools etc. of Paper Pulp, Paper and -127206796,7454822-Australia 0 0 25 -25Czech Republic 0 0 1 -1Kenya 0 0 3 -3Portugal 4,412 52 0 52Saudi Arabia 2,333 27 71 -43Spain 0 0 21 -21U. A. E. Dubai 0 0 50 -50U. S. A. 0 0 36 -36Other Paper and Paperboard and Articles NES 2519634729,6544823-Belgium 19,230 225 0 225Germany 8,174 96 96 ..Italy 1,872 22 0 22U. S. A. 378 4 0 4Printed Books, Brochures and Similar Printed 4431135530,3304901-Bangladesh 171 2 0 2Canada 164 2 5 -3China 0 0 8 -8

Rs. US $
(Amount in Thousand)
Difference
EXPORT OF GOODS BY COMMDOITY / COUNTRY AND SERVICES BY TYPE / COUNTRY
Export of Goods and Services July 2010 220
July20 10 200 920 10HS CODE-COMMODITY / COUNTRY
Denmark 0 0 1 -1France 2,564 30 0 30Hong Kong 0 0 28 -28India 571 7 40 -33Kuwait 349 4 6 -2Libya 0 0 9 -9Malaysia 0 0 1 -1Mozambique 0 0 1 -1Nepal 0 0 3 -3Nigeria 0 0 5 -5Norway 806 9 1 9Qatar 777 9 0 9Saudi Arabia 11,171 131 40 91Singapore 206 2 0 2South Africa 2,061 24 37 -13Syrian Arab Republic 735 9 0 9Tanzania 261 3 0 3U. A. E. Abudhabi 1,158 14 0 14U. A. E. Dubai 599 7 1 6U. A. E. Sharjah 423 5 0 5U. K. 6,903 81 47 34U. S. A. 1,410 16 48 -32Yemen Arab Republic 0 0 30 -30Newspapers, Journals and Periodicals 823312,6584902-Canada 0 0 2 -2Kuwait 84 1 3 -2Nepal 0 0 6 -6Norway 134 2 0 2Oman 106 1 0 1Qatar 73 1 1 ..Saudi Arabia 1,043 12 6 7U. A. E. Dubai 112 1 0 1U. K. 979 11 0 11U. S. A. 126 1 5 -4Children's Picture, Drawing or Coloring Books 2022124903-U. S. A. 212 2 0 2Maps and Hydrographic or Similar Charts of all -2753944905-U. S. A. 394 5 7 -2Printed or Illustrated Postcards, Greeting Cards -55004909-Afghanistan 0 0 5 -5Printed Matter including Pictures and -7687119784911-Congo 0 0 70 -70New Zealand 0 0 1 -1U. A. E. Dubai 978 11 8 3U. K. 0 0 4 -4U. S. A. 0 0 3 -3Silkworm Cocoons Suitable for Reeling -6363005001-Other Countries 0 0 63 -63Silk Waste, Including Silk Yarn Waste etc. -1010005003-Mexico 0 0 10 -10Yarn Spun From Silk Waste Not for Retail Sale -44005005-Bangladesh 0 0 4 -4Silk Yarn and Yarn Spun from Silk Waste or -77005006-Mexico 0 0 7 -7Woven Fabrics of Silk or Silk Waste 1,6842,5424,226361,3715007-Australia 3,644 43 0 43Bahrain 0 0 5 -5Bangladesh 2,991 35 72 -37Belgium 1,211 14 1 14Benin ( Dahomey ) 11,248 132 0 132Brazil 1,051 12 0 12Bulgaria 517 6 0 6Canada 7,386 86 3 83

Rs. US $
(Amount in Thousand)
Difference
EXPORT OF GOODS BY COMMDOITY / COUNTRY AND SERVICES BY TYPE / COUNTRY
221 State Bank of Pakistan
July20 10 200 920 10HS CODE-COMMODITY / COUNTRY
Chile 11,142 130 0 130China 8,531 100 122 -22Colombia 1,397 16 0 16Czech Republic 0 0 19 -19Denmark 0 0 5 -5Egypt 13,146 154 0 154France 32,005 374 96 279Germany 5,884 69 86 -17Greece 0 0 10 -10Hong Kong 7,227 85 0 85India 13,405 157 2 155Indonesia 23,513 275 67 208Italy 15,032 176 383 -208Japan 695 8 0 8Jordan 9,994 117 0 117Lebanon 4,234 50 0 50Malawi 0 0 3 -3Mauritius 0 0 19 -19Mexico 25,448 298 0 298Oman 3,306 39 116 -78Other Countries 14,143 165 41 125Panama Inc. Panama Canal Zone 5,380 63 0 63Portugal 0 0 29 -29Romania 0 0 10 -10Russian Federation 1,709 20 23 -3Saudi Arabia 15,433 180 142 39Singapore 619 7 0 7South Africa 5,233 61 4 57South Korea 4,782 56 89 -34Spain 8,354 98 0 98Sri Lanka 7,493 88 428 -340Thailand 3,266 38 0 38Turkey 5,090 60 19 40U. A. E. Dubai 24,983 292 397 -105U. A. E. Sharjah 162 2 12 -10U. K. 8,073 94 1 94U. S. A. 37,575 439 92 347Venezuela 16,070 188 116 72Viet Nam 0 0 1 -1Yemen Arab Republic 0 0 129 -129Wool, Not Carded or Combed 420423,6285101-India 3,628 42 0 42Fine or Coarse Animal Hair, Not Carded or 934413711,7235102-China 0 0 22 -22India 10,534 123 0 123Japan 0 0 5 -5U. K. 1,189 14 17 -3Waste of Wool, Fine or Coarse Animal Hair 61326087374,6185103-Belgium 2,411 28 0 28China 9,880 116 235 -120Hungary 1,686 20 0 20India 53,545 626 25 602Other Countries 4,704 55 0 55U. K. 2,392 28 0 28Wool and Fine or Coarse Animal Hair, Carded or 19911431326,7465105-Belgium 2,028 24 0 24Canada 0 0 13 -13China 8,721 102 45 57France 2,802 33 0 33Germany 1,183 14 0 14India 0 0 32 -32Other Countries 5,597 65 0 65Romania 6,414 75 0 75Turkey 0 0 8 -8U. A. E. Dubai 0 0 16 -16

Rs. US $
(Amount in Thousand)
Difference
EXPORT OF GOODS BY COMMDOITY / COUNTRY AND SERVICES BY TYPE / COUNTRY
Export of Goods and Services July 2010 222
July20 10 200 920 10HS CODE-COMMODITY / COUNTRY
Yarn of Carded Wool, Not for Retail Sale -481481005106-China 0 0 297 -297Czech Republic 0 0 21 -21Hong Kong 0 0 113 -113U. A. E. Dubai 0 0 50 -50Yarn of Combed Wool, Not for Retail Sale -51081038,7975107-India 0 0 83 -83Turkey 6,072 71 0 71U. K. 2,725 32 25 7Yarn of Wool or Fine Animal Hair, For Retail 810816,8955109-Tajikistan 3,668 43 0 43U. K. 2,784 33 0 33U. S. A. 444 5 0 5Woven Fabrics of Carded Wool or Fine Animal -16143627523,5005111-Australia 3,912 46 0 46Belgium 15,013 176 0 176Colombia 0 0 54 -54Ecuador 0 0 10 -10Netherlands (Holland) 0 0 122 -122Turkey 0 0 251 -251U. A. E. Dubai 4,575 54 0 54Woven Fabrics of Combed Wool or Fine Animal -55005112-Norway 0 0 5 -5Cotton, Not Carded Or Combed -2,1704,1431,973168,7045201-Bangladesh 8,590 100 1,166 -1,065Chile 0 0 25 -25China 0 0 717 -717Hong Kong 84,727 991 0 991India 0 0 268 -268Indonesia 11,002 129 471 -343Italy 0 0 48 -48Japan 0 0 29 -29Oman 0 0 26 -26Other Countries 0 0 115 -115Paraguay 0 0 27 -27Qatar 1,091 13 0 13Romania 0 0 7 -7Saudi Arabia 5,119 60 31 29Thailand 58,176 680 1,004 -324U. A. E. Dubai 0 0 3 -3U. S. A. 0 0 64 -64Viet Nam 0 0 142 -142Cotton Waste Including Yarn Waste etc. 1,5585,4547,012599,5825202-Algeria 7,939 93 0 93Argentina 8,218 96 0 96Bahrain 0 0 5 -5Belgium 33,514 392 100 292Chile 4,282 50 33 17China 42,393 496 201 295Cuba 629 7 0 7Egypt 0 0 5 -5France 92,979 1,087 645 442Germany 22,896 268 2,069 -1,802Greece 2,001 23 34 -10Hong Kong 43,765 512 382 130India 0 0 82 -82Ireland 0 0 120 -120Italy 35,628 417 111 306Jordan 0 0 10 -10Kenya 10,691 125 0 125Kuwait 0 0 26 -26Malaysia 5,635 66 21 45Mexico 6,357 74 25 50Netherlands (Holland) 43,006 503 493 10

Rs. US $
(Amount in Thousand)
Difference
EXPORT OF GOODS BY COMMDOITY / COUNTRY AND SERVICES BY TYPE / COUNTRY
223 State Bank of Pakistan
July20 10 200 920 10HS CODE-COMMODITY / COUNTRY
Oman 334 4 5 -1Other Countries 78,313 916 566 350Philippines 0 0 49 -49Poland 12,208 143 69 74Portugal 2,102 25 20 5Qatar 1,717 20 6 14Russian Federation 7,292 85 0 85Saudi Arabia 1,992 23 6 17Singapore 427 5 0 5Slovenia 3,567 42 0 42South Africa 5,984 70 0 70South Korea 28,880 338 108 229Spain 6,219 73 141 -68Sri Lanka 0 0 12 -12Thailand 4,641 54 0 54Tunisia 6,016 70 0 70Turkey 0 0 32 -32U. A. E. Abudhabi 3,584 42 0 42U. A. E. Dubai 4,418 52 5 46U. K. 41,863 490 42 447U. S. A. 15,773 184 22 162Viet Nam 14,319 167 9 159Cotton, Carded or Combed -1,10211,17310,071861,1325203-Australia 162 2 0 2Austria 20,898 244 23 222Bahrain 15,634 183 362 -179Bangladesh 56,852 665 1,743 -1,078Belgium 21,736 254 1 253Canada 0 0 33 -33Cape Verde 3,170 37 0 37Chile 0 0 5 -5China 197,764 2,313 2,692 -379Colombia 0 0 71 -71Dominica 8,303 97 41 56Ecuador 0 0 12 -12Egypt 0 0 51 -51France 12,890 151 158 -7Germany 17,722 207 210 -3Greece 5,076 59 44 15Guatemala 4,602 54 0 54Hong Kong 129,735 1,517 2,043 -525India 0 0 100 -100Italy 91,544 1,071 770 301Japan 68,303 799 469 329Kenya 0 0 40 -40Macao 0 0 53 -53Malaysia 13,618 159 65 94Mauritius 9,209 108 0 108Netherlands (Holland) 334 4 54 -50Oman 0 0 8 -8Other Countries 5,823 68 65 3Philippines 6,580 77 0 77Portugal 18,789 220 237 -17Saudi Arabia 1,297 15 0 15Slovenia 0 0 44 -44South Korea 24,185 283 688 -405Spain 20,544 240 79 161Sri Lanka 0 0 180 -180Swaziland 0 0 39 -39Switzerland 29,279 342 80 263Thailand 0 0 33 -33Turkey 21,520 252 173 79U. A. E. Dubai 15,393 180 0 180U. A. E. Sharjah 229 3 0 3U. K. 475 6 85 -79U. S. A. 30,578 358 341 17

Rs. US $
(Amount in Thousand)
Difference
EXPORT OF GOODS BY COMMDOITY / COUNTRY AND SERVICES BY TYPE / COUNTRY
Export of Goods and Services July 2010 224
July20 10 200 920 10HS CODE-COMMODITY / COUNTRY
Venezuela 8,889 104 0 104Virgin Islands 0 0 80 -80Cotton Sewing Thread, Retail Packed or Not -1,0985,7324,634396,2435204-Afghanistan 756 9 0 9Argentina 4,272 50 0 50Bahrain 0 0 70 -70Bangladesh 18,193 213 565 -352Belgium 0 0 163 -163China 99,234 1,161 822 338Ecuador 0 0 21 -21Egypt 0 0 71 -71France 854 10 103 -93Germany 1,543 18 0 18Hong Kong 95,976 1,122 1,031 91Indonesia 0 0 129 -129Iraq 136 2 0 2Ireland 0 0 17 -17Italy 14,249 167 638 -471Japan 19,096 223 336 -112Malaysia 21,267 249 36 213Norway 3,317 39 0 39Philippines 6,067 71 34 37Poland 3,284 38 0 38Portugal 24,073 282 301 -20South Korea 6,353 74 643 -569Spain 34,160 400 225 174Sri Lanka 1,135 13 61 -47Thailand 0 0 95 -95Turkey 7,679 90 0 90U. K. 28,347 332 29 303U. S. A. 6,254 73 313 -240Ukraine 0 0 30 -30Cotton Yarn not for Sewing Cotton more than 10,33672,96183,2977,122,1455205-Algeria 3,733 44 0 44Argentina 0 0 28 -28Australia 3,839 45 153 -108Austria 0 0 72 -72Bahrain 20,956 245 600 -355Bangladesh 564,005 6,596 5,133 1,464Belgium 30,920 362 272 89Brazil 0 0 49 -49Brunei 4,189 49 0 49Bulgaria 4,390 51 103 -52Cambodia Kampuchea 0 0 46 -46Canada 23,870 279 122 157Chad 0 0 44 -44Chile 15,432 180 153 28China 2,695,180 31,521 26,306 5,215Colombia 41,538 486 635 -149Costa Rica 0 0 16 -16Cuba 0 0 33 -33Czech Republic 0 0 80 -80Dominican Republic 8,803 103 593 -490Egypt 36,447 426 1,627 -1,201Estonia 0 0 40 -40Ethiopia 0 0 10 -10France 28,456 333 465 -132Germany 32,582 381 581 -200Greece 0 0 14 -14Guatemala 49,183 575 317 259Honduras 0 0 175 -175Hong Kong 1,727,296 20,202 13,519 6,683Hungary 3,050 36 131 -95India 78,831 922 147 775Indonesia 0 0 802 -802Iran 0 0 303 -303

Rs. US $
(Amount in Thousand)
Difference
EXPORT OF GOODS BY COMMDOITY / COUNTRY AND SERVICES BY TYPE / COUNTRY
225 State Bank of Pakistan
July20 10 200 920 10HS CODE-COMMODITY / COUNTRY
Ireland 0 0 34 -34Italy 217,299 2,541 1,737 805Japan 68,596 802 1,934 -1,132Libya 0 0 41 -41Lithuania 0 0 213 -213Macao 7,961 93 0 93Madagascar 0 0 48 -48Malaysia 78,144 914 977 -63Mauritius 4,646 54 285 -231Mexico 24,348 285 43 242Morocco 0 0 43 -43Nepal 0 0 20 -20Netherlands (Holland) 17,540 205 27 179New Zealand 0 0 53 -53Nicaragua 7,933 93 0 93North Korea 4,147 49 0 49Other Countries 283,244 3,313 1,169 2,144Paraguay 0 0 104 -104Philippines 44,024 515 1,064 -549Portugal 159,781 1,869 1,998 -130Romania 0 0 10 -10Russian Federation 0 0 23 -23Saudi Arabia 8,541 100 0 100Singapore 2,312 27 112 -85South Africa 0 0 42 -42South Korea 332,490 3,889 5,136 -1,247Spain 42,736 500 539 -39Sri Lanka 18,485 216 307 -90Sweden 13,425 157 10 147Switzerland 0 0 72 -72Thailand 46,947 549 304 246Tunisia 9,550 112 0 112Turkey 111,016 1,298 1,608 -309U. A. E. Dubai 337 4 177 -173U. A. E. Sharjah 0 0 7 -7U. K. 14,463 169 150 19U. S. A. 218,420 2,555 1,858 696Viet Nam 13,062 153 251 -98Cotton Yarn not for Sewing Cotton less than 85% 2601,0281,288110,1505206-Bahrain 0 0 185 -185Bangladesh 0 0 40 -40Belgium 4,381 51 119 -68Canada 0 0 50 -50China 62,759 734 67 667Germany 0 0 54 -54Italy 7,175 84 0 84New Zealand 502 6 0 6Philippines 0 0 62 -62Poland 4,312 50 0 50Portugal 5,149 60 0 60South Africa .. .. 0 ..South Korea 10,171 119 59 60Spain 0 0 179 -179Sri Lanka 0 0 42 -42Turkey 15,702 184 0 184U. A. E. Dubai 0 0 160 -160U. S. A. 0 0 10 -10Cotton Yarn not for Sewing Retail Packed 5,7589,92515,6831,340,9635207-Australia 18,135 212 7 205Bahrain 0 0 65 -65Bangladesh 73,056 854 527 327Brazil 0 0 30 -30Bulgaria 0 0 30 -30China 560,299 6,553 3,284 3,269Egypt 4,451 52 159 -107France 9,577 112 0 112

Rs. US $
(Amount in Thousand)
Difference
EXPORT OF GOODS BY COMMDOITY / COUNTRY AND SERVICES BY TYPE / COUNTRY
Export of Goods and Services July 2010 226
July20 10 200 920 10HS CODE-COMMODITY / COUNTRY
Germany 17,681 207 0 207Hong Kong 268,450 3,140 1,631 1,508Indonesia 22,905 268 76 192Italy 21,490 251 26 226Japan 11,921 139 674 -535Lebanon 2,007 23 0 23Macao 67,329 787 0 787Malaysia 0 0 49 -49Netherlands (Holland) 0 0 142 -142Other Countries 24,153 282 45 237Philippines 0 0 105 -105Portugal 88,616 1,036 1,356 -319Sierra Leone 0 0 35 -35South Korea 31,149 364 295 69Spain 5,066 59 0 59Sri Lanka 11,309 132 103 30Switzerland 9,574 112 0 112Thailand 1,517 18 52 -34Turkey 27,362 320 850 -530U. A. E. Dubai 0 0 43 -43U. A. E. Ummal Quwain 0 0 44 -44U. K. 4,983 58 50 8U. S. A. 56,874 665 208 457Viet Nam 3,060 36 38 -2Woven Cotton Fabrics, Cotton more than 85% 40235,08035,4823,033,7905208-Algeria 2,727 32 109 -78Argentina 3,815 45 294 -249Australia 66,212 774 378 397Austria 0 0 5 -5Bangladesh 187,528 2,193 1,795 398Barbados 5,174 61 0 61Belgium 131,732 1,541 1,017 523Belize 0 0 232 -232Botswana 4,480 52 38 15Brazil 37,307 436 247 189Bulgaria 0 0 62 -62Cambodia Kampuchea 11,767 138 61 77Cameroon 0 0 164 -164Canada 48,295 565 100 464Chile 29,341 343 57 286China 69,344 811 959 -148Colombia 2,979 35 21 14Congo 0 0 76 -76Croatia 8,851 104 57 47Cuba 0 0 12 -12Cyprus 0 0 40 -40Czech Republic 7,301 85 45 40Dominica 4,318 50 0 50Dominican Republic 221 3 33 -30Ecuador 2,996 35 0 35Egypt 6,057 71 708 -637Estonia 2,138 25 273 -248Ethiopia 0 0 7 -7Finland 19,633 230 65 165France 19,595 229 515 -285French Guinea 0 0 30 -30Georgia 0 0 389 -389Germany 151,975 1,777 2,707 -929Ghana 0 0 .. ..Greece 45,472 532 868 -336Haiti 1,640 19 0 19Hong Kong 79,834 934 1,556 -623India 47,182 552 432 120Indonesia 3,874 45 290 -245Iran 10,216 119 112 8Italy 303,315 3,547 3,863 -315

Rs. US $
(Amount in Thousand)
Difference
EXPORT OF GOODS BY COMMDOITY / COUNTRY AND SERVICES BY TYPE / COUNTRY
227 State Bank of Pakistan
July20 10 200 920 10HS CODE-COMMODITY / COUNTRY
Japan 3,314 39 378 -339Jordan 4,991 58 308 -250Kenya 10,457 122 26 97Kuwait 291 3 157 -154Lebanon 5,072 59 30 30Lithuania 35,724 418 450 -32Madagascar 18,065 211 55 157Malaysia 22,016 257 269 -11Mauritius 3,487 41 10 30Mexico 15,261 178 553 -374Morocco 0 0 42 -42Netherlands (Holland) 34,048 398 363 36New Zealand 7,825 92 158 -67Nicaragua 4,737 55 295 -240Norway 6,228 73 0 73Oman 11,043 129 14 115Other Countries 8,561 100 780 -680Panama Inc. Panama Canal Zone 1,622 19 21 -3Paraguay 11,355 133 245 -112Peru 0 0 35 -35Philippines 8,727 102 1,403 -1,301Poland 12,976 152 98 54Portugal 85,496 1,000 1,184 -184Qatar 854 10 0 10Romania 12,072 141 108 33Russian Federation 65,640 768 831 -63Saudi Arabia 10,043 117 179 -61Senegal .. .. 43 -43Serbia 392 5 0 5South Africa 65,308 764 136 628South Korea 64,648 756 685 71Spain 197,753 2,313 871 1,442Sri Lanka 24,630 288 975 -687Sweden 21,375 250 49 201Switzerland 1,691 20 310 -290Syrian Arab Republic 0 0 116 -116Tanzania 0 0 20 -20Thailand 13,104 153 214 -60Tunisia 9,866 115 104 12Turkey 336,026 3,930 2,113 1,817U. A. E. Ajman 120 1 0 1U. A. E. Dubai 5,761 67 114 -46U. A. E. Sharjah 0 0 88 -88U. K. 131,464 1,538 644 894U. S. A. 405,488 4,742 2,538 2,205Ukraine 12,346 144 150 -5Uruguay 19,244 225 0 225Venezuela 0 0 295 -295Viet Nam 9,355 109 14 95Woven Cotton Fabrics, Cotton more than 85% 2,20157,00659,2075,062,3595209-Algeria 27,259 319 356 -37Argentina 0 0 65 -65Armenia 0 0 4 -4Australia 5,287 62 483 -421Austria 0 0 86 -86Bahrain 1,602 19 105 -86Bangladesh 832,957 9,742 10,398 -656Belgium 86,414 1,011 644 367Bolivia 0 0 124 -124Brazil 32,910 385 104 281Bulgaria 29,229 342 353 -11Cambodia Kampuchea 29,243 342 949 -607Canada 572 7 201 -194Chile 9,911 116 155 -39China 289,713 3,388 3,466 -78Colombia 949 11 178 -167

Rs. US $
(Amount in Thousand)
Difference
EXPORT OF GOODS BY COMMDOITY / COUNTRY AND SERVICES BY TYPE / COUNTRY
Export of Goods and Services July 2010 228
July20 10 200 920 10HS CODE-COMMODITY / COUNTRY
Costa Rica 0 0 61 -61Cuba 4,668 55 97 -42Cyprus 0 0 4 -4Czech Republic 0 0 11 -11Denmark 4,637 54 0 54Djibouti 0 0 52 -52Dominican Republic 12,164 142 0 142Egypt 172,681 2,020 2,193 -173El Salvador 15,870 186 0 186Ethiopia 52 1 0 1Fiji 9,676 113 208 -95Finland 8,909 104 85 19France 14,464 169 452 -283Georgia 0 0 95 -95Germany 165,278 1,933 2,105 -172Greece 13,798 161 331 -170Guatemala 0 0 378 -378Hong Kong 64,535 755 2,524 -1,769Hungary 5,511 64 76 -12India 124,656 1,458 702 756Indonesia 55,225 646 461 185Iran 0 0 243 -243Iraq 3,796 44 0 44Italy 302,256 3,535 3,663 -128Japan 30,281 354 197 157Jordan 9,411 110 190 -79Kenya 35,387 414 311 103Lebanon 8,446 99 31 67Lesotho 18,174 213 312 -100Libya 2,770 32 0 32Lithuania 20,938 245 0 245Macedonia (FormerlyYugoslavia) 680 8 0 8Madagascar 0 0 486 -486Malaysia 11,523 135 120 15Mauritania 2,562 30 0 30Mauritius 2,941 34 236 -202Mexico 31,365 367 757 -390Morocco 33,170 388 180 208Nepal 447 5 0 5Netherlands (Holland) 181,272 2,120 814 1,306Netherlands Antilles 6,156 72 0 72New Zealand 12,052 141 15 126Nicaragua 0 0 432 -432Niger 8,109 95 277 -182Nigeria 0 0 22 -22Norway 30,203 353 86 267Oman 0 0 5 -5Other Countries 26,689 312 94 218Peru 26,727 313 4 309Philippines 4,731 55 242 -186Poland 8,677 101 447 -346Portugal 38,004 444 730 -285Qatar 1,550 18 16 2Reunion Island 0 0 11 -11Romania 19,946 233 51 182Russian Federation 19,734 231 364 -133Saudi Arabia 33,681 394 393 1Senegal 428 5 0 5Serbia 0 0 82 -82Singapore 6,210 73 20 53Slovak Republic 1,541 18 0 18South Africa 82,584 966 1,302 -337South Korea 90,241 1,055 525 530Spain 95,277 1,114 1,402 -287Sri Lanka 255,902 2,993 2,981 11St. Vincent 0 0 18 -18

Rs. US $
(Amount in Thousand)
Difference
EXPORT OF GOODS BY COMMDOITY / COUNTRY AND SERVICES BY TYPE / COUNTRY
229 State Bank of Pakistan
July20 10 200 920 10HS CODE-COMMODITY / COUNTRY
Sweden 22,812 267 106 161Switzerland 16,912 198 209 -12Syrian Arab Republic 7,733 90 0 90Tanzania 6,498 76 80 -4Thailand 91,016 1,064 579 486Togo 0 0 72 -72Tunisia 12,427 145 12 134Turkey 816,251 9,546 5,007 4,539U. A. E. Dubai 44,195 517 866 -349U. A. E. Sharjah 371 4 49 -45U. K. 87,650 1,025 651 374U. S. A. 257,319 3,009 2,569 441Ukraine 46,666 546 37 508Uruguay 0 0 80 -80Venezuela 24,062 281 136 146Viet Nam 142,816 1,670 1,972 -302Zimbabwe 3,596 42 13 29Woven Cotton Fabrics, Cotton less than 85% Wt 2,42716,53818,9651,621,5995210-Algeria 108 1 228 -226Argentina 108,568 1,270 451 819Australia 2,255 26 150 -123Bahrain 2,786 33 0 33Bangladesh 29,087 340 334 6Belgium 51,240 599 258 341Benin ( Dahomey ) 7,054 83 0 83Brazil 41,449 485 6 479Cambodia Kampuchea 1,437 17 0 17Canada 25,379 297 226 70Chile 33,870 396 705 -309China 1,253 15 848 -833Colombia 25,908 303 129 174Croatia 0 0 1 -1Cyprus 0 0 43 -43Denmark 2,930 34 0 34Ecuador 0 0 60 -60Egypt 3,777 44 139 -95Estonia 12,111 142 101 41Finland 8,225 96 38 58France 19,547 229 204 25Gambia 3,270 38 0 38Germany 60,129 703 731 -28Greece 14,115 165 338 -173Guatemala 5,974 70 0 70Hong Kong 1,254 15 233 -218Hungary 1,347 16 24 -8India 1,095 13 2 11Indonesia 11,424 134 238 -104Italy 95,277 1,114 556 558Japan 0 0 26 -26Jordan 4,534 53 46 8Latvia 2,633 31 56 -25Lebanon 3,024 35 223 -188Lithuania 11,410 133 59 75Malaysia 3,391 40 219 -179Mauritius 128 2 3 -1Mexico 24,700 289 658 -369Morocco 0 0 102 -102Netherlands (Holland) 13,009 152 102 50Netherlands Antilles 6,259 73 0 73New Caledonia 617 7 0 7New Zealand 8,587 100 153 -52Nigeria 10,300 120 120 1Norway 11,493 134 0 134Oman 0 0 42 -42Other Countries 23,165 271 20 251Panama Inc. Panama Canal Zone 2,599 30 139 -109

Rs. US $
(Amount in Thousand)
Difference
EXPORT OF GOODS BY COMMDOITY / COUNTRY AND SERVICES BY TYPE / COUNTRY
Export of Goods and Services July 2010 230
July20 10 200 920 10HS CODE-COMMODITY / COUNTRY
Paraguay 0 0 50 -50Peru 6,525 76 47 29Philippines 1,302 15 89 -74Poland 12,533 147 51 96Portugal 35,941 420 752 -332Qatar 0 0 186 -186Romania 4,047 47 12 35Russian Federation 80,606 943 814 129Saudi Arabia 31,167 365 161 204Senegal .. .. 0 ..Serbia 0 0 7 -7Singapore 0 0 11 -11Slovenia 0 0 51 -51South Africa 59,835 700 684 16South Korea 22,477 263 292 -30Spain 87,908 1,028 884 144Sri Lanka 49,739 582 283 299St. Vincent 0 0 37 -37Sweden 0 0 49 -49Switzerland 4,274 50 0 50Thailand 9,300 109 0 109Tunisia 0 0 94 -94Turkey 82,248 962 739 222U. A. E. Abudhabi 8,787 103 56 46U. A. E. Dubai 12,007 140 366 -226U. A. E. Sharjah 6,455 75 43 33U. K. 203,623 2,381 497 1,884U. S. A. 101,476 1,187 1,347 -160Ukraine 63,883 747 484 264Uruguay 10,682 125 0 125Venezuela 25,400 297 381 -84Viet Nam 3,812 45 62 -17Zimbabwe 854 10 0 10Woven Cotton Fabrics, Cotton less than 85% Wt -4,54520,40315,8581,355,8895211-Algeria 1,876 22 176 -154Australia 126 1 .. 1Bangladesh 169,611 1,984 3,858 -1,874Belgium 62,880 735 262 473Bolivia 9,964 117 0 117Brunei 4,343 51 0 51Cambodia Kampuchea 303 4 0 4Cameroon 0 0 11 -11Canada 3,327 39 0 39Chile 11,029 129 198 -69China 19,727 231 338 -108Colombia 0 0 288 -288Ecuador 0 0 127 -127Egypt 8,741 102 346 -244Finland 4,969 58 0 58France 11,876 139 59 80Germany 97,005 1,135 138 997Gibraltar 1,984 23 0 23Greece 0 0 8 -8Hong Kong 41,549 486 631 -146India 20,961 245 997 -752Indonesia 26,108 305 78 228Iran 0 0 145 -145Italy 46,673 546 1,263 -717Japan 0 0 108 -108Jordan 1,462 17 131 -114Kenya 50 1 0 1Malaysia 9,178 107 45 63Maldives 3,778 44 0 44Mauritius 554 6 0 6Mexico 1,388 16 0 16Morocco 0 0 124 -124

Rs. US $
(Amount in Thousand)
Difference
EXPORT OF GOODS BY COMMDOITY / COUNTRY AND SERVICES BY TYPE / COUNTRY
231 State Bank of Pakistan
July20 10 200 920 10HS CODE-COMMODITY / COUNTRY
Netherlands (Holland) 6,364 74 21 53Nicaragua 21,041 246 273 -26Niger 0 0 35 -35Nigeria 0 0 191 -191Norway 3,636 43 150 -108Other Countries 1,153 13 16 -3Peru 20,929 245 168 77Philippines 15,659 183 150 33Poland 9,523 111 0 111Portugal 22,363 262 202 60Russian Federation 62,864 735 41 694Saudi Arabia 8,309 97 213 -116Serbia 0 0 17 -17Singapore 0 0 20 -20South Africa 6,829 80 225 -145South Korea 19,249 225 136 90Spain 52,181 610 199 411Sri Lanka 48,777 570 596 -26Sudan 0 0 17 -17Sweden 3,533 41 0 41Switzerland 0 0 11 -11Syrian Arab Republic 14,144 165 73 92Thailand 11,682 137 57 79Togo 0 0 34 -34Tunisia 11,936 140 32 107Turkey 266,811 3,120 1,642 1,479U. A. E. Dubai 75,958 888 4,987 -4,098U. A. E. Sharjah 8,979 105 76 29U. K. 11,272 132 142 -10U. S. A. 72,577 849 1,044 -195Viet Nam 20,656 242 192 50Western Samoa 0 0 112 -112Woven Cotton Fabrics NES 3,01118,40121,4121,830,7725212-Afghanistan 0 0 41 -41Algeria 0 0 82 -82Antigua & Barbuda 4,437 52 0 52Argentina 22,234 260 0 260Australia 896 10 34 -23Austria 145 2 0 2Bahrain 0 0 20 -20Bangladesh 439,605 5,141 518 4,623Barbados 0 0 55 -55Belgium 11,870 139 640 -501Benin ( Dahomey ) 0 0 57 -57Brazil 49,685 581 174 407Bulgaria 510 6 0 6Cambodia Kampuchea 6,470 76 0 76Canada 18,445 216 23 193Chile 7,399 87 131 -45China 138,386 1,618 1,814 -196Colombia 1,002 12 20 -8Costa Rica 13,909 163 142 21Croatia 0 0 38 -38Cyprus 0 0 25 -25Czech Republic 7,102 83 0 83Dominican Republic 0 0 116 -116Egypt 4,878 57 206 -149El Salvador 0 0 98 -98Estonia 4,350 51 0 51Falkland Islands 0 0 47 -47Finland 20,361 238 321 -83France 18,690 219 281 -62Germany 44,977 526 154 372Greece 7,313 86 191 -105Guatemala 5,382 63 0 63Guinea 0 0 29 -29

Rs. US $
(Amount in Thousand)
Difference
EXPORT OF GOODS BY COMMDOITY / COUNTRY AND SERVICES BY TYPE / COUNTRY
Export of Goods and Services July 2010 232
July20 10 200 920 10HS CODE-COMMODITY / COUNTRY
Haiti 3,767 44 0 44Hong Kong 21,267 249 1,237 -988Hungary 2,204 26 33 -7India 23,369 273 286 -13Indonesia 544 6 36 -30Ireland 0 0 13 -13Italy 159,632 1,867 2,379 -512Ivory Coast 4,547 53 0 53Japan 16,346 191 187 4Jordan 0 0 42 -42Kenya 0 0 37 -37Kuwait 5,390 63 3 60Latvia 0 0 70 -70Lithuania 25,869 303 0 303Madagascar 6,155 72 0 72Mauritius 4,620 54 69 -15Mexico 19,481 228 335 -107Morocco 2,312 27 0 27Mozambique 0 0 33 -33Netherlands (Holland) 30,395 355 265 91New Zealand 2,505 29 50 -20Nigeria 6,593 77 131 -54Oman 12,218 143 16 127Other Countries 0 0 527 -527Panama Inc. Panama Canal Zone 8,549 100 0 100Paraguay 0 0 53 -53Peru 5,251 61 0 61Poland 10,898 127 0 127Portugal 51,485 602 587 16Romania 681 8 0 8Russian Federation 0 0 9 -9Saudi Arabia 4,189 49 79 -30Singapore 801 9 36 -26Slovenia 9,673 113 109 4South Africa 22,132 259 335 -76South Korea 27,222 318 328 -9Spain 135,600 1,586 561 1,025Sri Lanka 52,521 614 698 -84Sweden 961 11 10 1Switzerland 2,920 34 95 -61Tanzania 0 0 50 -50Tunisia 4,998 58 0 58Turkey 188,297 2,202 2,647 -445U. A. E. Ajman 0 0 25 -25U. A. E. Dubai 12,548 147 51 96U. A. E. Sharjah 0 0 6 -6U. K. 41,417 484 467 18U. S. A. 63,506 743 1,088 -345Ukraine 5,891 69 66 3Viet Nam 5,973 70 96 -26True Hemp, not Spun, Tow and Waste of Hemp 390393,3305302-South Africa 3,330 39 0 39Jute and other Textile Bast Fibers NES 136191,6265303-Other Countries 802 9 0 9South Korea 825 10 0 10U. S. A. 0 0 6 -6Yarn of Vegetable Textile Fibers NES, Paper 16010126122,2765308-Bangladesh 5,452 64 42 21China 15,594 182 59 123Germany 1,230 14 0 14Woven Fabrics of Jute or Other Textile Bast 25112237331,8605310-China 82 1 0 1Egypt 8,330 97 66 32Germany 640 7 0 7Iran 14,088 165 29 136

Rs. US $
(Amount in Thousand)
Difference
EXPORT OF GOODS BY COMMDOITY / COUNTRY AND SERVICES BY TYPE / COUNTRY
233 State Bank of Pakistan
July20 10 200 920 10HS CODE-COMMODITY / COUNTRY
Italy 3,701 43 0 43Switzerland 1,762 21 0 21U. K. 3,258 38 27 11Woven Fabrics of other Vegetable Textile Fibers -5050005311-Spain 0 0 50 -50Synthetic Filament Yarn Not Sewing Thread, Not 4916121017,9505402-Portugal 4,767 56 0 56Saudi Arabia 3,001 35 0 35South Korea 0 0 6 -6Switzerland 0 0 26 -26Turkey 2,524 30 42 -13U. A. E. Dubai 0 0 86 -86U. S. A. 7,658 90 0 90Artificial Filament Yarn Not Sewing Thread, Not -25765039333,5755403-Australia 0 0 75 -75Bangladesh 0 0 97 -97China 27,530 322 69 253Hong Kong 4,285 50 165 -115Indonesia 1,760 21 0 21Poland 0 0 20 -20Turkey 0 0 185 -185U. S. A. 0 0 39 -39Synthetic Monofilament of 67 Decitex or More 4043415404-U. S. A. 341 4 0 4Manmade Filament Yarn Not Sewing Thread, -209209005406-Iran 0 0 206 -206Malaysia 0 0 3 -3Woven Fabric of Synthetic Filament Yarn -1823,2303,048260,6015407-Australia 0 0 39 -39Bangladesh 7,539 88 309 -221Belgium 14,974 175 134 42China 4,959 58 66 -8France 9,289 109 0 109Germany 15,850 185 213 -28Hong Kong 0 0 66 -66Iceland 54 1 0 1Ireland 1,303 15 0 15Italy 22,803 267 0 267Kenya 2,858 33 0 33Libya 1,219 14 0 14Malaysia 243 3 0 3Netherlands (Holland) 21,444 251 247 4New Zealand 128 1 0 1Nigeria 3,437 40 0 40Portugal 0 0 111 -111Qatar 0 0 20 -20Saudi Arabia 2,816 33 0 33South Africa 971 11 0 11South Korea 50,548 591 280 312Spain 4,767 56 162 -106Sri Lanka 0 0 120 -120Sudan 333 4 207 -203Switzerland 7,456 87 0 87Turkey 54,602 639 518 121U. A. E. Dubai 1,862 22 178 -156U. K. 28,045 328 436 -108U. S. A. 3,100 36 125 -89Synthetic Filament Tow 119011910,1855501-Brunei 504 6 0 6Netherlands (Holland) 244 3 0 3Other Countries 4,704 55 0 55South Africa 129 2 0 2U. A. E. Sharjah 4,606 54 0 54

Rs. US $
(Amount in Thousand)
Difference
EXPORT OF GOODS BY COMMDOITY / COUNTRY AND SERVICES BY TYPE / COUNTRY
Export of Goods and Services July 2010 234
July20 10 200 920 10HS CODE-COMMODITY / COUNTRY
Artificial Filament Tow 500504,2755502-Niger 4,275 50 0 50Synthetic Staple Fibers, Not Carded, Combed etc. -33005503-U. S. A. 0 0 3 -3Artificial Staple Fibers, Not Carded, Combed etc. 11201129,5545504-China 3,609 42 0 42Turkey 5,945 70 0 70Waste of Manmade Fibers Including Noils etc. 516574,8815505-China 940 11 0 11India 1,382 16 0 16Singapore 1,341 16 0 16Slovenia 1,220 14 0 14U. S. A. 0 0 6 -6Sewing Thread, Manmade Staple Fibre 119011910,1885508-Spain 5,905 69 0 69U. A. E. Sharjah 4,283 50 0 50Yarn Not for Sewing Thread, Synthetic Staple 3890794580,8255509-Andorra 0 0 63 -63Bangladesh 21,127 247 71 176Canada 318 4 0 4China 0 0 122 -122Hong Kong 0 0 68 -68Italy 0 0 164 -164Peru 10,123 118 0 118Portugal 3,982 47 79 -33South Africa 2,565 30 166 -136South Korea 4,822 56 34 22Sri Lanka 5,525 65 68 -3Turkey 22,495 263 33 230U. A. E. Dubai 8,546 100 30 70U. K. 0 0 4 -4U. S. A. 0 0 4 -4Zimbabwe 1,322 15 0 15Yarn (Not Sew Thread), Art Staple Fib, Not 24927552444,7715510-Argentina 0 0 11 -11Brazil 0 0 38 -38Mexico 1,597 19 0 19Portugal 0 0 69 -69Russian Federation 5,138 60 26 35Spain 30,976 362 0 362Turkey 5,726 67 0 67U. S. A. 1,334 16 131 -116Yarn (No SewingThread), Manmade Staple -23348124821,2035511-Belgium 21,203 248 0 248China 0 0 160 -160Hong Kong 0 0 151 -151Indonesia 0 0 26 -26Italy 0 0 130 -130Spain 0 0 14 -14Woven Fabrics of Synthetic Staple Fibres 1,5242091,733148,1555512-Belgium 0 0 7 -7Benin ( Dahomey ) 19,415 227 0 227Egypt 7,662 90 13 76Germany 0 0 31 -31Hong Kong 0 0 25 -25Libya 7,854 92 0 92Other Countries 5,724 67 0 67Saudi Arabia 14,511 170 0 170Sudan 8,841 103 0 103U. A. E. Abudhabi 21,226 248 0 248U. A. E. Dubai 35,512 415 106 310U. S. A. 14,101 165 27 138Uruguay 13,309 156 0 156

Rs. US $
(Amount in Thousand)
Difference
EXPORT OF GOODS BY COMMDOITY / COUNTRY AND SERVICES BY TYPE / COUNTRY
235 State Bank of Pakistan
July20 10 200 920 10HS CODE-COMMODITY / COUNTRY
Woven Fabrics of Synthetic Staple Fibres 10,33022,92833,2582,843,6735513-Algeria 4,270 50 63 -13Antigua & Barbuda 7,016 82 0 82Argentina 202,081 2,363 833 1,531Australia 7,109 83 117 -34Austria 4,157 49 7 41Bahrain 0 0 22 -22Bangladesh 21,910 256 496 -240Belgium 81,828 957 493 464Benin ( Dahomey ) 1,339 16 0 16Brazil 17,791 208 10 198Bulgaria 0 0 40 -40Cambodia Kampuchea 0 0 81 -81Cameroon 30,544 357 380 -22Canada 36,237 424 255 169Chile 163,626 1,914 903 1,010China 30,436 356 65 291Colombia 25,928 303 387 -83Croatia 4,068 48 40 7Cyprus 0 0 8 -8Czech Republic 7,861 92 0 92Denmark 0 0 13 -13Dominica 6,612 77 0 77Dominican Republic 4,198 49 0 49Ecuador 29,584 346 329 17Egypt 18,596 217 11 207Estonia 12,749 149 68 81Faeroe Islands 8,054 94 0 94Fiji 5,073 59 0 59Finland 41,845 489 359 131France 17,744 208 83 125Germany 63,205 739 913 -174Ghana 2,769 32 0 32Greece 31,219 365 542 -177Guatemala 12,540 147 0 147Haiti 51 1 51 -50Hong Kong 28,527 334 178 156Hungary 3,667 43 84 -41India 8,137 95 5 90Indonesia 52,853 618 612 6Ireland 25,585 299 52 247Italy 136,854 1,601 1,010 591Jamaica 0 0 9 -9Japan 0 0 31 -31Jordan 24,366 285 55 230Kazakhstan 0 0 15 -15Kenya 34,278 401 27 374Kuwait 10,524 123 227 -104Lebanon 19,433 227 485 -257Lithuania 9,884 116 165 -49Macedonia (FormerlyYugoslavia) 211 2 0 2Malawi 0 0 35 -35Malaysia 35,736 418 304 114Mauritius 3,401 40 0 40Mexico 107,045 1,252 1,335 -83Montserrat .. .. 0 ..Morocco 6,572 77 69 7Netherlands (Holland) 24,826 290 207 83Netherlands Antilles 8,279 97 0 97New Zealand 10,858 127 95 32Nigeria 5,660 66 246 -180Norway 3,980 47 52 -5Oman 17,012 199 57 142Other Countries 45,717 535 172 362Paraguay 19,755 231 187 44Peru 30,136 352 234 118

Rs. US $
(Amount in Thousand)
Difference
EXPORT OF GOODS BY COMMDOITY / COUNTRY AND SERVICES BY TYPE / COUNTRY
Export of Goods and Services July 2010 236
July20 10 200 920 10HS CODE-COMMODITY / COUNTRY
Philippines 4,355 51 84 -33Poland 8,238 96 39 57Portugal 23,629 276 754 -478Reunion Island 0 0 10 -10Romania 35,950 420 166 254Russian Federation 122,303 1,430 1,002 428Saudi Arabia 25,388 297 157 140Serbia 0 0 20 -20Singapore 81,308 951 63 888South Africa 202,311 2,366 1,631 736South Korea 0 0 36 -36Spain 107,718 1,260 686 574Sri Lanka 4,576 54 12 42St. Vincent 4,690 55 0 55Suriname 6,149 72 0 72Sweden 9,979 117 3 113Switzerland 7,128 83 30 53Tanzania 9,104 106 0 106Thailand 0 0 4 -4Tunisia 12,497 146 314 -168Turkey 61,338 717 556 161U. A. E. Abudhabi 14,859 174 0 174U. A. E. Dubai 33,853 396 346 50U. A. E. Sharjah 5,928 69 279 -210U. K. 190,988 2,234 1,058 1,176U. S. A. 177,551 2,077 2,040 37Ukraine 59,541 696 132 565Uruguay 37,355 437 356 81Venezuela 19,891 233 634 -402Viet Nam 3,309 39 0 39Woven Fabric, Synthetic < 85% of Fibre Mix 4371,8082,245191,9255514-Australia 0 0 16 -16Bangladesh 0 0 35 -35Cambodia Kampuchea 0 0 30 -30Canada 0 0 35 -35China 2,254 26 0 26Djibouti 1,743 20 0 20Egypt 0 0 27 -27Estonia 4,213 49 0 49Germany 26,986 316 239 76Greece 1,041 12 0 12Haiti 6,320 74 0 74Ireland 0 0 32 -32Italy 0 0 27 -27Jordan 1,079 13 0 13Lebanon 234 3 0 3Mauritius 440 5 0 5Mexico 9,803 115 643 -528Netherlands (Holland) 37,928 444 61 383New Zealand 0 0 10 -10Other Countries 11,935 140 27 112Saudi Arabia 10,194 119 100 19South Africa 126 1 58 -57South Korea 728 9 73 -65Spain 5,179 61 14 47Sri Lanka 13,181 154 84 70Thailand 0 0 35 -35Turkey 3,480 41 0 41U. A. E. Dubai 934 11 53 -42U. K. 22,134 259 .. 259U. S. A. 22,151 259 138 121Ukraine 8,756 102 0 102Viet Nam 1,088 13 70 -57Woven Fabrics of Synthetic Staple Fibers NES -51387145515-New Zealand 0 0 1 -1Saudi Arabia 714 8 12 -4

Rs. US $
(Amount in Thousand)
Difference
EXPORT OF GOODS BY COMMDOITY / COUNTRY AND SERVICES BY TYPE / COUNTRY
237 State Bank of Pakistan
July20 10 200 920 10HS CODE-COMMODITY / COUNTRY
Woven Fabrics of Artificial Staple Fibers 19951149,7775516-Benin ( Dahomey ) 0 0 27 -27Botswana 0 0 8 -8Italy 1,949 23 0 23Senegal 6,550 77 0 77U. A. E. Dubai 1,279 15 0 15U. A. E. Sharjah 0 0 61 -61Textile Wadding and Articles; Text Fiber Not 1,4547782,232190,8055601-Afghanistan 31,293 366 0 366Algeria 1,635 19 0 19Argentina 426 5 0 5Australia 1,400 16 50 -34Azerbaijan 1,837 21 0 21Brazil 5,228 61 0 61Canada 8,658 101 14 87Denmark 1,993 23 2 21Germany 3,884 45 0 45Greece 0 0 69 -69India 0 0 46 -46Ireland 0 0 38 -38Italy 17,469 204 14 191Netherlands (Holland) 269 3 0 3New Zealand 12,622 148 0 148Poland 1,853 22 0 22Russian Federation 4,942 58 0 58South Africa 855 10 0 10Spain 2,980 35 22 13Sweden 0 0 25 -25U. A. E. Dubai 182 2 14 -11U. K. 16,709 195 218 -23U. S. A. 71,749 839 266 573Ukraine 3,969 46 0 46Zimbabwe 851 10 0 10Felt, Impregnated, Coated, Covered or Lamented 230231,9565602-Sri Lanka 363 4 0 4U. K. 1,594 19 0 19Nonwovens Impregnated, Coated, Covered or 3118121218,1595603-France 0 0 71 -71Hungary 6,383 75 0 75Sweden 4,831 56 0 56U. A. E. Dubai 6,402 75 100 -25U. S. A. 0 0 10 -10Ukraine 544 6 0 6Rubber Thread and Cord, Text Covered, Textile 230231,9465604-U. A. E. Dubai 239 3 0 3U. S. A. 1,707 20 0 20Metallised Yarn and Textile Yarn -495343305605-Bangladesh 154 2 6 -4Germany 176 2 0 2Poland 0 0 .. ..Saudi Arabia 0 0 3 -3Turkey 0 0 44 -44Twine, Cordage, Rope and Cables 490494,2265607-Kuwait 4,226 49 0 49Knotted Netting of Twine, Cordage or rope of 154115513,2765608-Canada 0 0 1 -1Germany 9,162 107 0 107Viet Nam 4,114 48 0 48Articles of Yarn Stripe or the like NES 270272,3315609-U. K. 2,331 27 0 27Carpets and other Textile Floor Coverings, -6199,0208,401718,3095701-Afghanistan 4,506 53 0 53Algeria 2,380 28 84 -56

Rs. US $
(Amount in Thousand)
Difference
EXPORT OF GOODS BY COMMDOITY / COUNTRY AND SERVICES BY TYPE / COUNTRY
Export of Goods and Services July 2010 238
July20 10 200 920 10HS CODE-COMMODITY / COUNTRY
Argentina 0 0 7 -7Australia 38,797 454 197 256Austria 18,573 217 140 77Bahrain 0 0 42 -42Belgium 2,492 29 15 14Bosnia Herzegovina 114 1 0 1Botswana 4,699 55 0 55Brazil 7,995 94 32 61Canada 17,313 202 305 -103Cayman Islands 0 0 14 -14Chile 4,388 51 0 51China 1,681 20 16 4Colombia 428 5 0 5Czech Republic 148 2 0 2Denmark 1,059 12 17 -4Egypt 2,124 25 0 25Finland 106 1 0 1France 22,481 263 413 -151Germany 68,111 797 685 112Greece 8,796 103 115 -12Hong Kong 1,834 21 0 21India 2,245 26 0 26Indonesia 425 5 0 5Italy 87,971 1,029 1,539 -510Japan 13,242 155 324 -169Jordan 0 0 10 -10Kenya 364 4 0 4Kuwait 1,035 12 0 12Lebanon 151 2 12 -10Luxembourg 372 4 0 4Malaysia 1,640 19 60 -41Mauritius 87 1 0 1Mexico 9,128 107 38 68Morocco 4,953 58 0 58Mozambique 354 4 0 4Netherlands (Holland) 1,356 16 7 9New Zealand 4,551 53 100 -47Nigeria 1,141 13 0 13North Korea 0 0 5 -5Norway 5,359 63 27 35Oman 3,329 39 0 39Other Countries 969 11 0 11Peru 0 0 8 -8Qatar 0 0 .. ..Saudi Arabia 3,096 36 73 -36Singapore 11,776 138 91 47South Africa 17,141 200 366 -166South Korea 170 2 0 2Spain 9,484 111 268 -157Sri Lanka 1,091 13 88 -75St. Lucia 1,708 20 0 20Swaziland 0 0 1 -1Sweden 4,791 56 136 -80Switzerland 920 11 41 -30Thailand 108 1 6 -5Tunisia 2,631 31 40 -9Turkey 47,959 561 585 -24U. A. E. Dubai 18,190 213 52 161U. A. E. Sharjah 539 6 5 2U. K. 43,372 507 359 148U. S. A. 208,634 2,440 2,696 -256Uganda 0 0 .. ..Carpets and other Textile Floor Coverings, -58197239133,4245702-Afghanistan 3,417 40 175 -135Australia 0 0 10 -10Bahrain 1,759 21 3 18

Rs. US $
(Amount in Thousand)
Difference
EXPORT OF GOODS BY COMMDOITY / COUNTRY AND SERVICES BY TYPE / COUNTRY
239 State Bank of Pakistan
July20 10 200 920 10HS CODE-COMMODITY / COUNTRY
Belgium 1,496 18 0 18Canada 860 10 0 10Chile 2,028 24 0 24China 651 8 0 8France 395 5 15 -10Germany 0 0 .. ..Greece 2,573 30 0 30Hong Kong 1,293 15 11 4India 510 6 7 -1Iran 0 0 218 -218Italy 1,056 12 45 -32Japan 0 0 7 -7Kuwait 0 0 28 -28Malaysia 1,110 13 0 13Malta 0 0 11 -11Nepal 0 0 27 -27Nigeria 0 0 20 -20Norway 0 0 42 -42Oman 0 0 6 -6Poland 2,297 27 0 27Qatar 0 0 12 -12Saudi Arabia 0 0 28 -28Singapore 485 6 3 2South Africa 2,881 34 82 -49Spain 2,435 28 0 28Sweden 426 5 3 2Switzerland 367 4 0 4Tanzania 0 0 6 -6Turkey 0 0 80 -80U. A. E. Ajman 440 5 0 5U. A. E. Dubai 673 8 27 -19U. S. A. 6,274 73 107 -33Carpets and other Textile Floor Coverings, -1066564,8175703-Australia 596 7 52 -45Botswana 0 0 11 -11Spain 1,643 19 0 19U. K. 2,578 30 0 30U. S. A. 0 0 3 -3Carpets and other Textile Floor Coverings, Felt 2471826522,6995704-Afghanistan 22,699 265 0 265South Africa 0 0 18 -18Other Carpets and other Textile Floor Coverings 230231,9495705-Bangladesh 1,154 14 0 14Malaysia 795 9 0 9Woven Pile and Chenille Fabrics NES 9831018,6365801-Germany 0 0 3 -3Italy 3,614 42 0 42Netherlands (Holland) 5,021 59 0 59Woven Terry Fabrics and Tufted Textile Fabric -2,84515,53912,6941,085,3885802-Albania 0 0 21 -21Angola 0 0 25 -25Argentina 894 10 0 10Australia 29,425 344 214 130Bangladesh 6,460 76 0 76Belgium 2,824 33 6 27Botswana 4,273 50 33 17Brunei 799 9 0 9Bulgaria 0 0 6 -6Canada 8,111 95 313 -219Cape Verde 0 0 48 -48Chile 13,819 162 112 50China 14,762 173 553 -380Croatia 6,364 74 39 35Czech Republic 1,267 15 36 -21

Rs. US $
(Amount in Thousand)
Difference
EXPORT OF GOODS BY COMMDOITY / COUNTRY AND SERVICES BY TYPE / COUNTRY
Export of Goods and Services July 2010 240
July20 10 200 920 10HS CODE-COMMODITY / COUNTRY
Denmark 3,469 41 1 39Egypt 3,628 42 0 42Estonia 7,456 87 76 12France 12,208 143 179 -36Germany 82,231 962 506 455Ghana 0 0 4 -4Greece 1,512 18 119 -101Hong Kong 0 0 397 -397India 299 4 27 -23Ireland 12,670 148 14 134Italy 13,851 162 403 -241Jamaica 0 0 36 -36Japan 2,897 34 37 -3Jordan 1,920 22 0 22Kuwait 1,592 19 0 19Latvia 0 0 18 -18Lithuania 4,201 49 0 49Malaysia 6,224 73 15 58Morocco 0 0 77 -77Netherlands (Holland) 8,007 94 142 -48New Zealand 6,784 79 205 -125Norway 16,785 196 9 187Other Countries 0 0 142 -142Philippines 3,425 40 11 29Poland 950 11 17 -6Portugal 11,390 133 203 -70Romania 0 0 14 -14Saudi Arabia 32,049 375 103 272Singapore 11,949 140 0 140Slovak Republic 0 0 14 -14South Africa 8,298 97 139 -42Spain 11,343 133 33 99Sri Lanka 10,138 119 262 -144Sweden 4,103 48 53 -5Switzerland 85 1 34 -33Tanzania 0 0 4 -4Tunisia 1,819 21 0 21Turkey 37,547 439 192 247U. A. E. Dubai 27,097 317 441 -124U. A. E. Sharjah 0 0 60 -60U. K. 48,737 570 325 245U. S. A. 597,865 6,992 9,819 -2,827Ukraine 3,858 45 0 45Viet Nam 0 0 4 -4Gauze other than Narrow Fabrics Not Over 30 1829281,11094,9195803-Bangladesh 41,580 486 394 92Chile 4,545 53 0 53China 0 0 167 -167Georgia 0 0 104 -104Hong Kong 0 0 59 -59Italy 0 0 38 -38Japan 0 0 27 -27Turkey 0 0 53 -53U. A. E. Dubai 48,794 571 23 548U. S. A. 0 0 62 -62Tulles and other Net Fabrics 4336796,7845804-Australia 257 3 0 3China 2,585 30 4 26Hong Kong 511 6 1 5India 0 0 5 -5Namibia 1,335 16 0 16New Zealand 0 0 9 -9Qatar 0 0 8 -8South Africa 596 7 0 7Spain 0 0 5 -5Turkey 1,498 18 0 18

Rs. US $
(Amount in Thousand)
Difference
EXPORT OF GOODS BY COMMDOITY / COUNTRY AND SERVICES BY TYPE / COUNTRY
241 State Bank of Pakistan
July20 10 200 920 10HS CODE-COMMODITY / COUNTRY
U. K. 0 0 2 -2U. S. A. 0 0 3 -3Narrow Woven Fabrics Except Labels 5772760451,6075806-China 24,915 291 0 291Denmark 75 1 0 1Germany 0 0 11 -11Italy 6,703 78 0 78Netherlands (Holland) 75 1 0 1Poland 0 0 15 -15Portugal 4,813 56 0 56South Africa 3,553 42 0 42South Korea 4,297 50 0 50Sri Lanka 7,176 84 0 84Labels, Badges and Similar Type of Textiles -2341,2801,04689,4055807-Australia 753 9 5 4Austria 1,599 19 13 5Azerbaijan 0 0 1 -1Bahrain 185 2 0 2Belgium 505 6 3 3Brunei 21 .. 0 ..Canada 2,521 29 25 4Chile 358 4 1 3China 1,471 17 33 -16Croatia 20 .. 0 ..Cyprus 81 1 0 1Denmark 443 5 0 5Ecuador 0 0 2 -2Egypt 4,300 50 0 50Ethiopia 174 2 0 2Fiji 27 .. 4 -4Finland 22 .. 2 -2France 9,291 109 94 15Germany 4,279 50 45 5Greece 0 0 46 -46Guyana 589 7 0 7Hong Kong 0 0 4 -4Indonesia 88 1 0 1Iran 0 0 14 -14Ireland 201 2 1 2Italy 4,412 52 115 -63Japan 3,148 37 77 -40Kenya 351 4 0 4Lithuania 0 0 1 -1Malaysia 110 1 2 -1Morocco 0 0 281 -281Netherlands (Holland) 421 5 19 -14New Zealand 277 3 2 2Nigeria 767 9 0 9Norway 821 10 11 -2Oman 1,375 16 7 9Other Countries 0 0 6 -6Panama Inc. Panama Canal Zone 5,098 60 0 60Poland 100 1 19 -18Portugal 695 8 0 8Qatar 282 3 5 -2Serbia 87 1 0 1Singapore 245 3 21 -18South Africa 0 0 5 -5South Korea 831 10 30 -20Spain 3,367 39 5 34Sri Lanka 0 0 2 -2Sweden 300 4 2 2Switzerland 693 8 10 -2Syrian Arab Republic 2,037 24 0 24Tanzania 154 2 0 2Turkey 1,894 22 6 16

Rs. US $
(Amount in Thousand)
Difference
EXPORT OF GOODS BY COMMDOITY / COUNTRY AND SERVICES BY TYPE / COUNTRY
Export of Goods and Services July 2010 242
July20 10 200 920 10HS CODE-COMMODITY / COUNTRY
U. A. E. Dubai 775 9 51 -42U. K. 16,283 190 202 -11U. S. A. 17,800 208 109 100Uganda 154 2 0 2Braids, Ornamental Trim in Pieces Not Knitted, 342453,8105808-Australia 205 2 2 1Saudi Arabia 0 0 15 -15U. A. E. Dubai 3,053 36 26 10U. K. 552 6 0 6Woven Fabrics of Metal Thread and Metallized 584058449,9225809-Belgium 5,966 70 0 70Hong Kong 3,675 43 0 43Sweden 8,558 100 0 100U. K. 30,416 356 0 356U. S. A. 1,308 15 0 15Embroidery in the Piece, In Strips or in Motifs -47462014612,4645810-Belgium 161 2 0 2Brazil 344 4 0 4Canada 0 0 6 -6France 145 2 1 1Germany 27 .. 0 ..Italy 0 0 69 -69Japan 0 0 15 -15Mexico 1,453 17 0 17Sweden 0 0 29 -29U. A. E. Dubai 9,265 108 0 108U. K. 216 3 454 -451U. S. A. 853 10 47 -37Quilt Textile Products -9733423720,2245811-Bangladesh 366 4 0 4Germany 1,468 17 33 -16Greece 0 0 8 -8Italy 5,928 69 24 45Lithuania 0 0 90 -90Netherlands (Holland) 1,472 17 125 -108Singapore 0 0 5 -5Sweden 203 2 0 2U. K. 3,512 41 0 41U. S. A. 7,275 85 48 37Gum Covered Fabric; Tracing Cloth; Paint 2382,2942,532216,4785901-Bangladesh 2,651 31 8 23Brazil 2,732 32 0 32Canada 17,255 202 153 48Egypt 0 0 8 -8France 0 0 3 -3Germany 0 0 64 -64Italy 0 0 6 -6Kazakhstan 0 0 11 -11Kenya 0 0 10 -10Malaysia 0 0 3 -3Mexico 8,970 105 49 56Netherlands (Holland) 4,721 55 0 55Qatar 0 0 24 -24Russian Federation 0 0 33 -33Saudi Arabia 2,138 25 236 -211Singapore 0 0 14 -14South Africa 0 0 87 -87U. A. E. Abudhabi 849 10 0 10U. A. E. Dubai 5,689 67 257 -190U. K. 138,278 1,617 1,235 382U. S. A. 33,195 388 95 293Tire Cord Fabric of High Tenacity Yarn of Nylon 48616465055,5505902-Belgium 9,220 108 0 108China 14,021 164 56 108

Rs. US $
(Amount in Thousand)
Difference
EXPORT OF GOODS BY COMMDOITY / COUNTRY AND SERVICES BY TYPE / COUNTRY
243 State Bank of Pakistan
July20 10 200 920 10HS CODE-COMMODITY / COUNTRY
Colombia 10,305 121 0 121France 7,217 84 0 84Germany 4,133 48 0 48Sri Lanka 8,640 101 1 100Turkey 0 0 107 -107U. A. E. Dubai 1,223 14 0 14U. S. A. 792 9 0 9Textile Fabrics Coated, Covered or Lamented -29041512510,7025903-Australia 4,190 49 9 40Bangladesh 1,204 14 0 14Belgium 0 0 80 -80Canada 0 0 4 -4Denmark 0 0 41 -41Finland 1,639 19 0 19Germany 0 0 52 -52Kuwait 2,960 35 17 17Nigeria 0 0 120 -120Sweden 0 0 76 -76U. A. E. Sharjah 709 8 0 8U. K. 0 0 15 -15Linoleum, Floor Coverings With Coating etc. 100108555904-Saudi Arabia 855 10 0 10Textile Fabrics, Theatrical Scenery, Back-Cloths -8541,02116714,3155907-Australia 30 .. 0 ..Belgium 907 11 36 -26Canada 0 0 2 -2Czech Republic 408 5 0 5Denmark 1,186 14 0 14Germany 1,971 23 93 -70Greece 5,216 61 30 31Indonesia 0 0 1 -1Italy 1,843 22 0 22Kuwait 0 0 49 -49Netherlands (Holland) 16 .. 3 -3Philippines 0 0 1 -1Poland 756 9 0 9Russian Federation 0 0 10 -10South Africa 0 0 768 -768Spain 0 0 15 -15Sweden 638 7 0 7U. K. 43 1 2 -1U. S. A. 1,300 15 10 5Textile Wicks for Lamps etc. and Gas Mantles -1414005908-Nigeria 0 0 14 -14Textile Products and Articles for Technical uses 1168119716,8525911-Bahrain 141 2 17 -15India 2,668 31 0 31Kuwait 2,542 30 6 24Mexico 0 0 6 -6Saudi Arabia 2,963 35 16 19U. A. E. Dubai 0 0 12 -12U. K. 8,538 100 12 88U. S. A. 0 0 12 -12Pile Fabrics and Terry Fabrics Knitted or -2321319016,2626001-Dominican Republic 0 0 63 -63Germany 406 5 0 5Netherlands (Holland) 0 0 3 -3U. A. E. Dubai 0 0 16 -16U. K. 0 0 6 -6U. S. A. 15,856 185 126 59Knitted or Crocheted Fabrics of Rubber of Width 29791089,2616002-Australia 1,161 14 0 14Canada 287 3 0 3Egypt 0 0 41 -41

Rs. US $
(Amount in Thousand)
Difference
EXPORT OF GOODS BY COMMDOITY / COUNTRY AND SERVICES BY TYPE / COUNTRY
Export of Goods and Services July 2010 244
July20 10 200 920 10HS CODE-COMMODITY / COUNTRY
Georgia 0 0 14 -14Romania 0 0 6 -6Russian Federation 0 0 7 -7U. K. 1,502 18 0 18U. S. A. 6,311 74 11 63Knitted or Crocheted fabrics of Rubber width 5054546004-Sri Lanka 454 5 0 5Warp Knit fabrics Not of Rubber and Pile 11341753045,3346005-Hungary 4,065 48 0 48Spain 6,912 81 0 81Sweden 0 0 12 -12Trinidad and Tobago 5,953 70 0 70U. A. E. Dubai 24,984 292 0 292U. A. E. Sharjah 3,420 40 0 40U. K. 0 0 73 -73U. S. A. 0 0 333 -333Other knitted or crocheted fabrics 1,6544,3636,017514,5066006-Australia 0 0 1 -1Bahrain 0 0 128 -128Bangladesh 21,896 256 588 -332Belgium 2,424 28 6 22Bermuda 0 0 77 -77Canada 11,556 135 0 135China 1,465 17 0 17Cyprus 0 0 37 -37Denmark 31 .. 0 ..Djibouti 1,619 19 58 -39Ethiopia 18 .. 0 ..France 2,563 30 5 25Germany 3,134 37 101 -65Guatemala 70,429 824 186 637Ireland 1,803 21 0 21Italy 31,526 369 187 182Jamaica 3,973 46 0 46Japan 2,162 25 0 25Jordan 80,068 936 0 936Netherlands (Holland) 0 0 98 -98Oman 0 0 2 -2Panama Inc. Panama Canal Zone 367 4 0 4Poland 0 0 161 -161Qatar 471 6 0 6Russian Federation 714 8 0 8Saudi Arabia 6,840 80 67 13South Africa 0 0 11 -11Spain 8,587 100 441 -340Sri Lanka 79,554 930 586 344U. A. E. Dubai 20,541 240 80 160U. K. 14,132 165 65 100U. S. A. 148,634 1,738 1,479 259Gents Overcoats, Car-Coats, Caps, Cloaks and -4891,14265355,8236101-Belgium 0 0 21 -21Canada 1,929 23 26 -3France 1,941 23 0 23Germany 0 0 14 -14Ireland 1,092 13 0 13Italy .. .. 0 ..Japan 0 0 7 -7Kenya 0 0 7 -7Libya 0 0 41 -41Malaysia 1,010 12 21 -9Netherlands (Holland) 10,935 128 139 -11South Africa 2,453 29 0 29Spain 3,234 38 77 -39Sweden 128 2 0 2U. A. E. Abudhabi 0 0 3 -3

Rs. US $
(Amount in Thousand)
Difference
EXPORT OF GOODS BY COMMDOITY / COUNTRY AND SERVICES BY TYPE / COUNTRY
245 State Bank of Pakistan
July20 10 200 920 10HS CODE-COMMODITY / COUNTRY
U. K. 1,861 22 120 -98U. S. A. 31,238 365 665 -299Ladies Overcoats, Car-Coats, Caps, Cloaks and 3385889176,2216102-Afghanistan 214 3 65 -62Antigua & Barbuda 0 0 62 -62Bahrain 0 0 7 -7Canada 7,435 87 0 87Germany 581 7 10 -4Iran 0 0 2 -2Italy 86 1 0 1Mozambique 851 10 0 10Nepal 736 9 0 9Qatar 2,386 28 0 28South Africa 1,786 21 20 1Spain 2,989 35 0 35Sri Lanka 352 4 0 4U. A. E. Dubai 0 0 15 -15U. K. 572 7 56 -49U. S. A. 57,382 671 622 49Uganda 852 10 0 10Gents Suits, Ensembles, Jackets etc. Kn/Cr 2,68319,24821,9311,875,1856103-Australia 1,358 16 5 11Austria 1,875 22 16 6Bahrain 692 8 5 3Belgium 89,297 1,044 1,420 -376Botswana 206 2 39 -37Brazil 1,167 14 0 14Canada 36,761 430 435 -5Chile 0 0 4 -4China 19,606 229 0 229Czech Republic 0 0 3 -3Egypt 0 0 72 -72Finland 14,025 164 142 22France 46,630 545 171 374Germany 25,948 303 437 -134Greece 7 .. 131 -131Hong Kong 22,411 262 76 186Hungary 873 10 0 10India 387 5 0 5Indonesia 519 6 0 6Ireland 1,609 19 19 -1Italy 17,570 205 132 74Japan 3,843 45 0 45Lebanon 594 7 16 -9Libya 5,032 59 0 59Malaysia 0 0 2 -2Mexico 14 .. 0 ..Netherlands (Holland) 7,746 91 266 -175New Zealand 677 8 0 8North Korea 181 2 0 2Norway 8,251 96 26 70Other Countries 0 0 .. ..Portugal 1,422 17 32 -16Qatar 0 0 9 -9Romania 0 0 .. ..Russian Federation 0 0 17 -17Saudi Arabia 1,136 13 32 -18Singapore 17 .. 8 -7Slovak Republic 0 0 174 -174South Africa 0 0 1 -1South Korea 14,688 172 3 169Spain 90,997 1,064 397 667Swaziland 8,674 101 0 101Sweden 153,224 1,792 38 1,754Switzerland 168 2 17 -15U. A. E. Abudhabi 341 4 0 4

Rs. US $
(Amount in Thousand)
Difference
EXPORT OF GOODS BY COMMDOITY / COUNTRY AND SERVICES BY TYPE / COUNTRY
Export of Goods and Services July 2010 246
July20 10 200 920 10HS CODE-COMMODITY / COUNTRY
U. A. E. Dubai 7,029 82 34 48U. K. 169,017 1,977 1,771 206U. S. A. 1,119,641 13,095 13,298 -203Uganda 1,303 15 0 15Zimbabwe 248 3 0 3Ladies Suits, Ensembles etc. Kn/Cr 3795,7496,128523,9256104-Australia 0 0 7 -7Austria 1,004 12 42 -30Belgium 220 3 19 -17Canada 1,054 12 89 -77Chile 0 0 26 -26Finland 5,199 61 78 -17France 19,609 229 24 205Germany 31,695 371 482 -111Greece 0 0 9 -9India 375 4 3 1Ireland 393 5 0 5Japan 446 5 0 5Kuwait 1,213 14 0 14Kyrgyzstan 0 0 .. ..Malaysia 1,470 17 21 -4Netherlands (Holland) 1,750 20 399 -378New Zealand 0 0 8 -8Norway 8,582 100 68 32Other Countries 0 0 4 -4Poland 4,181 49 0 49Russian Federation 254 3 0 3Saudi Arabia 157 2 0 2South Africa 7,213 84 0 84Spain 4,929 58 295 -237Swaziland 308 4 28 -25Sweden 11,119 130 104 26Switzerland 1,603 19 21 -2U. A. E. Dubai 11,514 135 14 120U. A. E. Ummal Quwain 488 6 0 6U. K. 113,616 1,329 680 649U. S. A. 295,531 3,456 3,327 130Gents Shirts, Knitted or Crocheted 4,99039,03544,0253,764,2666105-Aruba 0 0 6 -6Australia 1,706 20 51 -31Bangladesh 0 0 198 -198Belgium 80,440 941 194 746Botswana 869 10 81 -70Brazil 12,650 148 0 148Canada 44,506 521 650 -129Chile 8,590 100 0 100China 6,484 76 0 76Costa Rica 0 0 9 -9Czech Republic 579 7 0 7Denmark 5,047 59 55 4Dominican Republic 0 0 28 -28Ethiopia 3,047 36 0 36Finland 24,697 289 148 141France 48,121 563 200 363Germany 88,617 1,036 459 578Greece 2,142 25 56 -31Hong Kong 9,644 113 50 62Hungary 0 0 19 -19India 5,019 59 0 59Ireland 3,690 43 49 -6Italy 150,788 1,764 305 1,459Jamaica 0 0 10 -10Japan 19,802 232 54 178Kenya 0 0 9 -9Kuwait 0 0 34 -34Mexico 15 .. 27 -27

Rs. US $
(Amount in Thousand)
Difference
EXPORT OF GOODS BY COMMDOITY / COUNTRY AND SERVICES BY TYPE / COUNTRY
247 State Bank of Pakistan
July20 10 200 920 10HS CODE-COMMODITY / COUNTRY
Netherlands (Holland) 14,442 169 686 -517Nigeria 10,321 121 20 101Norway 596 7 76 -69Other Countries 287 3 0 3Panama Inc. Panama Canal Zone 454 5 50 -45Paraguay 512 6 0 6Philippines 0 0 1 -1Poland 0 0 64 -64Qatar 0 0 8 -8Russian Federation 124 1 34 -32Saudi Arabia 7,631 89 0 89Senegal 425 5 0 5Singapore 0 0 1 -1South Africa 4,772 56 9 47South Korea 4,168 49 67 -18Spain 44,731 523 1,591 -1,068Sri Lanka 120 1 0 1Swaziland 12,098 141 75 67Sweden 3,079 36 37 -1Switzerland 2,526 30 8 21Thailand 0 0 30 -30Turkey 4,970 58 4 55Tuvalu 2,103 25 0 25U. A. E. Abudhabi 272 3 0 3U. A. E. Ajman 1,394 16 0 16U. A. E. Dubai 1,469 17 198 -181U. A. E. Sharjah 14,689 172 0 172U. K. 621,838 7,273 5,115 2,158U. S. A. 2,494,796 29,178 28,268 910Western Samoa 0 0 1 -1Gents Blouses and Shirts Kn/Cr -2,3315,4273,096264,6986106-Belgium 0 0 27 -27Canada 3,418 40 51 -11Denmark 1,001 12 0 12Finland 5,965 70 30 39France 355 4 0 4Germany 1,273 15 67 -52Greece 5 .. 0 ..Hong Kong 54 1 7 -6Hungary 0 0 2 -2Ireland 0 0 6 -6Italy 3,392 40 20 20Malaysia 2,305 27 42 -15Mexico 0 0 27 -27Netherlands (Holland) 13,682 160 974 -814Saudi Arabia 2,206 26 1 25Spain 0 0 249 -249Sweden 0 0 27 -27Switzerland 0 0 4 -4U. A. E. Dubai 2,867 34 0 34U. K. 57,735 675 544 131U. S. A. 170,441 1,993 3,348 -1,355Gents Underpants, Briefs, Nightshirts etc. Kn/Cr -2,5737,1824,609394,0466107-Bangladesh 0 0 7 -7Belgium 15,513 181 177 5Canada 7,633 89 52 37China 0 0 103 -103Denmark 1,020 12 22 -10Finland 8,328 97 230 -132France 17,711 207 526 -319Germany 10,653 125 693 -569Greece 3,673 43 115 -72Hungary 0 0 18 -18Ireland 13,031 152 579 -426Italy 39,544 462 752 -290Kuwait 0 0 89 -89

Rs. US $
(Amount in Thousand)
Difference
EXPORT OF GOODS BY COMMDOITY / COUNTRY AND SERVICES BY TYPE / COUNTRY
Export of Goods and Services July 2010 248
July20 10 200 920 10HS CODE-COMMODITY / COUNTRY
Malaysia 871 10 1 9Netherlands (Holland) 3,856 45 192 -147Poland 0 0 31 -31Portugal 0 0 56 -56Russian Federation 0 0 15 -15Saudi Arabia 0 0 9 -9Spain 99,188 1,160 1,645 -485Sweden 0 0 143 -143Switzerland 2,727 32 0 32Turkey 8,927 104 68 36U. A. E. Dubai 633 7 11 -3U. K. 31,752 371 515 -144U. S. A. 128,988 1,509 1,132 376Ladies Slips, Petticoats, Briefs, Paints etc. Kn/Cr 7101,6012,311197,6096108-Canada 11,705 137 0 137Finland 0 0 143 -143France 5,561 65 0 65Germany 12,111 142 23 119Hong Kong 35 .. 0 ..India 0 0 12 -12Italy 0 0 23 -23Mexico 10,173 119 0 119Netherlands (Holland) 0 0 16 -16Serbia 1,710 20 0 20Spain 3,085 36 0 36U. A. E. Abudhabi 165 2 0 2U. A. E. Dubai 0 0 14 -14U. K. 0 0 59 -59U. S. A. 153,063 1,790 1,306 484Uganda 0 0 5 -5T-Shirts, Singlets and other Vests Kn/Cr -1,77117,71715,9461,363,4346109-Angola 3,221 38 268 -231Australia 8,360 98 69 28Austria 1,751 20 0 20Bahrain 0 0 30 -30Bangladesh 0 0 6 -6Belgium 11,430 134 19 115Cambodia Kampuchea 1,707 20 22 -2Canada 11,229 131 226 -95Chile 15,310 179 212 -32Congo 18,913 221 172 49Croatia 0 0 .. ..Denmark 5,431 64 34 29Finland 3,062 36 27 9France 151,643 1,774 617 1,157Germany 34,511 404 367 37Greece 125 1 0 1Guinea 4,273 50 30 20Honduras 6,424 75 70 5Hong Kong 9,265 108 660 -551Hungary 1,399 16 9 7India 2,590 30 16 14Ireland 3,483 41 71 -30Italy 1,720 20 95 -75Jamaica 1,022 12 0 12Jordan 0 0 53 -53Kenya 17,507 205 150 55Kuwait 0 0 2 -2Lebanon 2,988 35 0 35Malawi 3,915 46 0 46Malaysia 0 0 8 -8Mauritius 0 0 81 -81Mexico 9,755 114 0 114Mozambique 4,688 55 119 -64Netherlands (Holland) 9,233 108 400 -292New Zealand 2,424 28 16 13

Rs. US $
(Amount in Thousand)
Difference
EXPORT OF GOODS BY COMMDOITY / COUNTRY AND SERVICES BY TYPE / COUNTRY
249 State Bank of Pakistan
July20 10 200 920 10HS CODE-COMMODITY / COUNTRY
Niger 10,023 117 90 27Norway 210 2 0 2Philippines 0 0 97 -97Romania 770 9 12 -3Saudi Arabia 5,368 63 12 51Sierra Leone 1,536 18 25 -7Singapore 29,448 344 342 2South Africa 8,547 100 84 16South Korea 256 3 18 -15Spain 766 9 108 -99Sweden 3,556 42 85 -44Tanzania 0 0 104 -104Turkey 11,367 133 0 133U. A. E. Abudhabi 2,135 25 0 25U. A. E. Dubai 68,370 800 351 449U. A. E. Sharjah 2,135 25 50 -25U. K. 123,841 1,448 3,420 -1,972U. S. A. 740,376 8,659 8,905 -246Uganda 1,710 20 9 11Yemen Arab Republic 10 .. 156 -156Zambia 5,634 66 0 66Sweaters, Pullovers, Vests etc. Kn/Cr 6656,0956,760578,0426110-Belgium 18,600 218 293 -76Canada 1,010 12 17 -5Croatia 0 0 1 -1Czech Republic 0 0 5 -5Dominican Republic 0 0 60 -60Finland 262 3 0 3France 4,575 54 68 -14Gambia 0 0 15 -15Germany 1,167 14 69 -56Ireland 7,349 86 0 86Italy 0 0 78 -78Japan 145 2 0 2Libya 0 0 7 -7Netherlands (Holland) 1,769 21 14 6Oman 191 2 0 2Panama Inc. Panama Canal Zone 0 0 3 -3Saudi Arabia 0 0 6 -6South Africa 2,652 31 0 31South Korea 0 0 2 -2Sweden 0 0 156 -156U. A. E. Dubai 77 1 62 -61U. A. E. Fujairah 1,295 15 0 15U. K. 69,314 811 742 68U. S. A. 469,636 5,493 4,497 995Babies' Garments and Accessories Kn/Cr 5346561,190101,7646111-Algeria 47,529 556 0 556Belgium 0 0 11 -11France 1,096 13 9 4Ireland 4,054 47 0 47Netherlands (Holland) 4,175 49 96 -47Oman 0 0 5 -5Qatar 0 0 13 -13Singapore 0 0 3 -3Spain 5,875 69 0 69Syrian Arab Republic 0 0 2 -2Turkey 850 10 10 ..U. K. 6,485 76 428 -353U. S. A. 31,700 371 79 292Track Suits, Ski Suits and Swimwear Kn/Cr 1802,8162,996256,1726112-Argentina 1,697 20 0 20Australia 4,974 58 19 40Austria 0 0 21 -21Bahrain 0 0 2 -2

Rs. US $
(Amount in Thousand)
Difference
EXPORT OF GOODS BY COMMDOITY / COUNTRY AND SERVICES BY TYPE / COUNTRY
Export of Goods and Services July 2010 250
July20 10 200 920 10HS CODE-COMMODITY / COUNTRY
Belgium 2,358 28 96 -69Bermuda 644 8 1 7Brazil 5,313 62 28 34Canada 2,678 31 44 -12Chile 1,548 18 0 18Costa Rica 779 9 0 9Croatia 3,395 40 0 40Czech Republic 855 10 0 10Denmark 1,122 13 13 ..Ecuador 0 0 17 -17Egypt 19 .. 31 -31Finland 1,245 15 91 -76France 34,636 405 56 349Georgia 0 0 4 -4Germany 34,849 408 730 -323Greece 4,395 51 20 31Hong Kong 135 2 0 2India 0 0 4 -4Ireland 709 8 49 -41Italy 23,417 274 55 219Ivory Coast 0 0 2 -2Japan 33 .. 0 ..Jordan 426 5 0 5Kenya 0 0 1 -1Kuwait 0 0 11 -11Lebanon 2,667 31 25 6Luxembourg 135 2 4 -3Malaysia 0 0 1 -1Malta 36 .. 0 ..Netherlands (Holland) 10,007 117 182 -65New Zealand 1,885 22 1 22Nigeria 850 10 0 10Norway 78 1 16 -15Other Countries 0 0 1 -1Peru 445 5 0 5Poland 0 0 69 -69Portugal 501 6 0 6Qatar 0 0 .. ..Russian Federation 7,583 89 41 48Serbia 0 0 112 -112Singapore 6,286 74 0 74Slovak Republic 1,844 22 0 22South Africa 11,150 130 4 127Spain 5,742 67 31 36Sweden 0 0 13 -13Switzerland 614 7 4 3Syrian Arab Republic 1,148 13 0 13Tanzania 171 2 0 2Turkey 0 0 64 -64U. A. E. Dubai 272 3 1 2U. A. E. Sharjah 0 0 3 -3U. K. 48,524 568 643 -76U. S. A. 31,006 363 306 57Garments, Made-ups Kn/Cr etc. of Rubber or 2,91753,03955,9564,784,3916113-Algeria 0 0 269 -269Angola 1,724 20 0 20Argentina 0 0 5 -5Australia 17,624 206 146 60Austria 1,293 15 170 -155Bahamas 0 0 34 -34Bahrain 428 5 0 5Bangladesh 8,584 100 5 95Belgium 128,568 1,504 2,606 -1,102Benin ( Dahomey ) 0 0 12 -12Bermuda 152 2 6 -5Bolivia 2,788 33 0 33

Rs. US $
(Amount in Thousand)
Difference
EXPORT OF GOODS BY COMMDOITY / COUNTRY AND SERVICES BY TYPE / COUNTRY
251 State Bank of Pakistan
July20 10 200 920 10HS CODE-COMMODITY / COUNTRY
Botswana 1,122 13 0 13Brazil 16,249 190 94 96Bulgaria 0 0 3 -3Canada 90,144 1,054 528 526Chile 0 0 1 -1China 3,222 38 13 25Colombia 0 0 131 -131Croatia 0 0 2 -2Cyprus 0 0 7 -7Czech Republic 3,824 45 31 13Denmark 18,817 220 226 -6Dominican Republic 0 0 48 -48Estonia 0 0 8 -8Finland 4,483 52 46 6France 159,395 1,864 4,190 -2,325Gambia 5,122 60 10 50Germany 684,044 8,000 9,437 -1,437Ghana 169 2 0 2Greece 8,981 105 110 -5Greenland 0 0 170 -170Hong Kong 1,176 14 574 -560Hungary 307 4 8 -4Iceland 0 0 2 -2India 0 0 3 -3Indonesia 2,714 32 1 31Ireland 44,685 523 111 411Italy 34,618 405 1,171 -766Japan 7,510 88 115 -27Jordan 348 4 0 4Kenya 3,420 40 10 30Kuwait 285 3 7 -3Lebanon 692 8 9 -1Libya 1,075 13 0 13Malaysia 955 11 11 ..Mexico 7,431 87 7 80Morocco 0 0 76 -76Namibia 1,383 16 0 16Netherlands (Holland) 135,157 1,581 1,545 36New Zealand 346 4 17 -12Nigeria 32,876 384 239 145Norway 16,405 192 127 65Oman 0 0 4 -4Other Countries 6,408 75 0 75Panama Inc. Panama Canal Zone 509 6 5 1Philippines 1,188 14 8 6Poland 3,684 43 24 20Portugal 615 7 54 -46Qatar 906 11 0 11Russian Federation 1,857 22 40 -18Saudi Arabia 13,196 154 161 -7Singapore 1,664 19 29 -10Slovak Republic 369 4 1 4Slovenia 5,074 59 0 59South Africa 337 4 10 -6South Korea 400 5 13 -8Spain 165,203 1,932 2,794 -862Sri Lanka 2,269 27 84 -57Sweden 133,758 1,564 609 955Switzerland 28,121 329 233 96Syrian Arab Republic 0 0 43 -43Togo 0 0 164 -164Turkey 72,595 849 233 616U. A. E. Ajman 0 0 6 -6U. A. E. Dubai 19,369 227 289 -63U. A. E. Sharjah 501 6 50 -44U. K. 249,647 2,920 2,525 395

Rs. US $
(Amount in Thousand)
Difference
EXPORT OF GOODS BY COMMDOITY / COUNTRY AND SERVICES BY TYPE / COUNTRY
Export of Goods and Services July 2010 252
July20 10 200 920 10HS CODE-COMMODITY / COUNTRY
U. S. A. 2,628,605 30,743 23,255 7,488Venezuela 0 0 34 -34Viet Nam 0 0 30 -30Garments NES Knitted or Crocheted 4,4398,83713,2761,135,1436114-Australia 12,191 143 0 143Belgium 7,019 82 222 -140Bosnia Herzegovina 218 3 0 3Botswana 0 0 7 -7Canada 15,249 178 136 43Colombia 0 0 2 -2Czech Republic 0 0 7 -7Denmark 0 0 5 -5Finland 5,683 66 5 62France 28,741 336 229 107Gambia 654 8 0 8Germany 106,309 1,243 854 389Ghana 0 0 5 -5Hong Kong 15,731 184 37 147Hungary 556 7 274 -267Ireland 1,312 15 0 15Italy 4,345 51 135 -84Japan 464 5 0 5Kuwait 1,541 18 1 17Lebanon 0 0 23 -23Mexico 23 .. 0 ..Netherlands (Holland) 7,314 86 281 -196Norway 8,593 101 119 -18Panama Inc. Panama Canal Zone 0 0 5 -5Poland 6,296 74 0 74Qatar 0 0 .. ..Romania 0 0 5 -5Saudi Arabia 31,306 366 62 304Singapore 40,952 479 0 479South Africa 8,557 100 38 62Spain 2,736 32 14 18Sri Lanka 3,017 35 22 13Sweden 12,866 150 0 150Switzerland 465 5 0 5Turkey 48,427 566 17 549U. A. E. Abudhabi 4,345 51 15 36U. A. E. Ajman 345 4 0 4U. A. E. Dubai 85,563 1,001 524 476U. A. E. Sharjah 3,752 44 0 44U. K. 51,504 602 675 -72U. S. A. 619,066 7,240 5,080 2,160Vanuatu 0 0 36 -36Panty hose, Socks and other Hosiery Kn/Cr 1,87821,54323,4212,002,5306115-Afghanistan 5 .. 0 ..Australia 3,359 39 68 -28Belgium 241,521 2,825 814 2,010Botswana 9,778 114 0 114Brazil 9,238 108 0 108Bulgaria 8,925 104 0 104Canada 141,296 1,653 1,464 188China 24 .. 58 -57Cyprus 0 0 1 -1Denmark 2,296 27 33 -6Dominica 0 0 41 -41Finland 12,375 145 29 116France 68,167 797 1,225 -428Germany 80,833 945 550 395Hong Kong 18,191 213 344 -131Indonesia 255 3 .. 2Ireland 6,765 79 101 -22Italy 6,210 73 25 48Japan 110 1 5 -4

Rs. US $
(Amount in Thousand)
Difference
EXPORT OF GOODS BY COMMDOITY / COUNTRY AND SERVICES BY TYPE / COUNTRY
253 State Bank of Pakistan
July20 10 200 920 10HS CODE-COMMODITY / COUNTRY
Kuwait 761 9 0 9Malaysia 0 0 2 -2Malta 714 8 0 8Mexico 5,672 66 88 -21Netherlands (Holland) 70,408 823 942 -119New Zealand 196 2 6 -4Norway 1,485 17 95 -78Other Countries 21,858 256 0 256Panama Inc. Panama Canal Zone 7,337 86 122 -36Paraguay 1,550 18 0 18Philippines 0 0 1 -1Poland 4,083 48 0 48Russian Federation 234 3 0 3Saudi Arabia 15,254 178 102 77Singapore 190 2 1 1South Africa 257 3 0 3South Korea 0 0 15 -15Spain 3,645 43 120 -77Sweden 3,922 46 145 -99Switzerland 495 6 0 6Thailand 0 0 1 -1U. A. E. Dubai 2,860 33 72 -38U. A. E. Sharjah 227 3 2 1U. K. 90,997 1,064 971 93U. S. A. 1,161,037 13,579 13,967 -389Uruguay 0 0 11 -11Vanuatu 0 0 124 -124Gloves, Mittens and Mitts, Knitted or Crocheted 2875,0005,287452,0626116-Argentina 622 7 26 -19Australia 12,080 141 136 6Austria 4,381 51 0 51Bahrain 294 3 0 3Belgium 12,148 142 84 58Belize 0 0 4 -4Bolivia 167 2 0 2Brazil 17,770 208 1 206Canada 1,565 18 9 9Croatia 3,257 38 0 38Cyprus 0 0 71 -71Czech Republic 5,563 65 56 9Denmark 6,598 77 25 52Egypt 1,131 13 27 -14Finland 304 4 35 -31France 26,138 306 398 -92Germany 122,824 1,436 920 517Greece 2,391 28 3 25Hong Kong 164 2 70 -68Hungary 613 7 11 -4India 0 0 41 -41Ireland 5,553 65 10 55Italy 3,715 43 125 -82Japan 1,351 16 5 11Kuwait 724 8 0 8Latvia 1,270 15 0 15Libya 0 0 29 -29Malaysia 2,270 27 9 18Mexico 0 0 18 -18Netherlands (Holland) 18,123 212 516 -304New Zealand 0 0 12 -12Norway 13,537 158 186 -28Oman 0 0 134 -134Other Countries 51 1 7 -7Poland 1,965 23 22 1Portugal 0 0 21 -21Qatar 6,288 74 16 58Saudi Arabia 2,390 28 91 -63

Rs. US $
(Amount in Thousand)
Difference
EXPORT OF GOODS BY COMMDOITY / COUNTRY AND SERVICES BY TYPE / COUNTRY
Export of Goods and Services July 2010 254
July20 10 200 920 10HS CODE-COMMODITY / COUNTRY
Serbia 0 0 28 -28Singapore 18 .. 3 -3Slovak Republic 3,023 35 0 35South Africa 5,803 68 4 64South Korea 663 8 23 -15Spain 34,050 398 142 256Sri Lanka 4,682 55 125 -70Sweden 8,573 100 131 -30Switzerland 164 2 22 -20Thailand 594 7 0 7Turkey 21,534 252 0 252U. A. E. Abudhabi 1,445 17 6 11U. A. E. Dubai 13,022 152 159 -7U. K. 17,894 209 273 -63U. S. A. 62,413 730 967 -237Ukraine 1,052 12 0 12Uruguay 1,884 22 0 22Made-up Clothing Accessories NES Kn/Cr -1,8353,2591,424121,7906117-Bahrain 0 0 2 -2Belgium 6,522 76 0 76Brazil 0 0 31 -31Canada 8,835 103 0 103Chile 3,483 41 0 41China 0 0 240 -240Denmark 0 0 10 -10France 0 0 .. ..Germany 7,278 85 1,104 -1,019Hong Kong 0 0 1 -1Italy 4,581 54 292 -239Japan 0 0 1 -1Maldives 0 0 1 -1Netherlands (Holland) 0 0 8 -8Netherlands Antilles 7,820 91 0 91Philippines 0 0 30 -30Saudi Arabia 17,455 204 179 25Spain 9,553 112 0 112Switzerland 0 0 43 -43U. A. E. Dubai 21,710 254 170 84U. K. 19,314 226 273 -47U. S. A. 15,238 178 873 -695Men's or Boys' Overcoats, Cloaks etc. Not -4531,9101,457124,5796201-Australia 609 7 2 5Austria 1,092 13 0 13Bangladesh 0 0 70 -70Belgium 0 0 22 -22Canada 899 11 20 -9Chile 0 0 20 -20Denmark 0 0 49 -49France 4,330 51 24 27Germany 8,015 94 263 -169Greece 0 0 7 -7Hungary 0 0 14 -14Italy 800 9 69 -60Kuwait 284 3 22 -19Malaysia 854 10 26 -16Mauritius 333 4 0 4Netherlands (Holland) 1,317 15 0 15North Korea 2,874 34 0 34Norway 205 2 .. 2Other Countries 0 0 23 -23Philippines 222 3 13 -11Poland 0 0 21 -21Portugal 1,900 22 0 22Saudi Arabia 6,031 71 0 71Singapore 0 0 49 -49Slovak Republic 0 0 2 -2

Rs. US $
(Amount in Thousand)
Difference
EXPORT OF GOODS BY COMMDOITY / COUNTRY AND SERVICES BY TYPE / COUNTRY
255 State Bank of Pakistan
July20 10 200 920 10HS CODE-COMMODITY / COUNTRY
South Africa 271 3 0 3South Korea 1,368 16 0 16Spain 1,798 21 416 -395St. Kitts-Nevis 88 1 0 1Sweden 0 0 5 -5Thailand 93 1 0 1Turkey 2,130 25 159 -134U. A. E. Abudhabi 1,709 20 0 20U. A. E. Dubai 13,662 160 0 160U. K. 17,418 204 150 53U. S. A. 56,278 658 336 322Viet Nam 0 0 128 -128Women's or Girls' Overcoats etc, Not Knitted or 2993833728,8296202-Central African Republic 0 0 32 -32France 24,027 281 0 281Germany 2,887 34 0 34Netherlands (Holland) 0 0 6 -6U. A. E. Dubai 0 0 .. ..U. S. A. 1,915 22 0 22Men's or Boys' Suits, Ensembles etc, Not Knitted -3,05039,88036,8303,149,0806203-Afghanistan 175 2 0 2Algeria 14,290 167 231 -64Argentina 0 0 21 -21Australia 10,680 125 1,112 -987Austria 18,200 213 67 145Bangladesh 0 0 73 -73Belgium 178,367 2,086 2,943 -857Botswana 3,641 43 56 -13Canada 90,238 1,055 435 620China 0 0 17 -17Czech Republic 318 4 0 4Denmark 16,283 190 526 -336Djibouti 0 0 5 -5Egypt 221 3 0 3Ethiopia 0 0 4 -4Finland 6,941 81 135 -54France 341,212 3,991 3,084 906Germany 336,075 3,931 4,324 -394Greece 25,880 303 105 197Hong Kong 25,565 299 151 148India 0 0 31 -31Indonesia 5,877 69 0 69Ireland 144,849 1,694 1,427 267Italy 110,849 1,296 1,243 53Japan 135 2 72 -70Kenya 0 0 49 -49Kuwait 1,530 18 2 16Latvia 0 0 28 -28Lebanon 0 0 33 -33Malawi 1,295 15 0 15Mexico 1,101 13 0 13Netherlands (Holland) 14,671 172 1,153 -981New Zealand 839 10 74 -64North Korea 1,287 15 0 15Norway 43,866 513 724 -211Other Countries 0 0 3 -3Philippines 2,597 30 0 30Poland 6,850 80 0 80Portugal 10,551 123 19 105Qatar 0 0 73 -73Russian Federation 0 0 18 -18Saudi Arabia 11,155 130 33 97Singapore 1,487 17 15 3Slovak Republic 21,558 252 0 252Somalia 0 0 36 -36South Africa 1,978 23 142 -119
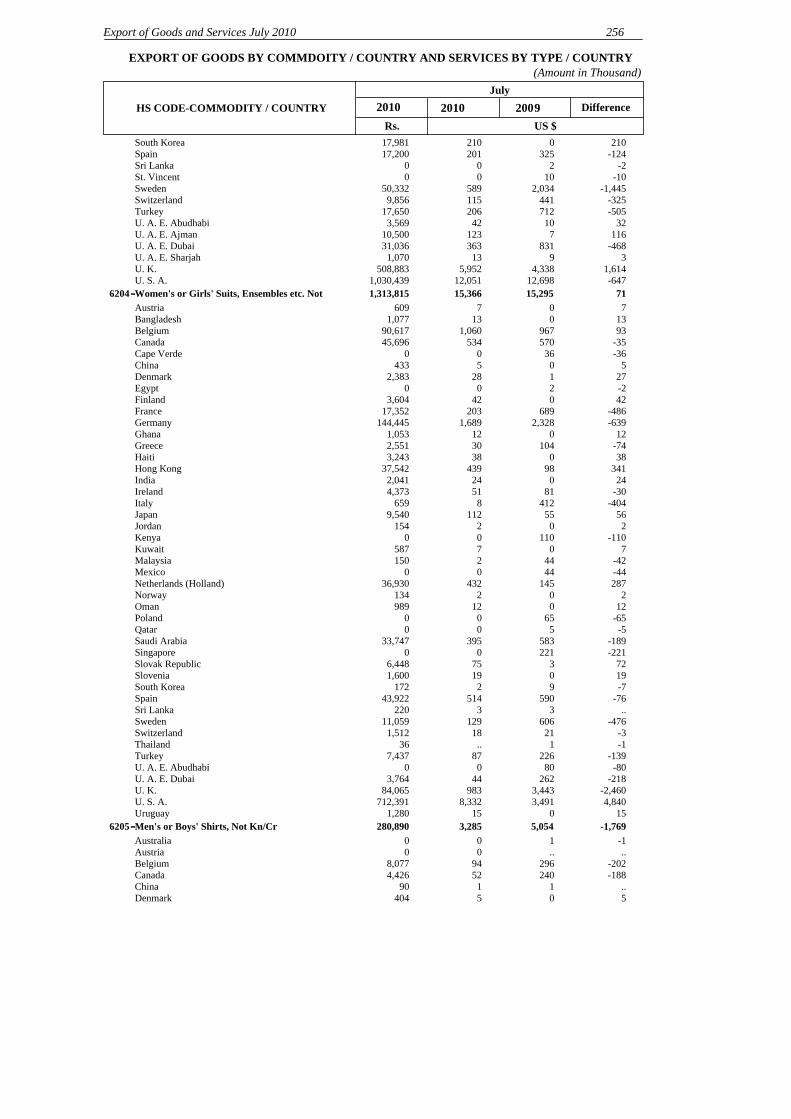
Rs. US $
(Amount in Thousand)
Difference
EXPORT OF GOODS BY COMMDOITY / COUNTRY AND SERVICES BY TYPE / COUNTRY
Export of Goods and Services July 2010 256
July20 10 200 920 10HS CODE-COMMODITY / COUNTRY
South Korea 17,981 210 0 210Spain 17,200 201 325 -124Sri Lanka 0 0 2 -2St. Vincent 0 0 10 -10Sweden 50,332 589 2,034 -1,445Switzerland 9,856 115 441 -325Turkey 17,650 206 712 -505U. A. E. Abudhabi 3,569 42 10 32U. A. E. Ajman 10,500 123 7 116U. A. E. Dubai 31,036 363 831 -468U. A. E. Sharjah 1,070 13 9 3U. K. 508,883 5,952 4,338 1,614U. S. A. 1,030,439 12,051 12,698 -647Women's or Girls' Suits, Ensembles etc. Not 7115,29515,3661,313,8156204-Austria 609 7 0 7Bangladesh 1,077 13 0 13Belgium 90,617 1,060 967 93Canada 45,696 534 570 -35Cape Verde 0 0 36 -36China 433 5 0 5Denmark 2,383 28 1 27Egypt 0 0 2 -2Finland 3,604 42 0 42France 17,352 203 689 -486Germany 144,445 1,689 2,328 -639Ghana 1,053 12 0 12Greece 2,551 30 104 -74Haiti 3,243 38 0 38Hong Kong 37,542 439 98 341India 2,041 24 0 24Ireland 4,373 51 81 -30Italy 659 8 412 -404Japan 9,540 112 55 56Jordan 154 2 0 2Kenya 0 0 110 -110Kuwait 587 7 0 7Malaysia 150 2 44 -42Mexico 0 0 44 -44Netherlands (Holland) 36,930 432 145 287Norway 134 2 0 2Oman 989 12 0 12Poland 0 0 65 -65Qatar 0 0 5 -5Saudi Arabia 33,747 395 583 -189Singapore 0 0 221 -221Slovak Republic 6,448 75 3 72Slovenia 1,600 19 0 19South Korea 172 2 9 -7Spain 43,922 514 590 -76Sri Lanka 220 3 3 ..Sweden 11,059 129 606 -476Switzerland 1,512 18 21 -3Thailand 36 .. 1 -1Turkey 7,437 87 226 -139U. A. E. Abudhabi 0 0 80 -80U. A. E. Dubai 3,764 44 262 -218U. K. 84,065 983 3,443 -2,460U. S. A. 712,391 8,332 3,491 4,840Uruguay 1,280 15 0 15Men's or Boys' Shirts, Not Kn/Cr -1,7695,0543,285280,8906205-Australia 0 0 1 -1Austria 0 0 .. ..Belgium 8,077 94 296 -202Canada 4,426 52 240 -188China 90 1 1 ..Denmark 404 5 0 5

Rs. US $
(Amount in Thousand)
Difference
EXPORT OF GOODS BY COMMDOITY / COUNTRY AND SERVICES BY TYPE / COUNTRY
257 State Bank of Pakistan
July20 10 200 920 10HS CODE-COMMODITY / COUNTRY
Finland 1,996 23 0 23France 11,204 131 34 97Germany 39,490 462 163 299Hong Kong 82 1 0 1Italy 323 4 0 4Japan 28 .. 7 -6Mexico 222 3 0 3Netherlands (Holland) 3,405 40 22 18New Zealand 292 3 0 3Norway 0 0 3 -3Oman 0 0 6 -6Poland 0 0 8 -8Saudi Arabia 0 0 4 -4South Korea 25 .. 0 ..Spain 1,667 19 21 -2Sweden 1,057 12 0 12Togo 0 0 35 -35U. A. E. Dubai 0 0 22 -22U. K. 30,766 360 242 117U. S. A. 177,336 2,074 3,947 -1,873Women's or Girls' Blouses, Shirts etc. Not -2264423,6146206-Canada 1,184 14 0 14Germany 0 0 56 -56Sweden 439 5 0 5U. K. 0 0 5 -5U. S. A. 1,991 23 2 21Men's or Boys' Undershirts etc Not Kn/Cr -1852,0441,859158,9156207-Australia 0 0 38 -38Austria 1,022 12 0 12Belgium 8,530 100 143 -43Canada 3,607 42 0 42Chile 0 0 21 -21Denmark 5,860 69 0 69France 4,376 51 125 -74Germany 2,147 25 31 -6Greece 2,993 35 89 -54Italy 29,965 350 258 93Kuwait 9,363 110 0 110Malaysia 5,578 65 0 65Netherlands (Holland) 1,721 20 0 20Saudi Arabia 35,257 412 0 412Spain 4,626 54 201 -147Switzerland 563 7 17 -11U. A. E. Abudhabi 9,078 106 0 106U. K. 6,022 70 46 24U. S. A. 28,206 330 1,076 -746Women's or Girls' Slips etc Not Kn/Cr 2641,1341,398119,5596208-Argentina 0 0 3 -3Austria 4,961 58 60 -2Belgium 0 0 17 -17Canada 5,265 62 0 62China 301 4 0 4Germany 17,448 204 54 150Greece 0 0 62 -62Hong Kong 2,078 24 0 24Italy 4,148 49 61 -12Japan 33 .. 0 ..Mali 0 0 223 -223New Zealand 0 0 7 -7Portugal 2,016 24 0 24Saudi Arabia 2,460 29 0 29Singapore 0 0 .. ..Spain 3,282 38 35 4U. A. E. Dubai 8,470 99 2 97U. K. 0 0 173 -173

Rs. US $
(Amount in Thousand)
Difference
EXPORT OF GOODS BY COMMDOITY / COUNTRY AND SERVICES BY TYPE / COUNTRY
Export of Goods and Services July 2010 258
July20 10 200 920 10HS CODE-COMMODITY / COUNTRY
U. S. A. 69,097 808 438 370Babies' Garments and Accessories Not Kn/Cr 5408541,394119,1916209-Austria 3,254 38 0 38Belgium 4,614 54 149 -95Canada 0 0 55 -55Cape Verde 0 0 8 -8Germany 3,827 45 89 -44Kenya 770 9 0 9Netherlands (Holland) 8,344 98 13 84New Zealand 0 0 6 -6Spain 16,568 194 265 -71Tanzania 1,707 20 0 20U. A. E. Dubai 2,904 34 25 9U. K. 0 0 31 -31U. S. A. 69,663 815 213 602Uruguay 7,540 88 0 88Garments, of Felt etc, or Fabric Impregnated etc -4,7086,9632,255192,8216210-Bahrain 0 0 2 -2Benin ( Dahomey ) 0 0 136 -136Canada 5,310 62 135 -73Chile 21,679 254 371 -117Cyprus 114 1 0 1Denmark 34,335 402 52 350Ecuador 0 0 58 -58France 0 0 431 -431Germany 17,396 203 441 -237Greece 0 0 34 -34Hong Kong 0 0 231 -231Indonesia 2,221 26 0 26Ireland 0 0 26 -26Kenya 1,236 14 0 14Kuwait 0 0 102 -102Mexico 0 0 4 -4Netherlands (Holland) 4,596 54 136 -82Nigeria 0 0 252 -252Norway 0 0 9 -9Philippines 0 0 42 -42Poland 530 6 0 6Portugal 1,528 18 0 18Saudi Arabia 0 0 688 -688Senegal 0 0 20 -20Singapore 1,159 14 0 14South Africa 386 5 341 -337Spain 0 0 130 -130Swaziland 0 0 12 -12Switzerland 2,963 35 0 35U. A. E. Dubai 59,030 690 751 -61U. K. 24,520 287 612 -325U. S. A. 15,820 185 1,945 -1,760Track Suits, Ski-Suits and Swimwear, Not 3414,5644,905419,3586211-Algeria 12,057 141 0 141Australia 88 1 0 1Bangladesh 553 6 15 -9Belarus 0 0 177 -177Belgium 1,277 15 180 -165Canada 376 4 43 -39China 675 8 5 3Cyprus 386 5 1 4Denmark 0 0 8 -8Finland 2,022 24 0 24France 11,477 134 324 -190Germany 36,730 430 673 -244Greece 1,745 20 60 -39Hong Kong 27 .. 1 ..Ireland 371 4 0 4

Rs. US $
(Amount in Thousand)
Difference
EXPORT OF GOODS BY COMMDOITY / COUNTRY AND SERVICES BY TYPE / COUNTRY
259 State Bank of Pakistan
July20 10 200 920 10HS CODE-COMMODITY / COUNTRY
Italy 5,409 63 25 38Kenya 1,494 17 0 17Malaysia 511 6 11 -5Netherlands (Holland) 13,143 154 220 -66Niger 7,871 92 0 92Norway 311 4 0 4Poland 718 8 0 8Romania 469 5 0 5Saudi Arabia 16,802 197 76 120Spain 18,649 218 579 -361Sweden 0 0 6 -6Turkey 0 0 142 -142U. A. E. Dubai 8,842 103 3 100U. K. 6,291 74 338 -265U. S. A. 271,065 3,170 1,676 1,494Handkerchiefs -788576036213-Canada 603 7 0 7France 0 0 82 -82U. S. A. 0 0 3 -3Shawls, Scarves, Mufflers, Mantillas, Veils etc. 78291079,1286214-Bangladesh 1,175 14 19 -5Ethiopia 5,288 62 0 62Germany 90 1 0 1Japan 0 0 3 -3Malaysia 1,042 12 0 12U. A. E. Dubai 102 1 0 1U. K. 399 5 0 5U. S. A. 1,031 12 7 5Gloves, Mittens and Mitts, Not Knitted or 5151,6802,195187,7076216-Australia 28 .. 7 -7Belgium 1,958 23 45 -22Brazil 0 0 32 -32Canada 1,661 19 24 -4Croatia 0 0 3 -3Czech Republic 0 0 66 -66Denmark 423 5 132 -127Egypt 0 0 6 -6Finland 0 0 9 -9France 17,929 210 34 175Germany 41,176 482 185 296Greece 0 0 12 -12India 5,023 59 10 49Italy 1,970 23 1 22Japan 0 0 .. ..Mauritius 86 1 0 1Netherlands (Holland) 12,088 141 330 -188New Zealand 220 3 0 3Norway 336 4 3 1Panama Inc. Panama Canal Zone 0 0 29 -29Philippines 0 0 1 -1Portugal 475 6 0 6Qatar 0 0 21 -21Romania 469 5 0 5Russian Federation 998 12 1 11Saudi Arabia 7,845 92 85 7Singapore 517 6 0 6South Africa 2,740 32 12 20South Korea 124 1 0 1Spain 5,474 64 8 56Sri Lanka 1,009 12 0 12Sweden 469 5 0 5Switzerland 155 2 0 2Turkey 0 0 5 -5U. A. E. Abudhabi 0 0 61 -61U. A. E. Dubai 15,180 178 42 135

Rs. US $
(Amount in Thousand)
Difference
EXPORT OF GOODS BY COMMDOITY / COUNTRY AND SERVICES BY TYPE / COUNTRY
Export of Goods and Services July 2010 260
July20 10 200 920 10HS CODE-COMMODITY / COUNTRY
U. A. E. Sharjah 356 4 0 4U. K. 9,846 115 151 -36U. S. A. 59,153 692 364 328Made-Up Clothing Accessories NES -5,8319,1243,293281,5546217-Afghanistan 0 0 30 -30Argentina 2,252 26 0 26Australia 8,474 99 113 -14Bahrain 0 0 10 -10Bangladesh 44,873 525 0 525Belgium 20,228 237 278 -41Brazil 2,633 31 0 31Canada 5,511 64 14 51Chile 26,572 311 0 311China 0 0 122 -122Croatia 0 0 57 -57Cyprus 2,869 34 71 -37Czech Republic 2,618 31 0 31Denmark 1,598 19 0 19France 0 0 163 -163Germany 13,753 161 192 -31Greece 0 0 174 -174India 1,881 22 39 -17Ireland 510 6 212 -206Italy 9,005 105 437 -331Japan 3,183 37 16 22Kuwait 0 0 31 -31Malta 2,067 24 0 24Mexico 0 0 4 -4Netherlands (Holland) 827 10 135 -125New Zealand 7,138 83 46 37Norway 2,029 24 0 24Oman 0 0 1 -1Other Countries 0 0 2 -2Philippines 0 0 929 -929Qatar 0 0 3 -3Romania 5,347 63 0 63Saudi Arabia 0 0 43 -43Singapore 3,952 46 49 -3South Africa 6,802 80 0 80South Korea 0 0 15 -15Spain 17,964 210 743 -532Sri Lanka 0 0 16 -16Sweden 5,657 66 0 66Switzerland 1,623 19 0 19Thailand 88 1 0 1Turkey 3,279 38 108 -70U. A. E. Dubai 7,220 84 165 -80U. A. E. Sharjah 0 0 31 -31U. K. 47,375 554 1,427 -873U. S. A. 24,228 283 3,449 -3,166Blankets and Traveling Rugs 1,0111,8012,812240,4076301-Bangladesh 599 7 15 -8Belgium 0 0 7 -7Canada 11,697 137 132 4China 3,634 43 66 -23Croatia 3,508 41 0 41Finland 370 4 0 4Greece 9,322 109 71 38Italy 0 0 53 -53Japan 1,242 15 0 15Kuwait 0 0 64 -64Malaysia 0 0 63 -63Mexico 0 0 5 -5New Zealand 1,300 15 0 15Oman 1,881 22 5 17Philippines 2,118 25 0 25

Rs. US $
(Amount in Thousand)
Difference
EXPORT OF GOODS BY COMMDOITY / COUNTRY AND SERVICES BY TYPE / COUNTRY
261 State Bank of Pakistan
July20 10 200 920 10HS CODE-COMMODITY / COUNTRY
Poland 3,364 39 0 39Saudi Arabia 19,073 223 8 215U. A. E. Ajman 807 9 0 9U. A. E. Dubai 1,820 21 23 -2U. K. 0 0 116 -116U. S. A. 176,138 2,060 1,173 887Ukraine 3,534 41 0 41Bed and Table Linen, Toilet and Kitchen Linen 17,351183,685201,03617,189,2256302-Afghanistan 0 0 9 -9Albania 425 5 21 -16Algeria 0 0 39 -39American Samoa 3,650 43 0 43Angola 0 0 22 -22Argentina 20,404 239 224 15Armenia 1,887 22 0 22Australia 267,089 3,124 2,946 178Austria 23,763 278 252 26Azerbaijan 0 0 25 -25Bahrain 2,099 25 73 -48Bangladesh 1,378 16 4 12Belgium 555,122 6,492 7,471 -979Bermuda 0 0 109 -109Botswana 1,023 12 100 -88Brazil 80,676 944 202 742Canada 409,062 4,784 3,350 1,434Cape Verde 9,412 110 37 73Chile 184,903 2,163 1,071 1,091China 64,567 755 978 -223Colombia 34,463 403 75 328Croatia 14,112 165 131 34Cyprus 19,476 228 181 47Czech Republic 28,018 328 80 248Denmark 220,677 2,581 2,551 30Dominican Republic 9,512 111 6 106Egypt 5,768 67 191 -124Equatorial Guinea 3,508 41 0 41Estonia 13,065 153 149 4Faeroe Islands 8,611 101 0 101Fiji 0 0 34 -34Finland 42,800 501 760 -260France 784,676 9,177 6,566 2,611Gabon 0 0 70 -70Gambia 2,470 29 48 -19Georgia 257 3 0 3Germany 1,579,863 18,477 13,152 5,325Greece 157,890 1,847 1,606 241Greenland 1,401 16 0 16Guatemala 0 0 30 -30Haiti 0 0 30 -30Hong Kong 95,878 1,121 1,055 67Hungary 2,455 29 63 -34Iceland 1,384 16 0 16India 321 4 38 -35Indonesia 2,074 24 0 24Ireland 102,344 1,197 829 368Italy 630,135 7,370 8,130 -760Ivory Coast 3,804 44 0 44Jamaica 0 0 30 -30Japan 15,572 182 86 96Jordan 6,228 73 128 -55Kenya 14,201 166 396 -230Kuwait 28,355 332 282 49Latvia 3,826 45 35 9Lebanon 0 0 13 -13Lithuania 4,471 52 37 15Macedonia (FormerlyYugoslavia) 0 0 3 -3

Rs. US $
(Amount in Thousand)
Difference
EXPORT OF GOODS BY COMMDOITY / COUNTRY AND SERVICES BY TYPE / COUNTRY
Export of Goods and Services July 2010 262
July20 10 200 920 10HS CODE-COMMODITY / COUNTRY
Madagascar 2,796 33 0 33Malaysia 8,168 96 110 -15Mali 0 0 67 -67Malta 12,793 150 176 -27Mauritius 1,516 18 29 -12Mexico 5,855 68 188 -119Morocco 1,840 22 0 22Mozambique 0 0 31 -31Netherlands (Holland) 495,318 5,793 7,982 -2,189Netherlands Antilles 4,313 50 0 50New Zealand 99,055 1,158 810 348Nigeria 7,328 86 68 18Norway 92,883 1,086 836 250Oman 7,285 85 84 2Other Countries 38,818 454 28 426Panama Inc. Panama Canal Zone 21,099 247 178 69Papua New Guinea .. .. 0 ..Paraguay 0 0 6 -6Peru 0 0 44 -44Philippines 11,216 131 69 63Poland 90,719 1,061 989 72Portugal 34,592 405 653 -248Qatar 11,405 133 155 -21Reunion Island 0 0 72 -72Romania 26,090 305 37 269Russian Federation 42,674 499 440 60Saudi Arabia 148,795 1,740 1,469 271Senegal 0 0 15 -15Serbia 3,780 44 11 34Singapore 39,104 457 170 287Slovak Republic 3,574 42 0 42Slovenia 9,250 108 154 -46South Africa 219,685 2,569 2,365 204South Korea 27,070 317 322 -6Spain 709,906 8,303 5,791 2,511Sri Lanka 2,303 27 379 -352Sudan 0 0 2 -2Swaziland 5,071 59 24 36Sweden 105,770 1,237 1,463 -226Switzerland 23,502 275 301 -26Tanzania 4,188 49 183 -135Thailand 329 4 7 -4Tunisia 2,536 30 26 3Turkey 104,286 1,220 526 693Tuvalu 7,351 86 0 86U. A. E. Abudhabi 8,429 99 160 -62U. A. E. Ajman 14,873 174 108 66U. A. E. Dubai 156,845 1,834 3,015 -1,181U. A. E. Fujairah 0 0 3 -3U. A. E. Sharjah 6,279 73 2 72U. K. 1,926,120 22,527 17,289 5,238U. S. A. 7,131,570 83,407 82,832 576Uganda 0 0 3 -3Ukraine 11,970 140 180 -40Uruguay 7,593 89 49 40Venezuela 17,387 203 .. 203Viet Nam 4,657 54 0 54Western Samoa 2,210 26 0 26Windward Islands 0 0 46 -46Yemen Arab Republic 3,274 38 20 18Zambia 2,676 31 0 31Curtains and Interior Blinds, Curtain or Bed -1,8988,6436,745576,7586303-Australia 2,659 31 0 31Austria 3,334 39 6 33Belgium 10,055 118 143 -25Botswana 1,215 14 0 14

Rs. US $
(Amount in Thousand)
Difference
EXPORT OF GOODS BY COMMDOITY / COUNTRY AND SERVICES BY TYPE / COUNTRY
263 State Bank of Pakistan
July20 10 200 920 10HS CODE-COMMODITY / COUNTRY
Canada 30,302 354 17 337Chile 0 0 144 -144China 8,564 100 93 7Denmark 0 0 22 -22Finland 1,003 12 18 -6France 3,082 36 11 25Germany 28,042 328 782 -454Ireland 4,029 47 0 47Italy 0 0 169 -169Japan 155 2 0 2Kuwait 892 10 0 10Malaysia 0 0 24 -24Mexico 0 0 1 -1Netherlands (Holland) 563 7 224 -217New Zealand 4,034 47 146 -99Norway 4,924 58 7 51Poland 0 0 18 -18Reunion Island 0 0 24 -24Russian Federation 229 3 88 -85Saudi Arabia 0 0 111 -111South Africa 60,182 704 279 424Spain 279 3 100 -97Sweden 11,434 134 223 -89Turkey 0 0 16 -16U. A. E. Dubai 2,298 27 11 16U. K. 139,951 1,637 3,453 -1,816U. S. A. 259,532 3,035 2,513 523Furnishing Articles of Textile Materials NES 1,2522,4703,722318,2076304-Algeria 2,736 32 0 32Australia 1,111 13 47 -34Austria 0 0 11 -11Azerbaijan 0 0 17 -17Belgium 15,991 187 0 187Canada 4,441 52 115 -63Denmark 0 0 8 -8Finland 2,154 25 0 25France 27,506 322 77 245Germany 39,706 464 599 -134Greece 3,521 41 0 41Italy 4,520 53 87 -34Kuwait 109 1 0 1Malta 893 10 23 -12Netherlands (Holland) 1,040 12 122 -109Nigeria 0 0 10 -10Norway 16,072 188 0 188Portugal 0 0 116 -116Qatar 920 11 0 11Russian Federation 340 4 0 4Saudi Arabia 25,152 294 233 61Spain 0 0 70 -70Sweden 1,433 17 0 17Turkey 0 0 7 -7U. A. E. Dubai 4,575 54 23 31U. A. E. Sharjah 0 0 51 -51U. K. 8,809 103 130 -27U. S. A. 157,179 1,838 726 1,113Sacks and Bags of Textile Material for Packing 1,4091,0672,476211,6746305-Australia 1,806 21 92 -71Austria 58 1 0 1China 0 0 31 -31Denmark 5,302 62 7 55Fiji 0 0 32 -32France 988 12 0 12Germany 2,563 30 55 -25Greece 0 0 .. ..Hong Kong 181 2 0 2
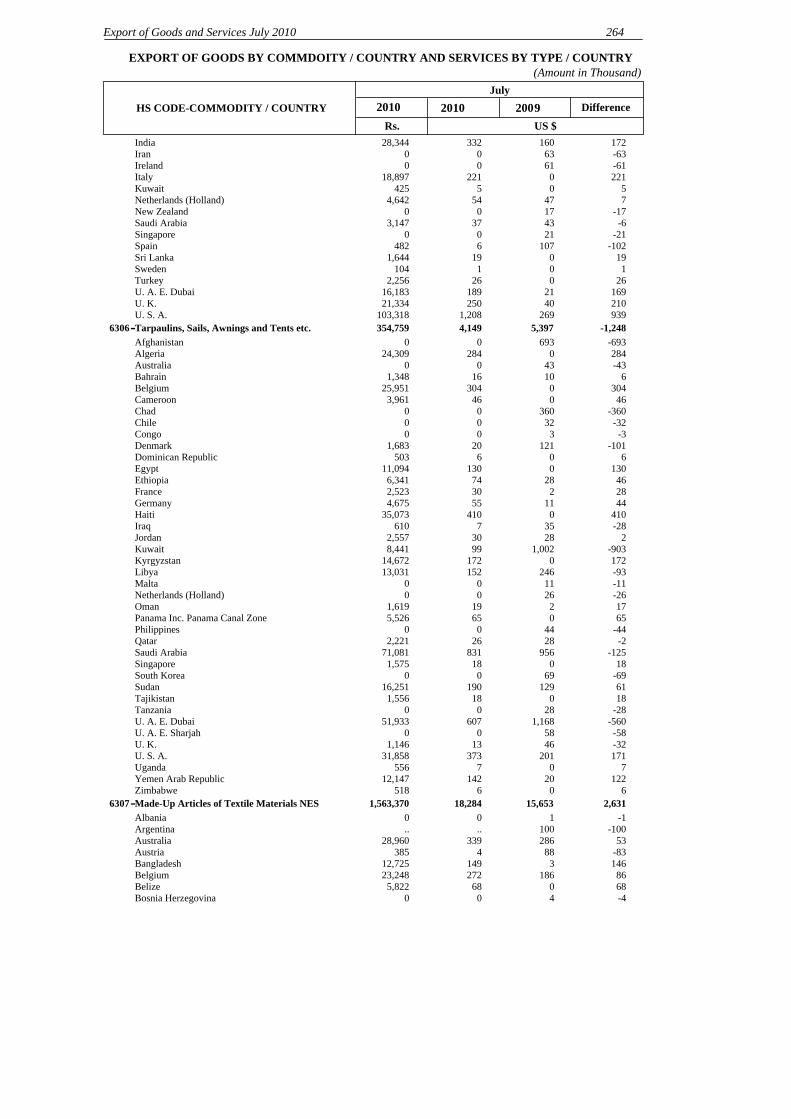
Rs. US $
(Amount in Thousand)
Difference
EXPORT OF GOODS BY COMMDOITY / COUNTRY AND SERVICES BY TYPE / COUNTRY
Export of Goods and Services July 2010 264
July20 10 200 920 10HS CODE-COMMODITY / COUNTRY
India 28,344 332 160 172Iran 0 0 63 -63Ireland 0 0 61 -61Italy 18,897 221 0 221Kuwait 425 5 0 5Netherlands (Holland) 4,642 54 47 7New Zealand 0 0 17 -17Saudi Arabia 3,147 37 43 -6Singapore 0 0 21 -21Spain 482 6 107 -102Sri Lanka 1,644 19 0 19Sweden 104 1 0 1Turkey 2,256 26 0 26U. A. E. Dubai 16,183 189 21 169U. K. 21,334 250 40 210U. S. A. 103,318 1,208 269 939Tarpaulins, Sails, Awnings and Tents etc. -1,2485,3974,149354,7596306-Afghanistan 0 0 693 -693Algeria 24,309 284 0 284Australia 0 0 43 -43Bahrain 1,348 16 10 6Belgium 25,951 304 0 304Cameroon 3,961 46 0 46Chad 0 0 360 -360Chile 0 0 32 -32Congo 0 0 3 -3Denmark 1,683 20 121 -101Dominican Republic 503 6 0 6Egypt 11,094 130 0 130Ethiopia 6,341 74 28 46France 2,523 30 2 28Germany 4,675 55 11 44Haiti 35,073 410 0 410Iraq 610 7 35 -28Jordan 2,557 30 28 2Kuwait 8,441 99 1,002 -903Kyrgyzstan 14,672 172 0 172Libya 13,031 152 246 -93Malta 0 0 11 -11Netherlands (Holland) 0 0 26 -26Oman 1,619 19 2 17Panama Inc. Panama Canal Zone 5,526 65 0 65Philippines 0 0 44 -44Qatar 2,221 26 28 -2Saudi Arabia 71,081 831 956 -125Singapore 1,575 18 0 18South Korea 0 0 69 -69Sudan 16,251 190 129 61Tajikistan 1,556 18 0 18Tanzania 0 0 28 -28U. A. E. Dubai 51,933 607 1,168 -560U. A. E. Sharjah 0 0 58 -58U. K. 1,146 13 46 -32U. S. A. 31,858 373 201 171Uganda 556 7 0 7Yemen Arab Republic 12,147 142 20 122Zimbabwe 518 6 0 6Made-Up Articles of Textile Materials NES 2,63115,65318,2841,563,3706307-Albania 0 0 1 -1Argentina .. .. 100 -100Australia 28,960 339 286 53Austria 385 4 88 -83Bangladesh 12,725 149 3 146Belgium 23,248 272 186 86Belize 5,822 68 0 68Bosnia Herzegovina 0 0 4 -4

Rs. US $
(Amount in Thousand)
Difference
EXPORT OF GOODS BY COMMDOITY / COUNTRY AND SERVICES BY TYPE / COUNTRY
265 State Bank of Pakistan
July20 10 200 920 10HS CODE-COMMODITY / COUNTRY
Brunei 0 0 5 -5Canada 13,703 160 152 8Chile 2,636 31 152 -121China 5,590 65 63 2Croatia 3,620 42 0 42Cyprus 0 0 41 -41Denmark 15,056 176 202 -26Djibouti 1,339 16 0 16Dominican Republic 4,939 58 0 58France 48,148 563 1,319 -756Georgia 0 0 56 -56Germany 61,195 716 478 238Greece 2,334 27 61 -34Hong Kong 2,783 33 22 11India 0 0 15 -15Iran 2,380 28 0 28Ireland 8,239 96 30 66Italy 61,576 720 229 491Japan 0 0 18 -18Jordan 2,699 32 0 32Kuwait 2,923 34 5 29Lebanon 0 0 3 -3Madagascar 0 0 10 -10Malawi 3,936 46 0 46Malaysia 4,773 56 15 41Mozambique 0 0 44 -44Netherlands (Holland) 66,348 776 338 438New Caledonia 0 0 4 -4New Zealand 5,466 64 60 4Norway 0 0 1 -1Oman 0 0 53 -53Other Countries 1,757 21 0 21Panama Inc. Panama Canal Zone 0 0 183 -183Poland 0 0 23 -23Portugal 12,668 148 18 130Russian Federation 303 4 0 4Saudi Arabia 5,966 70 120 -50South Africa 0 0 37 -37Spain 7,805 91 318 -227Sudan 0 0 17 -17Sweden 6,173 72 38 35Switzerland 0 0 3 -3Tanzania 0 0 6 -6U. A. E. Dubai 23,354 273 19 254U. A. E. Sharjah 489 6 15 -10U. K. 157,342 1,840 1,538 302U. S. A. 956,693 11,189 9,256 1,933Ukraine 0 0 20 -20Worn Clothing and other Worn Textile Articles -8654245639,0246309-Australia 0 0 81 -81Bahrain 1,421 17 0 17Bangladesh 1,016 12 0 12Benin ( Dahomey ) 0 0 8 -8Cambodia Kampuchea 0 0 8 -8Congo 1,458 17 15 2France 0 0 .. ..India 1,332 16 17 -1Japan 424 5 0 5Jordan 340 4 0 4Kenya 9,801 115 75 40Kuwait 0 0 16 -16Madagascar 1,915 22 13 10Malawi 0 0 95 -95Mozambique 3,946 46 0 46Philippines 0 0 12 -12Saudi Arabia 0 0 16 -16
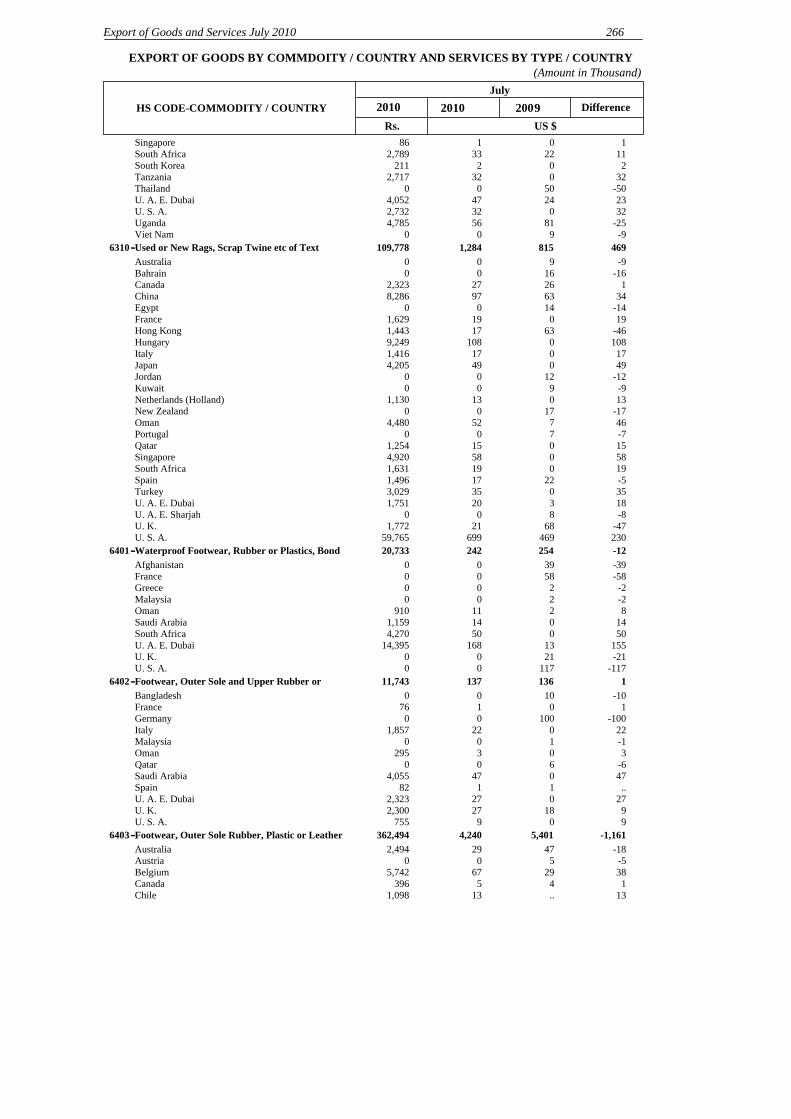
Rs. US $
(Amount in Thousand)
Difference
EXPORT OF GOODS BY COMMDOITY / COUNTRY AND SERVICES BY TYPE / COUNTRY
Export of Goods and Services July 2010 266
July20 10 200 920 10HS CODE-COMMODITY / COUNTRY
Singapore 86 1 0 1South Africa 2,789 33 22 11South Korea 211 2 0 2Tanzania 2,717 32 0 32Thailand 0 0 50 -50U. A. E. Dubai 4,052 47 24 23U. S. A. 2,732 32 0 32Uganda 4,785 56 81 -25Viet Nam 0 0 9 -9Used or New Rags, Scrap Twine etc of Text 4698151,284109,7786310-Australia 0 0 9 -9Bahrain 0 0 16 -16Canada 2,323 27 26 1China 8,286 97 63 34Egypt 0 0 14 -14France 1,629 19 0 19Hong Kong 1,443 17 63 -46Hungary 9,249 108 0 108Italy 1,416 17 0 17Japan 4,205 49 0 49Jordan 0 0 12 -12Kuwait 0 0 9 -9Netherlands (Holland) 1,130 13 0 13New Zealand 0 0 17 -17Oman 4,480 52 7 46Portugal 0 0 7 -7Qatar 1,254 15 0 15Singapore 4,920 58 0 58South Africa 1,631 19 0 19Spain 1,496 17 22 -5Turkey 3,029 35 0 35U. A. E. Dubai 1,751 20 3 18U. A. E. Sharjah 0 0 8 -8U. K. 1,772 21 68 -47U. S. A. 59,765 699 469 230Waterproof Footwear, Rubber or Plastics, Bond -1225424220,7336401-Afghanistan 0 0 39 -39France 0 0 58 -58Greece 0 0 2 -2Malaysia 0 0 2 -2Oman 910 11 2 8Saudi Arabia 1,159 14 0 14South Africa 4,270 50 0 50U. A. E. Dubai 14,395 168 13 155U. K. 0 0 21 -21U. S. A. 0 0 117 -117Footwear, Outer Sole and Upper Rubber or 113613711,7436402-Bangladesh 0 0 10 -10France 76 1 0 1Germany 0 0 100 -100Italy 1,857 22 0 22Malaysia 0 0 1 -1Oman 295 3 0 3Qatar 0 0 6 -6Saudi Arabia 4,055 47 0 47Spain 82 1 1 ..U. A. E. Dubai 2,323 27 0 27U. K. 2,300 27 18 9U. S. A. 755 9 0 9Footwear, Outer Sole Rubber, Plastic or Leather -1,1615,4014,240362,4946403-Australia 2,494 29 47 -18Austria 0 0 5 -5Belgium 5,742 67 29 38Canada 396 5 4 1Chile 1,098 13 .. 13

Rs. US $
(Amount in Thousand)
Difference
EXPORT OF GOODS BY COMMDOITY / COUNTRY AND SERVICES BY TYPE / COUNTRY
267 State Bank of Pakistan
July20 10 200 920 10HS CODE-COMMODITY / COUNTRY
Denmark 1,268 15 12 3Finland 471 6 0 6France 35,412 414 405 9Germany 93,937 1,099 1,787 -688Greece 8,041 94 30 64India 0 0 1 -1Ireland 0 0 .. ..Italy 56,098 656 806 -150Kenya 0 0 4 -4Malaysia 1,673 20 .. 19Mauritius 100 1 0 1Morocco 145 2 0 2Netherlands (Holland) 218 3 1 2New Zealand 0 0 .. ..Oman 0 0 27 -27Portugal 5,401 63 159 -96Saudi Arabia 36,168 423 817 -394Singapore 0 0 3 -3South Africa 12,925 151 199 -47Spain 6,004 70 6 65Sri Lanka 0 0 3 -3Sweden 2,587 30 0 30Switzerland 66 1 0 1Turkey 11,135 130 52 78U. A. E. Ajman 513 6 11 -5U. A. E. Dubai 38,895 455 375 80U. A. E. Sharjah 0 0 15 -15U. K. 11,619 136 270 -134U. S. A. 3,391 40 332 -293Yemen Arab Republic 26,697 312 0 312Footwear, Outer Sole Rubber, Plastic or Textile -12541829325,0406404-Australia 1,283 15 0 15Brunei 26 .. 0 ..Denmark 10,260 120 0 120France 0 0 41 -41Germany 1,022 12 27 -15India 254 3 0 3Ireland 55 1 0 1Italy 267 3 0 3Malaysia 0 0 1 -1Netherlands (Holland) 218 3 1 1Oman 0 0 4 -4Saudi Arabia 0 0 42 -42South Africa 0 0 130 -130U. A. E. Dubai 0 0 132 -132U. K. 3,974 46 0 46U. S. A. 7,006 82 40 42Uruguay 674 8 0 8Footwear NES -1991,14294380,6406405-Austria 1,472 17 0 17Bangladesh 277 3 0 3France 24,021 281 294 -13Germany 4,775 56 127 -71Italy 2,494 29 0 29Jordan 44 1 0 1Kuwait 556 7 5 2Libya 0 0 19 -19Luxembourg 9,714 114 0 114Malaysia 3,768 44 0 44Netherlands (Holland) 345 4 0 4Oman 1,929 23 25 -2Other Countries 10,048 118 17 100Saudi Arabia 4,968 58 115 -57Slovenia 0 0 23 -23South Africa 438 5 61 -56Sudan 0 0 24 -24

Rs. US $
(Amount in Thousand)
Difference
EXPORT OF GOODS BY COMMDOITY / COUNTRY AND SERVICES BY TYPE / COUNTRY
Export of Goods and Services July 2010 268
July20 10 200 920 10HS CODE-COMMODITY / COUNTRY
Thailand 345 4 0 4U. A. E. Dubai 3,679 43 172 -129U. K. 10,829 127 171 -44U. S. A. 938 11 90 -79Parts of Footwear: Insoles, Gaiters etc. Parts 409494,1866406-Bangladesh 0 0 1 -1Belgium 89 1 0 1Germany 2,096 25 0 25U. A. E. Dubai 2,000 23 6 17U. S. A. 0 0 2 -2Hat-Forms, Bodies and Hoods and Manchons of 530534,5366501-U. K. 4,536 53 0 53Hats and Headgear, Knitted etc. Lace etc. 123151,2536505-France 1,144 13 0 13Romania 109 1 0 1Saudi Arabia 0 0 1 -1U. K. 0 0 1 -1Headgear NES 1113714812,6186506-Austria 0 0 7 -7France 8,002 94 10 84Netherlands (Holland) 0 0 20 -20Oman 1,524 18 0 18U. A. E. Dubai 2,743 32 0 32U. K. 349 4 0 4Walking-Sticks, Seat-Sticks, Whips and 139221,8586602-Germany 321 4 0 4Hong Kong 201 2 0 2Morocco 1,337 16 0 16U. K. 0 0 9 -9Human Hair, Dressed, Wool of Animal Hair or 5054306703-U. S. A. 430 5 0 5Setts, Curbstone and Flagstones, of Natural Stone -209230211,8386801-France 0 0 37 -37Hong Kong 0 0 12 -12Kenya 0 0 19 -19Madagascar 0 0 103 -103Mauritius 0 0 43 -43Spain 1,838 21 0 21Tajikistan 0 0 15 -15U. K. 0 0 .. ..Worked Monumental or Building Stone and 47531879367,7996802-Bahrain 1,973 23 0 23China 21,547 252 41 211France 3,679 43 0 43Madagascar 4,989 58 0 58Malaysia 1,515 18 0 18Other Countries 0 0 4 -4Qatar 1,235 14 0 14Romania 0 0 2 -2Spain 542 6 0 6Turkey 5,624 66 0 66U. A. E. Dubai 2,741 32 13 19U. K. 3,265 38 3 36U. S. A. 20,689 242 257 -15Millstones etc. For Grinding etc of Various -7921446804-Bahrain 0 0 .. ..Bangladesh 0 0 9 -9U. K. 144 2 0 2Abrasive Powder etc. on a Base of Textile 7126978,2936805-Congo 0 0 26 -26U. A. E. Dubai 939 11 0 11U. K. 4,492 53 0 53U. S. A. 2,861 33 0 33

Rs. US $
(Amount in Thousand)
Difference
EXPORT OF GOODS BY COMMDOITY / COUNTRY AND SERVICES BY TYPE / COUNTRY
269 State Bank of Pakistan
July20 10 200 920 10HS CODE-COMMODITY / COUNTRY
Mineral Wools, Expanded Mineral Material and 3032886806-Saudi Arabia 288 3 0 3Panel, Boards, Tiles & Similar Articles of -6666006808-Sri Lanka 0 0 66 -66Articles of Plaster or Items Based on Plaster -2983544,6046809-Afghanistan 4,325 51 0 51Oman 0 0 22 -22Qatar 0 0 9 -9South Korea 0 0 2 -2U. A. E. Dubai 279 3 50 -47Articles of Cement, Concrete or Artificial Stone -1,5011,70120017,0836810-Canada 164 2 0 2China 0 0 30 -30Greece 0 0 7 -7India 9,979 117 185 -69Philippines 0 0 1 -1Qatar 1,051 12 0 12Saudi Arabia 3,035 36 40 -4St. Lucia 0 0 1,234 -1,234Tanzania 0 0 74 -74U. A. E. Dubai 2,854 33 74 -40U. A. E. Sharjah 0 0 57 -57Articles of Asbestos-Cement, Cellulose 1,8619412,802239,5916811-Afghanistan 235,856 2,758 905 1,854Canada 3,735 44 0 44Qatar 0 0 10 -10U. A. E. Dubai 0 0 26 -26Fabricated Asbestos Fibers, Items of Mixtures etc -3114231129,6036812-Belgium 0 0 3 -3Congo 2,537 30 0 30France 517 6 0 6Russian Federation 0 0 15 -15Saudi Arabia 2,905 34 0 34U. A. E. Dubai 0 0 406 -406U. S. A. 3,644 43 0 43Articles of Stone or Other Mineral Substance 4091,6462,055175,7236815-Australia 789 9 11 -2Austria 425 5 17 -12Azerbaijan 526 6 0 6Bangladesh 470 6 0 6Belgium 0 0 27 -27Brazil 1,941 23 0 23Canada 1,212 14 15 -1China 74,031 866 392 474Czech Republic 218 3 0 3Egypt 1,710 20 26 -6Fiji 0 0 4 -4France 3,850 45 112 -67Germany 6,808 80 105 -25Hong Kong 1,820 21 0 21Hungary 240 3 0 3Iceland 0 0 1 -1Iraq 1,491 17 0 17Italy 2,038 24 55 -32Japan 2,243 26 18 8Jordan 527 6 0 6Laos 1,178 14 0 14Lebanon 3,204 37 0 37Malaysia 273 3 0 3Mauritius 850 10 0 10Mongolia 855 10 0 10Morocco 788 9 20 -11Netherlands (Holland) 1,633 19 4 15Poland 0 0 8 -8
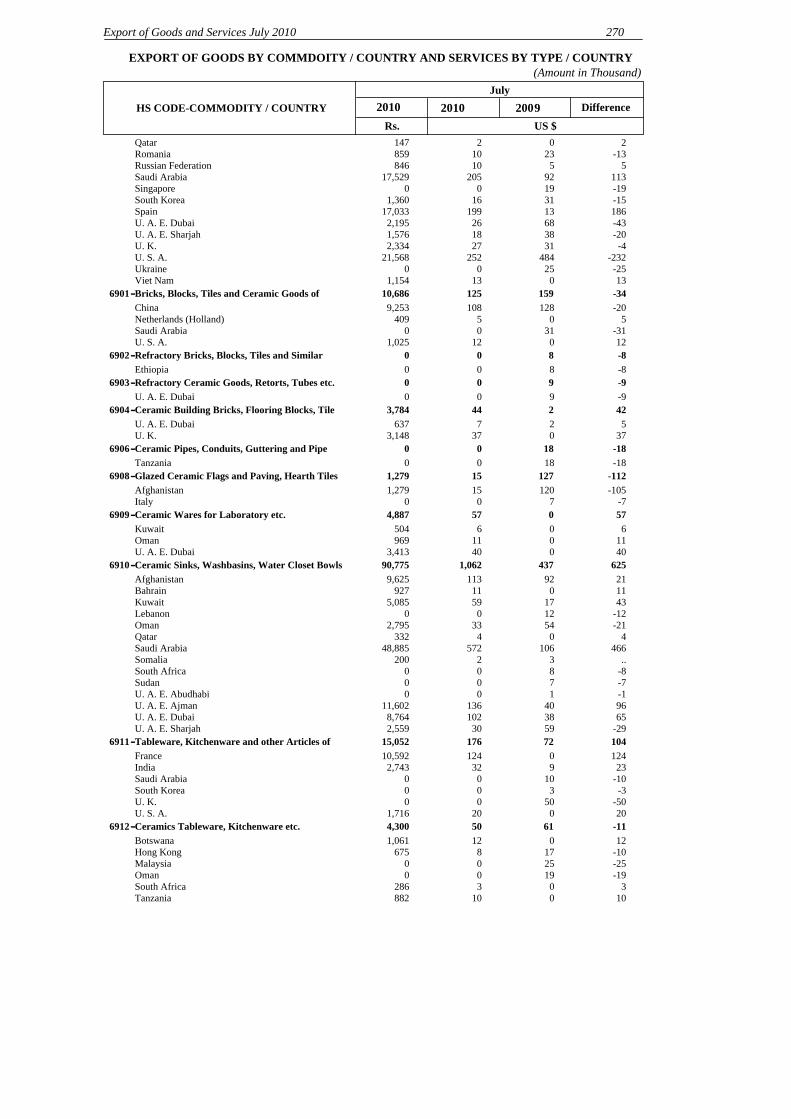
Rs. US $
(Amount in Thousand)
Difference
EXPORT OF GOODS BY COMMDOITY / COUNTRY AND SERVICES BY TYPE / COUNTRY
Export of Goods and Services July 2010 270
July20 10 200 920 10HS CODE-COMMODITY / COUNTRY
Qatar 147 2 0 2Romania 859 10 23 -13Russian Federation 846 10 5 5Saudi Arabia 17,529 205 92 113Singapore 0 0 19 -19South Korea 1,360 16 31 -15Spain 17,033 199 13 186U. A. E. Dubai 2,195 26 68 -43U. A. E. Sharjah 1,576 18 38 -20U. K. 2,334 27 31 -4U. S. A. 21,568 252 484 -232Ukraine 0 0 25 -25Viet Nam 1,154 13 0 13Bricks, Blocks, Tiles and Ceramic Goods of -3415912510,6866901-China 9,253 108 128 -20Netherlands (Holland) 409 5 0 5Saudi Arabia 0 0 31 -31U. S. A. 1,025 12 0 12Refractory Bricks, Blocks, Tiles and Similar -88006902-Ethiopia 0 0 8 -8Refractory Ceramic Goods, Retorts, Tubes etc. -99006903-U. A. E. Dubai 0 0 9 -9Ceramic Building Bricks, Flooring Blocks, Tile 422443,7846904-U. A. E. Dubai 637 7 2 5U. K. 3,148 37 0 37Ceramic Pipes, Conduits, Guttering and Pipe -1818006906-Tanzania 0 0 18 -18Glazed Ceramic Flags and Paving, Hearth Tiles -112127151,2796908-Afghanistan 1,279 15 120 -105Italy 0 0 7 -7Ceramic Wares for Laboratory etc. 570574,8876909-Kuwait 504 6 0 6Oman 969 11 0 11U. A. E. Dubai 3,413 40 0 40Ceramic Sinks, Washbasins, Water Closet Bowls 6254371,06290,7756910-Afghanistan 9,625 113 92 21Bahrain 927 11 0 11Kuwait 5,085 59 17 43Lebanon 0 0 12 -12Oman 2,795 33 54 -21Qatar 332 4 0 4Saudi Arabia 48,885 572 106 466Somalia 200 2 3 ..South Africa 0 0 8 -8Sudan 0 0 7 -7U. A. E. Abudhabi 0 0 1 -1U. A. E. Ajman 11,602 136 40 96U. A. E. Dubai 8,764 102 38 65U. A. E. Sharjah 2,559 30 59 -29Tableware, Kitchenware and other Articles of 1047217615,0526911-France 10,592 124 0 124India 2,743 32 9 23Saudi Arabia 0 0 10 -10South Korea 0 0 3 -3U. K. 0 0 50 -50U. S. A. 1,716 20 0 20Ceramics Tableware, Kitchenware etc. -1161504,3006912-Botswana 1,061 12 0 12Hong Kong 675 8 17 -10Malaysia 0 0 25 -25Oman 0 0 19 -19South Africa 286 3 0 3Tanzania 882 10 0 10

Rs. US $
(Amount in Thousand)
Difference
EXPORT OF GOODS BY COMMDOITY / COUNTRY AND SERVICES BY TYPE / COUNTRY
271 State Bank of Pakistan
July20 10 200 920 10HS CODE-COMMODITY / COUNTRY
U. A. E. Dubai 335 4 0 4U. S. A. 1,061 12 0 12Cullet and other Waste and Scrap of Glass -1495816,9247001-Afghanistan 6,924 81 68 13Saudi Arabia 0 0 5 -5U. A. E. Dubai 0 0 22 -22Glass in Balls, Rods or Tubes Unworked 1218302,5847002-Bangladesh 0 0 12 -12Sri Lanka 1,271 15 0 15U. K. 1,313 15 0 15Viet Nam 0 0 6 -6Drawn and Blown Glass in Sheets etc. -38556718215,5697004-Afghanistan 14,821 173 389 -216Bangladesh 748 9 0 9Kuwait 0 0 176 -176Netherlands (Holland) 0 0 2 -2Float Glass and Surface Ground or Polished -5324419116,3167005-Afghanistan 16,316 191 35 156India 0 0 190 -190Indonesia 0 0 4 -4U. A. E. Dubai 0 0 15 -15Glass Containers for Packing etc and Glass 15345260551,7327010-Afghanistan 6,169 72 10 62Bangladesh 10,125 118 0 118Cameroon 866 10 0 10China 47 1 0 1Cyprus 1,137 13 0 13Egypt 0 0 17 -17Ethiopia 0 0 14 -14Indonesia 0 0 9 -9Kenya 1,160 14 0 14Kuwait 0 0 110 -110Lebanon 1,027 12 0 12Mozambique 1,286 15 0 15New Zealand 645 8 0 8Oman 0 0 8 -8Philippines 0 0 230 -230Saudi Arabia 2,802 33 13 20South Africa 0 0 3 -3Syrian Arab Republic 2,825 33 0 33Tanzania 974 11 16 -5Turkey 679 8 9 -1U. A. E. Dubai 0 0 1 -1U. A. E. Sharjah 0 0 10 -10U. K. 340 4 0 4Zambia 21,652 253 0 253Glassware for Table, Kitchen, Toilet etc. NES -356393373,1567013-Afghanistan 0 0 393 -393Kuwait 2,047 24 0 24U. A. E. Dubai 855 10 0 10U. S. A. 56 1 0 1Uganda 198 2 0 2Glasses of Clock, watch, Spectacle etc Not 2021287015-Netherlands (Holland) 128 2 0 2Glass Paving Blocks, Bricks, Squares, Tiles and 370373,2017016-U. K. 1,413 17 0 17U. S. A. 1,788 21 0 21Glass Fibers and Articles Thereof (Yarn Etc.) -606222007019-Algeria 0 0 4 -4China 0 0 48 -48Kuwait 200 2 10 -7Articles of Glass NES -55007020-U. S. A. 0 0 5 -5

Rs. US $
(Amount in Thousand)
Difference
EXPORT OF GOODS BY COMMDOITY / COUNTRY AND SERVICES BY TYPE / COUNTRY
Export of Goods and Services July 2010 272
July20 10 200 920 10HS CODE-COMMODITY / COUNTRY
Precious and Semi Precious Stones NES 14615730325,9497103-Afghanistan 0 0 .. ..Australia 122 1 .. 1Austria 0 0 2 -2Canada 26 .. 11 -11China 227 3 7 -5France 0 0 4 -4Germany 1,287 15 9 6Hong Kong 3,569 42 0 42India 2,659 31 8 23Indonesia 0 0 .. ..Italy 900 11 2 9Japan 620 7 6 1Netherlands (Holland) 0 0 5 -5Philippines 189 2 0 2Singapore 0 0 1 -1Spain 0 0 1 -1Thailand 1,256 15 30 -15U. A. E. Dubai 44 1 3 -2U. K. 490 6 7 -2U. S. A. 14,561 170 60 110Synthetic Precious or Semi precious Stones, Not -2347242,0827104-France 0 0 .. ..Saudi Arabia 2,082 24 46 -21U. S. A. 0 0 1 -1Dust / Powder of Natural or Synthetic Precious / -340340007105-U. S. A. 0 0 340 -340Base Metal or Silver, Clad with Gold 305030526,0687109-Saudi Arabia 340 4 0 4U. S. A. 25,728 301 0 301Waste and Scrap of Precious Metal or of Metal 355585,0017112-Other Countries 5,001 58 27 31U. A. E. Dubai 0 0 27 -27Articles of Jewelry and Parts thereof or Precious 6881,0791,767151,1247113-Canada 6,825 80 128 -48Germany 104 1 0 1Hong Kong 0 0 12 -12Italy 801 9 1 8U. A. E. Dubai 114,235 1,336 606 730U. A. E. Sharjah 0 0 3 -3U. K. 12,275 144 136 8U. S. A. 16,885 197 193 4Articles of Natural or Cultured Pearls, Precious 2935645,4757116-Canada 0 0 4 -4Germany 2,311 27 0 27Hong Kong 2,565 30 0 30India 402 5 9 -5U. K. 32 .. 0 ..U. S. A. 164 2 22 -20Imitation Jewelry 1311242,0447117-Germany 0 0 4 -4Italy 148 2 2 ..Japan 63 1 0 1Thailand 173 2 .. 2Turkey 0 0 2 -2U. A. E. Dubai 104 1 1 ..U. K. 0 0 2 -2U. S. A. 1,556 18 1 17Pig Iron and Spiegeleisen in Pigs, Blocks or -15,49615,5961008,5447201-China 0 0 3,982 -3,982Hong Kong 0 0 6,743 -6,743Switzerland 0 0 4,829 -4,829U. A. E. Dubai 8,544 100 43 57

Rs. US $
(Amount in Thousand)
Difference
EXPORT OF GOODS BY COMMDOITY / COUNTRY AND SERVICES BY TYPE / COUNTRY
273 State Bank of Pakistan
July20 10 200 920 10HS CODE-COMMODITY / COUNTRY
Spongy Ferrous Products and Iron 99.94% Pure 20,148020,1481,722,7167203-China 860,425 10,063 0 10,063Hong Kong 409,883 4,794 0 4,794Switzerland 452,408 5,291 0 5,291Ferrous Waste and Scrap 8876331,520129,9417204-Afghanistan 0 0 221 -221Belgium 16,836 197 0 197China 8,545 100 0 100Hong Kong 3,679 43 0 43India 1,445 17 0 17Italy 0 0 39 -39Japan 0 0 26 -26Netherlands (Holland) 28,423 332 0 332Qatar 425 5 0 5U. A. E. Ajman 0 0 25 -25U. A. E. Dubai 26,816 314 132 182U. A. E. Sharjah 3,639 43 64 -21U. K. 38,333 448 40 408U. S. A. 1,801 21 86 -65Pig Iron, Spiegel, Iron or Steel Granules and 1121322419,1937205-China 19,193 224 210 14Oman 0 0 3 -3Iron and Non-alloy Steel in Ingots etc. NES 266322,7717206-Bahrain 986 12 0 12Saudi Arabia 1,785 21 0 21U. A. E. Dubai 0 0 6 -6U. S. A. 0 0 .. ..Semi-finished Products of Iron or Non Alloy Steel -1542561028,7617207-Afghanistan 8,761 102 256 -154Flat-Roll Iron and Non-Alloy >600mm, Clad, -510510007210-Canada 0 0 510 -510Flat-Roll Iron and Non-Alloy Steel <600mm, -262262007212-Afghanistan 0 0 262 -262Bars and Rods, Iron and Non-Alloy Steel NES -55007214-Afghanistan 0 0 5 -5Angles, Shapes and Sections of Iron and -39954114212,1397216-Afghanistan 12,139 142 541 -399Wire of Iron and Non-Alloy Steel 100108527217-Spain 0 0 .. ..U. A. E. Sharjah 852 10 0 10Stainless Steel in Ingots etc. and Semi-finished -192786667218-France 0 0 16 -16Other Countries 0 0 2 -2Singapore 0 0 9 -9U. A. E. Dubai 666 8 0 8Flat-rolled Stainless Steel Products, Under -11007220-Kuwait 0 0 1 -1Bars and Rods, Hot-Rolled in irregular Wound -190190007221-Hong Kong 0 0 49 -49India 0 0 59 -59Kenya 0 0 30 -30Mozambique 0 0 22 -22U. A. E. Ajman 0 0 30 -30Other Bars and Rods of Stainless Steel etc. -66007222-U. S. A. 0 0 6 -6Other Bars and Rods of Alloy Steel 450453,8247228-U. A. E. Sharjah 3,109 36 0 36U. S. A. 715 8 0 8Sheet Piling of Iron or Steel, Welded Angles etc. -5151007301-Afghanistan 0 0 30 -30

Rs. US $
(Amount in Thousand)
Difference
EXPORT OF GOODS BY COMMDOITY / COUNTRY AND SERVICES BY TYPE / COUNTRY
Export of Goods and Services July 2010 274
July20 10 200 920 10HS CODE-COMMODITY / COUNTRY
Bahrain 0 0 4 -4U. A. E. Dubai 0 0 18 -18Tubes, Pipes and Hollow Profiles of Cast Iron 4556581,11395,2067303-Afghanistan 94,376 1,104 654 449France 829 10 0 10Saudi Arabia 0 0 4 -4Tubes, Pipes and Hollow Profiles Seamless of 58541129,6137304-Afghanistan 0 0 54 -54Syrian Arab Republic 9,613 112 0 112Tubes and Pipes NES, Diameter more than -111,0601,04989,6817305-Afghanistan 89,681 1,049 944 105Iraq 0 0 116 -116Tubes, Pipes and Hollow Profiles NES of Iron 39354293579,9657306-Afghanistan 79,104 925 390 535Bangladesh 0 0 150 -150U. A. E. Dubai 861 10 2 8Tube or Pipe Fittings of Iron or Steel Like -1,0312,3321,301111,2307307-Afghanistan 17,836 209 0 209Bahrain 21,730 254 0 254Ecuador 0 0 154 -154Nigeria 0 0 1,567 -1,567Sri Lanka 38,716 453 612 -159U. K. 32,948 385 0 385Structures NES and Parts Thereof of Iron or 3,0203,7286,748576,9337308-Afghanistan 558,212 6,529 3,702 2,827Kuwait 250 3 0 3Other Countries 11,058 129 0 129Singapore 3,784 44 26 18U. A. E. Dubai 3,628 42 0 42Tanks etc Less than 300 Liter Capacity of Iron or 10715426122,3047310-Canada 983 12 12 ..Japan 1,703 20 0 20U. A. E. Dubai 19,617 229 142 88Stranded Wire, Rope etc, Not Electrically 63491129,5707312-Afghanistan 3,095 36 49 -13South Africa 4,665 55 0 55Turkey 1,810 21 0 21Cloth, Grill, Netting and Fencing of Iron or Steel -39110716,0377314-Afghanistan 6,037 71 0 71Bangladesh 0 0 69 -69Sri Lanka 0 0 36 -36U. A. E. Sharjah 0 0 5 -5Chain and Parts of Iron or Steel 3032167315-Australia 49 1 0 1Kazakhstan 167 2 0 2Anchors, Grapnels and Parts Thereof of Iron of 2022037316-U. A. E. Abudhabi 203 2 0 2Screws, Bolts, Nuts, Washers etc. Iron or Steel 3916554,6987318-Belgium 1,066 12 0 12Germany 200 2 0 2Iran 0 0 16 -16Kuwait 2,462 29 0 29U. A. E. Dubai 99 1 0 1U. S. A. 872 10 0 10Springs and Leaves for Springs of Iron or Steel -657514,3317320-Hungary 2,530 30 15 14Russian Federation 0 0 42 -42U. S. A. 1,801 21 0 21Stoves, Ranges, Grates, Cookers and Parts 10118528624,4887321-Bahrain 0 0 10 -10Cameroon 428 5 0 5

Rs. US $
(Amount in Thousand)
Difference
EXPORT OF GOODS BY COMMDOITY / COUNTRY AND SERVICES BY TYPE / COUNTRY
275 State Bank of Pakistan
July20 10 200 920 10HS CODE-COMMODITY / COUNTRY
China 770 9 0 9Qatar 852 10 0 10Saudi Arabia 0 0 158 -158Tanzania 225 3 0 3U. A. E. Dubai 43 1 0 1U. A. E. Sharjah 1,537 18 17 1U. K. 20,634 241 0 241Table, Kitchen or Household Articles & Parts of 2154225721,9667323-Afghanistan 21,966 257 35 222U. A. E. Dubai 0 0 2 -2U. S. A. 0 0 3 -3Yemen Arab Republic 0 0 2 -2Sanitary Ware and Parts of Iron or Steel 4832806,8837324-Namibia 0 0 21 -21Saudi Arabia 5,985 70 11 59U. A. E. Abudhabi 21 .. 0 ..U. A. E. Dubai 705 8 0 8U. A. E. Sharjah 171 2 0 2Articles of Iron or Steel, NES 814615413,1897326-Afghanistan 0 0 20 -20Australia 0 0 1 -1Belgium 0 0 6 -6Chile 281 3 0 3Germany 3,880 45 0 45Italy 0 0 27 -27Kuwait 2,930 34 17 17Other Countries 0 0 8 -8Poland 0 0 8 -8Saudi Arabia 109 1 6 -5South Korea 509 6 0 6Tanzania 0 0 5 -5Turkey 0 0 2 -2U. A. E. Dubai 640 7 1 7U. A. E. Sharjah 0 0 11 -11U. K. 2,367 28 0 28U. S. A. 2,138 25 35 -10Zimbabwe 335 4 0 4Copper Mattes; Cement Copper, Precipitated -774862887,5047401-Afghanistan 2,907 34 0 34China 0 0 214 -214Madagascar 4,597 54 0 54Somalia 0 0 127 -127Sudan 0 0 .. ..U. A. E. Dubai 0 0 520 -520Refined Copper and Copper Alloys, Unwrought 4311,0611,492127,6057403-Afghanistan 106,681 1,248 1,059 189Belgium 1,403 16 0 16China 596 7 0 7U. A. E. Dubai 12,302 144 0 144U. A. E. Sharjah 4,274 50 0 50U. K. 0 0 2 -2U. S. A. 2,349 27 0 27Copper Waste and Scrap 3149140534,5917404-China 0 0 31 -31Germany 7,744 91 0 91Other Countries 12,411 145 0 145U. A. E. Dubai 5,391 63 30 33U. A. E. Sharjah 9,046 106 0 106U. K. 0 0 30 -30Copper Bars, Rods and Profiles -363821487407-Tanzania 0 0 38 -38U. K. 148 2 0 2

Rs. US $
(Amount in Thousand)
Difference
EXPORT OF GOODS BY COMMDOITY / COUNTRY AND SERVICES BY TYPE / COUNTRY
Export of Goods and Services July 2010 276
July20 10 200 920 10HS CODE-COMMODITY / COUNTRY
Copper Wire -2,8133,31249942,6337408-China 27,924 327 2,091 -1,764Italy 0 0 116 -116Malaysia 0 0 3 -3Netherlands (Holland) 8,549 100 557 -457Saudi Arabia 0 0 143 -143Sri Lanka 2,138 25 0 25U. A. E. Dubai 0 0 314 -314U. A. E. Sharjah 0 0 77 -77U. K. 540 6 9 -2U. S. A. 3,483 41 2 39Copper Plates, Sheets and Strip, of Thickness -22007409-Kenya 0 0 2 -2Copper Tubes and Pipes -596786847411-Bangladesh 0 0 2 -2Japan 0 0 9 -9U. A. E. Dubai 684 8 0 8U. K. 0 0 56 -56Nails, Tacks etc. of Copper 5054387415-Oman 142 2 0 2U. A. E. Dubai 296 3 0 3Household Articles and Parts 30921051944,3467418-Afghanistan 2,565 30 0 30Bahrain 0 0 32 -32Mauritius 869 10 0 10Other Countries 0 0 9 -9Saudi Arabia 39,858 466 25 441Sri Lanka 253 3 0 3U. A. E. Ajman 0 0 133 -133U. A. E. Dubai 800 9 10 ..Articles of Copper NES 2415393,3497419-Iran 10 .. 0 ..U. K. 3,339 39 15 24Nickel Mattes, Nickel Oxide Sinters and other -3636007501-Hong Kong 0 0 36 -36Aluminum, Unwrought -211251048,9047601-Germany 0 0 34 -34Philippines 3,216 38 0 38Saudi Arabia 4,826 56 0 56South Africa 0 0 30 -30Sri Lanka 172 2 0 2U. A. E. Dubai 0 0 61 -61U. K. 690 8 0 8Aluminum Waste and Scrap -771861907,6697602-Germany 7,669 90 0 90Netherlands (Holland) 0 0 861 -861Aluminum Bars, Rods and Profiles 190191,6327604-Afghanistan 1,632 19 0 19Aluminum Foil -1515007607-Nigeria 0 0 15 -15Aluminum Tube or Pipe Fittings 210521518,3757609-Kenya 150 2 0 2Russian Federation 1,096 13 0 13South Africa 10,881 127 0 127Spain 0 0 5 -5U. A. E. Dubai 5,555 65 0 65U. K. 694 8 0 8Aluminum Structures NES -1010007610-U. A. E. Dubai 0 0 10 -10Tanks etc Over 300 Liter Capacity, Aluminum 170171,4117611-China 1,411 17 0 17

Rs. US $
(Amount in Thousand)
Difference
EXPORT OF GOODS BY COMMDOITY / COUNTRY AND SERVICES BY TYPE / COUNTRY
277 State Bank of Pakistan
July20 10 200 920 10HS CODE-COMMODITY / COUNTRY
Table, Kitchen or other Household Articles and 5851,2741,859158,9417615-Afghanistan 50,181 587 541 46Australia 1,896 22 5 17Kuwait 0 0 9 -9Madagascar 307 4 0 4Oman 0 0 15 -15Saudi Arabia 28,874 338 89 249South Africa 7,262 85 9 76Spain 8,586 100 131 -31Tanzania 5,196 61 69 -8U. A. E. Ajman 2,242 26 60 -34U. A. E. Dubai 27,079 317 176 140U. A. E. Sharjah 0 0 9 -9U. K. 19,697 230 161 69U. S. A. 7,621 89 0 89Articles o Aluminum NES -9727317615,0167616-Afghanistan 8,550 100 100 ..Poland 143 2 0 2Saudi Arabia 1,280 15 15 ..South Africa 1,127 13 24 -11U. A. E. Dubai 0 0 42 -42U. K. 3,916 46 82 -36U. S. A. 0 0 10 -10Lead, Unwrought -210292826,9997801-India 1,870 22 201 -179Indonesia 0 0 49 -49Sri Lanka 0 0 1 -1U. A. E. Ajman 5,129 60 0 60U. A. E. Dubai 0 0 40 -40Lead Waste ad Scrap -1,0711,68761652,7067802-Belgium 0 0 163 -163China 4,804 56 143 -87Hong Kong 0 0 10 -10India 34,688 406 122 284Japan 0 0 148 -148Netherlands (Holland) 0 0 28 -28Philippines 0 0 26 -26South Korea 9,555 112 19 93Sri Lanka 0 0 2 -2U. A. E. Dubai 872 10 660 -650U. K. 0 0 351 -351U. S. A. 2,786 33 14 19Zinc Waste and Scrap 8086847902-U. A. E. Dubai 684 8 0 8Tin, Unwrought -99008001-Qatar 0 0 3 -3U. A. E. Dubai 0 0 5 -5Tungsten and Articles Including Waste and 120012010,2338101-Italy 10,233 120 0 120Antimony and Articles Thereof Including Waste -9595008110-U. A. E. Sharjah 0 0 95 -95Beryllium, Chromium, Germanium, Vanadium, 1,9605762,536216,8508112-Comoros 21,762 255 0 255India 0 0 6 -6Iraq 2,852 33 0 33Mauritius 126,955 1,485 0 1,485Oman 0 0 478 -478Sri Lanka 0 0 6 -6U. A. E. Dubai 47,145 551 0 551U. K. 18,135 212 0 212Yemen Arab Republic 0 0 85 -85Hand tools and Tools Used in Agriculture etc. 2927564,8278201-Germany 2,048 24 3 21

Rs. US $
(Amount in Thousand)
Difference
EXPORT OF GOODS BY COMMDOITY / COUNTRY AND SERVICES BY TYPE / COUNTRY
Export of Goods and Services July 2010 278
July20 10 200 920 10HS CODE-COMMODITY / COUNTRY
Norway 0 0 4 -4Saudi Arabia 500 6 0 6U. S. A. 2,279 27 21 6Files, Rasps, Pliers, Metal cutting Shears etc. 2010302,5628203-France 0 0 2 -2Netherlands (Holland) 0 0 2 -2Poland 0 0 2 -2South Africa 0 0 1 -1Sweden 0 0 3 -3Tanzania 852 10 0 10U. K. 0 0 1 -1U. S. A. 0 0 .. ..Zimbabwe 1,710 20 0 20Hand tools NES Like Blow, Torches, Anvils etc. -95111161,3718205-Australia 0 0 6 -6Canada 61 1 16 -15Finland 111 1 0 1France 92 1 4 -3Germany 0 0 20 -20Hong Kong 0 0 7 -7Italy 0 0 1 -1Japan 0 0 43 -43Norway 0 0 1 -1Saudi Arabia 149 2 0 2South Africa 0 0 4 -4Thailand 0 0 1 -1U. K. 0 0 3 -3U. S. A. 957 11 6 5Interchange Tools for Hand or Machine Tools -25261888207-Bangladesh 0 0 14 -14Canada 88 1 5 -4U. S. A. 0 0 6 -6Knives and Blades for Machines and Appliances 2516018515,7818208-Argentina 1,026 12 0 12Australia 0 0 1 -1Bulgaria 0 0 .. ..China 8 .. 0 ..France 1,705 20 0 20Germany 7,070 83 68 15Netherlands (Holland) 1,871 22 43 -21Other Countries 0 0 9 -9South Africa 692 8 6 2Spain 1,941 23 6 17Sweden 0 0 2 -2Switzerland 0 0 1 -1U. K. 78 1 11 -10U. S. A. 1,390 16 12 4Hand Operated Mechanical Appliances -3632518210-U. S. A. 251 3 6 -3Knives With Blades and Blades for Knives NES -13056343337,0028211-Belgium 0 0 23 -23Denmark 0 0 1 -1France 11,281 132 133 -1Germany 7,234 85 35 49Hungary 0 0 1 -1Italy 988 12 47 -36Malaysia 0 0 3 -3New Zealand 27 .. 0 ..Oman 0 0 14 -14South Africa 660 8 28 -20Spain 0 0 3 -3Thailand 0 0 1 -1U. A. E. Ajman 0 0 12 -12U. A. E. Dubai 0 0 20 -20

Rs. US $
(Amount in Thousand)
Difference
EXPORT OF GOODS BY COMMDOITY / COUNTRY AND SERVICES BY TYPE / COUNTRY
279 State Bank of Pakistan
July20 10 200 920 10HS CODE-COMMODITY / COUNTRY
U. K. 1,377 16 18 -2U. S. A. 15,434 181 223 -43Razors and Razor Blades 7064271260,8728212-Bangladesh 10,236 120 50 70China 7,996 94 32 62Cyprus 0 0 31 -31Iran 10,233 120 139 -19Italy 198 2 0 2Kuwait 3,433 40 0 40Other Countries 0 0 55 -55Saudi Arabia 6,936 81 141 -60Spain 0 0 22 -22Syrian Arab Republic 12,822 150 156 -6U. A. E. Dubai 0 0 15 -15U. K. 914 11 0 11Uganda 0 0 2 -2Viet Nam 8,104 95 0 95Scissors, Tailors' Shears and Similar Shears and -6980119648213-Australia 0 0 3 -3China 0 0 5 -5Greece 0 0 3 -3Hong Kong 0 0 10 -10Myanmar 0 0 2 -2Saudi Arabia 109 1 0 1South Africa 0 0 31 -31U. S. A. 855 10 25 -15Articles of Cutlery NES and Manicure Sets etc. 4671,2861,753149,8468214-Argentina 0 0 3 -3Australia 2,182 26 20 5Austria 3,113 36 0 36Bahrain 300 4 6 -3Belgium 594 7 2 5Brazil 25,517 298 71 227Canada 65 1 0 1Chile 0 0 5 -5Colombia 0 0 11 -11Czech Republic 3,072 36 5 30Denmark 0 0 2 -2Egypt 0 0 13 -13France 8,726 102 34 68Germany 10,735 126 65 60Greece 3,049 36 51 -16Hong Kong 493 6 0 6India 330 4 0 4Ireland 463 5 3 2Italy 15,655 183 115 68Japan 94 1 17 -16Lebanon 0 0 7 -7Mexico 850 10 15 -5Netherlands (Holland) 249 3 28 -25New Zealand 372 4 0 4Peru 262 3 2 1Poland 2,284 27 29 -2Romania 324 4 17 -13Russian Federation 1,727 20 109 -89Saudi Arabia 602 7 25 -18Singapore 342 4 3 1Slovak Republic 515 6 0 6South Africa 898 10 0 10South Korea 2,610 31 19 11Spain 4,104 48 22 26Sri Lanka 0 0 .. ..Swaziland 0 0 8 -8Sweden 1,478 17 1 17Switzerland 0 0 6 -6

Rs. US $
(Amount in Thousand)
Difference
EXPORT OF GOODS BY COMMDOITY / COUNTRY AND SERVICES BY TYPE / COUNTRY
Export of Goods and Services July 2010 280
July20 10 200 920 10HS CODE-COMMODITY / COUNTRY
Thailand 299 4 .. 3Turkey 262 3 15 -12U. A. E. Dubai 1,591 19 33 -14U. K. 8,995 105 47 58U. S. A. 47,341 554 476 78Uruguay 355 4 0 4Tableware etc. of Base Metal and Parts of Base 143514812,6288215-Bangladesh 467 5 0 5Belgium 1,092 13 0 13Canada 375 4 0 4Chile 1,977 23 0 23France 4,133 48 0 48Malaysia 257 3 0 3U. A. E. Dubai 0 0 5 -5U. S. A. 4,326 51 0 51Hardware, Fixtures, Castors etc. and Part -110308302-Saudi Arabia 30 .. 0 ..U. K. 0 0 1 -1Office and Desk Equipments and Parts 101828304-Saudi Arabia 82 1 0 1Loose-leaf Binder etc. Fittings, Paper Cups etc. -22008305-Bangladesh 0 0 2 -2Bells, Gongs and the Like, Picture and Frames -2980514,3438306-China 0 0 3 -3Jordan 1,279 15 0 15Saudi Arabia 1,653 19 18 1Sri Lanka 557 7 0 7Syrian Arab Republic 854 10 0 10U. A. E. Abudhabi 0 0 5 -5Yemen Arab Republic 0 0 54 -54Flexible Tubing of Base Metal -4141008307-Afghanistan 0 0 41 -41Clasps, Frames, Buckles, Hooks etc. Beads and 720726,1258308-Australia 22 .. 0 ..Japan 400 5 0 5Saudi Arabia 5,702 67 0 67Sign and Name Plates and Symbols etc. 11001109,4308310-Russian Federation 9,430 110 0 110Wire, Rods etc. ror Soldering etc. -222222008311-U. A. E. Dubai 0 0 222 -222Steam etc Generating Boilers NES 880887,5628402-Bangladesh 5,805 68 0 68Japan 1,317 15 0 15Saudi Arabia 440 5 0 5Auxiliary Plant Used With Boilers; Condensers -1212008404-Ethiopia 0 0 12 -12Spark-Ignition Reciprocating or Rotary Internal 9097828407-U. K. 782 9 0 9Compression-Ignition Internal Combustion -3838008408-Jordan 0 0 35 -35Peru 0 0 3 -3Parts For Combustion Engines etc. -123190675,7708409-Bangladesh 260 3 1 2Canada 0 0 1 -1Germany 0 0 47 -47Sudan 332 4 0 4U. K. 5,178 61 2 59U. S. A. 0 0 140 -140Hydraulic Turbines, Water Wheels and -23452529124,9158410-Brazil 4,788 56 0 56Egypt 0 0 15 -15
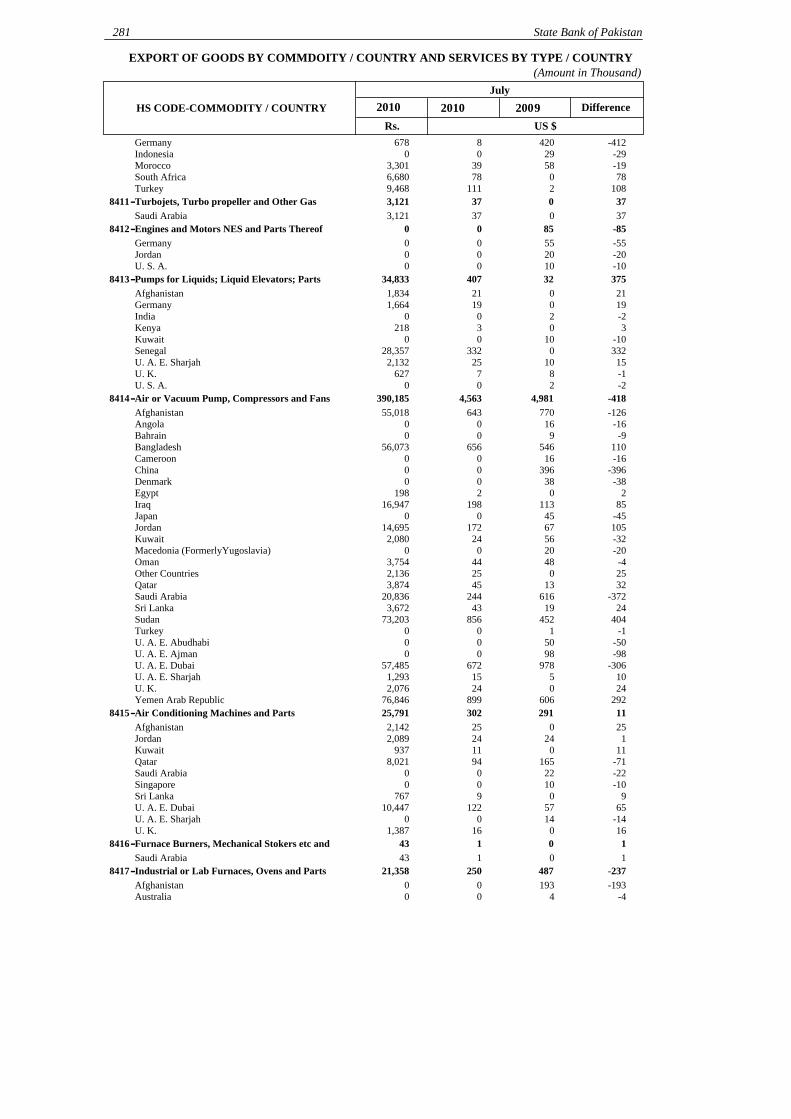
Rs. US $
(Amount in Thousand)
Difference
EXPORT OF GOODS BY COMMDOITY / COUNTRY AND SERVICES BY TYPE / COUNTRY
281 State Bank of Pakistan
July20 10 200 920 10HS CODE-COMMODITY / COUNTRY
Germany 678 8 420 -412Indonesia 0 0 29 -29Morocco 3,301 39 58 -19South Africa 6,680 78 0 78Turkey 9,468 111 2 108Turbojets, Turbo propeller and Other Gas 370373,1218411-Saudi Arabia 3,121 37 0 37Engines and Motors NES and Parts Thereof -8585008412-Germany 0 0 55 -55Jordan 0 0 20 -20U. S. A. 0 0 10 -10Pumps for Liquids; Liquid Elevators; Parts 3753240734,8338413-Afghanistan 1,834 21 0 21Germany 1,664 19 0 19India 0 0 2 -2Kenya 218 3 0 3Kuwait 0 0 10 -10Senegal 28,357 332 0 332U. A. E. Sharjah 2,132 25 10 15U. K. 627 7 8 -1U. S. A. 0 0 2 -2Air or Vacuum Pump, Compressors and Fans -4184,9814,563390,1858414-Afghanistan 55,018 643 770 -126Angola 0 0 16 -16Bahrain 0 0 9 -9Bangladesh 56,073 656 546 110Cameroon 0 0 16 -16China 0 0 396 -396Denmark 0 0 38 -38Egypt 198 2 0 2Iraq 16,947 198 113 85Japan 0 0 45 -45Jordan 14,695 172 67 105Kuwait 2,080 24 56 -32Macedonia (FormerlyYugoslavia) 0 0 20 -20Oman 3,754 44 48 -4Other Countries 2,136 25 0 25Qatar 3,874 45 13 32Saudi Arabia 20,836 244 616 -372Sri Lanka 3,672 43 19 24Sudan 73,203 856 452 404Turkey 0 0 1 -1U. A. E. Abudhabi 0 0 50 -50U. A. E. Ajman 0 0 98 -98U. A. E. Dubai 57,485 672 978 -306U. A. E. Sharjah 1,293 15 5 10U. K. 2,076 24 0 24Yemen Arab Republic 76,846 899 606 292Air Conditioning Machines and Parts 1129130225,7918415-Afghanistan 2,142 25 0 25Jordan 2,089 24 24 1Kuwait 937 11 0 11Qatar 8,021 94 165 -71Saudi Arabia 0 0 22 -22Singapore 0 0 10 -10Sri Lanka 767 9 0 9U. A. E. Dubai 10,447 122 57 65U. A. E. Sharjah 0 0 14 -14U. K. 1,387 16 0 16Furnace Burners, Mechanical Stokers etc and 101438416-Saudi Arabia 43 1 0 1Industrial or Lab Furnaces, Ovens and Parts -23748725021,3588417-Afghanistan 0 0 193 -193Australia 0 0 4 -4

Rs. US $
(Amount in Thousand)
Difference
EXPORT OF GOODS BY COMMDOITY / COUNTRY AND SERVICES BY TYPE / COUNTRY
Export of Goods and Services July 2010 282
July20 10 200 920 10HS CODE-COMMODITY / COUNTRY
Congo 0 0 26 -26Djibouti 0 0 9 -9Lebanon 0 0 10 -10Mozambique 0 0 4 -4Tanzania 19,996 234 193 41U. A. E. Dubai 0 0 48 -48U. S. A. 1,362 16 0 16Refrigerators, Freezers, Heat Pumps NES and 1,8562962,152184,0098418-Afghanistan 153,553 1,796 259 1,537India 30 .. 0 ..Kuwait 18,004 211 0 211Saudi Arabia 585 7 0 7U. A. E. Dubai 11,539 135 0 135U. S. A. 299 4 37 -33Machinery etc for Temperature Change -7,4557,479242,0288419-Afghanistan 0 0 29 -29Algeria 0 0 38 -38Bangladesh 0 0 2 -2Djibouti 0 0 4,054 -4,054Gambia 0 0 3,160 -3,160Nigeria 2,028 24 67 -43Saudi Arabia 0 0 7 -7South Africa 0 0 100 -100U. K. 0 0 2 -2Uganda 0 0 20 -20Calendaring or other Rolling Machines Not for 514554,6638420-Bangladesh 1,166 14 0 14Saudi Arabia 3,105 36 0 36U. K. 392 5 4 1Centrifuges, Including Dryers, Filter etc. -167246796,7148421-Azerbaijan 0 0 111 -111Brazil 513 6 0 6Iran 0 0 21 -21U. A. E. Abudhabi 83 1 0 1U. A. E. Dubai 6,118 72 108 -37U. K. 0 0 5 -5Machines, Dishwashing Machines for Cleaning 146473,9818422-Afghanistan 3,270 38 18 21Australia 711 8 0 8Bangladesh 0 0 11 -11Saudi Arabia 0 0 17 -17Weighing Machinery and Weights of all Kinds 2021848423-U. A. E. Dubai 184 2 0 2Mechenical Appliances etc -5975161,3658424-Ireland 0 0 11 -11Spain 0 0 1 -1Sri Lanka 0 0 22 -22Sudan 0 0 12 -12U. K. 1,365 16 12 4Zambia 0 0 17 -17Pulley Tackle and Hoists other than Skip Hoist, 360363,0758425-Germany 1,194 14 0 14Oman 1,881 22 0 22Fork-Lift Truck, Other Work Trucks With Lifts -839839008427-Afghanistan 0 0 839 -839Other Lifting, Handling, Loading and Unloading 2933432727,9218428-Oman 0 0 13 -13Saudi Arabia 0 0 16 -16Sri Lanka 103 1 0 1U. A. E. Dubai 27,819 325 5 320Self-Propelled Bulldozers, Graders, Scrapers etc. 6237998,4668429-Germany 2,135 25 0 25

Rs. US $
(Amount in Thousand)
Difference
EXPORT OF GOODS BY COMMDOITY / COUNTRY AND SERVICES BY TYPE / COUNTRY
283 State Bank of Pakistan
July20 10 200 920 10HS CODE-COMMODITY / COUNTRY
Greece 931 11 0 11Other Countries 411 5 6 -1Saudi Arabia 0 0 5 -5Singapore 1,263 15 26 -11U. A. E. Abudhabi 3,726 44 0 44Other Moving, Grading, leveling, Scraping & 3204836831,4288430-U. A. E. Dubai 31,428 368 0 368U. S. A. 0 0 48 -48Agriculture Machinery for Soil, Lawn 1941220617,6158432-Kenya 8,762 102 12 90Oman 252 3 0 3South Africa 5,567 65 0 65Thailand 513 6 0 6U. A. E. Dubai 2,520 29 0 29Harvesting or Threshing machinery 1114252,1718433-Malaysia 558 7 0 7Tanzania 1,613 19 0 19U. K. 0 0 14 -14Presses, Crushers and Similar Machinery -2474504,3098435-Afghanistan 0 0 25 -25Hong Kong 0 0 2 -2Netherlands (Holland) 0 0 3 -3Saudi Arabia 0 0 5 -5Turkey 1,707 20 0 20U. A. E. Dubai 2,602 30 0 30Yemen Arab Republic 0 0 40 -40Agriculture and Poultry etc Equipment Including 4043468436-U. A. E. Dubai 346 4 0 4Machinery for Cleaning, Sorting or Grading Seed -178178008437-Canada 0 0 178 -178Machinery NES used for Food and Drink and -1,0472,2191,172100,1798438-Afghanistan 11,282 132 31 101Australia 1,454 17 0 17Czech Republic 0 0 411 -411Dominica 2,262 26 0 26France 23,970 280 76 204Germany 2,844 33 2 32Ghana 3,416 40 0 40Guatemala 2,418 28 100 -72Kenya 853 10 0 10Lebanon 1,460 17 0 17Maldives 923 11 0 11Nicaragua 1,447 17 0 17Oman 426 5 0 5Saudi Arabia 1,283 15 0 15Senegal 0 0 34 -34South Africa 626 7 0 7U. A. E. Dubai 35,639 417 1,501 -1,084U. K. 6,271 73 45 28U. S. A. 3,233 38 20 18Zimbabwe 374 4 0 4Machinery for Making Pulp and Making Paper -1717008439-U. K. 0 0 17 -17Bookbinding Machinery Including Book-Sewing -1818008440-Bangladesh 0 0 2 -2U. S. A. 0 0 17 -17Machines for Making Pulp and Paper and Parts -58137796,7448441-Afghanistan 942 11 105 -94Australia 2,799 33 6 27Bangladesh 0 0 10 -10Germany 437 5 7 -2Saudi Arabia 2,565 30 4 26U. A. E. Dubai 0 0 5 -5

Rs. US $
(Amount in Thousand)
Difference
EXPORT OF GOODS BY COMMDOITY / COUNTRY AND SERVICES BY TYPE / COUNTRY
Export of Goods and Services July 2010 284
July20 10 200 920 10HS CODE-COMMODITY / COUNTRY
Machinery etc NES for Typeset, Making Printing 26817244037,6488442-Bangladesh 0 0 20 -20Mauritius 548 6 0 6Saudi Arabia 1,446 17 7 10Syrian Arab Republic 0 0 12 -12Turkey 35,093 410 133 277U. A. E. Dubai 561 7 0 7Printing Machinery, Machines including Ink-Jet -55107524,4098443-Bangladesh 3,899 46 0 46Denmark 0 0 8 -8Nigeria 0 0 5 -5Oman 510 6 0 6Saudi Arabia 0 0 54 -54Tanzania 0 0 39 -39Machines for Extruding, Drawing, Texturing 830837,1358444-Italy 7,135 83 0 83Machines For Preparing Textile Fibers and Yarn 2154356448,2478445-Bangladesh 10,004 117 20 97Ethiopia 0 0 10 -10India 10 .. 0 ..Saudi Arabia 0 0 2 -2Singapore 0 0 6 -6South Africa 2,502 29 134 -105Sri Lanka 0 0 10 -10Syrian Arab Republic 0 0 1 -1U. A. E. Dubai 20,348 238 176 62U. K. 1,256 15 33 -18U. S. A. 14,127 165 153 12Weaving Machines Like Looms 0443088446-Bangladesh 308 4 0 4India 0 0 4 -4Machines, Knitting and Stitch-Bonding Machines -1717008447-India 0 0 17 -17Auxiliary Machinery for use With Textile 369813411,4798448-Afghanistan 4,275 50 0 50Bahrain 0 0 3 -3Bangladesh 6,441 75 21 54Botswana 226 3 0 3Cyprus 0 0 50 -50Hong Kong 0 0 6 -6Indonesia 537 6 0 6South Africa 0 0 .. ..U. A. E. Dubai 0 0 4 -4U. S. A. 0 0 14 -14Washing Machines and Parts 30314544838,2728450-Afghanistan 34,882 408 145 263Kuwait 169 2 0 2Tanzania 3,222 38 0 38Machinery not for Laundry for Cleaning, Drying -17140523420,0268451-Afghanistan 5,857 69 0 69Bahrain 658 8 0 8Bangladesh 1,280 15 403 -388Egypt 9,401 110 0 110Jordan 847 10 0 10Mexico 0 0 1 -1Oman 0 0 1 -1Qatar 1,022 12 0 12Saudi Arabia 260 3 0 3Sri Lanka 700 8 0 8Sewing Machines other than Book Sewing 720726,1428452-U. S. A. 6,142 72 0 72
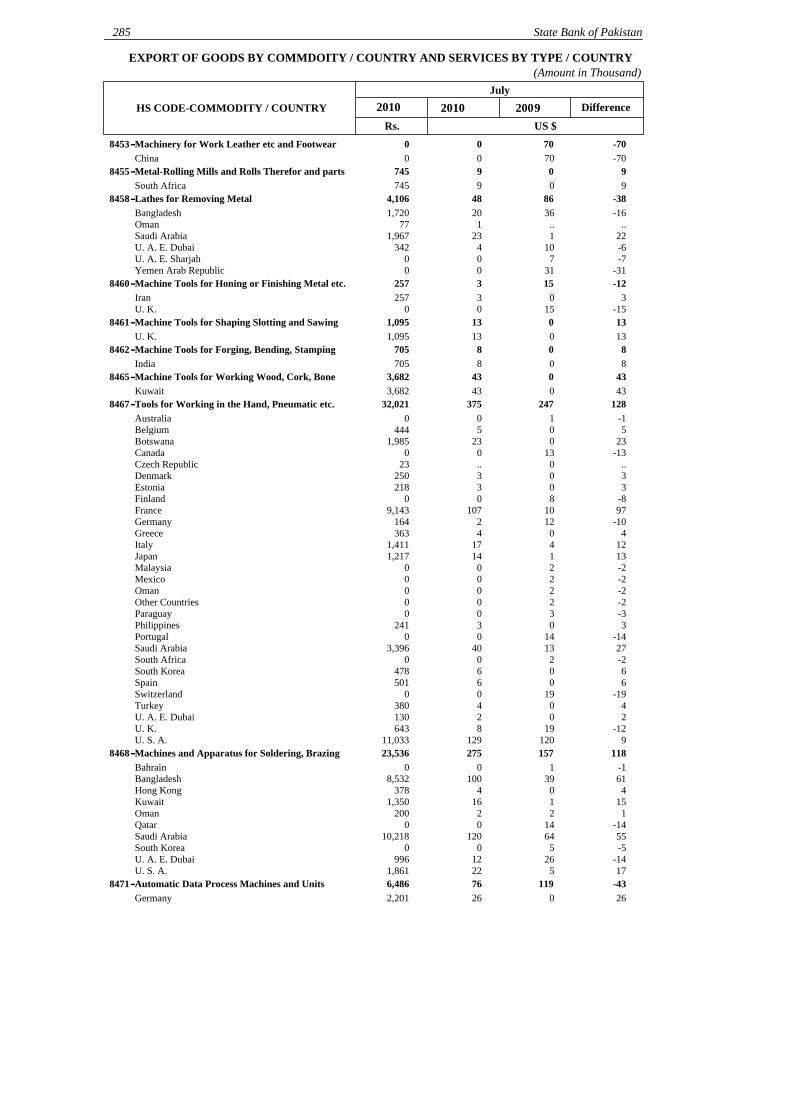
Rs. US $
(Amount in Thousand)
Difference
EXPORT OF GOODS BY COMMDOITY / COUNTRY AND SERVICES BY TYPE / COUNTRY
285 State Bank of Pakistan
July20 10 200 920 10HS CODE-COMMODITY / COUNTRY
Machinery for Work Leather etc and Footwear -7070008453-China 0 0 70 -70Metal-Rolling Mills and Rolls Therefor and parts 9097458455-South Africa 745 9 0 9Lathes for Removing Metal -3886484,1068458-Bangladesh 1,720 20 36 -16Oman 77 1 .. ..Saudi Arabia 1,967 23 1 22U. A. E. Dubai 342 4 10 -6U. A. E. Sharjah 0 0 7 -7Yemen Arab Republic 0 0 31 -31Machine Tools for Honing or Finishing Metal etc. -121532578460-Iran 257 3 0 3U. K. 0 0 15 -15Machine Tools for Shaping Slotting and Sawing 130131,0958461-U. K. 1,095 13 0 13Machine Tools for Forging, Bending, Stamping 8087058462-India 705 8 0 8Machine Tools for Working Wood, Cork, Bone 430433,6828465-Kuwait 3,682 43 0 43Tools for Working in the Hand, Pneumatic etc. 12824737532,0218467-Australia 0 0 1 -1Belgium 444 5 0 5Botswana 1,985 23 0 23Canada 0 0 13 -13Czech Republic 23 .. 0 ..Denmark 250 3 0 3Estonia 218 3 0 3Finland 0 0 8 -8France 9,143 107 10 97Germany 164 2 12 -10Greece 363 4 0 4Italy 1,411 17 4 12Japan 1,217 14 1 13Malaysia 0 0 2 -2Mexico 0 0 2 -2Oman 0 0 2 -2Other Countries 0 0 2 -2Paraguay 0 0 3 -3Philippines 241 3 0 3Portugal 0 0 14 -14Saudi Arabia 3,396 40 13 27South Africa 0 0 2 -2South Korea 478 6 0 6Spain 501 6 0 6Switzerland 0 0 19 -19Turkey 380 4 0 4U. A. E. Dubai 130 2 0 2U. K. 643 8 19 -12U. S. A. 11,033 129 120 9Machines and Apparatus for Soldering, Brazing 11815727523,5368468-Bahrain 0 0 1 -1Bangladesh 8,532 100 39 61Hong Kong 378 4 0 4Kuwait 1,350 16 1 15Oman 200 2 2 1Qatar 0 0 14 -14Saudi Arabia 10,218 120 64 55South Korea 0 0 5 -5U. A. E. Dubai 996 12 26 -14U. S. A. 1,861 22 5 17Automatic Data Process Machines and Units -43119766,4868471-Germany 2,201 26 0 26

Rs. US $
(Amount in Thousand)
Difference
EXPORT OF GOODS BY COMMDOITY / COUNTRY AND SERVICES BY TYPE / COUNTRY
Export of Goods and Services July 2010 286
July20 10 200 920 10HS CODE-COMMODITY / COUNTRY
Hong Kong 1,074 13 0 13Sri Lanka 0 0 116 -116U. A. E. Dubai 1,911 22 0 22U. S. A. 1,300 15 3 12Parts for Typewriters and other Office Machines -3030008473-Malta 0 0 11 -11U. A. E. Dubai 0 0 19 -19Machinery for Sorting Screening etc. 3745827,0308474-China 2,335 27 0 27Saudi Arabia 2,749 32 5 27U. A. E. Dubai 1,946 23 39 -17Automatic Goods-Vending Machines and Parts -11008476-Bangladesh 0 0 1 -1Machinery for Working Rubber or Plastic etc. -2459352,9908477-Bangladesh 419 5 0 5Netherlands (Holland) 0 0 12 -12South Africa 1,293 15 0 15U. A. E. Dubai 1,278 15 7 7Zambia 0 0 40 -40Machinery for Tobacco Preparation NES and -303221488478-India 0 0 10 -10Saudi Arabia 0 0 22 -22U. S. A. 148 2 0 2Machines and Mechanical Appliances NES 7019226222,4228479-Kenya 852 10 0 10Nepal 0 0 3 -3Saudi Arabia 16,263 190 188 2U. A. E. Dubai 3,342 39 0 39U. K. 1,964 23 0 23Molding Boxes for Metal Foundry, Mold Bases -2222008480-Oman 0 0 22 -22Taps, Cocks, Valves and Similar Appliances for -105129242,0298481-Bangladesh 475 6 0 6Jordan 0 0 8 -8Mauritius 0 0 5 -5Qatar 0 0 28 -28Saudi Arabia 0 0 30 -30U. A. E. Abudhabi 0 0 15 -15U. A. E. Dubai 1,554 18 37 -19U. A. E. Sharjah 0 0 6 -6Ball or Roller Bearings and Parts -3737008482-U. S. A. 0 0 37 -37Transmission Shafts, Bearings, Gears etc. and 4210524,4888483-Bangladesh 2,628 31 0 31India 65 1 0 1Nigeria 425 5 10 -5U. S. A. 1,370 16 0 16Gaskets and Similar Joints of Metal Sheeting 350352,9508484-U. K. 2,919 34 0 34Yemen Arab Republic 31 .. 0 ..Machinery Parts Not Electrical Connectors etc. -1717008485-Netherlands (Holland) 0 0 11 -11U. K. 0 0 5 -5Electric Motors and Generators 124161,3688501-Saudi Arabia 1,368 16 4 12Electrical Generating Sets and Rotary Converters 168016814,3848502-Germany 2,877 34 0 34Libya 11,507 135 0 135Parts of Electrical Motors, Generators and Sets -141843778503-Germany 377 4 8 -4Kenya 0 0 10 -10

Rs. US $
(Amount in Thousand)
Difference
EXPORT OF GOODS BY COMMDOITY / COUNTRY AND SERVICES BY TYPE / COUNTRY
287 State Bank of Pakistan
July20 10 200 920 10HS CODE-COMMODITY / COUNTRY
Electrical Transformers, Static Converters and -2,9303,42749742,5288504-Afghanistan 894 10 2,678 -2,668France 0 0 9 -9Germany 41,205 482 0 482Kuwait 429 5 703 -698U. S. A. 0 0 38 -38Electromagnets, Permanent Magnets etc and 00048505-Sri Lanka 4 .. 0 ..Primary Cells and Batteries Parts thereof -4040008506-Sri Lanka 0 0 40 -40Electrical Storage Batteries, Including Separators 22554076565,4408507-Afghanistan 65,440 765 485 280U. A. E. Dubai 0 0 35 -35U. S. A. 0 0 .. ..Yemen Arab Republic 0 0 20 -20Electromechanical Domestic Appliances and -7267860651,8258509-Australia 3,828 45 48 -3Bahrain 1,060 12 27 -14Bangladesh 1,542 18 0 18Canada 10,362 121 33 88Germany 0 0 5 -5Greece 0 0 29 -29Hong Kong 0 0 4 -4India 0 0 1 -1Kuwait 837 10 0 10Malaysia 0 0 99 -99Norway 952 11 0 11Oman 0 0 10 -10Qatar 869 10 0 10Saudi Arabia 6,617 77 69 9Singapore 0 0 48 -48South Africa 1,734 20 0 20South Korea 0 0 30 -30Sri Lanka 5,264 62 59 3Switzerland 0 0 3 -3Tanzania 0 0 5 -5U. A. E. Dubai 1,603 19 90 -71U. K. 12,218 143 35 108U. S. A. 4,938 58 82 -25Electrical Light Equipment Windshield Wipers -6868008512-U. S. A. 0 0 68 -68Portable Electrical Lamps Function By Own -2222008513-Saudi Arabia 0 0 16 -16Tanzania 0 0 6 -6Electrical Water Heater and Soil Heaters, -24324853928516-Belgium 392 5 0 5U. K. 0 0 248 -248Electric Apparatus for Line Telephony, -2424008517-U. A. E. Dubai 0 0 1 -1U. K. 0 0 23 -23Magnetic Tape and Other Sound Recorders 953095381,4898520-Afghanistan 81,489 953 0 953Video Recording or Reproducing Apparatus 172191,6348521-U. A. E. Abudhabi 1,163 14 0 14U. K. 471 6 2 3Transmission Apparatus for Radio-telephony etc. -11530719216,4428525-Afghanistan 0 0 307 -307Sri Lanka 288 3 0 3U. A. E. Dubai 16,154 189 0 189TV Receivers -5353008528-Hong Kong 0 0 53 -53

Rs. US $
(Amount in Thousand)
Difference
EXPORT OF GOODS BY COMMDOITY / COUNTRY AND SERVICES BY TYPE / COUNTRY
Export of Goods and Services July 2010 288
July20 10 200 920 10HS CODE-COMMODITY / COUNTRY
Parts for Television, Radio and Radar Apparatus 2021718529-Ghana 171 2 0 2Electrical Sound or Visual Signaling Apparatus -33008531-U. A. E. Dubai 0 0 3 -3Electrical Capacitors, Fixed, Variable or -5217212010,2338532-Australia 4,190 49 0 49Kuwait 4,270 50 125 -75Oman 1,706 20 12 8Saudi Arabia 39 .. 10 -10Sri Lanka 29 .. 0 ..U. A. E. Sharjah 0 0 25 -25Printed Circuits 000188534-U. K. 18 .. 0 ..Electrical Apparatus for Switching etc Over -322322008535-Greece 0 0 100 -100Oman 0 0 190 -190Yemen Arab Republic 0 0 32 -32Electrical Apparatus for Switching etc. Not Over 15611827423,4418536-Afghanistan 0 0 50 -50Bangladesh 2,884 34 19 15China 1,994 23 0 23Italy 7,133 83 0 83Jordan 0 0 2 -2Kuwait 0 0 19 -19Netherlands (Holland) 125 1 0 1Oman 512 6 3 3Saudi Arabia 2,986 35 16 19South Africa 77 1 0 1Sudan 0 0 8 -8U. A. E. Dubai 6,452 75 .. 75Uganda 1,278 15 0 15Boards, Panels etc With Electrical Switch 29511841335,3498537-Afghanistan 0 0 118 -118Germany 35,197 412 0 412Sri Lanka 152 2 0 2Parts for Electrical Apparatus etc of Switching, 700705,9698538-Afghanistan 5,816 68 0 68U. A. E. Dubai 153 2 0 2Electrical Filament or Discharge Lamps and 2575968539-Canada 0 0 .. ..Germany 0 0 1 -1U. A. E. Dubai 0 0 2 -2U. A. E. Sharjah 0 0 2 -2U. S. A. 596 7 0 7Electronic Integrated Circuits and Micro 640645,4548542-Oman 2,380 28 0 28Saudi Arabia 3,074 36 0 36Electrical Machinery and Apparatus 321032127,4048543-Oman 27,404 321 0 321Insulated Wire, Cable etc. Optical Sheath Fibres -49501758544-Australia 75 1 0 1U. A. E. Dubai 0 0 50 -50Carbon Electrodes and Brushes, Lamp Carbons 0221848545-Malaysia 0 0 2 -2Saudi Arabia 184 2 0 2Electrical Insulators of Any Material -6464008546-Saudi Arabia 0 0 2 -2U. K. 0 0 61 -61Electrical Parts of Machinery NES 52534086573,9458548-U. A. E. Ajman 7,695 90 0 90U. A. E. Dubai 57,702 675 340 335

Rs. US $
(Amount in Thousand)
Difference
EXPORT OF GOODS BY COMMDOITY / COUNTRY AND SERVICES BY TYPE / COUNTRY
289 State Bank of Pakistan
July20 10 200 920 10HS CODE-COMMODITY / COUNTRY
U. K. 8,548 100 0 100Railway or Tramway Freight Cars, Not 400403,3778606-U. S. A. 3,377 40 0 40Parts of Railway or Tramway Locomotives -273032578607-Afghanistan 0 0 30 -30U. S. A. 257 3 0 3Tractors Other Than Work Trucks used for 881,3951,483126,8048701-Afghanistan 0 0 82 -82Angola 1,668 20 0 20Argentina 6,056 71 0 71Bangladesh 5,498 64 0 64Brazil 1,048 12 0 12Croatia 6,267 73 77 -4Hong Kong 4,835 57 0 57Ireland 1,931 23 0 23Jordan 4,410 52 0 52Kenya 1,947 23 282 -259Mozambique 1,971 23 0 23Nigeria 0 0 655 -655Poland 0 0 31 -31Portugal 37 .. 0 ..South Africa 4,583 54 37 16Spain 0 0 4 -4Sri Lanka 13,645 160 9 151Sudan 3,814 45 0 45Switzerland 771 9 0 9Syrian Arab Republic 0 0 106 -106Tanzania 28,269 331 53 277Turkey 20,015 234 0 234U. A. E. Dubai 0 0 28 -28U. A. E. Sharjah 2,992 35 0 35U. K. 4,599 54 0 54Uganda 6,837 80 32 48Uruguay 5,612 66 0 66Motor Vehicle for Transport of Ten or more 2,087302,117181,0298702-Japan 181,029 2,117 0 2,117Mauritius 0 0 30 -30Motor Cars and Vehicles for Transporting 627213411,4958703-Afghanistan 0 0 36 -36Japan 6,372 75 0 75Liberia 766 9 0 9Malaysia 4,358 51 0 51Nigeria 0 0 16 -16Sudan 0 0 5 -5U. K. 0 0 15 -15Motor Vehicles for Transport of Goods 326032627,8508704-U. S. A. 27,850 326 0 326Special Purpose Motor Vehicles NES -140140008705-Bangladesh 0 0 140 -140Chassis Fitted with Engine for Vehicles -181181008706-Bangladesh 0 0 181 -181Bodies for Specific Motor Vehicles -1515008707-Sudan 0 0 15 -15Parts and Accessories for Motor Vehicles 27241668858,8058708-Bangladesh 2,179 25 15 10Belgium 1,851 22 1 21Brazil 1,538 18 10 8Canada 225 3 0 3Dominican Republic 40 .. 0 ..France 417 5 0 5Germany 3,220 38 10 28Ghana 686 8 0 8Guyana 0 0 15 -15

Rs. US $
(Amount in Thousand)
Difference
EXPORT OF GOODS BY COMMDOITY / COUNTRY AND SERVICES BY TYPE / COUNTRY
Export of Goods and Services July 2010 290
July20 10 200 920 10HS CODE-COMMODITY / COUNTRY
Iraq 0 0 7 -7Ireland 0 0 10 -10Italy 9,656 113 31 82Kenya 3,549 42 20 22Libya 1,864 22 0 22New Zealand 0 0 10 -10Nigeria 253 3 55 -52Saudi Arabia 1,648 19 29 -9South Africa 1,326 16 16 ..Spain 1,674 20 13 7Sri Lanka 1,376 16 0 16Sudan 3,501 41 44 -3Switzerland 0 0 .. ..Tanzania 424 5 0 5U. A. E. Dubai 2,792 33 27 5U. A. E. Sharjah 0 0 4 -4U. K. 3,451 40 1 40U. S. A. 16,293 191 97 94Uganda 841 10 0 10Motorcycles and Cycles With Auxiliary Motor 1,2084011,609137,5548711-Afghanistan 112,680 1,318 281 1,037Bangladesh 24,240 284 105 179Belgium 326 4 0 4Germany 0 0 2 -2Japan 307 4 0 4U. A. E. Dubai 0 0 11 -11U. S. A. 0 0 2 -2Parts and Accessories of Cycles and Invalid -1319518215,5728714-Afghanistan 587 7 0 7Bangladesh 0 0 6 -6France 0 0 27 -27Norway 461 5 0 5U. A. E. Dubai 608 7 16 -9U. K. 619 7 53 -46U. S. A. 13,298 156 93 62Trailers and Semi-Trailers etc and Parts -5050008716-Iran 0 0 20 -20Saudi Arabia 0 0 29 -29U. A. E. Sharjah 0 0 1 -1Aircraft, Powered, Spacecraft and Launch -1,6051,7101058,9628802-Canada 0 0 1,710 -1,710Oman 8,962 105 0 105Parts of Balloons etc. Aircraft, Spacecraft etc. -1,8302,14531526,9338803-Saudi Arabia 26,933 315 2,145 -1,830Aircraft Launch Gear, Deck-Arrestor or Similar 10401048,8768805-Oman 8,876 104 0 104Vessels for Transport of Persons or Goods 200201,7108901-South Africa 1,710 20 0 20Yachts and other Vessels for Pleasure etc or -6836830025,6458903-U. A. E. Dubai 25,645 300 368 -68Vessels and Floating Structures for Scrapping 3427615,1968908-Nigeria 22 .. 0 ..U. A. E. Dubai 283 3 2 1U. A. E. Sharjah 0 0 25 -25U. S. A. 4,891 57 0 57Optical Fibers and Bundles etc. -231719001-Germany 0 0 3 -3U. S. A. 71 1 .. 1Spectacles, Goggles etc. Correct, Protect etc. -75104292,5019004-U. S. A. 2,501 29 104 -74Optical Telescopes and Mounting for -55009005-Sri Lanka 0 0 5 -5

Rs. US $
(Amount in Thousand)
Difference
EXPORT OF GOODS BY COMMDOITY / COUNTRY AND SERVICES BY TYPE / COUNTRY
291 State Bank of Pakistan
July20 10 200 920 10HS CODE-COMMODITY / COUNTRY
Photographic Still Cameras, Flash Apparatus etc. -179179009006-Nigeria 0 0 179 -179Cinematographic Cameras and Projectors, Parts 2021819007-Afghanistan 181 2 0 2Medical, Surgical and Dental Instruments etc. -93823,00722,0691,886,9939018-Afghanistan 0 0 60 -60Algeria 5,810 68 82 -14Andorra 1,457 17 0 17Angola 36 .. 10 -10Argentina 16,955 198 99 99Aruba 0 0 1 -1Australia 24,630 288 409 -121Austria 3,646 43 44 -2Bahrain 374 4 1 3Bangladesh 3,325 39 36 3Belgium 24,976 292 255 37Belize 0 0 5 -5Bolivia 3,690 43 35 8Botswana 103 1 1 ..Brazil 40,784 477 521 -44Brunei 1,168 14 0 14Bulgaria 574 7 10 -3Cambodia Kampuchea 0 0 2 -2Cameroon 1,256 15 2 13Canada 10,902 128 177 -50Chile 6,353 74 47 27China 15,948 187 278 -91Colombia 1,837 21 24 -2Comoros 0 0 13 -13Costa Rica 162 2 0 2Croatia 198 2 6 -3Cyprus 86 1 2 -1Czech Republic 14,802 173 77 96Denmark 18,755 219 123 96Dominican Republic 1,750 20 0 20Ecuador 4,787 56 76 -20Egypt 7,753 91 190 -99El Salvador 157 2 6 -4Equatorial Guinea 100 1 0 1Estonia 132 2 6 -4Ethiopia 0 0 37 -37Finland 2,697 32 8 23France 94,816 1,109 1,336 -228Georgia 0 0 3 -3Germany 311,993 3,649 3,468 181Ghana 0 0 10 -10Greece 1,297 15 104 -89Guatemala 459 5 14 -8Haiti 231 3 2 1Honduras 0 0 8 -8Hong Kong 13,186 154 195 -41Hungary 8,895 104 98 6Iceland 40 .. 0 ..India 23,867 279 207 72Indonesia 10,192 119 78 42Iran 3,365 39 131 -91Ireland 756 9 14 -5Italy 71,556 837 1,026 -190Jamaica 0 0 1 -1Japan 41,247 482 436 46Jordan 1,009 12 0 12Kazakhstan 170 2 3 -1Kenya 1,892 22 64 -41Kuwait 342 4 14 -10Laos 571 7 0 7

Rs. US $
(Amount in Thousand)
Difference
EXPORT OF GOODS BY COMMDOITY / COUNTRY AND SERVICES BY TYPE / COUNTRY
Export of Goods and Services July 2010 292
July20 10 200 920 10HS CODE-COMMODITY / COUNTRY
Latvia 640 7 7 ..Lebanon 1,336 16 10 5Leeward Islands 97 1 0 1Libya 596 7 18 -11Macedonia (FormerlyYugoslavia) 853 10 0 10Malaysia 5,638 66 54 11Maldives 0 0 1 -1Mali 367 4 0 4Malta 0 0 .. ..Mauritania 469 5 0 5Mauritius 121 1 2 ..Mexico 26,997 316 270 45Moldova 204 2 0 2Mongolia 864 10 0 10Morocco 1,428 17 35 -19Mozambique 0 0 1 -1Myanmar 337 4 0 4Namibia 0 0 2 -2Nepal 6,484 76 18 57Netherlands (Holland) 22,202 260 424 -165Netherlands Antilles 0 0 3 -3New Zealand 5,424 63 9 55Nicaragua 803 9 0 9Nigeria 7,758 91 94 -3Norway 563 7 13 -6Oman 632 7 14 -6Other Countries 14,333 168 102 66Panama Inc. Panama Canal Zone 242 3 .. 3Papua New Guinea 0 0 5 -5Paraguay 220 3 4 -1Peru 5,299 62 71 -9Philippines 5,785 68 97 -30Poland 12,641 148 99 48Polynesia 22 .. 0 ..Portugal 3,750 44 28 16Qatar 0 0 20 -20Romania 1,605 19 29 -11Russian Federation 42,769 500 454 46Rwanda 605 7 0 7Saudi Arabia 13,193 154 157 -3Senegal 374 4 0 4Serbia 505 6 0 6Sierra Leone 192 2 0 2Singapore 5,332 62 105 -43Slovak Republic 0 0 13 -13Slovenia 125 1 0 1Solomon Islands 145 2 0 2South Africa 11,385 133 103 30South Korea 19,216 225 214 11Spain 19,370 227 188 39Sri Lanka 1,427 17 16 1Sudan 12,966 152 0 152Suriname 33 .. 0 ..Sweden 1,113 13 53 -40Switzerland 2,950 35 58 -23Syrian Arab Republic 4,455 52 56 -4Tanzania 0 0 6 -6Thailand 11,492 134 124 10Tunisia 1,520 18 19 -1Turkey 17,104 200 198 2U. A. E. Abudhabi 6,364 74 0 74U. A. E. Dubai 36,161 423 731 -309U. A. E. Fujairah 0 0 47 -47U. A. E. Sharjah 788 9 2 7U. K. 165,820 1,939 2,971 -1,032U. S. A. 566,176 6,622 5,964 658

Rs. US $
(Amount in Thousand)
Difference
EXPORT OF GOODS BY COMMDOITY / COUNTRY AND SERVICES BY TYPE / COUNTRY
293 State Bank of Pakistan
July20 10 200 920 10HS CODE-COMMODITY / COUNTRY
Uganda 922 11 14 -3Ukraine 1,199 14 64 -50Uruguay 2,133 25 23 2Uzbekistan 1,368 16 0 16Venezuela 4,459 52 16 36Viet Nam 2,436 28 69 -40Yemen Arab Republic 1,223 14 55 -41Zimbabwe 2,882 34 0 34Breathing Appliances and Gas Masks NES and 170171,4179020-Afghanistan 1,417 17 0 17Orthopedic Appliances Artificial Body and Parts 1539544,6239021-Ecuador 0 0 16 -16Fiji 200 2 0 2Indonesia 2,367 28 0 28Russian Federation 0 0 4 -4Senegal 603 7 0 7Tunisia 1,453 17 0 17Turkey 0 0 20 -20X-Ray etc Apparatus, Tubes, Panels, Screen and -2543181,5079022-Afghanistan 0 0 23 -23Australia 249 3 0 3Philippines 0 0 20 -20Poland 1,258 15 0 15Instrument, Apparatus and Models for 310312,6299023-U. S. A. 2,629 31 0 31Hydrometers, Thermometers, Pyrometers etc. -212875669025-Kuwait 566 7 0 7Saudi Arabia 0 0 28 -28Instruments and Apparatus for Physical and 240242,0609027-Bangladesh 1,889 22 0 22U. A. E. Dubai 171 2 0 2Gas, Liquid or Electricity Supply or Production 194231,9899028-Germany 388 5 0 5Other Countries 0 0 4 -4Turkey 1,601 19 0 19Oscilloscopes, Spectrum Analyzers etc and Parts -2525009030-Other Countries 0 0 25 -25Parts and Accessories NES 00009033-U. S. A. 0 0 .. ..Clock Movements, Complete and Assembled 80251058,9969109-Canada 4,185 49 0 49Hong Kong 2,993 35 0 35U. K. 1,819 21 0 21U. S. A. 0 0 25 -25Watch Cases and Parts 2021899111-Bangladesh 189 2 0 2Watch Straps, Watch Bands and Watch Bracelets -2525009113-Australia 0 0 2 -2Canada 0 0 2 -2Netherlands (Holland) 0 0 1 -1Western Samoa 0 0 20 -20Clock or Watch Parts NES 4043609114-Sweden 164 2 0 2U. K. 196 2 0 2String Musical Instruments NES 2021479202-France 34 .. 0 ..Spain 114 1 0 1Wind Musical Instruments NES 29314543837,4479205-Canada 0 0 1 -1France 139 2 46 -44Italy 153 2 0 2

Rs. US $
(Amount in Thousand)
Difference
EXPORT OF GOODS BY COMMDOITY / COUNTRY AND SERVICES BY TYPE / COUNTRY
Export of Goods and Services July 2010 294
July20 10 200 920 10HS CODE-COMMODITY / COUNTRY
Russian Federation 75 1 0 1Saudi Arabia 8,539 100 95 5South Korea 2,867 34 0 34Spain 29 .. 0 ..U. A. E. Dubai 19,617 229 0 229U. K. 6,028 71 1 70U. S. A. 0 0 2 -2Musical Instruments With Sound Electrically -384464719207-France 0 0 42 -42Germany 0 0 2 -2Ireland 245 3 0 3U. K. 156 2 0 2U. S. A. 70 1 0 1Musical Boxes, Fairground Organs etc. -1559443,7989208-Canada 93 1 0 1Germany 960 11 9 3Greece 0 0 38 -38Malaysia 297 3 0 3South Africa 142 2 0 2Spain 835 10 0 10U. K. 888 10 10 ..U. S. A. 584 7 2 5Parts etc. of Musical Instruments, Metronomes -9831621818,6639209-Australia 28 .. 6 -6Canada 0 0 4 -4Denmark 19 .. 1 -1France 818 10 4 6Germany 4,680 55 34 21Greece 411 5 0 5Ireland 1,475 17 0 17Italy 159 2 2 ..Jordan 0 0 5 -5Malaysia 197 2 0 2Netherlands (Holland) 0 0 2 -2New Zealand 28 .. 0 ..Singapore 270 3 0 3South Africa 1,786 21 1 20South Korea 0 0 5 -5Spain 0 0 9 -9U. K. 4,804 56 66 -10U. S. A. 3,987 47 177 -131Military Weapons other than Revolvers, Pistols 921222118,8829301-China 6,837 80 0 80Philippines 2,050 24 0 24Sri Lanka 0 0 212 -212U. S. A. 9,995 117 0 117Revolvers and Pistols Designed to Fire Live 1924326222,4369302-Bangladesh 22,436 262 243 19Bombs, Grenades, Cartridges and Parts -7541,14338933,3009306-France 26,622 311 429 -118Greece 6,678 78 0 78Sri Lanka 0 0 488 -488U. A. E. Ajman 0 0 225 -225Swords, Cutlasses, Bayonets and Similar Arms & -2437131,0949307-Australia 0 0 .. ..Denmark 0 0 3 -3France 150 2 0 2Germany 295 3 2 1New Zealand 229 3 0 3South Africa 112 1 0 1South Korea 0 0 3 -3U. K. 223 3 5 -3U. S. A. 86 1 23 -22

Rs. US $
(Amount in Thousand)
Difference
EXPORT OF GOODS BY COMMDOITY / COUNTRY AND SERVICES BY TYPE / COUNTRY
295 State Bank of Pakistan
July20 10 200 920 10HS CODE-COMMODITY / COUNTRY
Seats and Parts Except Barber, Dental etc. 6614806,8759401-Italy 3,562 42 0 42Spain 1,781 21 0 21U. S. A. 1,531 18 14 4Medical, Surgical, Dental or Veterinary 75121,0139402-Canada 0 0 3 -3Kenya 866 10 0 10Saudi Arabia 147 2 0 2Turkey 0 0 2 -2Furniture NES and Parts Thereof -29086957949,5309403-Afghanistan 4,104 48 188 -140Algeria 0 0 8 -8Australia 749 9 5 4Bahrain 5,860 69 8 61Bangladesh 112 1 0 1Barbados 0 0 9 -9Belgium 1,185 14 0 14Canada 0 0 13 -13China 0 0 7 -7Cyprus 215 3 0 3Egypt 6,238 73 0 73France 1,295 15 11 4Germany 0 0 14 -14Iran 851 10 0 10Ireland 787 9 0 9Italy 1,127 13 0 13Japan 855 10 9 1Kuwait 0 0 11 -11Malaysia 4,467 52 7 45Mauritius 528 6 23 -16Oman 748 9 0 9Other Countries 1,536 18 15 3Qatar 853 10 0 10Russian Federation 0 0 12 -12Saudi Arabia 2,760 32 26 6South Africa 521 6 0 6South Korea 226 3 0 3Spain 290 3 0 3Sri Lanka 513 6 0 6Switzerland 0 0 15 -15Tajikistan 0 0 50 -50U. A. E. Ajman 0 0 260 -260U. A. E. Dubai 5,256 61 22 39U. K. 3,107 36 72 -36U. S. A. 3,640 43 85 -42Uzbekistan 1,708 20 0 20Mattress Supports, Articles of Bedding etc -34610,2729,926848,7219404-Afghanistan 1,621 19 0 19Australia 19,882 233 150 82Austria 412 5 0 5Belgium 25,653 300 84 216Brazil 6,588 77 0 77Canada 32,206 377 379 -2Chile 0 0 90 -90Colombia 11,578 135 74 62Czech Republic 2,630 31 0 31Denmark 6,238 73 5 68Egypt 0 0 12 -12France 9,826 115 16 99Germany 5,046 59 0 59Greece 2,568 30 50 -20Ireland 13,721 160 24 137Italy 5,507 64 7 57Lithuania 0 0 27 -27Mexico 7,537 88 0 88

Rs. US $
(Amount in Thousand)
Difference
EXPORT OF GOODS BY COMMDOITY / COUNTRY AND SERVICES BY TYPE / COUNTRY
Export of Goods and Services July 2010 296
July20 10 200 920 10HS CODE-COMMODITY / COUNTRY
Netherlands (Holland) 3,736 44 69 -25New Zealand 3,102 36 11 26Peru 9,365 110 22 88Poland 3,522 41 2 39Portugal 0 0 24 -24Reunion Island 0 0 24 -24Russian Federation 0 0 86 -86Saudi Arabia 27,650 323 0 323Slovak Republic 2,628 31 0 31South Africa 7,808 91 235 -144South Korea 0 0 3 -3Spain 10,463 122 204 -82Sweden 4,057 47 0 47Switzerland 0 0 9 -9Turkey 0 0 6 -6U. A. E. Dubai 2,133 25 17 8U. A. E. Sharjah 1,840 22 0 22U. K. 80,605 943 683 260U. S. A. 540,801 6,325 7,960 -1,635Lamps and Lighting Fittings and Parts etc NES -2064443,7419405-Bahrain 0 0 26 -26Bangladesh 1,316 15 0 15Hungary 0 0 5 -5Kenya 1,999 23 0 23Singapore 427 5 0 5South Korea 0 0 5 -5Syrian Arab Republic 0 0 27 -27Wheel Toys for Children Like Tricycle, Scooters 7186669501-U. K. 666 8 1 7Dolls, Representing only Human Beings and -6374119739502-Australia 314 4 0 4Germany 214 3 20 -18U. A. E. Dubai 0 0 50 -50U. S. A. 445 5 4 1Toys NES, Reduced Size, Puzzles of all Kinds 234272,2939503-France 0 0 1 -1Hong Kong 2,293 27 0 27U. A. E. Dubai 0 0 3 -3Articles and Equipments for Sports etc NES 6,86024,15931,0192,652,2529506-Afghanistan 299 3 109 -105Algeria 1,539 18 55 -37Angola 0 0 17 -17Argentina 21,353 250 351 -102Australia 59,902 701 516 185Austria 3,512 41 77 -36Bahrain 2,409 28 12 16Bangladesh 4,709 55 7 48Belarus 542 6 26 -19Belgium 96,212 1,125 1,003 122Bosnia Herzegovina 168 2 19 -17Botswana 282 3 0 3Brazil 34,852 408 269 139Brunei 61 1 0 1Bulgaria 3,849 45 26 19Cameroon 0 0 2 -2Canada 42,146 493 326 167Cape Verde 0 0 4 -4Central African Republic 0 0 30 -30Chile 29,964 350 165 185China 6,334 74 11 63Colombia 644 8 57 -49Costa Rica 2,135 25 23 2Croatia 614 7 5 2Cyprus 2,693 31 40 -8

Rs. US $
(Amount in Thousand)
Difference
EXPORT OF GOODS BY COMMDOITY / COUNTRY AND SERVICES BY TYPE / COUNTRY
297 State Bank of Pakistan
July20 10 200 920 10HS CODE-COMMODITY / COUNTRY
Czech Republic 7,021 82 49 33Denmark 58,291 682 1,020 -339Ecuador 4,719 55 1 54Egypt 2,741 32 70 -38Ethiopia 4,686 55 0 55Finland 20,548 240 75 165France 154,300 1,805 1,034 771Gabon 0 0 .. ..Georgia 0 0 200 -200Germany 356,346 4,168 2,435 1,732Ghana 2,225 26 7 19Greece 22,933 268 148 120Guatemala 8,892 104 0 104Guyana 0 0 30 -30Haiti 263 3 0 3Honduras 655 8 0 8Hong Kong 30,116 352 499 -146Hungary 17,115 200 127 73Iceland 0 0 1 -1India 3,988 47 42 4Indonesia 272 3 17 -14Ireland 10,590 124 198 -75Italy 211,620 2,475 1,420 1,055Jamaica 0 0 1 -1Japan 63,039 737 805 -68Jordan 237 3 0 3Kazakhstan 1,518 18 12 6Kenya 214 3 31 -28Kuwait 13,872 162 127 35Latvia 98 1 0 1Lebanon 342 4 7 -3Lithuania 540 6 5 1Madagascar 0 0 6 -6Malawi 0 0 7 -7Malaysia 5,956 70 34 36Malta 171 2 5 -3Mauritius 269 3 2 1Mexico 48,582 568 498 71Montserrat 0 0 4 -4Mozambique 427 5 0 5Myanmar 0 0 7 -7Netherlands (Holland) 101,522 1,187 830 358Netherlands Antilles 1,496 17 6 12New Caledonia 0 0 16 -16New Zealand 2,659 31 63 -32Nigeria 364 4 11 -7Norway 8,781 103 253 -150Oman 522 6 .. 6Other Countries 1,394 16 51 -35Panama Inc. Panama Canal Zone 4,404 52 85 -33Paraguay 1,352 16 0 16Peru 7,745 91 5 86Philippines 2,697 32 10 22Poland 30,137 352 216 137Polynesia 563 7 0 7Portugal 11,859 139 139 ..Qatar 4,623 54 33 21Reunion Island 0 0 5 -5Romania 1,489 17 22 -4Russian Federation 44,639 522 310 212Saudi Arabia 18,265 214 222 -8Senegal 573 7 25 -18Serbia 549 6 20 -14Seychelles 796 9 0 9Sierra Leone 1,205 14 0 14Singapore 4,649 54 45 10

Rs. US $
(Amount in Thousand)
Difference
EXPORT OF GOODS BY COMMDOITY / COUNTRY AND SERVICES BY TYPE / COUNTRY
Export of Goods and Services July 2010 298
July20 10 200 920 10HS CODE-COMMODITY / COUNTRY
Slovak Republic 2,241 26 14 12Slovenia 557 7 45 -38Solomon Islands 0 0 15 -15South Africa 37,579 440 433 7South Korea 14,490 169 28 142Spain 88,648 1,037 995 42Sri Lanka 3,986 47 34 13St. Kitts-Nevis 158 2 0 2Sudan 1,958 23 20 3Swaziland 306 4 0 4Sweden 32,211 377 107 269Switzerland 17,959 210 149 61Syrian Arab Republic 0 0 5 -5Thailand 2,880 34 24 10Trinidad and Tobago 94 1 5 -4Tunisia 0 0 28 -28Turkey 33,427 391 445 -54U. A. E. Abudhabi 625 7 2 6U. A. E. Dubai 38,730 453 1,200 -747U. A. E. Sharjah 2,993 35 67 -32U. A. E. Ummal Quwain 0 0 5 -5U. K. 231,070 2,702 2,250 453U. S. A. 489,570 5,726 3,752 1,974Uganda 5,616 66 13 52Ukraine 10,940 128 39 89Uruguay 9,323 109 24 85Zambia 0 0 2 -2Zimbabwe 7,802 91 18 74Fishing Rods and Tackle Nets, Decoys etc. -1329161,3999507-Australia 0 0 26 -26China 439 5 0 5Germany 108 1 0 1South Korea 0 0 3 -3U. S. A. 852 10 0 10Merry-Go-Rounds, Other Fairground -77009508-Germany 0 0 7 -7Worked Ivory, Bone etc and Articles Thereof 255025521,7889601-Sri Lanka 4,693 55 0 55U. A. E. Dubai 17,095 200 0 200Vegetable Molded Resin etc Carving Material -428428009602-Japan 0 0 1 -1Kuwait 0 0 54 -54Saudi Arabia 0 0 45 -45Turkey 0 0 17 -17U. A. E. Dubai 0 0 126 -126U. K. 0 0 20 -20U. S. A. 0 0 166 -166Brooms, Brushes, Mops and Feather Dusters etc. -8329521218,0969603-Afghanistan 12,815 150 212 -62Australia 0 0 .. ..France 1,736 20 83 -63Syrian Arab Republic 2,562 30 0 30U. A. E. Dubai 983 12 0 12Hand Sieves and Hand Riddles -1010009604-Canada 0 0 10 -10Buttons, Press Studs, Button Mold and Blanks 101559606-U. A. E. Dubai 55 1 0 1Slide Fasteners and Parts Thereof 442044237,8019607-U. S. A. 37,801 442 0 442Pens, Ball Points, Soft Tip and Mechanical 7126733828,8759608-Afghanistan 5,886 69 40 29Algeria 0 0 20 -20Bahrain 1,294 15 0 15

Rs. US $
(Amount in Thousand)
Difference
EXPORT OF GOODS BY COMMDOITY / COUNTRY AND SERVICES BY TYPE / COUNTRY
299 State Bank of Pakistan
July20 10 200 920 10HS CODE-COMMODITY / COUNTRY
Bangladesh 1,040 12 0 12Egypt 2,050 24 17 7Ethiopia 849 10 0 10France 4,477 52 0 52Italy 0 0 11 -11Kuwait 4,398 51 59 -7Malawi 0 0 20 -20Morocco 3,372 39 7 33Saudi Arabia 2,362 28 29 -1Sudan 0 0 5 -5U. A. E. Dubai 3,148 37 61 -24Pencils, Crayons, Leads and Chalks etc. 50523473963,1559609-Brazil 22,586 264 149 115Egypt 1,711 20 0 20Germany 1,142 13 0 13Hong Kong 3,452 40 0 40Jordan 2,695 32 0 32Kuwait 4,988 58 0 58Lebanon 0 0 2 -2Netherlands (Holland) 361 4 0 4Oman 5,665 66 0 66Portugal 0 0 9 -9Saudi Arabia 1,339 16 0 16South Africa 124 1 0 1Turkey 13,339 156 21 136U. A. E. Dubai 814 10 53 -44U. S. A. 4,938 58 0 58Scent and Similar Sprayers, Powder Puffs and -202202009616-U. A. E. Dubai 0 0 202 -202Vacuum Flask and Vessel With Cases -2424009617-Tanzania 0 0 10 -10U. A. E. Dubai 0 0 14 -14Paintings, Drawing etc By Hand 8314287374,6459701-Italy 34 .. 0 ..Saudi Arabia 26 .. 42 -42Syrian Arab Republic 74,388 870 0 870Thailand 86 1 0 1U. K. 113 1 0 1Original Engravings, Prints and Lithographs 140141,2389702-U. S. A. 1,238 14 0 14Postage or Revenue Stamps etc. 000329704-U. S. A. 32 .. 0 ..Collectors Item of Botanic and Historical Interest -91565279705-China 117 1 0 1France 0 0 2 -2Kuwait 0 0 7 -7Netherlands (Holland) 273 3 0 3Saudi Arabia 52 1 1 ..U. K. 86 1 6 -5Cardiology / Cardiac Surgery Disposables 300302,5619938-Afghanistan 2,561 30 0 30Special Transaction NES 3755142636,4599992-Australia 94 1 0 1Belgium 168 2 3 -1Canada 757 9 0 9China 143 2 0 2Finland 381 4 3 2France 745 9 20 -11Germany 0 0 .. ..Greece 0 0 7 -7Japan 108 1 0 1Malta 25 .. 0 ..Netherlands Antilles 415 5 0 5
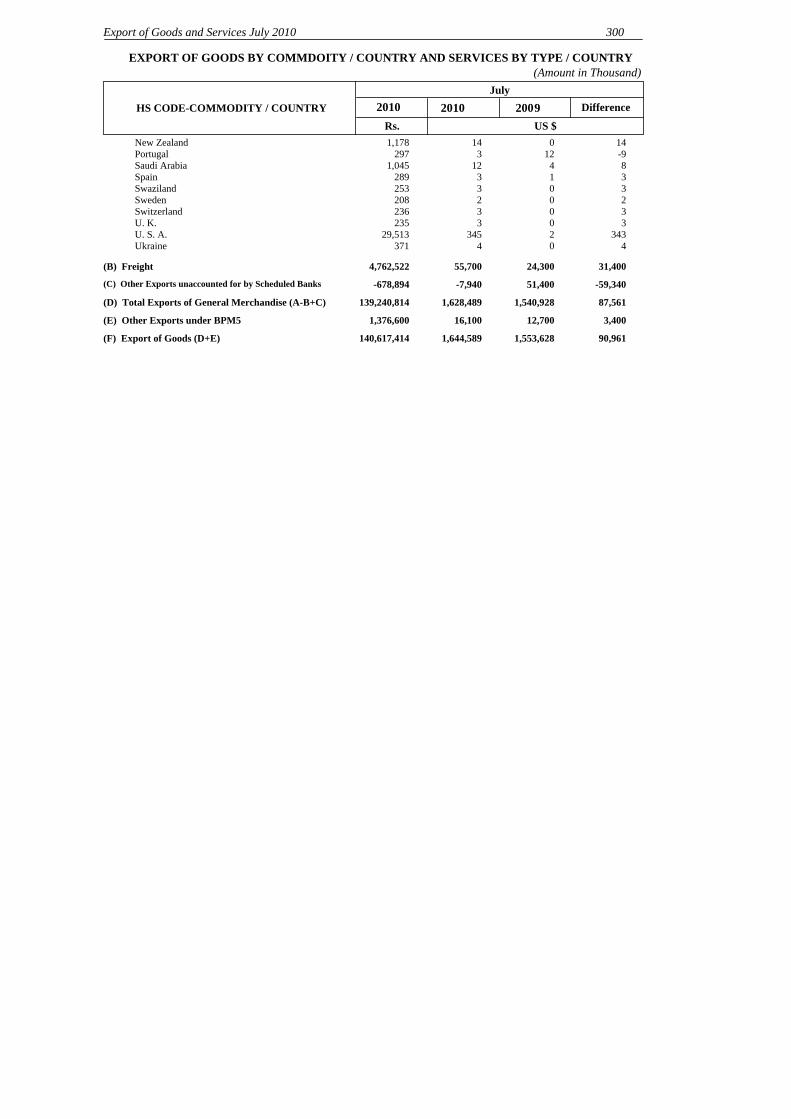
Rs. US $
(Amount in Thousand)
Difference
EXPORT OF GOODS BY COMMDOITY / COUNTRY AND SERVICES BY TYPE / COUNTRY
Export of Goods and Services July 2010 300
July20 10 200 920 10HS CODE-COMMODITY / COUNTRY
New Zealand 1,178 14 0 14Portugal 297 3 12 -9Saudi Arabia 1,045 12 4 8Spain 289 3 1 3Swaziland 253 3 0 3Sweden 208 2 0 2Switzerland 236 3 0 3U. K. 235 3 0 3U. S. A. 29,513 345 2 343Ukraine 371 4 0 4
(B) Freight
(C) Other Exports unaccounted for by Scheduled Banks
(D) Total Exports of General Merchandise (A-B+C)
(E) Other Exports under BPM5
(F) Export of Goods (D+E)
55,700 24,300 31,400
-7,940 51,400 -59,340
16,100 12,700 3,400
1,628,489 1,540,928 87,561
1,644,589 1,553,628 90,961
4,762,522
-678,894
1,376,600
139,240,814
140,617,414

TYPE OF SERVICE / COUNTRY
Rs. US $
(Amount in Thousand)
Difference
(G) Export of Services 24,115,991 32,938 282,323 249,385
301 State Bank of Pakistan
July20 10 200 920 10
EXPORT OF GOODS BY COMMDOITY / COUNTRY AND SERVICES BY TYPE / COUNTRY
Transportation 6,41787,37593,7927,999,110Afghanistan 7,288 85 434 -349Australia 7,601 89 9 80Azarbaijan 2,506 29 3 27Bahrain 311,109 3,648 3,135 513Bangladesh 20,666 242 48 194Belgium 21,657 254 0 254Brunei 8 .. 11 -11Canada 238 3 17 -14China-peoples Republic Of 81,000 950 166 784Cyprus 98 1 1 1Denmark 211,118 2,475 80 2,396Egypt 5,648 66 11 55Ethiopia 6,416 75 58 17France 503,307 5,902 6,609 -707Germany 339,676 3,982 2,954 1,029Greece 9,693 114 125 -11Hongkong 43,139 506 462 44India 7,086 83 0 83Indonesia 14,909 175 30 145Italy(including Vatican City) 1,444 17 7 10Japan 86,415 1,013 1,540 -527Jordan 1,032 12 0 12Kazakhstan 14 .. 1 -1Kenya 15,458 181 86 95Korea South-(republic Of) 80,002 938 91 847Korea - Dprk 1 .. 0 ..Kuwait 71,539 839 83 756Lebanon 0 0 .. ..Luxembourg 9,996 117 182 -65Malaysia 44,220 519 237 282Malta 57,013 669 42 627Mauritius 15,072 177 334 -157Morocco 0 0 59 -59Netherlands(holland) 208,394 2,444 2,966 -522Norway 8,388 98 31 67Oman 10,552 124 27 97Qatar 46,012 540 686 -147Saudi Arabia 1,076,442 12,622 14,076 -1,454Singapore 306,406 3,593 3,254 339Sri Lanka 430 5 172 -167Switzerland 189,473 2,221 1,992 230Syrian Arab Republic 3 .. 0 ..Thailand 218,417 2,561 2,032 529Tunisia 1,540 18 0 18Turkey 11,194 131 138 -7U. A. E. Abudhabi 147,546 1,730 1,931 -201U. A. E. Dubai 1,098,611 12,882 11,629 1,253U. A. E. Sharjah 22,510 264 273 -9U. K. 1,110,285 13,019 10,893 2,126U. S. A. 1,094,202 12,830 15,257 -2,427Ukraine 3,989 47 1 46Viet Nam 181 2 0 2Others, N. E. S. 469,165 5,501 5,207 294
Travel 1,83021,93723,7672,031,633Afghanistan 772 9 .. 9Australia 0 0 10 -10Austria 0 0 16 -16Bahrain 0 0 .. ..Bangladesh 0 0 .. ..Belgium 2,252 26 13 14Canada 271 3 5 -2China-peoples Republic Of 17 .. 0 ..

TYPE OF SERVICE / COUNTRY
Rs. US $
(Amount in Thousand)
Difference
Export of Goods and Services July 2010 302
July20 10 200 920 10
EXPORT OF GOODS BY COMMDOITY / COUNTRY AND SERVICES BY TYPE / COUNTRY
Croatia 0 0 1 -1Cyprus 0 0 5 -5Egypt 159 2 0 2Finland 17 .. 0 ..France 100 1 34 -33Germany 5,291 62 40 22Hongkong 0 0 6 -6Hungary 0 0 .. ..India 0 0 2 -2Ireland 51 1 0 1Japan 558 7 33 -26Korea South-(republic Of) 99 1 0 1Kuwait 98 1 2 -1Luxembourg 302 4 0 4Macao 0 0 2 -2Malaysia 0 0 7 -7Nepal 0 0 2 -2Netherlands(holland) 619 7 22 -15New Zealand 0 0 .. ..Norway 0 0 13 -13Oman 548 6 0 6Qatar 361 4 .. 4Saudi Arabia 29,303 343 71 271Singapore 6,538 76 36 41Slovenia 0 0 .. ..Spain 561 7 12 -6Sweden 1 .. 0 ..Switzerland 2,355 28 34 -7U. A. E. Abudhabi 751 9 20 -11U. A. E. Dubai 4,474 52 26 27U. A. E. Sharjah 212 2 0 2U. K. 3,859 45 132 -86U. S. A. 1,786,485 20,894 17,608 3,286Others, N. E. S. 185,576 2,176 3,784 -1,608
Communication Services -14,24323,5349,291794,261Afghanistan 1,069 13 .. 12Australia 89 1 0 1Austria 11 .. 2 -2Bahrain 33 .. .. ..Bangladesh 0 0 4 -4Belgium 105 1 1 ..Canada 4,376 51 74 -23Cyprus 35 .. 1,335 -1,335Denmark 1,763 21 .. 20Egypt 70 1 .. ..France 1,114 13 156 -143Germany 3,567 42 23 19Greece 33,774 395 0 395Hongkong 23 .. 1 -1Hungary 1 .. 0 ..India 5,443 64 1 62Indonesia 36 .. 0 ..Iran 1,018 12 0 12Ireland 19,066 223 45 178Italy(including Vatican City) 1,012 12 .. 11Japan 487 6 5 1Jordan 31 .. 0 ..Korea South-(republic Of) 72 1 86 -85Kuwait 209 2 .. 2Lithuania 1 .. 0 ..Malaysia 7,367 86 7 79Mauritania 0 0 .. ..Netherlands(holland) 62 1 1 ..Philippines 231 3 3 ..Poland 14 .. 0 ..

TYPE OF SERVICE / COUNTRY
Rs. US $
(Amount in Thousand)
Difference
303 State Bank of Pakistan
July20 10 200 920 10
EXPORT OF GOODS BY COMMDOITY / COUNTRY AND SERVICES BY TYPE / COUNTRY
Qatar 0 0 2 -2Romania 586 7 24 -17Russian Federation 13 .. 1 ..Saudi Arabia 2,567 30 17 13Singapore 7,430 87 323 -236Slovak Republic 19 .. 7 -6Slovenia 0 0 .. ..South Africa 0 0 9 -9Spain 253 3 0 3Sri Lanka 0 0 1 -1Sweden 0 0 653 -653Switzerland 224 3 307 -304Turkmanistan 0 0 .. ..U. A. E. Abudhabi 509 6 93 -87U. A. E. Dubai 56,410 660 845 -185U. A. E. Ras Al Khaimah 38,094 446 590 -144U. K. 104,940 1,227 2,177 -950U. S. A. 453,702 5,306 15,907 -10,600Zambia 18 .. 0 ..Others, N. E. S. 48,420 568 832 -264
Construction Services 48638787374,644Austria 0 0 8 -8Belgium 545 6 37 -31Canada 8,217 96 0 96China-peoples Republic Of 4,275 50 0 50France 126 1 0 1Germany 0 0 125 -125O.p.e.c.(organisation Of 0 0 11 -11Kuwait 15,237 178 2 176Netherlands(holland) 0 0 14 -14Oman 0 0 1 -1Qatar 0 0 1 -1Saudi Arabia 656 8 80 -72U. A. E. Abudhabi 0 0 4 -4U. A. E. Dubai 10,210 119 10 109U. A. E. Sharjah 2,561 30 1 29U. K. 10,208 119 52 67U. S. A. 22,427 262 40 222Others, N. E. S. 182 2 0 2
Insurance Services 4351,8512,286195,459Afghanistan 154 2 7 -5Bahrain 29,485 345 237 108Belgium 4,916 57 0 57Botswana 5,131 60 0 60Bulgaria 0 0 6 -6China-peoples Republic Of 7,583 89 0 89Cyprus 343 4 0 4Egypt 3,389 40 5 35France 4,303 50 .. 50Germany 2,261 26 200 -174Greece 436 5 6 -1Hongkong 12 .. .. ..India 0 0 64 -64Ireland 0 0 10 -10Japan 502 6 9 -3Kazakhstan 9 .. 0 ..Korea South-(republic Of) 7,432 87 82 5Korea - Dprk 0 0 7 -7Kuwait 0 0 20 -20Lebanon 0 0 4 -4Luxembourg 556 7 7 ..Malaysia 10,152 119 36 83Mauritius 0 0 .. ..Netherlands(holland) 0 0 63 -63

TYPE OF SERVICE / COUNTRY
Rs. US $
(Amount in Thousand)
Difference
Export of Goods and Services July 2010 304
July20 10 200 920 10
EXPORT OF GOODS BY COMMDOITY / COUNTRY AND SERVICES BY TYPE / COUNTRY
Norway 550 6 6 ..Poland 0 0 19 -19Qatar 0 0 .. ..Saudi Arabia 0 0 .. ..Singapore 36,233 424 229 195Sweden 0 0 3 -3Switzerland 3,101 36 301 -265Thailand 0 0 2 -2U. A. E. Dubai 18,267 214 179 35U. A. E. Sharjah 68 1 0 1U. K. 33,772 395 253 142U. S. A. 26,360 308 96 213Viet Nam 439 5 0 5Others, N. E. S. 7 .. 0 ..
Financial Services 2,0824,5426,624566,368Australia 3 .. 2 -2Austria 31 .. .. ..Bahrain 4,055 47 1 47Bangladesh 13 .. 1 -1Belgium 1 .. 0 ..Bermuda 0 0 5 -5Bolivia 0 0 .. ..Botswana 17 .. 0 ..Brazil 3,873 45 7 38Canada 13 .. 1 -1China-peoples Republic Of 6,554 77 22 55Czech Republic 0 0 9 -9Denmark 4 .. 6 -6Ethiopia 0 0 .. ..France 0 0 8 -8Germany 3,914 46 83 -38Hongkong 4,334 51 92 -42Iceland 52 1 4 -3India 1,332 16 20 -5Iran 4 .. 0 ..Ireland 0 0 -2 2Italy(including Vatican City) 11 .. .. ..Japan 1,544 18 24 -6Kenya 9 .. 0 ..Kuwait 45 1 2 -2Luxembourg 153 2 12 -10Malaysia 2 .. .. ..Mauritius 8,549 100 75 25Netherlands(holland) 349 4 3 1Norway 36 .. 4 -4Oman 3 .. 3 -3Portugal 0 0 .. ..Qatar 3 .. .. ..Saudi Arabia 175 2 48 -46Singapore 144 2 3 -1South Africa 16 .. 0 ..Spain 4 .. .. ..Sri Lanka 110 1 3 -1St.lucia 0 0 .. ..Swaziland 0 0 5 -5Sweden 745 9 0 9Switzerland 2,303 27 1 26Turkey 603 7 .. 7U. A. E. Abudhabi 3,183 37 2,042 -2,005U. A. E. Dubai 7,765 91 2 89U. A. E. Sharjah 0 0 110 -110U. A. E. Fujairah 28 .. 0 ..U. K. 410,896 4,806 61 4,745U. S. A. 98,246 1,149 1,793 -644Virgin Islands 0 0 1 -1

TYPE OF SERVICE / COUNTRY
Rs. US $
(Amount in Thousand)
Difference
305 State Bank of Pakistan
July20 10 200 920 10
EXPORT OF GOODS BY COMMDOITY / COUNTRY AND SERVICES BY TYPE / COUNTRY
Others, N. E. S. 7,247 85 90 -5Computer & Information Services -3,11016,36913,2591,133,661
Afghanistan 2,565 30 18 12Australia 8,396 98 112 -13Austria 686 8 28 -20Bahrain 470 6 317 -311Belgium 2,673 31 52 -20Canada 26,875 314 163 151Cayman Islands 0 0 32 -32China-peoples Republic Of 36,285 424 296 129Croatia 0 0 9 -9Cyprus 177 2 79 -77Denmark 25,623 300 54 245Egypt 2,857 33 .. 33Estonia 0 0 1 -1Finland 0 0 90 -90France 15,669 183 180 4Germany 11,840 138 66 73Ghana 0 0 .. ..Greece 0 0 .. ..Hongkong 4,777 56 4 52India 12 .. 4 -4Ireland 1,501 18 305 -287Italy(including Vatican City) 980 11 113 -102Japan 18,549 217 256 -39Jordan 197 2 .. 2Kenya 21 .. 5 -5Korea South-(republic Of) 254 3 .. 3Kuwait 975 11 12 -1Lebanon 0 0 10 -10Malaysia 1,583 19 1 18Malta 1,817 21 0 21Mauritius 180 2 249 -247Namibia 0 0 .. ..Nepal 9 .. 6 -5Netherlands(holland) 35,688 417 536 -119New Zealand 126 1 0 1Niger 10 .. 0 ..Nigeria 37 .. 2 -2Norway 5,703 67 164 -98Oman 0 0 97 -97Philippines 366 4 7 -3Portugal 0 0 1 -1Qatar 3,951 46 .. 46Saudi Arabia 40,628 475 229 246Singapore 2,192 26 93 -67South Africa 2,808 33 .. 33Spain 17,807 208 230 -22Sudan 0 0 56 -56Sweden 1,352 16 11 5Switzerland 6,657 78 59 19Thailand 1,646 19 19 ..Turkey 0 0 13 -13Turkmanistan 0 0 1 -1U. A. E. Abudhabi 5,020 59 0 59U. A. E. Dubai 96,006 1,123 1,302 -179U. A. E. Sharjah 0 0 .. ..U. A. E. Ummal Quwain 345 4 0 4U. K. 124,363 1,454 2,344 -890U. S. A. 598,446 6,999 8,504 -1,505Uganda 770 9 0 9Vanuatu 65 1 0 1Zambia 263 3 0 3Others, N. E. S. 24,446 286 239 47

TYPE OF SERVICE / COUNTRY
Rs. US $
(Amount in Thousand)
Difference
Export of Goods and Services July 2010 306
July20 10 200 920 10
EXPORT OF GOODS BY COMMDOITY / COUNTRY AND SERVICES BY TYPE / COUNTRY
Royalties & License fees -1,5381,94040234,343Australia 705 8 0 8Austria 31 .. .. ..China-peoples Republic Of 86 1 0 1Finland 68 1 0 1France 136 2 0 2Germany 8,823 103 55 49Hongkong 58 1 0 1Italy(including Vatican City) 75 1 0 1Japan 150 2 4 -3Lebanon 16 .. 0 ..Malaysia 86 1 0 1Singapore 144 2 4 -2South Africa 20 .. 0 ..Sweden 9 .. 0 ..Switzerland 202 2 1 1Thailand 20 .. 0 ..U. A. E. Abudhabi 0 0 15 -15U. K. 821 10 11 -1U. S. A. 22,894 268 1,851 -1,583
Other Business Services 8,93045,99054,9204,695,853Afghanistan 211,455 2,473 1,528 945American Samoa 0 0 5 -5Argentina 37 .. 8 -7Australia 34,195 400 123 277Austria 31,104 364 981 -618Bahrain 39,691 464 270 194Bangladesh 1,861 22 -20 42Belgium 79,867 934 769 166Benin(dahomey) 482 6 0 6Bermuda 167 2 6 -4Bhutan 111 1 0 1Botswana 118 1 1 1Brazil 732 9 12 -4Brunei 0 0 12 -12Bulgaria 117 1 0 1Canada 37,948 444 180 264Chad 2,031 24 0 24China-peoples Republic Of 354,083 4,141 2,329 1,812Colombia 0 0 10 -10Cyprus 1,666 19 15 5Czech Republic 1,732 20 101 -81Denmark 4,719 55 246 -191Djibouti 0 0 35 -35Egypt 6,062 71 14 57Estonia 655 8 .. 7Finland 17,920 210 62 148France 57,698 675 126 549Gabon 67 1 0 1Georgia 143 2 0 2Germany 316,168 3,698 2,410 1,287Ghana 0 0 3 -3Greece 19,035 223 43 180Hongkong 57,125 668 923 -255Iceland 0 0 1 -1India 29,489 345 566 -221Indonesia 15,467 181 48 133A.d.b.(asian Development 28 .. 0 ..B.i.s.(bank For International 0 0 8 -8W.h.o.(world Health 126 1 0 1Iran 68 1 2 -2Ireland 5,167 60 24 37Italy(including Vatican City) 14,934 175 486 -311Jamaica 217 3 0 3
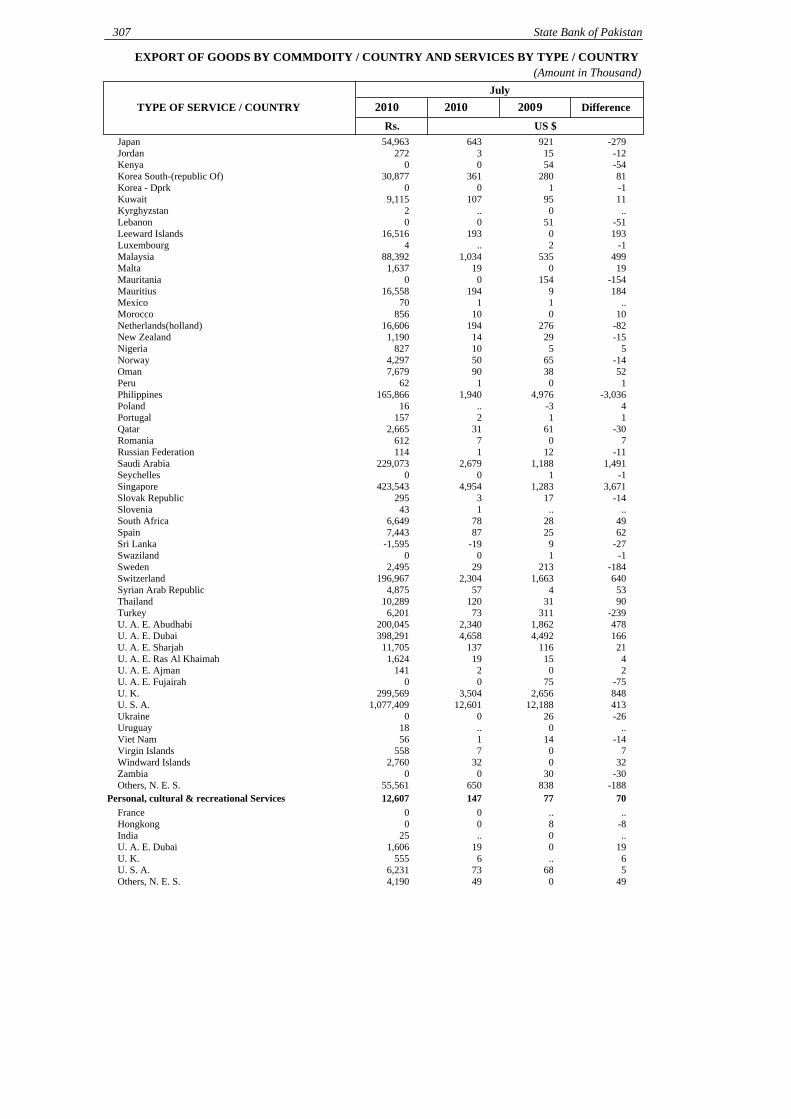
TYPE OF SERVICE / COUNTRY
Rs. US $
(Amount in Thousand)
Difference
307 State Bank of Pakistan
July20 10 200 920 10
EXPORT OF GOODS BY COMMDOITY / COUNTRY AND SERVICES BY TYPE / COUNTRY
Japan 54,963 643 921 -279Jordan 272 3 15 -12Kenya 0 0 54 -54Korea South-(republic Of) 30,877 361 280 81Korea - Dprk 0 0 1 -1Kuwait 9,115 107 95 11Kyrghyzstan 2 .. 0 ..Lebanon 0 0 51 -51Leeward Islands 16,516 193 0 193Luxembourg 4 .. 2 -1Malaysia 88,392 1,034 535 499Malta 1,637 19 0 19Mauritania 0 0 154 -154Mauritius 16,558 194 9 184Mexico 70 1 1 ..Morocco 856 10 0 10Netherlands(holland) 16,606 194 276 -82New Zealand 1,190 14 29 -15Nigeria 827 10 5 5Norway 4,297 50 65 -14Oman 7,679 90 38 52Peru 62 1 0 1Philippines 165,866 1,940 4,976 -3,036Poland 16 .. -3 4Portugal 157 2 1 1Qatar 2,665 31 61 -30Romania 612 7 0 7Russian Federation 114 1 12 -11Saudi Arabia 229,073 2,679 1,188 1,491Seychelles 0 0 1 -1Singapore 423,543 4,954 1,283 3,671Slovak Republic 295 3 17 -14Slovenia 43 1 .. ..South Africa 6,649 78 28 49Spain 7,443 87 25 62Sri Lanka -1,595 -19 9 -27Swaziland 0 0 1 -1Sweden 2,495 29 213 -184Switzerland 196,967 2,304 1,663 640Syrian Arab Republic 4,875 57 4 53Thailand 10,289 120 31 90Turkey 6,201 73 311 -239U. A. E. Abudhabi 200,045 2,340 1,862 478U. A. E. Dubai 398,291 4,658 4,492 166U. A. E. Sharjah 11,705 137 116 21U. A. E. Ras Al Khaimah 1,624 19 15 4U. A. E. Ajman 141 2 0 2U. A. E. Fujairah 0 0 75 -75U. K. 299,569 3,504 2,656 848U. S. A. 1,077,409 12,601 12,188 413Ukraine 0 0 26 -26Uruguay 18 .. 0 ..Viet Nam 56 1 14 -14Virgin Islands 558 7 0 7Windward Islands 2,760 32 0 32Zambia 0 0 30 -30Others, N. E. S. 55,561 650 838 -188
Personal, cultural & recreational Services 707714712,607France 0 0 .. ..Hongkong 0 0 8 -8India 25 .. 0 ..U. A. E. Dubai 1,606 19 0 19U. K. 555 6 .. 6U. S. A. 6,231 73 68 5Others, N. E. S. 4,190 49 0 49
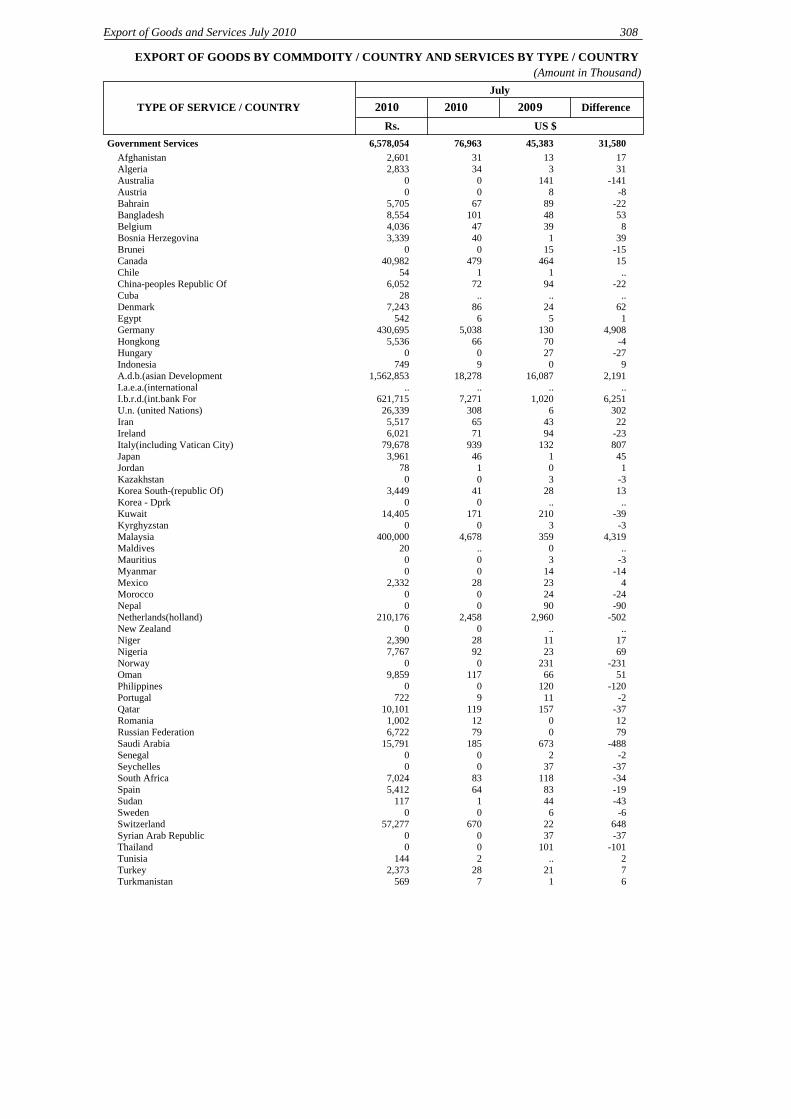
TYPE OF SERVICE / COUNTRY
Rs. US $
(Amount in Thousand)
Difference
Export of Goods and Services July 2010 308
July20 10 200 920 10
EXPORT OF GOODS BY COMMDOITY / COUNTRY AND SERVICES BY TYPE / COUNTRY
Government Services 31,58045,38376,9636,578,054Afghanistan 2,601 31 13 17Algeria 2,833 34 3 31Australia 0 0 141 -141Austria 0 0 8 -8Bahrain 5,705 67 89 -22Bangladesh 8,554 101 48 53Belgium 4,036 47 39 8Bosnia Herzegovina 3,339 40 1 39Brunei 0 0 15 -15Canada 40,982 479 464 15Chile 54 1 1 ..China-peoples Republic Of 6,052 72 94 -22Cuba 28 .. .. ..Denmark 7,243 86 24 62Egypt 542 6 5 1Germany 430,695 5,038 130 4,908Hongkong 5,536 66 70 -4Hungary 0 0 27 -27Indonesia 749 9 0 9A.d.b.(asian Development 1,562,853 18,278 16,087 2,191I.a.e.a.(international .. .. .. ..I.b.r.d.(int.bank For 621,715 7,271 1,020 6,251U.n. (united Nations) 26,339 308 6 302Iran 5,517 65 43 22Ireland 6,021 71 94 -23Italy(including Vatican City) 79,678 939 132 807Japan 3,961 46 1 45Jordan 78 1 0 1Kazakhstan 0 0 3 -3Korea South-(republic Of) 3,449 41 28 13Korea - Dprk 0 0 .. ..Kuwait 14,405 171 210 -39Kyrghyzstan 0 0 3 -3Malaysia 400,000 4,678 359 4,319Maldives 20 .. 0 ..Mauritius 0 0 3 -3Myanmar 0 0 14 -14Mexico 2,332 28 23 4Morocco 0 0 24 -24Nepal 0 0 90 -90Netherlands(holland) 210,176 2,458 2,960 -502New Zealand 0 0 .. ..Niger 2,390 28 11 17Nigeria 7,767 92 23 69Norway 0 0 231 -231Oman 9,859 117 66 51Philippines 0 0 120 -120Portugal 722 9 11 -2Qatar 10,101 119 157 -37Romania 1,002 12 0 12Russian Federation 6,722 79 0 79Saudi Arabia 15,791 185 673 -488Senegal 0 0 2 -2Seychelles 0 0 37 -37South Africa 7,024 83 118 -34Spain 5,412 64 83 -19Sudan 117 1 44 -43Sweden 0 0 6 -6Switzerland 57,277 670 22 648Syrian Arab Republic 0 0 37 -37Thailand 0 0 101 -101Tunisia 144 2 .. 2Turkey 2,373 28 21 7Turkmanistan 569 7 1 6

TYPE OF SERVICE / COUNTRY
Rs. US $
(Amount in Thousand)
Difference
309 State Bank of Pakistan
July20 10 200 920 10
EXPORT OF GOODS BY COMMDOITY / COUNTRY AND SERVICES BY TYPE / COUNTRY
U. A. E. Abudhabi 86,435 1,011 690 321U. A. E. Dubai 0 0 131 -131U. K. 438,564 5,129 7,902 -2,772U. S. A. 2,256,802 26,396 11,878 14,519Ukraine 619 7 4 3Uzbekistan 0 0 19 -19Viet Nam 68 1 24 -23Yemen Arab Republic 0 0 2 -2Zimbabwe 257 3 0 3Others, N. E. S. 212,548 2,486 698 1,788
(H) Total Export of Goods and Services (F+G) 164,733,405 1,926,913 1,803,013 123,900