northbay evaluation report 2012-2013 school year
44
Stern, Ardoin, & Powell © 2013 NORTHBAY EVALUATION REPORT 2012-2013 SCHOOL YEAR SUBMITTED BY: MARC J. STERN NICOLE ARDOIN BOB POWELL EVALUATION CONSULTANTS AUGUST 2013
-
Upload
khangminh22 -
Category
Documents
-
view
4 -
download
0
Transcript of northbay evaluation report 2012-2013 school year

Stern, Ardoin, & Powell © 2013
NORTHBAY EVALUATION REPORT 2012-2013 SCHOOL YEAR
SUBMITTED BY:
MARC J. STERN NICOLE ARDOIN BOB POWELL
EVALUATION CONSULTANTS
AUGUST 2013

Stern, Ardoin, & Powell © 2013
TABLE OF CONTENTS
I. Executive Summary ................................................................................................... 3 II. Evaluation Report ...................................................................................................... 8
A. Introduction .................................................................................................... 8 B. Overview and Timeline of Evaluation Process ............................................ 8 C. Outcomes of Interest ..................................................................................... 9 D. Evaluation Research Methods .................................................................... 11 E. Results: Student-related outcomes ............................................................ 14 F. Results: Teacher-Related Outcomes .......................................................... 36 G. Conclusions ................................................................................................. 42
III. Appendix A: Biographies of Evaluation Team ..................................................... 43

Stern, Ardoin, & Powell © 2013
3
EXECUTIVE SUMMARY This report summarizes the results from the first seven years of an ongoing
evaluation system designed to measure the short-term and long-term impacts of residential educational programs at the NorthBay Environmental Education Center during the school year. The data shared in this report result from surveys administered to student participants immediately before, immediately after, and three months following their NorthBay experiences in each year and to teachers in six years of the program.
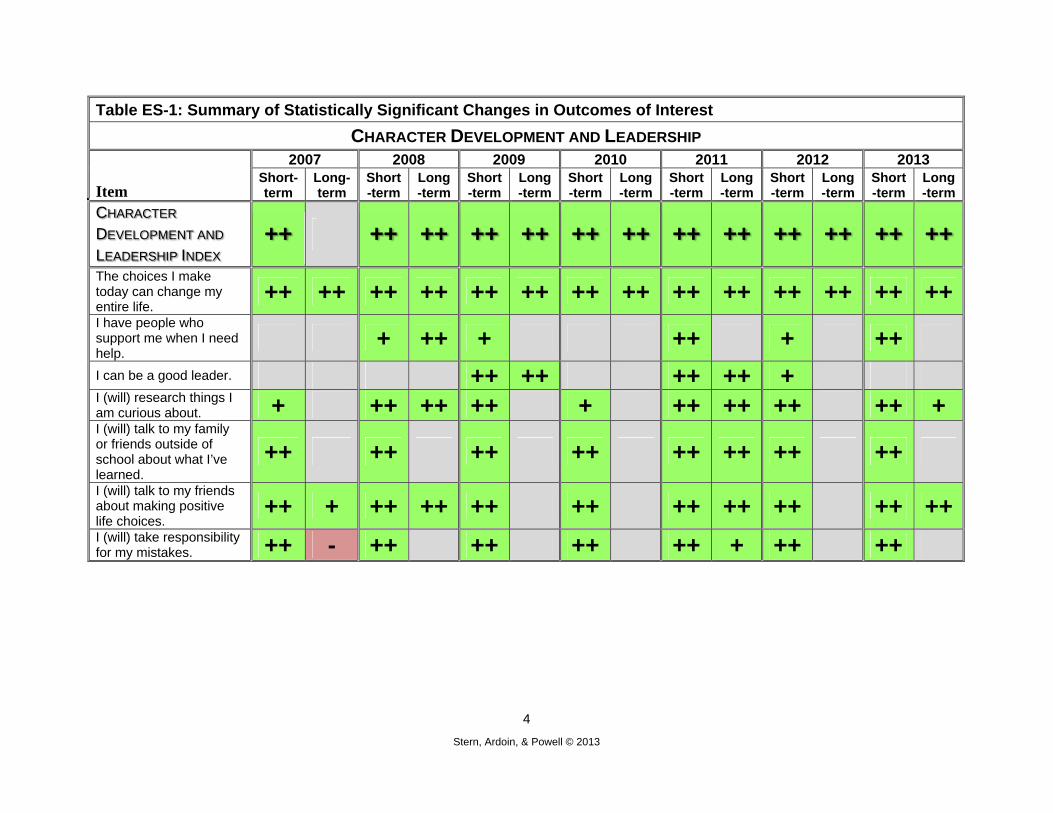
SUMMARIZING AND INTERPRETING STUDENT-RELATED OUTCOMES The evaluation investigated three primary targeted outcomes for student visitors
to NorthBay—character development and leadership; environmental responsibility; and attitudes toward school. Confirming the remarkable success of NorthBay, the results of the 2012-2013 evaluation show continued positive results associated with each targeted outcome of the program. Table ES-1 summarizes the individual measures associated with each of these themes that showed statistically significant changes over the course of the evaluation. Boxes marked with a “+” (and colored in green), indicate achievement of NorthBay goals, indicating statistically significant positive changes in scores (p < .05). Boxes marked with “++” indicate even stronger positive statistical relationships (p < .01). Boxes marked with minus symbols (and colored in red) indicate the opposite. Gray boxes indicate no statistically significant change in post-experience scores on survey items from pre-experience scores.
The table also contains composite indexes reflecting summary scores for each theme. These indexes were constructed to provide a concise measure of each concept and were confirmed through extensive statistical analysis (confirmatory factor analysis).
Examining the survey results over the seven years of the NorthBay program reveals some meaningful trends regarding the impacts of the program on visiting students. Throughout the tenure of the program, statistically significant short-term and long-term gains have been achieved on the Character Development and Leadership and the Environmental Responsibility indices. Significant short-term gains in the Attitudes toward School index began to take place in the second year of the program and have continued in subsequent years. The 2010-2011 school year marked the only year in which we observed significant positive long-term gains in attitudes toward school. The inconsistency on this goal indicates the likely influence of multiple intervening factors between the end of the program and the follow-up surveys. This is further supported by highly variable results in the last two years between populations at different schools.
With seven years of data, it is clear that NorthBay has positive impacts on students on all key outcomes of interest and a high potential for long-term gains as well. However, it is also clear that much of the longer-term attitudes measured herein rely not only upon NorthBay programming, but also upon students’ teachers, their schools, and their lived experiences in their homes and communities.
Stern, Ardoin, & Powell © 2013
4
Table ES-1: Summary of Statistically Significant Changes in Outcomes of Interest
CHARACTER DEVELOPMENT AND LEADERSHIP
Item
2007 2008 2009 2010 2011 2012 2013 Short-term
Long-term
Short-term
Long-term
Short-term
Long-term
Short-term
Long-term
Short-term
Long-term
Short-term
Long-term
Short-term
Long-term
CHARACTER
DEVELOPMENT AND
LEADERSHIP INDEX ++ ++ ++ ++ ++ ++ ++ ++ ++ ++ ++ ++ ++
The choices I make today can change my entire life.
++ ++ ++ ++ ++ ++ ++ ++ ++ ++ ++ ++ ++ ++I have people who support me when I need help.
+ ++ + ++ + ++
I can be a good leader. ++ ++ ++ ++ + I (will) research things I am curious about. + ++ ++ ++ + ++ ++ ++ ++ + I (will) talk to my family or friends outside of school about what I’ve learned.
++ ++ ++ ++ ++ ++ ++ ++
I (will) talk to my friends about making positive life choices.
++ + ++ ++ ++ ++ ++ ++ ++ ++ ++I (will) take responsibility for my mistakes. ++ - ++ ++ ++ ++ + ++ ++

Stern, Ardoin, & Powell © 2013
5
Table ES-1 (continued): Summary of Statistically Significant Changes in Outcomes of Interest
ENVIRONMENTAL RESPONSIBILITY
Item
2007 2008 2009 2010 2011 2012 2013 Short-term
Long-term
Short-term
Long-term
Short-term
Long-term
Short-term
Long-term
Short-term
Long-term
Short-term
Long-term
Short-term
Long-term
ENVIRONMENTAL
RESPONSIBILITY
INDEX ++ ++ ++ ++ ++ ++ ++ ++ ++ ++ + ++ ++
My actions impact the health of the environment.
++ + ++ ++ ++ ++ ++ ++ ++ ++ ++ ++ ++ ++I have the power to help protect the environment. ++ ++ ++ ++ ++ ++ ++ ++ + ++ I can make a change in my community. ++ ++ + ++ ++ ++ ++ + ++ ++Interest in learning about how to protect the environment.
-- ++ ++ ++ ++ ++ ++ Interest in working to make my community a better place.
-- ++ ++ ++ ++ ++ ++ I (will) work as a volunteer in my community.
++ ++ ++ ++ ++ ++ ++ ++ ++ ++ ++ ++ ++ ++

Stern, Ardoin, & Powell © 2013
6
Table ES-1 (continued): Summary of Statistically Significant Changes in Outcomes of Interest
ATTITUDES TOWARD SCHOOL
Item
2007 2008 2009 2010 2011 2012 2013 Short-term
Long-term
Short-term
Long-term
Short-term
Long-term
Short-term
Long-term
Short-term
Long-term
Short-term
Long-term
Short-term
Long-term
ATTITUDES
TOWARD SCHOOL
INDEX -- ++ ++ ++ - ++ ++ ++ ++
Going to school is a waste of time for me.
++ ++ ++ ++ ++ + ++
I enjoy school. - ++ ++ ++ ++ ++ ++ Interest in learning about new subjects in school.
- ++ ++ ++ ++ ++ ++ ++ ++ + ++ ++Interest in going to college ++ ++ + ++ ++ + + ++ + I have teachers that really care about me.***
-- - ++ ++ -- ++ + ++ + I have teachers that truly believe I can succeed.***
-- -- -- ++ - ++ ++ I (will) pay attention to the teacher in class.
++ -- ++ -- ++ - ++ -- ++ ++ -- ++ -- *** For years, 2007 through 2010, these survey items read: “How many of your teachers really care about you?” and “How many of your teachers truly believe that you can succeed?” These items were changed in the 2010-2011 school year to the above wording to better reflect the concept.

Stern, Ardoin, & Powell © 2013
7
SUMMARIZING AND INTERPRETING TEACHER-RELATED OUTCOMES This report contains results from surveys with visiting teachers from all years
except the 2008-2009 school year. Surveys were not obtained for teachers in 2008-2009 because of logistical difficulties. Teachers were asked on pre-experience surveys to select from two lists of objectives for their NorthBay experiences. One list included items related to student outcomes and the other included teacher-related outcomes. The most commonly selected student-related objectives for each year of the program were for students to recognize that the choices they make today will impact their future and for them to learn to cooperate better when interacting with each other. Teacher-related objectives have varied somewhat from year to year. The most consistently cited teacher-related objectives include getting to know students better, learning how to better motivate students, and learning to better facilitate positive interactions amongst students. Post-experience surveys reveal that teachers believe that NorthBay consistently achieves both student- and teacher-related objectives.
SATISFACTION: HIGH POINTS AND LOW POINTS
Similar to prior years, 2012-2013 students expressed tremendous satisfaction with their NorthBay experience, averaging a satisfaction score of 9.0 out of a possible 10.0. Immediately following their experiences in 2012-2013, 81% of students indicated that NorthBay changed the way they look at their lives. Three months after the experience, 70% still did so. The most popular activities cited by students in all years were the adventure-based activities. In each year, students cited student behavioral issues among their least favorite aspects of the program.
Teachers also report high levels of satisfaction with the program. On a 1-to-5 scale, levels of teacher satisfaction averaged 4.27, 4.52, 4.89, 4.83, 4.45, and 4.70 in consecutive years of measurement. Teachers consistently express getting to know their students better and the NorthBay staff as their favorite aspect of the program. In most years, including the most recent one, they also mention watching their students change over the course of the week, the NorthBay staff, and specific lessons among their favorite aspects of the program. Teachers’ least favorite aspects of the program are more variable from year to year. In 2012-2013, the most commonly reported “least favorite” parts of the experience involved program logistics and, to a lesser extent, some behavioral problems with the students.
CONCLUSIONS The NorthBay program continues to produce positive results for both students
and their teachers who participate in the program. Fluctuations in the long-term impact of the program on attitudes toward school confirm that while NorthBay can plant the seeds for long-term impacts upon visiting students, much lies in the hands of the students themselves, their teachers, and their communities to reinforce the lessons learned at NorthBay. With this in mind, we suggest that NorthBay continue to move forward with providing follow-on programming, including potential volunteer programs for students, to enhance the long-term impact of the program. We also recommend that NorthBay continue to document changes to their programs from year to year to be examined in concert with outcomes discussed in this report to continue to adapt to the changing needs of the populations the program serves.

Stern, Ardoin, & Powell © 2013
8
2012-2013 EVALUATION OF RESIDENTIAL SCHOOL-YEAR PROGRAMS AT THE
NORTHBAY ENVIRONMENTAL EDUCATION CENTER
INTRODUCTION NorthBay has continued its commitment to ongoing evaluation of the outcomes and long-term impacts of its educational programs. Recognizing the importance of measuring success, documenting areas for improvement, and acting upon this information, NorthBay’s leadership and education teams have implemented a robust system for assessing their efforts.
Developing the NorthBay evaluation system continues to be a participatory process. This process began in 2005 by engaging a diversity of staff members—including managers, educators, and operations personnel—in a year-long planning process. Facilitated by a team of evaluation consultants (see Appendix A for more on the team), a series of goal-setting and evaluation-development workshops encouraged staff members to clarify how program goals and objectives could most appropriately support the organization’s mission, which is currently stated as:
Challenge middle school students to realize that their attitudes and actions have a lasting impact on their future, the environment and the people around them by using approved Maryland Department of Education curriculum and the outdoors as an integrating context.
By framing the desired educational outcomes in light of the overall mission, these workshops were also instrumental in helping educators craft targeted experiences for students. The resulting evaluation strategy, which centers on a comprehensive array of evaluation instruments, was pilot tested and subsequently revised to reflect the unique setting, student population, and logistical considerations present at NorthBay.
The initial evaluation-development process was completed in August 2006. Data collection has taken place during each school since, including pre-visit surveys, post-visit surveys, and three-month delayed surveys administered at regular intervals by NorthBay staff. This report provides the results of the seven years of evaluation; it also compares each year’s results where appropriate.
OVERVIEW AND TIMELINE OF EVALUATION DEVELOPMENT PROCESS
NorthBay’s participatory evaluation-development process was directed by the organization’s needs, wants, and logistical realities. Following a utilization-focused evaluation approach,1 the end users (NorthBay staff) guided the process. The evaluation consultants, functioning as facilitators and methodological experts, tailored an evaluation system to meet stakeholders’ needs, using rigorous data-collection methods to produce use-oriented results. The evaluation was designed in the following stages:
1 Patton, M. Q. (1996). Utilization-Focused Evaluation: The new century text (3rd ed.) Thousand Oaks, CA: Sage Publications.

Stern, Ardoin, & Powell © 2013
9
Front-End Assessment (January through May 2005): Evaluation consultants interviewed key stakeholders to learn about their vision for an evaluation system.
Goal-Setting Workshop (June 2005): Evaluation consultants conducted a two-day workshop with NorthBay staff to clarify NorthBay’s goals and objectives and draft measurable indicators for addressing those objectives.
Instrument Development (Summer and Fall 2005): Based on workshop outcomes, consultants created the evaluation instruments, including surveys for students (pre-visit and post-visit); surveys for teachers (pre-visit and post-visit); interviews for teachers (post-visit only); and a trend monitoring template for participating schools and districts.
Pilot Testing and Program Observation (October and December 2005): Consultants observed one week of NorthBay programming. Tested draft pre-experience and post-experience surveys with five-day NorthBay programs (five schools). Tested follow-up interview scripts four months after program completion.
Instrument Revision (Spring and Summer 2006): Consultants revised evaluation instruments and protocol based on pilot test results and ongoing discussions with NorthBay administrators and senior staff.
Evaluation Workshop (August 2006): Consultants conducted one-day workshop to present and review final evaluation instruments with staff; instructed staff on data collection, management, and basic analysis; and responded to questions regarding the evaluation process.
Year 1 Data Collection (Fall 2006 through Spring 2007): NorthBay staff administered pre-experience, post-experience, and follow-up surveys to participating students and teachers. Staff members conducted interviews with selected visiting teachers after their experiences. Staff also entered data into SPSS spreadsheets for later analysis.
Interview Training (January 2007): Consultants conducted workshop to train selected NorthBay staff members to administer teacher interviews. Reviewed administration procedures, practiced interview techniques, and discussed interview data analysis.
Year 1 Data Analysis (Summer 2007): Evaluation consultants conducted statistical analyses of all survey data and reviewed interview notes taken by NorthBay staff.
Years 2 through 7 followed the same pattern as Year 1 for Data Collection and Analysis.
OUTCOMES OF INTEREST
During an intensive two-day workshop in June 2005, NorthBay staff identified six programmatic goals. Those goals drove the development of the evaluation instruments as well as subsequent analysis of all data collected.

Stern, Ardoin, & Powell © 2013
10
Goal One: Character Development: To empower NorthBay participants to recognize they can make choices that can lead to a promising future.
Primary objectives: Students will: Believe that their personal choices have an impact on their future. Believe they can make appropriate, positive life choices starting during the
NorthBay week. Develop and rely on a support structure.
Goal Two: Leadership: To foster the growth of leadership skills in NorthBay participants.
Primary objectives: Students will: Care about others. Clearly communicate with one another and demonstrate good listening skills. Take responsibility.
Goal Three: Environmental Responsibility: To inspire environmental responsibility and community respect in NorthBay participants.
Primary objectives: Students and teachers will: Understand their actions affect the environment. Be involved in making a difference for the community. Engage in environmental stewardship. Recognize environmental health, good and bad.
Goal Four: School Culture and Climate: To encourage a healthy and empowered culture in participant schools.
Primary objectives: Teachers are energetic, enthusiastic facilitators of learning who are respectful of
students and other staff. Students are enthusiastic, energetic learners who are respectful of others, the
school, and the community. Students are expected by themselves and by their teachers to complete
school/education.
Goal Five: Academic Performance: To inspire improved performance of NorthBay participants in school
Primary objectives: Students improve academic performance. Students are more excited about learning. Students are more involved in extra-curricular activities.

Stern, Ardoin, & Powell © 2013
11
Goal Six: Customer Satisfaction: To provide an extraordinary experience for guests and staff
Primary objectives: NorthBay exceeds expectations of guests. NorthBay participants exhibit high levels of satisfaction
The confirmatory factor analysis of early data indicated that the first five of these goals should be measured, analyzed, and reported as three specific measures: character development and leadership; environmental responsibility; and attitudes toward school (comprised of ideas from the school culture and climate and academic performance goals). Satisfaction was identified to be a stand-alone concept. In the 2010-2011 school year, additional items were added to the survey to measure participants’ attitudes toward the Chesapeake Bay (see below for more details).
EVALUATION RESEARCH METHODS
Surveys were administered at three points: (1) immediately upon school groups’ arrival to the NorthBay campus; (2) immediately before school groups’ departure during their final meal on the NorthBay campus; (3) and three months following the NorthBay visit at their respective schools. Table 1 shows the numbers and characteristics of the students surveyed in each school year. Follow-up surveys did not occur in urban schools in 2009. Table 1. Respondents to student surveys. School year
Pre-experience Post-experience Follow-up Total Female Urban Total Female Urban Total Female Urban
2006-2007 445 55.7% 37.5% 445 55.7% 37.5% 410 57.8% 38.5% 2007-2008 866 55.5% 40.6% 866 55.6% 40.6% 349 54.0% 55.0% 2008-2009 590 51.4% 28.6% 589 51.4% 28.7% 286 45.8% 0.0% 2009-2010 744 49.5% 35.5% 743 49.5% 35.3% 422 46.7% 30.3% 2010-2011 1190 53.2% 29.6% 1183 53.3% 29.5% 850 55.4% 25.4% 2011-2012 1142 52.6% 31.6% 1134 52.7% 31.7% 594 53.5% 22.1% 2012-2013 1829 52.8% 35.3% 1825 52.8% 35.3% 1026 55.2% 27.3%
Table 2 shows the numbers of teacher surveys we analyzed in each school year. Analysis of teacher surveys did not take place in 2008-2009 due to low survey response rates. Table 2. Respondents to teacher surveys.
School year Pre-experience Post-experience Follow-up Total Urban Total Urban Total Urban
2006-2007 40 57.5% 38 55.3% 6 83.3% 2007-2008 44 63.6% 44 63.6% 10 20.0% 2009-2010 23 34.8% 23 34.8% 9 33.3% 2010-2011 44 38.2% 43 37.2% 16 18.8% 2011-2012 49 30.6% 43 34.9% 22 9.1% 2012-2013 73 37.8% 71 39.4% 20 40.0%

Stern, Ardoin, & Powell © 2013
12
In each year of the program, an explicit effort was made to select schools for the study that would represent a diverse cross-section of participants across the non-urban-to-urban spectrum and ensure diverse ethnic and socioeconomic composition of the sample. Specific weeks were chosen each year in an effort to re-sample some of the same schools each year. This enabled a broader and more representative cross-section than surveying selected schools only. All schools visiting NorthBay during each selected week were sampled. Table 3 contains the names of the schools surveyed during each year of the NorthBay program and shows which schools were surveyed repeatedly. Table 3. Schools included in the evaluation study during each year of the NorthBay program. School year
Schools
2006-2007 Bohemia Manor (Cecil County), Calverton (Baltimore City), Connexions (Baltimore City), John Carroll (Prince George’s County), New Song Academy (Baltimore City), Perryville (Cecil County), Rosemont (Baltimore City), Woodburne Day School (Baltimore City)
Schools already surveyed Newly surveyed 2007-2008 Bohemia Manor, Calverton, Perryville Arlington, Armistead Garden, Barclay, Franklin
Square, George Kelson, Glenmount, Graceland Park, Harlem Park, Highland 215, Highland 237, Lemmel, Loch Raven, North Bend, Steuart Hill, Tench Tilghman
2008-2009 Bohemia Manor, Perryville, Catonsville, Chesapeake Public Charter School, Dunbar, Mt. Royal, West Baltimore
2009-2010 Bohemia Manor, Catonsville, Perryville, ,Mt. Royal, West Baltimore
Arundel, Dickey Hill, Empowerment Academy, Roland Park
2010-2011 Bohemia Manor, Catonsville, Perryville, Roland Park
Arbutus, City Neighbors, Frances Scott Key, Friendship Academy of Science and Technology, Golden Ring, Holabird, Resurrection-St. Paul, Somerset, Windsor Mill
2011-2012 Arbutus, Bohemia Manor, Catonsville, City Neighbors Charter School, Friendship Academy of Science and Technology, Perryville, Roland Park, Windsor Mill
Baden, Kenmoor, Knowledge and Success Academy, Old Court
2012-2013 Arbutus,Baden, Barclay, Bohemia Manor, Catonsville, Empowerment Academy, Glenmount, Golden Ring, Kenmoor, Perryville, Roland Park
Baltimore Leadership School for Women, Berwyn Heights, The Crossroads School, Fallstaff, Fort Foote, Francis Scott Key, General John Stricker, Hamilton, Harper’s Choice, John Rurah, Lakeland, Patuxent Valley, Robert Goddard Montessori, Southwest Academy
The surveys were designed explicitly to measure the outcomes of greatest interest to NorthBay, as described. Three indices were developed to provide summary measures of key student-related outcomes initially following procedures outlined by DeVellis (2003)2. These indices were later revised through confirmatory factor analysis.
2 DeVellis, R. F. (2003). Scale Development: Theory and application (2nd Ed.). Thousand Oaks, CA: Sage Publications.

Stern, Ardoin, & Powell © 2013
13
Measurement Improvement
During 2009, as part of a continuous improvement process, the evaluation consultants used the first two years of data to assess the reliability of the indices through Confirmatory Factor Analysis. This procedure was performed on each index to ensure that the indices were measuring the attitudes and behaviors they were thought to represent. This process revealed that for students participating at NorthBay, improvements could be made to the Character Development and Leadership index and the Attitudes toward School index. One item was removed from the original Character Development and Leadership index and another from the original Attitudes toward School index. Additionally, one item was moved from the Attitudes toward School index to the Character Development and Leadership index. The Environmental Responsibility index remained unchanged.3
The resulting Character Development and Leadership index was comprised of seven survey items; the Environmental Responsibility index was comprised of six items; and the Attitudes toward School index was comprised of seven items (Table 4).
Further reliability analyses were also performed to ensure internal validity of the indexes. Chronbach’s Alphas for each index are each above 0.7 and, therefore, were deemed internally consistent. Items were measured on five-point Likert-type scales, and components of each index were weighted equally. In 2010, an additional improvement was made to the Attitudes toward School index. The following two items were changed to better reflect the construct. In prior years, students were asked to respond with a rough proportion to “How many of your teachers really care about you?” and “How many of your teachers believe that you can succeed?” These items were changed to five-point agree/disagree questions: “I have teachers that really care about me” and “I have teachers that truly believe that I will succeed.” Cronbach’s alpha scores for the new Attitudes toward School index was 0.78. The items making up the final annual indexes for the last three years of the program are displayed in Table 4. We also added some additional items to the 2010-2011 survey regarding students’ attitudes toward the Chesapeake Bay. These items make up a fourth index (Cronbach’s alpha = 0.82):
The health of the Chesapeake Bay is important to me Interest in learning more about the Chesapeake Bay Interest in working to keep the Chesapeake Bay healthy
Because of the changes in items included in the indexes, this report is not directly comparable to the reports produced prior to 2010. All indexes from prior years have been updated and recalculated in this report to allow for direct comparison. Because of the changes to the Attitudes toward School index, this index is not directly comparable
3 For more information on the index development, see: Powell, R.B., M.J. Stern, B. Krohn, and N.M. Ardoin 2011. Scale
development and validation for environmental education outcomes: environmental responsibility, character development, and attitudes toward school. Environmental Education Research 17(1): 91-111.

Stern, Ardoin, & Powell © 2013
14
to prior years in either report. We consider the current index a better measure of the construct than prior years’ measures. The revised indexes in this report reflect the most rigorous statistical procedures available to confirm the indexes intended to measure each construct.
RESULTS: STUDENT-RELATED OUTCOMES
Unless otherwise noted, throughout this report higher numerical values indicate positive results reflecting NorthBay goals. Comparisons of before and after mean scores were used to investigate the influence of the program on these indexes. Paired samples t-tests examine the statistical significance of changes in outcome scores before and after the NorthBay experience. Table 5 shows the results of these tests on the indexes for the 2012-2013 school year and also includes comparisons of the Attitudes toward the Chesapeake Bay index. Table 6 compares the results across all four years of the program.
In the first year of the program, significant short-term increases were achieved in the Character Development and Leadership and Environmental Responsibility indices, but not in the Attitudes toward School index. The significant gains in the Character Development and Leadership and Environmental Responsibility indices faded after
Table 4. Final indexes and items.
Character Development and Leadership (α=.71) The choices I make today can change my entire life. I have people who support me when I need help. I (will) take responsibility for my mistakes. I (will) talk to my friends about making positive life choices. I can be a good leader. I (will) research things that I am curious about. I (will) talk to my family or friends outside of school about what I've learned.
Environmental Responsibility (α=.79) My actions impact the health of the environment. I have the power to help protect the environment. I can make a change in my community. Learning about how to protect the environment. Working to make my community a better place. I (will) work as a volunteer in my community.
Attitudes toward School (α=.80) Going to school is a waste of time for me. I enjoy school. Learning about new subjects in school. Going to college. I have teachers that really care about me. I have teachers that truly believe that I will succeed. I (will) pay attention to the teacher in class.
Stern, Ardoin, & Powell © 2013
15
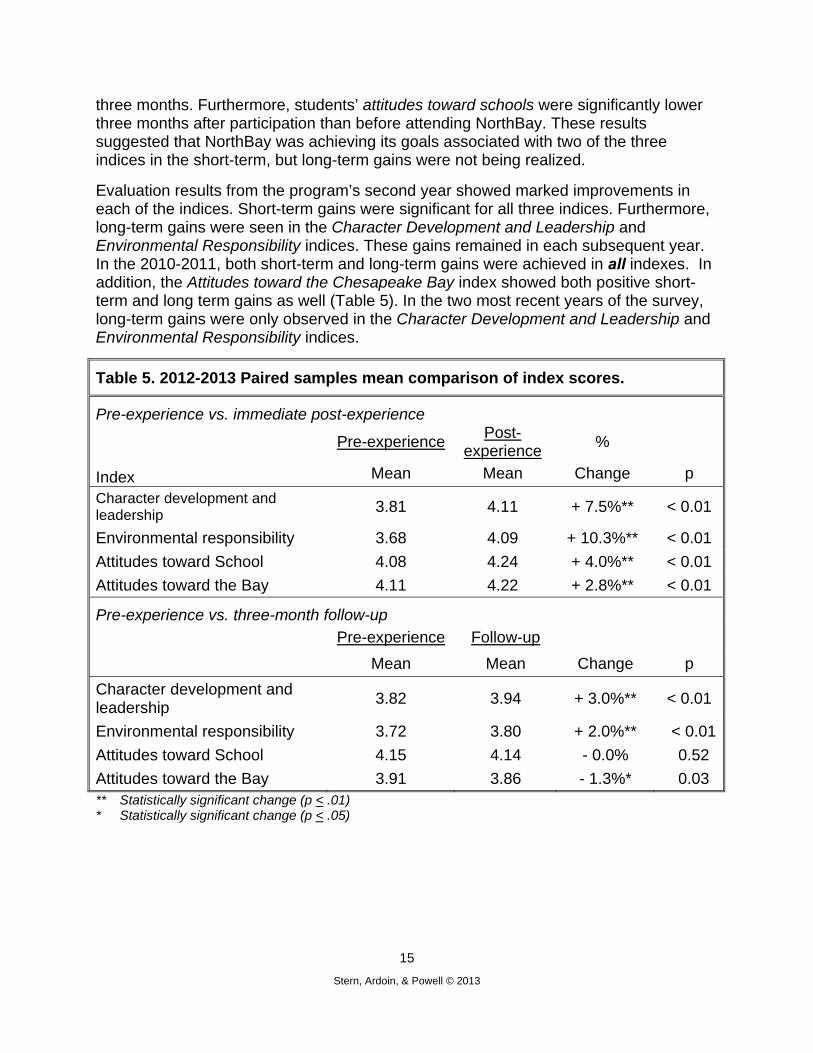
three months. Furthermore, students’ attitudes toward schools were significantly lower three months after participation than before attending NorthBay. These results suggested that NorthBay was achieving its goals associated with two of the three indices in the short-term, but long-term gains were not being realized.
Evaluation results from the program’s second year showed marked improvements in each of the indices. Short-term gains were significant for all three indices. Furthermore, long-term gains were seen in the Character Development and Leadership and Environmental Responsibility indices. These gains remained in each subsequent year. In the 2010-2011, both short-term and long-term gains were achieved in all indexes. In addition, the Attitudes toward the Chesapeake Bay index showed both positive short-term and long term gains as well (Table 5). In the two most recent years of the survey, long-term gains were only observed in the Character Development and Leadership and Environmental Responsibility indices.
Table 5. 2012-2013 Paired samples mean comparison of index scores.
Pre-experience vs. immediate post-experience
Pre-experience Post-
experience %
Index Mean Mean Change p
Character development and leadership 3.81 4.11 + 7.5%** < 0.01
Environmental responsibility 3.68 4.09 + 10.3%** < 0.01
Attitudes toward School 4.08 4.24 + 4.0%** < 0.01
Attitudes toward the Bay 4.11 4.22 + 2.8%** < 0.01
Pre-experience vs. three-month follow-up
Pre-experience Follow-up
Mean Mean Change p
Character development and leadership
3.82 3.94 + 3.0%** < 0.01
Environmental responsibility 3.72 3.80 + 2.0%** < 0.01
Attitudes toward School 4.15 4.14 - 0.0% 0.52
Attitudes toward the Bay 3.91 3.86 - 1.3%* 0.03 ** Statistically significant change (p < .01) * Statistically significant change (p < .05)

Stern, Ardoin, & Powell © 2013
16
Table 6. Comparisons of changes in index scores between school years.
Index Immediate post-test Follow-up survey
2007 2008 2009 2010 2011 2012 2013 2007 2008 2009 2010 2011 2012 2013
Character development and leadership
4.8%** 7.0%** 9.3%** 6.5%** 8.8%** 8.0%** 7.5%** 1.3% 4.5%** 5.3%** 4.5%* 5.5%** 2.8%** 3.0%**
Environmental responsibility
4.8%** 7.8%** 9.5%** 8.5%** 11.0%** 11.0%** 10.3%** - 0.3% 3.0%** 3.5%** 2.3%** 6.0%** 1.8%* 2.0%**
Attitudes toward School
- 0.5% 1.5%** 4.5%** 3.5%** 4.8%** 4.0%** 4.0%** - 3.8%** - 0.7% 0.0% -1.5%* 2.5%** 0.1% 0.0%
Attitudes toward the Bay
Not measured 6.3%** 6.3%** 2.8%** Not measured 3.0%** -1.5% -1.3%*
** Statistically significant (p < 0.01) * Statistically significant (p < 0.05)

Stern, Ardoin, & Powell © 2013
17
Character Development and Leadership The Character Development and Leadership index is comprised of seven questions, three of which are attitudinal statements and four are behavioral in nature. Tables 7, 8, and 9 summarize response to the individual survey items contributing to the Character Development and Leadership index. All items in each table make up the index. Table 7 shows the percentage of students responding positively to each survey item associated with the index. Table 8 compares the mean scores for these responses and show which post-visit scores were significantly different from pre-visit scores for the most recent year of the program.4 Table 9 summarizes the changes observed in students’ scores over the course of each school year. Only one survey item showed statistically significant short-term and long-term positive gains following students’ NorthBay experiences across all years of the program: “The choices I make today can change my entire life.” Most other items have shown statistically significant short-term gains in the past few years of the program. In the 2012-2013 school year, long-term gains were observed in students’ researching things they are curious about and talking to their friends about making positive life choices.
4 Responses were provided on a five-point scale.

Stern, Ardoin, & Powell © 2013
18
Table 7. Percent of student respondents responding affirmatively to survey statements associated with Character Development and Leadership index. Agree/Disagree Statements
% Agreeing With Statement Year Before After Follow-up
The choices I make today can change my entire life.
2007 55% 73% 73% 2008 51% 77% 77% 2009 48% 79% 78% 2010 45% 73% 71% 2011 51% 82% 82% 2012 52% 82% 78% 2013 53% 83% 77%
I have people who support me when I need help.
2007 89% 87% 89% 2008 89% 89% 91% 2009 83% 87% 82% 2010 87% 85% 86% 2011 90% 91% 90% 2012 88% 90% 88% 2013 87% 89% 87%
I can be a good leader.
2007 73% 76% 70% 2008 80% 81% 79% 2009 70% 78% 72% 2010 73% 74% 74% 2011 77% 80% 79% 2012 76% 80% 78% 2013 79% 80% 80%
Frequency Statements5
% Reporting Behavior Often or Always
Year Before After Follow-up
I (will) research things I am curious about.
2007 47% 51% 46% 2008 50% 61% 53% 2009 47% 56% 48% 2010 53% 57% 51% 2011 56% 69% 63% 2012 58% 68% 65% 2013 59% 69% 64%
I (will) talk to my family or friends outside of school about what I’ve learned.
2007 40% 44% 41% 2008 38% 47% 42% 2009 33% 47% 37% 2010 41% 51% 41% 2011 44% 57% 51% 2012 43% 56% 45% 2013 42% 55% 47%
I (will) talk to my friends about making positive life choices.
2007 41% 59% 48% 2008 48% 61% 51% 2009 42% 62% 42% 2010 42% 59% 40% 2011 49% 69% 57% 2012 50% 68% 53% 2013 48% 68% 54%
I (will) take responsibility for my mistakes.
2007 66% 72% 59% 2008 63% 73% 63% 2009 55% 70% 58% 2010 61% 74% 61% 2011 69% 81% 73% 2012 68% 83% 74% 2013 72% 82% 75%
5 Conditional wording (in parentheses) used on immediate post-experience tests only.

Stern, Ardoin, & Powell © 2013
19
Table 8. 2012-2013 Character Development and Leadership: paired samples means comparison by item.
Pre-experience vs. immediate post-experience
Survey Items
Pre-experience
Post-experience
%
Mean Mean Change p The choices I make today can change my entire life.
3.55 4.28 + 18.3%** < 0.01
I have people who support me when I need help.
4.38 4.44 + 1.5%* 0.04
I can be a good leader. 4.17 4.20 0.8% 0.11
I (will) research things I am curious about.
3.75 3.97 + 5.5%** < 0.01
I (will) talk to my family or friends outside of school about what I’ve learned.
3.31 3.60 + 7.3%** < 0.01
I (will) talk to my friends about making positive life choices.
3.42 3.95 + 13.3%** < 0.01
I (will) take responsibility for my mistakes.
4.05 4.29 + 6.0%** < 0.01
Pre-experience vs. three-month follow-up
Survey Items
Pre-experience
Follow-up %
Mean Mean Change p The choices I make today can change my entire life.
3.53 4.13 + 15.0%** < 0.01
I have people who support me when I need help.
4.37 4.37 0.0% 1.00
I can be a good leader. 4.15 4.19 + 1.0% 0.14
I research things I am curious about.
3.75 3.83 + 3.0%** 0.01
I talk to my family or friends outside of school about what I’ve learned.
3.39 3.40 + 0.3% 0.84
I talk to my friends about making positive life choices.
3.42 3.55 + 3.3%** < 0.01
I take responsibility for my mistakes.
4.09 4.05 - 1.0% 0.26
** Statistically significant change (p < .01) * Statistically significant change (p < .05)
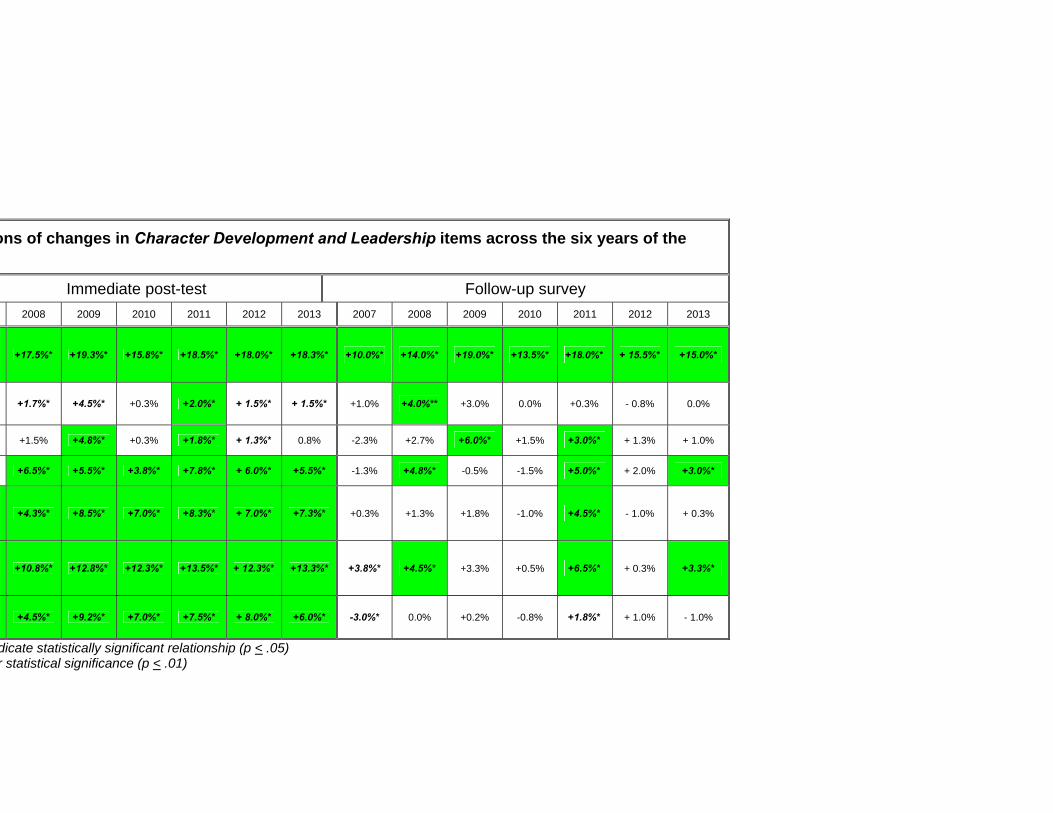
ons of changes in Character Development and Leadership items across the six years of the
Immediate post-test Follow-up survey
2008 2009 2010 2011 2012 2013 2007 2008 2009 2010 2011 2012 2013
+17.5%* +19.3%* +15.8%* +18.5%* +18.0%* +18.3%* +10.0%* +14.0%* +19.0%* +13.5%* +18.0%* + 15.5%* +15.0%*
+1.7%* +4.5%* +0.3% +2.0%* + 1.5%* + 1.5%* +1.0% +4.0%** +3.0% 0.0% +0.3% - 0.8% 0.0%
+1.5% +4.8%* +0.3% +1.8%* + 1.3%* 0.8% -2.3% +2.7% +6.0%* +1.5% +3.0%* + 1.3% + 1.0%
+6.5%* +5.5%* +3.8%* +7.8%* + 6.0%* +5.5%* -1.3% +4.8%* -0.5% -1.5% +5.0%* + 2.0% +3.0%*
+4.3%* +8.5%* +7.0%* +8.3%* + 7.0%* +7.3%* +0.3% +1.3% +1.8% -1.0% +4.5%* - 1.0% + 0.3%
+10.8%* +12.8%* +12.3%* +13.5%* + 12.3%* +13.3%* +3.8%* +4.5%* +3.3% +0.5% +6.5%* + 0.3% +3.3%*
+4.5%* +9.2%* +7.0%* +7.5%* + 8.0%* +6.0%* -3.0%* 0.0% +0.2% -0.8% +1.8%* + 1.0% - 1.0%
dicate statistically significant relationship (p < .05) r statistical significance (p < .01)

Stern, Ardoin, & Powell © 2013
21
Environmental Responsibility The Environmental Responsibility index is comprised of five attitudinal questions and one behavioral intention question. Table 10 shows the percentage of students responding affirmatively to survey items associated with the Environmental Responsibility for the four years of the program. Table 11 shows the individual surveyitems associated with environmental responsibility and their degree of change immediately after and three months after students’ visits to NorthBay in 2012-2013. Table 12 compares changes in scores from each year directly to each other. The 2012011 school year marked the first year in which statistically significant positive long-tegains were observed in all items of the index. In the following years, statistically significant gains were observed in four and three items, respectively. Tables 13 and 14 display responses to the items making up the Attitudes toward the Chesapeake Bay index. Each of the individual items showed statistically significant positive short-term and long-term gains following the NorthBay program in 2010-2011while long-term gains were not observed in the following years (Table 15). Students aArbutus who participated in Bayville programming in addition to NorthBay showed significantly greater positive changes in environmental responsibility and attitudes toward the Bay than other students in 2011-2012.

Stern, Ardoin, & Powell © 2013
22
Table 10. Percent of students responding affirmatively to survey statements associated with Environmental Responsibility.
Agree/Disagree Statements
% Agreeing with Statement Year Before After Follow-up
My actions impact the environment.
2007 49% 61% 55% 2008 47% 64% 68% 2009 59% 73% 71% 2010 52% 70% 67% 2011 65% 82% 79% 2012 64% 83% 77% 2013 67% 83% 48%
I have the power to help protect the environment.
2007 66% 72% 67% 2008 67% 73% 67% 2009 66% 76% 74% 2010 68% 75% 74% 2011 72% 86% 79% 2012 73% 85% 76% 2013 75% 86% 79%
I can make a change in my community.
2007 65% 67% 64% 2008 62% 70% 64% 2009 59% 73% 64% 2010 61% 69% 66% 2011 68% 83% 75% 2012 67% 83% 76% 2013 70% 74% 76%
Interest Statements % Pretty or Very Interested
Year Before After Follow-up
Interest in learning about how to protect the environment
2007 63% 62% 56% 2008 62% 66% 60% 2009 58% 66% 62% 2010 61% 66% 64% 2011 60% 73% 66% 2012 61% 73% 62% 2013 60% 74% 63%
Interest in working to make my community a better place
2007 69% 70% 64% 2008 70% 72% 67% 2009 64% 72% 59% 2010 64% 70% 67% 2011 67% 78% 71% 2012 67% 78% 68% 2013 69% 79% 71%
Frequency Statement % Reporting Behavior Often or Always
Year Before After Follow-up
I (will) work as a volunteer in my community.
2007 20% 38% 23% 2008 20% 42% 28% 2009 18% 41% 26% 2010 19% 39% 19% 2011 23% 43% 29% 2012 22% 46% 27% 2013 21% 48% 29%

Stern, Ardoin, & Powell © 2013
23
Table 11. Environmental Responsibility: paired samples means comparison by item for 2012-2013.
Pre-experience vs. immediate post-experience
Survey Items
Pre-experience
Post-experience
%
Mean Mean Change p My actions impact the environment. 3.80 4.26 +11.5%** < 0.01
I have the power to help protect the environment.
4.07 4.36 +7.3%** < 0.01
I can make a change in my community.
3.91 4.24 +8.3%** < 0.01
Interest in learning about how to protect the environment
3.74 4.06 +8.0%** < 0.01
Interest in working to make my community a better place
3.92 4.17 +6.3%** < 0.01
I (will) work as a volunteer in my community.
2.61 3.44 +20.8%** < 0.01
Pre-experience vs. three-month follow-up
Survey Items
Pre-experience
Follow-up %
Mean Mean Change p My actions impact the environment. 3.80 4.05 +6.3%** < 0.01
I have the power to help protect the environment.
4.10 4.13 +0.8% 0.43
I can make a change in my community.
3.95 4.04 +2.2%** < 0.01
Interest in learning about how to protect the environment
3.78 3.77 -0.2% 0.98
Interest in working to make my community a better place
3.96 3.90 -1.5% 0.08
I work as a volunteer in my community.
2.67 2.89 +5.5%** < 0.01
** Statistically significant change (p < .01)

Stern, Ardoin, & Powell © 2013
24
Table 12. Comparisons of Environmental Responsibility items across the six years of the program.
Immediate post-test Follow-up survey
Survey items 2007 2008 2009 2010 2011 2012 2013 2007 2008 2009 2010 2011 2012 2013
My actions impact the environment.
+8.5%* +11.3%* +10.3%* +11.3%* +12.3%* +12.8%* +11.5%* +4.0%* +12.0%* +6.3%* +9.8%* +9.8%* +5.5%* +6.3%**
I have the power to help protect the environment.
+3.5%* +5.7%* +7.8%* +6.5%* +9.5%* +8.5%* +7.3%* +1.0% +0.5% +5.5%* +2.5% +5.3%* +2.5%* +0.8%
I can make a change in my community.
+0.2% +5.0%* +8.5%* +5.3%* +10.0%* +10.0%* +8.3%* -1.0% -0.5% +3.5%* +2.3% +5.0%* +2.8%* +2.2%**
Interest in learning about how to protect the environment
-0.3% +1.5% +6.3%* +4.3%* +7.8%* +7.3%* +8.0%* -4.0%* 0.0% 0.0% +0.3% +4.8%* -2.3% -0.2%
Interest in working to make my community a better place
-1.5% +1.5% +4.0%* +3.8%* +6.8%* +6.3%* +6.3%* -5.0%* -1.3% -2.8% -1.0% +3.3%* -1.8% -1.5%
I work as a volunteer in my community.
+17.0%* +20.3%* +19.8%* +20.5%* +19.8%* +19.5%* +20.8%* +4.5%* +7.2%* +7.5%* +4.3%* +8.3%* +5.0%* +5.5%**
Asterisk and bold italics indicate statistically significant relationship (p < .05) Shading indicates stronger statistical significance (p < .01)

Stern, Ardoin, & Powell © 2013
25
Table 13. Percent of students responding affirmatively to survey statements associated with the Chesapeake Bay.
Agree/Disagree Statement Year % Agreeing with Statement
Before After Follow-up
The health of the Chesapeake Bay is important to me
2011 71% 82% 77%
2012 68% 79% 70%
2013 70% 80% 74%
Level of Interest Statements
% Pretty or Very Interested Before After Follow-up
Interest in learning more about the Chesapeake Bay
2011 59% 69% 66%
2012 57% 68% 58%
2013 58% 69% 58%
Interest in working to keep the Chesapeake Bay healthy
2011 69% 77% 73%
2012 65% 76% 66%
2013 69% 79% 69%
Table 14. Paired samples means comparison of items related to the Chesapeake Bay, 2012-2013.
Pre-experience vs. immediate post-experience
Survey Items
Pre-experience
Post-experience
%
Mean Mean Change p The health of the Chesapeake Bay is important to me 3.98 4.22 +6.0%** < 0.01
Interest in learning more about the Chesapeake Bay 3.70 3.94 +6.0%** < 0.01
Interest in working to keep the Chesapeake Bay healthy
3.97 4.19 +5.5%** < 0.01
Pre-experience vs. three-month follow-up
Survey Items
Pre-experience
Follow-up %
Mean Mean Change p The health of the Chesapeake Bay is important to me 4.05 4.01 -1.0% 0.24
Interest in learning more about the Chesapeake Bay 3.70 3.66 -1.0% 0.20
Interest in working to keep the Chesapeake Bay healthy
3.98 3.90 -2.0%* 0.01
** Statistically significant change (p < .01) ** Statistically significant change (p < .05).

Stern, Ardoin, & Powell © 2013
26
Table 15. Comparisons of Attitudes toward the Bay over the last two years of the program.
Survey Items Immediate post-test Follow-up survey
2011 2012 2013 2011 2012 2013
The health of the Chesapeake Bay is important to me
6.5%** + 8.3%** +6.0%** 2.5%** - 1.8% -1.0%
Interest in learning more about the Chesapeake Bay
6.3%** + 6.5%** +6.0%** 5.5%** - 2.3%* -1.0%
Interest in working to keep the Chesapeake Bay healthy
6.3%** + 6.8%** +5.5%** 2.3%** -1.0% -2.0%*
** Statistically significant change (p < .01) * Statistically significant change (p < .05) Attitudes toward School Comprised of seven survey items, the Attitudes toward School index investigates students’ attitudes and behaviors related to their interest in education and their perceptions of teacher support. Table 16 shows the percentage of students responding affirmatively to survey items associated with the Attitudes toward School index for all five years of the study. Table 17 shows the individual survey items associated with Attitudes toward School and their degree of change immediately after and three months after students’ visits to NorthBay for 2012-2013. Table 18 directly compares these changes from year to year. There are undoubtedly myriad factors outside the control of NorthBay that influence students’ attitudes toward school. A number of studies have shown that students’ motivation and enjoyment of school generally decreases in the spring, when the follow-up surveys were administered.6 The 2010-2011school year marked the only year in which positive gains were retained in the three-month follow-up survey, despite the expected general downward trend. Changes to the NorthBay program may have influenced this shift. In particular, additional training on programmatic messaging for night operations staff and cabin counselors may have helped to provide a more consistent message and pervasive tone throughout students’ NorthBay experiences. Moreover, additional programming on the final day of the program and follow-up in the schools instituted in the 2010-2011 school year further aimed to drive home positive messaging related to school. In 2011-2012, one school, Perryville, exhibited abnormally negative scores, causing the overall index to show no statistically significant gain. When Perryville was removed from the sample, a statistically significant long-term gain in Attitudes toward School was observed (+ 1.8%; p = .006). In 2012-2013, scores again
6 Ames, C. 1992. Classrooms: goals, structures, and student motivation. Journal of Educational Psychology 84: 261-271.
Meece, J. L. and S. D. Miller 2001. A longitudinal analysis of elementary schools students' achievement goals in literary activities. Contemporary Educational Psychology 26: 454-480.
Perry, K. E., K. M. Donohue and R. S. Weinstein 2007. Teaching practices and the promotion of achievement and adjustment in first grade. Journal of School Psychology 45: 269-292.

Stern, Ardoin, & Powell © 2013
27
varied widely across schools, with Roland Park and Harper’s Choice showing the largest negative long-term change in the index and Arbutus and General John Stricker showing the largest long-term positive change.
Table 16. Percent of students responding affirmatively to statements associated with Attitudes toward School. Agree/Disagree statements
% Agreeing with Statement Year Before After Follow-up
Going to school is a waste of time for me. (Inverse included in index.)
2007 5% 5% 6% 2008 6% 2% 5% 2009 9% 5% 8% 2010 7% 6% 6% 2011 7% 5% 4% 2012 6% 4% 4% 2013 5% 4% 4%
I enjoy school.
2007 53% 55% 50% 2008 59% 59% 50% 2009 40% 56% 38% 2010 45% 51% 50% 2011 47% 56% 52% 2012 48% 57% 51% 2013 48% 57% 50%
I have teachers that really care about me
2011 75% 80% 79% 2012 72% 77% 74% 2013 75% 75% 78%
I have teachers that truly believe that I will succeed 2011 83% 89% 85% 2012 82% 87% 82% 2013 84% 86% 84%
Interest statements % Pretty or Very Interested
Year Before After Follow-up
Interest in learning about new subjects in school
2007 60% 59% 62% 2008 63% 68% 65% 2009 54% 64% 55% 2010 57% 65% 59% 2011 57% 66% 66% 2012 59% 67% 65% 2013 59% 68% 68%
Interest in going to college
2007 86% 89% 90% 2008 88% 89% 88% 2009 89% 92% 88% 2010 87% 91% 89% 2011 89% 92% 91% 2012 90% 93% 92% 2013 91% 93% 92%
Frequency statement % Reporting Behavior Often or Always
Year Before After Follow-up
I (will) pay attention to the teacher in class.
2007 79% 83% 74% 2008 74% 83% 72% 2009 80% 81% 68% 2010 77% 85% 74% 2011 81% 88% 92% 2012 80% 87% 81% 2013 81% 86% 83%

Stern, Ardoin, & Powell © 2013
28
Table 17. 2011-2013 Attitudes toward School: paired samples means comparison by item
Pre-experience vs. immediate post-experience
Survey Items
Pre-experience
Post-experience
%
Mean Mean Change p Going to school is a waste of time for me. (Inverse included in index.) 1.70 1.61 -2.3%** < 0.01
I enjoy school. 3.46 3.70 +6.0%** < 0.01Interest in learning about new subjects in school
3.68 3.84 +4.0%** < 0.01
Interest in going to college 4.63 4.70 +1.8%** < 0.01I have teachers that really care about me
4.08 4.13 +1.3%* 0.03
I have teachers that truly believe that I will succeed
4.33 4.45 +3.0%** < 0.01
I (will) pay attention to the teacher in class.
4.26 4.36 +2.5%** < 0.01
Pre-experience vs. three-month follow-up
Survey Items
Pre-experience
Follow-up %
Mean Mean Change p Going to school is a waste of time for me. (Inverse included in index.) 1.67 1.68 +0.3% 0.62
I enjoy school. 3.55 3.52 -0.8% 0.39 Interest in learning about new subjects in school
3.70 3.82 +3.0%** < 0.01
Interest in going to college 4.61 4.67 +1.5%* 0.03 I have teachers that really care about me
4.12 4.11 -0.3% 0.72
I have teachers that truly believe that I will succeed
4.36 4.31 -1.3% 0.09
I pay attention to the teacher in class.
4.33 4.19 -3.5%** < 0.01
** Statistically significant change (p < .01) * Statistically significant change (p < .05)

ns of Attitudes toward School items across each year.
Immediate post-test Follow-up survey
2007 2008 2009 2010 2011 2012 2013 2007 2008 2009 2010 2011 2012 2013
0.0% +0.2% -4.0%* -3.8%* -3.0%* -2.8%* -2.3%* +2.0% -2.5% -2.8% 0.0% -3.3%* -2.8%* +0.3%
+0.3% +1.0% +6.8%* +5.3%* +6.3%* +6.3%* +6.0%* -3.0%* -1.0% +1.3% +1.0% +4.5%* +0.8% -0.8%
-2.3%* +2.5%* +5.3%* +5.0%* +5.8%* +4.3%* +4.0%* -2.3% +3.5%* +5.3%* +1.5% +6.5%* +2.5%* +3.0%*
+0.8% +1.0% +2.8%* +3.0%* +2.0%* +2.0%* +1.8%* +1.7% +2.0% +1.5% 2.3%* +2.5%* +2.0%* +1.5%*
-2.0% +1.0% +5.8%* +4.0%* New measure
New measure
-7.5%* -3.5%* -2.5% -5.3%* New measure
New measure
-2.8%* +0.2% +1.8% 0.0% New measure
New measure
-7.0%* -2.5% -3.0% -6.8%* New measure
New measure
+3.0%* +4.3%* +6.5%* +4.8%* +5.3%* +3.5%* +2.5%* -5.5%* -5.3%* -3.3%* -4.8%* -1.0% -2.8%* -3.5%*
Not measured
Not measured
Not measured
Not measured +4.8%* +4.3%* +1.3%* Not
measured Not
measured Not
measured Not
measured +2.0%* -0.5% -0.3%
Not measured
Not measured
Not measured
Not measured +9.0%* +4.8%* +3.0%** Not
measured Not
measured Not
measured Not
measured +1.0% -1.8% -1.3%
icate statistically significant relationship (p < .05) stronger statistical significance (p < .01)

Stern, Ardoin, & Powell © 2013
30
Satisfaction Rates of satisfaction were high among students. In both 2011-2012 and 2012-2013, satisfaction ratings averaged 9.0, with 88% rating their experiences as an 8 or better. In prior years, satisfaction scores were similarly high, averaging between 8.9 and 9.0 with 74% to 90% of students rating the program as an 8 or higher. Particularly telling of the program’s impact is the rate of agreement with the following statement in post-experience and follow-up surveys. Over the program’s first two years, immediately after the NorthBay program’s conclusion, over 72% of students agreed, and three months later over 71% agreed with the following statement:
My time at NorthBay has changed the way I look at my life. In 2008-2009, 78% of students agreed with the above statement immediately following the program, and 60% agreed in the three-month follow-up surveys. In 2009-2010, 75% agreed immediately following the program and 66% agreed in the three-month follow-up surveys. In 2010-2011, 82% agreed immediately following the program and 78% agreed in the three-month follow-up surveys. In 2011-2012, 79% agreed immediately following the program and 71% agreed in the three-month follow-up surveys. In 2012-2013, 81% agreed in the immediate post-experience surveys and 70% agreed in the three-month follow-up surveys (Table 19). Table 19. 2012-2013 level of agreement with the survey item “My time at NorthBay changed the way I look at my life” for urban, suburban and rural students. Survey Disagree Neutral Agree 2012‐2013 Urban Suburban Rural Urban Suburban Rural Urban Suburban Rural Immediate post‐test 5% 3% 4% 14% 14% 19% 81% 83% 77%
3‐month follow‐up 11% 7% 7% 22% 24% 19% 67% 69% 73%
School demographics and differential results In the first years of the evaluation, we examined the influence of the location of participating schools in urban vs. non-urban (rural and suburban) areas. Over the past three years, the sample has allowed a clear opportunity to examine additional demographic variables. A larger sample of suburban schools allows us to compare results from urban, suburban, and rural schools. In the first four years of the program, we observed no differences in satisfaction scores between students from urban vs. non-urban (rural and suburban) schools. In the 2010-2011 school year, urban students reported higher levels of satisfaction (9.27) on average than did suburban (9.06) and rural students (8.89; f-statistic 6.96; p = 0.001). In the 2011-2012 school year, opposing results were observed; rural students reported higher levels of satisfaction (9.30) than suburban (8.72) and urban students (8.98; f-

Stern, Ardoin, & Powell © 2013
31
statistic 13.1; p < 0.001). In 2012-2013, no statistically significant difference (p < 0.05) was observed in satisfaction scores across the urban to rural gradient, suggesting that these differences cannot be consistently explained by coarse-grained assumptions about school settings. Table 20 compares changes in index scores for each population during the last three years of the program. Only one statistically significant difference occurred in both of the last two years: rural students exhibited less positive short-term changes regarding their attitudes toward the Chesapeake Bay than other students. In 2011-2012, Perryville students displayed significantly more negative follow-up change scores on all indexes than students from all other schools. Moreover, teachers from Perryville were more likely to agree that “it is inevitable that a number of my students will drop out of school” (4 out of 5 agreed with this statement on the follow-up survey). The same trend was not observed this year, indicating a one-year anomaly in the data related to Perryville in 2011-2012. On a school by school basis in 2012-2013, only one school appeared to be statistically different from the others in outcomes related to the indexes. Harper’s Choice was the only school that exhibited a negative change on average in the Character Development index. Students from Harper’s Choice also exhibited significantly more negative long-term changes in the Attitudes toward School index. The findings demonstrate that the impacts of the NorthBay program are moderated by multiple confounding factors. Each year, different schools and different individuals make up the evaluation sample. They live in different places with different teachers, families, communities and experiences. As such, it is difficult to predict with consistency the exact effects a program such as NorthBay may have across the board. Rather, while general positive trends over the years suggest that NorthBay is having a positive impact, other circumstances have powerful influences on the nature, strength, and durability of that impact.

anges in mean index scores from pre-experience values for urban, suburban and t two years.
2011‐2012 school year Immediate post‐test Follow‐up survey
Rural (R) Suburban (S) Urban (U) Rural (R) Suburban (S) Urban (U)
ibility 9.0%S 12.3%R 9.9% ‐0.6%S 4.8%R 2.1%
8.6% 7.6% 7.7% 2.1% 4.3% 1.1%
l 4.0% 3.4% 4.4% 0.0% 1.6% 0.2%
ay 3.3%S,U 6.8%R 8.2%R ‐5.8%S,U 1.8%R 0.8%R
2012‐2013 school year Immediate post‐test Follow‐up survey
Rural (R) Suburban (S) Urban (U) Rural (R) Suburban (S) Urban (U)
ibility 9.7% 10.8% 9.7% 3.5% 1.8% 1.7%
7.8% 7.4% 7.5% 4.8%U 2.5% 2.0%R
l 2.6% 3.0% 2.9% ‐1.3% 0.5% ‐0.1%
ay 3.8%U 6.0% 7.0%R ‐2.7% ‐1.5% ‐0.0% groups that are statistically different from each other (p < .05).

Stern, Ardoin, & Powell © 2013
33
Students’ favorite and least favorite aspects of the program
Students have been asked two open-ended questions each year to provide insight into the aspects of the NorthBay experience that may have led to the greatest and least satisfaction. Figure 1 presents students’ favorite aspects of the NorthBay program for the last three school years. Figure 2 presents their least favorite. Results reflect the total percent of students offering either open-ended response. Students most commonly cited adventure activities as their favorite programmatic elements. Logistics complaints have been among the most commonly cited “least favorite” aspects of NorthBay each year. These complaints mainly involve the timing and/or sequence of activities and the week feeling rushed or hectic for some students.

Stern, Ardoin, & Powell © 2013
34

Stern, Ardoin, & Powell © 2013
35

Stern, Ardoin, & Powell © 2013
36
RESULTS: TEACHER-RELATED OUTCOMES Three measures were used to address teacher-related outcomes. First, teachers were asked to select from each of two lists their top three choices for desired outcomes from the NorthBay experience. The first list included desired outcomes pertaining to the experiences of their students, while the second included desired outcomes related to the teachers’ own experiences. Items on the post-experience surveys then explored teachers’ perceptions of the degree of achievement of those objectives. Second, a number of closed-ended survey items were used to measure teachers’ actions and intentions regarding their own teaching practices. Those items were intended to assess changes in teaching practices influenced by the NorthBay experience. Third, a number of closed- and open-ended survey items addressed teachers’ degree of satisfaction and their reasoning behind that satisfaction rating. Results are shared for six years of data collection, as surveys were not analyzed in 2009 due to logistical challenges leading to low response rates. Table 21 presents the frequency with which each desired student objective was selected as well as the rate of achievement for each. The top two objectives in each year were wanting students to recognize that the choices they make today will impact their future and to learn to cooperate better when interacting with each other. We added a new potential objective on the survey in 2010-2011 about understanding issues associated with the Chesapeake Bay. With the exception of one item in the first year of the program (motivating students to perform better academically), a majority of all teachers reported successful achievement of each objective. Table 22 presents the frequency with which each teacher-related objective was selected as well as the rate of achievement for each. More variability has been observed in these objectives from year to year. In the last three years, getting to know students better was the top objective, followed by learning how to motivate students better. Objective achievement reflects the percentage of all teachers who agreed or strongly agreed that the objective was met. In all years, a large majority of all teachers reported successful achievement of each objective.

student-related objectives and their achievement.
2006-07 N=40 2007-08 N=44 2009-10 N=23 2010-2011 N = 43 2011-12 N = 49/43 2012-13 N = 72/71
Freq. Achvmnt (all tchrs)
Freq. Achvmnt (all tchrs)
Freq. Achvmnt (all tchrs)
Freq. Achvmnt (all tchrs)
Freq. Achvmnt (all tchrs)
Freq. Achvmnt (all tchrs)
en 63% 56% 66% 82% 52% 71% 64% 91% 67% 81% 71% 88%
hey 73% 89% 68% 77% 74% 83% 59% 91% 61% 88% 53% 93%
m 45% 47% 36% 61% 35% 58% 39% 60% 39% 56% 18% 51%
es. 28% 73% 30% 80% 44% 96% 30% 95% 25% 98% 22% 94%
20% 100% 18% 93% 44% 96% 23% 100% 31% 98% 39% 96%
bout 18% 86% 34% 66% 9% 75% 21% 79% 43% 77% 26% 72%
23% 78% 18% 86% 17% 83% 16% 88% 12% 86% 11% 86%
15% 71% 16% 89% 4% 92% 18% 91% 12% 93% 8% 97%
10% 100% 7% 100% 13% 100% 21% 100% 14% 95% 21% 99%
dels. 5% 100% 7% 89% 9% 100% 14% 100% 10% 93% 17% 99%
d with NA NA NA NA NA NA 11% 98% 8% 98% 8% 89%
vailable for assessing achievement of this objective. Rather achievement percentages reflect the percentage of teachers who ts’ decision-making abilities were improved as a result of the NorthBay program.

Stern, Ardoin, & Powell © 2013
38
Table 22. Teachers’ teacher-related objectives and their achievement.
2006-07 N = 40 2007-08 N = 44 2009-10 N=23 2010-11 N=43 2011-2012 N =
49/43 2013-2013 N = 69
Teacher-related objectives ( I want to . . . )
Freq. Achvmnt (all tchrs)
Freq. Achvmnt (all tchrs)
Freq. Achvmnt (all tchrs)
Freq. Achvmnt (all tchrs)
Freq. Achvmnt (all tchrs)
Freq. Achvmnt (all tchrs)
Get to know my students better outside of a school setting.
45% 94% 52% 98% 55% 92% 71% 100% 71% 86% 77% 94%
Learn how to motivate my students in different ways.
83% 75% 61% 80% 23% 79% 55% 79% 69% 74% 54% 75%
Learn to better facilitate positive social interactions among my students.
68% 65% 64% 70% 36% 79% 61% 86% 53% 81% 33% 73%
Learn more about hands-on, experiential teaching methods.
50% 89% 46% 80% 82% 87% 25% 81% 33% 77% 35% 83%
Share my love of the outdoors and the environment with my students.
20% 86% 32% 81% 36% 96% 39% 91% 33% 84% 42% 94%
Gain ideas of how to incorporate environmental themes into my curriculum.
13% 100% 14% 75% 41% 83% 25% 77% 20% 84% 29% 93%
Relax with my students. 10% Not measured 21% Not
measured 27% Not measured 23% Not
measured 18% Not measured 20% Not
measured
Fulfill my school administration's goals of incorporating experiential and outdoor education into the students’ school experiences.
13% 100% 2% 89% 5% 96% 9% 84% 6% 84% 10% 87%

Stern, Ardoin, & Powell © 2013
39
Other survey items investigated NorthBay’s influence on visiting teachers’ skills, attitudes, and intentions associated with environmental responsibility and school cultuand climate (Table 23). The results show strong intentions to undertake new teachingactivities and environmentally responsible behaviors. Small sample sizes, however, lithe ability the draw statistical inference from these findings. The 2011-2012 and 20122013 showed markedly higher pre-experience scores, however, than prior years on anumber of items, suggesting a more positive teacher outlook toward students prior to the program. These inflated pre-experience scores limited the possibility of witnessingmajor post-experience gains. This year, teachers more commonly reported the inevitability of some students dropping out of school following the program than in prioyears. It is unclear what may have caused this increase.
Table 23. 2012-13 Teacher responses: behaviors, intentions, and perceptions.
Agree/Disagree statements % agreeing with statement
Before (73) After (71) Follow-up
I am comfortable using hands-on, inquiry-based teaching methods.
97% 96% 95%
I feel it is important to teach students about environmental conservation.
97% 100% 100%
I have high hopes for my students. 95% 100% 95%
I expect my students to succeed. 99% 100% 95%
It is inevitable that a number of my students will drop out of school.
27% 41% 35%
How often do you (think you will) undertake the following activities?*
% reporting often or always
Before (73) After (71) Follow-up
Incorporate inquiry-based, hands-on activities into students’ school experiences 49% 79% 50%
Actively encourage students to think creatively 90% 100% 100%
Talk with students about their problems that occur outside the classroom 68% 84% 80%
Encourage environmentally responsible behavior 67% 93% 75%
Participate in community service activities 44% 79% 50%
Incorporate real field data into my classes’ activities 39% 70% 40%
* Parenthetical language used only on immediate post-experience surveys.
Stern, Ardoin, & Powell © 2013
40
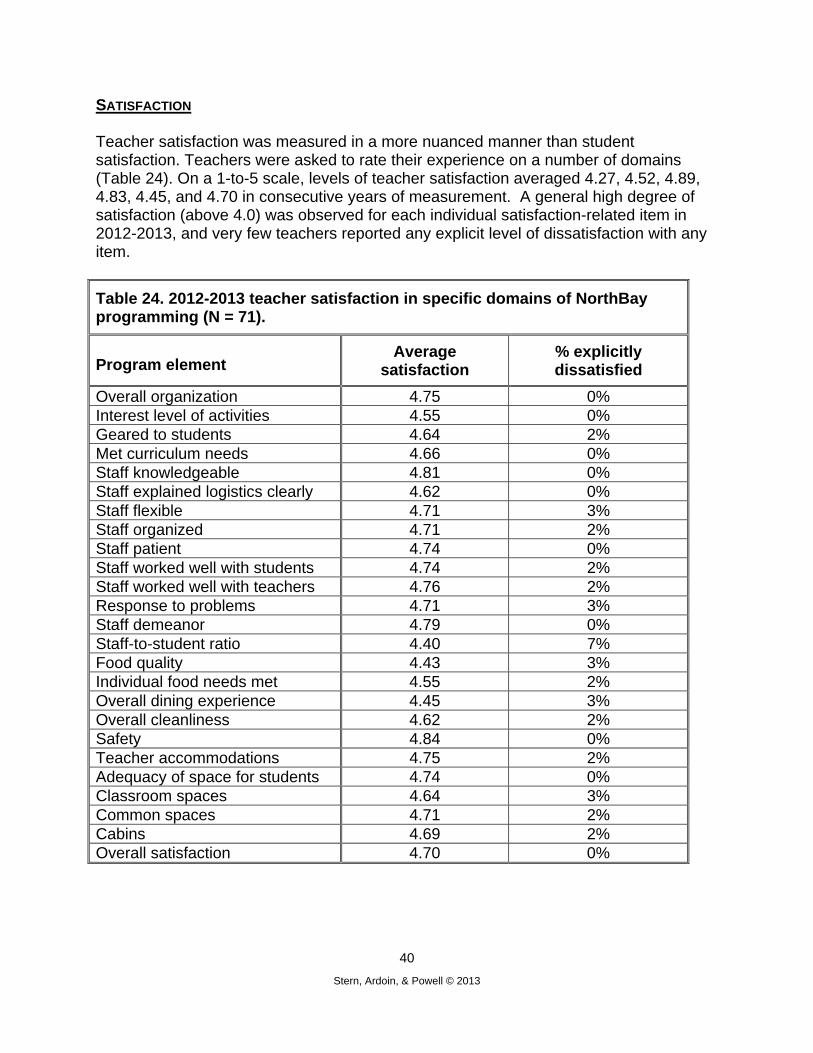
SATISFACTION Teacher satisfaction was measured in a more nuanced manner than student satisfaction. Teachers were asked to rate their experience on a number of domains (Table 24). On a 1-to-5 scale, levels of teacher satisfaction averaged 4.27, 4.52, 4.89, 4.83, 4.45, and 4.70 in consecutive years of measurement. A general high degree of satisfaction (above 4.0) was observed for each individual satisfaction-related item in 2012-2013, and very few teachers reported any explicit level of dissatisfaction with any item.
Table 24. 2012-2013 teacher satisfaction in specific domains of NorthBay programming (N = 71).
Program element Average
satisfaction % explicitly dissatisfied
Overall organization 4.75 0% Interest level of activities 4.55 0% Geared to students 4.64 2% Met curriculum needs 4.66 0% Staff knowledgeable 4.81 0% Staff explained logistics clearly 4.62 0% Staff flexible 4.71 3% Staff organized 4.71 2% Staff patient 4.74 0% Staff worked well with students 4.74 2% Staff worked well with teachers 4.76 2% Response to problems 4.71 3% Staff demeanor 4.79 0% Staff-to-student ratio 4.40 7% Food quality 4.43 3% Individual food needs met 4.55 2% Overall dining experience 4.45 3% Overall cleanliness 4.62 2% Safety 4.84 0% Teacher accommodations 4.75 2% Adequacy of space for students 4.74 0% Classroom spaces 4.64 3% Common spaces 4.71 2% Cabins 4.69 2% Overall satisfaction 4.70 0%

Stern, Ardoin, & Powell © 2013
41
TEACHERS’ HIGH AND LOW POINTS AND RECOMMENDATIONS Figure 3 presents teachers’ responses regarding the most positive aspects of their NorthBay experiences. Getting to know their kids and meeting and observing NorthBay staff remain highlights for teachers. Teachers also commonly cited the lessons and watching their kids change over the course of the week as highlights.
Figure 4 displays teachers’ perceptions regarding their least favorite aspects of the NorthBay experience. The last two years reveal an increase in logistical complaints over the prior two years. These most commonly included confusion in instructions or transitional times and scheduling.

Stern, Ardoin, & Powell © 2013
42
Figure 5 displays recommendations made by teachers for improving the NorthBay experience. In the last two years of the program, teachers’ recommendations most commonly focused improving logistics of the programs. In 2012-2013, come examples of these recommendations included allowing more time for certain aspects of the program and less time in transition, not pairing up cabins with other schools, turning off soda machines, additional lighting around the camp, returning campers a little earlier from the evening programs to their cabins, and more down time for teachers and students.
CONCLUSIONS Overall, the evaluation results reflect a successful program. The NorthBay program continues to produce positive results for both students and their teachers. Fluctuations in the long-term impact of the program on attitudes toward school confirm that while NorthBay can plant the seeds for positive long-term impacts upon visiting students, much lies in the hands of the students themselves, their teachers, and their communities to reinforce the lessons learned at NorthBay. With this in mind, we suggest that NorthBay continue to move forward with providing follow-up programming, including potential volunteer programs for students, to enhance the long-term impact of the program. We also recommend that NorthBay continue to document changes to their programs from year to year to be examined in concert with outcomes discussed in this report to continue to adapt to the changing needs of the populations the program serves. For example, classroom sizes were bigger over the past two years, which may have influenced outcomes. Tracking this from year to year would provide a way to test this hypothesis.

Stern, Ardoin, & Powell © 2013
43
APPENDIX A. EVALUATOR BIOGRAPHIES
Nicole Ardoin Stanford University
Assistant Professor, School of Education and Woods Institute for the Environment
Nicole Ardoin is an assistant professor of environmental education at Stanford University, where she holds a joint appointment between the School of Education and the Woods Institute for the Environment. Her current research focuses on motivations for environmental behavior, with an emphasis on the links among sense of place, geographic scale, and environmental behavior. Nicole is also collaborating on research projects looking at the impacts of the built environment (green buildings) on human/nature interactions and environmental behavior; visitor studies and environmental education program evaluation in nonformal education settings; and capacity building for environmental education and conservation professionals. She chairs the Education Advisory Council for the board of directors of NatureBridge and serves as an associate editor of Environmental Education Research.
Robert Powell Clemson University
Associate Professor, Department of Parks, Recreation and Tourism Management and Department of Forestry and Natural Resources
Bob Powell’s research and outreach program has focused on international park and protected area management with an emphasis on sustainable tourism and biodiversity conservation. As part of his research he has conducted programmatic evaluations of both formal and informal environmental education and interpretation programs. Recent projects include: working with the International Association of Antarctica Tourism Operators, Grand Canyon National Park, Grand Canyon River Outfitters Association, and more than 30 commercial tourism operators from Antarctica, the Galapagos Islands, and the Colorado River through Grand Canyon National Park, to evaluate nature-based tourism as a conservation and informal environmental education tool; and evaluating the efficacy of environmental education centers in Great Smoky Mountains National Park and Maryland. Other research includes investigating local Fijian stakeholders support for marine protected areas; and conducting a census of two endangered bird species on South Georgia Island (Antarctica) in an effort to develop tourism and protected area management recommendations. Bob’s current research involves evaluating outdoor recreation and ethics training programs occurring on public lands and conducting an integrated tourism and coastal zone planning project in Sri Lanka for US Agency for International Development. Bob teaches undergraduate and graduate courses in Park and Protected Area Planning; International Park and Protected Area Management; and Ecotourism. He currently serves as chair for five graduate students, whose research focuses on the evaluation of Leave No Trace education efforts within National Parks, restorative

Stern, Ardoin, & Powell © 2013
44
environments, the National Park Service’s management of underwater cultural resources, the use of case studies as an educational tool for participatory fisheries management, and the evaluation of environmental interpretation programs provided by Great Smoky Mountains National Park. Prior to returning to academics, Bob worked in over 40 countries as an outdoor educator, adventure travel manager and guide for twenty years.
Marc J. Stern Virginia Tech
Associate Professor, Department of Forest Resources and Environmental Conservation
Marc Stern’s research, outreach, and teaching are focused upon the relationships between environmental organizations and the various publics and other stakeholders with which they interact. These organizations include federal land management agencies as well as international, domestic, and local non-governmental organizations. In particular, Marc researches nature of interactions between these organizations and various types of stakeholders. Recent studies, consulting and advisory work has addressed the cognitive, affective, and behavioral impacts of numerous environmental education initiatives, the relative successes and failures of public involvement processes of federal agencies, the relationships between national parks (in the U.S., Caribbean, and South America) and the people living within their immediate vicinities, the organizational efficiencies of policy implementation within federal agencies in the U.S. and the management effectiveness of marine conservation initiatives worldwide. On these and other projects, Marc has worked closely with the USDA Forest Service, the U.S. National Park Service, The Nature Conservancy, The Great Smoky Mountains Institute at Tremont, the NorthBay Adventure Center, National Parks and Conservation Association, the National Audubon Society, the Bahamas National Trust, the Ecuadorian Ministry of the Environment, and numerous environmental organizations in southern Ecuador to produce knowledge and analysis relevant to improving organizational efficiencies and outcomes through the use of rigorous and often participatory evaluation research. Marc’s teaching responsibilities at Virginia Tech include undergraduate courses in Environmental Education and Environmental Interpretation and graduate courses in Social Science Research Methods and the Human Dimensions of Natural Resource Management.