North South Rail Link Feasibility Reassessment Appendices A-D
66
164 January 2019 | Preferred Alignment and Construction Technology North South Rail Link Feasibility Reassessment Final Report Photo Source: Katie Manning / Unsplash
-
Upload
khangminh22 -
Category
Documents
-
view
0 -
download
0
Transcript of North South Rail Link Feasibility Reassessment Appendices A-D

164 January 2019 | Preferred Alignment and Construction Technology North South Rail Link Feasibility Reassessment Final ReportPhoto Source: Katie Manning / Unsplash

165 Appendices | January 2019 North South Rail Link Feasibility Reassessment Final Report
9. Appendices

166 January 2019 | AppendicesNorth South Rail Link Feasibility Reassessment Final ReportPhoto Source: Michael Hicks / Flickr

North South Rail Link Feasibility Reassessment Final Report
A. Citations
1 Eighth in the US in 2017, Inrix Global Conges-tion Rankings, http://inrix.com/press-releases/ los-angeles-tops-inrix-global-congestion-ranking/; 10th in the US in 2017, TomTom Traffc Index, https://www.tomtom.com/en_gb/traffcin-dex/list?citySize=LARGE&continent=ALL&coun try=ALL
2 Ridership Trends presentation, MassDOT Offce of Performance Management and Innovation, February 27, 2017, http://old.mbta.com/upload-edfles/About_the_T/Board_Meetings/M.%20 %20Ridership%20Trends%20Final%20022717. pdf
3 Massachusetts Institute of Technology, Data USA portal, https://datausa.io/profle/geo/bos-ton-cambridge-quincy-ma-nh-metro-area/
4 Central Transportation Planning Staff, Bos-ton Region Metropolitan Planning Organiza-tion, Charting Progress to 2040: Long-Range Transportation Plan of the Boston Region Metropolitan Planning Organization, July 2015, http://www.ctps.org/data/pdf/plans/lrtp/chart-ing/2040_LRTP_Full_fnal.pdf
5 http://www.massbuilds.com/
6 MBTA, The Regional System and the MBTA, http://old.mbta.com/about_the_mbta/ history/?id=968
7 MBTA, Leadership, https://www.mbta.com/leadership
8 MassDOT, The Offcial Website of The Mas-sachusetts Department of Transportation - Rail & Transit Division, http://www.massdot.state. ma.us/Transit/
9 MassDOT, Tracker 2017: MassDOT’s Annual Performance Report, http://www.massdot.state. ma.us/Portals/0/docs/infoCenter/performance-management/Tracker2017.pdf
10 MBTA, The New MBTA, http://old.mbta.com/ about_the_mbta/history/?id=970
11 https://www.mbtafocus40.com/
12 MassDOT, MBTA State of the Service: Com-muter Rail, https://d3044s2alrsxog.cloudfront. net/uploadedfles/About_the_T/Board_Meetings/ StateofCommuterRailSystem.pdf
13 MBTA, Ridership and Service Statistics (Blue Book), 14th edition, July 2014, https://d3044s-2alrsxog.cloudfront.net/uploadedfles/docu-ments/2014%20BLUEBOOK%2014th%20Edi-tion(1).pdf
14 MassDOT, Tracker 2017, https://www.massdot. state.ma.us/Portals/0/docs/infoCenter/perfor-mancemanagement/Tracker2017.pdf
15 MassDOT, MBTA State of the Service: Com-muter Rail, https://d3044s2alrsxog.cloudfront. net/uploadedfles/About_the_T/Board_Meetings/ StateofCommuterRailSystem.pdf
16 Central Transportation Planning Staff, Boston Region Metropolitan Planning Organization, Memorandum: MBTA Commuter Rail Passenger Count Results, Dec. 21, 2012.
17 Boston Region Metropolitan Planning Organiza-tion, Long-Range Transportation Plan – Needs Assessment, www.ctps.org/lrtp_needs
18 According to Reconnecting America, a national nonproft that integrates transportation and community development, “Transit-oriented development… is a type of development that includes a mixture of housing, offce, retail and/ or other amenities integrated into a walkable neighborhood and located within a half-mile of quality public transportation.” http://reconnect-ingamerica.org/what-we-do/what-is-tod/
19 The Metropolitan Area Planning Council data also contain information on future projects, cat-egorized as either planned or projected. These projects are generally expected to be construct-ed prior to 2035, with a maximum completion date of 2042.
20 Metro-North Railroad, West of Hudson Regional Transit Access Study Alternatives Analysis Phase I Screening Report, Appendix D: Capital Cost and O&M Costs, Methodology and Esti-mates, May 2012.
21 Boston Region Metropolitan Planning Organiza-tion, Long-Range Transportation Plan – Needs Assessment, www.ctps.org/lrtp_needs
Appendices | January 2019 167
North South Rail Link Feasibility Reassessment Final Report
22 Dan Hodge and Benjamin Forman, ‘The Promise and Potential of Transformative Transit-Oriented Development in Gateway Cities’, April 24, 2018, https://2gaiae1lifzt2tsfgr2vil6c-wpengine. netdna-ssl.com/wp-content/uploads/2018/04/ TTOD-Report.pdf
23 Handy, Susan, Increasing Highway Capacity Unlikely to Relieve Traffc Congestion, National Center for Sustainable Transportation, UC Davis, October 2015.
24 United States Environmental Protection Agency, Learn About Environmental Justice, https:// www.epa.gov/environmentaljustice/learn-about-environmental-justice
25 MBTA, Title VI Notice of Nondiscrimination Rights and Protections to Benefciaries, https:// www.mbta.com/policies/title-vi
26 A T-test is a statistical procedure that deter-mines whether the mean of a population signif-cantly differs from a specifc value (the “hypoth-esized mean”) or from the mean of another population; the T-test is then used to determine whether the difference is statistically signifcant. In this test, the T-test used the following criteria for determining signifcance: If p<0.05, the differ-ence between an EJ community and a Non-EJ community is signifcant or likely to occur; If p>=0.05, the difference between an EJ commu-nity and a Non-EJ community is insignifcant or unlikely to occur.
27 Mass.gov, Global Warming Solutions Act Back-ground, https://www.mass.gov/service-details/ global-warming-solutions-act-background
28 Mass.gov, Massachusetts greenhouse gas emission trends, https://www.mass.gov/service-details/ma-ghg-emission-trends
January 2019 | Appendices 168

169 Appendices | January 2019 North South Rail Link Feasibility Reassessment Final Report
B. Full List of Upstream Improvements
“Critical” interventions must be in place for a particular service plan to be implemented. “Recommended” interventions reduce performance risks for a particular service plan and its associated level of service.
Line Service Alternative Critical /
Recommended Intervention Required Intervention Solution Intervention Reason
All Lines
South Station Expansion & All-Day Peak
Service (No NSRL), NSRL Regular Service
(2-Track), NSRL All-Day Peak Service (2-Track),
NSRL All-Day Peak Service (4-Track)
NSRL Regular Service (2-Track), NSRL All-Day Peak Service (2-Track),
NSRL All-Day Peak Service (4-Track)
Recommended
Critical
Review of platform workings at locations
where single platform face is provided on double track
sections.
Removal of conficts between trains entering the north & south tunnel portals and trains exiting the north & south tunnel
portals to each route.
Provision of additional platform faces and related
facilities.
Grade separation between northbound
and southbound services at each
tunnel portal.
The assumed track layout indicates locations where there is a single sided platform and it is understood
that passengers can board/alight from trains on either line. While it may be feasible to do so with
lower levels of services this approach may require reviewing with increases to the level of service. This is because an increased level of service may result in trains passing at locations whereby passengers
are required to cross the track to board/alight trains. For the purposes of the scheduling no constraint on platform/boarding side is assumed, with trains operating on both lines (right-hand-side running)
The service plans require 18-20tph trains in each direction through the tunnel core, it would not be feasible to cross opposing direction trains
multiple times at this level service with an at-grade junction. This option potentially requires all four tracks running out towards Back Bay splitting between Worcester Line and Providence Lines
(due short headways between services). However further schedule development may resolve some headway issues, but performance impact likely to
be signifcant.
All Lines

170 January 2019 | Appendices North South Rail Link Feasibility Reassessment Final Report
Line Service Alternative Critical /
Recommended Intervention Required Intervention Solution Intervention Reason
Fitchburg Line South Station Expansion & All-Day Peak Service
(No NSRL) Critical
Additional terminal platform capacity
Provision of an additional platform
If turnaround times/junction margins cannot be reduced at Wachusett, then provision of an
additional terminal platform is required.
Fitchburg Line South Station Expansion & All-Day Peak Service
(No NSRL) Recommended
A review of signaling capability within the North Station throat, specifcally
looking at the ability to perform parallel crossings
with same platform re-occupations. Requires at least 5-minute headways
Capability to support parallel
crossing moves in the station throat to support 5-minute same platform re-
occupation margins at North Station.
The schedule has been optimized around utilizing the minimum number of platforms at North Station.
It is assumed the capability of 5-minute platform re-occupation is possible at North Station with a
parallel crossing in the station throat. The ability to do so requires reviewing. Should it not be possible to do so then a review of the platform workings will
be required.
Fitchburg Line NSRL Regular Service
(2-Track) Critical
Additional terminal platform capacity
Provision of 1 additional terminal
platform
The service plan requires 4 tph to start and terminate at Fitchburg. This is not possible from a
single platform and therefore requires a minimum of 2 platforms (with a turnaround time/junction margin of less than 30 minutes). Note if the total turnaround
time and junction margin can be reduced to 15 minutes then 1 platform could support 4 tph.
Fitchburg Line NSRL Regular Service
(2-Track) Critical
Additional terminal platform capacity
Turnback siding for turning trains short
The service plan requires 4 tph to start and terminate at Fitchburg, This is not possible from a single platform and therefore this presents an
alternative to the above. However, additional turnback facilities may be \required if this option is
taken forward, i.e. a turnback siding.

171 Appendices | January 2019 North South Rail Link Feasibility Reassessment Final Report
Line Service Alternative Critical /
Recommended Intervention Required Intervention Solution Intervention Reason
Fitchburg Line NSRL Regular Service
(2-Track) Critical Enhance signal capability
Enhancements to the signaling capability to support 8-minute
headways
The service plan requires 4 tph on the Fitchburg Line. While theoretically 4 tph is a train every 15 minutes, it is not possible to support even
frequencies due to constraints on the southern lines. A headway reduction is therefore required from the
assumed 10 minutes to at least 8 minutes.
Fitchburg Line NSRL Regular Service
(2-Track) Critical
Reduction of single line re-occupation margin at
Waltham
Reduction of single line re-occupation margin at Waltham
to at least 5 minutes
The service plan requires 4 tph in each direction over the single track line between Beaver Brook
and Riverview. With each train occupying the single track line for 4 minutes (including 30 sec dwell at Waltham). The current assumption of 7 minutes
would not feasibly support the train plan and requires reducing to at least 5 minutes.
Fitchburg Line
NSRL All-Day Peak Service (2-Track), NSRL
All-Day Peak Service (4-Track)
Critical Additional terminal platform
capacity
Provision of 1 or 2 additional terminal
platforms
The service plans require 6 tph to start and terminate at Fitchburg. This is not possible from a
single platform and therefore requires a minimum of 2 platforms (with a turnaround time/junction margin
of less than 20 minutes) or 3 platforms (max 30 minutes turnaround/junction margin).
Fitchburg Line
NSRL All-Day Peak Service (2-Track), NSRL
All-Day Peak Service (4-Track)
Critical Additional terminal platform
capacity Turnback siding for turning trains short
The service plans require 6 tph to start and terminate at Fitchburg. This is not possible from a single platform and therefore as an alternative to the above. However, additional turnback facilities
may be required if this option is taken forward, i.e. a turnback siding.

172 January 2019 | Appendices North South Rail Link Feasibility Reassessment Final Report
Line Service Alternative Critical /
Recommended Intervention Required Intervention Solution Intervention Reason
Fitchburg Line
NSRL All-Day Peak Service (2-Track), NSRL
All-Day Peak Service (4-Track)
Critical Double track throughout
Fitchburg Line
Doubling of the single track line between Beaver
Brook and Riverview
The service plan requires 6 tph in each direction over the single track line between Beaver Brook
and Riverview. With each train occupying the single track line for 4 minutes (including 30 sec dwell at Waltham) this would only leave a 1-minute margin
between trains, which is unlikely to be feasible.
Lowell Line South Station Expansion & All-Day Peak Service
(No NSRL) Recommended
A review of signaling capability within the North Station throat, specifcally
looking at the ability to perform parallel crossings
with same platform re-occupations. Requires at least 5-minute headways
Capability to support parallel
crossing moves in the station throat to support 5-minute same platform re-
occupation margins at North Station.
The schedule has been optimized around utilizing the minimum number of platforms at North Station.
It is assumed the capability of 5-minute platform re-occupation is possible at North Station with a
parallel crossing in the station throat. The ability to do so requires reviewing. Should it not be possible to do so then a review of the platform workings will
be required.
Lowell Line
South Station Expansion & All-Day Peak Service
(No NSRL) & South Station Expansion &
All-Day Peak Service (No NSRL) & NSRL All-Day Peak Service (4-Track)
Critical Additional terminal platform
capacity
Provision of an additional terminal platform at Lowell and reduction in turnaround time and platform re-
occupation time to less than 20 minutes
The service plan requires 6 tph terminating at Lowell, which can be turned around using 2
platforms, provided the turnaround time and re-occupation margins can be reduced to less than 20
minutes per train.
Lowell Line NSRL All-Day Peak
Service (4-Track) Critical Enhance signal capability
A reduction of the signaling headway to 5 minutes is required
on the Lowell Line
The schedule requires 6 tph Lowell Line services, plus it is assumed to accommodate 1 tph each way
on the Wildcat Line. Due to the level of service, a headway reduction is required to support this
through re-signaling.

173 Appendices | January 2019 North South Rail Link Feasibility Reassessment Final Report
Line Service Alternative Critical /
Recommended Intervention Required Intervention Solution Intervention Reason
Haverhill Line South Station Expansion & All-Day Peak Service
(No NSRL) Recommended
A review of signaling capability within the North Station throat, specifcally
looking at the ability to perform parallel crossings
with same platform re-occupations. Requires at least 5-minute headways
Capability to support parallel
crossing moves in the station throat to support 5-minute same platform re-
occupation margins at North Station.
The schedule has been optimized around utilizing the minimum number of platforms at North Station.
It is assumed the capability of 5-minute platform re-occupation is possible at North Station with a
parallel crossing in the station throat. The ability to do so requires reviewing. Should it not be possible to do so then a review of the platform workings will
be required.
Haverhill Line South Station Expansion & All-Day Peak Service
(No NSRL) Critical
Reduction in the number of return movements to
Haverhill
Review yard capacities on the
Haverhill Line
The single-line section between Reading Junction and Fells on the Haverhill Line presents a constraint
on the network. As an alternative to the above options, it may be feasible to operate the peak
direction of services from units kept in yards on the Haverhill Line instead of return off-peak movements. A review of the yard capacity is required to confrm the maximum number of units which can be stored.
Haverhill Line
South Station Expansion & All-Day Peak
Service (No NSRL), NSRL Regular Service
(2-Track), NSRL All-Day Peak Service (2-Track),
NSRL All-Day Peak Service (4-Track)
Critical Enhance signal capability A reduction of the
signaling headway to 5 minutes is required
The level of service required in the service plan means that a signaling headway reduction from the
base assumption of 10 minutes to at least 5 minutes is required.

174 January 2019 | Appendices North South Rail Link Feasibility Reassessment Final Report
Line Service Alternative Critical /
Recommended Intervention Required Intervention Solution Intervention Reason
Haverhill Line
South Station Expansion & All-Day Peak
Service (No NSRL), NSRL Regular Service
(2-Track), NSRL All-Day Peak Service (2-Track),
NSRL All-Day Peak Service (4-Track)
Critical Enhance signal capability
Improve signaling capability to support margins of at least 5
minutes
The single line section between Reading and Fells Junctions on the Haverhill Line presents a constraint on the network. It is potentially possible to develop a schedule around this constraint, however it would
require a reduction of the margins at Fell Jn and Reading Junction.
Haverhill Line
South Station Expansion & All-Day Peak
Service (No NSRL), NSRL Regular Service
(2-Track), NSRL All-Day Peak Service (2-Track),
NSRL All-Day Peak Service (4-Track)
Critical Enhance signal capability
Improve signaling capability to support a junction margin of at least 3½ minutes.
The single line section between Reading and Fells Junctions on the Haverhill Line presents a constraint on the network. It is potentially possible to develop a schedule around this constraint, however it would require a reduction of the margins at Reading and
Fells Junctions.
Haverhill Line
South Station Expansion & All-Day Peak
Service (No NSRL), NSRL Regular Service
(2-Track), NSRL All-Day Peak Service (2-Track),
NSRL All-Day Peak Service (4-Track)
Critical Doubling of Reading
Junction and extension of siding.
Provision of a double junction and extension of siding
at Reading Junction.
The single line section between Reading and Fells Junctions on the Haverhill Line presents a
constraint on the network. As an alternative to the above options, provision of a double junction and
extension of siding at Reading Junction would offer greater schedule fexibility and resilience.

175 Appendices | January 2019 North South Rail Link Feasibility Reassessment Final Report
Line Service Alternative Critical /
Recommended Intervention Required Intervention Solution Intervention Reason
Newburyport/ Rockport Lines
South Station Expansion & All-Day Peak Service
(No NSRL) Recommended
A review of signaling capability within the North Station throat, specifcally
looking at the ability to perform parallel crossings
with same platform re-occupations. Requires at least 5-minute headways
Capability to support parallel
crossing moves in the station throat to support 5-minute same platform re-
occupation margins at North Station.
The schedule has been optimized around utilizing the minimum number of platforms at North Station.
It is assumed the capability of 5-minute platform re-occupation is possible at North Station with a
parallel crossing in the station throat. The ability to do so requires reviewing. Should it not be possible to do so then a review of the platform workings will
be required.
Newburyport/ Rockport Lines
South Station Expansion & All-Day Peak Service
(No NSRL) Recommended
Review of the yard capacity at Newburyport
and Rockport, should other enhancements to support full return movements not be delivered (i.e. Salem
double-tracking).
Review yard capacities on the
Newburyport/ Rockport Lines
Due to the network constraints outlined above, the resultant schedule has assumed a peak-direction
fow of services, whereby 4 tph operate in the peak direction and 3 tph operate in the counter-peak direction, it is assumed 1 of the 4 counter-peak
services operate between the MBTA CRMF depot and North Station. For the 3-hour AM and PM peaks, operating in such a manner means that to operate the peak-direction services, storage for at least 3 units is required before any return
movements can be utilized (over the 3-hour peak).
Newburyport/ Rockport Lines
South Station Expansion & All-Day Peak
Service (No NSRL), NSRL Regular Service
(2-Track), NSRL All-Day Peak Service (2-Track),
NSRL All-Day Peak Service (4-Track)
Recommended (Tier 3)
Double-track between McNall & Northey Point
Junctions (between Swampscott and Salem
stations)
Double-tracking between McNall
and Northey Point Junctions (not in
tunnel).
The single-line section between McNall and Northey Point Junctions (between Swampscott and Salem
stations), further constrains the schedule. The number of trains that can be scheduled through the single-line section per hour is not suffcient
to support the service plan alternatives. Double-tracking this section would remove this as a
signifcant constraint on the network.

176 January 2019 | Appendices North South Rail Link Feasibility Reassessment Final Report
Line Service Alternative Critical /
Recommended Intervention Required Intervention Solution Intervention Reason
Newburyport/ Rockport Lines
South Station Expansion & All-Day Peak
Service (No NSRL), NSRL Regular Service
(2-Track), NSRL All-Day Peak Service (2-Track),
NSRL All-Day Peak Service (4-Track)
Critical Enhance signal capability
A reduction of the signaling headway to 5 minutes is required
between North Station and Beverly
The level of service required in the service plan means that a signaling headway reduction from the
base assumption of 10 minutes to at least 5 minutes is needed.
Worcester Line
South Station Expansion & All-Day Peak
Service (No NSRL), NSRL Regular Service
(2-Track), NSRL All-Day Peak Service (2-Track),
NSRL All-Day Peak Service (4-Track)
Critical
Additional platform capacity at Worcester
and reduction of junction margins
Provision of an additional terminal
platform at Worcester
The level of service required in the service plan means that capability for more than 1 train
terminating at Worcester is required. Provision of a second terminal platform and 3-5 minute junction
margins is required.
Needham Line South Station Expansion & All-Day Peak Service
(No NSRL) Critical
Provision of an additional siding.
A siding is required at Highland
Station, preferably incorporating the station into the
siding
The availability of paths on the main line route results in trains passing on the Needham Branch at approximately the same location as Highland
Station.

177 Appendices | January 2019 North South Rail Link Feasibility Reassessment Final Report
Line Service Alternative Critical /
Recommended Intervention Required Intervention Solution Intervention Reason
Needham Line NSRL All-Day Peak
Service (4-Track) Critical Additional sidings Additional sidings
The level of service on the Needham Line requires provision of an additional siding between Highland and Bellevue Stations, in additional to requiring the existing sidings at Need and Rox Junctions. While it is possible to plan a service using these two sidings,
there is an impact to journey times with waiting times between 3 and 6 minutes in each siding.
Relocating the crossing sidings to existing stations could improve journey times.
The margin between a train from the Franklin Line and a train to the Franklin Line is less than 2 minutes. To resolve this, providing access to both
Readville platforms via a new crossover would avoid conficts between services.
Franklin Line South Station Expansion & All-Day Peak Service
(No NSRL) Critical
Ability to include parallel arrival and departures to/ from the Franklin Line at
Readville
Provision of an additional crossover at the country-end
of Readville to allow Franklin Line services to reach both platforms

178 January 2019 | Appendices North South Rail Link Feasibility Reassessment Final Report
Line Service Alternative Critical /
Recommended Intervention Required Intervention Solution Intervention Reason
Franklin Line
NSRL Regular Service (2-Track), NSRL All-Day Peak Service (2-Track),
NSRL All-Day Peak Service (4-Track)
Critical
Ability to include parallel arrival and departures to/ from the Franklin Line at
Readville and double-track to Endicott Station
Extension of double-track section
between Endicott and Readville Stations into
the two western side platforms at
Readville. Provision of a parallel
crossing so that simultaneous arrivals
and departures at the city-end of the station can occur.
The margin between a train from the Franklin Line and a train to the Franklin Line is less than 2 minutes. To resolve this, providing access to both
Readville platforms via a new crossover would avoid conficts between services. A new crossover is also needed at Readville to enable parallel arrivals and
departures.
Franklin Line
NSRL All-Day Peak Service (2-Track), NSRL
All-Day Peak Service (4-Track)
Critical Additional crossing sidings Additional crossing
sidings
Two additional crossing sidings are required for the Franklin Line, the frst at approximately 20.5mi between Norfolk and Walpole West Junctions. The
second (at approximately 26.5mi) is believed to be an existing siding named “Frank”. Should this
not be useable then a new siding is recommended at Franklin Station or towards the 28mi post. It is not possible for this schedule to make use of the
Walpole siding without considerable impact to journey times.
Franklin Line
NSRL All-Day Peak Service (2-Track), NSRL
All-Day Peak Service (4-Track)
Critical Capability to turn back
services at Dedham A turnback
crossover or siding The service plans require 2 tph to terminate at
Dedham, and facilities are required to support this.

179 Appendices | January 2019 North South Rail Link Feasibility Reassessment Final Report
Line Service Alternative Critical /
Recommended Intervention Required Intervention Solution Intervention Reason
Providence/ Stoughton Line
South Station Expansion & All-Day Peak Service
(No NSRL)
South Station Expansion & All-Day Peak
Service (No NSRL), NSRL Regular Service
(2-Track), NSRL All-Day Peak Service (2-Track),
NSRL All-Day Peak Service (4-Track)
Recommended
Critical
Review of platform workings at locations
where a single platform face is provided on double-
track sections.
Infrastructure to support the turning back of
services at Fairmount
Provision of additional platform faces and related
facilities.
Provision of an additional turnback
crossover at Fairmount, or
double-track to Readville
The assumed track layout indicates locations where there is a single-sided platform. It is understood that
passengers can board/alight from trains on either line at these locations. While it may be feasible to do so with lower levels of service, this approach
may require review once there are increases to the level of service. This is because an increased level of service may result in trains passing at locations
whereby passengers are required to cross the track to board/alight trains. For the purposes of the schedule, no constraint on platform/boarding side is assumed, with trains operating on both lines (right-
hand-side running)
As an alternative to running all the Fairmount Line services to Readville, which requires interventions
on the single-track line, it would be feasible to turn back some services at Fairmount instead. Or another alternative is to double-track the route to
Readville with 2 platforms
Fairmount Line

180 January 2019 | Appendices North South Rail Link Feasibility Reassessment Final Report
Line Service Alternative Critical /
Recommended Intervention Required Intervention Solution Intervention Reason
Old Colony Lines
South Station Expansion & All-Day Peak
Service (No NSRL), NSRL Regular Service
(2-Track), NSRL All-Day Peak Service (2-Track),
NSRL All-Day Peak Service (4-Track)
South Station Expansion & All-Day Peak
Service (No NSRL), NSRL Regular Service
(2-Track), NSRL All-Day Peak Service (2-Track),
NSRL All-Day Peak Service (4-Track)
South Station Expansion & All-Day Peak
Service (No NSRL), NSRL Regular Service
(2-Track), NSRL All-Day Peak Service (2-Track),
NSRL All-Day Peak Service (4-Track)
Critical
Critical
Recommended
Additional crossing locations on the Plymouth
Line
A reduction of the single-line re-occupation margins on the Old Colony Lines
Removal of single lines between JFK/UMass and
Braintree Stations, to support improved network resilience and performance
Provision of an additional siding
between Abington and Whitman
Stations
Provision of improved signaling capability to reduce
the single line re-occupation margins
to 3 minutes
Doubling of the single line tracks
between JFK/ UMass and Braintree
Stations
The number of constraints coupled with the service plans necessitates an additional passing location for
the Plymouth Line
The number of constraints coupled with the service plans necessitates an additional passing location on
the Plymouth Line in addition to a reduction in re-occupation times for the single-line sections
The single-track lines between JFK/Umass Stations and Braintree Station and Adams Junction would be
operating near maximum capacity and presents a signifcant risk to performance.
Old Colony Lines
Old Colony Lines
Table B1: Full List of Upstream Improvements

181 Appendices | January 2019 North South Rail Link Feasibility Reassessment Final Report
C. Ridership Model Description
Introduction
The Central Transportation Planning Staff (CTPS) develops and then employs a regional travel demand model for use in forecasting changes that could occur during the consideration of transportation proposals. For the North South Rail Link Study, CTPS provided technical support and developed ridership forecasts, as requested by the Massachusetts Department of Transportation (MassDOT). This document describes the modeling techniques and methodologies CTPS used when conducting an analysis of potential ridership.
Overview of the Modeling Process
To perform the analysis, CTPS used a four-step travel demand model, which was developed by CTPS and updated and improved over a number of years. The four steps of travel demand forecasting and in the CTPS model, described in more detail later in this Appendix, are trip generation, trip distribution, mode choice and then trip assignment.
The basis for ridership forecasts are transportation analysis zones (TAZs). TAZs are the geographic unit where trips are produced by households, and where trips are attracted to non-household destinations. TAZs are necessary for transportation modeling because they provide a level of estimation midway between the community and individual households. They are typically formed around small neighborhoods within a municipality or represent a group of blocks with similar land uses, such as residential, retail, service, or manufacturing. The TAZ structure was developed based on Census block groups, which have been subdivided in areas with high growth. Typically, TAZs in suburban and rural areas are relatively larger than TAZs in urban areas.
Outputs from the model include projected transit ridership on different transit modes (including estimates of passenger boardings on all the existing and proposed transit lines) and traffc volumes on the highway network. These are used as inputs to the planning and analysis process for the project. A fow chart of the modeling process is shown in Figure C1.
Figure C1: The CTPS Four-Step Travel Demand Modeling Process
ACS = American Community Survey. CBD = Central Business District. EI = External Internal.
IE = Internal External. PUDO = pick-up/drop-off.

182 North South Rail Link Feasibility Reassessment Final Report
Gloucester
Ports
mou
th
Greenland
Hampton
Hampton
Kensington King
ston Sandown
Danville
East
Kingston
Falls
Lyndeborough
SouthHampton Seabrook
Litchfield
Greenville Groveland Brookline Leyden
Bernardston
Tyngsborough
opsfi
eld
Greenfi
eld Tewksbury
Chelmsford
Middleton
T
Wilmington Manchester
Danvers
Hanc
ock Lanesborough
Phillipston
Lynnfield Read
ing
Dalto
n
Sund
erla
nd
Ston
eham
Woburn
Shut
esbu
ry
SaugusWinchesterLexington Arlington
Richmon
d Belmont Somerville
Cambridge
Boylston W
est
Weston W
ayla
nd
Stoc
kbrid
ge
Brooklin
e Westhampton St
ockb
ridge
Wes
t Framingham
Hun
tingt
on
Wellesley Shrewsbury
ham
pton
Ea
st-T
Alfo
rd yringham
Dedham
Montgomery
Broo
kfield
Egre
mon
t
Wey
mou
th
Aubu
rn
Med
field
Randolph Northbridge
Rockland
Wilbraham
Hopedale
Stou
ghto
n
Abington Marshfield
Bellin
gham
Fr
ankli
n
South
bridg
e
Holla
nd Hanson
Plainville
Raynham
Eastham
Seekonk
Som
erse
t
Acushnet Mar
ion
New Bedford
Portsmouth
Jam
esto
wn
Middletown Gosnold
Narra
gans
ett
Hooksett Candia Epping
Newfields Raymond
Lowell
Reading
Peabody
Wake-field lington
Lynn Melrose
Medford Everett
Waltham
Watertown
Boston
Westwood Braintree
brook Avon
Broc
kton
Features of the CTPS Model – Data Inputs Newington
Stratham Goffstown General Modeling Characteristics Exeter Rye Brentwood North
Chester Fremont Hampton Manchester Auburn NEW HAMPSHIRE New Boston Bedford
VERMONT Mont Vernon
Londonderry Derry Hampstead The CTPS travel demand forecasting model is an Merrimack Newton Amherst
Amesbury Atkinson Salisbury Wilton Merrimac Plaistow Milford
Sharon Temple Newburyport Windham
aggregate trip-based model. It is an aggregate West Hudson Haverhill Newbury
Salem
New Ipswich Newbury
Rowley
Ipswich
Rindge Mason
NEW YORK Hollis Nashua Monroe Clarksburg Methuen George-town Lawrence model because it does not simulate the activities of Pelham
Rowe Northfield North Heath Colrain Warwick Royalston Boxford Williamstown Adams North Dunstable Dracut Florida Rockport Winchendon Ashby Pepperell Townsend Andover Ashburnham Andover
each and every household (HH). Rather, the model Gloucester Adams Charlemont Gill New Hamilton Orange Essex Erving Ashford Shelburne Groton Lunenberg Savoy Wenham Fitchburg Hawley Buckland Gardner Westford North Athol Beverly Cheshire Templeton Shirley Ayer
simulates the travel behavior of groups of HHs, Billerica Wendell Montague Westminster Littleton Carlisle Ashfield Windsor Plainfield Leominster Harvard Deerfield Conway Bur- Salem Marblehead
Leverett Box- Bedford
Hubbardston Lancaster borough Acton
grouping them together based on common land Cummington Pittsfield Swampscott
Nahant
New- Concord Petersham Goshen Princeton Salem Sterling Hinsdale Peru Williamsburg
Whately Barre Bolton May-Stow nard Malden
Revere Lincoln Rutland Worthington Clinton
use and access to travel modes. Geographically Hatfield Chelsea Chesterfield Winthrop Pelham MASSACHUSETTS Hudson Sudbury Lenox Berlin Washington Middlefield Holden Boylston Marlborough Hadley Hardwick Oakham Newton Amherst New North-Northampton Braintree borough South-
borough and physically, these groups make up the TAZs. Paxton Lee Hull Becket Chester Natick West North Belchertown Ware Westborough Needham Brookfield Worcester Cohasset Brookfield Granby Ashland South Southampton Spencer
Leicester Quincy Sherborn Hadley Dover Milton
These zones do not cross municipal boundaries Great Otis Hopkinton Barrington Hingham Grafton Holyoke Monterey Scituate East Brook-field
Palmer Warren Millbury Holliston Blandford Ludlow Norwood Chicopee Upton Millis Norwell Russell Canton Milford Hol-
and they are similar in terms of size (number of HHs Medway Westfield West Walpole Sutton Spring-field
Charlton Sandisfield Brimfield Sturbridge
Pembroke
Hanover Springfield Mount New Oxford Norfolk Sharon Sheffield Wash- Marlborough Tolland Granville Monson ington East Mendon Whitman
Uxbridge Southwick Agawam Long- Long- Hampden Wales meadow meadow or employers per zone) across the entire modeling Foxborough
Millv
ille
Douglas Dudley Wrentham Provincetown Black- Duxbury Webster Easton East stone West Bridgewater Bridgewater Truro Mansfield
Woonsocket Halifax Kingston
region. Bridgewater Cumberland Burrillville North North Norton Attle- Plympton Wellfleet Smithfield boro Attleboro
Middleborough Lincoln Taunton Glocester Smithfield
Carver Plymouth Pawtucket North Providence East RHODE Rehoboth
Dighton Berkley
Providence Lakeville Johnston ISLAND Providence Orleans Wareham
Freetown Rochester Swansea Cranston Brewster Warren Foster Dennis Scituate Bourne Sandwich Barrington Warwick Modeled Area: The model encompasses all of CONNECTICUT
Coventry Bristol
Fall River West Harwich Chatham Yarmouth Warwick Barnstable Mattapoisett Fair-
haven Massachusetts, all of Rhode Island, and a portion of East West Mashpee Greenwich Westport Greenwich Dartmouth Falmouth
Tiverton Exeter North southern New Hampshire, as shown in Figure C52
Hopkington Little Kingstown Compton
below. Tisbury Richmond South Newport
Kingston Oak Bluffs
West Charlestown Tisbury
Edgartown Westerly Chilmark
Aquinnah
Nantucket
Figure C2: Extent of the CTPS Model Area
January 2019 | Appendices

183 Appendices | January 2019 North South Rail Link Feasibility Reassessment Final Report
Zone System: The modeled area is divided into 5,739 internal TAZs. There are also 100 external stations around the periphery of the modeled area that account for travel between the modeled area and adjacent areas of Connecticut, New York, Vermont, and New Hampshire.
In a trip-based model, TAZs are the places where trips begin (trip producers) or end (trip attractors). TAZs can be as small as a single block (for example, in downtown Boston) or they can cover many square miles in rural areas. CTPS increased the number of TAZs in order to produce more reliable travel forecasts, but this comes at the cost of having to manage more data.
Modeling Years: Base and Future
The starting year for the model, referred to as the base year, is 2016, and incorporates data that CTPS uses in the model inputs. The model forecast extends to 2040.1
Table C1 details the employment and population changes forecast for the Boston region.
Central Transportation Planning Staff, Boston Region Metropolitan Planning Organization, Charting Progress to 2040: Long-Range Transportation Plan of the Boston Region Metropolitan Planning Organization, July 2015, http://www.ctps. org/data/pdf/plans/lrtp/charting/2040_LRTP_Full_fnal.pdf
1

184 January 2019 | Appendices North South Rail Link Feasibility Reassessment Final Report
Community Information Total employment Total population
Area Rail Line Inside or outside
MA-128 Town/City 2016 2040 2016 2040
North Central
Haverhill Inside Malden 14,797 14,983 62,948 76,825
Haverhill Inside Melrose 7,151 7,343 27,148 27,487
Haverhill Inside Saugus 11,275 11,269 27,128 28,740
Haverhill Inside Stoneham 7,785 7,821 21,340 21,543
Haverhill Inside Wakefeld 14,167 14,237 25,221 26,075
Lowell Inside Lexington 20,134 22,504 31,972 34,717
Lowell Inside Winchester 8,547 8,569 21,329 21,733
Lowell Inside Woburn 34,373 34,600 39,246 42,679
SUBTOTALS INSIDE 118,229 121,326 256,332 279,799
Haverhill Outside Reading 6,061 6,110 25,384 27,975
Lowell Outside North Reading 6,855 7,040 15,295 16,954
Haverhill Outside Lynnfeld 4,388 4,877 11,473 11,520

185 Appendices | January 2019 North South Rail Link Feasibility Reassessment Final Report
Community Information Total employment Total population
Area Rail Line Inside or
outside MA-128 Town/City 2016 2040 2016 2040
North Central
Haverhill Outside Andover 26,560 26,636 33,961 37,687
Haverhill Outside Georgetown 2648 2651 8,501 9,442
Haverhill Outside Groveland 910 911 6,683 7,572
Haverhill Outside Haverhill 21,656 21,730 63,029 69,095
Haverhill Outside Lawrence 26640 27014 80,210 88,691
Haverhill Outside Merrimac 875 875 6,302 6,587
Haverhill Outside Methuen 18,647 18,962 50,329 58,094
Haverhill Outside North Andover 20883 21165 29,011 32,045
Haverhill Outside West Newbury 879 882 4,179 4,341
Lowell Outside Burlington 33,734 38,620 25,379 28,678
Lowell Outside Wilmington 20,162 20,352 22,670 23,836
Lowell Outside Billerica 23,779 23,011 40,661 43,583
Lowell Outside Chelmsford 21,367 23,387 34,046 35,878
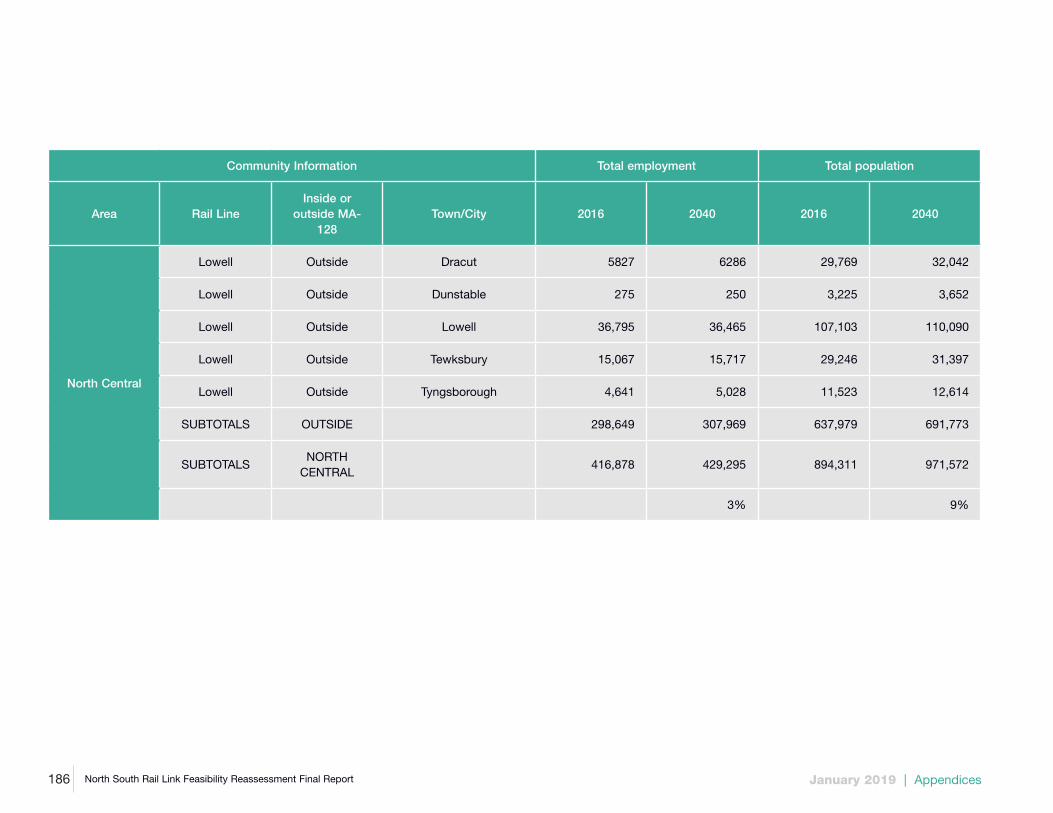
186 January 2019 | Appendices North South Rail Link Feasibility Reassessment Final Report
Community Information Total employment Total population
Area Rail Line Inside or
outside MA-128
Town/City 2016 2040 2016 2040
North Central
Lowell Outside Dracut 5827 6286 29,769 32,042
Lowell Outside Dunstable 275 250 3,225 3,652
Lowell Outside Lowell 36,795 36,465 107,103 110,090
Lowell Outside Tewksbury 15,067 15,717 29,246 31,397
Lowell Outside Tyngsborough 4,641 5,028 11,523 12,614
SUBTOTALS OUTSIDE 298,649 307,969 637,979 691,773
SUBTOTALS NORTH
CENTRAL 416,878 429,295 894,311 971,572
3% 9%

187 Appendices | January 2019 North South Rail Link Feasibility Reassessment Final Report
Community Information Total employment Total population
Area Rail Line Inside or
outside MA-128 Town/City 2016 2040 2016 2040
North East
Newburyport/ Rockport
Inside Winthrop 4,155 4,182 17,512 17,311
Newburyport/ Rockport
Inside Everett 15,562 17,041 45,099 60,434
Newburyport/ Rockport
Inside Lynn 27,181 28,815 92,881 100,819
Newburyport/ Rockport
Inside Manchester-by-
the-Sea 2,022 2,037 5,112 5,021
Newburyport/ Rockport
Inside Marblehead 6112 6138 19,775 20,515
Newburyport/ Rockport
Inside Nahant 506 509 3,309 3,113
Newburyport/ Rockport
Inside Peabody 27,536 27,739 52,998 58,884
Newburyport/ Rockport
Inside Revere 8,501 8,877 55,841 73,696
Newburyport/ Rockport
Inside Salem 18,980 20,027 42,433 45,390

188 January 2019 | Appendices North South Rail Link Feasibility Reassessment Final Report
Community Information Total employment Total population
Area Rail Line Inside or
outside MA-128
Town/City 2016 2040 2016 2040
North East
Newburyport/ Rockport
Inside Swampscott 4,061 4,081 13,737 14,193
Newburyport/ Rockport
Inside Chelsea 16,919 17,136 36,657 42,054
SUBTOTALS INSIDE 131,535 136,582 385,354 441,430
Newburyport/ Rockport
Outside Beverly 24,386 24,815 40,051 42,404
Newburyport/ Rockport
Outside Rockport 2,397 2,397 6,907 6,813
Newburyport/ Rockport
Outside Topsfeld 2,530 2,536 5,884 5,849
Newburyport/ Rockport
Outside Wenham 1,270 1,326 4,730 4,474
Newburyport/ Rockport
Outside Danvers 21,992 22,356 27,585 31,043
Newburyport/ Rockport
Outside Essex 1,605 1,610 3,591 3,737

189 Appendices | January 2019 North South Rail Link Feasibility Reassessment Final Report
Community Information Total employment Total population
Area Rail Line Inside or
outside MA-128
Town/City 2016 2040 2016 2040
North East
Newburyport/ Rockport
Outside Gloucester 13,013 13,228 28,626 27,607
Newburyport/ Rockport
Outside Hamilton 1,973 1,979 7,670 7,602
Newburyport/ Rockport
Outside Ipswich 5,325 5,349 13,207 13,820
Newburyport/ Rockport
Outside Middleton 5,361 5,494 9,416 10,786
Newburyport/ Rockport
Outside Amesbury 5,297 5,305 16,366 17,290
Newburyport/ Rockport
Outside Boxford 1,254 1,260 7,650 7,758
Newburyport/ Rockport
Outside Newbury 1,729 1,731 6,533 6,680
Newburyport/ Rockport
Outside Newburyport 12,394 12,520 17,451 18,673
Newburyport/ Rockport
Outside Rowley 2,545 2,555 6,042 6,638

190 January 2019 | Appendices North South Rail Link Feasibility Reassessment Final Report
Community Information Total employment Total population
Area Rail line Inside or outside
ma-128 Town/city 2016 2040 2016 2040
North East
Newburyport/ Rockport
Outside Salisbury 3,577 3,643 8,479 9,115
SUBTOTALS OUTSIDE 106,648 108,104 210,188 220,289
SUBTOTALS NORTH EAST 238,183 244,686 595,542 661,719
3% 11%

191 Appendices | January 2019 North South Rail Link Feasibility Reassessment Final Report
Community Information Total employment Total population
Area Rail Line Inside or outside
MA-128 Town/City 2016 2040 2016 2040
North West
Fitchburg Oustide Petersham 123 123 1,260 1,350
Fitchburg Inside Somerville 26,188 32,837 81,450 101,971
Fitchburg Inside Waltham 56,175 59,401 62,556 70,009
Fitchburg Inside Arlington 8,764 8,789 43,414 45,159
Fitchburg Inside Belmont 7,277 7,305 25,367 27,977
Fitchburg Inside Cambridge 113,070 123,395 109,486 123,808
Fitchburg Inside Harvard 5,844 11,444 6,513 6,700
SUBTOTALS INSIDE 217,441 243,294 330,046 376,974
Fitchburg Outside Phillipston 168 158 1,694 1,600
Fitchburg Outside Royalston 121 113 1,238 1,150
Fitchburg Outside Templeton 1,720 1,649 8,734 10,975
Fitchburg Outside Wayland 3,845 3,934 12,651 12,395

192 January 2019 | Appendices North South Rail Link Feasibility Reassessment Final Report
Community Information Total employment Total population
Area Rail Line Inside or
outside MA-128 Town/City 2016 2040 2016 2040
North West
Fitchburg Outside Westminster 2,568 2,398 7,414 7,445
Fitchburg Outside Weston 6,646 6,665 11,297 12,053
Fitchburg Outside Shirley 2,262 2,271 7,639 8,650
Fitchburg Outside Stow 2,441 2,583 6,757 7,421
Fitchburg Outside Sudbury 6,808 6,869 17,344 17,303
Fitchburg Outside Townsend 2,072 1,998 8,971 7,900
Fitchburg Outside Winchendon 1,636 1,549 10,625 11,175
Fitchburg Outside Pepperell 1,855 1,759 11,588 12,553
Fitchburg Outside Westford 12,034 13,832 22,260 25,105
Fitchburg Outside Abington 4,420 4,704 17,032 20,382
Fitchburg Outside Barre 1230 1332 5,534 5,936
Fitchburg Outside Princeton 780 811 3,514 3,828
Fitchburg Outside Acton 10,779 10811 22,315 24,253

193 Appendices | January 2019 North South Rail Link Feasibility Reassessment Final Report
Community Information Total employment Total population
Area Rail Line Inside or
outside MA-128 Town/City 2016 2040 2016 2040
North West
Fitchburg Outside Ashburnham 1019 932 6,302 6,900
Fitchburg Outside Ashby 282 274 3,166 3,313
Fitchburg Outside Athol 3,379 3,299 12,011 14,700
Fitchburg Outside Ayer 4,807 4,816 7,499 7,700
Fitchburg Outside Bolton 2,510 2,514 4,982 5,177
Fitchburg Outside Boxborough 2,082 2,180 4,893 4,730
Fitchburg Outside Carlisle 1,021 1,021 4,739 4,692
Fitchburg Outside Clinton 4,902 4,907 14,032 15,200
Fitchburg Outside Concord 13,935 14,591 17,795 18,497
Fitchburg Outside Fitchburg 12,740 12,598 41,038 42,340
Fitchburg Outside Gardner 8,255 8,023 19,909 17,600
Fitchburg Outside Groton 4361 4363 10,903 12,042
Fitchburg Outside Hubbardston 501 484 4,628 5,480

194 January 2019 | Appendices North South Rail Link Feasibility Reassessment Final Report
Community Information Total employment Total population
Area Rail Line Inside or
outside MA-128 Town/City 2016 2040 2016 2040
North West
Fitchburg Outside Hudson 8,293 8,751 19,548 20,807
Fitchburg Outside Leominster 17,690 17,498 40,210 36,500
Fitchburg Outside Lincoln 2,748 2,755 6,199 5,900
Fitchburg Outside Littleton 6,012 6,969 9,189 10,376
Fitchburg Outside Lunenburg 2,262 2,199 10,364 10,480
Fitchburg Outside Bedford 16,114 16,564 13,823 16,093
Fitchburg Outside Lancaster 1,962 1,970 8,464 9,600
Fitchburg Outside Maynard 3,201 3,210 10,158 10,208
SUBTOTALS OUTSIDE 179,461 183,354 446,459 468,459
SUBTOTALS NORTH WEST 396,902 426,648 776,505 845,433
7% 9%

195 Appendices | January 2019 North South Rail Link Feasibility Reassessment Final Report
Community Information Total employment Total population
Area Rail Line Inside or outside
MA-128 Town/City 2016 2040 2016 2040
South Central
Franklin Inside Dedham 14,895 15,162 25,563 28,539
Franklin Outside Hopedale 1,592 1,636 6,122 6,809
Franklin Outside Norwood 24,127 24,435 29,076 30,771
Franklin Outside Walpole 10,693 11,089 24,646 26,910
Franklin Outside Westwood 11,505 12,374 14,571 15,253
Franklin Outside Mendon 1362 1487 5,986 6,416
Franklin Outside Millville 290 300 3,274 3,522
Franklin Outside Blackstone 1,148 1,457 9,313 10,213
Franklin Outside Uxbridge 3,257 3,689 14,247 17,022
Franklin Outside Bellingham 5,747 5,759 16,797 17,912
Franklin Outside Franklin 15,566 17,567 32,029 34,241
Franklin Outside Medfeld 3,267 3,298 11,635 11,558

196 January 2019 | Appendices North South Rail Link Feasibility Reassessment Final Report
Community Information Total employment Total population
Area Rail Line Inside or
outside MA-128 Town/City 2016 2040 2016 2040
South Central
Franklin Outside Medford 18,828 19,254 57,776 64,380
Franklin Outside Medway 3,430 3,433 12,649 12,764
Franklin Outside Milford 18,962 19,856 29,102 32,978
Franklin Outside Millis 2,436 2,486 7,678 7,260
Franklin Outside Milton 7,442 7,463 27,385 28,917
Franklin Outside Norfolk 2,642 2,647 11,431 11,844
Franklin Outside Wrentham 5,885 6,158 10,952 11,257
Providence/ Stoughton
Outside Canton 28,097 28,444 22,096 24,190
Providence/ Stoughton
Outside Foxborough 9,938 11,608 16,992 17,434
Providence/ Stoughton
Outside Sharon 5,188 5,291 17,462 18,474
Providence/ Stoughton
Outside Stoughton 14,505 15,510 27,020 27,209

197 Appendices | January 2019 North South Rail Link Feasibility Reassessment Final Report
Community Information Total employment Total population
Area Rail Line Inside or outside
MA-128 Town/City 2016 2040 2016 2040
South Central
Providence/ Stoughton
Outside Easton 10,597 10,737 23,135 23,019
Providence/ Stoughton
Outside Attleboro 16,896 18,409 44,823 48,889
Providence/ Stoughton
Outside Dighton 1,823 1,873 7,208 7,422
Providence/ Stoughton
Outside Fairhaven 6,028 5,982 16,146 16,625
Providence/ Stoughton
Outside Mansfeld 11,162 12,140 23,058 24,157
Providence/ Stoughton
Outside Marion 2,183 2,140 4,991 5,140
Providence/ Stoughton
Outside North
Attleborough 11,291 12,293 29,328 31,624
Providence/ Stoughton
Outside Norton 6,078 6,690 19,277 20,617
Providence/ Stoughton
Outside Plainville 3,934 4,653 8,578 9,511

198 January 2019 | Appendices North South Rail Link Feasibility Reassessment Final Report
Community Information Total employment Total population
Area Rail Line Inside or
outside MA-128 Town/City 2016 2040 2016 2040
South Central
Providence/ Stoughton
Outside Rehoboth 1,687 1,719 11,808 12,159
Providence/ Stoughton
Outside Seekonk 8,301 8,643 13,958 14,371
Providence/ Stoughton
Outside Swansea 5,426 5,676 16,138 16,618
SUBTOTALS OUTSIDE 281,313 296,196 626,687 667,486
SUBTOTALS SOUTH
CENTRAL 296,208 311,358 652,250 696,025
5% 7%

199 Appendices | January 2019 North South Rail Link Feasibility Reassessment Final Report
Community Information Total employment Total population
Area Rail Line Inside or outside
MA-128 Town/City 2016 2040 2016 2040
South East
Old Colony Inside Quincy 36,820 41,942 96,630 111,114
Old Colony Outside Braintree 23,712 23,992 37,465 44,036
Greenbush Outside Norwell 8,426 8,437 10,645 11,196
Greenbush Outside Scituate 4,055 4,078 18,022 19,347
Greenbush Outside Weymouth 22,402 22,764 54,168 56,420
Greenbush Outside Cohasset 3,314 3,497 8,049 10,306
Greenbush Outside Hingham 14,889 15,361 22,521 23,426
Greenbush Outside Hull 1,888 1,893 10,095 9,376
Greenbush Outside Marshfeld 8,704 9,741 25,235 26,097
Kingston/ Plymouth
Outside Rockland 7,711 7,740 17,486 17,468
Kingston/ Plymouth
Outside Hanover 7,270 7,286 14,035 14,551
Kingston/ Plymouth
Outside Duxbury 3,571 3,594 15,108 18,622

200 January 2019 | Appendices North South Rail Link Feasibility Reassessment Final Report
Community Information Total employment Total population
Area Rail Line Inside or
outside MA-128 Town/City 2016 2040 2016 2040
South East
Kingston/ Plymouth
Outside Pembroke 5,006 5,040 18,141 15,472
Kingston/ Plymouth
Outside Halifax 1,446 1,461 7,513 7,448
Kingston/ Plymouth
Outside Hanson 2,146 2,149 10,524 11,351
Kingston/ Plymouth
Outside Kingston 6,892 7,806 13,060 14,630
Kingston/ Plymouth
Outside Plymouth 26458 28,368 59,142 64,342
Kingston/ Plymouth
Outside Plympton 832 1,130 2,860 3,002
Kingston/ Plymouth
Outside Whitman 2,707 2,738 14,773 15,235
Kingston/ Plymouth
Outside Carver 2,777 3,139 11,819 12,911
Middleborough/ Lakeville
Outside Randolph 8,233 8,263 33,240 37,119
Middleborough/ Lakeville
Outside Holbrook 2,972 2,990 10,850 11,110

201 Appendices | January 2019 North South Rail Link Feasibility Reassessment Final Report
Community Information Total employment Total population
Area Rail Line Inside or
outside MA-128 Town/City 2016 2040 2016 2040
South East
Middleborough/ Lakeville
Outside Avon 5,294 5,389 4,362 4,327
Middleborough/ Lakeville
Outside Bridgewater 8,661 9,117 26,859 27,456
Middleborough/ Lakeville
Outside Brockton 37,765 38,276 95,513 97,886
Middleborough/ Lakeville
Outside East Bridgewater 3,282 3,503 14,212 14,967
Middleborough/ Lakeville
Outside West Bridgewater 7,734 8,196 7,070 7,559
Middleborough/ Lakeville
Outside Acushnet 1226 1296 10,480 10,792
Middleborough/ Lakeville
Outside Berkley 571 616 6,521 6,715
Middleborough/ Lakeville
Outside Dartmouth 16,030 17,022 34,616 35,645
Middleborough/ Lakeville
Outside Fall River 35,017 35,584 90,383 91,557
Middleborough/ Lakeville
Outside Freetown 4,201 4,658 9,022 9,289

202 January 2019 | Appendices North South Rail Link Feasibility Reassessment Final Report
Community Information Total employment Total population
Area Rail Line Inside or
outside MA-128 Town/City 2016 2040 2016 2040
South East
Middleborough/ Lakeville
Outside Lakeville 3,174 3,620 10,889 11,909
Middleborough/ Lakeville
Outside Mattapoisett 1,750 1,763 6,148 6,331
Middleborough/ Lakeville
Outside Middleborough 8,456 9,514 24,491 28,130
Middleborough/ Lakeville
Outside New Bedford 35,894 35,332 96,710 99,580
Middleborough/ Lakeville
Outside Raynham 8515 9355 14,290 16,552
Middleborough/ Lakeville
Outside Rochester 768 763 5,322 5,479
Middleborough/ Lakeville
Outside Somerset 4,482 4,517 18,477 19,026
Middleborough/ Lakeville
Outside Taunton 24,542 26,971 56,404 59,958
Middleborough/ Lakeville
Outside Wareham 8,961 9,131 22,199 22,857

203 Appendices | January 2019 North South Rail Link Feasibility Reassessment Final Report
Community Information Total employment Total population
Area Rail Line Inside or
outside MA-128 Town/City 2016 2040 2016 2040
South East
Middleborough/ Lakeville
Outside Westport 3,304 3,206 15,798 17,775
SUBTOTALS OUTSIDE 385,038 399,296 984,517 1,037,255
SUBTOTALS SOUTH EAST 421,858 441,238 1,081,147 1,148,369
5% 6%

204 January 2019 | Appendices North South Rail Link Feasibility Reassessment Final Report
Community Information Total employment Total population
Area Rail Line Inside or
outside MA-128 Town/City 2016 2040 2016 2040
West
Worcester Inside Brookline 20,402 20,739 62,015 72,613
Worcester Inside Newton 47,995 49,184 86,416 90,182
Worcester Inside Watertown 18,296 18,437 33,040 36,901
SUBTOTALS INSIDE 86,693 88,360 181,471 199,696
Needham Outside Dover 884 888 5,482 5,410
Needham Outside Needham 18,209 18,441 29,251 31,623
Worcester Outside Auburn 10,071 10,684 16,603 17,814
Worcester Outside Wellesley 21825 21959 27,873 27,403
Worcester Outside Berlin 462 497 3,177 4,336
Worcester Outside Boylston 1671 1727 4,519 5,051
Worcester Outside Brookfeld 494 498 3,479 3,745
Worcester Outside Charlton 3824 4,394 13,534 15,380
Worcester Outside Douglas 874 1,045 8,788 9,820

205 Appendices | January 2019 North South Rail Link Feasibility Reassessment Final Report
Community Information Total employment Total population
Area Rail Line Inside or
outside MA-128 Town/City 2016 2040 2016 2040
West
Worcester Outside Dudley 2842 3107 11,674 12,503
Worcester Outside East Brookfeld 396 401 2,235 2,382
Worcester Outside Grafton 4134 4463 18,792 22,390
Worcester Outside Hardwick 392 395 3,066 3,289
Worcester Outside Holden 3,561 3,873 17,945 19,862
Worcester Outside Leicester 2,228 2,416 11,243 12,048
Worcester Outside Millbury 5093 5489 13,749 15,319
Worcester Outside New Braintree 239 243 1,019 1,071
Worcester Outside North Brookfeld 901 916 4,800 5,154
Worcester Outside Northborough 6,245 7,157 14,973 17,836
Worcester Outside Northbridge 5372 6233 16,424 18,855
Worcester Outside Oakham 211 225 1,942 2,053
Worcester Outside Oxford 4266 4690 14,164 15,601

206 January 2019 | Appendices North South Rail Link Feasibility Reassessment Final Report
Community Information Total employment Total population
Area Rail Line Inside or
outside MA-128 Town/City 2016 2040 2016 2040
West
Worcester Outside Paxton 834 914 4,970 5,493
Worcester Outside Rutland 1,096 1,220 8,332 9,543
Worcester Outside Shrewsbury 13,135 14,068 36,914 41,171
Worcester Outside Southbridge 5,941 6,876 17,030 17,814
Worcester Outside Spencer 3,079 3,343 11,997 12,915
Worcester Outside Sturbridge 4,711 5,186 9,949 12,392
Worcester Outside Sutton 2,203 2,350 9,263 10,213
Worcester Outside Upton 1170 1597 8,150 10,357
Worcester Outside Warren 585 628 5,278 5,709
Worcester Outside Webster 6,835 7,931 17,335 19,142
Worcester Outside West Boylston 3842 4318 7,930 8,766
Worcester Outside West Brookfeld 851 859 3,800 4,096
Worcester Outside Westborough 24,300 26,165 18,918 21,010

207 Appendices | January 2019 North South Rail Link Feasibility Reassessment Final Report
Community Information Total employment Total population
Area Rail Line Inside or
outside MA-128 Town/City 2016 2040 2016 2040
West
Worcester Outside Worcester 97,734 105,113 185,257 197,196
Worcester Outside Ashland 5,634 5,718 17,519 20,892
Worcester Outside Framingham 52,557 55,001 69,863 75,997
Worcester Outside Holliston 4,840 6,236 13,266 12,870
Worcester Outside Hopkinton 10,223 10,856 15,117 16,551
Worcester Outside Natick 24,204 24,543 33,469 34,850
Worcester Outside Marlborough 26321 27146 40,081 45,653
Worcester Outside Sherborn 946 952 3,919 3,682
Worcester Outside Southborough 7,453 8,174 9,909 11,082
Worcester Outside Sterling 2,344 2,298 7,893 7,500
SUBTOTALS OUTSIDE 395,032 421,233 800,891 873,839
SUBTOTALS WEST 481,725 509,593 982,362 1,073,535
6% 9%

208 January 2019 | Appendices North South Rail Link Feasibility Reassessment Final Report
Community Information Total employment Total population
Area Rail Line Inside or
outside MA-128 Town/City 2016 2040 2016 2040
Boston ALL LINES INSIDE Boston 600,371 646,946 645,570 743,967
8% 15%

209 Appendices | January 2019 North South Rail Link Feasibility Reassessment Final Report
Community Information Total employment Total population
Area Rail Line Inside or
outside MA-128 Town/City 2016 2040 2016 2040
Totals
COMMUTER RAILSHED (Does not include
Boston) 2,251,754 2,362,818 4,982,117 5,396,653
5% 8%
Inside 128 605,613 646,666 1,275,396 1,437,552
7% 13%
Outside 128 1,646,141 1,716,152 3,706,721 3,959,101
4% 7%
North Side 1,051,963 1,100,629 2,266,358 2,478,724
South Side 1,199,791 1,262,189 2,715,759 2,917,929
TOTAL REGIONAL GROWTH - INCLUDES BOSTON 2,852,125 3,009,764 5,627,687 6,140,620
6% 9%
Table C1: Boston Metro Employment and Population Projections
Source: Metropolitan Area Planning Council (MAPC) 2015 Projections; Long-Range Transportation Plan (LRTP), Charting Progress to 2040, Needs Assessment

210 January 2019 | Appendices North South Rail Link Feasibility Reassessment Final Report
Model Inputs
Inputs to the model include population by age; HHs by type (HHs by worker, by HH income, and by auto availability); and employment categories: basic, retail, and service.
The US Census is the source for population and HH data, while InfoUSA (a private data vendor) is the source for employment data. CTPS and the Metropolitan Area Planning Council (MAPC) purchased the data from InfoUSA in 2011, and spent a year analyzing and correlating the data before the agency staff were confdent of their accuracy for use in the model. The census data do not require the same degree of verifcation as the InfoUSA data, but analysis was also required to check and prepare the census data for inputs to the model.
The transit information used in the model is from transit schedules published by the Massachusetts Bay Transportation Authority (MBTA). CTPS periodically updates the schedules in the model to refect the most current schedule information. Typically, future-year No Build scenarios refect base-year transit schedules. As shown in Table C2, the transit system simulation is based on four time periods: AM peak period (6:00 AM to 9:00 AM), midday (9:00 AM to 3:00 PM), PM peak period (3:00 PM to 6:00 PM), and early evening and night (6:00 PM to 6:00 AM).
Time Period Highway Vehicle-Trips and
Transit Person-Trips
AM peak period 6:00 AM to 9:00 AM
Midday 9:00 AM to 3:00 PM
PM peak period 3:00 PM to 6:00 PM
Early evening/night 6:00 PM to 6:00 AM Table C2: Time Periods of Trip Assignments
Highway Data: Roadway information was taken from the 2012 MassDOT road inventory fle. This information includes number of travel lanes per direction, segment length, posted travel speed, and functional classifcation for each road and highway.
The following cost data were used in the model:
• Mode-specifc weighted transit fare (weighted based on the relative shares of pass holders, those paying full fares, and those with discount fares)
• Data on park-and-ride lot fees collected in 2012 for every known lot in the model area
• Information on applicable highway tolls collected in 2012 by individual toll facilities
• Auto operation costs calculated for the year 2012
MassDOT and the Boston Region MPO contributed funds to hire a consultant to conduct a statewide household travel survey during an 18-month period between June 2010 and November 2011, known as the 2011 Massachusetts Travel Survey (2011-MTS).
The 2011–MTS was used extensively to estimate, calibrate, and validate the CTPS model.
Trip Purposes
Daily HH activities are defned by trip purpose. The trip purposes that are represented in the CTPS model are home-based work (HBW) trips (work trips that have one end associated with the traveler’s home), home-based personal business (HBPB) trips, home-based social-recreational (HBSR) trips, home-based school (HBSC) trips, home-based pick-up/drop-off (PUDO) trips, non-home-based work (NHBW) trips (trips that neither begin nor end at home, but begin or end at work), and non-home-based other (NHBO) trips (trips that neither begin nor end at home).
Truck, Taxi, Logan International Airport, and Through Trips
Other types of trips are also considered by the model, such as commercial vehicle trips (trucks), taxi trips, trips to and from Logan Airport, and through trips (trips that neither begin nor end in the modeled area, but pass through the modeled area).
Description of Future-Year Land-Use Scenario
MassDOT, through an extensive effort involving other state agencies, the UMass Donahue Institute, and the state’s regional planning agencies, has developed a set of community forecasts for the
211 Appendices | January 2019 North South Rail Link Feasibility Reassessment Final Report
state. For the Boston region, MAPC allocated these community forecasts—or regional control totals—to TAZs.
MAPC allocated the MassDOT regional control totals to individual TAZs based on the Cube Land land-use allocation model, which is third-party software that forecasts land use by simulating the real estate market under different economic conditions. Cube Land forecasts the supply, location and rents by zone for different types of properties, estimating the location of households and non-residential activities for different demographic groups. The basis for Cube Land’s land-use allocation model is a development tracking database (developed by MAPC), changes in parcel transportation accessibility (computed by CTPS), and community assessor and zoning maps. MAPC’s application of Cube Land covers all 164 cities and towns in the MPO modeling area. (Note that this modeling area differs from the area covered by the MPO, which includes 101 cities and towns.)
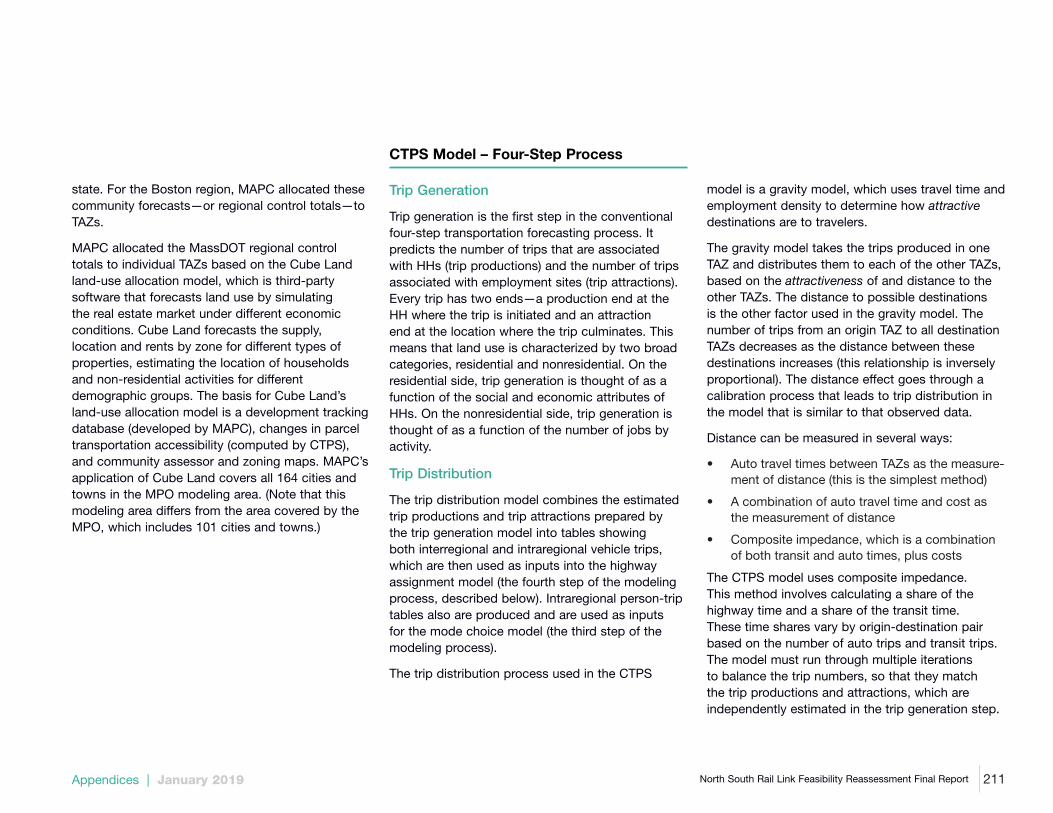
CTPS Model – Four-Step Process
Trip Generation
Trip generation is the frst step in the conventional four-step transportation forecasting process. It predicts the number of trips that are associated with HHs (trip productions) and the number of trips associated with employment sites (trip attractions). Every trip has two ends—a production end at the HH where the trip is initiated and an attraction end at the location where the trip culminates. This means that land use is characterized by two broad categories, residential and nonresidential. On the residential side, trip generation is thought of as a function of the social and economic attributes of HHs. On the nonresidential side, trip generation is thought of as a function of the number of jobs by activity.
Trip Distribution
The trip distribution model combines the estimated trip productions and trip attractions prepared by the trip generation model into tables showing both interregional and intraregional vehicle trips, which are then used as inputs into the highway assignment model (the fourth step of the modeling process, described below). Intraregional person-trip tables also are produced and are used as inputs for the mode choice model (the third step of the modeling process).
The trip distribution process used in the CTPS
model is a gravity model, which uses travel time and employment density to determine how attractive destinations are to travelers.
The gravity model takes the trips produced in one TAZ and distributes them to each of the other TAZs, based on the attractiveness of and distance to the other TAZs. The distance to possible destinations is the other factor used in the gravity model. The number of trips from an origin TAZ to all destination TAZs decreases as the distance between these destinations increases (this relationship is inversely proportional). The distance effect goes through a calibration process that leads to trip distribution in the model that is similar to that observed data.
Distance can be measured in several ways:
• Auto travel times between TAZs as the measure-ment of distance (this is the simplest method)
• A combination of auto travel time and cost as the measurement of distance
• Composite impedance, which is a combination of both transit and auto times, plus costs
The CTPS model uses composite impedance. This method involves calculating a share of the highway time and a share of the transit time. These time shares vary by origin-destination pair based on the number of auto trips and transit trips. The model must run through multiple iterations to balance the trip numbers, so that they match the trip productions and attractions, which are independently estimated in the trip generation step.

212 January 2019 | Appendices North South Rail Link Feasibility Reassessment Final Report
Mode Choice
Mode choice is the third step in the travel demand forecasting process. It is the process in which the trips from the distribution step are allocated to the available travel modes from the transportation network. Trip distribution establishes the volume of trips from one place to another, whereas mode choice estimates the mode that those travelers will use to make their trip.
CTPS used 2011 MTS data, information about travel impedances on the highway and transit networks, 2006-10 US Census data, and a variety of other data sources to develop a mode choice model by trip purpose. The mode choice model estimates what percentage of travelers will use each mode for four trip purposes:
• Home-based work (HBW) and work-related
• Home-based other (HBO)—including home-based shopping, personal business, social, recreation, and other miscellaneous purposes
• Home-based school (HBSC)—this trip purpose was further divided into HBSC1 (ages 0 to 13), HBSC2 (ages 14 to 18), and HBSC3 (ages 19 and older)
• Non-home based (NHB)—including non-home-based work and non-home-based other trips
The mode choice model is applied, by trip purpose, to the distributed trip tables that result from the trip distribution model, and splits the trip purposes between the following modes:
• Auto: drive alone (DA)
• Auto: two occupants (SR2)
• Auto: three or more occupants (SR3+; for HBW only)
• Transit: drive access to commuter rail (DAT_CR)
• Transit: drive access to rapid transit (DAT_RT)
• Transit: drive access to local bus (DAT_LB)
• Transit: drive access to boat/ferry (DAT_B/F; not for HBSC)
• Walk to transit (Boat, CR, RT, and bus)
• Nonmotorized: walk, bike
The number of trips in the 2011–MTS data by trip purpose, as well as the characteristics of the transportation system in the modeling area, determined the modes and trip purposes considered in the mode choice model. The transportation system characteristics can be thought of as a kind of level-of-service metric that aggregates various facility characteristics into one metric.
Transit Path-Building
The following topics have been discussed: how many trips will be made; where these trips will go; and what mode they will take. This section covers what route within that mode will be taken.
For transit trips, the path selected is based on the lowest generalized cost. This means that all components of the transit trip (access time, egress time, waiting time, in-vehicle time, fare, and transfer cost and time) are converted to one variable, which is cost. The transit path with the lowest cost is chosen.
Wait-time estimations in the model vary depending on the frequency of a particular service but are capped at ten minutes’ waiting time. Transfer time includes the time it takes to walk between two stops. The model caps the allowed number of transfers at six.
Highway Path-Building
For highway trips, the path is based on the minimum congested travel time path. The travel time is calculated based on the traffc volumes, which result from the highway assignment.

213 Appendices | January 2019 North South Rail Link Feasibility Reassessment Final Report
Trip Assignment
Trip assignment is the fourth step in the travel demand forecasting process. Trip assignment models are used to estimate the traffc and passenger fows on a transportation network. Trip assignment is the most time-consuming step—as well as one of the most data-intensive steps—of the four-step modeling process. The process is somewhat different for highway travel than for transit travel.
Highway Assignment Overview
The highway assignment model predicts the fows on the network, generates estimates of travel times, and produces attributes that are the basis for traffc volume and capacity analyses. This model is also used to generate the estimates of network performance that are used in the mode choice and trip distribution models.
The CTPS roadway/highway assignment procedure assigns highway trips to the highway network so that each user of the highway network chooses the route that he or she perceives to be the best. The assignment procedure is performed for each time period.
For more realistic assignment results, the assignment procedure recognizes that different groups of highway users value network attributes
(for example, travel time) differently. The highway users are represented by drive-alone auto trips, shared-ride auto trips, and truck trips.
The generalized cost is computed as the combination of the travel time and a toll equivalent time. Toll costs affect the assignment and are stored on the network. The generalized cost is converted to an equivalent time by applying the value time to the toll. The value of time for autos is $0.20 per minute ($12.00 per hour). This value is based on the average hourly rate for the region in 2010 dollars. Trucks have a signifcantly higher value of time. For small single-unit trucks, the value of time is $0.75 per minute. For large single-unit trucks and combination vehicles, the value of time is $1.00 per minute.
The assignment procedure uses the user equilibrium method—an iterative process which assigns trips to a series of routes until a level of travel time parity is achieved across the network. Travel time is a function of the assigned traffc volume and the road capacity. Road capacity is estimated based on the roadway attributes, such as the number of lanes. For each iteration of assignment, the highway trips between zone pairs are assigned to routes with the minimum cost and travel time is calculated after trip assignment. The iterative process stops when changing user’s paths will not achieve a faster route.
Transit Assignment Overview
To perform a transit assignment, the following inputs are needed:
• Transit route system
• Fare structure
• Demand for passenger trips between different origins and destinations
• After the demand matrices of drive access trips (DAT) and walk access trips (WAT) are forecast, the trips are assigned to the transit network and combined by time period. The congestion of passengers at stops and terminals does not infuence travel times or behavior in the model.
Finally, summaries of transit boardings by submode (for example, buses, rapid transit, ferry, commuter rail) and time of day are produced, along with boardings and alightings at rapid transit and commuter rail stations, with subtotals by line. For buses, summaries of boardings are produced that are classifed by the MBTA bus route number and time of day.

214 January 2019 | Appendices North South Rail Link Feasibility Reassessment Final Report
Other Model Outputs
Environmental Justice
When required, CTPS performs an environmental justice (EJ) analysis in the model. The EJ analysis examines the benefts and burdens of the project on EJ communities in the study area.
The EJ analysis is performed at the level of the TAZ. TAZs are identifed as being EJ TAZs if their populations meet certain thresholds with regard to income, race, or in some cases, English language profciency. The thresholds are based on regional or statewide averages.
The EJ analysis typically measures the change in accessibility to employment for a given alternative. That change is measured for trips within a particular area, or travel shed. The travel shed that is established depends on the particulars of the study and the alternatives being examined.
For example, if the study focuses on a commuter rail extension that would involve a 90-minute train ride to Boston, the travel shed would be defned as the area around the train route being analyzed.
Air Quality
When required, CTPS also performs an air quality mobile source emissions analysis. CTPS uses the travel demand model in conjunction with MOVES 2014a—the US Environmental Protection Agency’s (EPA) Motor Vehicle Emission Simulator—to estimate mobile source emissions from all modes of transportation for the different alternatives studied. Commuter rail emissions are estimated based on guidance from the EPA.
MOVES 2014a uses vehicle-miles traveled as well as vehicle speed, in combination with feet emissions rates, to estimate mobile source emissions. Emissions factors for motor vehicles are specifc to each vehicle model year, pollutant type, temperature, and travel speed. MOVES 2014a utilizes a wide range of input parameters, including inspection and maintenance program information, and other data such as hot/cold start mix, emission failure rates, vehicle feet mix, and feet age distribution.
The EPA guidance employs a similar methodology to estimate emissions for locomotives. Track miles are considered along with specifc emission factors to develop air quality estimates associated with the trains. CTPS estimates train emissions for vehicle feets of different ages, using a methodology employed by the EPA.

215 Appendices | January 2019 North South Rail Link Feasibility Reassessment Final Report
D. Fire and Life Safety
This Appendix provides further detail on Fire and Life Safety requirements and design, as they pertain to the NSRL project.
Means of Egress: Stations
The National Fire Protection Association (NFPA) publishes consensus codes and standards for minimization of fre and other risks, and the NFPA 130 Standard specifes fre protection and life safety requirements for fxed guideway transit and passenger rail. Per NFPA 130, the means of egress system at each station must be designed based on the station’s passenger load. This occupant load is calculated based on projected peak period train loads at the station in question, and is the sum (assuming simultaneous train movements on all tracks in normal traffc directions) of all passengers entering the station and outgoing passengers awaiting trains on the platforms.
NFPA 130 takes a performance-based approach to egress system design, requiring that evacuation time from the platform be less than four minutes, and that the total evacuation time from the most remote point of a platform to a Point of Safety be less than six minutes. Evacuation time is based on the design passenger load, means of egress components used, their maximum capacity and travel speed as prescribed by NFPA 130, and travel distances. The predicted passenger load at each station informs the number and capacity of the exits required for the station.
Since ridership numbers are fuid and can change signifcantly over the useful life of the station, for maximum fexibility each station should have at least four exits (the minimum requirement under the
Ninth Edition of the Massachusetts Building Code for a space serving more than 1,000 occupants). NFPA 130 limits the travel distance between the platform and a point where an egress route leaves the platform to 325 feet, and limits the common path of travel from the platform ends to 82 feet or one car length (whichever is greater).
Since NFPA 130 allows stairs, ramps, escalators, elevators, and doorways to be part of the means of egress system, and since these components also serve as points of ingress to the station, the recommended means of egress strategy (again, with a minimum of four exits/entrances) complies with code for a space with a large occupant load (over 1,000 people), and can provide convenient access points to and from the station for the riders and the general public.
Furthermore, the Standard specifes the following requirements:
• Escalators may not account for more than 50% of the required means of egress capacity at any one level except where the escalators can be brought to a stop remotely
• Each station level is also served by at least one stairwell, with at least one enclosed exit stairwell or exit passageway providing continuous access between platforms and the public way.
• Elevators used as a means of egress must not account for more than 50% of required egress capacity.

216 January 2019 | Appendices North South Rail Link Feasibility Reassessment Final Report
• Elevators used as a means of egress must be accessible via holding areas that are smoketight and fre-rated for a minimum of one hour or lob-bies that are served by a stairwell. Elevator shafts must be fre-rated for at least two hours.
In addition to meeting the specifc NFPA 130 component requirements shown in Table D15, the means of egress from stations must be provided with emergency lighting.
An alternative would be to base the egress system and features on a performance-based analysis (performance approach). A performance approach is an engineered process that focuses on meeting goals and objectives rather than prescriptive requirements. Based upon the unique nature of these deep stations, a performance-based egress analysis would be appropriate and would be recommended as part of future assessments.
Means of Egress Component
Minimum Clear Width
[in]
Maximum Means of Egress Capacity [person/in-min]
Maximum Travel Speed [ft/min]
Platforms Corridors
Ramps
44 2.08 124
Concourses Areas of lower
pedestrian density 44 2.08 200
Stairs Escalators
44 1.41 48 (vertical)
Doors Gates[single leaf]
n/a 60 person per minute for each
component n/a
Doors Gates [bi-parting multi-
leaf] n/a 2.08 n/a
Fare barriers 21 50 person per minute for each
component n/a
Table D1: NFPA 130 Means of Egress Component Requirements
217 Appendices | January 2019 North South Rail Link Feasibility Reassessment Final Report
Means of Egress: Tunnels
Evacuation from a vehicle within the trainway tunnel must allow the riders to proceed to the nearest station or another Point of Safety. Within the tunnel, exits must be located within 2,500ft of one another. Exit stairs must be constructed along the tunnels. This confguration can be cost-prohibitive, depending on proposed tunnel depth and the availability of open land on the surface.
However, NFPA 130 also allows cross-passageways in lieu of emergency exit stairways when tunnels are divided by fre separation that is rated for a minimum of two hours or where tunnels are in twin bores. The cross-passageways must be within 800ft of one another and of station boundaries or tunnel portals, and must have minimum dimensions of 44in clear width and 7ft clear height. The intent is for the cross-passageways to allow riders from one trainway or bore to enter into another trainway or bore, thereby separated from the hazard and able to continue on the evacuation route. To facilitate egress, ventilation for the incident trainway must be designed to control smoke spread in the vicinity of the passengers.
Fire Protection Features: Stations
Each station must be provided with an accessible fre command center. The fre command center is the main area displaying the status of the detection; containing alarm communications, control systems, and other emergency systems; and from where the systems can be manually controlled.
Automatic sprinklers are required in areas of a station used for concessions, storage, and trash collection, and in other similar spaces with combustible loadings (except tunnels). The sprinkler system is provided with a water fow alarm and supervisory signal service, and the system design and installation are required to comply with NFPA 13, the standard for sprinkler system installation. The City of Boston may require additional areas, such as back-of-house, lobbies, MEP rooms, or concourses, to be protected by automatic sprinkler systems.
Class I standpipes in accordance with NFPA 14, the standard for standpipe and hose systems, are required at each station. The standpipe system must be enclosed in fre construction unless the system is cross-connected or fed from two locations and the isolation valves are installed 800ft apart or less. The system is also required to be ‘wet type’ (standpipes with a continuous water supply) except where approved by the authority with jurisdiction, and where the system is designed so that water is delivered to all hose connections within 10 minutes and combination air relief-vacuum valves are installed at each high point of the system.
Each station is required to:
• Be protected by a fre alarm system designed and installed per NFPA 72. The fre alarm system must be provided with a fre alarm annuncia-tor panel at an approved location accessible to emergency response personnel.
• Incorporate automatic fre detection in all un-sprinklered ancillary spaces by temperature and rate-of-rise heat detectors or smoke detectors that achieve listed standards. Activation of initiat-ing devices must be announced at the Panels must announce activation of devices by audible alarm and visually display the location of the actuated device.
• Include separate alarm zones to monitor water fow and supervise main control valves for the automatic sprinkler. All indicator signals for fre alarms, smoke detection, valve switches, and water fow must be simultaneously transmitted to the local fre station and to the operations control center for the rail system.
• Provide an emergency communications system at each station that is in compliance with Chapter 10 of NFPA 130 .
NFPA 130 requires that the authority with jurisdiction determines the number, size, type, and location of any portable fre extinguishers to be installed in a train station.

218 January 2019 | Appendices North South Rail Link Feasibility Reassessment Final Report
Emergency power, in accordance with Article 700 of NFPA 70 and Chapter 4 of NFPA 100, is required for each station. The emergency power system is sized to selective load pickup and load shedding of the following systems:
• Emergency lighting
• Protective signaling
• Emergency communications
• Fire command center
• Elevators providing required egress capacity
Fire Protection Features: Tunnels
An emergency communications system in compliance with Chapter 10 of NFPA 130 is required within the tunnels.
At traction power substations and signal bungalows, heat and smoke detectors connected to the operations control center are required per NFPA 130. An automatic sprinkler system is not required within the tunnels per NFPA 130.
Class I standpipes are required to be installed within the tunnels. In addition to the requirements for standpipes for station structures, an approved water supply must provide the system demand for a minimum of one hour. Approved water supplies include a municipal or privately owned waterworks system, automatic or manually controlled fre pumps connected to a water source, or pressure-type or gravity-type storage tanks per NFPA 22. A fre department connection is required for the system, and a fre department access road must reach within 100ft of the fre department connections. The authority with jurisdiction determines the number, size, type, and location of any portable fre extinguishers to be installed within the tunnels.
Emergency power is required for the enclosed tunnels. The emergency power system will connect to the following systems within the trainway tunnel:
• Emergency lighting
• Protective signaling
• Emergency communications
• Fire command center

219 Appendices | January 2019 North South Rail Link Feasibility Reassessment Final Report
Ventilation
NFPA 130 requires a tunnel ventilation system, which performs a number of functions. The primary function is to ventilate any smoke produced during a fre event, to allow a clear path for evacuating passengers from any trains either in the tunnels between stations or in the stations themselves.
The tunnels will be cleared using a fan plant at either end of a tunnel segment, and these operate using the ‘push-pull’ principle (the fan plant at one end of the affected tunnel segment will be operated in supply mode, while the plant at the other end will operate in exhaust mode, as shown in Figure D3). A critical velocity is attained to force smoke in one direction while passengers exit in the opposite direction.
In the event of a train fre within a station, the fan plants at that station operate in exhaust mode. An over-track exhaust duct clears smoke from all areas of the platform outside the immediately affected area to meet visibility, temperature and carbon monoxide concentration tenability criteria at 6ft (1.8 meters) above platform level.
A fan plant is provided at both ends of each station to meet these ventilation needs. A series of dampers and ducts allows the same fan plant to ventilate either the station or the adjacent tunnel. These fan plants are connected by large shafts to a surface structure (vent building) to discharge or intake air.
A piston relief system, as shown in Figure D4, keeps
air velocities on the platform within acceptable limits and prevents heat buildup within the tunnels and stations. This directs the air carried along with the trains on an alternate path, rather than allowing the air to fnd its way to the surface through station entrances. To minimize costs, piston relief shafts are combined with fan shafts to the greatest extent possible.
Figure D1: Tunnel Ventilation

220 January 2019 | Appendices North South Rail Link Feasibility Reassessment Final Report
Figure D2: Piston Effects in a Train Tunnel
If a train is stopped between stations in the tunnel and the temperature within the tunnel rises above acceptable limits, the tunnel vent plants at each end operate in push-pull mode. This provides cooling air to prevent the train’s air conditioning units from overheating and shutting off. While all locomotives in revenue service or routine operation in the NSRL tunnels are assumed to be electric, on occasions that diesel equipment uses the tunnels, the fans can also be used to purge diesel exhaust.
Fan plants can be located in a number of confgurations, depending on various site conditions. If real-estate is available, the fan plants can be located above-grade, otherwise the generally more expensive option of providing space within the station box applies, as shown in Figure D5. The fans themselves can be mounted horizontally or vertically to suit the available space. A typical horizontal fan plant requires an approximate 75ft by 50ft space. In addition, there are associated electrical spaces to house the starters, transformers and controls for the fans.

221 Appendices | January 2019 North South Rail Link Feasibility Reassessment Final Report
Figure D3: Integrate Tunnel-Station Ventilation Fan Plant
NFPA 130 requires two independent electrical power sources for each fan system for redundancy. Spare fan capacity is provided such that the required performance can be maintained with the most critical fan out of service. The fans are reversible axial type with associated sound attenuators. Dampers are provided to allow fans to be taken out of service as well as to allow the system to operate in the various modes. A Supervisory Control and Data Acquisition (SCADA) system is provided to control the fans, which are interfaced with the rail control center.
In order to facilitate effective ventilation for the tunnel sections between the portals and the adjacent stations, a fan plant or a set of jet fans is required. Similar to fans inside a vent building, jet fans can provide makeup or exhaust air into the tunnel to control the smoke spread. Jet fans are recommended for both the North and South portals due to lower costs than a vent building. However, at the South portal location, smoke exhausted by jet fans at the tunnel opening may pose an environmental and pollution issue due to the high building/occupant density in the adjacent area. Thus, at the South portal location, a vent building may be necessary.
The following maps show possible locations for the vent buildings, based on adjacency to stations, the availability of land, and the potential costs related to acquisition.

222 January 2019 | Appendices North South Rail Link Feasibility Reassessment Final Report
Figure D4: Possible Vent Building Locations at North / State/Haymarket Station

223 Appendices | January 2019 North South Rail Link Feasibility Reassessment Final Report
Figure D5: Possible Vent Building Locations at North / State/Haymarket Station (Cont.)

224 January 2019 | Appendices North South Rail Link Feasibility Reassessment Final Report
Figure D6: Possible Vent Building Locations at South Station Pearl/Congress Alignment

225 Appendices | January 2019 North South Rail Link Feasibility Reassessment Final Report
Figure D7: Possible Vent Building Locations at South Station Central Artery Two-Track Alignment
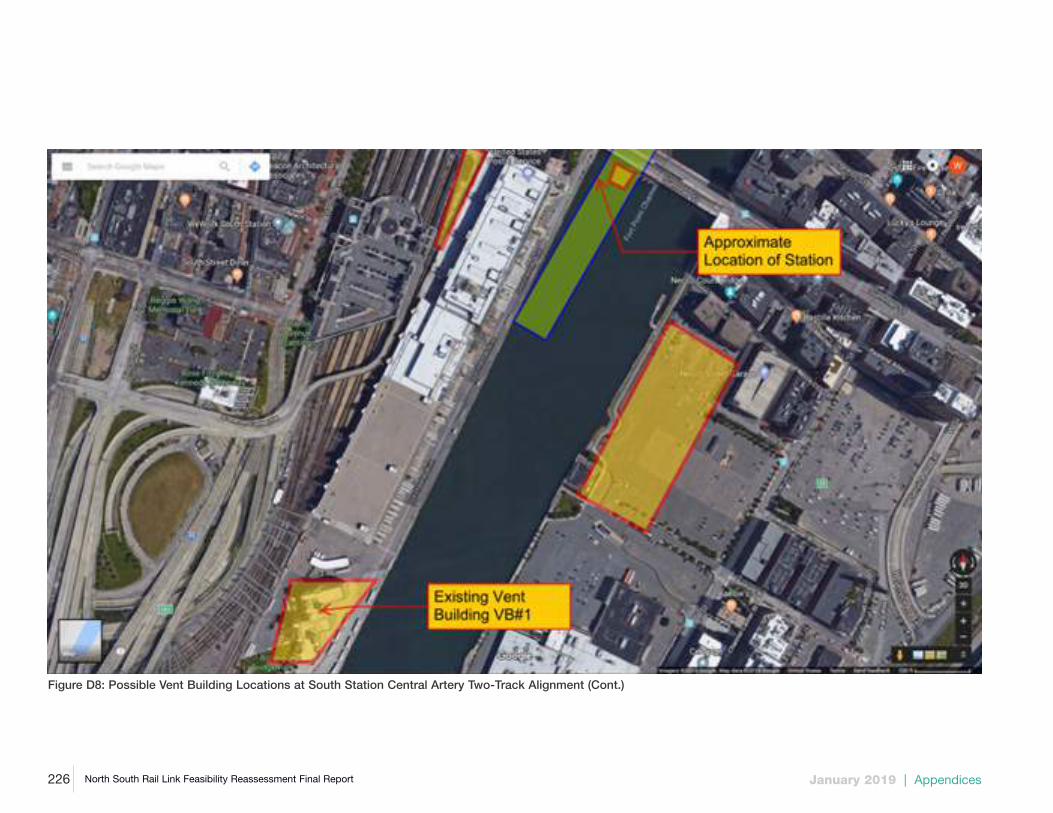
226 January 2019 | Appendices North South Rail Link Feasibility Reassessment Final Report
Figure D8: Possible Vent Building Locations at South Station Central Artery Two-Track Alignment (Cont.)

227 Appendices | January 2019 North South Rail Link Feasibility Reassessment Final Report
Figure D9: Possible Vent Building Locations at South Station South/Congress Alignment

228 January 2019 | Appendices North South Rail Link Feasibility Reassessment Final Report
Figure D10: Possible Vent Building Locations at North Portal

229 Appendices | January 2019 North South Rail Link Feasibility Reassessment Final Report
Figure D11: Possible Vent Building Locations at South Portal