Magnetic resonance imaging of abnormal ventricular septal ...
Upload
independentCategory
view
1download
0
Normal Appearing and Diffusely Abnormal White Matterin Patients with Multiple Sclerosis Assessed withQuantitative MRJanne West1,2*, Anne Aalto2,4, Anders Tisell1,2, Olof Dahlqvist Leinhard1,2, Anne-Marie Landtblom2,3,
Orjan Smedby2,5, Peter Lundberg1,2,4
1 Radiation Physics, Department of Medicine and Health, Linkoping University, Linkoping, Sweden, 2 Center for Medical Image Science and Visualization, Linkoping
University, Linkoping, Sweden, 3 Department of Neurology, Linkoping University, and Neurology, UHL and LiM County Council of Ostergotland, Linkoping, Sweden,
4 Radiological Sciences, Department of Medicine and Health, Linkoping University, Department of Radiation Physics, UHL County Council of Ostergotland, Linkoping,
Sweden, 5 Radiology, Department of Medicine and Health, Linkoping University, Department of Radiology, UHL County Council of Ostergotland, Linkoping, Sweden
Abstract
Introduction: Magnetic Resonance Imaging is a sensitive technique for detecting white matter (WM) MS lesions, but therelation with clinical disability is low. Because of this, changes in both ‘normal appearing white matter’ (NAWM) and‘diffusely abnormal white matter’ (DAWM) have been of interest in recent years. MR techniques, including quantitativemagnetic resonance imaging (qMRI) and quantitative magnetic resonance spectroscopy (qMRS), have been developed inorder to detect and quantify such changes. In this study, qMRI and qMRS were used to investigate NAWM and DAWM intypical MS patients and in MS patients with low number of WM lesions. Patient data were compared to ‘normal whitematter’ (NWM) in healthy controls. Methods: QMRI and qMRS measurements were performed on a 1.5 T Philips MR-scanner.35 patients with clinically definite MS and 20 healthy controls were included. Twenty of the patients fulfilled the ‘Barkhof-Tintore criteria’ for MS, (‘MRIpos’), whereas 15 showed radiologically atypical findings with few WM lesions (‘MRIneg’). QMRIproperties were determined in ROIs of NAWM, DAWM and lesions in the MS groups and of NWM in controls. Descriptivestatistical analysis and comparisons were performed. Correlations were calculated between qMRI measurements and (1)clinical parameters and (2) WM metabolite concentrations. Regression analyses were performed with brain parenchymafraction and MSSS. Results: NAWM in the MRIneg group was significantly different from NAWM in the MRIpos group andNWM. In addition, R1 and R2 of NAWM in the MRIpos group correlated negatively with EDSS and MSSS. DAWM wassignificantly different from NWM, but similar in the MS groups. N-acetyl aspartate correlated negatively with R1 and R2 inMRIneg. R2 of DAWM was associated with BPF. Conclusions: Changes in NAWM and DAWM are independent pathologicalentities in the disease. The correlation between qMRI and clinical status may shed new light on the clinicoradiologicalparadox.
Citation: West J, Aalto A, Tisell A, Leinhard OD, Landtblom A-M, et al. (2014) Normal Appearing and Diffusely Abnormal White Matter in Patients with MultipleSclerosis Assessed with Quantitative MR. PLoS ONE 9(4): e95161. doi:10.1371/journal.pone.0095161
Editor: Pablo Villoslada, Institute Biomedical Research August Pi Sunyer (IDIBAPS) - Hospital Clinic of Barcelona, Spain
Received November 1, 2013; Accepted March 24, 2014; Published April 18, 2014
Copyright: � 2014 West et al. This is an open-access article distributed under the terms of the Creative Commons Attribution License, which permitsunrestricted use, distribution, and reproduction in any medium, provided the original author and source are credited.
Funding: This study was supported by grants from The National Research Council (VR/NT) and the County Council of Ostergotland (ALF). The funders had no rolein study design, data collection and analysis, decision to publish, or preparation of the manuscript.
Competing Interests: The authors have declared that no competing interests exist.
* E-mail: [email protected]
Introduction
Multiple Sclerosis (MS) is often described as a chronic,
inflammatory, demyelinating disease of the central nervous system.
Magnetic Resonance Imaging (MRI) is a sensitive imaging
technique for detecting MS lesions in vivo, and conventional
T2-weighted imaging is widely used to monitor and diagnose MS
[1]. However, the correlation between focal white matter (WM)
lesions and clinical disability is only modest, a phenomenon which
has persisted for many years and is referred to as the
clinicoradiological paradox [2]. One of the factors thought to explain
this discrepancy is individual variations in brain plasticity and
cortical reorganization, which may limit the clinical disability
caused by focal lesions [3,4,5]. Because of this, interest in other
pathological tissue changes, beside WM lesions, has been of
interest in recent years. These include changes in cortical grey
matter [6,7], deep grey matter structures [8], and changes in
normal appearing white matter (NAWM) [9,10,11,12]. However,
mechanisms leading to persistent disability in MS remain unclear.
In addition to WM lesions and NAWM, diffuse abnormal signal
intensity changes are often seen on conventional T2-weighted
images, but these are mostly unaccounted for in the radiological
criteria for MS [13]. These regions, which have fuzzy borders and
signal intensity that is slightly higher than NAWM, but lower than
WM lesions, have been referred to as ‘diffusely abnormal white
matter’ or alternatively ‘dirty-appearing white matter’ (DAWM)
[14,15,16,17,18]. Several studies have suggested that DAWM may
be a separate pathological entity from NAWM and focal WM
lesions [15,17,18]. DAWM has been suggested to be a chronic
process due to Wallerian degeneration, secondary to focal WM
lesions [16], and this is consistent with histological findings
[19,20].
PLOS ONE | www.plosone.org 1 April 2014 | Volume 9 | Issue 4 | e95161

Regions of DAWM are difficult to characterize using standard
T2-weighted imaging because of their diffuse nature, and NAWM
in MS patients is identical to the normal white matter (NWM) in
healthy subjects. Recent studies, however, emphasize the impor-
tance of these diffuse changes as they may be important markers of
disease progression [17,18]. Technological developments and
advanced MR techniques have therefore been suggested for
characterizing and quantifying DAWM, as well as for detecting
changes in NAWM. These approaches include ‘diffusion tensor
imaging’ (DTI) [17,18,21], ‘quantitative magnetization transfer
imaging’ (qMTI) [15,18], ‘quantitative magnetic resonance
imaging’ (qMRI) [17,18,22], and ‘quantitative magnetic resonance
spectroscopy’ (qMRS) [23,24].
QMRI are techniques to obtain the absolute magnetic
properties of tissue water, such as the effective longitudinal (T1)
and transversal (T2) relaxation times, or their inverses R1 and R2,
and the proton density (PD). The determination of these properties
using qMRI is in principle insensitive to both MR-scanner
hardware and MRI acquisition protocol.
In MS pathology it has been shown that increased water T1 and
T2 times (decreased R1 and R2) are linked to increased water
contents, caused by oedema, as well as increased extracellular
spaces, caused by axonal loss and demyelination [16,17,25,26].
However, in MS lesions a wide range of T1 and T2 values have
been reported, probably a consequence of large individual
variability in lesion pathology [27,28]. Several studies on MS also
reported elevated T1 values within NAWM (a global shift affecting
all WM) [29,30,31]. In addition, Seewann et al. showed that both
T1 and T2 times are also prolonged in DAWM, an observation
that is consistent with axonal loss, decreased myelin density and
gliosis [17]. In particular in their excellent histopathological post-
mortem study they found that DAWM appears to be a chronic
process involving the development of an axonal pathology that is
different from both NAWM and focal WM lesions, with more
pronounced microglial activation than NAWM and absence of
acute axonal pathology as is found in lesions. Moreover, Vrenken
et al. showed that T1 times in DAWM differed between primary-
progressive (PP) and secondary-progressive (SP) MS patients [18]
and that qMRI characteristics of NAWM changed with distance to
focal WM lesions [32]. In combination, these findings suggest that
the sensitivity of qMRI may be higher than conventional imaging,
and thus of value for describing diffuse pathology. Moreover,
qMRI may also be used for calculating ‘brain parenchyma
fraction’ (BPF) [33] which has previously been used as a reliable
assessment of brain atrophy in MS [34,35].
In a minority of MS patients, no focal WM lesions at all, or very
few lesions, are detected using conventional MRI, also after a long
time of disease. These are atypical MS patients that constitute an
interesting model for investigating MS pathology in NAWM and
DAWM. Our research has taken a particular interest in
subgrouping MS patients with atypical features, for example this
group of MRI negative MS patients [23,36]. Results have shown
increased concentrations of glutamate and glutamine (tGlx) in
NAWM of both patients with no radiologically visible lesions
(‘MRIneg’) and the typical MS patients (‘MRIpos’) compared to
healthy controls. Moreover, the MRIpos group showed increased
myo-Inositol (mIns) concentrations and decreased total N-acetyl
aspartate (tNA) concentration in NAWM compared to both the
MRIneg and healthy controls. In contrast, the MRIneg group did
not show any significant difference in mIns and tNA concentra-
tions compared to the healthy controls.
In the present prospective study, four research questions were
addressed: (1) Are there any differences in NAWM and DAWM
between MS patients with atypical low-lesion MRI examinations
and MS patients with typical WM lesions, and are there
differences between any of these two groups and healthy controls?
(2) Are NAWM metabolite concentrations correlated with qMRI
measurements of NAWM? (3) Is whole brain atrophy related to
the qMRI properties of NAWM and DAWM? (4) Is the severity of
the MS disease, assessed by ‘Multiple Sclerosis Severity Score’
(MSSS) [37], associated with qMRI measurements of NAWM and
DAWM?
Materials and Methods
SubjectsA total of 35 clinically definite (CDMS) patients and 20 healthy
subjects were included in the investigations. (i) Fifteen MS patients
with two or fewer T2-hyperintense WM lesions, on a previous
clinical examination, were prospectively included in the low-lesion
MS group (‘MRIneg’), (ii) 20 MS patients fulfilling the ‘Barkhof-
Tintore criteria’ as defined in [13] were included in the MS group
with typical WM lesions (‘MRIpos’), and (iii) 20 healthy control
subjects were included in the control group (see Table 1). All
patients, in both MS groups, fulfilled the Poser criteria: with at
least two relapses, separated in space and time [38]. All patients
had been confirmed positive for oligoclonal bands in the CSF. The
study was approved by The Regional Ethics Committee in
Linkoping (Dnr: M88-07 T93-08), and written informed consent
was obtained from all subjects before study entry.
Magnetic Resonance MeasurementsMeasurements were performed using a 1.5 T Philips Achieva
MR-scanner (Philips Healthcare, Best, The Netherlands) using an
eight-channel phase array head coil. The qMRI protocol was part
of a more extensive investigation including clinical imaging
sequences, as well as qMRS measurements.
QMRI: The multi-slice, multi-echo and multi-saturation delay
qMRI method QMAP (also known as QRAPMASTER) was used
[22]. For each examination 30 slices were acquired with the qMRI
sequence (4.060.860.8 mm3). The QMAP sequence allowed
simultaneous quantification of R1 and R2, PD and the local B1
field in a clinically acceptable scanning time. QMAP consists of an
interleaved saturation pulse and a Carr-Purcell-Meiboom-Gill
sequence (CPMG) acquisition. The saturation, with flip angle
h= 120u, acts on slice n, whereas the subsequent acquisition acts
on a different slice, m. By introducing a shift between slice n and
slice m, a delay was created between the saturation and the
acquisition of each particular slice. The sequence was repeated
four times, with the shift between n and m set to 1, 4, 14 and 29.
Using 30 slices and TR of 3000 ms, these shifts resulted in
saturation delay times (TD) of 100, 400, 1400 and 2900 ms. Each
acquisition contained five echoes at TE of 14 ms multiples. The
excitation pulse, a, had a flip angle of 90u (X) followed by 180u (Y)
refocusing pulses. The refocusing pulses were followed by spoiler
gradients. The qMRI sequence resulted in 20 images for each
slice; with five echoes for each of the four saturation delays. To
accelerate the acquisition, Echo Planar Imaging (EPI) was applied
for each echo, using an EPI factor of 3 (gradient spin echo
acquisition, GraSE). The R1, R2 and PD maps were retrieved
from the raw data using the SyMRI Diagnostics (0.9.3) software
(SyntheticMR AB, Sweden, 2011). Sample qMRI maps from a 45-
years-old female MRIpos MS patient are provided in Fig. 1.
Furthermore, the BPF of each subject was calculated from the
qMRI maps, using the approach described in Ref. [33]. This
method was based on a partial volume model where brain tissue
fractions were estimated from the R1, R2 and PD values. This
calculation was also carried out in the SyMRI software.
qMRI in MS
PLOS ONE | www.plosone.org 2 April 2014 | Volume 9 | Issue 4 | e95161
QMRS: Two MRS VOIs were placed bi-laterally in NAWM.
The MRS signal was measured using the point-resolved spectros-
copy sequence (PRESS), TE = 30 ms, TR = 3 s and 128 transients
were averaged. Absolute aqueous fraction concentrations of
creatine (tCr-Aq), myo-Inositol (mIns-Aq), glutamate and gluta-
mine (tGlx-Aq) and N-acetyl aspartate (tNA-Aq) were calculated
using the procedure described in [24]. Typical MRS VOI
placements are shown in Fig. 2. The results of the qMRS
measurements was reported in [23] and in this work only
correlations to qMRI were considered.
ROI for Quantitative MR Imaging AnalysisIn order to measure brain qMRI values for the different tissue
types, standardised ‘Regions of Interest’ (ROIs) were positioned
manually in the MS patients and the healthy control group by a
radiologist (A.A.). The size of the ROIs was 363 voxels
(corresponding to 2.462.4 mm2) and they were placed on
synthetic T2-weighted images (TE = 100 ms, TR = 4.5 s), with
conventional T2-weighted images used for reference. Synthetic
T2-weighted images were generated from the quantitative data
using SyMRI Diagnostics (0.9.3), as described elsewhere [22].
Synthetic T2-weighted images were generated from the same data
as the qMRI parameter maps and therefore perfectly registered,
removing the need for additional data registration.
In healthy controls, two ROIs were placed in frontal and in
parietal NWM in the centrum semiovale (both left and right).
Similarly, in MS patients two ROIs were placed in NAWM (left
and right), frontally and parietally in the centrum semiovale,
making sure that no DAWM or WM lesions were included. Two
ROIs were also placed in areas of DAWM, and an additional two
ROIs were placed in focal WM lesions, whenever present. The
radiological DAWM definition was adapted from [17] and it was
defined as a diffuse uniform, non-focal area in the white matter,
preferentially periventricular and of increased signal intensity in
the T2-weighted image. Compared with the signal intensity of
WM lesions, DAWM was observed as subtly, but distinctly
increased signal intensity. The DAWM signal intensity decreased
towards the border to NAWM, leading to a relatively poorly
defined border of DAWM areas, compared to focal WM lesions.
Typical ROI placements are shown in Fig. 3. For each of these
ROIs, the mean R1, R2 and PD quantitative measurements were
obtained.
In addition, the mean qMRI R1, R2 and PD values were also
obtained from the MRS VOIs.
Table 1. Subjects.
Controls MRIpos MRIneg
Number of subjects 20 20 15
Age, [median (min-max)] 48 (27–72) 46 (20–66) 57 (32–69)
Sex [M/F] 5/15 6/14 1/14
MS type [RR/SP/PP] N/A 12/7/1 10/3/2
EDSS [Median (min–max)] N/A 3.25 (1.0–8.5) 2.50 (0.0–6.5)
MSSS [Median (min–max)] N/A 3.74 (0.45–9.57) 3.65 (0.05–9.38)
Disease duration year [Median (min–max)] N/A 13 (2–35) 16 (2–44)
Number of MS lesions [Median (min–max)] N/A 16 (3–30) 1 (0–20){{{
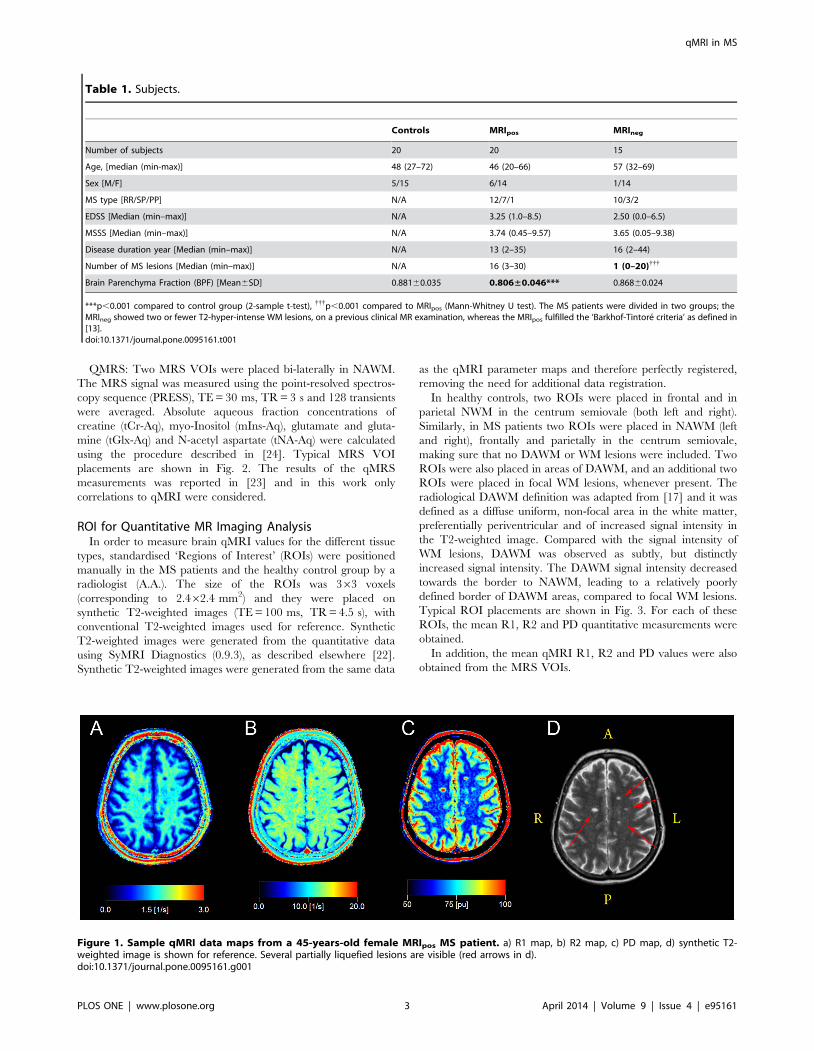
Brain Parenchyma Fraction (BPF) [Mean6SD] 0.88160.035 0.806±0.046*** 0.86860.024
***p,0.001 compared to control group (2-sample t-test), {{{p,0.001 compared to MRIpos (Mann-Whitney U test). The MS patients were divided in two groups; theMRIneg showed two or fewer T2-hyper-intense WM lesions, on a previous clinical MR examination, whereas the MRIpos fulfilled the ‘Barkhof-Tintore criteria’ as defined in[13].doi:10.1371/journal.pone.0095161.t001
Figure 1. Sample qMRI data maps from a 45-years-old female MRIpos MS patient. a) R1 map, b) R2 map, c) PD map, d) synthetic T2-weighted image is shown for reference. Several partially liquefied lesions are visible (red arrows in d).doi:10.1371/journal.pone.0095161.g001
qMRI in MS
PLOS ONE | www.plosone.org 3 April 2014 | Volume 9 | Issue 4 | e95161

Statistical AnalysisThree different sets of statistical tests were performed using
SPSS 21 (SPSS Inc., Chicago, USA). First; descriptive statistics
were calculated for qMRI measurements of all tissue types, in all
subject groups, and comparisons were also performed using two
separate general linear models (GLM1 and GLM2), with ‘subject’
and ‘ROI’ treated as a random effects. In GLM1, the tissue types
NAWM, DAWM and WM lesions were compared to NWM in
healthy subjects. This was done for each of the two MS groups
separately. In GLM2, comparisons were performed between the
same tissue types in the two different MS groups (e.g. NAWM in
MRIneg compared to NAWM in MRIpos).
Second, correlations were calculated between qMRI measure-
ments in NAWM and DAWM, and the clinical parameters
(number of lesions, EDSS, MSSS, disease duration, age and BPF).
Correlations between qMRI measurements in NAWM and
previously reported WM metabolite concentrations in the same
subjects (previously reported in [23]) were calculated. In these
subjects the mean qMRI values measured inside the MRS VOIs
were also correlated with the qMRS measurements of the same
VOIs. Pearson correlations were initially used for all variables and
Spearman correlations were subsequently used for EDSS and
MSSS scores, if significant, to verify findings.
Finally, regression analyses were performed with both MS
groups pooled to assess the association between qMRI measure-
ments and BPF, as well as qMRI measurements and MSSS.
The prospective inclusion criteria for the MRIneg group were
based on a previous clinical MRI examinations, thus the MRIneg
patients could have developed lesions between their previous and
the present MRI examination. Therefore, as a control experiment,
all tests were subsequently re-evaluated, excluding patients that
had developed more than two lesions.
Results
NAWM, DAWM and WM lesions were present in all MRIpos
patients, and NAWM was present in all MRIneg patients. In
addition, DAWM was present in twelve of the MRIneg patients,
and WM lesions were found in nine of them. No WM lesions at all
were observed in six of the MRIneg patients, and DAWM was not
observed in three of the MRIneg patients.
Descriptive statistics and results of the group comparisons, both
comparing MS patients to healthy controls and also comparing
MRIneg to MRIpos, are presented in Table 2. BPF was significantly
lower in the MRIpos group than in the healthy controls, but
unaffected in the MRIneg group, see Table 1. In Fig. 4, tissue
clusters are displayed in the R1-R2-PD space, showing tissue
cluster separation and covariances on top of in vivo data. The
indicated ellipses enclose 95% of the voxels from each tissue type.
The results of correlation analyses between qMRI measurements
of all tissue types, in all groups, and clinical parameters are listed in
Table 3. Correlations of qMRI and qMRS measurements are
listed in Table 4 (qMRS measurements were reported separately
in [23] and are not repeated in this paper). Correlations between
mean qMRI values measured inside the MRS VOIs and qMRS
measurements are reported in Table 5. Finally, the associations
between qMRI tissue properties and BPF as well as MSSS are
presented in Table 6 and Table 7.
Figure 2. Typical VOI placement in MS patients.doi:10.1371/journal.pone.0095161.g002
Figure 3. Typical ROI placement in MS patients and healthy controls. a) DAWM in MRIneg, b) NAWM in MRIneg, c) DAWM in MRIpos, d) NAWMin MRIpos, e) WM lesion in MRIpos, f) NWM in a healthy control. MRIneg subject was a 43 years old female, MRIpos subject was a 66 years old female andhealthy subject was a 42 years old female.doi:10.1371/journal.pone.0095161.g003
qMRI in MS
PLOS ONE | www.plosone.org 4 April 2014 | Volume 9 | Issue 4 | e95161

Normal Appearing White MatterNAWM ROIs could be placed parietally in the centrum
semiovale, similarly as placements of NWM ROIs in the healthy
subjects.
Statistical analysis revealed that NAWM in the MRIneg group
had significantly lower R1 and higher PD than NWM in the
healthy subjects. Moreover, NAWM in the MRIneg group had
significantly higher PD than in the MRIpos group. NAWM in the
MRIpos group, on the other hand, was not significantly different
from NWM (for details, see Table 2).
No correlations between qMRI properties of NAWM and
Figure 4. Tissue clusters and in vivo data, in the 3D feature space formed by R1-R2-PD, projected on a,d) R1-R2, b,e) R1-PD and c,f)R2-PD planes. Figures a-c shows NAWM, DAWM and NAWM, figures d-f shows NWM and WM lesions. Cluster ellipses indicates the calculatedcovariance’s of each tissue type separately, red ellipses correspond to the MRIneg group, blue ellipses correspond to the MRIpos group, and the dashedblack ellipses correspond to the NWM tissue cluster in healthy controls. The indicated ellipses enclose 95% of the in vivo data.doi:10.1371/journal.pone.0095161.g004
Table 2. Descriptive statistics (mean 6 SD) and groupcomparisons for tissue types, in all groups.
n R1 [s21] R2 [s21] PD [%]
HC
NWM 20 1.6560.10 12.8760.66 65.8361.66
MRIpos
NAWM 20 1.6160.13 12.7461.01 66.6063.04
DAWM 20 1.2260.19*** 8.8061.30*** 76.9165.08***
Lesion 20 1.0960.11*** 7.9760.91*** 82.1663.78***
MRIneg
NAWM 14 1.5760.10* 12.6460.66 68.5962.23***{
DAWM 12 1.2560.15*** 9.2460.70*** 75.6364.21***
Lesion 9 1.1860.11*** 9.4660.82***{{{ 78.6963.36***{
Stars indicate p-levels of comparisons to NWM in healthy controls and crossesindicate p-levels of comparisons of the same tissue type in MRpos- and MRIneg
groups.*p,0.05 compared to NWM, **p,0.01 compared to NWM, ***p,0.001compared to NWM. {p,0.05 compared to same tissue type in MRIpos, {{p,0.01compared to same tissue type in MRIpos,
{{{p,0.001 compared to same tissuetype in MRIpos.doi:10.1371/journal.pone.0095161.t002
Table 3. Pearson correlations between qMRI properties andclinical parameters.
# Lesions EDSS MSSS DD Age BPF
HC
NWM R1 - - - - 0.023 0.150
R2 - - - - 0.392 20.331
PD - - - - 0.139 20.316
MRIpos
NAWM R1 0.108 20.483* 20.508* 20.135 20.140 0.399
R2 20.273 20.550* 20.550* 20.128 0.126 0.187
PD 20.313 0.191 0.234 20.028 0.118 20.357
DAWM R1 20.049 0.025 0.222 20.190 20.233 0.166
R2 20.192 0.005 0.238 20.253 20.400 0.292
PD 20.003 20.134 20.281 0.132 0.121 20.145
MRIneg
NAWM R1 20.286 0.285 0.258 0.025 20.279 20.074
R2 0.092 0.352 0.103 0.325 0.375 20.504
PD 0.179 20.161 20.097 20.034 0.307 20.107
DAWM R1 0.231 0.372 0.409 20.303 20.554 0.213
R2 0.121 0.334 0.446 20.471 20.656* 0.326
PD 20.075 20.291 20.276 0.121 0.429 -0.115
*p,0.05, **p,0.01, ***p,0.001.doi:10.1371/journal.pone.0095161.t003
qMRI in MS
PLOS ONE | www.plosone.org 5 April 2014 | Volume 9 | Issue 4 | e95161

clinical parameters were observed in the MRIneg group. In
contrast, R1 and R2 in the MRIpos group were negatively
correlated to EDSS and MSSS, and these correlations were
confirmed when the Spearman correlations were calculated (for
details, see Table 3). Furthermore, a significant positive correlation
between R1 of NAWM in MRIpos and tCho-Aq concentration was
also observed (for details, see Table 4). Correlation analysis of
qMRI measurements and qMRS measurements inside the MRS
VOIs revealed statistically significant negative correlations be-
tween R1 and R2 of NAWM in the MRIneg group, and tNA-Aq
concentration. In contrast, such correlations were not observed in
the MRIpos group. Positive correlations were also obtained
between R1 of NAWM in MRIpos and tCho-Aq concentration.
Finally, a positive correlation was detected between R2 of NWM
and mIns-Aq, and a negative correlation was detected between PD
of NWM and mIns-Aq.
Regression analyses revealed no associations between any
qMRI properties of NAWM and BPF or MSSS, when both MS
groups were pooled (for details, see Table 6 and Table 7).
Diffusely Abnormal White MatterDAWM was mostly detected in periventricular WM, and only
rarely in the centrum semiovale. DAWM was observed in
proximity to focal WM lesions, but also found in isolation in
areas with no visible WM lesions. It was particularly notable that
DAWM was detected in the majority of the MRIneg patients with
very few or no focal WM lesions. Such DAWM usually extended
over large areas, and the border with NAWM was not clearly
distinguishable. DAWM ROIs could be placed in the bulk
DAWM areas avoiding the borders with NAWM, as has been
suggested by Seewann et al. [17].
Statistical analysis revealed that DAWM was significantly
different from NWM in both MS groups for all qMRI
measurements. No statistically significant difference in DAWM
was detected between the two MS groups (for details, see Table 2).
When correlating qMRI properties of DAWM with clinical
parameters a significant negative correlation was found between
R2 of DAWM in the MRIneg group and age. No other significant
correlations were detected (for details, see Table 3).
Regression analyses revealed an association between R2 of
DAWM and BPF. No similar association was observed between
qMRI properties of DAWM and MSSS (for details, see Table 6
and Table 7).
Re-evaluation of MRInegSeven patients in the MRIneg group had developed more than
two WM lesions on their present MR examination; therefore all
analyses were subsequently re-evaluated, excluding these patients.
The time from disease onset to the last MRI-negative scan of these
patients was 10611 years (range 1–36), indicating an atypical
period of lesion formation for these subjects.
When the MRIneg group was re-evaluated no differences
between the two MS groups reached statistical significance, and
the correlation between R2 of DAWM in the MRIneg group with
age diminished. This was probably caused by the low number of
remaning subjects. However, since the original MRIneg group
showed statistically significant differences in qMRI properties, this
indicates that the MRIneg group was nevertheless a subgroup
suitable to examine MS with atypically low number of focal WM
lesions.
Table 4. Correlations between qMRI properties of NAWM andNWM, in all groups, and qMRS metabolite concentrations.
tGlx-Aq tNA-Aq tCr-Aq mIns-Aq tCho-Aq
HC
NWM R1 20.161 20.346 20.018 0.039 0.195
R2 20.301 20.280 20.106 0.042 0.254
PD 0.032 0.205 20.061 0.112 20.219
MRIpos
NAWM R1 20.220 20.002 20.197 0.231 0.446*
R2 20.370 20.049 20.229 0.433 0.358
PD 0.019 20.028 0.013 20.059 20.219
MRIneg
NAWM R1 0.113 20.334 20.234 0.069 20.481
R2 0.257 20.279 0.354 0.428 20.042
PD 20.241 0.362 0.454 0.133 0.469
*p,0.05, **p,0.01, ***p,0.001.doi:10.1371/journal.pone.0095161.t004
Table 5. Correlations between mean qMRI parameter valueswithin the larger qMRS VOIs of NAWM and NWM and qMRSmetabolite concentrations measured in the same VOIs.
tGlx-Aq tNA-Aq tCr-Aq mIns-Aq tCho-Aq
HC
NWM R1 0.259 0.312 20.237 20.444 0.353
R2 0.150 20.186 20.224 20.474* 0.244
PD 20.291 0.344 0.320 0.446* 20.354
MRIpos
NAWM R1 20.351 20.281 20.208 0.136 0.453*
R2 20.441 20.232 20.245 0.280 0.260
PD 0.427 0.107 0.253 20.078 20.327
MRIneg
NAWM R1 0.203 20.520* 20.286 20.019 0.007
R2 0.008 20.540* 20.261 20.166 0.220
PD 20.172 0.442 0.249 0.077 20.014
*p,0.05, **p,0.01, ***p,0.001.doi:10.1371/journal.pone.0095161.t005
Table 6. Association between qMRI measurements and brainparenchyma fraction (BPF).
b SE p
NAWM R1 0.378 (0.200) 0.068
R2 20.023 (0.016) 0.148
PD 0.012 (0.007) 0.102
DAWM R1 20.168 (0.132) 0.213
R2 0.038 (0.016) * 0.027
PD 0 (0.004) 0.970
*p,0.05.doi:10.1371/journal.pone.0095161.t006
qMRI in MS
PLOS ONE | www.plosone.org 6 April 2014 | Volume 9 | Issue 4 | e95161
Discussion
We used quantitative magnetic resonance imaging (qMRI) to
gain insights on diffuse white matter (WM) changes in two groups
of clinically definite (CDMS) patients. One of the MS groups
(‘MRIneg’) showed very few focal WM lesions in a previous clinical
examination, and this group was useful for investigating WM in
the absence of focal lesions. The pathological hypotheses presented
by Lassman et.al. [39], that include the classification into several
subgroups with differing pathogenesis on the cellular level, may
have some bearing on such an atypical MS presentation. In this
group of patients the clinical investigation must be extraordinarily
thorough before a diagnosis of clinically definite (CDMS) can be
made, also concerning the radiological investigation [40].
We included normal appearing white matter (NAWM), diffusely
abnormal white matter (DAWM), and focal WM lesions in the
investigations. Comparisons were performed both between
MRIneg and typical MS patients with focal lesions, (‘MRIpos’), as
well as with healthy controls. Furthermore, correlation analyses
were performed between qMRI measurements and a range of
clinical parameters, as well as metabolite concentrations in
NAWM, measured using quantitative magnetic resonance spec-
troscopy (qMRS), reported previously in [23]. Finally, regression
analyses were performed to determine the associations between
qMRI measurements and BPF as well as MSSS.
Several of the MRIneg subjects had developed WM lesions
between the clinical examination and the present examination.
Even so, these patients were different from the typical MS patients,
who exhibited focal lesions early on in the disease. This is
supported by the differences found between the MRIneg patients
and the typical MS patients. The late presentation of focal lesions
rather supported the initial diagnosis of atypical MS.
The qMRI sequence used in this study was optimised to
accommodate clinical requirements, in particular regarding the
examination time, as well as to simultaneously quantify the three
quantitative properties R1, R2 and PD. In order to achieve the
short examination time, the speed-up techniques echo planar
imaging (EPI) and gradient spin echo (GraSE) were used. This
may have lead to some blurring in the R2 maps. Furthermore, off-
resonance effects of the saturation pulse may have affected the
signal attenuation due to magnetisation transfer. This effect,
however, would be systematic and affect all subject groups in
similar ways. The slice profiles were accounted for in the
parameter estimation by inclusion of a spin model, this was
described in detail in [22].
Normal Appearing White MatterChanges found in NAWM have previously been attributed to
axonal disruption through microglia activation [41], but also to
decreased axonal density [19]. In the present study we did not
observe any significant difference between NAWM in MRIpos and
NWM in healthy controls, but NAWM in the low-lesion MRIneg
group was characterized both by significantly higher PD and lower
R1 than in normal subjects.
In the MRIpos group it was found that R1 and R2 of NAWM
were correlated with EDSS and MSSS. This correlation was not
observed in the MRIneg group. Moreover, no association was
found between qMRI measurements of NAWM and BPF or
MSSS in the regression analysis, when both MS groups were
pooled. Conversely, in the previous qMRS study of these subjects,
reported in [23], negative correlations were observed between tCr-
Aq concentration as well as mIns-Aq concentration and BPF. Also,
a positive correlation was then observed between tGlx-Aq
concentration and MSSS.
One explanation may be that changes in R1 and R2 as well as
changes in BPF indicate different aspects of brain atrophy.
However, the relation between tCr-Aq and mIns-Aq with BPF in
all subjects may reflect a general atrophy process that is caused by
both ageing and MS pathology.
QMRI measurements of NAWM did not show any association
with MSSS, whereas our previous qMRS measurements of tGlx-
Aq concentration in NAWM did. This suggests that there are
pathological processes in NAWM, which could not be detected
with qMRI.
A positive correlation was found between the tCho-Aq
concentration of NAWM and R1 in MRIpos patients. Since tCho
has previously been shown to be a marker for membrane turnover
[42] this suggests that R1 may be related to this process.
Furthermore, the mIns-Aq concentration of NWM correlated
negatively with R2 and PD in the healthy control group. This
could be due to an effect of age [24].
The MRS VOIs were large compared to the qMRI ROIs, and
mean qMRI values were also measured inside these volumes, and
subsequently correlated with qMRS measurements in the same
volumes. An interesting observation was that there was a negative
correlation between R1 and R2 in the MRS VOIs with tNA-Aq
concentration in the MRIneg patients. This indicates that the tNA-
Aq concentration in these VOIs actually increased as R1 and R2
decreased. Since tNA is known to be a marker of neuronal density
[43] this result suggests that there was a process of demyelination,
indicated by decreased R1 and R2, without neuronal loss in these
patients. The neuronal density of the tissue (per volume) may in
fact increase as myelin diminishes, caused by a net shrinkage of the
tissue, leading to more axons inside the VOI. The correlation was
not observed in the MRIpos patients, indicating that these patients
suffered from axonal loss as well in the NAWM. This could be
attributed to Wallerian degeneration, which is considered to be
secondary to focal WM lesions [16,19,20].
Diffusely Abnormal White MatterPreviously, changes in DAWM have been attributed mainly to
Wallerian degeneration. Seewann et al. showed in a comprehensive
histopathological study that decreased R1 and R2 in DAWM were
associated with axonal loss and decreased myelin [17]. In our
present study, DAWM was observed in both the MS group with
typical MR presentation, and in the MS group with a low number
of focal lesions. Moreover, qMRI properties of DAWM were
similar in both groups. Since DAWM was found to a large extent
also in the group with a low number of lesions this might suggest
that DAWM is not exclusively due to Wallerian degeneration, but
that it is also a process in the WM which to some extent is
independent of the precense of focal WM lesions.
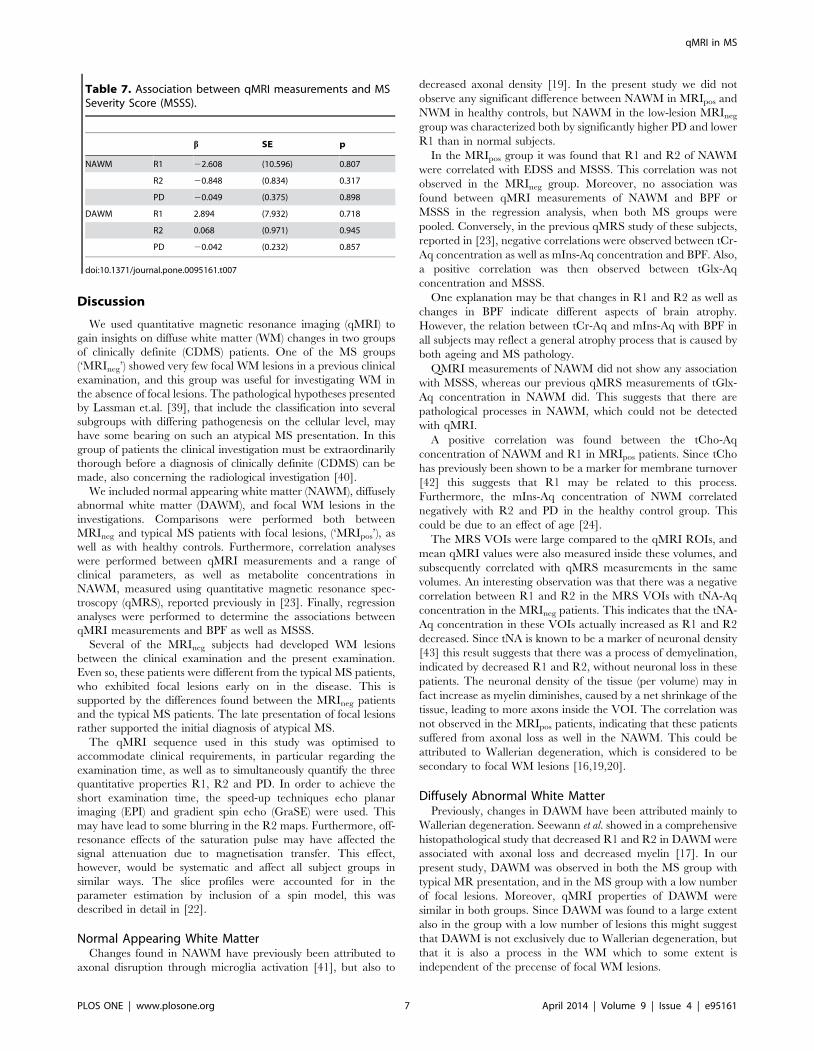
Table 7. Association between qMRI measurements and MSSeverity Score (MSSS).
b SE p
NAWM R1 22.608 (10.596) 0.807
R2 20.848 (0.834) 0.317
PD 20.049 (0.375) 0.898
DAWM R1 2.894 (7.932) 0.718
R2 0.068 (0.971) 0.945
PD 20.042 (0.232) 0.857
doi:10.1371/journal.pone.0095161.t007
qMRI in MS
PLOS ONE | www.plosone.org 7 April 2014 | Volume 9 | Issue 4 | e95161

One major result from this study was that DAWM appears to
constitute an intermediary between focal WM lesions and NAWM
for all qMRI measurements, in both groups of MS patients. This is
consistent with previous findings where Vrenken et al. showed that
DAWM was an intermediary in T1 [18]. In our view this may
reflect the relative increase of the extracellular water of the tissues,
where focal lesions have the highest increase, DAWM has a less
pronounced increase, and NAWM only has a slight increase. This
is supported by previous studies which have shown that decreased
R1 and R2 are linked to increased water contents due to increased
size of extracellular spaces, caused by a combination of axonal loss
and demyelination [16,17,25,26]. This is also consistent with the
observed increases of PD. Conversely, the WM lesions detected in
the MRIneg group was significantly different from the lesions in the
MRIpos group, the lesions in the MRIneg group seems to constitute
an intermediate between the MRIpos lesions and DAWM.
Another important finding was that DAWM was common in
both groups of MS patients. The MRIneg group had similar
disability and clinical presentations as the MRIpos group, even
though the number of WM lesions was low and the BPF was
unaffected. Furthermore, focal WM abnormalities detected in the
MRIneg group were significantly different from the WM lesions
detected in the MRIpos group. These abnormalities were more like
those in DAWM, and some of them may in fact have been small
regions of DAWM misinterpreted as focal lesions.
A correlation was observed between R2 of DAWM in the
MRIneg group and subject age, but since this finding was not
reproduced in the MRIpos group this might be a coincidental
finding. More interestingly an association was found between R2
of DAWM and BPF in the regression analysis. This may be related
to increased extracellular water caused by a global inflammation.
This should be further investigated in a longitudinal study.
Limitations of this StudyThis study was cross-sectional and as such it was not possible to
investigate changes of qMRI properties over time, nor the relation
to disease progression. Nevertheless, associations between some of
the qMRI measurements and clinical parameters as well as
metabolite concentrations were observed, and these findings
should be verified in a longitudinal study.
In total, 168 correlation coefficients were calculated; by chance
5% of these would fall out as significant (p,0.05). Therefore,
caution is warranted when interpreting the results and some of the
findings may have been caused by the effect of multiple
comparisons. The findings in this study should be investigated
and confirmed in larger population based studies.
Furthermore, other studies have highlighted the multi-expo-
nential behaviour of T2 in WM [44,45], and recently, the multi-
exponential behaviour of T1 has been reported [46]. MacKay et al.
carried out work with a 32 echo CPMG sequence in order to
directly measure the sizes of the different water compartments,
and in this way reach a surrogate measurement of myelin solids in
the tissue [45]. In the present study a fast qMRI sequence capable
of measuring a single component of R1, R2 and PD in the same
scan was applied. Although this sequence measured all three
properties in the same scan, only one component for R1 and R2
was measured. In this way the different compartments were
averaged together and it was not possible to establish whether
decreased R1 and R2 rates were due to loss of myelin, increased
intra/extra-cellular water, or inflammation.
Conclusions
A major finding of this study was that DAWM appears to
constitute an intermediate between focal WM lesions and NAWM
in terms of qMRI properties. Remarkably, the MRIneg group
exhibited similar amounts of DAWM as the MRIpos group, with
similar qMRI characteristics. This was the case even though WM
lesions were not common and BPF was unaffected in the MRIneg
group. Furthermore, qMRI measurements on NAWM in the
MRIneg group were correlated to qMRS measurements of tNA-Aq
concentration, suggesting that these patients suffered demyelin-
ation without axonal loss. The results suggest that changes in
NAWM and DAWM can be caused by pathological processes,
and are not only due to Wallerian degeneration and focal WM
lesions. QMRI measurements of NAWM and DAWM may
provide important markers for the disease status. In particular, the
correlation between qMRI properties and EDSS as well as MSSS
may shed some new light on the clinicoradiological paradox,
although these results should be interpreted with caution due to
the limited number of patients.
Acknowledgments
The clinical staff at CMIV is acknowledged for helping with MR
examinations. Dr. Johan Mellergard is acknowledged for valuable
discussions regarding MS pathology and R.N. Gunn Johansson is
acknowledged for obtaining clinical parameters for the MS patients from
the Swedish MS registry.
Author Contributions
Conceived and designed the experiments: JW AA AT ODL AML OS PL.
Performed the experiments: JW AA AT. Analyzed the data: JW AA AT.
Wrote the paper: JW AA AT ODL AML OS PL.
References
1. Paty DW, Oger JJ, Kastrukoff LF, Hashimoto SA, Hooge JP, et al. (1988) MRI
in the diagnosis of MS: a prospective study with comparison of clinical
evaluation, evoked potentials, oligoclonal banding, and CT. Neurology 38: 180–
185.
2. Barkhof F (2002) The clinico-radiological paradox in multiple sclerosis revisited.
Curr Opin Neurol 15: 239–245.
3. Harirchian MH, Rezvanizadeh A, Fakhri M, Oghabian MA, Ghoreishi A, et al.
(2010) Non-invasive brain mapping of motor-related areas of four limbs in
patients with clinically isolated syndrome compared to healthy normal controls.
J Clin Neurosci 17: 736–741.
4. Rocca MA, Colombo B, Falini A, Ghezzi A, Martinelli V, et al. (2005) Cortical
adaptation in patients with MS: a cross-sectional functional MRI study of disease
phenotypes. Lancet Neurol 4: 618–626.
5. Audoin B, Guye M, Reuter F, Au Duong MV, Confort-Gouny S, et al. (2007)
Structure of WM bundles constituting the working memory system in early
multiple sclerosis: a quantitative DTI tractography study. Neuroimage 36: 1324–
1330.
6. Kidd D, Barkhof F, McConnell R, Algra PR, Allen IV, et al. (1999) Cortical
lesions in multiple sclerosis. Brain 122 (Pt 1): 17–26.
7. Kutzelnigg A, Lucchinetti CF, Stadelmann C, Bruck W, Rauschka H, et al.
(2005) Cortical demyelination and diffuse white matter injury in multiple
sclerosis. Brain 128: 2705–2712.
8. Vercellino M, Masera S, Lorenzatti M, Condello C, Merola A, et al. (2009)
Demyelination, inflammation, and neurodegeneration in multiple sclerosis deep
gray matter. J Neuropathol Exp Neurol 68: 489–502.
9. Allen IV, McQuaid S, Mirakhur M, Nevin G (2001) Pathological abnormalities
in the normal-appearing white matter in multiple sclerosis. Neurol Sci 22: 141–
144.
10. Bjartmar C, Kinkel RP, Kidd G, Rudick RA, Trapp BD (2001) Axonal loss in
normal-appearing white matter in a patient with acute MS. Neurology 57:
1248–1252.
11. Vrenken H, Geurts JJ, Knol DL, van Dijk LN, Dattola V, et al. (2006) Whole-
brain T1 mapping in multiple sclerosis: global changes of normal-appearing gray
and white matter. Radiology 240: 811–820.
12. Moll NM, Rietsch AM, Thomas S, Ransohoff AJ, Lee JC, et al. (2011) Multiple
sclerosis normal-appearing white matter: pathology-imaging correlations. Ann
Neurol 70: 764–773.
qMRI in MS
PLOS ONE | www.plosone.org 8 April 2014 | Volume 9 | Issue 4 | e95161
13. McDonald WI, Compston A, Edan G, Goodkin D, Hartung HP, et al. (2001)
Recommended diagnostic criteria for multiple sclerosis: guidelines from theInternational Panel on the diagnosis of multiple sclerosis. Ann Neurol 50: 121–
127.
14. Chen SC, Chung HW, Liou M (2003) Measurement of volumetric lesion load inmultiple sclerosis: moving from normal- to dirty-appearing white matter. AJNR
Am J Neuroradiol 24: 1929–1930.15. Ge Y, Grossman RI, Babb JS, He J, Mannon LJ (2003) Dirty-appearing white
matter in multiple sclerosis: volumetric MR imaging and magnetization transfer
ratio histogram analysis. AJNR Am J Neuroradiol 24: 1935–1940.16. Moore GR, Laule C, Mackay A, Leung E, Li DK, et al. (2008) Dirty-appearing
white matter in multiple sclerosis: preliminary observations of myelinphospholipid and axonal loss. J Neurol 255: 1802–1811, discussion 1812.
17. Seewann A, Vrenken H, van der Valk P, Blezer EL, Knol DL, et al. (2009)Diffusely abnormal white matter in chronic multiple sclerosis: imaging and
histopathologic analysis. Arch Neurol 66: 601–609.
18. Vrenken H, Seewann A, Knol DL, Polman CH, Barkhof F, et al. (2010)Diffusely abnormal white matter in progressive multiple sclerosis: in vivo
quantitative MR imaging characterization and comparison between diseasetypes. AJNR Am J Neuroradiol 31: 541–548.
19. Evangelou N, Esiri MM, Smith S, Palace J, Matthews PM (2000) Quantitative
pathological evidence for axonal loss in normal appearing white matter inmultiple sclerosis. Ann Neurol 47: 391–395.
20. Evangelou N, Konz D, Esiri MM, Smith S, Palace J, et al. (2000) Regionalaxonal loss in the corpus callosum correlates with cerebral white matter lesion
volume and distribution in multiple sclerosis. Brain 123 (Pt 9): 1845–1849.21. Filippi M, Cercignani M, Inglese M, Horsfield MA, Comi G (2001) Diffusion
tensor magnetic resonance imaging in multiple sclerosis. Neurology 56: 304–
311.22. Warntjes JB, Leinhard OD, West J, Lundberg P (2008) Rapid magnetic
resonance quantification on the brain: Optimization for clinical usage. MagnReson Med 60: 320–329.
23. Tisell A, Leinhard OD, Warntjes JB, Aalto A, Smedby O, et al. (2013) Increased
Concentrations of Glutamate and Glutamine in Normal-Appearing WhiteMatter of Patients with Multiple Sclerosis and Normal MR Imaging Brain
Scans. PLoS One 8: e61817.24. Tisell A, Leinhard OD, Warntjes JB, Lundberg P (2012) Procedure for
quantitative (1) H magnetic resonance spectroscopy and tissue characterizationof human brain tissue based on the use of quantitative magnetic resonance
imaging. Magn Reson Med.
25. Vavasour IM, Li DK, Laule C, Traboulsee AL, Moore GR, et al. (2007) Multi-parametric MR assessment of T(1) black holes in multiple sclerosis: evidence that
myelin loss is not greater in hypointense versus isointense T(1) lesions. J Neurol254: 1653–1659.
26. van Walderveen MA, Barkhof F, Pouwels PJ, van Schijndel RA, Polman CH, et
al. (1999) Neuronal damage in T1-hypointense multiple sclerosis lesionsdemonstrated in vivo using proton magnetic resonance spectroscopy. Ann
Neurol 46: 79–87.27. Larsson HB, Frederiksen J, Kjaer L, Henriksen O, Olesen J (1988) In vivo
determination of T1 and T2 in the brain of patients with severe but stablemultiple sclerosis. Magn Reson Med 7: 43–55.
28. Larsson HB, Frederiksen J, Petersen J, Nordenbo A, Zeeberg I, et al. (1989)
Assessment of demyelination, edema, and gliosis by in vivo determination of T1and T2 in the brain of patients with acute attack of multiple sclerosis. Magn
Reson Med 11: 337–348.
29. Davies GR, Hadjiprocopis A, Altmann DR, Chard DT, Griffin CM, et al. (2007)
Normal-appearing grey and white matter T1 abnormality in early relapsing-
remitting multiple sclerosis: a longitudinal study. Mult Scler 13: 169–177.
30. Stevenson VL, Parker GJ, Barker GJ, Birnie K, Tofts PS, et al. (2000) Variations
in T1 and T2 relaxation times of normal appearing white matter and lesions in
multiple sclerosis. J Neurol Sci 178: 81–87.
31. Barbosa S, Blumhardt LD, Roberts N, Lock T, Edwards RH (1994) Magnetic
resonance relaxation time mapping in multiple sclerosis: normal appearing white
matter and the "invisible" lesion load. Magn Reson Imaging 12: 33–42.
32. Vrenken H, Geurts JJ, Knol DL, Polman CH, Castelijns JA, et al. (2006)
Normal-appearing white matter changes vary with distance to lesions in multiple
sclerosis. AJNR Am J Neuroradiol 27: 2005–2011.
33. West J, Warntjes JB, Lundberg P (2012) Novel whole brain segmentation and
volume estimation using quantitative MRI. Eur Radiol 22: 998–1007.
34. Rudick RA, Fisher E, Lee JC, Simon J, Jacobs L (1999) Use of the brain
parenchymal fraction to measure whole brain atrophy in relapsing-remitting
MS. Multiple Sclerosis Collaborative Research Group. Neurology 53: 1698–
1704.
35. Vagberg M, Lindqvist T, Ambarki K, Warntjes JB, Sundstrom P, et al. (2013)
Automated determination of brain parenchymal fraction in multiple sclerosis.
AJNR Am J Neuroradiol 34: 498–504.
36. Gustafsson MC, Dahlqvist O, Jaworski J, Lundberg P, Landtblom AM (2007)
Low choline concentrations in normal-appearing white matter of patients with
multiple sclerosis and normal MR imaging brain scans. AJNR Am J Neuroradiol
28: 1306–1312.
37. Roxburgh RH, Seaman SR, Masterman T, Hensiek AE, Sawcer SJ, et al. (2005)
Multiple Sclerosis Severity Score: using disability and disease duration to rate
disease severity. Neurology 64: 1144–1151.
38. Poser CM, Paty DW, Scheinberg L, McDonald WI, Davis FA, et al. (1983) New
diagnostic criteria for multiple sclerosis: guidelines for research protocols. Ann
Neurol 13: 227–231.
39. Lassmann H, Bruck W, Lucchinetti CF (2007) The immunopathology of
multiple sclerosis: an overview. Brain Pathol 17: 210–218.
40. Thorpe JW, Kidd D, Moseley IF, Thompson AJ, MacManus DG, et al. (1996)
Spinal MRI in patients with suspected multiple sclerosis and negative brain
MRI. Brain 119 (Pt 3): 709–714.
41. Howell OW, Rundle JL, Garg A, Komada M, Brophy PJ, et al. (2010) Activated
microglia mediate axoglial disruption that contributes to axonal injury in
multiple sclerosis. J Neuropathol Exp Neurol 69: 1017–1033.
42. Graaf RAd (2007) in vivo NMR Spectroscopy Principles and Techniques
Second Edition. Chichester: Wiley.
43. Bjartmar C, Battistuta J, Terada N, Dupree E, Trapp BD (2002) N-
acetylaspartate is an axon-specific marker of mature white matter in vivo: a
biochemical and immunohistochemical study on the rat optic nerve. Ann Neurol
51: 51–58.
44. MacKay A, Laule C, Vavasour I, Bjarnason T, Kolind S, et al. (2006) Insights
into brain microstructure from the T2 distribution. Magn Reson Imaging 24:
515–525.
45. MacKay A, Whittall K, Adler J, Li D, Paty D, et al. (1994) In vivo visualization
of myelin water in brain by magnetic resonance. Magn Reson Med 31: 673–677.
46. Labadie C, Lee JH, Rooney WD, Jarchow S, Aubert-Frecon M, et al. (2013)
Myelin water mapping by spatially regularized longitudinal relaxographic
imaging at high magnetic fields. Magn Reson Med.
qMRI in MS
PLOS ONE | www.plosone.org 9 April 2014 | Volume 9 | Issue 4 | e95161
Copyright © 2022 FDOKUMEN