Nonequilibrium Model for Sorption and Swelling of Bulk Glassy Polymer Films with Supercritical...
15
Nonequilibrium Model for Sorption and Swelling of Bulk Glassy Polymer Films with Supercritical Carbon Dioxide Vito Carla, ,‡ Ke Wang, Yazan Hussain, Kirill Efimenko, Jan Genzer, Christine Grant, Giulio C. Sarti, ‡ Ruben G. Carbonell, and Ferruccio Doghieri* ,‡ Department of Chemical and Biomolecular Engineering, North Carolina State University, Raleigh, North Carolina 27695, and Department of Chemical Engineering, University of Bologna, Bologna, Italy Received March 31, 2005; Revised Manuscript Received July 27, 2005 ABSTRACT: A new procedure is introduced for the calculation of solubility isotherms of plasticizing agents in glassy polymer matrices with particular application to the case of absorption of supercritical gases in bulk glassy polymer films. The model presented is an extension of the nonequilibrium thermodynamics for glassy polymers (NET-GP) approach, modified to allow for the calculation of the effects of pressure, temperature, and gas concentration on the glass transition. Mass sorption and one- dimensional swelling behavior are analyzed for the carbon dioxide (CO 2)-poly(methyl methacrylate) (PMMA) system at high pressure. A quantitative comparison is presented between the model performance and experimental data measured using quartz crystal microbalance (QCM) and high-pressure ellipsometry (HPE). 1. Introduction Carbon dioxide in its liquid and supercritical state is an attractive replacement for aqueous and organic solvents in industry primarily because of its tunable solvent properties, low cost, low toxicity, nonflam- mability, and its ease of recycle. 1-6 In addition, carbon dioxide is an excellent plasticizer for polymeric materials; 7-10 it is inert as a reaction solvent, and it has very low surface energy and viscosity, making it ideal for producing thin uniform coatings. 11-13 For these reasons, carbon dioxide has been used in several pro- cesses, such as polymerization reactions, 14 dry clean- ing, 15 drug formulations, 16 foam production, 17 metal deposition onto substrates, 18 polymer surface modifica- tion, 19 and microelectronics fabrication, 20 and many applications, including polymeric membrane condition- ing, 21 removal of residual solvents and contaminants from polymeric films, 22-24 solute impregnation, 25,26 and photoresist development. 27-29 In most of the aforementioned industrial applications the key factor that influences the quality of the final product is the ability to predict sorption and consequent swelling behavior of the polymer matrix at different operating conditions. Indeed, a reliable thermodynamic model, capable of describing the swelling of glassy polymer systems starting from dry polymeric matrices up to fully plasticized materials, is an essential prereq- uisite of any good transport model aimed at predicting sorption, desorption, and dissolution kinetics in poly- meric films. Because glassy polymers are nonequilib- rium systems, the usual thermodynamic models for fluids and amorphous polymers, such as the Sanchez- Lacombe (SL) or the statistical associated fluid theory (SAFT) equation of state, are not directly applicable to these systems. To fill this knowledge gap, a great deal of work has been done to obtain useful and reliable models for sorption and dilation in glassy polymers. Wissinger and Paulaitis were the first to apply successfully the non- equilibrium thermodynamics concept of an order pa- rameter to an equilibrium lattice model. 30 Although their results were in good agreement with their experi- mental data, they used a constant order parameter with its value fixed at the glass transition conditions so that their model was unable to represent the significant solubility variations and hysteresis behavior associated with sorption-desorption cycles. Soon after their work, several models appeared in the literature based on the same approach but with a different choice of the order parameter. 31,32 The Gibbs-DiMarzio criterion, which postulates a loss of configurational entropy at the glass transition temperature, was used by Condo et al. to develop a complete consistent theory for glassy systems through an extension of the classical Sanchez-Lacombe model. 33 Because this theory is a direct extension of the Sanchez- Lacombe lattice fluid theory, its predictive power is restricted to systems for which the Sanchez-Lacombe equation of state (EoS) is able to reproduce correctly the mixture behavior in the equilibrium region. However, there exist many real systems of importance for which this is not the case. The main aim of this work is to introduce a new flexible model for mass uptake and swelling of glassy polymer films induced by the sorption of plasticizing agents, with special attention to the case of CO 2 - polymer systems, over a wide range of pressures. This new model is an extension, to the case of plasticizing solutes, of the nonequilibrium thermodynamic model for solubility in glassy polymers (NET-GP), introduced by Doghieri and Sarti 34 and named NELF in its first version. 35-37 The NET-GP model extends the free energy mapping for the equilibrium state, which can be obtained from any equations of state, to the nonequilibrium domain of the glassy region using a thermodynamically consis- tent procedure. The NET-GP approach requires that independent information be available for the mass North Carolina State University. ‡ University of Bologna. * To whom correspondence should be addressed. E-mail: [email protected]. 10299 Macromolecules 2005, 38, 10299-10313 10.1021/ma0506684 CCC: $30.25 © 2005 American Chemical Society Published on Web 10/27/2005
-
Upload
independent -
Category
Documents
-
view
0 -
download
0
Transcript of Nonequilibrium Model for Sorption and Swelling of Bulk Glassy Polymer Films with Supercritical...

Nonequilibrium Model for Sorption and Swelling of Bulk GlassyPolymer Films with Supercritical Carbon Dioxide
Vito Carla,†,‡ Ke Wang,† Yazan Hussain,† Kirill Efimenko,† Jan Genzer,†Christine Grant,† Giulio C. Sarti,‡ Ruben G. Carbonell,† and Ferruccio Doghieri*,‡
Department of Chemical and Biomolecular Engineering, North Carolina State University,Raleigh, North Carolina 27695, and Department of Chemical Engineering, University of Bologna,Bologna, Italy
Received March 31, 2005; Revised Manuscript Received July 27, 2005
ABSTRACT: A new procedure is introduced for the calculation of solubility isotherms of plasticizingagents in glassy polymer matrices with particular application to the case of absorption of supercriticalgases in bulk glassy polymer films. The model presented is an extension of the nonequilibriumthermodynamics for glassy polymers (NET-GP) approach, modified to allow for the calculation of theeffects of pressure, temperature, and gas concentration on the glass transition. Mass sorption and one-dimensional swelling behavior are analyzed for the carbon dioxide (CO2)-poly(methyl methacrylate)(PMMA) system at high pressure. A quantitative comparison is presented between the model performanceand experimental data measured using quartz crystal microbalance (QCM) and high-pressure ellipsometry(HPE).
1. IntroductionCarbon dioxide in its liquid and supercritical state is
an attractive replacement for aqueous and organicsolvents in industry primarily because of its tunablesolvent properties, low cost, low toxicity, nonflam-mability, and its ease of recycle.1-6 In addition, carbondioxide is an excellent plasticizer for polymericmaterials;7-10 it is inert as a reaction solvent, and it hasvery low surface energy and viscosity, making it idealfor producing thin uniform coatings.11-13 For thesereasons, carbon dioxide has been used in several pro-cesses, such as polymerization reactions,14 dry clean-ing,15 drug formulations,16 foam production,17 metaldeposition onto substrates,18 polymer surface modifica-tion,19 and microelectronics fabrication,20 and manyapplications, including polymeric membrane condition-ing,21 removal of residual solvents and contaminantsfrom polymeric films,22-24 solute impregnation,25,26 andphotoresist development.27-29
In most of the aforementioned industrial applicationsthe key factor that influences the quality of the finalproduct is the ability to predict sorption and consequentswelling behavior of the polymer matrix at differentoperating conditions. Indeed, a reliable thermodynamicmodel, capable of describing the swelling of glassypolymer systems starting from dry polymeric matricesup to fully plasticized materials, is an essential prereq-uisite of any good transport model aimed at predictingsorption, desorption, and dissolution kinetics in poly-meric films. Because glassy polymers are nonequilib-rium systems, the usual thermodynamic models forfluids and amorphous polymers, such as the Sanchez-Lacombe (SL) or the statistical associated fluid theory(SAFT) equation of state, are not directly applicable tothese systems.
To fill this knowledge gap, a great deal of work hasbeen done to obtain useful and reliable models for
sorption and dilation in glassy polymers. Wissinger andPaulaitis were the first to apply successfully the non-equilibrium thermodynamics concept of an order pa-rameter to an equilibrium lattice model.30 Althoughtheir results were in good agreement with their experi-mental data, they used a constant order parameter withits value fixed at the glass transition conditions so thattheir model was unable to represent the significantsolubility variations and hysteresis behavior associatedwith sorption-desorption cycles. Soon after their work,several models appeared in the literature based on thesame approach but with a different choice of the orderparameter.31,32
The Gibbs-DiMarzio criterion, which postulates aloss of configurational entropy at the glass transitiontemperature, was used by Condo et al. to develop acomplete consistent theory for glassy systems throughan extension of the classical Sanchez-Lacombe model.33
Because this theory is a direct extension of the Sanchez-Lacombe lattice fluid theory, its predictive power isrestricted to systems for which the Sanchez-Lacombeequation of state (EoS) is able to reproduce correctly themixture behavior in the equilibrium region. However,there exist many real systems of importance for whichthis is not the case.
The main aim of this work is to introduce a newflexible model for mass uptake and swelling of glassypolymer films induced by the sorption of plasticizingagents, with special attention to the case of CO2-polymer systems, over a wide range of pressures. Thisnew model is an extension, to the case of plasticizingsolutes, of the nonequilibrium thermodynamic model forsolubility in glassy polymers (NET-GP), introduced byDoghieri and Sarti34 and named NELF in its firstversion.35-37
The NET-GP model extends the free energy mappingfor the equilibrium state, which can be obtained fromany equations of state, to the nonequilibrium domainof the glassy region using a thermodynamically consis-tent procedure. The NET-GP approach requires thatindependent information be available for the mass
† North Carolina State University.‡ University of Bologna.* To whom correspondence should be addressed. E-mail:
10299Macromolecules 2005, 38, 10299-10313
10.1021/ma0506684 CCC: $30.25 © 2005 American Chemical SocietyPublished on Web 10/27/2005

density of the polymer in the glassy state since this isused as an order parameter. Therefore, the first as-sumption of the NET-GP model is that the value of theorder parameter, the out-of-equilibrium polymer den-sity, determines the behavior of the system, regardlessof the sample history through which this polymerdensity is achieved. Thus, the NET-GP approach cannotbe used as a pure predictive tool because a value of theout-of-equilibrium polymer mass density must be avail-able. It should also be stressed that the latter, being anonequilibrium property, depends, in the most generalcase, on the thermal, mechanical, and sorption historyof the glassy sample.
This work enhances the predictive capability of theNET-GP model by coupling it with a simple theory38
capable of estimating the amount of swelling agentnecessary to result in a transition from the glassy tothe rubbery state based solely on the physical propertiesof the pure components. As the gas is absorbed, thepolymer starts to swell, and eventually, as result of theaugmented free volume, the glass transition tempera-ture is lowered until the system crosses the transitionpoint from glass to rubber. While the model obtainedthis way still requires independent information aboutthe nonequilibrium dry polymer density, it does notmake use of any specific adjustable parameter, and onlyequilibrium binary interaction coefficients need to bedetermined in order to perform the calculations.
In this paper, the predictions of the new model arecompared with mass sorption data collected using aquartz crystal microbalance (QCM) and one-dimensionalswelling data recorded using high-pressure ellipsometry(HPE) for PMMA/CO2 films supported on silicon at twodifferent temperatures and over a wide range of pres-sures. We also compare the modeling results with otherliterature data.
An additional significant finding of the present workis the experimental verification of the basic assumptionof the NET-GP approach, never done before, whichstates that two different glassy polymer samples shouldexhibit the same behavior provided that their initialdensities are the same, whatever their thermal, me-chanical, and sorption histories.
This was achieved by preparing PMMA films with thesame density using two completely different coating andcuring techniques. These samples were used to collectsorption and swelling data as a function of pressure attwo different temperatures using high-pressure ellip-sometry (HPE) and quartz crystal microbalance (QCM)methods. HPE measurements yield data on the filmthickness, which can be related to the film dilationthrough the expression
HPE also provides information on the average refractiveindex of the swollen film, which can be converted intototal carbon dioxide mass uptake39,40 using the indexof refraction of the pure components. In this work, themass sorption measurements from HPE were comparedto the more direct mass sorption data measured withQCM.
In the first part of this paper we describe theexperimental procedures utilized in film preparation,swelling, and sorption measurements. This is followedby a description of the NET-GP model, the model used
to predict the glass transition point, and the numericalprocedure used for carrying out the sorption and swell-ing calculations. The last section presents the modelresults of the simulations along with the experimentalresults. The model performance has been tested at twodifferent temperature, 35 and 50 °C, with pressuresranging from 0 to 1800 psi.
2. Experimental Methods2.1. High-Pressure Ellipsometry (HPE). 2.1.1. Materi-
als and Sample Preparation. PMMA (Mw ) 72 kDa, Mw/Mn ) 1.06) was purchased from Polymer Source, Inc., Dorval(Montreal, Canada). Toluene (Fisher) was used as solvent todissolve PMMA. Silicon wafers (100 mm diameter, a ⟨100⟩orientation) having ≈1.7 nm thick native oxide films (SiOx)were purchased from International Wafer Services (PortolaValley, CA). The wafers were cleaned by soaking in a mixtureof JTB-111 alkaline-surfactant, hydrogen peroxide, and DIwater with a 4.6:1:22.8 volume ratio for 10 min and subse-quently rinsed with copious amounts of DI water and driedwith nitrogen. PMMA/toluene solutions were spin-coated ontosilicon wafers using a Headway Research (model 131-024,Indianapolis, IN) spin-coater. The concentrations of the PMMA/toluene solutions and spin rates were varied to obtain filmsof different thickness. The coated wafers were annealed at 120°C under vacuum for 3-6 h to remove any residual solvent.After spin-coating and annealing, the film thickness at roompressure was measured by ellipsometry (see below), and theinitial mass was measured using a precision lab balance(Mettler Toledo, model AB204, Switzerland). Films of thickness≈1.2 and ≈1.5 µm were formed with a resulting density of1.187 g/cm3. The densities of films used for HPE were matchedas closely as possible to those used for QCM measurements.As described in detail below, the PMMA films for QCMexperiments were formed by dip-coating QCM substrates intoPMMA/toluene solution, followed by annealing in a vacuumat 80-90 °C for 1-2 h. The difference in density between thefilms used in QCM (1.189 g/cm3) and those used in ellipsometry(1.187 g/cm3) was less than 0.2%. The polymer mass per unitarea on the QCM substrates was determined by measuringthe fundamental frequency difference between the bare crystaland the coated crystal. SEM was used to measure the filmthickness.
2.1.2. Ellipsometry Equipment. A variable angle spec-troscopic ellipsometer (J.A. Woollam, Inc., Lincoln, NE) withrotating analyzer equipped with a custom-built high-pressureCO2 cell was used in the HPE experiments. The angle ofincidence (with respect to the sample normal) was fixed at 70°,and the wavelength was varied from 500 to 800 nm. The high-pressure cell, constructed of stainless steel, was equipped withthree fused silica windows (2.54 cm in diameter and 1.5 cm inthickness, Rubicon Technology Franklin Park, IL) (cf. Figure1). The two side windows were fixed at an angle of 110° fromvertical in order to obtain normal incidence of the beam withthe window to avoid any deviations that can cause a changein polarization of the light and to minimize the uncertaintiesin the incident angle of the beam on the sample. A custom-made copper sample holder with a spring clip was used to holdthe wafer, and it was placed on the bottom of the cell. A torquewrench was used to put an equivalent and minimal amount
% swelling ) (h - h0
h0) × 100 (1)
Figure 1. Experimental setup and ellipsometry high-pressurecell.
10300 Carla et al. Macromolecules, Vol. 38, No. 24, 2005
of force to seal the windows to minimize the window birefrin-gence induced by strain under high pressure. High-purity CO2
gas (Matheson Gas Product, Montgomeryville, PA, purity >99.999%) was charged to the cell to the desired pressure usingan ISCO pump (model 260D, Isco, Inc., Lincoln, NE).
The pressure in the cell was measured using a pressuretransducer (Omegadyne, model PX01C1-1KG10T, OMEGAEngineering, Inc., Stamford, CT) controlled to an accuracy of(2 psi (0.14 bar). A heating tape was wrapped around the celland was connected to a variable autotransformer (model3PN1010, Staco, Hayward, CA) for temperature control. Aninsulation cap was used to cover the entire cell and heatingtapes, except the windows, to obtain a uniform thermalequilibration that was found to be crucial in these experiments,especially near the critical point of CO2. A custom-built metalheating plate was placed beneath the supporting stage toprevent heat losses. An ISCO pump (model 260D, Isco Inc.,Lincoln, NE) was connected to a heated water bath (model9110, Poly Science, Niles, IL) to preheat CO2 to the desiredtemperature. The temperature inside the cell was measuredby using a thermocouple (Omegadyne model HGKQSS-116G-12-OMEGA Engineering, Inc., Stamford, CT) and was con-trolled to within (0.1 °C. The cell was allowed to reach thermalequilibration at each desired temperature for at least 1 h.
Birefringence of the windows can corrupt the polarizationstate of the light, and even nonbirefrigent windows can becomebirifrigent due to pressure-induced window strain.41 This, inturn, can cause large errors in the calculated properties of thesamples. An experimental procedure developed by J.A. Wool-lam Co., Inc., was used in this work to account for the effectof the window birefringence.42,43
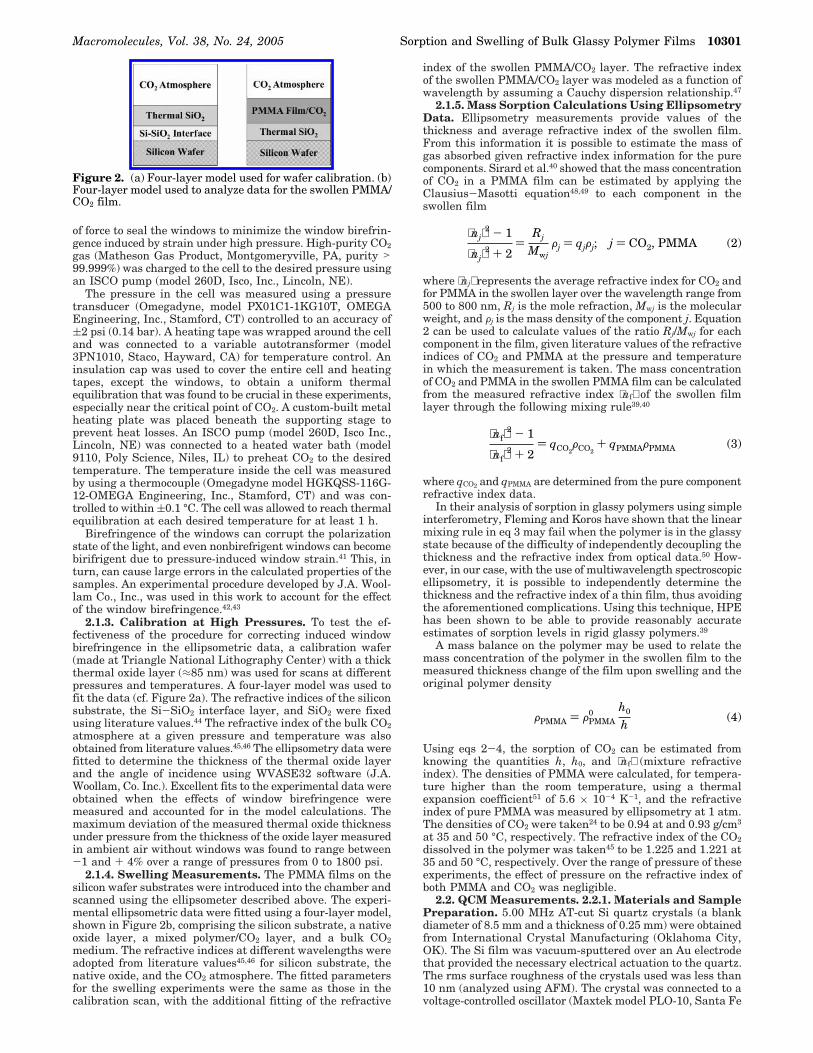
2.1.3. Calibration at High Pressures. To test the ef-fectiveness of the procedure for correcting induced windowbirefringence in the ellipsometric data, a calibration wafer(made at Triangle National Lithography Center) with a thickthermal oxide layer (≈85 nm) was used for scans at differentpressures and temperatures. A four-layer model was used tofit the data (cf. Figure 2a). The refractive indices of the siliconsubstrate, the Si-SiO2 interface layer, and SiO2 were fixedusing literature values.44 The refractive index of the bulk CO2
atmosphere at a given pressure and temperature was alsoobtained from literature values.45,46 The ellipsometry data werefitted to determine the thickness of the thermal oxide layerand the angle of incidence using WVASE32 software (J.A.Woollam, Co. Inc.). Excellent fits to the experimental data wereobtained when the effects of window birefringence weremeasured and accounted for in the model calculations. Themaximum deviation of the measured thermal oxide thicknessunder pressure from the thickness of the oxide layer measuredin ambient air without windows was found to range between-1 and + 4% over a range of pressures from 0 to 1800 psi.
2.1.4. Swelling Measurements. The PMMA films on thesilicon wafer substrates were introduced into the chamber andscanned using the ellipsometer described above. The experi-mental ellipsometric data were fitted using a four-layer model,shown in Figure 2b, comprising the silicon substrate, a nativeoxide layer, a mixed polymer/CO2 layer, and a bulk CO2
medium. The refractive indices at different wavelengths wereadopted from literature values45,46 for silicon substrate, thenative oxide, and the CO2 atmosphere. The fitted parametersfor the swelling experiments were the same as those in thecalibration scan, with the additional fitting of the refractive
index of the swollen PMMA/CO2 layer. The refractive indexof the swollen PMMA/CO2 layer was modeled as a function ofwavelength by assuming a Cauchy dispersion relationship.47
2.1.5. Mass Sorption Calculations Using EllipsometryData. Ellipsometry measurements provide values of thethickness and average refractive index of the swollen film.From this information it is possible to estimate the mass ofgas absorbed given refractive index information for the purecomponents. Sirard et al.40 showed that the mass concentrationof CO2 in a PMMA film can be estimated by applying theClausius-Masotti equation48,49 to each component in theswollen film
where ⟨nj⟩ represents the average refractive index for CO2 andfor PMMA in the swollen layer over the wavelength range from500 to 800 nm, Rj is the mole refraction, Mwj is the molecularweight, and Fj is the mass density of the component j. Equation2 can be used to calculate values of the ratio Rj/Mwj for eachcomponent in the film, given literature values of the refractiveindices of CO2 and PMMA at the pressure and temperaturein which the measurement is taken. The mass concentrationof CO2 and PMMA in the swollen PMMA film can be calculatedfrom the measured refractive index ⟨nf⟩ of the swollen filmlayer through the following mixing rule39,40
where qCO2 and qPMMA are determined from the pure componentrefractive index data.
In their analysis of sorption in glassy polymers using simpleinterferometry, Fleming and Koros have shown that the linearmixing rule in eq 3 may fail when the polymer is in the glassystate because of the difficulty of independently decoupling thethickness and the refractive index from optical data.50 How-ever, in our case, with the use of multiwavelength spectroscopicellipsometry, it is possible to independently determine thethickness and the refractive index of a thin film, thus avoidingthe aforementioned complications. Using this technique, HPEhas been shown to be able to provide reasonably accurateestimates of sorption levels in rigid glassy polymers.39
A mass balance on the polymer may be used to relate themass concentration of the polymer in the swollen film to themeasured thickness change of the film upon swelling and theoriginal polymer density
Using eqs 2-4, the sorption of CO2 can be estimated fromknowing the quantities h, h0, and ⟨nf⟩ (mixture refractiveindex). The densities of PMMA were calculated, for tempera-ture higher than the room temperature, using a thermalexpansion coefficient51 of 5.6 × 10⁻⁴ K-1, and the refractiveindex of pure PMMA was measured by ellipsometry at 1 atm.The densities of CO2 were taken24 to be 0.94 at and 0.93 g/cm3
at 35 and 50 °C, respectively. The refractive index of the CO2
dissolved in the polymer was taken45 to be 1.225 and 1.221 at35 and 50 °C, respectively. Over the range of pressure of theseexperiments, the effect of pressure on the refractive index ofboth PMMA and CO2 was negligible.
2.2. QCM Measurements. 2.2.1. Materials and SamplePreparation. 5.00 MHz AT-cut Si quartz crystals (a blankdiameter of 8.5 mm and a thickness of 0.25 mm) were obtainedfrom International Crystal Manufacturing (Oklahoma City,OK). The Si film was vacuum-sputtered over an Au electrodethat provided the necessary electrical actuation to the quartz.The rms surface roughness of the crystals used was less than10 nm (analyzed using AFM). The crystal was connected to avoltage-controlled oscillator (Maxtek model PLO-10, Santa Fe
Figure 2. (a) Four-layer model used for wafer calibration. (b)Four-layer model used to analyze data for the swollen PMMA/CO2 film.
⟨nj⟩2 - 1
⟨nj⟩2 + 2
)Rj
MwjFj ) qjFj; j ) CO2, PMMA (2)
⟨nf⟩2 - 1
⟨nf⟩2 + 2
) qCO2FCO2
+ qPMMAFPMMA (3)
FPMMA ) FPMMA0 h0
h(4)
Macromolecules, Vol. 38, No. 24, 2005 Sorption and Swelling of Bulk Glassy Polymer Films 10301

Springs, CA). This oscillator provides two outputs: frequencyand voltage. The voltage reading is inversely proportional tothe resistance of the crystal. The oscillator is further connectedto an Agilent 225 MHz universal frequency counter (model53131A, Palo Alto, CA) that records the frequency of thevibrating crystal. The time-dependent frequency readings werestored on a computer using Agilent Intuilink Connectivitysoftware.
PMMA films for the QCM experiments were cast onto thesurface of the crystal by dip-coating. The crystal was dippedvertically into a 2.4 wt % PMMA/toluene solution, allowed toequilibrate for a specific time, and then was withdrawn fromthe solution at a controlled rate using a motorized device. Thecoated crystal was dried under vacuum at 80-90 °C for 1-2h. The clean crystal was then placed in the cell under vacuum(0.01 psia), using precision DD-20 (Inxs Inc. Delray Beach, FL)vacuum pump, and the fundamental frequency F0 of the coatedcrystal was recorded. The stable frequency level is indicativeof complete evaporation of the solvent from the polymer duringcuring. The value of the stabilized frequency of the coated QCMin a vacuum was utilized to calculate the mass of coatedpolymer by comparing to fundamental frequency of the quartzcrystal without polymer. The annealing conditions were chosenso that the density of the films formed for the QCM sampleswere as close as possible to the density of the films made forthe ellipsometry experiments (final measured value 1.187g/cm3 for the ellipsometry sample and 1.189 g/cm3 for the QCMsample).
2.2.2. High-Pressure QCM Cell. The custom-built pres-sure cell consists of a thick-wall stainless steel cylinder (63.5mm i.d. × 200 mm height), with a high-pressure electricalfeedthrough (Conax Buffalo Technologies, NY) at the top endto drive the QCM (cf. Figure 3). The cell has an inside volumeof 25 cm3 and a maximum working pressure of 7500 psi. Thecrystal was placed in the cell and connected to the oscillatorthrough the electrical feedthrough during an experiment. Ahigh-pressure thermocouple (Omega, Stamfortd, CT) wasplaced in the cell to monitor the temperature of the CO2 fluid.Data acquisition was accomplished via a National InstrumentDAQ interface using Labwiew software. The whole assemblywas then placed in a custom-built water bath and controlledto within (0.1 °C.
2.2.3. Mass Sorption Measurements. QCM crystals coatedwith polymer films were placed in the pressure cell, and thefundamental F0 frequency of the QCM was measured in avacuum. After a stable signal was achieved, CO2 was slowlyintroduced into the chamber to increase the pressure. Thefrequency was then allowed to reach a new stable level andrecorded. This procedure was repeated for the third pressurelevel, and so on. A pressure range from 0 up to 1800 psi wasexamined in steps of 150 psi. After the time-dependentfrequency readings were recorded for each pressure, ananalysis was performed in order to obtain the correspondentmass of CO2 uptake vs time behavior.
The frequency of the QCM can be affected by several factors,including the mass adsorbed on the crystal surface (m), thepressure (P), the properties of the surrounding medium, andthe temperature (T). Since the temperature was held constantduring these experiments, the total change in frequency canbe written as the sum of the contributions from mass adsorbed,pressure, and the surrounding medium52,53
Estimation of the mass effect can be done using the well-knownSauerbrey equation54-58
where Cm is the mass sensitivity constant (56.6 µg/cm2),52 F0
is the fundamental frequency of the crystal, ∆m is the massper unit area absorbed on the crystal, and the quantities µq
and Fq are the shear modulus and density of the quartz,respectively. The equation above represents a simple linearrelationship between the change in frequency and the massuptake. For a crystal coated with a viscoelastic polymer layerthis simple relationship may not hold. However, the extent ofthe deviation from eq 6 depends strongly upon the filmthickness. Analysis on this subject in the literature has shownthat the linear approximation can be used with confidence onlywhen the load on the QCM is small, i.e., when the filmthickness is small (less than a few micrometers).55-58 In ourexperiments, all the film thickness values were on the orderof 1 µm, easily justifying the use of eq 6 in calculating thechange in frequency due to mass sorption. The QCM sorptiondata agreed extremely well with prior work in the literature,providing additional proof of the accuracy of eq 6 in thisapplication.
As for the second term, Stockbridge59 found that thefrequency changes linearly with pressure
where CP is a constant. This relation has been tested previ-ously52,53 and found to be valid for the crystals used in thiswork. The value of CP was found to be ∼0.34 Hz/psi in therange of temperature considered here for a 5 MHz quartzcrystal.52
The viscosity contribution it is more difficult to quantify.Kanazawa and Gordon proposed the following equation for theoscillation frequency of a quartz resonator in contact withfluid60
where Ff and ηf denote the density and shear viscosity of thefluid medium surrounding the crystal. It should also be notedthat in these experiments the initial conditions were chosento be in a vacuum, so that P, Ff, and ηf are used rather than∆P, ∆Ff, and ∆ηf.52,53
Although this relation has been used previously to performsimilar calculations in the case of bare crystal,52 it should berecognized that the presence of the polymer film introduces adiscontinuity in the viscosity profile in the vicinity of the QCMsurface. However, since the polymer film thickness is muchsmaller than that of the quartz (≈0.1%), this relation providesa good approximation to account for the viscosity effect.
3. Theory3.1. The NET-GP Model. This section summarizes
the NET-GP model for sorption of gases into glassypolymers for the case of homogeneous, amorphous, andisotropic materials.34-37 The model makes use of thewell-known concept of order parameter for the descrip-tion of the nonequilibrium state of the glassy phase ata given temperature, pressure, and composition. Thisidea provides a useful framework for describing systemsthat are not at equilibrium and avoids the introductionof mathematically cumbersome memory functions oth-erwise necessary for dealing with sample histories. Themodel then assumes that an unambiguous descriptionof the thermodynamic properties of the glassy polymer-gas mixture can be based on a set of state variables in
Figure 3. Schematic diagram of the QCM apparatus
∆F ) F - F0 ) ∆Fm + ∆FP + ∆Fη (5)
∆Fm ) -2F02∆m/(µqFq)
1/2 ) -Cm∆m (6)
∆FP ) CPP (7)
∆Fη ) -F03/2( Ffηf
πFqµq)1/2
(8)
10302 Carla et al. Macromolecules, Vol. 38, No. 24, 2005

which, along with temperature T, pressure P, and gascontent ω1, the polymer mass density F2 is included asindependent variable which measures the volume de-formation of the polymer network
Thus, any specific nonequilibrium function FNE of thestate of the system can be described by an expressionof the form
With this assumption, polymeric samples below theglass transition temperature have identical thermody-namic properties at given T, P, and ω1, provided theorder parameter F2 is the same, regardless of theirthermal, mechanical, or and sorption histories. Indeed,while the use of a single order parameter may not besufficient to describe all the nonequilibrium character-istics of the structure of a glassy polymer mixture,61,62
the first-order approximation used in NET-GP ad-dresses the major effect of volume deformation on theproperties of the glassy polymeric mixture, and it allowsfor a quantitative representation of sorption behaviorwhich is satisfactory for most technical purposes.
The thermodynamic analysis of NET-GP model relieson the additional assumption that the order parameterF2 is an internal state variable for the system; i.e., itsrate of change in time depends strictly on the state ofthe system:
While different order parameters can be used todescribe the same thermodynamic properties of a glassygas-polymer mixture, the assumption of different in-ternal state variables definitely leads to different ex-pressions for the properties in the nonequilibriumstates. In this sense, results of the NET-GP model areunique with regard to earlier attempts to describeproperties of glassy phases by means of different orderparameters.30-32
Given the assumptions of eqs 10 and 11, through theuse of well-established tools of thermodynamics ofsystems endowed with internal state variables, thefollowing conditions hold for the nonequilibrium Helm-holtz free energy density aNE and penetrant chemicalpotential µ1
NE in the mixture:35-37
Equations 12 and 13 constitute the key results of thethermodynamic analysis of nonequilibrium states forpenetrant-polymer mixtures below the glass transitiontemperature. They allow for the derivation of expres-sions for the free energy and solute chemical potentialof any nonequilibrium state of a glassy gas-polymermixture, once reliable expressions for the correspondingequilibrium conditions are known. It is thus possible tocalculate the solute solubility in the system, knowingthe polymer mass per unit volume, through the classicalphase equilibrium condition
or, equivalently, in terms of fugacities
In the expressions above, µ10 and f 1
0 are the equilibriumchemical potential and fugacity of a pure penetrantphase, at temperature T and pressure P, respectively,and F2
∞ is the pseudo-equilibrium polymer density thesystem reaches under sorption conditions. It is impor-tant to stress that F2
∞ must be known without usingequilibrium arguments in order to solve eqs 14 and 15for the pseudo-equilibrium gas content ω1.
In a low-pressure sorption experiment, the swellinginduced by the penetrant is negligible, and the pseudo-equilibrium value of the density, F2
∞, can be approxi-mated by the initial density of the pure polymer F2
0. Itis useful to remember that F2
0 is a nonequilibriumproperty which depends on the history of the polymericmaterial, and as such it should be specifically calculatedfor the case of interest. The problem of representationof solubility isotherms in the low-pressure range hasbeen addressed in previous papers, where numerousexamples have been discussed.35-37,63 However, in themore general case, the polymer density F2
∞ changeswith penetrant pressure P in the external phase, andits variation must be considered in order to correctlydescribe sorption isotherms at moderate and highpressures.
Careful analysis of experimental dilation data for awide variety of systems indicates that at constanttemperature the pseudo-equilibrium polymer densityvaries linearly with pressure,64 so that it can beadequately represented by an equation of the form
where the parameter ks is the dilation coefficient of thepolymeric material in the gaseous atmosphere. This isalso a nonequilibrium variable, which may changeaccording to the thermal and sorption history of thepolymeric material, as well as depending on sorption/desorption runs. Figure 4 shows a schematic represen-tation of the density behavior with pressure at constanttemperature. An increase in pressure results in a lineardecrease in density until a certain pressure Pg is reachedat which the amount of solvent absorbed is sufficientto reach the glass transition concentration ω1
g at whichthe equilibrium behavior is recovered. The point (Pg,F2
g)is the glass transition point, and for a given mixture itdepends only on temperature.
The case of representing sorption isotherms in glassypolymers up to moderate pressures, in which the swell-ing effect of the penetrant component must be takeninto account, has been considered in a previous workthrough the discussion of several examples.64 However,while the dilation coefficient ks has a precise physicalmeaning, it has been treated in this previous work asan adjustable parameter that needed to be fitted usinghigh-pressure nonequilibrium solubility data. In thefollowing section, an approach is presented that elimi-nates this shortcoming present in earlier NET-GPtheories.
3.2. Model for Plasticization. Using classical andstatistical mechanical arguments, Chow38 derived a
Σ ) Σ (T,P,ω1,F2) (9)
FNE ) FNE(T,P,ω1,F2) (10)
dF2
dt) f (T,P,ω1,F2) (11)
a ) aNE(T,P,ω1,F2) ) aEQ(T,ω1,F2) (12)
µ1NE ) (∂aNE
∂n1)
T,n2,F2
(13)
µ1(S)(T,P,ω1,F2
∞) ) µ10(T,P) (14)
f1(S)(T,P,ω1,F2
∞) ) f10(T,P) (15)
F2∞(P) ) F2
0(1 - ksP) (16)
Macromolecules, Vol. 38, No. 24, 2005 Sorption and Swelling of Bulk Glassy Polymer Films 10303

relationship expressing the depression of the glasstransition temperature of a polymer-solvent mixture(Tg
mix) by means of liquid plasticizers at low pressures,in terms of the glass transition temperature (Tg
0) of thepure polymer, the excess heat capacity, and the massfraction of solvent inside the polymer. The derivationwas based on the application of the Gibbs-DiMarziocriterion, which states that at the glass transitiontemperature the entropy is zero, to a lattice model.
The resulting expression for the glass transitiontemperature of the polymer-solvent mixture is givenby
with
and
In the equations above, Tg0 is the glass transition
temperature of the dry polymer, and Mp and Md are themolecular weights of the monomer and solvent, respec-tively. The quantity ∆Cp represents the difference inheat capacity between the supercooled liquid and glass,z is the lattice coordination number, R is the ideal gasconstant, and ω1 is the mass fraction of solvent in thepolymer. In Table 1 these parameters, obtained fromthe literature,65,66 are listed for PMMA.
Chow’s theory requires that the dimensionless pa-rameter θ in eq 19 be always less than 0.25 (smallconcentration limit).38,67 In the present work, the mostextreme case has been represented by the lower tem-perature, where a carbon dioxide mass fraction of 0.146is needed to lower the glass transition temperature to35 °C. This, in turn, corresponds to a value of θ ) 0.194,well within the window of applicability of eq 17.38,67
Since eq 17 was developed for calculating the glasstransition point in the presence of a liquid plasticizer,
it does not have any dependence on pressure. In our casethe plasticizer is a high-pressure gas and increases inpressure beyond the critical point may compress thepolymer sample, reducing the free volume and increas-ing its glass transition temperature. However, the effectof pressure on most polymers only becomes importantat pressures far above 500 bar,33 significantly above thepressures being considered in this work. As a result, itis reasonable to neglect pressure effects on the glasstransition temperature and to use eq 17 in the calcula-tions of the depression of the glass transition temper-ature for the PMMA/CO2 system.
A version of the Sanchez-Lacombe equation of statehas been developed recently to address the problem ofsorption in glassy polymers that also provides a methodfor estimating the glass transition depressiondue tosorption.33 Condo et al. have shown that the Chowtheory provides a better quantitative agreement withexperimental data67 than this new Sanchez-Lacombetheory. Our own calculations (not shown here) have alsoconfirmed the results of Condo et al., showing that theChow theory led to a much better fit to Tg data,especially at high solute concentrations. Because of itssimplicity and better predictive capability, the Chowmodel was used here to make all predictions of Tgvalues. Just as the NET-GP theory can be used withany equilibrium equation of state, the Chow theory canbe readily implemented with any equilibrium thermo-dynamic model to predict glass transition temperatures.
3.3. Calculation of Solubility Isotherms in GlassyPolymers. Equations 17-19 make it possible to findthe value of the penetrant composition that causes theglass transition temperature to drop down to theexperimental temperature. Knowing this value, it ispossible to calculate, using the equilibrium equation ofstate, the value of pressure and polymer density at theglass/rubber transition point (Pg,F2
g). The assumptionthat the density variation with pressure is approxi-mately linear up the glass transition point leads to theexpression
where F2g can be evaluated using the equilibrium EoS
at T, Pg, and ω1g. Knowing the density at the glass-
rubber transition, it is possible to calculate the swellingparameter combining eqs 16 and 20
The knowledge of the initial polymer density is crucialfor the present model; however, in many cases in theliterature this information is not provided, either be-cause it is not deemed to be relevant or because it isdifficult to measure the given size or shape of thesample. For those cases in which it is not directlyavailable, we figured out a simple procedure to estimateits value from swelling data.
Taking as example swelling data from the works ofWissinger et al.68 and Zhang et al.,32 Figure 5 presentsthe swelling information as a density ratio (F2/F2
0)depicting the variation of PMMA density with CO2pressure at two different temperatures, 32.7 and 35 °C.From the slope of the line it is possible to evaluate thevalue of ks, and then by using eq 21 and knowledge
Figure 4. Schematic linear behavior of the polymer densitywith pressure at constant temperature in the glassy region.
Table 1. Physical Properties of Un-Cross-Linked andNonbranched PMMA65,66
z ) 2 ∆Cp ) 32.72 J/(mol K)Mp ) 100.12 kg/mol Tg ) 105 °CMd ) 44 kg/kmol
ln(Tgmix
Tg0 ) ) Ψ[(1 - θ) ln(1 - θ) + θ ln θ] (17)
Ψ ) zRMp∆Cp
(18)
θ )Mp
zMd
ω1
1 - ω1(19)
F2∞(P) ) F2
0 + P/Pg(F2g - F2
0) (20)
kS ) 1Pg(1 -
F2g
F20) (21)
10304 Carla et al. Macromolecules, Vol. 38, No. 24, 2005
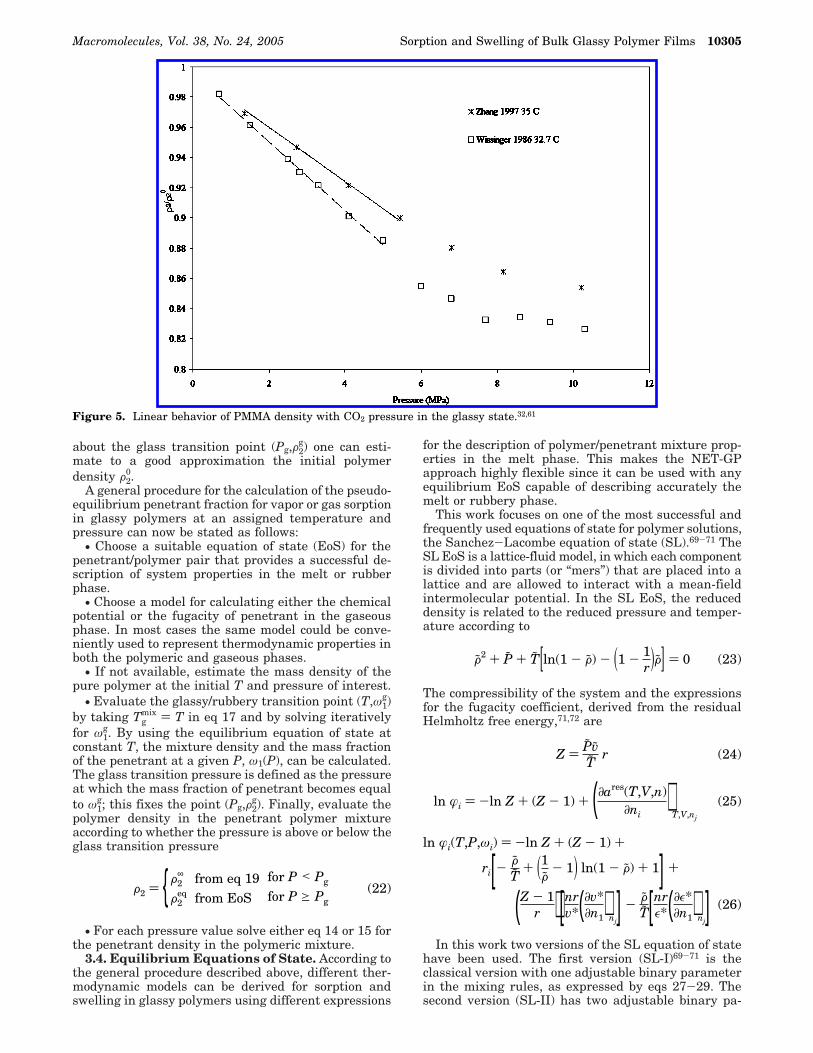
about the glass transition point (Pg,F2g) one can esti-
mate to a good approximation the initial polymerdensity F2
0.A general procedure for the calculation of the pseudo-
equilibrium penetrant fraction for vapor or gas sorptionin glassy polymers at an assigned temperature andpressure can now be stated as follows:
• Choose a suitable equation of state (EoS) for thepenetrant/polymer pair that provides a successful de-scription of system properties in the melt or rubberphase.
• Choose a model for calculating either the chemicalpotential or the fugacity of penetrant in the gaseousphase. In most cases the same model could be conve-niently used to represent thermodynamic properties inboth the polymeric and gaseous phases.
• If not available, estimate the mass density of thepure polymer at the initial T and pressure of interest.
• Evaluate the glassy/rubbery transition point (T,ω1g)
by taking Tgmix ) T in eq 17 and by solving iteratively
for ω1g. By using the equilibrium equation of state at
constant T, the mixture density and the mass fractionof the penetrant at a given P, ω1(P), can be calculated.The glass transition pressure is defined as the pressureat which the mass fraction of penetrant becomes equalto ω1
g; this fixes the point (Pg,F2g). Finally, evaluate the
polymer density in the penetrant polymer mixtureaccording to whether the pressure is above or below theglass transition pressure
• For each pressure value solve either eq 14 or 15 forthe penetrant density in the polymeric mixture.
3.4. Equilibrium Equations of State. According tothe general procedure described above, different ther-modynamic models can be derived for sorption andswelling in glassy polymers using different expressions
for the description of polymer/penetrant mixture prop-erties in the melt phase. This makes the NET-GPapproach highly flexible since it can be used with anyequilibrium EoS capable of describing accurately themelt or rubbery phase.
This work focuses on one of the most successful andfrequently used equations of state for polymer solutions,the Sanchez-Lacombe equation of state (SL).69-71 TheSL EoS is a lattice-fluid model, in which each componentis divided into parts (or “mers”) that are placed into alattice and are allowed to interact with a mean-fieldintermolecular potential. In the SL EoS, the reduceddensity is related to the reduced pressure and temper-ature according to
The compressibility of the system and the expressionsfor the fugacity coefficient, derived from the residualHelmholtz free energy,71,72 are
In this work two versions of the SL equation of statehave been used. The first version (SL-I)69-71 is theclassical version with one adjustable binary parameterin the mixing rules, as expressed by eqs 27-29. Thesecond version (SL-II) has two adjustable binary pa-
Figure 5. Linear behavior of PMMA density with CO2 pressure in the glassy state.32,61
F2 + P + T[ln(1 - F) - (1 - 1r)F] ) 0 (23)
Z ) PvT
r (24)
ln æi ) -ln Z + (Z - 1) + (∂ares(T,V,n)∂ni
)T,V,nj
(25)
ln æi(T,P,ωi) ) -ln Z + (Z - 1) +
ri[- FT
+ (1F - 1) ln(1 - F) + 1] +
(Z - 1r )[nr
v*(∂v*∂n1
)nj] - F
T[nrε*(∂ε*
∂n1)
nj] (26)
F2 ) F2∞ from eq 19 for P < Pg
F2eq from EoS for P g Pg
(22)
Macromolecules, Vol. 38, No. 24, 2005 Sorption and Swelling of Bulk Glassy Polymer Films 10305
rameters in the mixing rules as proposed more recentlyby McHugh and Krunokis,1,71-73 as represented by eqs29-32.
For a complete description of the symbols used abovethe reader is referred to the notation section at the endof the paper.
In the following section, results from the correlationof experimental sorption and swelling data for thePMMA/CO2 system through use of NET-GP model willbe shown in detail, using both the SL-I and SL-IIequations of state. The pure component parameters forCO2 and PMMA for use in the SL-I and SL-II equationsof state were obtained from the literature and aretabulated in Table 2. The critical point for carbondioxide predicted using these parameters is (42 °C, 75bar), which means that the model overestimates thecritical temperature by about 11 °C and overestimatesthe critical pressure by only 20 psi. In the case of thelowest temperature considered in this study, the CO2model will predict a phase change from gas to liquidinstead of the real transition from gas to supercriticalCO2. The binary interaction parameters, kij for SL-I andthe pair (kij, ηij) for the SL-II model, were determinedby fitting the EoS to sorption data at pressures above100 bar. In this region the PMMA/CO2 mixture isrubbery, and the SL equation of state is able to do anexcellent job of correlating the thermodynamic proper-ties. Table 3 lists values of the binary interactionparameters for SL-I and SL-II taken from high-pressuredata at 35 and 50 °C. The values of these parametersare in general agreement with previous literatureresults.73 The data used to make these parameter fitsare presented Figures 7-9, to be discussed in detail in
the following section. Once the binary interactionparameters were estimated, the model was used tocompute sorption and swelling behavior over the entirerange of pressure including the glassy region using theNET-GP approach described above.
4. Results and Discussion
To provide good estimates of the effect of the pen-etrant concentration on the glass transition pressure,the modified NET-GP procedure described above mustresult in good estimates of the dilation parameter. Table4 compares experimental64 and predicted values for theswelling coefficient ks for a series of polymer-gas pairs.All the reported values were calculated at 35 °C. Thepredicted values of ks were obtained using the proceduredescribed above, using eq 21 coupled with the SL-IIequation of state with pure component and binaryinteraction parameters fitted in this work for thePMMA-CO2 pair and taken from the literature for theother pairs.64,65 The predicted swelling coefficients areall within 1-4% of the experimental values, indicatingthat the procedure is indeed capable of making reason-able extrapolations of the density variations with pres-sure at constant temperature.
Solubility data obtained for CO2 in PMMA at 50 °Cas measured by both the HPE and QCM techniques insorption/desorption experiments are compared in Figure6a, where the quantity ΩCO2 represents the ratio ofgrams of CO2 absorbed per gram of polymer (gCO2/gpolymer).
The two series of measurements are in very goodagreement with each other, except for a few scatteredpoints at low pressures. At this relatively high temper-ature there is very little hysteresis in the CO2 isothermas the pressure is decreased. As discussed in theexperimental description, films prepared for QCM andHPE followed two completely different preparationhistories but have nearly identical densities. The excel-lent agreement between the sorption data for bothsamples shown in Figure 6a indicates not only that thetwo measurement techniques are highly consistent butalso that glassy polymer films prepared according to twocompletely different protocols exhibit similar sorptionbehaviors, provided they are characterized by the samepolymer mass density. This result provides experimen-tal verification of one of the basic assumptions in thedevelopment of NET-GP models, namely, that the glasspolymer density can be used as a single order parameterto determine swelling and sorption, and as a conse-quence, samples with the same initial density areexpected to exhibit similar sorption and swelling be-havior regardless of their past histories. This is the firstexperimental verification of the suitability of this as-sumption.
HPE can provide a prompt measurement for the glasstransition pressure, i.e., the pressure required to havesufficient amount of CO2 absorbed into the polymermatrix necessary to lower the glass transition temper-ature to the experimental temperature.39,74 To deter-mine the glass transition pressure, we measured theellipsometric angle ψ as a function of CO2 pressure atdifferent wavelengths (from 500 to 800 nm) for bothsorption and desorption isotherms. Figure 6b shows aplot of the average ψ values as a function of pressurealong with straight line fits to point out the differencein slopes before and after the critical pressure. Thepressure at which the change in curvature occurs is
Table 2. Pure Component Parameters33,72
pure parameter33-72 CO2 PMMA
T* [K] 283 696P* [MPa] 659 503F* [g/cm3] 1.62 1.269
Table 3. Interaction Parameters for Both Versions of theSL Equation of Statea
binary parameters SL-II SL-I
kij35 0.1246 -0.044
ηij35 0.033
kij50 0.1161 -0.040
ηij50 -0.015
a Parameters fit to sorption data above 100 bar at two temper-atures, 35 and 50 °C.
v* ) ∑φivii/ (27)
ε* ) ∑∑φiφjεij/ (28)
εij/ ) xεii
/εjj/(1 - kij) (29)
ε* ) 1v*∑∑φiφj(vε)ij
/ (30)
vij/ ) 1
2(vii
/ + vjj/)(1 - ηij) (31)
v* ) ∑∑φiφjvij/ (32)
10306 Carla et al. Macromolecules, Vol. 38, No. 24, 2005

identified as the Pg,74 i.e., Pg35 = 64 bar and Pg
50 = 58bar, which are in very good agreement with previousmeasurements.74,75 The beginning of the hysteresis inthe dilation data upon sorption and desorption cycleshas been often associated with the the glass transitionpressure.39,40 The data in Figure 6a,b indicate that thePg values estimated from the change in slope of theellipsometric angle agree quite well with Pg valuesestimated from the presence of hysteresis in dilationduring the sorption and desorption cycles.
Figure 7a shows experimental data for CO2 solubilityin PMMA at 50 °C measured from QCM sorption
experiments. Superimposed on the data in Figure 7aare the predictions of the NET-GP model using the SL-Iand SL-II equations of state. The interaction parametersused in the SL-I and SL-II models fitted to the sorptiondata for pressures greater than 100 bar are listed inTable 3. According to the Chow theory in eq 17, the CO2
concentration at the glass transition point should cor-respond to a value of ΩCO2
50 ) 0.096. At this penetrantconcentration, the glass transition pressure Pg
50 wasestimated as 46 and 54 bar using the SL-I and SL-IImodels, respectively, within a few bars from the mea-
Figure 6. (a) Solubility isotherm for CO2 in PMMA at 35 °C from sorption and desorption experiments as measured by QCMand high-pressure ellipsometry. (b) Ellipsometric angle ψ as a function of CO2 pressure at 35 and 50 °C. The CO2-induced glasstransition pressure, Pg, is identified as the pressure at which the slope of the ψ-pressure curve changes.
Macromolecules, Vol. 38, No. 24, 2005 Sorption and Swelling of Bulk Glassy Polymer Films 10307

sured experimental value. Model predictions belowPg shown in Figure 7a were obtained from solu-bility calculations using the nonequilibrium NET-GPapproach with the SL-I and SL-II equations of state.Solubility results obtained with NET-GP and theSL-II equation of state exhibit a clear representationof all features shown by experimental data over theentire pressure range, including a slight change in theslope at the glass transition pressure. A less accuratepicture of solubility and pseudo-solubility data is ob-tained by means of NET-GP with the SL-I equation of
state, although the qualitative variation of the solubil-ity isotherm with pressure range is correctly repre-sented.
Figure 7b shows % swelling or dilatation data usingHPE during sorption at 50 °C for PMMA at CO2pressures corresponding to the sorption data shownin Figure 7a. The predicted % swelling results fromthe NET-GP model using SL-I and SL-II param-eters shown in Table 3 are superimposed on theexperimental results. The swelling calculations shownin this figure did not require any additional fits of
Figure 7. (a) Solubility isotherm for sorption of CO2 in PMMA at 50 °C: comparison between experimental data and fittingresults using NET-GP SL-I [thin solid line] and NET-GP SL-II [thick solid line]. (b) Volume swelling isotherm for sorption of CO2in PMMA at 35 °C: comparison between experimental data and predicted results using NET-GP SL-I [thin solid line] and NET-GP SL-II [thick solid line].
10308 Carla et al. Macromolecules, Vol. 38, No. 24, 2005
parameters, only a direct application of the param-eters fitted in the high-pressure regime with sorp-tion data shown in Figure 7a. As was the case withthe sorption data, the results from the NET-GP ap-proach with the SL-II model provide a more ac-curate representation of the swelling experimentaldata. Considering that all the model results in Figure7b were complete predictions, even the less accurateNET-GP SL-I model resulted in an impressively goodcomparison with the % swelling experimental results.
The linear behavior assumed for volume swelling belowPg
50 in eq 16 is clearly visible in the model predictions,and it is substantially confirmed by the experimentaldata.
Having established that the NET-GP SL-II modelclearly offers a more accurate representation of theexperimental results for the PMMA/CO2 system, onlythe results of this model will be presented in subsequentdiscussions.
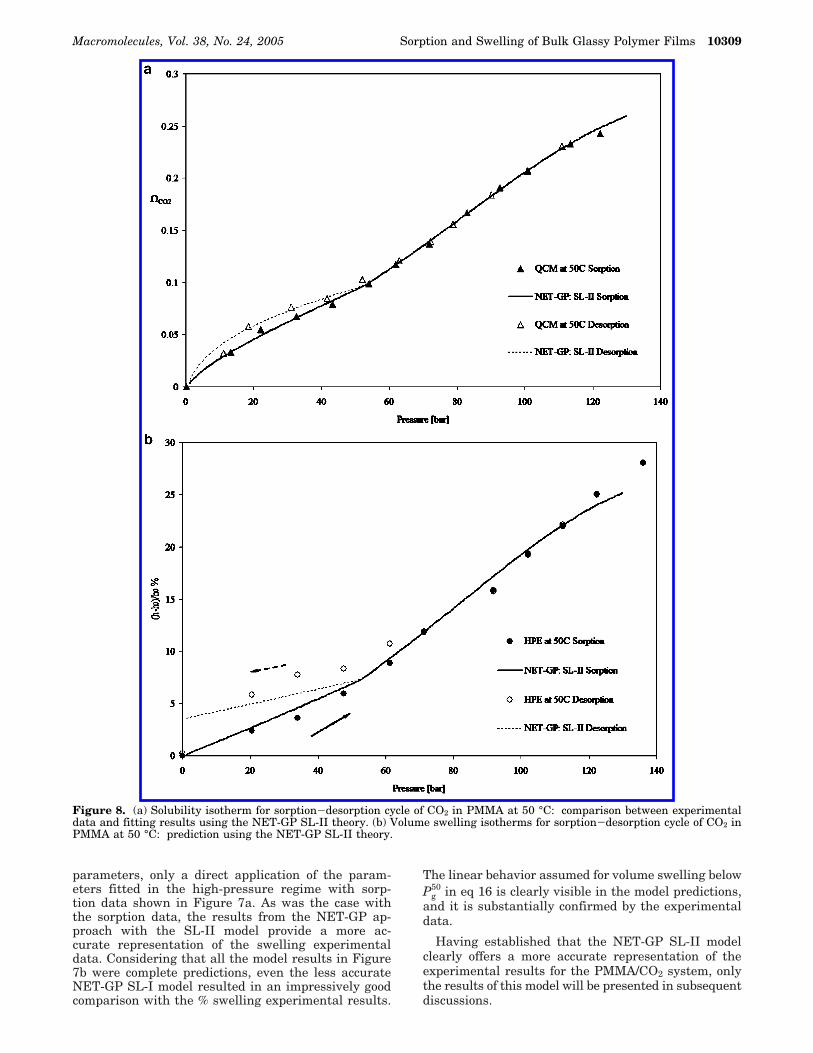
Figure 8. (a) Solubility isotherm for sorption-desorption cycle of CO2 in PMMA at 50 °C: comparison between experimentaldata and fitting results using the NET-GP SL-II theory. (b) Volume swelling isotherms for sorption-desorption cycle of CO2 inPMMA at 50 °C: prediction using the NET-GP SL-II theory.
Macromolecules, Vol. 38, No. 24, 2005 Sorption and Swelling of Bulk Glassy Polymer Films 10309

Figure 8a shows QCM sorption data measured at 50°C during both sorption and desorption cycles as the
pressure is increased to 135 bar and then decreased tothe atmospheric pressure. The results are compared tothe predicted gas solubility calculated using NET-GPSL-II. Even though the hysteresis in CO2 solubility forsorption-desorption cycles in this system is not verylarge, the model is able to represent it through the useof a different swelling coefficient (k′S) for the desorptionleg. The extra information needed for calculating thedesorption curve in the glassy region has been retrievedhere through the use of a fitting procedure for theswelling coefficient.
The corresponding HPE swelling data during thesorption and desorption cycle at 50 °C are shown in
Figure 9. (a) Solubility isotherm for sorption-desorption cycle of CO2 in PMMA at 50 °C: comparison between experimentaldata and fitted results using the NET-GP SL-II theory. (b) Volume swelling isotherm for sorption of CO2 in PMMA at 35 °C:comparison between experimental data and predicted results from NET-GP SL-II theory.
Table 4. Comparison of Experimental64 and CalculatedSwelling Coefficients for Several Polymer-Gas Pairs at
35 °Ca
ks [MPa-1]
system exptl calcd error [%]
PMMA-CO2 1.85 × 10⁻² 1.80 × 10⁻² 2.78PC-CO2 1.14 × 10⁻² 1.18 × 10⁻² 3.51PC-C2H4 1.20 × 10⁻² 1.21 × 10⁻² 1.67PS-CO2 1.21 × 10⁻² 1.23 × 10⁻² 1.65a The data needed for the calculations have been taken from
the literature.64,65
10310 Carla et al. Macromolecules, Vol. 38, No. 24, 2005
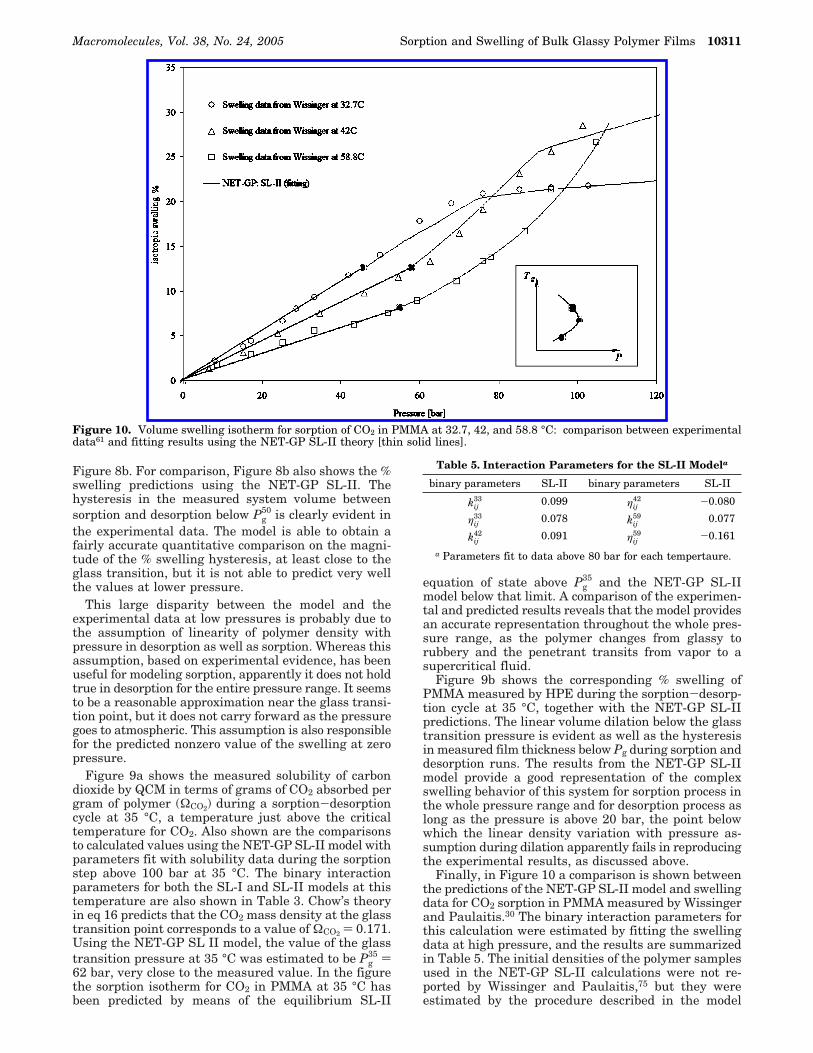
Figure 8b. For comparison, Figure 8b also shows the %swelling predictions using the NET-GP SL-II. Thehysteresis in the measured system volume betweensorption and desorption below Pg
50 is clearly evident inthe experimental data. The model is able to obtain afairly accurate quantitative comparison on the magni-tude of the % swelling hysteresis, at least close to theglass transition, but it is not able to predict very wellthe values at lower pressure.
This large disparity between the model and theexperimental data at low pressures is probably due tothe assumption of linearity of polymer density withpressure in desorption as well as sorption. Whereas thisassumption, based on experimental evidence, has beenuseful for modeling sorption, apparently it does not holdtrue in desorption for the entire pressure range. It seemsto be a reasonable approximation near the glass transi-tion point, but it does not carry forward as the pressuregoes to atmospheric. This assumption is also responsiblefor the predicted nonzero value of the swelling at zeropressure.
Figure 9a shows the measured solubility of carbondioxide by QCM in terms of grams of CO2 absorbed pergram of polymer (ΩCO2) during a sorption-desorptioncycle at 35 °C, a temperature just above the criticaltemperature for CO2. Also shown are the comparisonsto calculated values using the NET-GP SL-II model withparameters fit with solubility data during the sorptionstep above 100 bar at 35 °C. The binary interactionparameters for both the SL-I and SL-II models at thistemperature are also shown in Table 3. Chow’s theoryin eq 16 predicts that the CO2 mass density at the glasstransition point corresponds to a value of ΩCO2 ) 0.171.Using the NET-GP SL II model, the value of the glasstransition pressure at 35 °C was estimated to be Pg
35 )62 bar, very close to the measured value. In the figurethe sorption isotherm for CO2 in PMMA at 35 °C hasbeen predicted by means of the equilibrium SL-II
equation of state above Pg35 and the NET-GP SL-II
model below that limit. A comparison of the experimen-tal and predicted results reveals that the model providesan accurate representation throughout the whole pres-sure range, as the polymer changes from glassy torubbery and the penetrant transits from vapor to asupercritical fluid.
Figure 9b shows the corresponding % swelling ofPMMA measured by HPE during the sorption-desorp-tion cycle at 35 °C, together with the NET-GP SL-IIpredictions. The linear volume dilation below the glasstransition pressure is evident as well as the hysteresisin measured film thickness below Pg during sorption anddesorption runs. The results from the NET-GP SL-IImodel provide a good representation of the complexswelling behavior of this system for sorption process inthe whole pressure range and for desorption process aslong as the pressure is above 20 bar, the point belowwhich the linear density variation with pressure as-sumption during dilation apparently fails in reproducingthe experimental results, as discussed above.
Finally, in Figure 10 a comparison is shown betweenthe predictions of the NET-GP SL-II model and swellingdata for CO2 sorption in PMMA measured by Wissingerand Paulaitis.30 The binary interaction parameters forthis calculation were estimated by fitting the swellingdata at high pressure, and the results are summarizedin Table 5. The initial densities of the polymer samplesused in the NET-GP SL-II calculations were not re-ported by Wissinger and Paulaitis,75 but they wereestimated by the procedure described in the model
Figure 10. Volume swelling isotherm for sorption of CO2 in PMMA at 32.7, 42, and 58.8 °C: comparison between experimentaldata61 and fitting results using the NET-GP SL-II theory [thin solid lines].
Table 5. Interaction Parameters for the SL-II Modela
binary parameters SL-II binary parameters SL-II
kij33 0.099 ηij
42 -0.080
ηij33 0.078 kij
59 0.077
kij42 0.091 ηij
59 -0.161
a Parameters fit to data above 80 bar for each tempertaure.
Macromolecules, Vol. 38, No. 24, 2005 Sorption and Swelling of Bulk Glassy Polymer Films 10311
development section of this work. Little squares in thefigure mark the glass transition point as estimated herefrom Chow’s theory. The highest glass transition pres-sure is that at 42 °C because Pg experiences a maximumwith temperature. This feature, reported by Condo etal.,33 has been called “retrograde vitrification” and canbe explained by considering the Chow’s theory and thesorption behavior vs pressure at different temperatures.As the temperature increases, the amount of carbondioxide needed for the transition decreases but also thesorption isotherm decreases, as result of the two op-posite effects there is a maximum of Pg vs temperatureas shown in the little inbox of the figure. It is encourag-ing that our model coupled with Chow’s equation is ableto predict such a complex behavior.
5. Conclusions
This work describes an extension of the nonequilib-rium thermodynamics of glassy polymer (NET-GP)model for swelling and sorption to the case of a high-pressure plasticizing penetrant. The theory of Chow isused to estimate the penetrant concentration at theglass transition point, which can then be used toestimate the pressure at the glass transition point usingthe equilibrium equation of state for the rubber phase.By assuming there is a linear relation between theglassy polymer density and the pressure below the glasstransition pressure, it is possible to estimate the dilata-tion or swelling coefficient for the polymer-penetrantsystem. This facilitates the calculation of the sorptionand swelling behavior by modeling the system usingNET-GP below the glass transition pressure and theequilibrium equation of state above the glass transitionpressure. The NET-GP approach can be used with anyequilibrium equation of state that is capable of predict-ing the behavior of the system in the rubbery state. Asa result, this is a very flexible approach that can be usedfor any equation of state regardless of its complexity.Use of the theory relies on knowledge of the initialdensity of the glassy polymer prior to solvent penetra-tion. For cases, in which the initial polymer density isnot known or is not provided, a procedure is describedthat facilitates its estimation based on the magnitudeof the swelling coefficient.
The new model was applied to the interpretation ofexperimental data collected for sorption/desorption pro-cesses of CO2 in PMMA films at different temperaturesand for a wide range of CO2 pressures. Swelling ofPMMA was measured using high-pressure ellipsometry(HPE) and mass absorption was measured directly byuse of a quartz crystal microbalance (QCM). The massof absorbed CO2 was also determined indirectly fromthe measured refractive index of the swollen filmresulting from the ellipsometric analysis.
One of the major experimental findings of this workis that the sorption and swelling behaviors of twosamples of a glassy polymer are the same as long astheir densities are the same, even though their historiescan be significantly different. To the best of our knowl-edge, this is the first experimental verification of thebasic assumption of the NET-GP model, namely, thatthe glass polymer density can be used as order param-eter to describe the nonequilibrium thermodynamicstate of the system.
Through the use of a nonequilibrium version of theSanchez-Lacombe lattice fluid model with two binaryinteraction parameters (NET-GP SL-II model), gas
solubility and volume dilation were correctly repre-sented at all experimental conditions. The model wasable to provide a remarkably good agreement with theswelling hysteresis observed experimentally upon sorp-tion and desorption of the gas, except for pressures closeto atmospheric in desorption runs, where there is anapparent breakdown in the assumption of linearly ofdensity with pressure.
The model also was able to provide an accuratedescription of the glass transition pressure variationwith temperature as well as of the amount of gasabsorbed in the glassy polymer phase. The work pre-sented here can serve as the basis for future develop-ment in the study of the dynamic and equilibriumproperties of high-pressure gas-polymer systems.
Acknowledgment. The authors thank the KenanCenter for the Utilization of Carbon Dioxide in Manu-facturing at NC State University and the University ofBologna for their funding of this work. This work wasalso supported in part by the Italinan Ministry (MIRST)and the STC Program of the National Science Founda-tion under Agreement CHE-9876674.
Notation
a ) Helmholtz free energy density (kcal kg-1)Cm ) QCM mass coefficientCp ) QCM pressure coefficient∆CP ) constant pressure specific heat (J kg-1 K-1)f ) fugacityF, F0 ) QCM frequencies (MHz)∆Fm ) mass contribution to the frequency (MHz)∆FP ) pressure contribution to the frequency (MHz)∆Fη ) viscosity contribution to the frequency (MHz)h, h0 ) sample thickness (µm)kij ) binary energetic interaction parameterkS ) swelling coefficient (MPa-1)∆m ) adsorbed mass (µg cm-2)Mwj ) molecular weight (kg kmol-1)nj ) number of moles (mol)⟨nj⟩ ) refractive index⟨nf⟩ ) mixture refractive indexP ) pressure (bar)q ) HPE coefficient (cm3 g-1)r ) number of mersR ) gas constant (J mol-1 K-1)Rj ) molar refractionT ) temperature (K)v* ) Sanchez-Lacombe volumetric parameter (cm3)z ) coordination numberZ ) compressibilityε* ) Sanchez-Lacombe energetic parameter (J mol-1)φ ) volume fractionæ ) fugacity coefficientηq, ηf ) shear viscosities (kg m-1 s-1)ηij ) binary volumetric interaction parameterµj ) chemical potential (J mol-1)θ ) Chow’s theory parameterFj, Fq, Ff ) densities (g cm-3)Σ ) stateω ) mass fractionΩ ) mass ratioΨ ) Chow’s theory parameterSubscriptsi, j ) generic component in the mixture1, CO2 ) carbon dioxide2, PMMA ) polymermix ) mixturem ) massP ) pressareq ) quartz
10312 Carla et al. Macromolecules, Vol. 38, No. 24, 2005

f ) fluidp ) polymerd ) diluentg ) glassy/rubbery transitionSuperscripts0 ) referring to the initial conditions(s) ) solid phaseNE ) nonequilibriumeq ) equilibrium∞ ) asymptotic valueg ) glassy/rubbery transitionres ) residual35, 50 ) referring to a particular temperaturemix ) mixture
References and Notes
(1) McHugh, M. A.; Krukonis, V. J. Supercritical Fluid Extrac-tion: Principles and Practice; Butterworth: Boston, 1986.
(2) McHugh, M. A.; Krukonis, V. J. Encyclopedia of PolymerScience and Technology; Mark, H. F., Bikales, N. M., Over-berger, C. G., Menges, G., Eds.; Wiley-Interscience: NewYork, 1989; Vol. 16, p 368.
(3) Daneshvar, M.; Gulari, E. In Supercritical Fluid Science andTechnology; Johnston K. P., Penninger, J. M. L., Eds.; ACSSymposium Series 406; American Chemical Society: Wash-ington, DC, 1989.
(4) Canelas, D. A.; Betts, D. E.; DeSimone, J. M.; Yates, M. Z.;Johnston, K. P. Macromolecules 1998, 31, 6794.
(5) Yates, M. Z.; Li, G.; Shim, J.-J.; Johnston, K. P.; Lim, K. T.;Webber, S. Macromolecules 1999, 32, 1018.
(6) Kiran, E.; Saraf, V. P.; Sen, Y. L. Int. J. Thermophys. 1989,10, 437.
(7) Wang, W.-C. V.; Kramer, E. J.; Sachse, W. H. J. Polym. Sci.,Polym. Phys. Ed. 1982, 20, 1371.
(8) Chiou, J. S.; Barlow, J. W.; Paul, D. R. J. Appl. Polym. Sci.1985, 30, 2633.
(9) Hachisuka, H.; Sato, T.; Imai, T.; Tsujita, Y.; Takizawa, A.;Kinoshita, T. Polym. J. 1990, 22, 77.
(10) Wissinger, R. G.; Paulatis, M. E. J. Polym. Sci., Part B:Polym. Phys. 1991, 29, 879.
(11) Hoy, K. L.; Donhue, M. D. Polym. Prepr. 1990, 31, 679.(12) Cooper, A. I. Mater. Chem. 2000, 10, 207.(13) Novick, B. J.; Carbonell, R. G.; DeSimone, J. M. Proceedings
of the 5th International Symposium of Supercritical Fluids,April 2000.
(14) DeSimone, J. M.; Guan, Z.; Eisbernd, C. S. Science 1992, 257,945.
(15) Flores, P. A. PCT Int. Appl. 2004.(16) Kazarian, S. G. Drugs Pharm. Sci. 2004, 138, 343.(17) Dixon, D. J.; Johnston, K. P.; Bodmeier, M. A. AIChE J. 1993,
39, 127.(18) Watkins, J. J.; Blackburn, J. M.; McCarthy, T. J. Chem.
Mater. 1999, 11, 213.(19) Howdle, S. M.; George, M. W.; Poliakoff, M. In Chemical
Synthesis Using Supercritical Fluids; Jessop, P. G., Leiner,W., Eds.; Wiley-VCH: Weinheim, 1999.
(20) Weibel, G. L.; Ober C. K Microelectron. Eng. 2003, 65, 145.(21) Pope, D. S.; Koros, W. J. Macromolecules 1992, 25, 1711.(22) Shim, J.-J.; Johnston, K. P. AIChE J. 1989, 35, 1097.(23) Shim, J.-J.; Johnston, K. P. J. Phys. Chem. 1991, 95, 353.(24) Shim, J.-J.; Johnston, K. P. AIChE J. 1991, 37, 607.(25) Sand, M. L. Method for Impregnating a Thermoplastic
Polymer, US Patent #4,598,006, 1986.(26) Kazarian, S. G.; Vincent, M. F.; West, B. L.; Eckert, C. A. J.
Supercrit. Fluids 1998, 13, 107.(27) Gallacher-Wetmore, P.; Ober, C. K.; Gabor, A. H.; Allen, R.
D. Proc. SPIEsInt. Soc. Opt. Eng. 1996, 289, 2725.(28) Gabor, A. H.; Allen, R. D.; Gallacher-Wetmore, P.; Ober, C.
K. Proc. SPIEsInt. Soc. Opt. Eng. 1996, 410, 2724.(29) Sundararajan, N.; Yang, S.; Ogino, K.; Valiyaveettil, S.;
Wang, J.; Zhou, X.; Ober, C. K.; Obendorf, S. K.; Allen, R. D.Chem. Mater. 2000, 12, 41.
(30) Wissinger, R. G.; Paulatis, M. E. Ind. Eng. Chem. Res. 1991,30, 842.
(31) Barbari, T. A.; Conforti, R. M. Polym. Adv. Technol. 1994, 5,698.
(32) Zhang, Y.; Gangwani, K. K.; Lemert, R. M. J. Supercrit.Fluids 1997, 11, 115.
(33) Condo, P. D.; Sanchez, I. C.; Panayiotou, C. G.; Johnston, K.P. Macromolecules 1992, 25, 6119.
(34) Doghieri, F.; Ghedini, M.; Quinzi, M.; Rethwisch, D. G.; Sarti,G. C. In Advanced Materials for Membrane; Pinnau, I.,Freeman, B. D., Eds.; ACS Symp. Ser. 2004, 876, 55-73.
(35) Doghieri, F.; Sarti, G. C. Macromolecules 1996, 29, 7885.(36) Sarti, G. C.; Doghieri, F. Chem. Eng. Sci. 1998, 53, 3435.(37) Doghieri, F.; Sarti, G. C. J. Membr. Sci. 1998, 147, 73.(38) Chow, T. S. Macromolecules 1980, 13, 362.(39) Wind, J. D.; Sirard, S. M.; Paul, D. R.; Green, P. F.; Johnston,
K. P.; Koros, W. J. Macromolecules 2003, 36, 6433.(40) Sirard, S. M.; Green, P. F.; Johnston, K. P. J. Phys. Chem. B
2001, 105, 766.(41) Scmidt, J. W.; Moldover, M. R. J. Chem. Phys. 1993, 99, 582-
589.(42) Johs, B. Accurate Correction of Window Effects in Ellipso-
metric Data; J.A. Woollam Co., Inc., 9/7/99.(43) Johs, B. Methods for uncorrelated evaluation of parameters
in parametrized mathematical equations for window retar-dance, in ellipsometer and polarimeter systems, US Patent#6,034,777.
(44) Herzinger, C. M.; Johs, B.; McGahan, W. A.; Woollam, J. A.;Paulson, W. J. Appl. Phys. 1998, 83, 3323.
(45) Michels, A.; Hamers, J. Physica IV 1937, 995.(46) Obriot, J.; Ge, J.; Bose, T. K.; St-Arnaud, J. M. Fluid Phase
Equilib. 1993, 86, 315.(47) Tompkins, H. G.; McGahan, W. A. Spectroscopic Ellipsometry
and Reflectometry; John Wiley & Sons: New York, 1999.(48) Stamatialis, D. F.; Wessling, M.; Sanopoulou, M.; Strath-
mann, H.; Petropoulos, J. H. J. Membr. Sci. 1997, 130, 75.(49) Bolton, B. A.; Kint, S.; Bailey, G. F.; Scherer, J. R. J. Phys.
Chem. 1986, 90, 1207.(50) Fleming, G. K.; Koros, W. J. J. Polym. Sci., Part B: Polym.
Phys. 1987, 25, 2033.(51) Orwoll, R. A. In Physical Properties of Polymers Handbook;
Mark, J. E., Ed.; American Institute of Physics: Woodbury,NY, 1996.
(52) Wu, Y. T.; Akoto-Ampaw, P. J.; Elbaccouch, M.; Hurrey, M.L.; Wallen, S. L.; Grant, C. S. Langmuir 2004, 20, 3665.
(53) Miura, K.-I.; Otakeb, K.; Kurosawab, S.; Sakob, T.; Sugetab,T.; Nakaneb, T.; Satob, M.; Tsujia, T.; Hiakia, T.; Hongoa,M. Fluid Phase Equilib. 1998, 144, 181.
(54) Sauerbrey, G. Z. Phys. 1959, 155, 206.(55) Lu, C. S.; Lewis, O. J. Appl. Phys. 1972, 43, 4385.(56) Kanazawa, K. Faraday Discuss. 1997, 107, 77.(57) White, C. C.; Schrag, J. L. J. Chem. Phys. 1999, 111, 24,
11192.(58) Lucklum, R.; Hauptmann, P. Electrochim. Acta 2000, 45,
3907.(59) Stockbridge, C. D., Behrndt, K. H., Eds.; In Vacuum Mi-
crobalance Techniques; Plenum: New York, 1966; Vol. 5, pp147-191.
(60) Kanazawa, K. K.; Gordon, J. G., II Anal. Chem. Acta 1985,175, 99.
(61) Astarita, G.; Paulatis, M. E.; Wissinger, R. G. J. Polym. Sci.,Part B: Polym. Phys. 1989, 27, 2105.
(62) Roe, R.-J. J. Appl. Phys. 1977, 48, 4085.(63) Doghieri. F.; Ghedini, M.; Quinzi, M.; Rethwisch, D.; Sarti,
G. C. Desalination 2002, 144, 73.(64) Giacinti Baschetti, M.; Doghieri, F.; Sarti, G. C. Ind. Eng.
Chem. Res. 2001, 40, 3027.(65) Varma-Nair, M.; Wunderbelich, B. J. Phys. Chem. Ref. Data
1982, 11, 1985.(66) Royer, J. R.; DeSimone, J. M.; Khan, S. A. J. Polym. Sci.,
Part B: Polym. Phys. 2001, 39, 3055.(67) Condo, P. D.; Paul, D. R.; Johnston, K. P. Macromolecules
1994, 27, 365-371.(68) Wissinger, R. G.; Paulatis, M. E. J. Polym. Sci., Part B:
Polym. Phys. 1987, 25, 2497.(69) Sanchez, I. C.; Lacombe, R. H. J. Phys. Chem. 1976, 80, 2352.(70) Lacombe, R. H.; Sanchez, I. C. J. Phys. Chem. 1976, 80, 2568.(71) Sanchez, I. C.; Lacombe, R. H. Macromolecules 1978, 11,
1145.(72) Neau, E. Fluid Phase Equilib. 2002, 203, 133.(73) Kirby, C. F.; McHugh, M. A. Chem. Rev. 1999, 99, 565.(74) Pham, J. Q.; Sirard, S. M.; Johnston, K. P.; Green, P. F. Phys.
Rev. Lett. 2003, 91, 17.(75) Wissinger, R. G.; Paulatis, M. E. J. Polym. Sci., Part B:
Polym. Phys. 1987, 25, 2497.
MA0506684
Macromolecules, Vol. 38, No. 24, 2005 Sorption and Swelling of Bulk Glassy Polymer Films 10313